Embed Size (px)
Citation preview

Comparative Lifecycle Assessment of Toilet Paper and Water For Toilet use
Advance Lifecycle Assessment Class Project
Alejandra Munoz; Ashwin Kumar Sanath Kumar; Kaushik Sivasubramanian; Rachna Sharma
5/8/2011
DEPARTMENT OF CIVIL AND ENVIRONMENTAL ENGINEERING
Comparative Lifecycle Assessment of Toilet Paper and Water For Toilet use
May 8, 2011
1
TABLE OF CONTENTS
ABSTRACT AND INTRODUCTION ..................................................................................................................... 2
GOAL ........................................................................................................................................................................... 2
APPLICATION ............................................................................................................................................................................ 2
REASON FOR CONDUCTING THE STUDY ................................................................................................................................ 2
AUDIENCE ................................................................................................................................................................................. 2
COMPARATIVE ASSERTION .................................................................................................................................................... 2
SCOPE ......................................................................................................................................................................... 2
PRODUCT SYSTEMS ................................................................................................................................................................. 3
FUNCTION AND FUNCTIONAL UNIT ...................................................................................................................................... 3
SYSTEM BOUNDARY ................................................................................................................................................................ 3
CUT OFF CRITERIA ................................................................................................................................................................... 4
ALLOCATION PROCEDURES: .................................................................................................................................................. 4
LIFE CYCLE INVENTORY ......................................................................................................................................................... 4
ASSUMPTIONS .......................................................................................................................................................................... 4
LIFE CYCLE IMPACT ASSESSMENT METHODOLOGY ........................................................................................................... 5
INTERPRETATION .................................................................................................................................................................... 5
LIMITATIONS ............................................................................................................................................................................ 5
LIFE CYCLE INVENTORY....................................................................................................................................... 5
DATA COLLECTION .................................................................................................................................................................. 5
DATA CALCULATION ............................................................................................................................................................... 5
LIFE CYCLE IMPACT ASSESSMENT ................................................................................................................... 7
IMPACT CATEGORIES, CATEGORY INDICATOR AND CHARACTERIZATION MODEL ....................................................... 7
SENSITIVITY ANALYSIS ......................................................................................................................................................... 10
LIFE CYCLE INTERPRETATION ....................................................................................................................... 10
CONCLUSION ........................................................................................................................................................................... 11
LIMITATIONS .......................................................................................................................................................................... 11
RECOMMENDATIONS ............................................................................................................................................................. 11
REFERENCES ......................................................................................................................................................... 12
Comparative Lifecycle Assessment of Toilet Paper and Water For Toilet use
May 8, 2011
2
Abstract There are many ways to cleanse our body after defecation. Toilet use being a daily activity in every household, we wanted to compare the environmental impacts due to use of paper and water to clean the body, to assess how much a simple change in lifestyle would decrease the greenhouse gas emission and energy consumption. This study was carried out using Life Cycle Assessment methods guided by ISO 14040:2006 and ISO 14044:2006. Amount of toilet paper or water used for cleaning after toilet use per person per year in the United States was considered to be the functional unit of this study. From the analysis it was seen that the use of water with a health faucet caused less impact on the environment than use of toilet paper on an average by a factor of 16 for Global Warming Potential (GWP) and 13 for Cumulative Energy Demand (CED). It was also seen that the major contributors to GWP and CED in both the life cycles were paper production and heating of water. Thus in warmer locations, the impacts due to water would be further less.
Goal The goal of this study is to draw quantitative conclusions concerning the environmental burdens of toilet paper and water required for body cleansing after toilet use. Environmental impact categories of interest are GWP (climate change) and CED.
Application: This study was primarily done to hone our lifecycle assessment skills by making a “comparative assertion” as defined by the International Standard Organization (2006) as “an environmental claim regarding the superiority or equivalence of one product/ process versus a competing product that performs the same function.”
Reason for conducting the study: Several ways exist to clean the body after toilet use. In USA, as in most western countries, toilet paper is used to clean the body after urination and defecation. However, approximately only 30% of the global population uses toilet paper (Toilet Paper History). About four billion people use other methods for cleaning such as water via a Bideti, a health faucetii or a washletiii and other materials such as rags, sponges or sticksiv among others (Toilet Paper History). The prevalent method of use depends mainly on the custom and culture of the place, availability of resources and affordability. United states being endowed with both forests and water resources, we wanted to compare the environmental impacts due to use of paper and water to clean the body, to assess how much a simple change in lifestyle would decrease the greenhouse gas emissions and energy demand.
Audience: The intended audience for this study is the ‘Advanced Life Cycle Assessment’ class students, teaching assistants and instructor.
Comparative Assertion: Although this study aims to compare the environmental impacts of toilet paper and water use, we do not plan to communicate the results to general public, outside of the Advance Life Cycle Assessment class. Therefore, a critical review of the study is optional.
Scope The scope of the study includes the two product systems studied that have an equivalent function. The various parameters as required by ISO standards are discussed below.

Comparative Lifecycle Assessment of Toilet Paper and Water For Toilet use
May 8, 2011
3
Product Systems: The two product systems being considered are: Toilet Paper: Standard two ply toilet paper roll, packaged with a cylindrical cardboard roll and exterior packaging in plastic, bought at a retail store/super market, having approximately 363 sheets per roll, each roll weighing 143g (Refer to Appendix I – Toilet Paper, Sheets/ Roll and Weight/ Roll). As per industry data, 100% recycled paper has been considered for modeling toilet paper. Water: Tap water (municipally treated) has been considered to be used for cleaning. The average water supply temperature is estimated to be about 60 °F (Labs, 1979). Heating of water to 80 °F, using domestic hot water systems (operated by natural gas) (Koomey, 1995) has also been considered.
Function and Functional Unit: The functional unit of the product system is the amount of paper/water required per person per year for cleaning the body after toilet use. There are a number of secondary functions for toilet paper such as cleaning sinks, for lipstick removal etc. and for water use such as drinking, bathing etc. These functions are not a part of this study. Reference Flows: To quantify functional unit, the reference flows calculated for the two product systems are shown below: Toilet Paper – 8 Kg per person per year (Refer to Appendix I – Toilet Paper, Usage)
Water – 4076 Liters per person per year (Refer to Appendix I – Water, Usage)
System Boundary: The following phases have been considered in life cycle of the two product systems and have been shown in figure 1 Toilet Paper - > Production, Packaging, Storage, Transportation, Last Mile Travel, Disposal Water - > Catchment water treatment, Distribution, Waste water treatment, Usage (Heating), Appliances (Production, Packaging, Storage, Transportation, Disposal, Online Purchase)
Figure 1 Toilet paper and Water use Product Flow Diagrams
Toilet Paper Product System Water and Health Faucet Product System

Comparative Lifecycle Assessment of Toilet Paper and Water For Toilet use
May 8, 2011
4
As a part of system boundary refining, toilet paper disposal was excluded based on literature reviews that considered the impacts of toilet paper disposal as negligible (Owens, 1996) (Madsen, 2007). Cut off Criteria: Processes with mass, energy, environmental impact less than 1% of the reference flow in question have been neglected, based on similar assumptions in other LCA studies and class discussions.
Exclusions: Processes not included in the scope of the study are – Post Western Closet use processes such as Tap water for hand washing, flushing, use of soap, hand drying, paper towels etc. as their impacts would be the same irrespective of which method of cleaning is adopted. Allocation Procedures: We have allocated inputs by mass, economic activity and number of units. The amount of plastic used for packaging and the cardboard tube inside a toilet paper roll has been allocated based on number of units. The cardboard packaging for transporting toilet paper rolls from production to warehouse or retail has been allocated by volume (Refer to Appendix II – Inside and Outside Packaging). Transportation impacts for the last mile transportation have been allocated by economic activity (Refer to Appendix III –Last Mile Transportation) (US Dept. of Labor Bureau of Labor Statistics, 2003).Warehouse and retail store electricity and natural gas use data have been allocated based on volume (CBECS, 2006) (Tompkins & Smith, 1998) (Refer to Appendix IV – Warehouse and Retail Energy Use). The cardboard packaging, transportation of health faucets and warehouse energy use has been allocated by volume (Refer to Appendix V – Health Faucet).
Life Cycle Inventory (LCI) Data Requirements: We have used primary data, literature sources and LCI databases for our study. Primary data for packaging of toilet paper has been collected by actual measurements at retail stores. LCI databases have been used in Simapro and literature has been referenced whenever used for a data point. The data collected and methodology has been documented in Appendices I-VI. Data Quality Requirements: We have considered the following parameters in data collection: Temporal Quality – We have used recent data wherever possible and available. However, some data sources used are as old as 1994 from Life Cycle Inventory databases. Geographical Quality – We have used data for North American region primarily, but for some points, we used European data due to lack of better data and use of similar technologies in these regions. Technology – We have tried to use recent technology data wherever possible. Precision – We have specified data range instead of single data points as there are bound to be uncertainties in the study and thus we collected data from different sources. Completeness – All the expected data points required for the study in accordance with goal and scope were found and thus data is complete in this respect. Representativeness – In order to consider representativeness of data from United States, we collected data from various sources. Missing Data – Wherever we could not find data for a particular unit process, we have estimated or calculated it using existing data and mentioned the method used. For example, the amount of energy required to heat water before use in health faucet is calculated using specific heat and temperature difference (Refer to Appendix VI - Heating water before use in health faucet).

Comparative Lifecycle Assessment of Toilet Paper and Water For Toilet use
May 8, 2011
5
Assumptions: Toilet paper rolls are packed in plastic only (another method of packaging is using tissue paper which has not been considered because a relatively small portion of overall toilet paper production is packed using tissue papers). Distance from the production facility to warehouse and from warehouse to retail is assumed to be the same (Weber, Koomey, & Matthews, 2009). It is assumed that warehouse and retail stores use electricity for lighting and natural gas for heating. Health Faucets are assumed to be bought online (Since health faucet provision is not a part of regular construction practices in USA). Energy demand of distribution centers has been neglected as the time spent in a distribution center by the packages is really low (Weber, Koomey, & Matthews, 2009). We have assumed that no toilet paper is used when the health faucet and water method is chosen, in the base model. However, use of toilet paper to avoid drip drying has been considered in the sensitivity analysis.
Life Cycle Impact Assessment Methodology: We have used Simapro single issue impact assessment methods. The impact categories that we have considered are Global Warming Potential and Cumulative Energy Demand.
Interpretation: We have interpreted our LCI results to compare the environmental burdens of using either toilet paper or water and have presented a phase wise impacts of either method in our results.
Limitations: Huge variations in data were found (Refer to Appendix X). Further study of behavioral patterns is required to ensure the relevance of assumptions made, say, for the number of toilet uses per day or the amount of toilet paper or water used. For certain unit processes, the LCI values do not include infrastructure systems while for others, infrastructure set up impacts are considered (transport from warehouse to retail, lorry 3.5-7.5 tons, for instance includes impacts due to setting up of the infrastructure systems). This inconsistency is a known limitation of the study. Critical Review: A critical review is not required in this case as the results are not divulged to public. But as prime objective of this project is to hone our LCA skills, we would request the course instructor to do a critical review.
Life Cycle Inventory The material and energy inputs for various phases in the life cycle of both the product systems were obtained and are as shown in Table 1 (Refer to Appendix IX for the network representation of models).
Data Collection: We created a data collection sheet in the beginning to ensure capturing all requisite data as per the goal and scope of our study (Refer to Appendix VII). Primary data was collected for toilet paper and packaging material by actual measurements and for other unit processes professional life cycle inventory databases and literature sources were used. Data Calculation: The data calculations have been detailed in appendices I to VI. Ranges of data have been calculated wherever possible. For warehouse and retail electricity and natural gas consumption (both models), cardboard packaging required for transportation (health faucet), data center energy usage to order health faucet online, the minimum and maximum values have been taken as +/- 10% of the actual data values in order to do sensitivity analysis. For health faucet, material was changed from brass to plastic to see the change in emissions and cumulative energy demand for sensitivity analysis. For upper bound we assumed that the faucet may weigh up to 2 Kg instead of 1.36 Kg in the base case.

Comparative Lifecycle Assessment of Toilet Paper and Water For Toilet use
May 8, 2011
6
Table 1 Toilet Paper and Water Use Model
Toilet Paper ModelSystem/Phase Description Name of assembly/process Simapro Database Qt Unit
Toilet Paper / Production
Materials Toilet Paper Paper Towels 100% recycled FAL Franklin USA 98 8 kg
Processes Cutting Rolls Cutting rolls CF BUWAL 250 8 kg
Toilet paper / Distribution
ProcessesTo warehouse
transportationTransport, lorry >32t, EURO3/RER S Ecoinvent 4.39 tmi
Warehouse heating Heat from nat. gas FAL Franklin USA 98 826 Btu
Warehouse electricity Electricity, production mix US/US U Ecoinvent 1527 Btu
To retail store
transportationTransport, lorry 3.5-7.5t, EURO3/RER S Ecoinvent 4.39 tmi
Retail store heating Heat from nat. gas FAL Franklin USA 98 3062 Btu
Retail store electricity Electricity, production mix US/US U Ecoinvent 8502 Btu
Last mile customer transportationCar (diesel) I IDEMAT 2001 0.8 mile
Toilet paper / Disposal
Disposal Wastewater system Neglected
Packaging of toilet paper / Production
Materials Plastic packaging LDPE ETH S LCA Food DK 10 g
Tube inside packaging Cardboard cellulose S B251 BUWAL 250 0.261 kg
Box for transportation Cardboard cellulose S B250 BUWAL 250 1.06 kg
Packaging of toilet paper / Disposal
Scenario Plastic packaging Packaging waste scenario/US S Ecoinvent 100 %
Cardbaord packaging Waste scenario/US S Ecoinvent 100 %
Water ModelSystem/Phase Description Name of Simapro assembly/process Database Qt Unit
Water / Production
Materials
Catchment, treatment, and
distribution of drinking
water
Tap water, at user/RER U Ecoinvent 4076 kg
Water / use
Processes Domestic water heating Heat from nat. gas FAL Franklin USA 98 190 MJ
Water / Disposal
Disposal Wastewater systemTreatment, sewage, from residence, to
wastewater treatment, class 2/m3/CHEcoinvent 4076 kg
Additional Life Cycles
Health Faucet / Production
Materials Brass Production CuZn30 I IDEMAT 2001 1.36 kg
Packaging of health faucetPackaging, corrugated board, mixed
fibre, single wall, at plant/CH SEcoinvent 0.7 lb
Processes Manufacturing health FaucetCopper product manufacturing, average
metal working/RER UEcoinvent 1.36 kg
Health Faucet / Distribution
ProcessesTo warehouse
transportationTransport, lorry >32t, EURO3/RER U Ecoinvent 0.5576 tmi
Warehouse heating Heat from nat. gas FAL Franklin USA 98 208 Btu
Warehouse electricity Electricity avg. kWh USA Ecoinvent 384 Btu
To distribution center
transportation by airTransport, aircraft, freight, Europe/tkm/RER Ecoinvent 0.19 tmi
To distribution center
transportation by roadTransport, lorry 3.5-7.5t, EURO3/RER U Ecoinvent 0.49 tmi
Customer Purchase via InternetElectricity avg. kWh USA Ecoinvent 1.5 MJ
Data Center Energy Usage Electricity avg. kWh USA - Data center usageEcoinvent 0.25 MJ
Last mile truck transportationDiesel I IDEMAT 2001 0.22 kg
Health Faucet / Disposal
Scenario Health Faucet disposal Durable goods waste scenario/US S Ecoinvent 0.1 p

Comparative Lifecycle Assessment of Toilet Paper and Water For Toilet use
May 8, 2011
7
Data Validation: We validated the data to check whether the data quality requirements were met with respect to the goal and scope of the study. We also validated the material balance. Data Quality Evaluation: We evaluated the data quality using Weidema method (Refer to Appendix VIII (Weidema & Wesnaes, 1996) . The results of our data quality analysis based on this method are as shown below in Table 2. We conclude from this analysis that the data was of average quality.
Table 2 Data Quality Assessment Report
Relating Data to Unit Processes/ Functional Unit: In most cases, data was collected for specific unit processes, so relating data to unit processes was not a challenge. Other data were related to functional unit with the help of reference flows.
System Boundary Refining: Based on the data collection and sensitivity analysis, we refined our system boundary to:
Include heating of water to be used in the process (because of high impacts of this process in the life cycle of water and health faucet product system)
Excluding toilet paper disposal from the scope because of its negligible impacts (Owens, 1996) (Madsen, 2007). The study by Munoz et al (Ivan Muñoz, Canals, Clift, & Doka, 2007) considers toilet paper in waste water treatment; however, they mention that the mass of toilet paper in waste water stream is 0.3%, which is less than our cut off criteria, and hence, we excluded the analysis of toilet paper disposal phase.
Life Cycle Impact Assessment
Impact Categories, Category Indicator and Characterization Model: We selected CED and GWP as the impact categories because these are some of the current scientific concerns. The category indicator for GWP was chosen as the kg CO2 equivalent as it is the most prevalent GWP indicator. Characterization model used was Single Issue Impact Assessment Method (Cumulative Energy Demand V1.06 and IPCC 2007 GWP 100a V1.01). Since we have used single issue impact assessment method, this
Method type Life Cycle steps Acquisition
Method
Independence
of data supplier
Representa-
tiveness
Data age Geographical
Correlation
Technological
Correlation
Toilet Paper Production 3 1 3 4 2 4
Distribution-transport 3 1 3 2 3 4
Disribution - energy consumption 3 1 3 4 2 4
Disposal NA NA NA NA NA NA
Production 3 1 3 4 3 5
Disposal 3 1 3 2 2 4
Water Production 3 1 3 3 3 5
Use 3 1 3 4 3 4Disposal 3 1 3 3 2 3
Production- Brass 3 1 3 4 3 5
Manufacturing and package 3 1 3 2 3 5
Distribution-transport 3 1 3 2 3 5
Disribution - energy consumption 3 1 3 4 2 4
Disposal 3 1 3 2 2 3
Data Quality assessment
Toilet Paper
Packaging
Health
Faucet
Comparative Lifecycle Assessment of Toilet Paper and Water For Toilet use
May 8, 2011
8
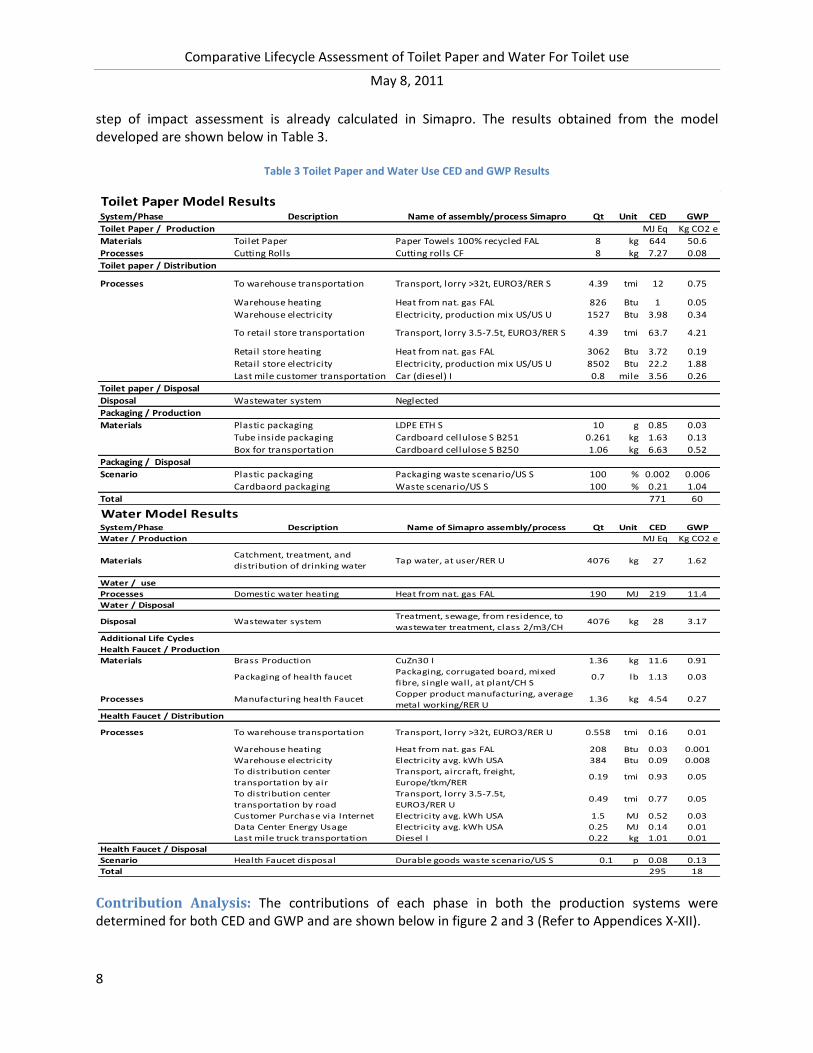
step of impact assessment is already calculated in Simapro. The results obtained from the model developed are shown below in Table 3.
Table 3 Toilet Paper and Water Use CED and GWP Results
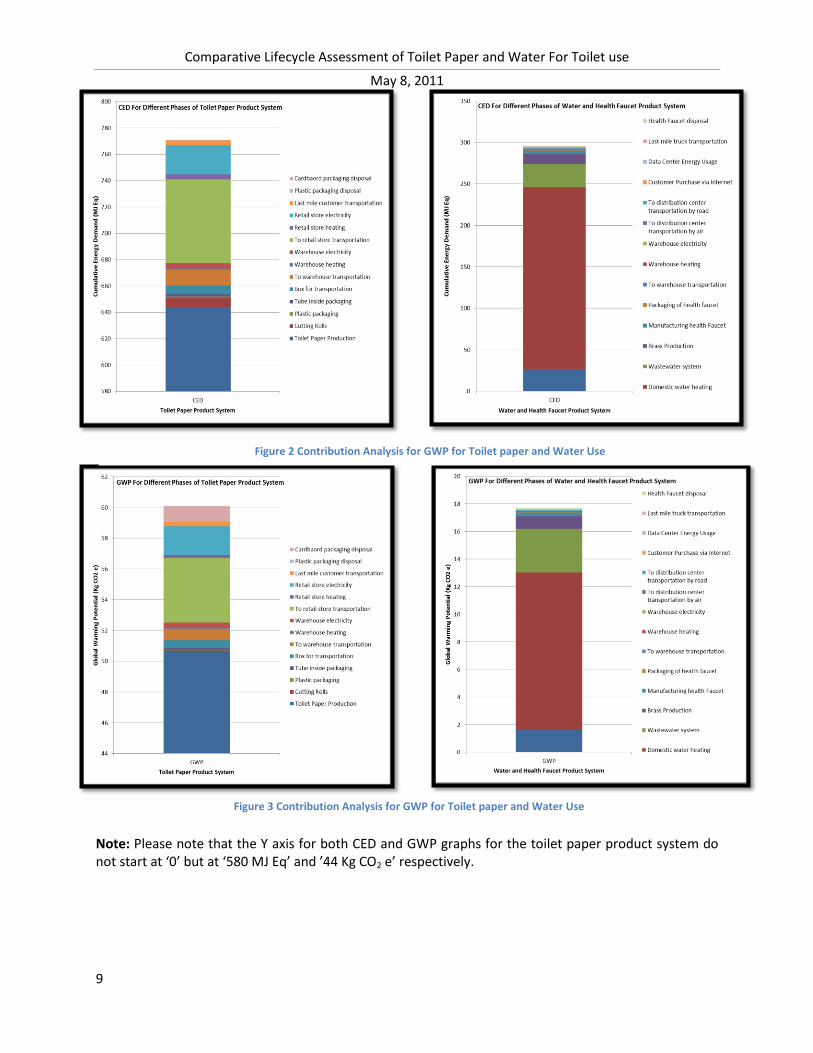
Contribution Analysis: The contributions of each phase in both the production systems were determined for both CED and GWP and are shown below in figure 2 and 3 (Refer to Appendices X-XII).
Toilet Paper Model ResultsSystem/Phase Description Name of assembly/process Simapro Qt Unit CED GWP
Toilet Paper / Production MJ Eq Kg CO2 e
Materials Toilet Paper Paper Towels 100% recycled FAL 8 kg 644 50.6
Processes Cutting Rolls Cutting rolls CF 8 kg 7.27 0.08
Toilet paper / Distribution
Processes To warehouse transportation Transport, lorry >32t, EURO3/RER S 4.39 tmi 12 0.75
Warehouse heating Heat from nat. gas FAL 826 Btu 1 0.05
Warehouse electricity Electricity, production mix US/US U 1527 Btu 3.98 0.34
To retail store transportation Transport, lorry 3.5-7.5t, EURO3/RER S 4.39 tmi 63.7 4.21
Retail store heating Heat from nat. gas FAL 3062 Btu 3.72 0.19
Retail store electricity Electricity, production mix US/US U 8502 Btu 22.2 1.88
Last mile customer transportation Car (diesel) I 0.8 mile 3.56 0.26
Toilet paper / Disposal
Disposal Wastewater system Neglected
Packaging / Production
Materials Plastic packaging LDPE ETH S 10 g 0.85 0.03
Tube inside packaging Cardboard cellulose S B251 0.261 kg 1.63 0.13
Box for transportation Cardboard cellulose S B250 1.06 kg 6.63 0.52
Packaging / Disposal
Scenario Plastic packaging Packaging waste scenario/US S 100 % 0.002 0.006
Cardbaord packaging Waste scenario/US S 100 % 0.21 1.04
Total 771 60
Water Model ResultsSystem/Phase Description Name of Simapro assembly/process Qt Unit CED GWP
Water / Production MJ Eq Kg CO2 e
MaterialsCatchment, treatment, and
distribution of drinking waterTap water, at user/RER U 4076 kg 27 1.62
Water / use
Processes Domestic water heating Heat from nat. gas FAL 190 MJ 219 11.4
Water / Disposal
Disposal Wastewater systemTreatment, sewage, from residence, to
wastewater treatment, class 2/m3/CH4076 kg 28 3.17
Additional Life Cycles
Health Faucet / Production
Materials Brass Production CuZn30 I 1.36 kg 11.6 0.91
Packaging of health faucetPackaging, corrugated board, mixed
fibre, single wall, at plant/CH S0.7 lb 1.13 0.03
Processes Manufacturing health FaucetCopper product manufacturing, average
metal working/RER U1.36 kg 4.54 0.27
Health Faucet / Distribution
Processes To warehouse transportation Transport, lorry >32t, EURO3/RER U 0.558 tmi 0.16 0.01
Warehouse heating Heat from nat. gas FAL 208 Btu 0.03 0.001
Warehouse electricity Electricity avg. kWh USA 384 Btu 0.09 0.008
To distribution center
transportation by air
Transport, aircraft, freight,
Europe/tkm/RER 0.19 tmi 0.93 0.05
To distribution center
transportation by road
Transport, lorry 3.5-7.5t,
EURO3/RER U0.49 tmi 0.77 0.05
Customer Purchase via Internet Electricity avg. kWh USA 1.5 MJ 0.52 0.03
Data Center Energy Usage Electricity avg. kWh USA 0.25 MJ 0.14 0.01
Last mile truck transportation Diesel I 0.22 kg 1.01 0.01
Health Faucet / Disposal
Scenario Health Faucet disposal Durable goods waste scenario/US S 0.1 p 0.08 0.13
Total 295 18
Comparative Lifecycle Assessment of Toilet Paper and Water For Toilet use
May 8, 2011
9
Note: Please note that the Y axis for both CED and GWP graphs for the toilet paper product system do not start at ‘0’ but at ‘580 MJ Eq’ and ’44 Kg CO2 e’ respectively.
Figure 3 Contribution Analysis for GWP for Toilet paper and Water Use
Figure 2 Contribution Analysis for GWP for Toilet paper and Water Use
Comparative Lifecycle Assessment of Toilet Paper and Water For Toilet use
May 8, 2011
10
0
10
0
20
0
30
0
40
0
50
0
60
0
70
0
80
0
90
0
Toilet_Paper_100%_Recycled / …
Heat from nat. gas FAL / Mean …
Waste Water Treatment / Mean …
Tap Water / Mean (D39)
Transport, lorry 3.5-7.5t, …
CuZn30I Brass / Mean (D27)
Cutting Rolls CF / Mean (D9)
Cardboard For Transportation / …
Copper product manufacturing, …
Transport, lorry >32t, …
Difference in CED - (Paper - Water)
Tornado Graph of difference in CED (Paper - Water)
0
10
20
30
40
50
60
70
Toilet_Paper_100%_Recycled / …
Heat from nat. gas FAL / Mean …
Waste Water Treatment / …
Tap Water / Mean (AB36)
Transport, lorry 3.5-7.5t, …
CuZn30I Brass / Mean (AB24)
Cardboard For Transportation …
Cardboard For Transportation …
Difference in GWP - (Paper - Water)
Tornado Graph of Difference in GWP (Paper - Water)
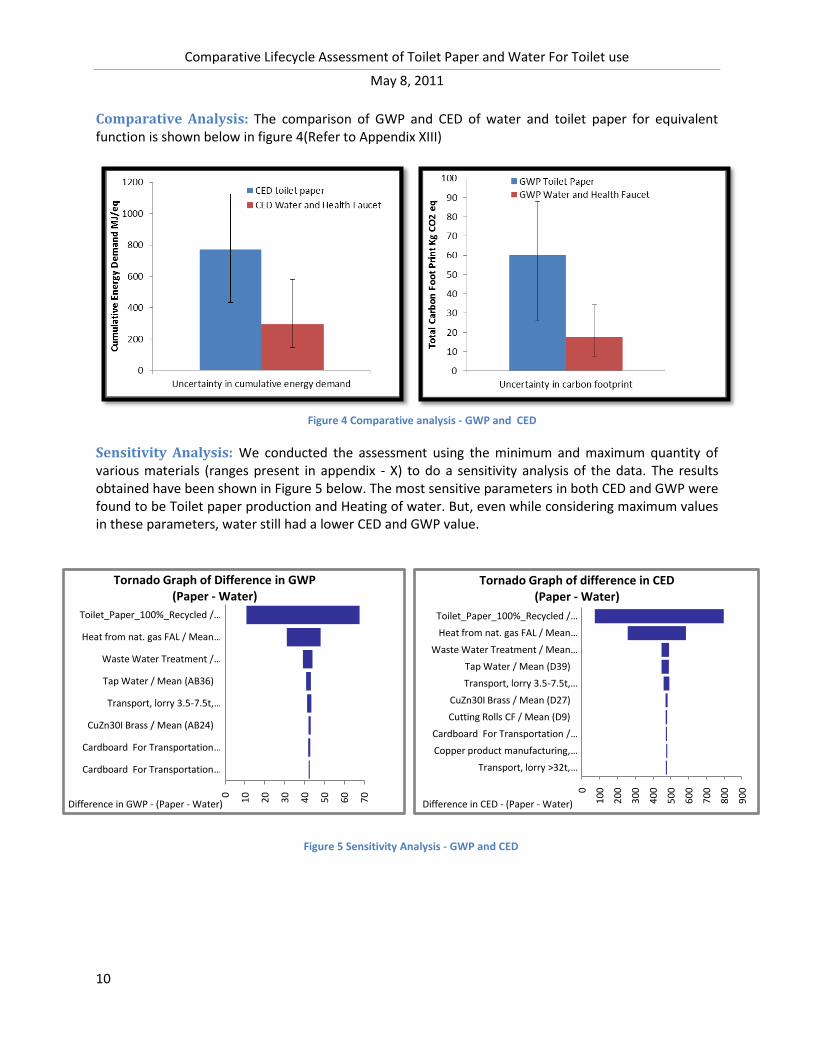
Comparative Analysis: The comparison of GWP and CED of water and toilet paper for equivalent function is shown below in figure 4(Refer to Appendix XIII)
Sensitivity Analysis: We conducted the assessment using the minimum and maximum quantity of various materials (ranges present in appendix - X) to do a sensitivity analysis of the data. The results obtained have been shown in Figure 5 below. The most sensitive parameters in both CED and GWP were found to be Toilet paper production and Heating of water. But, even while considering maximum values in these parameters, water still had a lower CED and GWP value.
Figure 4 Comparative analysis - GWP and CED
Figure 5 Sensitivity Analysis - GWP and CED

Comparative Lifecycle Assessment of Toilet Paper and Water For Toilet use
May 8, 2011
11
Life Cycle Interpretation This section includes the conclusion, recommendations and limitations of the study.
Conclusion: Based on our results, we can conclude that the toilet paper product system has 13 times higher CED and 16 times higher GWP as compared to the water and health faucet product system. Even if approximately 4 Kg of toilet paper (50% of the amount used otherwise per year) is used along with water and health faucet for drying the body parts after cleansing, water remains environmentally favorable as long as the temperature difference between incoming water and the warm water in health faucet is less than 60 units (corresponding to 120 °F ). A two-way sensitivity analysis with water heating and toilet production as inputs was done to identify when the toilet paper system would be environmentally preferable than the water system. The graphs have been shown below in figure 6. Toilet paper is environmentally favorable only when water heating energy requirements are really high and the amount of toilet paper used is really low.
Figure 6 Sensitivity Analysis Result (Varying Amount of Toilet Paper and Temperature of Water in Health Faucet)
Limitations: Limitations have been stated in the scope. Recommendations: Toilet paper production is the largest contributor to CED and GWP in the toilet paper product system. If the production method could be made better by doing further research, these impacts can be reduced. Using less toilet paper is also an obvious but effective method to reduce the impacts. Since water and health faucet system is an environmentally favorable option of toilet use, it may also be recommended that people switch to using water and faucet system instead of toilet paper. This change can be facilitated by making health faucets a regular fixture in buildings. For water and health faucet system environmental impacts can be reduced by heating the water to relatively lower temperature.
0
20
40
60
80
100
3 4 5 6 7 8 9
10
11
12
Tem
per
atu
re D
iffe
ren
ce in
Wat
er (
F)
Amount of paper Used er year - Kg/Year
Sensitivity Analysis of GWPTemp. Diff of water Vs Amount of Paper
Toilet Paper Water with Health Faucet
0
20
40
60
80
100
3 4 5 6 7 8 9
10
11
12
Tem
per
atu
re d
ifer
ecn
e in
Wat
er (
F)
Amount of paper used per year - Kg/Year
Sensitivity Analysis of CEDTemp. Diff of Water Vs Amount of Paper
Toilet paper Water with Health faucet

Comparative Lifecycle Assessment of Toilet Paper and Water For Toilet use
May 8, 2011
12
References CBECS. (2006). Total Energy Expenditures by Major Fuel for All Buildings. Retrieved April 2011, from
www.eia.gov: http://www.eia.gov/emeu/cbecs/cbecs2003/detailed_tables_2003/2003set14/2003html/c2a.html
International Standard Organization. (2006). Environmental Management: Life Cycle Assessment - Principles and Framework (Vol. Second). Switzerland: ISO.
Ivan Muñoz, Canals, L. M., Clift, R., & Doka, G. (2007). A simple model to include human excretion and wastewater treatment in Life Cycle Assessment of food products. University of Surrey, Centre for Environmental Strategy. Guildford (Surrey): Centre for Environmental Strategy.
Koomey, J. (1995, July). The effect of efficiency standards on water use and water-heating energy use in the U.S.: A detailed end-use treatment. Energy, 20.
Labs, K. (1979). Underground Building Climate. Solar Age, 44. Madsen, J. (2007). Life Cycle Assessment of Tissue Products. Kimberly Clark. Owens, J. W. (1996). LCA Impact Assessment: Case Study Using a Consumer Product. International
Journal of Life Cycle Assessment, 1(4). Toilet Paper History. (n.d.). Retrieved April 2011, from www.toiletpaperhistory.net:
http://www.toiletpaperhistory.net/ Tompkins, J. A., & Smith, J. D. (1998). The Warehouse Management Handbook. Tompkins Press. U.S. Department of Transportation, Bureau of Transportation Statistics. (2002). Freight Shipments In
America: Preliminary Highlights from the 2002 commodity flow survey Plus additional data. Retrieved April 2011, from www.bts.gov: http://www.bts.gov/publications/freight_shipments_in_america/pdf/entire.pdf
US Dept. of Labor Bureau of Labor Statistics. (2003). Consumer Expenditures in 2001, Report 966. Weber, C. L., Koomey, J. G., & Matthews, H. S. (2009). The energy and climate change impacts of
different music delivery methods. Weber, C., Hendrickson, C., Jaramillo, P., Matthews, S., Nagengast, A., & Nealer, R. (2008). Life Cycle
Comparison of Traditional Retail and E-commerce Logistics for Electronic Products: A Case Study of buy.com. Pittsburgh: Green Design Institute, Carnegie Mellon University.
Weidema, B., & Wesnaes, M. (1996). Data Quality Management for Life Cycle Inventories - an example of using data quality indicators. Journal of Cleaner Production Vol 4 , 167.
i http://en.wikipedia.org/wiki/Bidet ii http://en.wikipedia.org/wiki/Health_faucet
iii http://en.wikipedia.org/wiki/Washlet
iv http://en.wikipedia.org/wiki/Anal_cleansing