Embed Size (px)
Citation preview

Comparative Assessment of Nitrogen Fixation Methodologies,Conducted in the Oligotrophic North Pacific Ocean
Samuel T. Wilson,a,b Daniela Böttjer,a,b Matthew J. Church,a,b and David M. Karla,b
Department of Oceanography, School of Ocean and Earth Science and Technology, University of Hawaii, Honolulu, Hawaii, USA,a and Center for Microbial Oceanography:Research and Education, University of Hawaii, Honolulu, Hawaii, USAb
Resolution of the nitrogen (N) cycle in the marine environment requires an accurate assessment of dinitrogen (N2) fixation. Wepresent here an update on progress in conducting field measurements of acetylene reduction (AR) and 15N2 tracer assimilation inthe oligotrophic North Pacific Subtropical Gyre (NPSG). The AR assay was conducted on discrete seawater samples using a head-space analysis system, followed by quantification of ethylene (C2H4) with a reducing compound photodetector. The rates of C2H4
production were measurable for nonconcentrated seawater samples after an incubation period of 3 to 4 h. The 15N2 tracer mea-surements compared the addition of 15N2 as a gas bubble and dissolved as 15N2 enriched seawater. On all sampling occasions andat all depths, a 2- to 6-fold increase in the rate of 15N2 assimilation was measured when 15N2-enriched seawater was added to theseawater sample compared to the addition of 15N2 as a gas bubble. In addition, we show that the 15N2-enriched seawater can beprepared prior to its use with no detectable loss (<1.7%) of dissolved 15N2 during 4 weeks of storage, facilitating its use in thefield. The ratio of C2H4 production to 15N2 assimilation varied from 7 to 27 when measured simultaneously in surface seawatersamples. Collectively, the modifications to the AR assay and the 15N2 assimilation technique present opportunities for more ac-curate and high frequency measurements (e.g., diel scale) of N2 fixation, providing further insight into the contribution of differ-ent groups of diazotrophs to the input of N in the global oceans.
The biological conversion of dinitrogen (N2) gas into ammonia(NH3) is performed by a select group of organisms, termed
diazotrophs. Examining the identity of diazotrophs present in themarine environment, determining their abundance, and under-standing their physiological characteristics is vital to improvingour understanding of the marine nitrogen (N) cycle. Equally im-portant is quantifying the contribution of diazotrophs to the fixedpool of N in the global ocean, which is estimated to range from 100to 200 Tg of N year�1 (24). Calculating global N2 fixation viafield-based measurements (5, 25) results in lower estimates ofglobal N2 fixation compared to geochemical evidence such as nu-trient stoichiometry and isotopic ratios (10, 20, 27). In part, thismay derive from the methodologies used to measure N2 fixation, atopic that forms the basis of the present study. Recently, there havebeen several model-based estimates on the specific contributionsof individual diazotroph groups to the fixed pool of N (18, 29).The model outputs support field-based observations that the con-tribution of fixed N by unicellular N2-fixing cyanobacteria, in-cluding group A (termed UCYN-A) and Crocosphaera spp., canequal or even exceed the contribution of larger N2-fixing micro-organisms, such as Trichodesmium and various heterocystous cy-anobacteria (12, 31, 41).
The commonly applied methods to measure the rates of ma-rine N2 fixation include the acetylene reduction (AR) assay (4, 7,12, 36) and the 15N2 assimilation technique (30). The AR assayrelies on the preferential reduction of acetylene (C2H2) to ethylene(C2H4) by nitrogenase, instead of reducing N2 to NH3 (34). Themost extensive applications of the AR assay at sea include themeasurement of C2H4 production by Trichodesmium colonies viagas chromatography (6, 7) and the use of an online system incor-porating a laser photoacoustic detector (37, 42). However, the ARassay has not escaped criticism during the past 4 decades of its use,predominantly due to potential indirect effects of C2H2 on micro-bial metabolism and the reliability of the factor used to extrapolate
rates of C2H4 production to rates of N2 fixation (14, 16, 21, 36). Anadditional concern, especially for oligotrophic seawater samples,is the need to concentrate the microbial biomass, either by ship-board filtration or net tows, in order to obtain a detectable signalof C2H4 production (6, 12, 37). The filtration process can imposeundesired effects on the microbial population due to cell damage(1, 13). In comparison, the 15N2 assimilation technique followsthe net incorporation of the 15N2 tracer into cellular biomass aftera predetermined incubation period (2, 17, 26). Because the 15N2
technique has a lower detection limit than the AR assay, it is thepreferred method for the oligotrophic marine environment (30).Indeed, 15N2 assimilation has been used to describe rates of N2
fixation at Station (Stn) ALOHA (A Long-term OligotrophicHabitat Assessment) located at 22°45=N, 158°W in the North Pa-cific Subtropical Gyre (NPSG) (9, 11). However, it has recentlybeen demonstrated that the method used to add 15N2 to the sea-water sample can affect the measured rate of N2 fixation (28). Theauthors of that study found that the addition of 15N2 as a gasbubble underestimated N2 fixation because the gas bubble intro-duced does not attain equilibrium within the incubation period,causing an unknown and time-dependent 15N/14N ratio for the Npool.
We describe methodological developments to improve boththe AR assay and the 15N2 assimilation technique. We demon-strate that the rates of C2H4 production are quantifiable after in-cubations of 3 to 4 h by measuring the C2H4 concentration in
Received 9 April 2012 Accepted 28 June 2012
Published ahead of print 6 July 2012
Address correspondence to Samuel T. Wilson, [email protected].
Copyright © 2012, American Society for Microbiology. All Rights Reserved.
doi:10.1128/AEM.01146-12
6516 aem.asm.org Applied and Environmental Microbiology p. 6516–6523 September 2012 Volume 78 Number 18
on Septem
ber 4, 2012 by Univ of H
awaii at M
anoahttp://aem
.asm.org/
Dow
nloaded from
equilibrated headspace gas using a reduced gas analyzer that in-corporates a reducing compound photodetector. Importantly, nopreconcentration of microbial biomass is required. Additional keymethodological aspects of the AR assay are also documented, in-cluding the saturation of nitrogenase with C2H2 and the impor-tance of blank control treatments. The AR assay measurementswere conducted alongside rates of 15N2 assimilation, whereby 15N2
was added to seawater samples in both gaseous form and as 15N2-enriched seawater. We describe the preparation and storage of15N2-enriched seawater for use on oceanographic cruises, makingits use in the field more time efficient. The resulting advances tothe AR assay and 15N2 assimilation method described here allowmore accurate quantification of N2 fixation and increase the abil-ity to conduct time-resolved rate measurements in the oligotro-phic ocean.
MATERIALS AND METHODSThe fieldwork was conducted on multiple expeditions to the NPSG be-tween October 2010 and December 2011. Seawater samples were collectedduring Hawaii Ocean Time-series (HOT) cruises to Stn ALOHA and anadditional oceanographic cruise located �50 nautical miles to the northof Stn ALOHA (25°N, 157°30=W).
AR assay. The AR assay described here differs from the “typical” ARassay (see, for example, reference 4) in two main aspects. The first is withregard to sample preparation with C2H2 gas added in dissolved form tothe seawater sample, followed by incubation of the seawater sample withno headspace, and subsequent quantification of the ensuing C2H4 gas inthe whole sample. This differs from the routinely reported applications ofthe AR assay (4, 7, 12), whereby C2H2 gas is added to serum vials contain-ing approximately two-thirds sample seawater and one-third headspace,and aliquots of the gas phase are analyzed for C2H4 concentrations atselected intervals during the sample incubation period or a predeterminedendpoint. The second major methodological difference is that C2H4 con-centrations are quantified by using a reducing compound photodetectorin contrast with the more routinely utilized gas chromatography-flameionization detector (GC-FID). Below, we describe the five steps of themodified AR assay: (i) preparation of the C2H2-enriched seawater, (ii)sample collection and incubation, (iii) extraction of the dissolved C2H4
gas, (iv) quantification of the C2H4 concentrations, and (v) calculation ofthe C2H4 concentration.
(i) Preparation of C2H2 enriched seawater. The C2H2-saturated sea-water for the AR assay was prepared �1 h prior to use. To generate theC2H2 gas, 6 g of calcium carbide (CaC2; Sigma) was added to 150 ml ofdeionized water in a 250-ml side-arm glass flask according to the follow-ing equation:
CaC2 � 2H2O � C2H2 � Ca(OH)2. (1)
The resulting C2H2 gas was transferred via the side-arm of the flaskand 1/8-in. polytetrafluoroethylene (PTFE) tubing to the base of a sec-ondary 1-liter glass flask that contained 300 ml of filtered (0.2-�m poresize) seawater collected from the sampling location. To enhance the masstransfer of C2H2 gas into the filtered seawater, the outlet tubing was fittedwith a ceramic air stone diffuser resulting in the production of micro-bubbles. After purging the filtered seawater with C2H2 and shaking vigor-ously for 5 min, the C2H2-enriched seawater was stored in the dark untiluse. No measurements were made of C2H2 concentrations using the re-ducing compound photodetector since this would rapidly deplete the bedof mercuric oxide. Rather, we relied on empirical solubility studies show-ing that seawater saturated with C2H2 (1.6 ml of C2H2 per ml of water)contains 65 mM C2H2 (35). It should also be noted that C2H2 producedfrom calcium carbide does not result in pure C2H2 and contaminants arepresent, including C2H4 (22). These can potentially be decreased byscrubbing the C2H2 gas stream through an additional water flask (8);however, the presence of any level of contaminant C2H4 necessitates care-ful time zero measurements and blank controls, discussed in detail below.
(ii) Sample collection and incubation. Seawater samples were col-lected using a CTD-rosette and transferred to acid-washed, combusted,glass-stoppered 300-ml Wheaton bottles that were filled to two timesoverflowing. Subsequently, 20 ml of the seawater sample was removedfrom the Wheaton bottle using a pipettor and replaced with 20 ml ofC2H2-enriched seawater, with a final C2H2 concentration of 4 mM. Rep-licate (n � 3) samples were immediately analyzed after the introduction ofC2H2 enriched seawater to provide a time zero C2H4 concentration. Con-trol samples, consisting of 0.2-�m-pore-size filtered seawater, were inoc-ulated with 20 ml of C2H2-enriched seawater and analyzed in triplicatewhenever measurements were conducted on seawater samples. Experi-mental and control treatments were incubated in deckboard incubatorsplumbed with flowing surface seawater and shaded using blue Plexiglas to20% light intensity, approximately equivalent to a depth of 25 m in thewater column. The typical incubation period was 3 to 4 h, although on afew occasions the incubation time was extended up to 8 h.
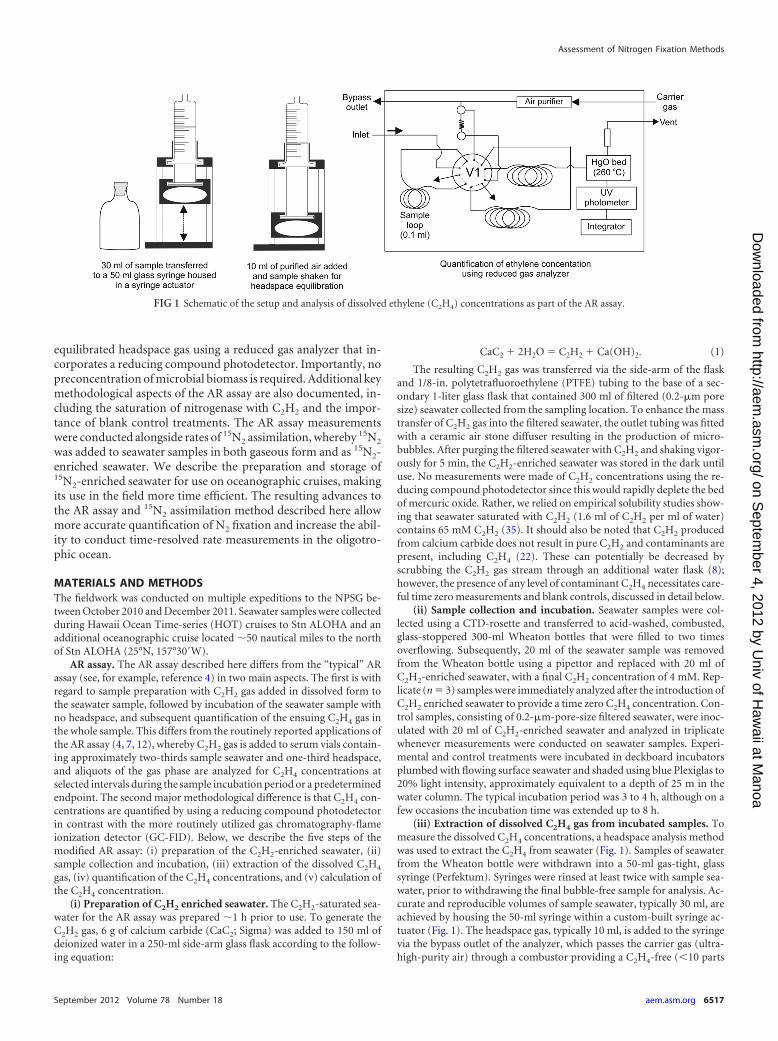
(iii) Extraction of dissolved C2H4 gas from incubated samples. Tomeasure the dissolved C2H4 concentrations, a headspace analysis methodwas used to extract the C2H4 from seawater (Fig. 1). Samples of seawaterfrom the Wheaton bottle were withdrawn into a 50-ml gas-tight, glasssyringe (Perfektum). Syringes were rinsed at least twice with sample sea-water, prior to withdrawing the final bubble-free sample for analysis. Ac-curate and reproducible volumes of sample seawater, typically 30 ml, areachieved by housing the 50-ml syringe within a custom-built syringe ac-tuator (Fig. 1). The headspace gas, typically 10 ml, is added to the syringevia the bypass outlet of the analyzer, which passes the carrier gas (ultra-high-purity air) through a combustor providing a C2H4-free (�10 parts
FIG 1 Schematic of the setup and analysis of dissolved ethylene (C2H4) concentrations as part of the AR assay.
Assessment of Nitrogen Fixation Methods
September 2012 Volume 78 Number 18 aem.asm.org 6517
on Septem
ber 4, 2012 by Univ of H
awaii at M
anoahttp://aem
.asm.org/
Dow
nloaded from
per trillion) source of air. The water and gas phases in the syringe are thenequilibrated at room temperature by vigorous shaking of the syringe for 3min. The equilibrated headspace is subsequently injected into the gasanalyzer inlet which incorporates a 0.2-�m-pore-size PTFE membranehydrophobic filter (Acrodisc; Pall Life Sciences) to prevent the accidentalinjection of seawater. An internal 10-port switching valve is subsequentlyactivated that injects 100 �l of the sample gas stream onto the chromatog-raphy columns described below. The total analytical time per sampleranges from 7 to 8 min.
(iv) Quantification of C2H4 concentrations. C2H4 concentrationswere measured using a reduced gas analyzer (RGA; Peak Laboratories).The RGA has previously been used to quantify other reduced gases such ashydrogen and carbon monoxide (33, 39, 40) and was modified for thequantification of C2H4 by installing two chromatographic columns—aprecolumn packed with a Unibeads 60/80 mesh to trap water vapor and a1/8-in. Unibeads 1S 60/80 analytical column to separate C2H2 and C2H4.Furthermore, the analytical time program of the RGA was altered to divertthe gas flow from the column after C2H4 had eluted to ensure that the largepulse of C2H2 did not reach the detector. One of the main advantages ofusing the RGA compared to a GC-FID is the high sensitivity to C2H4 witha detection limit of 30 ppb. This high sensitivity is achieved by passing thesample gas stream over a bed of heated mercuric oxide and quantifying theresulting mercury vapor with a UV photodetector (Fig. 1). Calibration ofthe RGA was routinely conducted using serial dilutions of a 10.3 � 0.1ppm of C2H4 standard in N2 (Scott-Marrin, Riverside, CA).
(v) Calculation of C2H4 concentrations. The measured concentrationof C2H4 in the equilibrated headspace was used to calculate the total dis-solved C2H4 concentration ({C2H4}w in ml of C2H4/ml of H2O) remain-ing in the water after equilibration by
{C2H4}w � 10�6 � ma p (2)
where � (ml of C2H4/ml of H2O/atm) represents the Bunsen solubilitycoefficient of C2H4 (3), ma is the measured concentration of C2H4 in theequilibrated headspace (in parts per million by volume), and p is atmo-spheric pressure (atm) of dry air. The C2H4 concentration in the initialseawater ({C2H4}aq in ml of C2H4/ml of H2O) was calculated, assumingmass balance, as follows:
{C2H4}aq � ({C2H4}w Vw � 10�6 ma Va) ⁄ Vw � 10�6 ma (�pVw
� Va) ⁄ Vw (3)
where Vw is the water sample size (ml) and Va is the volume of headspaceair (ml), followed by the conversion of {C2H4}aq to units in nM ([C2H4]aq)as follows:
[C2H4]aq � 109 � p{C2H4}aq ⁄ (RT) (4)
where R is the gas constant (0.08206 atm liter mol�1 K�1) and T is tem-perature (K). After the C2H4 concentrations in sample and control treat-ments were measured at both the beginning and end of the incubationperiod, the rate of C2H4 production was calculated as follows:
(Csfinal � Ccfinal) � (Cst � 0 � Cst � 0) ⁄ �t (5)
where C represents the concentration of C2H4 in the sample (s) and thecontrol treatment (c), as calculated using equations 1 to 3, at the end(final) or beginning (t�0) of the incubation period.
15N2 assimilation technique. In conjunction with the AR assay, wealso measured N2 fixation using the 15N2 assimilation technique. It wasrecently shown that the addition of 15N2 gas as a bubble resulted in theunderestimation of rates of N2 fixation in cultures of Crocosphaera (28).Therefore, the present work compared rates of 15N2 fixation when 15N2
gas was added either as a bubble or dissolved in seawater samples collectedfrom discrete depths in the upper 50 m of the water column at StnALOHA. We describe below the preparation of the 15N2-enriched seawa-ter and the sample collection, preparation, and analysis.
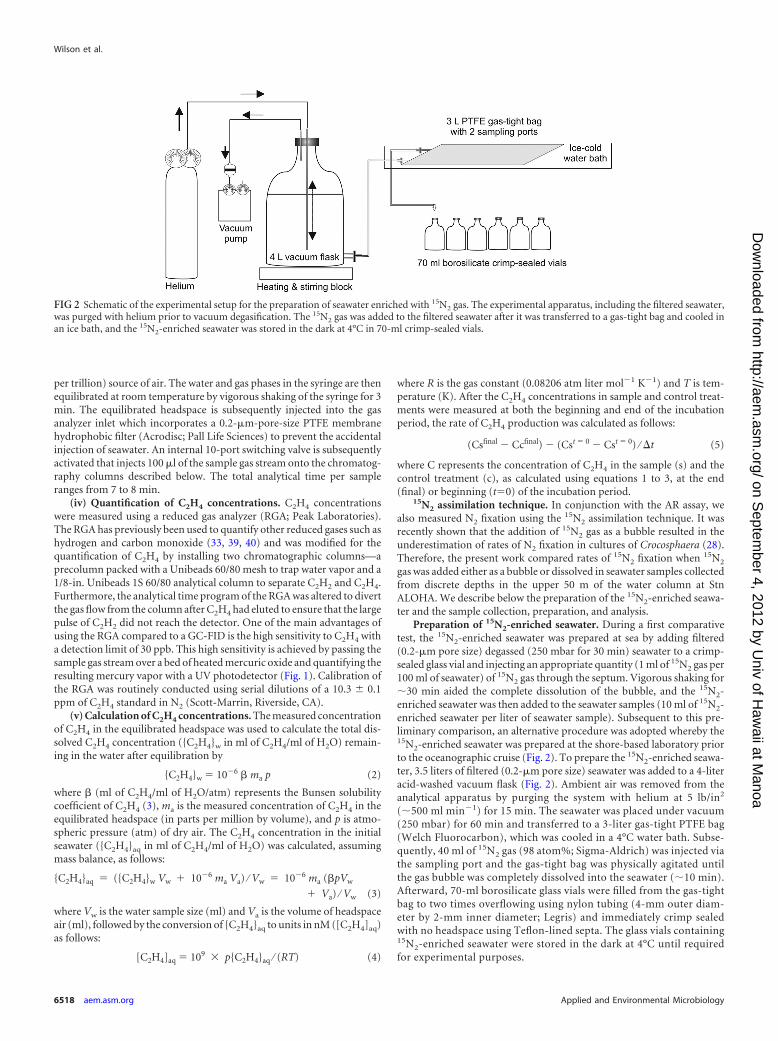
Preparation of 15N2-enriched seawater. During a first comparativetest, the 15N2-enriched seawater was prepared at sea by adding filtered(0.2-�m pore size) degassed (250 mbar for 30 min) seawater to a crimp-sealed glass vial and injecting an appropriate quantity (1 ml of 15N2 gas per100 ml of seawater) of 15N2 gas through the septum. Vigorous shaking for�30 min aided the complete dissolution of the bubble, and the 15N2-enriched seawater was then added to the seawater samples (10 ml of 15N2-enriched seawater per liter of seawater sample). Subsequent to this pre-liminary comparison, an alternative procedure was adopted whereby the15N2-enriched seawater was prepared at the shore-based laboratory priorto the oceanographic cruise (Fig. 2). To prepare the 15N2-enriched seawa-ter, 3.5 liters of filtered (0.2-�m pore size) seawater was added to a 4-literacid-washed vacuum flask (Fig. 2). Ambient air was removed from theanalytical apparatus by purging the system with helium at 5 lb/in2
(�500 ml min�1) for 15 min. The seawater was placed under vacuum(250 mbar) for 60 min and transferred to a 3-liter gas-tight PTFE bag(Welch Fluorocarbon), which was cooled in a 4°C water bath. Subse-quently, 40 ml of 15N2 gas (98 atom%; Sigma-Aldrich) was injected viathe sampling port and the gas-tight bag was physically agitated untilthe gas bubble was completely dissolved into the seawater (�10 min).Afterward, 70-ml borosilicate glass vials were filled from the gas-tightbag to two times overflowing using nylon tubing (4-mm outer diam-eter by 2-mm inner diameter; Legris) and immediately crimp sealedwith no headspace using Teflon-lined septa. The glass vials containing15N2-enriched seawater were stored in the dark at 4°C until requiredfor experimental purposes.
FIG 2 Schematic of the experimental setup for the preparation of seawater enriched with 15N2 gas. The experimental apparatus, including the filtered seawater,was purged with helium prior to vacuum degasification. The 15N2 gas was added to the filtered seawater after it was transferred to a gas-tight bag and cooled inan ice bath, and the 15N2-enriched seawater was stored in the dark at 4°C in 70-ml crimp-sealed vials.
Wilson et al.
6518 aem.asm.org Applied and Environmental Microbiology
on Septem
ber 4, 2012 by Univ of H
awaii at M
anoahttp://aem
.asm.org/
Dow
nloaded from
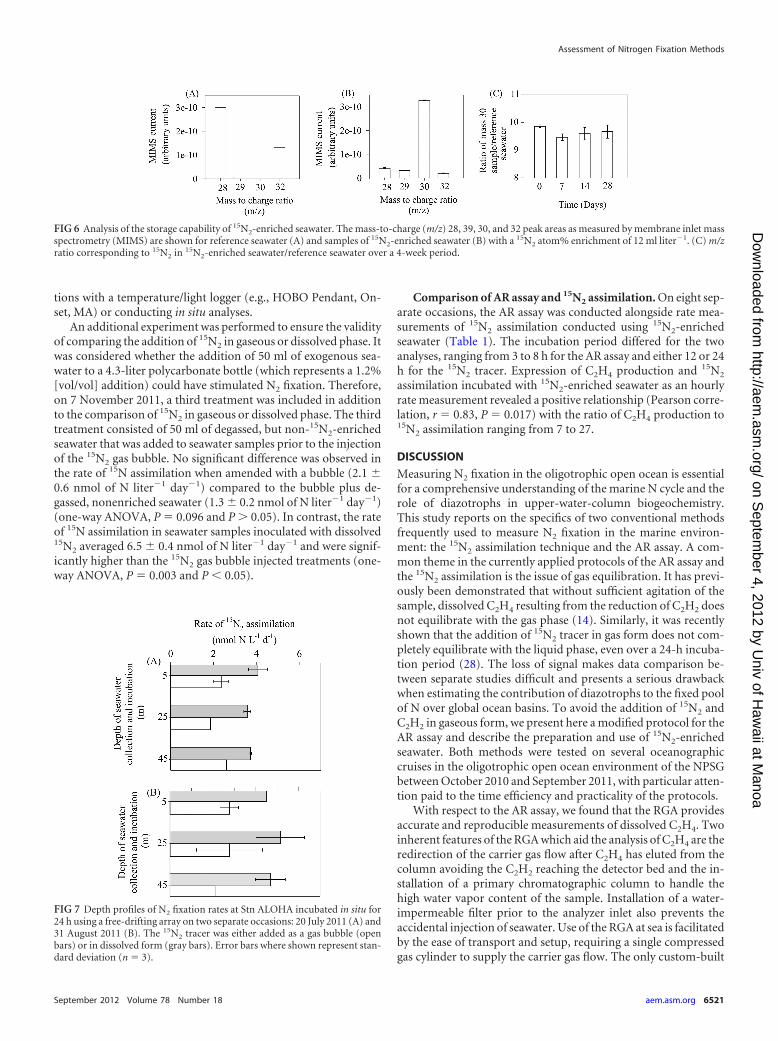
Validation of 15N2-enriched seawater. One of the major consider-ations for any analytical method is the ease of its application and althoughthe 15N2-enriched seawater was prepared at sea on one occasion, it wasfound to be more time efficient to prepare the 15N2-enriched seawater onland prior to its use at sea. We therefore investigated the feasibility ofstoring the 15N2-enriched seawater in crimp-sealed 70-ml borosilicateglass vials over a 4-week period by analyzing the dissolved 15N2 content atweekly intervals using a membrane inlet mass spectrometer (MIMS) (23).In brief, the MIMS provides rapid and accurate measurements of gasratios by coupling semipermeable, microbore tubing with the inlet vac-uum line of a quadrupole mass spectrometer. Reference measurementsconsisted of a 1-liter reservoir of filtered (0.2-�m pore size) surface sea-water collected from Stn ALOHA. Instrument drift in the N2/Ar ratio overthe 4-week period was 0.6%. The analytical temperature for referenceseawater and samples was kept constant at 25°C by immersing 1/16-in.stainless steel inlet tubing inside a water bath. The gases analyzed includedthose with a mass to charge ratio of 28, 30, and 32 (corresponding to 14N2,15N2, and O2), and they were detected sequentially using a repetitive cycleof 1.5 Hz. Replicate samples of prepared 15N2-enriched seawater wereanalyzed for the loss of 15N2 at weekly intervals over a 1-month period,comparing the ratio of mass 30 in 15N2-enriched seawater/reference sea-water.
Sample collection, inoculation, and incubation. Seawater sampleswere collected using a CTD-rosette from depths of 5, 25, and 45 m andsubsampled into acid-washed and seawater-rinsed 4.3-liter polycarbonatebottles. Once the bottles were completely filled, 50 ml of seawater wasremoved and replaced with 50 ml of 15N2-enriched seawater from the70-ml crimp-sealed vials using a 50-ml glass syringe, resulting in a final15N2 enrichment of 1.5 atom%. The syringe was attached to a 15-cmlength of 1/8-in. PTFE tubing which enabled the 15N2-enriched seawaterto be added below the neck of the 4.3-liter polycarbonate bottle. Bottleswere carefully closed using septum closure caps (Thermo Scientific) withno headspace and inverted 20 times. In addition, replicate seawater sam-ples which had been filled and capped with no headspace were injectedwith 3 ml of 15N2 gas (98 atom%; Sigma-Aldrich) using a gas-tight syringe(SGE Analytical Sciences) through the septum cap into the bottle. The3-ml 15N2 gas-injected sample bottles were gently shaken, and then all ofthe bottles were incubated using either (i) a free-floating in situ array atthree depths consisting of 5, 25, and 45 m (as described in reference 9) or(ii) deckboard incubators plumbed with surface seawater and shaded to50, 25, and 10% of full sunlight to represent 5, 25, and 45 m.
Sample analysis and calculation of 15N enrichment. At the end of theincubation period, the entire content of the 4.3-liter polycarbonate bottleswas filtered onto combusted (450°C for 5 h) 25-mm glass fiber filters thatwere subsequently placed on combusted foil pieces in polystyrene petridishes and stored frozen at �20°C for transport. To quantify the 15N2
enrichment of particulate material, samples were dried at 60°C for �24 hand pelleted before analysis with an elemental analyzer-isotope ratio massspectrometer (EA-IRMA Carlo Erba NC2500 coupled to a Thermo-Finni-gan Delta S) by the Stable Isotope Facility, University of Hawaii.
N2 fixation rates were determined from the particulate N (PN) and�15N-PN content of incubated samples, the 15N atom% enrichment, am-bient dissolved N2 concentration, and the �15N-PN for control (un-amended) samples. The �15N-PN of control samples (described as theAPPN-initial in equation 6 below) was provided by natural abundance PNconcentration and �15N-PN at a depth of 25 m in the water column at StnALOHA. Atmospheric N2 gas is used as the reference standard (15N/14N �0.0036765, �15N � 0‰). After the isotope mass balance calculation, therates of N2 fixation rates were expressed as PN by including a factor of 2 (asdescribed in reference 30):
V(t�1) � (APPN-final � APPN-initial) ⁄ (APN2
� APPN-initial) · 1 ⁄ �t · PNfinal ⁄ 2 (6)
where AP is the atom% 15N of the sample (e.g., PNfinal) or substrate (i.e.,N2) pool and t is the length of the sample incubation period.
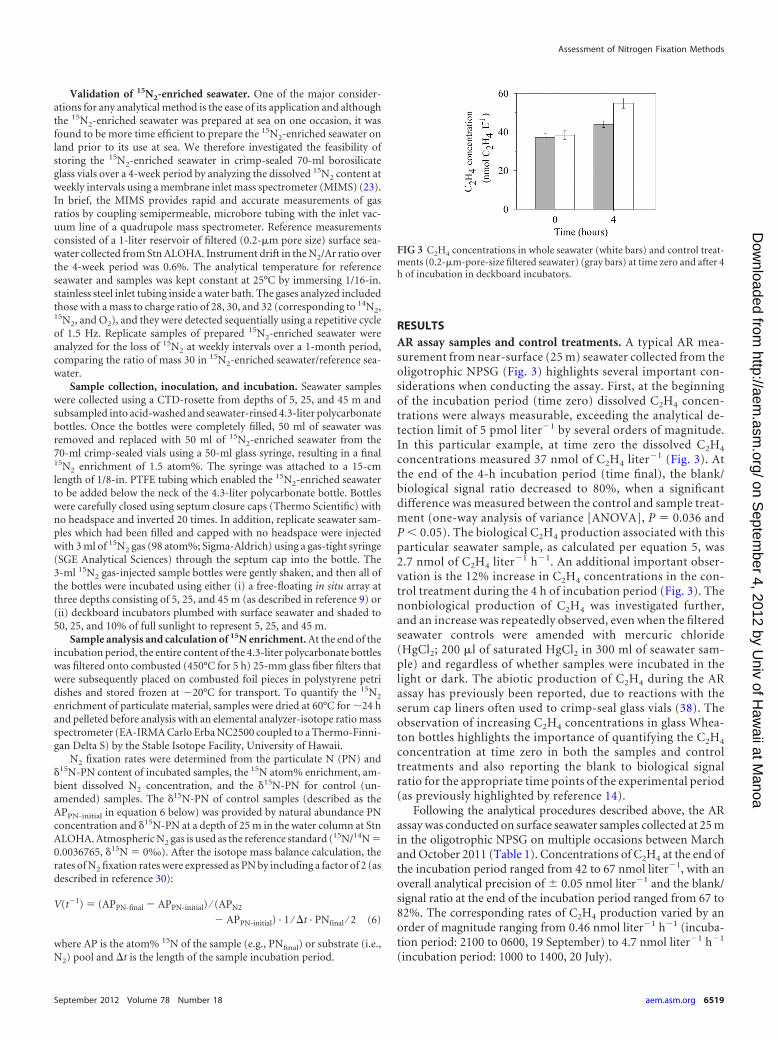
RESULTSAR assay samples and control treatments. A typical AR mea-surement from near-surface (25 m) seawater collected from theoligotrophic NPSG (Fig. 3) highlights several important con-siderations when conducting the assay. First, at the beginningof the incubation period (time zero) dissolved C2H4 concen-trations were always measurable, exceeding the analytical de-tection limit of 5 pmol liter�1 by several orders of magnitude.In this particular example, at time zero the dissolved C2H4
concentrations measured 37 nmol of C2H4 liter�1 (Fig. 3). Atthe end of the 4-h incubation period (time final), the blank/biological signal ratio decreased to 80%, when a significantdifference was measured between the control and sample treat-ment (one-way analysis of variance [ANOVA], P � 0.036 andP � 0.05). The biological C2H4 production associated with thisparticular seawater sample, as calculated per equation 5, was2.7 nmol of C2H4 liter�1 h�1. An additional important obser-vation is the 12% increase in C2H4 concentrations in the con-trol treatment during the 4 h of incubation period (Fig. 3). Thenonbiological production of C2H4 was investigated further,and an increase was repeatedly observed, even when the filteredseawater controls were amended with mercuric chloride(HgCl2; 200 �l of saturated HgCl2 in 300 ml of seawater sam-ple) and regardless of whether samples were incubated in thelight or dark. The abiotic production of C2H4 during the ARassay has previously been reported, due to reactions with theserum cap liners often used to crimp-seal glass vials (38). Theobservation of increasing C2H4 concentrations in glass Whea-ton bottles highlights the importance of quantifying the C2H4
concentration at time zero in both the samples and controltreatments and also reporting the blank to biological signalratio for the appropriate time points of the experimental period(as previously highlighted by reference 14).
Following the analytical procedures described above, the ARassay was conducted on surface seawater samples collected at 25 min the oligotrophic NPSG on multiple occasions between Marchand October 2011 (Table 1). Concentrations of C2H4 at the end ofthe incubation period ranged from 42 to 67 nmol liter�1, with anoverall analytical precision of � 0.05 nmol liter�1 and the blank/signal ratio at the end of the incubation period ranged from 67 to82%. The corresponding rates of C2H4 production varied by anorder of magnitude ranging from 0.46 nmol liter�1 h�1 (incuba-tion period: 2100 to 0600, 19 September) to 4.7 nmol liter�1 h�1
(incubation period: 1000 to 1400, 20 July).
FIG 3 C2H4 concentrations in whole seawater (white bars) and control treat-ments (0.2-�m-pore-size filtered seawater) (gray bars) at time zero and after 4h of incubation in deckboard incubators.
Assessment of Nitrogen Fixation Methods
September 2012 Volume 78 Number 18 aem.asm.org 6519
on Septem
ber 4, 2012 by Univ of H
awaii at M
anoahttp://aem
.asm.org/
Dow
nloaded from
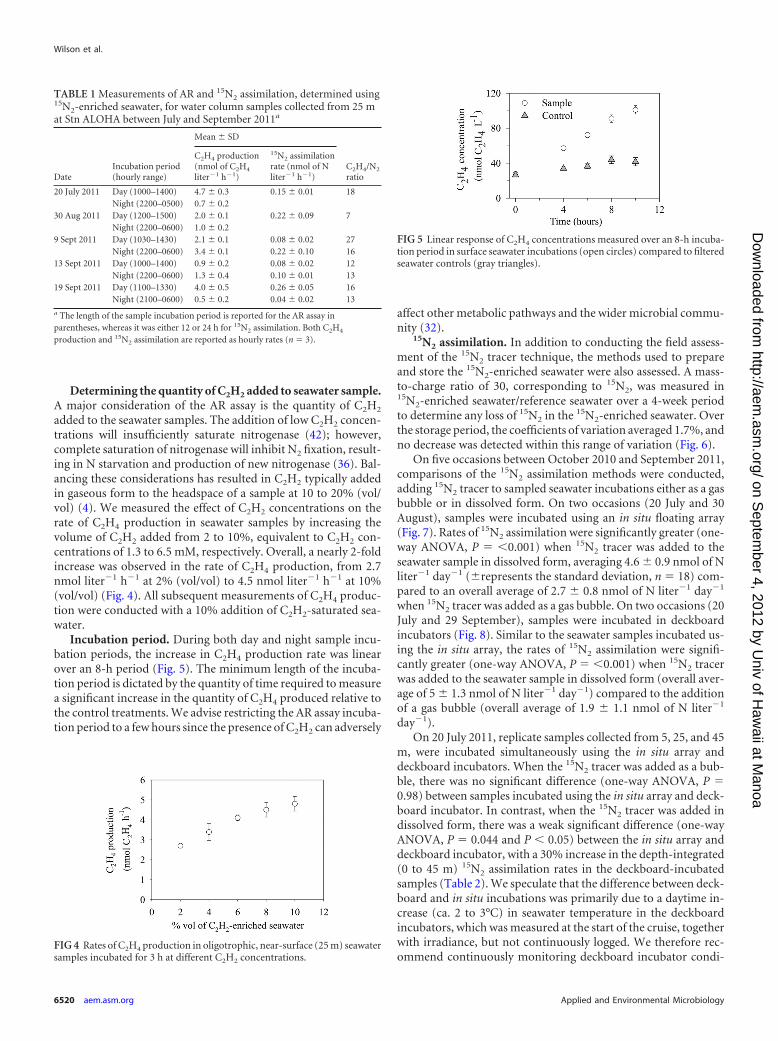
Determining the quantity of C2H2 added to seawater sample.A major consideration of the AR assay is the quantity of C2H2
added to the seawater samples. The addition of low C2H2 concen-trations will insufficiently saturate nitrogenase (42); however,complete saturation of nitrogenase will inhibit N2 fixation, result-ing in N starvation and production of new nitrogenase (36). Bal-ancing these considerations has resulted in C2H2 typically addedin gaseous form to the headspace of a sample at 10 to 20% (vol/vol) (4). We measured the effect of C2H2 concentrations on therate of C2H4 production in seawater samples by increasing thevolume of C2H2 added from 2 to 10%, equivalent to C2H2 con-centrations of 1.3 to 6.5 mM, respectively. Overall, a nearly 2-foldincrease was observed in the rate of C2H4 production, from 2.7nmol liter�1 h�1 at 2% (vol/vol) to 4.5 nmol liter�1 h�1 at 10%(vol/vol) (Fig. 4). All subsequent measurements of C2H4 produc-tion were conducted with a 10% addition of C2H2-saturated sea-water.
Incubation period. During both day and night sample incu-bation periods, the increase in C2H4 production rate was linearover an 8-h period (Fig. 5). The minimum length of the incuba-tion period is dictated by the quantity of time required to measurea significant increase in the quantity of C2H4 produced relative tothe control treatments. We advise restricting the AR assay incuba-tion period to a few hours since the presence of C2H2 can adversely
affect other metabolic pathways and the wider microbial commu-nity (32).
15N2 assimilation. In addition to conducting the field assess-ment of the 15N2 tracer technique, the methods used to prepareand store the 15N2-enriched seawater were also assessed. A mass-to-charge ratio of 30, corresponding to 15N2, was measured in15N2-enriched seawater/reference seawater over a 4-week periodto determine any loss of 15N2 in the 15N2-enriched seawater. Overthe storage period, the coefficients of variation averaged 1.7%, andno decrease was detected within this range of variation (Fig. 6).
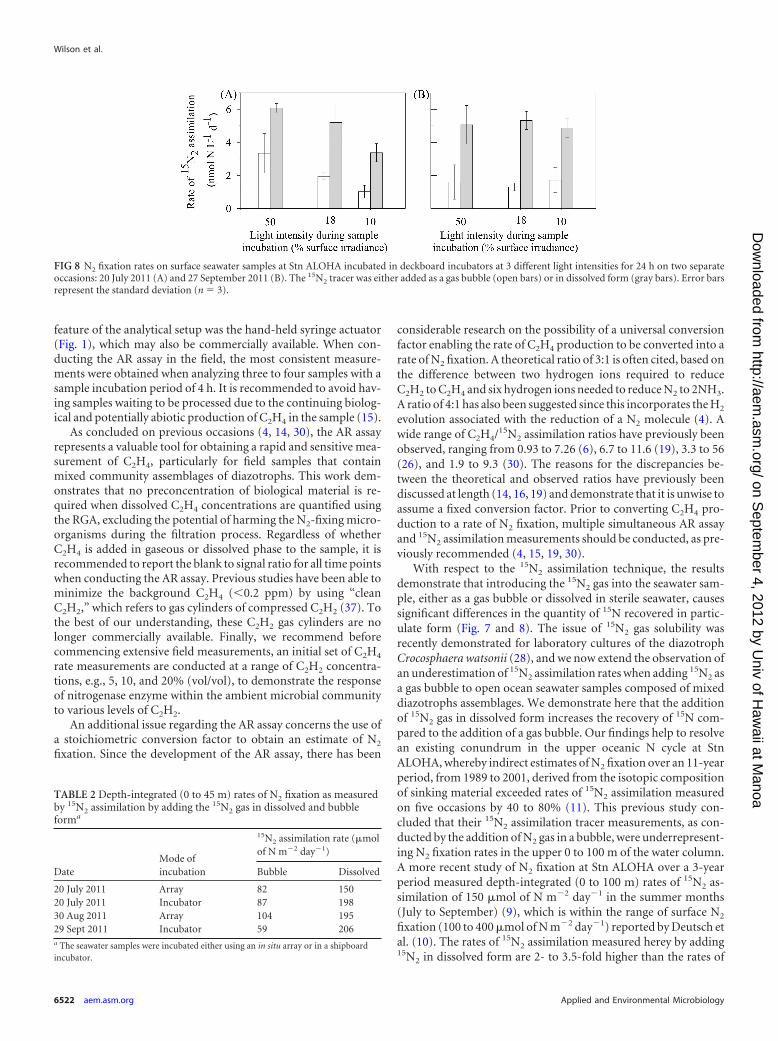
On five occasions between October 2010 and September 2011,comparisons of the 15N2 assimilation methods were conducted,adding 15N2 tracer to sampled seawater incubations either as a gasbubble or in dissolved form. On two occasions (20 July and 30August), samples were incubated using an in situ floating array(Fig. 7). Rates of 15N2 assimilation were significantly greater (one-way ANOVA, P � �0.001) when 15N2 tracer was added to theseawater sample in dissolved form, averaging 4.6 � 0.9 nmol of Nliter�1 day�1 (�represents the standard deviation, n � 18) com-pared to an overall average of 2.7 � 0.8 nmol of N liter�1 day�1
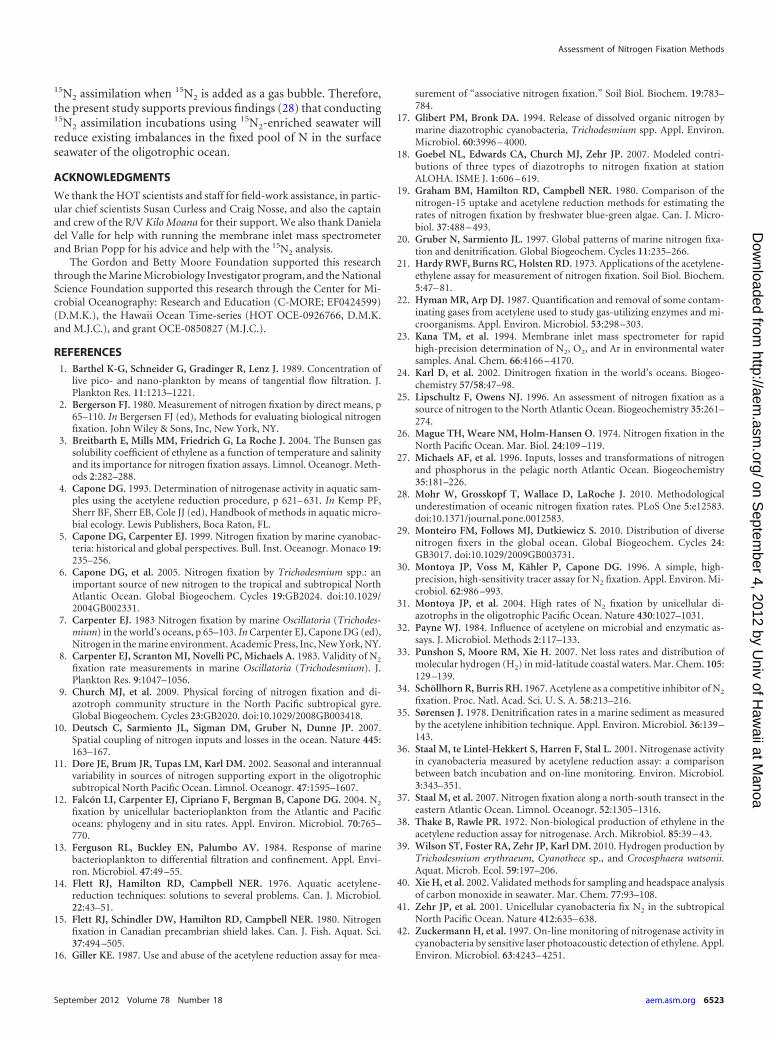
when 15N2 tracer was added as a gas bubble. On two occasions (20July and 29 September), samples were incubated in deckboardincubators (Fig. 8). Similar to the seawater samples incubated us-ing the in situ array, the rates of 15N2 assimilation were signifi-cantly greater (one-way ANOVA, P � �0.001) when 15N2 tracerwas added to the seawater sample in dissolved form (overall aver-age of 5 � 1.3 nmol of N liter�1 day�1) compared to the additionof a gas bubble (overall average of 1.9 � 1.1 nmol of N liter�1
day�1).On 20 July 2011, replicate samples collected from 5, 25, and 45
m, were incubated simultaneously using the in situ array anddeckboard incubators. When the 15N2 tracer was added as a bub-ble, there was no significant difference (one-way ANOVA, P �0.98) between samples incubated using the in situ array and deck-board incubator. In contrast, when the 15N2 tracer was added indissolved form, there was a weak significant difference (one-wayANOVA, P � 0.044 and P � 0.05) between the in situ array anddeckboard incubator, with a 30% increase in the depth-integrated(0 to 45 m) 15N2 assimilation rates in the deckboard-incubatedsamples (Table 2). We speculate that the difference between deck-board and in situ incubations was primarily due to a daytime in-crease (ca. 2 to 3°C) in seawater temperature in the deckboardincubators, which was measured at the start of the cruise, togetherwith irradiance, but not continuously logged. We therefore rec-ommend continuously monitoring deckboard incubator condi-
TABLE 1 Measurements of AR and 15N2 assimilation, determined using15N2-enriched seawater, for water column samples collected from 25 mat Stn ALOHA between July and September 2011a
DateIncubation period(hourly range)
Mean � SD
C2H4/N2
ratio
C2H4 production(nmol of C2H4
liter�1 h�1)
15N2 assimilationrate (nmol of Nliter�1 h�1)
20 July 2011 Day (1000–1400) 4.7 � 0.3 0.15 � 0.01 18Night (2200–0500) 0.7 � 0.2
30 Aug 2011 Day (1200–1500) 2.0 � 0.1 0.22 � 0.09 7Night (2200–0600) 1.0 � 0.2
9 Sept 2011 Day (1030–1430) 2.1 � 0.1 0.08 � 0.02 27Night (2200–0600) 3.4 � 0.1 0.22 � 0.10 16
13 Sept 2011 Day (1000–1400) 0.9 � 0.2 0.08 � 0.02 12Night (2200–0600) 1.3 � 0.4 0.10 � 0.01 13
19 Sept 2011 Day (1100–1330) 4.0 � 0.5 0.26 � 0.05 16Night (2100–0600) 0.5 � 0.2 0.04 � 0.02 13
a The length of the sample incubation period is reported for the AR assay inparentheses, whereas it was either 12 or 24 h for 15N2 assimilation. Both C2H4
production and 15N2 assimilation are reported as hourly rates (n � 3).
FIG 4 Rates of C2H4 production in oligotrophic, near-surface (25 m) seawatersamples incubated for 3 h at different C2H2 concentrations.
FIG 5 Linear response of C2H4 concentrations measured over an 8-h incuba-tion period in surface seawater incubations (open circles) compared to filteredseawater controls (gray triangles).
Wilson et al.
6520 aem.asm.org Applied and Environmental Microbiology
on Septem
ber 4, 2012 by Univ of H
awaii at M
anoahttp://aem
.asm.org/
Dow
nloaded from
tions with a temperature/light logger (e.g., HOBO Pendant, On-set, MA) or conducting in situ analyses.
An additional experiment was performed to ensure the validityof comparing the addition of 15N2 in gaseous or dissolved phase. Itwas considered whether the addition of 50 ml of exogenous sea-water to a 4.3-liter polycarbonate bottle (which represents a 1.2%[vol/vol] addition) could have stimulated N2 fixation. Therefore,on 7 November 2011, a third treatment was included in additionto the comparison of 15N2 in gaseous or dissolved phase. The thirdtreatment consisted of 50 ml of degassed, but non-15N2-enrichedseawater that was added to seawater samples prior to the injectionof the 15N2 gas bubble. No significant difference was observed inthe rate of 15N assimilation when amended with a bubble (2.1 �0.6 nmol of N liter�1 day�1) compared to the bubble plus de-gassed, nonenriched seawater (1.3 � 0.2 nmol of N liter�1 day�1)(one-way ANOVA, P � 0.096 and P 0.05). In contrast, the rateof 15N assimilation in seawater samples inoculated with dissolved15N2 averaged 6.5 � 0.4 nmol of N liter�1 day�1 and were signif-icantly higher than the 15N2 gas bubble injected treatments (one-way ANOVA, P � 0.003 and P � 0.05).
Comparison of AR assay and 15N2 assimilation. On eight sep-arate occasions, the AR assay was conducted alongside rate mea-surements of 15N2 assimilation conducted using 15N2-enrichedseawater (Table 1). The incubation period differed for the twoanalyses, ranging from 3 to 8 h for the AR assay and either 12 or 24h for the 15N2 tracer. Expression of C2H4 production and 15N2
assimilation incubated with 15N2-enriched seawater as an hourlyrate measurement revealed a positive relationship (Pearson corre-lation, r � 0.83, P � 0.017) with the ratio of C2H4 production to15N2 assimilation ranging from 7 to 27.
DISCUSSION
Measuring N2 fixation in the oligotrophic open ocean is essentialfor a comprehensive understanding of the marine N cycle and therole of diazotrophs in upper-water-column biogeochemistry.This study reports on the specifics of two conventional methodsfrequently used to measure N2 fixation in the marine environ-ment: the 15N2 assimilation technique and the AR assay. A com-mon theme in the currently applied protocols of the AR assay andthe 15N2 assimilation is the issue of gas equilibration. It has previ-ously been demonstrated that without sufficient agitation of thesample, dissolved C2H4 resulting from the reduction of C2H2 doesnot equilibrate with the gas phase (14). Similarly, it was recentlyshown that the addition of 15N2 tracer in gas form does not com-pletely equilibrate with the liquid phase, even over a 24-h incuba-tion period (28). The loss of signal makes data comparison be-tween separate studies difficult and presents a serious drawbackwhen estimating the contribution of diazotrophs to the fixed poolof N over global ocean basins. To avoid the addition of 15N2 andC2H2 in gaseous form, we present here a modified protocol for theAR assay and describe the preparation and use of 15N2-enrichedseawater. Both methods were tested on several oceanographiccruises in the oligotrophic open ocean environment of the NPSGbetween October 2010 and September 2011, with particular atten-tion paid to the time efficiency and practicality of the protocols.
With respect to the AR assay, we found that the RGA providesaccurate and reproducible measurements of dissolved C2H4. Twoinherent features of the RGA which aid the analysis of C2H4 are theredirection of the carrier gas flow after C2H4 has eluted from thecolumn avoiding the C2H2 reaching the detector bed and the in-stallation of a primary chromatographic column to handle thehigh water vapor content of the sample. Installation of a water-impermeable filter prior to the analyzer inlet also prevents theaccidental injection of seawater. Use of the RGA at sea is facilitatedby the ease of transport and setup, requiring a single compressedgas cylinder to supply the carrier gas flow. The only custom-built
FIG 6 Analysis of the storage capability of 15N2-enriched seawater. The mass-to-charge (m/z) 28, 39, 30, and 32 peak areas as measured by membrane inlet massspectrometry (MIMS) are shown for reference seawater (A) and samples of 15N2-enriched seawater (B) with a 15N2 atom% enrichment of 12 ml liter�1. (C) m/zratio corresponding to 15N2 in 15N2-enriched seawater/reference seawater over a 4-week period.
FIG 7 Depth profiles of N2 fixation rates at Stn ALOHA incubated in situ for24 h using a free-drifting array on two separate occasions: 20 July 2011 (A) and31 August 2011 (B). The 15N2 tracer was either added as a gas bubble (openbars) or in dissolved form (gray bars). Error bars where shown represent stan-dard deviation (n � 3).
Assessment of Nitrogen Fixation Methods
September 2012 Volume 78 Number 18 aem.asm.org 6521
on Septem
ber 4, 2012 by Univ of H
awaii at M
anoahttp://aem
.asm.org/
Dow
nloaded from
feature of the analytical setup was the hand-held syringe actuator(Fig. 1), which may also be commercially available. When con-ducting the AR assay in the field, the most consistent measure-ments were obtained when analyzing three to four samples with asample incubation period of 4 h. It is recommended to avoid hav-ing samples waiting to be processed due to the continuing biolog-ical and potentially abiotic production of C2H4 in the sample (15).
As concluded on previous occasions (4, 14, 30), the AR assayrepresents a valuable tool for obtaining a rapid and sensitive mea-surement of C2H4, particularly for field samples that containmixed community assemblages of diazotrophs. This work dem-onstrates that no preconcentration of biological material is re-quired when dissolved C2H4 concentrations are quantified usingthe RGA, excluding the potential of harming the N2-fixing micro-organisms during the filtration process. Regardless of whetherC2H4 is added in gaseous or dissolved phase to the sample, it isrecommended to report the blank to signal ratio for all time pointswhen conducting the AR assay. Previous studies have been able tominimize the background C2H4 (�0.2 ppm) by using “cleanC2H2,” which refers to gas cylinders of compressed C2H2 (37). Tothe best of our understanding, these C2H2 gas cylinders are nolonger commercially available. Finally, we recommend beforecommencing extensive field measurements, an initial set of C2H4
rate measurements are conducted at a range of C2H2 concentra-tions, e.g., 5, 10, and 20% (vol/vol), to demonstrate the responseof nitrogenase enzyme within the ambient microbial communityto various levels of C2H2.
An additional issue regarding the AR assay concerns the use ofa stoichiometric conversion factor to obtain an estimate of N2
fixation. Since the development of the AR assay, there has been
considerable research on the possibility of a universal conversionfactor enabling the rate of C2H4 production to be converted into arate of N2 fixation. A theoretical ratio of 3:1 is often cited, based onthe difference between two hydrogen ions required to reduceC2H2 to C2H4 and six hydrogen ions needed to reduce N2 to 2NH3.A ratio of 4:1 has also been suggested since this incorporates the H2
evolution associated with the reduction of a N2 molecule (4). Awide range of C2H4/15N2 assimilation ratios have previously beenobserved, ranging from 0.93 to 7.26 (6), 6.7 to 11.6 (19), 3.3 to 56(26), and 1.9 to 9.3 (30). The reasons for the discrepancies be-tween the theoretical and observed ratios have previously beendiscussed at length (14, 16, 19) and demonstrate that it is unwise toassume a fixed conversion factor. Prior to converting C2H4 pro-duction to a rate of N2 fixation, multiple simultaneous AR assayand 15N2 assimilation measurements should be conducted, as pre-viously recommended (4, 15, 19, 30).
With respect to the 15N2 assimilation technique, the resultsdemonstrate that introducing the 15N2 gas into the seawater sam-ple, either as a gas bubble or dissolved in sterile seawater, causessignificant differences in the quantity of 15N recovered in partic-ulate form (Fig. 7 and 8). The issue of 15N2 gas solubility wasrecently demonstrated for laboratory cultures of the diazotrophCrocosphaera watsonii (28), and we now extend the observation ofan underestimation of 15N2 assimilation rates when adding 15N2 asa gas bubble to open ocean seawater samples composed of mixeddiazotrophs assemblages. We demonstrate here that the additionof 15N2 gas in dissolved form increases the recovery of 15N com-pared to the addition of a gas bubble. Our findings help to resolvean existing conundrum in the upper oceanic N cycle at StnALOHA, whereby indirect estimates of N2 fixation over an 11-yearperiod, from 1989 to 2001, derived from the isotopic compositionof sinking material exceeded rates of 15N2 assimilation measuredon five occasions by 40 to 80% (11). This previous study con-cluded that their 15N2 assimilation tracer measurements, as con-ducted by the addition of N2 gas in a bubble, were underrepresent-ing N2 fixation rates in the upper 0 to 100 m of the water column.A more recent study of N2 fixation at Stn ALOHA over a 3-yearperiod measured depth-integrated (0 to 100 m) rates of 15N2 as-similation of 150 �mol of N m�2 day�1 in the summer months(July to September) (9), which is within the range of surface N2
fixation (100 to 400 �mol of N m�2 day�1) reported by Deutsch etal. (10). The rates of 15N2 assimilation measured herey by adding15N2 in dissolved form are 2- to 3.5-fold higher than the rates of
FIG 8 N2 fixation rates on surface seawater samples at Stn ALOHA incubated in deckboard incubators at 3 different light intensities for 24 h on two separateoccasions: 20 July 2011 (A) and 27 September 2011 (B). The 15N2 tracer was either added as a gas bubble (open bars) or in dissolved form (gray bars). Error barsrepresent the standard deviation (n � 3).
TABLE 2 Depth-integrated (0 to 45 m) rates of N2 fixation as measuredby 15N2 assimilation by adding the 15N2 gas in dissolved and bubbleforma
DateMode ofincubation
15N2 assimilation rate (�molof N m�2 day�1)
Bubble Dissolved
20 July 2011 Array 82 15020 July 2011 Incubator 87 19830 Aug 2011 Array 104 19529 Sept 2011 Incubator 59 206a The seawater samples were incubated either using an in situ array or in a shipboardincubator.
Wilson et al.
6522 aem.asm.org Applied and Environmental Microbiology
on Septem
ber 4, 2012 by Univ of H
awaii at M
anoahttp://aem
.asm.org/
Dow
nloaded from
15N2 assimilation when 15N2 is added as a gas bubble. Therefore,the present study supports previous findings (28) that conducting15N2 assimilation incubations using 15N2-enriched seawater willreduce existing imbalances in the fixed pool of N in the surfaceseawater of the oligotrophic ocean.
ACKNOWLEDGMENTS
We thank the HOT scientists and staff for field-work assistance, in partic-ular chief scientists Susan Curless and Craig Nosse, and also the captainand crew of the R/V Kilo Moana for their support. We also thank Danieladel Valle for help with running the membrane inlet mass spectrometerand Brian Popp for his advice and help with the 15N2 analysis.
The Gordon and Betty Moore Foundation supported this researchthrough the Marine Microbiology Investigator program, and the NationalScience Foundation supported this research through the Center for Mi-crobial Oceanography: Research and Education (C-MORE; EF0424599)(D.M.K.), the Hawaii Ocean Time-series (HOT OCE-0926766, D.M.K.and M.J.C.), and grant OCE-0850827 (M.J.C.).
REFERENCES1. Barthel K-G, Schneider G, Gradinger R, Lenz J. 1989. Concentration of
live pico- and nano-plankton by means of tangential flow filtration. J.Plankton Res. 11:1213–1221.
2. Bergerson FJ. 1980. Measurement of nitrogen fixation by direct means, p65–110. In Bergersen FJ (ed), Methods for evaluating biological nitrogenfixation. John Wiley & Sons, Inc, New York, NY.
3. Breitbarth E, Mills MM, Friedrich G, La Roche J. 2004. The Bunsen gassolubility coefficient of ethylene as a function of temperature and salinityand its importance for nitrogen fixation assays. Limnol. Oceanogr. Meth-ods 2:282–288.
4. Capone DG. 1993. Determination of nitrogenase activity in aquatic sam-ples using the acetylene reduction procedure, p 621– 631. In Kemp PF,Sherr BF, Sherr EB, Cole JJ (ed), Handbook of methods in aquatic micro-bial ecology. Lewis Publishers, Boca Raton, FL.
5. Capone DG, Carpenter EJ. 1999. Nitrogen fixation by marine cyanobac-teria: historical and global perspectives. Bull. Inst. Oceanogr. Monaco 19:235–256.
6. Capone DG, et al. 2005. Nitrogen fixation by Trichodesmium spp.: animportant source of new nitrogen to the tropical and subtropical NorthAtlantic Ocean. Global Biogeochem. Cycles 19:GB2024. doi:10.1029/2004GB002331.
7. Carpenter EJ. 1983 Nitrogen fixation by marine Oscillatoria (Trichodes-mium) in the world’s oceans, p 65–103. In Carpenter EJ, Capone DG (ed),Nitrogen in the marine environment. Academic Press, Inc, New York, NY.
8. Carpenter EJ, Scranton MI, Novelli PC, Michaels A. 1983. Validity of N2
fixation rate measurements in marine Oscillatoria (Trichodesmium). J.Plankton Res. 9:1047–1056.
9. Church MJ, et al. 2009. Physical forcing of nitrogen fixation and di-azotroph community structure in the North Pacific subtropical gyre.Global Biogeochem. Cycles 23:GB2020. doi:10.1029/2008GB003418.
10. Deutsch C, Sarmiento JL, Sigman DM, Gruber N, Dunne JP. 2007.Spatial coupling of nitrogen inputs and losses in the ocean. Nature 445:163–167.
11. Dore JE, Brum JR, Tupas LM, Karl DM. 2002. Seasonal and interannualvariability in sources of nitrogen supporting export in the oligotrophicsubtropical North Pacific Ocean. Limnol. Oceanogr. 47:1595–1607.
12. Falcón LI, Carpenter EJ, Cipriano F, Bergman B, Capone DG. 2004. N2
fixation by unicellular bacterioplankton from the Atlantic and Pacificoceans: phylogeny and in situ rates. Appl. Environ. Microbiol. 70:765–770.
13. Ferguson RL, Buckley EN, Palumbo AV. 1984. Response of marinebacterioplankton to differential filtration and confinement. Appl. Envi-ron. Microbiol. 47:49 –55.
14. Flett RJ, Hamilton RD, Campbell NER. 1976. Aquatic acetylene-reduction techniques: solutions to several problems. Can. J. Microbiol.22:43–51.
15. Flett RJ, Schindler DW, Hamilton RD, Campbell NER. 1980. Nitrogenfixation in Canadian precambrian shield lakes. Can. J. Fish. Aquat. Sci.37:494 –505.
16. Giller KE. 1987. Use and abuse of the acetylene reduction assay for mea-
surement of “associative nitrogen fixation.” Soil Biol. Biochem. 19:783–784.
17. Glibert PM, Bronk DA. 1994. Release of dissolved organic nitrogen bymarine diazotrophic cyanobacteria, Trichodesmium spp. Appl. Environ.Microbiol. 60:3996 – 4000.
18. Goebel NL, Edwards CA, Church MJ, Zehr JP. 2007. Modeled contri-butions of three types of diazotrophs to nitrogen fixation at stationALOHA. ISME J. 1:606 – 619.
19. Graham BM, Hamilton RD, Campbell NER. 1980. Comparison of thenitrogen-15 uptake and acetylene reduction methods for estimating therates of nitrogen fixation by freshwater blue-green algae. Can. J. Micro-biol. 37:488 – 493.
20. Gruber N, Sarmiento JL. 1997. Global patterns of marine nitrogen fixa-tion and denitrification. Global Biogeochem. Cycles 11:235–266.
21. Hardy RWF, Burns RC, Holsten RD. 1973. Applications of the acetylene-ethylene assay for measurement of nitrogen fixation. Soil Biol. Biochem.5:47– 81.
22. Hyman MR, Arp DJ. 1987. Quantification and removal of some contam-inating gases from acetylene used to study gas-utilizing enzymes and mi-croorganisms. Appl. Environ. Microbiol. 53:298 –303.
23. Kana TM, et al. 1994. Membrane inlet mass spectrometer for rapidhigh-precision determination of N2, O2, and Ar in environmental watersamples. Anal. Chem. 66:4166 – 4170.
24. Karl D, et al. 2002. Dinitrogen fixation in the world’s oceans. Biogeo-chemistry 57/58:47–98.
25. Lipschultz F, Owens NJ. 1996. An assessment of nitrogen fixation as asource of nitrogen to the North Atlantic Ocean. Biogeochemistry 35:261–274.
26. Mague TH, Weare NM, Holm-Hansen O. 1974. Nitrogen fixation in theNorth Pacific Ocean. Mar. Biol. 24:109 –119.
27. Michaels AF, et al. 1996. Inputs, losses and transformations of nitrogenand phosphorus in the pelagic north Atlantic Ocean. Biogeochemistry35:181–226.
28. Mohr W, Grosskopf T, Wallace D, LaRoche J. 2010. Methodologicalunderestimation of oceanic nitrogen fixation rates. PLoS One 5:e12583.doi:10.1371/journal.pone.0012583.
29. Monteiro FM, Follows MJ, Dutkiewicz S. 2010. Distribution of diversenitrogen fixers in the global ocean. Global Biogeochem. Cycles 24:GB3017. doi:10.1029/2009GB003731.
30. Montoya JP, Voss M, Kähler P, Capone DG. 1996. A simple, high-precision, high-sensitivity tracer assay for N2 fixation. Appl. Environ. Mi-crobiol. 62:986 –993.
31. Montoya JP, et al. 2004. High rates of N2 fixation by unicellular di-azotrophs in the oligotrophic Pacific Ocean. Nature 430:1027–1031.
32. Payne WJ. 1984. Influence of acetylene on microbial and enzymatic as-says. J. Microbiol. Methods 2:117–133.
33. Punshon S, Moore RM, Xie H. 2007. Net loss rates and distribution ofmolecular hydrogen (H2) in mid-latitude coastal waters. Mar. Chem. 105:129 –139.
34. Schöllhorn R, Burris RH. 1967. Acetylene as a competitive inhibitor of N2
fixation. Proc. Natl. Acad. Sci. U. S. A. 58:213–216.35. Sørensen J. 1978. Denitrification rates in a marine sediment as measured
by the acetylene inhibition technique. Appl. Environ. Microbiol. 36:139 –143.
36. Staal M, te Lintel-Hekkert S, Harren F, Stal L. 2001. Nitrogenase activityin cyanobacteria measured by acetylene reduction assay: a comparisonbetween batch incubation and on-line monitoring. Environ. Microbiol.3:343–351.
37. Staal M, et al. 2007. Nitrogen fixation along a north-south transect in theeastern Atlantic Ocean. Limnol. Oceanogr. 52:1305–1316.
38. Thake B, Rawle PR. 1972. Non-biological production of ethylene in theacetylene reduction assay for nitrogenase. Arch. Mikrobiol. 85:39 – 43.
39. Wilson ST, Foster RA, Zehr JP, Karl DM. 2010. Hydrogen production byTrichodesmium erythraeum, Cyanothece sp., and Crocosphaera watsonii.Aquat. Microb. Ecol. 59:197–206.
40. Xie H, et al. 2002. Validated methods for sampling and headspace analysisof carbon monoxide in seawater. Mar. Chem. 77:93–108.
41. Zehr JP, et al. 2001. Unicellular cyanobacteria fix N2 in the subtropicalNorth Pacific Ocean. Nature 412:635– 638.
42. Zuckermann H, et al. 1997. On-line monitoring of nitrogenase activity incyanobacteria by sensitive laser photoacoustic detection of ethylene. Appl.Environ. Microbiol. 63:4243– 4251.
Assessment of Nitrogen Fixation Methods
September 2012 Volume 78 Number 18 aem.asm.org 6523
on Septem
ber 4, 2012 by Univ of H
awaii at M
anoahttp://aem
.asm.org/
Dow
nloaded from