Embed Size (px)
Citation preview

Comparative Analysis of Residential Heating Systems
2010 Analysis Update
Prepared for Propane Education & Research Council
by Newport Partners LLC
June 2010

Comparative Analysis of Residential Heating Systems i 2010 Analysis Update
About the Authors This research project was conducted by Newport Partners LLC of Davidsonville, MD. Newport Partners performs technical, regulatory, and market research and analysis related to the built environment, with a specific focus on the energy performance of buildings and building systems.

Comparative Analysis of Residential Heating Systems ii 2010 Analysis Update
Executive Summary Builders, contractors, and homeowners today face a myriad of options for home heating systems. Traditional furnaces and boilers, high efficiency models, heat pumps (both air-source and ground-source), and even dual fuel systems are all options. Sorting out the best choice for a home requires consideration of system costs, efficiency levels, energy rates, comfort levels, the severity of the climate, and any applicable incentives or credits. Carbon emissions have evolved as another critical system characteristic, whether the emissions result from combusting a fossil fuel on-site or from an upstream electric power generation plant. When considering residential heating systems on a national basis, the importance of these issues is even greater. America’s 111 million housing units are responsible for 22% of the nation’s total energy use each year, while generating 21% of the nation’s carbon emissions. Residential heating systems present a unique and high impact opportunity to influence existing homes’ energy performance and carbon emissions, because they are replaced on a regular interval and represent the largest energy end-use in the home in much of the country. At a time when energy prices are rising, new technologies are emerging in the residential market, and programs and regulations are developing to limit carbon emissions, this study provides unique insights into the performance of home heating systems. This 2010 release of the study updates the original 2009 report with more current energy prices (2009 data) from the U.S. Energy Information Administration. In analyzing 14 heating systems in 16 different locations across the U.S., the study allows comparisons of key metrics such as annual operating costs, CO2 emissions, and simple paybacks for higher first cost, more efficient systems. The heating systems assessed include mainstream system types such as furnaces, boilers, and air-source heat pumps, as well as less common options including dual fuel systems and ground-source heat pumps. The energy sources are electricity, fuel oil, and propane, and most of the systems are evaluated at a high efficiency and a standard efficiency level. Each of these systems is analyzed in a typical new U.S. home as well as a typical existing home, so that the results speak to new construction as well as options for heating system replacements. Due to the extensive number of variables involved (e.g. efficiency ratings, energy costs, system costs, prototype house characteristics), the study followed a detailed methodology that treated such variables in a consistent and logical manner. The findings reveal that system selection is a balance of several factors. For instance, the lowest first cost system – a standard efficiency propane furnace with standard efficiency central A/C – has slightly higher annual operating costs than the standard efficiency air source heat pump (~$250). However, this air source heat pump (ASHP) also costs about $650 more up front and emits more than double the quantity of carbon emissions as the propane furnace. In another example, the attractive operating costs for ground-source heat pumps (GSHPs) must

Comparative Analysis of Residential Heating Systems iii 2010 Analysis Update
be weighed against a significantly higher first cost compared to other high efficiency alternatives such as a dual fuel system (ASHP with 95% efficient propane furnace back-up) or a 95% efficient propane furnace.
Some systems emerge as strong candidates for applications in new and/or existing homes due to a combination of high operating efficiency, reasonable first costs, reasonable energy rates, and better carbon emissions than competing systems. For instance, the graph below evaluates different heating and cooling system replacement options for an existing home in the Cold Climate zone. It is assumed that the home already has duct work, and that the main replacement system under consideration is a standard efficiency air source heat pump.
Simple Payback of Various Heating and Cooling Systems for Cold Climate Existing Homes, assuming a
Standard Efficiency Air Source Heat Pump as the Baseline Replacement System
A high efficiency propane furnace coupled with a standard central A/C has both lower first cost and lower operating costs compared to the baseline ASHP system, and thus offers immediate payback. Other system alternatives with relatively short (≤ 2 years) paybacks include the high efficiency fuel oil forced-air furnace (System G) and the dual fuel systems (Systems M, N).
Comparative Analysis of Residential Heating Systems iv 2010 Analysis Update
The carbon emissions from heating system operation show significantly lower emissions from high efficiency propane-based systems and dual fuel systems. Air-source heat pumps experience much higher emission rates, especially in the coal-based Midwest, due to less efficient operation at colder temperatures. Considering these findings along with the system replacement scenario shown above, excellent opportunities exist to simultaneously improve efficiency and carbon emissions in existing homes. Emissions analysis for propane- and fuel oil-based heating systems in the Northeast also revealed significantly lower emissions rates for propane systems of comparable efficiency levels to heating oil counterparts. In the Midwest region, ground source heat pump systems - despite their efficiency ratings – actually showed higher carbon emissions than most propane-based and dual fuel heating systems. The greatly reduced carbon emissions which result from some heating systems also indicate the potential for future decisions on technologies to more heavily weigh this factor in the interest of managing both emissions and energy consumption. This report is available in PDF form at www.buildwithpropane.com.

Comparative Analysis of Residential Heating Systems v 2010 Analysis Update
Contents
Introduction .................................................................................................................................... 1
2010 Analysis Update ..................................................................................................................... 1
Methodology and Background Data ............................................................................................... 3
Development of House Prototypes ............................................................................................. 4
Selection of Analysis Locations ................................................................................................... 4
Specifications for Heating/Cooling Systems ............................................................................... 6
Emissions Factors ........................................................................................................................ 9
System Costs................................................................................................................................ 9
Energy Rates .............................................................................................................................. 11
Scope Limitations ...................................................................................................................... 12
Key Findings .................................................................................................................................. 13
Operating Costs ......................................................................................................................... 13
Simple Paybacks ........................................................................................................................ 15
Emissions ................................................................................................................................... 24
Conclusions ................................................................................................................................... 30
Appendices .................................................................................................................................... 32
Appendix A: Energy Rates Methodology .................................................................................. 33
Appendix B: Annual CO2 Emissions Resulting from Heating Energy ........................................ 35

Comparative Analysis of Residential Heating Systems 1 2010 Analysis Update
Introduction Builders, contractors, and homeowners today face a myriad of options for home heating systems. Traditional furnaces and boilers, high efficiency models, heat pumps (both air-source and ground-source), and even dual fuel systems are all options. Sorting out the best choices requires taking a close look at system costs, efficiency levels, energy rates, comfort levels, the severity of the climate, and any applicable incentives including tax credits. In addition to these considerations, one other factor is more important now than ever before: how “green” a system is – especially in terms of the carbon emissions which result from its operation. Beyond homeowners and builders, energy efficiency and environmental advocates also have a keen interest in the energy/environmental performance of residential heating systems. Collectively, America’s 111 million housing units have a tremendous impact on the nation’s energy consumption and carbon emissions, representing 22% and 21% of the nation’s total, respectively. Residential heating systems are generally replaced on a regular interval (~12-18 years), and heating system replacements far outweigh the number of new home installations. This means that there exists an ongoing opportunity to positively affect the energy and environmental performance of residential heating systems in America’s homes. This is important to note given that most housing characteristics which impact heating energy use are more challenging to alter after the initial construction of the home (e.g. wall insulation, foundation insulation, duct location). Heating system efficiency upgrades represent a unique and high impact opportunity. This research project examined the performance of 14 heating systems in 16 different locations across the U.S. The 14 heating systems included mainstream types of units and fuel sources, as well as a few less common systems. The heating systems were analyzed in terms of their first cost, operating cost, emissions, and simple payback. “Operating cost” is defined as the cost for heating and cooling energy within this study, and does not include maintenance. Systems were evaluated for new homes as well as retrofits in existing homes. The study was conducted according to a detailed research methodology which created a consistent analysis framework, and also utilized third-party data for most inputs into the analysis.
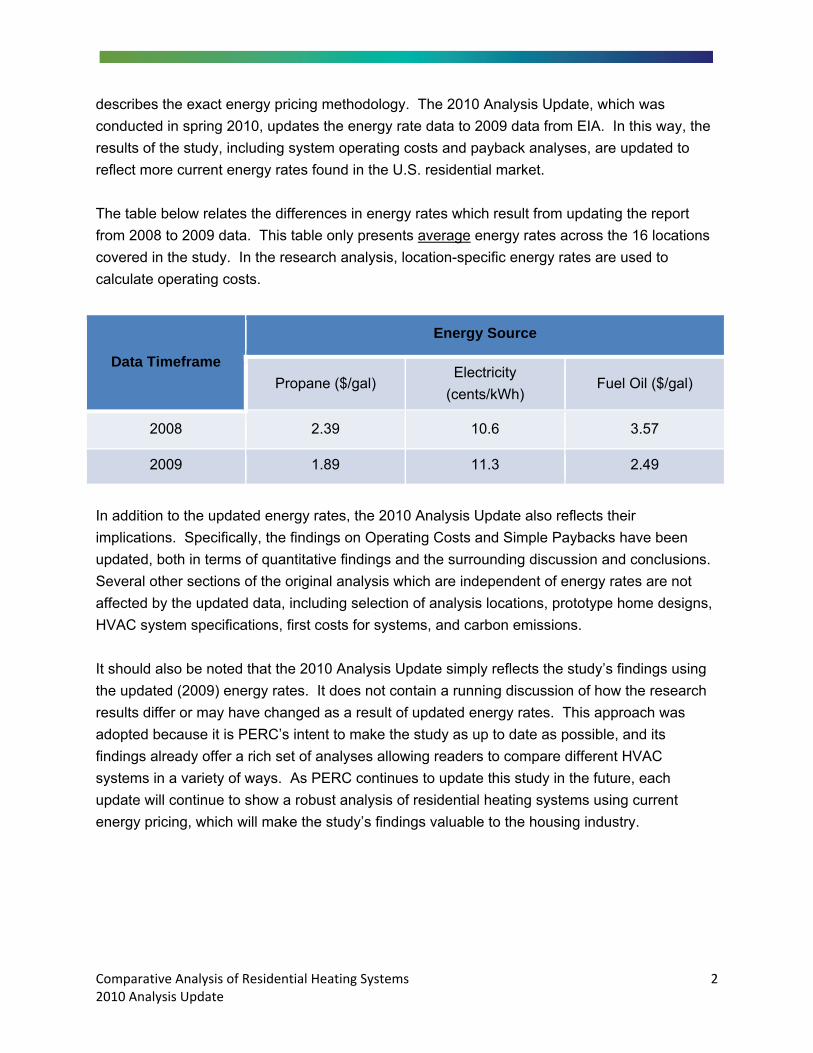
2010 Analysis Update This report, referred to as the “2010 Analysis Update,” revisits the original study which was released in June 2009. The purpose of revisiting the original report is to update the study with more current residential energy rates for propane, heating oil, and electricity. The original study, which was conducted from fall 2008 through spring 2009, was based on 2008 energy rates data from the U.S. Energy Information Administration (EIA). The Energy Rates section in this report
Comparative Analysis of Residential Heating Systems 2 2010 Analysis Update
describes the exact energy pricing methodology. The 2010 Analysis Update, which was conducted in spring 2010, updates the energy rate data to 2009 data from EIA. In this way, the results of the study, including system operating costs and payback analyses, are updated to reflect more current energy rates found in the U.S. residential market. The table below relates the differences in energy rates which result from updating the report from 2008 to 2009 data. This table only presents average energy rates across the 16 locations covered in the study. In the research analysis, location-specific energy rates are used to calculate operating costs.
Data Timeframe
Energy Source
Propane ($/gal) Electricity
(cents/kWh) Fuel Oil ($/gal)
2008 2.39 10.6 3.57
2009 1.89 11.3 2.49
In addition to the updated energy rates, the 2010 Analysis Update also reflects their implications. Specifically, the findings on Operating Costs and Simple Paybacks have been updated, both in terms of quantitative findings and the surrounding discussion and conclusions. Several other sections of the original analysis which are independent of energy rates are not affected by the updated data, including selection of analysis locations, prototype home designs, HVAC system specifications, first costs for systems, and carbon emissions. It should also be noted that the 2010 Analysis Update simply reflects the study’s findings using the updated (2009) energy rates. It does not contain a running discussion of how the research results differ or may have changed as a result of updated energy rates. This approach was adopted because it is PERC’s intent to make the study as up to date as possible, and its findings already offer a rich set of analyses allowing readers to compare different HVAC systems in a variety of ways. As PERC continues to update this study in the future, each update will continue to show a robust analysis of residential heating systems using current energy pricing, which will make the study’s findings valuable to the housing industry.

Comparative Analysis of Residential Heating Systems 3 2010 Analysis Update
Methodology and Background Data A detailed methodology was developed to guide this analysis of a broad array of heating systems across multiple locations in the U.S., for both new and existing homes. This methodology provided for a consistent approach to the analysis across the many variables which were involved. A basic overview of the analysis methodology is shown below in Figure 1.
Development of New & Existing Home Prototypes
Selection of 16 Analysis Locations
Specifications for Heating/Cooling
Systems
Energy Performance & Emissions Simulations
Energy Rates
System Costs
Operating Cost Analysis & Paybacks
Emission Factors
Figure 1: Analysis Methodology and Sequence of Analysis
As indicated in the figure, the main sections of the methodology fall into these categories:

Comparative Analysis of Residential Heating Systems 4 2010 Analysis Update
Development of House Prototypes The analysis called for assessing heating system performance in both new and existing homes. To facilitate this, prototype home designs were developed using historical housing characteristics data. This data helped to define a “typical” house in terms of square footage, number of stories, foundation type, window area, insulation values, duct location, etc. Characteristics such as foundation type, insulation levels, and window specifications were varied by location. Also, housing characteristics for the existing home prototype were based roughly on a 1973 home, as this was the median date of construction for the existing U.S. housing stock when this analysis was initially conducted in 2008-2009.
The primary data sources used for the development of house prototypes were U.S. Energy Information Administration’s (EIA) Residential Energy Consumption Survey (RECS), data from U.S. DOE’s Building America program, U.S. Census Bureau, and current building codes such as the 2006 International Energy Conservation Code (IECC). Figure 2 below illustrates the basic characteristics of both the new and existing home prototypes. Building Characteristic Existing Home Prototype New Home Prototype Above-Grade square footage 1,660 SF 2,434 SF Number of stories 1 1 or 2, depending on location
Foundation Type Slab, crawlspace, and basement – depending on location
Slab, crawlspace, and basement – depending on location
Window Area 15% of above-grade gross wall area
15% of above-grade gross wall area
Attic R-Value R-7 up to R-22, depending on location
R-30 up to R-49, depending on location
Wall R-Value R-9 R-13 to R-21, depending on location
Figure 2: Characteristics of Existing and New Prototype Homes In general, the smaller size of the existing homes was outweighed by the lower insulating values of building shell components, which typically resulted in higher heating loads and larger capacity HVAC systems for the existing homes.
Selection of Analysis Locations A total of 16 analysis locations were selected from across the U.S. The locations span 5 of the Climate Zones typically used in U.S. building codes, including most of the U.S. except for the warmest regions where heating system performance is not nearly as significant in terms of energy use or cost. A map of the analysis locations is shown below in Figure 3.

Comparative Analysis of Residential Heating Systems 5 2010 Analysis Update
Figure 3: Analysis Locations
Map Source: U.S. DOE Building America Program: “Guide to Determining Climate Regions by County,” 2007.

Comparative Analysis of Residential Heating Systems 6 2010 Analysis Update
Specifications for Heating/Cooling Systems For each system, specific parameters such as efficiency levels were determined to define the system for the energy modeling. For “standard” equipment, the system efficiency levels were based on federally regulated minimum levels (e.g. a 78% AFUE propane furnace was the federal and market minimum when this study commenced in 2007). In the case of “high efficiency” equipment, system efficiency ratings were based on the thresholds set by the federal tax credits for energy efficiency, which were recently updated with the passage of the American Recovery and Reinvestment Act of 2009. In most cases, these efficiency levels were adopted into the study to define a high efficiency system, such as a 95% AFUE propane furnace. In one case however, the efficiency level of a system was adjusted because it was very difficult to identify such equipment in the marketplace at the specified efficiency using industry equipment databases such as the AHRI equipment directory1. So for this particular system, a high efficiency fuel-oil boiler, the efficiency rating used in the study was adjusted to reflect products available in the marketplace. The heating systems examined in the study along with their associated efficiency ratings are shown below in Figure 4. Additionally, overall system design parameters were also developed for the analyses. The capacity of each heating system (e.g., a 48 kBtu/hour furnace) was based on a Manual J load calculation for each home in the analysis, as determined using Right-J software which utilizes the 8th edition of the Manual J load analysis procedure. Manual J is the residential industry’s standard analysis method for determining the heating and cooling loads for a home. Over-sizing limits for the capacity of the systems (e.g., how much larger should the furnace be than the exact heating design load) followed common industry guidance from groups such as the Air-Conditioning Contractors of America (ACCA) and the ENERGY STAR Homes program. Other components of each heating system were also specified, including general characteristics of the distribution system (forced-air ducts or hydronic tubing). And in the case of ground source heat pumps (GSHPs), a loop field design was developed using common GSHP design software (Right-Radiant) to estimate the depth of vertical wells and the total length of piping. A vertical well system was assumed in the loop field analysis (as opposed to another configuration such as horizontal) because it was a safe assumption that nearly all building sites can accommodate a vertical well system, whether for new construction or retrofit and regardless of lot size. In the absence of site-specific data, average values were assumed for items such as soil conductivity (1.0 Btuh/ft*°F). The system characteristics and specifications were input into both the energy modeling software (REM/Rate v12.61) as well as the cost estimating phases of the project. 1 Air‐Conditioning, Heating, and Refrigeration Institute equipment directory: www.ahridirectory.org/

Comparative Analysis of Residential Heating Systems 7 2010 Analysis Update
Another set of assumptions deals with the system configurations with respect to cooling. In the new homes analysis, it was assumed that each of the 14 systems would include both heating and cooling functions. So a propane furnace, for example, was also coupled with a central A/C unit. This was done to create a level playing field in terms of first costs, since heat pump systems (air-source or ground-source) provide both heating and cooling in a single unit. To treat these systems fairly in terms of first cost, heating-only systems like a furnace were combined with a cooling system, the cost of which was included in the first cost estimate for that system. The only exception to this treatment of cooling equipment was for two locations with very modest cooling demands: Duluth, MN and Burlington, VT. In these locations no central cooling system was included. In existing homes, the assumptions on first cost for new equipment were different. In the existing home analysis it was assumed that a heating system change-out was limited to heating only, so no first cost was applied for a cooling system. For example, the first cost associated with installing a new high efficiency propane furnace in Buffalo, NY was limited to the cost of the furnace, without including the cost of a new cooling system as well. Also in existing homes, it was assumed that the distribution system for a new heating system, whether central ducts or hydronic tubing, was already in place. Thus the first cost for a new heating system in an existing home did not incorporate costs for purchasing and installing distribution system components. Finally, heating systems which rely on fuel oil were only evaluated in those markets where this energy source is most common (the Northeast US).

Comparative Analysis of Residential Heating Systems 8 2010 Analysis Update
Fuel Source
Heating System Type* System Efficiency Ratings
Furnaces* (with central A/C)
• Standard Efficiency Propane • High Efficiency Propane • Standard Efficiency Fuel Oil • High Efficiency Fuel Oil
• 78 AFUE w/ 13 SEER A/C • 95 AFUE w/ 13 SEER A/C • 78 AFUE w/ 13 SEER A/C • 95 AFUE w/ 13 SEER A/C
Boilers* (with central A/C)
• High Efficiency Propane with Forced-Air (water/air heat HX) • High Efficiency Fuel Oil w/ Forced-air (water/air HX) • Standard Efficiency Propane Hydronic with Baseboard Radiant • High Efficiency Propane Hydronic with In-Floor Radiant • High Efficiency Fuel Oil Hydronic with In-Floor Radiant
• 95 AFUE w/ 13 SEER A/C • 86 AFUE w/ 13 SEER A/C • 80 AFUE w/ 13 SEER A/C • 95 AFUE w/ 13 SEER A/C • 86 AFUE w/ 13 SEER A/C
GSHPs • GSHP Closed Loop System with Electric Resistance Back-up • EER=14.1; COP=3.3
ASHPs
• Standard Efficiency ASHP with Electric Resistance Back-up • High Efficiency ASHP with Electric Resistance Back-up • Standard Efficiency ASHP w/ High Efficiency Propane Furnace Back-up • High Efficiency ASHP with High Efficiency Propane Furnace Back-up
• 13 SEER; HSPF 7.7 • 15 SEER; HSPF 8.5 • 13 SEER; HSPF 7.7; 95 AFUE • 15 SEER; HSPF 8.5; 95 AFUE
*Heating-only systems (boilers and furnaces) were combined with a standard central cooling system in all locations except Burlington, VT and Duluth, MN for the purpose of cost estimating systems in new homes and assessing overall system operating costs
Figure 4: Heating Systems and Efficiency Ratings

Comparative Analysis of Residential Heating Systems 9 2010 Analysis Update
Emissions Factors Beyond energy performance, another very important performance metric of residential heating systems is their environmental footprint in terms of carbon emissions. The CO2 emissions which are associated with the operation of each heating system in each location were analyzed as part of this project. This analysis was conducted through the use of “emissions factors” integrated into the REM/Rate V12.61 software from U.S. EPA’s Emissions & Generation Resource Integrated Database (eGRID). These emission factors provide a multiplier to estimate the emissions which result from the production of a unit of electricity. The emissions factors within REM/Rate are given down to the state level. So for a given state, the emissions factor takes into account the mix of fuel sources used to generate electricity in that state (e.g. coal, nuclear, hydro) and develops the state’s emission factor based on this blend of sources. For this reason, a unit of electricity in a state with a high proportion of hydropower-generated electricity will result in lower emissions than a unit of electricity in a state heavily reliant on coal-generated electricity.
System Costs Equipment and installation costs (referred to as “First Costs”), for both new installations and system change-outs in existing homes, were estimated for each system using industry cost estimating data with location factors. As mentioned above, in the case of the new home analysis the system cost included both heating and cooling equipment (in all but two locations). In the case of heat pumps, these functions were covered with a single heat pump system, whereas for boilers and furnaces a separate central A/C unit was added. The cost components included in the estimate of a system’s first cost included the following:
• Equipment cost, as a function of equipment type and system size (e.g. 48 kBtu/hr)
• Equipment installation cost
• Distribution system cost (e.g., forced-air ducts or hydronic tubing for hot water systems) for new construction applications
• Distribution system installation cost, for new construction applications
• Loop field for GSHP systems, including drilling costs, pump costs, and tubing costs Most of these cost estimates were available through R.S. Means 2009 Mechanical Cost Data and R.S. Means 2008 Residential Cost Data. For these data points, location factors were also applied to reflect labor costs in particular regions. For those cost data which were not available from industry cost estimating resources, independent surveys were conducted to obtain average

Comparative Analysis of Residential Heating Systems 10 2010 Analysis Update
costs. Such surveys including researching pricing of equipment through online resources, or in the case of GSHP drilling costs involved directly contacting several dozen contractors and collecting cost data. For the 14 systems analyzed, the average first cost of each system across all 16 locations for new homes is shown in Figure 5 below.
System* Average
First Costs of System
A – Standard efficiency propane forced-air furnace w/ 13 SEER A/C $8,848B - High efficiency propane forced-air furnace w/ 13 SEER A/C $9,108C - High efficiency propane boiler with forced-air (water/air HX) w/ 13 SEER A/C $14,769D - Standard eff. propane boiler system with baseboard radiation w/ 13 SEER A/C $14,165E - High efficiency propane boiler system with in-floor radiant heat w/ 13 SEER A/C $23,877F – Standard efficiency fuel oil forced-air furnace w/ 13 SEER A/C $8,985G - High efficiency fuel oil forced-air furnace w/ 13 SEER A/C $11,245H - High efficiency fuel oil boiler with forced-air (water/air HX) w/ 13 SEER A/C $12,065I - High efficiency fuel oil boiler system with in-floor radiant heat w/ 13 SEER A/C $20,189J - GSHP closed loop system with electric resistance back-up $22,378K - Standard efficiency ASHP with electric resistance back-up $9,482L - High efficiency ASHP with electric resistance back-up $10,337M - Standard efficiency ASHP with high efficiency propane furnace back-up $10,573N - High efficiency ASHP with high efficiency propane furnace back-up $11,428
*Average system costs across all 16 locations are shown. Note that for the 2 coldest locations, furnace and boiler systems did not include a central cooling system.
Figure 5: Average First Cost for Heating/Cooling Systems of New Homes For the systems listed above, the system costs include heating plus cooling equipment. Thus, all of the first costs for boiler and furnace systems also include a cost for an accompanying central A/C system. The only exception to this is for the two climates (Burlington, VT and Duluth, MN) where cooling systems were not added to furnaces and boilers. The first costs for these two locations are averaged in with the other 14 locations. Highlights of the first cost estimates for the 14 systems include the following points:
• Standard efficiency fossil-fired (propane and fuel oil) furnaces are the least expensive systems
• The marginal first cost for upgrading from a standard efficiency to high efficiency unit was lowest for propane furnaces, at less than 5%

Comparative Analysis of Residential Heating Systems 11 2010 Analysis Update
• The marginal first cost for upgrading from an air-source heat pump to an air-source heat pump with a high efficiency propane furnace back-up (System K vs M; System L vs N) was modest, at about 11%
• The higher first cost for in-floor radiant systems (Systems E and I) is largely driven by the cost of the in-floor hydronic distribution system plus that fact that these homes also had to incorporate forced-air duct work for central cooling in all but 2 locations.
• The higher first cost of ground-source heat pumps is driven significantly by the cost of the ground loop drilling and materials.
Energy Rates While the energy simulations were used to develop projections of the energy consumption of each system in each location, actual energy rates (e.g., cents per kWh of electricity) were needed to develop operating cost data. Energy rates used in the study were derived from market data which is regularly collected and made available by the U.S. Energy Information Administration (EIA). At the time of the 2010 Analysis Update, data from the U.S. Energy Information Administration for the 2009 calendar year was obtained for deriving estimates of residential rates for heating oil, propane, and electricity. EIA’s energy rate data is arranged by geographic regions such as states, regions, and other geographic groupings, which allowed this study to develop rates for each location in the study (as a function of the state). Additional information on the Energy Rate Methodology is included in Appendix A. The results of this effort – which are the energy rates used in the analysis – are shown in Figure 6 below. Fuel oil prices are only provided for those locations (Burlington, VT and Buffalo, NY) where these systems were analyzed.

Comparative Analysis of Residential Heating Systems 12 2010 Analysis Update
City State Residential
Propane Price ($/gal)
Residential Heating Oil Price
($/gal)
Residential Electricity Price
($/kWh) Baltimore MD 2.38 N/A 0.15 Boise ID 1.77 N/A 0.08 Buffalo NY 2.34 2.48 0.18 Burlington VT 2.55 2.50 0.15 Columbia MO 1.59 N/A 0.08 Des Moines IA 1.43 N/A 0.10 Duluth MN 1.60 N/A 0.10 Grand Rapids MI 1.86 N/A 0.12 Indianapolis IN 1.82 N/A 0.09 Las Vegas NV 2.00 N/A 0.13 Madison WI 1.63 N/A 0.12 Mansfield OH 1.91 N/A 0.11 Montgomery AL 2.03 N/A 0.11 Nashville TN 1.66 N/A 0.09 Peoria IL 1.66 N/A 0.11 Portland OR 2.00 N/A 0.09 Average $1.89 $2.49 $0.11
Figure 6: Energy Rates used in the Analysis
Scope Limitations This study covered a wide array of heating systems, new and existing homes, and locations throughout the U.S. The scope did not cover several issues however, including financial incentives or tax credits for systems, the ability of some systems to provide domestic hot water supply in certain configurations, or costs for maintenance. Incentives and credits for systems were not included in the analysis because federal, state, and utility-based incentives vary widely, are temporary measures subject to change, and will have different financial impacts for individuals depending on their financial and tax status. The ability of some systems to produce domestic hot water was not assessed because the vast majority of heating systems do not provide this function, and even among those systems capable of providing hot water they are sometimes not set up to do so. Even in cases where a system is capable of providing hot water and is set up to do so, the efficiency and energy-savings benefit of this operation depends heavily on the actual hot water demand in the home, which varies widely. Lastly, system maintenance was not included in the analysis of system costs because it is applied inconsistently in the real world, and its overall significance relative to first costs and heating/cooling energy costs was modest. For this reason “operating costs” within the context of this report excludes maintenance and only includes heating and cooling energy.

Comparative Analysis of Residential Heating Systems 13 2010 Analysis Update
Finally, it should be noted that sophisticated energy modeling simulation tools, such as REM/Rate which was used for this analysis, are quite useful for predicting relative performance differences across different system options. Predicting actual performance, which will match how a building performs in the real world, is not as exact. The actual energy performance of a home will vary (sometimes quite significantly) with several factors including occupancy behavior, actual weather conditions, changes to the building, changes in energy rates, the quality of the system installation, and system maintenance. Due to the number of variables involved, the results of this study are best taken as relative comparisons across systems in different locations and not as absolute predictors.
Key Findings Given the breadth of this analysis, with hundreds of energy simulations conducted and each simulation generating several data points of interest, there is extensive data generated by this study. This section extracts key findings and trends from this data set, organized into Operating Costs, Paybacks, and Emissions. Many of the findings concentrate either on the Cold Climate or the Midwest region, as these areas contain the most data points in the analysis and represent most of the country’s heating-dominated areas (see Figure 3).
Operating Costs
Operating costs are the costs of the energy used to provide space heating and cooling to the prototype house. System first costs are not included in operating costs. Operating costs in the study are presented on an annual basis. Figure 7 below lists the annual operating costs for the heating/cooling systems in new homes in the Cold Climate zone. This data is derived from the analysis for all study locations located in the Cold Climate zone (9).
Most of the systems are bunched within roughly a $400 band between ~$1400 and $1800. Systems beyond this range on the higher side are the standard propane furnace (System A: $2,167); the standard fuel oil furnace (System F: $2,124); and the standard ASHP (System K: $1,910). Notably, these three systems are also three of the four lowest first cost systems (Figure 5). Also, the high efficiency ASHP (System L) is just beyond the upper edge of this range at $1,804/year. On the lower end, the GSHP system (System J) is estimated at $985/year.

Comparative Analysis of Residential Heating Systems 14 2010 Analysis Update
System Annual
Operating Cost
A – Standard efficiency propane forced-air furnace w/ 13 SEER A/C $2,167 B - High efficiency propane forced-air furnace w/ 13 SEER A/C $1,790 C - High efficiency propane boiler with forced-air (water/air HX) w/ 13 SEER A/C $1,796 D - Standard eff. propane boiler system with baseboard radiation w/ 13 SEER A/C $1,684 E - High efficiency propane boiler system with in-floor radiant heat w/ 13 SEER A/C $1,452
F – Standard efficiency fuel oil forced-air furnace w/ 13 SEER A/C $2,124 G - High efficiency fuel oil forced-air furnace w/ 13 SEER A/C $1,608 H - High efficiency fuel oil boiler with forced-air (water/air HX) w/ 13 SEER A/C $1,752 I - High efficiency fuel oil boiler system with in-floor radiant heat w/ 13 SEER A/C $1,529 J - GSHP closed loop system with electric resistance back-up $985 K - Standard efficiency ASHP with electric resistance back-up $1,910 L - High efficiency ASHP with electric resistance back-up $1,804 M - Standard efficiency ASHP with high efficiency propane furnace back-up $1,520 N - High efficiency ASHP with high efficiency propane furnace back-up $1,471
Average Cold Climate Utility Prices: Propane: $1.89/gal; Electricity: $0.12/kWh; Fuel Oil: $2.49/gal
Figure 7: New Home Annual Heating and Cooling System Operating Costs, Cold Climate
While a potential difference of $400 in annual operating costs is significant (~ $33/month difference), for systems whose operating costs are grouped closely, small changes in energy prices can flip-flop cheaper systems with more expensive ones. This point is particularly relevant if anticipated carbon emissions regulations eventually drive up residential electricity rates. Also note that the table relates heating plus cooling costs, so heat-pump systems with higher-than-standard cooling efficiencies, such as System L, will use less energy for cooling than the 13 SEER cooling systems which are coupled with all boilers and furnaces. In other words, the cooling efficiency of the systems has some impact on the overall costs, even though this impact is somewhat secondary to the heating performance since the basis for this data is Cold Climate locations.
The lowest operating cost system is the ground-source heat pump system. This system achieves higher rated performance by utilizing thermal energy from the earth, although the

Comparative Analysis of Residential Heating Systems 15 2010 Analysis Update
ground loop which makes this possible also results in a higher first cost for the system (Figure 5). The tradeoffs between performance and first cost are examined in the section below.
Among the systems in the most common price range, systems with in-floor radiant heat distribution (Systems E and I) and dual-fuel systems (Systems M and N) show lower operating costs. In-floor radiant systems perform well due to lower distribution losses and high efficiency equipment; however first costs for such systems are among the highest (see Figure 5). Dual-fuel systems utilize electricity for heating (via heat pump operation) during milder outdoor temperatures when heat pumps can provide more heating capacity. When outdoor temperatures grow colder these systems switch over to a propane furnace system for heating.
In general, the operating cost data illustrate tradeoffs between first cost, system efficiency, and operating costs. These relationships are explored further in the payback analysis below.
Simple Paybacks
Simple payback is a tool to evaluate how long it will take to “pay back” a higher first cost for a more efficient heating system. In other words, if a homebuyer is willing to spend more money up front for a system which will have lower monthly utility bills, the payback analysis indicates how long it takes for the resulting savings to outweigh the higher first cost. Given the number of heating systems analyzed as well analyses for both new and existing homes, a large number of payback analysis scenarios can be drawn from this study. A selection of payback analyses, which concentrate on common scenarios in new construction and for existing homes, are presented below.

Comparative Analysis of Residential Heating Systems 16 2010 Analysis Update
Scenario A: For a new home in the Cold Climate zone, what is the payback for a ground-source heat pump system compared to a more typical high efficiency system, which is assumed to be a 95% propane furnace with 13 SEER central A/C?
Figure 8: Payback Period for a GSHP System in a New, Cold Climate Home Compared to a High Efficiency Propane Furnace System

Comparative Analysis of Residential Heating Systems 17 2010 Analysis Update
The payback scenario in Figure 8 shows that although GSHP systems will generally produce lower heating and cooling bills to condition a home (Figure 7), the significantly higher up-front cost can take roughly 13 years to recover in the form of energy savings in a Cold Climate. The Cold Climate region covers 9 of the analysis locations in the study (many of which are in the Midwest), so the data used in the payback analysis is an average of first cost and operating cost data in those 9 locations.
It should also be noted that this payback analysis reflects both the heating and cooling operating costs of the two comparison systems: a GSHP and a high efficiency 95 AFUE propane furnace with standard efficiency 13 SEER A/C. So the GSHP system has the “opportunity” to pay back its higher initial cost through both lower heating and cooling bills. Even with costs savings through both heating and cooling however, the payback period for a GSHP system compared to the high efficiency propane furnace with a standard A/C system is beyond the timeframe that many homeowners will stay in a home.
Tax Credit for GSHP Systems
While this study does not generally
incorporate the impact of potential tax
credits in the overall economic analysis,
for this one scenario it is explored
because of the availability of a 30%
personal federal tax credit for qualifying
GSHP systems in homes (including new
construction). Generally this tax credit
can be used to reduce the payback period
of GSHP systems, but it is informative to
explore the exact payback durations
which result when this credit is applied in
a comparison scenario.
Applying the 30% credit as essentially a
price reduction on the first cost of the
GSHP system, the GSHP payback period
compared to a high efficiency propane
furnace moves from roughly 13 years to
roughly 6 years in the cold climate. While
this is a significant reduction, a 6 year
payback period is marginal. Acceptable
paybacks for energy efficiency
investments in commercial buildings are
typically 2 years or less.

Comparative Analysis of Residential Heating Systems 18 2010 Analysis Update
Scenario B: For an existing home in the Cold Climate where the homeowner needs to replace the old heating system, what is the payback for more efficient systems assuming that the main system under consideration is a standard 78% propane furnace?
Figure 9: Simple Payback of Various Heating Systems for Cold Climate Existing Homes, Assuming a 78 AFUE Propane Furnace as the Baseline System
The scenario above assumes that the home already has forced-air duct work in place, and evaluates a range of different forced-air systems as possible replacements for the home. This scenario characterizes the situation of many thousands of homes every year, where an “efficiency upgrade” is considered when equipment is replaced.
Figure 9 clearly shows that investing in a high efficiency propane furnace is a good option, as it will very quickly (< 1/2 year) result in heating energy savings which are greater than the added cost for the 95% efficient furnace. A high efficiency fuel oil system offers a relatively short (< 2 year) payback compared to the baseline furnace, if fuel oil is available in the area. The GSHP system will provide significant heating energy savings relative to a 78% propane furnace; however the sizable up-front system costs take about 9 years to recover through reduced heating bills. Note that applying potential tax credits to this scenario would benefit several of the

Comparative Analysis of Residential Heating Systems 19 2010 Analysis Update
high efficiency systems, as credits are available for multiple system types when used in replacement applications. More information on potential tax credits is found at www.dsireusa.org.
Air-source heat pump systems are less effective change-out options relative to the baseline furnace (or the high efficiency propane furnace), with paybacks of 6-7 years. Finally, dual fuel systems which couple ASHPs with high efficiency back-up furnaces are estimated to have paybacks in the 3-4 year range.
Other system replacement considerations which are not quantified in this scenario include comfort preferences (residents in cold climates often prefer combustion-based heating for higher delivery temperatures), and complications and costs from fuel switching (e.g., tank siting) or a GSHP system (lot and landscaping disturbance from ground loop drilling).

Comparative Analysis of Residential Heating Systems 20 2010 Analysis Update
Scenario C: For an existing home in the Cold Climate where the homeowner is strongly interested in an efficiency upgrade and needs to replace the old heating system, what is the payback for alternatives assuming that the main heating system under consideration is a 95% efficient propane furnace?
Figure 10: Simple Payback of Various Heating Systems for Cold Climate Existing Homes, Assuming a 95 AFUE Propane Furnace as the Baseline System
In Figure 10 above, the baseline system – a 95 AFUE propane furnace – is clearly the best high efficiency replacement option given lengthy paybacks (6-14 years) or no payback at all (ASHPs) for the alternatives. The paybacks for high efficiency system alternatives such as a GSHP (13+ years) or a high efficiency dual fuel system (6-7 years) are generally not in a range attractive to home owners. The high efficiency ASHP system (System L) is not shown because, on average in the Cold Climate zone, its operating costs are higher than the baseline furnace system - so there is no payback.
The long or non-existent payback periods are due to fairly comparable operating cost performance between the high efficiency propane furnace and Systems L, M, and N. Thus, the ability to make up for added first cost is limited. And in the case of the GSHP system, its relatively lower operating costs are offset by the higher initial investment which is required, which extends the payback.

Comparative Analysis of Residential Heating Systems 21 2010 Analysis Update
Scenario D: For an existing home in the Cold Climate where the homeowner needs to replace the old fuel oil heating system, what is the payback for more efficient systems assuming that the main system under consideration is a 78% fuel oil furnace?
Figure 11: Payback of Various Heating Systems for Cold Climate Existing Homes, Assuming a 78 AFUE Fuel Oil Furnace as the Baseline System
The scenario explores the options when considering the replacement of an old fuel oil heating system. The chart in Figure 11 is based on the operating cost and first cost data for the two Cold Climate locations in the study which involved fuel oil: Burlington, VT and Buffalo, NY.
Notably, a high efficiency propane system actually has an immediate payback because it has both a lower first cost and lower operating costs. Fuel-switching costs are not incorporated in system first costs, to the extent that they apply.
A high efficiency fuel oil furnace would pay back in 3-4 years compared to the standard efficiency fuel oil furnace. Also evident on the graph – both the standard and the high efficiency ASHP systems actually have an infinite payback compared to the baseline system. In other words, the data for these two locations showed that replacement ASHPs had both higher first

Comparative Analysis of Residential Heating Systems 22 2010 Analysis Update
costs and higher operating costs compared to the baseline system (78 AFUE fuel oil furnace). Note that the average electricity price in these 2 locations is 16.4 cents/kWh.
The other system alternatives, dual fuel systems and the GSHP, have very lengthy paybacks due to a combination of first costs (especially for the GSHP) and the relative prices of fuel oil, electricity, and propane.

Comparative Analysis of Residential Heating Systems 23 2010 Analysis Update
Scenario E: For an existing home in the Cold Climate where the homeowner needs to replace an old air source heat pump, what is the payback for various heating and cooling system alternatives assuming that the main system under consideration is a new, standard efficiency air source heat pump?
Figure 12: Payback of Various Heating and Cooling Systems for Cold Climate Existing Homes, Assuming a Standard Efficiency Air Source Heat Pump as the Baseline System
In this scenario, since the HVAC system being replaced (an ASHP) provides both heating and cooling to the home, each of the replacement options also provide both heating and cooling. For furnace systems, this means that the first cost of a new A/C system is also included as part of the economic analysis. Further, both the heating and cooling operating costs are considered in the payback analysis.
Examining the results reveals that a high efficiency propane furnace coupled with a standard efficiency 13 SEER central A/C is a better option than simply replacing the old ASHP with a new, standard efficiency ASHP. The propane furnace and A/C combination has both lower first cost and lower operating costs, so the payback on this system is immediate. Any fuel switching costs (if the home does not already have propane) are not included, although propane switching

Comparative Analysis of Residential Heating Systems 24 2010 Analysis Update
costs are typically minor due to flexible tank placement, little/no trenching, and leasing arrangements with propane suppliers which avoid the need to purchase the propane tank.
Other system alternatives with relatively short (< 2 years) paybacks include the dual fuel systems (Systems M, N) and the high efficiency fuel oil forced-air furnace. The dual fuel systems are particularly interesting because they continue to incorporate heat pump heating operation until colder outdoor temperatures develop, at which point the propane furnace provides the home’s heating. These systems also can provide a hedge against future swings in energy rates, by permitting the homeowner to operate either the high efficiency furnace or the ASHP based on the most favorable economic conditions.
In each of the five payback scenarios above, ultimately individual homeowners need to make decisions about how they should best invest their money. Cost estimates for different systems may vary based upon local market conditions. It should also be noted that a significant factor in the economics of different systems is the availability of federal, state, and utility-based incentives and tax credits for high efficiency systems. Such incentives and credits will often make the investment in a more efficient model over a standard efficiency model more attractive, and in some cases could cause a homeowner to select a different category of system all together. While tax credits and incentives are not included in the payback analyses above (see page 12 for this discussion), interested readers can review available offers at the Database of State Incentives for Renewables & Efficiency (DSIRE) www.dsireusa.org.
Emissions All heating systems – regardless of the energy source – result in carbon emissions in most parts of the country. Fossil-fuel heating systems, like those which use propane, fuel oil, or other fossil sources for combustion, release green house gasses (GHGs) such as CO2 as a result of the combustion of the fuel. This is obvious to most homeowners since the combustion occurs at the home in the heating unit, and combustion products are vented to outdoors through a flue pipe or vent. What may be less obvious is that electricity-based heating systems also result in carbon emissions which are in fact often much greater than a fossil heating system like a propane furnace. Most electricity in the United States is produced from power plants which rely on fossil fuels to create thermal energy, which is then converted to electrical energy. As shown in Figure 12 below, roughly three-quarters of the electricity generated in the United States is from fossil-

Comparative Analysis of Residential Heating Systems 25 2010 Analysis Update
based sources. Further, these power plants will typically consume roughly 3 units of energy to produce 1 output unit of electricity, so the resulting emissions from the production of electricity are often significant.
59.5%8.8%0.4%
12.5%
1.6%
0.0%17.1% Coal
Hydroelectric
Other Renewables
Natural Gas
Petroleum
Other
Nuclear
Figure 13: Electric Power Industry Electricity Generation by Energy Source, 2007 Source: U.S. Energy Information Administration, Electric Power Annual 2007
Thus, systems like air-source heat pumps and ground-source heat pumps are also associated with GHG emissions, even though these systems utilize thermal energy from the air and ground, respectively, and no fuel combustion occurs at the home. The electricity which is used to run their pumps, fans, and compressors comes from an upstream power generation plant, which in most cases is combusting a fuel like coal and producing GHG emissions. Figure 14 below illustrates the CO2 emissions which result from the operation of the various heating systems averaged across the 8 Midwest analysis locations. A full data table of emissions results for the different regions of the U.S. is included in Appendix B. As described above, the modeling software used for the energy analysis incorporates state-level emissions factors from EPA’s eGRID database. These emission factors take into account the mix of energy sources used to generate electricity in a given state (e.g. coal, nuclear, hydro) to develop an average emission factor which reflects the quantity of GHGs that result from the generation of electricity in the state.

Comparative Analysis of Residential Heating Systems 26 2010 Analysis Update
Figure 14: CO2 Emissions for Heating Systems for New Home Analysis for the Midwest Region The graph clearly illustrates that electricity-based heating systems, and especially air-source heat pumps, result in much higher emissions than propane-based furnace and boiler systems in the Midwest. For example, the standard efficiency ASHP (System K) has more than double the CO2 emissions compared to the standard efficiency propane furnace (System A). This is partly driven by the fact that during the colder parts of the winter, ASHP systems use increasingly more electric resistance heat to satisfy the home’s heating demand. This form of heating is much less efficient and uses more electricity, which in turn means greater carbon emissions. To put these abstract quantities of “pounds of CO2” into somewhat more understandable terms2, the difference each year in carbon emissions between the standard propane furnace and the standard ASHP is roughly equal to the GHG emissions of a passenger vehicle for an entire year. It should also be noted that these are only annual numbers, so for each year of operation the propane furnace would result in recurring emissions benefits. So a homeowner in
2 U.S. EPA’s Greenhouse Gas Equivalencies Calculator: www.epa.gov/cleanenergy/energy‐resources/calculator.html

Comparative Analysis of Residential Heating Systems 27 2010 Analysis Update
the Midwest could essentially offset the carbon emissions from one of their passenger cars every year, by opting to use a propane furnace instead of a standard air-source heat pump. The graph also reveals several other important conclusions:
• The high efficiency propane boiler system with in-floor radiant heat (System E) results in the lowest emissions due to a less carbon-intensive energy source (propane), the high efficiency boiler (95 AFUE), and lower distribution system losses compared to forced-air duct (furnace) systems.
• The ground-source heat pump system (System J) has lower emissions compared to ASHPs due to more efficient operation, but greater emissions than most propane-based systems due to greater consumption of electricity.
• The dual-fuel systems, which combine an ASHP with a high-efficiency propane back-up furnace (Systems M and N), avoid the problem of inefficient resistance heating by turning off the heat pump during colder outdoor conditions. As the outdoor temperature gets colder, the propane furnace cycles on and provides the heating to the home instead of the ASHP. As a result, the dual fuel system emissions are similar to those of a propane furnace.
It is worth noting that emissions levels from the systems will vary if a particular state has a high proportion of non-fossil electricity production capacity (e.g. hydropower in the Northwest). This is particularly true for all-electric systems like heat pumps (air or ground source). Even regions which are now heavily reliant on coal-fired electricity production may eventually start to shift their mix of power production facilities. However for the foreseeable future coal will continue to be the dominant source of electricity production in much of the U.S., meaning that electric-based heating systems will be reliant on a carbon-intensive energy source. While Figure 14 above compares a selection of propane- and electric-based heating system options, Figure 15 examines the emissions for fuel oil- and propane-based systems in the two fuel oil markets in the analysis. The results indicate that for propane and fuel oil systems with comparable efficiencies, fuel oil systems generate significantly higher CO2 emissions. For example, the standard efficiency fuel oil furnace (System F) has CO2 emissions roughly 32% higher than the standard efficiency propane furnace (System A). Both of these furnace systems have rated efficiencies of 78 AFUE, so efficiency levels are not driving this difference in emissions. The difference in carbon emissions is driven by the fuel source, with fuel oil combustion being more carbon-intensive than propane. The other propane- and fuel oil-based systems in Figure 15 show this same trend, with propane systems resulting in lower carbon emissions for comparable heating systems.

Comparative Analysis of Residential Heating Systems 28 2010 Analysis Update
In terms of absolute quantities, System A (standard efficiency propane furnace) results in 4,100 fewer pounds of CO2 emissions per year from heating operation, compared to System F (standard efficiency fuel oil furnace). Over the life cycle of a furnace (~15 years), this difference is roughly equal to the carbon which would be sequestered by about 48 medium growth tree seedlings over 10 years.
Figure 15: CO2 Emissions for Fuel Oil and Propane Heating Systems in New Homes in Fuel Oil Markets (2) included in the Analysis
Finally, while the emissions of all-electric heating systems like heat pumps may vary based on the mix of fuels used to generate electricity (see discussion above), the results shown for propane and fuel oil in Figure 15 will remain steady in any market. This is due to the fact that the total carbon emissions from propane and fuel oil heating systems are mostly (95% or higher) due to the combustion of the fuel. Very little (< 5%) of the emissions from these systems is due to the electrical energy used by the system for the blower, exhaust fan, and other components.. Thus, shifting the analysis shown in Figure 15 to a region with a different electric power generation mix would have very little impact on the results; plus any shift in the carbon intensity of electric power would impact both the propane and fuel oil heating systems roughly equally.

Comparative Analysis of Residential Heating Systems 29 2010 Analysis Update
The Relationship between First Costs, Operating Costs, and CO2 Emissions The payback analyses above relate first cost and operating costs for different HVAC options. Another key consideration for heating and cooling systems is the level of carbon emissions which result from their operation. To illustrate this point, Figure 16 below shows system first costs and carbon emissions associated with heating over 15 years for a selection of HVAC options in new Midwest houses.
System First Cost (Midwest locations)
Annual Heating Operating Costs
(Midwest locations)
Heating Season CO2 Emissions over 15 Years - Midwest Locations (tons)
B - High efficiency propane forced-air furnace
$8,882 $1,531 79
J - GSHP closed loop system with electric resistance back-up
$21,627 $760 86
L – High efficiency ASHP with electric resistance back-up
$10,041 $1,611 196
M – Standard efficiency ASHP with high efficiency propane furnace back-up
$10,356 $1,242 82
Figure 16: First Costs, Heating Operating Costs, and Carbon Emissions for Heating in New, Midwest Homes for a Selection of High Efficiency Heating Systems
The data indicate that the relationship between costs (first and operating) and emissions varies significantly across the different system types. For instance, the lowest first cost system of this set of high efficiency options – the high efficiency propane furnace - is also the lowest in terms of CO2 emissions. So it does not have to “cost more” to have a heating system which also carries the smallest carbon footprint, when looking across high efficiency alternatives. Conversely, the highest first cost system and the one with the lowest operating costs – the GSHP system – ranks 3rd out of the 4 systems in terms of its carbon emissions. Again, paying more up front for a very efficient system does not translate to lower carbon emissions compared to alternatives.

Comparative Analysis of Residential Heating Systems 30 2010 Analysis Update
This table helps to illustrate that in some cases there are no “tradeoffs” between first costs, operating costs, and carbon emissions. Rather, the energy source can be the main driver for the carbon emissions, with high efficiency propane systems offering lower emissions generally.
Conclusions Considering the extent of information generated in this analysis a number of conclusions are found involving heating system performance. In reviewing operating cost, payback, and emissions analyses, systems which appear strong in one respect may not be the strongest performers in another area. This leads to perhaps the most prominent finding of the study: any heating system should be viewed in terms of all three of these factors. Occupant comfort is also another critical consideration, although that issue was not included in this analysis. The need to evaluate systems in terms of multiple factors is also found in some of the more specific conclusions below:
• Operating costs for the systems in cold climates (Figure 7) show the majority of systems within an annual cost range between ~$1400 and $1800. Systems higher than this range included 3 of the 4 lowest first cost systems (standard propane furnace, stand fuel oil furnace, standard ASHP), as well as the high efficiency ASHP. When the ASHP systems were coupled with propane furnaces in dual fuel systems (M, N) the overall operating costs of these systems was much lower (~$1500). The GSHP system carried the lowest annual operating cost; however this performance is tempered by the system’s high first cost relative to other high efficiency systems such as propane or fuel oil furnaces.
• Several typical payback scenarios, focusing on both new and existing homes, highlight that high efficiency systems with moderate first costs are typically the most attractive option. The high efficiency propane furnace matched these characteristics and compared favorably against lower first cost options (e.g., standard propane furnace) as well as lower operating cost options (e.g., GSHP). Dual fuel systems combining an air-source heat pump with a high efficiency propane furnace for back-up heat were a viable option in several scenarios as well. Ground source heat pumps had significantly higher paybacks than other systems despite markedly lower operating costs. This is due to the high first cost of the GSHP systems. Air source heat pumps had relatively higher paybacks in two scenarios and actually had an infinite payback in two other scenarios, where their operating costs were higher than the baseline system under consideration.

Comparative Analysis of Residential Heating Systems 31 2010 Analysis Update
• Greenhouse gas emissions, quantified in terms of CO2, result from the operation of heating systems regardless of fuel source. Emissions data from heating systems in the Midwest showed a relatively heavy carbon impact from air-source heat pump systems, while propane systems and dual fuel systems resulted in much lower (~ ½) quantities of CO2 emissions. Assessing costs (first and operating) along with emissions shows that propane-based systems are often better options than electric-based counterparts, especially in the Midwest where electricity is generated primarily from coal.
Analysis of carbon emissions for fuel oil systems in the 2 fuel oil markets revealed that propane systems generate significantly less CO2. When comparing fuel oil- and propane-based furnaces of the same efficiency, the fuel oil system had significantly higher (~30%) emissions. This illustrates that the fuel source is driving the higher emissions rates for fuel oil systems, as opposed to equipment efficiency levels.
Looking ahead, several important variables in this study are likely to evolve in the next several years. These include potential upward pressure on residential electricity prices resulting from carbon emissions regulations, volatility in propane and fuel oil pricing, and a greater emphasis on the carbon emissions which result from home energy use. On this last issue, various efforts to reward efficiency (e.g. tax credits, labeling programs, green building rating systems) may gradually shift to also include consideration of a building’s carbon emissions in addition to its energy use.

Comparative Analysis of Residential Heating Systems 32 2010 Analysis Update
Appendices

Comparative Analysis of Residential Heating Systems 33 2010 Analysis Update
Appendix A: Energy Rates Methodology Pricing data from 2009 from the U.S. DOE’s Energy Information Administration (EIA) was referenced to develop energy prices for each of the 16 analysis locations. Because recent state level data was not always available, it was sometimes necessary to derive state utility price estimates from regional data. Explanations for the derivation of energy prices are presented below. Heating Oil Heating oil prices are tracked by the EIA on both the PADD level and the state level for PADDs 1 and 2. PADDs (Petroleum Administration for Defense Districts) are geographic divisions whose petroleum sales, production, and pricing are tracked and reported by the EIA at state and/or district levels. There are 7 total PADD districts: 1A, 1B, 1C, 2, 3, 4, and 5. States are assigned to the PADDs as shown below in Figure 17. PADD States 1A Connecticut, Maine, Massachusetts, New Hampshire, Rhode Island,
Vermont
1B Delaware, District of Columbia, Maryland, New Jersey, New York, Pennsylvania
1C North Carolina, Virginia, West Virginia 2 Illinois, Indiana, Iowa, Kansas, Kentucky, Michigan, Minnesota, Missouri,
Nebraska, North Dakota, Ohio, Oklahoma, South Dakota, Tennessee, Wisconsin
3 Alabama, Arkansas, Louisiana, Mississippi, New Mexico, Texas 4 Colorado, Idaho, Montana, Utah, Wyoming 5 Alaska, Arizona, California, Hawaii, Nevada, Oregon, Washington
Figure 17: States by PADD Designation Heating oil prices are reported for PADDs 1A, 1B, 1C, and 2 as well as most of their individual states on a monthly basis. This study requires heating oil prices for Vermont in PADD 1A and New York in PADD 1B. Monthly price data from 2009 for New York and Vermont was collected and averaged to provide average state residential price data.

Comparative Analysis of Residential Heating Systems 34 2010 Analysis Update
Electricity Electricity prices are collected by the EIA on a monthly basis for all states. Monthly price data for each state location within the study was collected and averaged based on the 2009 data to provide the average state residential price data. Propane Propane prices are available from the EIA in two data sets. The first data set provides weekly heating season prices by PADD and by state for PADD 1A, 1B, 1C, and 2. The second data set provides monthly prices by PADD only. To estimate monthly prices at the state level, weekly heating season prices were used to develop state to PADD price ratios. These ratios were derived from 2009 data. State to PADD price ratios were then applied to monthly PADD prices to provide state level monthly estimates for propane pricing. The 12 months of data for 2009 were then averaged to obtain the most recent annual average state residential price data. Where ratios could not be calculated due to missing data (e.g. PADD 3, 4, and 5), the PADD average was used as a proxy for the state level estimate.
City State PADD Residential
Propane Price ($/gal)
Residential Heating Oil Price
($/gal)
Residential Electricity Price
($/kWh) Baltimore MD 1B 2.38 N/A 0.15 Boise ID 4 1.77 N/A 0.08 Buffalo NY 1B 2.34 2.48 0.18 Burlington VT 1A 2.55 2.50 0.15 Columbia MO 2 1.59 N/A 0.08 Des Moines IA 2 1.43 N/A 0.10 Duluth MN 2 1.60 N/A 0.10 Grand Rapids MI 2 1.86 N/A 0.12 Indianapolis IN 2 1.82 N/A 0.09 Las Vegas NV 5 2.00 N/A 0.13 Madison WI 2 1.63 N/A 0.12 Mansfield OH 2 1.91 N/A 0.11 Montgomery AL 3 2.03 N/A 0.11 Nashville TN 2 1.66 N/A 0.09 Peoria IL 2 1.66 N/A 0.11 Portland OR 5 2.00 N/A 0.09 Average $1.89 $2.49 $0.11
Figure 18: Utility Prices Determined for Use in Analysis

Comparative Analysis of Residential Heating Systems 35 2010 Analysis Update
Appendix B: Annual CO2 Emissions Resulting from Heating Energy
System Midwest Mid-Atlantic Northeast Southeast Northwest West
A - Std Eff propane forced air furnace 13,042 11,019 13,235 6,073 7,526 5,915B - High Eff propane forced air furnace 10,477 8,896 10,865 4,880 6,130 4,666C - High Eff propane hydronic with forced air (hydronic with air handler coil) 10,477 8,896 10,865 4,883 6,136 4,692D - Std Eff propane hydronic system with baseboard radiation 9,436 8,176 10,320 4,469 5,785 4,311E - High Eff propane hydronic system with in-floor heat 7,983 6,908 8,690 3,776 4,870 3,624F - Std Eff fuel oil forced air N/A 16,035 17,645 N/A N/A N/AG - High Eff fuel oil forced air N/A 13,238 11,590 N/A N/A N/AH - High Eff fuel oil hydronic with forced air (hydronic with air handler coil) N/A 14,555 12,803 N/A N/A N/AI - High Eff fuel oil hydronic system with in floor heat N/A 11,363 12,800 N/A N/A N/AJ - GSHP closed loop system with electric resistance back up 12,294 6,424 57 3,973 1,297 4,366K - Std Eff ASHP with electric resistance back up 27,211 12,160 125 6,924 2,023 7,035L - High Eff ASHP with electric resistance back up 26,094 11,382 120 6,401 1,866 6,420M - Std Eff ASHP with High Eff propane furnace back up 10,902 7,873 7,642 4,080 3,519 4,498N - High Eff ASHP system with High Eff propane furnace back up 10,599 7,652 7,642 3,987 3,403 4,315
Figure 19: CO2 Emissions by Region for Various Heating Systems (New Homes)

Comparative Analysis of Residential Heating Systems 36 2010 Analysis Update
Propane Education & Research Council 1140 Connecticut Ave. NW, Suite 1075
Washington, DC 20036 202-452-8975 main 202-452-9054 fax
[email protected] www.propanecouncil.org www.usepropane.com
www.buildwithpropane.com
The Propane Education & Research Council was authorized by the U.S. Congress with the passage of Public Law 104-284, the Propane
Education and Research Act (PERA), signed into law on October 11, 1996. The mission of the Propane Education & Research Council is to promote the safe, efficient use of odorized propane gas as a preferred
energy source.