Embed Size (px)
Citation preview

Company Presentation Non-deal Asia Roadshow February 7-10, 2017
Non-deal Asia Roadshow, February 7-10, 2017 page 2
Market
Company
Strategy & Execution
Non-deal Asia Roadshow, February 7-10, 2017
German Residential – Safe Harbor and Low Risk
page 3
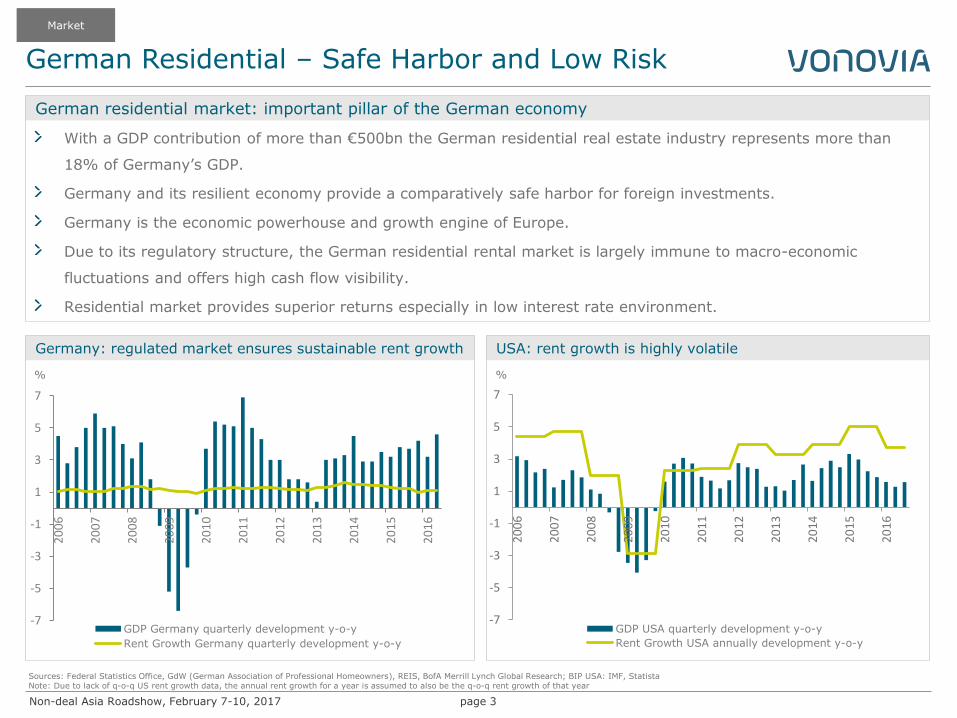
With a GDP contribution of more than €500bn the German residential real estate industry represents more than
18% of Germany’s GDP.
Germany and its resilient economy provide a comparatively safe harbor for foreign investments.
Germany is the economic powerhouse and growth engine of Europe.
Due to its regulatory structure, the German residential rental market is largely immune to macro-economic
fluctuations and offers high cash flow visibility.
Residential market provides superior returns especially in low interest rate environment.
Sources: Federal Statistics Office, GdW (German Association of Professional Homeowners), REIS, BofA Merrill Lynch Global Research; BIP USA: IMF, Statista Note: Due to lack of q-o-q US rent growth data, the annual rent growth for a year is assumed to also be the q-o-q rent growth of that year
German residential market: important pillar of the German economy
Germany: regulated market ensures sustainable rent growth
%
USA: rent growth is highly volatile
%
Market
-7
-5
-3
-1
1
3
5
7
20
06
20
07
20
08
20
09
20
10
20
11
20
12
20
13
20
14
20
15
20
16
GDP Germany quarterly development y-o-y
Rent Growth Germany quarterly development y-o-y
-7
-5
-3
-1
1
3
5
7
20
06
20
07
20
08
20
09
20
10
20
11
20
12
20
13
20
14
20
15
20
16
GDP USA quarterly development y-o-y
Rent Growth USA annually development y-o-y
Non-deal Asia Roadshow, February 7-10, 2017
German Residential – Favorable Fundamentals
page 4
Sources: Federal Statistics Office, IW Köln, GdW (German Association of Professional Homeowners)
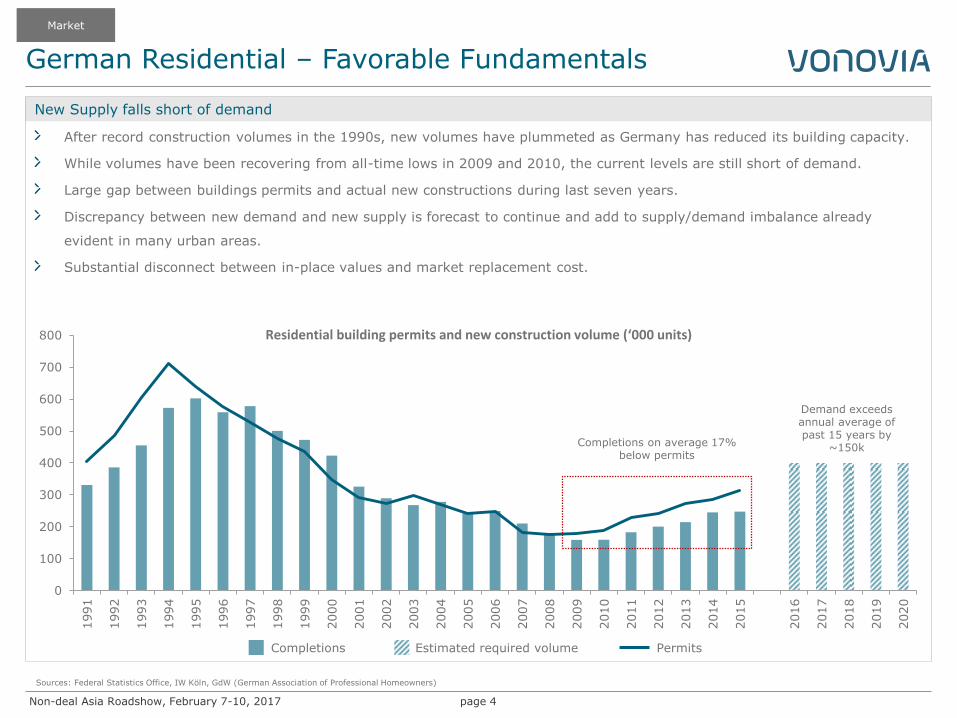
New Supply falls short of demand
Market
After record construction volumes in the 1990s, new volumes have plummeted as Germany has reduced its building capacity.
While volumes have been recovering from all-time lows in 2009 and 2010, the current levels are still short of demand.
Large gap between buildings permits and actual new constructions during last seven years.
Discrepancy between new demand and new supply is forecast to continue and add to supply/demand imbalance already
evident in many urban areas.
Substantial disconnect between in-place values and market replacement cost.
0
100
200
300
400
500
600
700
800
1991
1992
1993
1994
1995
1996
1997
1998
1999
2000
2001
2002
2003
2004
2005
2006
2007
2008
2009
2010
2011
2012
2013
2014
2015
2016
2017
2018
2019
2020
Completions Permits Estimated required volume
Completions on average 17% below permits
Residential building permits and new construction volume (‘000 units)
Demand exceeds annual average of past 15 years by
~150k
Non-deal Asia Roadshow, February 7-10, 2017
German Residential – Favorable Fundamentals
page 5
Sources: Federal Statistics Office, Eurostat
Home ownership rate 2015 in %
Market
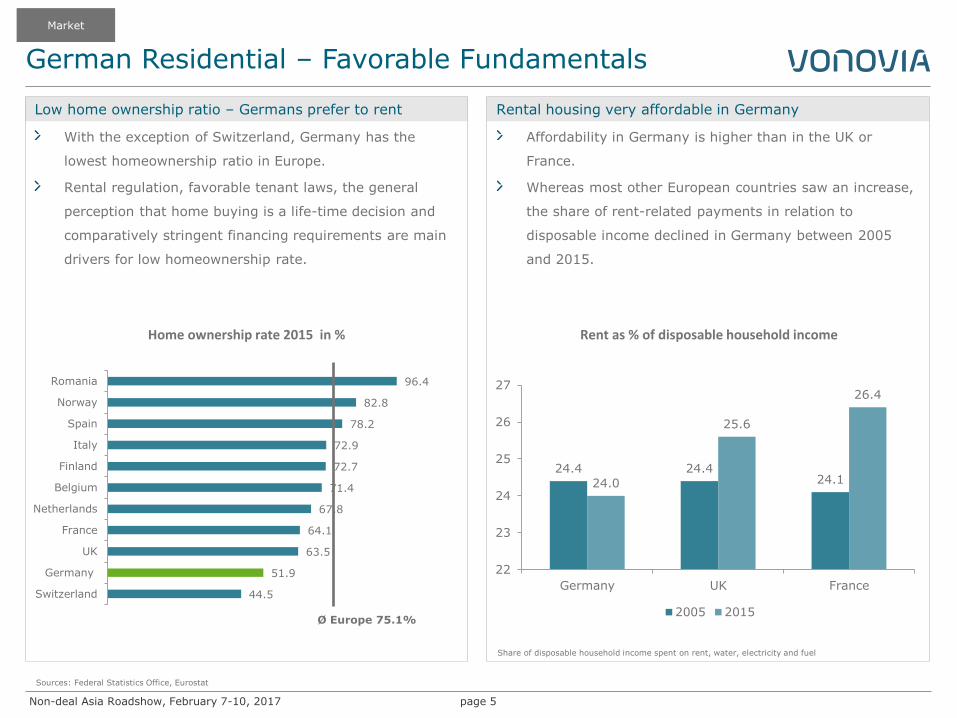
Low home ownership ratio – Germans prefer to rent Rental housing very affordable in Germany
24.4 24.4 24.1 24.0
25.6
26.4
22
23
24
25
26
27
Germany UK France
2005 2015
Rent as % of disposable household income
With the exception of Switzerland, Germany has the
lowest homeownership ratio in Europe.
Rental regulation, favorable tenant laws, the general
perception that home buying is a life-time decision and
comparatively stringent financing requirements are main
drivers for low homeownership rate.
Affordability in Germany is higher than in the UK or
France.
Whereas most other European countries saw an increase,
the share of rent-related payments in relation to
disposable income declined in Germany between 2005
and 2015.
Share of disposable household income spent on rent, water, electricity and fuel
96.4
82.8
78.2
72.9
72.7
71.4
67.8
64.1
63.5
51.9
44.5
Romania
Norway
Spain
Italy
Finland
Belgium
Netherlands
France
UK
Germany
Switzerland
Ø Europe 75.1%
Non-deal Asia Roadshow, February 7-10, 2017
German Residential – Favorable Fundamentals
page 6
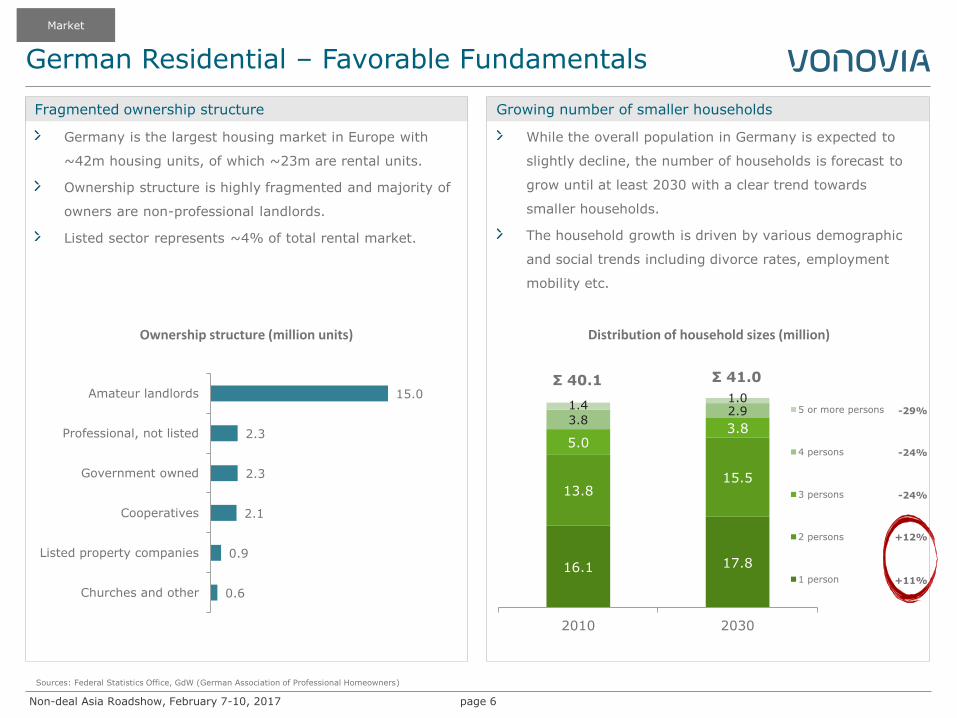
16.1 17.8
13.8 15.5
5.0 3.8
3.8 2.9
1.4 1.0
2010 2030
5 or more persons
4 persons
3 persons
2 persons
1 person
Sources: Federal Statistics Office, GdW (German Association of Professional Homeowners)
-29%
-24%
-24%
+12%
+11%
Market
Fragmented ownership structure Growing number of smaller households
While the overall population in Germany is expected to
slightly decline, the number of households is forecast to
grow until at least 2030 with a clear trend towards
smaller households.
The household growth is driven by various demographic
and social trends including divorce rates, employment
mobility etc.
Distribution of household sizes (million)
15.0
2.3
2.3
2.1
0.9
0.6
Amateur landlords
Professional, not listed
Government owned
Cooperatives
Listed property companies
Churches and other
Germany is the largest housing market in Europe with
~42m housing units, of which ~23m are rental units.
Ownership structure is highly fragmented and majority of
owners are non-professional landlords.
Listed sector represents ~4% of total rental market.
Ownership structure (million units)
Σ 40.1 Σ 41.0
Non-deal Asia Roadshow, February 7-10, 2017 page 7
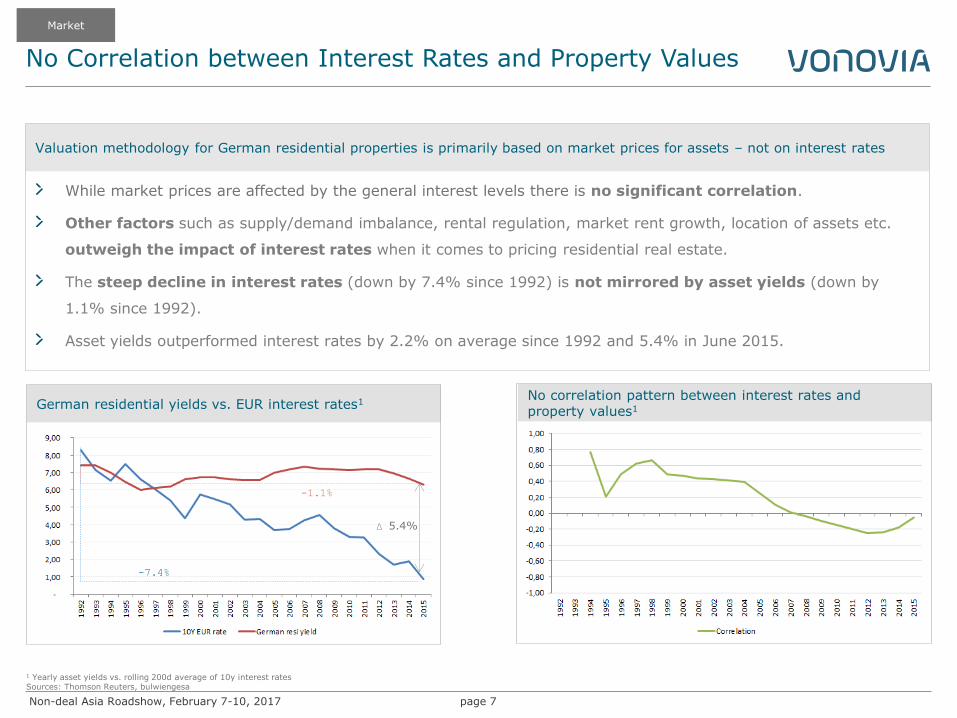
German residential yields vs. EUR interest rates1
1 Yearly asset yields vs. rolling 200d average of 10y interest rates Sources: Thomson Reuters, bulwiengesa
-7.4%
-1.1%
Δ 5.4%
While market prices are affected by the general interest levels there is no significant correlation.
Other factors such as supply/demand imbalance, rental regulation, market rent growth, location of assets etc.
outweigh the impact of interest rates when it comes to pricing residential real estate.
The steep decline in interest rates (down by 7.4% since 1992) is not mirrored by asset yields (down by
1.1% since 1992).
Asset yields outperformed interest rates by 2.2% on average since 1992 and 5.4% in June 2015.
Valuation methodology for German residential properties is primarily based on market prices for assets – not on interest rates
No Correlation between Interest Rates and Property Values
No correlation pattern between interest rates and property values1
Market
Non-deal Asia Roadshow, February 7-10, 2017 page 8
Market
Company
Strategy & Execution
Non-deal Asia Roadshow, February 7-10, 2017
Vonovia at a Glance
page 9
Company
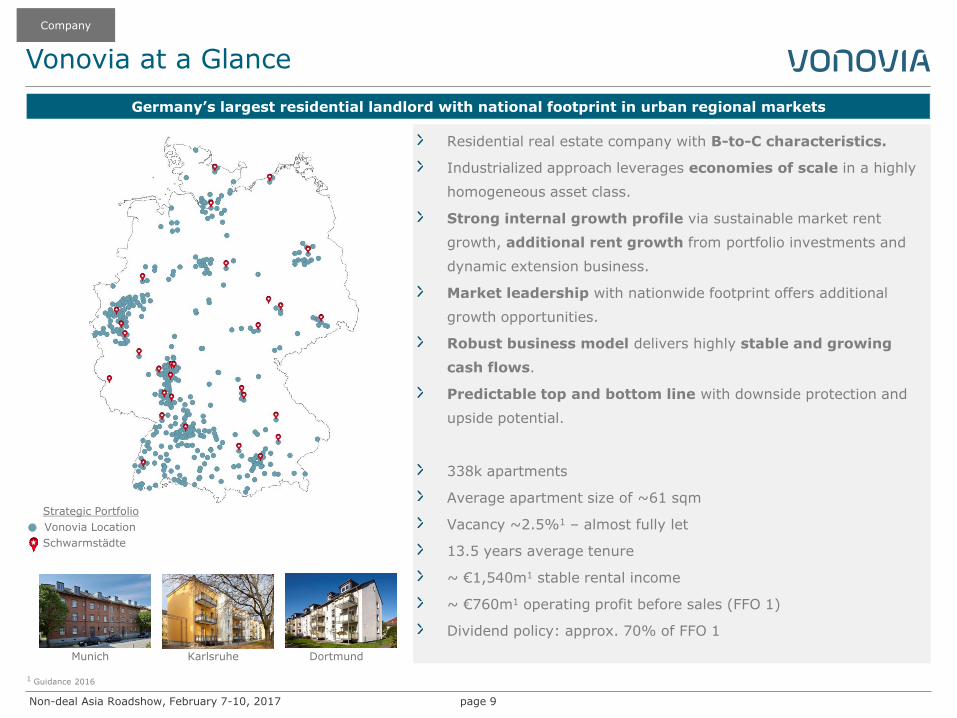
Residential real estate company with B-to-C characteristics.
Industrialized approach leverages economies of scale in a highly
homogeneous asset class.
Strong internal growth profile via sustainable market rent
growth, additional rent growth from portfolio investments and
dynamic extension business.
Market leadership with nationwide footprint offers additional
growth opportunities.
Robust business model delivers highly stable and growing
cash flows.
Predictable top and bottom line with downside protection and
upside potential.
338k apartments
Average apartment size of ~61 sqm
Vacancy ~2.5%1 – almost fully let
13.5 years average tenure
~ €1,540m1 stable rental income
~ €760m1 operating profit before sales (FFO 1)
Dividend policy: approx. 70% of FFO 1
1 Guidance 2016
Germany’s largest residential landlord with national footprint in urban regional markets
Schwarmstädte
Vonovia Location
Strategic Portfolio
Karlsruhe Dortmund Munich

Non-deal Asia Roadshow, February 7-10, 2017
If You Want to Know Where Germans Live - Follow the Light
page 10
Company
Illustration of Germany at Night
Source: www.bundeswahlleiter.de
Non-deal Asia Roadshow, February 7-10, 2017
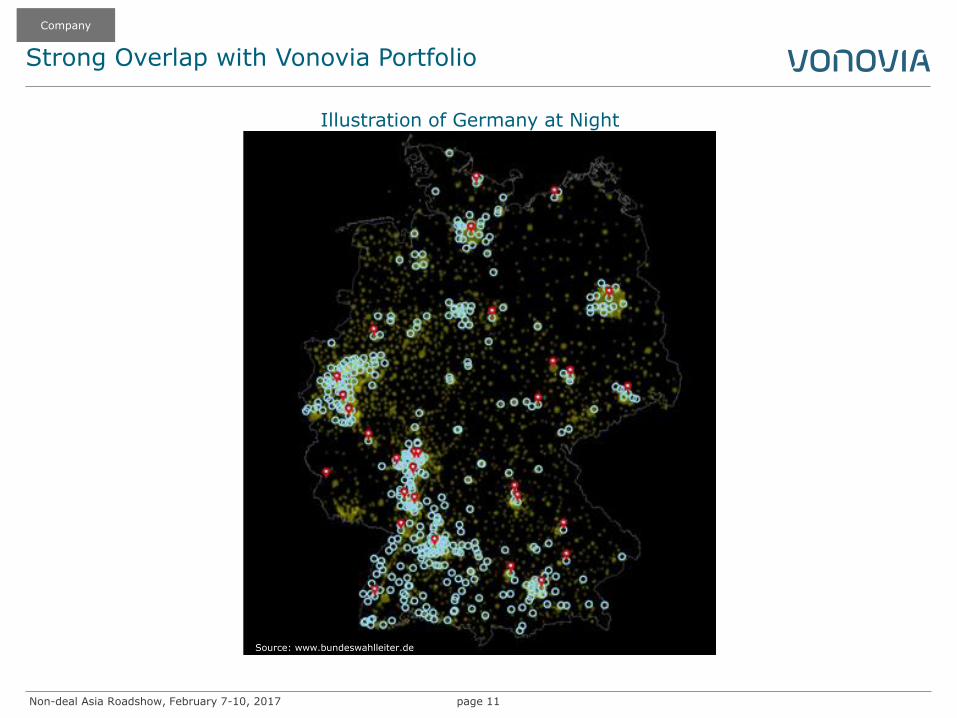
Strong Overlap with Vonovia Portfolio
page 11
Illustration of Germany at Night
Company
Source: www.bundeswahlleiter.de
Non-deal Asia Roadshow, February 7-10, 2017
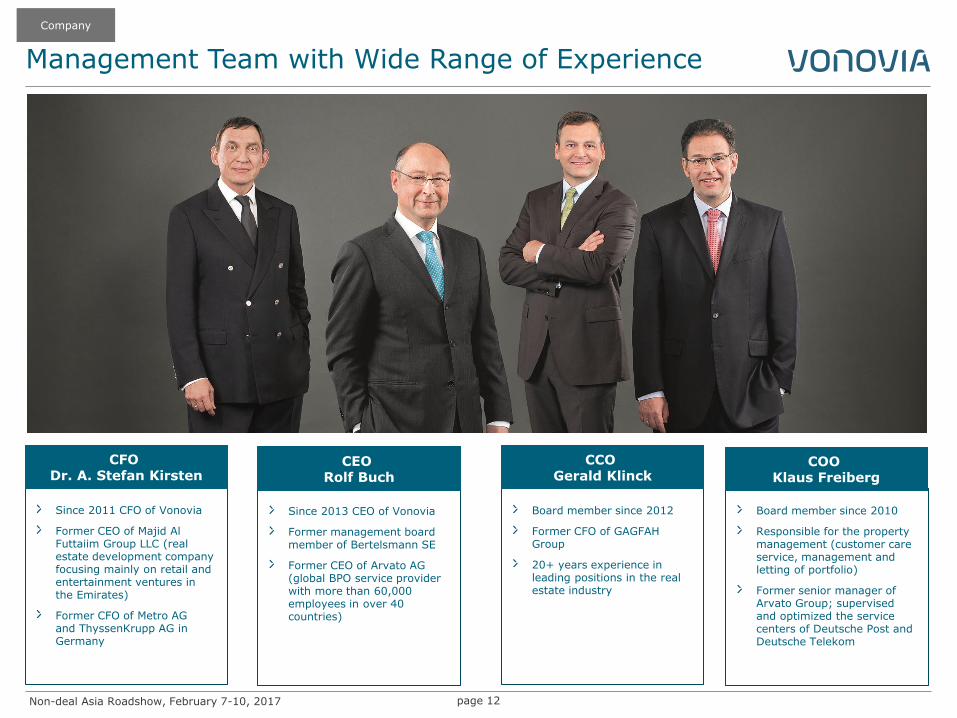
Management Team with Wide Range of Experience
page 12
Since 2011 CFO of Vonovia
Former CEO of Majid Al Futtaiim Group LLC (real estate development company focusing mainly on retail and entertainment ventures in the Emirates)
Former CFO of Metro AG and ThyssenKrupp AG in Germany
CFO Dr. A. Stefan Kirsten
Since 2013 CEO of Vonovia
Former management board member of Bertelsmann SE
Former CEO of Arvato AG (global BPO service provider with more than 60,000 employees in over 40 countries)
CEO Rolf Buch
Board member since 2012
Former CFO of GAGFAH Group
20+ years experience in leading positions in the real estate industry
CCO Gerald Klinck
Board member since 2010
Responsible for the property management (customer care service, management and letting of portfolio)
Former senior manager of Arvato Group; supervised and optimized the service centers of Deutsche Post and Deutsche Telekom
COO Klaus Freiberg
Company
Non-deal Asia Roadshow, February 7-10, 2017
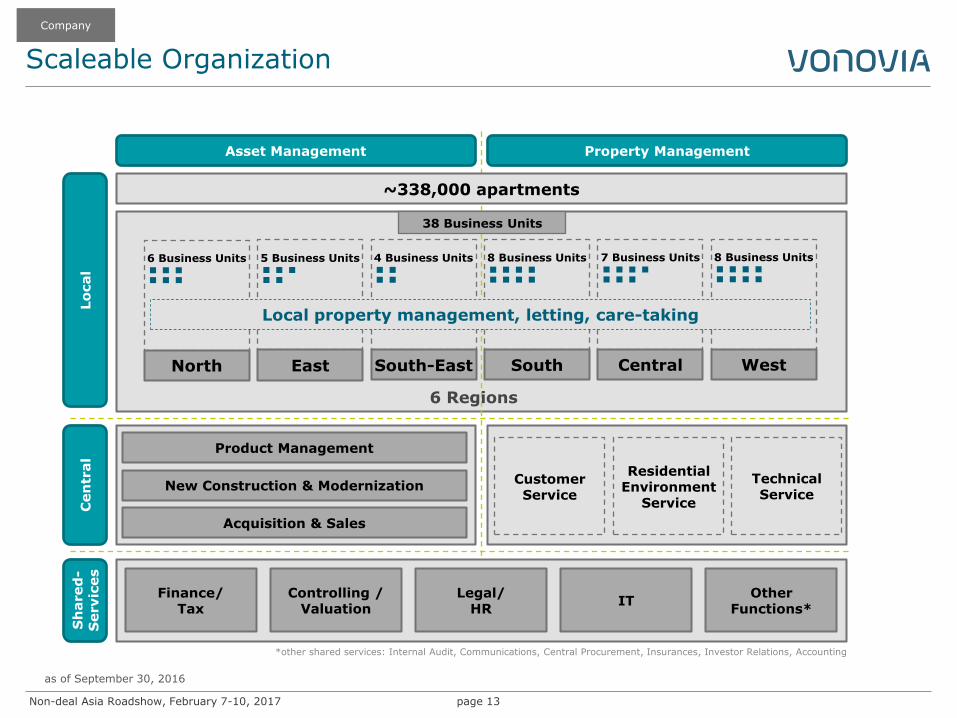
Scaleable Organization
page 13
Lo
cal
Cen
tral
Asset Management Property Management
~338,000 apartments
38 Business Units
6 Business Units
North
Customer Service
Sh
ared
- S
ervic
es
Acquisition & Sales
Finance/ Tax
Controlling / Valuation
Legal/ HR
IT Other
Functions*
5 Business Units
East
4 Business Units
South-East
8 Business Units
South
7 Business Units
Central
8 Business Units
West
6 Regions
Residential Environment
Service
Local property management, letting, care-taking
*other shared services: Internal Audit, Communications, Central Procurement, Insurances, Investor Relations, Accounting
New Construction & Modernization
Product Management
Technical Service
as of September 30, 2016
Company
Non-deal Asia Roadshow, February 7-10, 2017 page 14
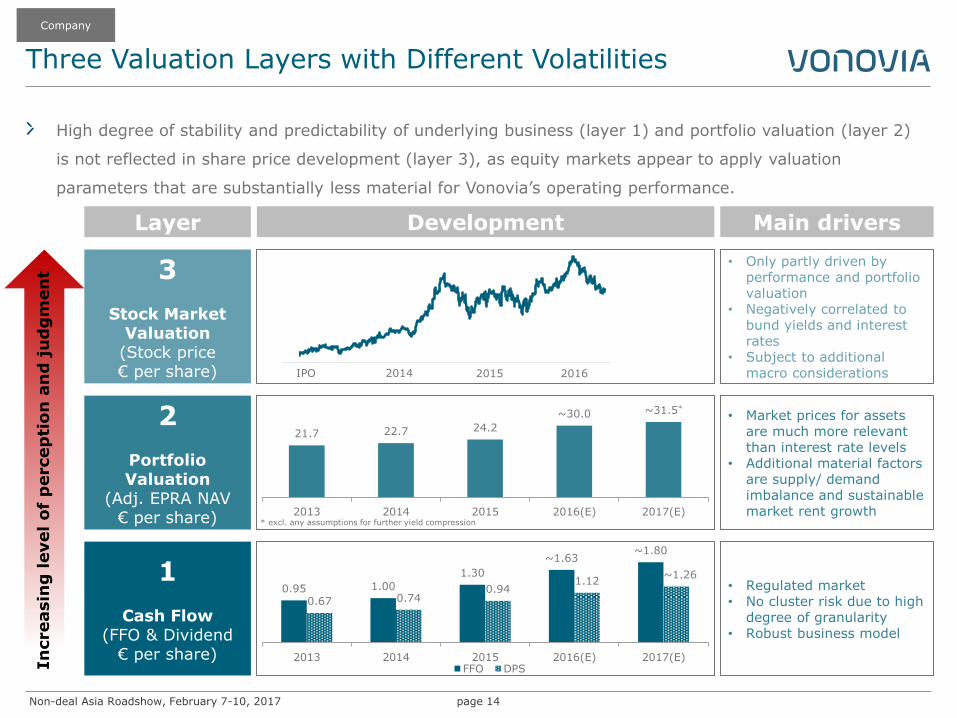
1
Cash Flow (FFO & Dividend
€ per share)
2
Portfolio Valuation
(Adj. EPRA NAV € per share)
3
Stock Market Valuation (Stock price € per share)
• Regulated market • No cluster risk due to high
degree of granularity • Robust business model
• Market prices for assets
are much more relevant than interest rate levels
• Additional material factors are supply/ demand imbalance and sustainable market rent growth
• Only partly driven by performance and portfolio valuation
• Negatively correlated to bund yields and interest rates
• Subject to additional macro considerations
21.7 22.7 24.2
~30.0 ~31.5*
2013 2014 2015 2016(E) 2017(E)
0.95 1.00
1.30
~1.63 ~1.80
0.67 0.74 0.94
1.12 ~1.26
2013 2014 2015 2016(E) 2017(E)FFO DPS
* excl. any assumptions for further yield compression
Three Valuation Layers with Different Volatilities
Layer Development Main drivers
IPO 2014 2015 2016
High degree of stability and predictability of underlying business (layer 1) and portfolio valuation (layer 2)
is not reflected in share price development (layer 3), as equity markets appear to apply valuation
parameters that are substantially less material for Vonovia’s operating performance.
Company
In
creasin
g level
of
percep
tio
n a
nd
ju
dg
men
t
Non-deal Asia Roadshow, February 7-10, 2017
Vonovia History
page 15
Source: Factset, company data
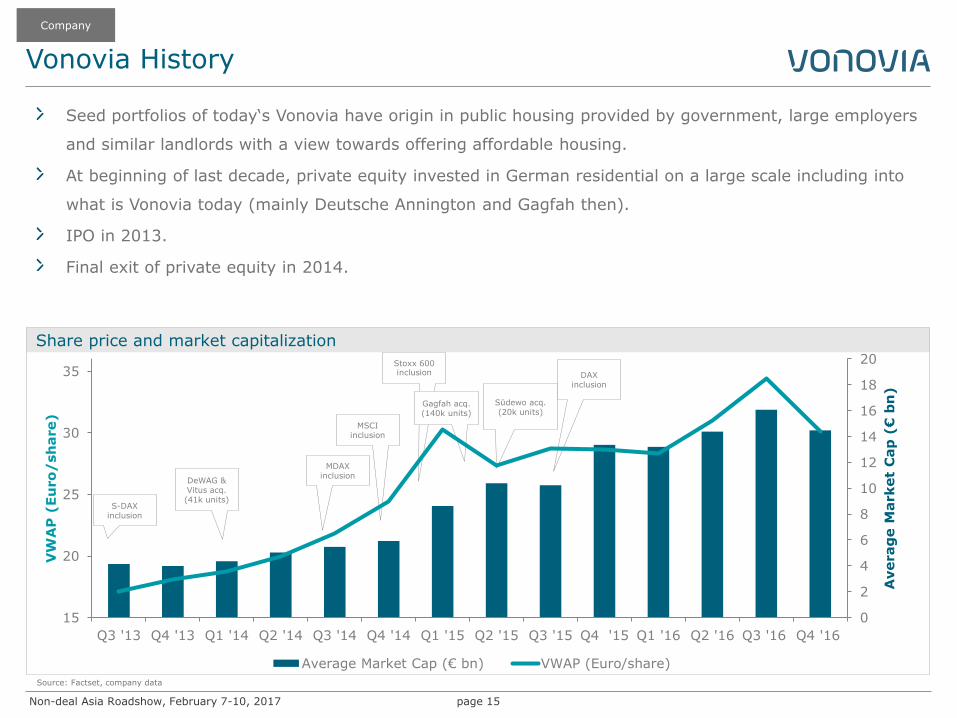
Share price and market capitalization
Seed portfolios of today‘s Vonovia have origin in public housing provided by government, large employers
and similar landlords with a view towards offering affordable housing.
At beginning of last decade, private equity invested in German residential on a large scale including into
what is Vonovia today (mainly Deutsche Annington and Gagfah then).
IPO in 2013.
Final exit of private equity in 2014.
Company
DAX inclusion
MSCI inclusion
Stoxx 600 inclusion
Südewo acq. (20k units)
MDAX inclusion
S-DAX inclusion
DeWAG & Vitus acq. (41k units)
Gagfah acq. (140k units)
0
2
4
6
8
10
12
14
16
18
20
15
20
25
30
35
Q3 '13 Q4 '13 Q1 '14 Q2 '14 Q3 '14 Q4 '14 Q1 '15 Q2 '15 Q3 '15 Q4 '15 Q1 '16 Q2 '16 Q3 '16 Q4 '16
Averag
e M
arket
Cap
(€
bn
)
VW
AP
(Eu
ro
/sh
are)
Average Market Cap (€ bn) VWAP (Euro/share)
Non-deal Asia Roadshow, February 7-10, 2017
Liquid Large-cap Stock
page 16
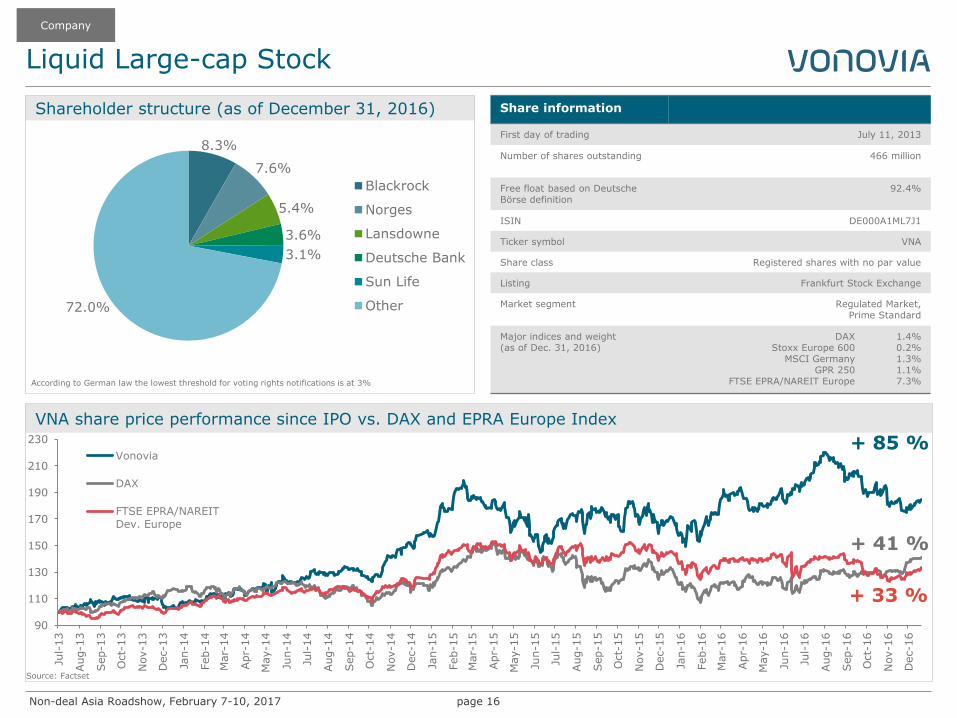
VNA share price performance since IPO vs. DAX and EPRA Europe Index
90
110
130
150
170
190
210
230
Jul-
13
Aug-1
3
Sep-1
3
Oct-
13
Nov-1
3
Dec-1
3
Jan-1
4
Feb-1
4
Mar-
14
Apr-
14
May-1
4
Jun-1
4
Jul-
14
Aug-1
4
Sep-1
4
Oct-
14
Nov-1
4
Dec-1
4
Jan-1
5
Feb-1
5
Mar-
15
Apr-
15
May-1
5
Jun-1
5
Jul-
15
Aug-1
5
Sep-1
5
Oct-
15
Nov-1
5
Dec-1
5
Jan-1
6
Feb-1
6
Mar-
16
Apr-
16
May-1
6
Jun-1
6
Jul-
16
Aug-1
6
Sep-1
6
Oct-
16
Nov-1
6
Dec-1
6
Vonovia
DAX
FTSE EPRA/NAREITDev. Europe
Company
Source: Factset
Share information
First day of trading July 11, 2013
Number of shares outstanding 466 million
Free float based on Deutsche Börse definition
92.4%
ISIN DE000A1ML7J1
Ticker symbol VNA
Share class Registered shares with no par value
Listing Frankfurt Stock Exchange
Market segment Regulated Market, Prime Standard
Major indices and weight (as of Dec. 31, 2016)
DAX Stoxx Europe 600
MSCI Germany GPR 250
FTSE EPRA/NAREIT Europe
1.4% 0.2% 1.3% 1.1% 7.3%
Shareholder structure (as of December 31, 2016)
8.3%
7.6%
5.4%
3.6%
3.1%
72.0%
Blackrock
Norges
Lansdowne
Deutsche Bank
Sun Life
Other
+ 41 %
+ 85 %
+ 33 %
According to German law the lowest threshold for voting rights notifications is at 3%
Non-deal Asia Roadshow, February 7-10, 2017
Attractive Dividend Policy
page 17
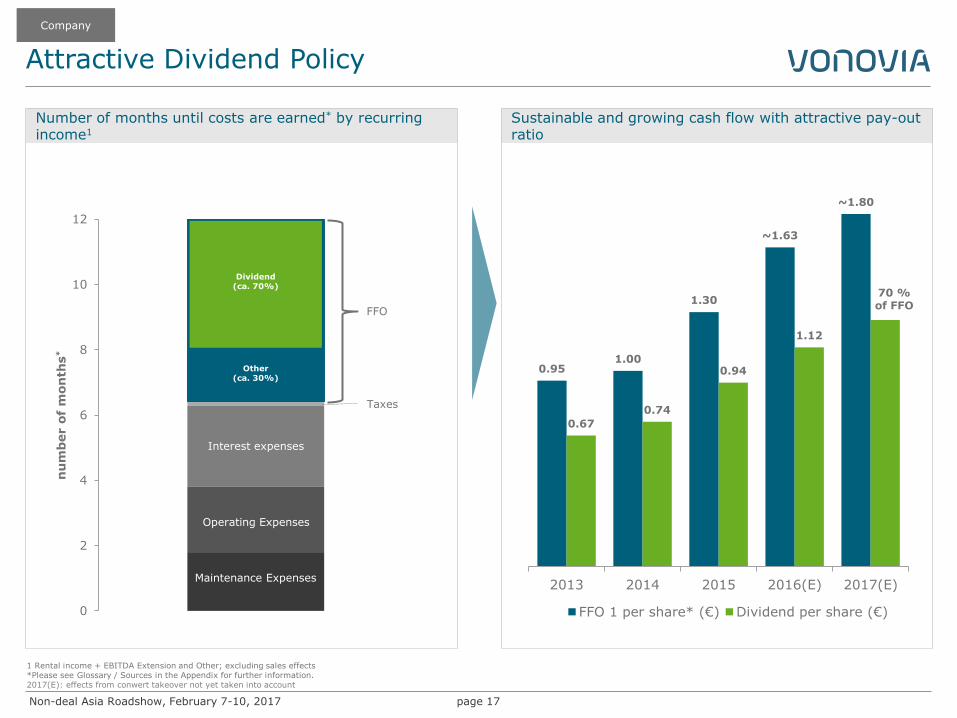
0.95 1.00
1.30
~1.63
~1.80
0.67
0.74
0.94
1.12
2013 2014 2015 2016(E) 2017(E)
FFO 1 per share* (€) Dividend per share (€)
70 % of FFO
Sustainable and growing cash flow with attractive pay-out ratio
1 Rental income + EBITDA Extension and Other; excluding sales effects *Please see Glossary / Sources in the Appendix for further information. 2017(E): effects from conwert takeover not yet taken into account
0
2
4
6
8
10
12
nu
mb
er o
f m
on
ths
*
Number of months until costs are earned* by recurring income1
Maintenance Expenses
Taxes
Interest expenses
Operating Expenses
FFO
Dividend (ca. 70%)
Other (ca. 30%)
Company
Non-deal Asia Roadshow, February 7-10, 2017
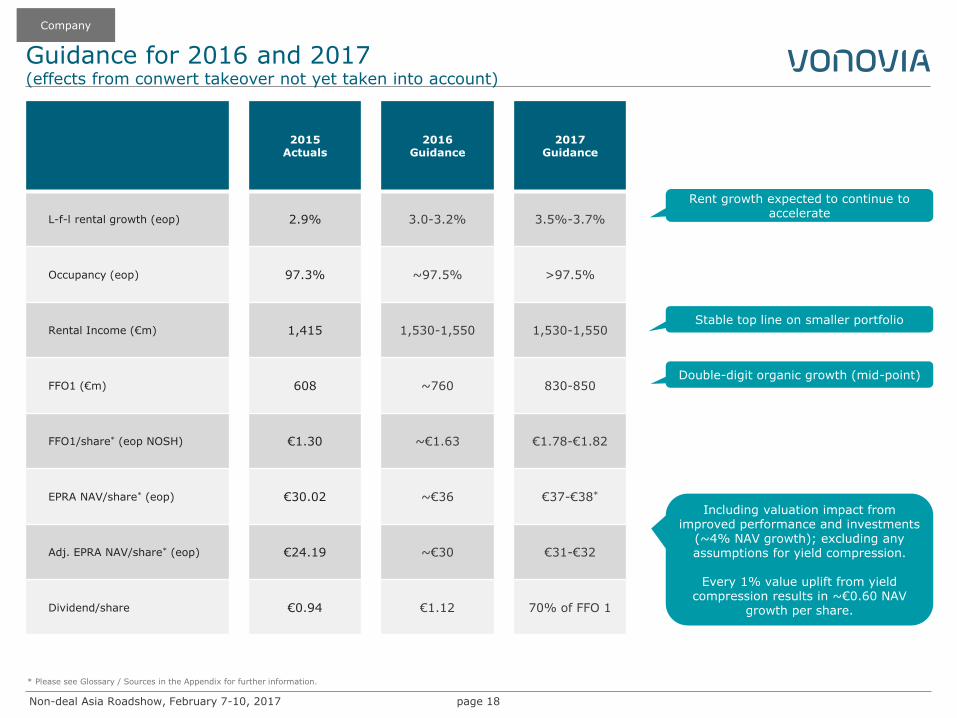
Guidance for 2016 and 2017 (effects from conwert takeover not yet taken into account)
page 18
2015 Actuals
2016 Guidance
2017 Guidance
L-f-l rental growth (eop) 2.9% 3.0-3.2% 3.5%-3.7%
Occupancy (eop) 97.3% ~97.5% >97.5%
Rental Income (€m) 1,415 1,530-1,550 1,530-1,550
FFO1 (€m) 608 ~760 830-850
FFO1/share* (eop NOSH) €1.30 ~€1.63 €1.78-€1.82
EPRA NAV/share* (eop) €30.02 ~€36 €37-€38*
Adj. EPRA NAV/share* (eop) €24.19 ~€30 €31-€32
Dividend/share €0.94 €1.12 70% of FFO 1
Rent growth expected to continue to accelerate
Stable top line on smaller portfolio
Double-digit organic growth (mid-point)
Including valuation impact from improved performance and investments
(~4% NAV growth); excluding any assumptions for yield compression.
Every 1% value uplift from yield
compression results in ~€0.60 NAV growth per share.
* Please see Glossary / Sources in the Appendix for further information.
Company

Non-deal Asia Roadshow, February 7-10, 2017
Guidance for 2016 and 2017 (effects from conwert takeover not yet taken into account)
page 19
* Please see Glossary / Sources in the Appendix for further information. Exchange rates as of Jan 31, 2017 (EUR1.00 : JPY122.39)
Company
EUR USD JPY
2015 2016 2017 2015 2016 2017 2015 2016 2017
Actuals Guidance Guidance Actuals Guidance Guidance Actuals Guidance Guidance
L-f-l rental growth (eop) 2.9% 3.0% - 3.2% 3.5% - 3.7% 2.9% 3.0% - 3.2% 3.5% - 3.7% 2.9% 3.0% - 3.2% 3.5% - 3.7%
Occupancy (eop) 97.3% ~97.5% >97.5% 97.3% ~97.5% >97.5% 97.3% ~97.5% >97.5%
Rental Income (m) 1,415 1,530 - 1,550 1,530 - 1,550 1,514 1,637 - 1,658 1,637 - 1,658 173,182 187,257 - 189,705 187,257 - 189,705
FFO1 (m) 608 ~760 830 - 850 650 ~813 888 - 909 74,413 ~93,016 101,584 - 104,032
FFO1/share* (eop NOSH) 1.30 ~1.63 1.78 - 1.82 1.39 ~1.74 1.90 - 1.95 159 ~199 218 - 223
EPRA NAV/share* (eop) 30.02 ~36 37 - 38* 32.11 ~39 40 - 41 3,674 ~4,406 4,528 - 4,651
Adj. EPRA NAV/share* (eop) 24.19 ~30 31 - 32 25.88 ~32 33 - 34 2,961 ~3,672 3,794 - 3,916
Dividend/share 0.94 ~1.12 70% of FFO 1 1.01 ~1.20 70% of FFO 1 115 ~137 70% of FFO 1
Non-deal Asia Roadshow, February 7-10, 2017
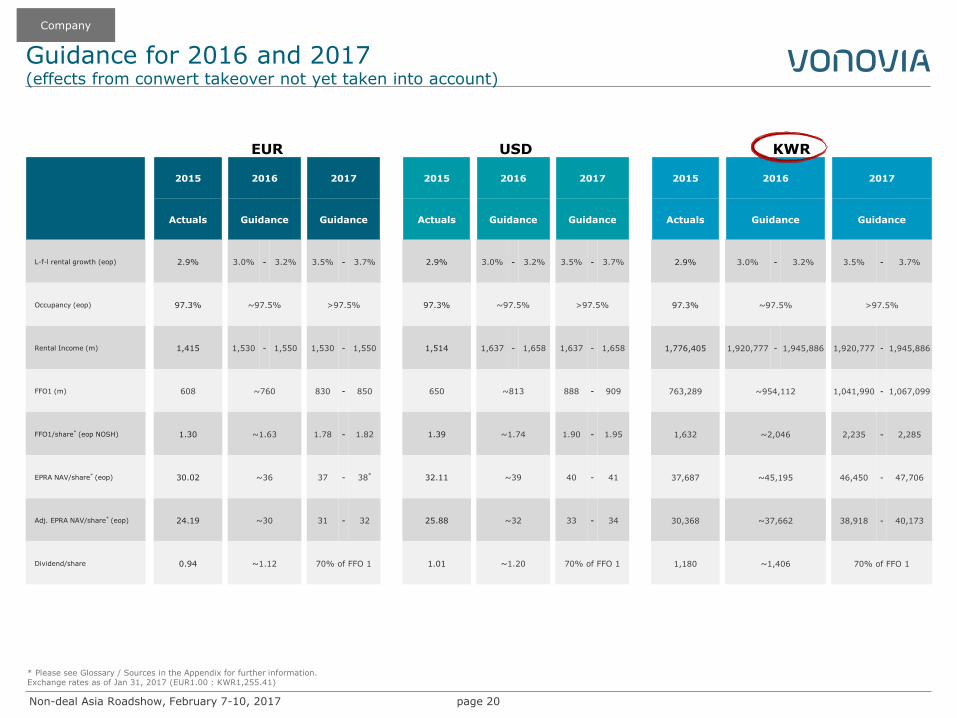
Guidance for 2016 and 2017 (effects from conwert takeover not yet taken into account)
page 20
Company
EUR USD KWR
2015 2016 2017 2015 2016 2017 2015 2016 2017
Actuals Guidance Guidance Actuals Guidance Guidance Actuals Guidance Guidance
L-f-l rental growth (eop) 2.9% 3.0% - 3.2% 3.5% - 3.7% 2.9% 3.0% - 3.2% 3.5% - 3.7% 2.9% 3.0% - 3.2% 3.5% - 3.7%
Occupancy (eop) 97.3% ~97.5% >97.5% 97.3% ~97.5% >97.5% 97.3% ~97.5% >97.5%
Rental Income (m) 1,415 1,530 - 1,550 1,530 - 1,550 1,514 1,637 - 1,658 1,637 - 1,658 1,776,405 1,920,777 - 1,945,886 1,920,777 - 1,945,886
FFO1 (m) 608 ~760 830 - 850 650 ~813 888 - 909 763,289 ~954,112 1,041,990 - 1,067,099
FFO1/share* (eop NOSH) 1.30 ~1.63 1.78 - 1.82 1.39 ~1.74 1.90 - 1.95 1,632 ~2,046 2,235 - 2,285
EPRA NAV/share* (eop) 30.02 ~36 37 - 38* 32.11 ~39 40 - 41 37,687 ~45,195 46,450 - 47,706
Adj. EPRA NAV/share* (eop) 24.19 ~30 31 - 32 25.88 ~32 33 - 34 30,368 ~37,662 38,918 - 40,173
Dividend/share 0.94 ~1.12 70% of FFO 1 1.01 ~1.20 70% of FFO 1 1,180 ~1,406 70% of FFO 1
* Please see Glossary / Sources in the Appendix for further information. Exchange rates as of Jan 31, 2017 (EUR1.00 : KWR1,255.41)

Non-deal Asia Roadshow, February 7-10, 2017
Guidance for 2016 and 2017 (effects from conwert takeover not yet taken into account)
page 21
Company
EUR USD HKD
2015 2016 2017 2015 2016 2017 2015 2016 2017
Actuals Guidance Guidance Actuals Guidance Guidance Actuals Guidance Guidance
L-f-l rental growth (eop) 2.9% 3.0% - 3.2% 3.5% - 3.7% 2.9% 3.0% - 3.2% 3.5% - 3.7% 2.9% 3.0% - 3.2% 3.5% - 3.7%
Occupancy (eop) 97.3% ~97.5% >97.5% 97.3% ~97.5% >97.5% 97.3% ~97.5% >97.5%
Rental Income (m) 1,415 1,530 - 1,550 1,530 - 1,550 1,514 1,637 - 1,658 1,637 - 1,658 11,743 12,698 - 12,864 12,698 - 12,864
FFO1 (m) 608 ~760 830 - 850 650 ~813 888 - 909 5,046 ~6,307 6,888 - 7,054
FFO1/share* (eop NOSH) 1.30 ~1.63 1.78 - 1.82 1.39 ~1.74 1.90 - 1.95 10.8 ~13.5 14.8 - 15.1
EPRA NAV/share* (eop) 30.02 ~36 37 - 38* 32.11 ~39 40 - 41 249 ~299 307.1 - 315.4
Adj. EPRA NAV/share* (eop) 24.19 ~30 31 - 32 25.88 ~32 33 - 34 201 ~249 257.3 - 265.6
Dividend/share 0.94 ~1.12 70% of FFO 1 1.01 ~1.20 70% of FFO 1 ~7.80 ~9.30 70% of FFO 1
* Please see Glossary / Sources in the Appendix for further information. Exchange rates as of Jan 31, 2017 (EUR1.00 : HKD8.29922)

Non-deal Asia Roadshow, February 7-10, 2017
Guidance for 2016 and 2017 (effects from conwert takeover not yet taken into account)
page 22
Company
EUR USD SGD
2015 2016 2017 2015 2016 2017 2015 2016 2017
Actuals Guidance Guidance Actuals Guidance Guidance Actuals Guidance Guidance
L-f-l rental growth (eop) 2.9% 3.0% - 3.2% 3.5% - 3.7% 2.9% 3.0% - 3.2% 3.5% - 3.7% 2.9% 3.0% - 3.2% 3.5% - 3.7%
Occupancy (eop) 97.3% ~97.5% >97.5% 97.3% ~97.5% >97.5% 97.3% ~97.5% >97.5%
Rental Income (m) 1,415 1,530 - 1,550 1,530 - 1,550 1,514 1,637 - 1,658 1,637 - 1,658 2,157 2,332 - 2,363 2,332 - 2,363
FFO1 (m) 608 ~760 830 - 850 650 ~813 888 - 909 927 ~1,159 1,265 - 1,296
FFO1/share* (eop NOSH) 1.30 ~1.63 1.78 - 1.82 1.39 ~1.74 1.90 - 1.95 2.0 ~2.5 2.7 - 2.8
EPRA NAV/share* (eop) 30.02 ~36 37 - 38* 32.11 ~39 40 - 41 45.8 ~55 56.4 - 57.9
Adj. EPRA NAV/share* (eop) 24.19 ~30 31 - 32 25.88 ~32 33 - 34 36.9 ~46 47.3 - 48.8
Dividend/share 0.94 ~1.12 70% of FFO 1 1.01 ~1.20 70% of FFO 1 ~1.43 ~1.71 70% of FFO 1
* Please see Glossary / Sources in the Appendix for further information. Exchange rates as of Jan 31, 2017 (EUR1.00 : SGD1.52449)
Non-deal Asia Roadshow, February 7-10, 2017 page 23
Market
Company
Strategy & Execution
Non-deal Asia Roadshow, February 7-10, 2017
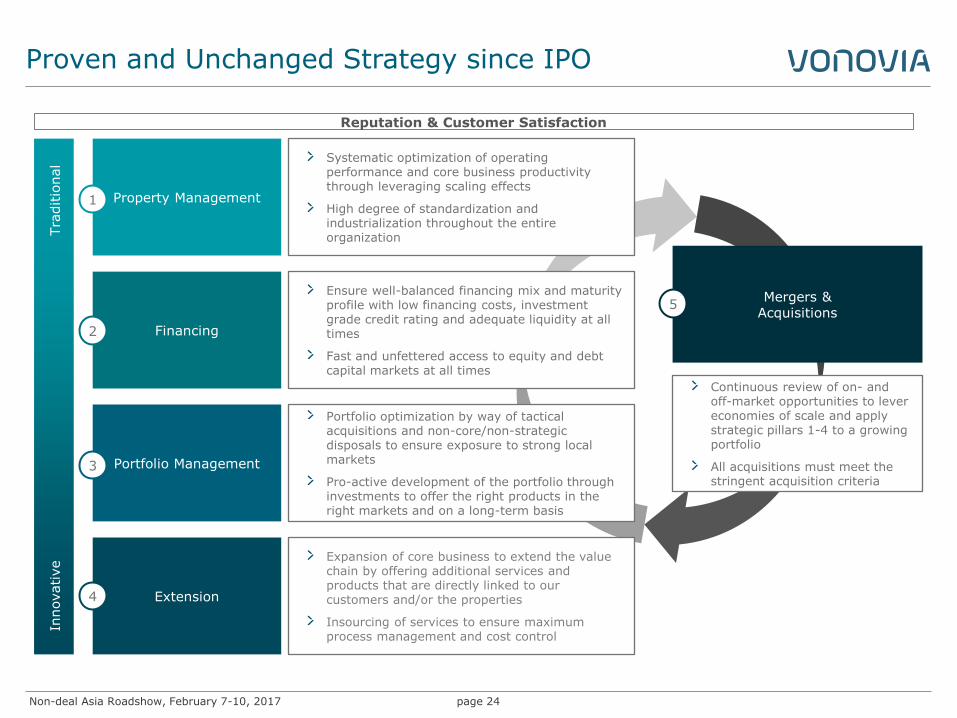
Proven and Unchanged Strategy since IPO
page 24
Financing 2
Ensure well-balanced financing mix and maturity profile with low financing costs, investment grade credit rating and adequate liquidity at all times
Fast and unfettered access to equity and debt capital markets at all times
Portfolio Management 3
Portfolio optimization by way of tactical acquisitions and non-core/non-strategic disposals to ensure exposure to strong local markets
Pro-active development of the portfolio through investments to offer the right products in the right markets and on a long-term basis
Extension 4
Expansion of core business to extend the value chain by offering additional services and products that are directly linked to our customers and/or the properties
Insourcing of services to ensure maximum process management and cost control
Innovative
Tra
ditio
nal
Property Management 1
Systematic optimization of operating performance and core business productivity through leveraging scaling effects
High degree of standardization and industrialization throughout the entire organization
Continuous review of on- and off-market opportunities to lever economies of scale and apply strategic pillars 1-4 to a growing portfolio
All acquisitions must meet the stringent acquisition criteria
Reputation & Customer Satisfaction
Mergers & Acquisitions
5
Non-deal Asia Roadshow, February 7-10, 2017
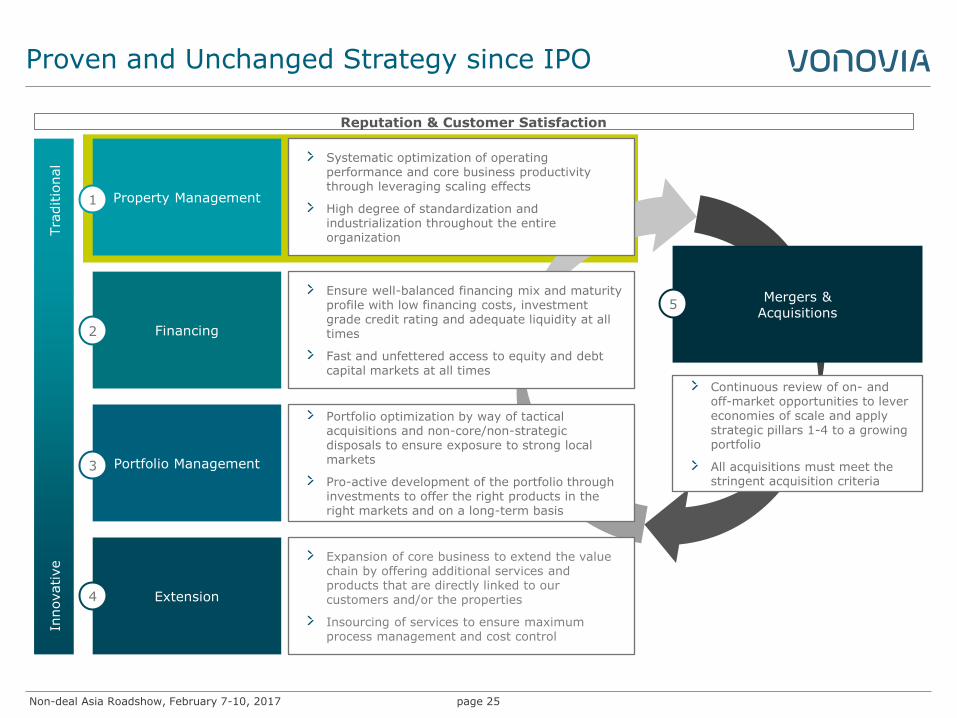
Proven and Unchanged Strategy since IPO
page 25
Financing 2
Ensure well-balanced financing mix and maturity profile with low financing costs, investment grade credit rating and adequate liquidity at all times
Fast and unfettered access to equity and debt capital markets at all times
Portfolio Management 3
Portfolio optimization by way of tactical acquisitions and non-core/non-strategic disposals to ensure exposure to strong local markets
Pro-active development of the portfolio through investments to offer the right products in the right markets and on a long-term basis
Extension 4
Expansion of core business to extend the value chain by offering additional services and products that are directly linked to our customers and/or the properties
Insourcing of services to ensure maximum process management and cost control
Innovative
Tra
ditio
nal
Property Management 1
Systematic optimization of operating performance and core business productivity through leveraging scaling effects
High degree of standardization and industrialization throughout the entire organization
Continuous review of on- and off-market opportunities to lever economies of scale and apply strategic pillars 1-4 to a growing portfolio
All acquisitions must meet the stringent acquisition criteria
Reputation & Customer Satisfaction
Mergers & Acquisitions
5
Non-deal Asia Roadshow, February 7-10, 2017
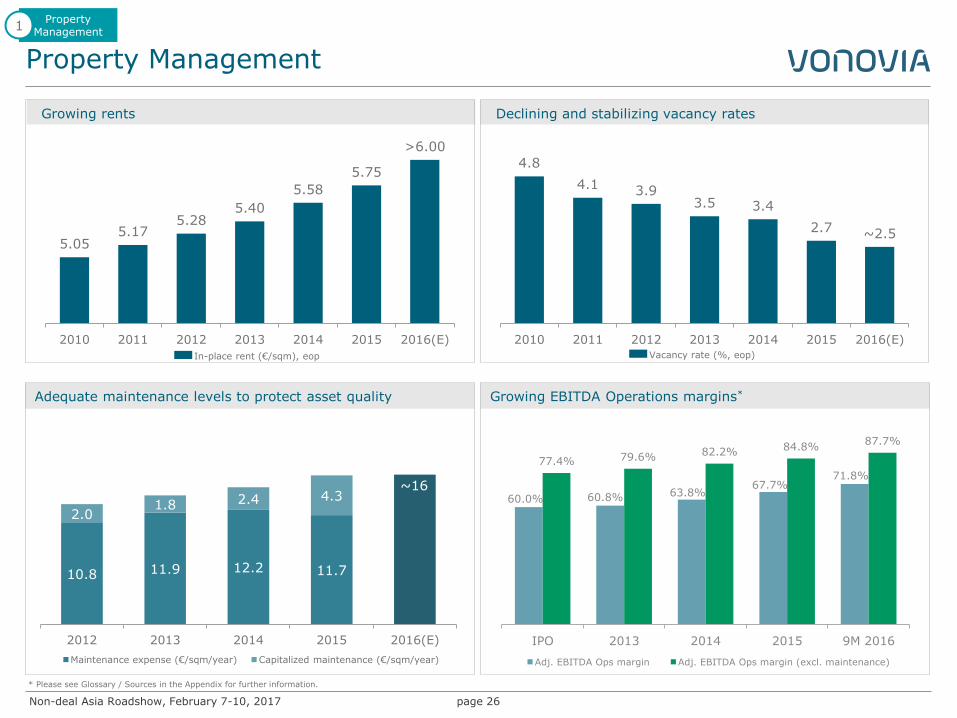
Adequate maintenance levels to protect asset quality
Property Management
page 26
Growing rents
In-place rent (€/sqm), eop
Declining and stabilizing vacancy rates
Growing EBITDA Operations margins*
60.0% 60.8% 63.8% 67.7%
71.8%
77.4% 79.6% 82.2% 84.8% 87.7%
IPO 2013 2014 2015 9M 2016
Adj. EBITDA Ops margin Adj. EBITDA Ops margin (excl. maintenance)
* Please see Glossary / Sources in the Appendix for further information.
Property Management
1
10.8 11.9 12.2 11.7
2.0 1.8 2.4 4.3
2012 2013 2014 2015 2016(E)
Maintenance expense (€/sqm/year) Capitalized maintenance (€/sqm/year)
Vacancy rate (%, eop)
~16
5.05 5.17
5.28 5.40
5.58
5.75
>6.00
2010 2011 2012 2013 2014 2015 2016(E)
4.8
4.1 3.9 3.5 3.4
2.7 ~2.5
2010 2011 2012 2013 2014 2015 2016(E)
Non-deal Asia Roadshow, February 7-10, 2017
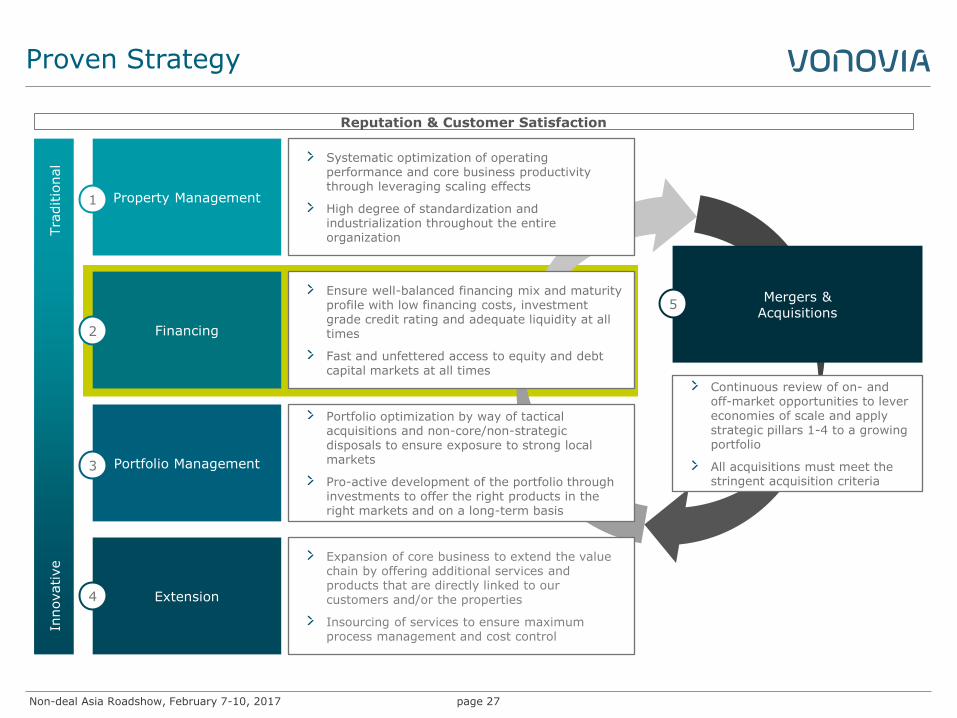
Proven Strategy
page 27
Financing 2
Ensure well-balanced financing mix and maturity profile with low financing costs, investment grade credit rating and adequate liquidity at all times
Fast and unfettered access to equity and debt capital markets at all times
Portfolio Management 3
Portfolio optimization by way of tactical acquisitions and non-core/non-strategic disposals to ensure exposure to strong local markets
Pro-active development of the portfolio through investments to offer the right products in the right markets and on a long-term basis
Extension 4
Expansion of core business to extend the value chain by offering additional services and products that are directly linked to our customers and/or the properties
Insourcing of services to ensure maximum process management and cost control
Innovative
Tra
ditio
nal
Property Management 1
Systematic optimization of operating performance and core business productivity through leveraging scaling effects
High degree of standardization and industrialization throughout the entire organization
Continuous review of on- and off-market opportunities to lever economies of scale and apply strategic pillars 1-4 to a growing portfolio
All acquisitions must meet the stringent acquisition criteria
Reputation & Customer Satisfaction
Mergers & Acquisitions
5
Non-deal Asia Roadshow, February 7-10, 2017
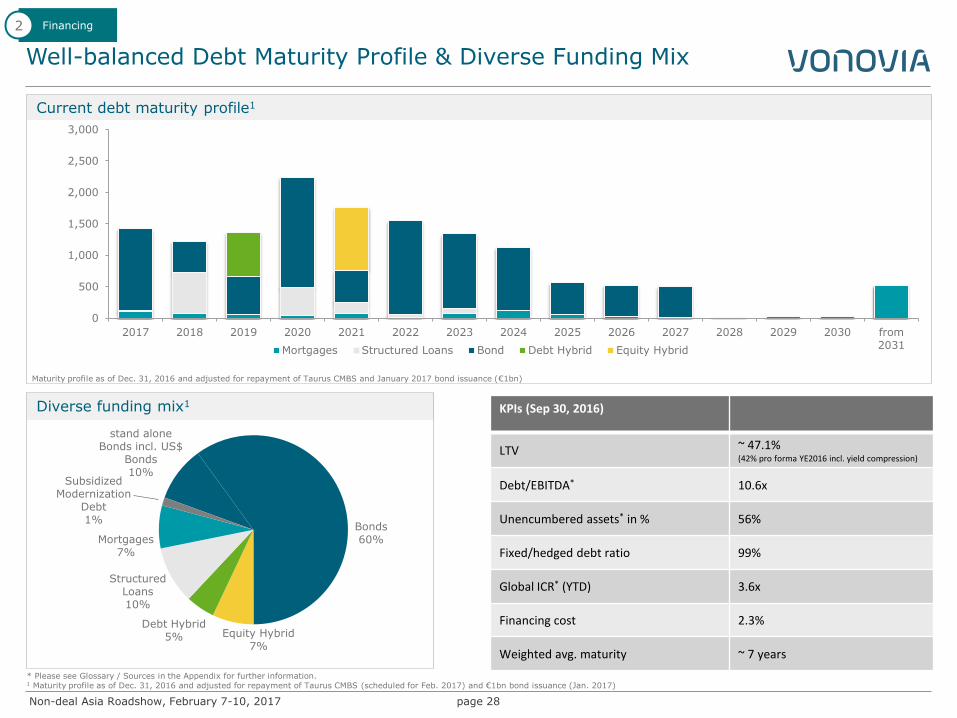
Well-balanced Debt Maturity Profile & Diverse Funding Mix
page 28
KPIs (Sep 30, 2016)
LTV ~ 47.1% (42% pro forma YE2016 incl. yield compression)
Debt/EBITDA* 10.6x
Unencumbered assets* in % 56%
Fixed/hedged debt ratio 99%
Global ICR* (YTD) 3.6x
Financing cost 2.3%
Weighted avg. maturity ~ 7 years
Current debt maturity profile1
Diverse funding mix1
Financing 2
* Please see Glossary / Sources in the Appendix for further information. 1 Maturity profile as of Dec. 31, 2016 and adjusted for repayment of Taurus CMBS (scheduled for Feb. 2017) and €1bn bond issuance (Jan. 2017)
Maturity profile as of Dec. 31, 2016 and adjusted for repayment of Taurus CMBS and January 2017 bond issuance (€1bn)
0
500
1,000
1,500
2,000
2,500
3,000
2017 2018 2019 2020 2021 2022 2023 2024 2025 2026 2027 2028 2029 2030 from2031Mortgages Structured Loans Bond Debt Hybrid Equity Hybrid
stand alone Bonds incl. US$
Bonds 10%
Bonds 60%
Equity Hybrid 7%
Debt Hybrid 5%
Structured Loans 10%
Mortgages 7%
Subsidized Modernization
Debt 1%
Non-deal Asia Roadshow, February 7-10, 2017
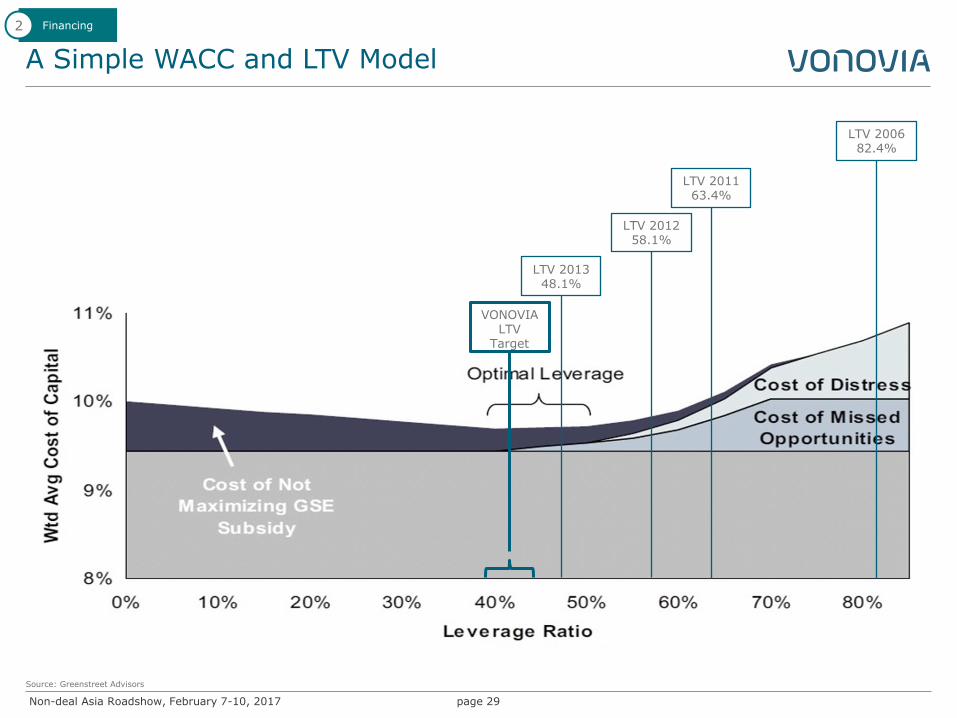
A Simple WACC and LTV Model
page 29
VONOVIA LTV
Target
Source: Greenstreet Advisors
Financing 2
VNA LTV 2014 49.3%
VNA LTV 2015 46.9%
LTV 2013 48.1%
LTV 2012 58.1%
LTV 2011 63.4%
LTV 2006 82.4%
Non-deal Asia Roadshow, February 7-10, 2017
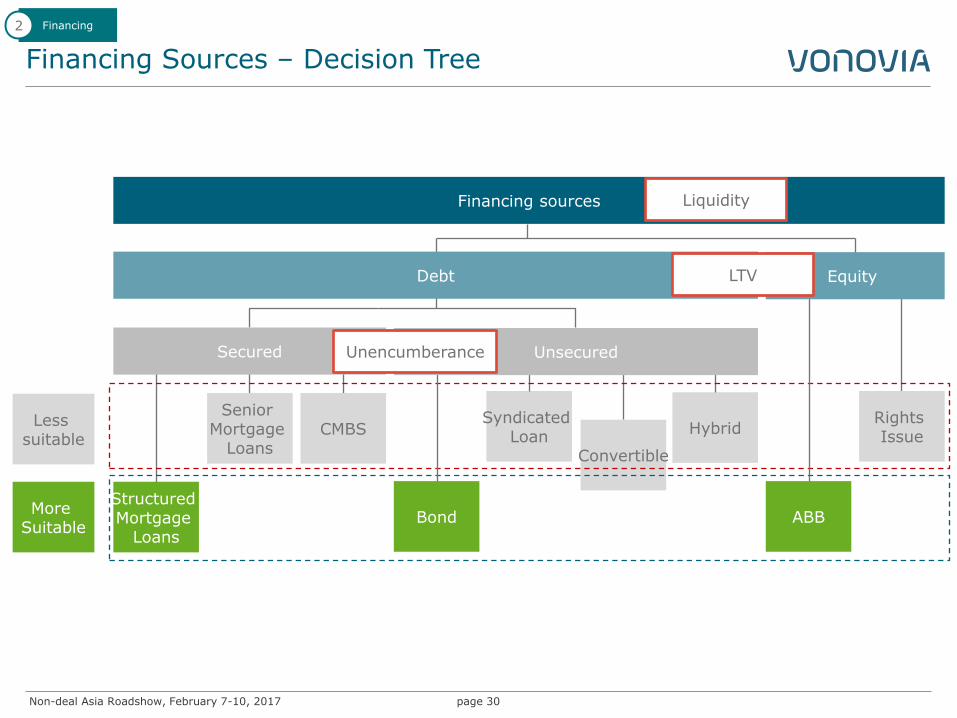
Financing Sources – Decision Tree
page 30
Convertible
Syndicated Loan
Hybrid CMBS Senior
Mortgage Loans
Structured Mortgage
Loans
Secured
Less suitable
More Suitable
Rights Issue
Unsecured
Bond ABB
Equity Debt
Financing sources
Financing 2
Liquidity
LTV
Unencumberance
Non-deal Asia Roadshow, February 7-10, 2017
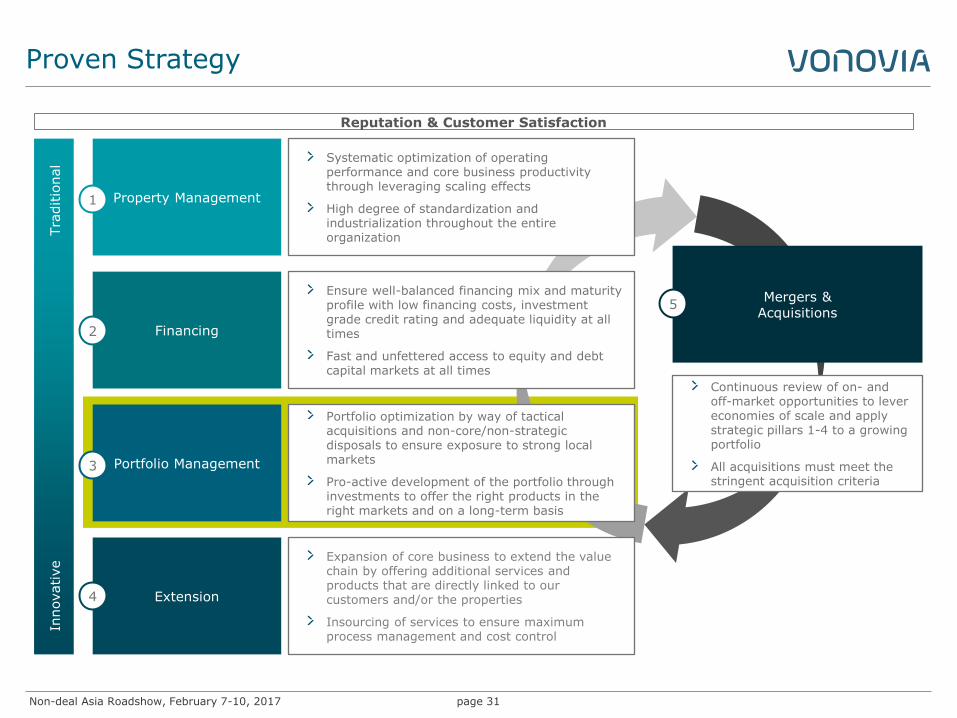
Proven Strategy
page 31
Financing 2
Ensure well-balanced financing mix and maturity profile with low financing costs, investment grade credit rating and adequate liquidity at all times
Fast and unfettered access to equity and debt capital markets at all times
Portfolio Management 3
Portfolio optimization by way of tactical acquisitions and non-core/non-strategic disposals to ensure exposure to strong local markets
Pro-active development of the portfolio through investments to offer the right products in the right markets and on a long-term basis
Extension 4
Expansion of core business to extend the value chain by offering additional services and products that are directly linked to our customers and/or the properties
Insourcing of services to ensure maximum process management and cost control
Innovative
Tra
ditio
nal
Property Management 1
Systematic optimization of operating performance and core business productivity through leveraging scaling effects
High degree of standardization and industrialization throughout the entire organization
Continuous review of on- and off-market opportunities to lever economies of scale and apply strategic pillars 1-4 to a growing portfolio
All acquisitions must meet the stringent acquisition criteria
Reputation & Customer Satisfaction
Mergers & Acquisitions
5
Non-deal Asia Roadshow, February 7-10, 2017
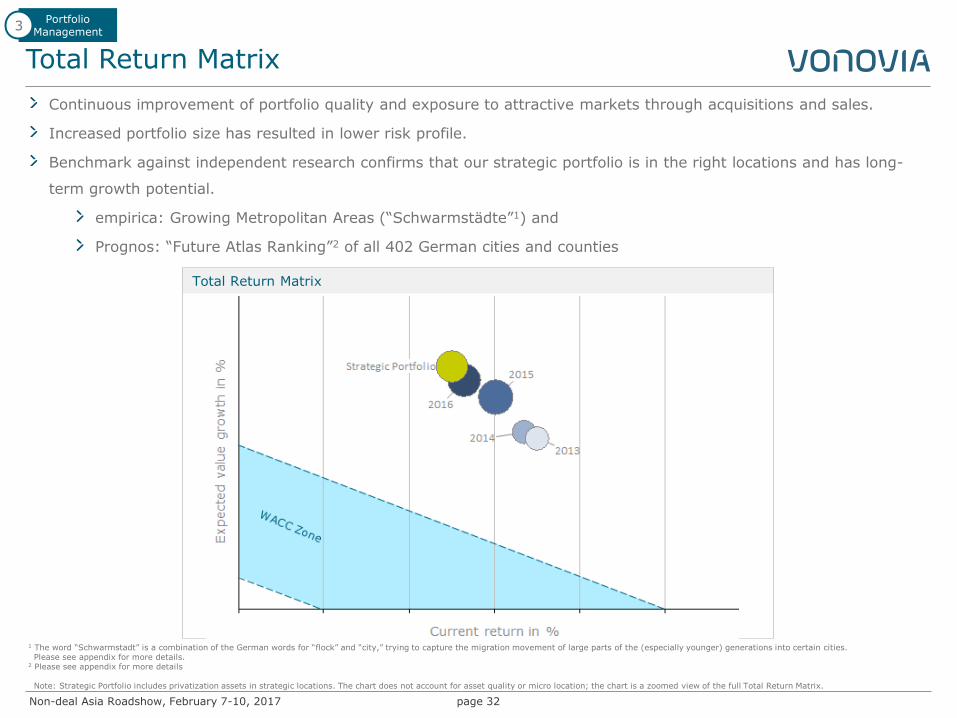
Total Return Matrix
page 32
Continuous improvement of portfolio quality and exposure to attractive markets through acquisitions and sales.
Increased portfolio size has resulted in lower risk profile.
Benchmark against independent research confirms that our strategic portfolio is in the right locations and has long-
term growth potential.
empirica: Growing Metropolitan Areas (“Schwarmstädte”1) and
Prognos: “Future Atlas Ranking”2 of all 402 German cities and counties
1 The word “Schwarmstadt” is a combination of the German words for “flock” and “city,” trying to capture the migration movement of large parts of the (especially younger) generations into certain cities. Please see appendix for more details. 2 Please see appendix for more details Note: Strategic Portfolio includes privatization assets in strategic locations. The chart does not account for asset quality or micro location; the chart is a zoomed view of the full Total Return Matrix.
Total Return Matrix
Portfolio Management
3
Non-deal Asia Roadshow, February 7-10, 2017
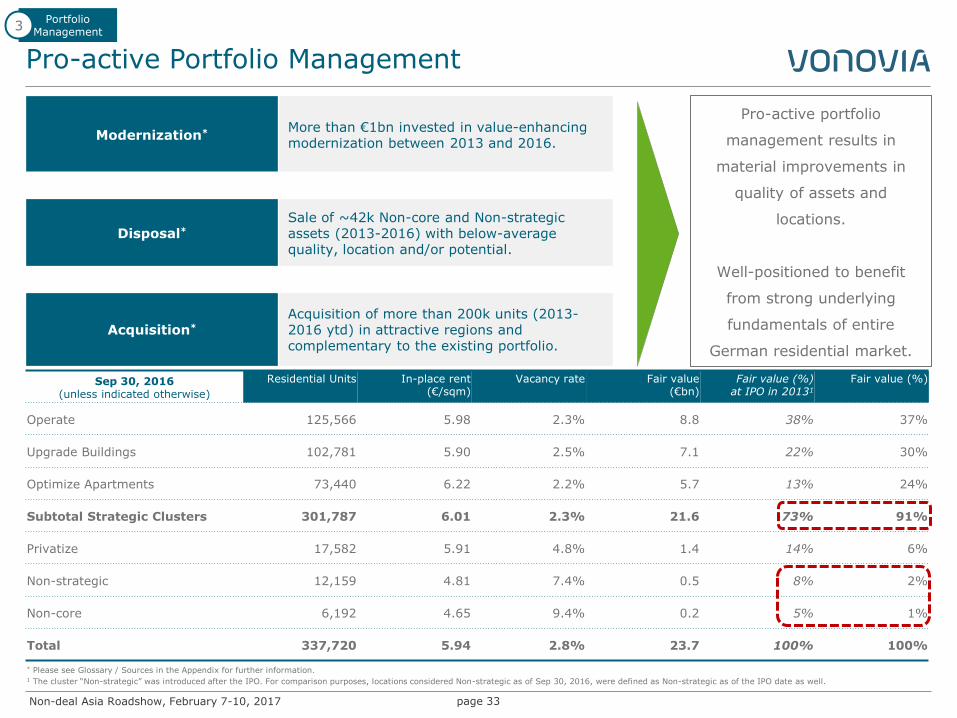
Pro-active Portfolio Management
page 33
Modernization* More than €1bn invested in value-enhancing modernization between 2013 and 2016.
Disposal* Sale of ~42k Non-core and Non-strategic assets (2013-2016) with below-average quality, location and/or potential.
Acquisition*
Acquisition of more than 200k units (2013-2016 ytd) in attractive regions and complementary to the existing portfolio.
Pro-active portfolio
management results in
material improvements in
quality of assets and
locations.
Well-positioned to benefit
from strong underlying
fundamentals of entire
German residential market.
Portfolio Management
3
* Please see Glossary / Sources in the Appendix for further information.
Sep 30, 2016 (unless indicated otherwise)
Residential Units In-place rent (€/sqm)
Vacancy rate Fair value (€bn)
Fair value (%) at IPO in 20131
Fair value (%)
Operate 125,566 5.98 2.3% 8.8 38% 37%
Upgrade Buildings 102,781 5.90 2.5% 7.1 22% 30%
Optimize Apartments 73,440 6.22 2.2% 5.7 13% 24%
Subtotal Strategic Clusters 301,787 6.01 2.3% 21.6 73% 91%
Privatize 17,582 5.91 4.8% 1.4 14% 6%
Non-strategic 12,159 4.81 7.4% 0.5 8% 2%
Non-core 6,192 4.65 9.4% 0.2 5% 1%
Total 337,720 5.94 2.8% 23.7 100% 100%
1 The cluster “Non-strategic” was introduced after the IPO. For comparison purposes, locations considered Non-strategic as of Sep 30, 2016, were defined as Non-strategic as of the IPO date as well.
Non-deal Asia Roadshow, February 7-10, 2017
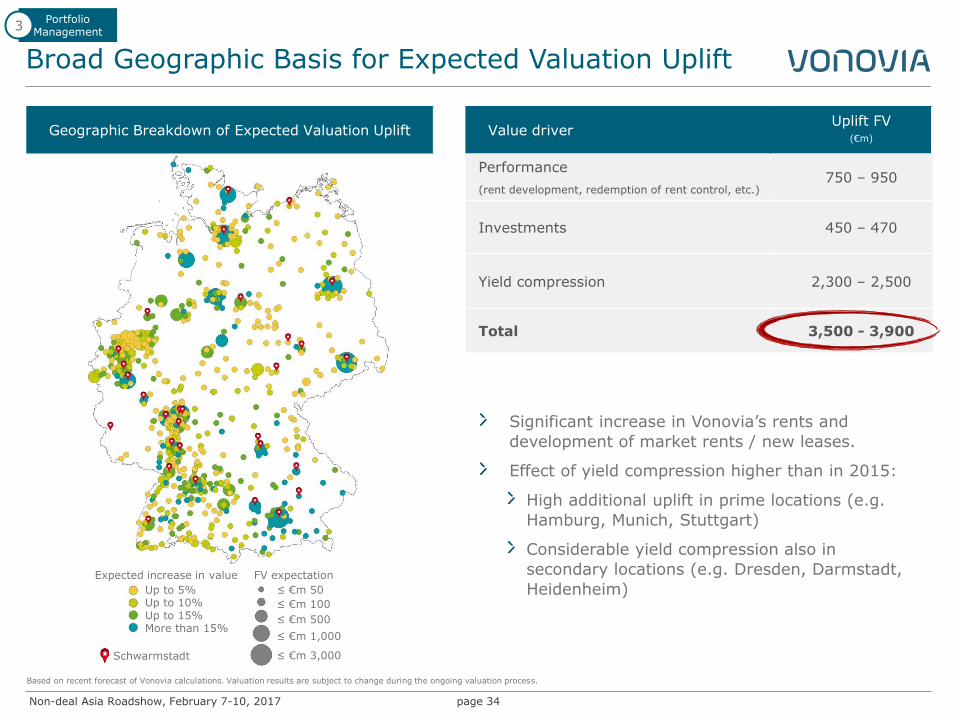
Broad Geographic Basis for Expected Valuation Uplift
page 34
Portfolio Management
3
Based on recent forecast of Vonovia calculations. Valuation results are subject to change during the ongoing valuation process.
Up to 5% Up to 10% Up to 15% More than 15%
Expected increase in value
≤ €m 50
≤ €m 100
≤ €m 500
≤ €m 1,000
≤ €m 3,000
FV expectation
Schwarmstadt
Value driver Uplift FV
(€m)
Performance
(rent development, redemption of rent control, etc.) 750 – 950
Investments 450 – 470
Yield compression 2,300 – 2,500
Total 3,500 - 3,900
Significant increase in Vonovia’s rents and
development of market rents / new leases.
Effect of yield compression higher than in 2015:
High additional uplift in prime locations (e.g.
Hamburg, Munich, Stuttgart)
Considerable yield compression also in
secondary locations (e.g. Dresden, Darmstadt,
Heidenheim)
Geographic Breakdown of Expected Valuation Uplift
Non-deal Asia Roadshow, February 7-10, 2017
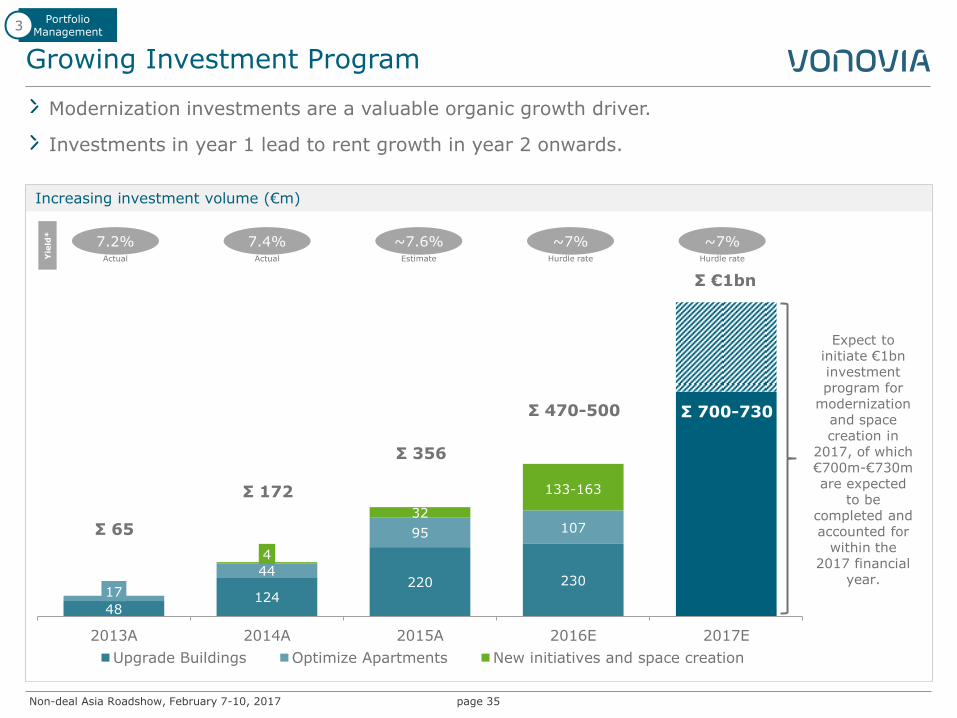
Increasing investment volume (€m)
48 124
220 230 17
44
95 107
4
32
2013A 2014A 2015A 2016E 2017E
Upgrade Buildings Optimize Apartments New initiatives and space creation
133-163
Growing Investment Program
page 35
7.2% 7.4% ~7.6% ~7%
Modernization investments are a valuable organic growth driver.
Investments in year 1 lead to rent growth in year 2 onwards.
Σ 65
Σ 172
Σ 356
Σ 470-500
Yie
ld*
~7%
Portfolio Management
3
Σ 700-730
133-163
Expect to initiate €1bn investment program for
modernization and space creation in
2017, of which €700m-€730m are expected
to be completed and accounted for
within the 2017 financial
year.
Σ €1bn
Hurdle rate Hurdle rate Actual Estimate Actual
Non-deal Asia Roadshow, February 7-10, 2017
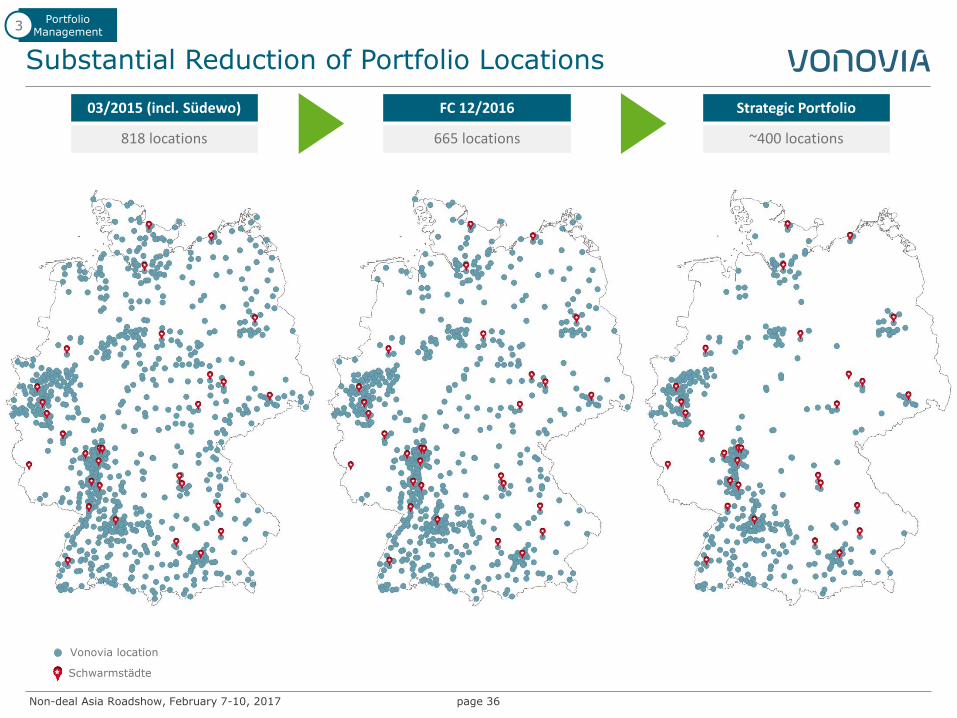
Substantial Reduction of Portfolio Locations
page 36
Portfolio Management
3
Schwarmstädte
Vonovia location
03/2015 (incl. Südewo)
818 locations
FC 12/2016
665 locations
Strategic Portfolio
~400 locations
Non-deal Asia Roadshow, February 7-10, 2017
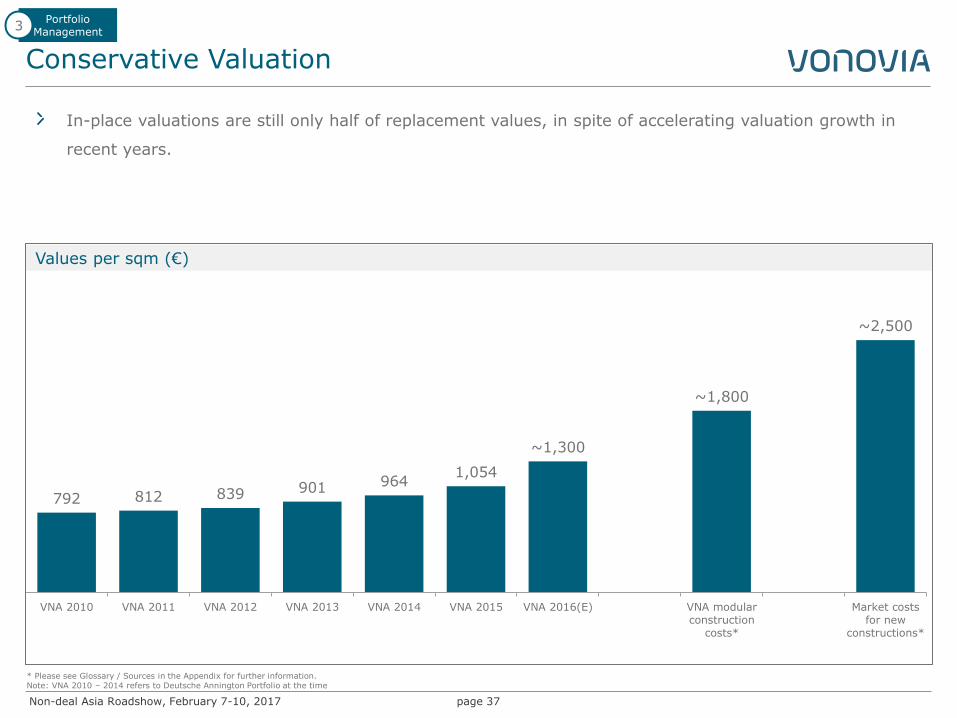
Values per sqm (€)
Conservative Valuation
page 37
In-place valuations are still only half of replacement values, in spite of accelerating valuation growth in
recent years.
Portfolio Management
3
* Please see Glossary / Sources in the Appendix for further information. Note: VNA 2010 – 2014 refers to Deutsche Annington Portfolio at the time
792 812 839 901 964 1,054
~1,300
~1,800
~2,500
VNA 2010 VNA 2011 VNA 2012 VNA 2013 VNA 2014 VNA 2015 VNA 2016(E) VNA modularconstruction
costs*
Market costsfor new
constructions*
Non-deal Asia Roadshow, February 7-10, 2017
Proven Strategy
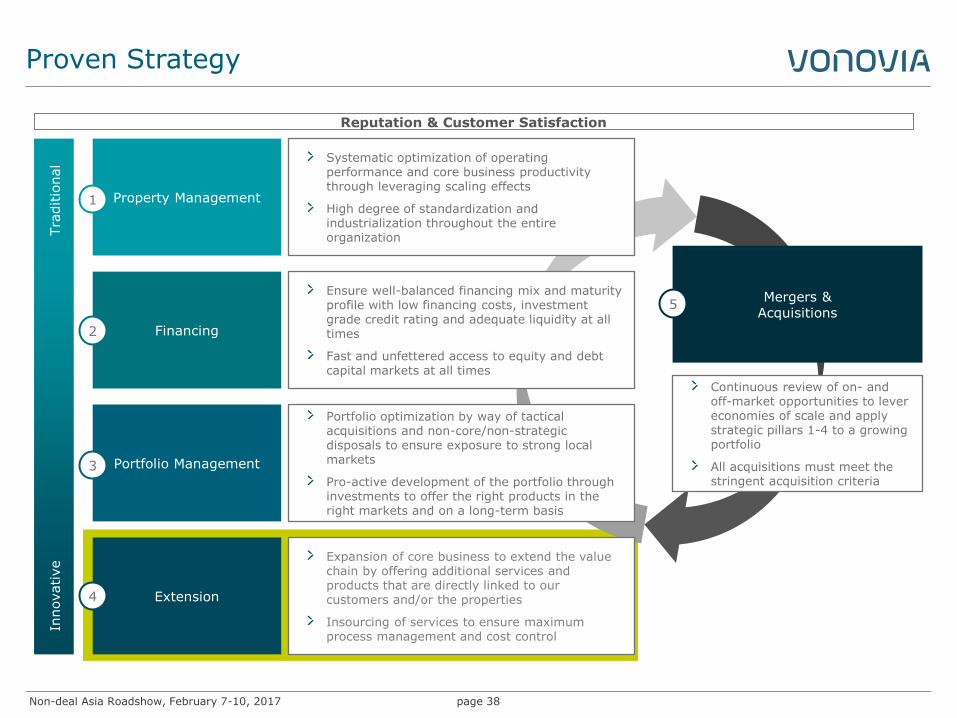
page 38
Financing 2
Ensure well-balanced financing mix and maturity profile with low financing costs, investment grade credit rating and adequate liquidity at all times
Fast and unfettered access to equity and debt capital markets at all times
Portfolio Management 3
Portfolio optimization by way of tactical acquisitions and non-core/non-strategic disposals to ensure exposure to strong local markets
Pro-active development of the portfolio through investments to offer the right products in the right markets and on a long-term basis
Extension 4
Expansion of core business to extend the value chain by offering additional services and products that are directly linked to our customers and/or the properties
Insourcing of services to ensure maximum process management and cost control
Innovative
Tra
ditio
nal
Property Management 1
Systematic optimization of operating performance and core business productivity through leveraging scaling effects
High degree of standardization and industrialization throughout the entire organization
Continuous review of on- and off-market opportunities to lever economies of scale and apply strategic pillars 1-4 to a growing portfolio
All acquisitions must meet the stringent acquisition criteria
Reputation & Customer Satisfaction
Mergers & Acquisitions
5
Non-deal Asia Roadshow, February 7-10, 2017
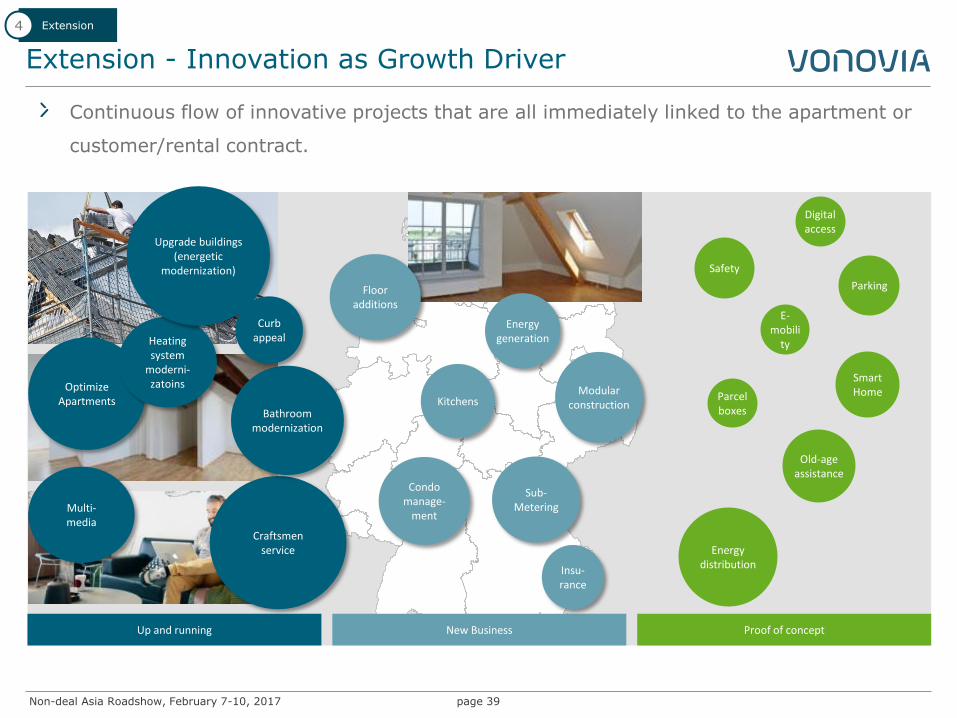
Extension - Innovation as Growth Driver
page 39
Extension 4
Continuous flow of innovative projects that are all immediately linked to the apartment or
customer/rental contract.
Multi- media
Kitchens
Sub-Metering
Old-age assistance
Digital access
Parking
Parcel boxes
Smart Home Optimize
Apartments
Heating system
moderni-zatoins
Energy distribution
Craftsmen service
Upgrade buildings (energetic
modernization)
Bathroom modernization
Up and running New Business Proof of concept
Floor additions
Insu-rance
Energy generation
E-mobili
ty
Condo manage-
ment
Curb appeal
Modular construction
Safety
Non-deal Asia Roadshow, February 7-10, 2017
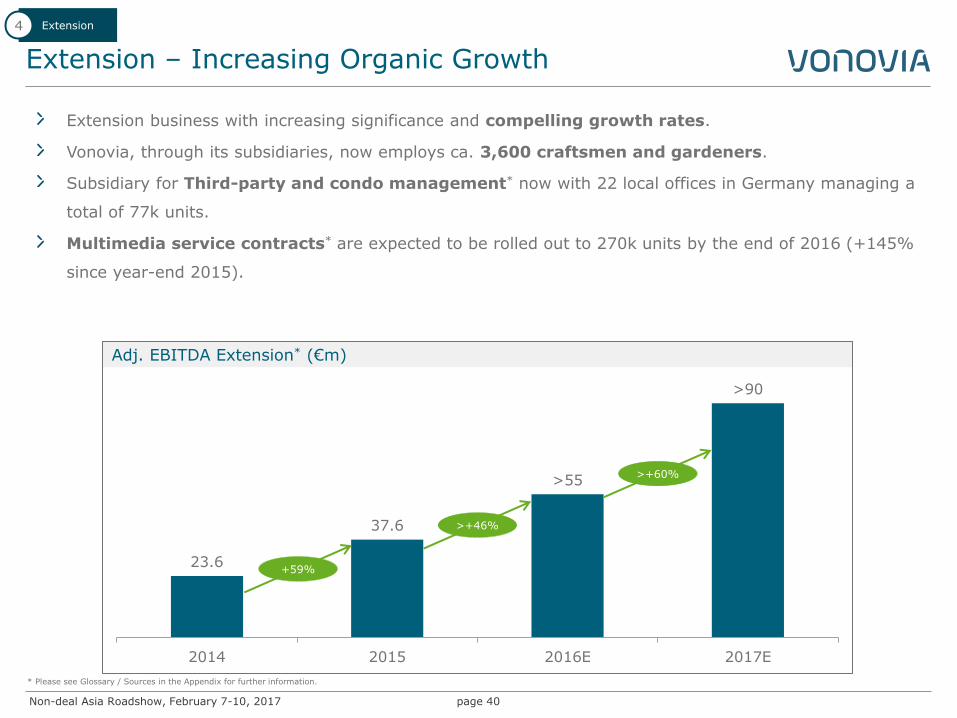
Adj. EBITDA Extension* (€m)
Extension – Increasing Organic Growth
page 40
23.6
37.6
>55
>90
2014 2015 2016E 2017E
+59%
>+46%
Extension business with increasing significance and compelling growth rates.
Vonovia, through its subsidiaries, now employs ca. 3,600 craftsmen and gardeners.
Subsidiary for Third-party and condo management* now with 22 local offices in Germany managing a
total of 77k units.
Multimedia service contracts* are expected to be rolled out to 270k units by the end of 2016 (+145%
since year-end 2015).
Extension 4
>+60%
* Please see Glossary / Sources in the Appendix for further information.
Non-deal Asia Roadshow, February 7-10, 2017
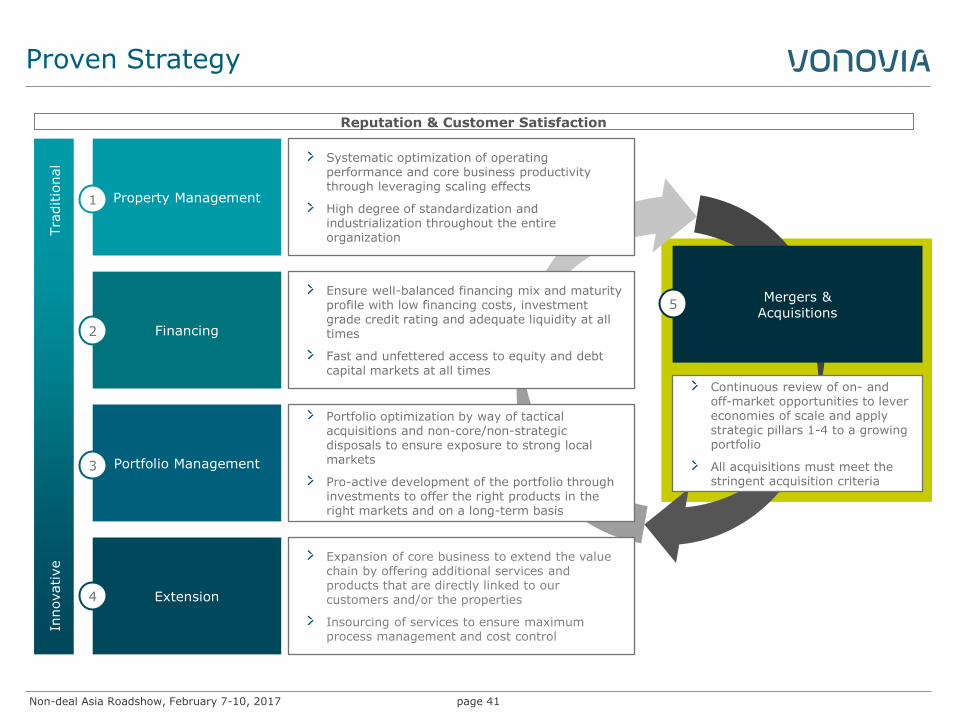
Proven Strategy
page 41
Financing 2
Ensure well-balanced financing mix and maturity profile with low financing costs, investment grade credit rating and adequate liquidity at all times
Fast and unfettered access to equity and debt capital markets at all times
Portfolio Management 3
Portfolio optimization by way of tactical acquisitions and non-core/non-strategic disposals to ensure exposure to strong local markets
Pro-active development of the portfolio through investments to offer the right products in the right markets and on a long-term basis
Extension 4
Expansion of core business to extend the value chain by offering additional services and products that are directly linked to our customers and/or the properties
Insourcing of services to ensure maximum process management and cost control
Innovative
Tra
ditio
nal
Property Management 1
Systematic optimization of operating performance and core business productivity through leveraging scaling effects
High degree of standardization and industrialization throughout the entire organization
Continuous review of on- and off-market opportunities to lever economies of scale and apply strategic pillars 1-4 to a growing portfolio
All acquisitions must meet the stringent acquisition criteria
Reputation & Customer Satisfaction
Mergers & Acquisitions
5
Non-deal Asia Roadshow, February 7-10, 2017
Conwert Acquisition an All-around Success
page 42
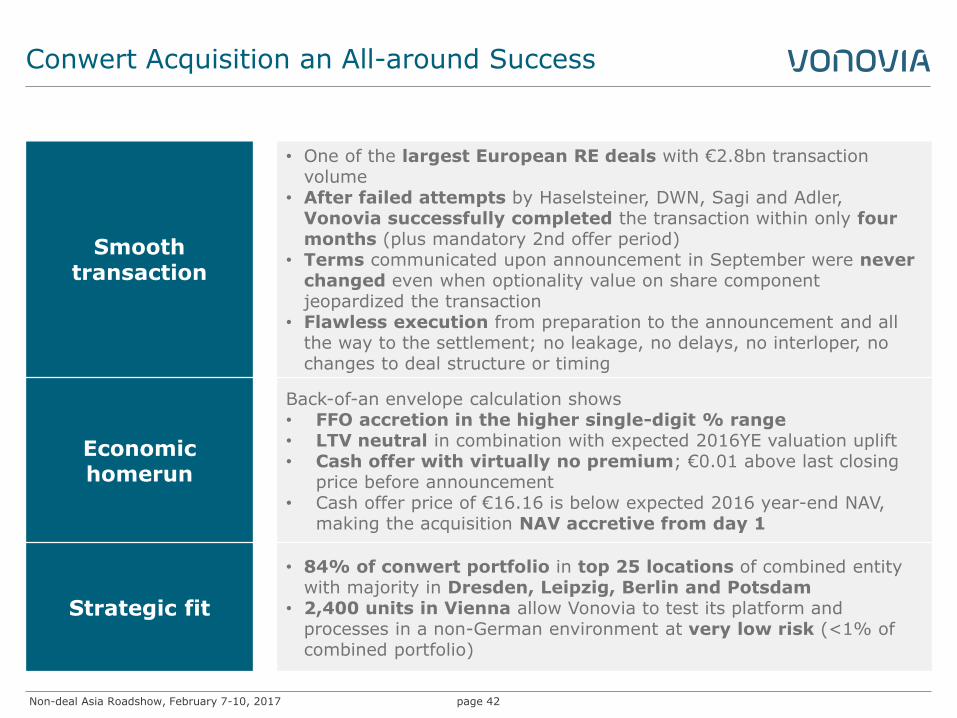
Smooth transaction
• One of the largest European RE deals with €2.8bn transaction volume
• After failed attempts by Haselsteiner, DWN, Sagi and Adler, Vonovia successfully completed the transaction within only four months (plus mandatory 2nd offer period)
• Terms communicated upon announcement in September were never changed even when optionality value on share component jeopardized the transaction
• Flawless execution from preparation to the announcement and all the way to the settlement; no leakage, no delays, no interloper, no changes to deal structure or timing
Economic homerun
Back-of-an envelope calculation shows • FFO accretion in the higher single-digit % range • LTV neutral in combination with expected 2016YE valuation uplift • Cash offer with virtually no premium; €0.01 above last closing
price before announcement • Cash offer price of €16.16 is below expected 2016 year-end NAV,
making the acquisition NAV accretive from day 1
Strategic fit
• 84% of conwert portfolio in top 25 locations of combined entity with majority in Dresden, Leipzig, Berlin and Potsdam
• 2,400 units in Vienna allow Vonovia to test its platform and processes in a non-German environment at very low risk (<1% of combined portfolio)
Non-deal Asia Roadshow, February 7-10, 2017
Acquisition
page 43
Acquisition 5
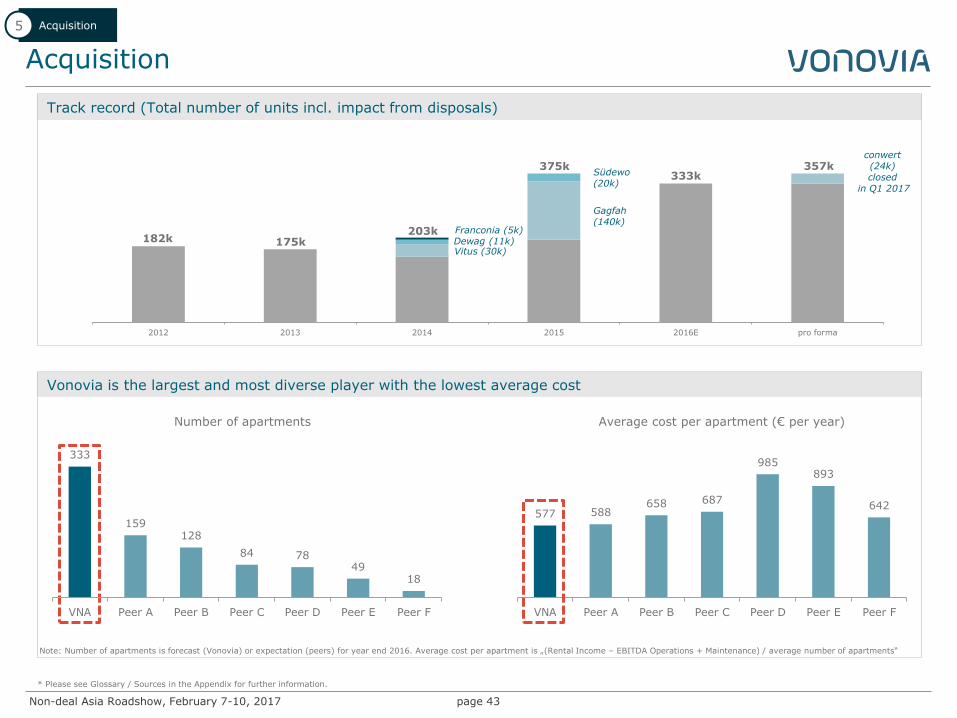
Track record (Total number of units incl. impact from disposals)
Vonovia is the largest and most diverse player with the lowest average cost
* Please see Glossary / Sources in the Appendix for further information.
577 588 658 687
985 893
642
VNA Peer A Peer B Peer C Peer D Peer E Peer F
Number of apartments Average cost per apartment (€ per year)
Note: Number of apartments is forecast (Vonovia) or expectation (peers) for year end 2016. Average cost per apartment is „(Rental Income – EBITDA Operations + Maintenance) / average number of apartments“
333
159 128
84 78 49
18
VNA Peer A Peer B Peer C Peer D Peer E Peer F
2012 2013 2014 2015 2016E pro forma
Gagfah (140k)
Südewo (20k)
182k 175k 203k
375k 333k
conwert (24k) closed
in Q1 2017
357k
Vitus (30k) Dewag (11k) Franconia (5k)
Non-deal Asia Roadshow, February 7-10, 2017
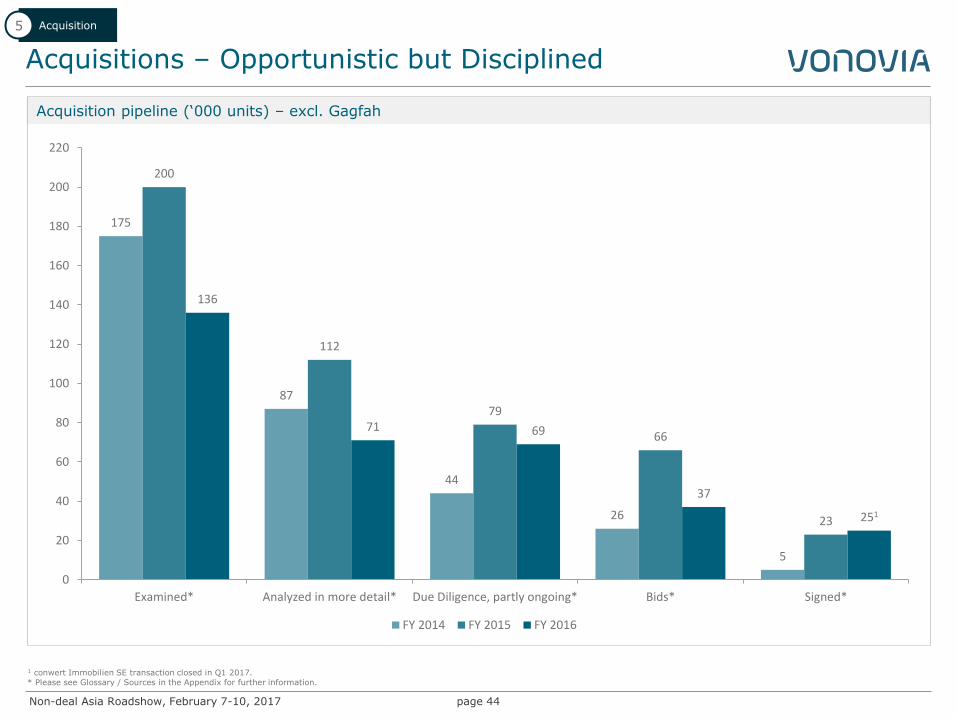
Acquisitions – Opportunistic but Disciplined
Acquisition pipeline (‘000 units) – excl. Gagfah
page 44
Acquisition 5
1 conwert Immobilien SE transaction closed in Q1 2017.
175
87
44
26
5
200
112
79
66
23
136
71 69
37
251
0
20
40
60
80
100
120
140
160
180
200
220
Examined* Analyzed in more detail* Due Diligence, partly ongoing* Bids* Signed*
FY 2014 FY 2015 FY 2016
* Please see Glossary / Sources in the Appendix for further information.
Non-deal Asia Roadshow, February 7-10, 2017
Summary
page 45
Predictable top and bottom line with downside protection and upside
potential.
Only residential company in German Blue Chip Index DAX; ca. €14bn market
cap.
Liquid stock with 92% free float and ca. €45m daily turnover on Xetra.
Market leadership with nationwide footprint offers additional growth
opportunities.
Strong internal growth profile via sustainable market rent growth,
additional rent growth from portfolio investments and dynamic extension
business.
Industrialized approach leverages economies of scale in a highly
homogeneous asset class.
Proven track record of sustainable and growing free cash flow from operations
(“FFO”) and dividends.
Non-deal Asia Roadshow, February 7-10, 2017
IR Contact & Financial Calendar
page 46
Rene Hoffmann Head of Investor Relations Vonovia SE Philippstraße 3 44803 Bochum Germany +49 234 314 1629 [email protected] www.vonovia.de
Financial Calendar Contact
Vonovia Investor Relations Tablet App
Now available for iOS and Android
Feb 7-10 Management Roadshow, Asia (excl. China)
Mar 7 FY 2016 results
Mar 8-10 Roadshow London, Frankfurt, Amsterdam
Mar 13 Roadshow Paris
Mar 22 Commerzbank Resi Property Forum, London (IR only)
Mar 23 HSBC Real Estate Conference, Frankfurt (IR only)
Mar 28-30 Management Roadshow, China
Mar 29 BofAML European Real Estate Conference (IR only)
Mar 30 Bankhaus Lampe Deutschlandkonferenz, Baden Baden (IR only)
May 9 Estimated record day for dividend entitlement
May 16 Annual General Meeting
May 241 Interim results 3M 2017
May 24 Berenberg European Conference, USA
June 1 German Property Day, Paris
June 8 Kempen European Property Seminar, Amsterdam
~ June 12 Estimated dividend payment date
June 19-20 Capital Markets Day (Bochum)
June 22 dBAccess Berlin Conference, Berlin
Aug 2 Interim results 6M 2017
Nov 8 Interim results 9M 2017
1 Dates are indicative and subject to change depending on conwert integration
Non-deal Asia Roadshow, February 7-10, 2017 page 47
Appendix
Non-deal Asia Roadshow, February 7-10, 2017
Highlights 9M 2016
page 48
Operating business running smoothly with strong momentum
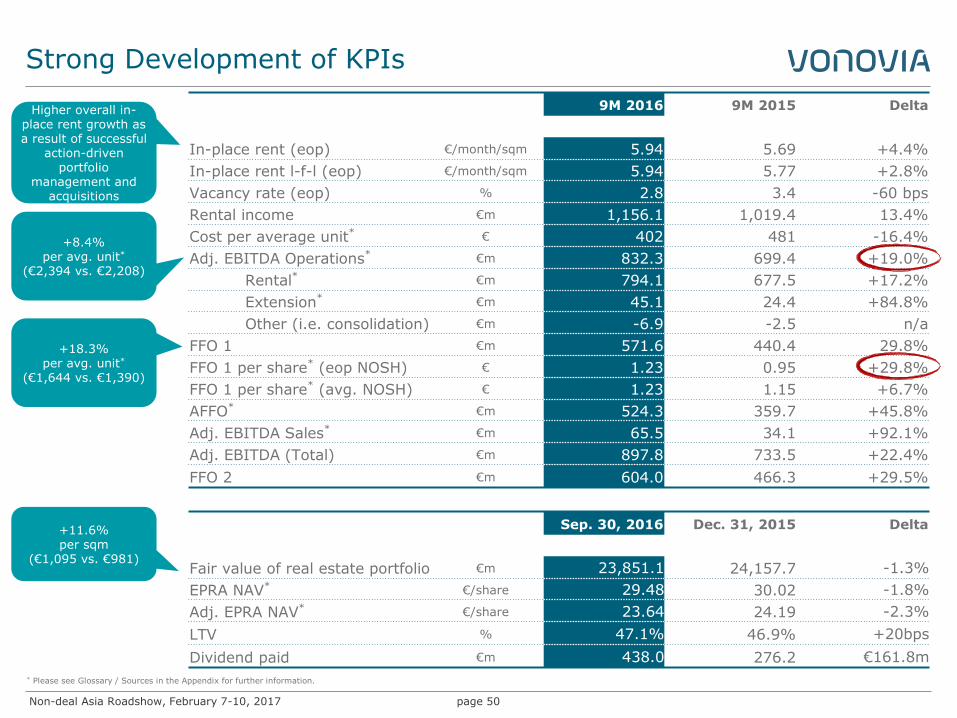
In-place rent of €5.94 per sqm per month (+4.4% y-o-y). L-f-l rent growth of 2.8% y-o-y.
Adj. EBITDA Operations* of €832.3m or €2,394 per average unit* (+8.4% y-o-y).
FFO 1 of €571.6m or €1.23 per share* (up 29.8% y-o-y on an eop per-share basis).
Currently ongoing valuation work indicates strong uplift1; growth potential across
strategic portfolio
Annual valuation work underway indicates a valuation uplift between €3.5bn and €3.9bn (+15% to 17%)
on the back of better performance, investments and yield compression.
Break-down of Strategic Portfolio into 15 Markets and benchmarking against external sources shows
growth potential across strategic portfolio.
Portfolio management strategy confirmed with regards to investments, acquisitions and disposals.
1 Recent forecast of Vonovia calculations. The value is subject to change during the ongoing valuation process. * Please see Glossary / Sources in the Appendix for further information.
Non-deal Asia Roadshow, February 7-10, 2017
Highlights 9M 2016
page 49
2016 guidance confirmed at upper end of range; increase of proposed dividend
FFO 1 now expected at higher end of the range with ~€760m or ~€1.63 per share*.
Dividend of €1.12 per share (19.1% increase y-o-y) intended to be proposed to the 2017 Annual
General Meeting; dividend proposal not dependent on acceptance level of tender offer for conwert
shares. New shares from conwert offer fully eligible for dividends.
EPRA NAV per share* of ~€36 and adj. EPRA NAV per share* of ~€30 expected for year-end 2016.
Confident 2017 guidance (effects from potential conwert takeover not yet taken into account)
L-f-l rent growth expected to accelerate to 3.5%-3.7%.
Expected double-digit organic FFO 1 growth to €830m to €850m or €1.78-€1.82 per share*.
Expect to initiate €1bn investment program for modernization and space creation in 2017, of which
€700m-€730m are expected to be completed and accounted for within the 2017 financial year.
EPRA NAV per share* expected to grow to €37-€38 based on increased performance and higher
investments. Does not include any assumptions for yield compression.
* Please see Glossary / Sources in the Appendix for further information.
Non-deal Asia Roadshow, February 7-10, 2017
Strong Development of KPIs
page 50
9M 2016 9M 2015 Delta
In-place rent (eop) €/month/sqm 5.94 5.69 +4.4%
In-place rent l-f-l (eop) €/month/sqm 5.94 5.77 +2.8%
Vacancy rate (eop) % 2.8 3.4 -60 bps
Rental income €m 1,156.1 1,019.4 13.4%
Cost per average unit* € 402 481 -16.4%
Adj. EBITDA Operations* €m 832.3 699.4 +19.0%
Rental* €m 794.1 677.5 +17.2%
Extension* €m 45.1 24.4 +84.8%
Other (i.e. consolidation) €m -6.9 -2.5 n/a
FFO 1 €m 571.6 440.4 29.8%
FFO 1 per share* (eop NOSH) € 1.23 0.95 +29.8%
FFO 1 per share* (avg. NOSH) € 1.23 1.15 +6.7%
AFFO* €m 524.3 359.7 +45.8%
Adj. EBITDA Sales* €m 65.5 34.1 +92.1%
Adj. EBITDA (Total) €m 897.8 733.5 +22.4%
FFO 2 €m 604.0 466.3 +29.5%
Sep. 30, 2016 Dec. 31, 2015 Delta
Fair value of real estate portfolio €m 23,851.1 24,157.7 -1.3%
EPRA NAV* €/share 29.48 30.02 -1.8%
Adj. EPRA NAV* €/share 23.64 24.19 -2.3%
LTV % 47.1% 46.9% +20bps
Dividend paid €m 438.0 276.2 €161.8m
+8.4% per avg. unit*
(€2,394 vs. €2,208)
+18.3% per avg. unit*
(€1,644 vs. €1,390)
+11.6% per sqm
(€1,095 vs. €981)
Higher overall in-place rent growth as a result of successful
action-driven portfolio
management and acquisitions
* Please see Glossary / Sources in the Appendix for further information.
Non-deal Asia Roadshow, February 7-10, 2017
Growing Adj. EBITDA and EBITDA Operations Margin*
page 51
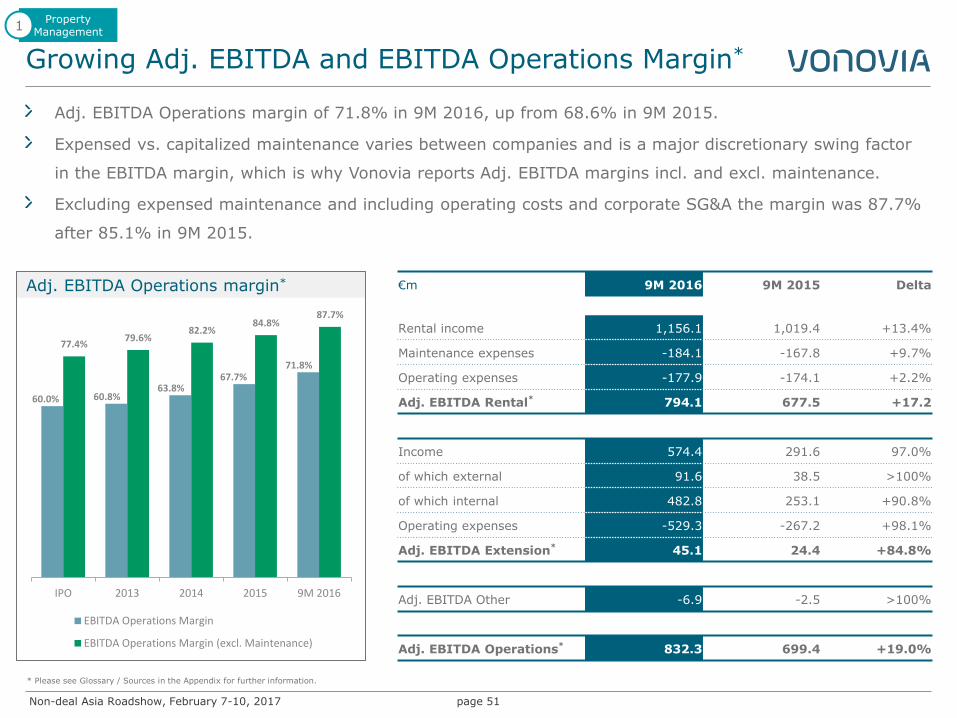
Adj. EBITDA Operations margin of 71.8% in 9M 2016, up from 68.6% in 9M 2015.
Expensed vs. capitalized maintenance varies between companies and is a major discretionary swing factor
in the EBITDA margin, which is why Vonovia reports Adj. EBITDA margins incl. and excl. maintenance.
Excluding expensed maintenance and including operating costs and corporate SG&A the margin was 87.7%
after 85.1% in 9M 2015.
€m 9M 2016 9M 2015 Delta
Rental income 1,156.1 1,019.4 +13.4%
Maintenance expenses -184.1 -167.8 +9.7%
Operating expenses -177.9 -174.1 +2.2%
Adj. EBITDA Rental* 794.1 677.5 +17.2
Income 574.4 291.6 97.0%
of which external 91.6 38.5 >100%
of which internal 482.8 253.1 +90.8%
Operating expenses -529.3 -267.2 +98.1%
Adj. EBITDA Extension* 45.1 24.4 +84.8%
Adj. EBITDA Other -6.9 -2.5 >100%
Adj. EBITDA Operations* 832.3 699.4 +19.0%
Adj. EBITDA Operations margin*
60.0% 60.8% 63.8%
67.7% 71.8%
77.4% 79.6%
82.2% 84.8%
87.7%
IPO 2013 2014 2015 9M 2016
EBITDA Operations Margin
EBITDA Operations Margin (excl. Maintenance)
Property Management
1
* Please see Glossary / Sources in the Appendix for further information.
Non-deal Asia Roadshow, February 7-10, 2017
Maintenance and Modernization
page 52
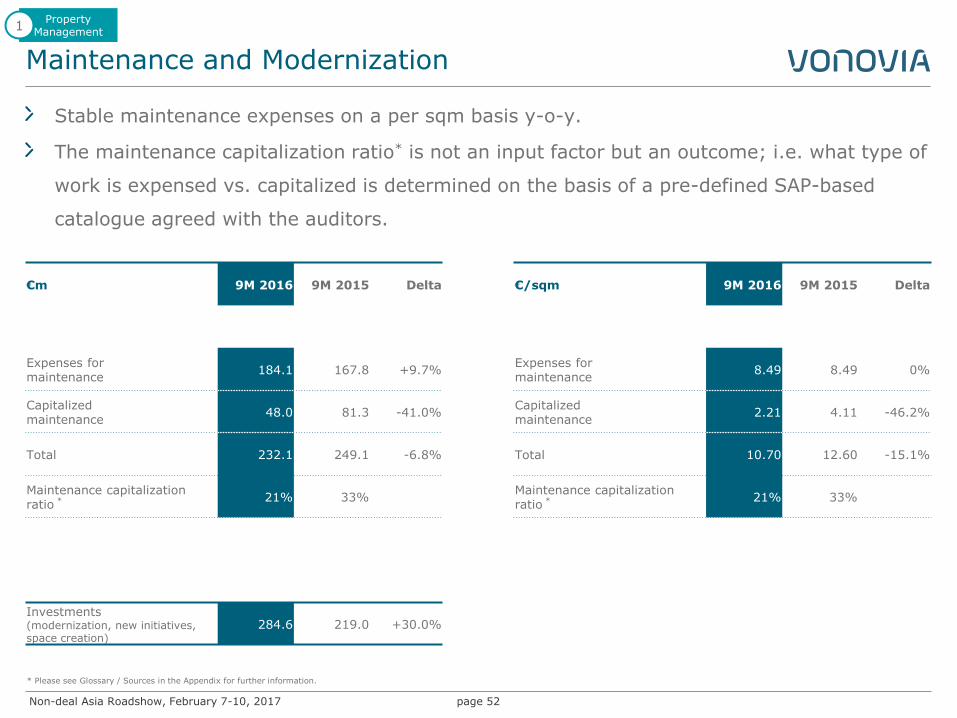
€m 9M 2016 9M 2015 Delta
Expenses for maintenance
184.1 167.8 +9.7%
Capitalized maintenance
48.0 81.3 -41.0%
Total 232.1 249.1 -6.8%
Maintenance capitalization ratio *
21% 33%
Investments (modernization, new initiatives, space creation)
284.6 219.0 +30.0%
€/sqm 9M 2016 9M 2015 Delta
Expenses for maintenance
8.49 8.49 0%
Capitalized maintenance
2.21 4.11 -46.2%
Total 10.70 12.60 -15.1%
Maintenance capitalization ratio *
21% 33%
Stable maintenance expenses on a per sqm basis y-o-y.
The maintenance capitalization ratio* is not an input factor but an outcome; i.e. what type of
work is expensed vs. capitalized is determined on the basis of a pre-defined SAP-based
catalogue agreed with the auditors.
Property Management
1
* Please see Glossary / Sources in the Appendix for further information.
Non-deal Asia Roadshow, February 7-10, 2017
Substantial LTV Reduction Expected for YE 2016
page 53
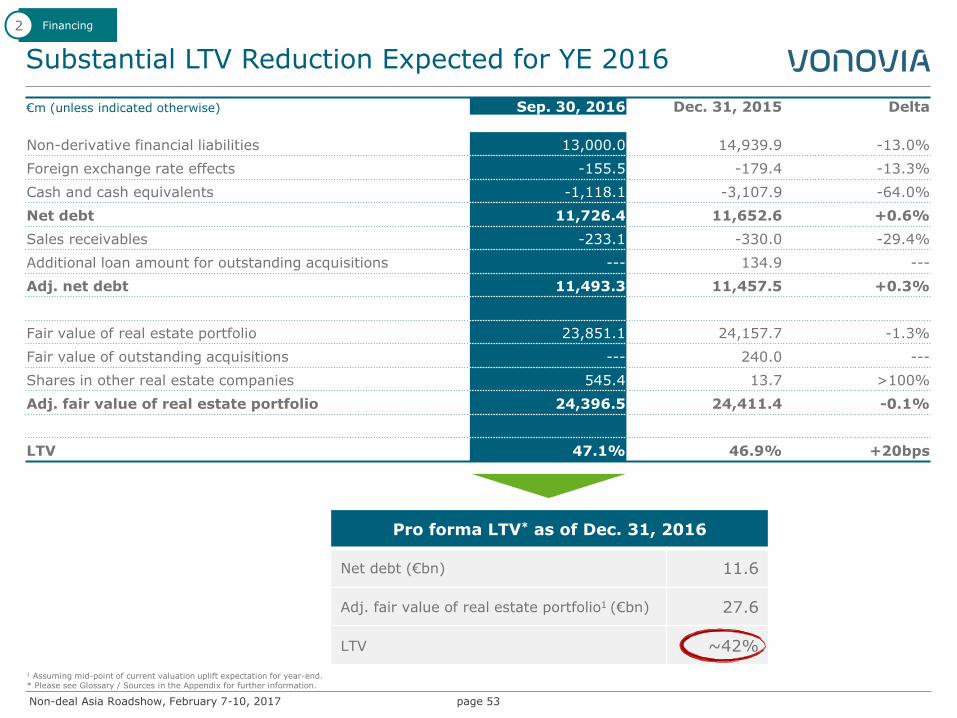
€m (unless indicated otherwise) Sep. 30, 2016 Dec. 31, 2015 Delta
Non-derivative financial liabilities 13,000.0 14,939.9 -13.0%
Foreign exchange rate effects -155.5 -179.4 -13.3%
Cash and cash equivalents -1,118.1 -3,107.9 -64.0%
Net debt 11,726.4 11,652.6 +0.6%
Sales receivables -233.1 -330.0 -29.4%
Additional loan amount for outstanding acquisitions --- 134.9 ---
Adj. net debt 11,493.3 11,457.5 +0.3%
Fair value of real estate portfolio 23,851.1 24,157.7 -1.3%
Fair value of outstanding acquisitions --- 240.0 ---
Shares in other real estate companies 545.4 13.7 >100%
Adj. fair value of real estate portfolio 24,396.5 24,411.4 -0.1%
LTV 47.1% 46.9% +20bps
Financing 2
Pro forma LTV* as of Dec. 31, 2016
Net debt (€bn) 11.6
Adj. fair value of real estate portfolio1 (€bn) 27.6
LTV ~42%
1 Assuming mid-point of current valuation uplift expectation for year-end. * Please see Glossary / Sources in the Appendix for further information.
Non-deal Asia Roadshow, February 7-10, 2017
Bonds / Rating
page 54
Financing 2
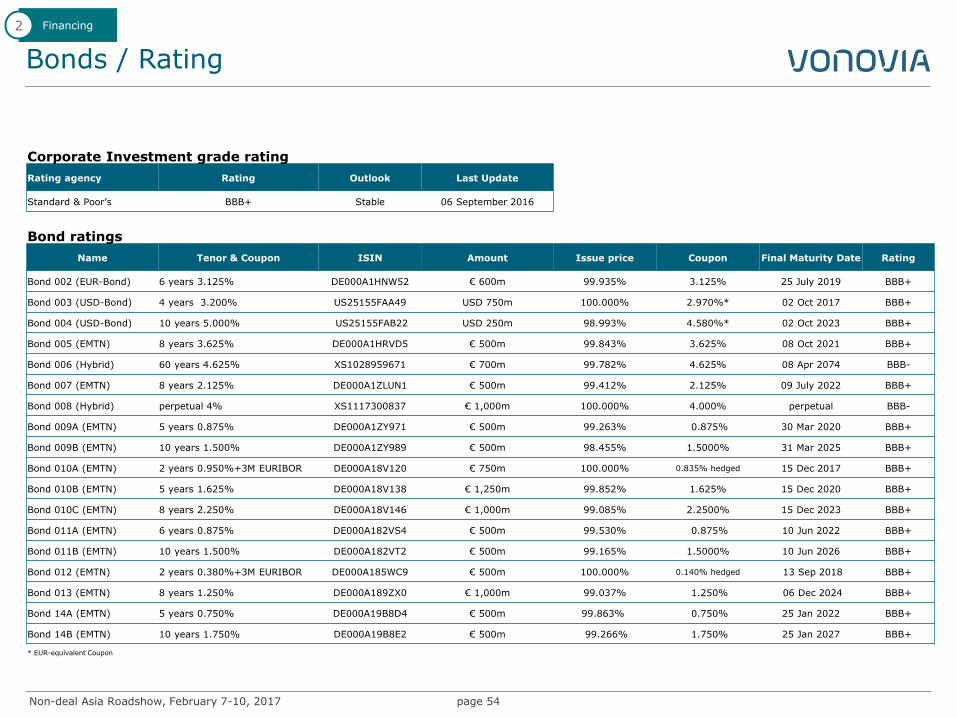
Corporate Investment grade rating as of 2015-09-30
Rating agency Rating Outlook Last Update
Standard & Poor’s BBB+ Stable 06 September 2016
Bond ratings as of 2015-09-30
Name Tenor & Coupon ISIN Amount Issue price Coupon Final Maturity Date Rating
Bond 002 (EUR-Bond) 6 years 3.125% DE000A1HNW52 € 600m 99.935% 3.125% 25 July 2019 BBB+
Bond 003 (USD-Bond) 4 years 3.200% US25155FAA49 USD 750m 100.000% 2.970%* 02 Oct 2017 BBB+
Bond 004 (USD-Bond) 10 years 5.000% US25155FAB22 USD 250m 98.993% 4.580%* 02 Oct 2023 BBB+
Bond 005 (EMTN) 8 years 3.625% DE000A1HRVD5 € 500m 99.843% 3.625% 08 Oct 2021 BBB+
Bond 006 (Hybrid) 60 years 4.625% XS1028959671 € 700m 99.782% 4.625% 08 Apr 2074 BBB-
Bond 007 (EMTN) 8 years 2.125% DE000A1ZLUN1 € 500m 99.412% 2.125% 09 July 2022 BBB+
Bond 008 (Hybrid) perpetual 4% XS1117300837 € 1,000m 100.000% 4.000% perpetual BBB-
Bond 009A (EMTN) 5 years 0.875% DE000A1ZY971 € 500m 99.263% 0.875% 30 Mar 2020 BBB+
Bond 009B (EMTN) 10 years 1.500% DE000A1ZY989 € 500m 98.455% 1.5000% 31 Mar 2025 BBB+
Bond 010A (EMTN) 2 years 0.950%+3M EURIBOR DE000A18V120 € 750m 100.000% 0.835% hedged 15 Dec 2017 BBB+
Bond 010B (EMTN) 5 years 1.625% DE000A18V138 € 1,250m 99.852% 1.625% 15 Dec 2020 BBB+
Bond 010C (EMTN) 8 years 2.250% DE000A18V146 € 1,000m 99.085% 2.2500% 15 Dec 2023 BBB+
Bond 011A (EMTN) 6 years 0.875% DE000A182VS4 € 500m 99.530% 0.875% 10 Jun 2022 BBB+
Bond 011B (EMTN) 10 years 1.500% DE000A182VT2 € 500m 99.165% 1.5000% 10 Jun 2026 BBB+
Bond 012 (EMTN) 2 years 0.380%+3M EURIBOR DE000A185WC9 € 500m 100.000% 0.140% hedged 13 Sep 2018 BBB+
Bond 013 (EMTN) 8 years 1.250% DE000A189ZX0 € 1,000m 99.037% 1.250% 06 Dec 2024 BBB+
Bond 14A (EMTN) 5 years 0.750% DE000A19B8D4 € 500m 99.863% 0.750% 25 Jan 2022 BBB+
Bond 14B (EMTN) 10 years 1.750% DE000A19B8E2 € 500m 99.266% 1.750% 25 Jan 2027 BBB+
* EUR-equivalent Coupon
Non-deal Asia Roadshow, February 7-10, 2017
Financing – Economies of Scale in EMTN Issuance Costs
page 55
Financing 2
* Please see Glossary / Sources in the Appendix for further information.
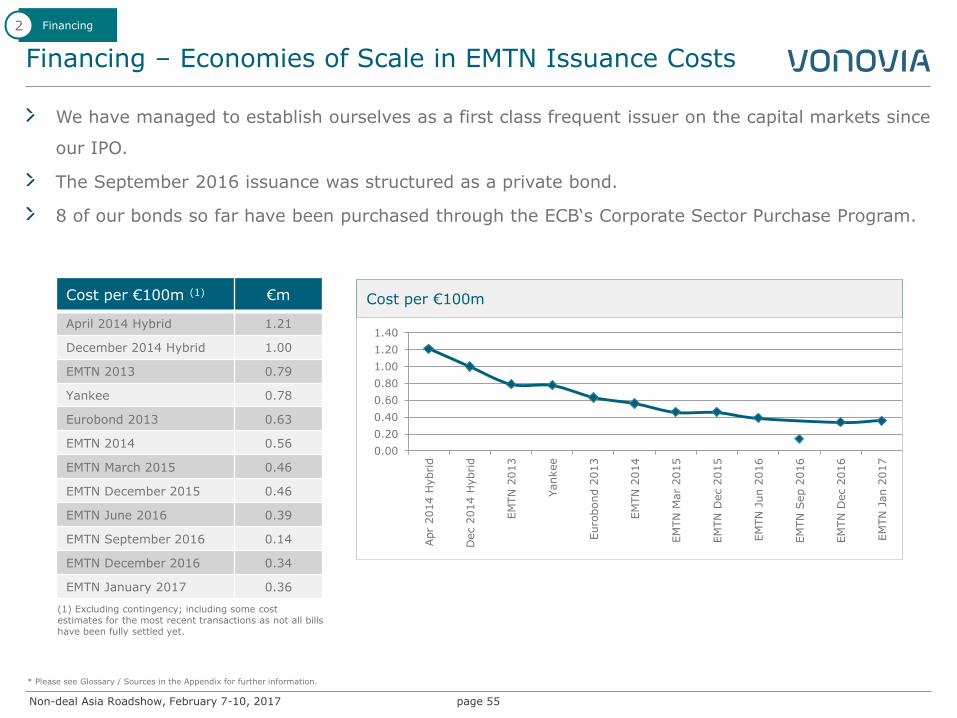
Cost per €100m (1) €m
April 2014 Hybrid 1.21
December 2014 Hybrid 1.00
EMTN 2013 0.79
Yankee 0.78
Eurobond 2013 0.63
EMTN 2014 0.56
EMTN March 2015 0.46
EMTN December 2015 0.46
EMTN June 2016 0.39
EMTN September 2016 0.14
EMTN December 2016 0.34
EMTN January 2017 0.36
(1) Excluding contingency; including some cost estimates for the most recent transactions as not all bills have been fully settled yet.
We have managed to establish ourselves as a first class frequent issuer on the capital markets since
our IPO.
The September 2016 issuance was structured as a private bond.
8 of our bonds so far have been purchased through the ECB‘s Corporate Sector Purchase Program.
Cost per €100m
0.00
0.20
0.40
0.60
0.80
1.00
1.20
1.40
Apr
2014 H
ybrid
Dec 2
014 H
ybrid
EM
TN
2013
Yankee
Euro
bond 2
013
EM
TN
2014
EM
TN
Mar
2015
EM
TN
Dec 2
015
EM
TN
Jun 2
016
EM
TN
Sep 2
016
EM
TN
Dec 2
016
EM
TN
Jan 2
017
Non-deal Asia Roadshow, February 7-10, 2017
Bond and Rating KPIs - as per September 30, 2016
page 56
* Please see Glossary / Sources in the Appendix for further information
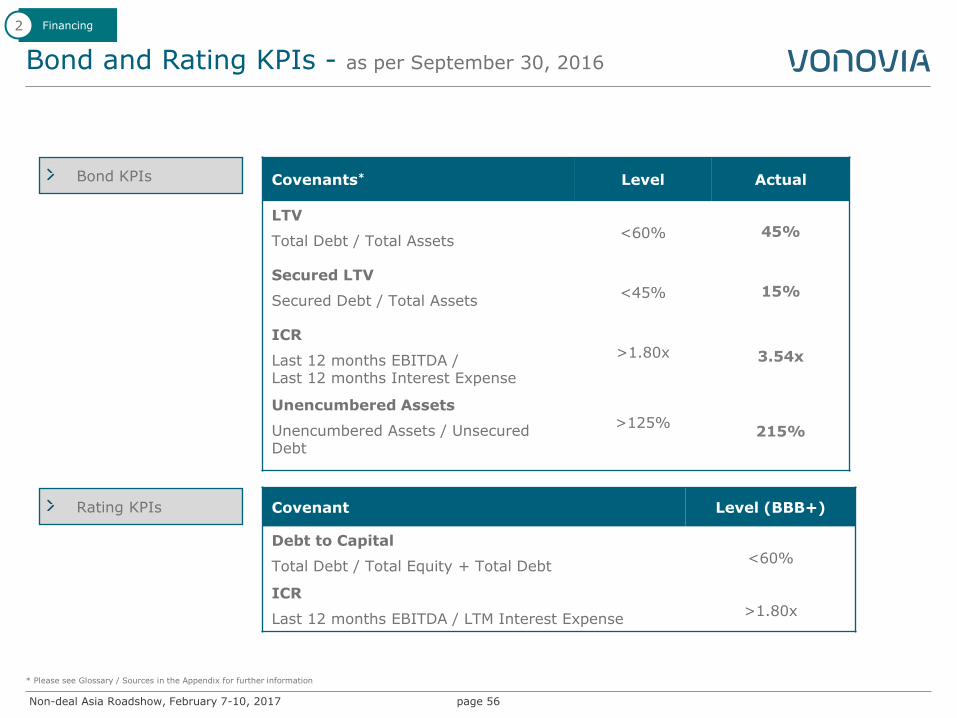
Covenants* Level Actual
LTV
Total Debt / Total Assets
<60% 45%
Secured LTV
Secured Debt / Total Assets
<45% 15%
ICR
Last 12 months EBITDA / Last 12 months Interest Expense
>1.80x 3.54x
Unencumbered Assets
Unencumbered Assets / Unsecured Debt
>125%
215%
Covenant Level (BBB+)
Debt to Capital
Total Debt / Total Equity + Total Debt
<60%
ICR
Last 12 months EBITDA / LTM Interest Expense
>1.80x
Bond KPIs
Rating KPIs
Financing 2
Non-deal Asia Roadshow, February 7-10, 2017
Development of Unencumberance Ratio
page 57
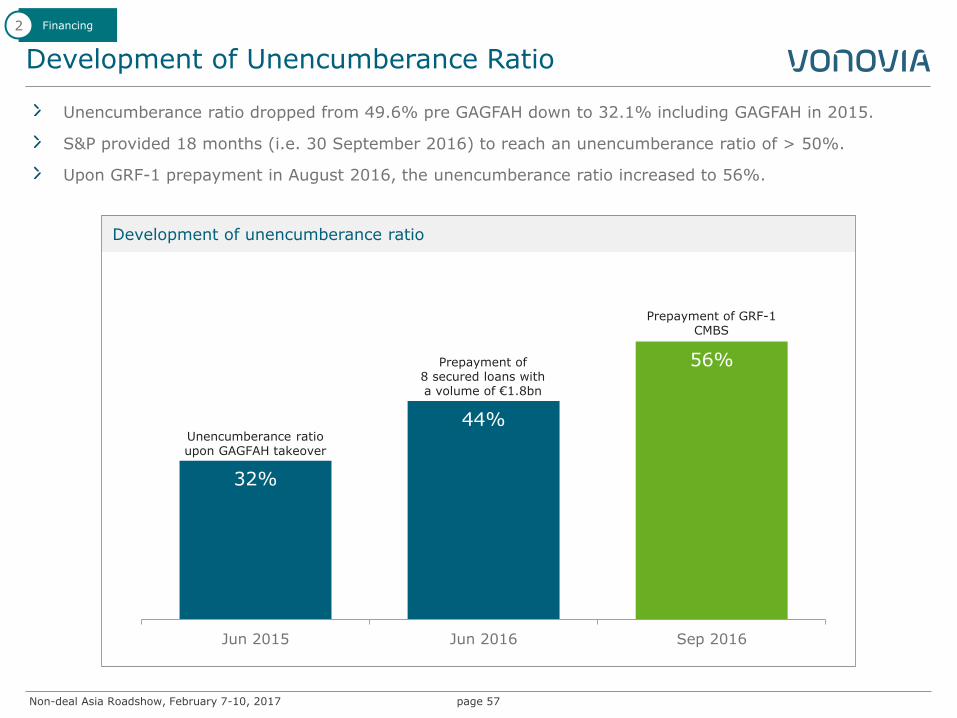
Unencumberance ratio dropped from 49.6% pre GAGFAH down to 32.1% including GAGFAH in 2015.
S&P provided 18 months (i.e. 30 September 2016) to reach an unencumberance ratio of > 50%.
Upon GRF-1 prepayment in August 2016, the unencumberance ratio increased to 56%.
Financing 2
32%
44%
56%
Jun 2015 Jun 2016 Sep 2016
Development of unencumberance ratio
Prepayment of 8 secured loans with a volume of €1.8bn
Prepayment of GRF-1 CMBS
Unencumberance ratio upon GAGFAH takeover
Non-deal Asia Roadshow, February 7-10, 2017
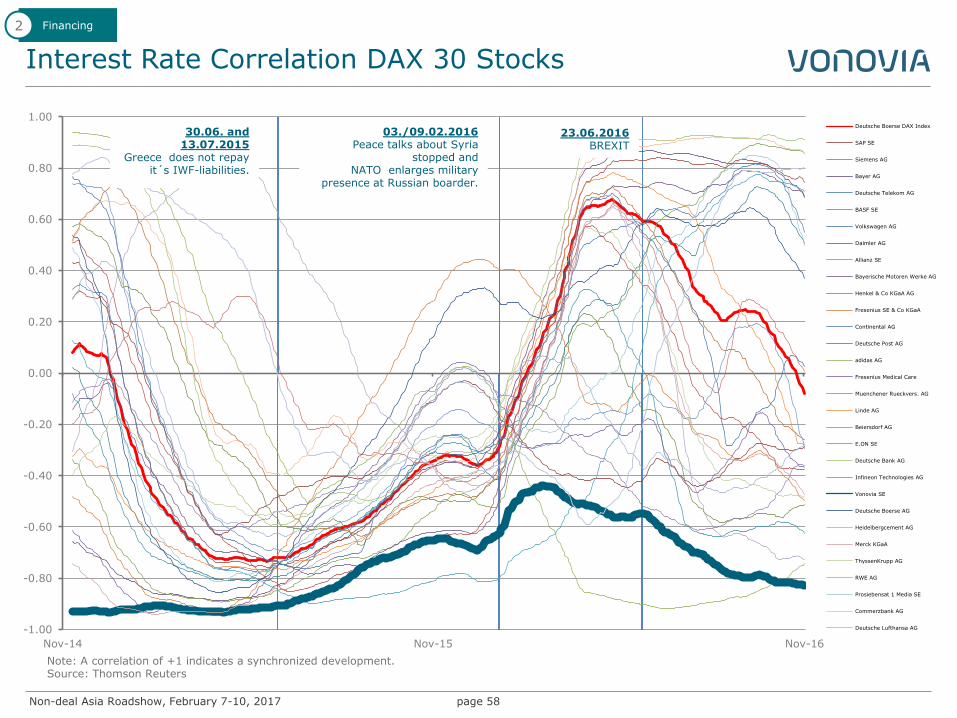
Interest Rate Correlation DAX 30 Stocks
page 58
Note: A correlation of +1 indicates a synchronized development. Source: Thomson Reuters
Financing 2
-1.00
-0.80
-0.60
-0.40
-0.20
0.00
0.20
0.40
0.60
0.80
1.00
Nov-14 Nov-15 Nov-16
Deutsche Boerse DAX Index
SAP SE
Siemens AG
Bayer AG
Deutsche Telekom AG
BASF SE
Volkswagen AG
Daimler AG
Allianz SE
Bayerische Motoren Werke AG
Henkel & Co KGaA AG
Fresenius SE & Co KGaA
Continental AG
Deutsche Post AG
adidas AG
Fresenius Medical Care
Muenchener Rueckvers. AG
Linde AG
Beiersdorf AG
E.ON SE
Deutsche Bank AG
Infineon Technologies AG
Vonovia SE
Deutsche Boerse AG
Heidelbergcement AG
Merck KGaA
ThyssenKrupp AG
RWE AG
Prosiebensat 1 Media SE
Commerzbank AG
Deutsche Lufthansa AG
30.06. and 13.07.2015
Greece does not repay it´s IWF-liabilities.
23.06.2016 BREXIT
03./09.02.2016 Peace talks about Syria
stopped and NATO enlarges military
presence at Russian boarder.
Non-deal Asia Roadshow, February 7-10, 2017
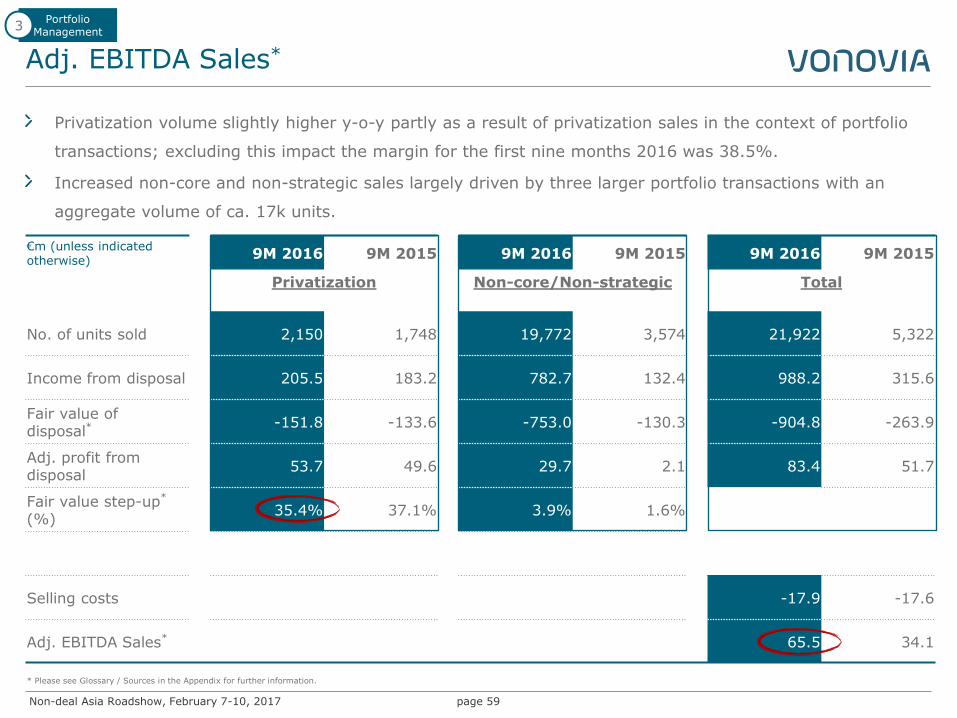
Adj. EBITDA Sales*
page 59
Privatization volume slightly higher y-o-y partly as a result of privatization sales in the context of portfolio
transactions; excluding this impact the margin for the first nine months 2016 was 38.5%.
Increased non-core and non-strategic sales largely driven by three larger portfolio transactions with an
aggregate volume of ca. 17k units.
€m (unless indicated otherwise)
9M 2016 9M 2015
9M 2016 9M 2015
9M 2016 9M 2015
Privatization Non-core/Non-strategic Total
No. of units sold 2,150 1,748 19,772 3,574 21,922 5,322
Income from disposal 205.5 183.2 782.7 132.4 988.2 315.6
Fair value of disposal* -151.8 -133.6 -753.0 -130.3 -904.8 -263.9
Adj. profit from disposal
53.7 49.6 29.7 2.1 83.4 51.7
Fair value step-up* (%)
35.4% 37.1% 3.9% 1.6%
Selling costs
-17.9 -17.6
Adj. EBITDA Sales*
65.5 34.1
Portfolio Management
3
* Please see Glossary / Sources in the Appendix for further information.
Non-deal Asia Roadshow, February 7-10, 2017
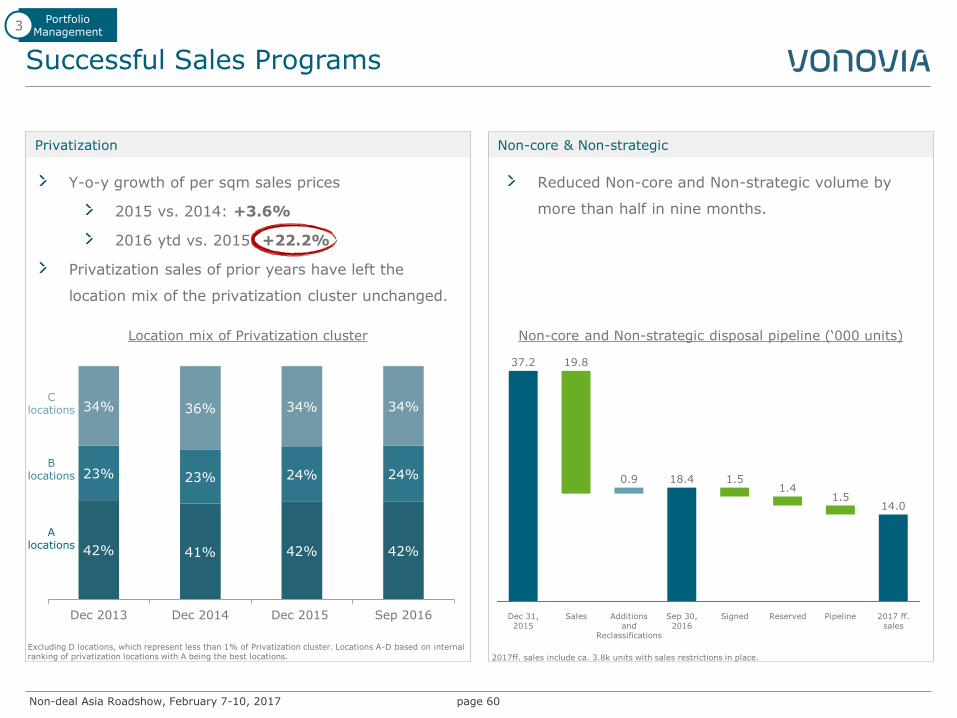
Successful Sales Programs
page 60
Portfolio Management
3
Privatization Non-core & Non-strategic
42% 41% 42% 42%
23% 23% 24% 24%
34% 36% 34% 34%
Dec 2013 Dec 2014 Dec 2015 Sep 2016
Y-o-y growth of per sqm sales prices
2015 vs. 2014: +3.6%
2016 ytd vs. 2015: +22.2%
Privatization sales of prior years have left the
location mix of the privatization cluster unchanged.
A locations
B locations
C locations
Reduced Non-core and Non-strategic volume by
more than half in nine months.
Non-core and Non-strategic disposal pipeline (‘000 units) Location mix of Privatization cluster
2017 ff. sales
14.0
Pipeline
1.4 1.5
1.5
Reserved Sep 30, 2016
18.4
Signed Additions and
Reclassifications
0.9
Sales
19.8
Dec 31, 2015
37.2
Excluding D locations, which represent less than 1% of Privatization cluster. Locations A-D based on internal ranking of privatization locations with A being the best locations. 2017ff. sales include ca. 3.8k units with sales restrictions in place.
Non-deal Asia Roadshow, February 7-10, 2017
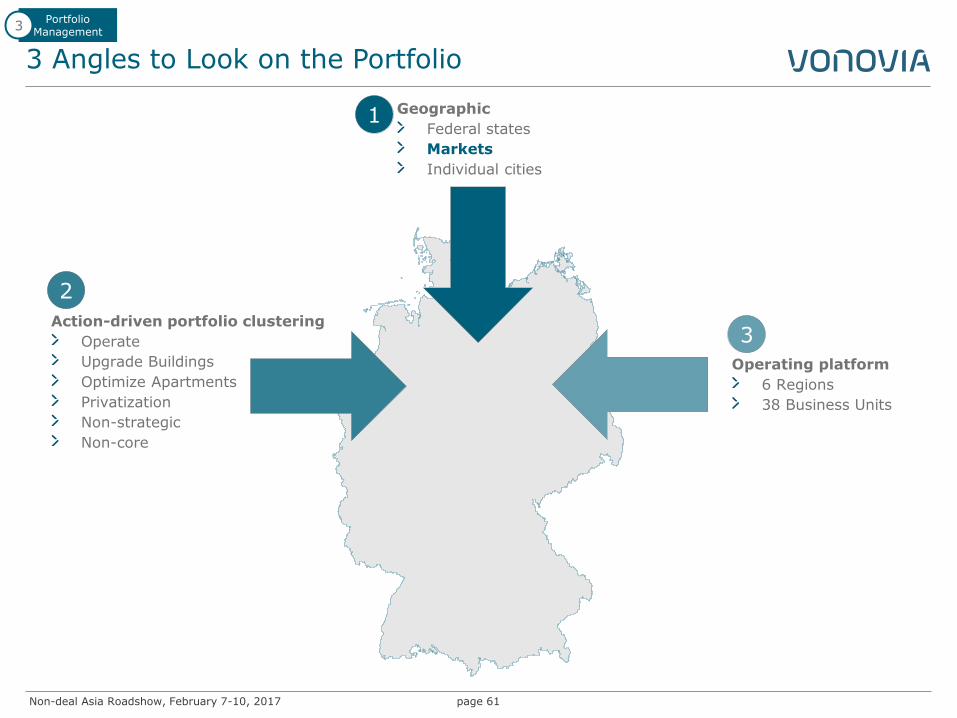
3 Angles to Look on the Portfolio
page 61
Portfolio Management
3
Operating platform
6 Regions
38 Business Units
Action-driven portfolio clustering
Operate
Upgrade Buildings
Optimize Apartments
Privatization
Non-strategic
Non-core
Geographic
Federal states
Markets
Individual cities
2
1
3
Non-deal Asia Roadshow, February 7-10, 2017
Enhanced Transparency on Portfolio Structure
page 62
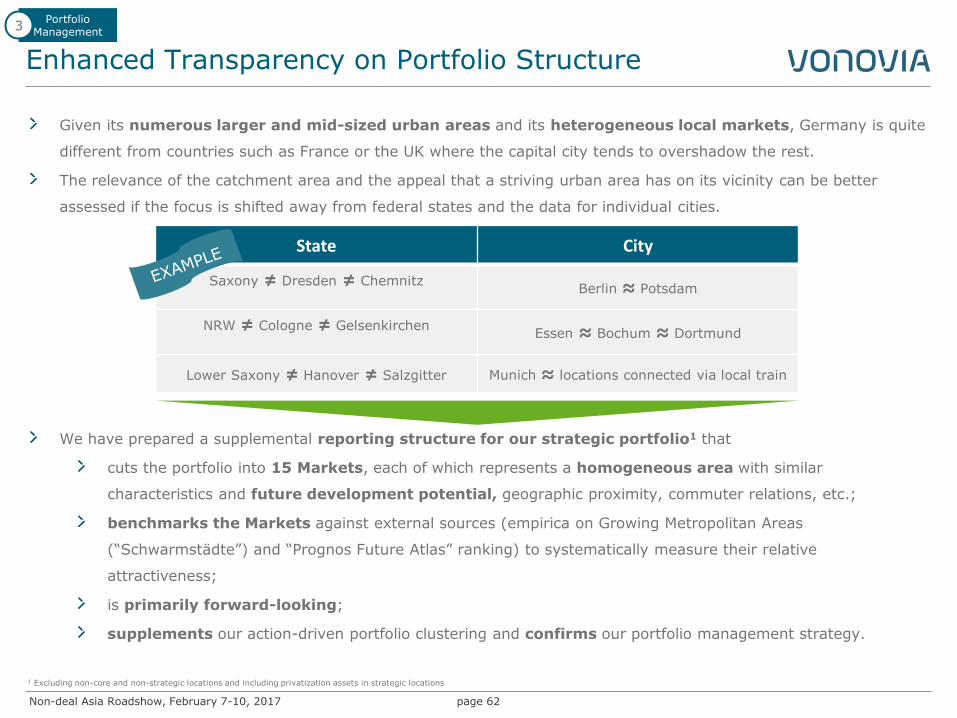
Given its numerous larger and mid-sized urban areas and its heterogeneous local markets, Germany is quite
different from countries such as France or the UK where the capital city tends to overshadow the rest.
The relevance of the catchment area and the appeal that a striving urban area has on its vicinity can be better
assessed if the focus is shifted away from federal states and the data for individual cities.
We have prepared a supplemental reporting structure for our strategic portfolio1 that
cuts the portfolio into 15 Markets, each of which represents a homogeneous area with similar
characteristics and future development potential, geographic proximity, commuter relations, etc.;
benchmarks the Markets against external sources (empirica on Growing Metropolitan Areas
(“Schwarmstädte”) and “Prognos Future Atlas” ranking) to systematically measure their relative
attractiveness;
is primarily forward-looking;
supplements our action-driven portfolio clustering and confirms our portfolio management strategy.
1 Excluding non-core and non-strategic locations and including privatization assets in strategic locations
Portfolio Management
3
State City
Saxony ≠ Dresden ≠ Chemnitz
Berlin ≈ Potsdam
NRW ≠ Cologne ≠ Gelsenkirchen
Essen ≈ Bochum ≈ Dortmund
Lower Saxony ≠ Hanover ≠ Salzgitter Munich ≈ locations connected via local train
Non-deal Asia Roadshow, February 7-10, 2017
15 Regional Markets
page 63
Portfolio Management
3
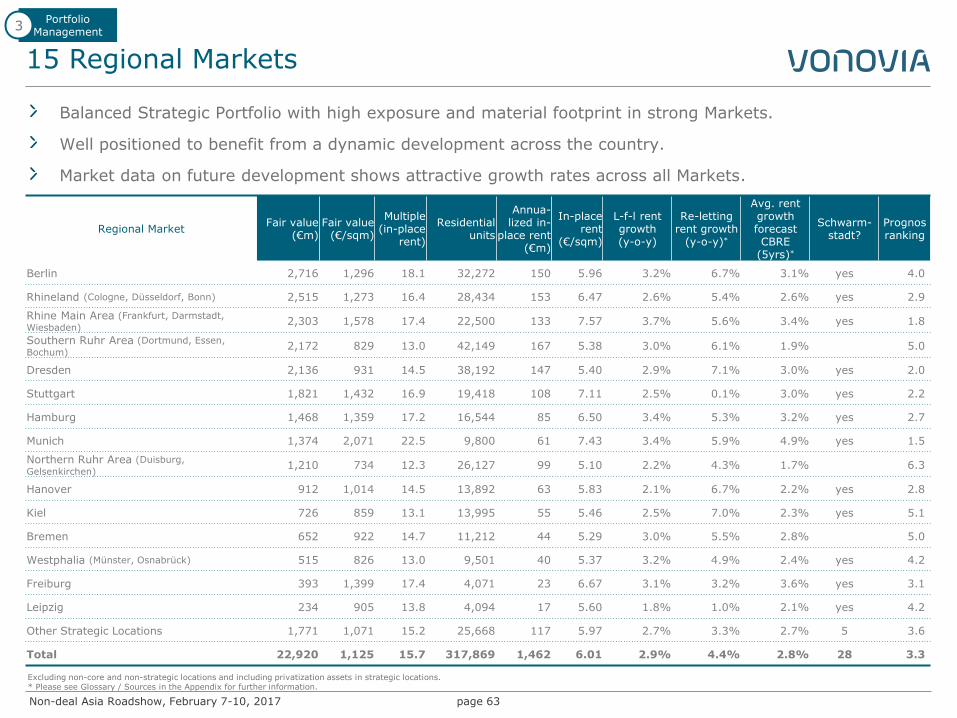
Balanced Strategic Portfolio with high exposure and material footprint in strong Markets.
Well positioned to benefit from a dynamic development across the country.
Market data on future development shows attractive growth rates across all Markets.
Excluding non-core and non-strategic locations and including privatization assets in strategic locations. * Please see Glossary / Sources in the Appendix for further information.
Regional Market Fair value
(€m) Fair value
(€/sqm)
Multiple (in-place
rent)
Residential units
Annua-lized in-
place rent (€m)
In-place rent
(€/sqm)
L-f-l rent growth (y-o-y)
Re-letting rent growth
(y-o-y)*
Avg. rent growth forecast CBRE
(5yrs)*
Schwarm-stadt?
Prognos ranking
Berlin 2,716 1,296 18.1 32,272 150 5.96 3.2% 6.7% 3.1% yes 4.0
Rhineland (Cologne, Düsseldorf, Bonn) 2,515 1,273 16.4 28,434 153 6.47 2.6% 5.4% 2.6% yes 2.9
Rhine Main Area (Frankfurt, Darmstadt,
Wiesbaden) 2,303 1,578 17.4 22,500 133 7.57 3.7% 5.6% 3.4% yes 1.8
Southern Ruhr Area (Dortmund, Essen,
Bochum) 2,172 829 13.0 42,149 167 5.38 3.0% 6.1% 1.9% 5.0
Dresden 2,136 931 14.5 38,192 147 5.40 2.9% 7.1% 3.0% yes 2.0
Stuttgart 1,821 1,432 16.9 19,418 108 7.11 2.5% 0.1% 3.0% yes 2.2
Hamburg 1,468 1,359 17.2 16,544 85 6.50 3.4% 5.3% 3.2% yes 2.7
Munich 1,374 2,071 22.5 9,800 61 7.43 3.4% 5.9% 4.9% yes 1.5
Northern Ruhr Area (Duisburg,
Gelsenkirchen) 1,210 734 12.3 26,127 99 5.10 2.2% 4.3% 1.7% 6.3
Hanover 912 1,014 14.5 13,892 63 5.83 2.1% 6.7% 2.2% yes 2.8
Kiel 726 859 13.1 13,995 55 5.46 2.5% 7.0% 2.3% yes 5.1
Bremen 652 922 14.7 11,212 44 5.29 3.0% 5.5% 2.8% 5.0
Westphalia (Münster, Osnabrück) 515 826 13.0 9,501 40 5.37 3.2% 4.9% 2.4% yes 4.2
Freiburg 393 1,399 17.4 4,071 23 6.67 3.1% 3.2% 3.6% yes 3.1
Leipzig 234 905 13.8 4,094 17 5.60 1.8% 1.0% 2.1% yes 4.2
Other Strategic Locations 1,771 1,071 15.2 25,668 117 5.97 2.7% 3.3% 2.7% 5 3.6
Total 22,920 1,125 15.7 317,869 1,462 6.01 2.9% 4.4% 2.8% 28 3.3
Non-deal Asia Roadshow, February 7-10, 2017
Exposure to Attractive Regional Markets has Grown
page 64
Portfolio Management
3
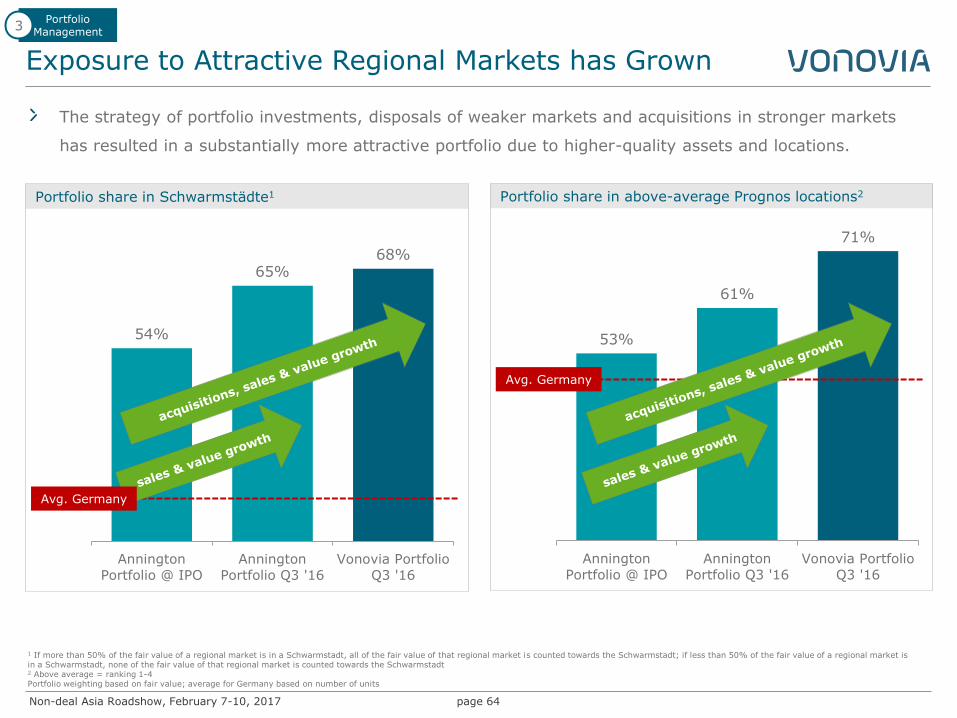
53%
61%
71%
20%
30%
40%
50%
60%
70%
Annington
Portfolio @ IPO
Annington
Portfolio Q3 '16
Vonovia Portfolio
Q3 '16
Portfolio share in above-average Prognos locations2
1 If more than 50% of the fair value of a regional market is in a Schwarmstadt, all of the fair value of that regional market is counted towards the Schwarmstadt; if less than 50% of the fair value of a regional market is in a Schwarmstadt, none of the fair value of that regional market is counted towards the Schwarmstadt 2 Above average = ranking 1-4 Portfolio weighting based on fair value; average for Germany based on number of units
54%
65% 68%
20%
30%
40%
50%
60%
70%
Annington
Portfolio @ IPO
Annington
Portfolio Q3 '16
Vonovia Portfolio
Q3 '16
Portfolio share in Schwarmstädte1
Avg. Germany
Avg. Germany
The strategy of portfolio investments, disposals of weaker markets and acquisitions in stronger markets
has resulted in a substantially more attractive portfolio due to higher-quality assets and locations.
Non-deal Asia Roadshow, February 7-10, 2017
Maintenance or Modernization?
page 65
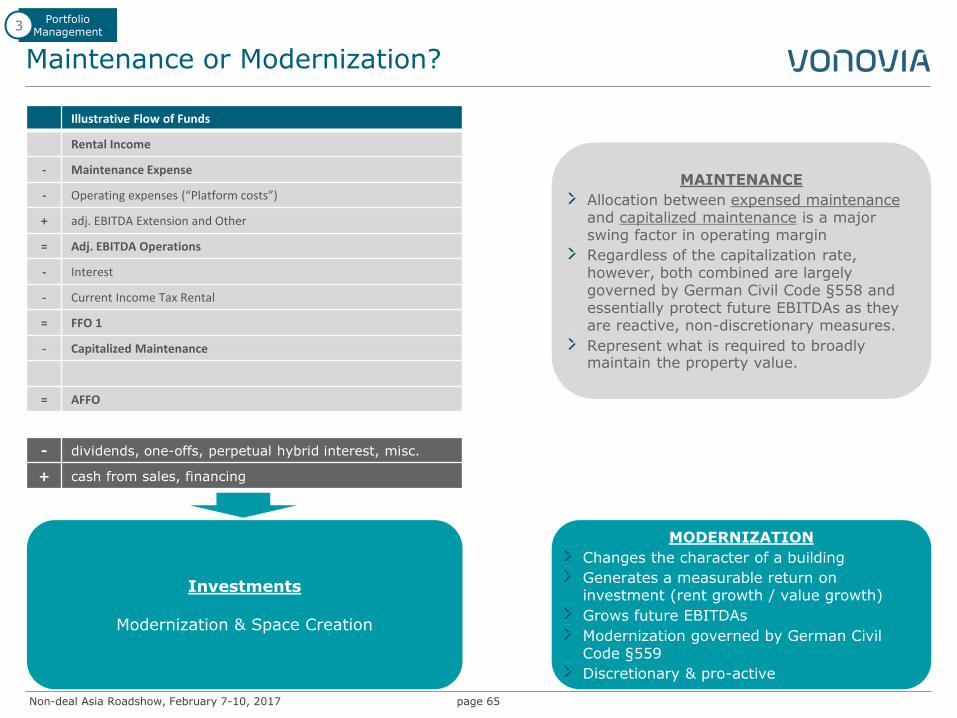
Illustrative Flow of Funds
Rental Income
- Maintenance Expense
- Operating expenses (“Platform costs”)
+ adj. EBITDA Extension and Other
= Adj. EBITDA Operations
- Interest
- Current Income Tax Rental
= FFO 1
- Capitalized Maintenance
= AFFO
- dividends, one-offs, perpetual hybrid interest, misc.
+ cash from sales, financing
Investments
Modernization & Space Creation
MAINTENANCE
Allocation between expensed maintenance and capitalized maintenance is a major swing factor in operating margin
Regardless of the capitalization rate, however, both combined are largely governed by German Civil Code §558 and essentially protect future EBITDAs as they are reactive, non-discretionary measures.
Represent what is required to broadly maintain the property value.
MODERNIZATION
Changes the character of a building
Generates a measurable return on investment (rent growth / value growth)
Grows future EBITDAs
Modernization governed by German Civil Code §559
Discretionary & pro-active
Portfolio Management
3
Non-deal Asia Roadshow, February 7-10, 2017
Schwarmstädte
page 66
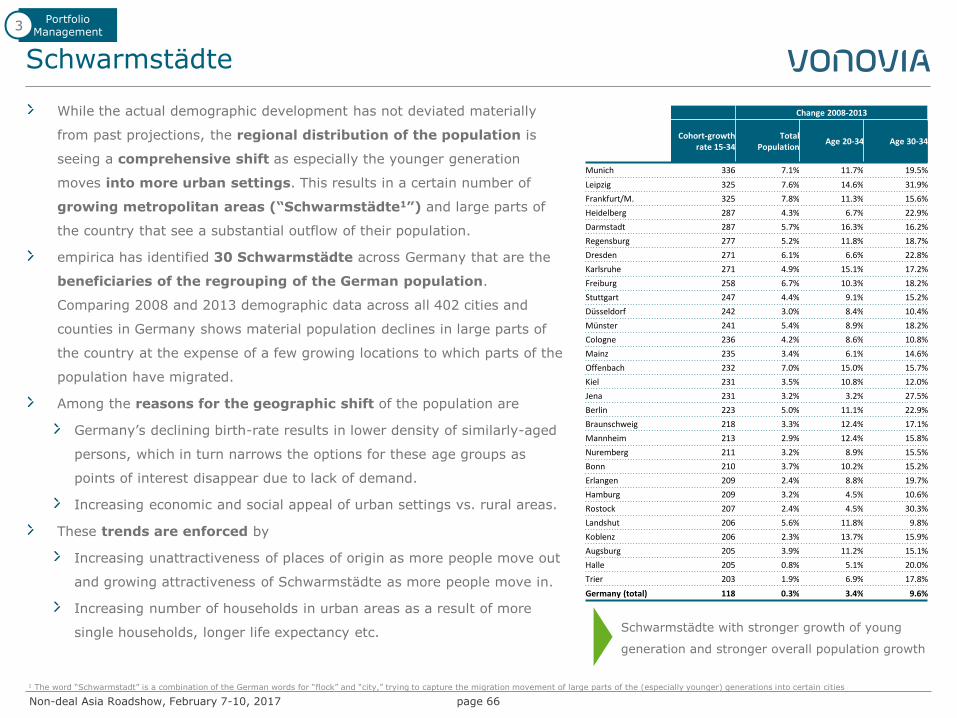
While the actual demographic development has not deviated materially
from past projections, the regional distribution of the population is
seeing a comprehensive shift as especially the younger generation
moves into more urban settings. This results in a certain number of
growing metropolitan areas (“Schwarmstädte1”) and large parts of
the country that see a substantial outflow of their population.
empirica has identified 30 Schwarmstädte across Germany that are the
beneficiaries of the regrouping of the German population.
Comparing 2008 and 2013 demographic data across all 402 cities and
counties in Germany shows material population declines in large parts of
the country at the expense of a few growing locations to which parts of the
population have migrated.
Among the reasons for the geographic shift of the population are
Germany’s declining birth-rate results in lower density of similarly-aged
persons, which in turn narrows the options for these age groups as
points of interest disappear due to lack of demand.
Increasing economic and social appeal of urban settings vs. rural areas.
These trends are enforced by
Increasing unattractiveness of places of origin as more people move out
and growing attractiveness of Schwarmstädte as more people move in.
Increasing number of households in urban areas as a result of more
single households, longer life expectancy etc.
Portfolio Management
3
Schwarmstädte with stronger growth of young
generation and stronger overall population growth
1 The word “Schwarmstadt” is a combination of the German words for “flock” and “city,” trying to capture the migration movement of large parts of the (especially younger) generations into certain cities
Change 2008-2013
Cohort-growth rate 15-34
Total Population
Age 20-34 Age 30-34
Munich 336 7.1% 11.7% 19.5%
Leipzig 325 7.6% 14.6% 31.9%
Frankfurt/M. 325 7.8% 11.3% 15.6%
Heidelberg 287 4.3% 6.7% 22.9%
Darmstadt 287 5.7% 16.3% 16.2%
Regensburg 277 5.2% 11.8% 18.7%
Dresden 271 6.1% 6.6% 22.8%
Karlsruhe 271 4.9% 15.1% 17.2%
Freiburg 258 6.7% 10.3% 18.2%
Stuttgart 247 4.4% 9.1% 15.2%
Düsseldorf 242 3.0% 8.4% 10.4%
Münster 241 5.4% 8.9% 18.2%
Cologne 236 4.2% 8.6% 10.8%
Mainz 235 3.4% 6.1% 14.6%
Offenbach 232 7.0% 15.0% 15.7%
Kiel 231 3.5% 10.8% 12.0%
Jena 231 3.2% 3.2% 27.5%
Berlin 223 5.0% 11.1% 22.9%
Braunschweig 218 3.3% 12.4% 17.1%
Mannheim 213 2.9% 12.4% 15.8%
Nuremberg 211 3.2% 8.9% 15.5%
Bonn 210 3.7% 10.2% 15.2%
Erlangen 209 2.4% 8.8% 19.7%
Hamburg 209 3.2% 4.5% 10.6%
Rostock 207 2.4% 4.5% 30.3%
Landshut 206 5.6% 11.8% 9.8%
Koblenz 206 2.3% 13.7% 15.9%
Augsburg 205 3.9% 11.2% 15.1%
Halle 205 0.8% 5.1% 20.0%
Trier 203 1.9% 6.9% 17.8%
Germany (total) 118 0.3% 3.4% 9.6%
Non-deal Asia Roadshow, February 7-10, 2017
Prognos Methodology
page 67
Prognos is an independent research institute that benchmarks all 402 cities and
counties in Germany (“Prognos Future Atlas Ranking”).
Cities and counties are ranked across 8 categories ranging from 1 (“excellent
potential”) to 8 (“extreme future risks”).
Analysis comprises 29 socioeconomic indicators across four categories
Demographics
Labor market
Innovation
Prosperity
The analysis looks at both the current strength and the dynamic development, allowing
an assessment of the positive/negative momentum.
The first Prognos ranking was published in 2004; updates have been made in 2007,
2010, 2013 and most recently in 2016.
Portfolio Management
3
Non-deal Asia Roadshow, February 7-10, 2017
Impressions
page 68
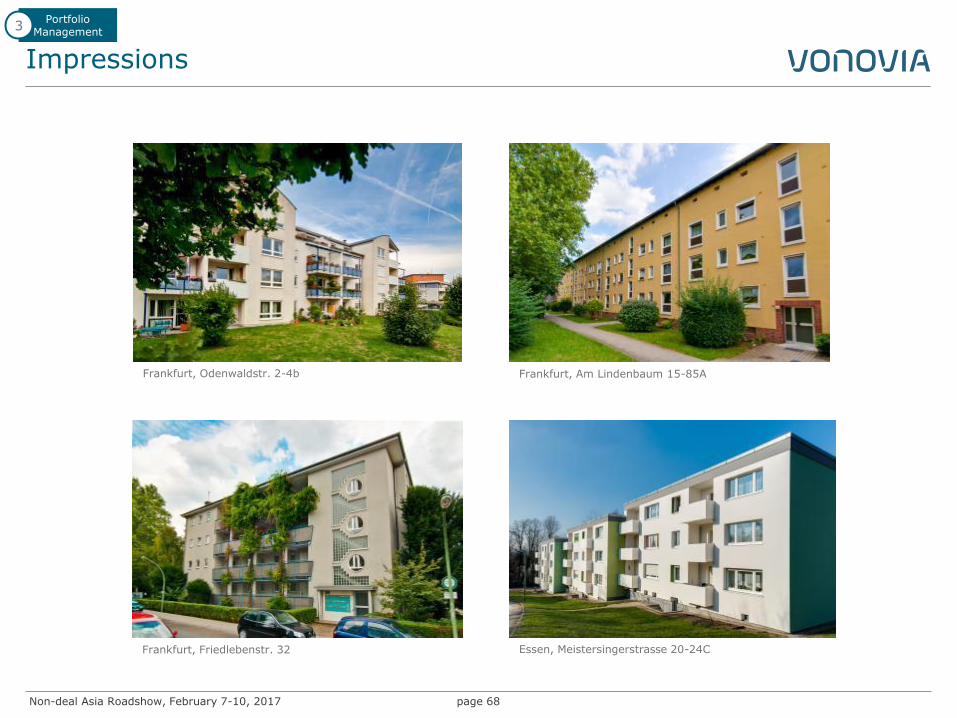
Frankfurt, Odenwaldstr. 2-4b
Frankfurt, Friedlebenstr. 32
Frankfurt, Am Lindenbaum 15-85A
Essen, Meistersingerstrasse 20-24C
Portfolio Management
3
Non-deal Asia Roadshow, February 7-10, 2017
Impressions
page 69
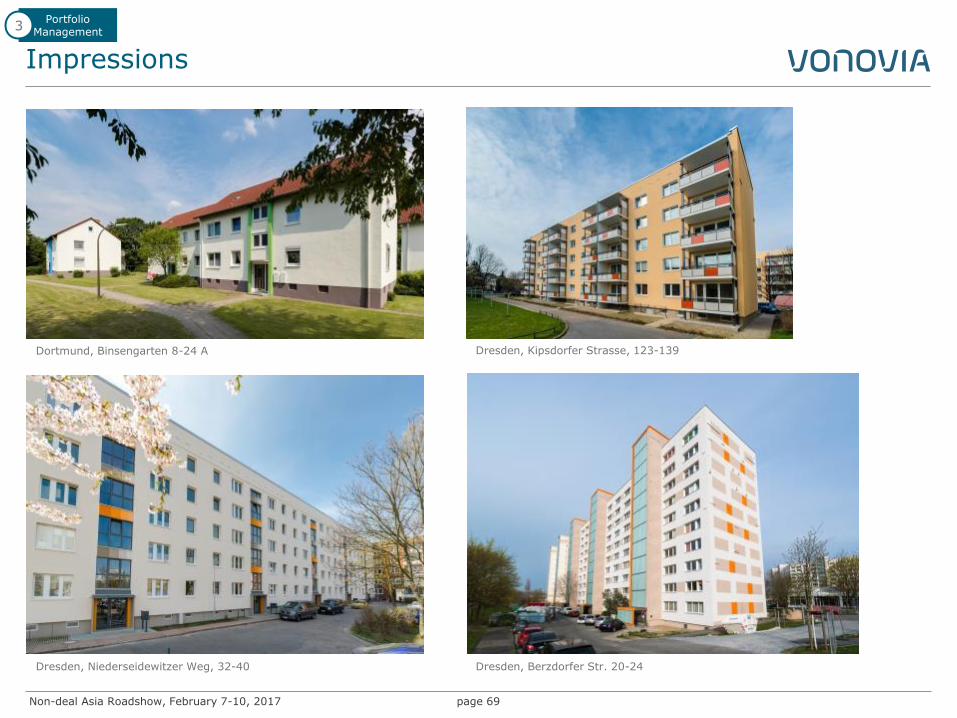
Dresden, Niederseidewitzer Weg, 32-40
Dresden, Kipsdorfer Strasse, 123-139 Dortmund, Binsengarten 8-24 A
Dresden, Berzdorfer Str. 20-24
Portfolio Management
3
Non-deal Asia Roadshow, February 7-10, 2017
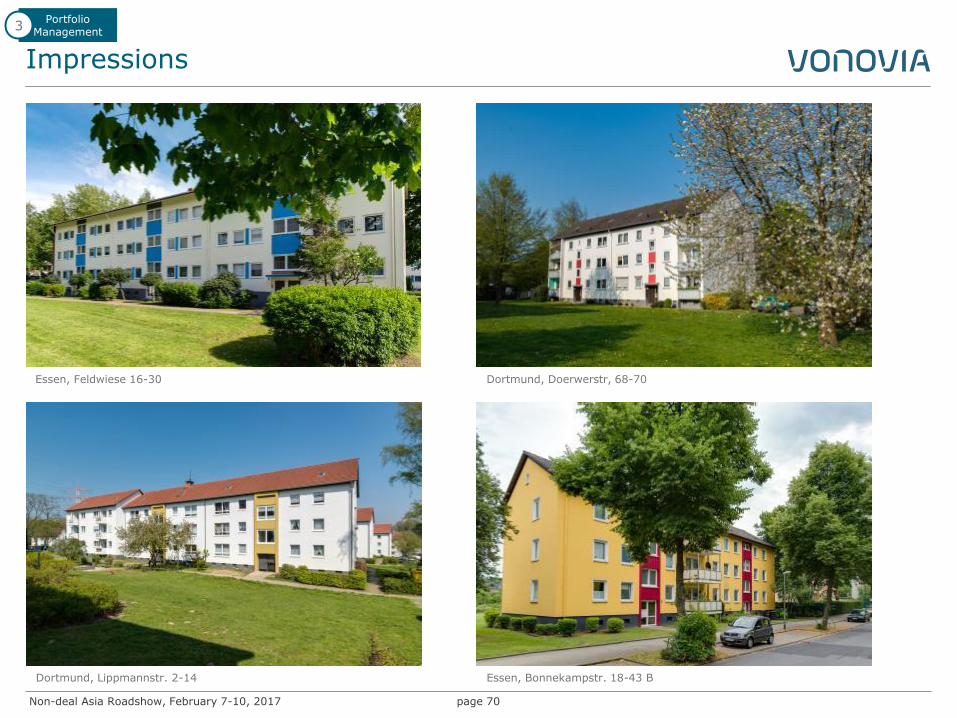
Impressions
page 70
Essen, Feldwiese 16-30 Dortmund, Doerwerstr, 68-70
Dortmund, Lippmannstr. 2-14 Essen, Bonnekampstr. 18-43 B
Portfolio Management
3
Non-deal Asia Roadshow, February 7-10, 2017 page 71
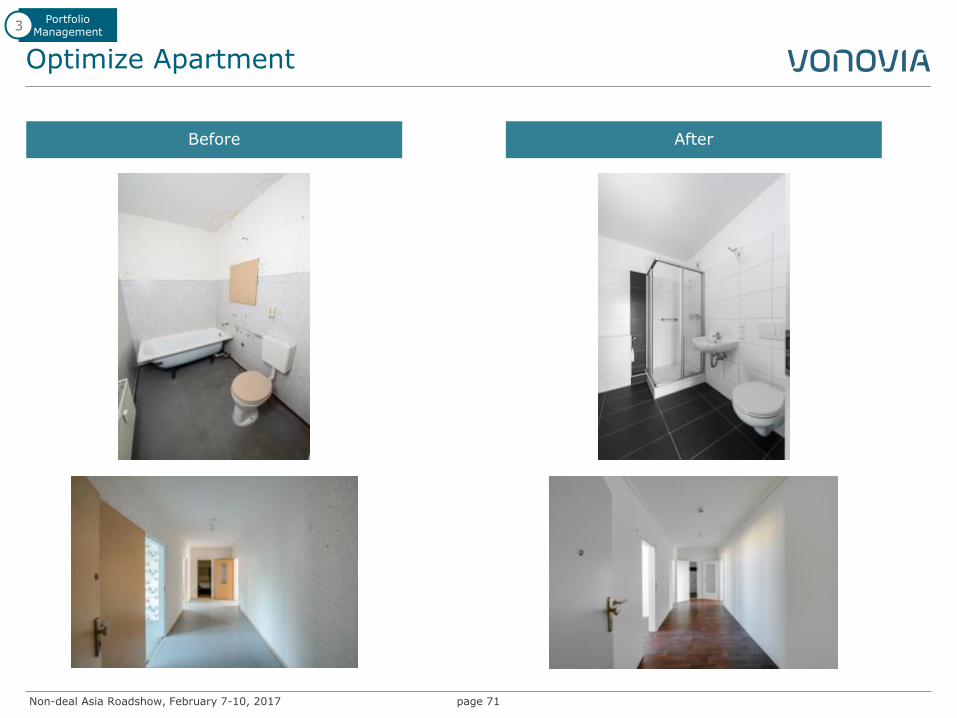
Before After
Optimize Apartment
Portfolio Management
3
Non-deal Asia Roadshow, February 7-10, 2017 page 72
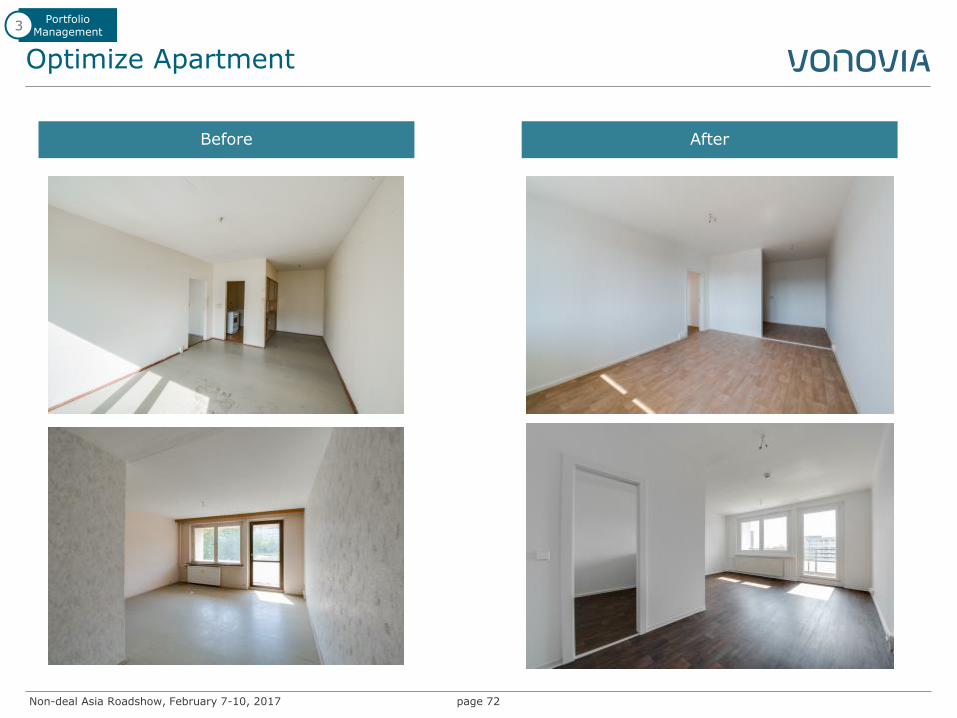
Before After
Optimize Apartment
Portfolio Management
3
Non-deal Asia Roadshow, February 7-10, 2017 page 73
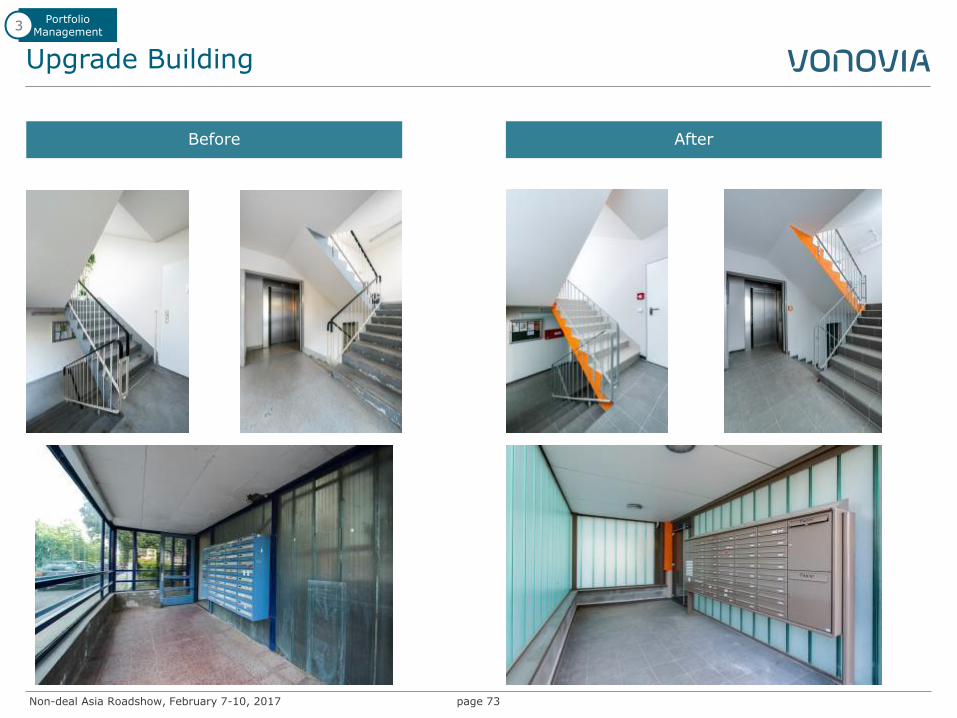
Before After
Upgrade Building
Portfolio Management
3
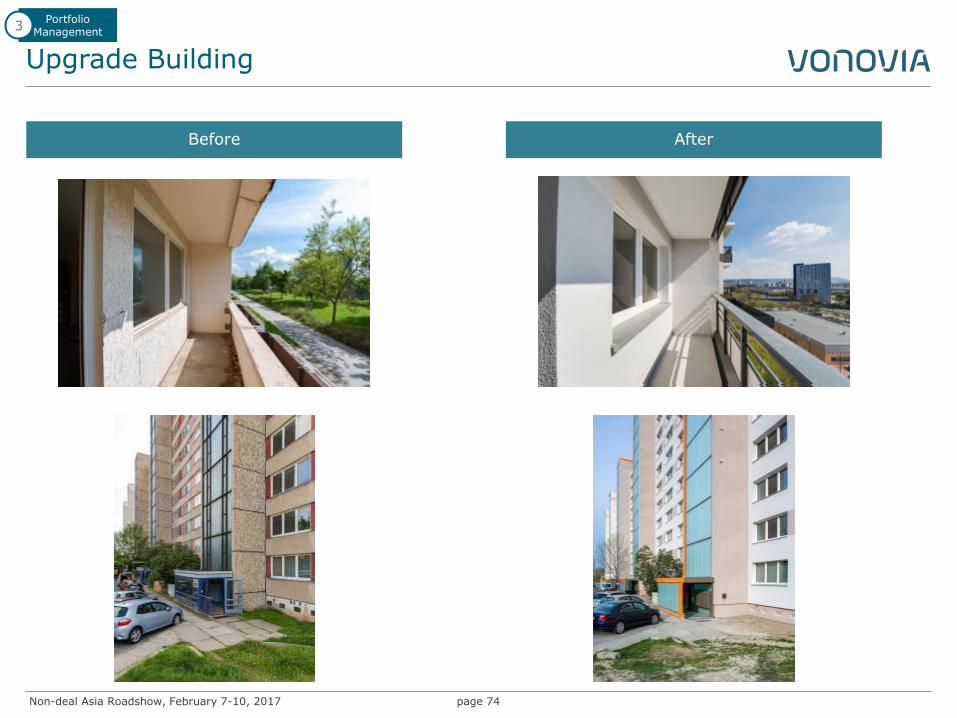
Non-deal Asia Roadshow, February 7-10, 2017 page 74
Before After
Upgrade Building
Portfolio Management
3
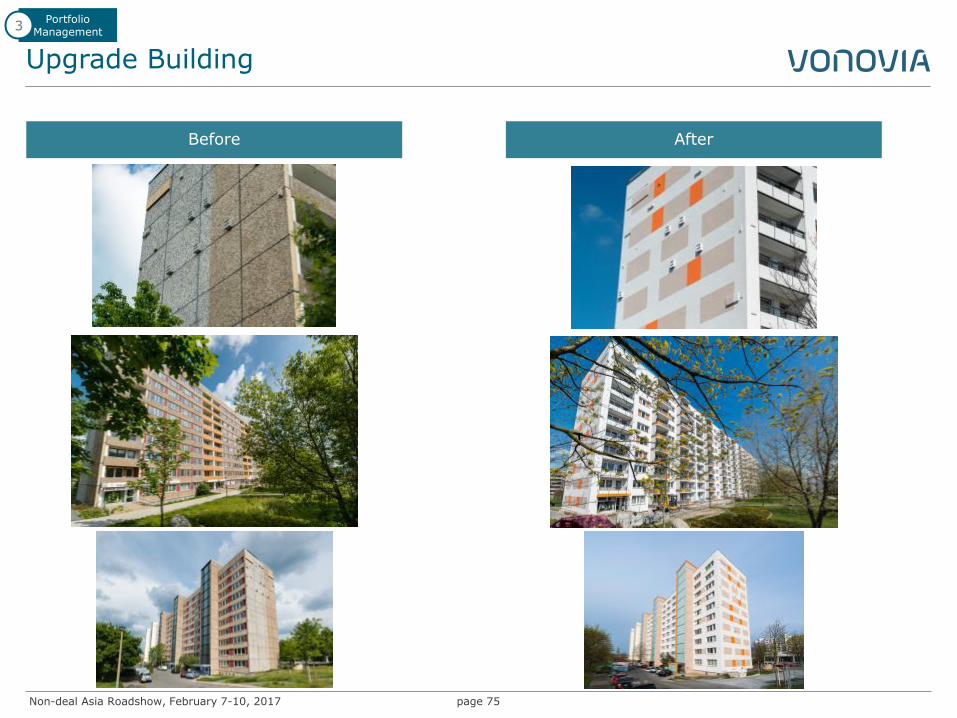
Non-deal Asia Roadshow, February 7-10, 2017 page 75
Before After
Upgrade Building
Portfolio Management
3
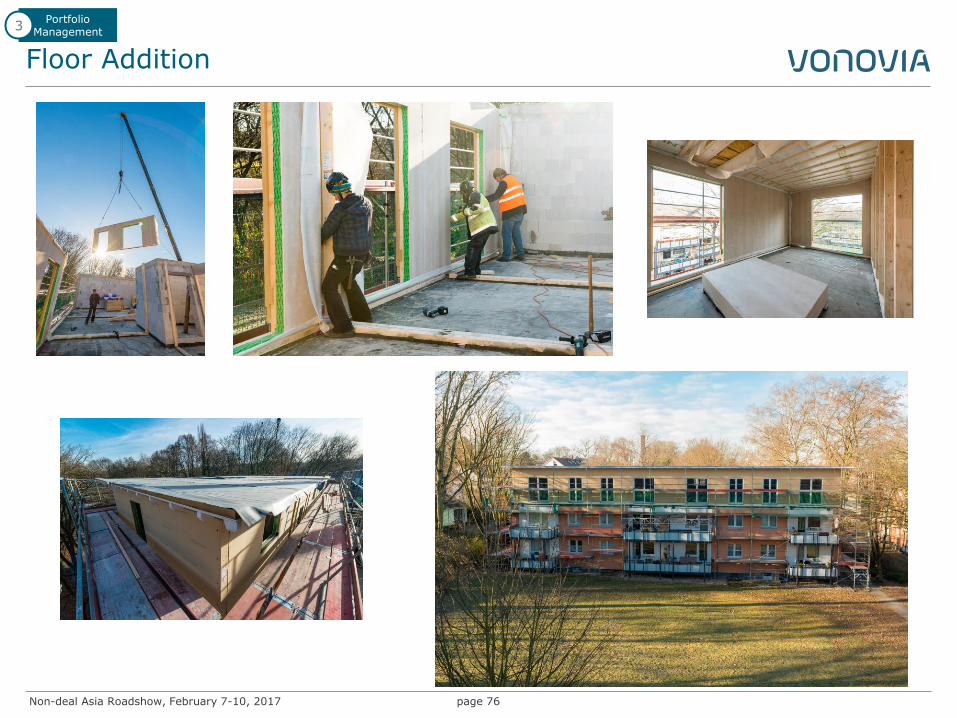
Non-deal Asia Roadshow, February 7-10, 2017
Floor Addition
page 76
Portfolio Management
3
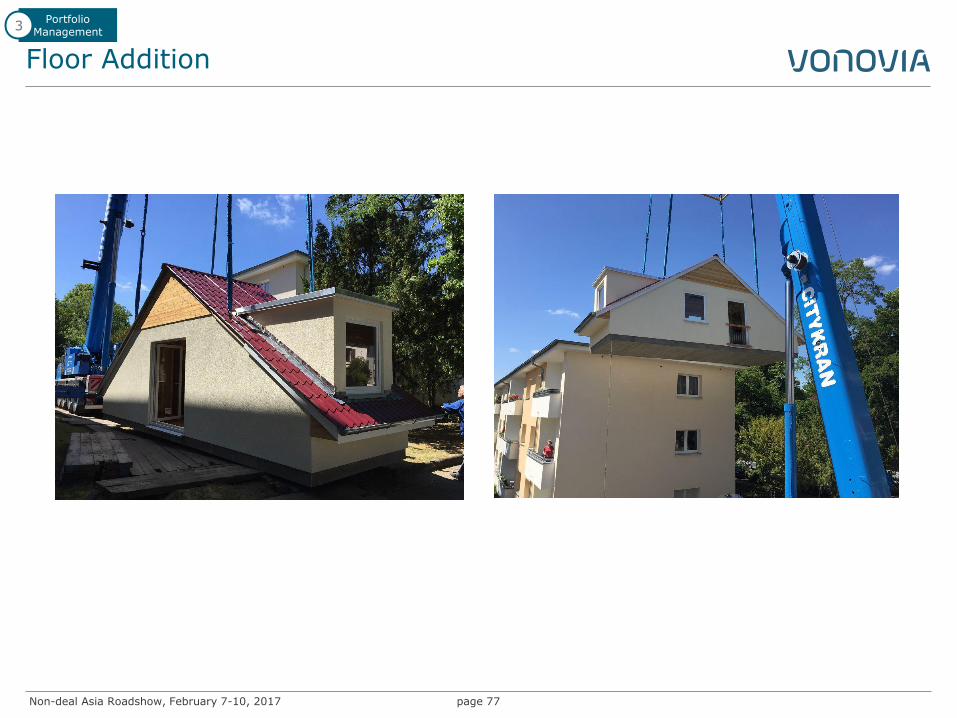
Non-deal Asia Roadshow, February 7-10, 2017
Floor Addition
page 77
Portfolio Management
3
Non-deal Asia Roadshow, February 7-10, 2017
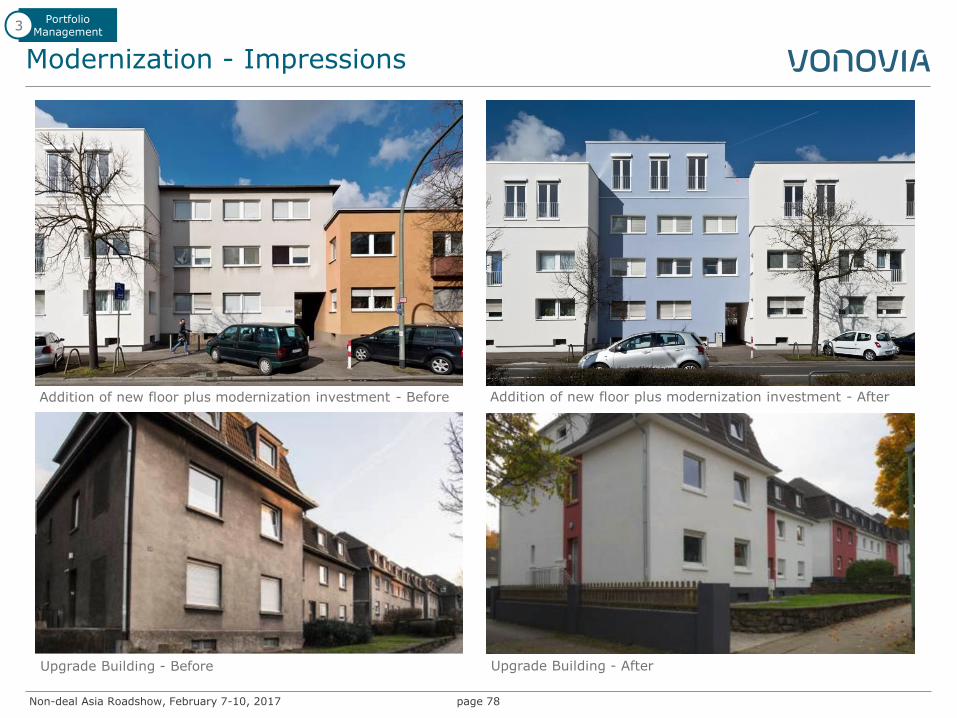
Modernization - Impressions
page 78
Portfolio Management
3
Upgrade Building - Before Upgrade Building - After
Addition of new floor plus modernization investment - Before Addition of new floor plus modernization investment - After
Non-deal Asia Roadshow, February 7-10, 2017
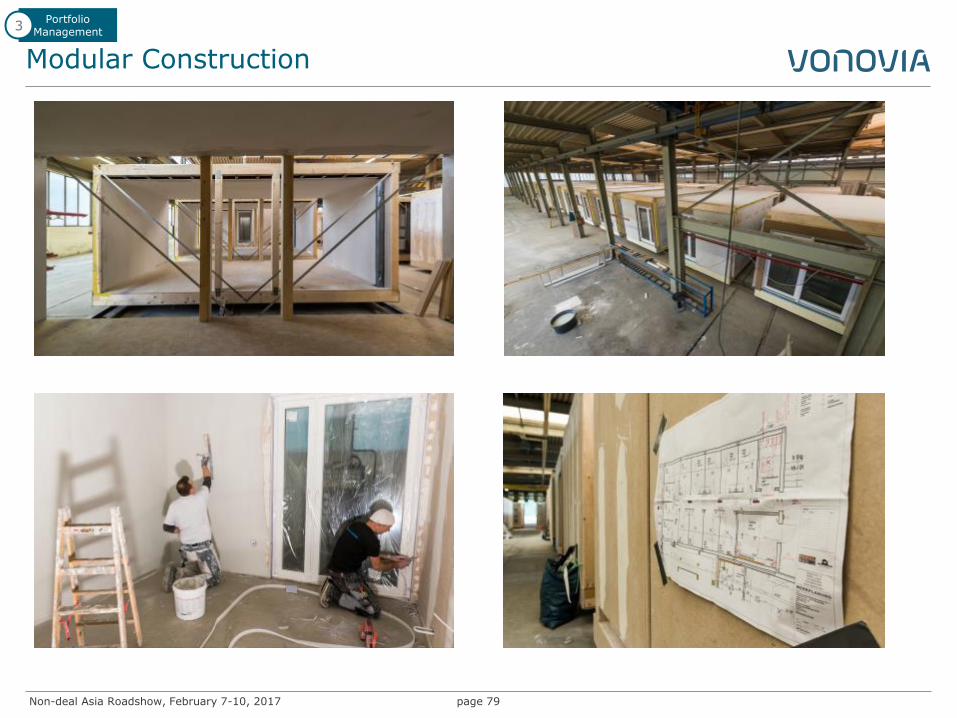
Modular Construction
page 79
Portfolio Management
3
Non-deal Asia Roadshow, February 7-10, 2017
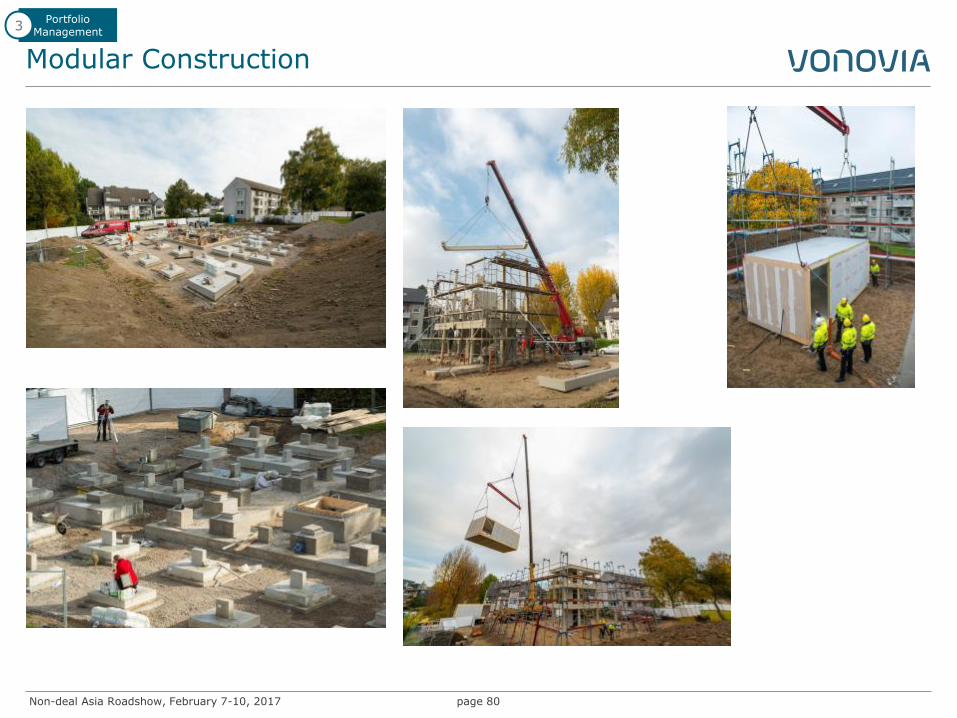
Modular Construction
page 80
Portfolio Management
3
Non-deal Asia Roadshow, February 7-10, 2017
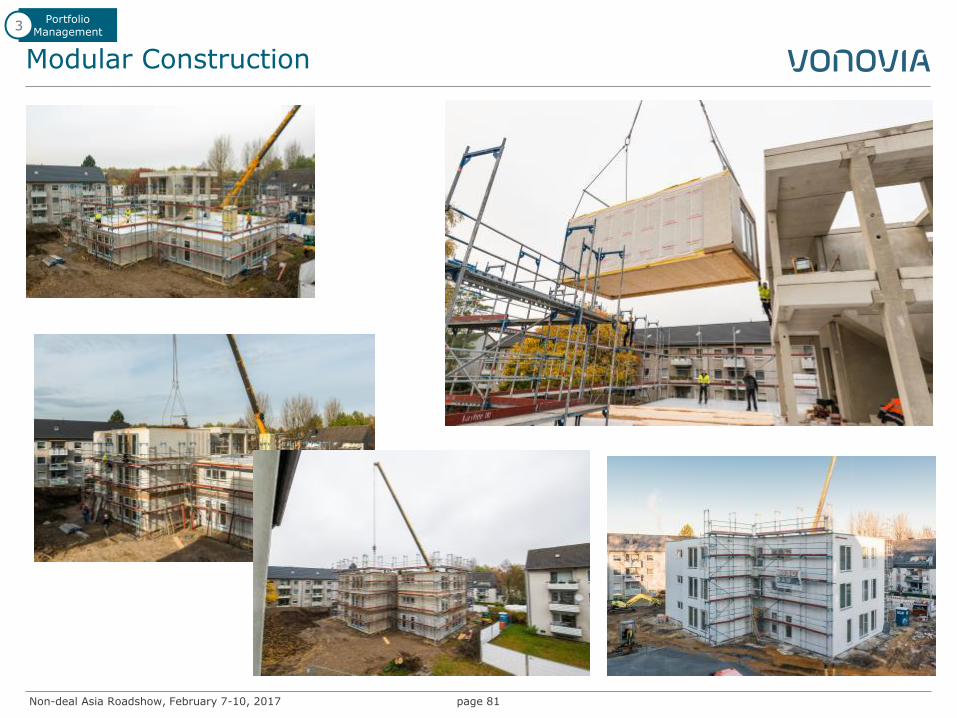
Modular Construction
page 81
Portfolio Management
3
Non-deal Asia Roadshow, February 7-10, 2017
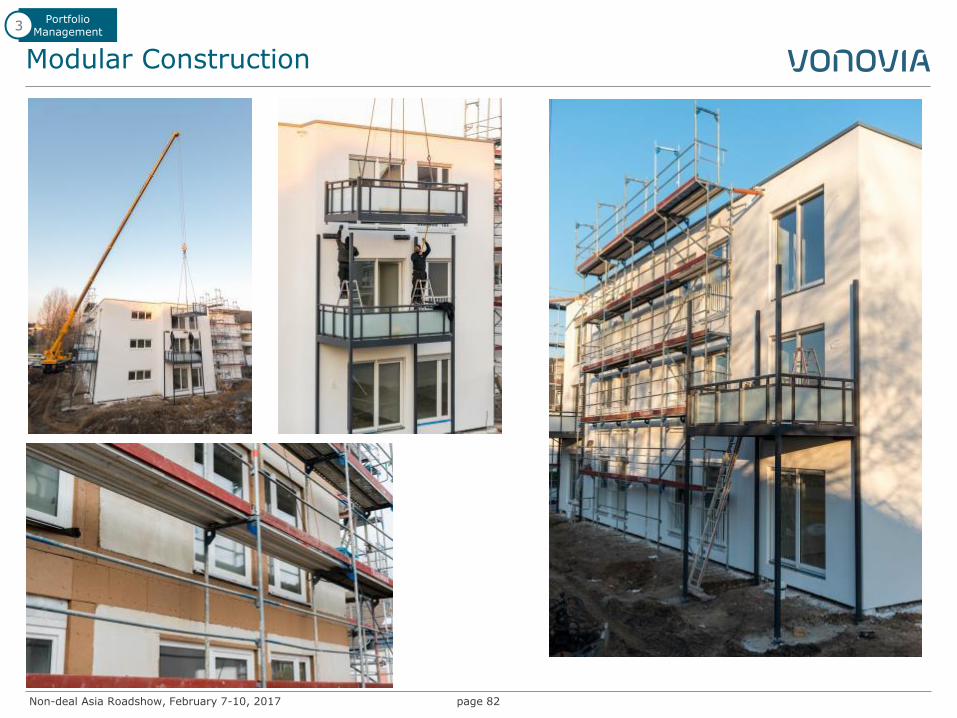
Modular Construction
page 82
Portfolio Management
3
Non-deal Asia Roadshow, February 7-10, 2017
Modular Construction
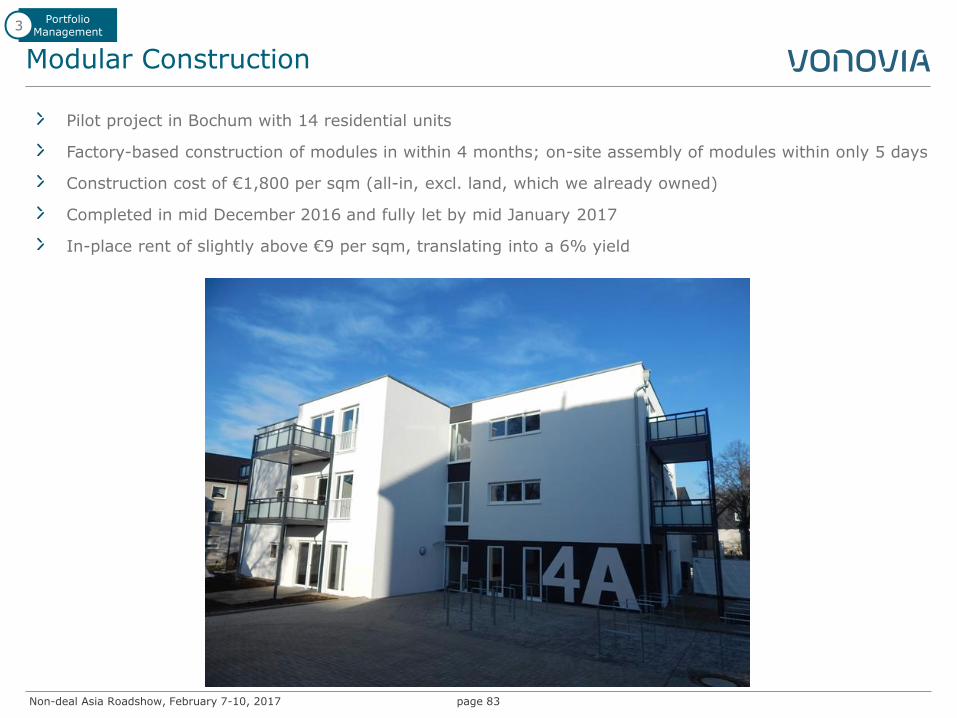
page 83
Pilot project in Bochum with 14 residential units
Factory-based construction of modules in within 4 months; on-site assembly of modules within only 5 days
Construction cost of €1,800 per sqm (all-in, excl. land, which we already owned)
Completed in mid December 2016 and fully let by mid January 2017
In-place rent of slightly above €9 per sqm, translating into a 6% yield
Portfolio Management
3
Non-deal Asia Roadshow, February 7-10, 2017
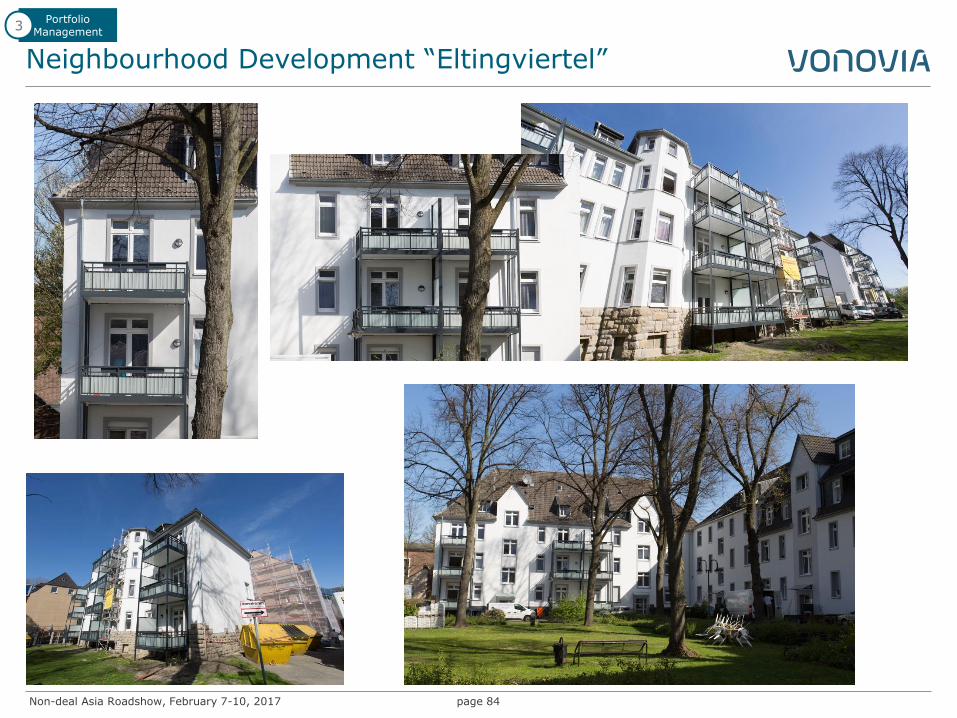
Neighbourhood Development “Eltingviertel”
page 84
Portfolio Management
3
Non-deal Asia Roadshow, February 7-10, 2017
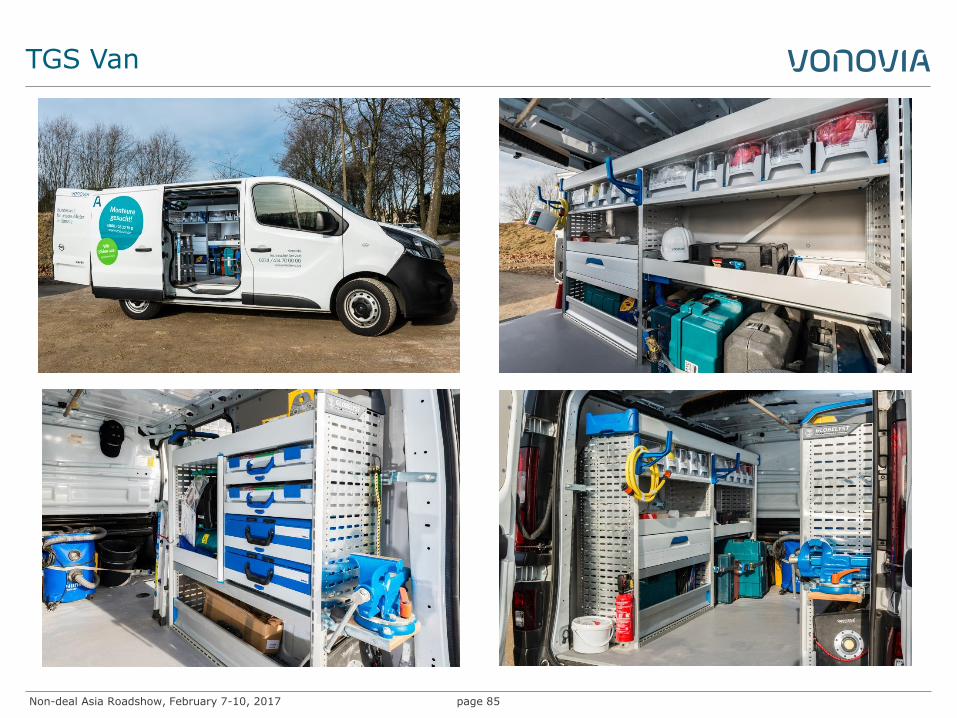
TGS Van
page 85
Non-deal Asia Roadshow, February 7-10, 2017
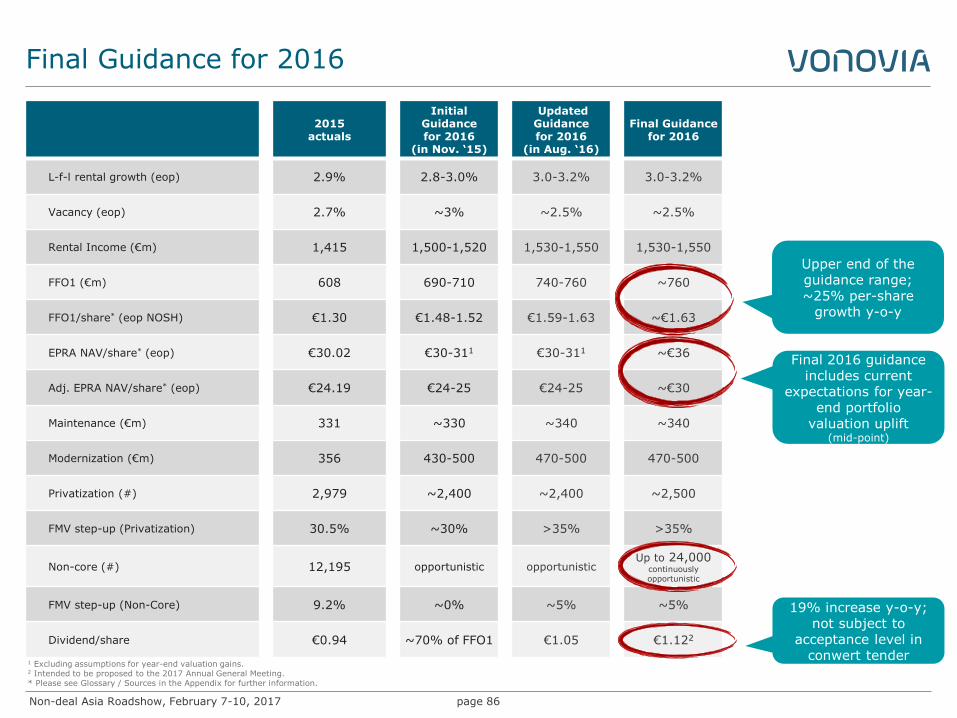
Final Guidance for 2016
page 86
2015 actuals
Initial Guidance for 2016
(in Nov. ‘15)
Updated Guidance for 2016
(in Aug. ‘16)
Final Guidance for 2016
L-f-l rental growth (eop) 2.9% 2.8-3.0% 3.0-3.2% 3.0-3.2%
Vacancy (eop) 2.7% ~3% ~2.5% ~2.5%
Rental Income (€m) 1,415 1,500-1,520 1,530-1,550 1,530-1,550
FFO1 (€m) 608 690-710 740-760 ~760
FFO1/share* (eop NOSH) €1.30 €1.48-1.52 €1.59-1.63 ~€1.63
EPRA NAV/share* (eop) €30.02 €30-311 €30-311 ~€36
Adj. EPRA NAV/share* (eop) €24.19 €24-25 €24-25 ~€30
Maintenance (€m) 331 ~330 ~340 ~340
Modernization (€m) 356 430-500 470-500 470-500
Privatization (#) 2,979 ~2,400 ~2,400 ~2,500
FMV step-up (Privatization) 30.5% ~30% >35% >35%
Non-core (#) 12,195 opportunistic opportunistic Up to 24,000
continuously opportunistic
FMV step-up (Non-Core) 9.2% ~0% ~5% ~5%
Dividend/share €0.94 ~70% of FFO1 €1.05 €1.122
19% increase y-o-y; not subject to
acceptance level in conwert tender
Final 2016 guidance includes current
expectations for year-end portfolio
valuation uplift (mid-point)
Upper end of the guidance range; ~25% per-share
growth y-o-y
1 Excluding assumptions for year-end valuation gains. 2 Intended to be proposed to the 2017 Annual General Meeting. * Please see Glossary / Sources in the Appendix for further information.
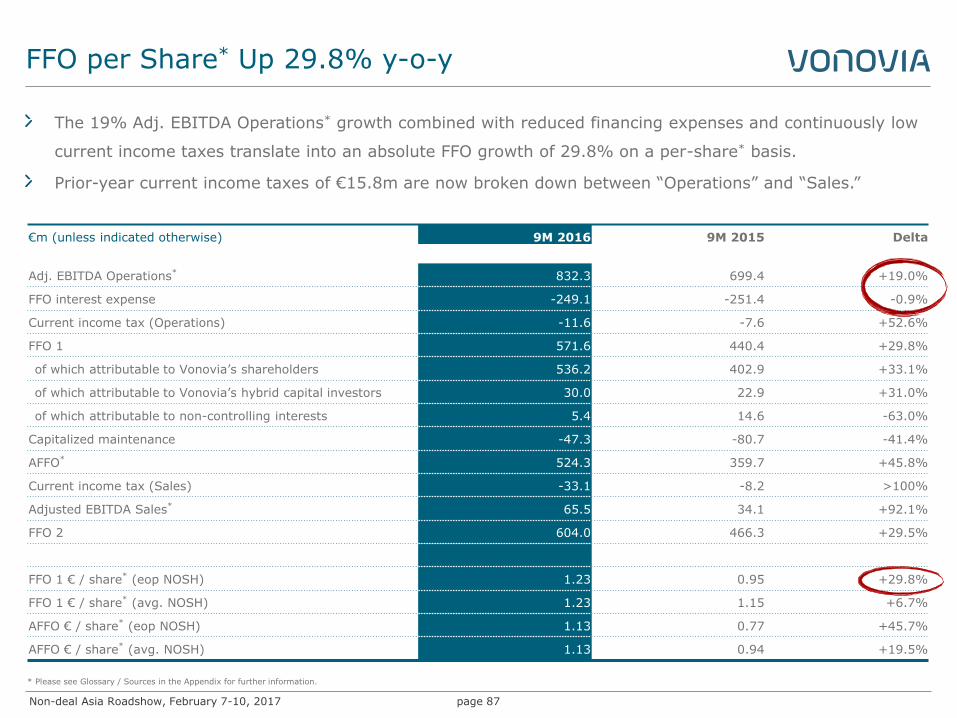
Non-deal Asia Roadshow, February 7-10, 2017
FFO per Share* Up 29.8% y-o-y
page 87
€m (unless indicated otherwise) 9M 2016 9M 2015 Delta
Adj. EBITDA Operations* 832.3 699.4 +19.0%
FFO interest expense -249.1 -251.4 -0.9%
Current income tax (Operations) -11.6 -7.6 +52.6%
FFO 1 571.6 440.4 +29.8%
of which attributable to Vonovia’s shareholders 536.2 402.9 +33.1%
of which attributable to Vonovia’s hybrid capital investors 30.0 22.9 +31.0%
of which attributable to non-controlling interests 5.4 14.6 -63.0%
Capitalized maintenance -47.3 -80.7 -41.4%
AFFO* 524.3 359.7 +45.8%
Current income tax (Sales) -33.1 -8.2 >100%
Adjusted EBITDA Sales* 65.5 34.1 +92.1%
FFO 2 604.0 466.3 +29.5%
FFO 1 € / share* (eop NOSH) 1.23 0.95 +29.8%
FFO 1 € / share* (avg. NOSH) 1.23 1.15 +6.7%
AFFO € / share* (eop NOSH) 1.13 0.77 +45.7%
AFFO € / share* (avg. NOSH) 1.13 0.94 +19.5%
The 19% Adj. EBITDA Operations* growth combined with reduced financing expenses and continuously low
current income taxes translate into an absolute FFO growth of 29.8% on a per-share* basis.
Prior-year current income taxes of €15.8m are now broken down between “Operations” and “Sales.”
* Please see Glossary / Sources in the Appendix for further information.
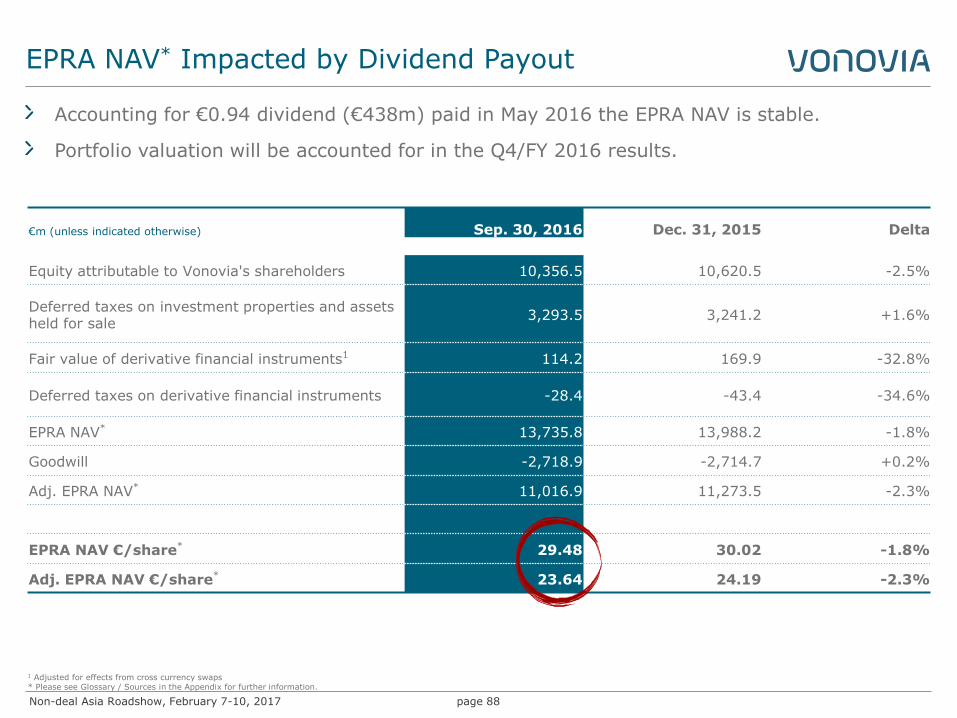
Non-deal Asia Roadshow, February 7-10, 2017
EPRA NAV* Impacted by Dividend Payout
page 88
€m (unless indicated otherwise) Sep. 30, 2016 Dec. 31, 2015 Delta
Equity attributable to Vonovia's shareholders 10,356.5 10,620.5 -2.5%
Deferred taxes on investment properties and assets held for sale
3,293.5 3,241.2 +1.6%
Fair value of derivative financial instruments1 114.2 169.9 -32.8%
Deferred taxes on derivative financial instruments -28.4 -43.4 -34.6%
EPRA NAV* 13,735.8 13,988.2 -1.8%
Goodwill -2,718.9 -2,714.7 +0.2%
Adj. EPRA NAV* 11,016.9 11,273.5 -2.3%
EPRA NAV €/share* 29.48 30.02 -1.8%
Adj. EPRA NAV €/share* 23.64 24.19 -2.3%
1 Adjusted for effects from cross currency swaps * Please see Glossary / Sources in the Appendix for further information.
Accounting for €0.94 dividend (€438m) paid in May 2016 the EPRA NAV is stable.
Portfolio valuation will be accounted for in the Q4/FY 2016 results.
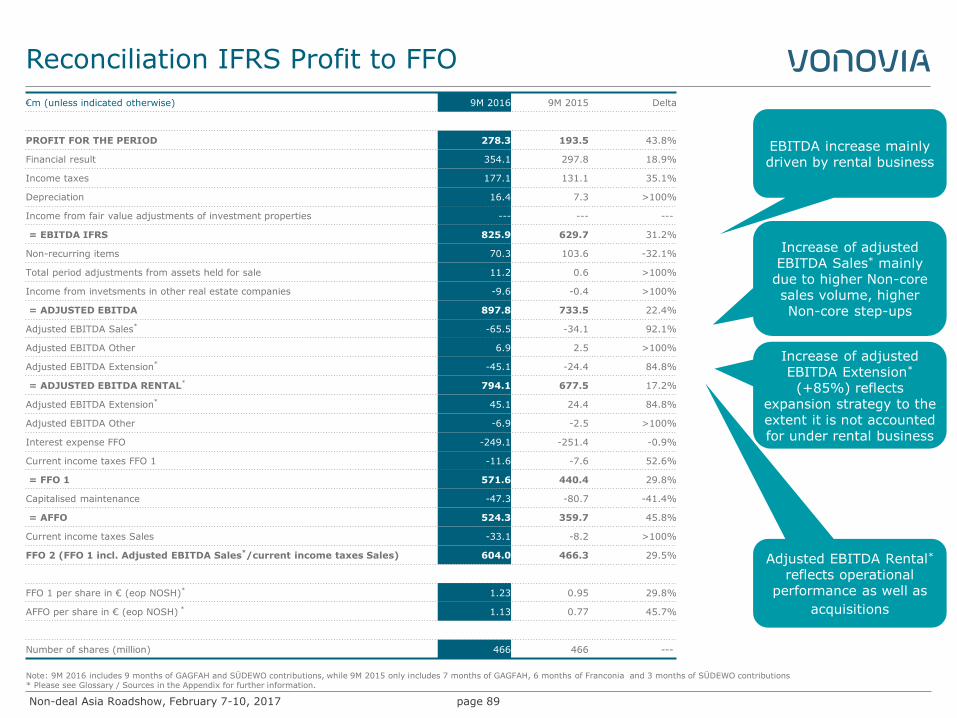
Non-deal Asia Roadshow, February 7-10, 2017
Reconciliation IFRS Profit to FFO
page 89
EBITDA increase mainly driven by rental business
Adjusted EBITDA Rental* reflects operational
performance as well as
acquisitions
Increase of adjusted EBITDA Extension*
(+85%) reflects expansion strategy to the extent it is not accounted for under rental business
Increase of adjusted EBITDA Sales* mainly due to higher Non-core sales volume, higher Non-core step-ups
€m (unless indicated otherwise) 9M 2016 9M 2015 Delta
0
PROFIT FOR THE PERIOD 278.3 193.5 43.8%
Financial result 354.1 297.8 18.9%
Income taxes 177.1 131.1 35.1%
Depreciation 16.4 7.3 >100%
Income from fair value adjustments of investment properties --- --- ---
= EBITDA IFRS 825.9 629.7 31.2%
Non-recurring items 70.3 103.6 -32.1%
Total period adjustments from assets held for sale 11.2 0.6 >100%
Income from invetsments in other real estate companies -9.6 -0.4 >100%
= ADJUSTED EBITDA 897.8 733.5 22.4%
Adjusted EBITDA Sales* -65.5 -34.1 92.1%
Adjusted EBITDA Other 6.9 2.5 >100%
Adjusted EBITDA Extension* -45.1 -24.4 84.8%
= ADJUSTED EBITDA RENTAL* 794.1 677.5 17.2%
Adjusted EBITDA Extension* 45.1 24.4 84.8%
Adjusted EBITDA Other -6.9 -2.5 >100%
Interest expense FFO -249.1 -251.4 -0.9%
Current income taxes FFO 1 -11.6 -7.6 52.6%
= FFO 1 571.6 440.4 29.8%
Capitalised maintenance -47.3 -80.7 -41.4%
= AFFO 524.3 359.7 45.8%
Current income taxes Sales -33.1 -8.2 >100%
FFO 2 (FFO 1 incl. Adjusted EBITDA Sales*/current income taxes Sales) 604.0 466.3 29.5%
FFO 1 per share in € (eop NOSH)* 1.23 0.95 29.8%
AFFO per share in € (eop NOSH) * 1.13 0.77 45.7%
Number of shares (million) 466 466 ---
Note: 9M 2016 includes 9 months of GAGFAH and SÜDEWO contributions, while 9M 2015 only includes 7 months of GAGFAH, 6 months of Franconia and 3 months of SÜDEWO contributions * Please see Glossary / Sources in the Appendix for further information.
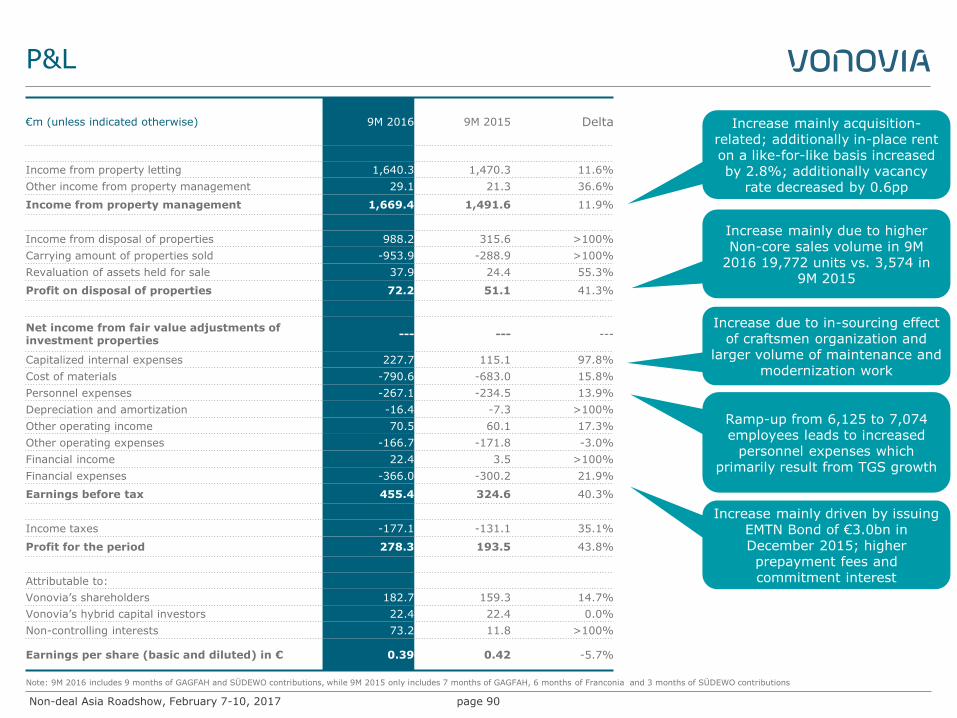
Non-deal Asia Roadshow, February 7-10, 2017
P&L
page 90
Increase mainly acquisition-related; additionally in-place rent on a like-for-like basis increased by 2.8%; additionally vacancy
rate decreased by 0.6pp
Increase due to in-sourcing effect of craftsmen organization and
larger volume of maintenance and modernization work
Increase mainly due to higher Non-core sales volume in 9M
2016 19,772 units vs. 3,574 in 9M 2015
Ramp-up from 6,125 to 7,074 employees leads to increased
personnel expenses which primarily result from TGS growth
Increase mainly driven by issuing EMTN Bond of €3.0bn in December 2015; higher prepayment fees and commitment interest
€m (unless indicated otherwise) 9M 2016 9M 2015 Delta
0
Income from property letting 1,640.3 1,470.3 11.6%
Other income from property management 29.1 21.3 36.6%
Income from property management 1,669.4 1,491.6 11.9%
Income from disposal of properties 988.2 315.6 >100%
Carrying amount of properties sold -953.9 -288.9 >100%
Revaluation of assets held for sale 37.9 24.4 55.3%
Profit on disposal of properties 72.2 51.1 41.3%
Net income from fair value adjustments of investment properties
--- --- ---
Capitalized internal expenses 227.7 115.1 97.8%
Cost of materials -790.6 -683.0 15.8%
Personnel expenses -267.1 -234.5 13.9%
Depreciation and amortization -16.4 -7.3 >100%
Other operating income 70.5 60.1 17.3%
Other operating expenses -166.7 -171.8 -3.0%
Financial income 22.4 3.5 >100%
Financial expenses -366.0 -300.2 21.9%
Earnings before tax 455.4 324.6 40.3%
Income taxes -177.1 -131.1 35.1%
Profit for the period 278.3 193.5 43.8%
Attributable to:
Vonovia’s shareholders 182.7 159.3 14.7%
Vonovia’s hybrid capital investors 22.4 22.4 0.0%
Non-controlling interests 73.2 11.8 >100%
Earnings per share (basic and diluted) in € 0.39 0.42 -5.7%
Note: 9M 2016 includes 9 months of GAGFAH and SÜDEWO contributions, while 9M 2015 only includes 7 months of GAGFAH, 6 months of Franconia and 3 months of SÜDEWO contributions
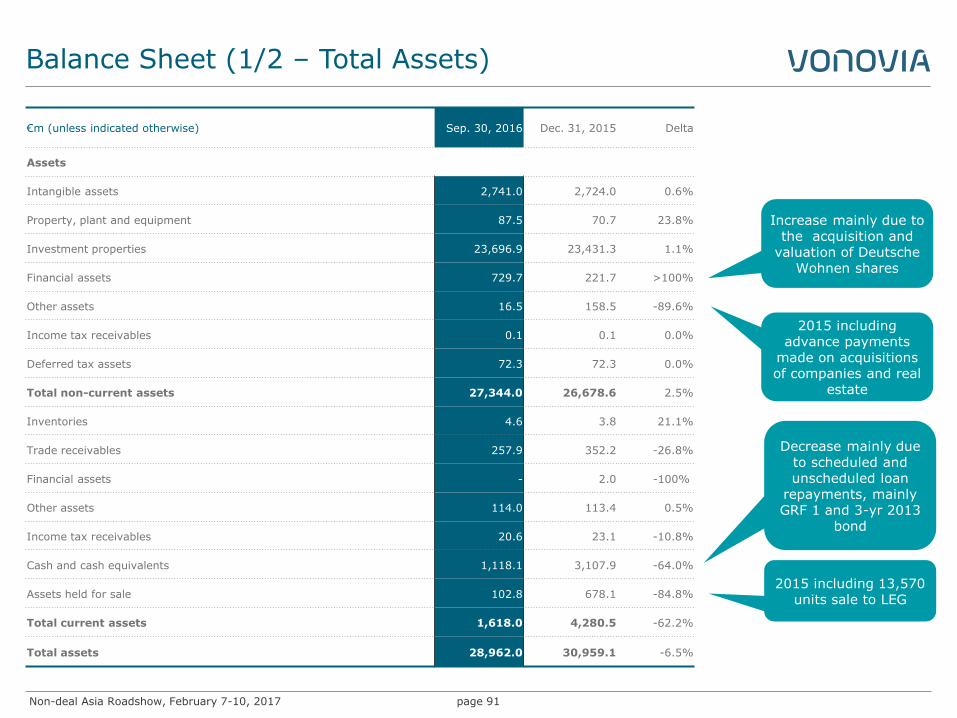
Non-deal Asia Roadshow, February 7-10, 2017
Balance Sheet (1/2 – Total Assets)
page 91
Increase mainly due to the acquisition and
valuation of Deutsche Wohnen shares
Decrease mainly due to scheduled and unscheduled loan
repayments, mainly GRF 1 and 3-yr 2013
bond
€m (unless indicated otherwise) Sep. 30, 2016 Dec. 31, 2015 Delta
Assets
Intangible assets 2,741.0 2,724.0 0.6%
Property, plant and equipment 87.5 70.7 23.8%
Investment properties 23,696.9 23,431.3 1.1%
Financial assets 729.7 221.7 >100%
Other assets 16.5 158.5 -89.6%
Income tax receivables 0.1 0.1 0.0%
Deferred tax assets 72.3 72.3 0.0%
Total non-current assets 27,344.0 26,678.6 2.5%
Inventories 4.6 3.8 21.1%
Trade receivables 257.9 352.2 -26.8%
Financial assets - 2.0 -100%
Other assets 114.0 113.4 0.5%
Income tax receivables 20.6 23.1 -10.8%
Cash and cash equivalents 1,118.1 3,107.9 -64.0%
Assets held for sale 102.8 678.1 -84.8%
Total current assets 1,618.0 4,280.5 -62.2%
Total assets 28,962.0 30,959.1 -6.5%
2015 including advance payments
made on acquisitions of companies and real
estate
2015 including 13,570 units sale to LEG
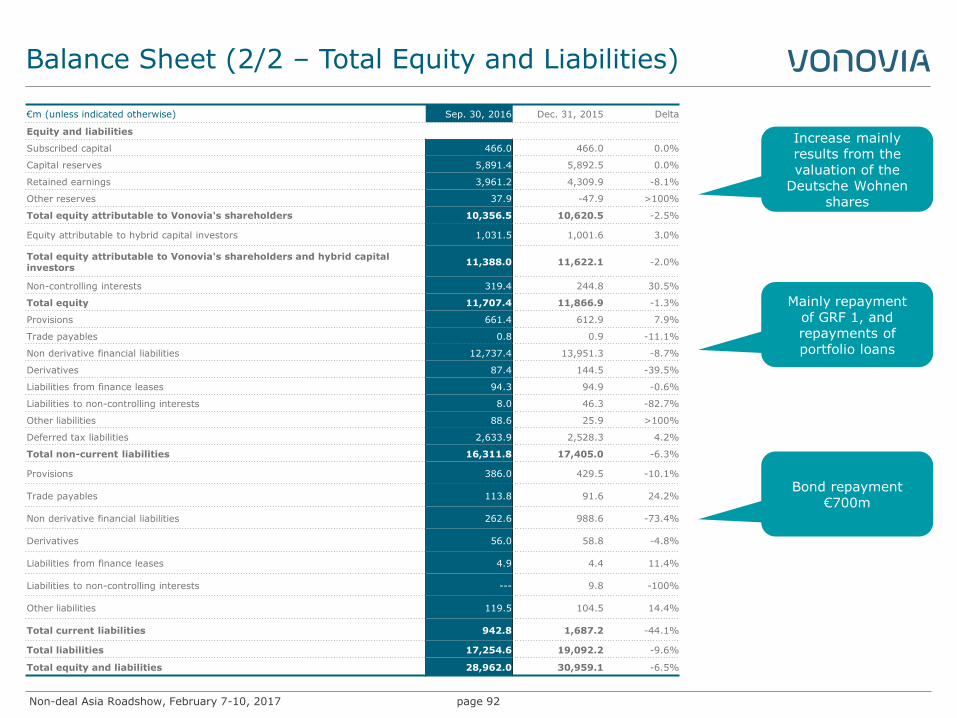
Non-deal Asia Roadshow, February 7-10, 2017
Balance Sheet (2/2 – Total Equity and Liabilities)
page 92
Increase mainly results from the valuation of the
Deutsche Wohnen shares
€m (unless indicated otherwise) Sep. 30, 2016 Dec. 31, 2015 Delta
Equity and liabilities
Subscribed capital 466.0 466.0 0.0%
Capital reserves 5,891.4 5,892.5 0.0%
Retained earnings 3,961.2 4,309.9 -8.1%
Other reserves 37.9 -47.9 >100%
Total equity attributable to Vonovia's shareholders 10,356.5 10,620.5 -2.5%
Equity attributable to hybrid capital investors 1,031.5 1,001.6 3.0%
Total equity attributable to Vonovia's shareholders and hybrid capital investors
11,388.0 11,622.1 -2.0%
Non-controlling interests 319.4 244.8 30.5%
Total equity 11,707.4 11,866.9 -1.3%
Provisions 661.4 612.9 7.9%
Trade payables 0.8 0.9 -11.1%
Non derivative financial liabilities 12,737.4 13,951.3 -8.7%
Derivatives 87.4 144.5 -39.5%
Liabilities from finance leases 94.3 94.9 -0.6%
Liabilities to non-controlling interests 8.0 46.3 -82.7%
Other liabilities 88.6 25.9 >100%
Deferred tax liabilities 2,633.9 2,528.3 4.2%
Total non-current liabilities 16,311.8 17,405.0 -6.3%
Provisions 386.0 429.5 -10.1%
Trade payables 113.8 91.6 24.2%
Non derivative financial liabilities 262.6 988.6 -73.4%
Derivatives 56.0 58.8 -4.8%
Liabilities from finance leases 4.9 4.4 11.4%
Liabilities to non-controlling interests --- 9.8 -100%
Other liabilities 119.5 104.5 14.4%
Total current liabilities 942.8 1,687.2 -44.1%
Total liabilities 17,254.6 19,092.2 -9.6%
Total equity and liabilities 28,962.0 30,959.1 -6.5%
Bond repayment €700m
Mainly repayment of GRF 1, and repayments of portfolio loans
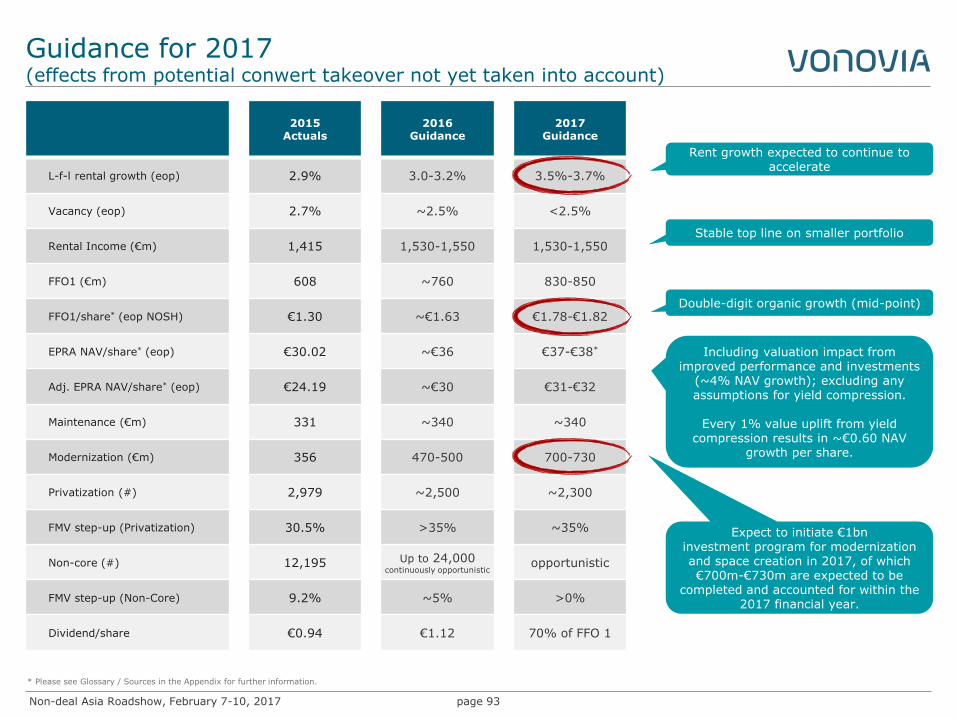
Non-deal Asia Roadshow, February 7-10, 2017
Guidance for 2017 (effects from potential conwert takeover not yet taken into account)
page 93
2015 Actuals
2016 Guidance
2017 Guidance
L-f-l rental growth (eop) 2.9% 3.0-3.2% 3.5%-3.7%
Vacancy (eop) 2.7% ~2.5% <2.5%
Rental Income (€m) 1,415 1,530-1,550 1,530-1,550
FFO1 (€m) 608 ~760 830-850
FFO1/share* (eop NOSH) €1.30 ~€1.63 €1.78-€1.82
EPRA NAV/share* (eop) €30.02 ~€36 €37-€38*
Adj. EPRA NAV/share* (eop) €24.19 ~€30 €31-€32
Maintenance (€m) 331 ~340 ~340
Modernization (€m) 356 470-500 700-730
Privatization (#) 2,979 ~2,500 ~2,300
FMV step-up (Privatization) 30.5% >35% ~35%
Non-core (#) 12,195 Up to 24,000 continuously opportunistic
opportunistic
FMV step-up (Non-Core) 9.2% ~5% >0%
Dividend/share €0.94 €1.12 70% of FFO 1
Rent growth expected to continue to accelerate
Stable top line on smaller portfolio
Double-digit organic growth (mid-point)
Including valuation impact from improved performance and investments
(~4% NAV growth); excluding any assumptions for yield compression.
Every 1% value uplift from yield
compression results in ~€0.60 NAV growth per share.
Expect to initiate €1bn investment program for modernization and space creation in 2017, of which €700m-€730m are expected to be
completed and accounted for within the 2017 financial year.
* Please see Glossary / Sources in the Appendix for further information.
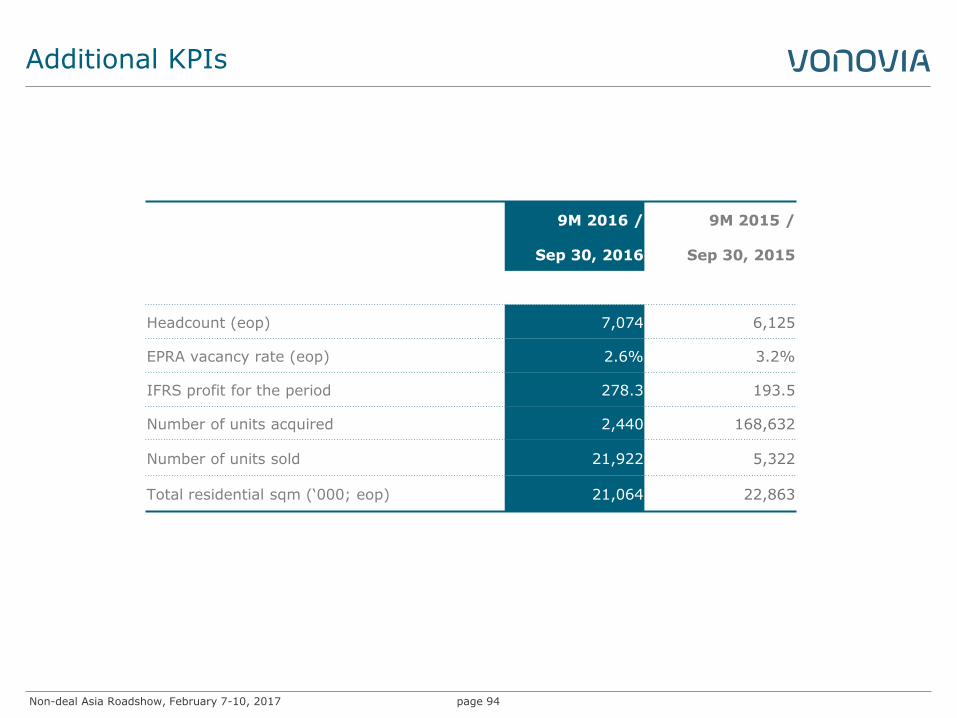
Non-deal Asia Roadshow, February 7-10, 2017
Additional KPIs
page 94
9M 2016 / 9M 2015 /
Sep 30, 2016 Sep 30, 2015
Headcount (eop) 7,074 6,125
EPRA vacancy rate (eop) 2.6% 3.2%
IFRS profit for the period 278.3 193.5
Number of units acquired 2,440 168,632
Number of units sold 21,922 5,322
Total residential sqm (‘000; eop) 21,064 22,863
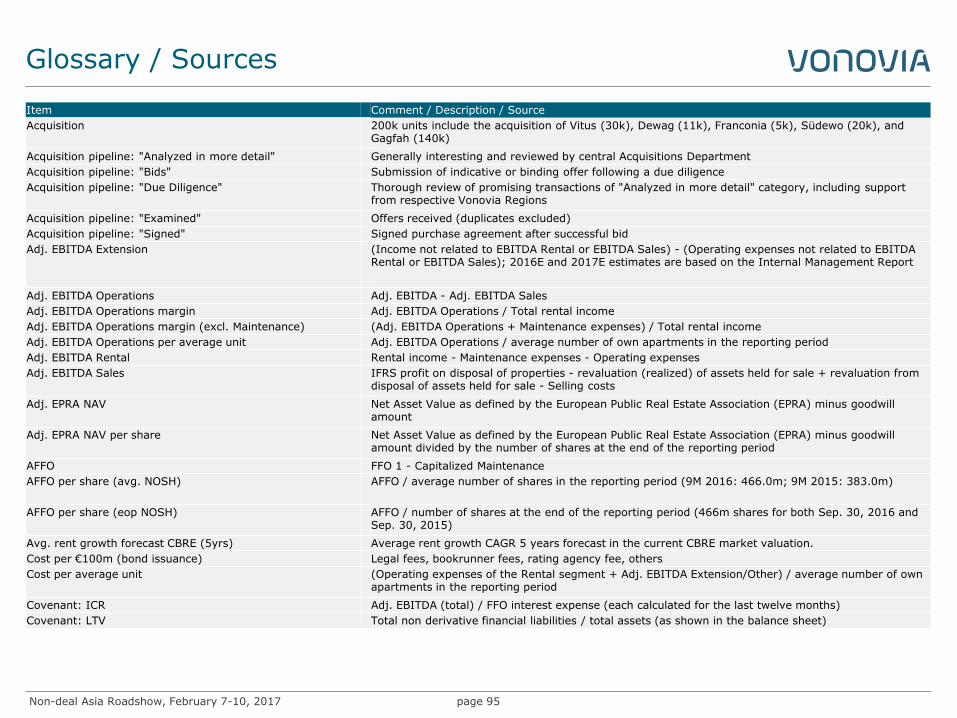
Non-deal Asia Roadshow, February 7-10, 2017
Glossary / Sources
page 95
Item Comment / Description / Source
Acquisition 200k units include the acquisition of Vitus (30k), Dewag (11k), Franconia (5k), Südewo (20k), and Gagfah (140k)
Acquisition pipeline: "Analyzed in more detail" Generally interesting and reviewed by central Acquisitions Department
Acquisition pipeline: "Bids" Submission of indicative or binding offer following a due diligence
Acquisition pipeline: "Due Diligence" Thorough review of promising transactions of "Analyzed in more detail" category, including support from respective Vonovia Regions
Acquisition pipeline: "Examined" Offers received (duplicates excluded)
Acquisition pipeline: "Signed" Signed purchase agreement after successful bid
Adj. EBITDA Extension (Income not related to EBITDA Rental or EBITDA Sales) - (Operating expenses not related to EBITDA Rental or EBITDA Sales); 2016E and 2017E estimates are based on the Internal Management Report
Adj. EBITDA Operations Adj. EBITDA - Adj. EBITDA Sales
Adj. EBITDA Operations margin Adj. EBITDA Operations / Total rental income
Adj. EBITDA Operations margin (excl. Maintenance) (Adj. EBITDA Operations + Maintenance expenses) / Total rental income
Adj. EBITDA Operations per average unit Adj. EBITDA Operations / average number of own apartments in the reporting period
Adj. EBITDA Rental Rental income - Maintenance expenses - Operating expenses
Adj. EBITDA Sales IFRS profit on disposal of properties - revaluation (realized) of assets held for sale + revaluation from disposal of assets held for sale - Selling costs
Adj. EPRA NAV Net Asset Value as defined by the European Public Real Estate Association (EPRA) minus goodwill amount
Adj. EPRA NAV per share Net Asset Value as defined by the European Public Real Estate Association (EPRA) minus goodwill amount divided by the number of shares at the end of the reporting period
AFFO FFO 1 - Capitalized Maintenance
AFFO per share (avg. NOSH) AFFO / average number of shares in the reporting period (9M 2016: 466.0m; 9M 2015: 383.0m)
AFFO per share (eop NOSH) AFFO / number of shares at the end of the reporting period (466m shares for both Sep. 30, 2016 and Sep. 30, 2015)
Avg. rent growth forecast CBRE (5yrs) Average rent growth CAGR 5 years forecast in the current CBRE market valuation.
Cost per €100m (bond issuance) Legal fees, bookrunner fees, rating agency fee, others
Cost per average unit (Operating expenses of the Rental segment + Adj. EBITDA Extension/Other) / average number of own apartments in the reporting period
Covenant: ICR Adj. EBITDA (total) / FFO interest expense (each calculated for the last twelve months)
Covenant: LTV Total non derivative financial liabilities / total assets (as shown in the balance sheet)
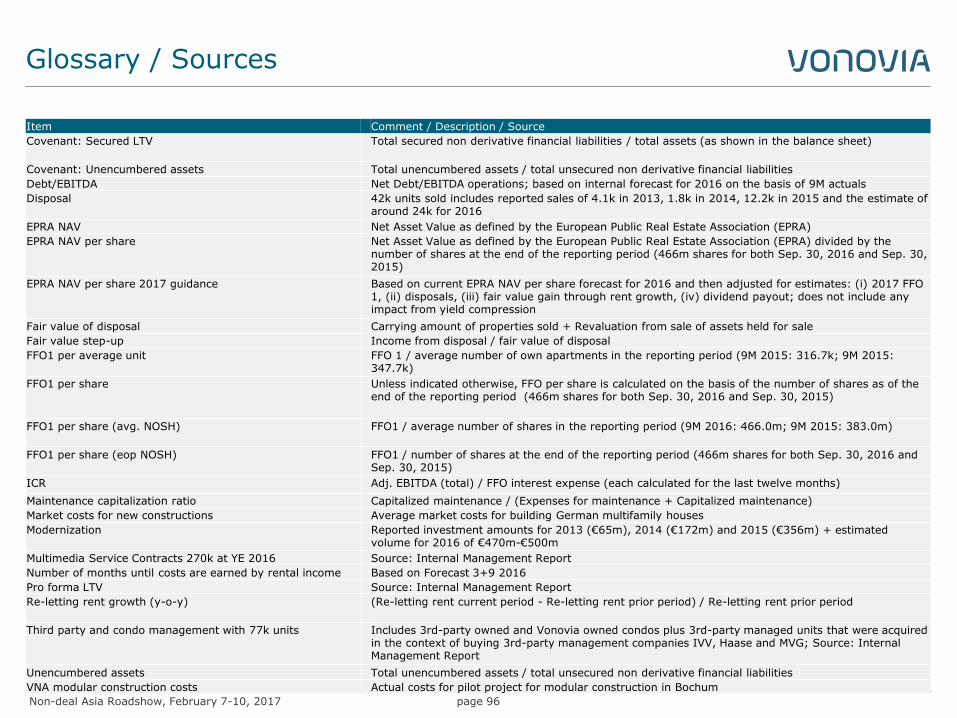
Non-deal Asia Roadshow, February 7-10, 2017
Glossary / Sources
page 96
Item Comment / Description / Source
Covenant: Secured LTV Total secured non derivative financial liabilities / total assets (as shown in the balance sheet)
Covenant: Unencumbered assets Total unencumbered assets / total unsecured non derivative financial liabilities
Debt/EBITDA Net Debt/EBITDA operations; based on internal forecast for 2016 on the basis of 9M actuals
Disposal 42k units sold includes reported sales of 4.1k in 2013, 1.8k in 2014, 12.2k in 2015 and the estimate of around 24k for 2016
EPRA NAV Net Asset Value as defined by the European Public Real Estate Association (EPRA)
EPRA NAV per share Net Asset Value as defined by the European Public Real Estate Association (EPRA) divided by the number of shares at the end of the reporting period (466m shares for both Sep. 30, 2016 and Sep. 30, 2015)
EPRA NAV per share 2017 guidance Based on current EPRA NAV per share forecast for 2016 and then adjusted for estimates: (i) 2017 FFO 1, (ii) disposals, (iii) fair value gain through rent growth, (iv) dividend payout; does not include any impact from yield compression
Fair value of disposal Carrying amount of properties sold + Revaluation from sale of assets held for sale
Fair value step-up Income from disposal / fair value of disposal
FFO1 per average unit FFO 1 / average number of own apartments in the reporting period (9M 2015: 316.7k; 9M 2015: 347.7k)
FFO1 per share Unless indicated otherwise, FFO per share is calculated on the basis of the number of shares as of the end of the reporting period (466m shares for both Sep. 30, 2016 and Sep. 30, 2015)
FFO1 per share (avg. NOSH) FFO1 / average number of shares in the reporting period (9M 2016: 466.0m; 9M 2015: 383.0m)
FFO1 per share (eop NOSH) FFO1 / number of shares at the end of the reporting period (466m shares for both Sep. 30, 2016 and Sep. 30, 2015)
ICR Adj. EBITDA (total) / FFO interest expense (each calculated for the last twelve months)
Maintenance capitalization ratio Capitalized maintenance / (Expenses for maintenance + Capitalized maintenance)
Market costs for new constructions Average market costs for building German multifamily houses
Modernization Reported investment amounts for 2013 (€65m), 2014 (€172m) and 2015 (€356m) + estimated volume for 2016 of €470m-€500m
Multimedia Service Contracts 270k at YE 2016 Source: Internal Management Report
Number of months until costs are earned by rental income Based on Forecast 3+9 2016
Pro forma LTV Source: Internal Management Report
Re-letting rent growth (y-o-y) (Re-letting rent current period - Re-letting rent prior period) / Re-letting rent prior period
Third party and condo management with 77k units Includes 3rd-party owned and Vonovia owned condos plus 3rd-party managed units that were acquired in the context of buying 3rd-party management companies IVV, Haase and MVG; Source: Internal Management Report
Unencumbered assets Total unencumbered assets / total unsecured non derivative financial liabilities
VNA modular construction costs Actual costs for pilot project for modular construction in Bochum
Non-deal Asia Roadshow, February 7-10, 2017
Disclaimer
page 97
This presentation has been specifically prepared by Vonovia SE and/or its affiliates (together, “Vonovia”) for internal use. Consequently, it may not be sufficient or appropriate for the purpose for which a third party might use it.
This presentation has been provided for information purposes only and is being circulated on a confidential basis. This presentation shall be used only in accordance with applicable law, e.g. regarding national and international insider dealing rules, and must not be distributed, published or reproduced, in whole or in part, nor may its contents be disclosed by the recipient to any other person. Receipt of this presentation constitutes an express agreement to be bound by such confidentiality and the other terms set out herein.
This presentation includes statements, estimates, opinions and projections with respect to anticipated future performance of Vonovia ("forward-looking statements") which reflect various assumptions concerning anticipated results taken from DA’s current business plan or from public sources which have not been independently verified or assessed by Vonovia and which may or may not prove to be correct. Any forward-looking statements reflect current expectations based on the current business plan and various other assumptions and involve significant risks and uncertainties and should not be read as guarantees of future performance or results and will not necessarily be accurate indications of whether or not such results will be achieved. Any forward-looking statements only speak as at the date the presentation is provided to the recipient. It is up to the recipient of this presentation to make its own assessment of the validity of any forward-looking statements and assumptions and no liability is accepted by Vonovia in respect of the achievement of such forward-looking statements and assumptions.
Vonovia accepts no liability whatsoever to the extent permitted by applicable law for any direct, indirect or consequential loss or penalty arising from any use of this presentation, its contents or preparation or otherwise in connection with it.
No representation or warranty (whether express or implied) is given in respect of any information in this presentation or that this presentation is suitable for the recipient’s purposes. The delivery of this presentation does not imply that the information herein is correct as at any time subsequent to the date hereof.
Vonovia has no obligation whatsoever to update or revise any of the information, forward-looking statements or the conclusions contained herein or to reflect new events or circumstances or to correct any inaccuracies which may become apparent subsequent to the date hereof.
This presentation does not, and is not intended to, constitute or form part of, and should not be construed as, an offer to sell, or a solicitation of an offer to purchase, subscribe for or otherwise acquire, any securities of the Company nor shall it or any part of it form the basis of or be relied upon in connection with or act as any inducement to enter into any contract or commitment or investment decision whatsoever.
This presentation is neither an advertisement nor a prospectus and is made available on the express understanding that it does not contain all information that may be required to evaluate, and will not be used by the attendees/recipients in connection with, the purchase of or investment in any securities of the Company. This presentation is selective in nature and does not purport to contain all information that may be required to evaluate the Company and/or its securities. No reliance may or should be placed for any purpose whatsoever on the information contained in this presentation, or on its completeness, accuracy or fairness.
This presentation is not directed to or intended for distribution to or use by, any person or entity that is a citizen or resident or located in any locality, state, country or other jurisdiction where such distribution, publication, availability or use would be contrary to law or regulation or which would require any registration or licensing within such jurisdiction.
Neither this presentation nor the information contained in it may be taken, transmitted or distributed directly or indirectly into or within the United States, its territories or possessions. This presentation is not an offer of securities for sale in the United States. The securities of the Company have not been and will not be registered under the US Securities Act of 1933, as amended (the “Securities Act”) or with any securities regulatory authority of any state or other jurisdiction of the United States. Consequently, the securities of the Company may not be offered, sold, resold, transferred, delivered or distributed, directly or indirectly, into or within in the United States except pursuant to an exemption from, or in a transaction not subject to, the registration requirements of the Securities Act and in compliance with any applicable securities laws of any state or other jurisdiction of the United States unless registered under the Securities Act.
Tables and diagrams may include rounding effects.
Non-deal Asia Roadshow, February 7-10, 2017
For Your Notes
page 98

Non-deal Asia Roadshow, February 7-10, 2017
For Your Notes
page 99