Embed Size (px)
Citation preview
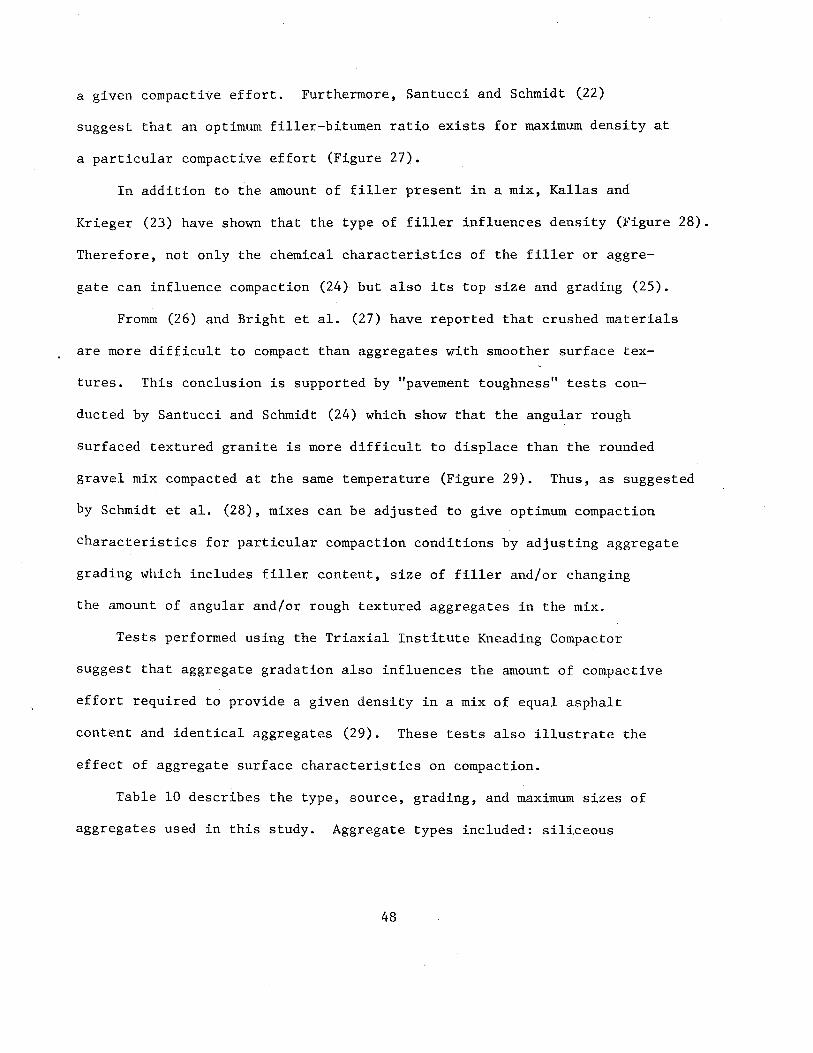
COMPACTION OF ASPHALT CONCRETE PAVEMENTS
By
Jon A. Epps Engineering Research Associate
Bob M. Gallaway Research Engineer
William J. Harper Formerly Assistant Research Engineer
William W. Scott, Jr. Research Assistant
and
Jeff W. Seay Supervising Field Engineer
Research Report 90-2F Research Study Number 2-6-65-90
Sponsored By
The Texas Highway Department
in cooperation with the
U. S. Department of Transportation Federal Highway Administration
Bureau of Public Roads
July, 1969
TEXAS TRANSPORTATION INSTITUTE Texas A&M University
College Station, Texas
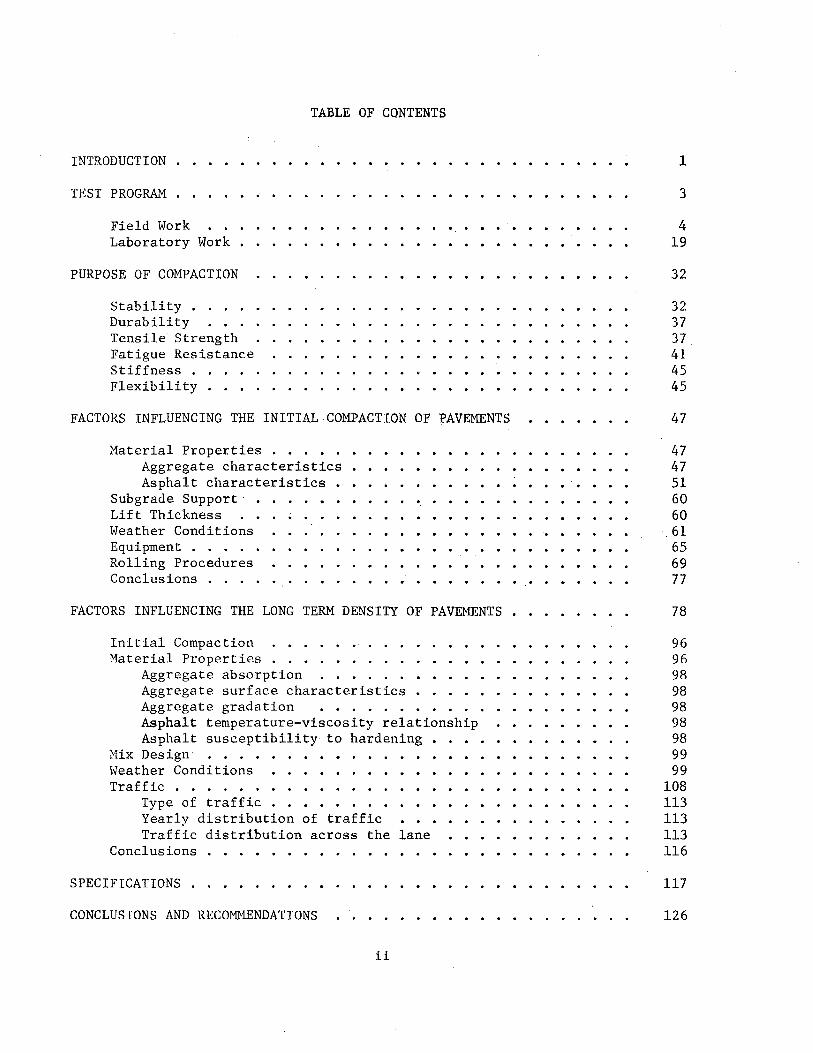
TABLE OF CONTENTS
INTRODUCTION .
TEST PROGRAM
Field Work Laboratory Work .
PURPOSE OF COHPACTION
Stability . . . . Durability Tensile Strength Fatigue Resistance Stiffness . Flexibility . . . .
FACTORS INFLUENCING THE INITIAL.COHPACTION OF PAVEMENTS
Haterial Properties . . . • . Aggregate characteristics • . Asphalt characteristics •
Subgrade Support Lift Thickness Weather Conditions Equipment . . . . . Rolling Procedures Conclusions . . . • .
FACTORS INFLUENCING THE LONG TERH DENSITY OF PAVEHENTS
Initial Compaction Haterial Properties
Aggregate absorption Aggregate surface characteristics . Aggregate gradation • . . . . . Asphalt temperature-viscosity relationship Asphalt susceptibility to hardening •
Hix Design . . . . . . • • . • • • • • Weather Conditions Traffic . • . . • . . . . . •
Type of traffic • • • . . Yearly distribution of traffic Traffic distribution across the lane
Conclusions
SPECIFICATIONS .
CONCLUSIONS AND RECOMHENDATIONS
ii
1
3
4 19
32
32 37 37 41 45 45
47
47 47 51 60 60
. 61 65 69 77
78
96 96 98 98 98 98 98 99 99
108 113 113 113 116
117
126
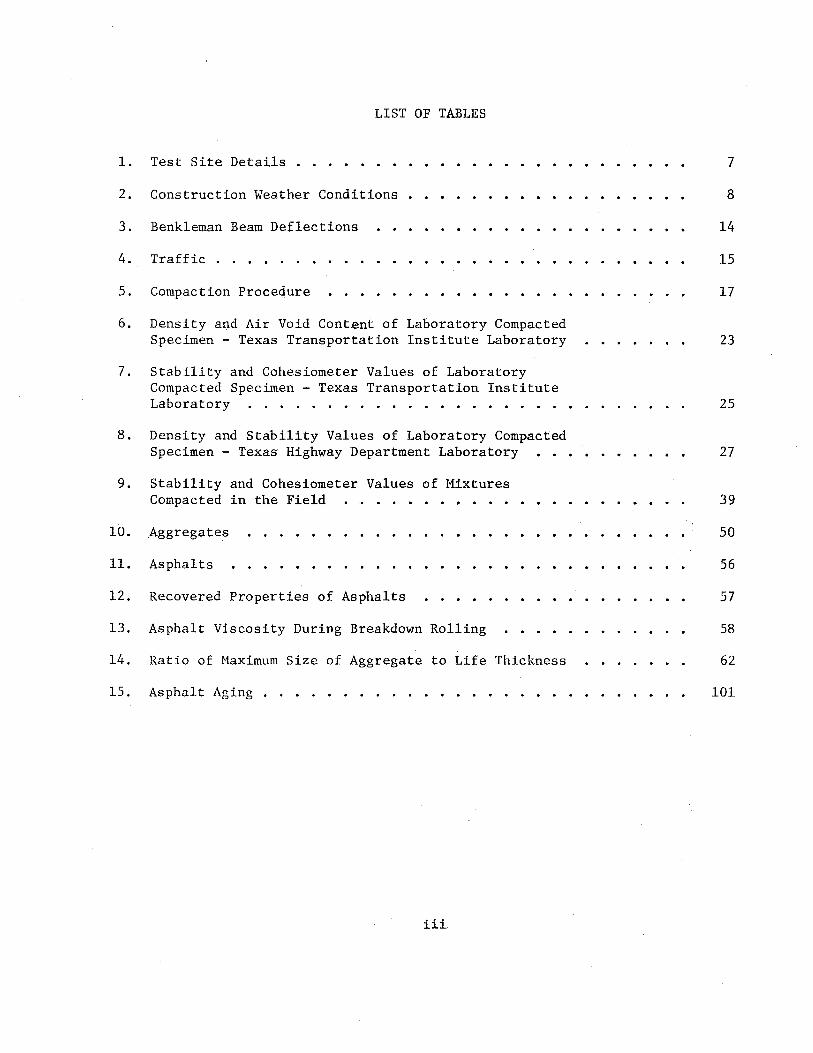
LIST OF TABLES
1. Test Site Details . . . • . • • •
2. Construction Weather Conditions •
3. Benkleman Beam Deflections
4. Traffic .
5. Compaction Procedure
6.
7.
8.
Density and Air Void Content of Laboratory Compacted Specimen - Texas Transportation Institute Laboratory
Stability and Cohesiometer Values of Laboratory Compacted Specimen - Texas Transportation Institute Laboratory . . . • • . • . • . • . • • . • . . • •
Density and Stability Values of Laboratory Compacted Specimen - Texas Highway Department Laboratory
9. Stability and Cohesiometer Values of Mixtures Compacted in the Field
10. Aggregates
11. Asphalts
12. Recovered Properties of Asphalts
13. Asphalt Viscosity During Breakdown Rolling
14. Ratio of Maximum Size of Aggregate to Life Thickness
15. Asphalt Aging . . • .
iii
7
8
14
15
17
23
25
27
39
50
56
57
58
62
101
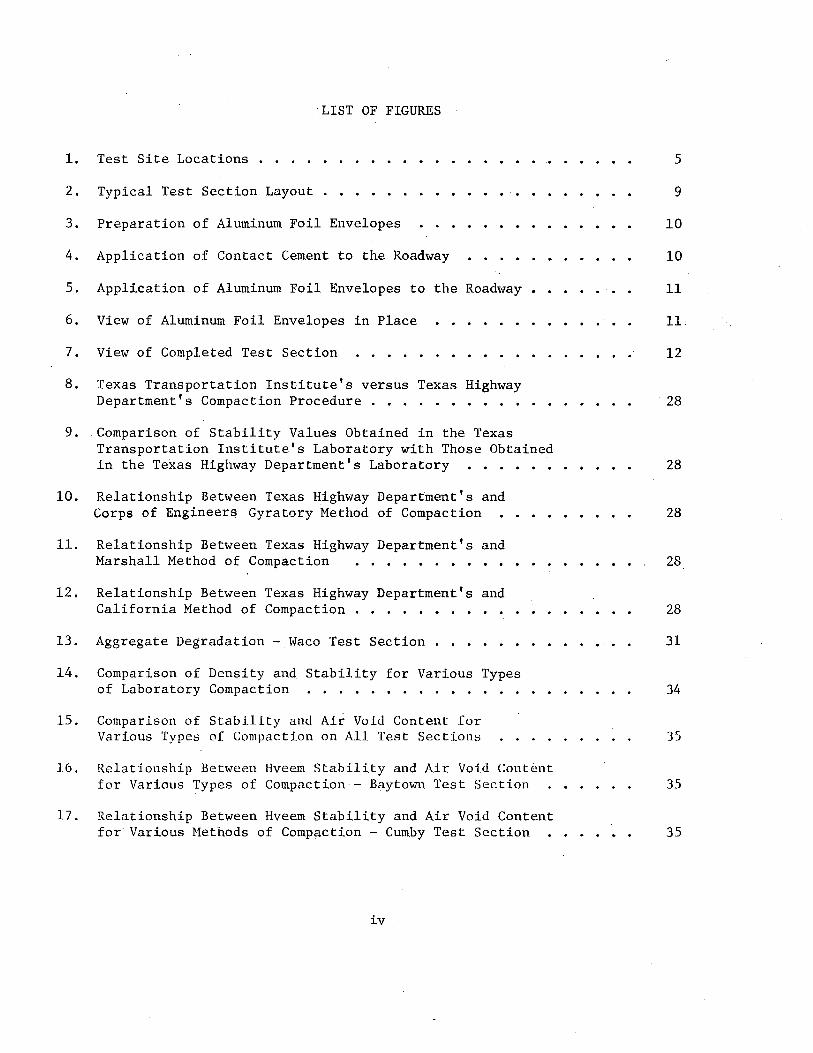
·LIST OF FIGURES
1. Test Site Locations • • • .
2. Typical Test Section Layout •
3. Preparation of Aluminum Foil Envelopes
4. Application of Contact Cement to the Roadway
5. Application of Aluminum Foil Envelopes to the Roadway •
6. View of Aluminum Foil Envelopes in Place
7.
8.
9.
10.
11.
View of Completed Test Section
Texas Transportation Institute's versus Texas Highway Department's Compaction Procedure . • • . ••.
Comparison of Stability Values Obtained in the Texas Transportation Institute's Laboratory with Those Obtained in the Texas Highway Department's Laboratory ·
Relationship Between Texas Highway Department's and Corps of Engineers Gyratory Method of Compaction
Relationship Between Texas Highway Department's and Marshall Method of Compaction • • • • • • • •
12. Relationship Between Texas Highway Department's and California Method of Compaction • • . • • • • • • • • •
13. Aggregate Degradation - Waco Test Section •
14.
15.
Comparison of Density and Stability for Various Types of Laboratory Compaction • • • . •
Comparison of Stability and Air Void Content for Various Types of Compaction on All Test Sections
16. Relationship Between Hveem Stability and Air Void Content
5
9
10
10
11
11
12
28
28
28
28
28
31
34
35
for Various Types of Compaction - Bayto~1 Test Section 35
17. Relationship Between Hveem Stability and Air Void Content for Various Methods of Compaction - Cumby Test Section • • • . • . 35
iv
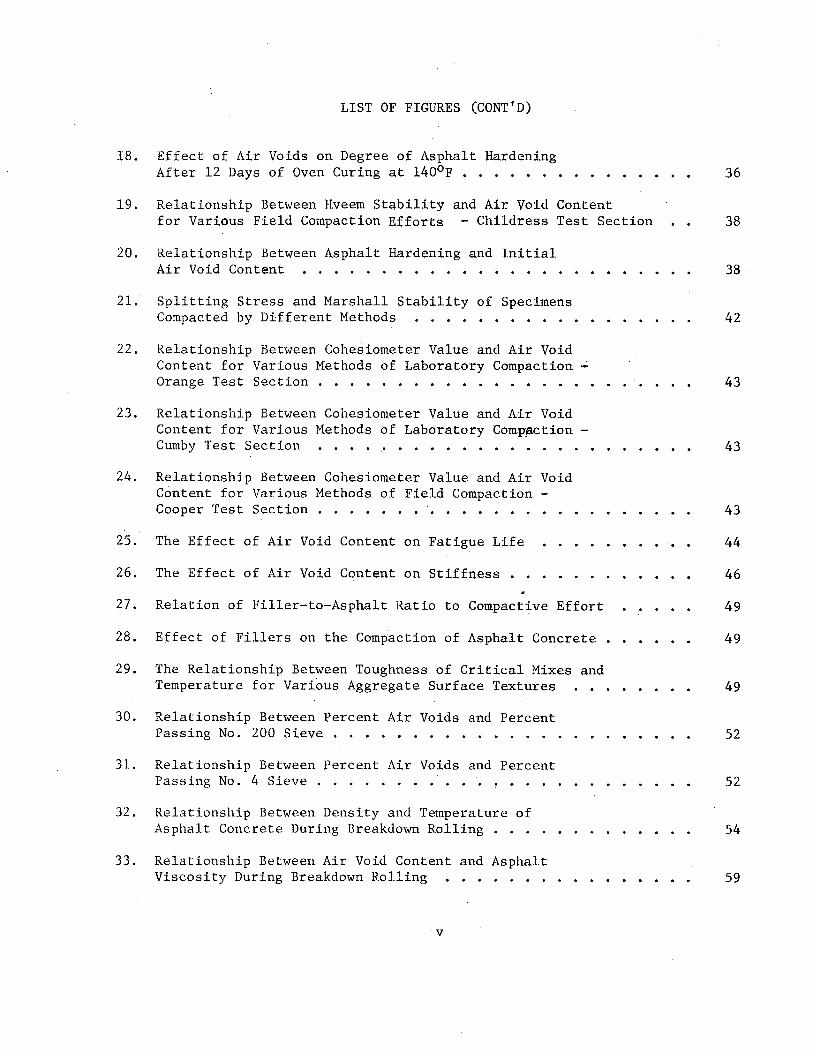
LIST OF FIGURES (CONT'D)
18. Effect of Air Voids on Degree of Asphalt Hardening After 12 Days of Oven Curing at 140°F • • • • • • •
19. Relationship Between Hveem Stability and Air Void Content
20.
21.
22.
23.
for Various Field Compaction Efforts - Childress Test Section
Relationship Between Asphalt Hardening and Initial Air Void Content • • • • . . • • • • • • • • • . • •
Splitting Stress and Marshall Stability of Specimens Compacted by Different Methods • . • •
Relationship Between Cohesiometer Value and Air Void Content for Various Methods of Laboratory Compaction -Orange Test Section . • . . . • •
Relationship Between Cohesiometer Value and Air Void Content for Various Methods of Laboratory Com.p_action -Cumby Test Section • • • . • • .
24. Relationship Between Cohesiometer Value and Air Void Content for Various Methods of Field Compaction -Cooper Test Section • • • • • • • • • • •
25. The Effect of Air Void Content on Fatigue Life
26. The Effect of Air Void Content on Stiffness •••
27.
28.
29.
30.
31.
32.
33.
Relation of Filler-to-Asphalt Ratio to Compactive Effort
Effect of Fillers on the Compaction of Asphalt Concrete •
The Relationship Between Toughness of Critical Mixes and Temperature for Various Aggregate Surface Textures
Relationship Between Percent Air Voids and Percent Passing No. 200 Sieve ..•••••.•••••.•
Relationship Between Percent Air Voids and Percent Passing No. 4 Sieve .......•••• ~ •.
Relationship Between Density and Temperature of Asphalt Concrete During Breakdown Rolling
Relationship Between Air Void Content and Asphalt Viscosity During Breakdown Rolling • • • • . • .
v
36
38
38
42
43
43
43
44
46
49
49
49
52
52
54
59
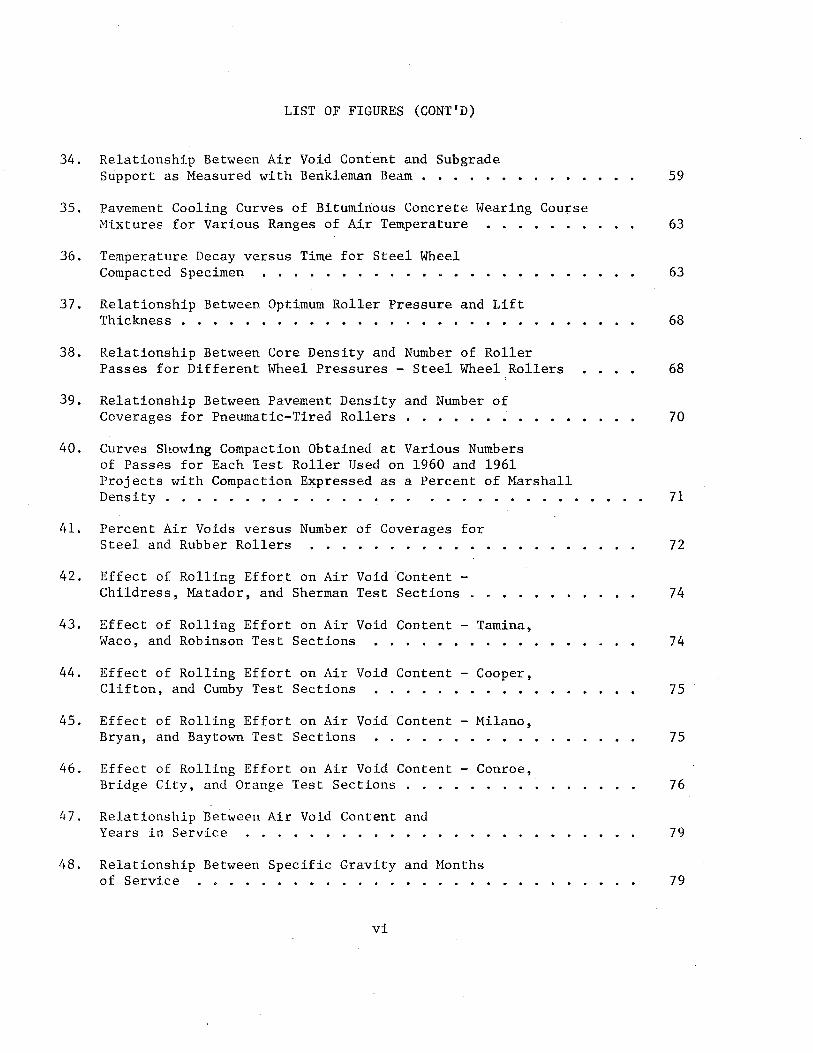
34.
LIST OF FIGURES (CONT'D)
Relationship Between Air Void Content and Subgrade Support as Measured with Benkleman Beam • • • . • •
35. Pavement Cooling Curves of Bituminous Concrete Wearing Course Mixtures for Various Ranges of Air Temperature • • • • • • •
36.
37.
Temperature Decay versus Time for Steel Wheel Compacted Specimen • • . • .
Relationship Bet\veen Optimum Roller Pressure and Lift Thickness • . • . • • • • • • • • • • . • • . •
38. Relationship Between Core Density and Number of Roller Passes for Different Wheel Pressures - Steel Wheel Rollers
39.
40.
41.
42.
43.
44.
45.
46.
47.
48.
Relationship Between Pavement Density and Number of Coverages for Pneumatic-Tired Rollers
Curves Showing Compaction Obtained at Various Numbers of Passes for Each Test Roller Used on 1960 and 1961 Projects with Compaction Expressed as a Percent of Marshall Density • . • • . • . • • • • • • • . • •
Percent Air Voids versus Number of Coverages for Steel and Rubber Rollers • • • • • • • . •
Effect of Rolling Effort on Air Void Content -Childress, Matador, and Sherman Test Sections "
Effect of Rolling Effort on Air Void Content - Tamina, Waco, and Robinson Test Sections • • • . • • • • . • •
Effect of Rolling Effort on Air Void Content - Cooper, Clifton, and Cumby Test Sections •••••••••••
Effect of Rolling Effort on Air Void Content - Milano, Bryan, and Baytown Test Sect ions • . • • • • • . • • •
Effect of Rolling Effort on Air Void Content - Conroe, Bridge City, and Orange Test Sections ••....•
Relationship Between Air Void Content and Years in Service . • . • • • • • . •
Relationship Between Specific Gravity and Months of Service • • . . . • . • . • . . • • • • •
vi
59
63
63
68
68
70
71
72
74
74
75
75
76
79
79
LSIT OF FIGURES (CONT'D).
49. Relationship Between Air Void Content and Years of Service by Wheel path . . . . . . . . . . . . . . . . . . . . . 80
50. Air Void Content with Time at Various Locations in the Pavement - Childress Test Section . . . . . . . . . . . . . . . 81
51. Air Void Content with Time at Various Locations in the Pavement - Matador Test Section . . . . . . . . . . . . . . . . 81
52. Air Void Content with Time at Various Locations in the Pavement - Sherman Test Section . . . . . . . . . . . . . . . . 82
53. Air Void Content with Time at Various Locations in the Pavement - Cooper Test Section . . . . . . . . . . . . . . . . . 82
54. Air Void Content with Time at Various Locations in the Pavement - Cumby Test Section . . . . . . . . . . . . . . . . . 83
55. Air Void Content with Time at Var.ious Locations in the Pavement - Clifton Test Section . . . . . . . . . . . . . . . . 83
56. Air Void Content with Time at Various Locations in the Pavement - Waco Test Section . . . . . . . . . . . . . . . . . . 84
57. Air Void Content with Time at Various Locations in the Pavement - Robinson Test Section . . . . . . . . . . . . . . . . 84
58. Air Void Content with Time at Various Locations in the Pavement - Milano Test Section . . . . . . . . . . . . . . . . . 85
59. Air Void Content with Time at Various Locations in the Pavement - Bryan Test Section . . . . . . . . . . . . . . . . . 85
60. Air Void Content with Time at Various Locations in the Pavement - Tamina Test Section . . . . . . . . . . . . . . . . . 86
61. Air Void Content with Time at Various Locations in the Pavement - Conroe Test Section . . . . . . . . . . . . . . . . . 86
62. Air Void Content with Time at Various Locations in the Pavement - Baytown Test Section . . . . . . . . . . . . . . . . 87
63. Air Void Content with Time at Various Locations in the Pavement - Orange Test Section . . . . . . . . . . . . . . . . . 87
vii
64.
65.
66.
67.
68.
69.
70.
71.
72.
73.
74.
75.
76.
LIST OF FIGURES (CONT'D)
Air Void Content with Time at Various Locations in the Pavement - Bridge City Test Section . • • • •
Air Void Content with Time for Various Compactive Efforts - Childress Test Section . • . • • • • •
Air Void Content with Time for Various Compactive Efforts - Matador Test Section . . . . . . . . . Air Void Content with Time for Various Compactive Efforts - Sherman Test Section . . . . . . . . . Air Void Content with Time for Various Compactive Efforts - Cooper Test Section . . . . . . . . . . Air Void Content with Time for Various Compactive Efforts - Cumby Test Section • . • • • • • • • .
Air Void Content with Time for Various Compactive Efforts - Clifton Test Section • • • • • • . • •
Air Void Content with Time for Various Compactive Efforts - Haco Test Section . . • . • • • • • . •
Air Void Content with Time for Various Compactive Efforts - Robinson Test Section • • • . • • • • •
Air Void Content with Time for Various Compactive Efforts - Milano Test Section . • . • • • • • . •
Air Void Content with Time for Various Compactive Efforts - Bryan Test Section • • • • . • • • • •
Air Void Content with Time for Various Compactive Efforts - Tamina Test Section . . . . . . . . . . Air Void Content with Time for Various Compactive Efforts - Conroe Test Section . . . . . . . . . .
77. Air Void Content with Time for Various Compactive
78.
79.
Efforts - Baytown Test Section
Air Void Content with Time for Various Compactive Efforts - Orange Test Section . . • • • . • • • .
Air Void Content with Time for Various Compactive Efforts - Bridge City Test Section • • • . •
viii
88
88
. . . . . . . . . 89
. . . . . . . . . 89
. . . . . . . . . 90
90
91
91
92
92
93
. . . . . . . . . 93
. . . . . . . . . 94
94
95
95
LIST OF FIGURES (CONT'D)
80. Density Change as A Function of Initial Compaction
81. Effects of Air Void Content on Hardening During 36 Months of Service .
82. Effect of Aging Time on Viscosity Ratio •
83. Asphalt Hardening in Several Midwestern Pavements .
84.
85.
Relationship Between Decrease in Air Void Content and Asphalt Viscosity . . . . • . • . • . • •
Seasonal Variation in Temperature Robinson, Sherman, and Milano • • .
Childress,
86. Seasonal Variation in Temperature Matador, Cooper, Cumby
87. Seasonal Variation in Temperature Clifton and Waco
88. Seasonal Variation in Temperature Bryan, Conroe, and Baytown . . . . . . . . . . . . . . . . . . . . . . .
89. Seasonal Variation in Temperature - Orange, Tamina, and Bridge City . . . . • . • . • • • • • . • • • .
90. Daily Temperature Variations - Childress and Matador
91. Daily Temperature Variations - Sherman, Cooper, and Cumby
92. Daily Temperature Variations - Clifton, Robinson, and Waco
93. Daily Temperature Variation - Milano and Bryan
94. Daily Temperature Variations - Tamina, Conroe, and Baytown
95. Daily Temperature Variations - Orange and Bridge City
96. Densification of a Pavement with Time as Measured with a Hater Permeability Apparatus . .
97
100
100
100
103
103
103
104
. . . . . 104
104
106
106
106
106
107
107
109
97. Density and Void Trends Demonstrated on the MSHO Road Test 110
98. Percent Compaction Versus Age for Various Contact Pressures at Optimum Number of Passes of Pneumatic Roller • . • • • 111
ix
LIST OF FIGURES (CONT'D)
99. Relationship Between Increase in Density and Traffic During Two Years of Service . • . . • • •
100. Load Positions and Traffic Distributions
101. Schematic Diagram of Air Permeability Apparatus •
102. Relationship Between Air Flow Rates and Pavement Density
103. Relationship Between Air Voids and Water Permeability ••
104. Cumulative Frequency - Relative Density •
105. Relationship Between Laboratory and Field Air Void Content . . . . . • . • . • • •
106. Factors Influencing Compaction of Asphalt Concrete Pavements . • . . . . • . • . • . . . . . • • • . •
X
112
114
120
121
122
124
125
129
APPENDICES
Appendix A Percent Air Voids in ?avements at Various Ages 1.37
Appendix B Aggregate Gradation Curves Showing Degradation with Time . . . . . . . . . . • . . . . . 140
Appendix C Laboratory and Field Density Comparisons 147
Disclaimer
The op~n~ons, findings, and conclusions expressed in this report are those of the authors and not necessar~ly those of the Bureau of Public Roads.
xi

INTRODUCTION
The importance of proper compaction of asphalt pavements has been
recognized for many years. Investigators have shown that pavement sta
bility, durability, tensile strength, fatigue resistance, stiffness, and
flexibility are controlled to a certain degree by the density of asphalt
concrete.
To insure adequate compaction several agencies specify "in,....place"
density requirements. These in-place requirements are commonly expressed
as a percent of a standard laboratory compaction density. Laboratory
tests are intended to give the engineer needed information about the
density of the ~urfacing material as it ultimately appears on the roadway.
However, there is evidence that an increasing number of asphalt concrete
pavements in Texas as well as other states are not stabilizing at a
density equal to that obtained in the laboratory design of a companion
paving mixture.
The reasons for this unpredictable behavior are probably many and
complex. In an attempt to define more adequately the variables that may
affect the long term density of a pavement, fifteen test sites were
selected throughout the state of Texas, and compaction data were collected
over a three-year span, covering a maximum life span of two years for any
individual pavement. The results of this study are presented herein.
For the sake of simplicity in reporting the results of this study,
the long term compaction has been separated into initial compaction or
that which occurs during the construction of the pavement while the asphalt
concrete is at an elevated temperature, and long term compaction. The
1
latter compaction is considered to be due to the action of traffic and
environment, and takes place after initial compaction has occurred.
Furthermore, the data collected during the laboratory phase of the project
have been separated from the data collected during the field phase of
the project. Detailed results will be presented in each section of the
report together with a brief literature review.
2
TEST PROGRAM
The test program can be conveniently separated into laboratory and
field work. Laboratory compaction data were obtained on the paving
mixtures obtained from fifteen full scale field test sites. For compari
son purposes, similar measurements were made by the Texas Highway
Department district laboratories.
The field work included site selection, preparation and placing of
the test section, and regular sampling of the fifteen test sections.
As a result of the above mentioned laboratory and field data, com
parisons have been made which suggest that the rate and amount of den
sification of a surface course of asphalt concrete is dependent upon a
complex set of vari&bles that cannot be easily separated.
3
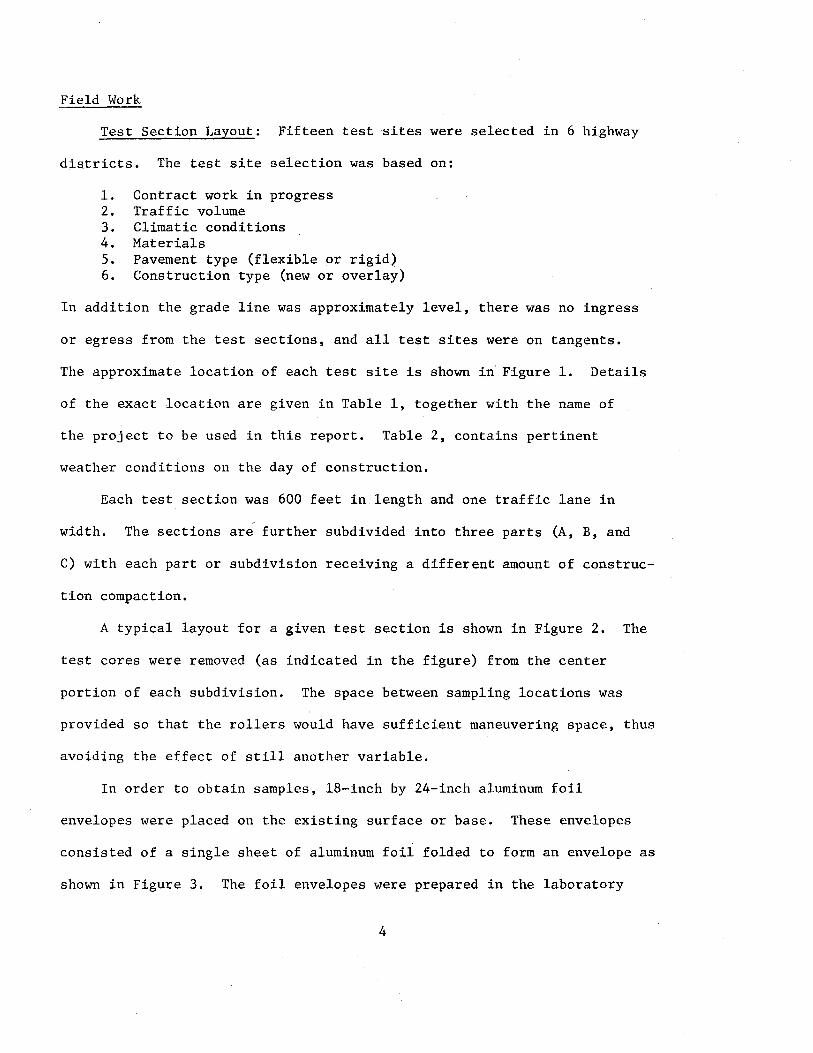
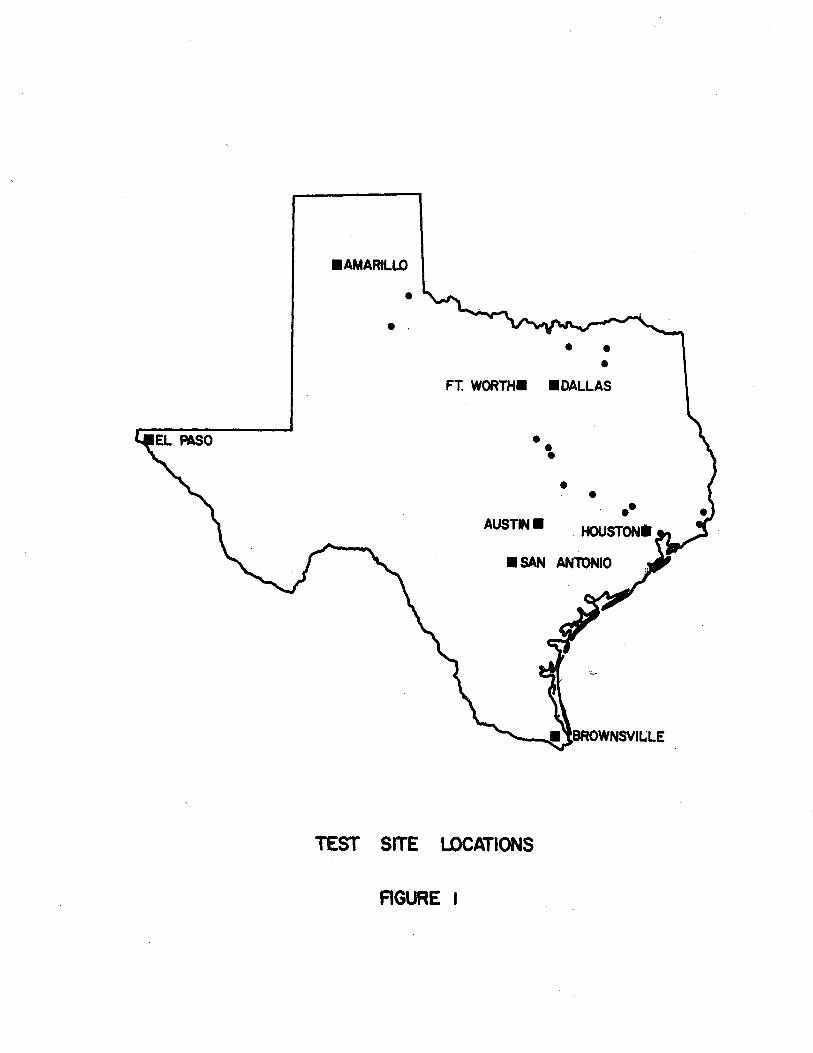
Field Work
Test Section Layout: Fifteen test sites were selected in 6 highway
districts. The test site selection was based on:
1. Contract work in progress 2. Traffic volume 3. Climatic conditions 4. Materials 5. Pavement type (flexible or rigid) 6. Construction type (new or overlay)
In addition the grade line was approximately level, there was no ingress
or egress from the test sections, and all test sites were on tangents.
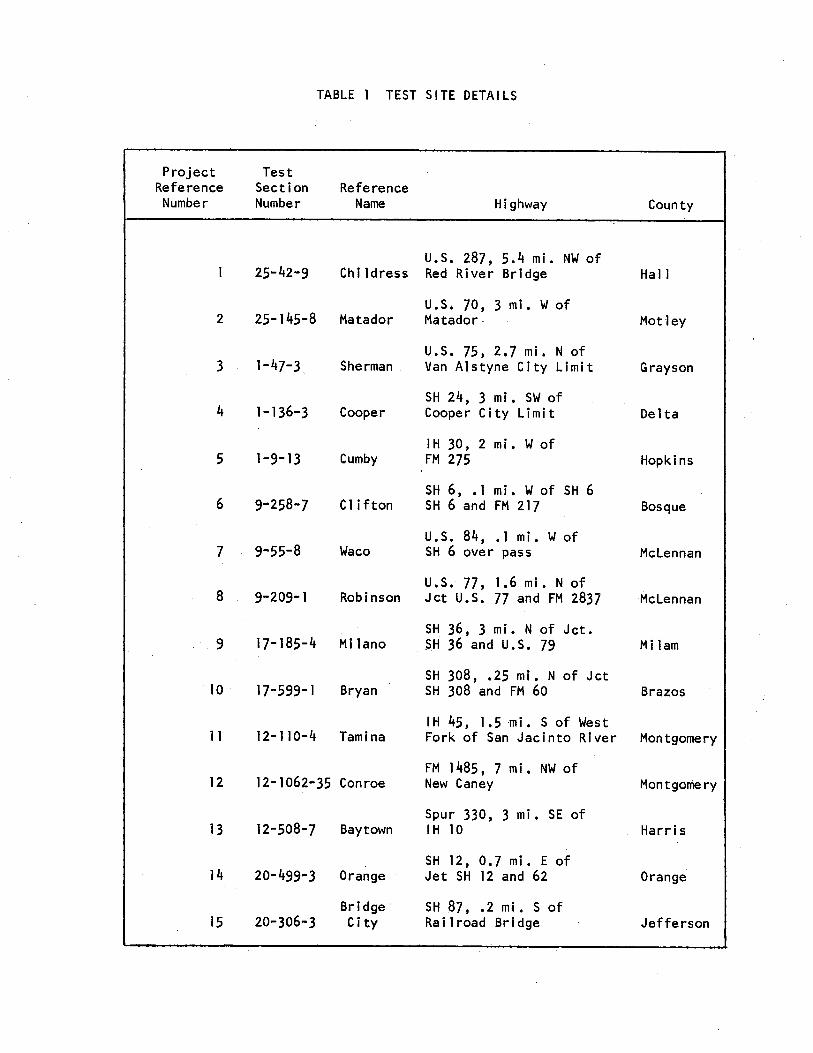
The approximate location of each test site is shown in Figure 1. Details
of the exact location are given in Table 1, together with the name of
the project to be used in this report. Table 2, contains pertinent
weather conditions on the day of construction.
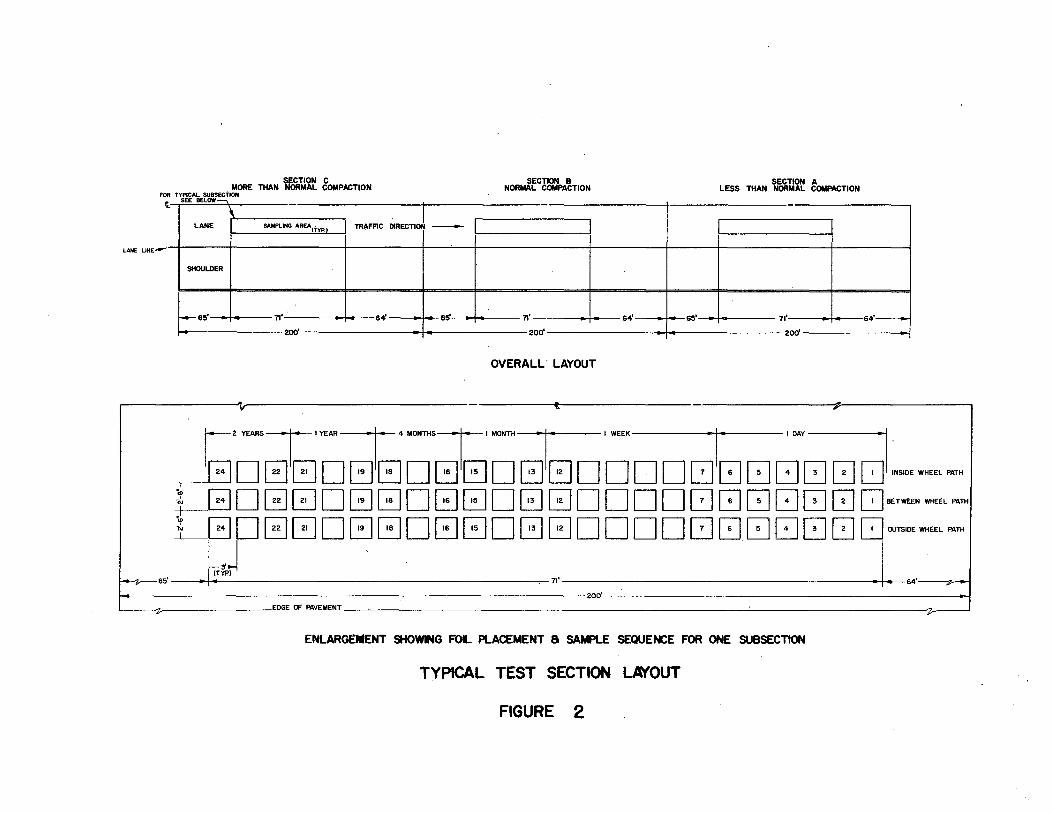
Each test section was 600 feet in length and one traffic lane in
width. The sections are further subdivided into three parts (A, B, and
C) with each part or subdivision receiving a different amount of construe-
tion compaction.
A typical layout for a given test section is shown in Figure 2. The
test cores were removed (as indicated in the figure) from the center
portion of each subdivision. The space between sampling locations was
provided so that the rollers would have sufficient maneuvering space, thus
avoiding the effect of still another variable.
In order to obtain samples, 18-inch by 24-inch aluminum foil
envelopes were placed on the existing surface or base. These envelopes
consisted of a single sheet of aluminum foil folded to form an envelope as
shown in Figure 3. The foil envelopes were prepared in the laboratory
4
•AMARILLO
• . ' • •
• FT. WORTH• •DALLAS
• \ • •
AUSTIN.
• SAN AN'TONIO
TEST SITE LOCATIONS
AGURE
••
before field construction, and were glued to the pavement with contact
cement as shown in Figures 4 and 5. The pressure required to hold the
foil in place was applied by an automobile tire. Figure 6 is a close-up
view of an aluminum foil envelope in-place on an existing roadway. As
shown in Figures 2 and 7, the aluminum foil envelopes are arranged in
rows to correspond to the wheel paths of the vehicles with an additional
row of envelopes between the wheel paths.
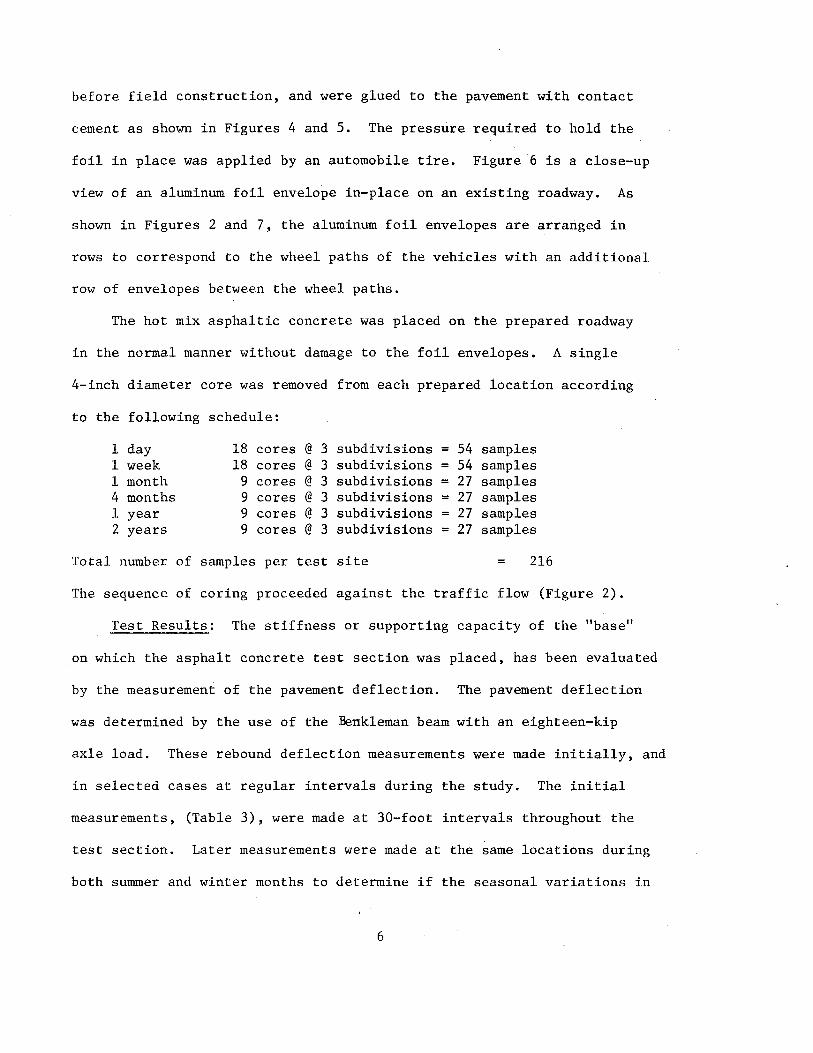
The hot mix asphaltic concrete was placed on the prepared roadway
in the normal manner without damage to the foil envelopes. A single
4-inch diameter core was removed from each prepared iocation according
to the following schedule:
1 day 18 cores @ 3 subdivisions 54 samples 1 week 18 cores @ 3 subdivisions 54 samples 1 month 9 cores @ 3 subdivisions = 27 samples 4 months 9 cores @ 3 subdivisions = 27 samples 1 year 9 cores @ 3 subdivisions 27 samples 2 years 9 cores @ 3 subdivisions = 27 samples
Total number of samples per test site 216
The sequence of coring proceeded against the traffic flow (Figure 2).
Test Results: The stiffness or supporting capacity of the "base"
on which the asphalt concrete test section was placed, has been evaluated
by the measurement of the pavement deflection. The pavement deflection
was determined by the use of the Benkleman beam with an eighteen-kip
axle load. These rebound deflection measurements were made initially, and
in selected cases at regular intervals during the study. The initial
measurements, (Table 3), were made at 30-foot intervals throughout the
test section. Later measurements were made at the same locations during
both summer and winter months to determine if the seasonal variations in
6
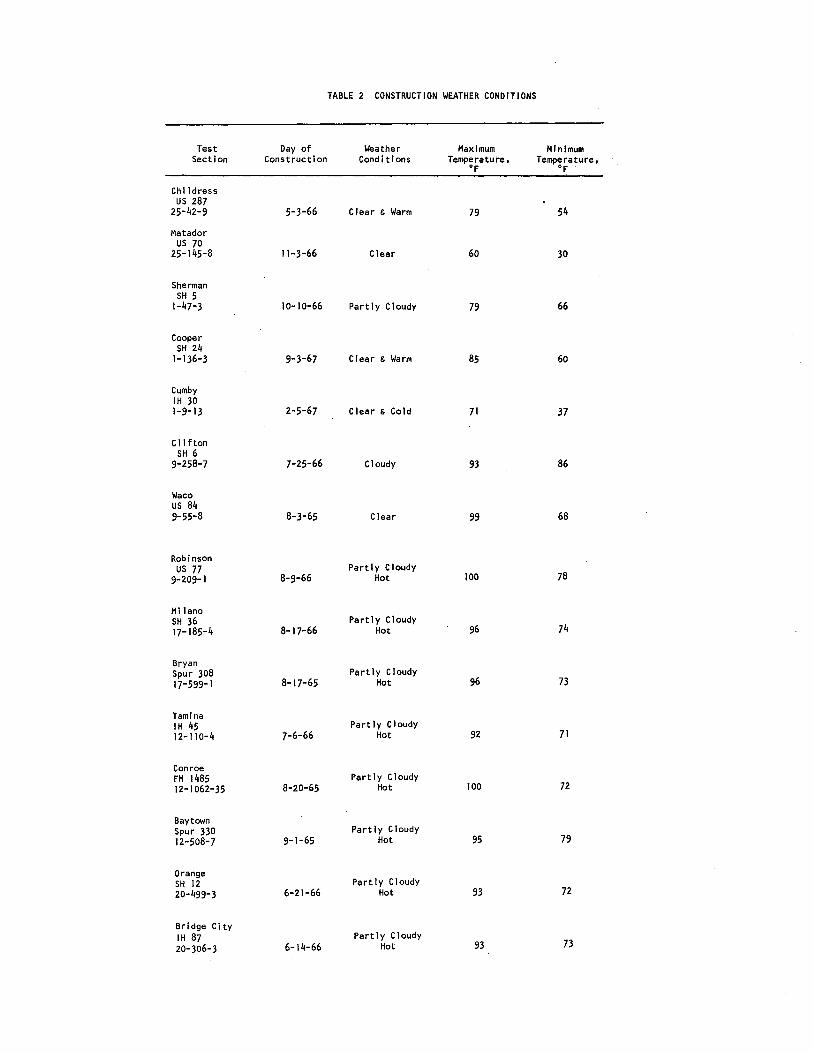
TABLE 2 CONSTRUCTION WEATHER CONDITIONS
Test Day of Weather Maximum Minimum Section Construction Conditions Temperature, Temperature,
"F "F
Chi I dress us 287
25-42-9 5-3-66 Clear & Warm 79 54
Matador us 70
25-145-8 11-3-66 Clear 60 30
Sherman SH 5
1-47-3 10-I0-66 Partly Cloudy 79 66
Cooper SH 24
1-136-3 9-3-67 Clear & Warm 85 60
Cumby IH 30 1-9-13 2-5-67 Clear & Cold 71 37
Clifton SH 6
9-258-7 7-25-66 Cloudy 93 86
Waco us 84 9-55-8 8-3-65 Clear 99 68
Robinson us 77 Partly Cloudy
78 9-209-1 8-9-66 Hot 100
Milano SH 36 Partly Cloudy
74 17-185-4 8-17-66 Hot 96
Bryan Partly Cloudy Spur 308
17-599-1 8-17-65 Hot 96 73
Tami na IH 45 Partly Cloudy 12-110-4 7-6-66 Hot 92 71
Conroe FM 1485 Partly Cloudy 12-1062-35 8-20-65 Hot 100 72
Baytown Partly Cloudy Spur 330
12-508-7 9-1-65 Hot 95 79
Orange Partly Cloudy SH 12
20-499-3 6-21-66 Hot 93 72
Bridge City IH 87 Partly Cloudy
73 20-306-3 6-14-66 Hot 93
Project Reference Number
2
3
4
5
TABLE TEST SITE DETAILS
Test Section Number
Reference Name Highway
25-42-9 U.S. 287, 5.4 mi. NW of
Childress Red River Bridge
25-145-8 Matador
1-47-3 Sherman
1-136-3 Cooper
1-9-13 Cumby
U.S. 70, 3 mi. W of Matador
U.S. 75, 2.7 mi. N of Van Alstyne City Limit
SH 24, 3 mi. SW of Cooper City Limit
IH 30, 2 mi. W of FM 275
SH 6, . 1 mi. W of SH 6
County
Hall
Motley
Grayson
Delta
Hopkins
6 9-258-7 Clifton SH 6 and FM 217 Bosque
U.S. 84, • 1 m i . W of 7 9-55-8 Waco SH 6 over pass Mclennan
U.S. 77, 1 • 6 m i . N of 8 9-209-1 Robinson Jet U.S. 77 and FM 2837 Mclennan
SH 36, 3 mi. N of Jet. 9 17-185-4 Milano SH 36 and U.S. 79 Milam
SH 308, • 25 m i . N of J ct 10 17-599-1 Bryan SH 308 and FM 60 Brazos
I H 45, 1 • 5 m i • S of West 11 12-110-4 Tamina Fork of San Jacinto River Montgomery
12 12-1062-35 Conroe
13 12-508-7 Baytown
14 20-499-3 Orange
Bridge· 15 20-306-3 City
FM 1485, 7 mi. NW of New Caney
Spur 330, 3 mi. SE of IH 10
SH 12, 0.7 mi. E of Jet SH 12 and 62
SH 87, • 2 m i • S of Ra i 1 road Bridge
Montgomery
Harris
Orange
Jefferson
SECTION C MORE THAN NORMAL COMPACTION
FOR TYPICAL SUBSECTION
SECTION B NORMAL COMPACTION
SECTION A LESS THAN NORMAL COMPACTION
it SEE BELOW
TRAFFIC OJRECTIJ -
-
LANE LINE...,.-
65'
LANE SAMPLING AREA (tYP.
SHOULDER
f: .. . I. 71' 6~ 6~ 71' 6~ 65' 71' 64t~
200' 200' 200'
OVERALL· LAYOUT
t
t·~~:t"·AA:r·~x·~ T ·~~ l ·--j GDGGDG0DG0DG0DDDD80080881~~~
CG D G 0 D G G D 0 0 D 0 GJ D D D D 8 GJ GJ 8 [] D []BETWEEN WHEEL PATH
LG D GG D ~ 0 D 0 00 G 0 D D D D ~ 0 [J 8 U 0 CJouTSIDEWHEEL PATH
J .. J . . n' . M-----<
~-------------------------------------------------------------------------------200'--------------------------------------------------------------.; ~EDGE OF PAVEMENT--------------------------------------------------------------------------~------------------------------~~----_J
ENLARGEMENT SHOWING FOIL PLACEMENT a SAMPLE SEQUENCE FOR ONE SUBSECTION
TYPICAL TEST SECTION LAYOUT
FIGURE 2
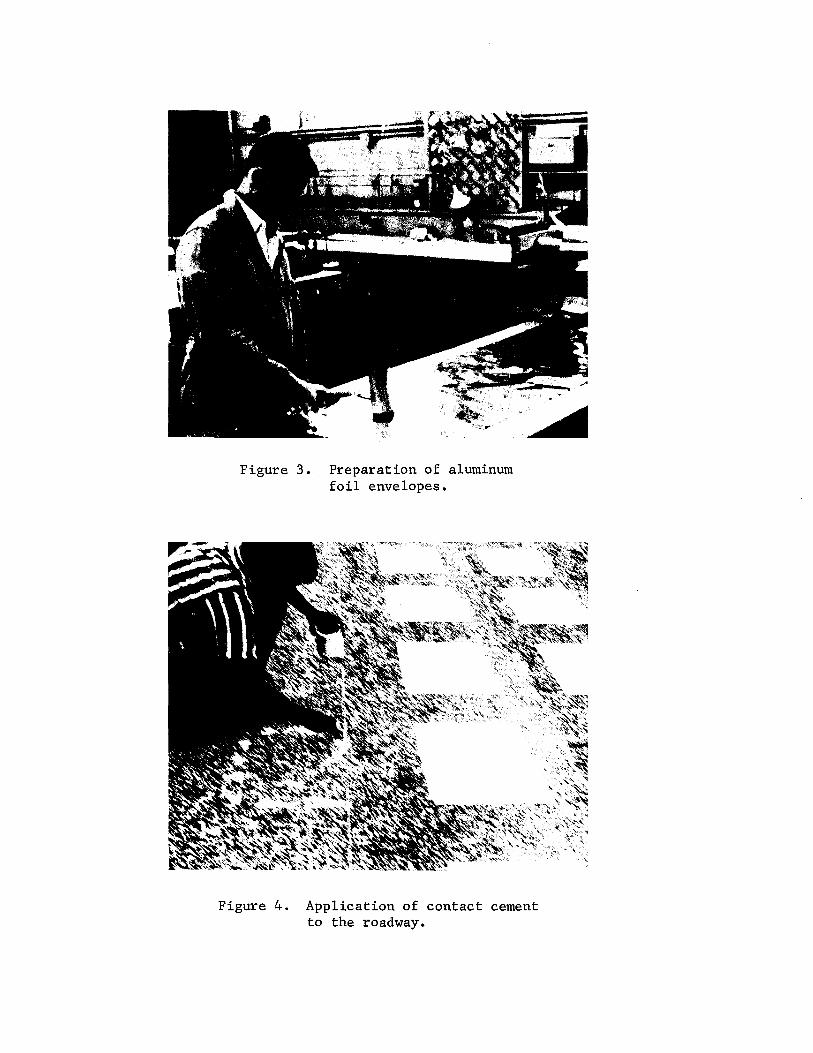
Figure 3. Preparation of aluminum foil envelopes.
Figure 4. Application of contact cement to the roadway.
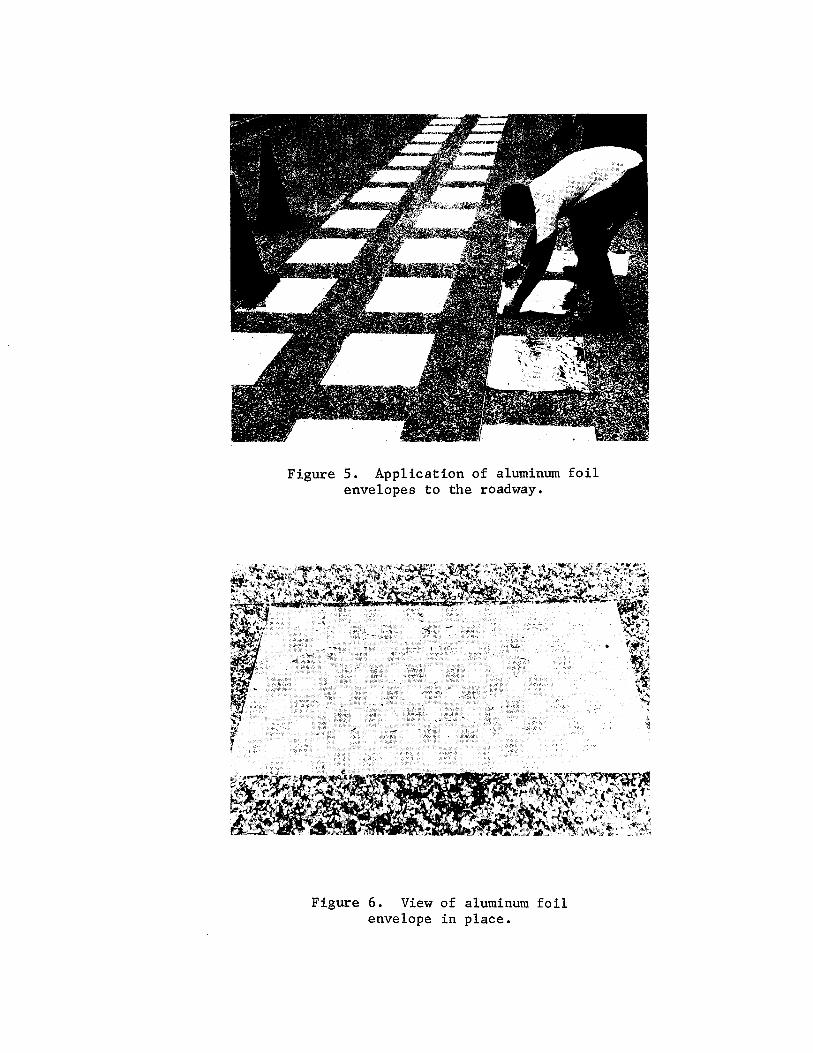
Figure 5. Application of aluminum foil envelopes to the roadway.
Figure 6. View of aluminum foil envelope in place.
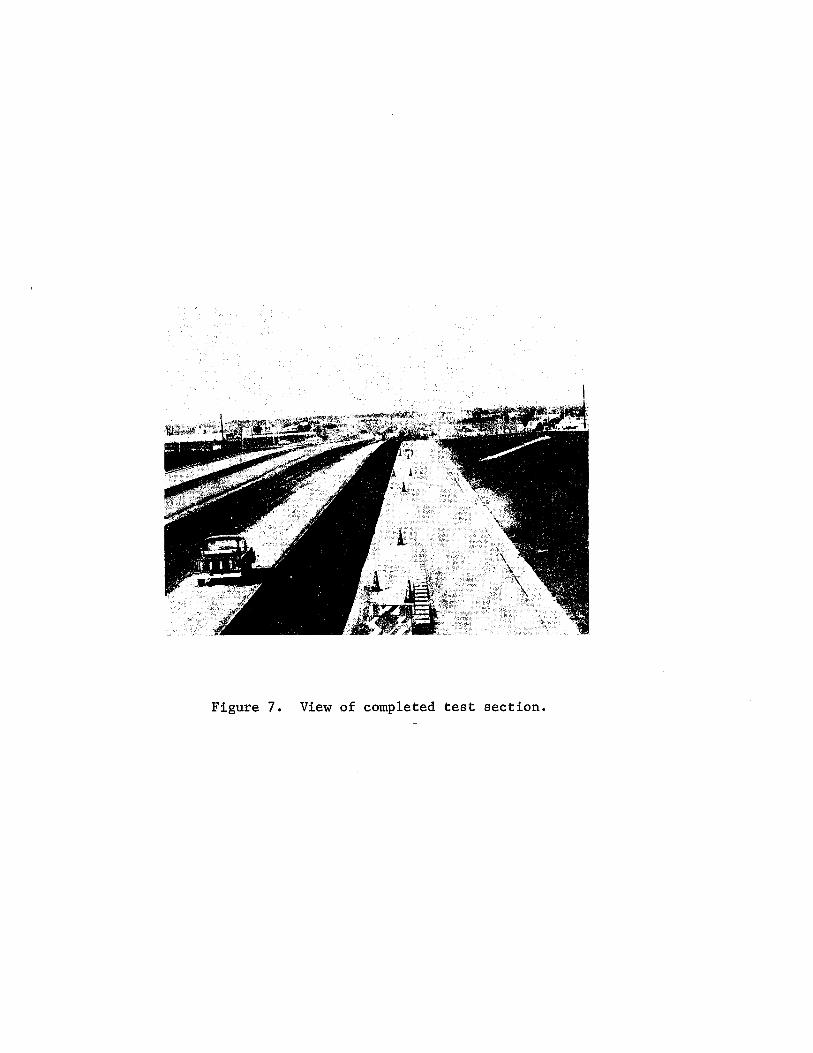
Figure 7. View of completed test section.
the pavement flexibility are a factor influencing the surface compaction
(Table 3). The type of "base" material on which the test section was
placed is given in Table 3. As shown both new and overlay construction on
rigid and flexible pavement bases were used.
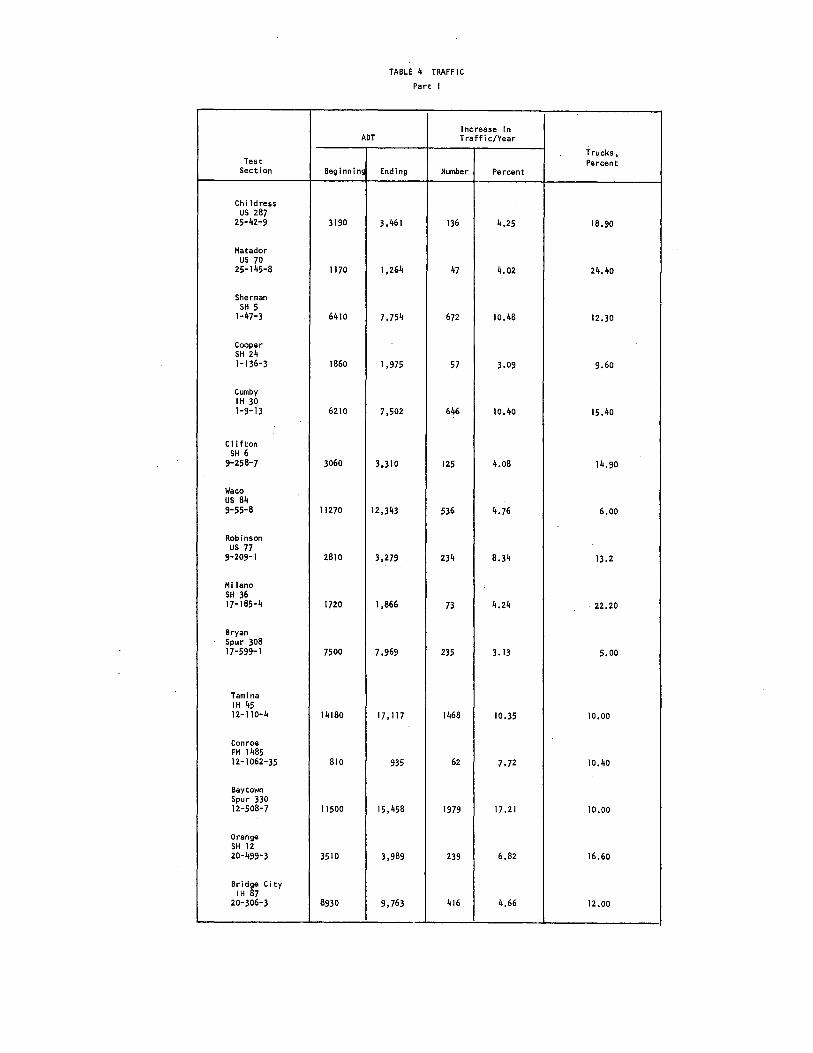
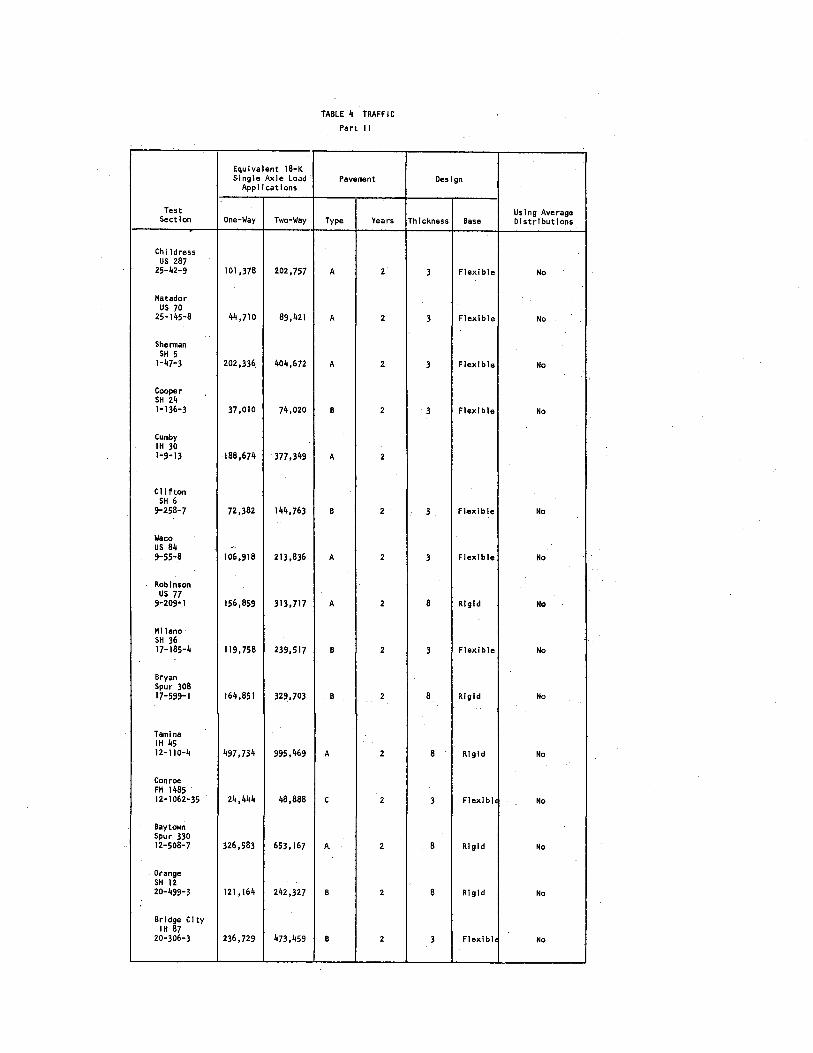
The amount of traffic on these test sections (Table 4, Part I) has
been determined by the Texas Highway Department and presented in terms of
equivalent 18,000-pound axle loads (Table 4, Part II). The equivalent
18,000-pound axle load considers not only the number of vehicles but also
their directional distribution, the percentage of trucks, the weight of
trucks and other factors.
The percent air voids for the pavements after initial compaction
and at various times during a two-year span is given in Appendix A. As
shown each test site has three subsections A, B, and C. Each subsection
has been subjected to different amounts of compaction as follows:
subsection A - half as many roller passes as subsection B.
subsection B - normal rolling procedures for the given project.
subsection C - twice as many roller passes as subsection B.
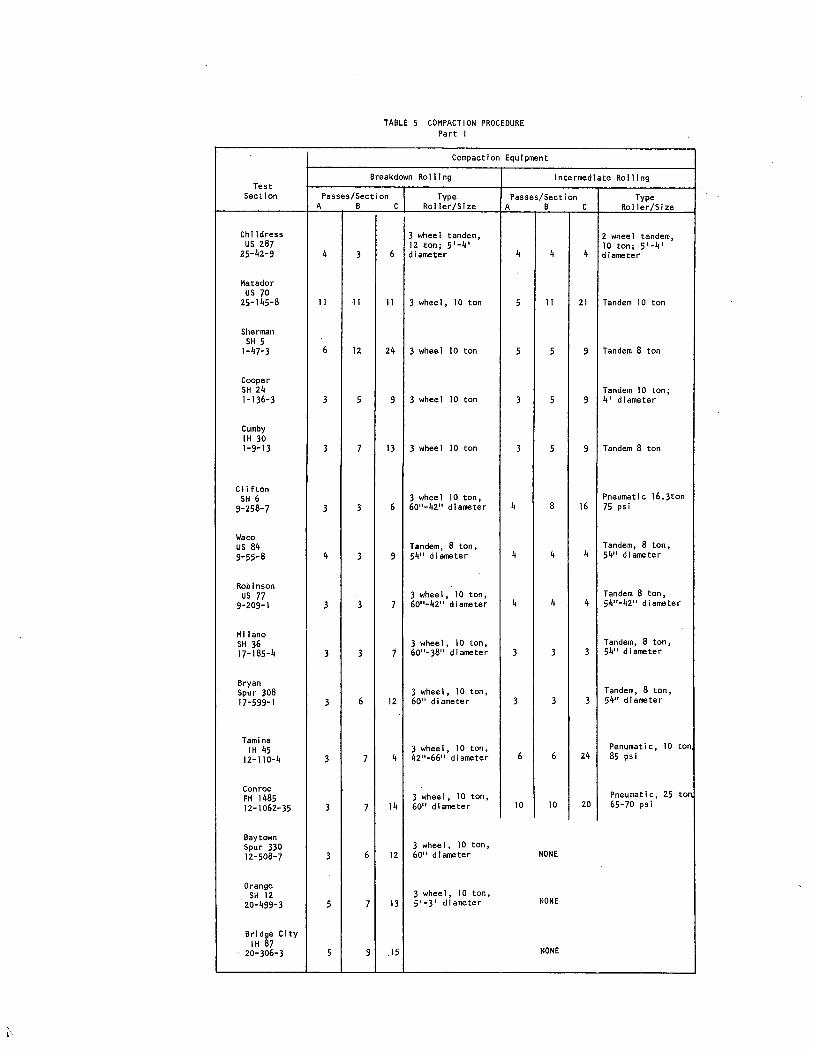
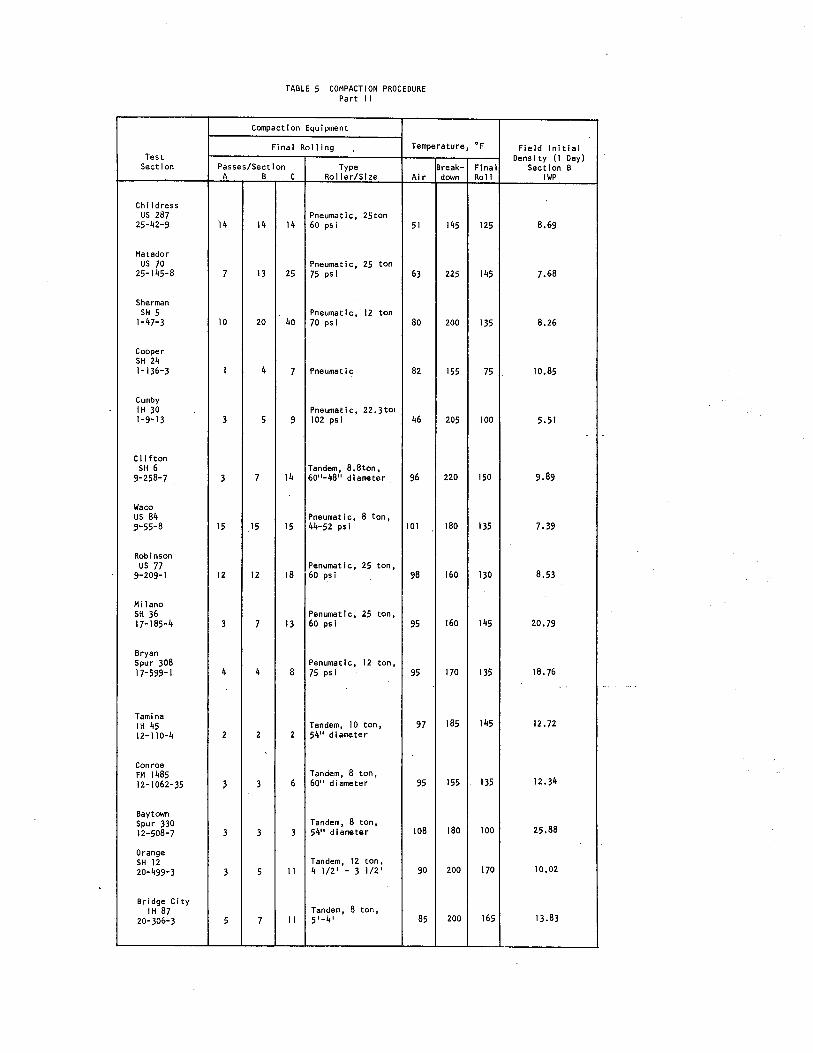
It is believed that this range of roller passes would span the range
encountered in practice. Compaction procedures for each project are
given in Table 5. These data will be used subsequently.
Approximately twenty-five pounds of loose mixture was taken from the
laydown machine at each section. These materials were used for the
laboratory study explained in the next section.
13
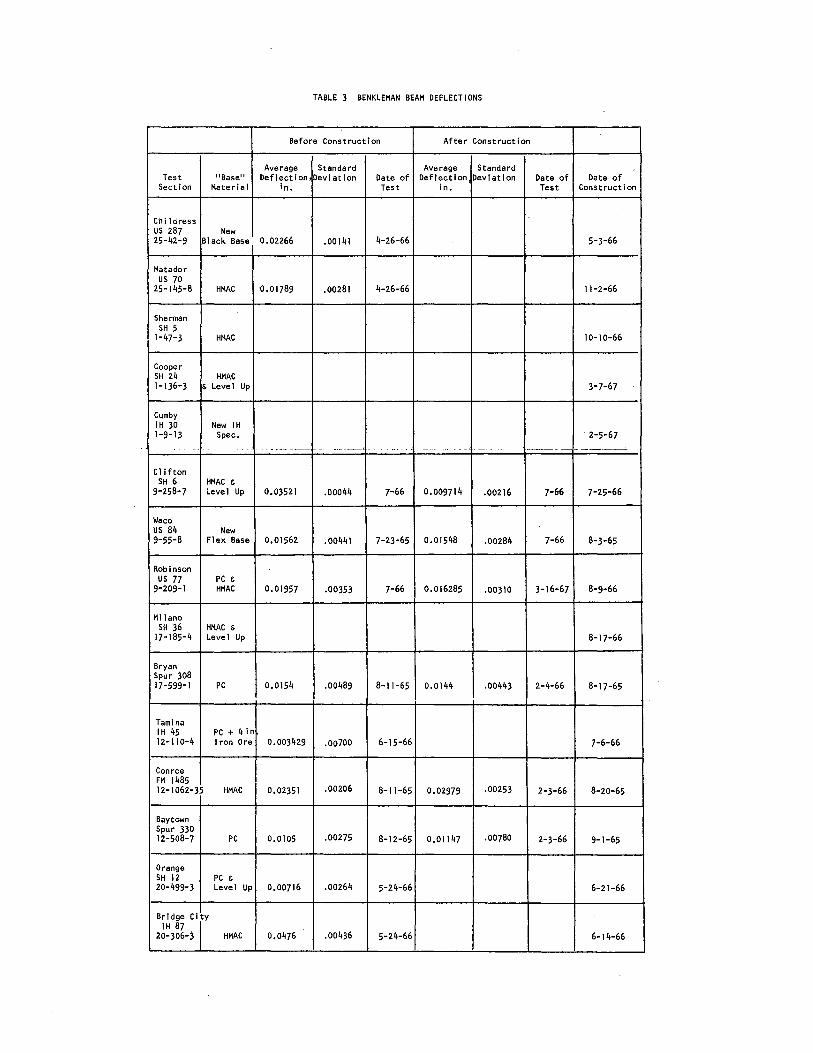
TABLE 3 BENKLEMAN BEAM DEFLECTIONS
Before Construction After Construction
Average Standard Average Standard Test 11 Base•• Deflection Deviation Date of Deflection Deviation Date of Date of
Section Material in. Test in. Test Construction
Childress us 287 New 25-42-9 Black Base 0.02266 .00141 4-26-66 5-3-66
Matador us 70
25-145-8 HMAC ·0.01789 .00281 4-26-66 11-2-66
Sherman SH 5
1-47-3 HMAC 10-I0-66
Cooper SH 24 HMAC 1-136-3 & Level Up 3-7-67
Cumby IH 30 New IH 1-9-13 Spec. 2-5-67
. ----- -~--- ~ -·--- ... -- ... ------ --~-----~ -----~
Clifton SH 6 HMAC &
9-258-7 Level Up 0.03521 .00044 7-66 0.009714 .00216 7-&6 7-25-66
Waco us 84 New 9-55-8 Flex Base 0.01562 .00441 7-23-65 0.01548 .00284 7-66 8-3-65
Robinson us 77 PC &
9-209-1 HMAC 0.01957 .00353 7-66 0.016285 .00310 3-16-67 8-9-66
Milano SH 36 HMAC &
17-185-4 Level Up 8-17-66
Bryan Spur 308 17-599-1 PC 0.0154 .00489 8-11-65 0.0144 .00443 2-4-66 8-17-65
Tamina IH 45 PC + 4 In 12-110-4 Iron Ore 0.003429 .oo1oo 6-15-66 7-6-66
Conroe FM 1485 12-1062-35 HMAC 0.02351 .00206 8-11-65 0.02979 .00253 2-3-66 8-20-65
Baytown Spur 330 12-508-7 PC 0.0105 .00275 8-12-65 0.01147 .00780 2-3-66 9-1-65
Orange SH 12 PC & 20-499-3 Level Up 0.00716 .00264 5-24-66 6-21-66
Bridge Cily IH 87
20-306-3 HMAC 0.0476 .00436 5-24-66 6-14-66
Test Section
Chi I dress us 287
25-42-9
Matador us 70
25-145-8
Sherman SH 5
1-47-3
Cooper SH 24 1-136-3
Cumby IH 30 1-9-13
Clifton SH 6
9-258-7
Waco us 84 9-55-8
Robinson us 77
9-209-1
Milano SH 36 17-185-4
Bryan Spur 308 17-599-1
Tam Ina IH 45 12-110-4
Conroe FH 1485 12-1062-35
Baytown Spur 330 12-508-7
Orange SH 12 20-499-3
Bridge City IH 87
20-306-3
ADT
Beginnin!
3190
1170
6410
1860
6210
3060
TABLE 4 TRAFFIC
Part I
Increase In Traffic/Year
Ending Number Percent
3,461 136 4.25
1,264 47 4.02
7,754 672 10.48
1,975 57 3.09
7,502 646 10.40
3,310 125 4.08
11270 12,343 536 4.76
2810 3,279 234 8.34
1720 1,866 73 4.24
7500 7,969 235 3.13
14180 17,117 1468 10.35
810 935 62 7 .]2
11500 15,458 1979 17.21
3510 3,989 239 6.82
8930 9,763 416 4.66
Trucks, Percent
18.90
24.40
12.30
9.60
15.40
14.90
6.00
13.2
22.20
5.00
10.00
10.40
10.00
16.60
12.00
Equivalent 18-K Single Axle Load
Applications
Test Section One-Way Two-Way
Chi ]dress us 287
25-42-9 101,378 202,757
Matador us 70
25-145-8 44,710 89,421
Sherman SH 5
1-47-3 202,336. 404,672
Cooper SH 24 1-136-3 37,010 74,020
Cumby IH 30 1-9-13 ·188,674 377,349
Clifton SH 6
9-258-7 72,382 144,763
Waco us 84 .. 9-55-8 106,918 213,836
Robinson us 77
9-209•1 156,859 313,717
Milano SH 36 17-185-4 119,758 239,517
Bryan· Spur 308 17-599-1 164,851 329 .• 703
Tam ina IH 45 12-110-4 497,734 995,469
Conroe FM 1485 12-1062-35 24,444 48,888
Baytown Spur 330 12-508-7 326,583 653,167
Orange SH 12 20-499-3 121 '164 242,327
Bridge City IH 87
20-306-3 236,729 473,459
TABLE 4 TRAFFIC
Part II
Pavement
Type Years
A 2
A 2
A 2
B 2
A 2
B 2
A 2
A 2
B 2
B 2
A 2
c 2
A 2
B 2
B 2
Des lgn
Using Average Th lckness Base Distributions
3 Flexible No
3 Flexible No
3 Flexible No
3 Flex! b le No
3 Flexible No
3 Flexible No
8 Rigid No
3 Flexible No
8 Rigid No
8 Rigid No
3 Flexibl• No
8 Rigid No
8 Rigid No
3 Flexibl No
Test Section
Chi I dress us 287
25-42-9
Matador us 70
25-145-8
Sherman SH 5
1-47-3
Cooper SH 24 1-136-3
Cumby IH 30 1-9-13
Clifton SH 6
9-258-7
Waco us 84 9-55-8
Robinson us 77
9-209-1
Mi lane SH 36 17-185-4
Bryan Spur 308 17-599-1
Tam ina IH 45
12-110-4
Conroe FM 1485 12-1062-35
Baytown Spur 330 12-508-7
Orange SH 12
20-499-3
Bridge City IH 87
20-306-3
TABLE 5 COMPACTION PROCEDURE Part I
Compaction Equipment
Breakdown Rolling Intermediate Rolling
Passes/Section Type Passes/Section Type A B c Roller/Size A B c Roller/Size
3 wheel tandem, 2 wheel tandem, 12 ton; 5'-4' Jo·ton; 5'-4'
4 3 6 diameter 4 4 4 dIameter
11 II 11 3 wheel, 10 ton 5 11 21 Tandem 10 ton
6 12 24 3 wheel 10 ton 5 5 9 tandem 8 ton
Tandem 10 ton; 3 5 9 3 wheel 10 ton 3 5 9 4' diameter
3 7 13 3 wheel 10 ton 3 5 9 Tandem 8 ton
3 wheel 10 ton, Pneumatic 16.3ton 3 3 6 60"-42" diameter 4 8 16 75 psi
Tandem, 8 ton, Tandem, 8 ton, 4 3 9 54" diameter 4 4 4 54" diameter
3 wheel, 10 ton, Tandem 8 ton, 3 3 7 60"-42" diameter 4 4 4 54"-42" diameter
3 wheel, 10 ton, Tandem, 8 ton, 3 3 1 60"-38" diameter 3 3 3 54" diameter
Tandem, 8 ton, 3 wheel, 10 ton, 3 6 12 60" diameter 3 3 3 54" diameter
3 wheel, 10 ton, Penumati c, 10 ton 3 7 4 42"-66" diameter 6 6 24 85 psi
Pneumatic, 25 ton 3 wheel, 10 ton, 3 7 14 60" diameter 10 10 20 65-70 psi
3 wheel, 10 ton, 3 6 12 60" diameter NONE
3 wheel, 10 ton, 5 7 13 5'-3' diameter NONE
5 9 .15 NONE
Test Section
Chi I dress us 287
25-42-9
Matador us 70
25-145-8
Sherman SH 5
1-47-3
Cooper SH 24 1-136-3
Cumby IH 30 1-9-13
Clifton SH 6
9-258-7
Waco us 84 9•55-8
Robinson us 77
9-.209-1
Mi lane SH 36 17-185-4
Bryan Spur 308 17-599-1
Tam ina IH 45 12-110-4
Conroe FM 1485 12-1062-35
Baytown Spur 330 12-508-7
Orange SH 12 20-499-3
Bridge City IH 87
20-306-3
TABLE 5 COMPACTION PROCEDURE Part II
Compaction Equipment
Final Rolling Temperature,
Passes/Section Type Break-A B c Roller/Size Air down
Pneumatic, 25ton "14 14 14 60 psi 51 145
Pneumatic, 25 ton 7 13 25 75 psi 63 225
Pneumatic, 12 ton 10 20 40 70 psi 80 200
I 4 7 Pneumatic 82 155
Pneumatl c, 22.3 tOI 3 5 9 102 psi 46 205
Tandem, 8.8ton, 3 7 14 60"-48" diameter 96 220
Pneumatic, 8 ton, 15 15 IS 44-52 psi 101 180
Penumatic, 25 ton, 12 12 18 60 psi 98 160
Penumatic, 25 ton, 3 7 13 60 psi 95 160
Penumatic, 12 ton, 4 4 8 75 psi 95 170
Tandem, 10 ton, 97 185 2 2 2 54" diameter
Tandem, 8 ton, 3 3 6 60" diameter 95 155
Tandem, 8 ton, 108 180 3 3 3 54" diameter
Tandem, 12 ton, 3 5 II 4 I /2' - 3 1/2' 90 200
Tandem, 8 ton, 5 7 II 5'-4' 85 200
OF Field Initial Density (I Day)
Final Section B Roll IWP
125 8.69
145 7.68
135 8.26
75 10.85
100 5.51
150 9.89
135 7.39
130 8.53
145 20.79
135 18.76 . -
145 12.72
135 12.34
100 25.88
170 10.02
165 13.83
Laboratory Work
The loose mixture obtained from the laydown equipment in the field
was transported to the central laboratory of the Texas Transportation
Institute for future evaluation. Also samples of the mixture were obtained
by the Texas Highway Department. The proposed purpose of the duplication
of effort was to compare the results of the "field laboratory" and those
of the research laboratory so that any reconnnendations resulting from
the study could be translated to Texas Highway Department field conditions.
However, this was a secondary objective of the study suggested by the
Construction Division of the Texas Highway Department.
The laboratory measurements that were duplicated were those of making
' and testing job control specimens using the Texas motorized gyratory
shear press. The compactive effort was a variable in the study and
constituted an attempt to determine the optimum amount of laboratory
compaction. The present reconnnended procedure according to test method
Tex-206-F, Part II (tentative) (1) is to apply an initial gage pressure
of 50 psi to the specimen to be compacted. The mold containing the loose
mix is then tilted 10 and rotated three revolutions after which the mold
is leveled and a check is made to determine whether or not the desired
compaction has been reached. This is done by making one full stroke on
the jack and (this deformation represents approximately 1 percent strain
on the compacted specimen) if one stroke of the jack increases the gage
pressure to 150 psi or more, the sample is considered to have peen satis-
factorily compacted. If one stroke on the jack does not increase the
pressure to 150 psi, the gage pressure is adjusted to 50 psi, and another
19
set of three gyrations is applied. The procedure is repeated until the
designated end point has been reached, then the ends of the sample are
leveled or made parallel by applying a leveling force equivalent to 1588
psi on the specimen. The leveling load is then immediately removed. The
compacted sample is extruded from the mold and allowed to cool.
Variations in the compactive effort were obtained by changing the
starting pressure and the end point pressure. The leveling procedure
remained the same. The concensus was that the laboratory density obtained
by the standard method (described above) was sufficient for normal
roadway construction. Thus, it became necessary to reduce the compactive
effort. This was accomplished by reducing the end point from 150 psi
(gage) to 100 psi. This is termed for this report the medium compactive
effort; whereas, the standard method described previously is called the
high compactive effort. This so-called medium effort is the same as
the procedure currently being used by the Texas Highway Department for
the manual gyratory shear press (Tex-206-F Part I). (1) The low compac
tive effort was effected by reducing the starting pressure to 40 psi and
the end to 50 psi, otherwise the procedure remained the same.
A second laboratory compactor was used at three different energy
levels to aid in evaluating the compactibility of the asphaltic concrete
mixtures. This compactor was the gyratory testing apparatus developed
by the U. S. Army Corps of Engineers at Vicksburg, Mississippi ~nd
presently patented by the Engineering Development Company (EDCO). This
apparatus is similar in design to the THD motorized gyratory shear press.
The standard procedure or compactive effort requires 30 gyrations with the
20
mold inclined at 1° and a constant pressure of 100 psi on the specimen.
The compactive effort was varied by changing the constant pressure to 50
and 150 psi and holding the 30 gyrations and 1° of tilt constant.
A third type compaction procedure was used~ This was the Marshall
compaction procedure, which compacts by the impact of a dropped hammer.
The standard procedure requires 50 blows per face and this was used as
a medium effect for the laboratory study. The low Marshall compactive
effort consisted of 10 blows per face while the high compactive effort
consisted of 75 blows of the ten-pound hammer on each face of the specimen.
The California Kneading Compactor was the fourth type of compaction
used. The high compactive effort followed the California specified
procedure (Test Method No. Calif. 304-E) (2) which requires 150 tamps
at 500 psi foot pressure. The medium compactive effort was set at 100
tamps while the low compactive effort was set at 25 tamps at 500 psi foot
pressure.
TTI and THD Comparisons: All Specimens compacted in the Texas
Transportation Institute Laboratory were tested for density, percent air
voids, stability, and cohesion. The samples compacted in the individual
field laboratories were transported to the Texas Highway Department
Materials and Test Laboratories in Austin, Texas for measurement of sta
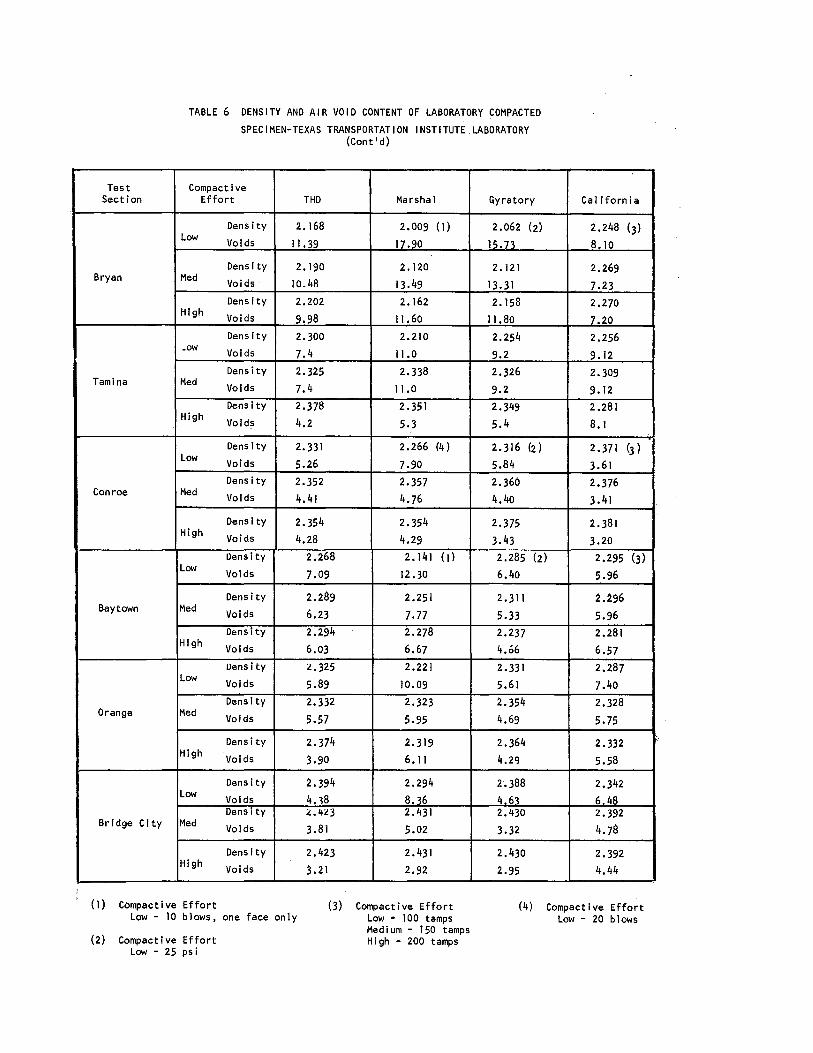
bility and density. Density and air void contents for the specimen com
pacted in the TTI laboratory were determined by weighing the specimens in
air and water, and comparing this value with the Rice specific gravity
obtained on the loose mix (the Rice method allows for absorption of the
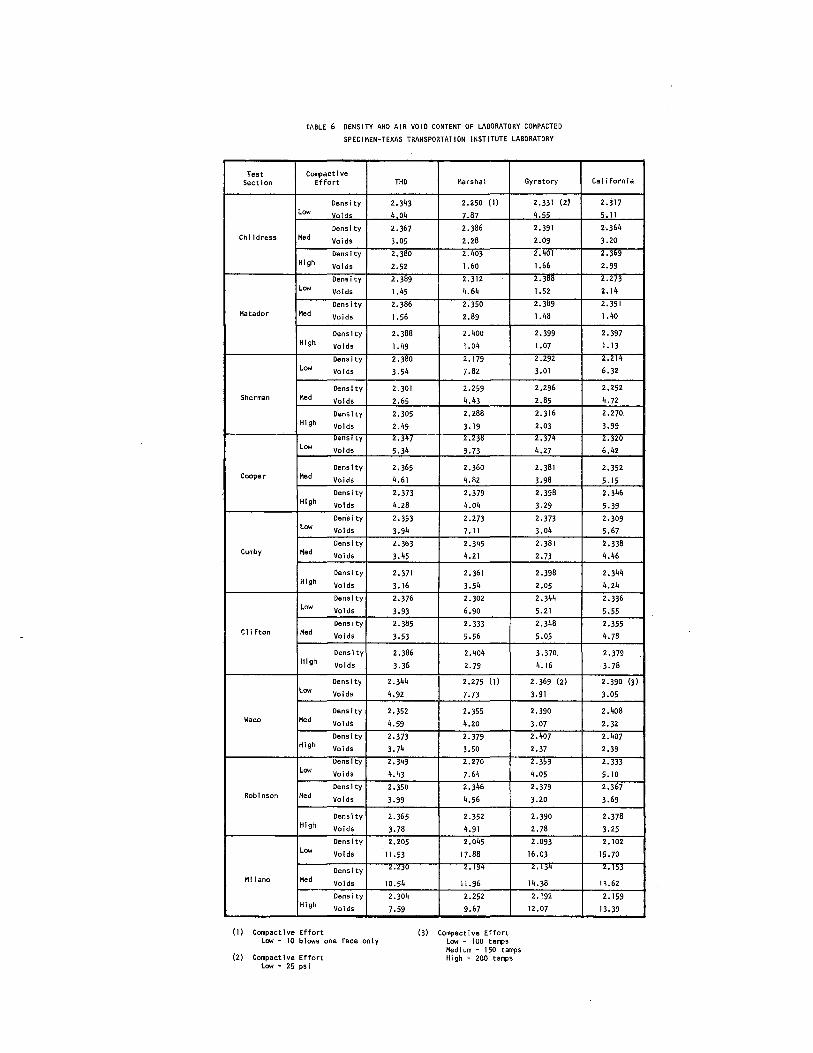
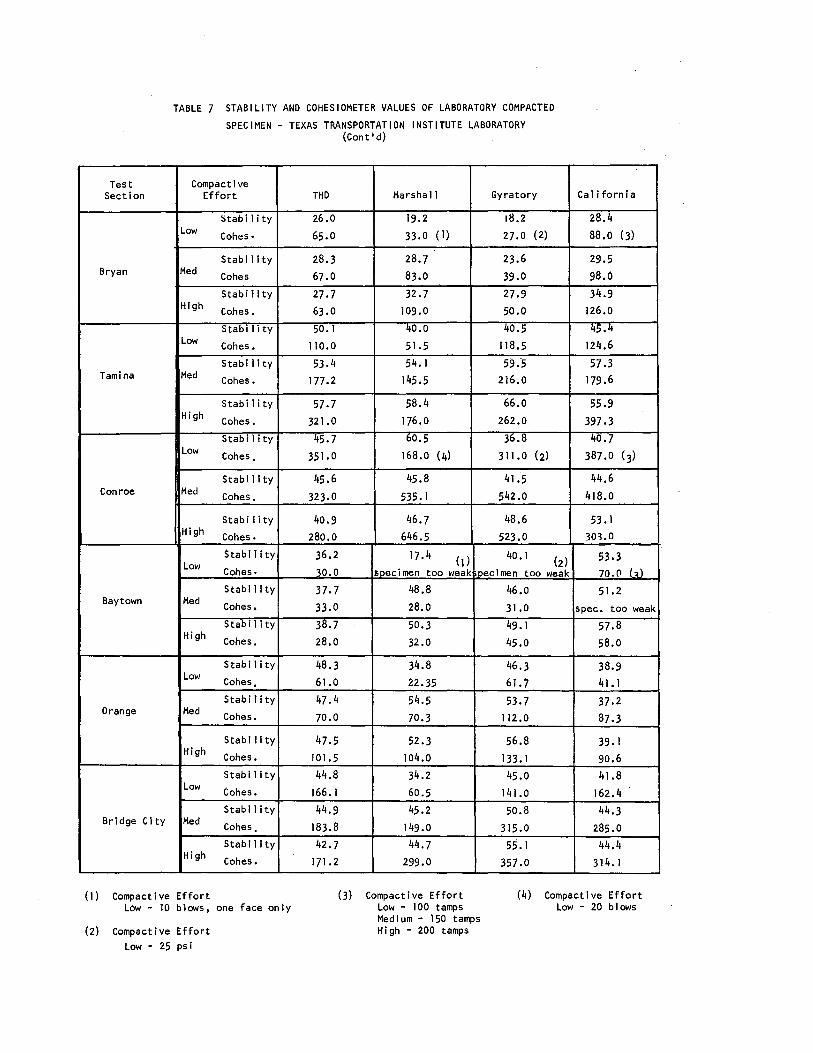
asphalt by the aggregates). These values are given in Table 6 while
stability and cohesiometer values are given in Table 7. Density and air
21
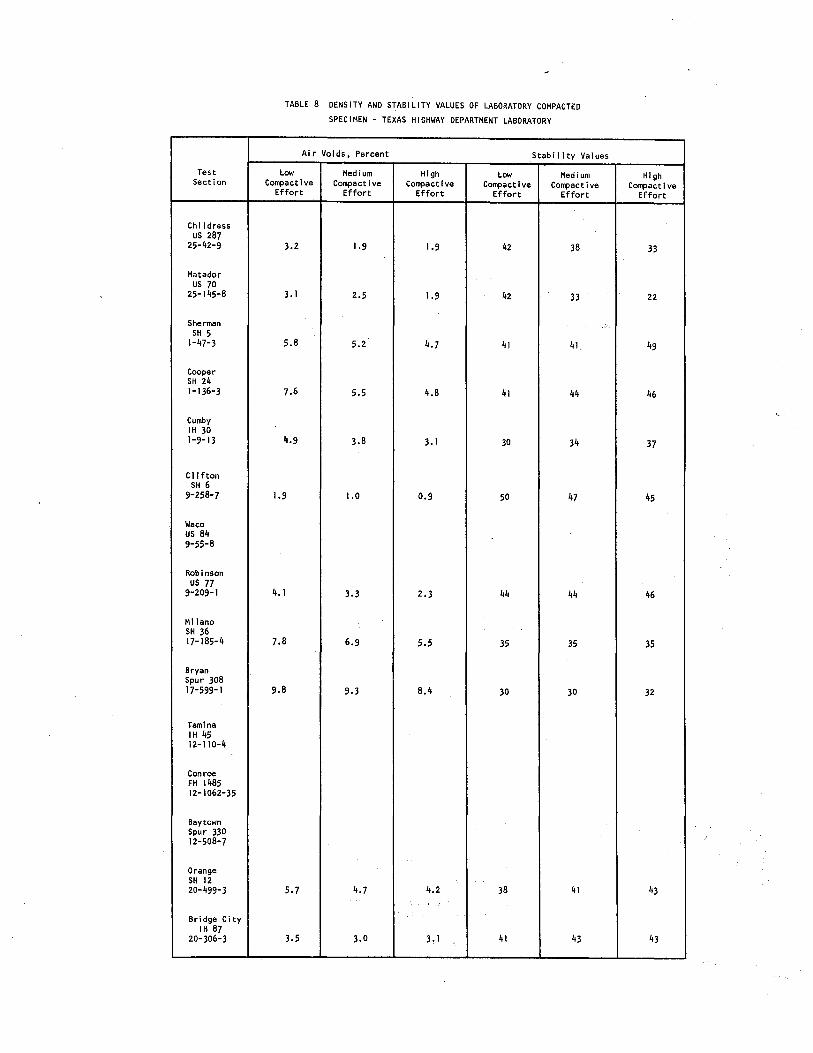
void contents for the specimen compacted in the THD laboratory were
determined by weighing the coated specimens in air and water, and compar-
ing this value with the calculated theoretical maximum specific gravity of
the components of the mix. Results obtained by the THD are shown in
Table 8. The values shown in these tables are averages of three specimens.
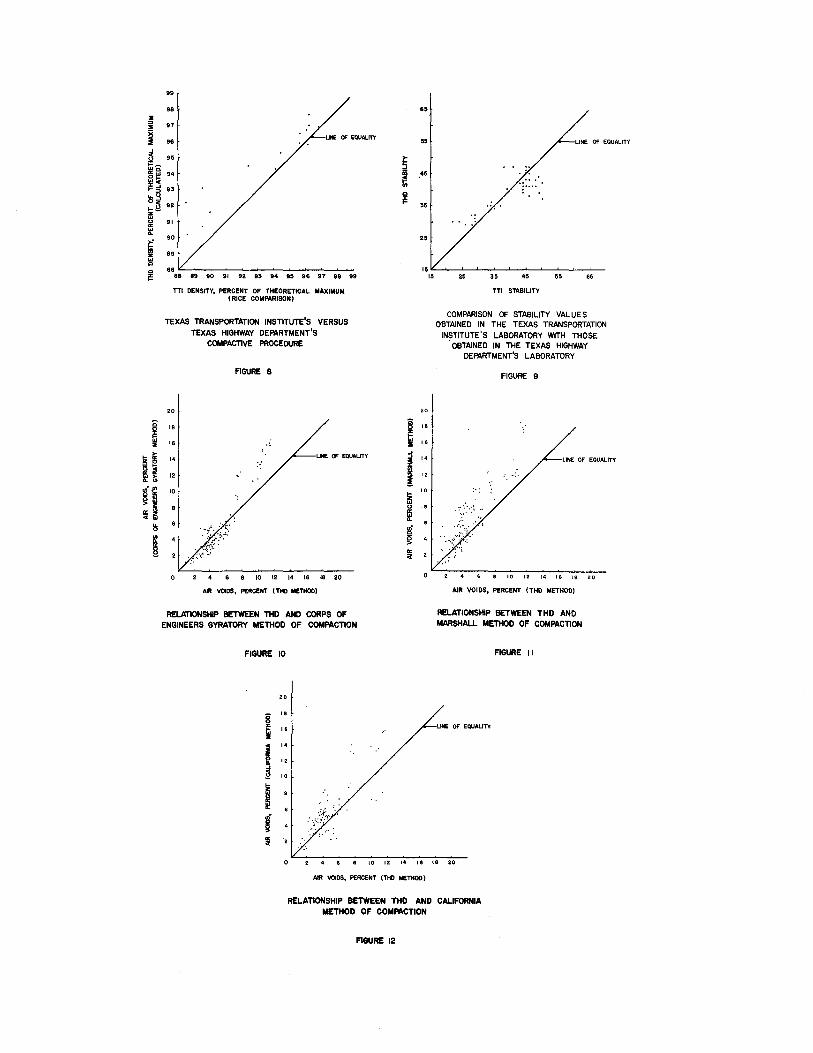
The variations noted in density between the TTI and THD laboratory
compacted specimens (Figure 8) are due to different methods of analysis
as reported by Gallaway (3, 4), Gallaway and Harper (5) and explained
above. However, even after corrections were made for the method of analy-
sis, it was found that differences existed; but, on the average, the air
void differences were less than 1.5 percent.
The Hveem stability values of specimens compacted in the TTI laboratory
are compared with the specimen compacted in the THD laboratory in Figure 9.
As shown the TTI values tended to be higher than the stabilities measured
in the THD laboratory. These differences neglect the difference between
the two stabilometers used in the measurements.
Comparison of Compaction Methods: Another objective of the labo-
ratory portion of the study was to examine ar.d compare methods of compact-
ing specimens in the laboratory. The standard methods of compaction were
used for these comparisons, i.e. 50-blow Marshall, 150-tamp California,
100 psi gyratory and 150 psi THD methods. A comparison between the THD
and Corps of Engineers gyratory compaction method is shown in Figure 10
while comparisons between the THD and Marshall and THD and California i
method are shown in Figures 11 and 12.
22
Ti\BLE 6 DENSITY AND AIR VOID CONTENT OF LABORATORY COMPACTED
SPEC I MEN-TEXAS TRANSPORT AT I ON INSTITUTE LABORATORY
Test Compactive Section Effort
Density Low Voids
Density Childress Med
Voids
Density High Voids
Density Low Voids
Density Matador Med Voids
Density High Voids
Density Low Voids
Density Sherman Med Voids
DensIty HIgh Voids
trens 1 ty Low Voids
Density Cooper Med Voids
Density High Voids
Density Low Voids
Density Cumby Med Voids
Density High Voids
DensIty Low Voids
Dens 1 ty Clifton Med
Voids
Density High Voids
Density Low Voids
DensIty Waco Med Voids
DensIty High
Voids
Density Low Voids
Density Robinson Hed
Voids
Density High Voids
Density Low Voids
DensIty Milano Med Voids
Density High
Vol ds
(I) Compact i ve Effort LON - 10 blows one face only
(2) Compact I ve Effort Low - 25 psI
THO
2.343
4 04
2.367
3.05
2.380
2.52
2.389
1.45
2.386
1.56
2.388
1.49
2.380
3.54
2.301
2.65
2.305
2.49 l.347
5.34
2. 365
4.61
2.373 4.28
2.353
3.94
l, 3b3
3.45
2.371
3.16
2.376
3.93
2. 385
3.53
2.386
3.36
2.344
4.92
2.352
4.59
2.373
3. 74
2. 349
4.43
2.350
3.99
2.365
3.78
2.205
11.53 l.ljU
10.54
2.304
7.59
Marsha 1
2.250 (I)
7.87
2.386
2.28
2.403
1.60
2.312
4.64
2.350
2.89
2.400
1.04
2. 179
7.82
2.259
4.43
2.288
3.19 l,l3~
9.73
2.360
4.82
2.379
4.04
2.273
7. 11
2.345
4.21
2.361
3.54
2.302
6.90
2.333
5.56
2.404
2. 79
2.275 (I)
7. 73
2.355
4.20
2. 379
3.50
2.270
7.64
2.346
4.56
2.352
4.91
2.045
17.88
'· ~~· 11.96
2.252
9.67
(3) Compact i ve Effort Low - 100 tamps Med I urn - 150 tamps High - 200 tamps
Gyratory
2.331 (2)
4.55
2.391
2.09
2.401
1.66
2,388
1.52
2.389
1.48
2.399
1.07
2.292
3.01
2.296
2.85
2.316
2.03
2.377f
4.27
2.381
3.98
2.398
3.29
2.373
3.04
2.381
2.73
2.398
2.05
2.344
5.21
2.348
5.05
3.370.
4.16
2. 369 (2)
3.91
2. 390
3.07
2.407
2.37
2.359
4.05
2.379
3.20
2.390
2.78
2.093
16.03
2,1Jlf
14.38
2.192
12.07
Ca 1 iforn i a
2.317
5.11
2.364
3.20
2.309
2.99
2.273
2.14
2.391
1.40
2.397
I. 13
2.214
6.32
2.252
4.72
2.270.
3.99 2.320
6,42
2.352
5.15
2.346
5.39
2.309
5.67
2.338 4,46
2.344
4.24
2.336
5.55
2.355
4.78
2.379
3. 78
2.390 (3)
3.05
2.408
2. 32
2.407
2.39
2.333
5.10
2.367
3.69
2.378
3.25
2.102
15.70
l,l53
I ,,62
2. 159
13.39
Test Section
Bryan
Tam ina
Conroe
Baytown
Orange
Bridge City
TABLE 6 DENSITY AND AIR VOID CONTENT OF LABORATORY COMPACTED
SPECIMEN-TEXAS TRANSPORTATION INSTITUTE LABORATORY (Cont'd)
Compactive Effort THO Marshal Gyratory
Density 2.168 2.009 (1) 2.062 (2) Low Voids 11.39 17.90 15.73
Density 2.190 2.120 2.121 Med Voids 10.4R ]3.49 13.31
Density 2.202 2.162 2.158 High Voids 9.98 11.60 11.80
Density 2.300 2.210 2.254 _ow
Voids 7.4 11.0 9.2 Density 2.325 2.338 2.326
Med Voids 7.4 11.0 9.2 Density 2.378 2.351 2.349
High Voids 4.2 5.3 5.4
Density 2.331 2.266 (4) 2.316 (2) Low Voids 5.26 7.90 5.84
Density 2.352 2.357 2.360 Med Voids 4.41 4.76 4.40
Density 2.354 2.354 2.375 High Voids 4.28 4.29 3.43
Density 2.268 2.141 ( 1) 2.285 (2) Low Voids 7.09 12.30 6.40
Density 2.289 2.251 2.311 Med Voids 6.23 7.77 5.33
De:nsity 2.294 2.278 2.237 High Voids 6.03 6.67 4.o6
Density 2.325 2.221 2.331 Low Voids 5.89 10.09 5.61
Density 2.332 2.323 2. 354 Med Voids 5.57 5.95 4.69
Density 2.374 2.319 2.364 High Voids 3.90 6.11 4,2q
Density 2.394 2.294 2.388 Low Voids 4.38 8.36 4.63
Density l..'ll.3 2.431 2.'+30 Med Voids 3.81 5.02 3.32
Density 2.423 2.431 2.430 High Voids 3.21 2.92 2.95
California
2.248 (J)
8.10
2.269 7.23 2.270 7.20 2.256 9.12 2.309 9.12 2.281 8.1
2.371 (3)
3.61 2.376 3.41
2.381 3.20 2.295 (3) 5.96
2.296 5.96 2.281
6.57 2.287 7.40 2.328
5.75
2.332
5.58
2.342 6.48 2.392 4.78
2.392 4.44
(1) Compactive Effort Low- 10 blows, one face only
(3) Compactive Effort Low • 100 tamps Medium - 150 tamps High - 200 tamps
(4) Compactive Effort Low - 20 blows
(2) Compactive Effort Low- 25 psi
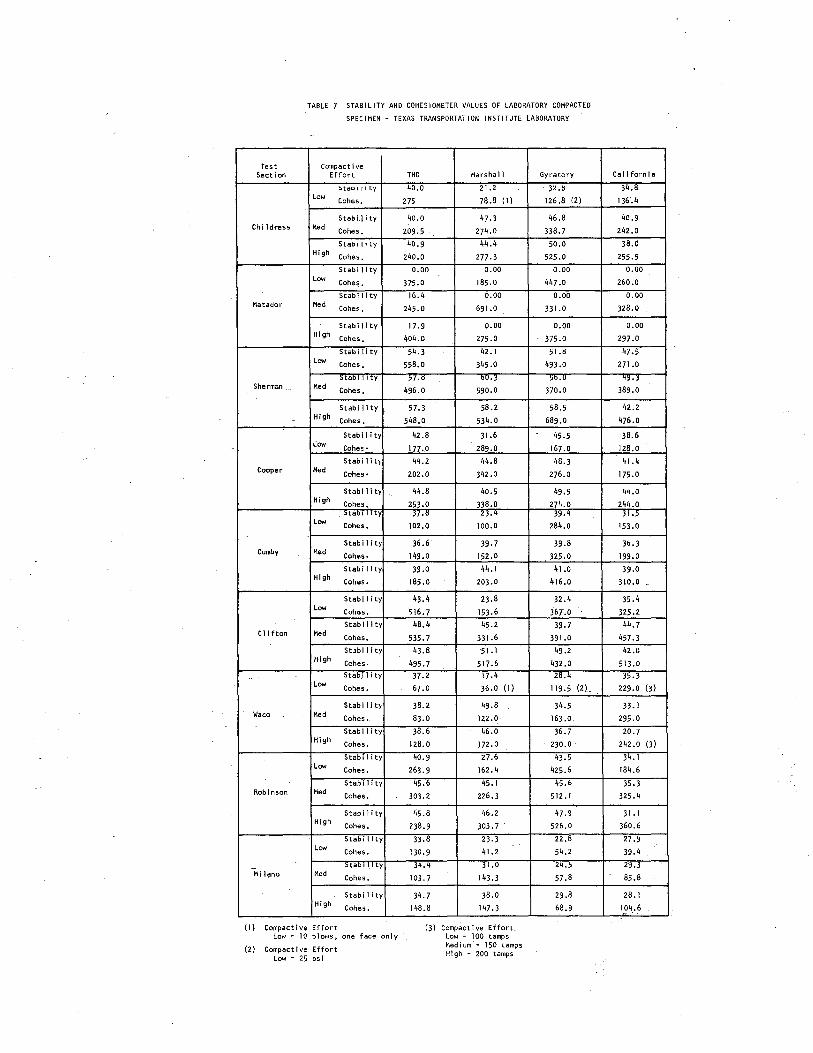
TABLE 7 STABILITY AND CDHESIDMETER VALUES OF LABORATORY COMPACTED
SPEC I MEN - TEXAS TRANSPORT AT! ON I NST! TUTE LABORATORY
Test Compact i ve Section Effort
~taD I I I ty Low Cohes.
Stabi.l i ty Childress Hed Cohes.
S~abr II ty HIgh
Cohes.
Stability Low Cohes.
Stabi 1 ity Matador Med
Cohe~.
Stabi 1 i ty High
Cohes.
Stab i 1i ty Low Cohes.
>taD I I ty Sherman ___ Hed Cohes.
Stabi 1 i ty
- High Cohes.
Stabi I ity Low
Cohes •
Stabilit) Cooper Hed
Cohes•
Stabi I it~ High
Cohes. >taD I ty
Low Cohes.
Stab i 1 i ty Cumby Hed
Cohes•
Stabi I i ty High Cohes.
Stabi I ity Low Cohcs.
Stab Ill ty Clifton Hed
Cohes.
St•bi I ity High Cohes.
s·tabll i ty Low Cohes.
Stab il it~ Waco Hed Cohes.
Stabi I ity High Cohes.
Stabi I i ty Low
Cohes.
Stabi I ity Rob 1 nson Hed
Cohes.
Stabi 1 ity High Cohes.
Stabi I ity Low
Cohes.
Stability Milano Med
Cohes.
Stabi 1 i ty High
Cohes.
(I) Compactive Effort Low - 10 blm·JS, one face only
(2) Compactive Effort Low - 25 psi
THO Marshall
40.0 21.2
275 78.8 (I)
40.0 47.3
209:5 274.0
40.9 44.4
240.0 277.3
0.00 0.00
375.0 185.0
16.4 0.00
245.0 691.0
17.9 o.oo
404.0 275 .o
54.3 42. I
558.0 345 .o
!>/.0 DU.j
496.0 590.0
57.3 58.2
548.0 534.0
42.8 31.6
177 •. 0 289.0
44.2 44.8
202.0 342 .o
44.8 40.5
253.0 338.0 jf,O Zj,4
102,0 100.0
36.6 39.7
149.0 152.0
39 .o 44.1
185.0 203.0
43.4 23.8
516.7 153.6
48.4 45.2
535.7 331 .6
43.8 51.1
495.7 517.6
37.2 17.4
67.0 36.0 (I)
38.2 49.8
83.0 122.0
38.6 46.0
128.0 172.0
40.9 27.6
263.9 162.4
45.6 45. I
303.2 226.3
45.8 46.2
238.9 303.7
33.8 23.3
130.9 41.2
34.4 31.0
103.7 143.3
34.7 38.0
148.8 147.3
(3) Compact i ve Effort. low - 100 tamps Med i uffi - 150 tamps High - 200 tamps
Gyratory
32.~
126.8 12)
46.8
338.7
50.0
525.0
0.00
447 .o
0.00
331.0
0.00
375.0
51.~
493.0
;o.u
370.0
58.5
689.0
45.5
167.0
48.3
276.0
49.5
274.0 39.4
284.0
39.8
325 .o
41.0
416.0
32.4
367.0
39.7
391.0
49.2
432,0
28.4
119.5 (2)_
34.5
163 .o
36.7
230.0.
43.5
425.6
45.&
512 ,I
47.9
526,0
22.8
54.2
24.!>
57 .1l
29.8
68.9
Ca I i forn i a
34.8
136.4
40.9
242.0
38.0
255.5
o.oo
260.0
0.00
328,0
0.00
297.0
47.5
271 .o
·~· j 389.0
42.2
476.0
38.6
128.0
41.4
175.0
44.0
244.0 j 1.!>
153 .o
3o. 3
199.0
39.0
310.0 -
35.4
325.2
44.7
457.3
42.0
513.0
35.3
229.0 (3)
33.1
295.0
20.7
242 .o (3)
34. I
184.6
35.3
325.4
31.1
360.6
27.9
39.4
29.3
85.8
28.1
'.o~.6
Test Section
Bryan
Tamina
Conroe
Baytown
Orange
Bridge City
TABLE 7 STABILITY AND COHESIOMETER VALUES OF LABORATORY COMPACTED
SPECIMEN - TEXAS TRANSPORTATION INSTITUTE LABORATORY (Cont'd)
Compactive Effort THO Marsha 11 Gyratory
Stabi 1 ity 26.0 19.2 18.2 Low Cohes• 65.0 33.0 ( 1) 27.0 (2)
Stability 28.3 28.7 23.6 Med Cohes 67.0 83.0 39.0
Stabi 1 i ty 27.7 32.7 27.9 High Cohes. 63.0 109.0 50.0
Stab i 1 i ty 50.1 40.0 40.5 Low Cohes. 110.0 51.5 118.5
Stabi 1 i ty 53.4 54.1 59.-5 Med Cohes. 177.2 145.5 216.0
Stab i 1 i ty 57.7 58.4 66.0 High Cohes. 321.0 176.0 262.0
Stabi 1 ity 45.7 60.5 36.8 Low Cohes. 351.0 168.0 (4) 311.0 (2)
Stabi 1 ity 45.6 45.8 41.5 Med Cohes. 323.0 535.1 542.0
Stability 40.9 46.7 48.6 High Cohes• 280.0 646.5 523.0
Stabi I i ty 36.2 17.4 ( 1) 40.1 (2) Low Cohes· 30.0 &oecimen too weak ioecimen too weak Stab i 1 i ty 37.7 48.8 46.0
Med Cohes, 33.0 28.0 31.0 Stability 38.7 50.3 49.1
High Cohes. 28.0 32.0 45.0
Stab i 1 i ty 48.3 34.8 46.3 Low Cohes. 61.0 22.35 61.7
Stabi 1 ity 47.4 54.5 53.7 Med Cohes. 70.0 70.3 112.0
Stability 47.5 52.3 56.8 High Cohes. 101.5 104.0 133.1
Stability 44.8 34.2 45.0 Low Cohes. 166.1 60.5 141.0
Stability 44.9 45.2 50.8 Med Cohes. 183.8 149.0 315.0
Stabi 1 ity 42.7 44.7 55.1 High Cohes. 171.2 299.0 357.0
California
28.4 88.0 (3)
29.5 98.0 34.9
126.0
45.4 124.6
57.3 179.6
55.9
397.3 40.7
387.0 (3)
44.6 418.0
53.1 303.0
-
53.3 70.0 (~
51.2 spec. too weak
57.8 58.0
38.9 41.1
37.2 87.3
39.1 90.6 41.8
162.4 44.3
285.0 44.4
314. 1
(1) Compactive Effort Low- 10 blows, one face only
(3) Compactive Effort Low - 100 tamps Medium - 150 tamps High - 200 tamps
(4) Compactive Effort Low - 20 blows
(2) Compactive Effort Low - 25 psi
Test Section
Chi I dress us 287
25-42-9
Matador us 70
25-145-8
Sherman SH 5
1-47-3
Cooper SH 24 1-136-3
Cumby IH 30 1-9-13
Clifton SH 6
9-258-7
Waco us 84 9-55-8
Robinson us 77
9-209-1
Milano SH 36 17-185-4
Bryan Spur 308 17-599-1
Tam ina IH 45 12-110-4
Conroe FM 1485 12-1062-35
Baytown Spur 330 12-508-7
Orange SH 12 20-499-3
Bridge City IH 87
20-306-3
TABLE 8 DENSITY AND STABILITY VALUES OF LABORATORY COMPACTED
SPECIMEN - TEXAS HIGHWAY DEPARTMENT LABORATORY
Air Voids, Percent Stability Values
Low Medium High Low Medium Compactive Compactive Compactive Compactive Compactive
Effort Effort Effort Effort Effort
3.2 1.9 1.9 42 38
3.1 2.5 1.9 42 33
5.8 5.2 4.7 41 41
7.6 5.5 4.8 41 44
4.9 3.8 3.1 30 34
1.9 1.0 0.9 50 47
4.1 3.3 2.3 44 44
7.8 6.9 5.5 35 35
9.8 9.3 8.4 30 30
5.7 4.7 4.2 38 41
3.5 3.0 3.1 41 43
High Compactlve
Effort
33
22
49
46
37
45
46
35
32
43
43
Q
~ .. ~ ~ 0~ ~"' "J!I :gm
g z
~ ~ i!; Ul .. ~
99 .. 97 .. l.NE OF EOUALrTY
9&
94
93
92
91
90
89
TTl DENSITY, PERCENT OF THEORETICAL MAXIMUM (RICE COMPARISON)
TEXAS TRANSPORTATION INSTITUTE'S VERSUS TEXAS HIGHWAY DEPARTMENT'S
COMPACTIVE PROCEDURE
AGURE 8
20
18
, . . .. 14
lME OF EQUALJTY
12
10 12 14 16 18 20
AIR VOIDS, PERCENT (THO IIETHOO)
RELATIONSHIP BETWEEN THO AND CORPS OF ENGINEERS GYRATORY METHOD OF COMPACTION
FIGURE 10
20
> ~ ID
i! rn
~
8 "' ... !II ..J
~ K! ! !i "' u
"' ~
~ "' <!
85
••
.••
••
2&
20
08
0 6
02
00
..
•• •• • • TTl STABILITY
COMPARISON OF STABILITY VALUES OBTAINED IN THE TEXAS TRANSPORTATION
INSTITUTE'S LABORATORY WITH THOSE . OBTAINED IN THE TEXAS HIGHWAY
DEPARTMENT'S LABORATORY
FIGURE 9
...
..
. ::;: .·.~ -
10 12 14 16 18 20
AIR VOIDS, PERCENT (THO METHOD)
RELATIONSHIP BETWEEN THO AND MARSHALL METHOD OF COMPACTION
AGURE II
LINE OF EQUALITY.
10 12 14 I& 18 20
AIR VOIOS, PERCENT (THO METHOD)
RELATIONSHIP BETWEEN THD AND CALIFORNIA METHOD OF COMPACTION
AGURE 12
A regression analysis on the density data collected from the various
compaction methods suggests that
where:
DG = density of specimen compacted in the Corps of Engineers
gyratory testing machine (100 psi pressure)
DT = density of specimen compacted in the Texas gyratory shear press
(150 psi end point pressure).
This relationship has a coefficient of determination equal to 0.74.
Similarly a linear relationship was found to exist between the Marshall and
THD method.
DM = -0.67 + 1.27 DT
where:
DM = density of specimen compacted by the Marshall method (SO blows)
per face 10-pound hammer 18-inch drop).
These figures suggest that the Texas method produces a more dense
mix than any of the other three compaction methods investigated for the
majority of the mixtures under study.
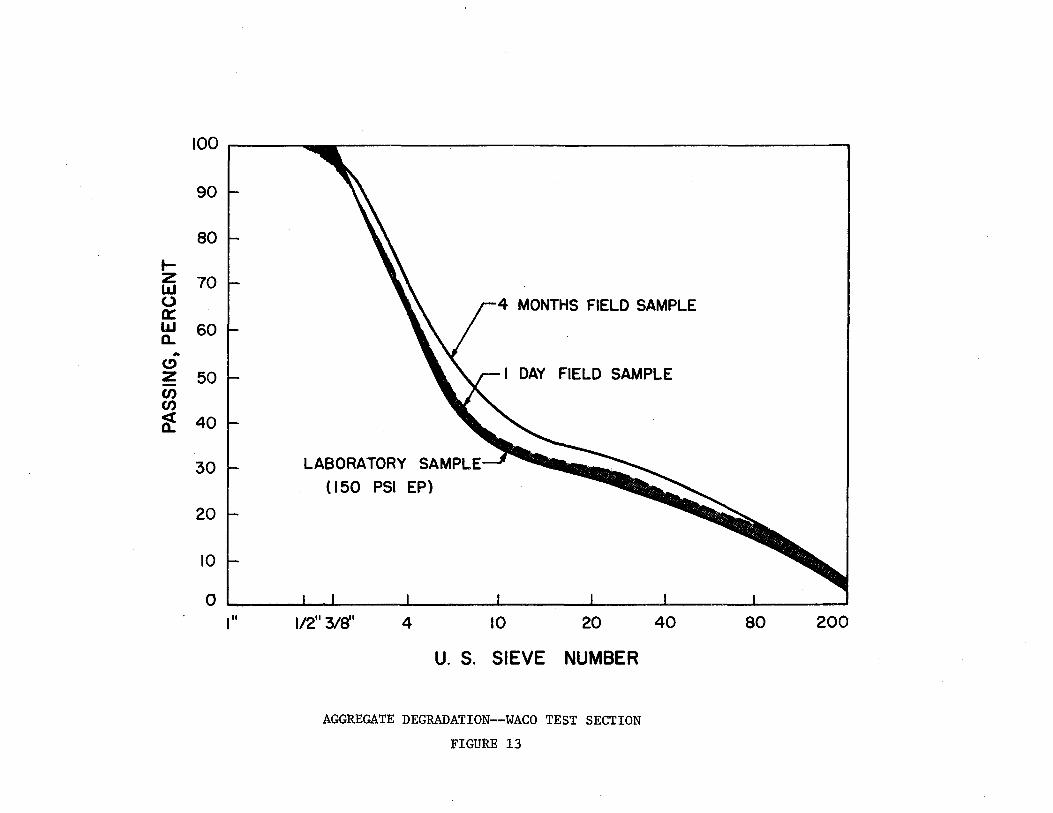
Aggregate Degradation: Concern has been expressed by several in
vestigators that aggregates degrade during the mixing and compaction
process both in the field and the laboratory. Figure 13, which represents
typical data collected in this project, suggests that little degradation
takes place that cannot be explained by differences in sampling and
degradations created by the coring operation. In particular, this figure
29
shows the gradation of the aggregate after a sample of mixture obtained
from the field has been compacted in the normal manner in the laboratory
and the asphalt removed, the gradation from a core sample obtained from the
field after construction and before traffic was allowed on the surface,
and the gradation after 4 months of traffic. The original gradation
determined from the THD samples of the hot bins is not shown; however,
it falls in the shaded area between the laboratory and one-day samples.
The gradation of the one-year sample is not shown; however, it also
falls within the shaded region. Gradation curves showing degradation for
all field sites are shown in Appendix B.
30
100
90
80
1-z 70 LLJ 0 a:: LLJ 60 a.. .. (!) z 50 -C/) C/)
~ 40
30
20
10
0 I"
4 MONTHS FIELD SAMPLE
I DAY FIELD SAMPLE
LABORATORY SAMPLE (150 PSI EP)
1/2"3/fi' 4 10 20
U. S. SIEVE NUMBER
AGGREGATE DEGRADATION--WACO TEST SECTION
FIGURE 13
40 80 200
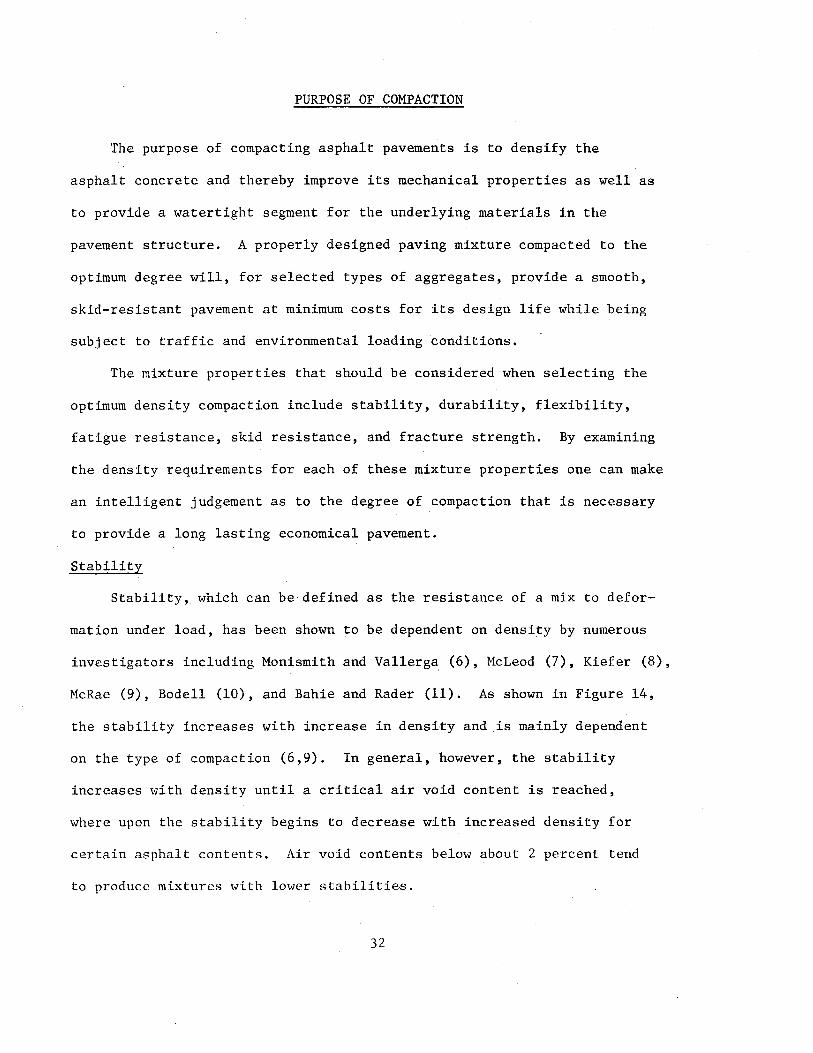
PURPOSE OF COMPACTION
The purpose of compacting asphalt pavements is to densify the
asphalt concrete and thereby improve its mechanical properties as well as
to provide a watertight segment for the underlying materials in the
pavement structure. A properly designed paving mixture compacted to the
optimum degree will, for selected types of aggregates, provide a smooth,
skid-resistant pavement at minimum costs for its design life while being
subject to traffic and environmental loading conditions.
The mixture properties that should be considered when selecting the
optimum density compaction include stability, durability, flexibility,
fatigue resistance, skid resistance, and fracture strength. By examining
the density requirements for each of these mixture properties one can make
an intelligent judgement as to the degree of compaction that is necessary
to provide a long lasting economical pavement.
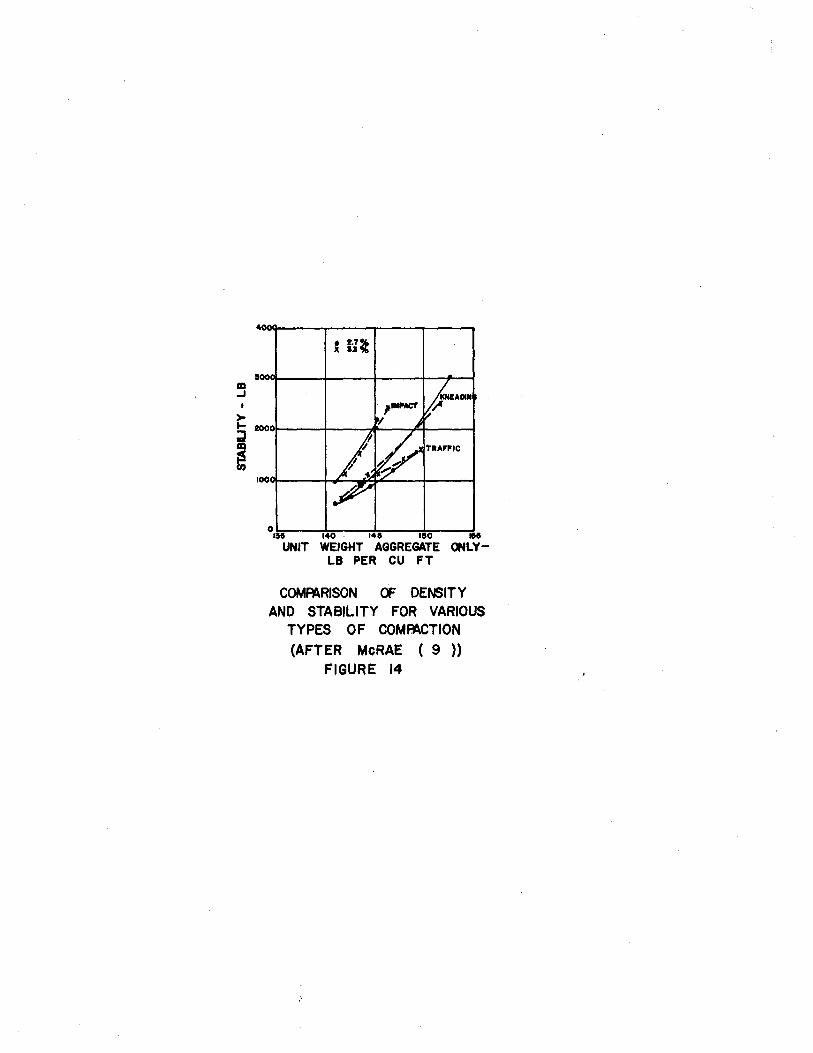
Stability
Stability, which can be·defined as the resistance of a mix to defor
mation under load, has been shown to be dependent on density by numerous
investigators including Monismith and Vallerga (6), McLeod (7), Kiefer (8),
McRae (9), Bodell (10), and Bahie and Rader (11). As shown in Figure 14,
the stability increases with increase in density and is mainly dependent
on the type of compaction (6,9). In general, however, the stability
increases with density until a critical air void content is reached,
where upon the stability begins to decrease with increased density for
certain asphalt contents. Air void contents below about 2 percent tend
to produce mixtures with lower stabilities.
32
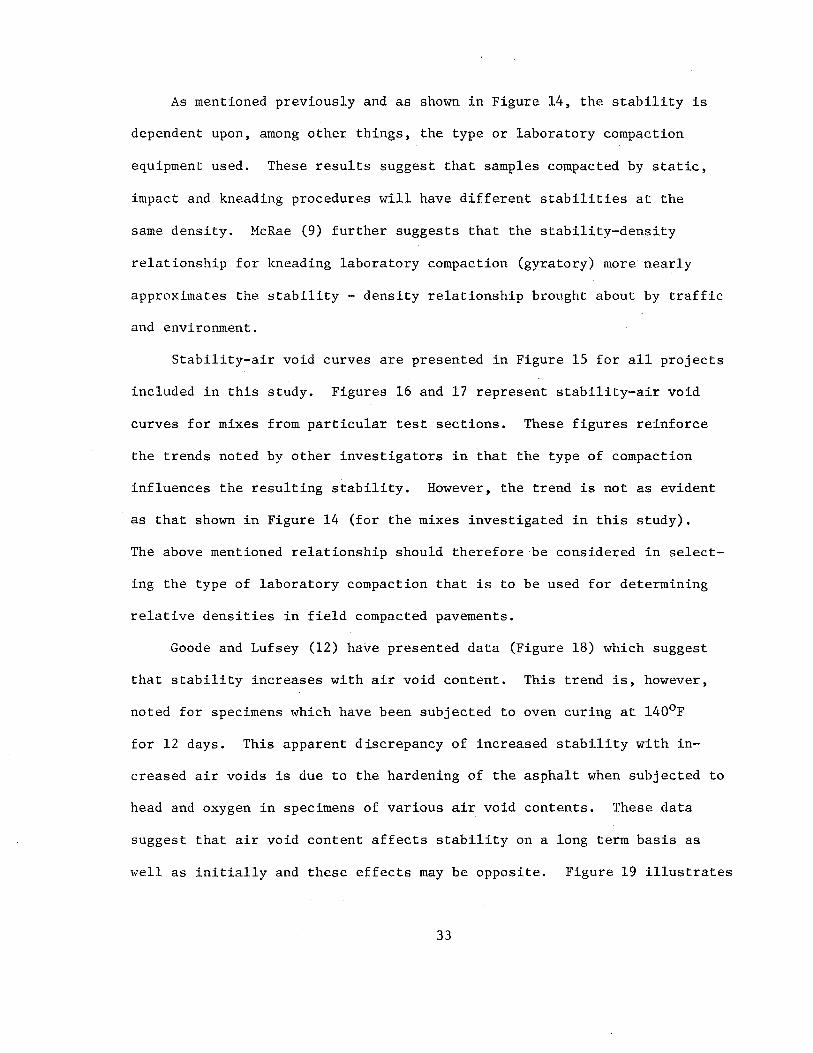
As mentioned previously and as shown in Figure 14, the stability is
dependent upon, among other things, the type or laboratory compaction
equipment used. These results suggest that samples compacted by static,
impact and kneading procedures will have different stabilities at the
same density. McRae (9) further suggests that the stability-density
relationship for kneading laboratory compaction (gyratory) more nearly
approximates the stability - density relationship brought about by traffic
and environment.
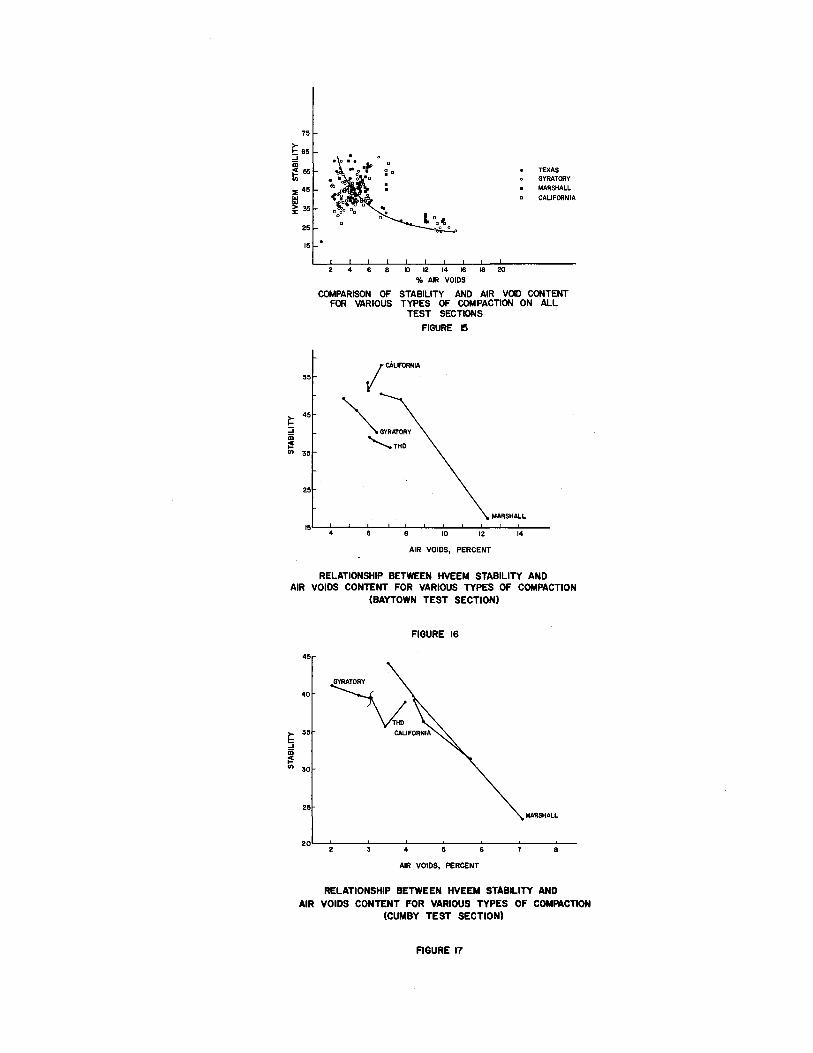
Stability-air void curves are presented in Figure 15 for all projects
included in this study. Figures 16 and 17 represent stability-air void
curves for mixes from particular test sections. These figures reinforce
the trends noted by other investigators in that the type of compaction
influences the resulting stability. However, the trend is not as evident
as that shown in Figure 14 (for the mixes investigated in this study).
The above mentioned relationship should therefore be considered in select
ing the type of laboratory compaction that is to be used for determining
relative densities in field compacted pavements.
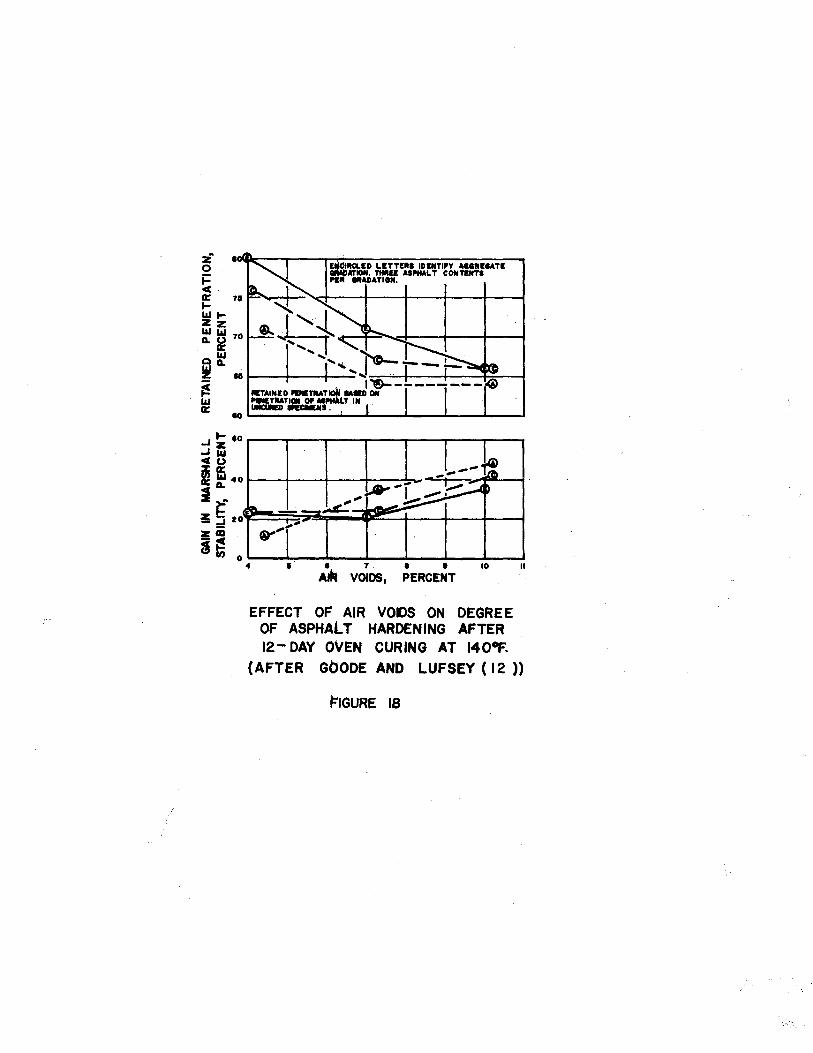
Goode and Lufsey (12) have presented data (Figure 18) which suggest
that stability increases with air void content. This trend is, however,
noted for specimens which have been subjected to oven curing at 140°F
for 12 days. This apparent discrepancy of increased stability with in
creased air voids is due to the hardening of the asphalt when subjected to
head and oxygen in specimens of various air void contents. These data
suggest that air void content affects stability on a long term basis as
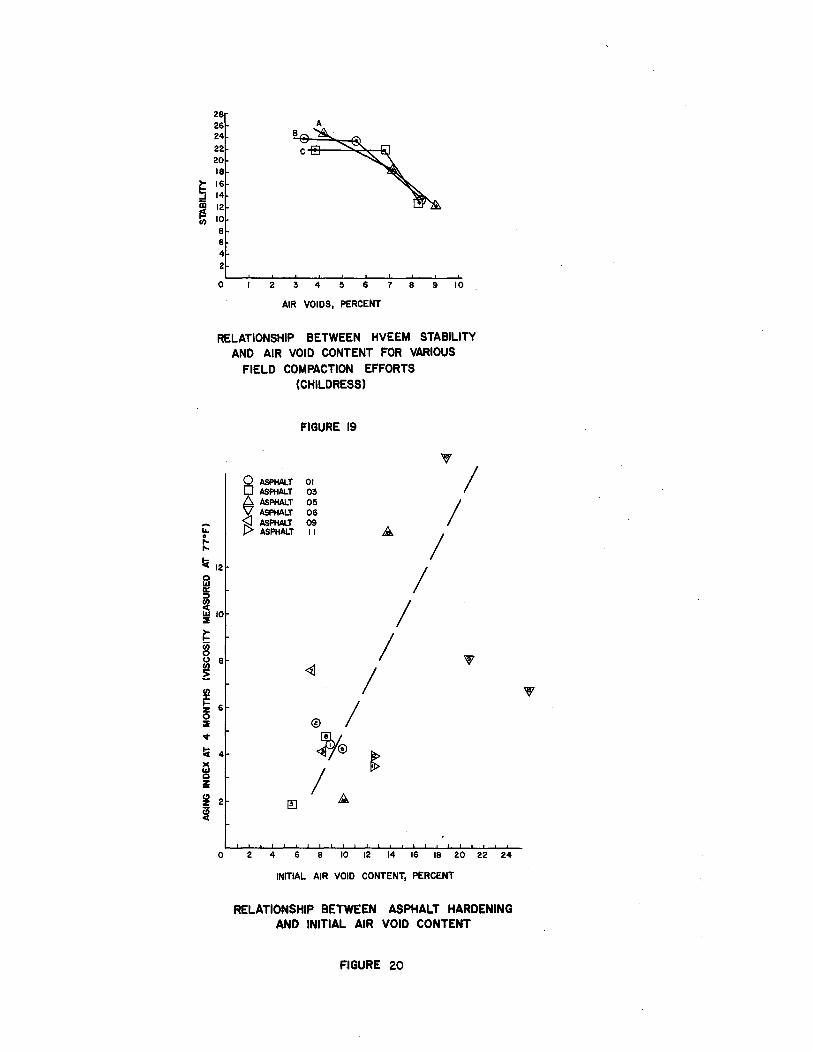
well as initially and these effects may be opposite. Figure 19 illustrates
33
• 2.7'!1. ll U%
0,,=~~--~,.o:::---~,.~~..---.:,llb:o-~1111 UNJT WEIGHT AGGREGATE <»>LY
LB PER CU FT
COMR\RISON CF DENSITY AND STABILITY FOR VARIOUS
TYPES OF COMB\CTION (AFTER McRAE ( 9 ))
FIGURE 14
75
> I- 65 :::; iii ~55 ::E 45
"' ~35 25
15
55
2 4 6 a o ~ ~ ~ ~ ro % AI! VOIDS
TEXAS GYRATORY MARSHALL CALIFORNIA
COMPARISON OF STABILITY AND AIR VOID CONTENT FOR VARIOUS TYPES OF COMPACTION ON ALL
TEST SECTIONS
FIGURE 15
lcAufoRNIA
45 "'
"" GYRATORY 'THO
35
25
MARSHALL
15L--'4:---'-~:----'-~8~-'--':IO~...L----LI2_....__.....,14--
AIR VOIDS, PERCENT
RELATIONSHIP BETWEEN HVEEM STABILITY AND AIR VOIDS CONTENT FOR VARIOUS TYPES OF COMPACTION
(BAYTOWN TEST SECTION)
FIGURE 16
45
40
~ 35
...J iii t! "' 30
25 MARSHALL
20L---'------'------'4----~5----~6----~-----s~--
AIR VOIDS, PERCENT
RELATIONSHIP BETWEEN HVEEM STABILITY AND AIR VOIDS CONTENT FOR VARIOUS TYPES OF COMPACTlON
(CUMBY TEST SECTION)
FIGURE 17
-c-'--~k Ia.
----~-~b ·-~
ty'f~ I • 1. • • 10 II
Afh VOIDS, PERCENT
EFFECT OF AIR VOIDS ON DEGREE OF ASPHAlT HARDENING AFTER 12- DAY OVEN CURING AT 1400f'.
(AFTER GCJODE AND LUFSEY ( 12 ))
FIGURE IS
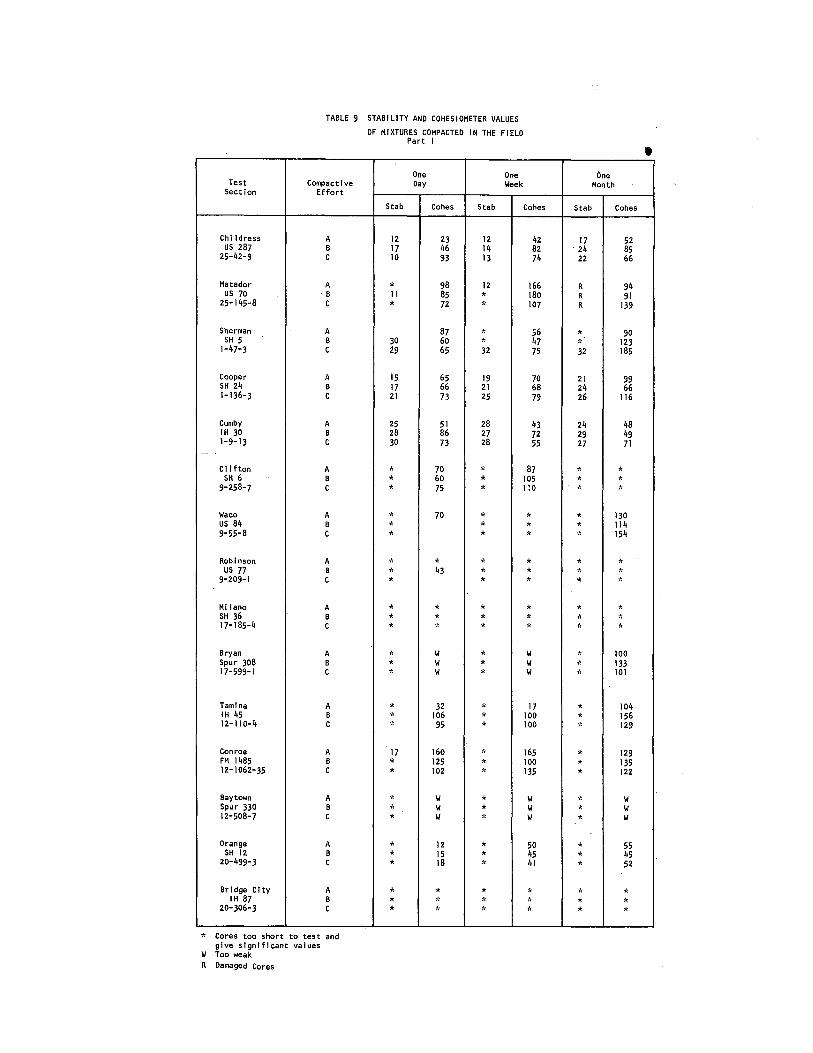
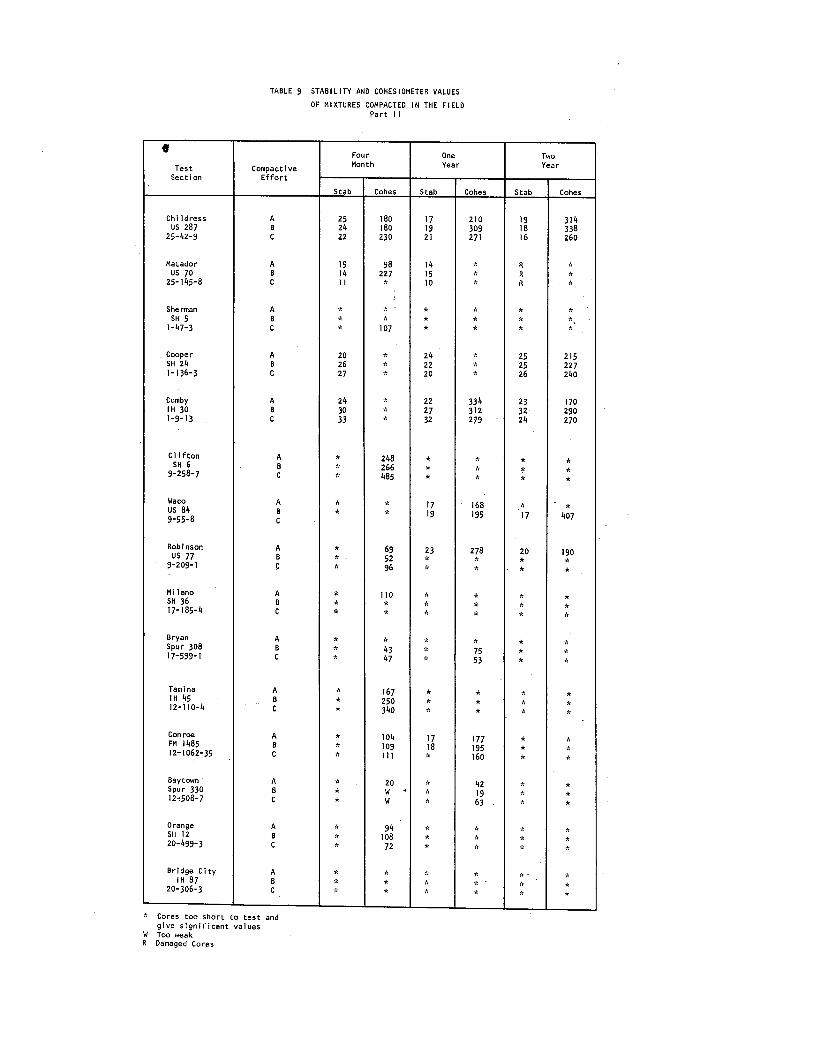
the effect of high density on stability for a mix compacted in the field.
Stability and cohesiometer values for all mixtures compacted in the field
are shown in Table 9.
Durability
The durability of a paving mixture (resistance to weathering and the
abrasive action of traffic) is dependent upon density (Figure 18) (7,
12, 13, 14). Although the absolute volume of air is not as important as
the degree of interconnection of air voids, the dependence upon absolute
density is nevertheless evident. The interconnected voids permit the
intrusion of air and water into the pavement which in turn oxidizes the
asphalt thereby creating a stiff and more brittle mix. These stiff and
brittle mixes often fail as they can no longer withstand the repeated
deflections imposed by traffic.
The increase in viscosity after four months of service expressed in
terms of relative viscosity is shown in Figure 20 for several test sections.
Although several asphalts were used which age at different rates and the
pavements were subjected to various environments, the trend of increased
relative viscosity with high air voids is evident.
If the volume and interconnection of voids·in a pavement is such
that water is transmitted to the base course, the pavement may fail due to
loss of strength in the base material.
Tensile Strength
The presence of voids in asphalt concrete has essentially two effects
on tensile strength. First, the presence of voids reduces the effective
cross section of the stressed area and thereby reduces its potential
strength; and second, the voids act as inducers of highly localized
37
28 26 24
22 20 18
~ 16 5 14
~ 12 V< 10
8 6 4 2
A B
0 2 3 4 5 6 7 8 9 10
AIR VOIDS, PERCENT
RELATIONSHIP BETWEEN HVEEM STABILITY AND AIR VOID CONTENT FOR VARIOUS
FIELD COMPACTION EFFORTS (CHILDRESS)
FIGURE 19
0 ASPHALT 01
~ASPHALT 03 ASPHALT 05
__, ASPHALT 06 "l>-1 ASPHALT 09 [:> ASPHALT I I
I Jb!®
@] /A
I I
~
I I
I I
I
0 2 4 6 8 10 12 14 16 18 20 22 24
INITIAL. AIR VOID CONTENT, PERCENT
RELATIONSHIP BETWEEN ASPHALT HARDENING AND INITIAL AIR VOID CONTENT
FIGURE 20
Test Section
Chi I dress us 287
25-42-9
Matador us 70
25-145-8
Sherman SH 5
1-47-3
Cooper SH 24 1-136-3
Cumby lH 30 1-9-13
--Clifton
SH 6 9-258-7
Waco us 84 9-55-8
Robinson us 77
9-209-1
Milano SH 36 17-185-4
Bryan Spur 308 17-599-1
Tam ina IH 45 12-110-4
Conroe FM 1485 12-1062-35
Baytown Spur 330 12-508-7
Orange SH 12
20-499-3
Bridge City IH 87
20-306-3
TABLE 9 STABILITY AND COHESIOMETER VALUES
OF MIXTURES COMPACTED IN THE FIELD Part I
One One Compactive Day Week
Effort
Stab Cohes Stab
A 12 23 12 B 17 46 14 c 10 93 13
A * 98 12 ·B 11 85 * c * 72 *
A 87 * B 30 60 * c 29 65 32
A 15 65 19 B 17 66 21 c 21 73 25
A 25 51 28 B 28 86 27 c 30 73 28
A * 70 * B * 60 * c * 75 *
A * 70 * B * * c * *
A * * * B * 43 * c * *
A * * * B * * * c * *
,,
A * w * ·B * w * c * w *
A * 32 * B * 106 * c * 95 *
A 17 160 * B * 125 * c * 102 *
A * w * B * w * c * w *
A * 12 * B * 15 * c * 18 *
A * * * B * * * c * * *
* Cores too short to test and give signIficant values
W Too weak
R Damaged Cores
• One
Month
Cohes Stab Cohes
42 17 52 82 24 85 74 22 66
166 R 94 180 R 91 107 R 139
56 * 90 47 * 123 75 32 185
70 21 99 68 24 66 79 26 116
43 24 48 72 29 49 55 27 71
87 * * 105 * * 1 :o * *
* * 130
* * 114
* * 154
* * * * * * * * *
* * * * * * * * *
w * 100 w * 133 w * 101
17 * 104 100 * 156 100 * 129
165 * 129 100 * 135 135 * 122
w * w w * w w * w
50 * 55 45 * 45 41 * 52
* * * * * * * * *
t
Test Section
Chi I dress us 287
25-42-9
Matador us 70
25-145-8
Sherman SH 5
1-47-3
Cooper SH 24 ]"] 36-3
Cumby IH 30 1-9-13
Clifton SH 6
9-258-7
Waco us 84 9-55-8
RobInson us 77
9-209-1
Milano SH 36 17-185-4
Bryan Spur 308 17-599-1
Tami na IH 45 12-110-4
Conroe FM 1485 12-1062-35
Baytown Spur 330 12"508-7
Orange SH 12 20-499-3
Bridge City I H 87
20-306-3
TABLE 9 STABILITY AND COHESIOMETER VALUES
OF MIXTURES COMPACTED IN THE FIELD Part II
Four One
Compactive Month Year
Effort
Stab Cohes Stab
A 25 180 17 B 24 180 19 c 22 230 21
A 15 98 14 B 14 227 15 c II * 10
' A * * * B * • * c * 107 *
A 20 * 24 B 26 * 22 c 27 * 20
A 24 * 22 B 30 * 27 c 33 * 32
A * 248 * B * 266 * c * 485 * A * * 17 B * * 19 c
A * 69 23 B * 52 * c * 96 *
A * 110 * B * * * c * * *
A * * • B * 43 * c * 47 *
A * 167 * B * 250 * c * 340 *
A * 104 17 B * 109 18 c * Ill *
A * 20 * B • w . * c * w *
A ,, 94 * B * 108 ,,
c * 72 *
A * * ~" B * ~r }" c }': * *
* Cores too short to test and give significant values
W Too weak R Damaged Cores
Two Year
Cohes Stab Cohes
210 19 314 309 18 338 271 16 260
* R ,, * R * * R •
* * * * * * * * •
* 25 215
* ·25 227
* 26 240
334 23 170 312 32 290 279 24 270
* * * * * * * * *
168 * * 195 17 407
278 20 190
* * * * * *
* * * * * * * * *
* ,, * 75 * *
53 * *
* * * * * * * * *
177 * * 195 * * 160 * *
42 * * 19 ~" * 63 * *
* * * * * * * * *
* *-,, ,, * *
stresses (15). The magnitude of the increased stress is dependent upon
the size and shape of the void which in turn is dependent primarily upon
the type and amount of compaction.
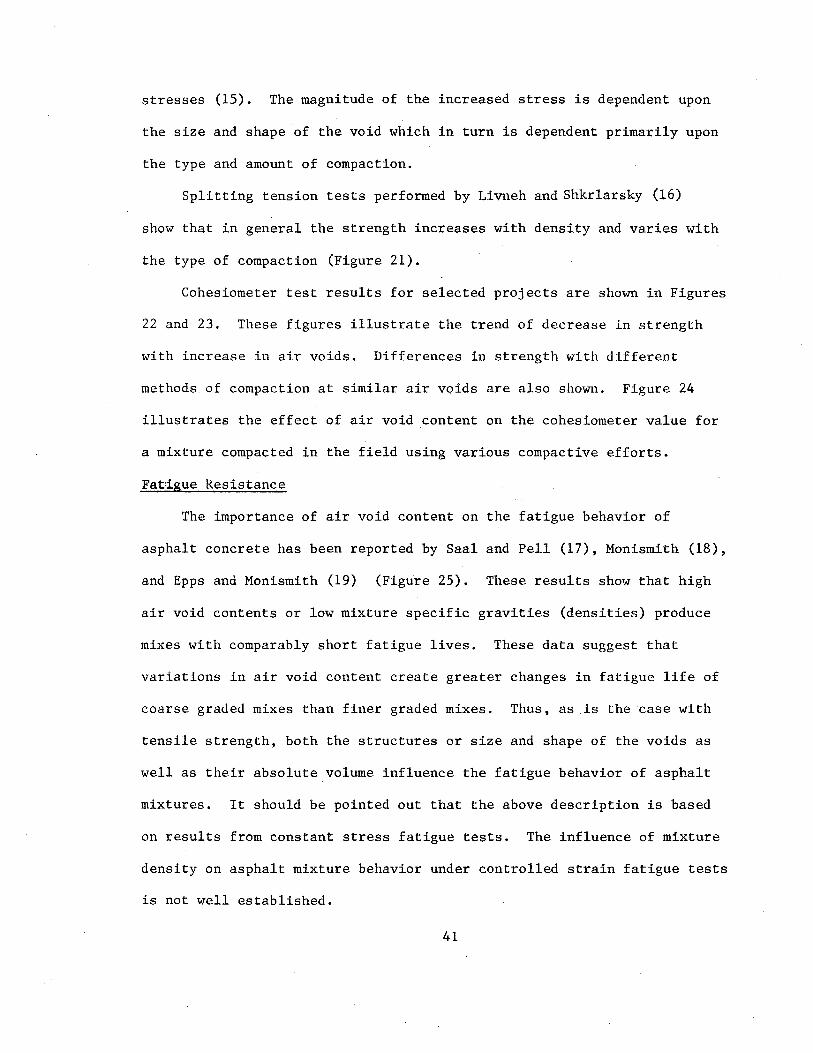
Splitting tension tests performed by Livneh and Shkrlarsky (16)
show that in general the strength increases with density and varies with
the type of compaction (Figure 21).
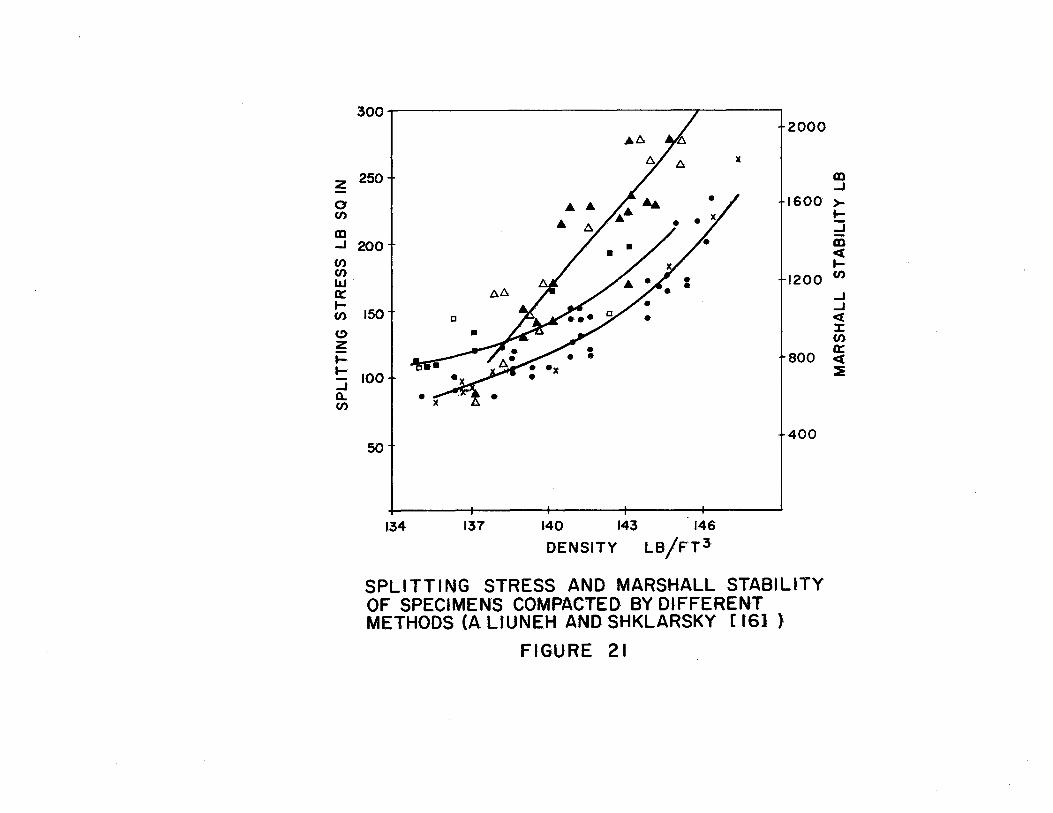
Cohesiometer test results for selected projects are shown in Figures
22 and 23. These figures illustrate the trend of decrease in strength
with increase in air voids. Differences in strength with different
methods of compaction at similar air voids are also shown. Figure 24
illustrates the effect of air void content on the cohesiometer value for
a mixture compacted in the field using various compaetive efforts.
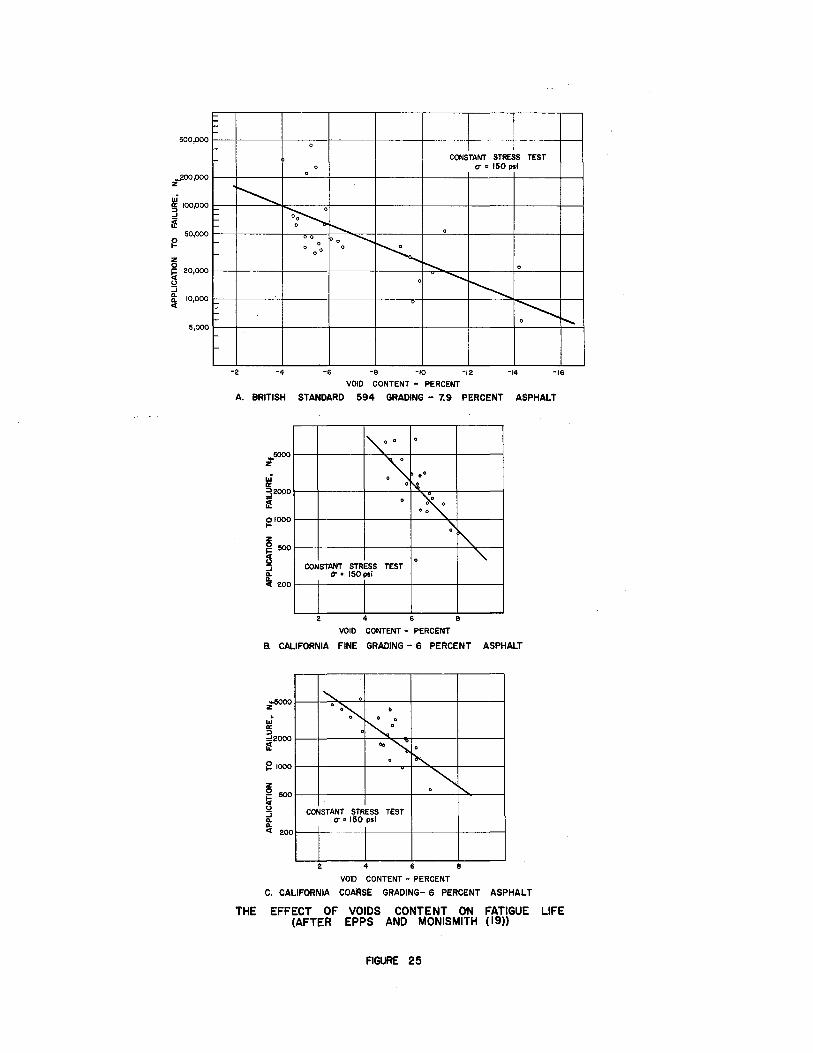
Fat'igue Resistance
The importance of air void content on the fatigue behavior of
asphalt concrete has been reported by Saal and Pell (17), Monismith (18),
and Epps and Monismith (19) (Figure 25). These results show that high
air void contents or low mixture specific gravities (densities) produce
mixes with comparably short fatigue lives. These data suggest that
variations in air void content create greater changes in fatigue life of
coarse graded mixes than finer graded mixes. Thus, as is the case with
tensile strength, both the structures or size and shape of the voids as
well as their absolute volume influence the fatigue behavior of asphalt
mixtures. It should be pointed out that the above description is based
on results from constant stress fatigue tests. The influence of mixture
density on asphalt mixture behavior under controlled strain fatigue tests
is not well established.
41
300 . 2000
z 250 m ..J -
0 (f)
1600 >-r-
m :J ..J 200 m
<1: (f) (f) L&J 0: 1-(f)
(!)
z 1-1-..J Q.. (f)
1-1200 (f)
150
800
100
I t400 50
134 137 140 143 146
DENSITY LB/FT3
SPLITTING STRESS AND MARSHALL STABILITY OF SPECIMENS COMPACTED BY DIFFERENT METHODS (A LIUNEH AND SHKLARSKY [ 16], )
FIGURE 21
..J
..J <1: :I: (f)
0: <1: ::E
140
120
410
;:i10
jno
luo
210
210
110
130
1&0
140
oao
1120
110
r 90
eo
70
eo
0 2 3 4 6 7 8 9 10
AIR VOIDS , PERCENT
AELATION BETWEEN COHESIOMETER VALUE AND AIR VOID CONTENT FOR \MIOUS MEfHOOS OF LABORATORY
COMPACT
FIGURE 22
AIR VOIDS , PERCENT
RELATIONSHIP BETWEEN eot£SIOMETER \tWJE AND AIR VOO CONTENT FOR VARiOus METHODS
t7 I.ABORA'TORY COMPACTION-ROUNDED SILICEOUS
FIGURE 23
0-. c
-A 1 • 9 10
AIR VOIDS , PERCENT
RELATIONSHIP BETWEEN COHESIOMETER VALUE AN0 AIR VOID CONTENT FOR \ARIOUS
AMOUNTS OF FiELD COMPACtiON (COOPER TEST SECTION )
FIGURE 24
12
,,
A. BRITISH
.. 5000 z
~ ;;j2000
~ 01000 1-
z 0 500
3 ::i Q.
Ia 200
I ... .,. ---
CONSTANT STRESS TEST cr • 150 psi
-6 -s -1o -12 -14 -16
VOID CONTENT - PERCENT
STANDARD 594 GRADING - 7.9 PERCENT ASPHALT
"'0 0 0
~ o• 0 t'4.
0
·~ 0
)' 0 "\.
CONSTANT STRESS TEST (T. 150 psi
2 4 6 8
VOID CONTENT - PERCENT
B. CALIFORNIA FINE GRADING - 6 PERCENT ASPHALT
" 0
0~ 0
K .. 0 .. ~ 0
0 ~
.~ I'-. ~ 1000
CONSTANT STRESS TEST
H-cr • 150 psi
2 4 6 8
VOID CONTENT - PERCENT
C. CALIFORNIA COARSE GRADING- 6 PERCENT ASPHALT
THE EFFECT OF VOIDS CONTENT ON FATIGUE LIFE (AFTER EPPS AND MONISMITH (19))
FIGURE 25
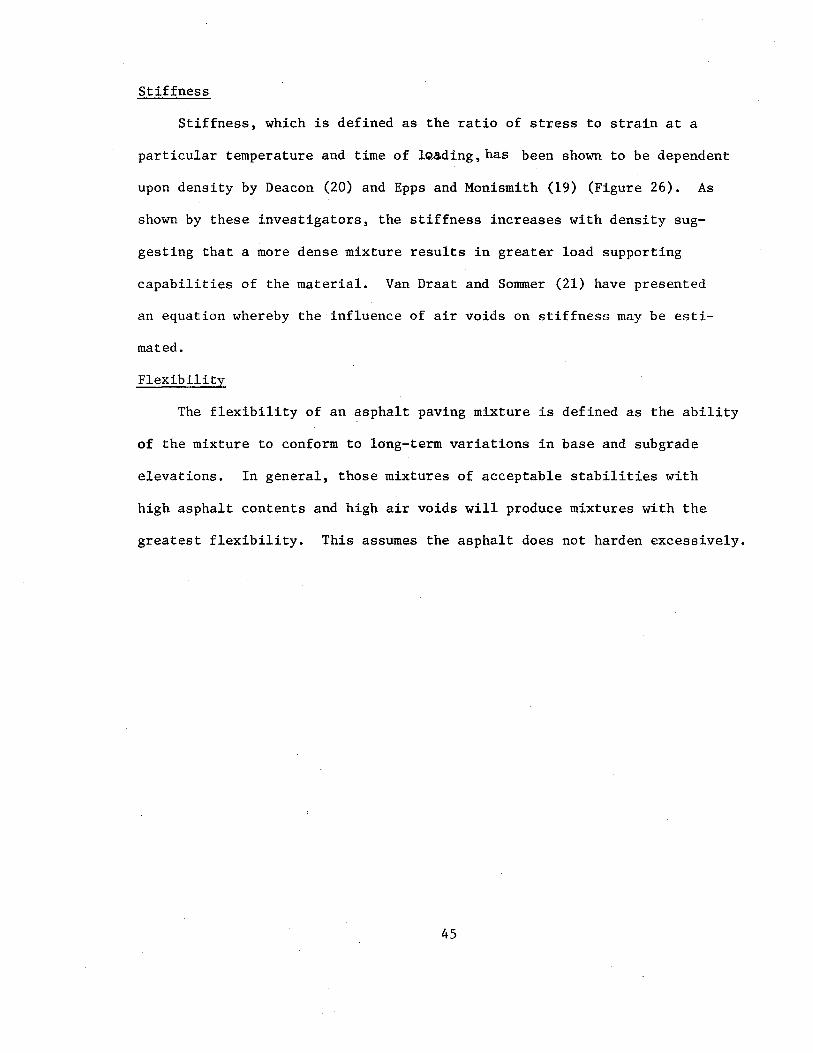
Stiffness
Stiffness, which is defined as the ratio of stress to strain at a
particular temperature and time of lGading, has been shown to be dependent
upon density by Deacon (20) and Epps and Monismith (19) (Figure 26). As
shown by these investigators, the stiffness increases with density sug
gesting that a more dense mixture results in greater load supporting
capabilities of the material. Van Draat and Sommer (21) have presented
an equation whereby the influence of air voids on stiffness may be esti
mated.
Flexibility
The flexibility of an asphalt paving mixture is defined as the ability
of the mixture to conform to long-term variations in base and subgrade
elevations. In general, those mixtures of acceptable stabilities with
high asphalt contents and high air voids will produce mixtures with the
greatest flexibility. This assumes the asphalt does not harden excessively.
45
~ 800
o2 •• z =- 600
~~ ~
~G: ~ 400
~~ 200
~· ..l ... 0 0
............... Oo 0
00
~ ~ 0 0 0 0 0
0 0
~ 0
.......
~ 0
~ 0
~
4 6 8 10 12 14
VOID CONTENT - PERCENT
-
A. BRITISH STANDARD 594 GRADING- 7.9 PERCENT ASPHALT
~ 0-i ..
z Ill-Ill I&IO ~Ill
~ffi Q.
~Ill !::~ z
400
3110
300
250
200
150
2
B. CALIFORNIA
..............
4
VOID
FINE
rr • 1!0 psi
~ 0
0
0
~ 0 ~ ~
0 ' 6 8 10
CONTENT - PERCENT
GRADING - 6 PERCENT ASPHALT
rr • 160 psi
'~o 0
0 0 ., ~oo
0 0
0
~ 0 0
0
"' 0
2 4 6 B 10
VOID CONTENT - PERCENT
C. CALIFORNIA COARSE GRADING- 6 PERCENT ASPHALT
RELATIONSHIPS BETWEEN INITIAL STIFFNESS MODULUS AND AIR VOID CONTENT - GRANITE AGGREGATE (AFTER
EPPS AND MONISMITH ( 19))
FIGURE 26
FACTORS INFLUENCING INITIAL COMPACTION OF PAVEMENTS
The main purpose of this study is to define the factors which control
the ultimate density of a pavement. The factors which control the ultimate
term density have been separated for convenience into those variables
which influence initial density and long term density. The factors which
control the initial density will be discussed in hopes that the important
variables can be recognized and separated from those variables which
have a secondary effect on the compaction process.
Initial Density
The initial density of the pavement is dependent upon the compact
ability of the mix or the ease with which it can. be compacted, the type
of compaction equipment, the rolling sequence and procedure, and the timing
of the compaction processes.
The compactability of a mix is dependent on material properties, mix
design, subgrade support, thickness of lift, temperature of mix, weather
conditions during placement, and moisture in the mix is to be determined.
Material Properties
Considerable information has been published concerning the effects
of aggregates and asphalts on compaction. The effect of temperature on
asphalt viscosity and therefore the influence of temperature on compact
ability has been reported widely. The effect of aggregate characteristics,
however, will be discussed initially.
Aggregate Characteristics
Santucci and Schmidt (22) in addition to Bahri and Rader (11)
suggest that the filler-bitumen ratio influences the density of a mix for
47
a given compactive effort. Furthermore, Santucci and Schmidt (22)
suggest that an optimum filler-bitumen ratio exists for maximum density at
a particular compactive effort (Figure 27).
In addition to the amount of filler present in a mix, Kallas and
Krieger (23) have shown that the type of filler influences density (Figure 28).
Therefore, not only the chemical characteristics of the filler or aggre-
gate can influence compaction (24) but also its top size and grading (25).
Fromm (26) and Bright et al. (27) have reported that crushed materials
are more difficult to compact than aggregates with smoother surface tex
tures. This conclusion is supported by "pavement toughness" tests con
ducted by Santucci and Schmidt (24) which show that the angu~ar rough
surfaced textured granite is more difficult to displace than the rounded
gravel mix compacted at the same temperature (Figure 29). Thus, as suggested
by Schmidt et al. (28), mixes can be adjusted to give optimum compaction
characteristics for particular compaction conditions by adjusting aggregate
grading which includes filler content, size of filler and/or changing
the amount of angular and/or rough textured aggregates in the mix.
Tests performed using the Triaxial Institute Kneading Compactor
suggest that aggregate gradation also influences the amount of compactive
effort required to provide a given density in a mix of equal asphalt
content and identical aggregates (29). These tests also illustrate the
effect of aggregate surface characteristics on compaction.
Table 10 describes the type, source, grading, and maximum sizes of
aggregates used in this study. Aggregate types included: siliceous
48
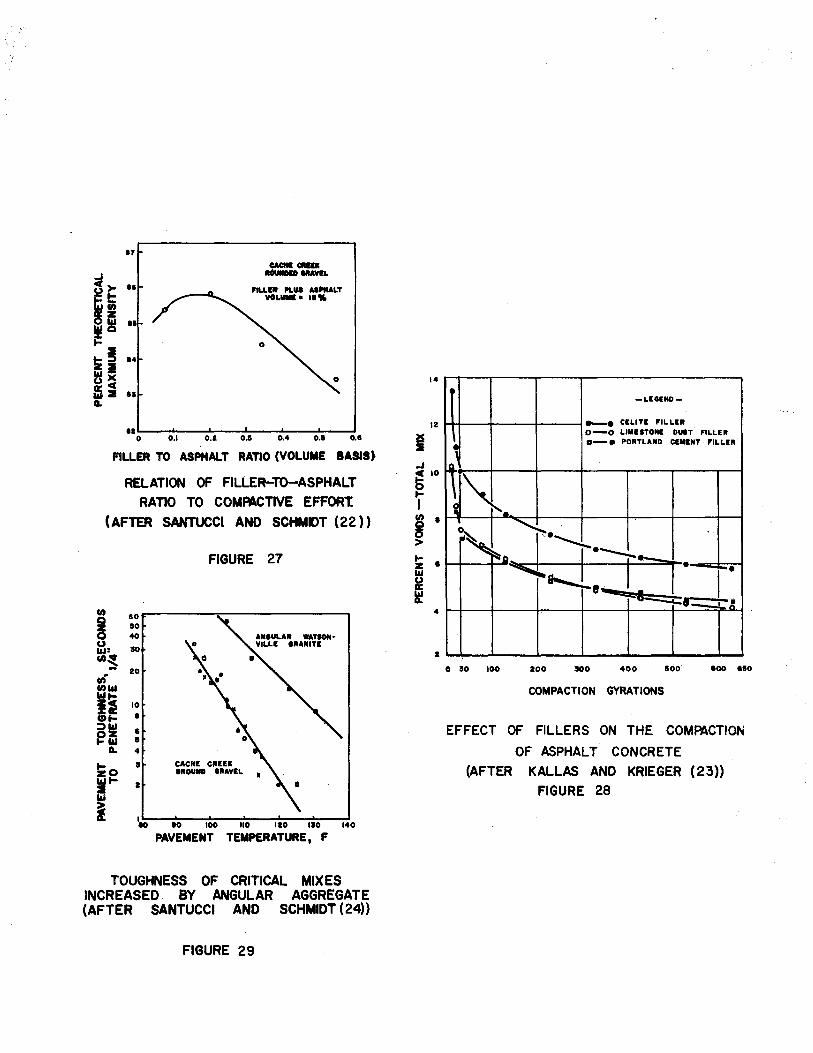
CACIII CIIIIIC IIOUIIDDIIIAYn
PIU.Ilt I'LUI AII'IIALT YOLUIIIE• II%
12'---~-~-.....L..--""----''-----' o o.1 o.2 o.a o.4 o.e 0.8
FILLER TO ASPHALT RATIO (VOLUME BASIS)
RELATION OF FILLER-TO-ASPHALT
RATIO TO COM~CTIVE EFFORT.
(AFTER SANTUCCI AND SCHMI>T (22))
FIGURE 27
(I) Q 80
! 50 40
CJ so ~= en~
10 .,; (I)~ =ti 10
~~ • ~~ I ~15 5
CL. 4
~0 I CACHE CIIEIIC
IIIOUIIO IIIAYIL wt- I
11.1
i I 10 eo 100 110 110 ISO 140
PAVEMENT TEMPERATURE, F
TOUGHNESS OF CRITICAL MIXES INCREASED BY ANGULAR AGGREGATE (AFTER SANTUCCI AND SCHMIDT ( 24))
FIGURE 29
14~r--,-----.----.------------------,
-LEGENO-
11 J.+.l---4-----....+------1-. CILITE FILLEII 0-0 LIIIISTONE OUIT fiLLEII a-a POIITLAND CEIIINT fiLLEII
2 ~~~---~--~----~--~----~~ 0 50 100 200 !00 400 1100 eoo eao
COMPACTION GYRATIONS
EFFECT OF FILLERS ON THE COMPACTION
OF ASPHALT CONCRETE
(AFTER KALLAS AND KRIEGER (23))
FIGURE 28
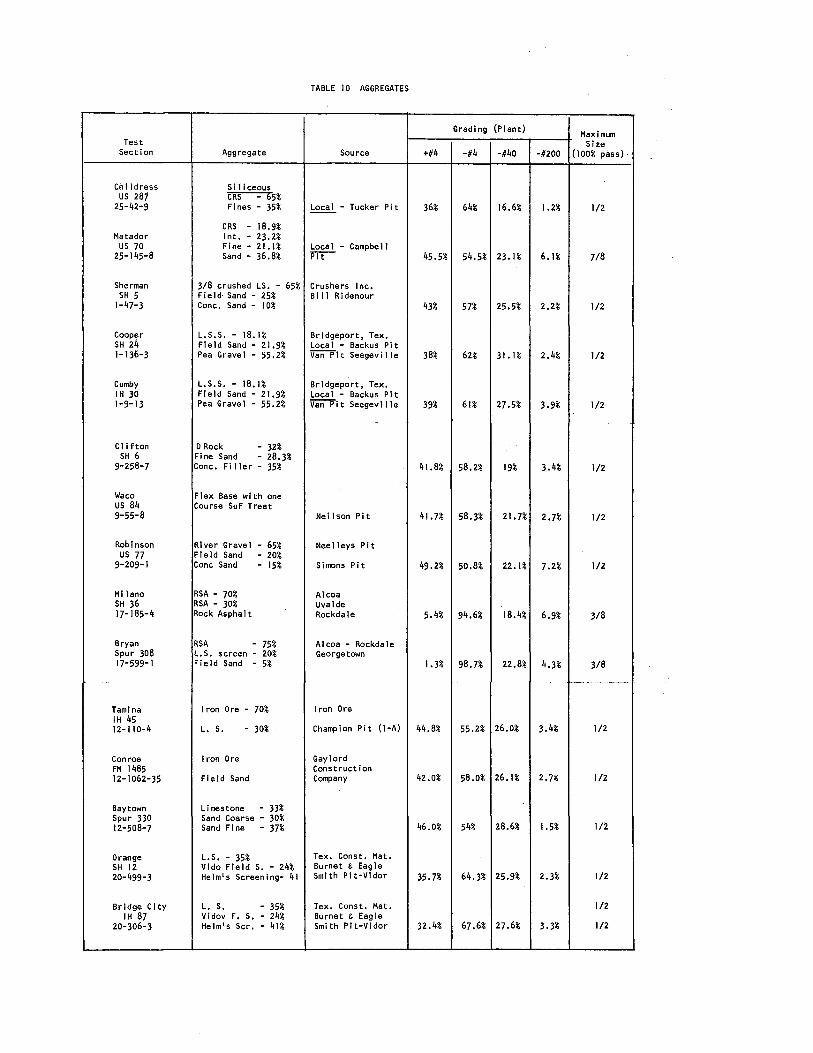
TABLE 10 AGGREGATES
Grading (Plant) Maximum Test Size
Section Aggregate Source +#4 -#4 -#40 -#200 ( 100% pass)·
Chi I dress Siliceous us 287 CRS - 65%
25-42-9 Fines - 35% Local - Tucker Pit 36% 64% 16.6% 1.2% 1/2
CRS - 18.9% Matador Int. - 23.2%
us 70 Fine - 21.1% Local - Campbe 11 25-145-8 Sand - 36.8% ~ 45.5% 54.5% 23.1% 6.1% 7/8
Sherman 3/8 crushed LS. - 65% Crushers Inc. SH 5 Fiel6 Sand - 25% Bill Ridenour
1-47-3 Cone. Sand - 10% 43% 57% 25.5% 2.2% 1/2
Cooper L.s.s. - 18.1% Bridgeport, Tex. SH 24 Field Sand- 21.9% Local - Backus Pit 1-136-3 Pea Gravel - 55.2% ii'BriPi t Seegev i 11 e 38% 62% 31.1% 2.4% 1/2
Cumby L.S.S. - 18.1% Bridgeport, Tex. IH 30 Field Sand- 21.9% Local - Backus Pit 1-9-13 Pea Gravel - 55.2% ii'BriPi t Seegev i 11 e 39% 61% 27.5% 3.9% 1/2
-
Clifton D Rock - 32% SH 6 Fine Sand - 28.3%
9-258-7 Cone. Filler - 35% 41.8% 58.2% 19% 3.4% 1/2
Waco Flex Base with one us 84 Course SuF Treat 9-55-8 Neilson Pit 41.7% 58.3% 21.7% 2.7% 1/2
Robinson River Gravel - 65% Nee lleys Pit us 77 Field Sand - 20%
9-209-1 Cone Sand - 15% Simons Pit 49.2% 50.8% 22.1% 7.2% 1/2
Mi lana RSA - 70% Alcoa SH 36 RSA - 30% Uvalde 17-185-4 Rock Asphalt Rockdale 5.4% 94.6% 18.4% 6.9% 3/8
Bryan RSA - 75% Alcoa - Rockdale Spur 308 L.S. screen - 20% Georgetown 17-599-1 Field Sand - 5% 1.3% 98.7% 22.8% 4.3% 3/8
f--- ----
Tam ina Iron Ore- 70% Iron Ore iH 45 12-110-4 L. S. - 30% Champion Pit (1-A) 44.8% 55.2% 26.0% 3.4% 1/2
Conroe Iron Ore Gaylord FM 1485 Construction 12-1062-35 Field Sand Company 42.0% 58.0% 26.1% 2.7:i; 1/2
Baytown Limestone - 33% Spur 330 Sand Coarse - 30% 12-508-7 Sand Fine - 37% 46.0% 54% 28.6% 1.5% 1/2
Orange L. s. - 35% Tex. Canst. Mat. SH 12 Vida Field s. - 24% Burnet & Eagle 20-499-3 Helm's Screening- 41 Smith Pit-Vidor 35.7% 64.3% 25.9% 2.3% 1/2
Bridge City L. S. - 35% Tex. Canst. Mat. 1/2 IH 87 Vidov F. S, - 24%. Burnet & Eagle
20-306-3 Helm's Scr. - 41% Smith Pit-Vidor 32.4% 67.6% 27.6% 3.3% 1/2
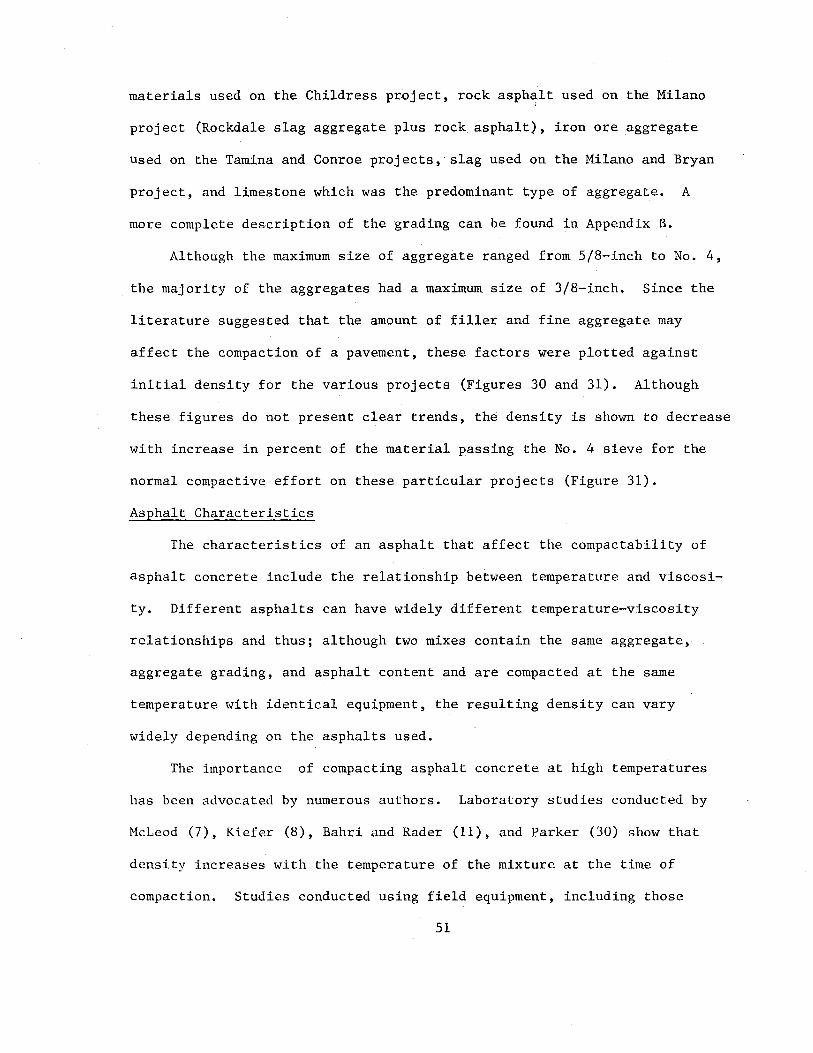
materials used on the Childress project, rock asphalt used on the Milano
project (Rockdale slag aggregate plus rock asphalt), iron ore aggregate
used on the Tamina and Conroe projects, slag used on the Milano and Bryan
project, and limestone which was the predominant type of aggregate. A
more complete description of the grading can be found in Appendix B.
Although the maximum size of aggregate ranged from 5/8-inch to No. 4,
the majority of the aggregates had a maximum size of 3/8-inch. Since the
literature suggested that the amount of filler and fine aggregate may
affect the compaction of a pavement, these factors were plotted against
initial density for the various projects (Figures. 30 and 31). Although
these figures do not present clear trends, the density is shown to decrease
with increase in percent of the material passing the No. 4 sieve for the
normal compactive effort on these particular projects (Figure 31).
Asphalt Characteristics
The characteristics of an asphalt that affect the compactability of
asphalt concrete include the relationship between temperature and viscosi
ty. Different asphalts can have widely different temperature-viscosity
relationships and thus; although two mixes contain the same aggregate,
aggregate grading, and asphalt content and are compacted at the same
temperature with identical equipment, the resulting density can vary
widely depending on the asphalts used.
The importance of compacting asphalt concrete at high temperatures
has been advocated by numerous authors. Laboratory studies conducted by
HcLeod (7), Kiefer (8), Bahri and Rader (ll), and Parker (30) show that
density increases with the temperature of the mixture at the time of
compaction. Studies conducted using field equipment, including those
51
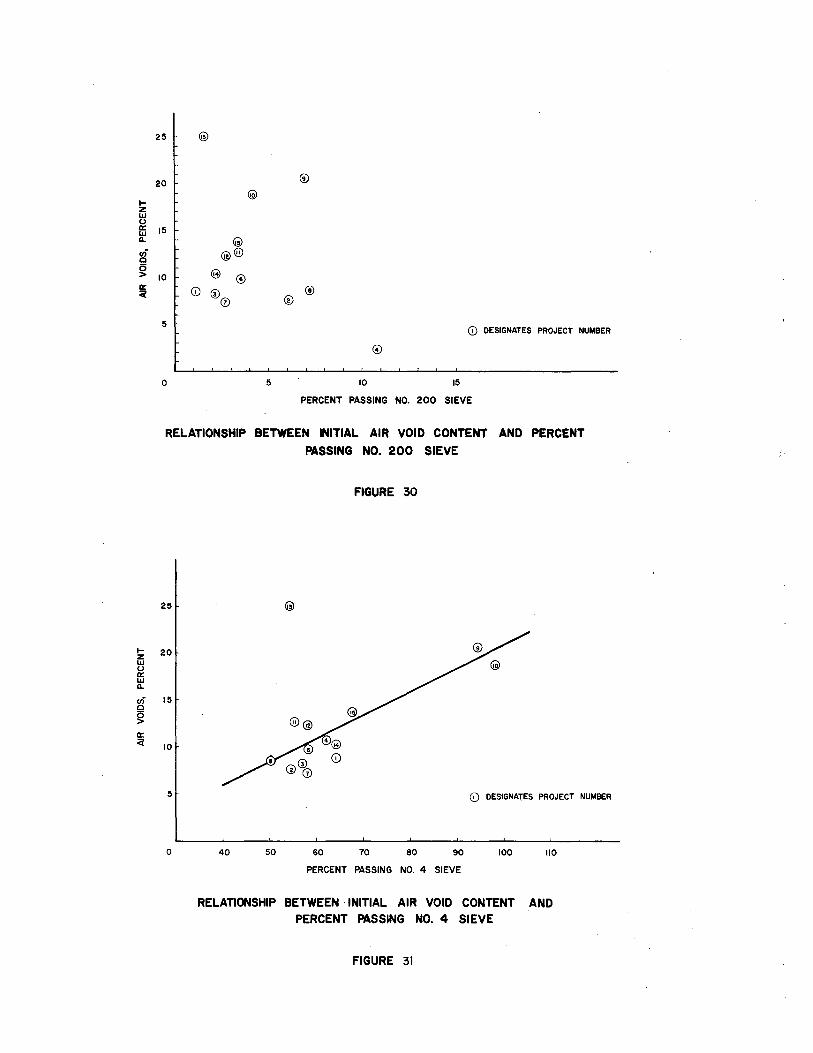
1-z UJ (.) 0: UJ ll.
.n c 6 > 0: Ci
25 @
20
15 ~
@@
10 @ ®
(i) ® 0
5
0
<i9>
5
® ®
10
(i) DESIGNATES PROJECT NUMBER
15
PERCENT PASSING NO. 200 SIEVE
RELATIONSHIP BETWEEN INITIAL AIR VOID CONTENT AND PERCENT
PASSING NO. 200 SIEVE
25
20
15
10
5
0
FIGURE 30
(i) DESIGNATES PROJECT NUMBER
40 50 60 70 80 90 100 110
PERCENT PASSING NO. 4 SIEVE
RELATIONSHIP BETWEEN INITIAL AIR VOID CONTENT AND PERCENT PASSING NO. 4 SIEVE
FIGURE 31
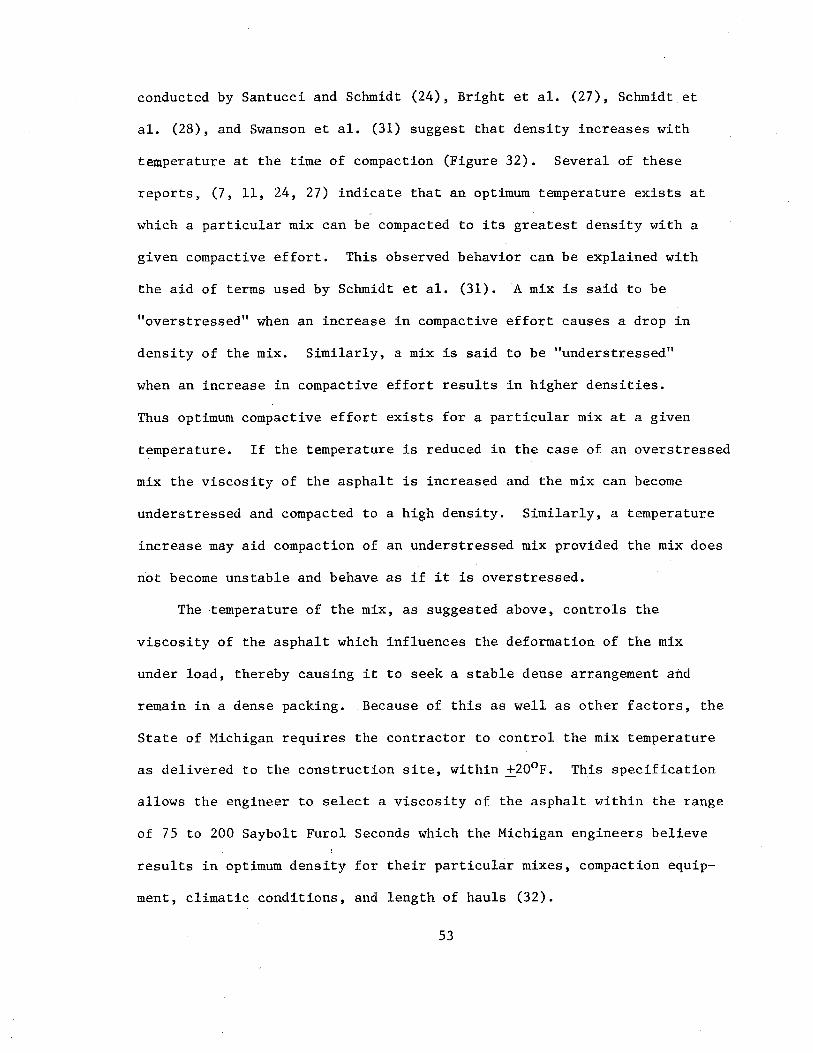
conducted by Santucci and Schmidt (24), Bright et al. (27), Schmidt et
al. (28), and Swanson et al. (31) suggest that density increases with
temperature at the time of compaction (Figure 32). Several of these
reports, (7, 11, 24, 27) indicate that an optimum temperature exists at
which a particular mix can be compacted to its greatest density with a
given compactive effort. This observed behavior can be explained with
the aid of terms used by Schmidt et al. (31). A mix is said to be
"overstressed" when an increase in compactive effort causes a drop in
density of the mix. Similarly, a mix is said to be "understressed"
when an increase in compactive effort results in higher densities.
Thus optimum compactive effort exists for a particular mix at a given
temperature. If the temperature is reduced in the case of an overstressed
mix the viscosity of the asphalt is increased and the mix can become
understressed and compacted to a high density. Similarly, a temperature
increase may aid compaction of an understressed mix provided the mix does
not become unstable and behave as if it is overstressed.
The temperature of the mix, as suggested above, controls the
viscosity of the asphalt which influences the deformation of the mix
under load, thereby causing it to seek a stable dense arrangement and
remain in a dense packing •. Because of this as well as other factors, the
State of Michigan requires the contractor to control the mix temperature
as delivered to the construction site, within +20°F. This specification
allows the engineer to select a viscosity of the asphalt within the range
of 75 to 200 Saybolt Furol Seconds which the Michigan engineers believe
results in optimum density for their particular mixes, compaction equip
ment, climatic conditions, and length of hauls (32).
53
CAC.. CIIIIK CIIUIIIID IIIAVIL &.1% Aa'MALT LIMIITO. DUIT PILLIII-I'Ifo I NIKI PIIHIM-aoo LI/LIM IN.
t: I PAIKI IIIIAICDOWII-400 LI/UM IN.
141 r---------------. ;:::) u
...
0 -I~D CAIIOIIIIIA COAITAL AND VALLIY
0 -CALIPOIIIIIA VALLIY V -ILDWII CALII'OIIIIIA
WUIY
.. .• i ou
~ u
.. lSI
·-~~~~-_.-~--~--._~ 141 110 liD ITO liD UO 100 110
BREAI<DOWN TEMPERATURE1 Of
RELATIONSHIP BETWEEN DENSITY AND TEMPERATURE OF
ASPHALT CONCRETE DURING BREAKDOWN ROLLING
( ~FTER SCHMIDT ET Al (28))
FIGURE 32
The asphalt source, type, content, viscosity, and penetration for
the various test sites is shown in Table 11. The viscosity and penetration
of the asphalts recovered after service for various lengths of time are
shown in Table 12.
Temperatures were recorded during breakdown and final rolling opera
tions. The data presented in Table 5 indicate that breakdown rolling
occurred at temperatures below 175°F on 6 of the 15 test sites and final
rolling was started when the temperature was below 175°F on all projects.
This information indicates that pavements in Texas are compacted at a
temperature at which densification is not easily obtained.
The asphalt viscosity at the compaction temperature is given in
Table 13. These data were obtained from temperature viscosity data on
the original asphalt and therefore is not absolutely correct as some
hardening occurred during the mixing operation. The relationship between
air void content and asphalt viscosity at breakdown rolling for pavements
studied in this project is shown in Figure 33. The general trend of
increased density with low viscosity is not evident for these projects as
too many other variables control the compactability of the mix. However,
a comparison of the Cooper and Cumby projects suggests that the temperature
of the pavement during compaction is very important. These pavements
were constructed with the same asphalt type, approximately the same asphalt
contents, aggregates, aggregate gradations, and compactive effort. Thus
the major variable between these two projects is the pavement temperature.
As shown in Figure 33 the Cooper project which was compacted at the lowest
temperature resulted in the lowest density.
55
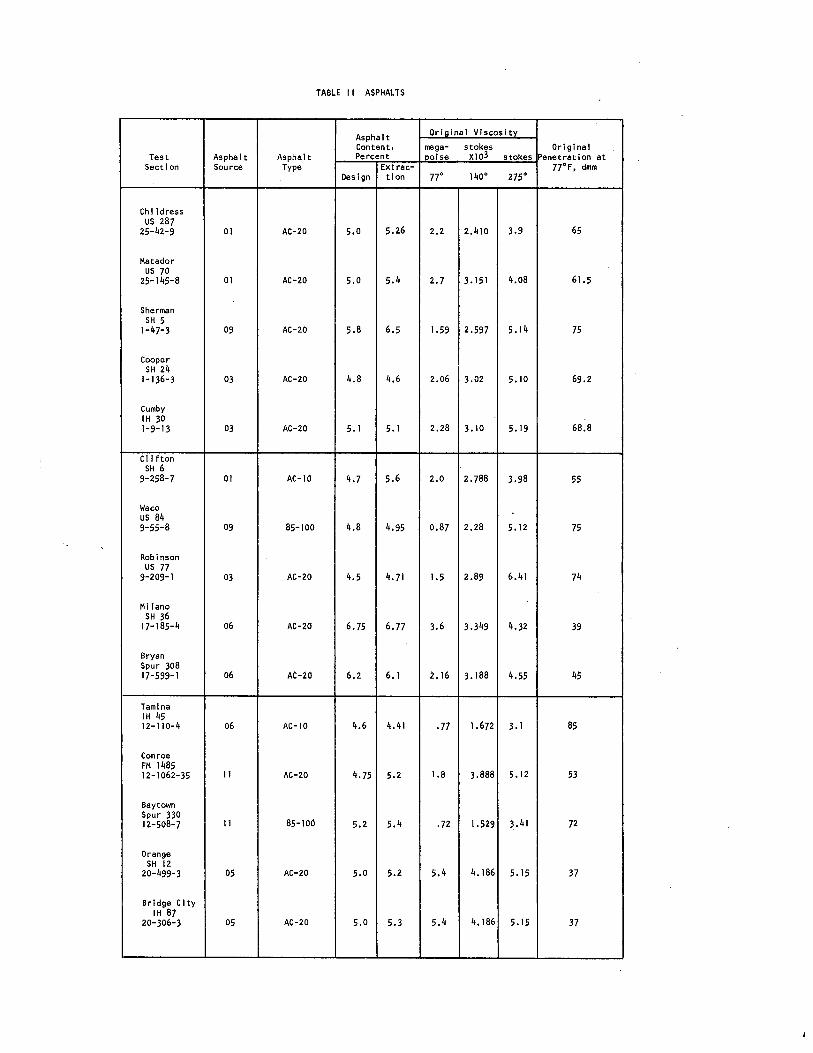
TABLE II ASPHALTS
Asphalt Original Viscosity Content, mega- stokes Original
Test Asphalt Asphalt Percent poise XJ03 stokes !Penetration at Section Source Type Ext rae- 77°F, dmm
Design tion no 140° 275°
Chi ]dress us 287
25-42-9 01 AC-20 5.0 5.26 2.2 2.410 3.9 65
Matador us 70
25-145-8 01 AC-20 5.0 5.4 2.7 3.151 4.08 61.5
Sherman SH 5
1-47-3 09 AC-20 5.8 6.5 1.59 2.597 5.14 75
Cooper SH 24
1-136-3 03 AC-20 4.8 4,6 2.06 3.02 5.10 69.2
Cumby I H 30 1-9-13 03 AC-20 5.1 5.1 2.28 3.10 5.19 68.8
Clifton SH 6
9-258-7 01 AC-10 4.7 5.6 2.0 2.788 3.98 55
Waco us 84 9-55-8 09 85-100 4.8 4.95 0.87 2.28 5.12 75
Robinson us 77
9-209-1 03 AC-20 4.5 4. 71 1.5 2.89 6.41 74
Milano SH 36
17-185-4 06 AC-20 6.75 6.77 3.6 3.349 4.32 39
Bryan Spur 308 17-599-1 06 AC-20 6.2 6.1 2.16 3.188 4.55 45
Tam ina IH 45 12-110-4 06 AC-10 4.6 4.41 .77 1.672 3.1 85
Conroe FM 1485 12-1062-35 11 AC-20 4.75 5.2 1.8 3.888 5.12 53
Baytown Spur 330
85-100 12-508-7 11 5.2 5.4 .72 1.529 3.41 72
Orange SH 12
20-499-3 05 AC-20 5.0 5.2 5.4 4.186 5.15 37
Bridge Clty IH 87
20-306-3 05 AC-20 5.0 5.3 5.4 4. 186 5.15 37
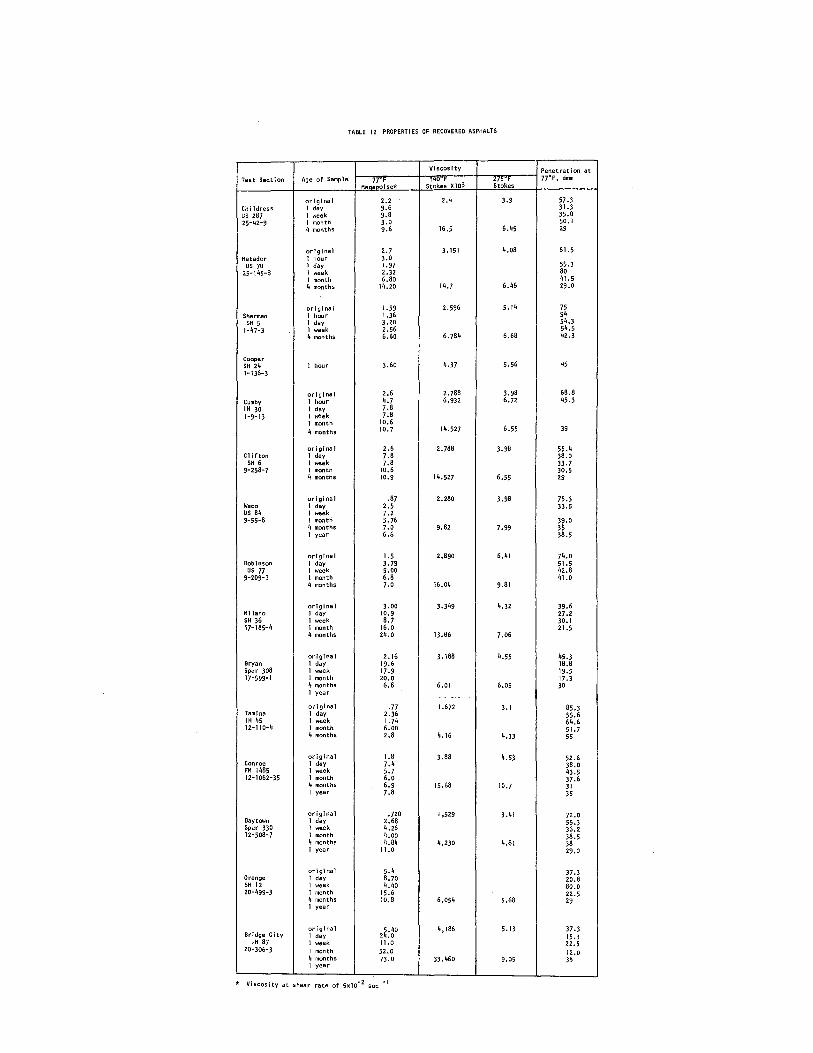
TABLE 12 PROPERTIES OF RECOVERED ASPHALTS
Viscosity Penetration at
Test Section Age of Sample 77F s~~~es XJ03 ~~~~ .. ]7°F, d1m1
Meaaoolse*
original 2.2 2.4 3.9 57.3 Chi I dress I day 9.6 31.3 us 287 I week 9.8 35.0 25-42-9 I month 3.0 50.1
4 months 9.6 16.5 6.45 29
original 2.7 3.151 4.08 61.5 Matador 1 hour 3.0
us 70 1 day 1.97 55.3 25-145-8 1 week 2.32 80
I month 6.80 41.5 4 months 14.20 14.7 6.46 29.0
original 1.59 2.596 5.14 75 Sherman I hour 1.36 94
SH 5 I day 3.20 54.3 1-47-3 1 week 2.56 54.5
4 months 6.60 6.784 6.68 42.3
Cooper 3.60 4.37 5.56 45 SH 24 1 hour
1-136-3
original 2.6 2.)88 3.98 68.8 Cumby I hour 4.7 6.932 6.72 45.3 1H 30 I day 7.8 1-9-13 1 week ).8
1 month 10.6 4 months 10.7 14.527 6.55 39
original 2.6 2.)88 3.98 55.4 Clifton 1 day ).8 38.0
SH 6 1 week 7.8 33.7 9-258-7 1 month 10.6 30.5
4 months 10.9 14.527 6.55 29
original .87 2.280 3.98 75.3 Waco I day 2.5 33.5 us 84 1 week 7.2 9-55-8 I month 5.76 39.0
4 months 7.0 9.82 7.99 35 1 year 6.6 38.5
original 1.5 2.890 6.41 74.0 Robinson I day 3.79 51.5 us 77 I week s.oo 42.8
9-209-1 I month 6.8 41.0 4 months ).0 16.04 9.81
original 3.00 3.349 4.32 39.6 Hllano 1 day 10.9 27.2 SH 36 l week 8.7 30.1 17-185-4 1 month 16.0 21.5
4 months 24.0 13.86 7.06
original 2.16 3.188 4.55 45.3 Bryan I day 19.6 18.8 Spur 308 1 week 17.9 19.5 17-599-1 I month 20.0 17.3
4 months 6.8 6.01 6.05 30 1 year
-·· original .77 1.672 3.1 85.3
Tam ina 1 day 2.36 55.6 1H 45 I week 1.74 64.6 12-110-4 I month 6.00 51.7
4 months 2.8 4.16 4.33 55
original 1.8 3.88 4.53 52.6 Conroe 1 day 7.4 38.0 FM 1485 1 week 5.7 43.5 12-1062-35 I month 6.0 37.6
4 months 6.9 15.68 10.7 31 I year 7.8 35
original .720 1,529 3.41 72.0 Baytown I day 2.68 55.3 Spur 330 l week 4.26 36.2 12-508-7 l month 4.00 38.5
4 months 4.84 4,230 4.81 38 1 year 11.0 29.0
original 5.4 37.3 Orange 1 day 8.70 20.8 SH 12 1 week 4.40 80.0 20-499-3 1 month 15.6 22.5
4 months 10.8 6,054 5.68 29 1 year
original ~.40 4,186 5.13 37.3 Bridge City 1 day 2 .0 15.3
1H 87 1 week 11.0 22.5 20-306-3 1 month 52.0 12.0
4 months 73.0 33,460 9.05 38 I year
* Viscosity at shear rate of 5xlo·2 sec ·I
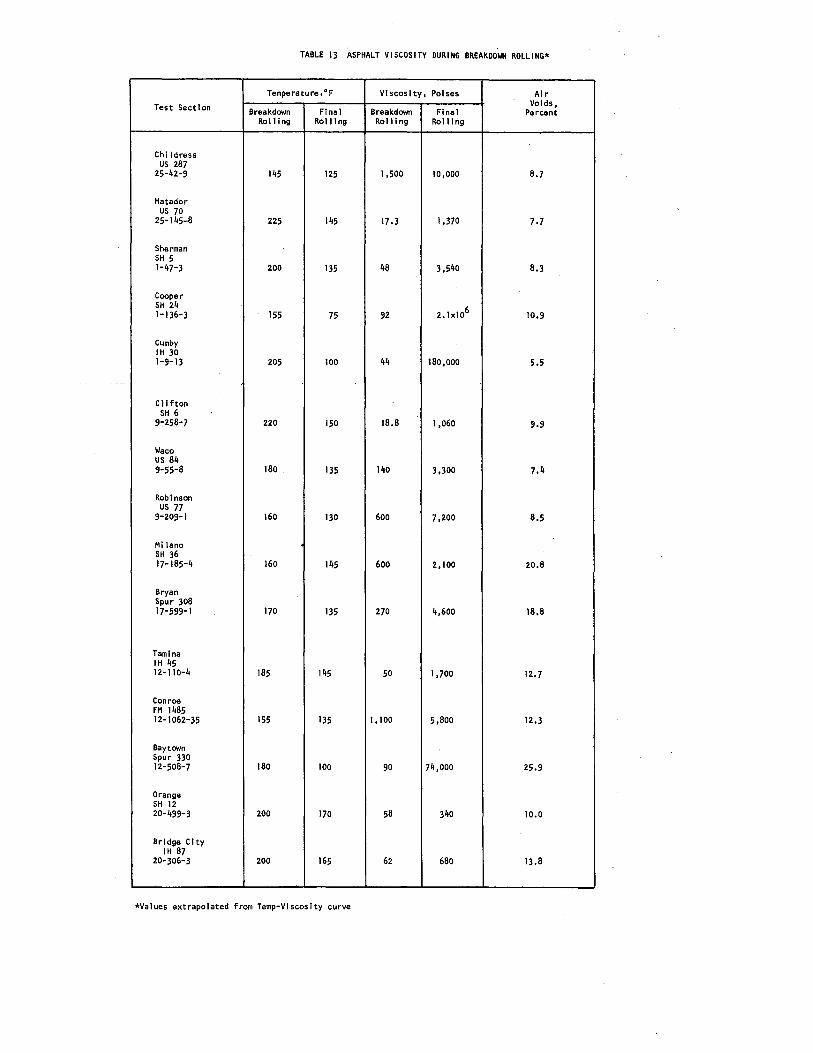
TABLE 13 .ASPHALT VISCOSITY DURING BREAKDOWN ROLLING*
Temperature,"F VI sees I ty, Poises Air
Test Section Voids, Breakdown Final Breakdown Final Percent
Rolling Rolling Rolling Rolling
Chi !dress us 287
25-42-9 145 125 1,500 10,000 8.7
Matador us 70
25-145-8 225 145 17.3 1,370 7.7
Sherman SH 5 1-47-3 200 135 48 3,540 8.3
Cooper SH 24
2.1x1o6 1-136-3 155 75 92 10.9
Cumby IH 30 1-9-13 205 100 44 180,000 5.5
C IIfton SH 6
9~258-7 220 150 18.8 1,060 9.9
Waco us 84 9-55-8 180 . 135 140 3,300 7.4
Robinson us 77
9-209-1 160 130 600 7,200 8.5
Hi lane SH 36 17-185-4 160 145 600 2,100 20.8
Bryan Spur 308 17-599-1 170 135 270 4,600 18.8
Tam ina IH 45 12-110-4 185 145 50 1,700 12.7
Conroe FH 1485 12-1062-35 155 135 1,100 5,800 12.3
Baytown Spur 330 12-508-7 180 100 90 74,000 25.9
Orange SH 12 20-499-3 200 170 58 340 10.0
Bridge City IH 87
20-306-3 200 165 62 680 13.8
*Va 1 ues ext rape 1 a ted from Temp-VIscosity curve
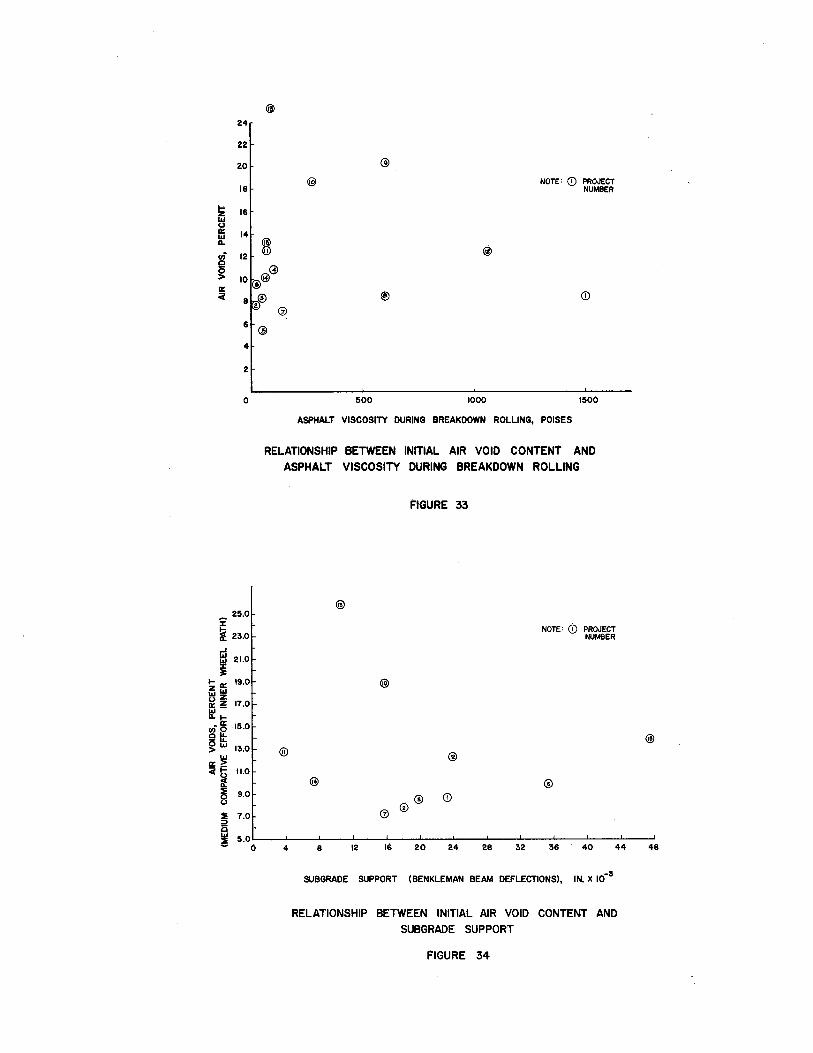
.... z .... (.) II: .... a. ui c g a:: a:
£
® 24
22
20 @
18 @ NOTE: 0 PROJECT
NUMBER
16
14
12 w @
Gl IO@@
8 @ @) CD 2
G)
6 @
4
2
0 500 1000 1500
ASPHALT VISCOSITY DURING BREAKDOWN ROLLING, POISES
RELATIONSHIP BETWEEN INITIAL AIR VOID CONTENT AND
ASPHALT VISCOSITY DURING BREAKDOWN ROLLING
FIGURE 33
25.0
~ 23.0 NOTE: 0 PROJECT
NUMBER
...J .... 21.0 .... i
1-o:: 19.0 z.., ""z ~3!:: 17.0 .... a.li:
15.0 ui~ §l:;i
13.0 > II:~ <it;
rf. 11.0
~ 9.0 u
~ 7.0
i5
~ 5.0 0
® @
@
@ CD (]
@
4 8 12 16 20 24 28 32 36 40 44
SUBGRADE SUPPORT (BENKLEMAN BEAM DEFLECTIONS), IN. x 10-a
RELATIONSHIP BETWEEN INITIAL AIR VOID CONTENT AND
SUBGRADE SUPPORT
FIGURE 34
@)
48
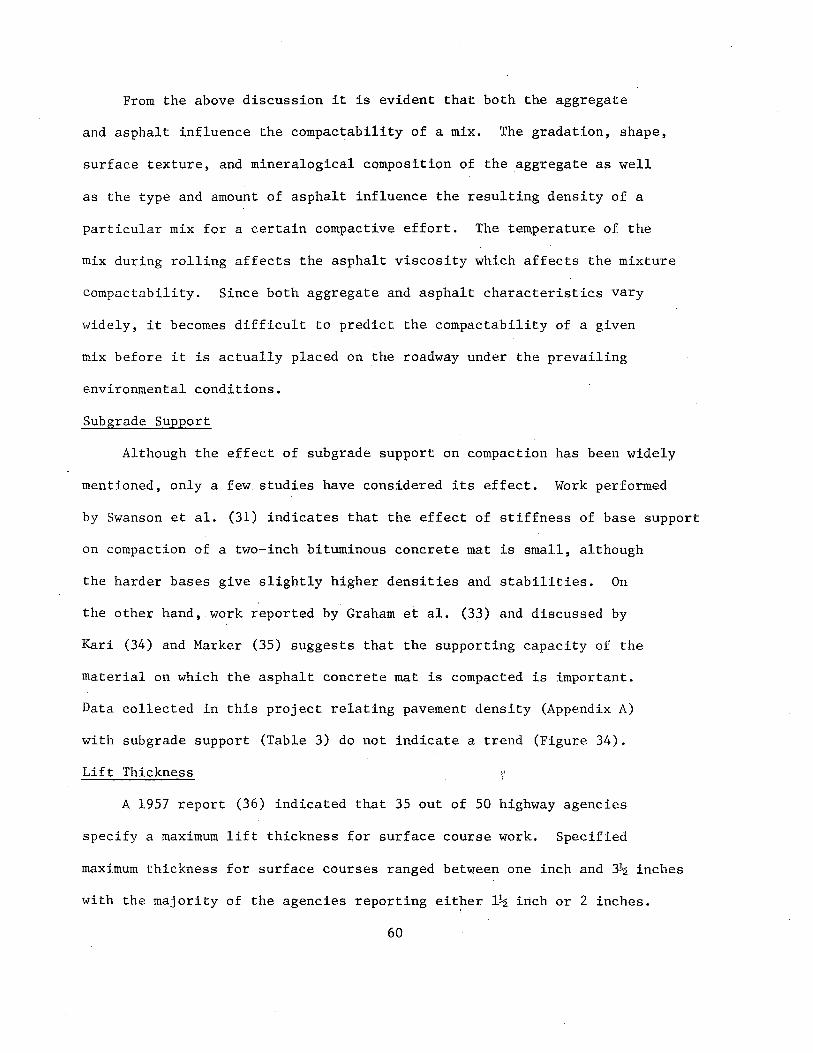
From the above discussion it is evident that both the aggregate
and asphalt influence the compactability of a mix. The gradation, shape,
surface texture, and mineralogical composition of the aggregate as well
as the type and amount of asphalt influence the resulting density of a
particular mix for a certain compactive effort. The temperature of the
mix during rolling affects the asphalt viscosity which affects the mixture
compactability. Since both aggregate and asphalt characteristics vary
widely, it becomes difficult to predict the compactability of a given
mix before it is actually placed on the roadway under the prevailing
environmental conditions.
Subgrade Support
Although the effect of subgrade support on compaction has been widely
mentioned, only a few studies have considered its effect. Work performed
by Swanson et al. (31) indicates that the effect of stiffness of base support
on compaction of a two-inch bituminous concrete mat is small, although
the harder bases give slightly higher densities and stabilities. On
the other hand, work reported by Graham et al. (33) and discussed by
Kari (34) and Marker (35) suggests that the supporting capacity of the
material on which the asphalt concrete mat is compacted is important.
Data collected in this project relating pavement density (Appendix A)
with subgrade support (Table 3) do not indicate a trend (Figure 34).
Lift Thickness
A 1957 report (36) indicated that 35 out of 50 highway agencies
specify a maximum lift thickness for surface course work. Spec~fied
maximum thickness for surface courses ranged between one inch and 3~ inches
with the majority of the agencies reporting either 1~ inch or 2 inches.
60
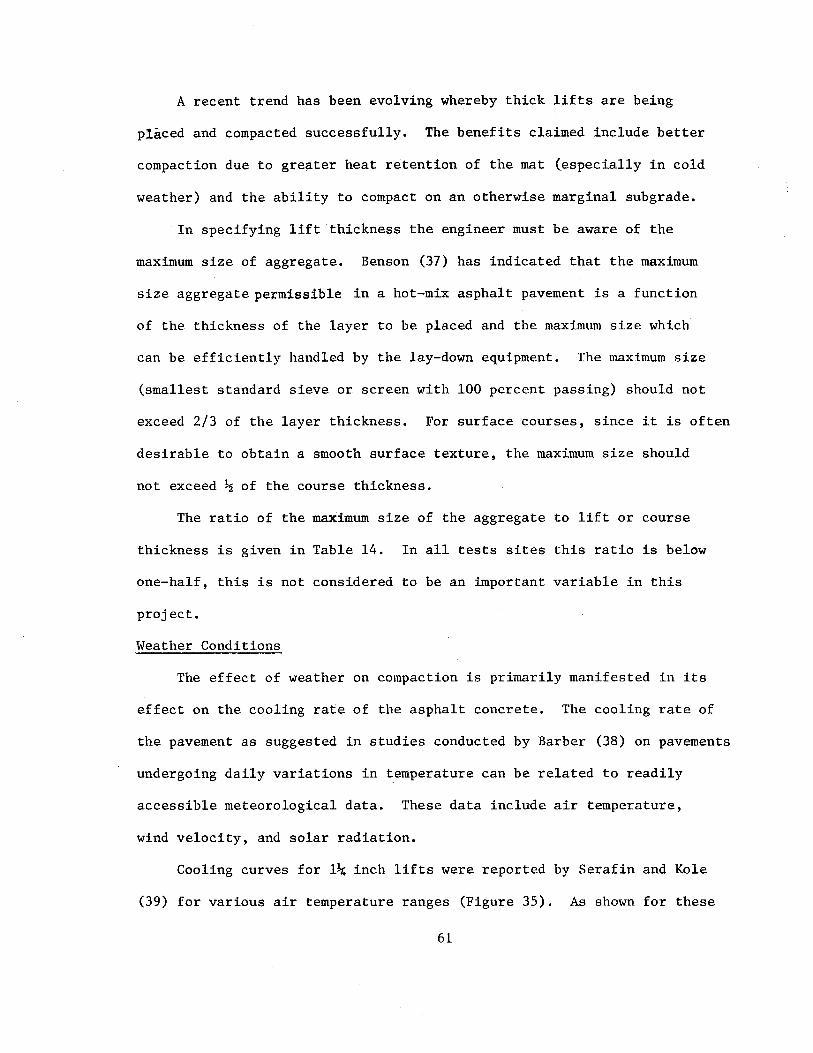
A recent trend has been evolving whereby thick lifts are being
placed and compacted successfully. The benefits claimed include better
compaction due to greater heat retention of the mat (especially in cold
weather) and the ability to compact on an otherwise marginal subgrade.
In specifying lift thickness the engineer must be aware of the
maximum size of aggregate. Benson (37) has indicated that the maximum
size aggregate permissible in a hot-mix asphalt pavement is a function
of the thickness of the layer to be placed and the maximum size which
can be efficiently handled by the lay-down equipment. The maximum size
(smallest standard sieve or screen with 100 percent passing) should not
exceed 2/3 of the layer thickness. For surface courses, since it is often
desirable to obtain a smooth surface texture, the maximum size should
not exceed ~ of the course thickness.
The ratio of the maximum size of the aggregate to lift or course
thickness is given in Table 14. In all tests sites this ratio is below
one-half, this is not considered to be an important variable in this
project.
Weather Conditions
The effect of weather on compaction is primarily manifested in its
effect on the cooling rate of the asphalt concrete. The cooling rate of
the pavement as suggested in studies conducted by Barber (38) on pavements
undergoing daily variations in temperature can be related to readily
accessible meteorological data. These data include air temperature,
wind velocity, and solar radiation.
Cooling curves for 1~ inch lifts were reported by Serafin and Kole
(39) for various air temperature ranges (Figure 35). As shown for these
61
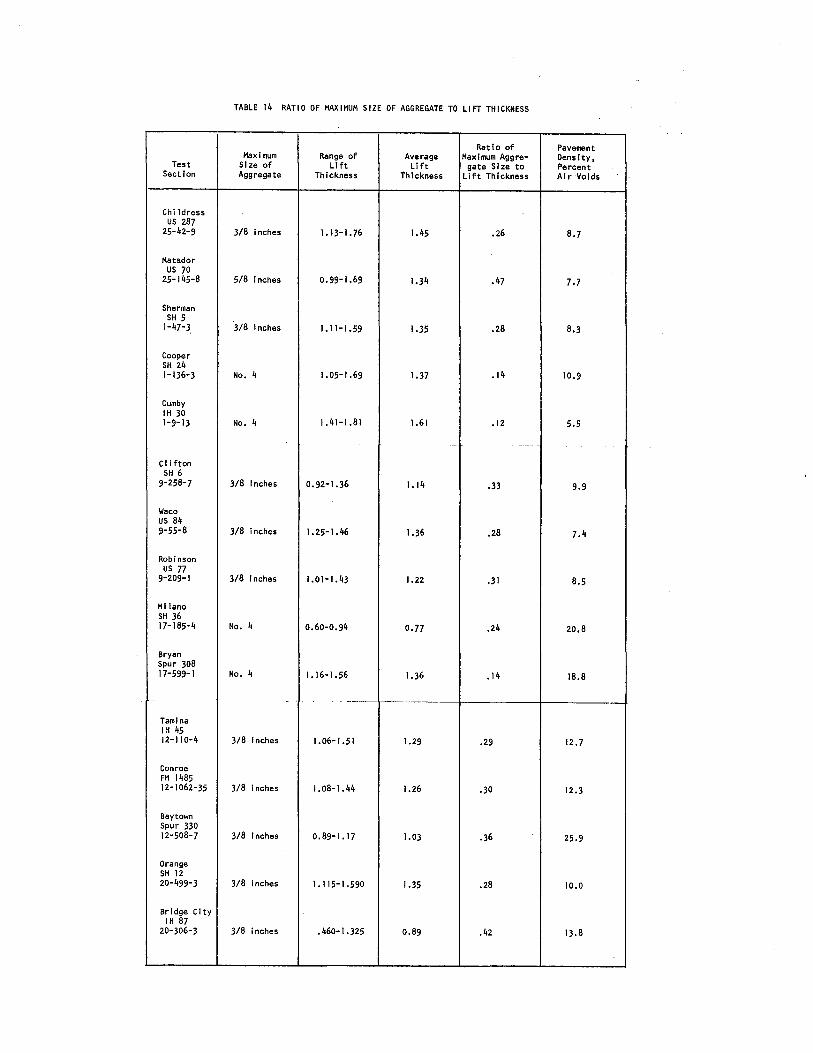
TABLE 14 RATIO OF MAXIMUM SIZE OF AGGREGATE TO LIFT THICKNESS
Ratio of Pavement Maximum Range of Average Maximum Aggre- Dens lty,
Test Size of Lift Lift gate Size to Percent Section Aggregate Thickness Thickness Lift Thickness Air Voids
Chi I dress us 287
25-42-9 3/8 Inches I. 13-1.76 1.45 .26 8.7
Matador us 70
25-145-8 5/8 inches 0.99-1.69 1.34 .47 1.7
Sherman SH 5
1-47-3 3/8 inches I. 11-1.59 1.35 .28 8.3
Cooper SH 24 1-136-3 No. 4 1.05-1.69 1.37 .14 10.9
Cumby IH 30 1-9-13 No. 4 1.41-1.81 1.61 .12 5.5
- ---·-
Clifton SH 6
9-258-7 3/8 inches 0.92-1.36 1.14 .33 9.9
Waco us 84 9-55-8 3/8 Inches 1.25-1.46 1.36 .28 7.4
Robinson us 77
9-209-1 3/8 inches 1.01-1.43 1.22 .31 8.5
Milano SH 36 17-185-4 No. 4 0.60-0.94 0.77 .24 20.8
Bryan Spur 308 17-599-1 No. 4 1.16-1.56 1.36 .14 18.8
.. ----~- --·
Tam ina IH 45 12-110-4 3/8 Inches 1.06-1.51 1.29 .29 12.7
Conroe FM 1485 12-1062-35 3/8 inches 1.08-1.44 1.26 .30 12.3
Baytown Spur 330 12-508-7 3/8 inches 0.89-1.17 1.03 .36 25.9
Orange SH 12 20-499-3 3/8 inches 1.115-1.590 1.35 .28 10.0
Bridge City IH 87
20-306-3 3/8 inches • 460-1.325 0.89 .42 13.8
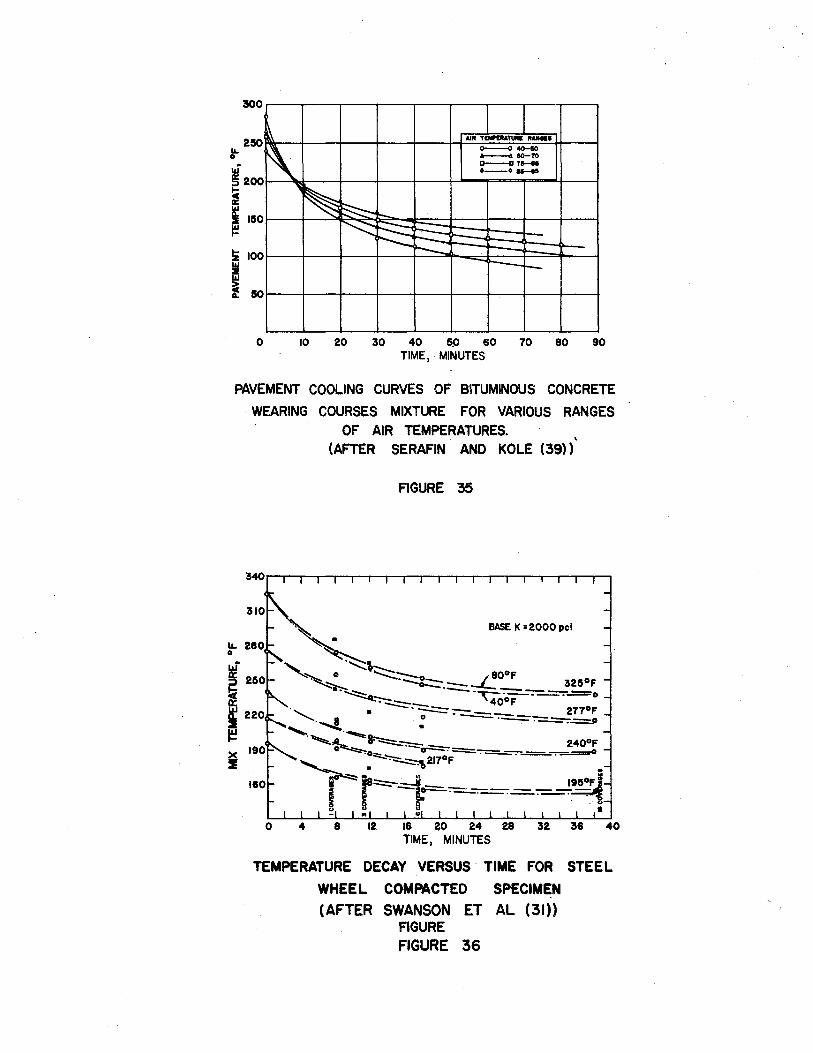
!00
250 ... 0
.; !!§ 200
~ ~ 150 ~
~
~ ~~ ~ ~
Alit TEWIIIATUII£ -· o----o 40-10 ---10-'10 D-----<17-·-·-
:-..
~ =--- ..._ -~ --.___ -..._ t--
0 10 20 30 40 5.P 60 70 80 90 TIME, MINUTES
PAVEMENT COOLING CURVES OF BITUMINOUS CONCRETE
WEARING COURSES MIXTURE FOR VARIOUS RANGES
OF AIR TEMPERATURES. (AFTER SERAFIN AND KOLE (39))
FIGURE 35
BASE K =2000 pel
160
0 40
TEMPERATURE DECAY VERSUS- TIME FOR STEEL
WHEEL COMPACTED SPECIMEN
(AFTER SWANSON ET AL (31)) FIGURE
FIGURE 36
particular lift thicknesses the pavement temperature is below 200°F
after 10 minutes regardless of the initial and air temperature. Cooling
curves obtained in the laboratory on two inch mats have been reported
by Swanson et al. (bl) Figure 36. Additional information obtained by
the Texas Highway Department (40) reports temperature drops of from
40 to 70°F for 1 to 1.5 inch mat thicknesses after 3 to 7 passes of
compaction rollers while Corlew and Dickson (41) indicate a 50°F loss
may occur in as little as 4 minutes for a 1.5 inch mat.
As is evident by these cooling rates; it is important that compaction
equipment follow the lay down machine as closely as possible for thin
lifts, and cool weather construction; as the temperature drop increases
the resistance to compaction by increasing the viscosity of the asphalt.
Thus the rate at which a pavement cools becomes important with regard to
the cornpactive effort needed to achieve a specified density.
The data collected in this study show that the pavements cooled
a significant amount even though the air temperature was high (Table 5)
in most projects. Therefore, this rapid cooling rate is primarily due to
factors other than weather conditions (Table 5).
Since Parker (30) and Nijboer (42) suggest that rolling below a temp
erature of 175°F is not effective in obtaining adequate density for
asphalts of 85-100 penetration or harder, the equipment should be com
pacting the pavement as soon as the mix will not shove under the weight
of the equipment. As stated previously the speed of application of corn
paction equipment is especially critical for thin lift.
64
In addition to the previously mentioned air temperature and lift
thickness, the cooling rate of asphalt concrete placed on a roadway is
a function of the temperature of the "base" material on which the asphalt
concrete is to be compacted and a function of the wind velocity. Thin
lifts placed on cool base materials will cool rapidly and thus become
difficult to compact. High wind velocities especially if the air temper
ature is low will decrease the asphalt concrete pavement temperature very
rapidly. Humidity will also have an effect on the cooling rate of a
pavement. This effect is, however, probably minor compared to the
previously mentioned factors.
Equipment
Various types of rollers have been used to compact asphalt concrete
pavements. The advantage of using intermediate pneumatic rolling in the
sequence of rolling operation has been suggested to be beneficial by
Schmidt, Santucci, and Garrison (43). Work conducted by Swanson et al.
(31) indicates that no advantage exists in using the pneumatic rollers
except that the surface appeared more dense. Furthermore,_ work conducted
by Serafin and Kole (39) and by the California Division of Highways
suggests that no advantage is obtained by using pneumatic rolling.
Arena, Shah, and Adam (44) have presented data which they state
emphasize the importance of compacting pavement with pneumatic rollers
having contact pressures similar to that of the rolling stock on the
highway. McLeod (7) also suggests that pneumatic rolling is beneficial
and even more beneficial if the tire pressure is adjusted to match the
resistance of compaction of the pavement. ~odell (45) indicates that a
more dense pavement resulted when pneumatic tire equipment was being used.
65
Kari (46) has suggested that the reason for the differences noted is the
difference in the bearing capacity of the mix. Pneumatic tire rolling
does not increase density for high bearing capacity mixes. On the other
hand low pressure pneumatic rolling contributes a great deal to compaction
if the mix has a low bearing capacity.
Steel wheeled rollers with various types of roller configurations
have been used extensively for many years (33). Recently sales of tandem
rollers exceed those of the three-wheel rollers suggesting that the con
tractors are obtaining better results with this type of machine.
Foster (47) has compiled a report of information received from
questionnaires sent out by the Highway Research Board. He indicates
that the equipment used for breakdown rolling is predominantly steel
wheel rollers while pneumatic tired rollers are used in the majority of
cases when intermediate rolling is specified. Tire pressures range
from 60-90 psi. Steel wheel rollers are used to smooth the pavement
during final rolling.
The weight of the roller as specified by the state highway departments
runs from 5 to 12 tons for two-axle tandem steel rollers with 8 tons
being the most popular weight. A three-axle tandem roller has been
specified from 8 to 13 tons by these same highway agencies with the 10-
and 12-ton rollers being the most popular. The 10-ton three-wheel
roller appears to be the most popular three-wheel steel roller (47).
Rubber tired rollers have been specified over a wide range of tire
pressures; however, the 60-90 psi range is the most popular among the
state highway agencies.
66
Maximum roller speeds as specified by the state highway agencies
in 1953 range from 1.5 to 3.0 m.p.h. The purpose of this requirement
is to reduce the speed of the roller such that exces'sive displacement
of the mix under the roller will be avoided. A significant number of
agencies however, do not specify a maximum roller speed (36).
Schmidt, Kari, Bower, and Hein (28) suggest that each mix possesses
an optimum roller weight and further indicate that stable mixes tolerate
heavier rollers. Steel wheel diameters are also important in that large
wheel diameters, allow higher pressures to be used and thus higher
densities obtained before excessive shear deformation occurs. Wheels
with small diameters cause excessive shear stresses at rather low loadings
and will give low maximum densities. Additional data contained in this
report indicate that an optimum roller pressure exits for a selected
mix and a particular lift thickness (Figure 37).
The compaction equipment used for each test site is given in Table 5.
The predominant type of roller used for breakdown rolling is the three
wheel ten-ton roller (14 projects). Intermediate rolling was conducted
by using the eight- and ten-ton tandem roller on nine projects while
pneumatic equipment was used on three test sites. Three test sites did
not use intermediate rolling. Pneumatic rolling equipment was used for
the final rolling operation on nine projects while steel tandem rollers
were used on six projects. The roller weights and tire pressures on the
pneumatic rollers and the roller weight of steel wheel rollers are
representative of those used throughout the country.
67
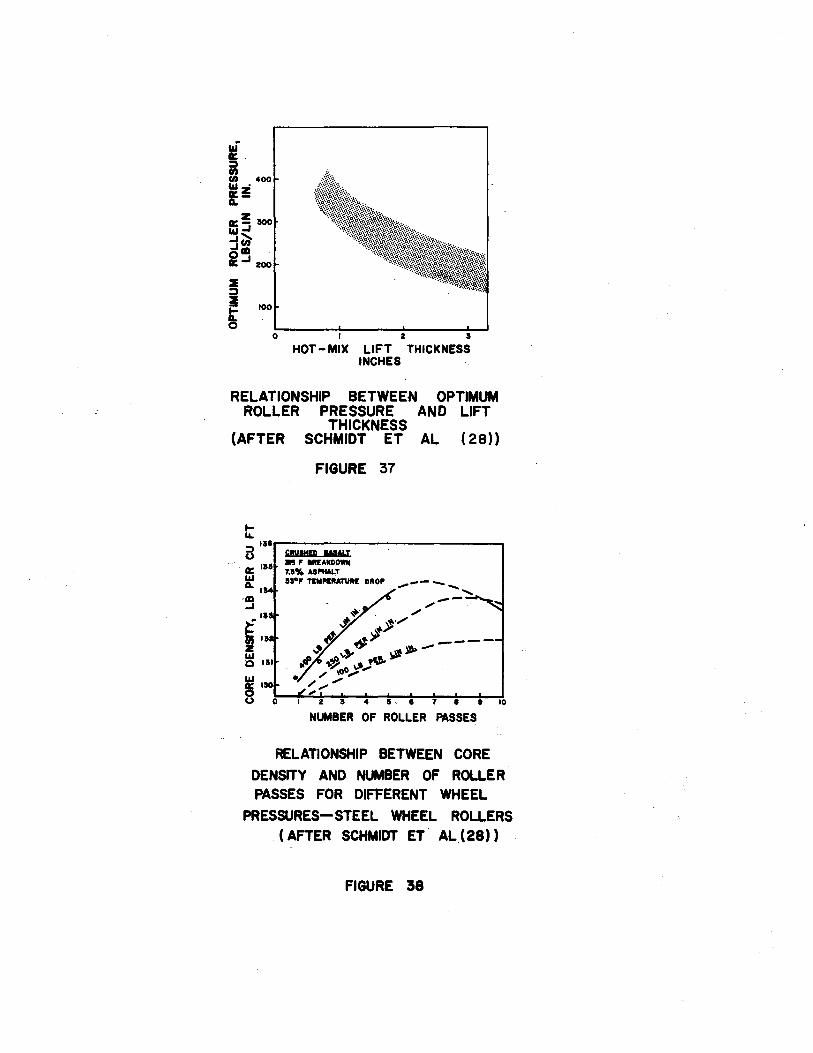
0 I Z :S
HOT- MIX LIFT THICKNESS INCHES
RELATIONSHIP BETWEEN OPTIMUM ROLLER PRESSURE AND LIFT
THICKNESS (AFTER SCHMIDT ET AL ( 28))
FIGURE 37
t .... 111.---------------, (j CftUMQ '''ftl I
M F lllt:AKDOWII It: Ill T.S'Ifo ASI'IW.T 1&1 lla°F TDIPDATUM DIIOP ILlS
-ID ..I
4 I, I T I t 10
· NUMBER OF ROLLER PASSES
RELATIONSHIP BETWEEN CORE
DENSITY AND NUMBER OF ROLLER PASSES FOR DIFFERENT WHEEL
PRESSURES-STEEL WHEEL ROLLERS (AFTER SCHMIDT ET AL (28))
FIGURE 38
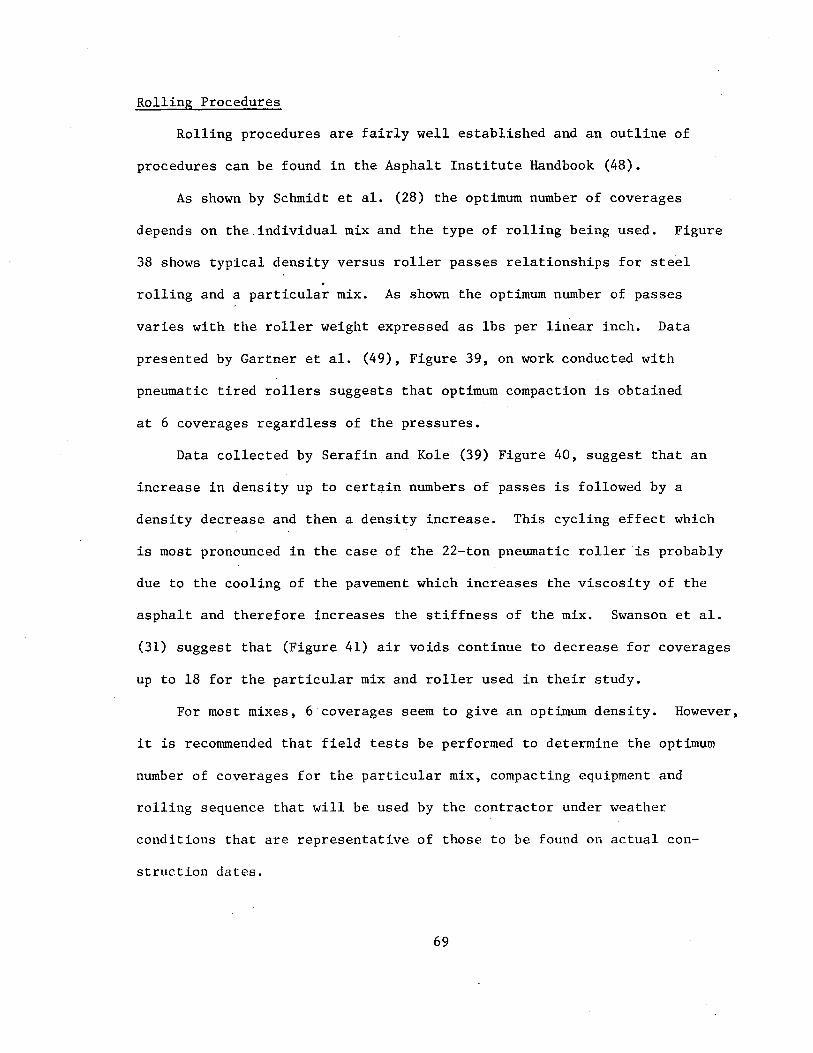
Rolling Procedures
Rolling procedures are fairly well established and an outline of
procedures can be found in the Asphalt Institute Handbook (48).
As shown by Schmidt et al. (28) the optimum number of coverages
depends on the individual mix and the type of rolling being used. Figure
38 shows typical density versus roller passes relationships for steel
rolling and a particular mix. As shown the optimum number of passes
varies with the roller weight expressed as lbs per linear inch. Data
presented by Gartner et al. (49), Figure 39, on work conducted with
pneumatic tired rollers suggests that optimum compaction is obtained
at 6 coverages regardless of the pressures.
Data collected by Serafin and Kole (39) Figure 40, suggest that an
increase in density up to certain numbers of passes is followed by a
density decrease and then a density increase. This cycling effect which
is most pronounced in the case of the 22-ton pneumatic roller is probably
due to the cooling of the pavement which increases the viscosity of the
asphalt and therefore increases the stiffness of the mix. Swanson et al.
(31) suggest that (Figure 41) air voids continue to decrease for coverages
up to 18 for the particular mix and roller used in their study.
For most mixes, 6 coverages seem to give an optimum density. However,
it is recommended that field tests be performed to determine the optimum
number of coverages for the particular mix, compacting equipment and
rolling sequence that will be used by the contractor under weather
conditions that are representative of those to be found on actual con
struction dates.
69
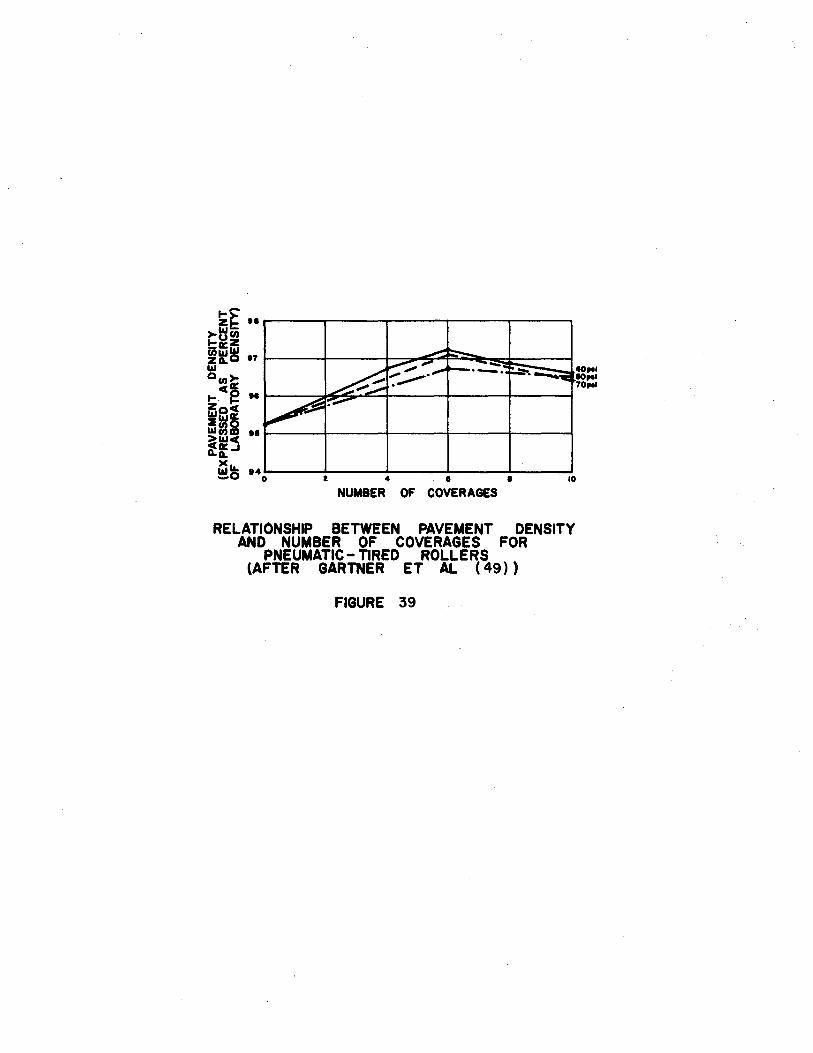
..... '"""'
~ ~~ ...... -:"'.......--· -. ...:::. !-=="·
~ .-
t 4 I I
NUMBER OF COVERAGES
.... 40,.1 10,.1 70 ...
10
RELATIONSHIP BETWEEN PAVEMENT DENSITY AND NUMBER OF COVERAGES FOR
PNEUMATIC- TIRED ROllERS (AFTER GARTNER ET Al ( 49))
FIGURE 39
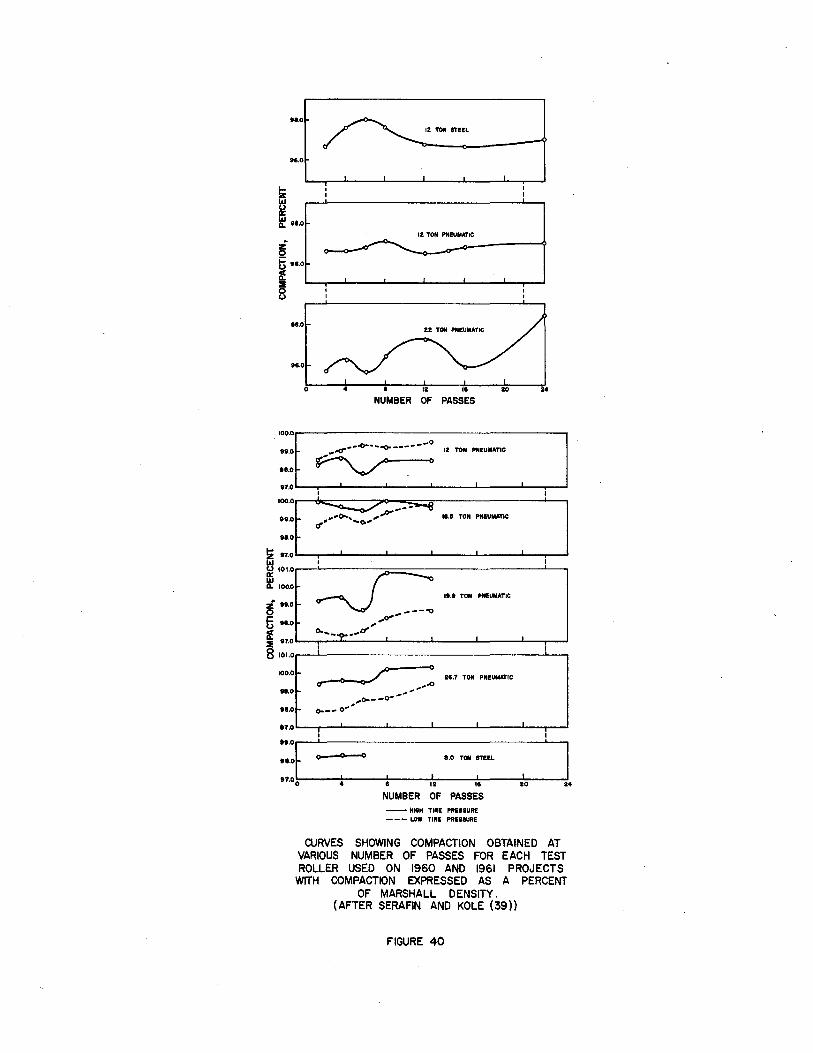
11.0
12 1011 STEEL
98.0
~ li! ~ 18.0
12 TON PNEUMATIC
~ i3 18.0
if 8
11.0
18.0
0
NUMBER OF PASSES
12 TON PNEUMATIC ·~~ 1?.0'--.....,.:--'----.1....--.....L---.1....----L-"""T"~
IOO.Or--6o;;::--:----:;;JI'o-._=::i;"--------....L.---,
11.0 ---....... --<Y" _,.---~ d.ll'·o-.,.._o. .... ' le.S TON PN£UMATIC
11.0
!Z 17.0 '--"""T-....L..----L---.1....---L.--.....J'--....,..---J
~ 101.0,..--<-----==------------'----,
:·:~ 11.1 TON PNEUMATIC
c: 0'-l,) H.O ,~ if C>., .. "9" __ 1:1'
2 97.o'---...,--'----.1....---L---.1....----"--r~
8 IOI.o,..--->.------------------'---,
100.0
•. o
11.0 o--- c-*'
0
_..o -,~--o-''
28.? TON PNEUIUITIC
.T.O'-----r-.....L.---.1....---L----'------"--r-.J
~~t : = ---- I 91·0 !:-o ---.~----±-----!:~~~,_..---:~.:~e,-----:Jo::----~~.
NUMBER OF PASSES -- HIIH TIRE PRESSURE --- LOW TIRE PRESSURE
CURVES SHOWING COMPACTION OBTAINED AT VARIOUS NUMBER OF PASSES FOR EACH TEST ROLLER USED ON 1960 AND 1961 PROJECTS
WITH COMPACTION EXPRESSED AS A PERCENT OF MARSHALL DENSITY.
(AFTER SERAFIN AND KOLE (39))
FIGURE 40
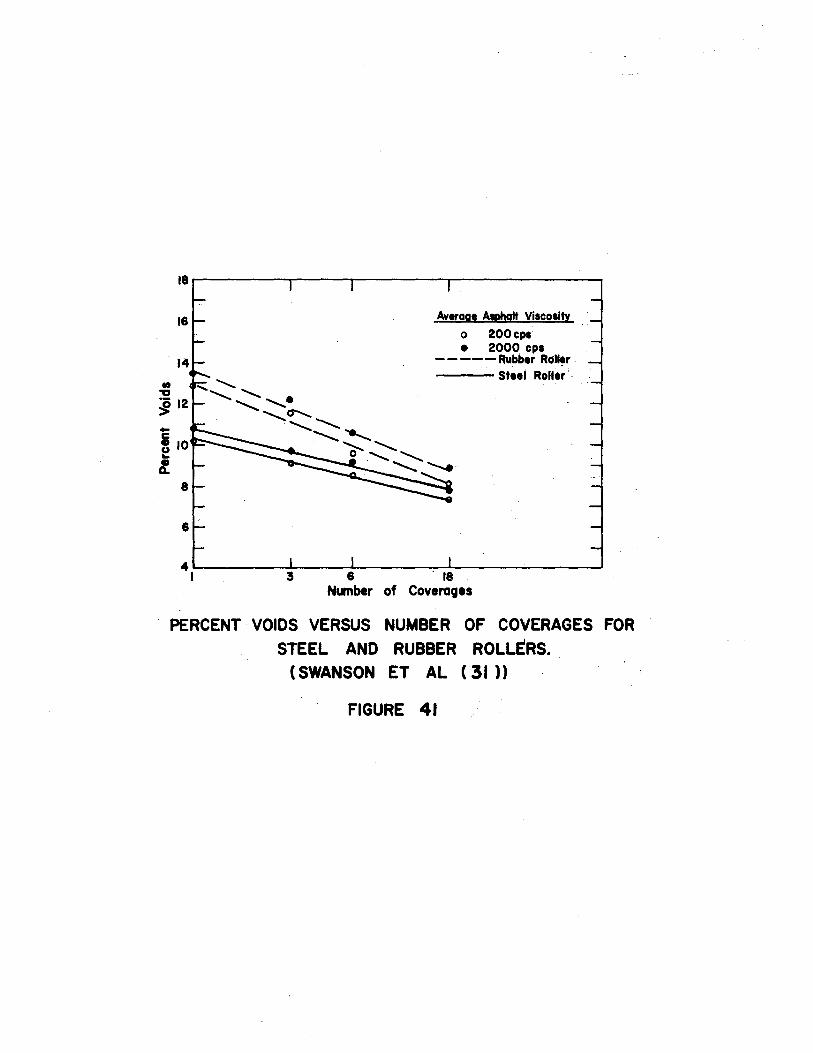
• 'U
16
~ 12 -i 10 e t.
8
Averaae A!phqft Viscosity
o 200cps • 2000 cps
-----Rubber RcJI~r ---Steel Roller
PERCENT · VOIDS VERSUS NUMBER OF COVERAGES FOR
STEEL AND RUBBER ROLLERS. (SWANSON ET AL ( 31 ))
FIGURE 41
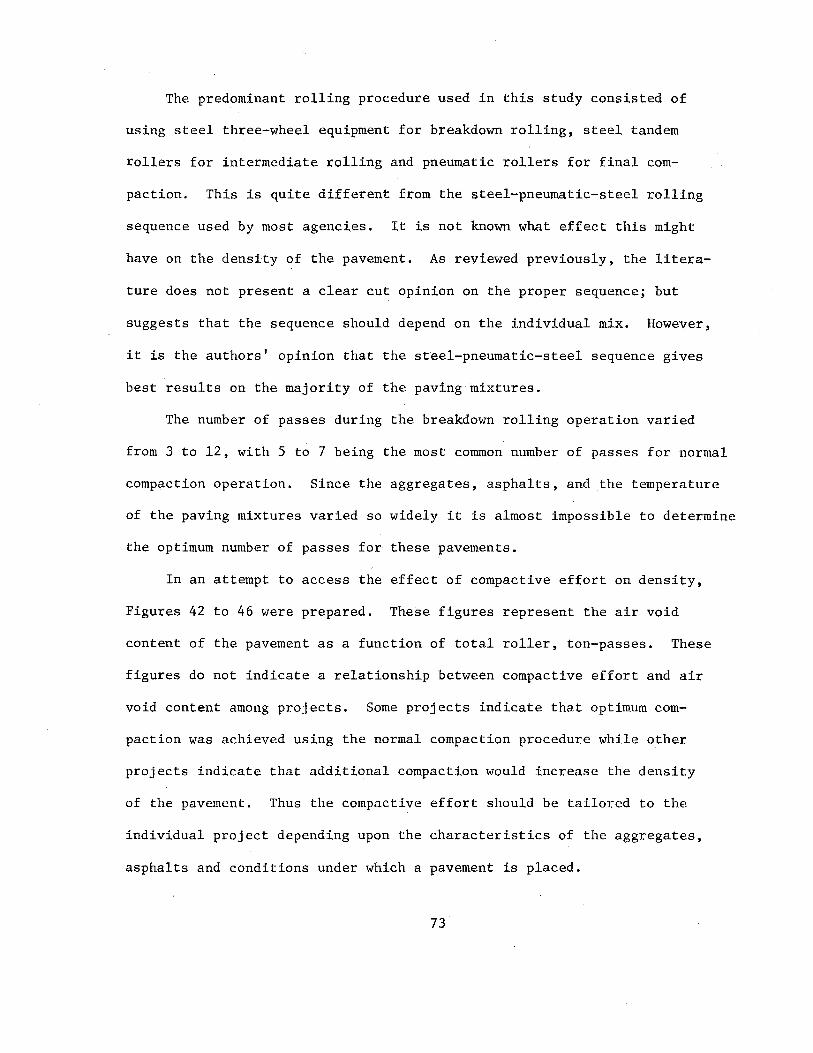
The predominant rolling procedure used in this study consisted of
using steel three-wheel equipment for breakdown rolling, steel tandem
rollers for intermediate rolling and pneumatic rollers for final com
paction. This is quite different from the steel-pneumatic-steel rolling
sequence used by most agencies. It is not known what effect this might
have on the density of the pavement. As reviewed previously, the litera
ture does not present a clear cut opinion on the proper sequence; but
suggests that the sequence should depend on the individual mix. However,
it is the authors' opinion that the steel-pneumatic-steel sequence gives
best results on the majority of the paving mixtures.
The number of passes during the breakdown rolling operation varied
from 3 to 12, with 5 to 7 being the most common number of passes for normal
compaction operation. Since the aggregates, asphalts, and the temperature
of the paving mixtures varied so widely it is almost impossible to determine
the optimum number of passes for these pavements.
In an attempt to access the effect of compactive effort on density,
Figures 42 to 46 were prepared. These figures represent the air void
content of the pavement as a function of total roller, ton-passes. These
figures do not indicate a relationship between compactive effort and air
void content among projects. Some projects indicate that optimum com
paction was achieved using the normal compaction procedure while other
projects indicate that additional compaction would increase the density
of the pavement. Thus the compactive effort should be tailored to the
individual project depending upon the characteristics of the aggregates,
asphalts and conditions under which a pavement is placed.
73
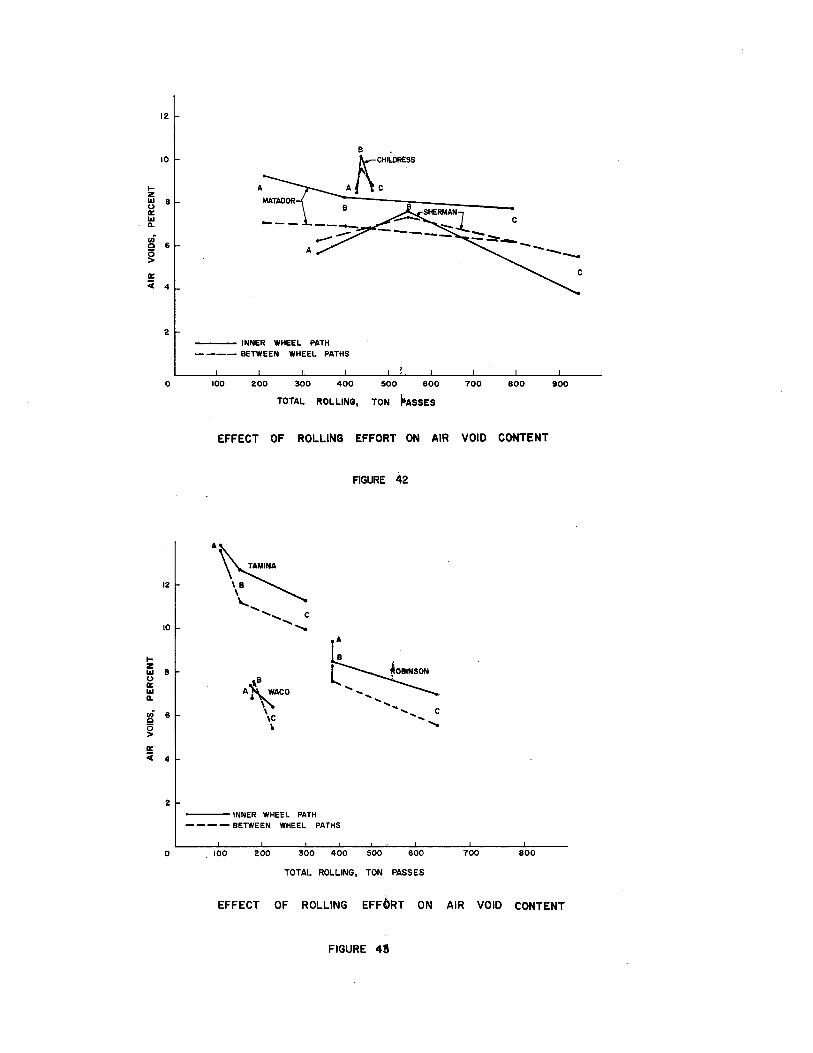
... z LLI (.) a: LLI C1.
ui c 0 > a: ;;:
... z
12
10
B
6
4
2
0
12
10
LL1 B (.) a: LLI C1.
:g 6
g a: ;;: 4
2
0
A
A
--- INNER WHEEL PATH - --- BETWEEN WHEEL PATHS
100 200 300 400 500 600 700 BOO
TOTAL ROLLING, TON ~ASSES
EFFECT OF ROLLING EFFORT ON AIR VOID CONTENT
A~ \B \
'-- ...... ............ c
..............
,a A~ACO
\ \C \
---- INNER WHEEL PATH ----BETWEEN WHEEL PATHS
100 200 300 400
FIGURE 42
500 600
TOTAL ROLLING, TON PASSES
700 BOO
900
EFFECT OF ROLLING EFFbRT ON AIR VOID CONTENT
FIGURE 41
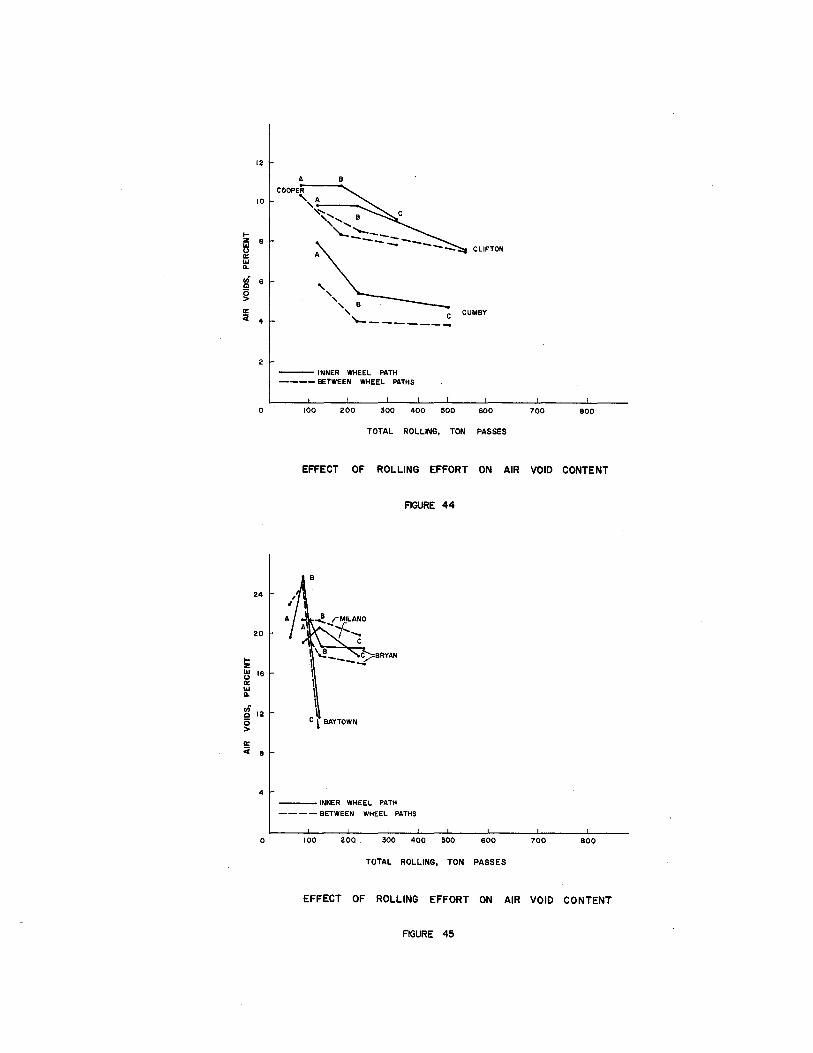
12
10
1-i::i 8
lil Ul a..
~ 6
§! a: <i 4
2
0
24
20
1-z Ul 16 (,) a: Ul a..
u; 12 Q
0 > a: <i 8
4
0
A B COOPER ',A._ ___ ~
,,.._, B
' ' '-~------- -- ...... -.. ...... ..._..._ CLIFTON
', ', B
' C CUMBY ......_ ______ _
--- INNER WHEEL PATH ----BETWEEN WHEEL PATHS
100 200 300 400 500 600 700 800
TOTAL ROLLING, TON PASSES
EFFECT OF ROLLING EFFORT ON AIR VOID CONTENT
AGURE 44
--- INNER WHEEL PATH ----BETWEEN WHEEL PATHS
100 200 300 400 500 600 700 800
TOTAL ROLLING, TON PASSES
EFFECT OF ROLLING EFFORT ON AIR VOID CONTENT
FIGURE 45
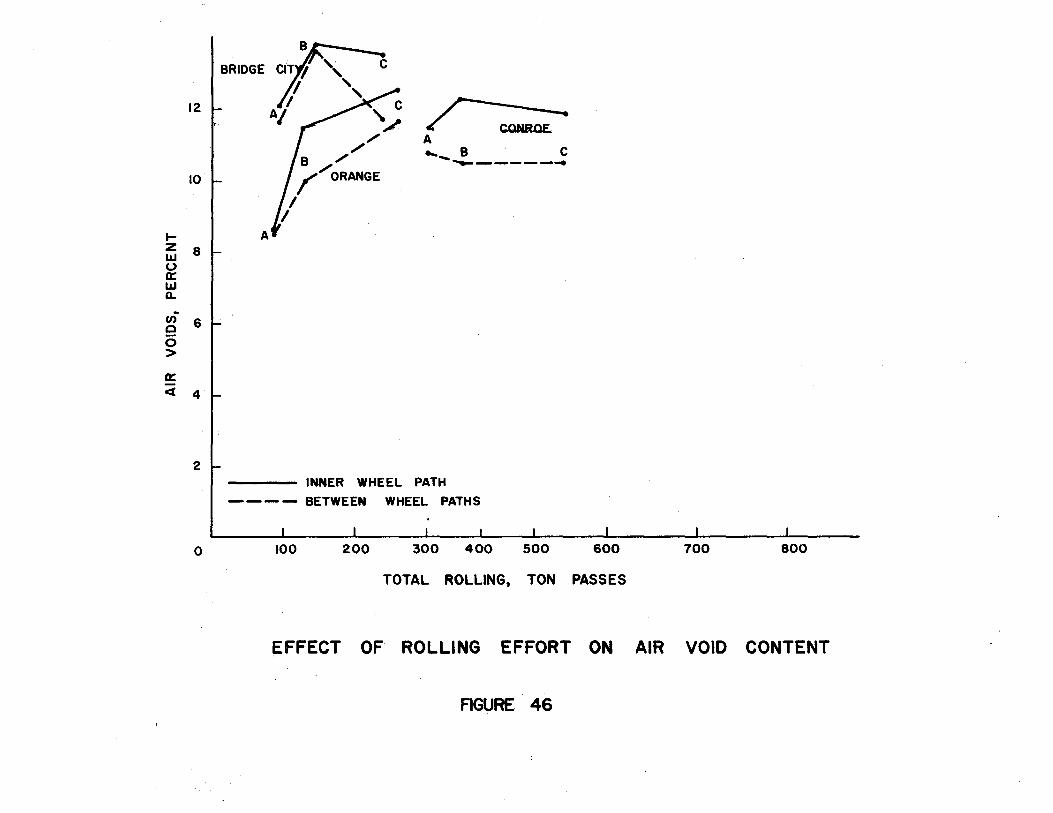
12
10
1-z 8 LLI 0 0: LLI Q.
u) 6 c 0 > 0:
<1: 4
2
0
BRIDGE
A
/
'c ~ /.
B / r/ORANGE
'II
/CQNROE A ..., B C
...... ~-------
INNER WHEEL PATH
----BETWEEN WHEEL PATHS
100 200 300 400 500 600
TOTAL ROLLING, TON PASSES
700 800
EFFECT OF ROLLING EFFORT ON AIR VOID CONTENT
AGURE 46
Conclusions
1. The initial compactability of a mix has been shown, by data
obtained in this study and data obtained from the literature, to be a
function of aggregate surface texture, aggregate shape, aggregate mineralo
gical composition, aggregate gradation, asphalt type, asphalt content,
subgrade support, lift thickness, temperature of the mix during compaction,
subgrade temperature weather conditions, and the type and sequence of
operation of the compaction equipment. All of these factors must be considered
if the relative compactability of a mix is to be determined.
2. Comparison of results obtained from the Milano and Bryan sites
with those of the other projects suggest that the finer mixes, or those
mixes with large percentages passing the No. 4 sieve, do not compact to a
high density when normal procedures are used.
3. A comparison of results obtained from the Cooper and Cumby
projects indicates that pavement temperature is an important variable.
4. Many p~vements constructed in Texas are compacted at a temperature
at which densi.fication is not easily obtained.
5. The cooling rates of thin lifts of asphalt concrete are very
rapid; thereby making it necessary to start rolling immediately after
placement and complete most of the rolling operation within a matter of
minutes.
6. The rolling sequence most frequently used in Texas (steel
steel-pneumatic) differs from the procedure generally used throughout
the rest of the country (steel-pneumatic-steel).
7. Initial air void contents are high for the majority of these
test sections.
77
FACTORS INFLUENCING THE LONG TERM DENSITY OF PAVEMENTS
Variation in pavement densities with time has. been studied by various
groups including Kenis (5) (Figure 47) Bright et al. (27) (Figure 48),
Palmer and Thomas (51) (Figure 49), Campen et al. (52), Gallaway (53),
and Pauls and Halstead (54). These and other studies have suggested
that the following factors influence the long term density of the pavement.
1. Amount of initial compaction
2. Material propeities a. Aggregate absorption b. Aggregate surface characteristics c. Aggregate gradation d. Asphalt temperature-viscosity relationship e. Asphalt susceptibility to hardening
3. Mix Design a. Asphalt content (film thickness (12) b. Voids in mineral aggregate
4. Weather conditions a. Air temperature variations (daily and seasonly) b. Date of construction
5. Traffic a. Amount b. Type c. Distribution throughout the year d. Distribution in lanes
6. Pavement thickness
Results in fifteen test sites in this study are presented in Figures
SO to 79. Figures SO to 64 represent air void contents for normal
compactive efforts between the wheel path as well as the inner and outer
wheel path. Figures 65 to 79 represent air void contents at the inner
wheel path for the three compactive efforts. Appendix C contains infor-
mation in graphical form at the inner and outer wheel path as well as
78
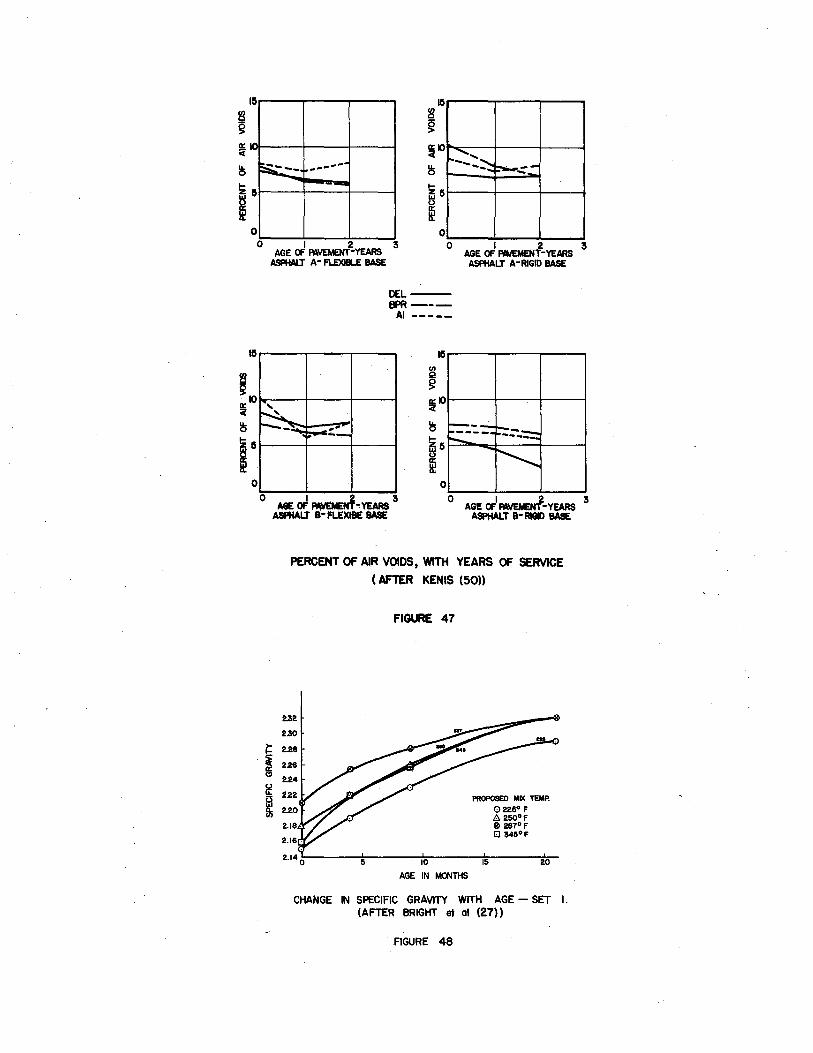
~
~-· ~-------~::::--::::--.. --.. !:'-~
0 Lo----~~----~2~--~3
AGE OF PAIEMENT-YEARS ASPHALT A-RIGID BASE
DEL-----BPR--
AI -----
~r-----~--------~ ~~----~----~----~
~ IO!r----l---+----1 ~
~ ~10~----+-----1-----; <[·
~
15 0~0----~~----~2--~3
ME. OF PAVEMENT.,YEARS ASPHALT a- A.EXIBE BASE
0~----~--~~--~ 0 I 2 3
AGE OF PAVEMENT-YEARS ASPHALT a- RIGI> BASE
>-
i a: (l)
0 li:
~
PERCENT OF AIR VOIDS, WITH YEARS OF SERVICE
( AFTER KENIS (50))
FIGURE 47
232
230
2.28
2.22 PROPOSED MD< TEMP. 0225° F 8 250°F
2.18 e 287°F
2.16. 8 345°F
5 10 15 20
AGE IN MONTHS
CHANGE IN SPECIFIC GRAVITY WITH AGE - SET I. (AFTER BRIGHT et al (27))
.FIGURE 48
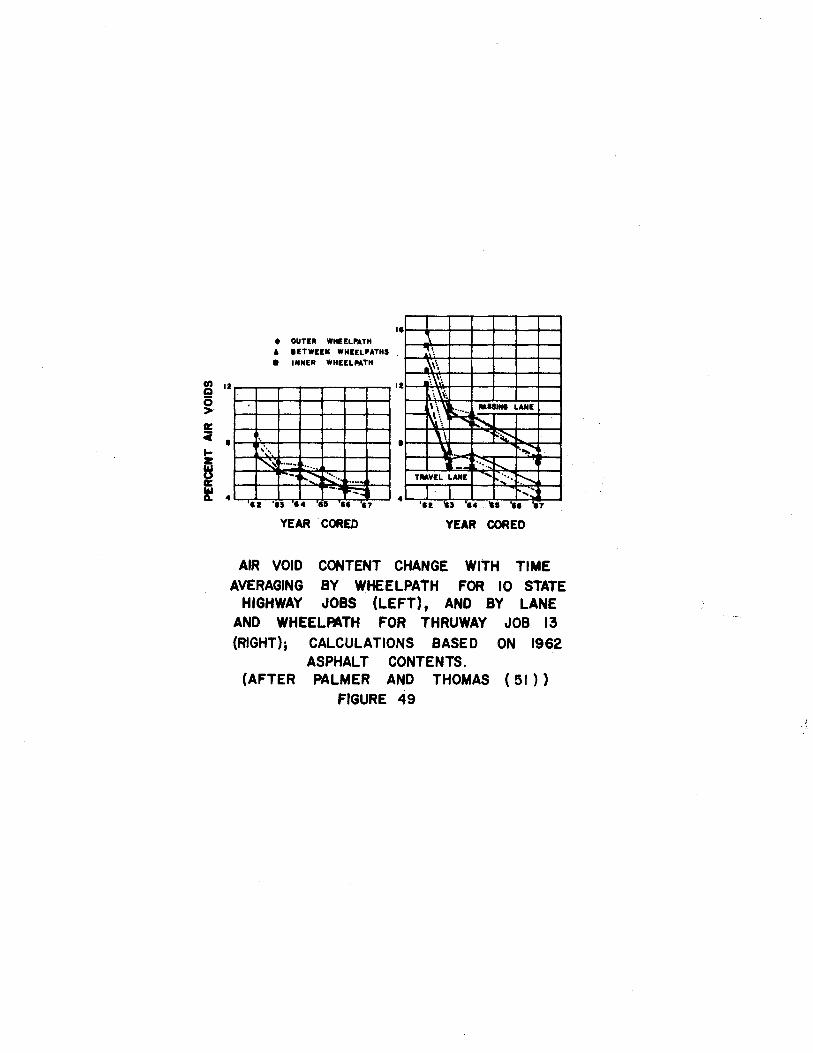
•• I
' I OUTE~ WHEELMTH A IETWEEN WHIELPATHS . ";,': • INNER WHEELMTH .\\\
\\~: :, \\:, ! 12 r---r-o--r--,---r--r---,,-, 12
s >· G:
!---' ~\~ ······ MISIIII LANE
-......, ~ \\ .-~~
\ .......... C I ~..,..,_-+--+--4----"f--+--+ I ... \· .. ~ "-"' ·~·- ..... ce .. ~~~·· ~ 4 ....._,.~~~--.:!:.---..,.,·· .. "="~ .... ·----...J 4
IZ 'II 14 II II 17
YEAR ·cORED
- ··~ ["'.., TMYEL LANE '~·· ~ .. ..._, . . . .
YEAR CORED
AIR VOID CONTENT CHANGE WITH TIME AVERAGING BY WHEELPATH FOR 10 STATE
HIGHWAY JOBS (LEFT), AND BY LANE AND WHEELMTH FOR THRUWAY JOB 13
(RIGHT}; CALCULATIONS BASED ON 1962 ASPHALT CONTENTS.
(AFTER PALMER AND THOMAS ( 51 ) ) FIGURE 49
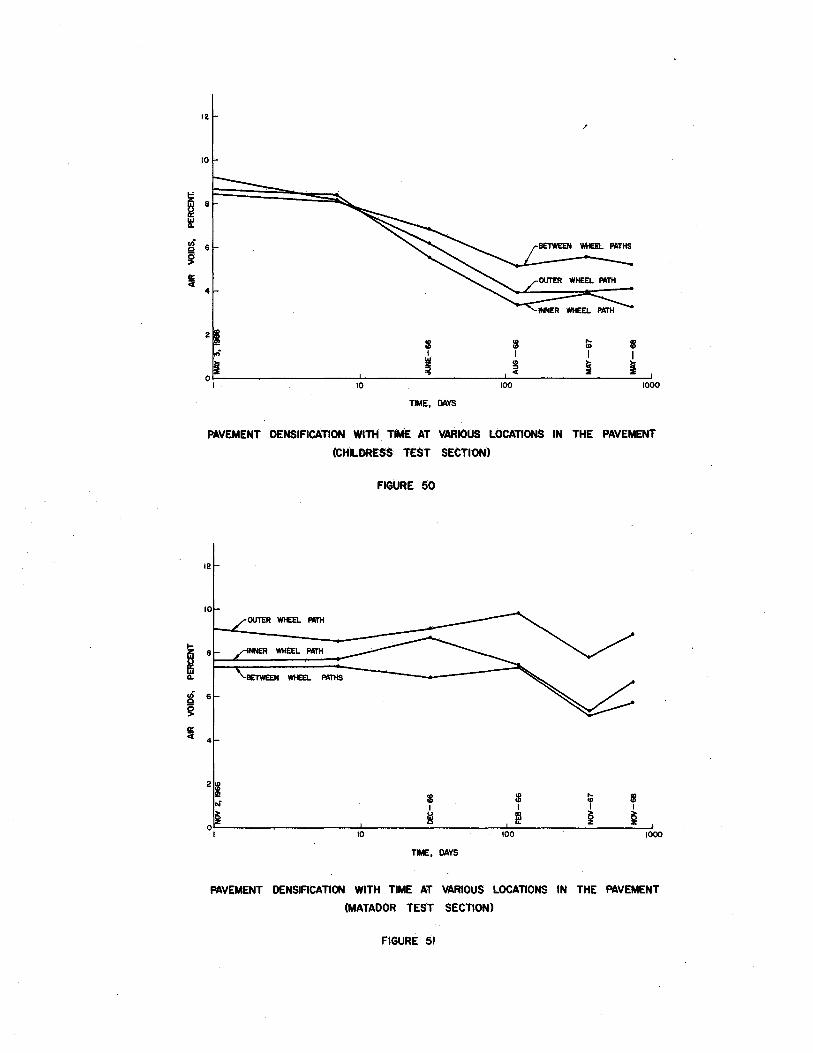
!Z ~ ~
ui e g a: c
IZ
10
B
6
4
$ I
l 10
TIME, DAYS
$ I
~ 100
/
1B I i
1000
PAVEMENT DENSIFICATION WITH TIME AT VARIOUS LOCATIONS IN THE PAVEMENT
(CHILDRESS TEST SECTION)
FIGURE 50
12
$ I
~ 10 100 1000
TIME, DAYS
PAVEMENT DENSIFICATION WITH TIME AT VARIOUS LOCATIONS IN THE PAVEMENT
(MATADOR TEST SECTION)
FIGURE 51
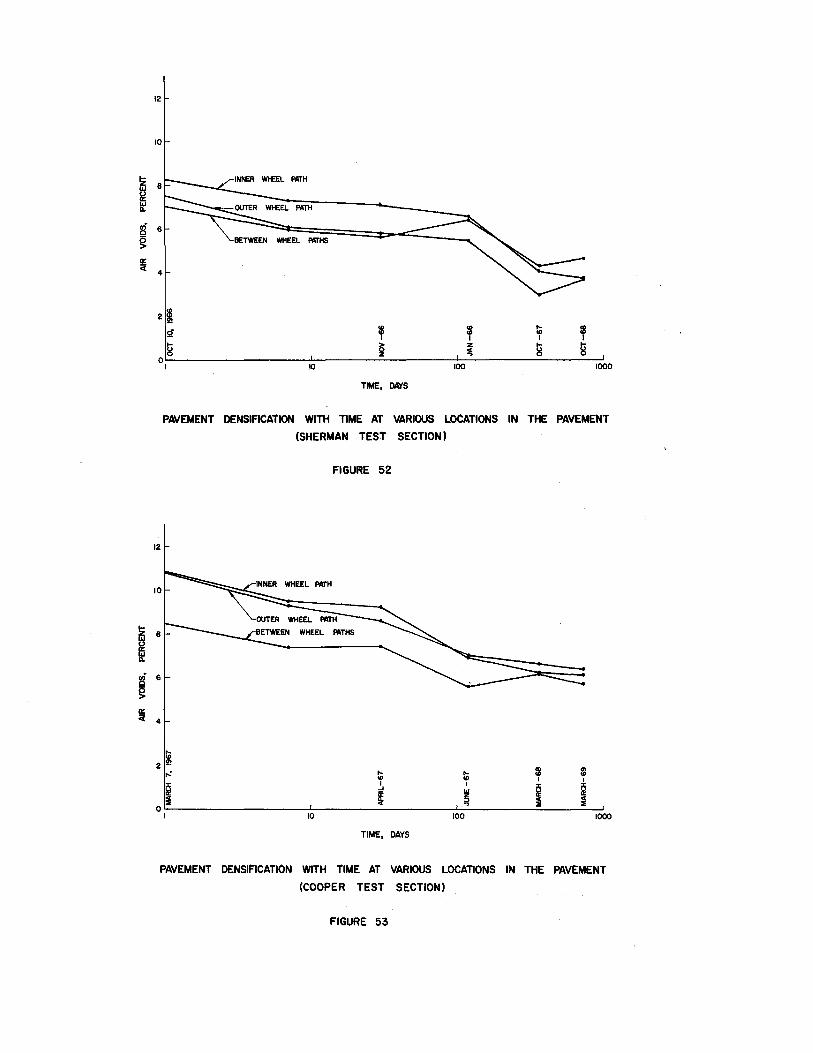
!z 11.1
15 11.
!!I ~ ac: <t
12
10
BETWEEN WHEEL FIQ'HS
21 ~ T g ~
0 ~1 ------------------~~~----------------~~oo~----------------~~000~
12
8
6
4
TIME, DAYS
PAVEMENT DENSIFICATION WITH TIME AT VARIOUS LOCATIONS IN THE PAVEMENT
(SHERMAN TEST SECTION)
FIGURE 52
ID 2!!! m m ...: .... ....
"' "' I I
~ I I :1:: ~ ...J
~ ~ i ~ " ::& 0
I 10 100 1000
TIME, DAYS
PAVEMENT DENSIFICATION WITH TIME AT VARIOUS LOCATIONS IN THE PAVEMENT
(COOPER TEST SECTION)
FIGURE 53
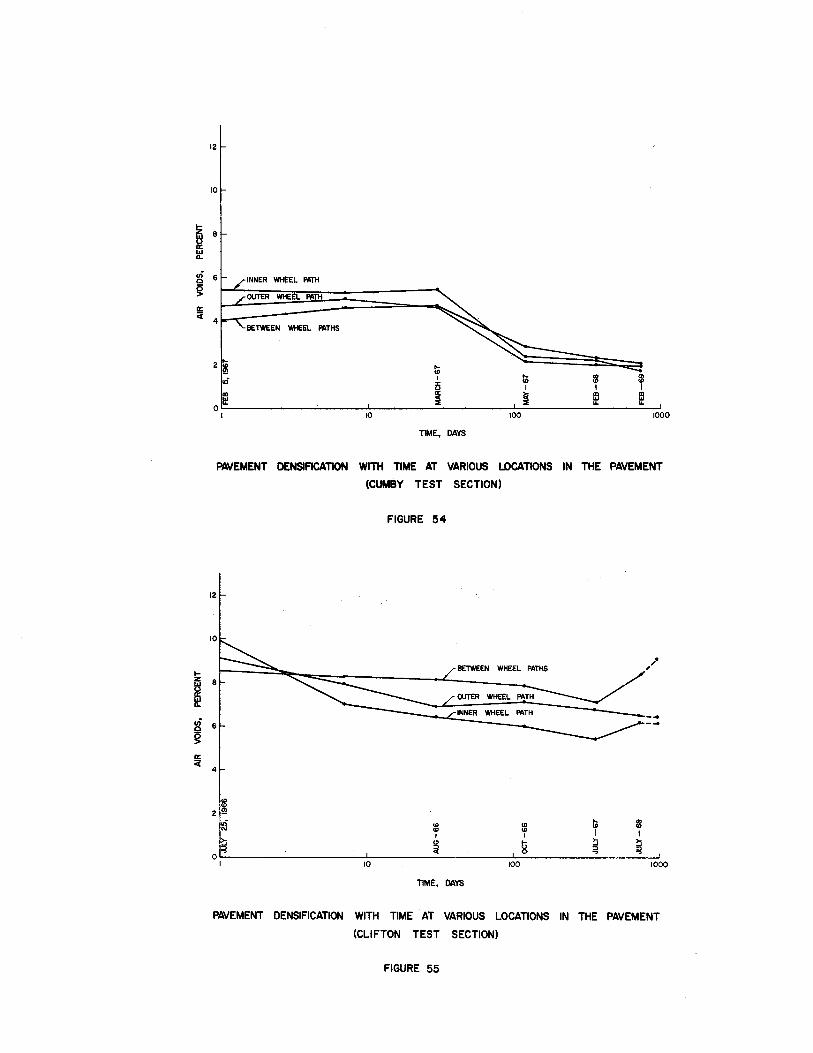
12
10
!f 6 INNER WHEEL Ml"H
g r-~==~~~~~----~--------~ OOTER WHEEL PAT
i5 &1 ~
ui
~ a: <r
BETWEEN WHEEL PATHS
0~ 10 100 1000
TIME, DAYS
PAVEMENT DENSIFICATION WITH TIME AT VARIOUS LOCATIONS IN THE PAVEMENT
(CUMBY TEST SECTION)
FIGURE 54
12
BETWEEN WHEEL PATHS ,. ,
8
6
4
$ 2 !!!
,; Ill <D !D m "' <D <D I I I I
a " t; ~ ~ ~ ::> ~ 0 ..,
0 I 10 100 1000
TIME, DAYS
PAVEMENT DENSIFICATION WITH TIME AT VARIOUS LOCATIONS IN THE PAVEMENT
(CLIFTON TEST SECTION)
FIGURE 55
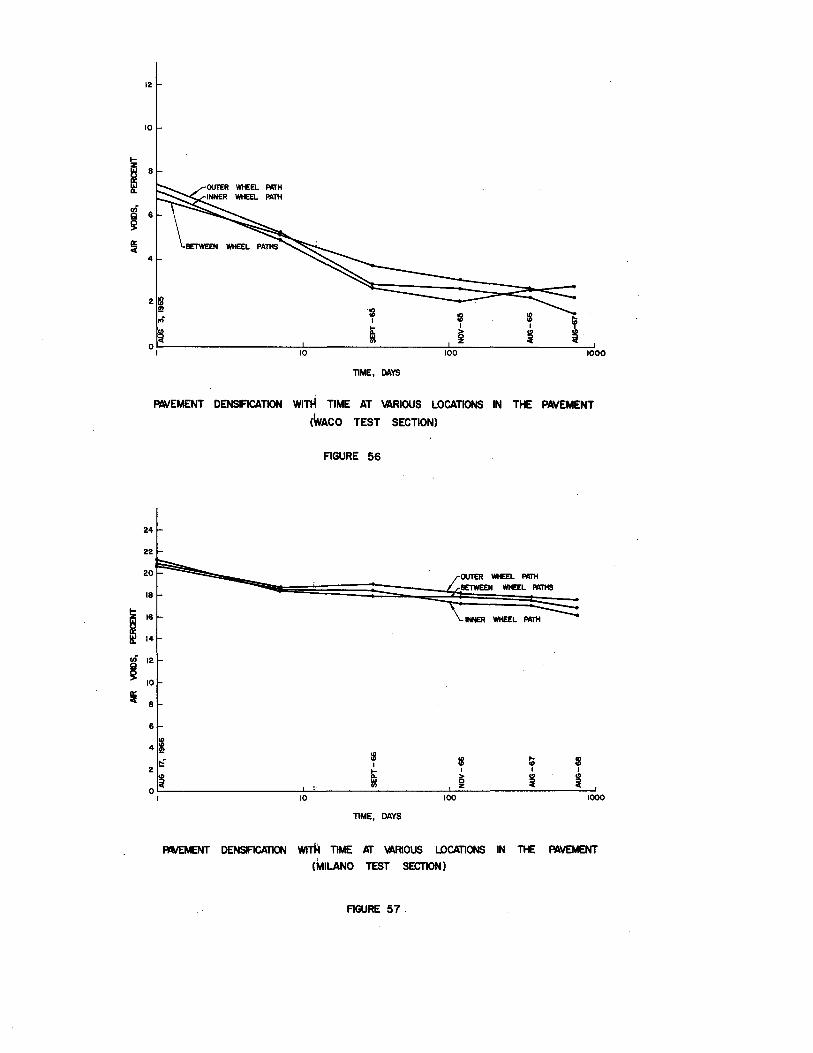
12
10
4
~ 0 ~1 ------------------~10~------~--------~IO~O=---------~----~I~OOO
24
22
6
TIME, DAYS
PAVEMENT DENSFICATION WIT~ TIME AT VARIOUS LOCATIONS IN THE PAVEMENT
(WACO TEST SECTION)
FIGURE 56
INNER WHEEL MrH
41 !8
2
0
t:: !8 ... :8 I "' li: I I I
i ~ i "' ... ~ "' z I 10 100 1000
TIME, DAYS
AIIWEMENT DENSIFIC.4mON wrrH TIME l{f \MIOUS LOCATIONS IN Tt£ PAVEMENT
(MILANO TEST SECTION)
FIGURE 57.
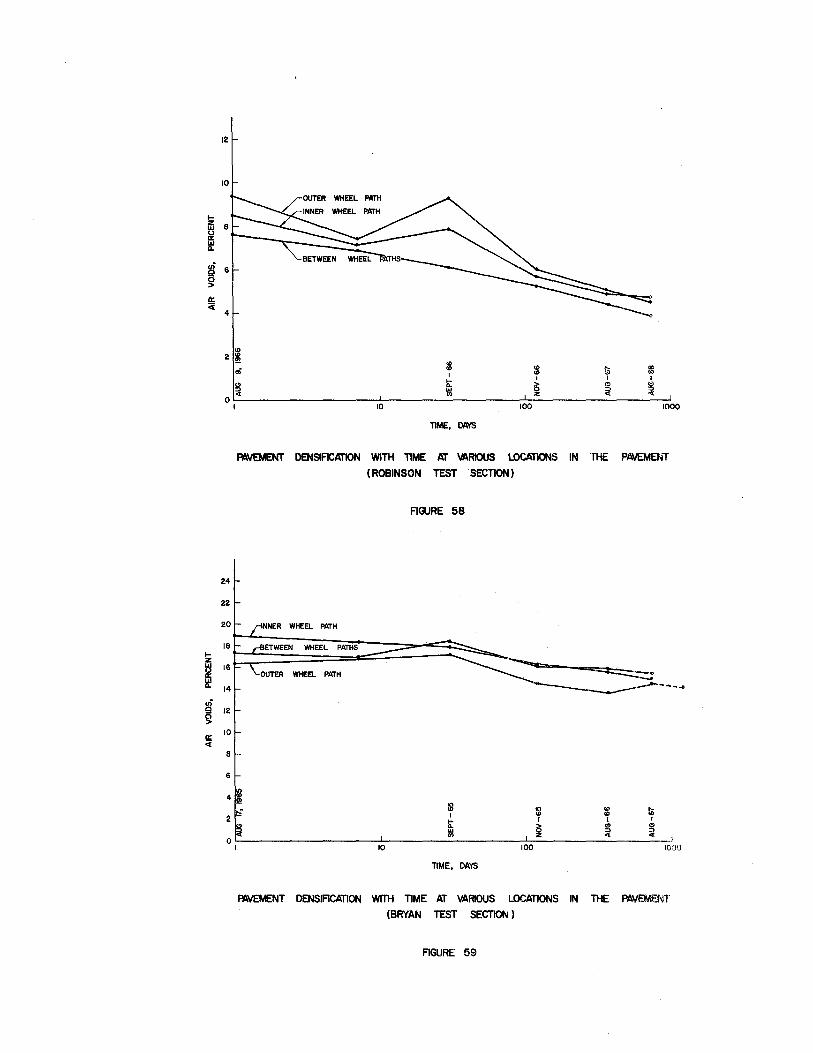
1-z UJ
II! ~
f !!;; <[
12
tO
<D
2 ~ :8 <D ti; f8 I <D
I I I li: i3 <!> "' UJ ;if ~ (/) z ~
tO tOO 1000 OL,--------------------~------------------~~------------------~.
24
22
20
18
16
14
12
tO
8
6
TIME, DAYS
PAVEMENT DENSIFJCmlON WITH TIME f(r VARIOUS I..OCAl10NS IN THE PAVEMEI'tT
(ROBINSON TEST SECTION)
FIGURE 58
INNER WHEEL PATH
OUTER WHEEL PATH ---..
., 4;
IS 2
0 I
t:: ., <D !D I ISJ <D
li: I I I
~ "' "' "' ::> ::>
"' z "' ct _J 10 tOO 10,)0
TIME, DAYS
PAVEMENT DENSIFICATION WITH TIME AT VARIOUS LOCATIONS IN THE PAVEMENT
(BRYAN TEST SECTION )
FIGURE 59
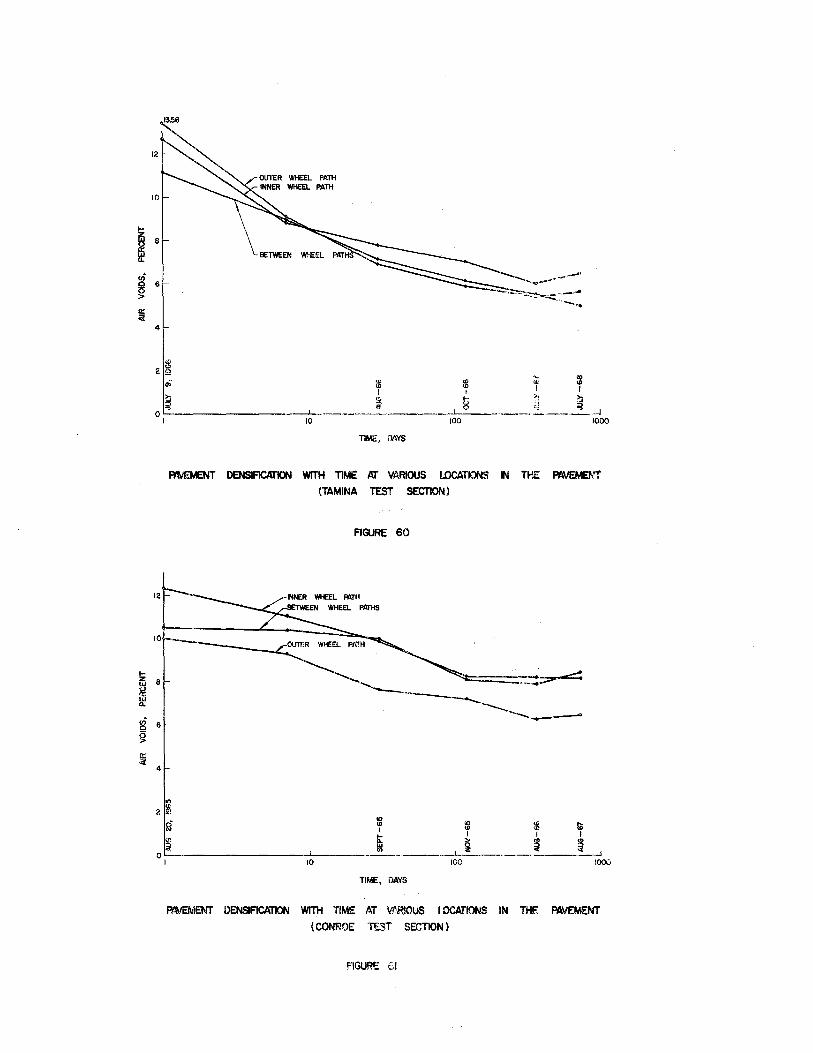
4
~ $ ~ = 1 t I I w t; 'i ~ i 0 <j iJ
------------'--··--·~----------·_j_---··----- ------ . ..J 10 100 1000
TIME, DAYS
mJEMENT DENSIFDmON WITH TIME /S:r VARIOUS LOCATIONS IN TI-'.E PAVE~tr
(TAMINA TEST SECTION)
FIGURE 60
!z 8
~ a.
,.; 6 0 g
tr. <[
4 •
"' 2 ~ c5 "' "' a
0
.., "' ~ $ ~ 1
I I I
-----------'------ ~ _____ _LJ _______ ij ____ ~ __ _, I 10 100 1000
TIME, DAYS
M!EMENT DENSIFICATION WITH TIM!:: AT VfR!OUS lDCATIONS IN THE PAVEMENT
(CONROE TF-ST SECTION)
FIGURE <:,.1
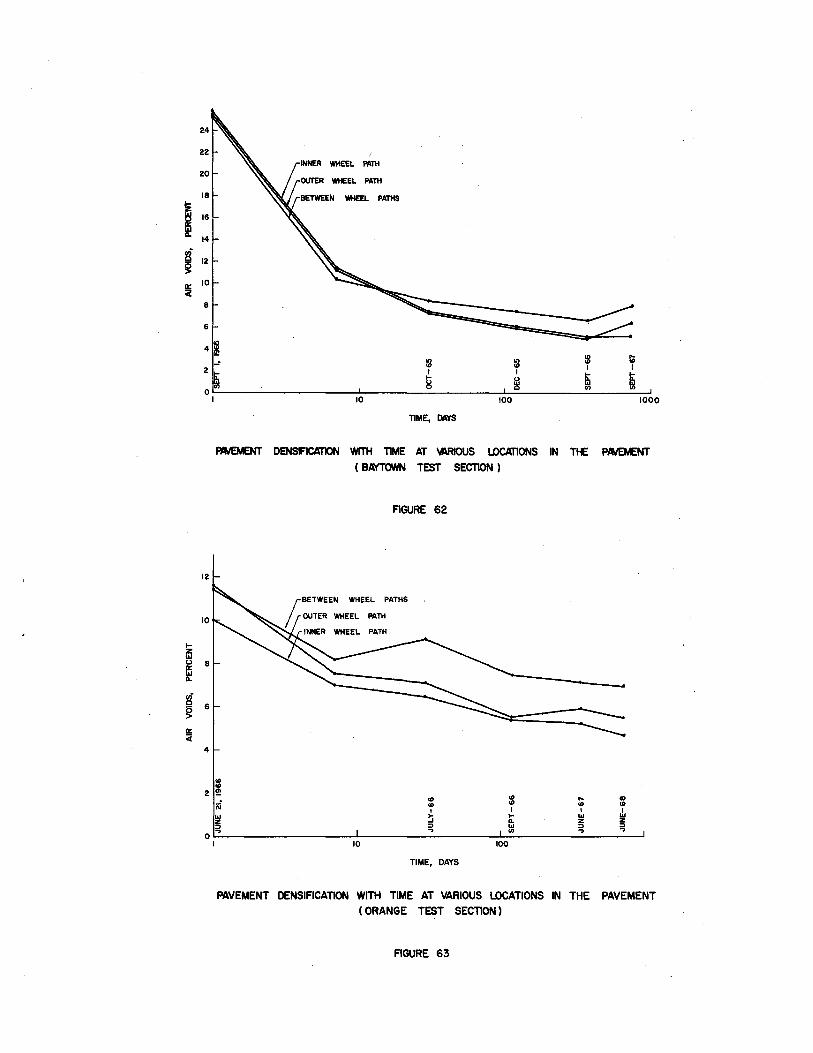
6
a: Ci
4
2
0 I
10 100 1000
TIME, DAYS
PAIEMENT DENSFlOOION WITH TIME AT \MIOUS I.OOOIONS IN Tt£ PMt.£NT ( BAYTOWN TEST SECTION l
"' "' !!!
oi "' z ::> ...
FIGURE 62
!BETWEEN WHEEL PATHS
II OUTER WHEEL PATH
INNER WHEEL PATH
10
"' "' I
~ :;
TIME, DAYS
"' .. .. "' "' "' I I I ,..
"' "' ... z z "' ::> ::> ., ... ...
100
PAVEMENT DENSIFICATION WITH TIME AT VARIOUS LOCATIONS IN THE PAVEMENT ( ORANGE TEST SECTION l
FIGURE 63
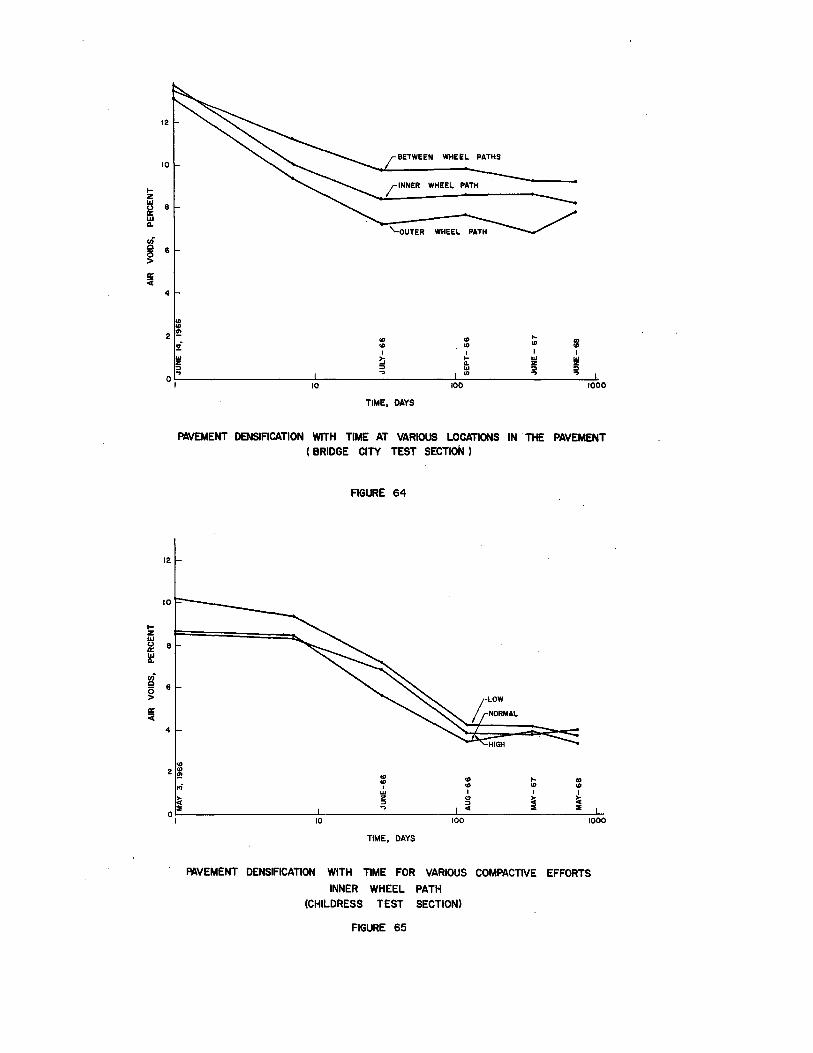
1-z t.l
II! t.l 0..
!If c 0 > a: <i
!If
12
10 ~BETWEEN WHEEL PATHS
/INNER WHEEL,. PATH
8
6
4
CD CD
2 !!! CD CD .. CD
0
i CD CD CD CD I I I I .... z
::> .. ~ ... .... .... ... z z :::> .... :::> ::> .. "' .. .. I 10 100 1000
TIME, DAYS
PAVEMENT OENSIFICATION WITH TIME AT VARIOUS LOCATIONS IN . THE PAVEMENT ( BRIDGE CITY TEST SECTION )
FIGURE 64
~ 6 > a: <i
4
CD
2 ~ ,.;
CD CD I ..
::>
.. CD CD CD I I
~ ~ ~ oC-----------------~~--------------~~~--------------~ I
4 ::& ::&
10 100 1000
TIME, DAYS
PAVEMENT DENSIFICATION WITH TIME FOR VARIOUS COMPACTIVE EFFORTS
INNER WHEEL PATH
(CHILDRESS TEST SECTION)
FIGURE 65
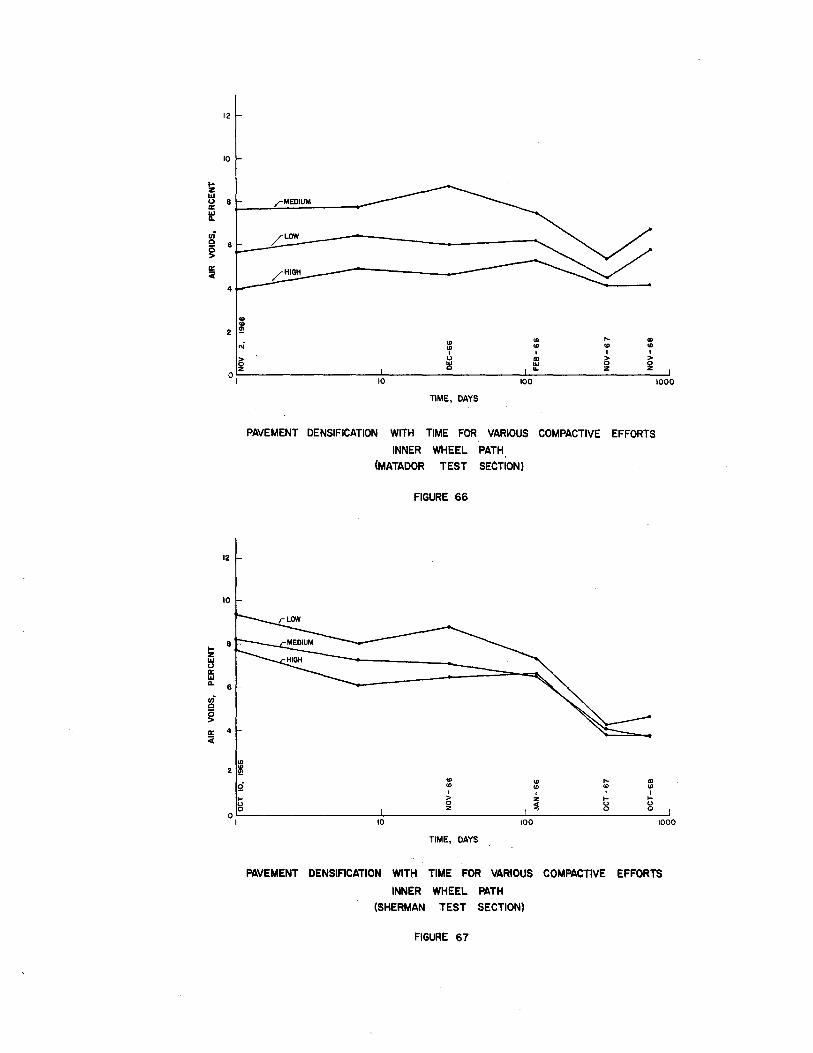
12
10
!Z LIJ ~ 8 /"MEDIUM
~
ui 0 6 g a: <i
., ., 2 2!
N' ., ., ' (.)
l!l
., ... "' ., "' "' ' I I
ID ~ > "' 0 ... z z ~
0~.~------------------~--------------------~------------------~ 10 100 1000
12
10
1-8
z LIJ <.J a: LIJ 11.
ui 0
g
"' 2 ~
Q .... (.) 0
0 I
TIME, DAYS
PAVEMENT DENSIFICATION WITH TIME FOR VARIOUS COMPACTIVE EFFORTS
INNER WHEEL PATH
(MATADOR TEST SECTION)
FIGURE 66
"' CD ... "' CD
"' CD ., ' ' ' I > z ... .... 0 .. (.) (.) z ... 0 0
10 100
TIME, DAYS
1000
PAVEMENT DENSIFICATION WITH TIME FOR VARIOUS COMPACTIVE EFFORTS
INNER WHEEL PATH
(SHERMAN TEST SECTION)
FIGURE 67
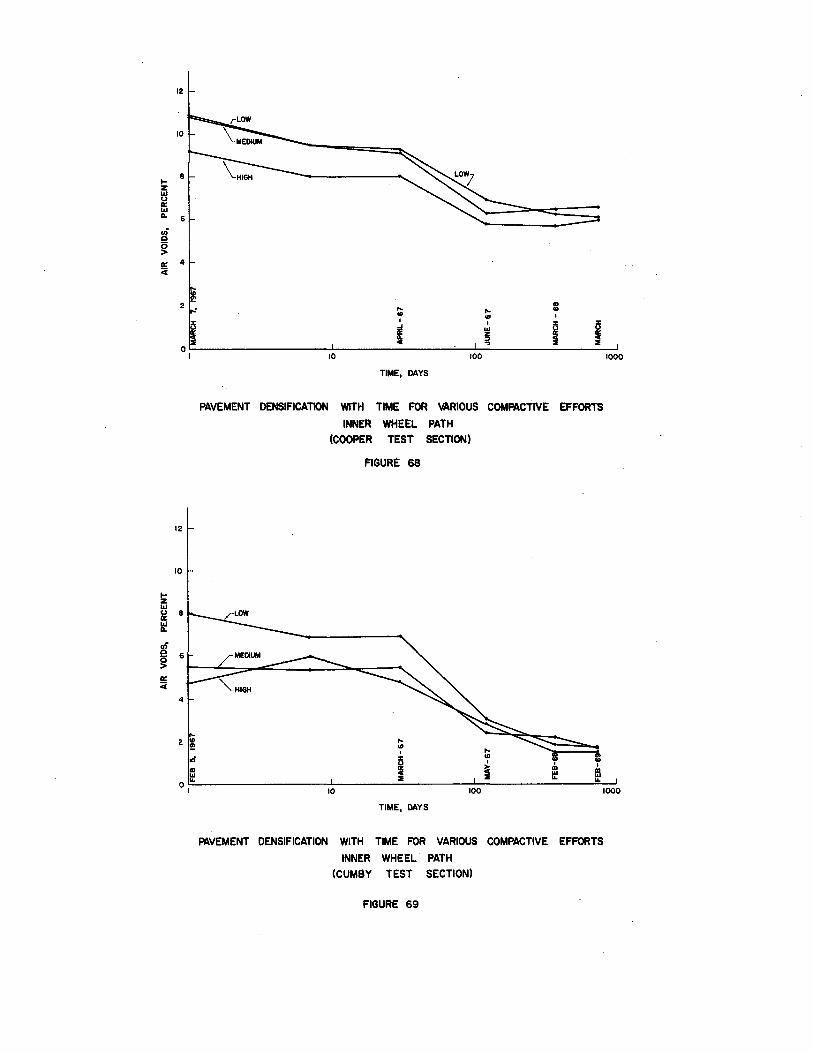
12
10
8 .... z Ill u a: Ill Q. 6
.n Q 0 > g; 4 c
12
10
.n e 6 g a: Ci
4
... 2 ;
,; ID
"'
.. ... ... "' "' "' I I I :z: :z: i! ~ i
(J
~ ::) ~ ., :I
10 100
TIME, DAYS
PAVEMENT DENSIFICATION WITH TIME FOR VARIOUS COMPACTIVE EFFORTS
INNER WHEEL PATH
(COOPER TEST SECTION)
FIGUR£ 68
... "' ... I :z: "' ~
I I I ID ID
"' "'
1000
o~~~----------------~--------~--------~~--------------~~-1
i :I ~ ~
100 1000 10
TIME, DAYS
PAVEMENT DENSIFICATION WITH TIME FOR VARIOUS COMPACTIVE EFFORTS
INNER WHEEL PATH
(CUMBY TEST SECTION)
FIGURE 69
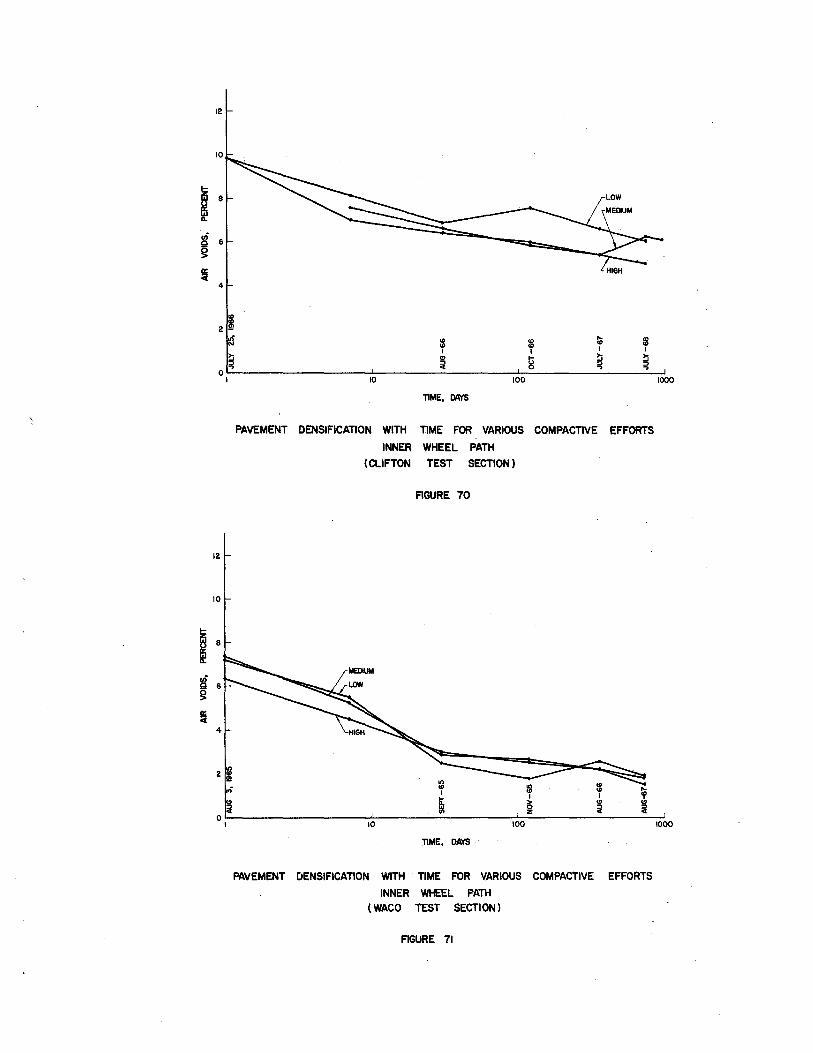
4
"' 2~
~ Ol
"' :8 "' I I
"' t; a 0
HIGH
I'D f8 I I ~ ~ ::> ::> .. ..
0~1 ------------------~~----------------~~------------------~-10 100 1000
TIME,OOS
PAVEMENT DENSIFICATION WITH TIME FOR VARIOUS COMPACTIVE EFFORTS
INNER WHEEL PATH
(CLIFTON TEST SECTION)
FIGURE 70
TIME, DAYS
PAVEMENT DENSIFICATION WITH TIME FOR VARIOUS COMPACTIVE EFFORTS
INNER WHEEL PATH (WACO TEST SECTION)
FIGURE 71
1000
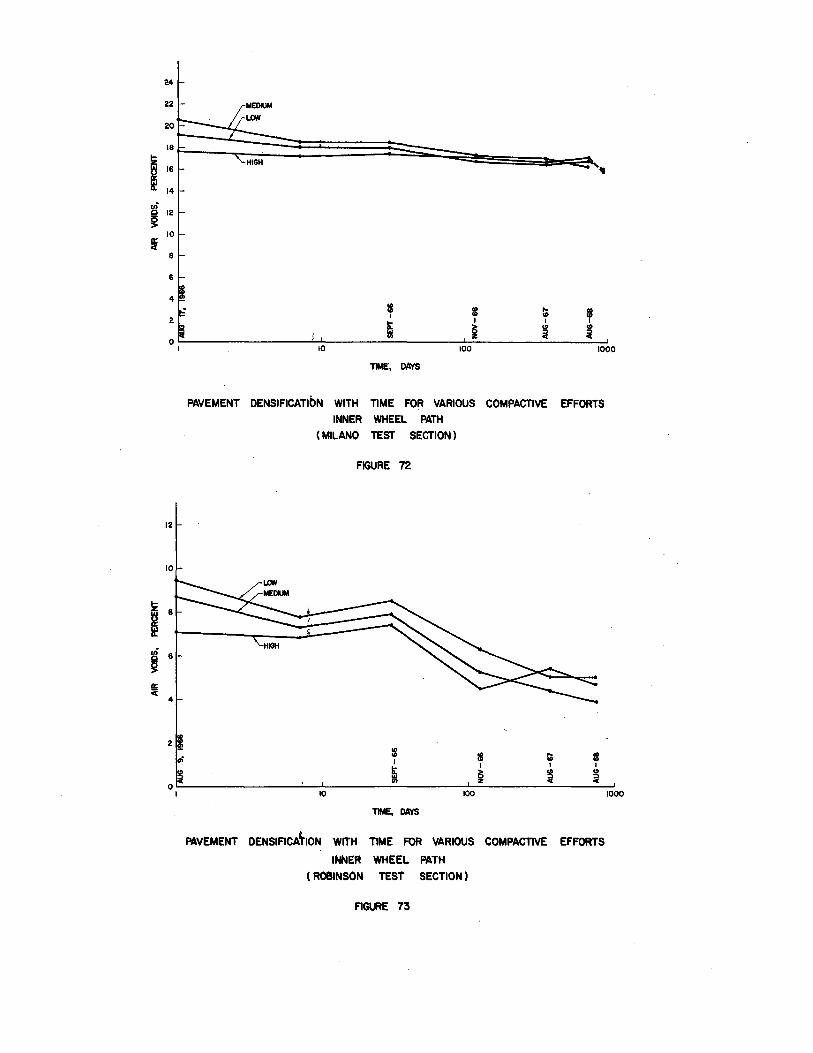
24
22
20
18
I 16
14
~ 12 g 10 a::
Ci 8
6
4
2
12
10
•
IJ I
i 10 100 1000
TIME, DAYS
PAVEMENT DENSIFICATibN WITH TIME FOR VARIOUS COMPACTIVE EFFORTS
INNER WHEEL PATH
(MILANO TEST SECTION)
FIGURE 72
:s I
~ IJ I
i 10 100
TIME, DAYS
PAVEMENT DENSIFICAtiON WITH TIME FOR VARIOUS COMPACTIVE EFFORTS
INNER WHEEL PATH
( ROBINSON TEST SECTION)
FIGURE 73
1000
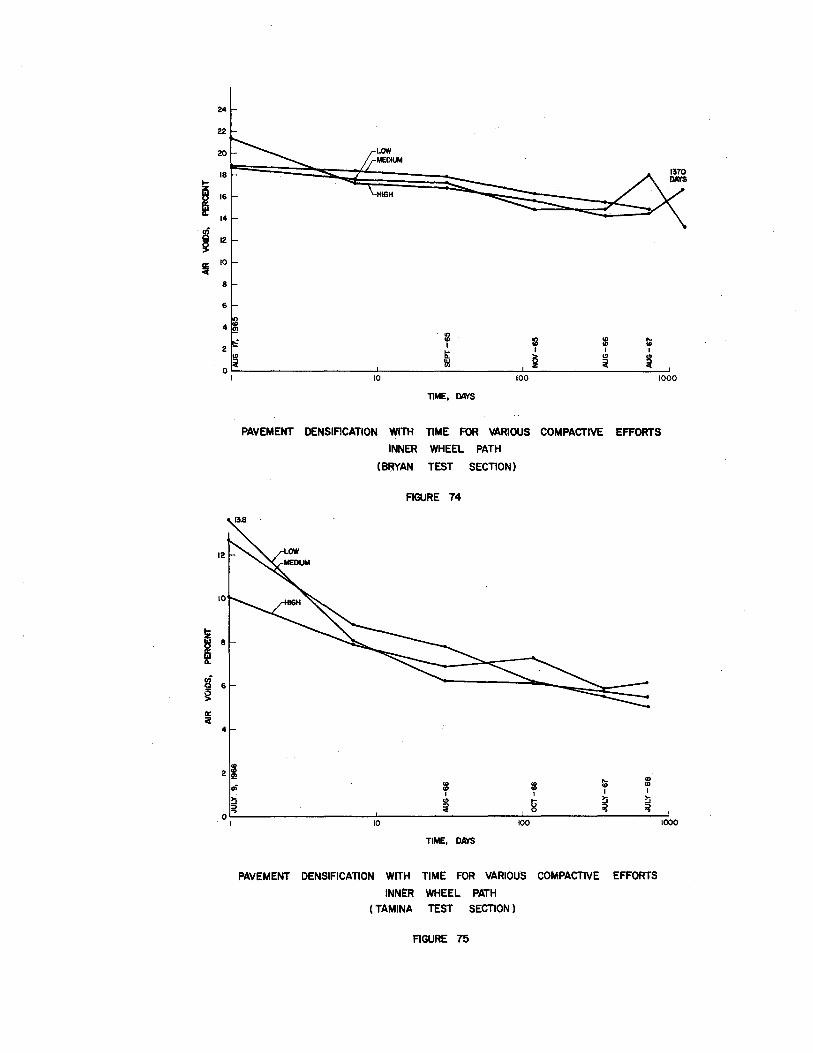
24
22
20
18
~ 16
~
!!f 12 g
i 10
8
6
2
12
10
~ 8
Q.
~ 6 g a:: c
4
21 ai
~ ::> .,
0 I
LOW MEDIUM
HIGH
lll I
li: Ill
:s ... 10 CD I I I
~ " " z il il 10 100 1000
TIME, DAYS
PAVEMENT DENSIFICATION WITH TIME FOR VARIOUS COMPACTIVE EFFORTS
INNER WHEEL PATH
(BaYAN TEST SECTION)
FIGURE 74
10 "' :8 $ CD
I I I I
" t ~ ~ ::> ::> ~ .. 0 ., 10 100
TIME, DAYS
PAVEMENT DENSIFICATION WITH TIME FOR VARIOUS COMPACTIVE EFFORTS
INNER WHEEL PATH
( TAMINA TEST SECTION )
FIGURE 75
1000
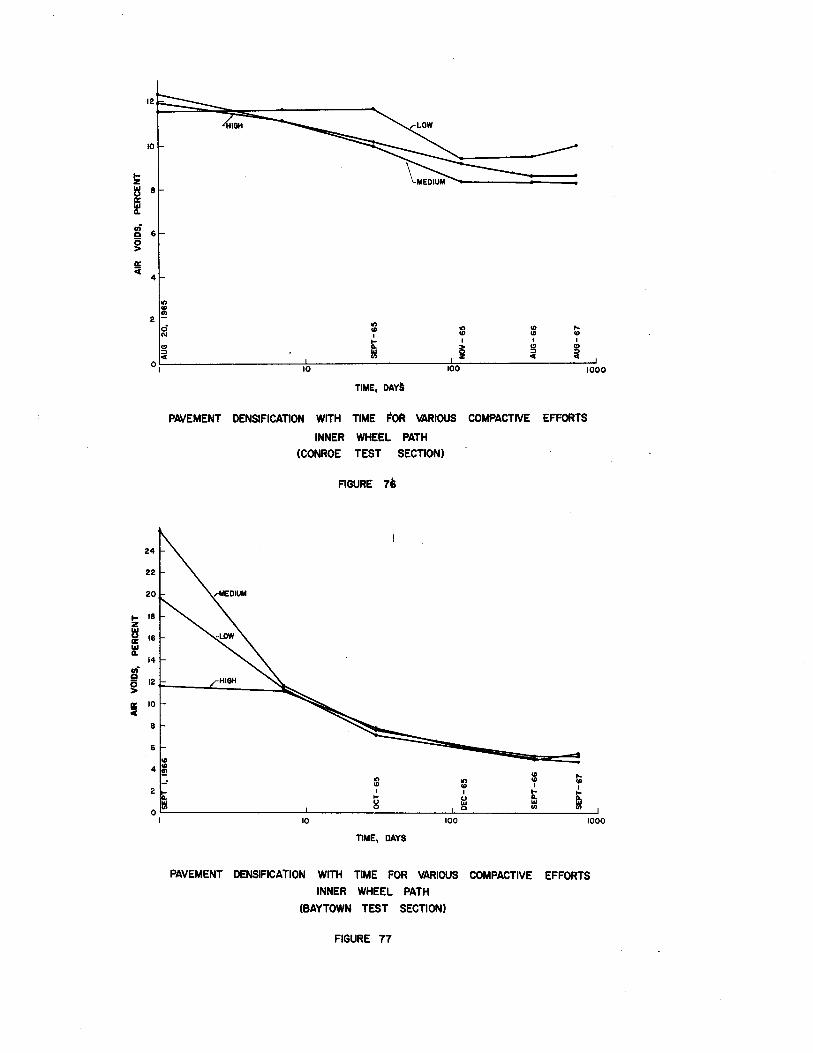
10
!z ~ 8 a: ~
l!i 6 g ~
4
., = 2 -0 N
" :::>
"
., ., U> ... U> I U> U> U> ... I I I ...
~ " " ... :::> :::>
"' " " oLI ------------------~~------------------~------------------~-10 100 1000
TIME, DAYS
PAVEMENT DENSIFICATION WITH TIME FOR VARIOUS COMPACTIVE EFFORTS
INNER WHEEL PATH
(CONROE TEST SECTION)
FIGURE 76
.. U> ... ., U> U> U> U> I I I I ... ~ ... u ...
u 1!1 ...
0 "' "' 10 100
TIME, DAYS
1000
PAVEMENT DENSFICATION WITH TIME FOR VARIOUS COMPACTIVE EFFORTS
INNER WHEEL PATH
(BAYTOWN TEST SECTION)
FIGURE 77
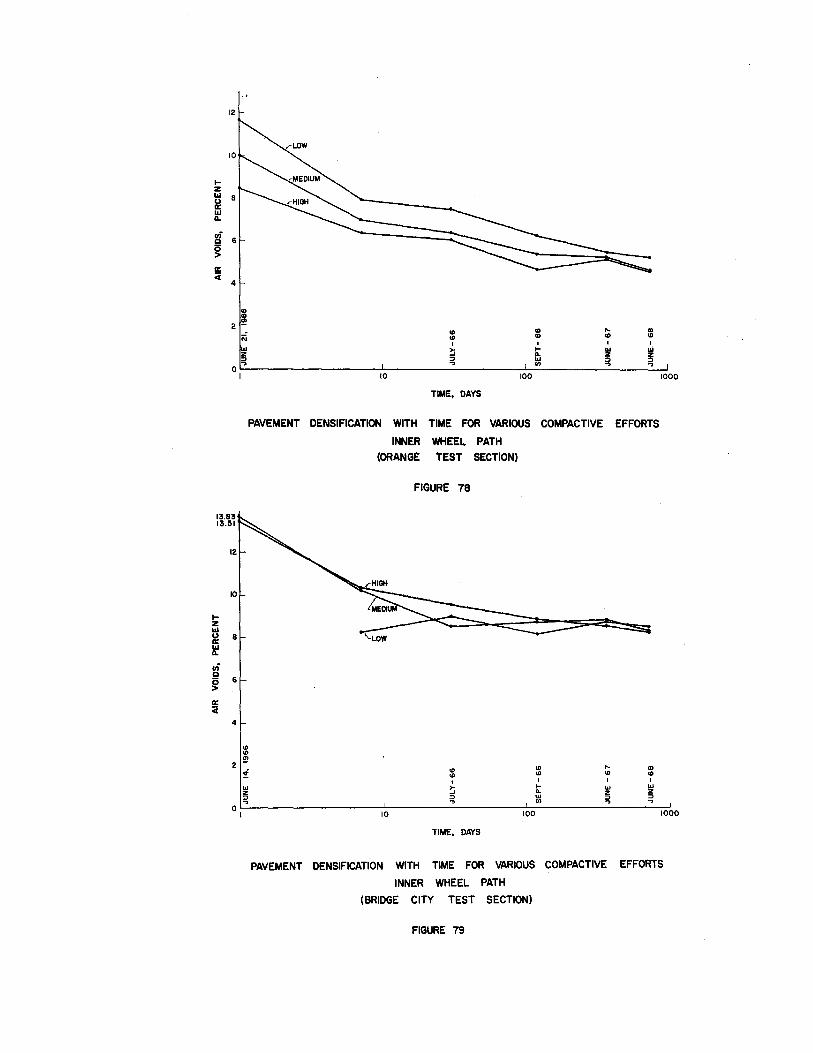
..... z 1.1.1 u II: 1.1.1 11.
.n Q
g !E <(
..... z 1.1.1 u II: 1.1.1 11.
.n Q
g II: Ci
12
10
8
6
4
"' :g 2-
"' .. 0
6
4
2
0
I
i\i "' "' "' "' I I I ... z ::> .. !; .... ... ... z
::> ll! ::> .. .. 10 100
TIME, DAYS
PAVEMENT DENSIFICATION WITH TIME FOR VARIOUS COMPACTIVE EFFORTS
INNER WHEEL PATH
(ORANGE TEST SECTION)
FIGURE 78
"' "' !!?
! "' .. CD
"' "' "' I I I ... z ::> .. .... ... ...
a. z z UJ ::> :; "' ..
1000
I 10 100 1000
TIME, DAYS
PAVEMENT DENSIFICATION WITH TIME FOR VARIOUS COMPACTIVE EFFORTS
INNER WHEEL PATH
(BRIDGE CITY TEST SECTION)
FIGURE 79
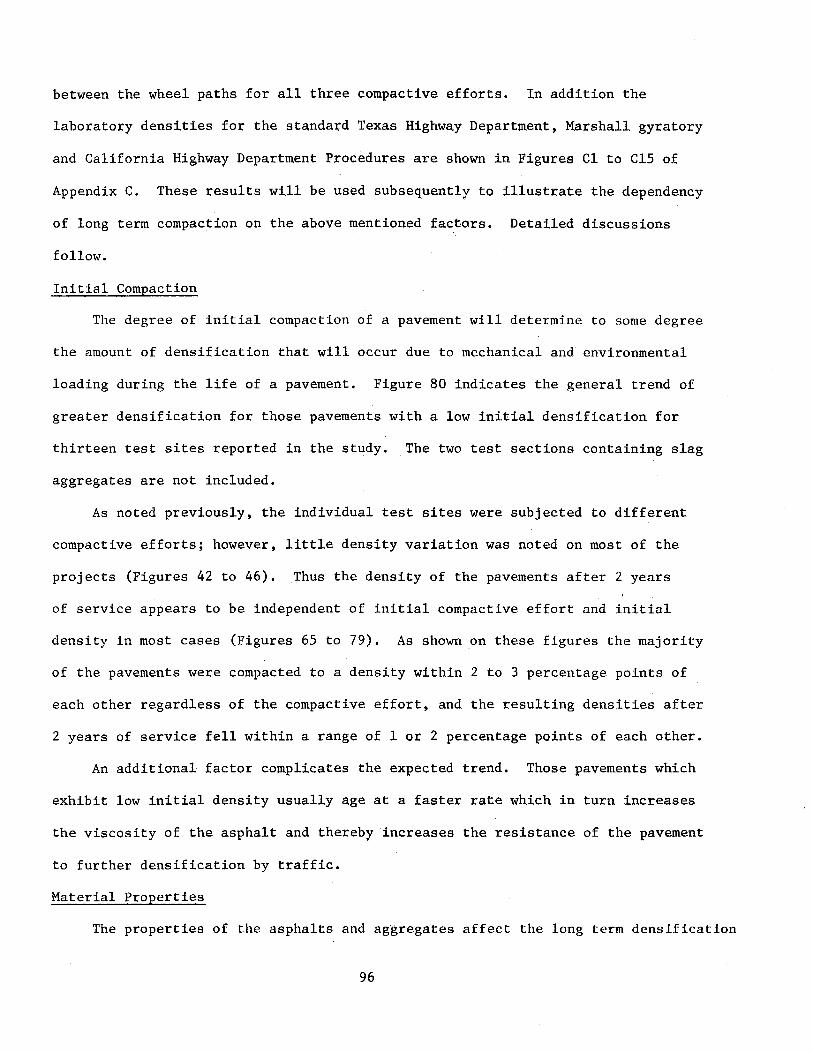
between the wheel paths for all three compactive efforts. In addition the
laboratory densities for the standard Texas Highway Department, Marshall gyratory
and California Highway Department Procedures are shown in Figures Cl to Cl5 of
Appendix C. These results will be used subsequently to illustrate the dependency
of long term compaction on the above mentioned factors. Detailed discussions
follow.
Initial Compaction
The degree of initial compaction of a pavement will determine to some degree
the amount of densification that will occur due to mechanical and environmental
loading during the life of a pavement. Figure 80 indicates the general trend of
greater densification for those pavements with a low initial densification for
thirteen test sites reported in the study. The two test sections containing slag
aggregates are not included.
As noted previously, the individual test sites were subjected to different
compactive efforts; however, little density variation was noted on most of the
projects (Figures 42 to 46). Thus the density of the pavements after 2 years
of service appears to be independent of initial compactive effort and initial
density in most cases (Figures 65 to 79). As shown on these figures the majority
of the pavements were compacted to a density within 2 to 3 percentage points of
each other regardless of the compactive effort, and the resulting densities after
2 years of service fell within a range of 1 or 2 percentage points of each other.
An additional factor complicates the expected trend. Those pavements which
exhibit low initial density usually age at a faster rate which in turn increases
the viscosity of the asphalt and thereby increases the resistance of the pavement
to further densification by traffic.
Material Properties
The properties of the asphalts and aggregates affect the long term densification
96
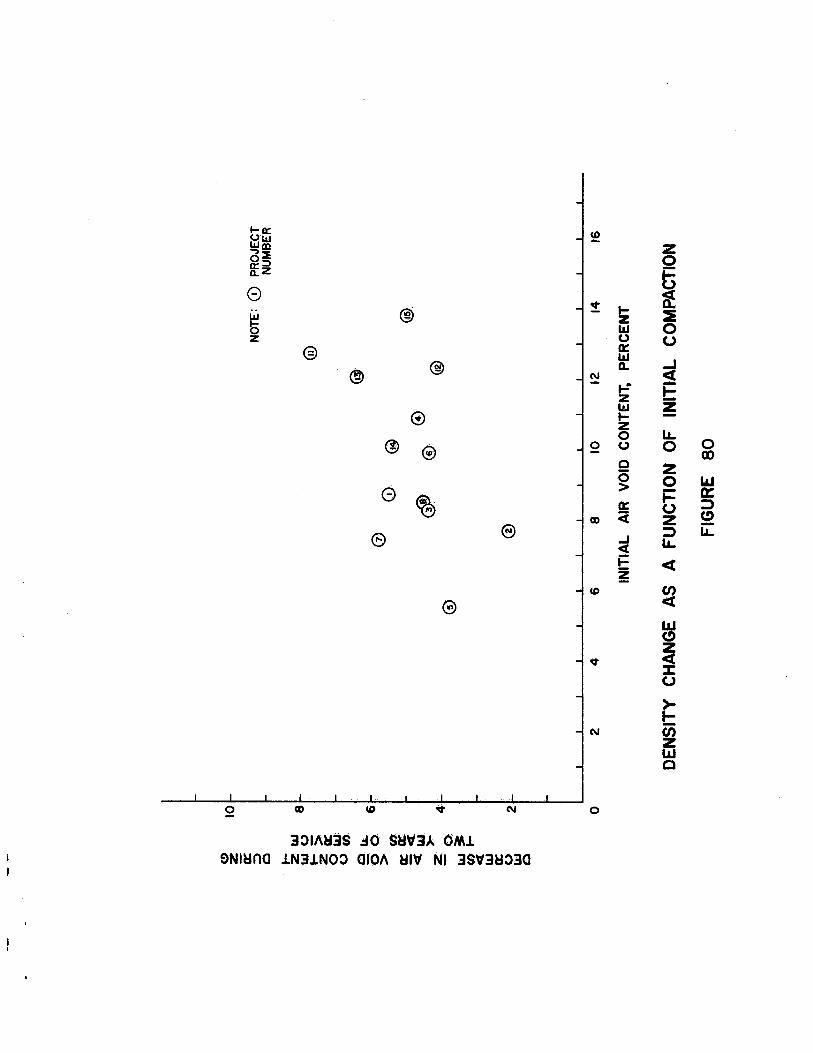
1-a::: U) (.)llj llltt) z (3:!: 0 a:: :::::I
t; a.Z
8 o;t ~
® 1- ~ w z b l&J 0 z 0 0 @ a::
l&J _. @) Q.
@) (\J <( t-=' -.,_ z z I.&J
@ 1- -z 0 LL
0 ® @ 0 0 0 Q)
0 z 0 0 IIJ
0 > ~ a:
~ a:: 0 :::> co Ci z (!)
e e ..J :::> iL:
<( LL i= <( z
U) en @ <(
IIJ (!) z <( % 0
> 1-u; z w Q
2 co 0
3:>1A~3S .:tO SY'd3A OMl. 9NtYno l.N3l.NO:> 0101\ Yl\f Nl 3S\f3Y:>30
of a pavement as well as its initial densification. Those material properties
which tend to increase the resistance of a pavement to initial compaction behave
in the same manner for the long tprm density increase due to mechanical and
environmental loading.
Aggregate Absorption: Gallaway (52) has shown that, if aggregate absorption
is not considered, asphalt densities can be calculated which result in values
greater than that which is theoretically possible. The error in density measure
ments associated with absorption of asphalt by the aggregate can lead to high
densities that are due neither to mechanical nor environmental loadings.
Aggregate Surface Characteristics: Although a wide variety of aggregates
were used in terms of mineralogical composition, shape, surface texture, and
maximum size; no conclusion can be drawn from data gathered on the fifteen test
sites as to the effect of these variables on either the initial or long term
compaction. However, it is well known that angular aggregates with rough surface
textures will give high resistance to compaction.
Aggregate Gradation: The effect of aggregate gradations on initial compaction
is shown in Figure 31. Two mixtures shown on the figure containing greater than
ninety-five percent passing the number four sieve, were very difficult to compact.
These same mixtures compacted very little with time (Figures 57, 59, 72, and 74)
considering their high initial compaction and the relatively heavy traffic on the
pavements (Table 4).
Asphalt Temperature-Viscosity Relationship: The asphalt temperature-viscosity
relationship controls to a degree the compactability of a mix at a given temperature.
Viscosity at various temperatures for the asphalts used in this project (Table 13)
indicate that little difference exists in the initial temperature-viscosity rela
tionship for these asphalts. Therefore, this variable is not considered important
in this study.
Asphalt Susceptibility to Hardening: Asphalt hardening has been correlated
98
to a certain degree with air void content and degree of interconnectability of air
voids. Figures 81, 82, and 83 indicate that the greater the air void content, the
faster the rate of hardening and thus the less likely the pavement will be compacted
by traffic. In addition, data collected in this study suggest this same trend
(Figure 20).
Asphalt viscosity at 4 months, which may be typical of the viscosity of the
asphalt during its initial rapid densification due to traffic and environmental
loading, is related to densification of the pavement with age in Figure 84. The
general trend of low density gain with high viscosity asphalts is evident from
this figure. Particular attention should be given the Milano and Bryan Projects
(points 9 and 10 in Figure 84) which show low, long term densification and relatively
high recovered asphalt viscosities after 4 months of service. It should be
remembered that these two projects contained high initial air void contents which
would contribute to high viscosities with age; and they also contained fine graded
aggregates and relatively thin films of asphalt on the aggregate particles.
Mix Design
Mix design is important in that it is responsible for the selection of the
asphalt content which controls the film thickness (22). It should be pointed out
that mixture design quantities are dependent upon aggregate type, grading, surface
texture, shape, asphalt viscosity, and other factors. Thus the influence of mix
design on compaction has been discussed in part in the preceding section.
The effect of asphalt content (Table 11) on compaction is difficult to
separate from the numerous variables which existed in this study.
Weather Conditions
Density increases between the wheel paths have been noticed in
several long term density studies (51, 54) (Figure 49) as well as this
99
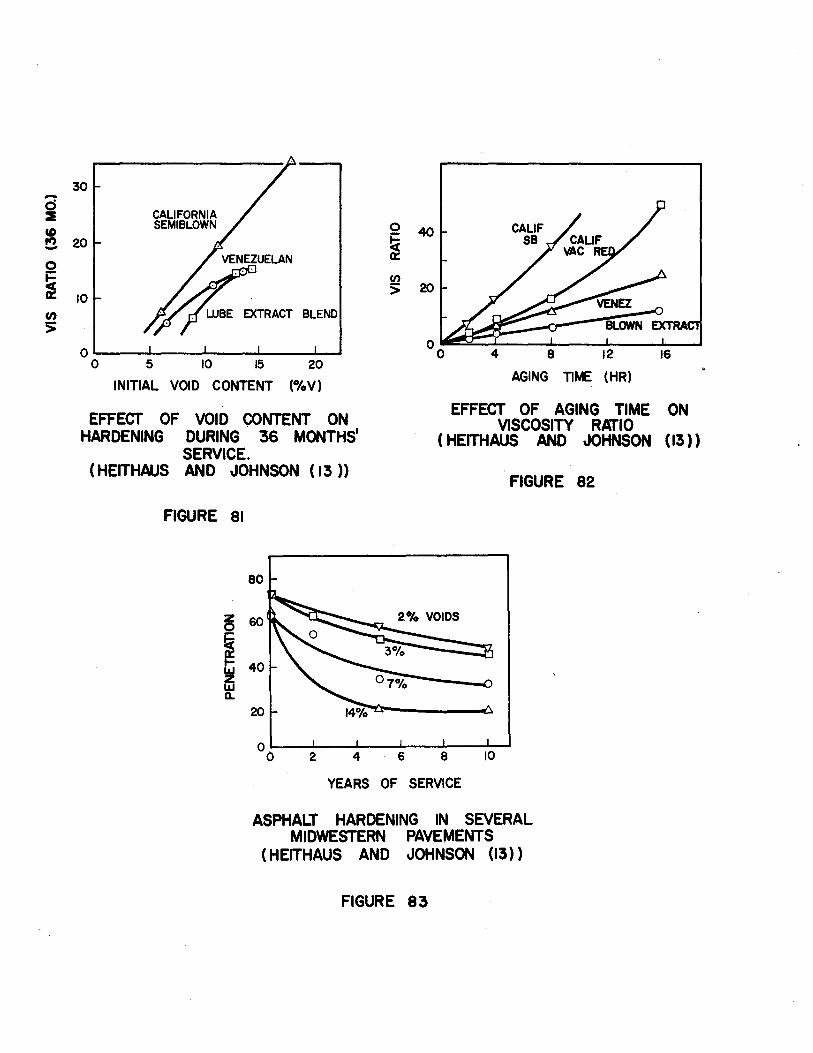
30
a 2
~ 20 -CALIFORNIA SEMIBLOWN 0 40
ti 0::
0
fi U)
a:: 10 > 20
Cl)
> EXTRACT BLEND
0~---L----~--~--~~ 0 5 10 15 20
INITIAL VOID CONTENT (%V)
EFFECT OF VOID CONTENT ON HARDENING DURING . 36 MONTHS'
SERVICE. (HEITHAUS AND JOHNSON ( 13))
FIGURE 81
2 4 6
4
AGING TIME (HR)
EFFECT OF AGING TIME ON VISCOSITY RATIO
( HEITHAUS AND JOHNSON ( 13))
FIGURE 82
YEARS OF SERVICE
ASPHALT HARDENING IN SEVERAL MIDWESTERN PAVEMENTS
(HEITHAUS AND JOHNSON (13))
FIGURE 83
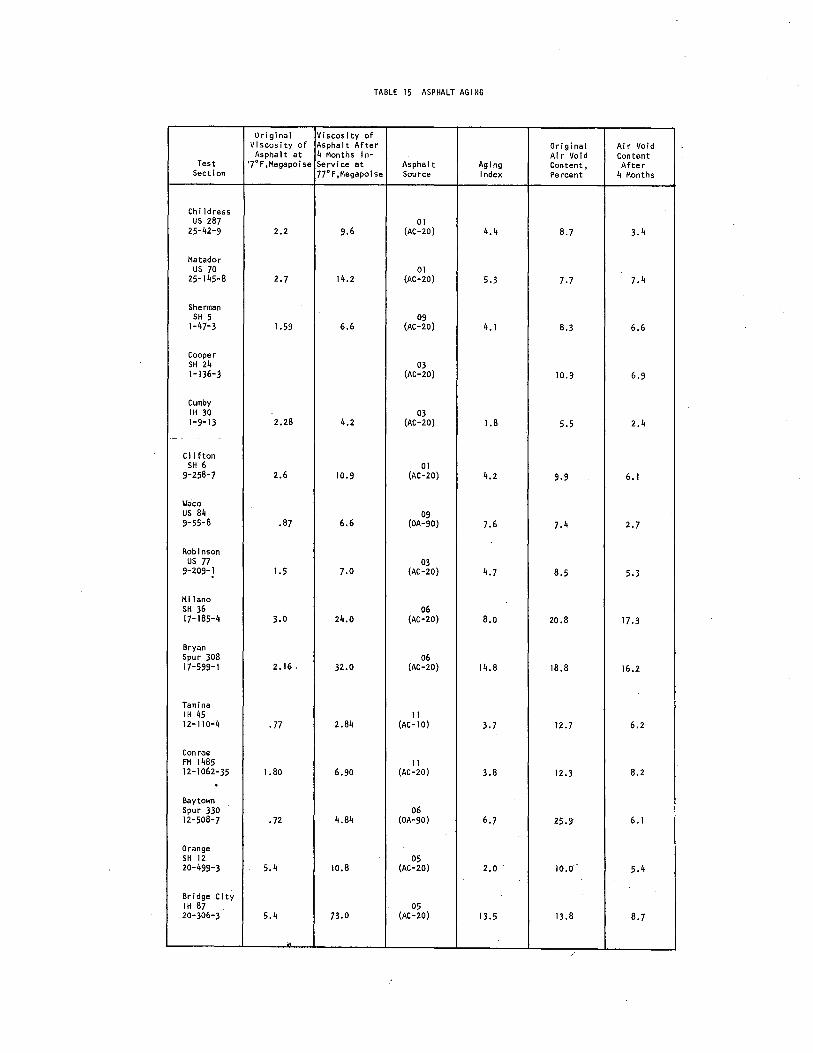
TABLE 15 ASPHALT AGING
Original Viscosity of Viscosity of Asphalt After Original AIr Void Asphalt at 4 Months In- Air Void Content
Test '7°F,Megapoise Service at Asphalt Aging Content, After Section 77°F,Megapoise Source index Percent 4 Months
Chi I dress us 287 01
25-42-9 2.2 9.6 (AC-20) 4.4 8.7 3.4
Matador us 70 01
25-145-8 2.7 14.2 (AC-20) 5.3 7.7 7.4
Sherman SH 5 09
1-47-3 1.59 6.6 (AC-20) 4.1 8.3 6.6
Cooper SH 24 03 1-136-3 (AC-2oi 10.9 6.9
Cumby IH 30 - 03 1-9-13 2.28 4.2 (AC-20) 1.8 5.5 2.4
--. -
Clifton SH 6 Ol
9-258-7 2.6 10.9 (AC-20) 4.2 9.9 6.1
Waco us 84 09 9-55-8 .87 6.6 (OA-90) 7.6 7.4 2.7
Robinson us 77 03
9-209-1 1.5 7.0 (AC-20) 4.7 8.5 5.3
Milano SH 36 06 17-185-4 3.0 24.0 (AC-20) 8.0 20.8 17.3
Bryan Spur 308 06 17-599-1 2.16. 32.0 (AC-20) 14.8 18.8 16.2
Tam ina IH 45 11 12-110-4 .77 2.84 (AC-10) 3. 7 12.7 6.2
Con roe FM 1485 11 12-1062-35 1.80 6.90 (AC-20) 3.8 12.3 8.2 . Baytown Spur 330 06 12-508-7 .72 4.84 (OA-90) 6.7 25.9 6.1
Orange SH 12 05 20-499-3 5.4 10.8 (AC-20) 2.0 10.0 5.4
Bridge City IH 87 -- 05 20-306-3 5.4 73.0 (AC-20) 13.5 13.8 8.7
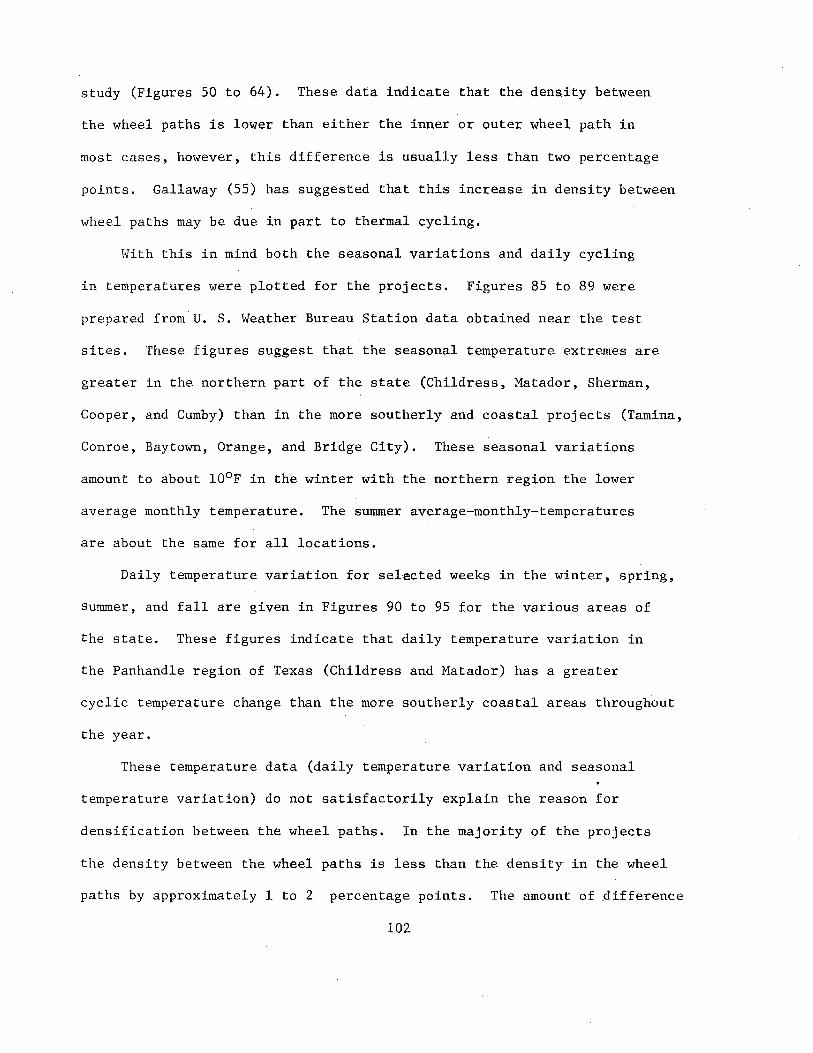
study (Figures 50 to 64). These data indicate that the density between
the wheel paths is lower than either the inner or outer wheel path in
most cases, however, this difference is usually less than two percentage
points. Gallaway (55) has suggested that this increase in density between
wheel paths may be due in part to thermal cycling.
With this in mind both the seasonal variations and daily cycling
in temperatures were plotted for the projects. Figures 85 to 89 were
prepared from U. S. Weather Bureau Station data obtained near the test
sites. These figures suggest that the seasonal temperature extremes are
greater in the northern part of the state (Childress, Matador, Sherman,
Cooper, and Cumby) than in the more southerly and coastal projects (Tamina,
Conroe, Baytown, Orange, and Bridge City). These seasonal variations
amount to about 10°F in the winter with the northern region the lower
average monthly temperature. The summer average-monthly-temperatures
are about the same for all locations.
Daily temperature variation for selected weeks in the winter, spring,
summer, and fall are given in Figures 90 to 95 for the various areas of
the state. These figures indicate that daily temperature variation in
the Panhandle region of Texas (Childress and Matador) has a greater
cyclic temperature change than the more southerly coastal areas throughout
the year.
These temperature data (daily temperature variation and seasonal
temperature variation) do not satisfactorily explain the reason for
densification between the wheel paths. In the majority of the projects
the density between the wheel paths is less than the density in the wheel
paths by approximately 1 to 2 percentage points. The amount of difference
102
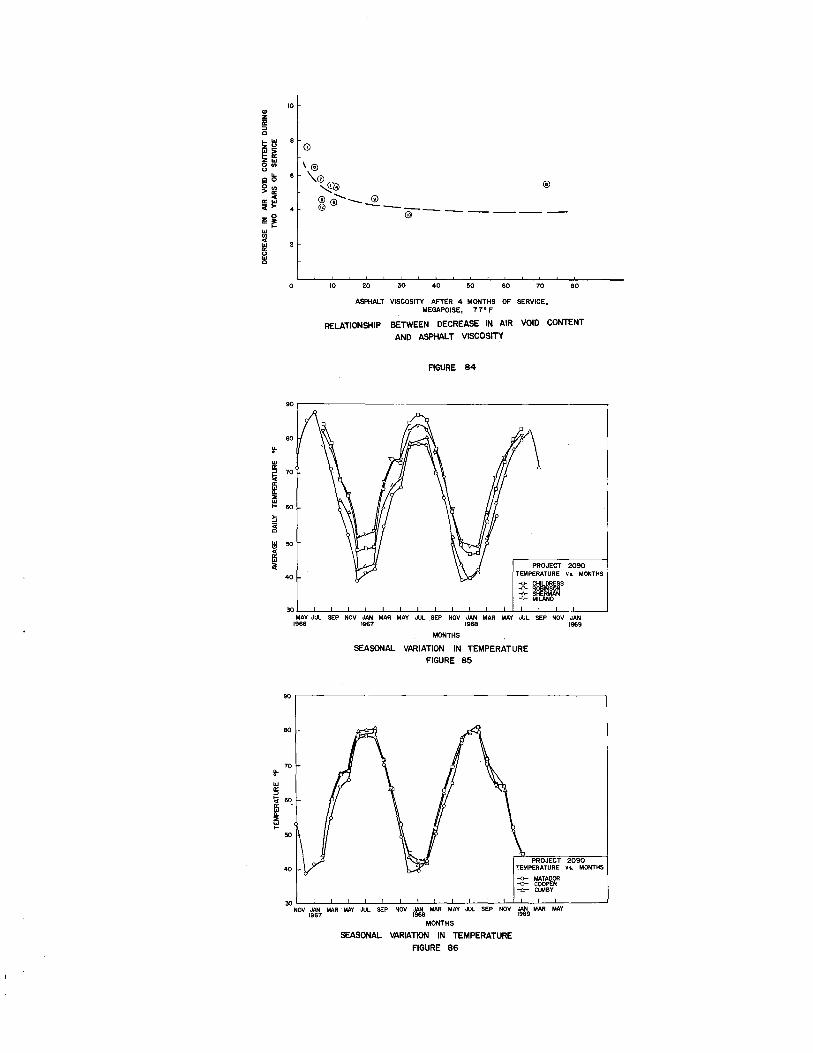
"' z a: :::> 0 ,_.., z!o! ~~ ZLU O<n u ... 00
~:11 .. "'"' .. ,.. ~~ "' ., .. "' "' 1;l 0
~
"' !§ !< 0:
"' "-,. "' ,_ ~ ~
~ .. "' "' a
10
90
80
70
60
50
40
\@
\.(!) .......... ~ ®(!)-- ® @ --- @ -- -- -- ------ --
10 20 30 40 50 60 70 80
ASPHALT VISCOSITY AFTER 4 MONTHS OF SERVICE, MEGAPOISE, 77" F
RELATIONSHIP BETWEEN DECREASE IN AIR VOID CONTENT
AND ASPHALT VISCOSITY
FIGURE 84
PROJECT 2090 TEMPERATURE "· MONTHS
-o- CHILDRESS -o- ROBINSON -fro SHERMAN -r MILANO
~~-L--~~~~~~-L--~~--~~~-L--~~--~~~~-----"
--~~~~--~~~~--~~~ 1966 t967 ' 1968 1969
MONTHS
SEASONAL VARIATION IN TEMPERATURE FIGURE 85
90 r--------------------------------------------------------,
80
70
50
40 PROJECT 2090
TEMPERATURE vs. MONTHS
~ MATADOR ~ COOPER ---b- CtMBY
~L--L--L-~--~~L--L--L-~--~~---L--~~--~~---------"
NOV JAN MAR ·MAY JUL SEP NOV JAN MAR MAY JUL. SEP NOV JAN MAR MAY 1967 1968 1969
MONTHS
SEASONAL VARIATION IN TEMPERATURE
FIGURE 86
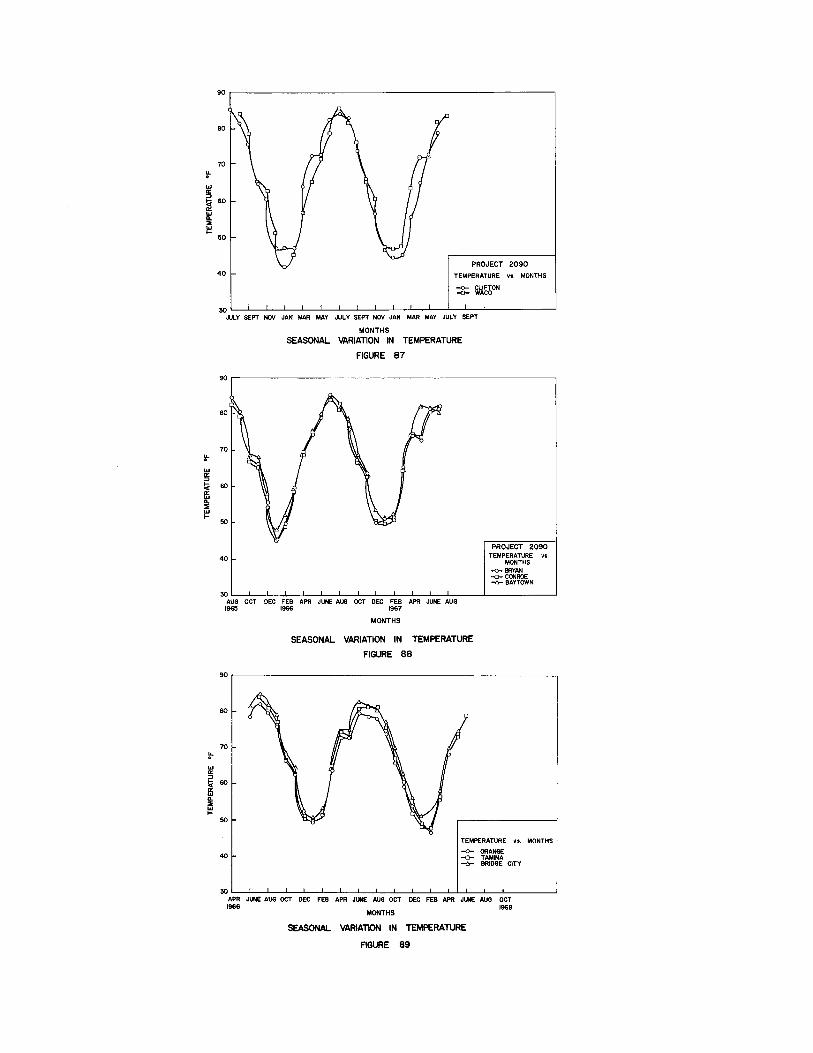
~
"' !!5 !;< a: ~ :::E
"' ....
~
"' a: ::I !;< f5 0. :::E
"' ....
90
80
70
60
50
PROJECT 2090 40 TEMPERATURE vs. MONTHS
-o- CUFTON ~WACO
~L_-L~--~_L __ L__L~L_~~--L--L--L--L~----------~
JULY SEPT NOV JAN MAR MAY JULY SEPT NOV JAN MAR MAY JULY SEPT
MONTHS
SEASONAL VARIATION IN TEMPERATURE
FIGURE 87
90r-------------------------------------------------------,
80
70
50
40
PROJECT 2090 TEMPERATURE va,
MONTHS -o- BRYAN -o- CONROE -6- BAYTOWN
~AULG~O~C=T~O~EC~F~E=8~A~~~J~u=~~ALOO~~OC=T~D~E=C~FE~B~A~~=-~J~~-A~U=G~--~------------~ 1965 1966 1967
MONTHS
SEASONAL VARIATION IN TEMPERATURE
FIGURE 88
90r-------------------------------------------------------~
80
70
60
50
40
TEMPERATURE vs. MONTHS
-o- ORANGE ~ TAMINA ....,_ BRIDGE CITY
~~~--~--~~--~--~~--~--L-~--~~~~--~--L-------~ APR JUNE AUG OCT DEC FEB APR JUNE AUG OCT DEC FEB - JUNE AUG OCT 1966 1968
MONTHS
SEASONAL VARIATION IN TEMPERATURE
FIGURE 89
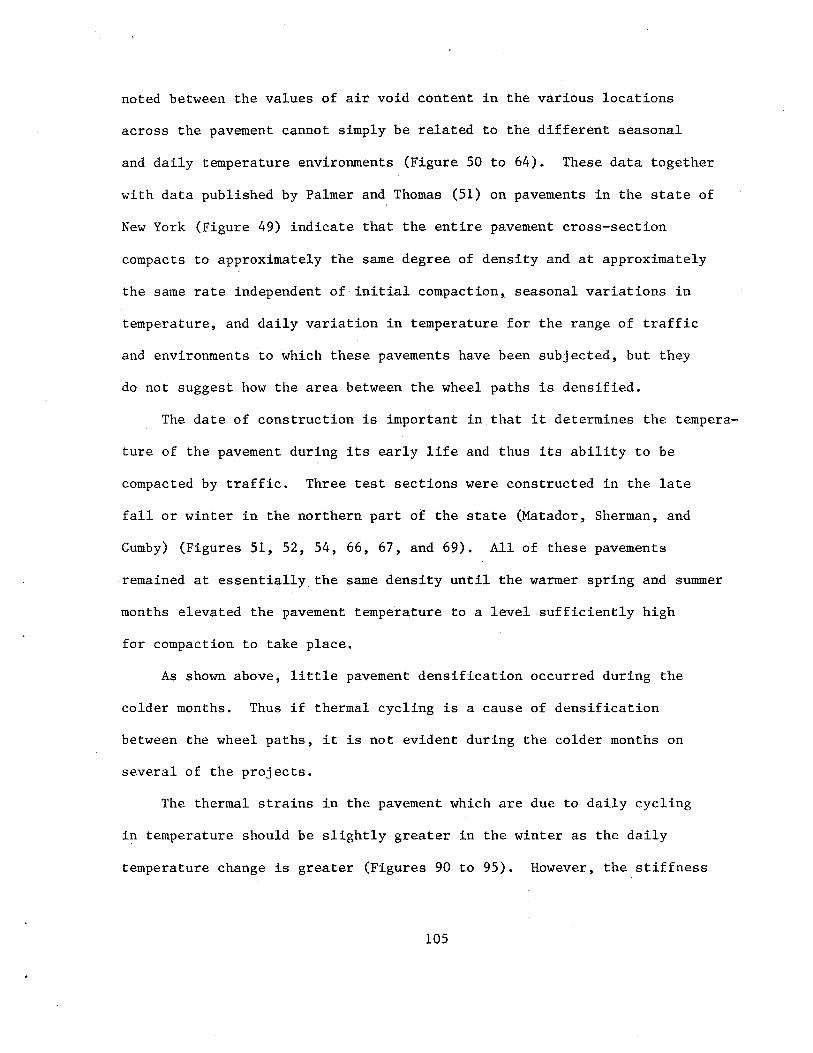
noted between the values of air void content in the various locations
across the pavement cannot simply be related to the different seasonal
and daily temperature environments (Figure 50 to 64). These data together
with data published by Palmer and Thomas (51) on pavements in the state of
New York (Figure 49) indicate that the entire pavement cross-section
compacts to approximately the same degree of density and at approximately
the same rate independent of initial compaction, seasonal variations in
temperature, and daily variation in temperature for the range of traffic
and environments to which these pavements have been subjected, but they
do not suggest how the area between the wheel paths is densified.
The date of construction is important in that it determines the tempera
ture of the pavement during its early life and thus its ability to be
compacted by traffic. Three test sections were constructed in the late
fall or winter in the northern part of the state (Matador, Sherman, and
Cumby) (Figures 51, 52, 54, 66, 67, and 69). All of these pavements
remained at essentially the same density until the warmer spring and summer
months elevated the pavement temperature to a level sufficiently high
for compaction to take place.
As shown above, little pavement densification occurred during the
colder months. Thus if thermal cycling is a cause of densification
between the wheel paths, it is not evident during the colder months on
several of the projects.
The thermal strains in the pavement which are due to daily cycling
in temperature should be slightly greater in the winter as the daily
temperature change is greater (Figures 90 to 95). However, the stiffness
105
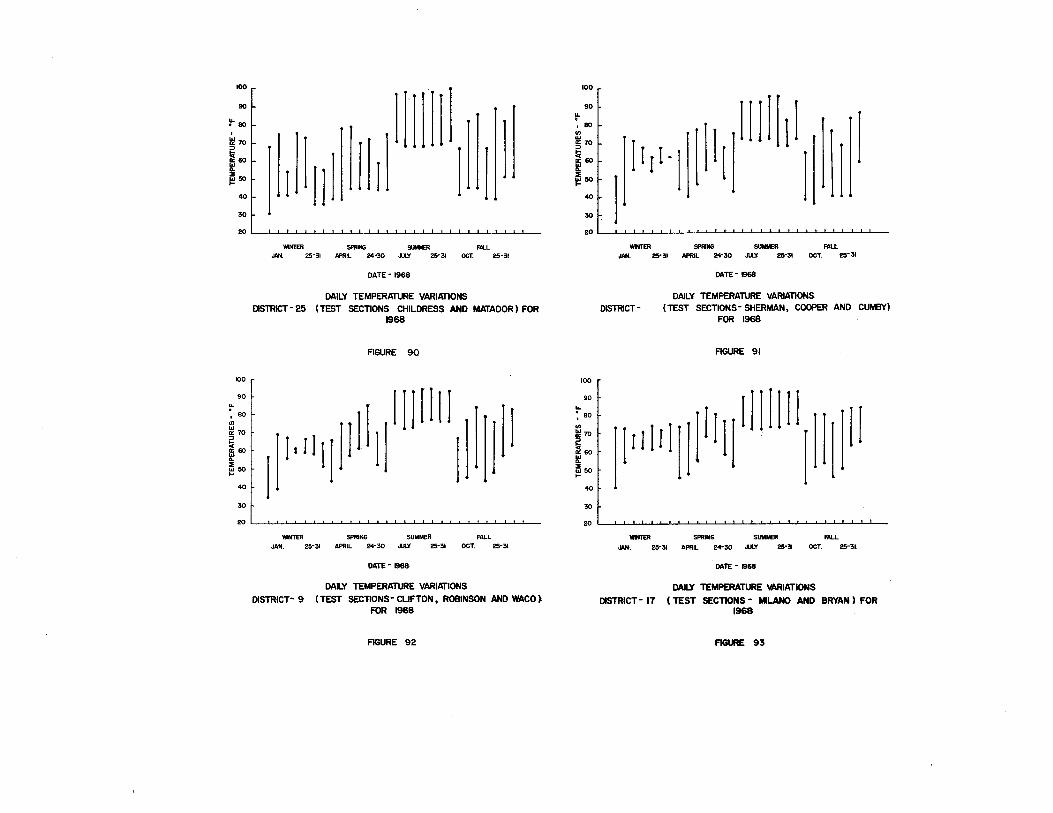
100
90
1: r Jl 11
~: I Ill II 20
100
90 .. ~ 80 ., .., a:70 ::> !¢ a:60 :t ::E o.J50 1-
40
30
WINTER Sf'ANl SUMMER FALL JAN. 25-31 APRIL 24-30 .IUIY 25-31 OCT. 25-31
DATE -1968
DAILY TEMPERATURE VARIATIONS
DISTRICT- 25 (TEST SECTIONS CHILDRESS AND MATADOR) FOR 1968
FIGURE 90
l·llq]lilllllll!ll jll
20 L_~~~~-L~~~-L~LJ_LJ_~LJ-L~~~-L~~~---
WINTER SPRING SUMMER FALL JAN. 25-31 APRIL 24-30 JUlY 25-31 OCT. 25-31
DATE- 1968
DAILY TEMPERATURE VARIATIONS
DISTRICT- 9 (TEST SECTIONS- CLIFTON, ROBINSON AND WACO l FOR 1968
FIGURE 92
100
90
!.'-,80 ., .., g;ro
"' ~80 ~50
40
30
20
100
90 .. : 80
~70 :60
:t i5so 1-
40
30
1 ]I llll[!l
j Irl·j I j
wmER SPRING SUMMER FALL JAN. 25-31 APRIL 24-30 JW' 25-31 OCT. 25-31
DISTRICT-
DATE- 1968
DAILY TEMPERATURE VARIATIONS (TEST SECTIONS- SHERMAN, COOPER AND CUMBY)
FOR 1968
AGURE 91
[riiiljj]ll[j !]]]]!] [ I
w L__LJ_~~~J_~~~J_~~_LJ_~~-L~~_LJ_~LJ---
WINTER SPRING SUMMER FALL
JAN. 25-31 APRIL 24-30 JLLY 25-31 OCT. 25-31
DATE- 1968
DAILY TEMPERATURE VARIATIONS
DISTRICT- 17 (TEST SECTIONS- MILANO AND BRYAN) FOR 1968
FIGURE 93
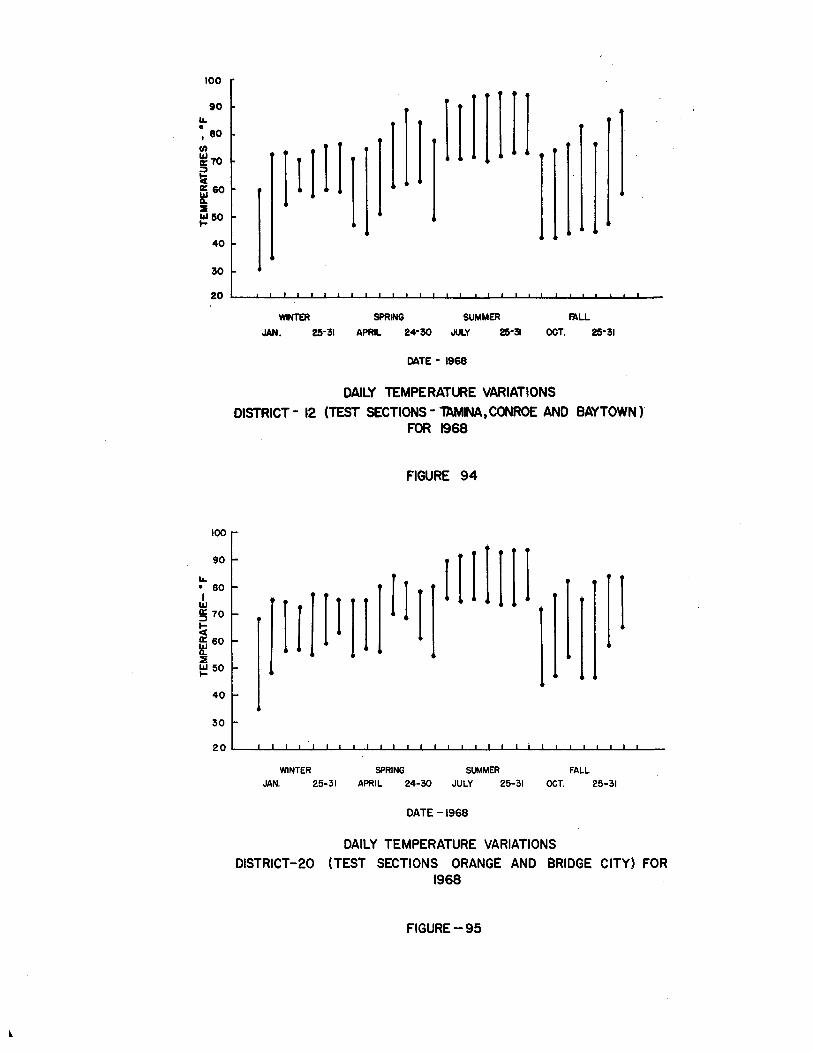
100
1&. 0
90
I 80 en
~70 ~ ~ 60
:IE ~50
40
30
100
90
1&. 0 80 I ~
~ 70
~ a: 60
~ ~50
40
30
WINTER SPRING SUMMER ~LL
JAN. 25-31 APRIL 24-30 JULY 25-31 OOT. 25-31
DATE- 1968
DAILY lEMPERATURE VARIATIONS
DISTRICT- 12 (TEST SECTIONS- "UMNA, CONROE AND BAYTOWN) FOR 1968
FIGURE 94
WINTER SPRING SUMMER FALL
JAN. 25-31 APRIL 24-30 JULY 25-31 OOT. 25-31
DATE -1968
DAILY TEMPERATURE VARIATIONS
DISTRICT-20 (TEST SECTIONS ORANGE AND BRIDGE CITY) FOR 1968
FIGURE-95
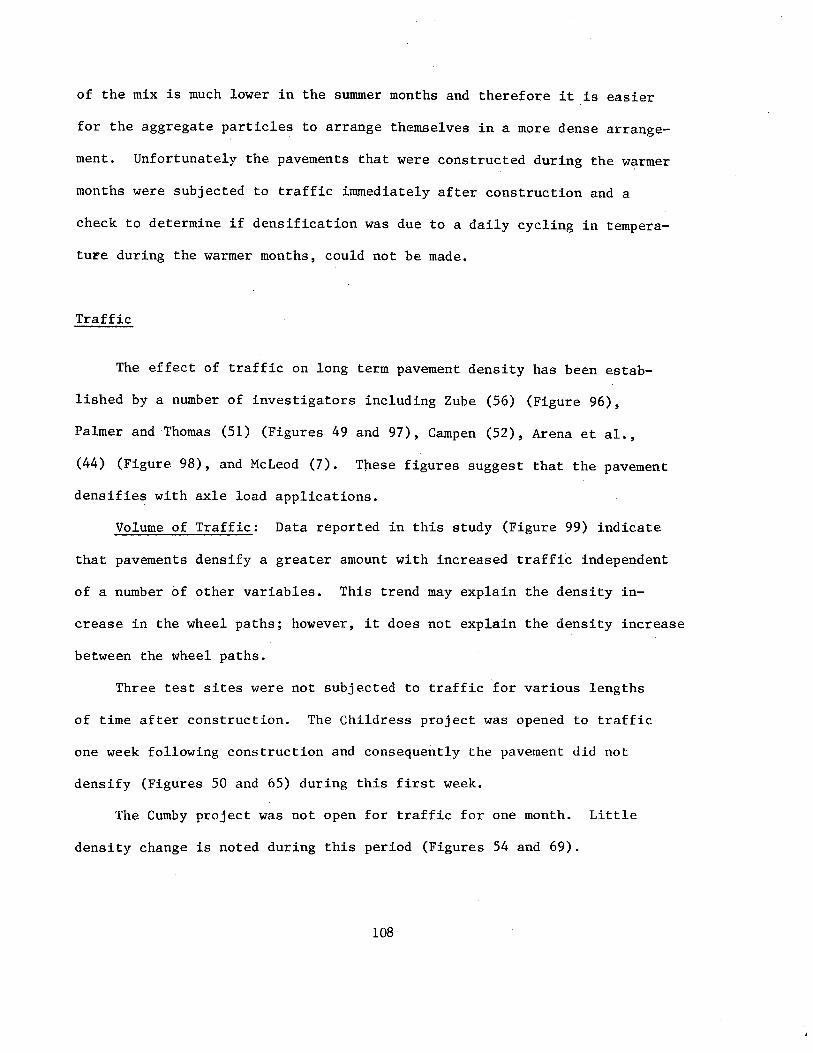
of the mix is much lower in the summer months and therefore it is easier
for the aggregate particles to arrange themselves in a more dense arrange
ment. Unfortunately the pavements that were constructed during the warmer
months were subjected to traffic immediately after construction and a
check to determine if densification was due to a daily cycling in tempera
ture during the warmer months, could not be made.
Traffic
The effect of traffic on long term pavement density has been estab
lished by a number of investigators including Zube (56) (Figure 96),
Palmer and Thomas (51) (Figures 49 and 97), Campen (52), Arena et al.,
(44) (Figure 98), and McLeod (7). These figures suggest that the pavement
densifies with axle load applications.
Volume of Traffic: Data reported in this study (Figure 99) indicate
that pavements densify a greater amount with increased traffic independent
of a number of other variables. This trend may explain the density in
crease in the wheel paths; however, it does not explain the density increase
between the wheel paths.
Three test sites were not subjected to traffic for various lengths
of time after construction. The Childress project was opened to traffic
one week following construction and consequently the pavement did not
densify (Figures 50 and 65) during this first week.
The Cumby project was not open for traffic for one month. Little
density change is noted during this period (Figures 54 and 69).
108
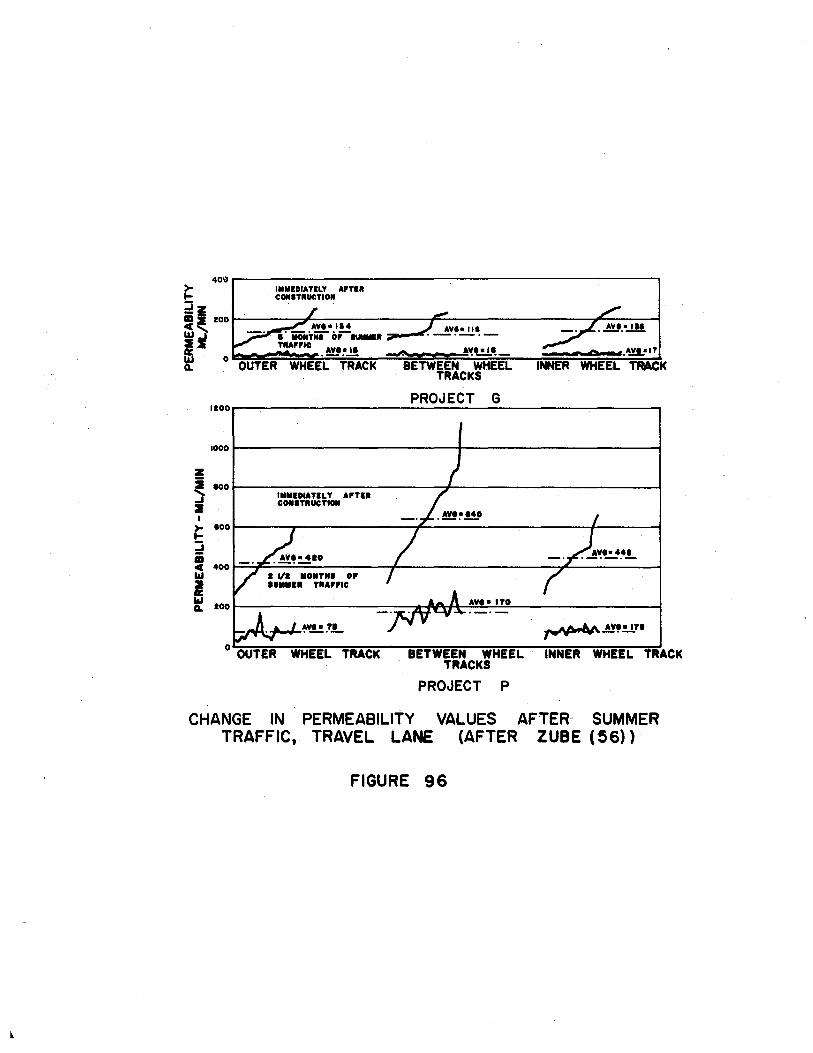
40;) )-.... ~~zoo ........ ~i a: ~ 0
1100
1000
z
~ 100
2 I )- 100 ... ::; ii c 400 1&1
I w
100 A.
IMMIDIATELY A'TIII CCIIIITIIUCTIOII
IMMIDIATIL Y APTIII COIIITIIUCTICIII
WHEEL TRACK
BETWEEN WHEEL TRACKS
PROJECT G
AYI• ITO
BETWEEN WHEEL INNER WHEEL TRACK TRACKS
PROJECT P
CHANGE JN PERMEABILITY VALUES AFTER· SUMMER TRAFFIC, TRAVEL LANE (AFTER ZUBE (56))
FIGURE 96
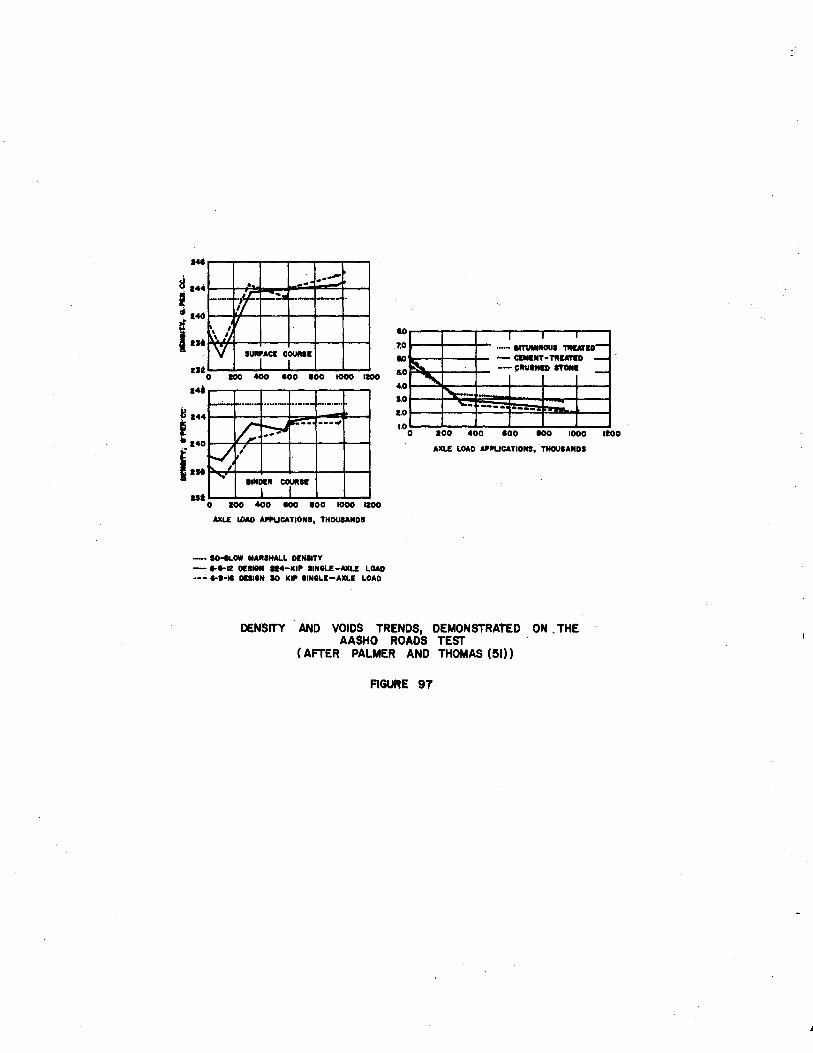
l4e
~ 144
• .
·--Vf ,II
\ ~/
___ .,.,.
--~ .. --.
I I I i:: " SUiACI CJI!
1.0
7.0
loO
1.0
4.0
1.0
1.0
1.00
·-·· IITUIMNOUI 1111Af10-
Ill 0 100 400 100 100 1000 1100 ...
8144 --'-- _ ..... -····- ··-·--1-·-·-.. --=--- ---~
~ - CIMINT•TIIIIIr&D --- ciiUIHID ITCIIII -
' ~-· -- ---- ·--- -I v; ~ 100 400 100 100 1000 1100
i:: ~ I ~I
I ... IINOIII i"" I 1st
AICLI LOAD API'LICATIONI, . THOUIANDS
0 100 400 100 100 1000 1100
AXLE LOAD API'UCATIONI, THDUaANDI
- 10-ILOW MAIIIIW.L DI!NIITY - 1-1•12 01!11811 a4-KII" IINkll-AXLE LOAD ·-.;. 1-1•11 DI!IIIN SD ICII" IINILE -AICLI! LOAD
DENSITY AND VOIDS TRENDS, DEMONSTRATED ON .THE AASHO ROADS TEST
(AFTER PALMER AND THOMAS (~I))
FIGURE 97
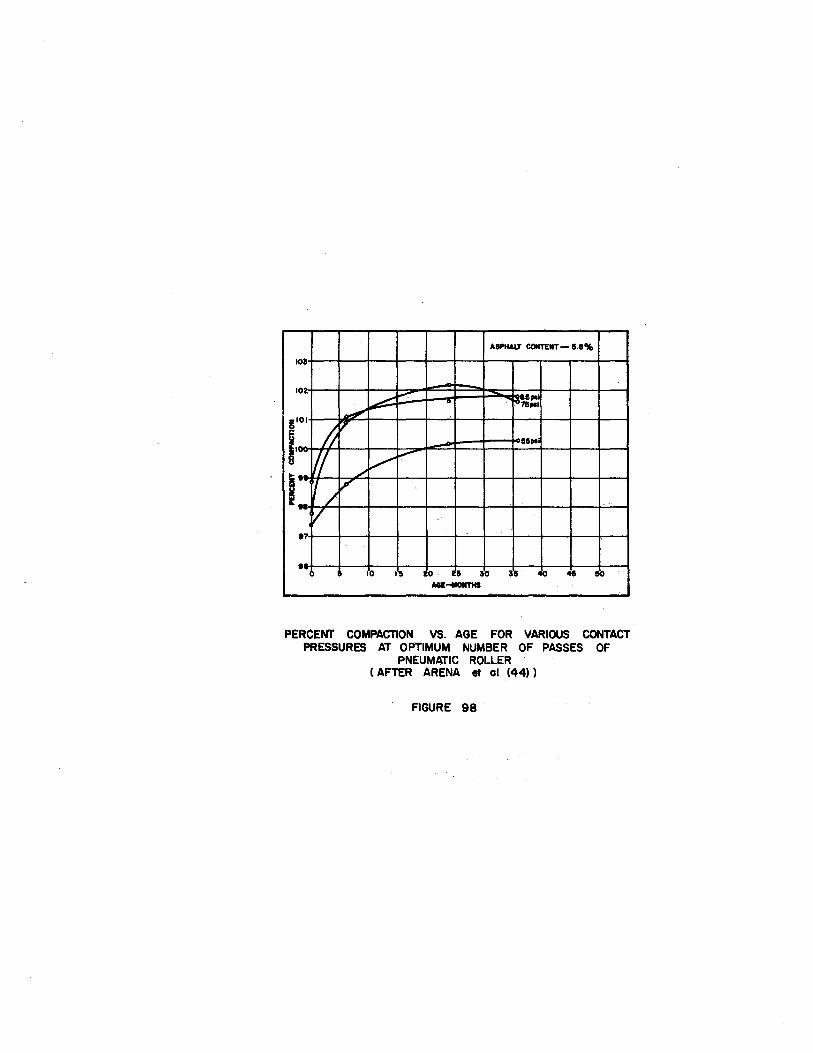
ASPHAIJ' CONTENT- 5.1%
lOS
10 ....... ......... ..,~lpol
""" .--- - 7Spol
r ;/ vr-55 pol
If/ / ~--""'"
1: ./
'/ / I"
~ I?
• 10 ,.,
0 5 Jb IS ~0 45 50
-..-ntiS
PERCENT COMPACTION VS. AGE FOR VARIOUS CONTACT PRESSURES AT OPTIMUM NUMBER OF PASSES OF
PNEUMATIC ROLLER ( AFTER ARENA et ol (44) )
FIGURE 98
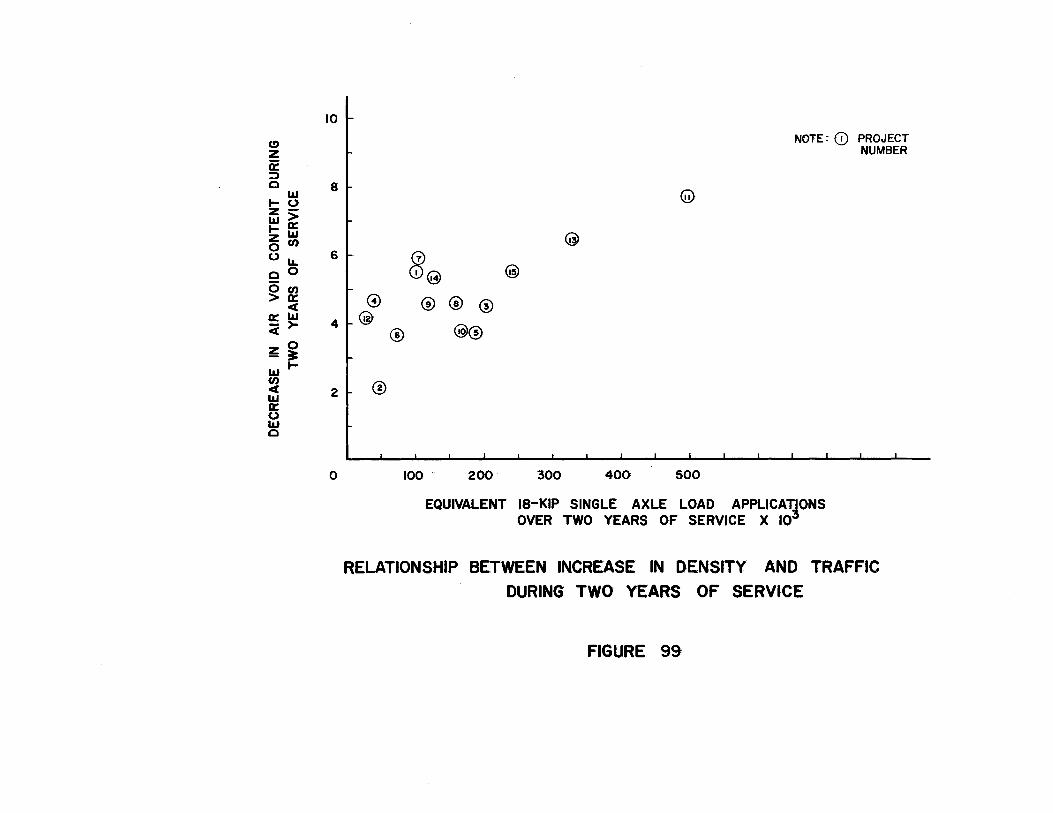
(!) z 0: ::) 0
LLI 1-0 z-LLI> I- a: z"' OCI) OIL. cO 0CI) >a:
<( a::;LIJ <t> zO -~ LLII-Cl) <( LIJ a: 0 LLI c
10
l 81
6
G)
4 @
2 L ®
0
NOTE : CD PROJECT
@
@
~@ @
@ @ G)
® @@
100 200 300 400 500
EQUIVALENT 18-KIP SINGLE AXLE LOAD APPLICAT~ONS OVER TWO YEARS OF SERVICE X 10
NUMBER
RELATIONSHIP BETWEEN INCREASE IN DENSITY AND TRAFFIC
DURING TWO YEARS OF SERVICE
FIGURE 99
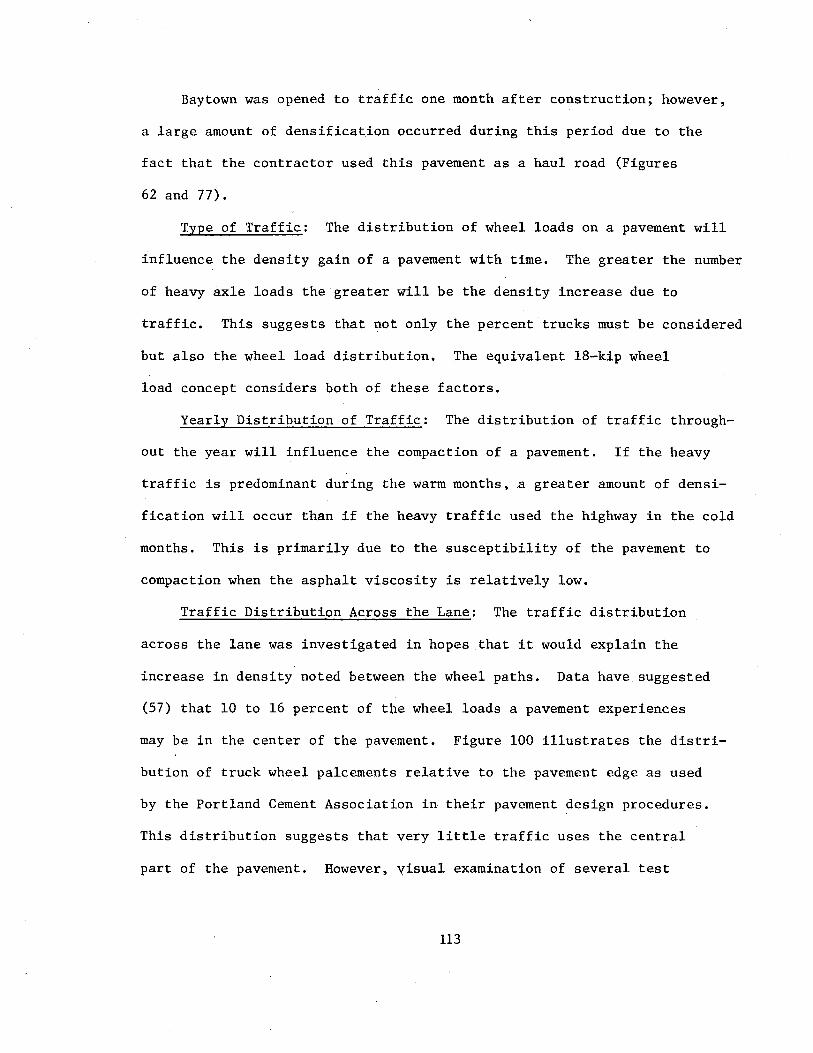
Baytown was opened to traffic one month after construction; however,
a large amount of densification occurred during this period due to the
fact that the contractor used this pavement as a haul road (Figures
62 and 77).
Type of Traffic: The distribution of wheel loads on a pavement will
influence the density gain of a pavement with time. The greater the number
of heavy axle loads the greater will be the density increase due to
traffic. This suggests that not only the percent trucks must be considered
but also the wheel load distribution. The equivalent 18-kip wheel
load concept considers both of these factors.
Yearly Distribution of Traffic: The distribution of traffic through
out the year will influence the compaction of a pavement. If the heavy
traffic is predominant during the warm months, .a greater amount of densi
fication will occur than if the heavy traffic used the highway in the cold
months. This is primarily due to the susceptibility of the pavement to
compaction when the asphalt viscosity is relatively low.
Traffic Distribution Across the Lane: The traffic distribution
across the lane was investigated in hopes that it would explain the
increase in density noted between the wheel paths. Data have suggested
(57) that 10 to 16 percent of the wheel loads a pavement experiences
may be in the center of the pavement. Figure 100 illustrates the distri
bution of truck wheel palcements relative to the pavement edge as used
by the Portland Cement Association in their pavement design procedures.
This distribution suggests that very little traffic uses the central
part of the pavement. However, yisual examination of several test
113
~ :t
j
I
DISTRIBUTION OF TRUCK WHEEL PLACEMENTS RELATIVE TO PAVEMENT EDGE
(Right side ~ contact a ... a, 12' right lane)
Distance from ec!Qe Frequency ~ pavement in Inches %
0 0.03 0-1 0.03
IO''x 20" Tire " Tire width= 11:7 Contact area ~=7.2" Truck width • 9!
Q-2 0.1 o-3 0.2
t Truck to ~ide edge of contact area =45.25
I
J! I
Q-4 03 0-5 0.4 0-6 0.5
with riaht side of contact area at or blyoncf the pavement edge
Al,~istanc" greater than 75 diltributlons of right a left contact area overlap.
'I 4 3
PAVEMENT EDGE
CASE II ·-·-·-~---------L-----,------~~--------~~~~1-E~~~~ Frequtney, percent
LOAD POSmONS AND TRAFFIC DISTRIBUTION (AFTER PCA (58) AND MONISMITH (59))
FIGURE 100
40
3S
30 0 oc 25 li
I I 20~ -a I&J Lt..
J 15
10
5
sections with thirteen feet wide lanes suggests that these data may be
incorrect as the vehicles seem to wander in the lane a significant
amount and therefore a larger portion of the wheel loads actually come
in contact with the center portion of the pavement than would otherwise
be expected.
115
Conclusions
1. Data collected in this study as well as others suggest that the
long term density gain of asphalt concrete pavements is a function of
many factors. The most important factors as indicated above are the degree
of initial compaction, susceptibility of asphalt to hardening and thus
increasing its viscosity, the volume of traffic and its nature, and the
time of year of construction. It is evident that a pavement will densify
with time provided it does not have high initial density and provided it
is subjected to heavy wheel loads in warm weather.
2. Densification noted between the wheel paths closely paralleled
the density gain in the wheel paths. The reasons for this trend are
not clear. A possible explanation exists if we consider thermal cycling
as a cause of densification. This however implies that the predominant
forces creating compaction in all sections of the pavement are due to
thermal changes and not traffic associated load. It is believed that
the compaction between the wheel paths is due to wheel loads rather than
thermal considerations as two pavements exhibited no density increase
for periods of up to one month without traffic. If thermal stresses
create densification with age, they should have been active during this
period and a density increase should have been noted.
3. The air void content decreased by 2 and 8 percent during two
years of service. The majority of the pavements were reduced 3 to 6
percent.
4. Eighty percent, of the anticipated two-year compaction due to
traffic and environmental effects, was complete after one year of service on
all of the projects studied.
116
SPECIFICATIONS
Hughes (66) presented a compilation of information concerning the
control procedures in current use by the various state highway departments.
This questionnaire suggests that the majority of states use end result
s·pecifications to control density. This type of specification states
a particular density that must be achieved after the contractor has
rolled the mix to his satisfaction.
The other type of specification disclosed is the method type speci
fication which suggests the type and weight of rollers to be used and the
number of passes that each rdller should make. Seven of 46 replying.
agencies suggest that they used the latter type of specification.
Since end result specifications are the most commonly used, a short
discussion will follow of the necessary data that must be obtained to
enforce this type of specification.
Requirements for end result specifications include procedures for
determining the standard reference density and test procedures for deter
mining field density. A number of methods have been used to determine
the standard reference density. These include maximum density methods
based on 1) bulk specific gravity of the aggregate or vacuum testing
methods. 2) standard laboratory or field densities which are the most
common types and 3) maximum attainable field density.
Several methods have been used to measure field densities. These
methods include destructive methods which include pavement cores or
sawed specimen and split ring methods, non-destructive methods include
117
In addition, control strip techniques have been suggested (60)
as an economical means of obtaining proper compaction of pavements.
This method allows the engineer to compact a trial section using the
equipment and materials that will be used on the job under similar environ
mental conditions. By compacting this test section with various number
of passes of the compacting equipment and various sequences of operation
of the equipment, the engineer can determine the optimum compactive
effort required for the specialized conditions of the particular project.
These sections also allow the engineer to correlate rapid field
measuring devices with cored densities. This information can then be
used for additional job control.
Control strip techniques can produce well compacted pavements at
minimum costs.
Texas Highway Department Standard Specifications (1962) require
in-place densities between 95 and 100 percent of standard laboratory
density for class AA hot-mix asphaltic concrete pavement. In addition
the standard laboratory density must be within 94 to 99 percent of theo
retical maximum density as measured by the Texas Highway Department method.
This suggests the absolute air void content of a pavement may range from
eleven to one percent and be within the specifications for class AA
asphalt concrete. No in-place density requirements exist for the more
popular class A mixes.
Other common specifications range from 95 to 100 percent of laboratory
density or 85 to 100 percent of theoretical of mixtures. The Asphalt
Institute recommends a field density of 97 percent of laboratory density.
'
118
nuclear air and water permeability methods. The majority of methods
currently in use are destructive methods of test. Several reports have
been written on the usefulness of these devices and will be discussed
subsequently.
Core density tests have probably been used by more agencies than
any other to determine the density of the pavement. Work by Kimble
(61) suggests that densities can be obtained relatively quickly by use
of portable laboratories. However, this type of test in addition to
being destructive is also time consuming.
Comparison of air permeability devices (Figure 101) and density
determined from coring operations have been made by Schmidt et al. (43)
(Figure 102) and Kari and Santucci (62). Additional work by Ellis and
Schmidt (63) has correlated core permeability with permeability of cores
in place.
Goode and Lufsey (12) have shown that air permeability is a function
of aggregate gradations as well as total air voids; therefore, the air
permeability apparatus may have to be determined for each individual
mix and compared with the standard for that mix.
Zube (56) has developed a water permeability deivce used by the
California Division of Highways and has presented a correlation with
field core measurements (Figure 103) for ten projects.
Nuclear gauges have been used in Oregon (64), Texas, and California (70).
Work performed by Hughes (66, 67) and a number of factors including
aggregate type, asphalt content, layer thickness, and surface texture
affect the density as measured using this device be calibrated for use on
a particular project.
119
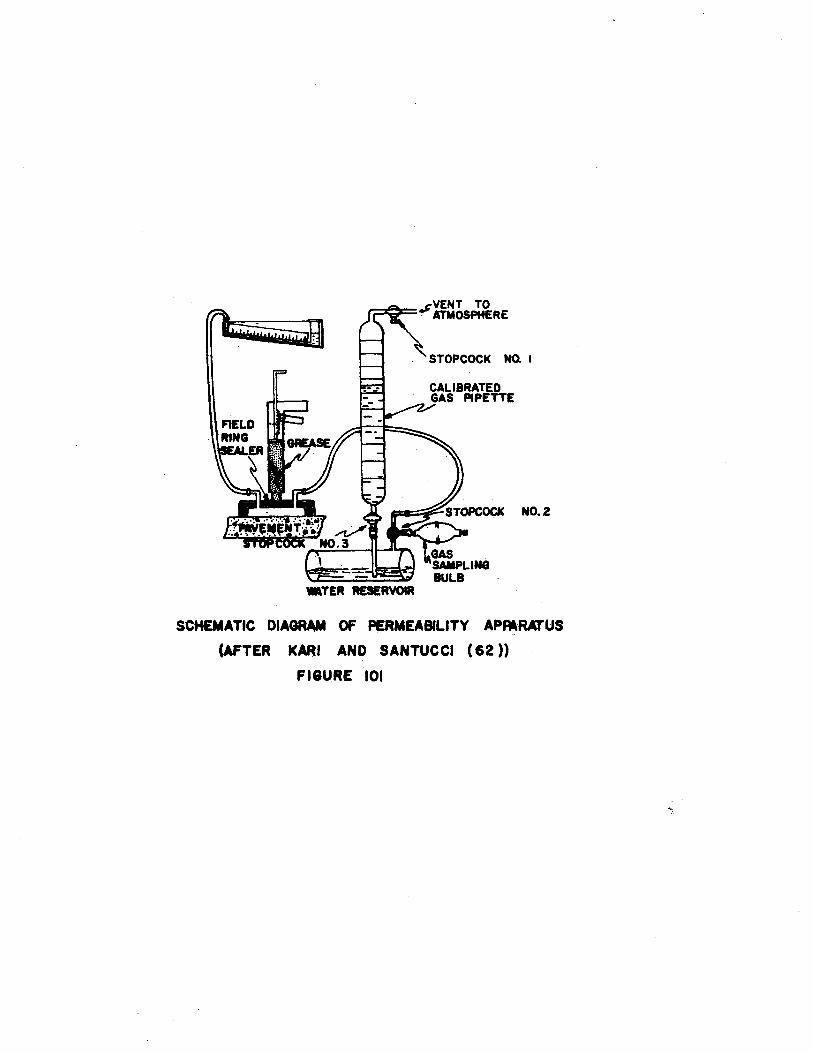
STOPCOCK NO. I
N0.2
WllTER RESERVOIR
SCHEMATIC DIAGRAM Of PERMEABILITY AP~RATUS
(AFTER KARl AND SANTUCCI ( 62 ))
FIGURE 101
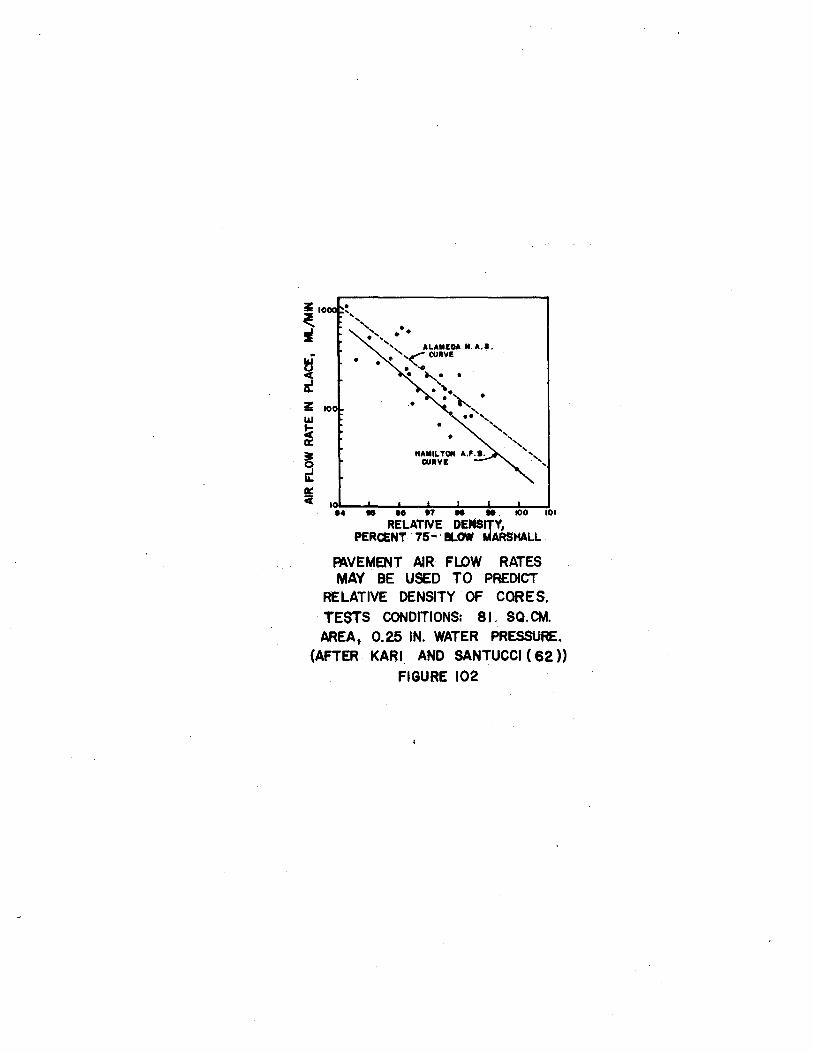
~ 10
u.a !;( a:
~ ~
~ ~~ •• -~.=--~ .. =--~.T~~ .. ~~ ...... _--JIO,..,....O ---!101
RELATIVE DEMSJTY, PERCENT . 75• ·BLOW MARSHALL
PAVEMENT AIR FLOW RATES MAY BE USED TO PREDICT
RELATIVE DENSITY OF CORES.
TESTS CONDITIONS: 81. SQ.CM. AREAt 0.25 IN. WATER PRESSURE.
(AFTER KARl AND SANTUCCI ( 62))
FIGURE 102
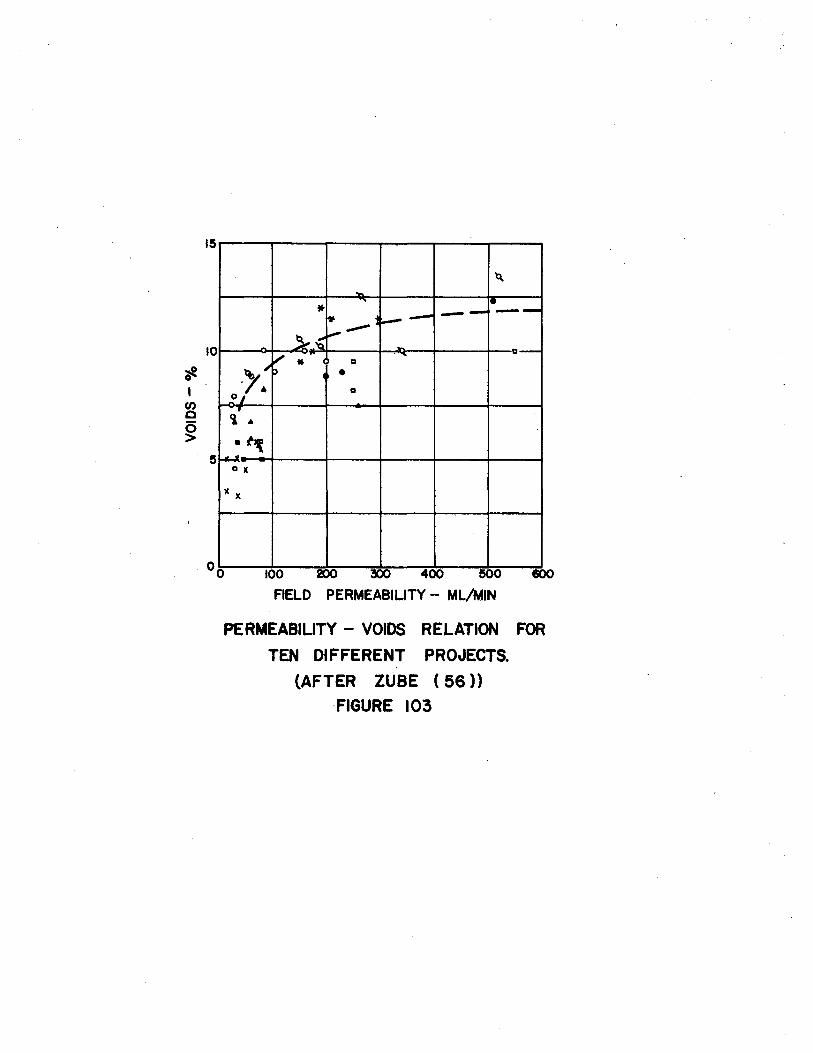
.,. I en c 0 >
15
'Q.
"
10
* --·--.. ! :---
~-.0: -----v • ·~ a-
~ ~ a
p 4 • 0~/. a
'if •
-~~ ... D X
lC X
. 0 0 100 ~ !00 400 500 600
FIELD PERMEABILITY - ML/MIN
PERMEABILITY- VOIDS RELATION FOR
TEN DIFFERENT PROJECTS.
(AFTER ZUBE ( 56 ) )
FIGURE 103
If the data for all fifteen test sections are considered collectively,
a histogram can be prepared and a cumulative frequency distribution
chart can be plotted. The chart for the relative densities before traffic
and after four months traffic is shown in Figure 104. From these curves
it can be seen that, after construction and before any traffic is allowed
on the pavement, 84 percent of the samples from the normal construction
operations did not attain 9S percent of the laboratory density. After
one week of traffic approximately SO percent of the test sections had
reached 9S percent laboratory density. After four months, 80 percent
had reached 95 percent relative compaction. After two years of service
80 percent of the pavement reached 95 percent relative compaction while
only 20 percent reached 100 percent relative compaction (Appendix D).
Thus it is apparent that these test sites were not compacted initially
to the expected density nor did their density increase to the desired
2 to 6 percent air void content after two years of service, in approximately
one third of the sites.
Data collected in this project (Figure lOS) indicate that the ease
with which a mix can be compacted in the laboratory can be used as an
approximation of how well the mix can be GOmpacted in the field with
normal construction techniques. In particular the laboratory test indicated
that the slag aggregate mixes (Milano and Bryan Projects) could not be
compacted to a high density.
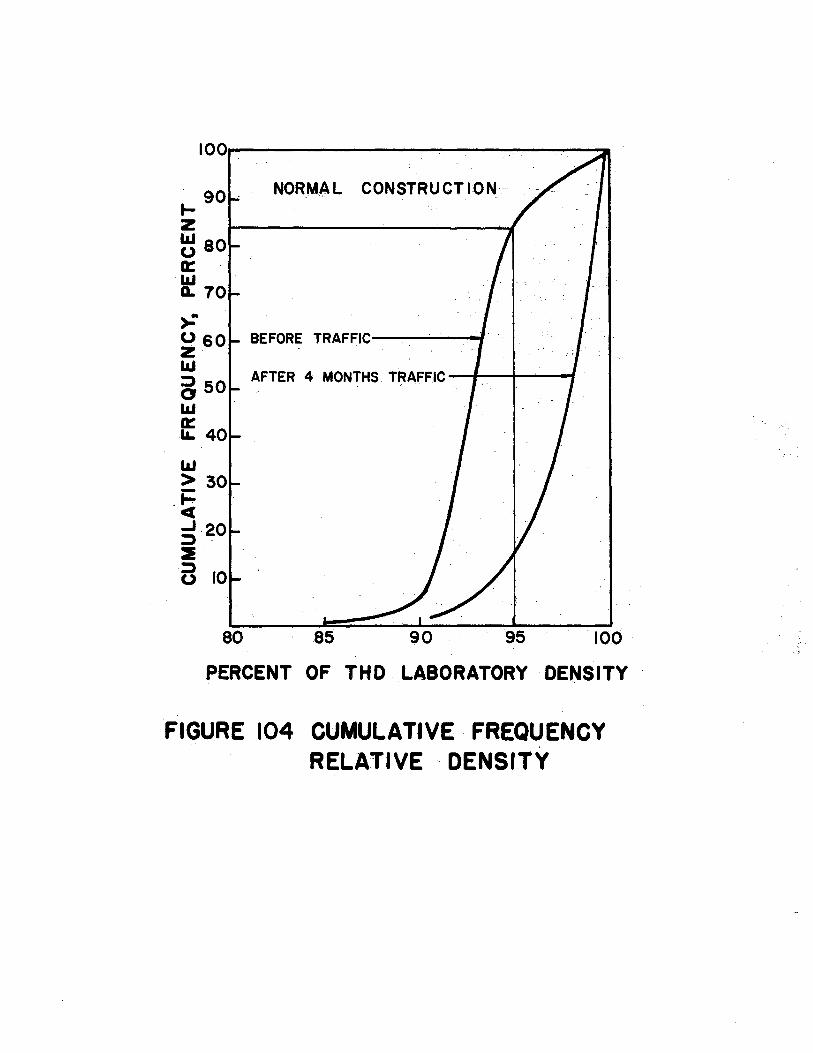
100--------------~----------~
LaJ > 30 .~ c ..J 20 ;:)-
2 a 80
NORM,\L CONSTRUCTION-
BEFORE TRAFFIC--,---~__,
AFTER 4 MONTHS. T~AFFIC ----11---+----t
85 90 95 100
PERCENT OF THO LABORATORY DENSITY
FIGURE 104 CUMULATIVE FREQUENCY RELATIVE · DENSITY
I
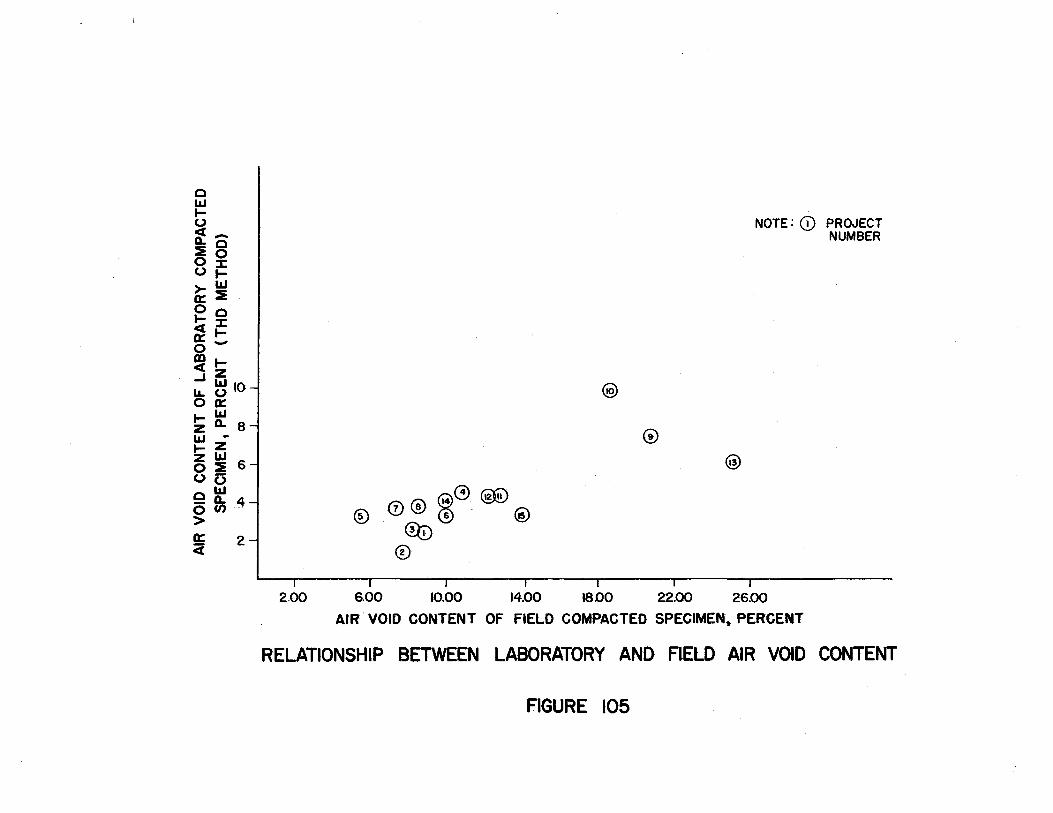
0 w t-o <(_ a..o :to O::t: Ot->-W a::E Oo 1-::t: <(ta:_ 0
~~ _J w1o ~0 oa:
w t- Q.. 8 z .. wz t-z w 6 o:t oo
w 0 Q.. 4 5 en .. > a: 2 Ci
@). 0 ® ~(~) @0 ~ @
®
@
@
@
NOTE: G) PROJECT NUMBER
2.00 6.00 10.00 14.00 18.00 22.00 26.00
AIR. VOID CONTENT OF FIELD COMPACTED SPECIMEN, PERCENT
RELATIONSHIP BETWEEN LABORATORY AND FIELD AIR VOID CONTENT
FIGURE 105
CONCLUSIONS AND RECOMMENDATIONS
Conclusion
1) The mechanical properties of asphalt concrete are largely
determined by its density. Information presented in this study suggest
that high densities are necessary if a pavement is to be durable and
have adequate tensile strength, fatigue resistance, stiffness, and
stability.
2) The engineer must consider a number of variables in order to
obtain adequate initial compaction. These include:
a. The compaction characteristics of the particular asphaltaggregate mixture which depend on aggregate absorption, aggregate surface texture, aggregate gradation, and asphalt type.
b. The environmental conditions under which the pavement will be placed.
c. The heat capacity of the mixture and its cooling rate for the particular geometry and environmental conditions under which it will be placed.
d. The timing and sequence of roller operations.
e. The type of equipment to be used.
f. The stiffness of the "base" material.
3) The long term density of a pavement is largely controlled by
the following factors:
a. Amount of initial compaction
b. Amount of traffic
c. Type of traffic
d. Susceptibility of asphalt to harden
126
Daily temperature cycling may also contribute to the gain in density
with age. However, the amount of densification due to this thermal
cycling can not be determined from the information considered in this study.
4) The Texas Gyratory method of compacting specimen in the laboratory
produces a more dense mix than any of the following methods:
a. Corps of Engineers' Gyratory
b. Marshall
c. California Kneading
5) The majority of the pavements considered in this study were
compacted to an air void content that ranged between 8 and 12 percent and
obtained 95 percent relative compaction after 4 months. Decreases in
air void content of 4 to 6 percent during two years of service were also
noted.
Recommendations
As shown the initial density of a pavement is dependent upon a number
of factors which are unique for any particular construction project.
These factors are difficult to evaluate before actual construction.
Therefore, it is recommended that trial compaction sections be included as
a job requirement and constructed prior to the placement of the asphalt
concrete. These trial sections would allow the engineer the opportunity to:
1) Determine the proper type of equipment needed to compact the particular mix.
2) Determine the timing and sequence of roller operation to compact the particular mix.
3) Determine the rate of heat loss for the particular mix and job geometry under conditions that will exist during full scale construction.
127
4) Determine the compaction characteristics of the particular mix.
5) Evaluate the "base" support for the particular job~
6) Calibrate non-destructive testing methods for use as compaction control devices during full scale construction.
These test sections should be constructed on the pavement structure
that is to be paved and under environmental conditions that can be expected
during the full scale construction.
The trial test section has been used successfully by several agencies
and such usage resulted in optimum compaction with minimum compactive
effort. This approach will be economically feasible for the contractor,
as a minimum amount of effort will be used to obtain the desired density,
and it will be economical to the owner as better control and higher
densities will result.
As discussed previously, certain non-destructive testing methods
afford the opportunity for rapid density determinations while the
pavement is at an elevated temperature and further densification can take
place. It is recommended that continued and widespread use be made of
these techniques as they will allow the engineer to obtain higher densities.
Data reported herein suggest that breakdown rolling occurred in the
majority of the test sections after the mat had cooled below 175°F. It
is suggested that rolling be initiated after the laydown machine has
placed the asphalt concrete or that thicker lifts be used so that the
mat will retain its heat a longer period of time. Methods of obtaining
greater densification during the laydown operation should be investigated.
The mix is normally at an elevated temperature during this operation and
thus can be easily compacted.
128
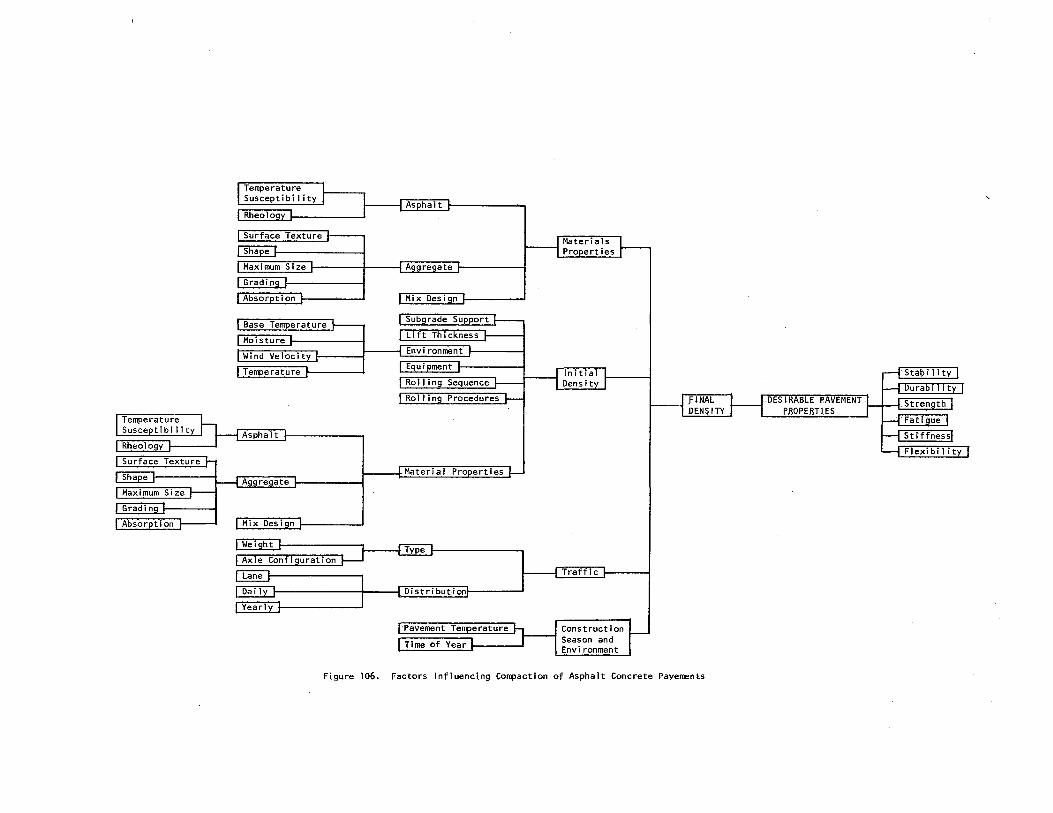
Distri but· ion
TraTflc
Construction Season and Environment
Figure 106. Factors Influencing Compaction of Asphalt Concrete P.ayements
DESIRABLE PAVEMENT PROPERTI.ES J I .:. :::;:~:;~1.11 I
As suggested above considerable effort should be aimed at improving
the initial density of the pavement as results contained herein indicate
that only a 4 to 6 percent reduction in air voids occurs due to traffic
over a two-year period. Less than half of the pavements studied reached
the desired range in air void content of 2 to 6 percent.
This desired range in air void content is based on stability, dura
bility, strength, fatigue resistance and stiffness requirements discussed
previously. Furthermore, the rolling sequence most frequently used on
these projects (steel-steel-pneumatic) should be compared with the more
common (steel-pneumatic-steel) method used on particular projects to
determine if the roller sequence is an important variable.
As an aid to the construction engineer, a flow diagram (Figure 106)
has been prepared and it is suggested that it be referred to prior to the
start of compaction operations. This diagram is intended to guide the
engineer in order that he may consider the important items which control the
compaction of asphalt concrete pavements. Details as to the relative
importance of these factors and why these factors have been considered
can be found in the report.
REFERENCES
1. , "Manual of Testing Procedures-Volume I," Texas Highway Department, February, 1963.
2. , "Materials Manual Volume I, Testing and Control Procedures," California Division of Highways, 1963.
3. Gallaway, Bob M., "Laboratory and Field Densities of Hot-Mix Asphaltic Concrete in Texas," Highway Research Board Bulletin 251, pp. 12-17, 1960.
4. Gallaway, Bob M., "A Limited Study of Laboratory and Field Densities of Hot-Mix Asphalt Concrete in Texas," Report for the Texas Highway Department, RP-13, 1960.
5. Gallaway, Bob M. and Harper, William J., "Interim Report on the Laboratory Considerations for the Use of Synthetic Aggregates for Hot-Mix Asphalt Pavements," Report for the Texas Highway Department, Research Report 51-3, 1966.
6. Monismith, C. L. and Vallerga, B. A., "Relationship Between Density and Stability of Asphaltic Paving Mixtures," Proceedings, Association of Asphalt Paving Technologists, Vol. 25, pp. 88-101, 1956.
7. McLeod, N. w., "Influence of Viscosity of Asphalt Cements on Compaction of Paving Mixtures in the Field," Highway Research Board Record 158, pp. 76-115, 1967.
8. Kiefer, R. W., "The Effect of Compaction Temperature on the Properties of Bituminous Concrete," American Society of Testing Materials, STP No. 294, pp. 19-26, 1960.
9. McRae, J. L., "Compaction of Bituminous Concrete," Proceedings, Association of Asphalt Paving Technologists, Vol. 26, pp. 206-213, 1957.
10. Bodell, R. S., "Field Compaction of Bituminous Concrete," Proceedings, Association of Asphalt Paving Technologists, Vol. 26, pp. 213-217, 1957.
11. Bahri, G. R. and Rader, L. F., "Effects of Asphalt Viscosity on Physical Properties of Asphaltic Concrete," Highway Research Board Record 67, pp. 59-79, 1965.
12. Goode, J. F. and Lufsey, L.A., "Voids Permeability, Film Thickness vs Asphalt Hardening," Proceedings, Association of Asphalt Paving Technologists, p. 430, 1965.
131
13. Heithaus, J. F. and Johnson, R. W., "A Microviscometer Study of Road Asphalt Hardening in the.Field and Laboratory," Proceedings, Association of Asphalt Paving Technologists, Vol. 27, pp. 17-31, 1958.
14. Krchma, L. C. and Groening, T., "Influence of Pavement Voids, Asphalt Content and Asphalt Grade on Asphalt Performance," Proceedings, Association of Asphalt Paving Technologists, Vol. 28, pp. 34-47, 1959.
15. Tons, Egons and Krokosky, E. M., "Tensile Properties of Dense Graded Bituminous Concrete," Proceedings Association of Asphalt Paving Technologists, Vol. 32, pp. 497-528, 1963.
16. Livneh, M. and Shkrlarsky, E., "The Splitting Test for Determination of Bituminous Concrete Strength," Proceedings, Association of Asphalt Paving Technologists, Vol. 31, pp. 457-474, 1962.
17. Saal, R. M. J. and Pel!, P. S., "Fatigue of Bituminous Road Mixes," Kolloid Zeitschrift (Darmstadt), Vol. 171, 1960.
18. Monismith, C. L., "Asphalt Mixture Behaviour in Repeated Flexure," Report No. TE65-9, ITTE.
19. Epps, Jon A. and Monismith, C. L., "Influence of Mixture Variables on the Flexural Fatigue Properties of Asphalt Concrete," Proceedings, Association of Asphalt Paving Technologists, Vol. 38, 1969.
20. Deacon, J. A., "Fatigue of Asphalt Concrete," Graduate Report, The Institute of Transportation and Traffic Engineering, University of California, Berkeley, 1965.
21. Van Draat, w. E. F. and Sommer, P. "Ein Gerat zur Bestimmung der dynamischen Elastizitates Moduln von Asphalt," Strasse and Autobahn, Vol. 35, 1966.
22. Santucci, L. E. and Schmidt, R. J., "Setting Rate of Asphalt Concrete," Highway Research Board Bulletin 333, pp. 1-8, 1962.
23. Kallas, B. F. and Krieger, H. C., "Effects of consistency of Asphalt Cements and Types of Mineral Filler on the Compaction of Asphalt Concrete," Proceedings, Association of Asphalt Paving Technologists, Vol. 29, pp. 152-171, 1960.
24. Santucci, L. E. and Schmidt, R. J., "Setting Rate of Asphalt Concrete," Highway Research Board Bulletin 333, pp. 1-8, 1962.
25. Nijboer, L. W., "The Compaction of Asphaltic Road Mixtures by Rolling," Proceedings, Association of Asphalt Paving Technologists, Vol. 33, pp. 241-268, 1964.
132
26. Fromm, H. J., "The Compaction of Asphaltic Concrete on the Road," Proceedings, Association of Asphalt Paving Technologists, Vol. 33, pp. 241-268, 1964.
27. Bright, Richard, Steed, Boyd, Steele, John, and Justice, Allan, "The Effect of Viscosity of Asphalt on Properties of Bituminous Wearing Surface ~ixtures," Proceedings, Association of Asphalt Paving Technologists, Vol. 35, p. 164, 1966.
28. Schmidt, R. M., Kari, W. J., Bower, H. C., and Rein, T. C., "Behaviour or Hot Asphaltic Concrete Under Steel Wheel Rollers," Highway Research Bulletin 251, 1960.
29. Epps, Jon A., "Influence of Mixture Variables on the Flexural Fatigue and Tensile Properties of Asphalt Concrete," Thesis, University of California, Berkeley, 1968.
30. Parker, C. F., "Steel-Tired Rollers," Highway Research Board Bulletin 246, 1960.
31. Swanson, R. C., Nemec, Joseph, Jr., and Tons, Egons, "Effect of Asphalt Viscosity on Compaction of Bituminous Concrete," Highway Research Board Record 117, pp. 23-53, 1966.
32. Parr, Ward K., Serafin, P. J., and Humphries, Tom, "Michigan State Highway Experimental Bituminous Concrete Construction Project," Proceedings, Association of Asphalt Paving Technologists, Vol. 24, pp. 125-171, 1955.
33. Graham, M.D., Burnett, W. C., Thomas, Jerome J., and Dixon, W. C. "Pavement Density- What Influences It," Proceedings, Association of Asphalt Paving Technologists, Vol. 34, p. 286, 1965.
34. Kari, W. J., "Discussion to 'Symposium on Compaction of Asphalt Concrete,'" Proceedings, Association of Asphalt Paving Technologists, Vol. 36, pp. 288-294, 1967.
35. Marker, Vaughn, "Introduction, 'Symposium on Compaction of Asphalt Concrete,'" Proceedings, Association of Asphalt Paving Technologists, Vol. 36, pp. 288-294, 1967.
36. Chastain, W. E. and Burke, J. E., "State Practices in the Use of Bituminous Concrete," Highway Research Board Bulletin 160, Bituminous Paving Mixture, 1957.
37. Benson, F. J., "Survey of Use of Crushed Aggregates In Hot Mix Asphalt Pavements," National Asphalt Pavement Association, Publication QlP-91, September, 1968.
133
38. Barber, E. S., "Calculation of Maximum Pavement Temperatures from Weather Reports," Highway Research Board Bulletin No. 168, 1957.
39. Serafin, P. J. and Kole, L. L.; "Comparative Studies of Pneumatic Tire Rolling," Proceedings, Association of Asphalt Paving Technologists, Vol. 31, pp. 418-456, 1962.
40. Bituminous Pavement Investigation, Texas Highway Department, Report Ll-14-68-F, October, 1968.
41. Corlew, J. S. and Dickson, P. F., "Methods of Calculating Temperatures Profiles of Hot Mix Asphalts Concrete as Related to the Construction of Asphalt Pavements," Proceedings, Assoication·of Asphalt Paving Technologists, Vol. 37, 1968.
42. Nijboer, L. W., "Plasticity as a Factor in the Design of Dense Bituminous Road Carpets," p. 83, 1948.
43. Schmidt, R. J., Santucci, L. E., and Garrison, W. A., "High Temperatures Pneumatic Compaction," Highway Research Board Record No. 132, 1966.
44. Arena, Philip, Shah, S. C., and Adam, Verdi, "Compaction of \sphaltic Concrete Pavement with High Intensity Pneumatic Roller," Highway Research Board Record No. 178, 1967.
45. Bodell, R. S., "Field Compaction of Bituminous Concrete," Proceedings, Association of Asphalt Paving Technologists, Vol. 26, pp. 213-217, 1957.
46. Kari, W. J., "Mix Properties as They Influence Compaction," Proceedings, Association of Asphalt Paving Technologists, Vol. 36, pp. 295-309, 1967.
47. Foster, C. R., "The Current State of the Art of Compaction Procedure," Presented at the Highway Research Board Annual Meeting, January, 1969.
48. The Asphalt Handbook, The Asphalt Institute, 1965.
49. Gartner, W., Cobb, D. A., and Lindley, R. W., "Field Compaction Studies on Asphaltic Concrete," Highway Research Bulletin No. 358, pp. 38-53.
50. Kenis, W. J., "Progress Report on Changes in Asphaltic Concrete in Service," Highway Research Board Bulletin 333, pp. 39-65, 1962.
51. Palmer, Robert K. and Thomas, J. J., "Pavement Density- How It Changes," Proceedings, Association of Asphalt Paving Technologists, Vol. 37, pp. 542-574, 1968.
52. Campen, W. H., Smith, J. R., Erickson, L. G., and Mertz, L. R., "The Effect of Traffic on the Density of Bituminous Paving Mixtures," Proceedings, Association of Asphalt Paving·Technologists, Vol. 30, pp. 378-388, 1961.
134
53. Gallaway, B. M., "Laboratory and Field Densities of Hot Mix Asphaltic Concrete in Texas," Highway Research Board Bulletin 251, pp. 12-17, 1960.
54. Pauls, J. T. and Halstead, W. J., "Progressive Alterations in a Sheet Asphalt Pavement Over a Long Period of Time," Proceedings, Association of Asphalt Paving Technologists, Vol. 27, 1958.
55. Gallaway, B. M., "Discussion of 'Pavement Density - How It Changes,"' Proceedings, Association of Asphalt Paving Technologists, Vol. 37, p. 577, 1968.
56. Zube, Ernest, "Compaction Studies of Asphalt Concrete Pavement as Related to the Water Permeability Test," Highway Research Board Bulletin 358, pp. 12-31, 1962.
57. , " Road Test One -MD," Highway Research Board, Special -----,:---:-:-Report 4, 1949.
58. Portland Cement Association, Thickness Design for Concrete Pavements, Chicago, Illinois, 1966.
59. Monismith, C. L., "Asphalt Mixture Behaviour in Repeated Flexure," Report TE 66-6, University of California, Berkeley, 1966.
60. McRae, J. L., "Compaction of Bituminious Concrete," Proceedings, Association of Asphalt Paving Technologists, Vol. 26, pp. 206-213, 1957.
61. Kimble, F., "A Field Method of In-Place Density Determination and Control of Hot Mix Asphaltic Concrete," Proceedings, Association of Asphalt Paving Technologists, Vol. 27, pp. 265-291, 1958.
62. Kari, W. J. and Santucci, L. E., "Control of Asphalt Concrete Construction by the Air Permeability Test," Proceedings, Association of Asphalt Paving Technologists, Vol. 32, 1963.
63. Ellis, W. H. and Schmidt, R. J., "A Method of Measuring the Air Permeabilities of Asphalt Concrete Pavements," American Society for Testing Materials STP No. 294, pp. 85-91, 1960.
64. Morgan, F. D., Decker, G. L., Yarbrough, F. W., and Fields, J. W., "Verification of Nuclear Moisture and Density Gauges," Oregon State Highway Department, 1966.
65. Handy, Henry and Baxter, C. W., "Evaluation of the Asphalt Density Gauge and Compaction of Bituminous Pavements," Texas Highway Department, Report No. SS6.0, July, 1967.
66. Hughes, C. S., "Investigation of a Nu~lear Device for Determining the Density of Bituminous Concrete," Proceedings, Association of Asphalt Paving Technologists, Vol. 31, pp. 400-416, 1962.
135
67. Hughes, C. S. and Ralston, H. H., "Field Testing of a Nuclear Density Device on Bituminous Concrete," Proceedings, Association of Asphalt Paving Technologists, Vol. 32, pp. 106-142, 1963.
68. Stephens, Jack E., "Discussion of Symposium on Compaction," Proceedings, Association of Asphalt Paving Technologists, Vol. 36, p. 357, 1967.
69. Jones, George M., "Discussion of Symposium on Compaction," Proceedings, Association of Asphalt Paving Technologists, Vol. 36, p. 357, 1967.
70. Personal Correspondence with W. A. Garrison, 1969.
136

APPENDIX A
137
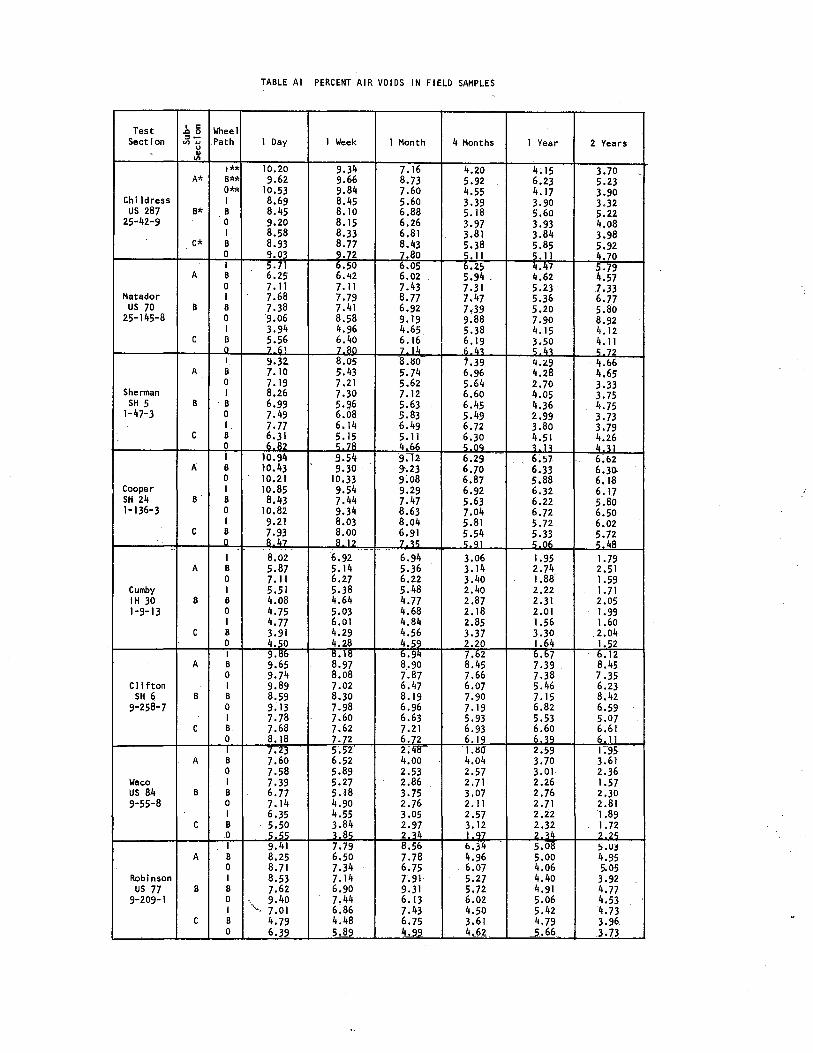
TABLE Al PERCENT AIR VOIDS IN FIELD SAMPLES
Test I C: Wheel ..Q 0·
Section ::J·- Path 1 Day Vl .... u
1 Week 1 Month 4 Months 1 Year 2 Years Ql Vl
I** 10.20 9.34 7.16 4.20 4.15 3.70 -A* B** 9.62 9.66 8.73 5.92 6.23 5.23 0** 10.53 9.84 7.60 4.55 4.17 3.90
Chi I dress I 8.69 8.45 5.60 3.39 3.90 3.32 us 287 B* B 8.45 8.10 6.88 5.18 5.60 5.22
25-42-9 0 9.20 8.15 6.26 3.97 3.93 4.08 I 8.58 8.33 6.81 3.81 3.84 3.98
C* B 8.93 8.77 8.43 5.38 5.85 5.92 0 9.03 9.72 7.80 5.11 5.11 4.70 I
t~~ -o.50 6.05 6.2!) 4.47 5-79
A B 6.'12 6.02 5.94 . 4.62 4.57 0 7.11 7.11 7.43 7.31 5.23 7.33
Matador I 7.68 7.79 8.77 7.47 5.36 6.77 us 70 B B 7.38 7.41 6.92 7.39 5.20 5.80
25-145-8 0 9.06 8.58 9.19 9.88 7.90 8.92 I 3.94 4.96 4.65 5.38 4.15 4.12
c B 5.56 ~·:~ ~~ :t t!~ 3.~0 4.11 0 7.61 <; 11 5.72 I 9.32. 8.Q5 8.80 1.39 '+.:£9 4.66
A B 7.10 5'.43 ;.74 6.96 4.28 4.65' 0 7.19 7.21 5.62 5.64 2.70 3.33
Sherman I 8.26 7.3Q 7.12 6.60 4.05 3.75 SH 5 B . B 6.99 5.96 5.63 6.45 4.36 4.75
1-47-3 0 7.49 6.68 5.83 5.49 2.99 3.73 I 7.77 6.14 6.49 6.72 3.80 3.79 c B ~J~ ~:~~ 5.1! 6.30 ~·~! 4.26 0 4 6 s oq 4.~1 i 10.94 9.54 9.12 6.29 6:s1 6:&2
A B 10.43 9.30 9'.23 6.70 6.33 6.30. 0 10.21 10.33 9;oa 6.87 5.88 6.18
Cooper I 10.85 9.54 9.29 6.92 6.32 6.17 SH 24 B B 8.43 7.44 7.47 5.63 6.22 5.80 1-136-3 0 10.82 9.34 8.63 7.04 6.72 6.50
I 9.21 8.03 8.04 5.81 5.72 6.02 c B ~:~~ ~·~~ ~:~! 5.54 ~:~~ 5.72 n <;.QI 5 48
I 8.02 6.92 6.94 3.06 1.95 1.79 A B 5.87 5.14 5.36 3.14 2.74 2.51
0 7.11 6.27 6.22 3.40 1.88 1.59 Cumby I 5.51 5.38 5.48 2.4Q 2.22 1.71 IH 30 B B 4.08 4.64 4.77 2.87 2.31 2.05 1-9-13 0 4.75 5.03 4.68 2.18 2.01 1.99
I 4.77 6.01 4.84 2.85 1.56 1.60 c B 3.91 4.29 4.56 3.37 3.30 .2.04
0 4.50 4.28 4.59 2.20 1.64 1,.52 I 9.~b 8.18 6.94 7.62 6.67 b.12
A B 9.65 8.97 8.90 8.45 7.39 8.45 0 9.74 8.08 7.87 7.66 7.38 7.35
Clifton I 9.89 7.02 6.47 6.07 5.46 6.23 SH 6 B B 8.59 8.30 8.19 7.90 7.15 8.42
9-258-7 0 9.13 7.98 6.96 7.19 6.82 6.59 I 7.78 7.60 6.63 5.93 5.53 5.07
c B 7.68 7.62 7.21 6.93 6.60 6.61 0 8.18 7.72 6.72 6.19 6.~q 6.11 I
~:~~ s-. 52" 2:lllf '1.80' 2.59 1.95'--A B 6.52 4.00 4.04 3.70 3.61
0 7.58 5.89 2.53 2.57 3.01 2.36 Waco I 7.39 5.27 2.86 2.71 2.26 1.57 us 84 B B 6.77 5.18 3.75 3.07 2.76 2.30 9-55-8 0 7.14 4.90 2.76 2.11 2.71 2.81
I 6.35 4.55 3.05 2.57 2.22 1.89 c B 5.50 3.~~ 2.97 3.12 2.32 ' 1.72
; 0 5.55 ~.a 2.~4 ].Q7 2. ~4 2 2'i I 9.41 7.79 8.56 b.;f4 5.Da !j,Uj
A B 8.25 6.50 7.78 4.96 5.00 4.95 0 8.71 7.34 6.75 . 6.07 4.06 5.05
Robinson I 8.53 7.14 7.91 5.27 4.40 3.92 us 77 B B 7.62 6.90 9.31 5.72 4.91 4.77
9-209-1 0 9.40 7.44 6.13 6.02 5.06 4.53 I " . 7.01 6:86 7.43 4.50 5.42 4.73
c B 4.79 4.48 6.75 3.61 4.79 3.96 0 6.li_ 5.89 4.99 4,62 5.66 ].73
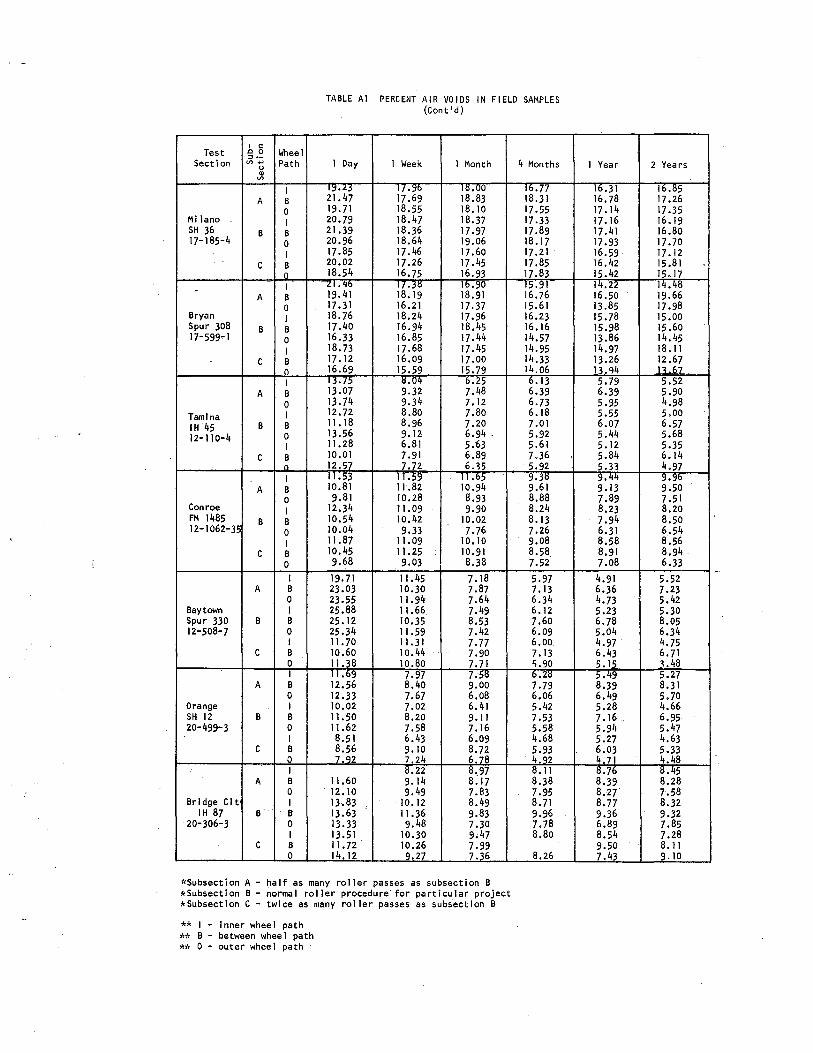
TABLE AI PERCENT AIR VOIDS IN FIELD SAMPLES (Cont'd)
I 1::: Test .Q 0 Wheel :l•-
Section "' ... Path 1 Day 1 Week 1 Month u Q)
"' I ~~:~? 1/.~b 1~.~0 A B 17.69 18.83
0 19.71 18.55 18.10 Milano I 20.79 18.47 18.37 SH 36 B B 21.39 18.36 17.97 17-185-4 0 20.96 18.64 19.06
I 17.85 17.46 17.60 c B 20.02 17.26 17.45
0 18.54 16.75 16.93 . I i:I,'IO I{.~IJ 1o.90
A B 19.41 18.19 18.91 0 17.31 16.21 17.37
Bryan I 18.76 18.24 17.96 Spur 308 B B 17.40 16.94 18.45 17-599-1 0 16.33 16.85 17.44
I 18.73 17.68 17.45 c B 17.12 16.09 17.00
0 16.69 15.59 . 15.79 I :t~~
11.0'1 b.25 A B 9.32 7.48
0 13.74 9.34 7.12 Tam ina 1 12.72 8.80 7.80 IH 45 B B 11.18 8.96 7.20 12-110-4 0 13.56 9.12 6.94 .
I 11.28 6.81 5.63 c B 10.01 7.91 6.89
n 12.57 7.72 6.,5 I 11.~3 11.~9 11.o5
A B 10.81 11.82 10.94 0 9.81 10.28 8.93
Conroe I 12.34 11.09 9.90 FM 1485 B B 10.54 10.42 10.02 12-1062-35 0 10.04 9.33 7.76
I 11.87 11.09 10.10 c B 10.45 11.25 10.91
0 9.68 9.03 8.38 I 19.71 11.45 7.18
A B 23.03 10.30 7.87 0 23.55 11.94 7.64
Baytown I 25.88 11.66 7.49 Spur 330 B B 25.12 10.35 8.53 12-508-7 0 25.34 11.59 7.42
I 11.70 11.31 7.77 c B 10.60 10.44 7.90
0 11.38 10.80 7.71 r 11.69 7.97 7.51:!
A B 12.56 8.40 9.00 0 12.33 7.67 6.08
Orange I 10.02 7.02 6.41 SH 12 B B 11.50 8.20 9.11 20-499-3 0 11.62 7.58 7.16
I 8.51 6.43 6.09 c B 8.56 9.10 8.72
0 7.92 7.24 6.78 I 8.22 8.97
A B 11.60 9.14 8.17 0 12.10 9.49 7.83
Bridge Cit I 13.83 10.12 8.49 IH 87 B B 13.63 11.36 9.83
20-306-3 0 13.33 9.48 7.30 I 13.51 10.30 9.47
c B 11.72 10.26 7.99 0 14.12 9.27 7.36
*Subsection A- half as many roller passes as subsection B *Subsection B- normal roller procedure for particular project *Subsection C- twice as many roller passes as subsection B
** I - inner wheel path ** B - between whee 1 path ** 0 - outer whee 1 path
4 Months
1~·?7 18.31 17.55 17.33 17.89 18.17 17.21 17.85 17.83 15.~1 16.76 15.61 16.23 16.16 14.57 14.95 14.33 14.06 ~.13 6.39 6.73 6.18 7.01 5.92 5.61 7.36 5.92 9.31l 9.61 8.88 8.24 8.13 7.26 9.08 8.58 7.52 5.97 7.13 6.34 6.12 7.60 6.09 6.00 7.13 <;,go b,:.!IJ 7.79 6.06 5.42 7.53 5.58 4.68 5.93 4 ._9_2 8.11 8.38 7.95 8.71 9.96 7.78 8.80
8.26
1 Year 2 Years
1o.31 16.85 16.78 17.26 17.14 17.35 17.16 16.19 17.41 16.80 17.93 17.70 16.59 17.12 16.42 15.81 15.42 15.17 14.22 14.48 16.50 19.66 13.85 17.98 15.78 15.00 15.98 15.60 13.86 14.45 14.97 18.11 13.26 12.67 U.'l4 1' 6_7__ 5.79 5.52 6.39 5.90 5.95 4.98 5.55 5.00 6.07 6.57 5.44 5.68 5.12 5.35 5.84 6.14 5.33 4.97 9.'1'1 ~.~b
9.13 9.50 7.89 7.51 8.23 8.20 7.94 8.50 6.31 6.54 8.58 8.56 8.91 8.94 7.08 6.33 4.91 5.52 6.36 7.23 4.73 5.42 5.23 5.30 6.78 8.05 5.04 6.34 4.97 4.75 6.43 6.71 5. 12.. j.48 5.'19 5.27 8.39 8.31 6.49 5.70 5.28 4.66 7.16 6.95 5.94 5.47 5.27 4.63 6.03 5.33 4.71 4;48 8.76 8.45 8.39 8.28 8.27 7.58 8.77 8.32 9.36 9.32 6.89 7.85 8.54 7.28 9.50 8.11 7.43 9.10

. APPENDIX B
140
. .,
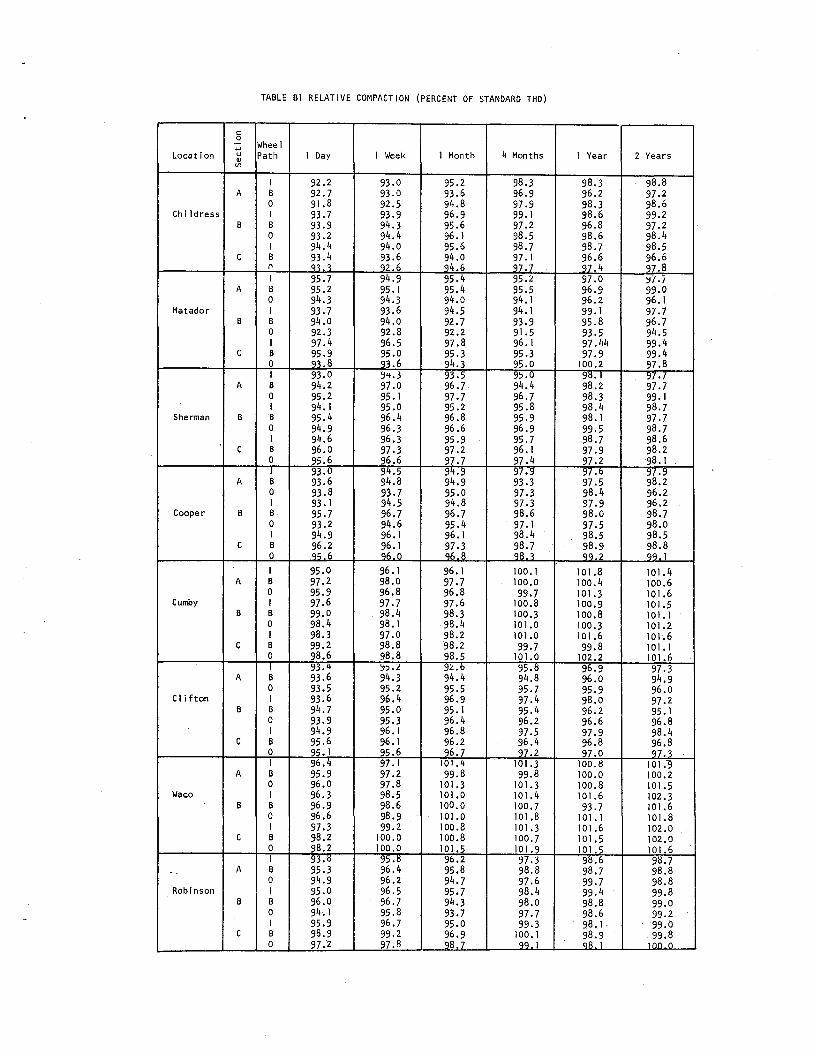
TABLE Bl RELATIVE COMPACTION (PERCENT OF STANDARD THO)
c: 0 .., Wheel
Location u Path 1 Day 1 Week 1 Month 4 Months 1 Year 2 Years Q) Vl
I 92.2 93.0 95.2 98.3 98.3 98.8 A B 92.7 93.0 93.6 96.9 96.2 97.2
0 91.8 92.5 94.8 97.9 98.3 98.6 Childress I 93.7 93.9 96.9 99.1 98.6 99.2
B B 93.9 94.3 95.6 97.2 96.8 97.2 0 93.2 94.4 96.1 98.5 98.6 98.4 I 94.4 94.0 95.6 98.7 98.7 98.5
c B 93.4 93.6 94.0 97.1 96.6 96.6 I' 93-~ G2.6 G4.6 CJ7.7 97.4 97.8 I 95.7 94.9 95.4 95.2 97.0 ':J7./
A B 95.2 95.1 95.4 95.5 96.9 99.0 0 94.3 94.3 94.0 94.1 96.2 96.1
Matador I 93.7 93.6 94.5 94.1 99.1 97.7 B B 94.0 94.0 92.7 93.9 95.8 96.7
0 92.3 92.8 92.2 91.5 93.5 94.5 I 97.4 96.5 97.8 96.1 97.44 99.4
c B 95.9 95.0 95.3 95.3 97.9 99.4 0 93.8 93.6 94.3 95.0 100.2 97.8 I 93.0 9'+.3 93.5 9!>.0 9!!. I 'J/.7
A B 94.2 97.0 96.7 94.4 98.2 97.7 0 95.2 95.1 97.7 96.7 98.3 99.1 I 94. 1 95.0 95.2 95.8 98.4 98.7
Sherman B B 95.4 96.4 96.8 95.9 98.1 97.7 0 94.9 96.3 96.6 96.9 99.5 98.7 I 94.6 96.3 95.9 95.7 98.7 98.6
c B 96.0 97.3 97.2 96.1 97.9 98.2 0 95.6 96.6 97.7 97.4 97.2 98.1 I 93.0 94.5 94.9 97.9 97.b 9~.9
A B 93.6 94.8 94.9 93.3 97.5 98.2 0 93.8 93.7 95.0 97.3 98.4 96.2 I 93.1 94.5 94.8 97.3 97.9 96.2
Cooper B B 95.7 96.7 96.7 98.6 98.0 98.7 0 93.2 94.6 95.4 97.1 97.5 98.0 I 94.9 96.1 96.1 98.4 98.5 98.5
c B 96.2 ~tb 97.3 98.7 98.9 98.8 0 95 6 G6 8 CJ8. ~ qq 2 qq 1
I 95.0 96.1 96.1 100.1 101.8 101.4 A B 97.2 98.0 97.7 100.0 100.4 100.6
0 95.9 96.8 96.8 99.7 101.3 101.6 Cumby I 97.6 97.7 97.6 100.8 100.9 101.5
B B 99.0 98.4 98.3 100.3 100.8 101.1 0 98.4 98.1 98.4 101.0 100.3 101.2 I 98.3 97.0 98.2 101.0 101 .• 6 101.6
c B 99.2 98.8 98.2 99.7 99.8 101.1 0 98.6 98.8 98.5 101.0 102.2 101.6 I 93.4 ~,.l 9L.b 95.8 96.9 97.3
A B 93.6 94.3 94.4 94.8 96.0 94.9 0 93.5 95.2 95.5 95.7 95.9 96.0
Clifton I 93.6 96.4 96.9 97.4 98.0 97.2 B B 94.7 95.0 95.1 95.4 96.2 95.1
0 93.9 95.3 96.4 96.2 96.6 96.8 I 94.9 96.1 96.8 97.5 97.9 98.4
c B 95.6 96.1 96.2 96.4 96.8 96.8 0 95.1 95.6 96.7 97.2 97.0 CJ7.3 I 96.4 97.1 101.4 101.3 100.8 1 Ol.:J
A B 95.9 97.2 99.8 99.8 100.0 100.2 0 96.0 97.8 101.3 101.3 100.8 101.5
Waco I 96.3 98.5 101.0 101.4 101.6 102.3 B B 96.9 98.6 100.0 100.7 93.7 101.6
0 96.6 98.9 101.0 101.8 101.1 101.8 I 97.3 99.2 100.8 101.3 101.6 102.0
c B 98.2 100.0 100.8 100.7 101.5 102.0 0 98.2 100.0 101.5 101.9 101.5 101.6 I 93.ts 95.8 9b.2 97.3 9B.b 91:!.7
--. A B 95.3 96.4 95.8 98.8 98.7 98.8 0 94.9 96.2 94.7 97.6 99.7 98.8
Robinson I 95.0 96.5 95.7 98.4 99.4 99.8 B B 96.0 96.7 94.3 98.0 98.8 99.0
0 94.1 95.8 93.7 97.7 98.6 99.2 I 95.9 96.7 95.0 99.3 98.1 99.0
c B 98.9 99.2 96.9 100.1 98.9 ~~~·~ 0 97.2 97.8 98.7 qq 1 GR 1
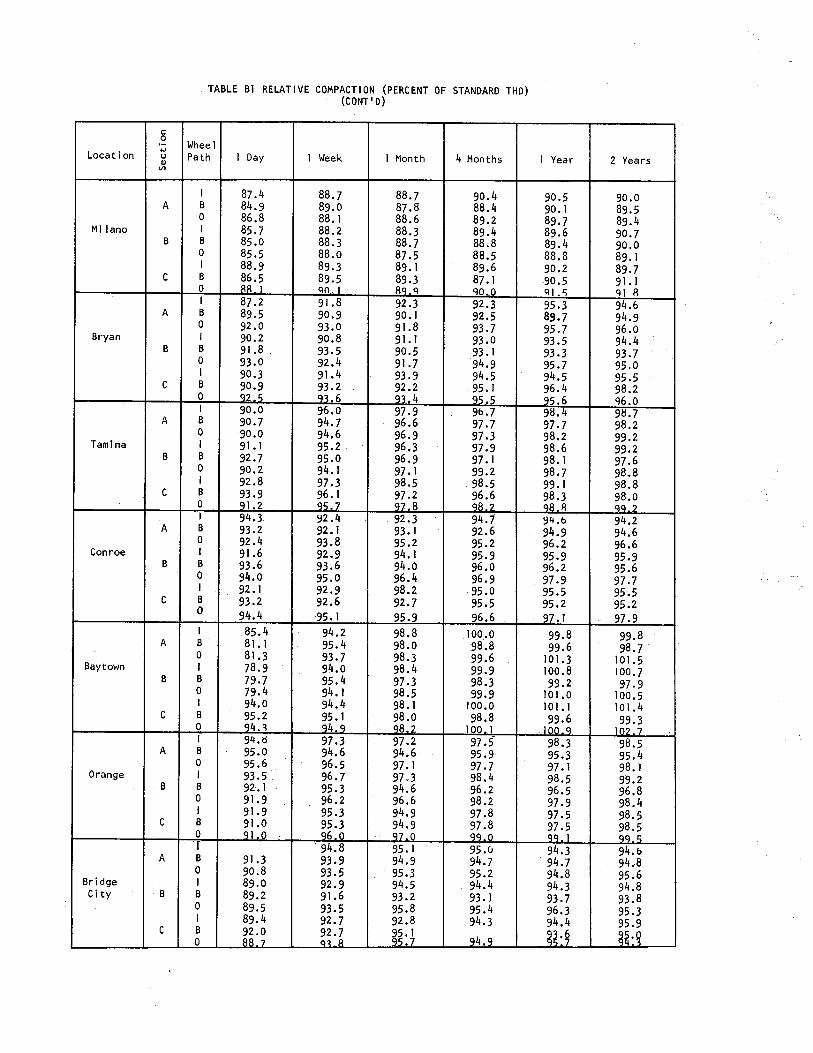
c: 0 ... Location u Q)
Vl
A
Milano B
c
A
Bryan B
c
A
Tam ina B
c
A
Conroe B
c
A
Baytown B
c
A
Orange B
c
A
Bridge City . B
c
. TABLE Bl RELATIVE COMPACTION (PERCENT OF STANDARD THO) (CONT'D)
Wheel Path 1 Day 1 Week 1 Month 4 Months
I 87.4 88.7 88.7 90.4 B 84.9 89.0 87.8 88.4 0 86.8 88.1 88.6 89.2 I 85.7 88.2 88.3 89.4 B 85.0 88.3 88.7 88.8 0 85.5 88.0 87.5 88.5 I 88.9 89.3 89.1 89.6 B 86.5 89.5 89.3 87.1 0 _881 GO .. I 8CJ q CJO.O I 87.2 91.8 92.3 92.3 B 89.5 90.9 90.1 92.5 0 92.0 93.0 91.8 93.7 I 90.2 90.8 91.1 93.0 B 91.8 93.5 90.5 93.1 0 93.0 92.4 91.7 .94.9 I 90.3 91.4 93.9 94.5 B 90.9 93.2 92.2 95.1 0 CJ2 ,i; q~ 6 CJ~.4 95.5 I 90.0 96.0 97.9 9b.7 B 90.7 94.7 96.6 97.7 0 90.0 94.6 96.9 97.3 I 91.1 95.2 96.3 97.9 B 92.7 95.0 96.9 97.1 0 90.2 94.1 97.1 99.2 I 92.8 97.3 98.5 98.5 B 93.9 96.1 97.2 96.6 0 91.2 95.7 CJ7 8 CJ8 2 I 94.3 ~2.4 92.3 94.7 B 93.2 92. 1 93.1 92.6 0 92.4 93.8 95.2 95.2 I 91.6 92.9 94.1 95.9 B 93.6 93.6 94.0 96.0 0 94.0 95.0 96.4 96.9 I 92.1 92.9 98.2 95.0 B 93.2 92.6 92.7 95.5 0 94.4 95.1 95.9 96.6 I 85.4 94.2 98.8 100.0 B 81.1 95.4 98.0 98.8 0 81.3 93.7 98.3 99.6 I 78.9 94.0 98.4 99.9 B 79.7 95.4 97.3 98.3 0 79.4 94.1 98.5 99.9 I 94.0 94.4 98.1 100.0 B 95.2 95.1 98.0 98.8 0 94."1 94.9 CJ8.2 100 1 I 94.1:l 97.3 97.2 97.5-B 95.0 94.6 94.6· 95.9 0 95.6 96.5 97.1 97.7 I 93.5 96.7 97.3 98.4 B 92.1 95.3 94.6 96.2 0 91.9 96.2 96.6 98.2 I 91.9 95.3 94.9 97.8 B 91.0 95.3 94.9 97.8 0 91 0 96.0 q7.0 99 0 I 94.8 95.1 9·5.u B 91.3 93.9 94.9 94.7 0 90.8 93.5 95.3 95.2 I 89.0 92.9 94.5 94.4 B 89.2 91.6 93.2 93.1 0 89.5 93.5 95.8 95.4 I 89.4 92.7 92.8 94.3 B 92.0 92.7 ~~:~ 94.9 0 88 7 Q':! ~
1 Year 2 Years
90.5 90.0 90.1 89.5 89.7 89.4 89.6 90.7 89.4 90.0 88.8 89.1 90.2 89.7 90.5 91.1 qJ_<; Gl R 95.3 94.6 89.7 94.9 95.7 96.0 93.5 94.4 93.3 93.7 95.7 95.0 94.5 95.5 96.4 98.2 95.6 CJ6.o 9!!.4 9!!.7 97.7 98.2 98.2 99.2 98.6 99.2 98.1 97.6 98.7 98.8 99.1 98.8 98.3 98.0 CJ8 il CJCJ.2 94.b 94.2 94.9 94.6 96.2 96.6 95.9 95.9 96.2 95.6 97.9 97.7 95.5 95.5 95.2 95.2 97.1 97.9 99.8 99.8 99.6 98.7
101.3 101.5 100.8 100.7 99.2 97.9
101.0 100.5 101.1 101.4 99.6 99.3
.. IOO.G _l_Q2, 7 98.3 98.5 95.3 95.4 97.1 98.1 98.5 99.2 96.5 96.8 97.9 98.4 97.5 98.5 97.5 98.5 qq I 9CJ.5 94.3 94.b 94.7 94.8 94.8 95.6 94.3 94.8 93.7 93.8 96.3 95.3 94.4 95.9 ~~:~ ~~~~
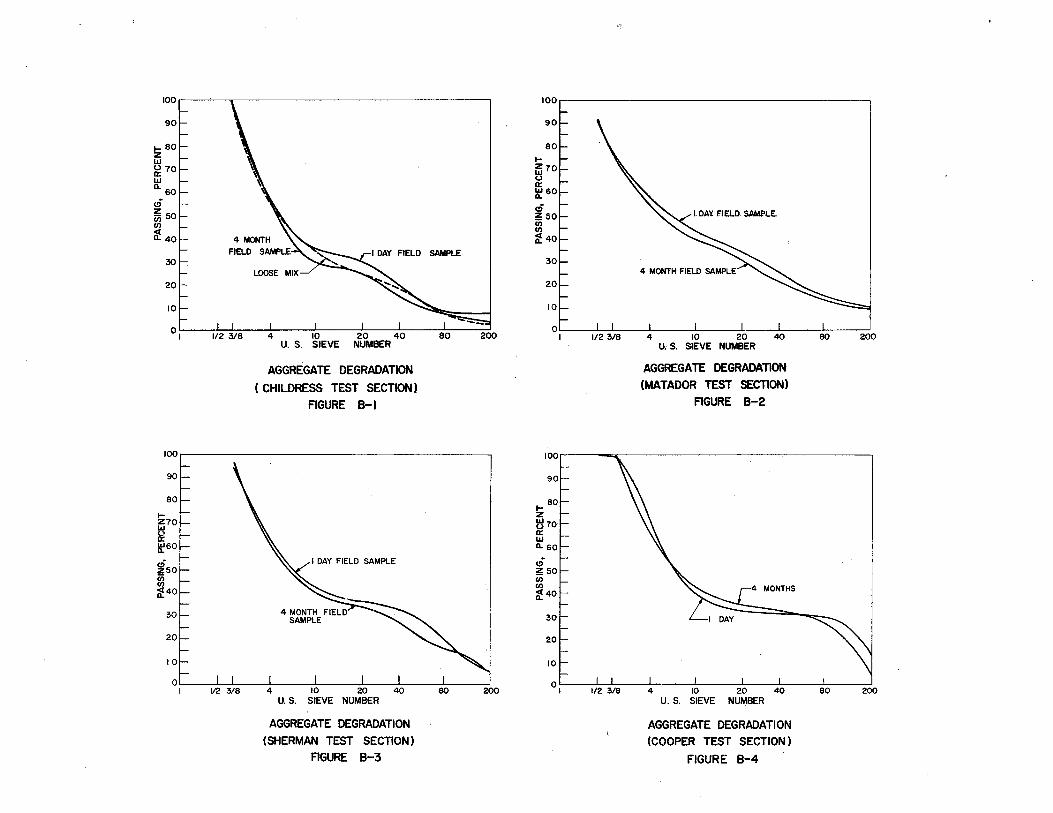
IOOr---~--~--------------------------------------,
.... 80 z IJJ ~ 70 IJJ Q.60
(!)
~50 (/)
if 40
30
20
10
SAMPLE
01 --- --- -- -- -- -- --U.S.
AGGREGATE DEGRADATION
( CHILDRESS TEST SECTION)
FIGURE B-1
I DAY FIELD SAMPLE
u.s.
AGGREGATE DEGRADATION (SHERMAN TEST SECTION)
AGURE B-3
200
100.-----------------------------------------------,
~50 (/) (/)
if 40
30
20
10
(!)
~50 (/) (/)
if 40
30
20
10
1/2 3/8 4 10 20 40 U. S. SIEVE NUMBER
AGGREGATE DEGRADATION (MATADOR TEST SECTION)
FIGURE B-2
80 200
O I 1/2 3/8 4 10 20 40 80 200 U. S. SIEVE NUMBER
AGGREGATE DEGRADATION (COOPER TEST SECTION)
FIGURE B-4
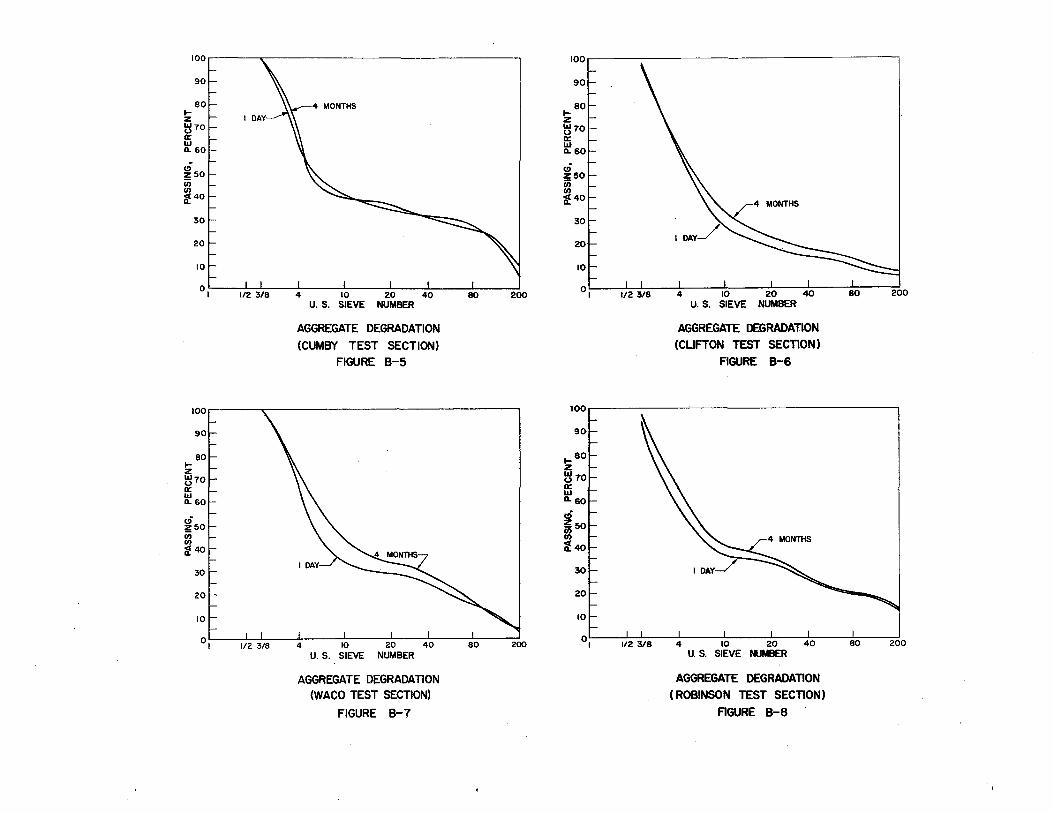
r.5 ~50 rn rn jf40
30
10 20 40 U. S. SIEVE NUMBER
AGGREGATE DEGRADATION
(CUMBY TEST SECTION) FIGURE B-5
u.s.
AGGREGATE DEGRADATION (WACO TEST SECTION)
FIGURE B-7
80 200
r9 Z50 u; rn if 40
112 3/8
u.s.
AGGREGATE DEGRADATION (CLIFTON TEST SECTION)
FIGURE B-6
4 10 20 U. S. SIEVE NUMBER
AGGREGATE DEGRADATION
(ROBINSON TEST SECTION)
FIGURE B-8
200
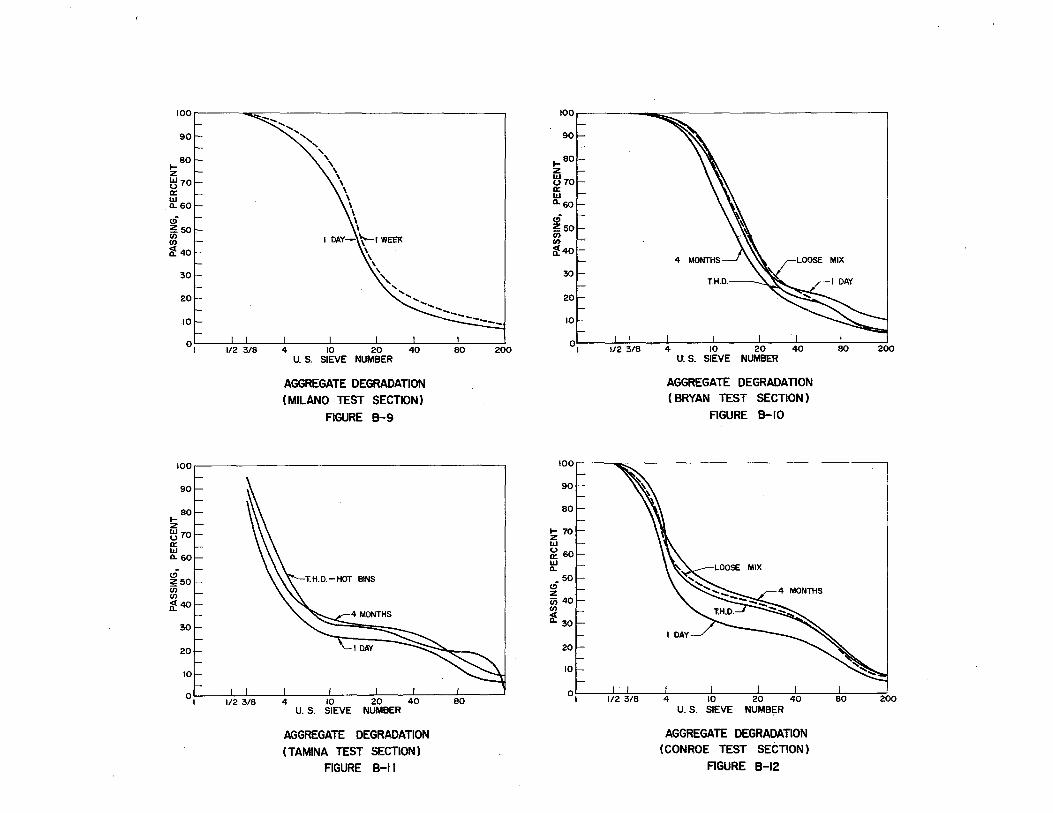
C!S ~50 •. U) U)
~ 40
30
20
10
,......._ ................ ,
', ', ' ' \ ' \ \
\ \ \
I DAY-~\-----1 WEEK \
' ' ',,
u.s.
' ............... --
AGGREGATE DEGRADATION (MILANO TEST SECTION)
FIGURE B-9
10 U.S. SIEVE
AGGREGATE DEGRADATION ( TAMINA TEST SECTION)
FIGURE B-11
...... ... _ -----200
U.S.
AGGREGATE DEGRADATION ( BRYAN TEST SECTION)
FIGURE B-10
u.s.
AGGREGATE DEGRADATION (CONROE TEST SECTION)
FIGURE B-12
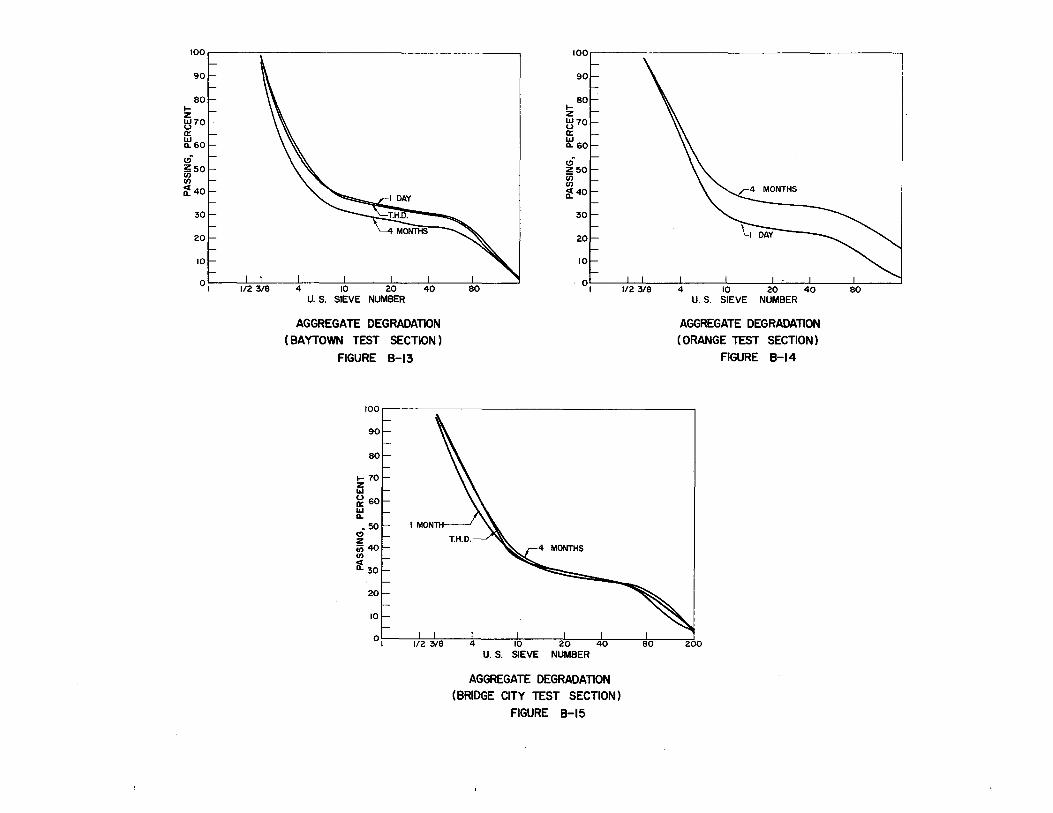
u.s.
AGGREGATE DEGRADATION (BAYTOWN TEST SECTION)
FIGURE B-13
u. 5. 20
NUMBER
AGGREGATE DEGRADATION (BRIDGE CITY TEST SECTION)
FIGURE B-15
4 10 20 40 U. 5. SIEVE NUMBER
AGGREGATE DEGRADATION (ORANGE TEST SECTION)
FIGURE B-14
eo

APPENDIX C
147
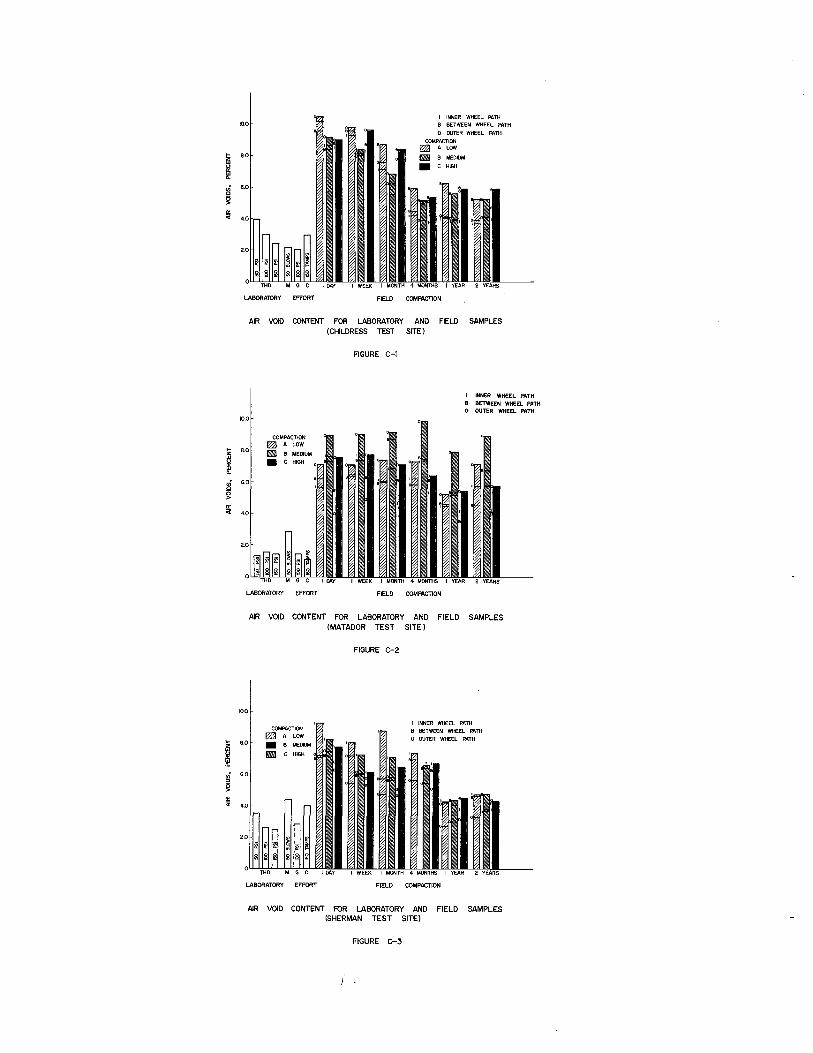
~ "' i5 .. <Ji
~ 0: <!
10.0
LABORIIJORY EFFORT
AIR VOID CONTENT
COMPACTION
r0J A LOW 80 1mB 8 MEOIUM • C HIGH
6.0
4.0
LABORATORY EFFORT
I IN~R WHEEL PATH B BETWEEN WHEEL PATH 0 OUTER WHEEL PATH
COMPACTION ~ A LOW
m\m B MEDIUM
• C HIGH
FIELD COMPACTION
FOR LABORATORY (CHILDRESS TEST
FIGURE C-1
AND SITE)
FIELD
FIELD COMPACTION
SAMPLES
INNER WHEEL PATH BETWEEN WHEEL PATH
0 OUTER WHEEL PATH
AIR VOID CONTENT FOR LABORATORY AND FIELD SAMPLES (MATADOR TEST SITE)
20
COMPACTION
~ A LOW
• B MEiliUo1
1!11!!1 C HIGH
LABORATORY EFFORT
FIGURE C-2
FIELD COMPACTION
AIR VOID CONTENT FOR LABORATORY AND FIELD SAMPLES (SHERMAN TEST SITE)
FIGURE C-3
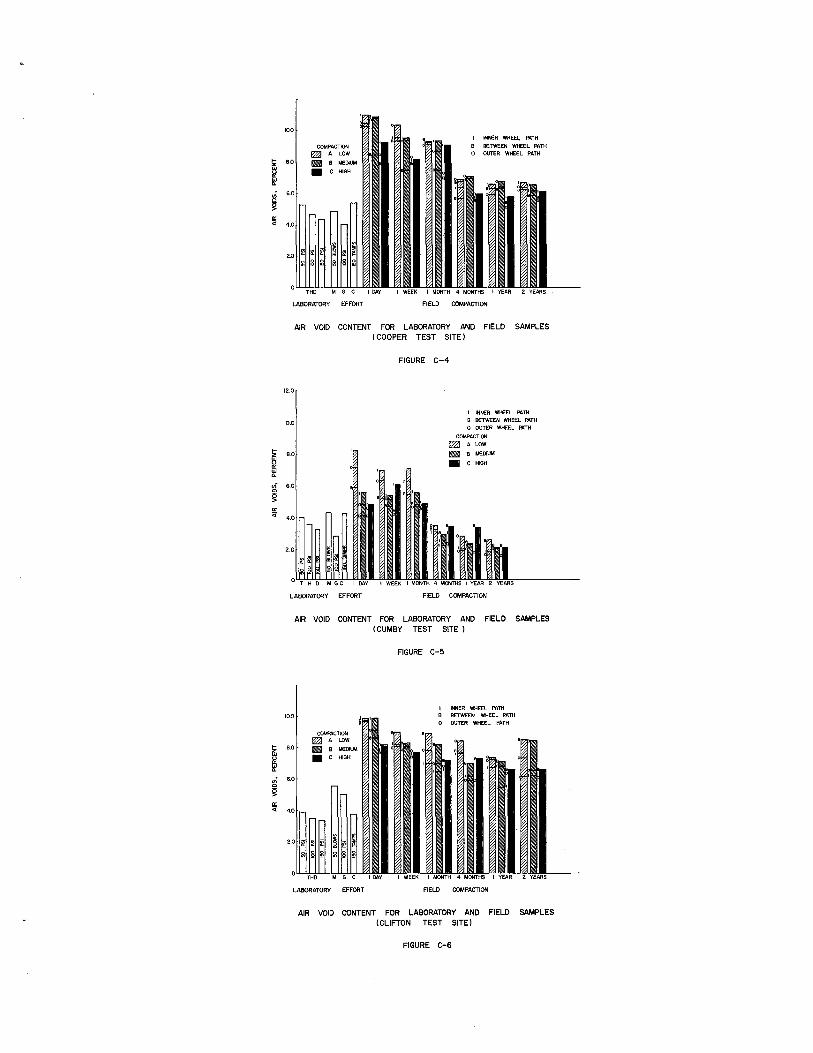
... z l'j 0: w 0.
<ti Q
§! g;
"'
ffi " 0: w 0.
i g
~
10.0
COMPACTION ~ A LOW
~ 8 MEDIUM
• C HIGH
LABORATORY EFFORT FIELD COMPACTION
AIR VOID CONTENT FOR LABORATORY AND FIELD SAMPLES (COOPER TEST SITE)
FIGURE C-4
12.0
I INNER WI-£EL PATH
10.0 8 BETWEEN WHEEL PATH 0 OUTER WI-£EL PATH
COMPACTION
fZll A LOW
8.0 lilll1l 8 MEOIUM
• c HIGH
6.0
4.0
2.0
0 THD MGC IOAY IWEEK
LABORATORY EFFORT FIELD COMPACTION
AIR VOID CONTENT FOR LABORATORY AND FIELD SAMPLES (CUMBY TEST SITE )
FIGURE C-5
I INNER WHEEL PATH 10.0
i ' B BETWEEN WHEEL PATH 0 OUTER WtEEL PATH
COMPACTION
~ A LOW 8.0 ~ 8 MEOILO.\
• c HIGH
6.0
4.0
2.0 ~ ~
8 a
THO " G c
LABORATORY EFFORT FIELD COMPACTION
AIR VOID CONTENT FOR LABORATORY AND FIELD SAMPLES (CLIFTON TEST SITE l
FIGURE C-6
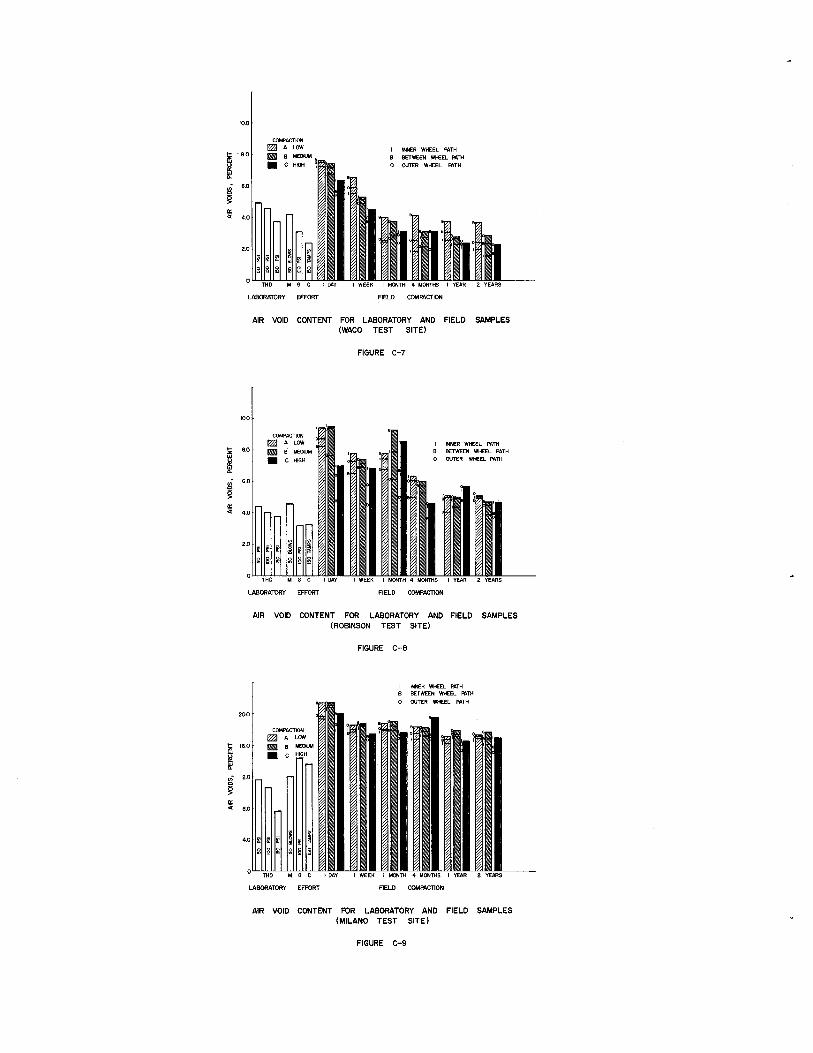
COMPACTION ~ A LOW mlJ B MEDIUM
• C HIGH
l INNER WI£EL PATH B BETWEEN WI£El PATH 0 OUTER WHEEL PATH
~ 4.0
!z s Q.
~ ~ 0:
"
1-
ill (.) 0:
"' Q.
.;
~ 0:
"
2.0
LABORATORY EFFORT FIELD COMPACTION
AIR VOID CONTENT FOR LABORATORY AND FIELD SAMPLES (WACO TEST SITE)
FIGURE C-7
10.0
COMPACTION
a>J A LOW 8.0 mm B MEDIUM
• C HIGH
6.0
4.0
2.0
LABORATORY EFFORT FIELD COMPACTtoN
20.0
[6.0
12.0
8.0
4.0
AIR VOID CONTENT FOR LABORATORY AND FIELD SAMPLES (ROBINSON TEST SITE)
FIGURE C-8
INNER WI£El PATH B BETWEEN WI-EEL PATH 0 OUTER WHEEL PATH
COMPACTION
rn A LOW
mm B
• c
lllD 2 YEARS
LABORATORY EFFORT FlELD COMPACTION
AIR VOID CONTENT FOR LABORATORY AND FIELD SAMPLES (MILANO TEST SITE)
FIGURE C-9
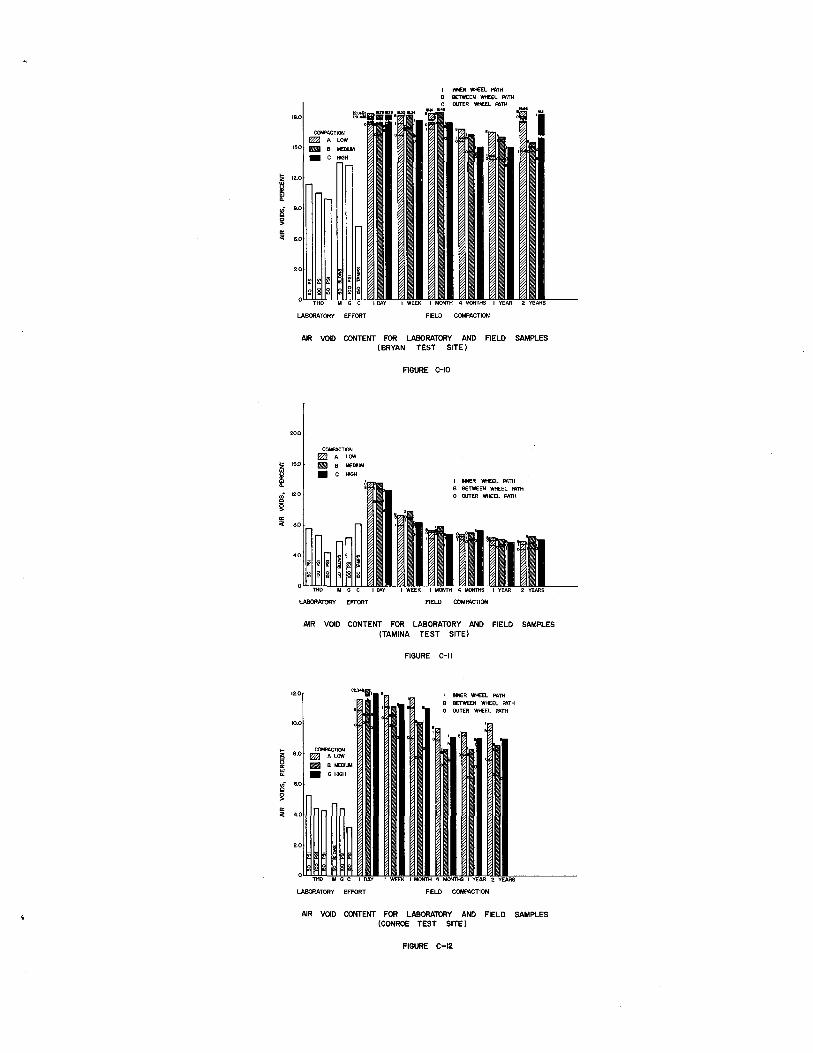
I INNER WHEEL PATH 8 BETWEEN wt£EL PATH 0 OI.JTER WHEEL PATH
LABORATORY EFFORT FIELD COMPACTION
AR VOID CONTENT FOR LABORATORY AND FIELD SAMPLES (BRYAN TEST SITE)
FIGURE C-10
20.0
.. 12.0
~
I N£R WHEEL PATH BETWEEN WHEEL PATH OUTER WHEEL PATH
~ 8.0
4.0
LABORATORY EFFORT FIELD COMPACTION
AIR VOID CONTENT FOR LABORATORY AND FIELD SAMPLES (TAMINA TEST SITE)
LABORATORY EFFORT
FIGURE C-11
I N£R WHEEL PATH BETWEEN WHEEL PATH OUTER Wt£EL PATH
FELO COMPACTION
AIR VOID CONTENT FOR LABORATORY AND FIELD SAMPLES (CONROE TEST SITE)
FIGURE C-12
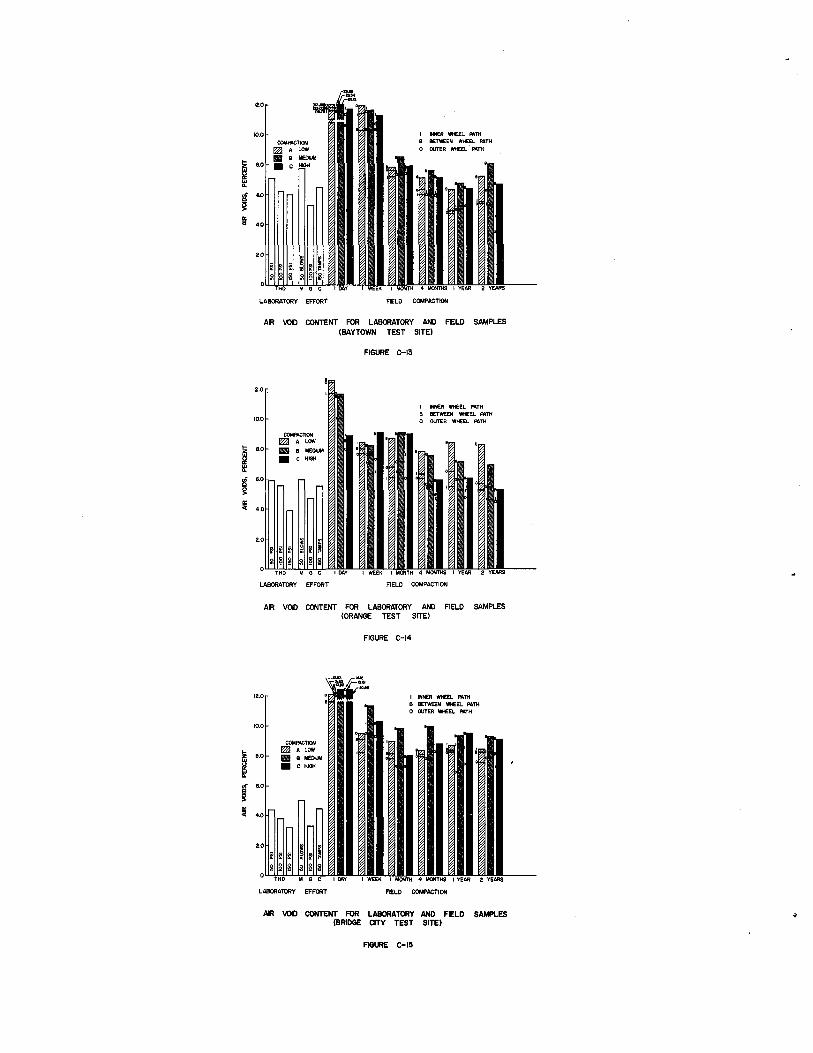
2.0
COMPACTION ~ALOW
IIIII• • c
LABORATORY EFFORT
HER WHEEL Ari.TH BETWEEN WHEEL PATH OUTER WHEEL PATH
FIELD COMPACTION
AIR \00 CONTENT FOR LABORATORY AND FELD SAMPLES
LABORATORY EFFORT
(BAYTOWN TEST SITE)
FIGURE C-13
INNER wt£El PATH BETWEEN WIEEL PATH
0 OUTER Wt£EL PATH
FIELD COMPACTION
AIR VOO CONTENT FOR LABORJQ"ORY AND FIELD SAMPLES
COMPACTION ~A LOW
1111111•• C HIGH
LABORATORY EFFORT
(ORANGE TEST SITE)
FIGURE C-14
FIELD COMPACTION
AIR \101) CONTENT FOR LABORATORY AND FELD SAMPLES (BRIDGE CITY TEST SITE)
FIGLM: C-15