Embed Size (px)
Citation preview

Winter 2018 Volume XLI, No. 4
COMMUNITY RESEARCH QUARTERLYA Socio-Economic Review
FairbanksNorthStarBorough
Community Planning DepartmentCommunity ResearchPO Box 71267Fairbanks, Alaska 99707-1267(907) 459-1260

COMMUNITY RESEARCHThe Department of Community Planning is located on the second floor
of the Juanita Helms Administration Centerat 907 Terminal Street.
CITATIONTabular and summary information contained herein may be reproduced without special permission. It is requested that anyinformation reproduced be cited as follows: Fairbanks North Star Borough, Department of Community Planning, Community ResearchQuarterly, Vol. XLI, No. 4, 2018.
ACKNOWLEDGMENTSThe Department of Community Planning would like to thank the many persons, businesses, government agencies and organizationswho contributed to this report. FNSB has established a policy of equal opportunity in employment, service, programs and activities.
COVER PAGESanta photo taken by Stephanie Pearson, Community Research Technician of the Fairbanks North Star Borough, Department ofCommunity Planning.

FAIRBANKS NORTH STAR BOROUGH
COMMUNITY RESEARCH QUARTERLYA Review of Socio-Economic Trends
Volume XLI, Number 4Winter 2018
Oct. – Dec.
BOROUGH MAYORBryce J. Ward
COMMUNITY PLANNING DEPARTMENTD. Christine Nelson, Director
Kellen Spillman, Deputy Director
COMMUNITY RESEARCHStephanie Pearson, Community Research Technician
Fairbanks North Star Borough, Community Planning DepartmentPO Box 71267, Fairbanks, Alaska 99707-1267
Phone: (907) 459-1260E-mail: [email protected]
WEBSITE: http://fnsb.us/cp/Pages/crq.aspx
© 2018

a Winter 2018 Community Research Quarterly
Table of Contents
Page
A Spotlight on Community Economic Trends i-iii
Fairbanks Economy at a Glance 1-2
Economic Indicators 3-15Bank Deposit & Loan Summary 3Bankruptcies Filed 4Foreclosures and Notices of Default 5-6Fairbanks International Airport Freight 7Fairbanks International Airport Transit Freight 8Fairbanks International Airport Revenue Landings 9Fairbanks International Airport Passengers 10Hotel / Motel Room Receipts 11Quarterly Hotel / Motel Room Receipts 11Annual Hotel / Motel Room Receipts 12Marijuana Sales Tax Revenue 13Marijuana Excise Tax Revenue 14University of Alaska Museum Visitors 15
Employment 16-21Civilian Labor Force Unemployment Rates 16-17Average Monthly Employment Estimates by Sector 17Average Monthly Employment Estimates by Industry 18Annual Average Monthly Employment by Industry 19Annual Average Monthly Wage by Industry 20Quarterly Census of Employment and Wages by Industry 21
Housing 22-27Apartment/Multi-Plex Vacancy Rates 22Rental Housing Units Available 23Average Monthly Rents for Available Housing Units 24Residential Housing Sales 25Annual Average Residential Housing Sales 26New Structures Annual Report 27
NEW
NEW
NEW

Table of Contents
Community Research Quarterly Winter 2018 b
Page
Cost of Living 28-32C2ER Cost of Living Index 28-29Consumer Price Index-U for All Items 29Consumer Price Index-U (Anchorage) 30Consumer Price Index-U for All Items (U.S. City Average) 30Cost of Food at Home for a Week 31Average Self-service Unleaded Gasoline Prices 32
Population & Social Conditions 33-41Population Counts & Estimates 33Military Population 34Vital Statistics 35Birth, Death, Marriage & Divorce Rates 36College Degrees Awarded 37Opening Fall Semester headcounts for Credit Enrollment, University of Alaska 37Fall Public School Enrollments 38Private School Enrollments 39Alaska Statewide Correspondence School Enrollments 39Alcoholic Beverages Distributed or Sold 40Annual Alcoholic Beverages Distributed or Sold 41
NOTE FROM THE EDITOR:
The Fairbanks North Star Borough has chosen to move the Community Research Quarterly to a digital format in order to help reduce paper use. A hard copy of the Community Research Quarterly can now be purchased for $10 at the Fairbanks North Star Borough, Community Planning Department's front counter.
PLEASE NOTE:
These documents contain links to websites outside the Fairbanks North Star Borough Web Server. The Fairbanks North Star Borough has no control over the contents posted on any linked external web sites and these sites may have separate terms of use and privacy policies. The inclusion of this web link does not imply endorsement by the Fairbanks North Star Borough of the site, its content, advertisers or sponsors.

i Winter 2018 Community Research Quarterly
A SPOTLIGHT
ON
COMMUNITY ECONOMIC TRENDS
SPOTLIGHT SOURCE: Construction spending forecasted to rise 10%By Elwood Brehmer, Alaska Journal of Commerce, Jan. 30, 2019.
Elwood Brehmer can be reached at [email protected]
Read more at the Alaska Journal of Commerce website: http://www.alaskajournal.com

Community Research Quarterly Alaska Journal of Commerce Winter 2018 ii
Employees with Cruz Construction work on the Tok Cutoff culvert replacement in 2017.
Public construction spending is expected to increase 7 percent this year. (Photo/courtesy/Cruz Construction)
The coming year should be better than last for Alaska’s construction industry and the state economy as a whole.
Construction spending across the state is expected to increase about 10 percent this year over last to a grand total of more than $7.2 billion, according to the Associated General Contractors of Alaska’s annual industry forecast.
AGC of Alaska Executive Director Alicia Siira said the trade group is “cautiously optimistic” about 2019 after some very tough times.
“Our industry has really taken a beating over the past few years with this recession and we could really use some good news,” Siira said. “We’re hopeful this trend continues and we start to see some dollars moving through the state to help support the economy.”
Alaska’s construction workforce averaged a little more than 15,000 workers the past two years and employment levels that low hadn’t been seen since 2001-02, according to state Labor Department data. The industry was doubly hit by Alaska’s three-year oil price-induced recession. Not only did oil companies sharply curtail capital spending, but the state also cut its capital budget allocations from more than $2 billion to less than $200 million in recent years.
Restoring some of that state capital spending is a top priority for AGC.
State economists expect Alaska to officially climb out of the recession towards the end of the year. The construction industry is correspondingly expected to add roughly 900 jobs in 2019.
Most of the spending growth is expected to come via the oil and gas industry and Department of Defense projects at Interior military installations. Both sectors are pegged for 13 percent growth; however, in oil and gas that means an increase to $2.7 billion and roughly $700 million overall for Alaska Defense spending in 2019.
Construction spending forecasted to rise 10% ELWOOD BREHMER, ALASKA JOURNAL OF COMMERCE Jan. 30, 2019 -2:35pm
iii Winter 2018 Alaska Journal of Commerce Community Research Quarterly
On the oil side, many companies have managed to reduce their operating costs to where they can afford to resume investing in larger projects at current prices in the $60-70 range — a price band that is being predicted for several years. The discovery of the now-prolific Nanushuk oil formation on the North Slope has also spurred some oil prospects with development costs pegged at upwards of $5 billion. As a result, oil industry spending is projected to increase for several years, according to the forecast.
Military construction in the state continues to center on Eielson Air Force Base near Fairbanks, which is readying for two new squadrons of F-35 fighters that are planned to start arriving in 2020.
“Some of the larger elements of the (F-35) ‘bed-down’ are a flight simulator, new maintenance buildings, aircraft weather shelters, new utilidor, as well as renovation of many existing structures,” the forecast states.
Additional missile defense projects are ongoing at Fort Greeley near Delta Junction and Clear Air Force Station near Nenana.
While not as significant in terms of overall dollars, the mining industry is projected to increase its capital spending by 18 percent this year to $265 million as three of Alaska’s six big large mines — Red Dog in the Northwest and Pogo and Fort Knox in the Interior — have major expansions planned.
Siira said she is hopeful political forces will continue to support the resource industries.
“For increased spending to continue we feel that we need some stability in our stat and timely review of resource development projects which support the economy and, of course, construction spending,” she said.
Overall private industry spending is expected to be about $4.4 billion, a 9 percent year-over-year increase; Alaska public construction expenditures should grow about 7 percent, with about $200 million or more coming as a result of the Nov. 30 earthquake.
“Our industry, both vertical and road construction, did see an increase in activity due to the earthquake and although it was unfortunate, it maybe highlighted some of the projects that have been overlooked over the years,” Siira noted.
She added that private building damage from the earthquake is more difficult to quantify.
State and local government officials have emphasized since the earthquake that additional damage will likely be revealed with the arrival of spring.
Longer term, the state still has a $2 billion-plus deferred maintenance list that it must address and new cost estimates to rehabilitate the Anchorage port have shot up dramatically to nearly $2 billion as well.
Elwood Brehmer can be reached at [email protected].

Community Research Quarterly Winter 2018 iv
COMMUNITY RESEARCH QUARTERLY
of the
FAIRBANKS NORTH STAR BOROUGH

1 Winter 2018 Community Research Quarterly
ECONOMY AT-A-GLANCE
Economic Indicators 4th Qtr '18 % Change from Prev Qtr
% Change from Prev Yr
BANKING Total Bank Deposits (millions of $) $813.7 -2.0% -32.6% Total Bank Loans (millions of $) $600.0 4.3% -8.9%
BANKRUPTCIES Business 2 100.0% 100.0% Non-Business 56 300.0% 229.4%
TRANSPORTATION Fairbanks International Airport Incoming Freight (thousands of lbs.) 1,906 -2.0% -4.1% Outgoing Freight (thousands of lbs.) 6,133 -38.8% 6.2% Transit Freight (thousands of lbs.) 34 21.4% -85.3% Revenue Landings 4,621 -26.2% -10.3% Incoming Passengers 124,982 -30.8% -0.7% Outgoing Passengers 132,859 -25.5% 0.9%
Employment 4th Qtr '18 % Change from Prev Qtr
% Change from Prev Yr
EMPLOYMENT Total Nonfarm Employment 37,000 -4.9% 0.5% Mining and Logging 700 -12.5% -12.5% Construction 2,700 -12.9% -3.6% Manufacturing 600 -14.3% 0.0% Trade/Transportation/Utilities 7,400 -7.5% -2.6% Information 400 0.0% -20.0% Financial Activities 1,100 -8.3% -8.3% Professional & Business Services 2,600 0.0% 23.8% Education & Health Services 5,600 -1.8% 0.0% Leisure & Hospitality 4,100 -19.6% 13.9% Other Services 1,000 0.0% 0.0% Government 10,700 3.9% -2.7%
Fairbanks North Star Borough
SOURCE: FNSB Community Research Quarterly: (see table of contents for source data page) Bank Deposit & Loan Summary, Total Bankruptcies Filed, Fairbanks International Airport Freight, Fairbanks International Airport Transit Freight, FairbanksInternational Airport Revenue Landings, Fairbanks International Airport Passengers, Average Monthly Employment Estimates By IndustryNOTE: Employment numbers rounded to nearest 100.

Fairbanks Economy at-a-Glance
Community Research Quarterly Winter 2018 2
Housing 4th Qtr '18 '% Change from Prev Qtr
'% Change from Prev Yr
REAL ESTATE Single Family Houses Number Sold 264 -29.4% -5.0% Average Price $227,435 -5.5% 8.7%
RENTALS Residential Rentals Rental Units Advertised 634 30.2% 24.8% Average Rent (2 bdrm. apartment) $1,158 -1.1% 1.9%
Housing 2018 % Change from Prev Yr
CONSTRUCTIONNew Structures Annual Report 258 - 21.1%
Population 2017 % Change from Prev Yr
POPULATION **U.S. Census Annual Estimates FNSB* 99,703 - -0.9% City of Fairbanks 31,644 - -3.4% City of North Pole 2,101 - -5.9%AK Dept of Commerce, Community & Economic Dev FNSB* 97,738 - -1.2%AK Dept of Labor and Workforce Development FNSB* 97,738 - -1.2% City of Fairbanks 31,905 - -0.2% City of North Pole 2,124 - -1.0%
(continued)Fairbanks North Star Borough
SOURCE: FNSB Community Research Quarterly: (see table of contents for source data page) Residential Housing Sales, Rental Housing Units Available, Average Monthly Rents for Available Housing Units, New Structures by Unit Annual Report, Population Counts and Estimates.* The FNSB numbers include population for all communities within the Borough plus Fort Wainwright Army Base and Eielson Air Force Base. ** U.S. Census and ADOL estimated numbers may be revised annually.

3 Winter 2018 Community Research Quarterly
2011 2012 2013 2014 2015 2016 2017 2018*
DepositsMarch 31 $938.3 $957.0 $1,007.8 $1,063.7 $1,083.7 $1,191.4 $1,168.3 $1,190.6June 30 $929.3 $983.6 $1,023.2 $1,064.6 $1,131.5 $1,160.7 $1,154.7 $804.9Sept. 30 $966.3 $1,021.4 $1,064.8 $1,075.3 $1,165.1 $1,191.3 $1,200.3 $830.1Dec. 31 $960.3 $1,014.6 $1,073.7 $1,105.7 $978.5 $1,164.0 $1,207.1 $813.7LoansMarch 31 $646.9 $619.5 $675.3 $655.9 $680.1 $673.3 $636.4 $663.8June 30 $651.6 $644.7 $681.8 $657.7 $687.2 $645.4 $654.2 $508.8Sept. 30 $636.1 $685.6 $669.8 $663.1 $655.4 $614.0 $661.6 $575.1Dec. 31 $636.7 $679.1 $662.8 $668.9 $683.1 $619.0 $658.9 $600.0
ECONOMIC INDICATORS
Fairbanks North Star Borough2011-2018
BANK DEPOSIT & LOAN SUMMARY
-------------------------------------------Millions of Dollars----------------------------------------------------
-------------------------------------------Millions of Dollars----------------------------------------------------
Fairbanks North Star Borough2011-2018, End of Quarter
BANK DEPOSIT & LOAN SUMMARY
SOURCE: Denali State Bank, First National Bank of Alaska, Mt. McKinley Bank, Northrim Bank, personal communications 2011-2018.* Wells Fargo Bank data no longer included; their data is now grouped as Northern Alaska rather than by Borough. Withdrawn from the Bank Deposit & Loan Survey 10/5/18.
0.0
10.0
20.0
30.0
40.0
50.0
60.0
70.0
80.0
1 2 3 4 1 2 3 4 1 2 3 4 1 2 3 4 1 2 3 4 1 2 3 4 1 2 3 4 1 2 3 4
Loan-to-Deposit Ratio
2016 2017 201820132012 201520142011

Economic Indicators
Community Research Quarterly Winter 2018 4
2011 2012 2013^ 2014 2015 2016 2017 2018Nonbusiness 1st Quarter 40 24 28 14 6 6 15 16 2nd Quarter 37 26 26 14 12 21 15 11 3rd Quarter 35 31 13 20 14 12 12 14 4th Quarter 33 20 8 12 14 16 17 15Total 145 101 75 60 46 55 59 56% Change from Previous Year 18% -30% -26% -20% -23% 20% 7% -5%
Business 1st Quarter 0 0 0 2 0 0 3 0 2nd Quarter 1 0 0 0 1 2 0 0 3rd Quarter 0 0 2 1 0 0 0 1 4th Quarter 0 1 2 2 1 0 1 1Total 1 1 4 5 2 2 4 2% Change from Previous Year -95% 0% 300% 25% -60% 0% 100% -50%
Combined Annual Total 146 102 79 65 48 57 63 58
2011-2018
2011-2018
TOTAL BANKRUPTCIES FILEDAlaska Fourth Judicial District, Fairbanks Office
BANKRUPTCIES FILEDAlaska Fourth Judicial District, Fairbanks Office
020406080
100120140160
2011
2012
2013
2014
2015
2016
2017
2018
Combined Bankruptcies
SOURCE: Personal communications with FNSB Treasury & Budget Division, 2011-2018.NOTE: Revised formulas and chart, November 18, 2013.
^ 3rd Quarter 2013 numbers were changed to remove count of bankruptcy appeal case and correct a miscount in business cases.

Economic Indicators
5 Winter 2018 Community Research Quarterly
2012 2013 2014 2015 2016 2017 2018 % Change 2017-18
January 8 30 29 9 17 17 28 65%February 20 20 18 20 11 18 11 -39%March 25 13 12 11 18 25 18 -28%April 14 16 17 17 10 12 12 0%May 26 18 17 12 11 12 20 67%June 24 16 29 13 17 13 19 46%July 23 25 15 18 13 16 21 31%August 22 24 15 12 20 17 29 71%September 27 17 18 14 9 17 22 29%October 21 19 19 7 4 16 27 69%November 12 19 15 13 11 12 8 -33%December 12 33 22 8 10 12 16 33%Total 234 250 226 154 151 187 231 24%
2012 2013 2014 2015 2016 2017 2018 % Change 2017-18
January 14 19 21 17 8 9 7 -22%February 11 9 6 9 5 15 7 -53%March 18 7 24 20 8 9 12 33%April 9 22 13 8 8 12 11 -8%May 18 14 13 15 14 8 13 63%June 10 6 19 17 14 25 6 -76%July 17 22 20 19 10 15 9 -40%August 12 25 16 13 13 12 18 50%September 8 13 18 21 12 32 9 -72%October 9 27 15 19 19 8 19 138%November 18 16 16 9 6 12 17 42%December 18 13 15 11 14 13 14 8%Total 162 193 196 178 131 170 142 -16%
NOTICES OF DEFAULTFairbanks Recording District
2012-2018
2012-2018
FORECLOSURESFairbanks Recording District
SOURCE: Recorder's Office, Alaska Department of Natural Resources website: http://www.dnr.alaska.gov, 2012-2018.NOTE: Foreclosures in this table indicate the loss of property by a borrower as a result of an Affidavit of Foreclosure, Deed in Lieu of Foreclosure, Relinquishment, Trustee Deed, or Judicial Deed of Foreclosure. More than a single parcel may be affected by the foreclosure. Current data supersedes previous figures reported.
SOURCE: Recorder's Office, Alaska Department of Natural Resources website: http://www.dnr.alaska.gov, 2012-2018.NOTE: Current data supersedes previous figures reported. The data presented only reflects the number of notice of defaults that have been recorded and does not reflect any effect of amendments, modifications or terminations of notice of defaults.

Economic Indicators
Community Research Quarterly Winter 2018 6
Annual Foreclosures & Notices of DefaultFairbanks Recording District
Quarterly Foreclosures & Notices of DefaultFairbanks Recording District
2014-2018
2014-2018
0
50
100
150
200
250
2014 2015 2016 2017 2018
NOTICES OF DEFAULT
FORECLOSURES
0
10
20
30
40
50
60
70
80
1st 2nd 3rd 4th 1st 2nd 3rd 4th 1st 2nd 3rd 4th 1st 2nd 3rd 4th 1st 2nd 3rd 4th
NOTICES OF DEFAULT
FORECLOSURES
2014 2015 2016 20182017

Economic Indicators
7 Winter 2018 Community Research Quarterly
2012 2013 2014 2015 2016 2017 2018 % Change 2017-18
Incoming January 307 449 418 369 421 942 473 -50%February 500 425 467 366 469 412 558 36%March 587 470 554 455 503 504 642 27%April 557 618 604 485 492 475 768 62%May 680 622 649 521 588 853 726 -15%June 663 600 517 1,156 595 594 572 -4%July 698 728 841 770 585 640 617 -4%August 759 814 759 705 829 615 696 13%September 707 750 715 664 1,278 572 632 11%October 699 635 700 548 589 663 691 4%November 574 460 483 513 490 602 650 8%December 599 425 580 524 667 723 565 -22%
Total 7,330 6,996 7,287 7,076 7,506 7,595 7,591 0%
Outgoing January 2,666 1,871 2,205 1,464 2,034 2,118 1,660 -22%February 2,590 2,365 2,561 1,721 1,819 1,983 2,061 4%March 2,721 1,394 2,578 2,140 2,088 2,395 2,003 -16%April 2,670 2,781 2,711 7,369 1,987 2,433 2,240 -8%May 4,112 3,162 3,421 3,747 2,455 2,825 3,028 7%June 3,574 3,740 2,973 3,203 3,652 3,703 3,074 -17%July 3,830 3,658 3,268 3,980 3,480 3,606 3,486 -3%August 3,956 3,619 3,057 3,516 3,718 3,681 3,587 -3%September 4,143 3,003 3,130 3,125 3,702 3,561 2,952 -17%October 2,857 3,043 2,782 3,662 2,602 2,664 2,624 -2%November 2,310 1,982 2,091 1,558 1,747 1,714 1,790 4%December 2,725 2,203 1,812 1,749 1,970 1,399 1,720 23%
Total 38,154 32,821 32,589 37,234 31,254 32,082 30,224 -6%
FAIRBANKS INTERNATIONAL AIRPORT FREIGHT2012-2018
-------------------------------------Thousands of Pounds------------------------------------------
-------------------------------------Thousands of Pounds------------------------------------------
SOURCE: Alaska Department of Transportation and Public Facilities, Fairbanks International Airport, "Fairbanks International AirportStatistical Report", 2012-2018.NOTE: Fluctuations in Freight numbers are unpredictable from month to month. Factors that may influence Freight numbers could includefire, flooding, storms and regional construction projects.This data is preliminary and may be subject to revision.

Economic Indicators
Community Research Quarterly Winter 2018 8
2013 2014 2015 2016 2017 2018 % Change 2017-18
January 631 313 8 4 185 5 -97%February 270 219 15 72 - 118 -March 670 664 226 5 9 12 30%April 276 86 8 5 10 10 -5%May 291 107 9 6 7 6 -13%June 109 97 19 8 15 7 -57%July 250 295 7 10 17 7 -59%August 215 16 14 16 22 13 -41%September 40 21 9 312 5 8 60%October 151 83 73 13 207 9 -96%November 469 67 93 9 7 7 -1%December 323 4 72 115 17 18 4%
Total 3,695 1,972 553 575 501 218 -56%
FAIRBANKS INTERNATIONAL AIRPORT TRANSIT FREIGHT2013-2018
FAIRBANKS INTERNATIONAL AIRPORT TRANSIT FREIGHT2013-2018
'-------------------------Thousands of Pounds------------------------------
SOURCE: Alaska Department of Transportation and Public Facilities, Fairbanks International Airport, "Fairbanks International Airport Statistical Report", 2013-2018.NOTE: Fluctuations in Transit Freight numbers are unpredictable from month to month. Factors that may influence transit freight number could include fire, flooding, storms and regional construction projects.This data is preliminary and may be subject to revision.
0
100,000
200,000
300,000
400,000
500,000
600,000
700,000
800,000
J/13
J/14
J/15
J/16
J/17
J/18
J=January/Year
Poun
dsof
Tra
nsit
Frei
ght

Economic Indicators
9 Winter 2018 Community Research Quarterly
2012 2013 2014 2015 2016 2017 2018 % Change 2017-18
January 1,614 1,508 1,569 1,611 1,711 1,676 1,605 -4%February 1,588 1,578 1,649 1,565 1,750 1,665 1,541 -7%March 1,836 1,813 2,074 1,913 1,959 1,962 1,751 -11%April 1,712 1,742 1,801 1,919 1,673 1,650 1,518 -8%May 2,085 1,983 1,973 1,992 1,984 1,922 1,819 -5%June 2,360 2,431 2,305 2,236 2,421 2,373 2,036 -14%July 2,349 2,398 2,416 2,310 2,455 2,289 2,115 -8%August 2,447 2,631 2,632 2,490 2,698 2,570 2,265 -12%September 2,167 2,258 2,365 2,244 2,336 2,261 1,880 -17%October 1,715 1,862 1,904 1,959 1,913 1,800 1,710 -5%November 1,459 1,585 1,596 1,603 1,735 1,699 1,445 -15%December 1,532 1,561 1,693 1,746 1,757 1,651 1,466 -11%
Total 22,864 23,350 23,977 23,588 24,392 23,518 21,151 -10%
2012-2018FAIRBANKS INTERNATIONAL AIRPORT REVENUE LANDINGS
FAIRBANKS INTERNATIONAL AIRPORT REVENUE LANDINGS2012-2018
SOURCE: Alaska Department of Transportation and Public Facilities, Fairbanks International Airport, "Fairbanks International Airport Statistical Report", 2012-2018.NOTE: This data is preliminary and may be subject to revision.
1,000
1,200
1,400
1,600
1,800
2,000
2,200
2,400
2,600
2,800
J/12
J/13
J/14
J/15
J/16
J/17
J/18
J=January/Year

Economic Indicators
Community Research Quarterly Winter 2018 10
2012 2013 2014 2015 2016 2017 2018 % Change 2017-18
IncomingJanuary 33,555 34,474 34,000 36,438 37,979 39,770 40,290 1%February 31,566 31,104 32,849 31,848 38,002 39,383 39,192 0%March 37,380 38,735 43,295 44,445 47,778 48,914 47,884 -2%April 30,156 29,853 31,459 32,234 35,306 35,425 37,470 6%May 42,888 41,734 42,797 47,161 48,831 50,289 51,554 3%June 56,506 53,673 56,100 59,012 59,225 63,538 61,926 -3%July 57,927 59,516 61,957 64,499 64,338 65,053 68,116 5%August 58,021 57,174 60,925 62,256 63,907 65,505 68,849 5%September 39,404 38,093 39,852 41,671 47,325 45,603 43,615 -4%October 31,710 33,781 33,536 37,222 40,492 39,241 41,615 6%November 30,085 29,534 30,834 36,920 39,873 42,549 41,839 -2%December 31,250 33,512 34,859 39,280 42,174 44,011 41,528 -6%
Total 480,448 481,183 502,463 532,986 565,230 579,281 583,878 1%
OutgoingJanuary 29,447 30,946 30,299 32,576 35,529 36,769 38,943 6%February 31,231 30,457 32,386 31,770 36,544 39,488 38,729 -2%March 37,143 38,519 44,297 43,609 47,936 48,847 47,828 -2%April 29,746 29,952 31,562 32,052 35,209 36,213 38,062 5%May 40,461 38,411 38,924 42,898 43,516 43,905 45,105 3%June 50,765 49,715 54,636 57,462 59,248 59,611 58,496 -2%July 55,564 56,807 59,333 61,578 62,638 62,145 61,953 0%August 56,668 56,543 59,422 60,438 63,432 63,888 65,036 2%September 45,283 45,978 45,950 48,353 51,919 51,414 51,322 0%October 33,915 35,712 36,223 39,056 43,484 41,318 44,754 8%November 30,909 30,748 31,816 37,421 40,200 42,519 42,805 1%December 36,169 37,428 38,780 42,638 46,125 47,802 45,300 -5%
Total 477,301 481,216 503,628 529,851 565,780 573,919 578,333 1%
FAIRBANKS INTERNATIONAL AIRPORT PASSENGERS2012-2018
SOURCE: Alaska Department of Transportation & Public Facilities, Fairbanks International Airport, "Fairbanks International AirportStatistical Report", 2012-2018.NOTE: Numbers do not include passengers in transit.
This data is preliminary and may be subject to revision.

Economic Indicators
11 Winter 2018 Community Research Quarterly
Quarter 2013 2014 2015 2016 2017 2018 % Chg 2017-18
1st $7,170,000 $8,202,072 $7,895,695 $8,966,361 $11,697,004 $10,116,888 -13.5%2nd $14,031,111 $14,523,116 $15,293,135 $16,910,821 $16,269,468 $17,449,054 7.3%3rd $25,686,646 $25,687,167 $27,541,793 $28,845,490 $29,008,361 $31,898,957 10.0%4th $10,909,172 $8,430,551 $8,989,832 $10,441,284 $10,271,906 $11,405,905 11.0%
Total $57,796,929 $56,842,905 $59,720,454 $65,163,956 $67,246,739 $70,870,804 5.4%
2009-2018
2013-2018Fairbanks North Star Borough
HOTEL/MOTEL ROOM RECEIPTS
QUARTERLY HOTEL/MOTEL ROOM RECEIPTSFairbanks North Star Borough
SOURCE: City of Fairbanks, Finance Dept.; City of North Pole, Finance Dept.; FNSB, Financial Services, personal communications, 2013-2018.NOTE: Room receipt figures are based on hotel/motel bed tax which is 8%. Receipts are calculated on taxes paid. Due to accrual adjustments the current data will supersede previous figures reported.
2009
2010
2011
2012
2013
2014
2015
2016
2017
2018
$0
$10,
000
$20,
000
$30,
000
$40,
000
$50,
000
$60,
000
$70,
000
$80,
000
in Thousands
1st Qtr. 2nd Qtr. 3rd Qtr. 4th Qtr.

Economic Indicators
Community Research Quarterly Winter 2018 12
Year 1st Qtr 2nd Qtr 3rd Qtr 4th Qtr Annual Total % Change From Prev Yr
2009 $5,554,495 $11,750,227 $25,311,523 $7,176,965 $49,793,210 -13.1%2010 $5,549,520 $14,817,922 $27,183,699 $6,887,983 $54,439,124 9.3%2011 $6,317,082 $13,757,533 $26,099,065 $7,429,594 $53,603,274 -1.5%2012 $6,603,066 $14,464,988 $28,737,266 $8,886,940 $58,692,260 9.5%2013 $7,170,000 $14,031,111 $25,686,646 $10,909,172 $57,796,929 -1.5%2014 $8,202,072 $14,523,116 $25,687,167 $8,430,551 $56,842,906 -1.7%2015 $7,895,695 $15,293,135 $27,541,793 $8,989,832 $59,720,454 5.1%2016 $8,966,361 $16,910,821 $28,845,490 $10,441,284 $65,163,956 9.1%2017 $11,697,004 $16,269,468 $29,008,361 $10,271,906 $67,246,739 3.2%2018 $10,116,888 $17,449,054 $31,898,957 $11,405,905 $70,870,804 5.4%
2009-2018
ANNUAL HOTEL/MOTEL ROOM RECEIPTSFairbanks North Star Borough
2009-2018
ANNUAL HOTEL/MOTEL ROOM RECEIPTSFairbanks North Star Borough
$40
$45
$50
$55
$60
$65
$70
$75
$80
2009
2010
2011
2012
2013
2014
2015
2016
2017
2018
Mill
ions
SOURCE: Fairbanks North Star Borough, City of Fairbanks, and City of North Pole, Finance Departments, personal communications 2008-2018.NOTE: Room receipt figures are based on hotel/motel bed tax which is 8%. Receipts are calculated on taxes paid. City of North Pole was added beginning second quarter 2009.Due to accrual adjustments the current figures supersede previous figures.

Economic Indicators
13 Winter 2018 Community Research Quarterly
City of FBKS FNSB Total City of
FBKS FNSB Total City of FBKS FNSB Total
January - - - $5,671 - $5,671 $56,665 $14,536 $71,201February - - - $15,966 - $15,966 $58,751 $11,651 $70,402March - - - $20,069 - $20,069 $75,804 $7,525 $83,329April - - - $22,542 $3,927 $26,469 $71,676 $8,408 $80,085May - - - $28,031 $6,992 $35,024 $78,448 $3,997 $82,445June - - - $37,795 $15,836 $53,630 $78,899 $6,550 $85,449July - - - $43,348 $7,939 $51,287 $82,029 $11,778 $93,806August - - - $47,469 $7,484 $54,953 $91,839 $9,307 $101,146September - - - $50,220 $11,388 $61,609 $85,840 $16,129 $101,969October $136 - $136 $60,326 $14,868 $75,194 $109,495 $13,224 $122,719November $13,727 - $13,727 $48,976 $16,582 $65,558 $96,582 $14,769 $111,350December $18,475 - $18,475 $62,407 $15,572 $77,979 $103,369 $12,607 $115,976TOTAL $32,338 - $32,338 $442,821 $100,588 $543,409 $989,399 $130,479
MARIJUANA SALES TAX REVENUECity of Fairbanks and Fairbanks North Star Borough
2016-2018
2016 2017 2018Month
QUARTERLY MARIJUANA SALES TAX REVENUECity of Fairbanks and Fairbanks North Star Borough
2017 - 2018
SOURCE: City of Fairbanks Finance Dept. website: www.fairbanksalaska.us/sales-tax-filing-informationFairbanks North Star Borough Treasury & Budget Dept., personal communications 2018.
NOTE: The City of North Pole does not allow marijuana facilities within city limits.Data provided is subject to revision.
$41,706$88,368
$141,038$171,708 $191,220
$229,024$259,708
$309,447
$0
$26,755
$26,811
$47,022 $33,712$18,955
$37,213
$40,599
1Q 2Q 3Q 4Q 1Q 2Q 3Q 4Q
City of Fairbanks Fairbanks North Star Borough
2017 2018
Economic Indicators
Community Research QuarterlyWinter 2018 14
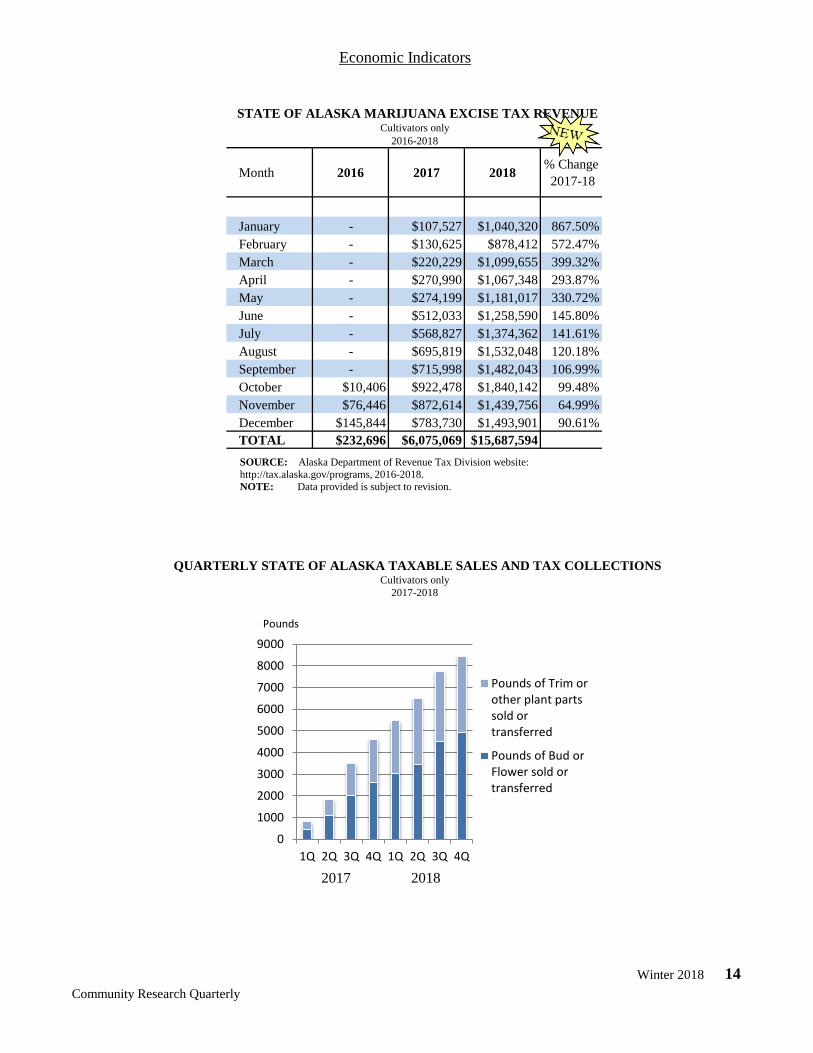
Month 2016 2017 2018 % Change 2017-18
January - $107,527 $1,040,320 867.50%February - $130,625 $878,412 572.47%March - $220,229 $1,099,655 399.32%April - $270,990 $1,067,348 293.87%May - $274,199 $1,181,017 330.72%June - $512,033 $1,258,590 145.80%July - $568,827 $1,374,362 141.61%August - $695,819 $1,532,048 120.18%September - $715,998 $1,482,043 106.99%October $10,406 $922,478 $1,840,142 99.48%November $76,446 $872,614 $1,439,756 64.99%December $145,844 $783,730 $1,493,901 90.61%TOTAL $232,696 $6,075,069 $15,687,594
STATE OF ALASKA MARIJUANA EXCISE TAX REVENUECultivators only
2016-2018
Cultivators only2017-2018
QUARTERLY STATE OF ALASKA TAXABLE SALES AND TAX COLLECTIONS
SOURCE: Alaska Department of Revenue Tax Division website: http://tax.alaska.gov/programs, 2016-2018.NOTE: Data provided is subject to revision.
0
1000
2000
3000
4000
5000
6000
7000
8000
9000
1Q 2Q 3Q 4Q 1Q 2Q 3Q 4Q
Pounds of Trim orother plant partssold ortransferred
Pounds of Bud orFlower sold ortransferred
Pounds
2017 2018

Economic Indicators
15 Winter 2018 Community Research Quarterly
2013 2014 2015 2016 2017 2018 % Change 2017-18
January 3,170 4,697 4,406 3,338 3,364 3,953 18%February 3,705 6,201 3,651 5,763 5,676 6,537 15%March 6,871 9,634 6,810 9,477 6,845 8,187 20%April 2,664 4,657 3,255 3,487 3,084 2,870 -7%May 4,859 4,721 5,820 5,893 5,438 5,107 -6%June 10,956 12,070 12,870 13,319 11,454 10,649 -7%July 14,746 14,876 14,517 15,249 13,925 12,724 -9%August 12,993 13,336 14,341 13,924 13,643 13,177 -3%September 8,163 6,489 6,917 8,588 7,700 7,631 -1%October 6,116 5,525 4,009 4,384 5,041 4,712 -7%November 4,206 4,350 3,802 3,885 4,136 3,721 -10%December 6,013 5,572 6,754 5,424 4,939 6,015 22%
Total 84,462 92,128 87,152 92,731 85,245 85,283 0%
2009-2018
UNIVERSITY OF ALASKA MUSEUM OF THE NORTH VISITORSFairbanks, Alaska
2013-2018
UNIVERSITY OF ALASKA MUSEUM OF THE NORTH VISITORSFairbanks, Alaska
SOURCE: University of Alaska Museum of the North, University of Alaska, Fairbanks, personal communications 2013-2018.NOTE: Numbers are preliminary and may be subject to revision.
010,00020,00030,00040,00050,00060,00070,00080,00090,000
100,000
Museum of the North Visitors

Community Research Quarterly Winter 2018 16
EMPLOYMENT
2012 2013 2014 2015 2016 2017 2018F January 7.5 7.2 6.6 6.3 6.4 6.6 7.4A February 7.4 6.7 6.6 6.3 6.4 6.5 7.4I March 7.1 6.2 6.2 5.8 6.2 6.2 6.9R April 6.5 5.9 5.8 5.3 5.8 6.1 6.9B May 6.0 5.6 5.7 5.1 5.5 6.0 6.3A June 6.6 6.4 6.2 5.7 5.7 6.2 6.0N July 6.1 5.5 5.5 4.7 5.2 5.8 5.1K August 5.5 5.2 5.1 4.6 4.8 5.5 4.4S September 5.1 5.0 5.1 4.8 5.3 5.8 4.9
October 5.1 5.2 5.3 5.3 5.3 5.9 5.1M November 5.6 5.4 5.6 5.6 5.6 6.3 5.5S December 6.2 5.4 5.6 5.7 5.7 6.6 5.8A Average 6.2 5.8 5.8 5.4 5.7 6.1 6.0
January 8.1 7.8 7.7 7.1 7.3 7.2 8.1February 8.0 7.4 7.9 7.6 7.5 7.4 8.2March 7.8 7.0 7.6 7.5 7.2 7.2 7.9
A April 7.2 6.6 7.1 7.0 6.8 7.0 7.5L May 6.8 6.3 6.8 6.6 6.6 6.8 7.0A June 7.3 6.9 7.0 6.9 6.8 7.0 6.7S July 6.6 6.0 6.1 5.9 6.1 6.6 5.8K August 6.2 5.8 6.0 5.5 5.8 6.3 5.4A September 5.9 5.8 6.2 5.7 6.1 6.6 5.6
October 6.0 6.2 6.2 6.1 6.2 6.7 5.8November 6.4 6.3 6.4 6.4 6.4 7.1 6.3December 7.0 6.5 6.4 6.6 6.6 7.3 6.5Average 6.9 6.5 6.8 6.6 6.6 6.9 6.7
U January 8.8 8.5 7.0 6.1 5.3 5.1 4.5N February 8.7 8.1 7.0 5.8 5.2 4.9 4.4I March 8.4 7.6 6.8 5.6 5.1 4.6 4.1T April 7.7 7.1 5.9 5.1 4.7 4.1 3.7E May 7.9 7.3 6.1 5.3 4.5 4.1 3.6D June 8.4 7.8 6.3 5.5 5.1 4.5 4.2
July 8.6 7.7 6.5 5.6 5.1 4.6 4.1S August 8.2 7.3 6.3 5.2 5.0 4.5 3.9T September 7.6 7.0 5.7 4.9 4.8 4.1 3.6A October 7.5 7.0 5.5 4.1 4.7 3.9 3.5T November 7.4 6.6 5.5 4.3 4.4 3.9 3.5E December 7.6 6.5 5.4 4.3 4.5 3.9 3.7S Average 8.1 7.4 6.2 5.2 4.9 4.4 3.9
2012-2018Fairbanks MSA, Alaska and the United States
CIVILIAN LABOR FORCE UNEMPLOYMENT RATES
SOURCES: Alaska Department of Labor, Research and Analysis Section, website: http://live.laborstats.alaska.gov/labforce. U.S. Department of Labor, Bureau of Labor Statistics, Current Population Survey, and website: http://www.bls.gov, 2012-2018.NOTE: Rates presented are "not seasonally adjusted". MSA (Metropolitan Statistical Area)Data provided is subject to revision.

Employment
17 Winter 2018 Community Research Quarterly
CIVILIAN LABOR FORCE UNEMPLOYMENT RATESState of Alaska, FNSB, and the United States
2013-2018
AVERAGE MONTHLY EMPLOYMENT ESTIMATES BY INDUSTRYFairbanks North Star BoroughFourth Quarter Average 2018
0.0
3.0
6.0
9.0
J/13
J/14
J/15
J/16
J/17
J/18
Perc
enta
ge U
nem
ploy
ed
J = January/Year
AlaskaFNSBU. S.
10,700
7,400
4,100
2,700
1,100
700
600
0
2,00
0
4,00
0
6,00
0
8,00
0
10,0
00
12,0
00
Government
Trade, Transportation & Utilities
Leisure & Hospitality
Construction
Financial Activities
Mining & Logging
Manufacturing

Employment
Community Research Quarterly Winter 2018 18
Industry 2018 20171st 2nd 3rd 4th
Reporting Period Qtr Qtr Qtr Qtr Jan-Dec Jan-Dec Jan-Dec Mining and Logging 700 700 800 700 700 800 -12.5% Construction 2,200 2,700 3,400 2,700 2,800 2,900 -3.4% Manufacturing 500 600 600 600 600 600 0.0%Trade, Transportation, Utilities 7,300 7,700 7,800 7,400 7,600 7,700 -1.3% Wholesale Trade 600 600 600 600 600 600 0.0% Retail Trade 4,600 4,700 4,700 4,600 4,700 4,700 0.0% Trans/Warehouse/Utilities 2,100 2,400 2,500 2,200 2,300 2,300 0.0% Information 400 400 400 400 400 500 -20.0% Financial Activities 1,200 1,200 1,200 1,100 1,200 1,200 0.0% Professional & Business Svcs 2,500 2,700 2,800 2,600 2,700 2,100 28.6% Educational & Health Services 5,600 5,700 5,700 5,600 5,700 5,500 3.6% Leisure & Hospitality 4,100 4,700 5,000 4,100 4,500 4,100 9.8% Other Services 1,000 1,000 1,000 1,000 1,000 1,000 0.0% Government 10,700 10,500 10,200 10,700 10,500 10,800 -2.8% Federal Government 2,800 3,100 3,100 3,000 3,000 3,000 0.0% State Government 4,700 4,600 4,500 4,700 4,600 4,800 -4.2% Local Government ² 3,100 2,800 2,600 3,100 2,900 3,100 -6.5%
Total Nonfarm 36,300 37,900 38,900 37,000 37,500 37,300 0.5%
AVERAGE MONTHLY EMPLOYMENT ESTIMATES BY INDUSTRYFairbanks North Star Borough (MSA)
2018
2018
Year-to-Date Average % Change 2017-18
SOURCE: Alaska Department of Labor and Workforce Development, Research and Analysis Section; U.S. Department of Labor, Bureau of Labor Statistics. State website: http://live.laborstats.alaska.gov/ces, 2018. NOTE: Data provided is subject to change. Please note that rounding is to nearest 100. Excludes self-employed workers, fishers, domestics, and unpaid family workers. Government includes employees of public school systems and the University of Alaska.MSA (Metropolitan Statistical Area)

Employment
19 Winter 2018 Community Research Quarterly
2014 2015 2016 2017 Natural Resources & Mining * 1,468 Agriculture, Forestry, Fishing, Hunting 40 45 41 100 143.9% Mining * 1,429 Construction 2,557 3,197 2,898 2,604 -10.1% Construction of Buildings 648 568 540 504 -6.7% Heavy Construction 506 1,163 1,040 949 -8.8% Specialty Trade Contractors 1,403 1,465 1,318 1,151 -12.7% Manufacturing * 602 Trade, Transportation & Utilities 7,760 7,934 7,817 7,658 -2.0% Wholesale Trade 745 715 663 618 -6.8% Retail Trade 4,678 4,882 4,767 4,710 -1.2% Food & Beverage 479 509 486 455 -6.4% General Merchandise 1,261 1,311 1,349 1,338 -0.8% Transportation & Warehousing 1,947 1,940 2,005 1,941 -3.2% Air Transportation 506 497 553 550 -0.5% Transit & Ground Passenger 286 308 295 311 5.4% Information 456 483 487 421 -13.6% Telecommunication 229 242 249 223 -10.4% Financial Activities 1,308 1,356 1,336 1,309 -2.0% Finance & Insurance 688 697 702 652 -7.1% Credit Intermediation, etc. 511 498 485 462 -4.7% Real Estate, Renting & Leasing 621 659 633 657 3.8% Real Estate 408 435 430 462 7.4% Professional & Business Services 2,252 2,265 2,223 2,496 12.3% Professional, Scientific, Technical Services 1,319 1,279 1,266 1,398 10.4% Management of Companies & Enterprises 123 128 130 127 -2.3% Administrative & Waste Services 811 857 827 971 17.4% Educational & Health Services 5,158 5,205 5,365 5,524 3.0% Health Care & Social Assistance 4,953 5,005 5,171 5,320 2.9% Leisure & Hospitality 4,212 4,250 4,298 4,465 3.9% Accommodation 1,095 1,129 1,161 1,118 -3.7% Food Services & Drinking Places 2,649 2,615 2,623 2,784 6.1% Other Services 1,130 1,129 1,042 1,027 -1.4% Membership Organizations, etc. 467 464 378 369 -2.4% Repair & Maintenance 431 441 442 436 -1.4% Government 11,419 11,209 10,904 10,697 -1.9% Federal Government 2,865 2,926 3,005 3,018 0.4% State Government 5,426 5,242 4,931 4,726 -4.2% Local Government 3,128 3,041 2,968 2,953 -0.5% Unclassified Establishments 49 40 57 32 -43.9%
Total Industries 38,859 38,371 37,872 37,671 -0.5%
ANNUAL AVERAGE MONTHLY EMPLOYMENT BY INDUSTRYFairbanks North Star Borough
2014-2017
Industry% Change
2016-17
SOURCE: Alaska Department of Labor and Workforce Development, Research and Analysis Section; Quarterly Census of Employment & Wages-Annual Review 2017.NOTE: Data is preliminary and subject to revision* Due to changes in employer classifications & employment levels data that was previously disclosable has become confidential.

Employment
Community Research Quarterly Winter 2018 20
2014 2015 2016 2017 Natural Resources & Mining * $7,694 Agriculture, Forestry, Fishing, Hunting $1,634 $1,788 $1,602 $2,597 62.1% Mining* $7,859 Construction $6,669 $7,413 $7,004 $6,784 -3.1% Construction of Buildings $5,677 $5,666 $5,762 $5,276 -8.4% Heavy Construction $8,740 $9,170 $8,456 $8,378 -0.9% Specialty Trade Contractors $6,381 $6,700 $6,366 $6,131 -3.7% Manufacturing * $4,491 Trade, Transportation & Utilities $3,414 $3,413 $3,429 $3,445 0.5% Wholesale Trade $4,560 $4,590 $4,602 $4,490 -2.4% Retail Trade $2,633 $2,635 $2,657 $2,717 2.3% Food & Beverage $2,289 $2,295 $2,339 $2,287 -2.2% General Merchandise $2,488 $2,450 $2,472 $2,540 2.8% Transportation & Warehousing $4,106 $4,087 $4,088 $4,021 -1.6% Air Transportation $3,941 $3,485 $4,002 $4,099 2.4% Transit & Ground Passenger $2,607 $2,474 $2,542 $2,520 -0.9% Information $4,793 $4,658 $4,551 $4,747 4.3% Telecommunication $6,393 $6,492 $6,244 $6,523 4.5% Financial Activities $3,951 $4,047 $4,113 $4,206 2.3% Finance & Insurance $4,044 $4,131 $4,174 $4,337 3.9% Credit Intermediation, etc. $4,126 $4,272 $4,252 $4,439 4.4% Real Estate, Renting & Leasing $3,841 $3,958 $4,052 $4,076 0.6% Real Estate $3,470 $3,610 $3,753 $3,624 -3.4% Professional & Business Services $4,188 $4,261 $4,297 $4,351 1.3% Professional, Scientific, Technical Services $4,548 $4,626 $4,502 $4,701 4.4% Management of Companies & Enterprises $7,623 $7,765 $8,197 $7,897 -3.7% Administrative & Waste Services $3,077 $3,197 $3,370 $3,384 0.4% Educational & Health Services $3,883 $4,032 $4,198 $4,273 1.8% Health Care & Social Assistance $3,949 $4,102 $4,265 $4,347 1.9% Leisure & Hospitality $1,701 $1,751 $1,770 $1,739 -1.8% Accommodation $2,403 $2,378 $2,280 $2,305 1.1% Food Services & Drinking Places $1,439 $1,537 $1,600 $1,578 -1.4% Other Services $2,538 $2,606 $2,831 $2,851 0.7% Membership Organizations, etc. $1,885 $1,828 $2,126 $2,155 1.4% Repair & Maintenance $3,718 $3,873 $3,953 $3,910 -1.1% Government $4,613 $4,728 $4,870 $4,858 -0.2% Federal Government $5,847 $5,939 $5,950 $6,120 2.9% State Government $4,277 $4,335 $4,603 $4,407 -4.3% Local Government $4,065 $4,240 $4,222 $4,290 1.6%Unclassified Establishments $2,661 $2,081 $2,368 $2,380 0.5%
Total Industries $4,097 $4,190 $4,211 $4,178 -0.8%
#DIV/0!
ANNUAL AVERAGE MONTHLY WAGE BY INDUSTRYFairbanks North Star Borough
2014-2017
Industry% Change
2016-17
SOURCE: Alaska Department of Labor and Workforce Development, Research and Analysis Section; Quarterly Census of Employment & Wages - Annual Review 2017.NOTE: Data is preliminary and subject to revision* Due to changes in employer classification & employment levels data that was previously disclosable has become confidential.

Employment
21 Winter 2018 Community Research Quarterly
Emp Wage Emp Wage Emp Wage Natural Resources & Mining 915 $8,110 1,001 $6,239 9.4% -23.1% Agriculture, Forestry, Fishing, Hunting* Mining * Construction 2,251 $6,621 2,732 $6,997 21.4% 5.7% Construction of Buildings 394 $4,901 520 $4,906 32.0% 0.1% Heavy Construction 965 $8,560 991 $8,451 2.7% -1.3% Specialty Trade Contractors 892 $5,282 1,221 $6,708 36.9% 27.0% Manufacturing 507 $3,903 583 $3,659 15.0% -6.3% Trade, Transportation & Utilities 7,350 $3,560 7,708 $3,484 4.9% -2.1% Wholesale Trade 631 $4,509 644 $4,574 2.1% 1.4% Retail Trade 4,586 $2,808 4,661 $2,760 1.6% -1.7% Food & Beverage 431 $2,320 454 $2,435 5.3% 5.0% General Merchandise 1,285 $2,751 1,172 $2,841 -8.8% 3.3% Transportation & Warehousing 1,763 $4,145 2,007 $3,975 13.8% -4.1% Air Transportation 530 $4,374 551 $4,209 4.0% -3.8% Transit & Ground Passenger 338 $2,600 279 $2,764 -17.5% 6.3% Information 411 $4,550 407 $4,551 -1.0% 0.0% Telecommunication 212 $6,496 208 $6,249 -1.9% -3.8% Financial Activities 1,265 $4,415 1,287 $4,206 1.7% -4.7% Finance & Insurance 630 $4,505 630 $4,259 0.0% -5.5% Credit Intermediation, etc. 458 $4,772 458 $4,306 0.0% -9.8% Real Estate, Renting & Leasing 636 $4,319 657 $4,155 3.3% -3.8% Real Estate 457 $4,000 462 $3,799 1.1% -5.0% Professional & Business Services 2,511 $4,391 2,684 $4,473 6.9% 1.9% Professional, Scientific, Technical Services 1,369 $4,686 1,418 $4,911 3.6% 4.8% Management of Companies & Enterprises 127 $6,910 132 $5,974 3.9% -13.5% Administrative & Waste Services 1,015 $3,677 1,134 $3,751 11.7% 2.0% Educational & Health Services 5,478 $4,017 5,498 $4,315 0.4% 7.4% Health Care & Social Assistance 5,281 $4,078 5,283 $4,399 0.0% 7.9% Leisure & Hospitality 4,075 $1,739 4,686 $1,713 15.0% -1.5% Accommodation 828 $2,717 1,239 $2,055 49.6% -24.4% Food Services & Drinking Places 2,690 $1,533 2,894 $1,626 7.6% 6.1% Other Services 975 $2,675 1,039 $2,914 6.6% 8.9% Repair & Maintenance 386 $3,649 423 $4,025 9.6% 10.3% Membership Organizations, etc. 270 $2,092 380 $2,198 40.7% 5.1% Government 10,844 $4,643 10,338 $5,148 -4.7% 10.9% Federal Government 2,886 $5,970 3,073 $5,803 6.5% -2.8% State Government 4,707 $4,455 4,650 $4,338 -1.2% -2.6% Local Government 3,251 $3,738 2,615 $5,819 -19.6% 55.7%Unclassified Establishments 38 $2,111 5 $1,557 -86.8% -26.2%
Total Industries 36,623 $4,125 37,967 $4,257 3.7% 3.2%
QUARTERLY CENSUS OF EMPLOYMENT AND WAGES BY INDUSTRYFairbanks North Star Borough
By Quarter
Industry--2Q 2018 Avg Mo-- % Chg From Prev Qtr--1Q 2018 Avg Mo--
SOURCE: Alaska Department of Labor and Workforce Development, Research and Analysis Section; Quarterly Census of Employment & Wages, State of Alaska website: http://almis.labor.state.ak.us. NOTE: All numbers are preliminary and subject to revision. There is an approximate 6 month lag in data release.* Due to changes in employer classification & employment levels data that was previously disclosable has become confidential.

Community Research Quarterly Winter 2018 22
HOUSING
2014 2015 2016 2017 2018
March 15.0% 15.2% 11.5% 11.5% 13.0%June 15.8% 6.8% 12.0% 8.7% 12.3%September 15.3% 8.8% 12.1% 10.3% 12.8%December 17.7% 12.8% 14.0% 13.1% 17.9%
2014-2018
2014-2018
APARTMENT / MULTI-PLEX VACANCY RATESFairbanks North Star Borough
APARTMENT / MULTI-PLEX VACANCY RATESFairbanks North Star Borough
02468
101214161820
Mar
Dec
Mar
Dec
Mar
Dec
Mar
Dec
Mar
Dec
Vac
ancy
Rat
e Pe
rcen
tage
20152014 2016 20182017
SOURCE: FNSB Community Research Center Rental Survey, 2014-2018.NOTE: Vacancy rates are based on a sample of 2,000 to 3,000 rental units and include data for apartments, duplexes, tri-plexes and larger multi-plex rental properties. They do not include single-family houses, mobile homes or cabins. Changes in seasonal apartment availability may also factor into the Fall and Winter figures. Vacancy influences: The Military Police were deployed to Iraq in Fall-Winter 2013-2014. The Ft. Wainwright Army 1st Battalion, 52nd Aviation Regiment, approximately 360 soldiers, deployed for a nine-month tour beginning March 2014. The 6th Squadron, 17th Cavalry Regiment, U.S. Army Alaska Aviation Task Force, approximately 400 soldiers, deployed for a nine-month tour beginning May 2014.

Housing
23 Winter 2018 Community Research Quarterly
------------- Apartments --------------------------------- Houses ------------------- Mobile TotalEff. 1-BR 2-BR 3+BR 1-BR 2-BR 3-BR 4+BR Homes Rentals
2014March 25 154 271 137 8 12 39 14 10 20 690June 38 155 261 114 5 9 15 18 5 27 647September 48 190 286 142 4 12 28 12 1 24 747December 38 241 280 146 2 15 10 6 - 25 7632015March 28 155 275 60 3 3 11 15 - 29 579June 22 72 150 54 - 7 6 5 1 25 342September 17 95 164 76 4 10 13 4 2 25 410December 21 142 192 98 7 10 12 7 - 16 5052016March 20 127 150 93 1 2 2 7 2 5 409June 26 124 137 142 6 2 12 11 - 10 470September 22 147 150 146 4 7 7 20 1 34 538December 30 181 161 137 9 9 24 12 - 19 5822017March 38 133 146 94 - 2 6 11 - 13 443June 24 125 143 43 3 13 11 3 - 20 385September 25 155 195 64 6 14 28 3 - 19 509December 33 122 217 98 3 4 8 8 - 15 5082018March 25 136 198 98 1 4 10 7 - 13 492June 14 123 179 105 4 11 19 8 - 19 482September 16 140 186 93 4 5 10 6 2 25 487December 21 199 242 102 6 16 22 7 - 19 634
% Change2017-18 Dec. -36% 63% 12% 4% 100% 300% 175% -13% - 27% 25%
Cabins
RENTAL HOUSING UNITS AVAILABLEFairbanks North Star Borough
2014-2018
RENTAL HOUSING UNITS AVAILABLE *Fairbanks North Star Borough
2014-2018
0100200300400500600700800
Mar
Dec
Mar
Dec
Mar
Dec
Mar
Dec
Mar
Dec
Num
ber A
vaila
ble
HousesApartments
2014 2015 2016 2017 2018
SOURCE: Community Research rental surveys, 2014-2018, including most major apartment complexes, Fairbanks Daily News-Miner advertisements, and http://www.craigslist.com during the week surrounding the 19th of March, June, September and December.NOTE: B&B's come off survey in May & back on in September.* Correction made to chart below (September and December 2014 data) on May 15, 2015.- No units appeared during the survey period.

Housing
Community Research Quarterly Winter 2018 24
---------------- Apartments --------------------------------------- Houses ---------------------- MobileEff. 1-BR 2-BR 3+ BR 1-BR 2-BR 3-BR 4+ BR Homes
2014March $700 $1,036 $1,215 $1,609 $1,015 $1,291 $1,523 $2,217 $1,022 $611June $717 $935 $1,201 $1,577 $970 $1,278 $1,856 $2,155 $770 $664September $847 $933 $1,197 $1,586 $912 $1,241 $1,762 $1,912 $850 $682December $700 $939 $1,195 $1,505 $1,087 $1,335 $1,699 $1,845 - $6972015March $658 $910 $1,113 $1,574 $1,341 $1,283 $1,719 $2,222 - $764June $641 $892 $1,099 $1,678 - $1,207 $1,650 $2,118 $700 $556September $685 $907 $1,151 $1,723 $1,136 $1,292 $1,511 $2,348 $950 $718December $596 $951 $1,128 $1,764 $995 $1,295 $1,602 $2,154 - $5652016March $668 $911 $1,160 $1,746 $1,100 $1,175 $1,325 $2,270 $875 $635June $661 $898 $1,142 $1,747 $956 $1,375 $1,686 $2,160 - $552September $663 $912 $1,161 $1,661 $993 $1,421 $1,614 $2,352 $850 $685December $612 $926 $1,144 $1,704 $1,133 $1,225 $1,682 $2,057 - $7342017March $625 $915 $1,159 $1,577 - $1,337 $1,674 $2,297 - $557June $644 $876 $1,141 $1,580 $1,191 $1,335 $1,590 $2,248 - $626September $671 $893 $1,115 $1,631 $912 $1,300 $1,509 $2,190 - $606December $606 $906 $1,136 $1,690 $1,066 $1,147 $1,687 $2,038 - $5602018March* $719 $890 $1,159 $1,714 $950 $1,387 $1,515 $2,022 - $525June* $647 $910 $1,152 $1,628 $937 $1,539 $1,713 $2,082 - $602September $669 $922 $1,171 $1,651 $1,312 $1,445 $1,546 $2,099 $1,250 $574December $659 $915 $1,158 $1,685 $1,029 $1,346 $1,598 $2,032 - $610% Change2017-18December
9% 1% 2% 0% -3% 17% -5% 0% - 9%
AVERAGE MONTHLY RENTS FOR AVAILABLE HOUSING UNITSFairbanks North Star Borough
2014-2018
2014-2018
Cabins
AVERAGE MONTHLY RENTS FOR AVAILABLE HOUSING UNITSFairbanks North Star Borough
$0
$500
$1,000
$1,500
$2,000
$2,500
$0$200$400$600$800
$1,000$1,200$1,400
Mar
Dec
Mar
Dec
Mar
Dec
Mar
Dec
Mar
Dec
3 Bedroom
House R
ent2 B
edro
om A
pt R
ent
2 Bdrm. Apts.
3 Bdrm. Houses
20162014 2015 2018
SOURCE: Community Research rental surveys, 2014-2018, including most major apartment complexes, Fairbanks Daily News-Miner advertisements, and http://www.craigslist.com during the week surrounding the 19th of March, June, September and December.NOTE: B&B's come off survey in May & back on in September.- No units appeared during the survey period.
* 2018 June amounts mistakenly reported for 2018 March time period.
2017

Housing
25 Winter 2018 Community Research Quarterly
Quarter Total# Price # Price # Price # Price # Price # Sold Avg Price
2016 1st 10 $93,420 23 $140,052 71 $221,600 35 $279,065 8 $300,018 147 $218,071 2nd 22 $110,136 48 $179,916 143 $238,091 54 $271,963 10 $391,980 277 $230,006 3rd 24 $110,537 54 $185,868 163 $236,312 62 $274,355 11 $393,427 314 $231,039 4th 19 $106,773 32 $167,387 111 $248,492 43 $280,606 20 $332,520 225 $238,596
2016 Total 75 $107,184 157 $173,570 488 $237,463 194 $275,924 49 $353,021 963 $230,528
2017 1st 8 $108,462 24 $152,287 90 $242,233 29 $289,242 8 $255,450 159 $231,165 2nd 19 $100,600 51 $160,789 152 $236,169 82 $282,893 20 $317,900 324 $233,224 3rd 28 $98,786 66 $171,589 182 $241,902 68 $293,794 27 $329,701 371 $234,493 4th 26 $101,987 50 $152,548 139 $226,432 48 $263,450 15 $250,246 278 $209,181
2017 Total 81 $101,195 191 $161,295 563 $236,588 227 $282,858 70 $300,817 1132 $227,446
2018 1st 10 $78,700 45 $132,148 109 $236,507 43 $280,179 14 $302,471 221 $220,793 2nd 23 $109,652 57 $158,684 162 $252,307 74 $289,660 15 $335,253 331 $238,382 3rd 26 $117,267 71 $185,758 181 $249,247 66 $287,733 30 $322,100 374 $240,655 4th 24 $93,179 40 $175,635 121 $232,188 57 $285,834 22 $292,491 264 $227,590
2018 Total 83 $103,545 213 $165,286 573 $244,086 240 $286,523 81 $313,101 1190 $233,435
% Chg 4th Qtr 2017-18
-8% -9% -20% 15% -13% 3% 19% 8% 47% 17% -5% 9%
% Chg ANNUAL 2017-18
2% 2% 12% 2% 2% 3% 6% 1% 16% 4% 5% 3%
Fairbanks North Star BoroughRESIDENTIAL HOUSING SALES
3 Bedroom 4 Bedroom
RESIDENTIAL HOUSING SALES*Fairbanks North Star Borough
2016-2018**1 Bedroom 2 Bedroom 5+ Bedroom
2014-2018, Quarterly Data
SOURCE: Greater Fairbanks Board of Realtors and Alaska/Multiple Listing Service, Inc., personal and computer printout communications 2016-2018. Fairbanks Area MLS District data maintained by the Board or its MLS may not reflect all real estate activity in the market, and neither the Board nor its MLS guarantees or is in any way responsible for accuracy of the data.* Does not include houses without bedrooms or sales of housing with zero lot lines.** The Year-End Total number of sales includes the calculated average price of sales.
$0$50,000$100,000$150,000$200,000$250,000$300,000$350,000$400,000
050
100150200250300350400
1st
2nd
3rd
4th
1st
2nd
3rd
4th
1st
2nd
3rd
4th
1st
2nd
3rd
4th
1st
2nd
3rd
4th
Average Selling PriceTo
tal N
umbe
r Sol
d
SalesAverage Selling Price
2014 2015 2016 2017 2018

Housing
Community Research Quarterly Winter 2018 26
# Price # Price # Price # Price # Price2003 59 $74,127 204 $107,667 410 $170,379 173 $204,159 47 $237,134 893 $159,751 28.9% 24.7%2004 56 $95,940 135 $130,274 426 $184,914 137 $220,814 26 $261,834 780 $177,939 -12.7% 11.4%2005 55 $95,452 160 $135,749 439 $207,847 163 $244,873 38 $266,373 855 $196,785 9.6% 10.6%2006 64 $107,793 158 $148,952 554 $220,860 194 $262,791 46 $288,256 1016 $213,613 18.8% 8.6%2007 58 $107,211 176 $170,842 541 $228,359 194 $271,421 41 $288,301 1010 $222,084 -0.6% 4.0%2008 59 $107,872 135 $155,583 493 $218,826 159 $277,801 19 $306,389 865 $214,152 -14.4% -3.6%2009 46 $109,055 154 $161,362 465 $224,245 171 $264,285 40 $287,474 876 $217,845 1.3% 1.7%2010 59 $115,540 139 $147,941 493 $223,043 198 $266,623 47 $269,378 936 $216,659 6.8% -0.5%2011 26 $107,961 104 $165,471 332 $219,677 142 $266,935 35 $279,511 639 $220,088 -31.7% 1.6%2012 44 $109,099 108 $157,211 343 $227,744 126 $271,471 24 $275,062 645 $218,143 0.9% -0.9%2013 44 $109,647 115 $158,175 399 $223,618 138 $290,081 42 $274,467 738 $221,947 14.4% 1.7%2014 48 $98,358 140 $160,243 465 $215,997 207 $268,183 46 $314,264 906 $218,062 22.8% -1.8%2015 59 $97,275 164 $161,091 550 $227,298 242 $271,706 44 $328,445 1059 $224,152 16.9% 2.8%2016 75 $107,184 157 $173,570 488 $237,463 194 $275,924 49 $353,021 963 $230,528 -9.1% 2.8%2017 81 $101,195 191 $161,295 563 $236,588 227 $282,858 70 $300,817 1132 $227,446 17.5% -1.3%2018 83 $103,545 213 $165,286 573 $244,086 240 $286,523 81 $313,101 1190 $233,435 5.1% 2.6%
10 Year Average (2009-18)
57 $105,886 149 $161,164 467 $227,976 189 $274,459 48 $299,554 908 $222,831
2009-2018
ANNUAL RESIDENTIAL HOUSING SALES*Fairbanks North Star Borough
% Chg From Prev Yr
Total # Sold**
5+ BedroomAvg.
Selling Price
ANNUAL AVERAGE RESIDENTIAL HOUSING SALES*Fairbanks North Star Borough
2003-2018
4 Bedroom3 Bedroom Avg. Price
Total # Sold
2 Bedroom1 BedroomYear
SOURCE: Greater Fairbanks Board of Realtors and Alaska/Multiple Listing Service, Inc., personal and computer printout communications 2003-2019. Fairbanks Area MLS District data maintained by the Board or its MLS may not reflect all real estate activity in the market, and neither the Board nor its MLS guarantees or is in any way responsible for accuracy of the data.* Does not include houses without bedrooms or housing with zero lot lines.** The Year-End Total number of sales includes the calculated average price of sales.
$0
$50,000
$100,000
$150,000
$200,000
$250,000
$300,000
0
200
400
600
800
1,000
1,200
1,400
2009
2010
2011
2012
2013
2014
2015
2016
2017
2018
Average Selling PriceTo
tal N
umbe
r Sol
d
Total # Sold**Avg. Selling Price

Housing
27 Winter 2018 Community Research Quarterly
Single Family Cabin
Multi Family
Fairbanks Total
Single Family Cabin
Multi Family
North Pole Total
2014 13 0 6 19 2 0 0 22015 21 0 39 60 3 0 0 32016 13 0 30 43 11 0 3 142017 9 0 10 19 14 0 9 23
2018* 10 0 4 14 19 0 32 51
Single Family Cabin
Multi Family
FNSB Balance
TotalSingle Family Cabin
Multi Family
New Con-struction
Total2014 156 72 10 238 171 72 16 2592015 125 67 20 212 149 67 59 2752016 126 59 14 199 150 59 47 2562017 143 50 23 216 166 50 42 258
2018* 122 54 17 193 151 54 53 258
NEW STRUCTURES BY UNITFairbanks North Star Borough
2008-2018
NEW STRUCTURES BY UNIT ANNUAL REPORTFairbanks North Star Borough
2014-2018
Year Built
Balance of Borough NEW CONSTRUCTION (All)
Year Built
City of Fairbanks City of North Pole
SOURCE: Fairbanks North Star Borough Assessing Department, personal communications, 2014-2018.NOTE: Balance of Borough does not include City of North Pole or City of Fairbanks data.
Current data supersedes previous figures reported.
0
100
200
300
400
500
600
700
800
Num
ber o
f New
Stru
ctur
es b
y U
nit
City of North Pole
City of Fairbanks
Balance of Borough

Community Research Quarterly Winter 2018 28
COST OF LIVING
CityComposite
IndexGrocery
Items Housing UtilitiesTrans-
portationHealth Care
Misc. Goods & Services
100% 13.40% 29.34% 8.94% 9.22% 4.26% 34.84%West: Fairbanks, AK 128.3 125.6 118.3 212.6 117.9 150.9 116.2 Anchorage, AK 128.9 134.0 142.5 122.9 109.6 144.3 120.3 Juneau, AK 134.0 146.5 151.2 133.8 129.9 153.2 113.4 Phoenix, AZ 97.4 98.7 94.4 111.2 99.2 95.5 95.7 San Diego, CA 147.0 112.7 230.3 131.5 122.2 108.2 105.4 Denver, CO 113.2 99.0 138.8 81.0 104.5 103.1 108.8 Boise, ID 97.2 95.8 91.6 87.4 113.2 104.0 99.9 Bozeman, MT 103.9 105.5 110.1 86.5 95.7 105.6 104.4 Cedar City, UT 88.2 93.7 74.2 99.2 104.7 84.7 91.1 Seattle, WA 154.8 127.1 212.5 111.1 135.4 123.5 136.9 Pierre, SD 99.9 100.9 115.0 91.4 89.4 98.2 92.0South: Miami, FL 116.2 110.2 146.0 101.1 105.7 96.2 102.5 Atlanta, GA 101.8 99.6 106.2 87.0 100.1 109.1 102.4 Lafayette, LA 90.1 99.4 78.5 88.1 104.0 87.9 93.3 Springfield, MO 85.9 97.9 69.5 87.3 90.6 102.3 91.6 Tulsa, OK 87.4 95.1 64.5 97.8 96.2 91.7 98.3 Memphis, TN 80.6 89.3 68.5 96.2 85.4 78.0 82.4 Dallas, TX 105.4 107.0 106.3 105.8 98.4 105.4 105.9North Central: Indianapolis, IN 92.8 94.4 79.2 105.5 94.4 91.7 100.2 Grand Rapids, MI 97.0 89.7 90.3 98.2 102.5 93.3 104.0 Madison, WI 105.9 105.4 109.1 99.3 103.6 118.8 104.2Northeast: New York, NY 248.5 139.5 522.8 118.9 126.9 114.8 141.3 Philadelphia, PA 113.4 116.7 124.3 107.4 113.9 103.5 105.5 Boston, MA 150.0 108.5 213.6 121.8 116.6 134.2 130.3 Raleigh, NC 91.5 93.4 84.8 93.0 94.3 100.7 94.1 Richmond, VA 94.9 86.7 88.2 96.4 92.8 115.6 101.2
Annual Average 2018For Selected Cities
C2ER COST OF LIVING INDEX*
SOURCE: Council for Community and Economic Research (C2ER), Cost of Living Index, Comparative Data for 270 Urban Areas, Annual Average 2018, January 2019.NOTE: This Cost of Living Index does not measure inflation (price change over time). Because each quarterly report is a separate comparison of prices at a single point in time, and because both the number and the mix of participants changes from one quarter to the next, Index data from different quarters cannot be compared. The Index reflects cost differentials for professional and executive households in the top income quintile. For inflation data contact the US Bureau of Labor Statistics (BLS) at www.bls.gov.* Item percentages change so please watch for current percentages.

Cost of Living
29 Winter 2018 Community Research Quarterly
C2ER COST OF LIVING INDEXFor Selected Cities
Annual Average 2018
CONSUMER PRICE INDEX-U FOR ALL ITEMSUrban Alaska & U.S. City Annual Average
2009-2018
140.000
160.000
180.000
200.000
220.000
240.000
260.000
2009
2010
2011
2012
2013
2014
2015
2016
2017
2018
U.S. City AverageAnchorage
0.0
20.0
40.0
60.0
80.0
100.0
120.0
140.0
160.0
180.0
Seat
tle, W
A
S
an D
iego
, CA
Anc
hora
ge, A
K
Fairb
anks
, AK
D
enve
r, C
O
Boz
eman
, MT
Atla
nta,
GA
Ric
hmon
d, V
A
Ced
ar C
ity, U
T
Sprin
gfie
ld, M
O
M
emph
is, T
N
National Average = 100
Fair
bank
s, A
K

Cost of Living
Community Research Quarterly Winter 2018 30
2013 2014 2015 2016 2017 2018 % Change 2017-18
Jan. - June Average 210.853 214.777 217.111 216.999 218.616 223.099 2.1%July - Dec. Average 213.910 216.833 216.706 218.660 219.131 227.992 4.0%
Annual Average 212.381 215.805 216.909 217.830 218.873 225.545 3.0%
% Change From Previous Year 3.1% 1.6% 0.5% 0.4% 0.5% 3.0%
2013 2014 2015 2016 2017 2018 % Change 2017-18
January 230.280 233.916 233.707 236.916 242.839 247.867 2.1%February 232.166 234.781 234.722 237.111 243.603 248.991 2.2%March 232.773 236.293 236.119 238.132 243.801 249.554 2.4%April 232.531 237.072 236.599 239.261 244.524 250.546 2.5%May 232.945 237.900 237.805 240.229 244.733 251.588 2.8%June 233.504 238.343 238.638 241.018 244.955 251.989 2.9%July 233.596 238.250 238.654 240.628 244.786 252.006 2.9%August 233.877 237.852 238.316 240.849 245.519 252.146 2.7%September 234.149 238.031 237.945 241.428 246.819 252.439 2.3%October 233.546 237.433 237.838 241.729 246.663 252.885 2.5%November 233.069 236.151 237.336 241.353 246.669 252.038 2.2%December 233.049 234.812 236.525 241.432 246.524 251.233 1.9%
Annual Average 232.957 236.736 237.769 241.237 246.163 252.125 2.4%
% Change From Previous Year 3.6% 1.6% 0.4% 1.5% 2.0% 2.4%
U.S. City Average2013-2018
CONSUMER PRICE INDEX-U FOR ALL URBAN CONSUMERS*Urban Alaska
2013-2018
CONSUMER PRICE INDEX-U FOR ALL URBAN CONSUMERS, FOR ALL ITEMS
SOURCE: U.S. Department of Labor, Bureau of Labor Statistics, Consumer Price Indexes Pacific Cities and U.S. CityAverage, not seasonally adjusted, 2013-2018.NOTE: 1982-1984 = 100* Consumer Price Index not available for the Fairbanks area.
SOURCE: U.S. Department of Labor, Bureau of Labor Statistics, Consumer Price Indexes Pacific Cities and U.S. City Average, not seasonally adjusted, 2013-2018.NOTE: 1982-1984=100; All items. 3rd Qtr. 2013 - federal government shutdown pushed back the release dates for data.

Cost of Living
31 Winter 2018 Community Research Quarterly
Anchorage Cordova Delta Fairbanks Kenai Matsu Sitka
Family of 219-50 years $132.10 $193.80 $156.40 $119.10 $138.80 $122.10 $158.9051-70 years $125.10 $183.50 $148.10 $112.80 $131.40 $115.60 $150.50Family of 4 with:Children, 2-5 years $192.50 $282.40 $227.90 $173.60 $202.20 $177.80 $231.50Children, 6-11 years $220.80 $323.90 $261.40 $199.10 $231.90 $204.00 $265.60Individuals Children: 1 years $32.20 $47.20 $38.10 $29.00 $33.80 $29.80 $38.70 2-3 years $35.40 $51.90 $41.90 $31.90 $37.10 $32.70 $42.50 4-5 years $37.20 $54.50 $44.00 $33.50 $39.00 $34.30 $44.70 6-8 years $47.30 $69.40 $56.00 $42.70 $49.70 $43.70 $56.90 9-11 years $53.30 $78.20 $63.10 $48.10 $56.00 $49.30 $64.20 Males: 12-13 years $57.50 $84.40 $68.10 $51.90 $60.40 $53.20 $69.20 15-18 years $59.20 $86.80 $70.10 $53.40 $62.10 $54.70 $71.20 19-50 years $63.70 $93.40 $75.40 $57.40 $66.90 $58.80 $76.60 51-70 years $58.00 $85.00 $68.60 $52.30 $60.90 $53.60 $69.70 71+ years $58.30 $85.50 $69.00 $52.50 $61.20 $53.80 $70.10 Females: 12-13 years $57.50 $84.40 $68.10 $51.90 $60.40 $53.20 $69.20 15-18 years $56.30 $82.60 $66.70 $50.80 $59.20 $52.00 $67.80 19-50 years $56.50 $82.80 $66.90 $50.90 $59.30 $52.20 $67.90 51-70 years $55.90 $82.00 $66.20 $50.40 $58.70 $51.60 $67.20 71+ years $54.20 $79.30 $64.20 $48.90 $57.00 $50.10 $65.20
.
COST OF FOOD AT HOME FOR A WEEKSelected Alaskan Communities
March 2018
COST OF FOOD AT HOME FOR A WEEKFAMILY OF 4
Selected Alaskan CommunitiesMarch 2018
SOURCE: Alaska Cooperative Extension Service, UAF, "Cost of Food at Home for a Week," March 2018.NOTE: The data sets in this table are interpolated data.
$0 $50 $100 $150 $200 $250 $300 $350
Cordova
Sitka
Delta
Kenai
Anchorage
Matsu
Fairbanks
$323.90
$265.60
$261.40
$231.90
$220.80
$204.00
$199.10

Cost of Living
Community Research Quarterly Winter 2018 32
2013 2014 2015 2016 2017 2018 % Change 2017-18
January $3.779 $3.649 $2.989 $2.619 $2.899 $3.259 12.4%February $3.939 $3.679 $2.869 $2.479 $2.899 $3.199 10.3%March $4.179 $3.799 $3.029 $2.359 $2.989 $3.199 7.0%April $4.169 $3.919 $3.149 $2.589 $3.059 $3.349 9.5%May $4.169 $3.999 $3.359 $2.639 $3.059 $3.499 14.4%June $4.189 $4.179 $3.599 $2.719 $2.999 $3.549 18.3%July $4.159 $4.299 $3.630 $2.739 $2.969 $3.519 18.5%August $4.069 $4.229 $3.470 $2.739 $3.009 $3.499 16.3%September $3.999 $4.079 $3.380 $2.689 $3.099 $3.499 12.9%October $3.889 $3.919 $3.099 NA $3.149 NANovember $3.769 $3.739 $2.699 $2.769 $3.449 NADecember $3.719 $3.429 $2.669 $2.769 $3.349 NA
Annual Average $4.002 $3.910 $3.162 $2.646 $3.077
ANNUAL AVERAGE SELF-SERVICE UNLEADED GASOLINE PRICESFairbanks North Star Borough
2008-2017
AVERAGE SELF-SERVICE UNLEADED GASOLINE PRICESFairbanks North Star Borough
2013-2018
SOURCE: Community Research gasoline price survey, personal communications with Totem Chevron 2012-2017 and Simard Automotive Chevron on Gaffney Road in Fairbanks, Alaska, 2017-2018.NOTE: Figures reflect prices at the self-serve pump for unleaded gasoline. Price is a monthly average of full months business.Only national gasoline retail chain outlets are surveyed.Factors that may influence the price fluctuations include seasonality in the demand for gasoline, changes in the cost of crude oil, product supply/demand imbalances, proximity of supply, supply disruptions, competition in the local market, environmental programs, operating costs, World oil supply/demand, and natural disasters. Totem Chevron was sold to Simard Automotive in 2016 and is now Simard Automotive Chevron.NA October 2016 data unavailable. Data not available at publication time.
Annual Average Self-Serve Unleaded
Gasoline Price
0.000
1.000
2.000
3.000
4.000
5.000
6.000
2008
2009
2010
2011
2012
2013
2014
2015
2016
2017

33 Winter 2018 Community Research Quarterly
POPULATION & SOCIAL CONDITIONS
U.S. Census Bureau (1)
AK Department of Labor (2)
AK Dept of Commerce (3)
F 2009 31,083 32,346 32,346A 2010 31,535 31,535 31,535I 2011 32,012 30,606 30,621R 2012 32,254 32,017 32,033B 2013 32,324 32,208 32,204A 2014 32,469 31,831 31,721N 2015 32,325 32,116 32,116K 2016 32,751 31,957 31,957S 2017 31,644 31,905 31,905
2018 NA 31,668 NAN 2009 2,045 2,199 2,199O 2010 2,117 2,117 2,117R 2011 2,172 2,101 2,104T 2012 2,205 2,157 2,158H 2013 2,214 2,212 2,209
2014 2,178 2,204 2,198P 2015 2,189 2,138 2,138O 2016 2,232 2,145 2,145L 2017 2,101 2,124 2,124E 2018 NA 2,101 NA
2009 95,238 96,631 97,5812010 98,190 97,581 97,581
F 2011 99,276 98,181 97,909N 2012 100,141 100,605 100,320S 2013 100,436 99,974 99,632B 2014 99,357 98,703 97,972
2015 99,631 98,645 98,6452016 100,605 98,957 98,9572017 99,703 97,738 97,7382018 NA 97,121 NA
POPULATION COUNTS & ESTIMATESFairbanks, North Pole and the Fairbanks North Star Borough
2009-2018, Selected Years
SOURCE: (1) U.S. Census Bureau, Population Division, July 1st estimates. 2016 Population Estimates. PEPANNRES Table: Annual Estimates of the Resident Population for Counties of Alaska: April 1, 2010 to July 1, 2017. Geographic change notes defined at: http://www.census.gov.
(2) Alaska Department of Labor and Workforce Development, Research and Analysis Section; and US Census Bureau. Alaska Population Estimates by Borough, Census Area, City and Census Designated Place (CDP), 2010-2015, Vintage 2018, and Alaska Population Estimates by Borough, Census Area, City and Census Designated Place (CDP), 2010-2018, Vintage 2018. All numbers are based on 2018 Census geography. ADOL website: http://laborstats.alaska.gov, March 2019.
(3) Alaska Department of Commerce, Community and Economic Development (ADCCED), Division of Community and Regional Affairs, 2015 Commissioner Certified Estimates. ADCCED Certified numbers may vary from ADOL population estimates as a result of the Population Estimate Appeal process available to incorporated communities on a yearly basis, as well as annual revisions by ADOL. Once certified, ADCCED numbers may be applied for two consecutive calendar years. ADCCED website: http://www.commerce.state.ak.us/dca/commdb/CF_COMDB.htm.NOTE: The FNSB numbers include population for all communities within the Borough plus Fort Wainwright Army Base and Eielson Air Force Base. U.S. Census and ADOL estimated numbers may be revised annually.NA Data not yet available.

Population and Social Conditions
Community Research Quarterly Winter 2018 34
Ft. Wainwright Army Base
FFY Qtr
FFY Months
Military Active Duty Personnel
Military Families Total % Change From
Prev Qtr
2016 1 Oct-Dec 6,965 7,331 14,296 -3.0%2 Jan-Mar 7,086 8,122 15,208 6.4%3 Apr-Jun 7,012 7,581 14,593 -4.0%4 Jul-Sept 6,786 7,477 14,263 -2.3%
2017 1 Oct-Dec 6,761 7,230 13,991 -1.9%2 Jan-Mar 6,983 6,950 13,933 -0.4%3 Apr-Jun 7,117 6,996 14,113 1.3%4 Jul-Sept 7,135 7,017 14,152 0.3%
2018 1 Oct-Dec 7,160 6,986 14,146 0.0%2 Jan-Mar 7,212 6,939 14,151 0.0%3 Apr-Jun 7,199 6,893 14,092 -0.4%4 Jul-Sept 7,052 6,527 13,579 -3.6%
2019 1 Oct-Dec 6,887 6,346 13,233 -2.5%
Eielson Air Force Base
FFY Qtr
FFY Months
Military Active Duty Personnel
Military Families Total % Change From
Prev Qtr
2016 1* Oct-Dec 1,791 2,636 4,427 -1.6%2* Jan-Mar 1,805 2,667 4,472 1.0%3* Apr-Jun 1,808 2,645 4,453 -0.4%4* Jul-Sept 1,799 2,605 4,404 -1.1%
2017 1* Oct-Dec 1,809 2,547 4,356 -1.1%2* Jan-Mar 1,833 2,524 4,357 0.0%3 Apr-Jun 1,813 3,535 5,348 22.7%4 Jul-Sept NA NA
2018 1 Oct-Dec NA NA2 Jan-Mar NA NA3 Apr-Jun 1,790 1,204 2,9944 Jul-Sept 1,761 1,207 2,968 -0.9%
2019 1 Oct-Dec 1,830 1,386 3,216 8.4%
MILITARY POPULATIONFt. Wainwright Army Base
By Federal Fiscal Year Quarter: 2016-2019
By Federal Fiscal Year Quarter: 2016-2019
MILITARY POPULATIONEielson Air Force Base
SOURCE: FT. W.W. Plans, Analysis and Integration Office (PAIO), and ALCOM, Alaskan Command, 2016-2019.NOTE: Using Federal Fiscal Year (FFY) reporting periods: FFY1Q: Oct-Dec; FFY2Q: Jan-Mar; FFY3Q: Apr-Jun; FFY4Q: Jul-Sept. This data does not include contract civilian positions or BLM.
SOURCE: ALCOM, Alaskan Command and 2016-2019.NOTE: Using FFY reporting periods: FFY1Q: Oct-Dec; FFY2Q: Jan-Mar; FFY3Q: Apr-Jun; FFY4Q: Jul-Sept. This data does not include contract civilian positions or BLM. Eielson AFB military population data before FFY 2017 3Q is Defense Enrollment Eligibility Reporting System data (DEERS). DEERS is a worldwide, computerized database of uniformed services members, their family members, and other who are eligible for military benefits, including TRICARE.NA Data not available.* DEERS data

Population and Social Conditions
35 Winter 2018 Community Research Quarterly
Year Births Deaths Marriages Divorces* Adoptions
1996 1,462 298 804 556 841997 1,424 310 778 600 1031998 1,439 290 735 677 881999 1,415 335 817 593 1182000 1,537 329 806 475 1142001 1,488 367 806 558 1042002 1,515 283 831 541 1092003 1,564 355 779 525 882004 1,591 388 854 531 762005 1,557 338 897 559 632006 1,568 363 805 475 752007 1,725 387 1,123 622 592008 1,881 362 995 614 922009 1,557 421 800 614 742010 1,764 393 992 735 602011 1,679 424 878 718 642012 1,449 456 940 670 552013 1,802 448 942 621 772014 1,670 466 918 591 822015 1,713 472 880 555 802016 1,677 519 848 555 852017 1,631 483 798 517 86
% Chg. 2016-17 -3% -7% -6% -7% 1%
VITAL STATISTICS^Fairbanks North Star Borough
1996-2017
BIRTH, DEATH, MARRIAGE & DIVORCE RATESFNSB, Alaska & the United States
2017
SOURCE: Alaska Department of Health and Social Services, Division of Public Health, Vital Statistics Section, Annual Reports 1993-2003, and personal communications, 1996-2019. NOTE: Births & deaths are counted by place of residence. Marriages & adoptions are counted by place of occurrence of the event, and Divorces are for the 4th Judicial District. Beginning in 2010 , data for adoptions occuring in the Fairbanks North Star Borough were no longer available. The adoption data from 2010 to today are calculated by residence of the adopting mother.* Includes dissolutions & annulments for the 4th Judicial District.^ Current data supersedes previously reported figures.
0.02.04.06.08.0
10.012.014.016.018.0
Birth Death Marriage DivorceRat
e pe
r 1,0
00 P
opul
atio
n FNSB Alaska U.S.

Population and Social Conditions
Community Research Quarterly Winter 2018 36
Year Births Deaths Marriages Divorces*
2007 18.1 4.1 11.8 4.72008 19.5 3.8 10.3 4.62009 16.1 4.4 8.3 4.6
F 2010 18.1 4.0 10.2 5.4N 2011 17.2 4.3 9.0 5.2S 2012 14.4 4.5 9.4 4.7B 2013 18.0 4.4 9.4 4.7
2014 16.9 4.7 9.3 4.52015 17.4 4.7 8.9 4.22016 16.7 5.2 8.6 4.22017 16.7 4.9 8.2 4.02007 16.2 5.1 8.6 4.52008 16.6 5.1 8.4 4.6
A 2009 16.2 5.2 7.8 4.6L 2010 16.1 5.3 8.0 4.8A 2011 15.8 5.3 7.8 4.8S 2012 14.4 5.3 7.3 4.6K 2013 15.6 5.4 7.3 4.5A 2014 15.5 5.6 7.6 4.2
2015 15.3 5.8 7.5 4.22016 15.2 6.1 7.1 4.02017 14.2 5.9 7.0 3.72007 14.3 8.0 7.3 3.62008 14.0 8.0 7.1 3.52009 13.5 7.9 6.8 3.5
U 2010 13.0 7.9 6.8 3.6S 2011 12.7 8.1 6.8 3.6A 2012 12.6 8.1 6.8 3.4
2013 12.4 8.2 6.8 3.32014 12.5 8.2 6.9 3.22015 12.4 8.4 6.9 3.12016 12.2 7.3 7.0 3.02017 11.8 8.5 6.9 2.9
2007-2017Fairbanks North Star Borough, Alaska & the United States
BIRTH, DEATH, MARRIAGE & DIVORCE RATES^
SOURCE: Alaska Dept. of Health and Social Services, Division of Public Health, Vital Statistics Section, Alaska Vital Statistics, personal communications, 2006-2018. U.S. Dept. of Commerce, Bureau of Census, Statistical Abstract of the United States 2004-2006. National Center for Health Statistics: www.cdc.gov/nchs.NOTE: Rates are the number per 1,000 population. Births and deaths are counted by place of residence. Marriages, divorces and adoptions are counted by the place of occurrence of the event. * Includes dissolution's and annulments. The data listed for the FNSB are for the Alaskan 4th Judicial District.^ Preliminary figures and may be subject to revision.

Population and Social Conditions
37 Winter 2018 Community Research Quarterly
Academic Year Occupational Endorsements Certificates Associate's Bachelor's Teacher
Licensure Master's Doctorate Total
1999-00 - 115 190 445 - 169 20 9392000-01 - 104 216 448 - 125 27 9202001-02 - 98 243 431 - 142 19 9332002-03 - 78 246 395 - 163 36 9182003-04 - 117 240 411 - 183 20 9712004-05 - 91 223 432 - 236 25 1,0072005-06 - 124 237 483 34 183 21 1,0822006-07 - 169 210 464 34 199 33 1,1092007-08 - 190 238 444 30 199 29 1,1302008-09 26 109 193 483 30 169 37 1,0472009-10 66 165 204 473 34 219 45 1,2062010-11 54 98 233 523 35 199 46 1,1882011-12 59 179 226 535 30 245 50 1,3242012-13 80 162 283 550 37 213 52 1,3772013-14 126 204 333 579 44 223 49 1,5582014-15 112 238 307 572 48 209 40 1,5262015-16 134 221 334 572 29 227 47 1,5642016-17 118 214 309 581 44 228 49 1,5432017-18 157 186 281 533 39 191 55 1,442
% Change '16-17 to '17-18 33% -13% -9% -8% -11% -16% 12% -7%
Fall Semester 2012 2013 2014 2015 2016 2017 2018 % chg 2017-18
Fairbanks Campus 5,369 6,279 6,229 5,997 5,967 5,423 5,163 -4.8%UAF System 9,314 9,256 8,700 8,719 8,360 7,744 7,479 -3.4%UA System 29,866 29,510 28,388 27,726 26,479 25,181 23,792 -5.5%
COLLEGE DEGREES AWARDED*University of Alaska Fairbanks
1999-00 to 2017-18
OPENING FALL SEMESTER HEADCOUNTS FOR CREDIT ENROLLMENT*University of Alaska - Fairbanks and Alaska
2012-2018
SOURCE: University of Alaska Fairbanks, Office of Planning, Analysis and Institutional Research, Fairbanks, Alaska, personal communications, 1999-2018. NOTE: The academic year runs from summer through spring. Beginning FY08 the UAF awards occupational endorsements, which is a non-degree award similar to a certificate, but requiring fewer credits to complete. UAF also recognizes its students who have earned the university's recommendation for teacher licensure.* Current data supersedes previous figures reported.
SOURCE: University of Alaska Fairbanks, Office of Planning, Analysis and Institutional Research, personal communications, 2012-2019.NOTE: Opening headcounts are taken near the end of the second week of classes. Because most campuses offer credit courses beginning after this period, opening counts are generally lower than closing counts taken at the end of the semester.* Current data supersedes previous figures reported.

Population and Social Conditions
Community Research Quarterly Winter 2018 38
School 2012 2013 2014 2015 2016 2017 2018% Chg
2017-18In-Town Enrollments Alternative Schools 137 131 129 109 120 114 127 11.4% Anne Wien Elem. 401 412 401 385 386 375 392 4.5% Midnight Sun Elem. 505 497 490 501 478 476 457 -4.0% Barnette Magnet 412 415 420 412 420 432 433 0.2%Boreal Sun Charter - - - - - 181 191 5.5% Chinook Charter Elem. 153 150 149 152 153 152 151 -0.7% Denali Elem. 398 402 400 383 370 341 324 -5.0% Effie Kokrine Charter 152 167 169 158 157 168 151 -10.1% Fairbanks Youth Facility 17 10 9 8 13 16 18 12.5% Hunter Elem. 353 353 344 327 357 372 369 -0.8% Hutchison High 372 362 363 400 410 408 405 -0.7% Joy Elem. 444 464 441 386 391 418 403 -3.6% Lathrop High 1,101 1,073 1,079 1,032 946 1,011 944 -6.6% Midnight Sun Elem. 505 497 490 501 478 476 457 -4.0% Nordale Elem. 360 317 310 337 354 356 315 -11.5% North Pole Elem. 453 459 446 502 490 479 431 -10.0% North Pole Middle 679 656 657 655 656 593 583 -1.7% North Pole Sr. High 730 753 751 721 736 704 642 -8.8% Pearl Creek Elem. 470 478 470 493 506 491 478 -2.6% Randy Smith Middle 326 338 338 328 336 294 291 -1.0% Ryan Middle School 394 385 383 366 390 370 369 -0.3% Salcha Elem. 84 75 75 78 73 69 82 18.8% Star of the North Charter 196 194 188 196 211 191 177 -7.3% Tanana Middle 513 472 474 471 434 388 402 3.6% Ticasak Brown Elem. 545 514 508 491 498 496 461 -7.1% Two Rivers Elem. 87 98 98 99 95 86 72 -16.3% University Park Elem. 529 503 503 494 505 472 476 0.8% WaterShed Charter 196 202 202 200 197 197 198 0.5% Weller Elem. 484 477 471 466 452 465 459 -1.3% West Valley High 1,019 966 971 1,023 972 968 981 1.3% Woodriver Elem. 445 438 436 473 468 435 467 7.4%Subtotal 12,460 12,258 12,165 12,147 12,052 11,994 11,706 -2.4%On-Base Enrollments Anderson Elem. 269 253 246 240 243 214 196 -8.4% Arctic Light Elem. 569 530 521 536 536 532 446 -16.2% Ben Eielson Jr/Sr High 403 399 398 345 335 350 328 -6.3% Crawford Elem. 300 298 298 291 298 296 289 -2.4% Ladd Elem. 499 540 526 508 496 492 476 -3.3%Subtotal 2,040 2,020 1,989 1,920 1,908 1,884 1,735 -7.9%BEST Correspondence 211 274 269 268 287 289 294 1.7%Total 14,711 14,552 14,423 14,335 14,247 14,167 13,735 -3.0%
2012-2018
FALL PUBLIC SCHOOL ENROLLMENTSFairbanks North Star Borough
SOURCE: FNSB School District, Attendance Office, "FTE October 20-school-Day ADM Count.", personal communications 2012-2018.NOTE: Midnight Sun Elementary aka Badger Road Elementary (changed name in 2017). Boreal Sun Charter School opened in August 2017.
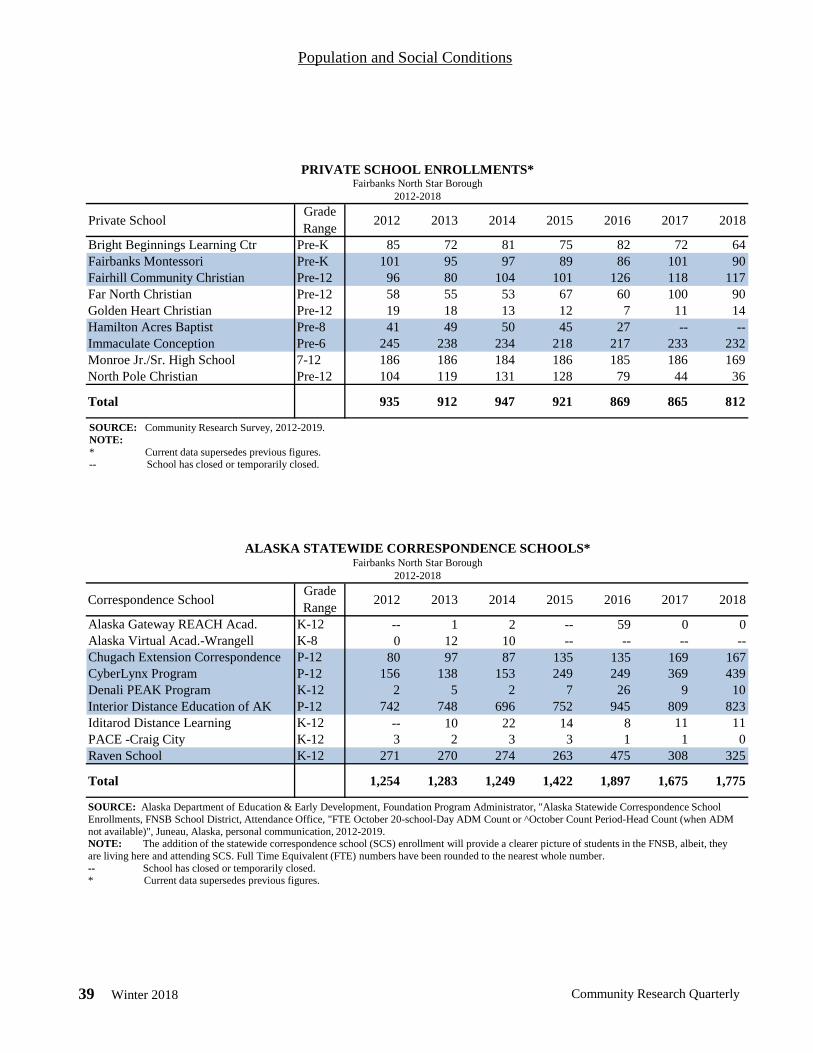
Population and Social Conditions
39 Winter 2018 Community Research Quarterly
Private SchoolGrade Range 2012 2013 2014 2015 2016 2017 2018
Bright Beginnings Learning Ctr Pre-K 85 72 81 75 82 72 64Fairbanks Montessori Pre-K 101 95 97 89 86 101 90Fairhill Community Christian Pre-12 96 80 104 101 126 118 117Far North Christian Pre-12 58 55 53 67 60 100 90Golden Heart Christian Pre-12 19 18 13 12 7 11 14Hamilton Acres Baptist Pre-8 41 49 50 45 27 -- --Immaculate Conception Pre-6 245 238 234 218 217 233 232Monroe Jr./Sr. High School 7-12 186 186 184 186 185 186 169North Pole Christian Pre-12 104 119 131 128 79 44 36
Total 935 912 947 921 869 865 812
Correspondence SchoolGrade Range 2012 2013 2014 2015 2016 2017 2018
Alaska Gateway REACH Acad. K-12 -- 1 2 -- 59 0 0Alaska Virtual Acad.-Wrangell K-8 0 12 10 -- -- -- --Chugach Extension Correspondence P-12 80 97 87 135 135 169 167CyberLynx Program P-12 156 138 153 249 249 369 439Denali PEAK Program K-12 2 5 2 7 26 9 10Interior Distance Education of AK P-12 742 748 696 752 945 809 823Iditarod Distance Learning K-12 -- 10 22 14 8 11 11PACE -Craig City K-12 3 2 3 3 1 1 0Raven School K-12 271 270 274 263 475 308 325
Total 1,254 1,283 1,249 1,422 1,897 1,675 1,775
PRIVATE SCHOOL ENROLLMENTS*
Fairbanks North Star BoroughALASKA STATEWIDE CORRESPONDENCE SCHOOLS*
2012-2018
2012-2018Fairbanks North Star Borough
SOURCE: Community Research Survey, 2012-2019.NOTE:* Current data supersedes previous figures.-- School has closed or temporarily closed.
SOURCE: Alaska Department of Education & Early Development, Foundation Program Administrator, "Alaska Statewide Correspondence SchoolEnrollments, FNSB School District, Attendance Office, "FTE October 20-school-Day ADM Count or ^October Count Period-Head Count (when ADM not available)", Juneau, Alaska, personal communication, 2012-2019.NOTE: The addition of the statewide correspondence school (SCS) enrollment will provide a clearer picture of students in the FNSB, albeit, they are living here and attending SCS. Full Time Equivalent (FTE) numbers have been rounded to the nearest whole number.-- School has closed or temporarily closed.* Current data supersedes previous figures.

Population and Social Conditions
Community Research Quarterly Winter 2018 40
Month 2013 2014 2015 2016 2017 2018LIQUORJanuary 19,998 20,543 23,319 30,447 16,624 16,210February 14,852 14,189 19,634 14,660 13,533 14,352March 15,794 15,302 8,539 6,758 16,754 16,877April 19,335 16,072 17,905 19,406 17,177 17,058May 17,540 16,674 18,283 16,596 22,250 21,435June 22,585 21,259 21,226 36,819 24,353 21,056July 21,839 20,557 9,448 19,536 17,876 18,483August 21,385 20,589 19,991 21,872 23,352 21,492September 23,305 19,584 23,542 18,903 18,255 19,308October 19,114 20,889 18,665 8,003 19,070 17,934November 20,171 19,614 19,070 7,590 19,062 19,754December 18,573 15,980 16,828 7,186 20,443 22,729TOTAL 234,491 221,252 216,450 207,776 228,749 226,688WINEJanuary 27,239 25,536 32,167 43,925 22,768 23,949February 21,284 20,835 27,666 20,135 16,877 17,506March 28,304 22,911 14,814 7,266 22,094 23,728April 23,598 22,531 23,229 25,418 20,875 19,729May 22,146 24,147 22,220 23,854 23,743 26,778June 31,152 28,952 29,092 42,440 30,028 27,112July 26,492 28,092 13,965 27,592 30,339 24,601August 28,539 29,703 29,686 28,624 26,038 31,324September 28,455 25,237 27,491 27,676 25,257 22,176October 22,242 24,431 24,331 10,401 22,791 22,074November 26,850 25,857 24,537 7,827 23,433 26,481December 32,923 23,274 23,485 10,585 26,288 26,519TOTAL 319,224 301,506 292,683 275,743 290,531 291,977BEERJanuary 84,043 155,065 171,658 229,997 132,355 145,971February 140,870 145,286 122,282 138,646 117,378 121,631March 133,662 126,082 126,841 68,802 148,904 140,694April 153,189 151,213 146,535 163,238 153,214 145,602May 163,514 173,463 176,583 169,945 192,494 198,817June 241,805 232,259 233,292 218,375 233,729 221,117July 238,211 219,915 240,210 347,290 240,039 214,733August 247,744 235,635 241,876 188,353 219,726 243,556September 240,894 224,500 216,449 259,242 203,782 189,210October 172,101 184,304 188,059 97,871 153,718 158,673November 182,026 178,297 170,537 78,382 150,877 165,227December 154,824 133,344 141,485 81,302 146,217 135,970TOTAL 2,152,883 2,159,363 2,175,807 2,041,443 2,092,433 2,081,201
ALCOHOLIC BEVERAGES DISTRIBUTED OR SOLDFourth Judicial District
2013-2018
------------------------------IN GALLONS------------------------------
SOURCE: Alaska Department of Revenue, Report of Alcoholic Beverages Distributed or Sold, 2013-2019.The 4th Judicial District includes Fairbanks, Bethel, Delta Jct., Ft. Yukon, Galena, Healy, Nenana, Rampart,Tanana & Tok.NOTE: All gallons rounded to the nearest whole gallon for reporting purposes.

Population and Social Conditions
41 Winter 2018 Community Research Quarterly
TotalYear Liquor Wine Beer Gallons1980 202,099 165,259 1,987,710 2,355,068 10%1981 224,084 187,968 2,178,041 2,590,093 10.0%1982 238,162 192,634 2,225,209 2,656,005 2.5%1983 238,056 206,550 2,437,909 2,882,515 8.5%1984 224,666 228,067 2,414,750 2,867,483 -0.5%1985 211,861 222,148 2,385,227 2,819,236 -1.7%1986 166,064 198,852 2,187,939 2,552,855 -9.4%1987 165,766 195,227 2,157,696 2,518,689 -1.3%1988 156,158 169,387 2,060,926 2,386,471 -5.2%1989 153,093 158,816 1,843,109 2,155,018 -9.7%1990 157,740 168,780 2,040,133 2,366,653 9.8%1991 160,334 160,079 2,072,898 2,393,311 1.1%1992 156,997 169,307 2,155,268 2,481,572 3.7%
1993# 147,971 140,573 1,971,294 2,259,838 -8.9%1994 174,206 172,048 2,239,190 2,585,444 14.4%1995 157,502 169,369 2,163,870 2,490,741 -3.7%1996 156,754 186,899 2,124,892 2,468,545 -0.9%1997 153,440 175,481 2,123,419 2,452,340 -0.7%1998 161,313 182,293 2,256,574 2,600,180 6.0%1999 163,599 188,063 2,397,989 2,749,651 5.7%
2000# 165,256 189,689 2,381,779 2,736,724 -0.5%2001 169,696 201,823 2,300,564 2,672,083 -2.4%2002 186,477 220,965 2,375,380 2,782,822 4.1%
2003** 159,510 218,309 2,263,094 2,640,913 -5.1%2004** 179,574 228,859 2,363,897 2,772,330 5.0%2005** 189,249 237,384 2,322,680 2,749,313 -0.8%2006** 193,641 254,251 2,297,600 2,745,492 -0.1%2007** 186,879 254,344 2,298,831 2,740,054 -0.2%2008** 203,539 283,329 2,205,837 2,692,705 -1.7%2009** 235,351 311,889 2,532,419 3,079,659 14.4%2010** 223,669 283,058 2,415,629 2,922,356 -5.1%2011** 243,091 319,420 2,331,426 2,893,937 -1.0%2012** 235,860 312,264 2,319,975 2,868,099 -0.9%2013** 234,491 319,224 2,152,883 2,706,598 -5.6%2014** 221,252 301,506 2,159,363 2,682,121 -0.9%2015** 216,450 292,683 2,175,807 2,684,940 0.1%2016** 207,776 275,743 2,041,443 2,524,962 -6.0%2017** 228,749 290,531 2,092,433 2,611,713 3.4%2018** 226,688 291,977 2,081,201 2,599,866 -0.5%
10 Yr/Avg 227,338 299,830 2,230,258 2,757,425
ANNUAL ALCOHOLIC BEVERAGES DISTRIBUTED OR SOLDFourth Judicial District
1980-2018
--------------------IN GALLONS-------------------- % Change fr/prev Yr.
SOURCE: Alaska Department of Revenue, Report of Alcoholic Beverages Distributed or Sold, 1980 -2018.NOTE: The 4th Judicial District includes Fairbanks, Bethel, Delta Jct., Ft. Yukon, Galena, Healy, Nenana, Rampart, Tanana andTok.** Beginning in 2003, qualifying beer includes the category malt beverage in its total.# 1993 totals revised January 1998. 2000 totals revised July 2001.

Harding Lake
Birch Lake
Quartz Lake
Volkmar Lake
Blair Lakes
Tanana River
Sal chaRiver
Chena River
Chena Lakes
Chatanika River
YukonR iver
James Dal to n Hwy
Alaska Hwy
Richardson Hwy
Denali Hwy
Elli ot
t Hwy
Circle Hot Springs Rd
S teese Highway
Chena Hot Springs Rd
Parks Highway
Elliott H ighwayOld Murphy Dome Road
Johnson Road
College Road
P A C I F I C O C E A N
A R C T I C O C E A N
G u l f o fA l a s k a
B e a u f o r t S e a
B r i s t o lB a y
B e r i n gS e a
NORTHWESTTERRITORIES
YUKON
ALASKA
NUNAVUT
BRITISHCOLUMBIA
CHUKOTKA
Fairbanks North Star Borough VicinityTo
lovan
aRi
ver
Li ttleChena
River
Go
od P aster
River
Fairbanks NorthPole
PopulationUS Census: 99,703Size: 7,361 square miles 19,065 square kilometersCertified AssessedValuation: $9,099,028,572 (non-pipeline) $735,113,850 (pipeline)
Date ofIncorporation: January 1, 1964Form ofGovernment: Second Class BoroughType ofGovernment: Borough Mayor, 3 yr. Term Assembly, 9 Members Elected at large, 3 yr. Terms
0 20 4010Miles
²Prepared for Community Planning
GIS Division, bmdMarch 3rd, 2015

TO:
Fairbanks North Star BoroughCommunity Planning DepartmentPO Box 71267Fairbanks, AK 99707-1267