Embed Size (px)
Citation preview

Community Health Status Assessment:
Nelson County
Mobilizing for Action through Planning and Partnerships
A Compilation of Data that Reflects the Community’s Health

DemographicsSocioeconomicsHealth Resource Availability
Section One: Who are we and what do we bring to the table?

Demographics

Population Growth TJHD by Locality, 1990-2010
Albemarle (18%)
Charlottesville (8%)
Fluvanna (28%)
Greene (21%) Louisa (29%) Nelson (4%)0
10,000
20,000
30,000
40,000
50,000
60,000
70,000
80,000
90,000
100,000
68,172
40,475
12,42910,297
20,235
12,778
98,970
43,475
25,691
18,403
33,153
15,020
1990 2000 2010
Locality (% Change 2000-2010)
Nu
mb
er
of
Pe
rso
ns
Liv
ing
in L
oca
lity
Source: Weldon Cooper Center

Percent Change in PopulationTJHD by Locality, TJHD, and Virginia
1990-2010
Source: Weldon Cooper Center and the Thomas Jefferson District Planning Commission
1990 2000 2010 % Change 1990-2000
%Change 2000-2010
Albemarle 68,172 84,186 98,970 23% 18%
Charlottesville 40,475 40,099 43,475 -1% 8%
Fluvanna 12,429 20,047 25,691 61% 28%
Greene 10,297 15,244 18,403 48% 21%
Louisa 20,235 25,627 33,153 26% 29%
Nelson 12,778 14,445 15,020 13% 4%
TJHD 164,476 199,648 234,712 21% 18%
Virginia 6,189,317 7,079,030 8,001,024 14% 13%

Age and Sex DistributionNelson County, 2010
Source: U.S. Census Bureau
Under 5 years
5 to 9 years
10 to 14 years
15 to 19 years
20 to 24 years
25 to 29 years
30 to 34 years
35 to 39 years
40 to 44 years
45 to 49 years
50 to 54 years
55 to 59 years
60 to 64 years
65 to 69 years
70 to 74 years
75 to 79 years
80 to 84 years
85 to 89 years
90 years and over
2,0001,5001,00050005001,0001,5002,000
Male Female

Age DistributionNelson County, 2000, 2010
Source: U.S. Census Bureau
< 18 yrs 18-24 yrs 25-44 yrs 45-64 yrs 65+ yrsNelson
0
1000
2000
3000
4000
5000
6000
3,133
920
3,692
4,280
2,420
2,892
931
3,085
5,124
2,988
2000 2010
Nu
mb
er
of
Pe
rso
ns
Liv
ing
in L
oca
lity

Racial CompositionNelson County, 2010
Source: U.S. Census Bureau
• Other includes: American Indian, Alaska Native, Native Hawaiian, Pacific Islander, and some other race
White83.3%
Black13.1%
Asian0.5%
Other1.5%
Two or more races1.7%
White Black AsianOther Two or more races

Percent of Population by RaceTJHD by Locality, 1980-2010
Percent of Population
1980 1990 2000 2010
Albemarle CountyBlack 11% 10% 10% 10%
White 87% 86% 85% 81%
City of CharlottesvilleBlack 18% 21% 22% 19%
White 81% 76% 70% 69%
Fluvanna CountyBlack 29% 23% 18% 15%
White 70% 77% 79% 81%
Greene CountyBlack 8% 6% 6% 6%
White 92% 93% 91% 88%
Louisa CountyBlack 33% 26% 22% 18%
White 67% 74% 77% 78%
Nelson CountyBlack 24% 19% 15% 13%
White 76% 80% 83% 83%
Source: U.S. Census Bureau

Percent Change in Hispanic PopulationNelson County and Virginia, 2000-2010
Source: U.S. Census Bureau
Nelson Virginia0%
1%
2%
3%
4%
5%
6%
7%
8%
9%
2000 2010
Pe
rce
nt
of
To
tal P
ers
on
s L
ivin
g in
Lo
calit
y th
at
is H
isp
an
ic
305
459
51% increase
92% increase
1,102
329,540
631,825

Limited English Proficient Student Enrollment Nelson County, TJHD, and Virginia, 2002-2012
Source: Virginia Department of Education
2002-03 2003-04 2004-05 2005-06 2006-07 2007-08 2008-09 2009-10 2010-11 2011-12-1%
0%
1%
2%
3%
4%
5%
6%
7%
8%
9%
10%
11%
12%
1.9%
2.2%
2.9%
4.6%4.2%
7.2%
Nelson TJHD Virginia
Pe
rce
nt
of
To
tal S
tud
en
ts E
nro
lled
in P
ub
lic
Sch
oo
ls

SSI and Disabled OASDI BeneficiariesTJHD by Locality and Virginia, 2011
Source: U.S. Social Security Administration; U.S. Census Bureau
Total Number of
BeneficiariesTotal
PopulationPercent of the
Population
Albemarle 2,428 98,970 2.45%
Charlottesville 1,806 43,475 4.15%
Fluvanna 899 25,691 3.50%
Greene 725 18,403 3.94%
Louisa 1,850 33,153 5.58%
Nelson 891 15,020 5.93%
Virginia 355,299 8,001,024 4.44%
Residents who received SSI (Supplemental Security Income) benefits, excluding those who also received OASDI (Old-Age, Survivors, and Disability Insurance) benefits to avoid duplication, PLUS persons classified as “Disabled” who received OASDI benefits.

Percent of Supplemental Security Income (SSI) Recipients
Nelson County, 2010
Nelson County2.4%
Source: Weldon Cooper Center, County Health Rankings; U.S. Social Security Administration
*Measured as December 2010 recipients of SSI benefits divided by the total population

Percent of Students Receiving Special Education
Nelson County, 2006-2010
Source: Virginia Department of Education; U.S. Census Bureau, Small Area Health Insurance Estimates
2006 2007 2008 2009 20100%
1%
2%
3%
4%
5%
6%
7%
8%
9%
10%
11%
9.78%
8.61%
Nelson
Pe
rce
nt
of
To
tal C
hild
ren
Ag
ed
19
an
d U
n-
de
r L
ivin
g in
Lo
calit
y

2008 2009 2010 2011 2008 2009 2010 2011Nelson Virginia
0%
10%
20%
30%
40%
50%
60%
70%
80%
90%
100%
80.1% 78.7% 77.8%85.3% 82.1% 83.2%
85.5% 86.6%
72.5%
64.8%
72.2%
84.2%
70.6% 73.2%
77.6% 79.9%
Pe
rce
nt
of
Stu
de
nts
in C
oh
ort
**
On-Time* Graduation Rate Nelson County and Virginia, 2008-2011
Source: Virginia Department of Education
*The percentage of students in a cohort who earn a diploma within 4 years of entering high school**Cohort: Students who entered the ninth grade for the first time together and were scheduled to graduate 4 years later

Educational AttainmentCharlottesville Metro Area, and Virginia, 2011
Source: American Community Survey
High School 2011 Bachelor's Degree 2011 Advanced Degree 20110%
10%
20%
30%
40%
50%
60%
70%
80%
90%
100%
88.1%
44.7%
21.5%
87.8%
35.1%
14.6%
Charlottesville Metro Area Virginia
Pe
rce
nt
of
To
tal P
ers
on
s A
ge
d 2
5 a
nd
O
ver
Liv
ing
in L
oca
lity

Socioeconomics

Median Household IncomeNelson County, Virginia, and U.S., 2000-2011
Source: U.S. Census Bureau, Small Area Income and Poverty Estimates
2000 2001 2002 2003 2004 2005 2006 2007 2008 2009 2010 2011$0
$5,000
$10,000
$15,000
$20,000
$25,000
$30,000
$35,000
$40,000
$45,000
$50,000
$55,000
$60,000
$65,000
$70,000
$75,000
$37,565
$46,055
$46,789
$61,877
$41,990
$50,502
Nelson Virginia U.S.
An
nu
al I
nco
me
in D
olla
rs

Nelson County13.1%
Source: Weldon Cooper Center; U.S. Census Bureau, Small Area Income and Poverty Estimates
Percent of Persons in PovertyNelson County, 2010

Percent of Persons in Poverty Nelson County, Virginia, and U.S., 2000-2011
Source: U.S. Census Bureau, Small Area Income and Poverty Estimates
2000 2001 2002 2003 2004 2005 2006 2007 2008 2009 2010 2011-2%
0%
2%
4%
6%
8%
10%
12%
14%
16%
18%
20%
22%
24%
26%
28%
30%
10.3%
13.6%
8.9%
11.6%
11.3%
15.9%
Nelson Virginia U.S.
Pe
rce
nt
of
To
tal P
ers
on
s L
ivin
g in
Lo
calit
y

Percent of Children in PovertyNelson County, Virginia, and U.S., 2000-2011
Source: U.S. Census Bureau, Small Area Income and Poverty Estimates
2000 2001 2002 2003 2004 2005 2006 2007 2008 2009 2010 2011-2%
0%
2%
4%
6%
8%
10%
12%
14%
16%
18%
20%
22%
24%
26%
28%
30%
14.6%
21.0%
12.2%
15.6%
16.2%
22.5%
Nelson Virginia U.S.
Pe
rce
nt
of
To
tal C
hild
ren
Ag
ed
18
an
d U
nd
er
Liv
-in
g in
Lo
calit
y

2005-06 2006-07 2007-08 2008-09 2009-10 2010-11 2011-120%
5%
10%
15%
20%
25%
30%
35%
40%
45%
50%
55%
60%
42.9%
55.2%
50.1%
30.2%
36.0%32.9%
39.7%
Nelson TJHD Virginia
Pe
rce
nt
of
To
tal S
tud
en
ts E
nro
lled
in P
ub
lic
Sch
oo
ls in
Lo
calit
yPercent of Students Eligible for
Free/Reduced Lunch Nelson County, TJHD, and Virginia, 2005-2012
Source: Virginia Department of Education, School Nutrition Program

2001 2002 2003 2004 2005 2006 2007 2008 2009 2010 20110
100
200
300
400
500
600
700
800
900
1,000
1,100
1,200
410
1,099
Nelson
Nu
mb
er
of
Ho
use
ho
lds
En
rolle
dNumber of Households Receiving Supplemental Nutrition Assistance
Nelson County, 2001-2011
Source: Virginia Department of Social Services
168% increase

Nelson County13.7%
Source: Weldon Cooper Center; Virginia Department of Social Services
Percent of Supplemental Nutrition Assistance Program (SNAP) Participants
Nelson County, 2010
*Measured as average monthly persons on SNAP divided by the total population

Number of Homeless PersonsTJHD, 2004-2011
Source: Thomas Jefferson Area Coalition for the Homeless (TJACH)
2004 2005 2006 2007 2008 2009 2010 20110
50
100
150
200
250
300
129
277
235
35 18
Sheltered Unsheltered
Nu
mb
er
of
Ho
me
less
Pe
rso
ns

Unemployment RateNelson County, TJHD, Virginia, and U.S., 2000-2011
2000 2001 2002 2003 2004 2005 2006 2007 2008 2009 2010 20110%
1%
2%
3%
4%
5%
6%
7%
8%
9%
10%
11%
Nelson; 2.3%
Nelson; 5.4%
TJHD 2.1%
TJHD 5.5%
Virginia 2.3%
6.2%
4.0%
8.9%
Nelson TJHD Virginia United States
Per
cent
of T
otal
Per
sons
Age
d 16
and
Ove
r Li
ving
in L
ocal
ity
Source: Virginia Workforce Connection

Health Resource Availability

Sources of Health Insurance Virginia and U.S., 2010
Source: Kaiser Family Foundation
Virginia United States
Employer; 49%
Medicare; 13%
Medicaid; 16%
In-di-vidual; 5%
Other
Pub-lic; 1%
Uninsured;
16%
Employer; 55%
Medicare; 12%
Medicaid; 9%
In-di-vid-ual; 5%
Other Pub-lic; 4%
Uninsured; 14%
Percentages may not sum to 100% due to rounding effects

Health Insurance Coverage by AgeVirginia, 2010-2011
Source: U.S. Census Bureau, Annual Social and Economic Supplement
< 18 yrs 18-64 65+ yrs0%
10%
20%
30%
40%
50%
60%
70%
80%
90%
100%
67.7%70.3%
61.8%
35.4%
18.0%
94.9%
5.9%
18.8%
0.8%
Private Government Not Covered
Pe
rce
nt
of
To
tal P
ers
on
s in
Ag
e G
rou
p L
ivin
g
in L
oca
lity

Estimated Uninsured Persons, 18-64Nelson County, TJHD, and Virginia, 2005-2010
Source: U.S. Census Bureau, Small Area Health Insurance Estimates
2005 2006 2007 2008 2009 20100%
5%
10%
15%
20%
25%
30%
35%
Nelson TJHD Virginia
Pe
rce
nt
of
To
tal P
ers
on
s A
ge
d 1
8 t
o 6
4 L
ivin
g
in L
oca
lity

Estimated Uninsured Persons <19 YearsNelson County and Virginia, 2006-2010
Source: U.S. Census Bureau, Small Area Health Insurance Estimates
2006 2007 2008 2009 20100%
2%
4%
6%
8%
10%
12%
14%
16%
18%
15.2%
10.2%
12.8%
7.9%
10.4%
7.0%
Nelson TJHD Virginia
Pe
rce
nt
of
Pe
rso
ns
Ag
ed
Le
ss t
ha
n 1
9 Y
ea
rs
Liv
ing
in L
oca
lity

Medicaid Enrollment and Spending by Recipient Group Virginia and U.S., FY 2009
Source: Kaiser Family Foundation
Enrollment 0.95M
Spending $5.55B
Enrollment 62.59M
Spending $346B
Virginia United States
0%
10%
20%
30%
40%
50%
60%
70%
80%
90%
100%
55%
25%
49%
21%
16%
10%
26%
14%
11%
20%
10%
23%
18%
45%
15%
42%
Children Adults Elderly Disabled
Pe
rce
nt
of
To
tal E
nro
llme
nt/
Sp
en
din
g
United StatesVirginia

Number of Primary Care ProvidersTJHD by Locality, 2011
Source: UVA Physician Directory; Martha Jefferson Hospital Physician Directory
Internal
MedicinePediatrics
Family Medicine
OB/GYN Geriatrics
Albemarle/Charlottesville 65 39 67 27 8
Fluvanna 3 1 4 - 1
Greene - - 4 - -
Louisa 1 1 8 - -
Nelson - - 9 - -
TJHD 69 41 92 27 9

Number of Charlottesville Free Clinic Medical Patients
TJHD by Locality, FY2012
61040.48%
52134.57%
1036.83%
583.85%
916.04%
261.73%
956.30%
30.20%
Albemarle Charlottesville Fluvanna Greene Louisa Nelson Other Unknown
Source: Charlottesville Free Clinic

Number of Dental Service ProvidersTJHD by Locality, 2012
Source: Community Dental Center; DentaQuest; yellow pages
Dentists in General Practice, Oral Surgery and Pediatric Specialists
Albemarle/Charlottesville 189
Fluvanna 11
Greene 8
Louisa 9
Nelson 10

Number of Charlottesville Free Clinic Dental Patients
TJHD by Locality, FY2012
Source: Charlottesville Free Clinic
98952.80%
55829.79%
1105.87%
985.23%
573.04%
30.16%
542.88%
40.21%
Albemarle Charlottesville Fluvanna Greene Louisa Nelson Other Unknown

Average Number of Community Dental Center Patients Served Per Month, FY2010-2012
Source: Community Dental Center
FY2010 FY2011 FY20120
50
100
150
200
250
300
350
400
450
500
550
600
495
564
522
Ave
rag
e N
um
be
r o
f P
atie
nts
Se
rve
d P
er
Mo
nth

Medicaid/FAMIS Enrollees <19 Years Receiving Dental Services
Nelson County and TJHD, FY 2007- FY 2010
Source: Virginia Smiles for Children
2006-2007 2007-2008 2008-2009 2009-20100%
10%
20%
30%
40%
50%
60%
41.8%44.2%
47.2%
50.3%
40.4%
44.2%46.4%
52.3%
Nelson TJHD
Pe
rce
nt
of
To
tal P
ed
iatr
ic M
ed
ica
id/F
AM
IS
En
rolle
es
Liv
ing
in L
oca
lity

Number of Licensed Mental Health Providers TJHD by Locality, 2011
Source: Mental Health America
Clinicians Practices
PsychiatristsLicensed Therapists
Total Practices
Practices Serving Youth
Practices Accepting Medicaid
Albemarle/Charlottesville
24 115 66 7 35
Fluvanna 0 3 3 2 2
Greene 0 1 1 1 1
Louisa 2 16 4 2 2
Nelson 0 3 2 2 2
TJHD 26 135 73 11 39

Number of Region Ten Community Services Board Direct Service Staff
TJHD by Locality, 2012
Source: Region Ten
Number of Mental Health
Direct Service Staff
Albemarle/Charlottesville 161
Fluvanna 11
Greene 15
Louisa 14
Nelson 18
TJHD 219
All mental health direct service staff at Region Ten – anyone who provides mental health services, whether licensed or not

Number of Public Health Staff by SpecialtyTJHD by Locality, 2012
Local Health
Department
Number of Full-Time Equivalent Positions
Public Health Nurses
Environmental Health
SpecialistsNutritionists Clinicians
Public Health
Specialists
Albemarle/Charlottesville
10.65 9.00 3.70 0.70 4.40
Fluvanna 2.40 1.47 0.19 0.11 0.80
Greene 2.45 1.52 0.29 0.11 0.80
Louisa 4.85 2.59 0.63 0.37 2.00
Nelson 2.15 1.42 0.19 0.11 0.80
TJHD 22.50 16.00 5.00 1.40 8.80
Source: Thomas Jefferson Health District

Section Two: What are the strengths and risks in our community that
contribute to health?
Community ResourcesCommunity SafetyEnvironmental QualityHealth Behaviors

Community Resources

JAUNT PassengersNelson County, FY2008-FY2012
Source: Jaunt Ridership Report
*Passengers are counted by trip and may be duplicated
FY08 FY09 FY10 FY11 FY120
2,000
4,000
6,000
8,000
10,000
12,000
14,000
16,000
18,000
20,000
16,018
14,037
18,508
Nelson
Nu
mb
er
of
Pa
sse
ng
ers
(b
y p
lace
of
ori
gin
)

JAUNT Passengers by TypeTJHD, FY2008–FY2012
Source: Jaunt Ridership Report
FY08 FY09 FY10 FY11 FY120
50,000
100,000
150,000
200,000
250,000
300,000
350,000
75,353 82,703 84,080 81,128 86,606
92,19696,408 96,110 98,122 100,738
67,17879,322 84,377 93,819
93,279
Medical Elderly and Disabled (nonmedical)Children and Youth Elderly Nutrition ServicesRural Routes Other
Nu
mb
er
of
Pa
sse
ng
ers

Recreational Facilities TJHD by Locality and Virginia, 2009
Source: County Health Rankings
Albemarle Charlottesville Fluvanna Greene Louisa Nelson Virginia0
5
10
15
20
25
12.6
21.3
7.8
5.4
9.1
6.5
11
Fa
cilit
ies
pe
r 1
00
,00
0 P
ers
on
s L
ivin
g in
Lo
cal-
ity
National Bench-mark

Food Stores by TypeNelson County, 2009
Source: U.S. Department of Agriculture
4
167
7
1
Grocery stores Supercenters & club stores Convenience storesSpecialized food stores Fast-food restaurants Full-service restaurantsFarmers' markets

Number of children < 5 yrs old residing in locality 7,832 1,592 1,310 2,029 727
Licensed Childcare Centers & Preschool Programs
Number of Slots Available (Includes 1 mo to 5 yrs old and 6-12 yrs old after school) 3,919 279 434 381 393
Number of Facilities 54 4 7 12 7
Number of those Facilities that Accept
Ages
1 mo to 1 yr old 19 2 1 1 -1 to 2 yrs old 6 - 1 - -2 to 4 yrs old 23 - 3 7 54 to 5 yrs old 6 2 2 4 2
Family Day Homes
Number of Slots Available (Includes 1 mo to 5 yrs old and 6-12 yrs old after school) 174 44 0 76 12
Number of Facilities 16 4 0 7 1
Number of those Facilities that Accept
Ages
1 mo to 1 yr old 12 2 - 7 11 to 2 yrs old 1 2 - - -2 to 4 yrs old 3 - - - -4 to 5 yrs old - - - - -
Source: Virginia Department of Social Services
Licensed Child Care FacilitiesTJHD by Locality, 2012
Fluvanna
GreeneLouisa
Nelson
Charlotte
sville &
Albemarle

Community Safety

2000 2001 2002 2003 2004 2005 2006 2007 2008 2009 2010 20110
1000
2000
3000
4000
5000
6000
7000
8000
9000
10000
11000
12000
13000
14000
3,724.50
2,782.93
6,016.59
4,336.80
Nelson TJHD
Re
po
rte
d G
rou
p A
Off
en
ses*
pe
r 1
00
,00
0
Pe
rso
ns
Liv
ing
in L
oca
lity
Reported Crime Incident Rates Nelson County and TJHD, 2000-2011
*Reported Group A Offenses; arson, assault, bribery, burglary, counterfeiting/forgery, destruction/damage/vandalism of property; drug/narcotic; embezzlement; extortion/blackmail; fraud; gambling; homicide; kidnapping/abduction; larceny/theft; motor vehicle theft; pornography/obscene material; prostitution; robbery; sex, forcible and non-forcible; stolen property; weapon law violations
Source: Department of State Police, Virginia Uniform Crime Reporting Program

Violence Incidence Rates in SchoolsNelson County, TJHD, and Virginia, 2007-2011
Source: Virginia Department of Education
0
2
4
6
8
10
12
14
16
18
20
22
24
2624.95
3.92
8.14
4.34 3.85
0.61
2.66
0.38
3.78
5.54
15.47
2.74
6.53
2.64
5.20
0.36
2.571.00
1.58
6.08
12.73
3.465.03
2.47
6.67
0.35
5.14
0.96 1.45
4.82
Nelson TJHD Virginia
Inci
de
nts
pe
r 1
,00
0 S
tud
en
ts E
nro
lled
in
Pu
blic
Sch
oo
ls in
Lo
calit
y

Founded Child Abuse and Neglect Rates
TJHD and Virginia, 2000-2011
Source: Virginia Department of Social Services
*Five-year rolling averages of Rate of Abuse and Neglect per 1,000 Children (Founded Investigations and Duplicated)
2000-04 2001-05 2002-06 2003-07 2004-08 2005-09 2006-10 2007-110
1
2
3
4
5
6
7
1.94
2.853.03
2.47
TJHD Virginia
Fo
un
de
d C
hild
Ab
use
an
d N
eg
lect
Re
po
rts
pe
r 1
,00
0 C
hild
ren
Ag
ed
0-1
7 L
ivin
g in
Lo
calit
y

Reported Adult Abuse and Neglect Rates, TJHD and Virginia, 2008-2011
Source: Virginia Department of Social Services
2008 2009 2010 20110
1
2
3
4
5
6
7
8
9
10
11
12
5.254.96
2.41 2.88
TJHD Virginia
Ad
ult
Pro
tect
ive
Se
rvic
e R
ep
ort
s p
er
1,0
00
A
du
lts A
ge
d 1
8 a
nd
Ove
r L
ivin
g in
Lo
calit
y

Drug/Narcotic Arrest RatesNelson County, TJHD, and Virginia, 2000-2011
Source: Department of State Police, Virginia Uniform Crime Reporting Program
2000-02 2001-03 2002-04 2003-05 2004-06 2005-07 2006-08 2007-09 2008-10 2009-110
100
200
300
400
500
600
700
800
900
1000
1100
1200
293.1318.4
439.2
495.0455.4
595.7
Nelson TJHD Virginia
Dru
g/N
arc
otic
Arr
est
s p
er
10
0,0
00
Pe
rso
ns
Liv
-in
g in
Lo
calit
y
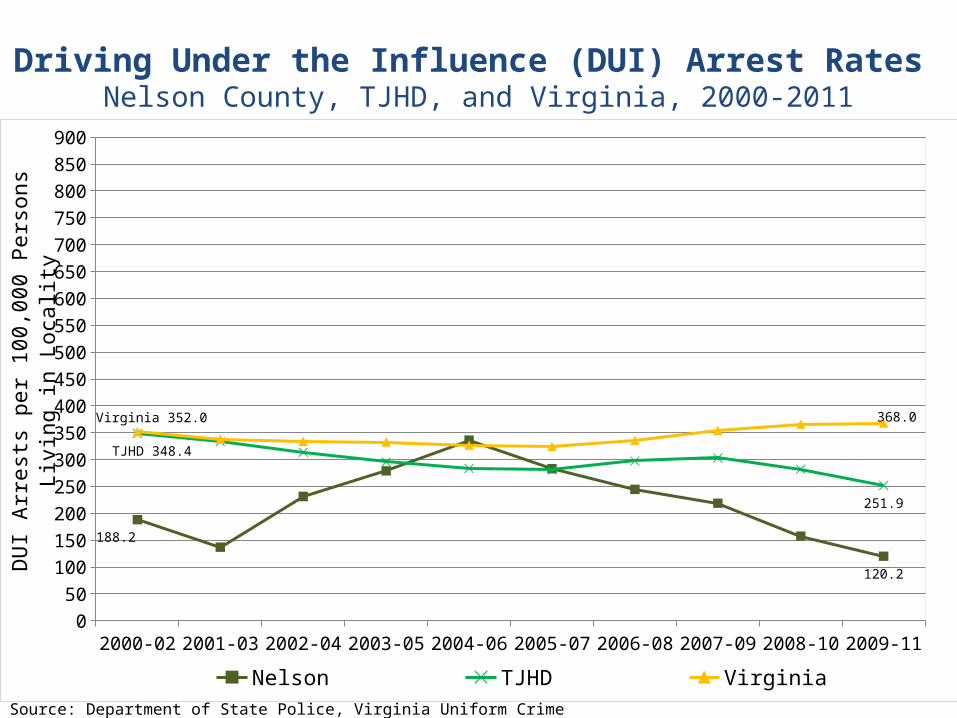
Driving Under the Influence (DUI) Arrest Rates Nelson County, TJHD, and Virginia, 2000-2011
2000-02 2001-03 2002-04 2003-05 2004-06 2005-07 2006-08 2007-09 2008-10 2009-110
50
100
150
200
250
300
350
400
450
500
550
600
650
700
750
800
850
900
188.2
120.2
TJHD 348.4
251.9
Virginia 352.0 368.0
Nelson TJHD Virginia
DU
I A
rre
sts
pe
r 1
00
,00
0 P
ers
on
s L
ivin
g in
Lo
calit
y
Source: Department of State Police, Virginia Uniform Crime Reporting Program

Environmental Quality

Air Quality Index Report Charlottesville, Fairfax, Richmond, and Virginia Beach
2011
Source: Environmental Protection Agency
Air Quality Rating
Total Number of
Days Monitored
(Number of days at each rating)
Good Moderate
Unhealthy for
Sensitive Groups
Unhealthy for
Anyone
Charlottesville CBSA 330 (91%) 34 (9%) 0 (0%) 0 (0%) 364
Fairfax CBSA 295 (82%) 54 (15%) 9 (2%) 2 (1%) 360
Richmond CBSA 283 (78%) 70 (19%) 11 (3%) 1 (0%) 365
Virginia Beach CBSA 276 (76%) 79 (21%) 10 (3%) 0 (0%) 365*Cities are defined as Core Based Statistical Areas (CBSA) – Charlottesville CBSA includes Albemarle, Fluvanna, Greene, and Nelson Counties and the City of Charlottesville; Richmond CBSA includes the Amelia, Caroline, Charles City, Chesterfield, Cumberland, Dinwiddie, Goochland, Hanover, Henrico, King And Queen, King William, Louisa, New Kent, Powhatan, Prince George and Sussex Counties as well as the Cities of Colonial Heights, Hopewell, Petersburg and Richmond.

Good and Impaired Streams in Watersheds Nelson County, 2008
Source: Environmental Protection Agency
Maury Middle James - Buffalo Rivanna South Fork Shenandoah0%
10%
20%
30%
40%
50%
60%
70%
80%
90%
100%
23
7827
117
33
5928
39
Impaired Streams Good Streams
Pe
rce
nt
of
To
tal S
tre
am
s in
Wa
ters
he
d

Watersheds that Drain IntoNelson County
Source: Environmental Protection Agency
Middle James - Buffalo
Rivanna
South Fork Shenandoah
MauryNelsonCounty

Impaired StreamsNelson County, 2010
Source: Thomas Jefferson District Planning Commission
Tye River North Fork
Buffalo River
Rockfish River

Rivanna: Biological Health ScoresNelson County, 2006-2009
Source: StreamWatch
6%
22%
56%
13%
3%
Very Good Good
Fair Poor
Very Poor
Samples are scored per an index that reflects the composition and diversity of the array of captured organisms. Site health is assessed based on all scores generated during the assessment window

Lead Exposure: At-Risk Zip Codes*TJHD by Locality, 2011
Source: Virginia Department of Health, Lead Safe Virginia
Albemarle 2290122931
(Covesville)22937
(Esmont)22943
(Greenwood)22947
(Keswick)22959
(North Garden)24590
(Scottsville)
Charlottesville 22903
Fluvanna 23022 23084
Greene 22935(Dyke)
Louisa 23024
Nelson 22938 (Faber)
22964 (Piney River)
22969 (Schuyler
)
22971 (Shipman)
24464 (Montebello
)
24553 (Gladstone)
*VDH identifies areas in Virginia at risk for lead exposure as those with more than 27% of homes built before 1950 and/or those with an increased prevalence of children with elevated blood lead levels (EBLL)

Elevated Blood Lead Level Tests and Results in Children <72 Months of Age
Nelson County and TJHD, 2004-2011
Source: Virginia Department of Health, Lead Safe Virginia
2004 2005 2006 2007 2008 2009 2010 20110
10
20
30
40
50
60
70
80
90
100
0
250
500
750
1,000
1,250
1,500
1,750
2,000
2,250
2,500
3 41
23 3
30
11
9 63 10 10
894 90
150127 113
198 176 195
859
963
2,153
1,929
1,052
1,980
1,852
2,402
Nelson TJHD NelsonTJHD
Nu
mb
er
of
Te
sts
Re
turn
ing
Po
sitiv
e (
ba
rs)
Nu
mb
er
of
Ch
ildre
n <
72
Mo
nth
s o
f A
ge
Te
ste
d
(Lin
es)

Health Behaviors

Low dietary polyunsaturated fatty acids (PUFA)
Low intake of fruits and vegetables
Alcohol use
High dietary trans fatty acids
Low dietary omega-3 fatty acids
High dietary salt
High LDL cholesterol
High blood glucose
Physical inactivity
Overweight-obesity (high BMI)
High blood pressure
Tobacco smoking
0 100 200 300 400 500
15
58
64
82
84
102
113
190
191
216
395
467
Septicemia
Kidney Disease
Influenza and Pneumonia
Alzheimer's Disease
Diabetes
Unintentional Injuries
Chronic Lower Respiratory Diseases
Stroke
Cancer
Heart Disease
-10% 0% 10% 20% 30%
1.4%
1.8%
2.5%
2.8%
3.1%
4.7%
5.1%
6.3%
23.1%
37.2%
Percentage of Total Deaths Deaths (in thousands)
Source: Danaei G, Ding EL, Mozaffarian D, Taylor B, Rehm J, et al. (2009) The Preventable Causes of Death in the United States: Comparative Risk Assessment of Dietary, Lifestyle, and Metabolic Risk Factors. PLoS Med 6(4):Heron, M., Tejada-Vera, B. (2009). Deaths: Leading Causes for 2005. National Vital Statistics Reports. 58(8)
Leading Causes of Death Deaths Attributable to Individual Risk Factors
Leading vs. Actual Causes of Death

Self-Reported Adult SmokersTJHD and Virginia, 2000-2010
2000-2002 2001-2003 2002-2004 2003-2005 2004-2006 2005-2007 2006-2008 2007-2009 2008-20100%
5%
10%
15%
20%
25%
17.6% 17.9%
22.9%
18.0%
TJHD Virginia
Pe
rce
nt
of
Ad
ults
Ag
ed
20
an
d O
ver
Liv
ing
in
Lo
calit
y
Healthy People 2020
Source: Virginia Department of Health, Virginia Behavioral Risk Factor Surveillance Survey

Tobacco Facts Virginia, 2012
Virginia United States
Adult Smoking Rank(1st = low smoking rates)
31st N/A
Cigarette Tax(per pack)
$0.30($0.35 local tax for Cville)
$1.46
Cigarette Tax Rank(1st = high taxes)
50th N/A
FY 2012 Funding for State TC Programs(millions)
$8.4 $456.7
Tobacco Prevention Spending % of CDC Target
8.1% 12.5%
Tobacco Prevention Spending Rank(1st =high spending rates)
30th N/A
Source: Campaign for Tobacco-Free Kids; City of Charlottesville City Treasurer Website

Physical InactivityTJHD by Locality and Virginia, 2009
Source: Behavioral Risk Factor Surveillance System; County Health Rankings *Numbers are self-reported
Albemarle Charlottesville Fluvanna Greene Louisa Nelson Virginia0%
5%
10%
15%
20%
25%
30%
35%
19%
26%
22%
24%
30%
25%24%
Est
ima
ted
pe
rce
nt
of
ad
ults
ag
ed
20
an
d o
ver
rep
ort
ing
no
le
isu
re t
ime
ph
ysic
al a
ctiv
ity

Obesity Trends Among U.S. Adults1985
(*BMI ≥30, or ~ 30 lbs. overweight for 5’ 4” person)
No Data <10% 10%–14%
Source: Centers for Disease Control and Prevention, Behavioral Risk Factor Surveillance System

(*BMI ≥30, or ~ 30 lbs. overweight for 5’ 4” person)
No Data <10% 10%–14%
Obesity Trends Among U.S. Adults1990
Source: Centers for Disease Control and Prevention, Behavioral Risk Factor Surveillance System

No Data <10% 10%–14% 15%–19%
Obesity Trends Among U.S. Adults1995
(*BMI ≥30, or ~ 30 lbs. overweight for 5’ 4” person)
Source: Centers for Disease Control and Prevention, Behavioral Risk Factor Surveillance System

No Data <10% 10%–14% 15%–19% ≥20%
(*BMI ≥30, or ~ 30 lbs. overweight for 5’ 4” person)
Obesity Trends Among U.S. Adults2000
Source: Centers for Disease Control and Prevention, Behavioral Risk Factor Surveillance System

No Data <10% 10%–14% 15%–19% 20%–24% 25%–29% ≥30%
Obesity Trends Among U.S. Adults2005
(*BMI ≥30, or ~ 30 lbs. overweight for 5’ 4” person)
Source: Centers for Disease Control and Prevention, Behavioral Risk Factor Surveillance System

No Data <10% 10%–14% 15%–19% 20%–24% 25%–29% ≥30%
(*BMI ≥30, or ~ 30 lbs. overweight for 5’ 4” person)
Obesity Trends Among U.S. Adults2010
Source: Centers for Disease Control and Prevention, Behavioral Risk Factor Surveillance System

Percentage of Adults Who Are Obese TJHD by Locality, 2009
Nelson County26.4%
Source: Centers for Disease Control and Prevention: National Diabetes Surveillance System
**Body mass was derived from self-report of height and weight from adults 20 and Over.
*Obese = Body Mass Index (BMI) ≥30, or ~ 30 lbs. overweight for 5’ 4” person
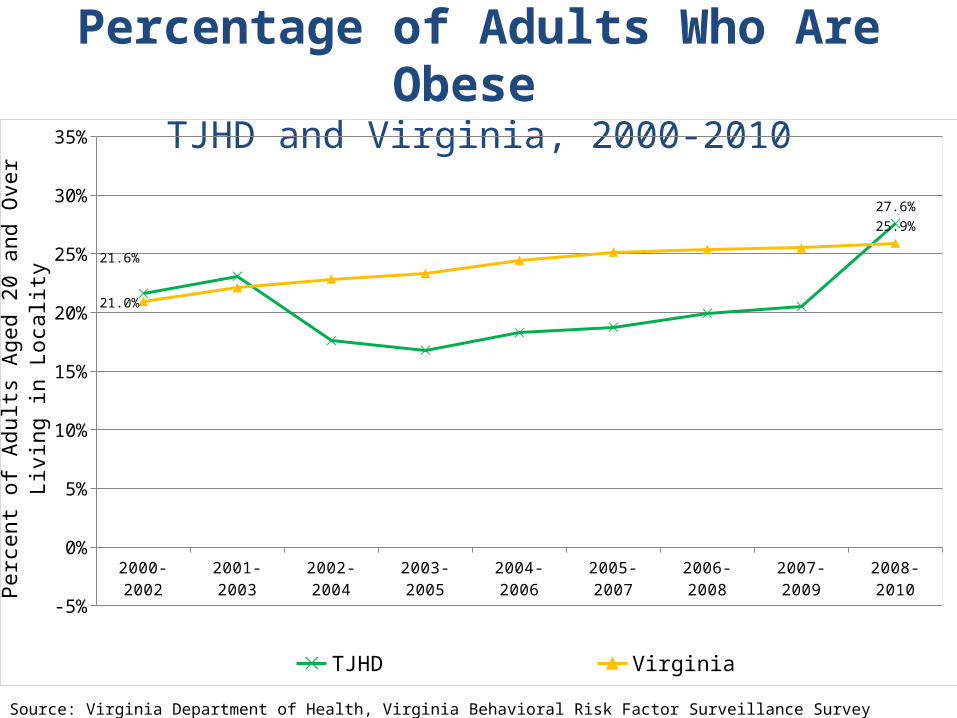
Percentage of Adults Who Are Obese TJHD and Virginia, 2000-2010
Source: Virginia Department of Health, Virginia Behavioral Risk Factor Surveillance Survey
2000-2002 2001-2003 2002-2004 2003-2005 2004-2006 2005-2007 2006-2008 2007-2009 2008-2010
-5%
0%
5%
10%
15%
20%
25%
30%
35%
21.6%
27.6%
21.0%
25.9%
TJHD Virginia
Pe
rce
nt
of
Ad
ults
Ag
ed
20
an
d O
ver
Liv
ing
in L
oca
l-ity
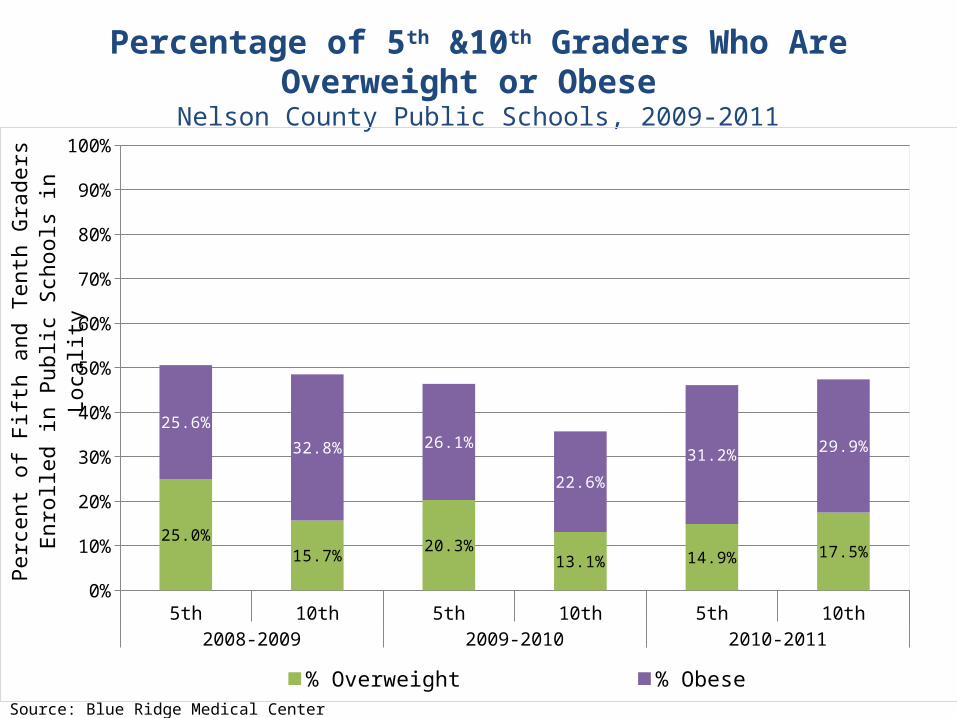
Percentage of 5th &10th Graders Who Are Overweight or Obese
Nelson County Public Schools, 2009-2011
Source: Blue Ridge Medical Center
5th 10th 5th 10th 5th 10th2008-2009 2009-2010 2010-2011
0%
10%
20%
30%
40%
50%
60%
70%
80%
90%
100%
25.0%15.7%
20.3%13.1% 14.9% 17.5%
25.6%
32.8% 26.1%
22.6%
31.2% 29.9%
% Overweight % Obese
Pe
rce
nt
of
Fift
h a
nd
Te
nth
Gra
de
rs E
nro
lled
in
Pu
blic
Sch
oo
ls in
Lo
calit
y

Seat Belt UsageVirginia, 1987-2011
Source: Virginia Department of Motor Vehicles, Highway Safety Office
19871988
19891990
19911992
19931994
19951996
19971998
19992000
20012002
20032004
20052006
20072008
20092010
20110%5%
10%15%20%25%30%35%40%45%50%55%60%65%70%75%80%85%90%95%
100%
32.5%
81.8%
Virginia
National Average
Pe
rce
nt
of
Dri
vers
an
d P
ass
en
ge
rs U
sin
g S
ea
t B
elts

Three Year Rolling Average Number of Hospitalizations from Motor/Other Vehicle Accidents With and Without Safety
Device Usage, Nelson County, 2007-2011
Source: Virginia Department of Health, Office of Emergency Medical Services
*Safety Devices include air bags, child safety seats, helmets, and safety belts; note that the presence of a safety device does not necessarily imply that it was used (properly or otherwise). Similarly, "none" does not necessarily mean that safety device was not used
2007-09 2008-10 2009-110
2
4
6
8
10
12
10.010.7
9.7
9.710.3
8.0
Nelson with SD Nelson without SD
Nu
mb
er
of
Ho
spita
liza
tion
s fr
om
MV
As

Source: Virginia Department of Health, Division of Immunization
2008 2009 2010 20110%
10%
20%
30%
40%
50%
60%
70%
80%
90%
100%
95.9% 95.1% 94.8% 93.4%
40.9%
95.7%
84.8%
94.7%
Public School Private School
Pe
rce
nt
of
Kin
de
rga
rte
ne
rs E
nro
lled
in R
e-
po
rtin
g S
cho
ols
*Percentage of Adequately Immunized
KindergartenersTJHD, 2008-2011
*Includes schools that submit student immunization survey results in the Fall of each year – approximately 30 public schools and 6 private schools (only 2 private schools reported in 2008)

2008 2009 2010 20110%
10%
20%
30%
40%
50%
60%
70%
80%
90%
100%97.5% 97.0% 97.8%
88.4%
21.4%
94.9%
81.8%78.8%
Public School Private School
Pe
rce
nt
of
Six
th G
rad
ers
En
rolle
d in
Re
po
rt-
ing
Sch
oo
ls*
Percentage of Adequately Immunized Sixth Graders
TJHD, 2008-2011
*Includes schools that submit student immunization survey results in the Fall of each school year – approximately 10 public schools and approximately 8 private schools (only 2 private schools reported in 2008)
Source: Virginia Department of Health, Division of Immunization

Section Three: What is our health status?
Maternal and Child HealthLeading Causes of DeathCancerUnintentional InjuryInfectious DiseasesAmbulatory Care Sensitive ConditionsMental Health

Maternal and Child Health

Live Birth RatesNelson County, TJHD, and Virginia, 1998-2011
Source: Virginia Department of Health, Division of Health Statistics
*Live Births Counted by Place of Residence
1998 1999 2000 2001 2002 2003 2004 2005 2006 2007 2008 2009 2010 20110
2
4
6
8
10
12
14
16
18
20
Nelson 13.7
8.3
12.9
10.8
Virginia 13.9
12.7
Nelson TJHD Virginia
Liv
e B
irth
s* p
er
1,0
00
To
tal P
ers
on
s L
ivin
g in
Lo
cal-
ity

Infant Mortality Rates*TJHD and Virginia,1999-2011
Source: Virginia Department of Health, Division of Health Statistics
*Deaths among infants <1year of age
1999-2003 2000-2004 2001-2005 2002-2006 2003-2007 2004-2008 2005-2009 2006-2010 2007-20110
2
4
6
8
10
12
14
16
18
20
22
7.06.3
7.2 7.0
TJHD Virginia
Healthy People 2020
Infa
nt
De
ath
s p
er
1,0
00
Liv
e B
irth
s b
y P
lace
of
Re
si-
de
nce

Infant Mortality Rates* by Race TJHD, Virginia, and U.S., 1999-2011
Source: Virginia Department of Health, Division of Health Statistics
1999-2003 2000-2004 2001-2005 2002-2006 2003-2007 2004-2008 2005-2009 2006-2010 2007-20110
2
4
6
8
10
12
14
16
18
20
22
14.9
17.3
13.8
13.8
TJHD White 5.7
TJHD White 4.5
Virginia White; 5.6 Virginia White; 5.4
TJHD Black Virginia Black U.S. Black TJHD White Virginia White U.S. White
Healthy People 2020
Infa
nt D
eath
s pe
r 1,
000
Live
Birt
hs b
y P
lace
of
Res
iden
ce
*Deaths among infants <1year of age

Neonatal Death Rate* TJHD and Virginia, 1999-2011
Source: Virginia Department of Health, Division of Health Statistics
*Deaths among infants <28 days of age
1999-2003 2000-2004 2001-2005 2002-2006 2003-2007 2004-2008 2005-2009 2006-2010 2007-20110
2
4
6
8
10
12
14
16
18
20
22
4.4 4.3
5.0 4.7
TJHD Virginia
Healthy People 2020
Infa
nt
De
ath
s p
er
1,0
00
Liv
e B
irth
s b
y P
lace
of
Re
si-
de
nce

Percentage of Preterm* BirthsNelson County, TJHD, West Central Perinatal Region and
Virginia, 2001-2010
Source: Virginia Department of Health
*Percent of live births born less than 37 weeks gestation
2001-2003 2002-2004 2003-2005 2004-2006 2005-2007 2006-2008 2007-2009 2008-20100%
1%
2%
3%
4%
5%
6%
7%
8%
9%
10%
11%
12%
13%
8.59%
6.28%
8.27% 8.29%
9.77%
8.73%
10.37% 10.26%
Nelson TJHD West Central Perinatal Region Virginia
Pe
rce
nt
of
To
tal L
ive
Bir
ths
by
Pla
ce o
f R
esi
-d
en
ce
Healthy People 2020

Percentage of Low-Weight* BirthsNelson County, TJHD, Virginia, and U.S., 1999-2011
Source: Virginia Department of Health, Division of Health Statistics
*Low Birth Weight = Live Births Weighing <2500 grams
1999-01 2000-02 2001-03 2002-04 2003-05 2004-06 2005-07 2006-08 2007-09 2008-10 2009-110%
1%
2%
3%
4%
5%
6%
7%
8%
9%
10%
11%
12%
13%
14%
8.9%
5.8%TJHD 7.1%
TJHD 7.6%Virginia 7.9%
Virginia 7.9%
U.S. 7.5%
8.2%
Nelson TJHD Virginia U.S.
Healthy People 2020
Per
cent
of T
otal
Liv
e B
irths
by
Pla
ce o
f Res
i-de
nce

Percentage of Low-Weight Births* by Race, Nelson County, TJHD, and Virginia, 1999-2011
Source: Virginia Department of Health, Division of Health Statistics
1999-01
2000-02
2001-03
2002-04
2003-05
2004-06
2005-07
2006-08
2007-09
2008-10
2009-11
0%50%
100%150%200%250%300%350%400%450%500%550%600%650%700%750%800%850%900%950%
1000%
Nelson Black TJHD Black Virginia Black Nelson White TJHD WhiteVirginia White
Pe
rce
nt
of
To
tal L
ive
Bir
ths
by
Pla
ce o
f R
esi
-d
en
ce
Healthy People 2020
*Low Birth Weight = Live Births Weighing <2500 grams

Teen Pregnancy Rates: Ages 10-19Nelson County, TJHD, and Virginia, 2000-2011
Source: Virginia Department of Health, Division of Health Statistics
2000-2002 2001-2003 2002-2004 2003-2005 2004-2006 2005-2007 2006-2008 2007-2009 2008-2010 2009-20110
5
10
15
20
25
30
35
40
45
50
55
60
65
34.9
19.1
23.2
15.6
29.6
21.3
Nelson TJHD Virginia
Pre
gn
an
cie
s p
er
1,0
00
Fe
ma
les
Ag
ed
10
to
19

Teen Pregnancy Rates: Ages 15-17Nelson County, TJHD, and Virginia, 2000-2011
Source: Virginia Department of Health, Division of Health Statistics
2000-2002 2001-2003 2002-2004 2003-2005 2004-2006 2005-2007 2006-2008 2007-2009 2008-2010 2009-20110
5
10
15
20
25
30
35
40
45
50
55
60
65
70
33.4
9.9
27.6
13.3
31.3
19.1
Nelson TJHD Virginia
Pre
gn
an
cie
s p
er
1,0
00
Fe
ma
les
Ag
ed
15
-17
Healthy People 2020

Teen Pregnancy Rates by Race: Ages 10-19, Nelson County, TJHD, and Virginia, 2000-2011
Source: Virginia Department of Health, Division of Health Statistics
2000-02 2001-03 2002-04 2003-05 2004-06 2005-07 2006-08 2007-09 2008-10 2009-110
5
10
15
20
25
30
35
40
45
50
55
60
65
70
75
47.5
Nelson Black 16.7
41.2
26.2
48.7
35.1
31.8
19.4
19.5
13.8
23.6
Virginia White 16.7
Nelson Black TJHD Black Virginia Black Nelson White TJHD WhiteVirginia White
Pre
gnan
cies
per
1,0
00 F
emal
es A
ged
10 to
19

Induced Termination Rates Nelson County, TJHD and Virginia, 2003-2011
Source: Virginia Department of Health, Division of Health Statistics
2003-2005 2004-2006 2005-2007 2006-2008 2007-2009 2008-2010 2009-20110
2
4
6
8
10
12
14
16
18
20
22
24
26
28
30
32
12.6
8.8
12.1
11.7
16.215.1
Nelson TJHD Virginia
Ind
uce
d T
erm
ina
tion
s p
er
1,0
00
Wo
me
n A
ge
d 1
5-4
4

2000-2002 2001-2003 2002-2004 2003-2005 2004-2006 2005-2007 2006-2008 2007-2009 2008-20100%
10%
20%
30%
40%
50%
60%
70%
80%
90%
Nelson 81.7%
Nelson 75.6%TJHD 79.3%
TJHD 77.0%
84.7% 83.2%
Nelson TJHD Virginia
Pe
rce
nt
of
To
tal L
ive
Bir
ths
to M
oth
ers
by
Pla
ce o
f R
esi
de
nce
Healthy People 2020
Percentage of Mothers Entering Prenatal Care in the 1st Trimester
Nelson County, TJHD and Virginia, 2000-2010
Source: Virginia Department of Health, Division of Health Statistics
Percentage of Total Live Births with Prenatal Care Beginning in the First 13 Weeks

Percentage of Mothers Who had 10 or More Prenatal Care Visits
Nelson County, TJHD, and Virginia, 1999-2010
1999-01 2000-02 2001-03 2002-04 2003-05 2004-06 2005-07 2006-08 2007-09 2008-100%
10%
20%
30%
40%
50%
60%
70%
80%
90%
100%
Nelson 79.2%
64.0%
TJHD 79.8%
66.0%
82.7%
77.7%
Nelson TJHD Virginia
Pe
rce
nt
of
To
tal L
ive
Bir
ths
to M
oth
ers
by
Pla
ce o
f R
esi
de
nce
Source: Virginia Department of Health, Division of Health Statistics

Percentage of Mothers With <12th Grade Education
Nelson County and Virginia, 2002-2010
2002 2003 2004 2005 2006 2007 2008 2009 20100%
5%
10%
15%
20%
25%
30%
35%
40%
45%
50%
14%Nelson 12%
15%
Virginia 12%
Nelson Virginia
Pe
rce
nt
of
To
tal L
ive
Bir
ths
to M
oth
ers
by
Pla
ce o
f R
esi
de
nce
Source: Virginia Department of Health, Division of Health Statistics

Percentage of Mothers Who Smoke During Pregnancy
Nelson County, TJHD, and Virginia, 1999-2008
1999-01 2000-02 2001-03 2002-04 2003-05 2004-06 2005-07 2006-080%
5%
10%
15%
20%
25%
30%
35%
40%
45%
50%
Nelson TJHD Virginia
Healthy People 2020 Pe
rce
nt
of
To
tal L
ive
Bir
ths
to M
oth
ers
by
Pla
ce o
f R
esi
de
nce
Source: Virginia Department of Health, Division of Health Statistics

Reported Substance Exposed Infants*TJHD, FY1999-2011
Source: Virginia Department of Social Services
99-00 00-01 01-02 02-03 03-04 04-05 05-06 06-07 07-08 08-09 09-10 10-110
2
4
6
8
10
12
14
16
18
20
22
24
2
22
TJHD
Nu
mb
er
of
Re
po
rte
d S
ub
sta
nce
Exp
ose
d
Infa
nts
*Newborn infants that may have been exposed to controlled substances prior to birth (as indicated by a positive drug toxicology of the mother with presence of a controlled substance or by the child being born dependent on a controlled substance and demonstrating withdrawal symptoms) or have a diagnosis of fetal alcohol syndrome

Leading Causes of Death

Mortality RatesNelson County, TJHD, and Virginia, 1999-2010
Source: Virginia Department of Health, Division of Health Statistics
1999-2001 2000-2002 2001-2003 2002-2004 2003-2005 2004-2006 2005-2007 2006-2008 2007-2009 2008-20100
100
200
300
400
500
600
700
800
900
1,000
1,100
1,200
956.1
761.7857.8
678.5
882.9
747.7
Nelson TJHD VirginiaAg
e-A
dju
ste
d D
ea
ths
pe
r 1
00
,00
0 P
ers
on
s L
ivin
g in
Lo
cal-
ity

Mortality Rates by Race Nelson County, TJHD, and Virginia, 2000-2010
Source: Virginia Department of Health, Division of Health Statistics
2000-02 2001-03 2002-04 2003-05 2004-06 2005-07 2006-08 2007-09 2008-100
100
200
300
400
500
600
700
800
900
1,000
1,100
1,200
1,300
1,400
1173.6
1277.0
TJHD Black 1093.6
TJHD Black 896.1
Virginia Black 1083.9
Virginia Black 916.0
1004.2
812.9
815.2
681.8
831.5
728.0
Nelson Black TJHD Black Virginia Black Nelson White TJHD WhiteVirginia WhiteA
ge-A
djus
ted
Dea
ths
per
100,
000
Per
sons
Liv
ing
in L
ocal
-ity

Five Leading Causes of DeathTJHD and Virginia, 2010
1. Cancer
2. Heart Disease
3. Stroke
4. Chronic Respiratory Disease (Chronic Obstructive Pulmonary Disease (COPD) and Asthma)
5. Unintentional Injuries
Source: Virginia Department of Health, Division of Health Statistics

Leading Causes of Death By AgeVirginia, 2010Youth/Teens
Source: Virginia Department of Health, Division of Health Statistics
6.1%
24.2%
3.0%
6.1%
60.6%
<1 Year
32.4%
12.4%
5.7%
1.0%
48.6%
1-14 Years
11.1%
7.3%
0.6%
0.3%
80.6%
15-24 Years

Leading Causes of Death By AgeVirginia, 2010
Adults
Source: Virginia Department of Health, Division of Health Statistics
21.4%
21.3%
3.0%1.1%
53.2%
25-39 Years
47.0%
31.9%
5.4%
3.5% 12.2%
40-59 Years
52.5%
30.4%
5.5%
7.4%
4.2%60-64 Years

Leading Causes of Death By AgeVirginia, 201065 and over
Source: Virginia Department of Health, Division of Health Statistics
50.7%
30.0%
6.6%
9.8%
2.9%
65-74 Years
39.5%
36.1%
9.6%
11.1%
3.7%75-84 Years
22.0%
50.8%
14.5%
8.1%
4.6%85 and over Years

Heart Disease Death RatesNelson County, TJHD, and Virginia, 1999-2010
Source: Virginia Department of Health, Division of Health Statistics
1999-01 2000-02 2001-03 2002-04 2003-05 2004-06 2005-07 2006-08 2007-09 2008-100
25
50
75
100
125
150
175
200
225
250
275
300
325
259.5
176.2
222.6
148.8
243.3
171.6
Nelson TJHD Virginia
Ag
e-A
dju
ste
d H
ea
rt D
ise
ase
De
ath
s p
er
10
0,0
00
P
ers
on
s L
ivin
g in
Lo
calit
y

Heart Disease Death Rates by Race Nelson County, TJHD, and Virginia, 2000-2009
2000-2004 2001-2005 2002-2006 2003-2007 2004-2008 2005-20090
25
50
75
100
125
150
175
200
225
250
275
300
325297.6
202.9
255.7
214.0
Virginia Black; 274.5
227.4
Nelson White 274.1
167.0
193.0
149.3
216.6
178.1
Nelson Black TJHD Black Virginia Black Nelson White TJHD WhiteVirginia White
Ag
e-A
dju
ste
d H
ea
rt D
ise
ase
De
ath
s p
er
10
0,0
00
Pe
rso
ns
Liv
ing
in L
oca
lity
Source: Virginia Department of Health, Division of Health Statistics
Five-year rolling averages

Stroke-Related Death Rates Nelson County, TJHD, and Virginia, 1999-2010
Source: Virginia Department of Health, Division of Health Statistics
1999-01 2000-02 2001-03 2002-04 2003-05 2004-06 2005-07 2006-08 2007-09 2008-100
10
20
30
40
50
60
70
80
90
100
110
120
60.8 Nelson 45.0
78.2
TJHD 44.2
67.2
41.9
Nelson TJHD Virginia
Ag
e-A
dju
ste
d S
tro
ke-R
ela
ted
De
ath
s p
er
10
0,0
00
Pe
rso
ns
Liv
ing
in L
oca
lity

Stroke-Related Death Rates by Race TJHD and Virginia, 2000-2009
2000-2002 2001-2003 2002-2004 2003-2005 2004-2006 2005-2007 2006-2008 2007-20090
10
20
30
40
50
60
70
80
90
100
110
120110.9
52.5
69.5
39.9
87.3
60.9
60.1
39.0
TJHD Black TJHD White Virginia Black Virginia White
Ag
e-A
dju
ste
d S
tro
ke-R
ela
ted
De
ath
s p
er
10
0,0
00
P
ers
on
s L
ivin
g in
Lo
calit
y
Source: Virginia Department of Health, Division of Health Statistics

Cancer-Related Death RatesNelson County, TJHD, and Virginia, 1999-2010
Source: Virginia Department of Health, Division of Health Statistics
1999-01 2000-02 2001-03 2002-04 2003-05 2004-06 2005-07 2006-08 2007-09 2008-100
25
50
75
100
125
150
175
200
225
250
275
300
214.6
183.7190.4
TJHD 179.6
206.9
Virginia 174.5
Nelson TJHD Virginia
Ag
e-A
dju
ste
d C
an
cer
De
ath
s p
er
10
0,0
00
Pe
r-so
ns
Liv
ing
in L
oca
lity

Cancer-Related Death Rates by RaceNelson County, TJHD, and Virginia, 2000-2009
Source: Virginia Department of Health, Division of Health Statistics
2000-2004 2001-2005 2002-2006 2003-2007 2004-2008 2005-20090
25
50
75
100
125
150
175
200
225
250
275
300
238.0
213.7
225.2TJHD Black 222.1
249.7
220.6Nelson White 189.8
188.2
179.0171.5
189.1
176.4
Nelson Black TJHD Black Virginia Black Nelson WhiteTJHD White Virginia White
Ag
e-A
dju
ste
d C
an
cer
De
ath
s p
er
10
0,0
00
P
ers
on
s L
ivin
g in
Lo
calit
y
Five-year rolling averages

COPD-Related Death RatesNelson County, TJHD, and Virginia, 2000-2010
Source: Virginia Department of Health, Division of Health Statistics
Four-year rolling averages
1999-02 2000-03 2001-04 2002-05 2003-06 2004-07 2005-08 2006-09 2007-100
5
10
15
20
25
30
35
40
45
50
55
60
65
43.6 43.3
40.5
34.9
42.5
38.6
Nelson TJHD Virginia
Ag
e-A
dju
ste
d C
OP
D D
ea
ths
pe
r 1
00
,00
0 P
er-
son
s L
ivin
g in
Lo
calit
y
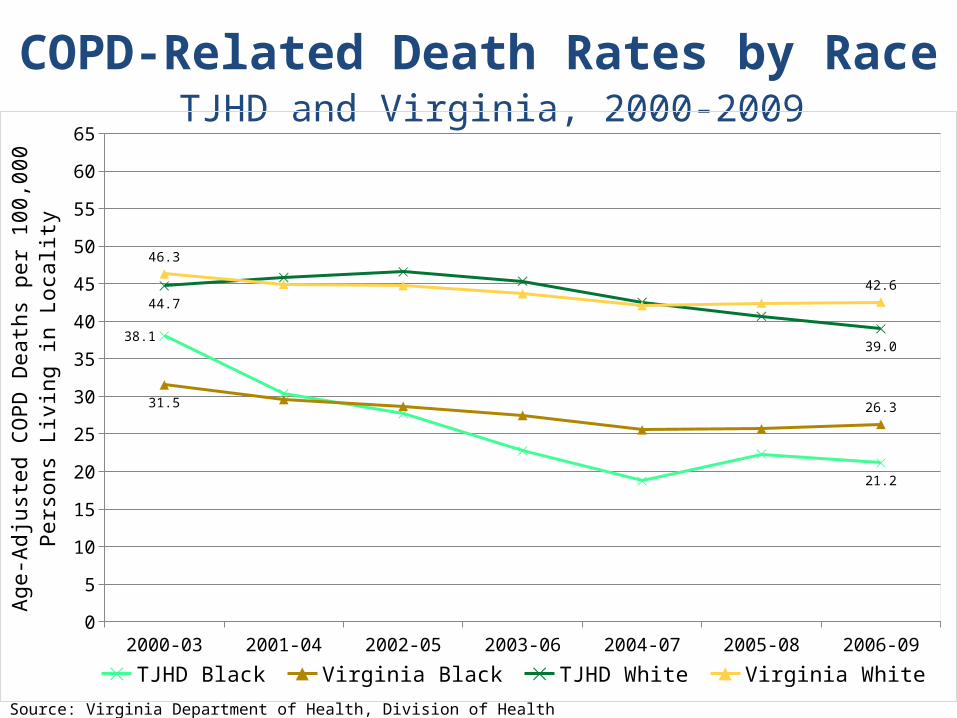
COPD-Related Death Rates by Race TJHD and Virginia, 2000-2009
Source: Virginia Department of Health, Division of Health Statistics
2000-03 2001-04 2002-05 2003-06 2004-07 2005-08 2006-090
5
10
15
20
25
30
35
40
45
50
55
60
65
38.1
21.2
31.526.3
44.7
39.0
46.3
42.6
TJHD Black Virginia Black TJHD White Virginia White
Ag
e-A
dju
ste
d C
OP
D D
ea
ths
pe
r 1
00
,00
0 P
ers
on
s L
ivin
g in
Lo
calit
y

Diabetes-Related Death RatesNelson County, TJHD, and Virginia, 1999-2010
Source: Virginia Department of Health, Division of Health Statistics
1999-03 2000-04 2001-05 2002-06 2003-07 2004-08 2005-09 2006-100
5
10
15
20
25
30
35
40
45
50
55
37.6
Nelson 20.3
21.1
15.7
23.7
Virginia 20.1
Nelson TJHD Virginia
Ag
e-A
dju
ste
d D
iab
ete
s D
ea
ths
pe
r 1
00
,00
0
Pe
rso
ns
Liv
ing
in L
oca
lity
Five-year rolling averages

Diabetes-Related Death Rates by RaceTJHD and Virginia, 2000-2009
Source: Virginia Department of Health, Division of Health Statistics
2000-2002 2001-2003 2002-2004 2003-2005 2004-2006 2005-2007 2006-2008 2007-20090
5
10
15
20
25
30
35
40
45
50
55
38.3
41.5
47.8
37.9
TJHD White; 19.5
12.5
Virginia White 19.7
16.3
TJHD Black Virginia Black TJHD White Virginia White
Ag
e-A
dju
ste
d D
iab
ete
s D
ea
ths
pe
r 1
00
,00
0
Pe
rso
ns
Liv
ing
in L
oca
lity

Unintentional Injury Death RatesTJHD and Virginia, 1999-2010
Source: Virginia Department of Health, Division of Health Statistics
Four-year rolling averages
1999-02 2000-03 2001-04 2002-05 2003-06 2004-07 2005-08 2006-09 2007-100
5
10
15
20
25
30
35
40
45
50
55
60
65
70
7569.6
51.8
TJHD 33.8
38.4
Virginia 34.0 34.5
Nelson TJHD Virginia
Ag
e-A
dju
ste
d U
nin
ten
tion
al I
nju
ry D
ea
ths
pe
r 1
00
,00
0 P
ers
on
s L
ivin
g in
Lo
calit
y

Unintentional Injury Death Rates by Race TJHD and Virginia, 2000-2009
Source: Virginia Department of Health, Division of Health Statistics
2000-03 2001-04 2002-05 2003-06 2004-07 2005-08 2006-090
5
10
15
20
25
30
35
40
45
50
55
60
65
70
75
39.7
47.8
33.4
53.5
TJHD White 35.3
39.9VA White, 35.9
38.6
TJHD Black Virginia Black TJHD White Virginia White
Ag
e-A
dju
ste
d D
ea
ths
pe
r 1
00
,00
0 P
ers
on
s L
iv-
ing
in L
oca
lity
Four-year rolling averages

Suicide and Homicide Rates TJHD and Virginia, 1999-2009
Source: Virginia Department of Health, Virginia Online Injury Reporting System
1999-2001
2000-2002
2001-2003
2002-2004
2003-2005
2004-2006
2005-2007
2006-2008
2007-2009
0
2
4
6
8
10
12
14
16
18
20
4.60
2.80
6.12
4.98
14.49
TJHD Suicide 11.4111.05
Virginia Suicide 11.54
TJHD Homicide Virginia Homicide TJHD Suicide Virginia SuicideAge
-Adj
uste
d D
eath
s pe
r 100
,000
Per
sons
Liv
ing
in L
ocal
ity

Youth Suicide Rates TJHD and Virginia, 2004-2008
• Suicide is the third leading cause of death for 10-24 year-olds.
• On average, two Virginia youths die each week from suicide.
• The suicide rate is higher in males than the rate of females.
• The White suicide rate is 2.4 times higher than the Black suicide rate.
Source: Virginia Department of Health, Office of Family Health Services
TJHD Virginia0
2
4
6
8
10
4.39
6.86
2004-2008
Dea
ths
per
100,
000
Per
sons
Liv
ing
in L
ocal
ity

Cancer

Lung Cancer Incidence RatesNelson County, TJHD, and Virginia, 1999-2008
Nelson TJHD Virginia0
5
10
15
20
25
30
35
40
45
50
55
60
65
70
75
80
85
61.6564.43 64.44
83.64
69.8768.40
Ag
e-A
dju
ste
d R
ate
of
Lu
ng
& B
ron
chu
s C
an
cer
Ca
ses
pe
r 1
00
,00
0 P
ers
on
s L
ivin
g in
Lo
calit
y
19
99
-2
00
3
19
99
-2
00
3
19
99
-2
00
3
20
04
-2
00
8
20
04
-2
00
8
20
04
-2
00
8
Source: Virginia Cancer Registry

Lung Cancer Incidence Rates by Race TJHD and Virginia, 1999-2008
Source: Virginia Cancer Registry
Black White Black WhiteTJHD Virginia
0
5
10
15
20
25
30
35
40
45
50
55
60
65
70
75
80
85
73.38
63.31
69.12
64.39
78.06
69.0671.73
68.91
Ag
e-A
dju
ste
d R
ate
of
Lu
ng
& B
ron
chu
s C
an
cer
Ca
ses
pe
r 1
00
,00
0 P
ers
on
s L
ivin
g in
Lo
calit
y
19
99
-2
00
3
19
99
-2
00
3
19
99
-2
00
3
19
99
-2
00
3
20
04
-2
00
8
20
04
-2
00
8
20
04
-2
00
8
20
04
-2
00
8

Lung Cancer Death Rates TJHD and Virginia, 1996-2007
Source: Virginia Department of Health, Division of Health Statistics
1996-2000 1997-2001 1998-2002 1999-2003 2000-2004 2001-2005 2002-2006 2003-20070
5
10
15
20
25
30
35
40
45
50
55
60
65
70
75
80
85
55.252.5
60.7
54.8
TJHD Virginia
Ag
e-A
dju
ste
d R
ate
of
Lu
ng
Ca
nce
r D
ea
ths
pe
r 1
00
,00
0 P
ers
on
s L
ivin
g in
Lo
calit
y

Breast Cancer Incidence Rates Nelson County, TJHD, and Virginia, 1999-2008
Source: Virginia Cancer Registry
Nelson TJHD Virginia0
20
40
60
80
100
120
140
160
180
200
106.35
144.81
124.5
146.6
127.52 124.81
Ag
e-A
dju
ste
d R
ate
of
Fe
ma
le B
rea
st C
an
cer
Ca
ses
pe
r 1
00
,00
0 F
em
ale
s L
ivin
g in
Lo
calit
y
19
99
-2
00
3
19
99
-2
00
3
19
99
-2
00
3
20
04
-2
00
8
20
04
-2
00
8
20
04
-2
00
8

Breast Cancer Incidence Rates by Race TJHD and Virginia, 1999-2008
Source: Virginia Cancer Registry
Black White Black WhiteTJHD Virginia
0
10
20
30
40
50
60
70
80
90
100
110
120
130
140
150
160
129.15
147.74
118.13
126.59133.84
125.95 127.06 124.83
Ag
e-A
dju
ste
d R
ate
of
Fe
ma
le B
rea
st C
an
cer
Ca
ses
pe
r 1
00
,00
0 F
em
ale
s L
ivin
g in
Lo
calit
y
19
99
-2
00
3
19
99
-2
00
3
19
99
-2
00
3
19
99
-2
00
3
20
04
-2
00
8
20
04
-2
00
8
20
04
-2
00
8
20
04
-2
00
8

Breast Cancer Death Rates TJHD and Virginia, 1996-2007
Source: Virginia Department of Health, Division of Health Statistics
1996-2000 1997-2001 1998-2002 1999-2003 2000-2004 2001-2005 2002-2006 2003-20070
10
20
30
40
50
60
70
80
90
100
26.6
20.9
28.825.4
TJHD Virginia
Ag
e-A
dju
ste
d R
ate
of
Bre
ast
Ca
nce
r D
ea
ths
pe
r 1
00
,00
0 P
ers
on
s L
ivin
g in
Lo
calit
y
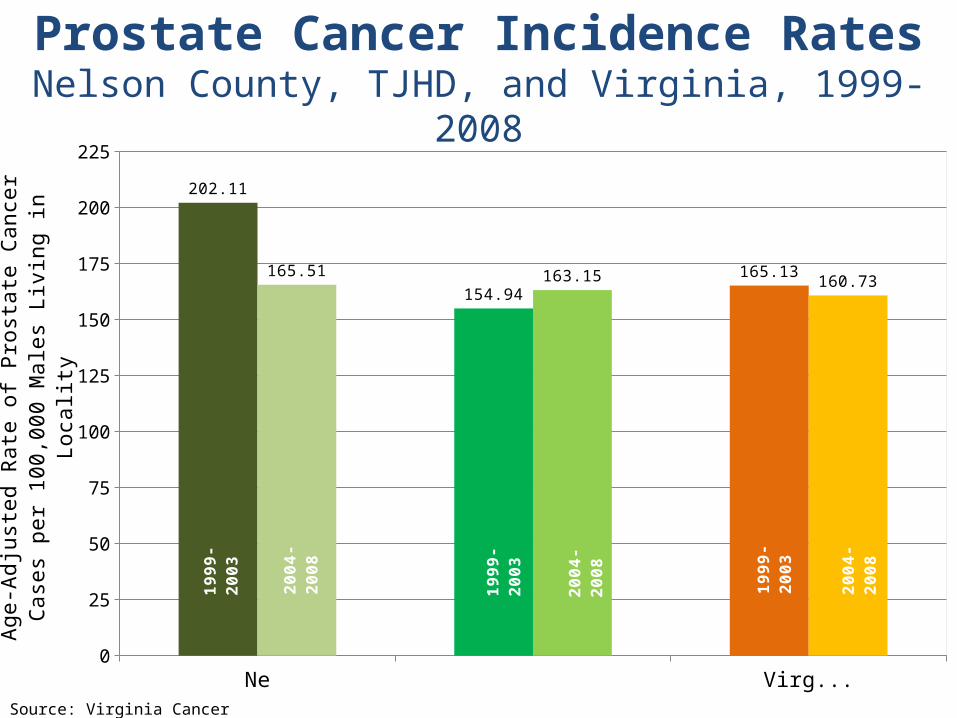
Prostate Cancer Incidence RatesNelson County, TJHD, and Virginia, 1999-2008
Source: Virginia Cancer Registry
Nelson TJHD Virginia0
25
50
75
100
125
150
175
200
225
202.11
154.94
165.13165.51 163.15 160.73
19
99
-20
03
19
99
-20
03
19
99
-20
03
20
04
-20
08
20
04
-20
08
20
04
-20
08
Ag
e-A
dju
ste
d R
ate
of
Pro
sta
te C
an
cer
Ca
ses
pe
r 1
00
,00
0 M
ale
s L
ivin
g in
Lo
calit
y
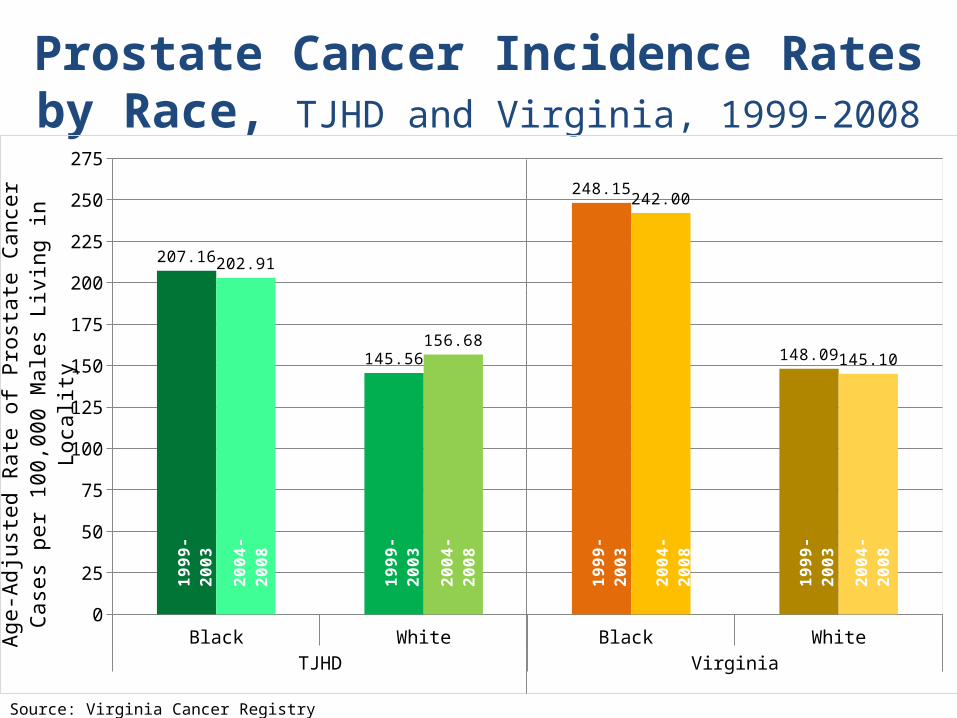
Prostate Cancer Incidence Rates by Race, TJHD and Virginia, 1999-2008
Source: Virginia Cancer Registry
Black White Black WhiteTJHD Virginia
0
25
50
75
100
125
150
175
200
225
250
275
207.16
145.56
248.15
148.09
202.91
156.68
242.00
145.10
Ag
e-A
dju
ste
d R
ate
of
Pro
sta
te C
an
cer
Ca
ses
pe
r 1
00
,00
0 M
ale
s L
ivin
g in
Lo
calit
y
19
99
-2
00
3
19
99
-2
00
3
19
99
-2
00
3
19
99
-2
00
3
20
04
-2
00
8
20
04
-2
00
8
20
04
-2
00
8
20
04
-2
00
8

Prostate Cancer Death RatesTJHD and Virginia, 1996-2007
Source: Virginia Department of Health, Division of Health Statistics
1996-2000 1997-2001 1998-2002 1999-2003 2000-2004 2001-2005 2002-2006 2003-200705
101520253035404550556065707580859095
100105
34.2 TJHD 27.3
36.8
Virginia 26.6
TJHD Virginia
Ag
e-A
dju
ste
d R
ate
of
Pro
sta
te C
an
cer
De
ath
s p
er
10
0,0
00
Pe
rso
ns
Liv
ing
in L
oca
lity

Colorectal Cancer Incidence Rates Nelson County, TJHD, and Virginia, 1999-2008
Source: Virginia Cancer Registry
Nelson TJHD Virginia0
5
10
15
20
25
30
35
40
45
50
55
60
65
7066.80
53.0850.20
38.20
44.17 45.14
Ag
e-A
dju
ste
d R
ate
of
Co
lore
cta
l Ca
nce
r C
ase
s p
er
10
0,0
00
Pe
rso
ns
Liv
ing
in L
oca
lity
19
99
-2
00
3
19
99
-2
00
3
19
99
-2
00
3
20
04
-2
00
8
20
04
-2
00
8
20
04
-2
00
8

Colorectal Cancer Incidence Rates by Race, TJHD and Virginia, 1999-2008
Source: Virginia Cancer Registry
Black White Black WhiteTJHD Virginia
0
5
10
15
20
25
30
35
40
45
50
55
60
65
7067.45
50.93
59.66
48.57
60.97
41.66
55.02
43.24
Ag
e-A
dju
ste
d R
ate
of
Co
lore
cta
l Ca
nce
r C
ase
s p
er
10
0,0
00
Pe
rso
ns
Liv
ing
in L
oca
lity
19
99
-2
00
3
19
99
-2
00
3
19
99
-2
00
3
19
99
-2
00
3
20
04
-2
00
8
20
04
-2
00
8
20
04
-2
00
8
20
04
-2
00
8

Colorectal Cancer Death RatesTJHD and Virginia, 1996-2007
Source: Virginia Department of Health, Division of Health Statistics
1996-2000 1997-2001 1998-2002 1999-2003 2000-2004 2001-2005 2002-2006 2003-20070
5
10
15
20
25
30
35
40
45
50
55
60
65
70
18.9
15.6
21.4
17.3
TJHD Virginia
Ag
e-A
dju
ste
d R
ate
of
Co
lore
cta
l Ca
nce
r D
ea
ths
pe
r 1
00
,00
0 P
ers
on
s L
ivin
g in
Lo
calit
y
Unintentional Injury

Percent of Hospitalizations due to Unintentional Injury by Cause
Nelson County, 1999-2009
Source: Virginia Department of Health, Virginia Online Injury Reporting System
Falls; 47.0%
Motor Vehicles/Other Transport Crashes;
22.9%
Struck by, against, 3.0%
Poisoning; 4.4%
Bites/Stings; 2.6%
Other/Unspecified; 20.1%

Hospitalizations due to Unintentional Injury by Cause and Age Group, Nelson County, 1999-2009
0-19 20-64 65+
Number % Number % Number %
Falls 14 15% 124 28% 318 73%
Motor Vehicle/Other Transport Crashes
46 51% 144 32% 32 7%
Struck by, against 10 11% 12 3% 7 2%
Poisoning 2 2% 21 5% 20 5%
Bites, Stings 4 4% 13 3% 8 2%
Other/Unspecified 15 16% 131 29% 49 11%
Source: Virginia Department of Health, Virginia Online Injury Reporting System

Rates of Hospitalizations due to Falls among Persons Aged 65+, Nelson County, TJHD, and Virginia, 1999-2009
Source: Virginia Online Injury Reporting System, Virginia Department of Health
1999-01 2000-02 2001-03 2002-04 2003-05 2004-06 2005-07 2006-08 2007-090
25
50
75
100
125
150
175
200
225
115.00
Nelson 194.51
151.86
168.08
160.99
Virginia 193.04
Nelson TJHD VirginiaRe
po
rte
d H
osp
ital D
isch
arg
es
for
Inju
rie
s d
ue
to
Fa
lls p
er
10
0,0
00
Pe
rso
ns
Ag
ed
65
an
d O
ver
Liv
ing
in L
oca
lity

Rates of Unintentional Injury Deaths by CauseNelson County, TJHD, and Virginia,1999-2009
Source: Virginia Department of Health, Virginia Online Injury Reporting System
Falls Transport Crashes Suffocation Poisoning Drowning Fire/Flame Other/Unspecified0
5
10
15
20
25
30
5.82
26.81
3.564.47
1.12999999999998
3.71
9.45
5.54
17.13
2.75 3.670.960000000000001 1.1
5.5
5.4
13.04
2.32
5.89
1.06 1.22
4.66
Nelson TJHD Virginia
Ag
e-A
dju
ste
d U
nin
ten
tion
al I
nju
ry D
ea
ths
pe
r 1
00
,00
0 P
ers
on
s L
ivin
g in
Lo
calit
y

Rates of Motor Vehicle AccidentsNelson County, TJHD, and Virginia, 2000-2011
Source: Virginia Department of Motor Vehicles
*Crashes are by place of occurrence
2000-02 2001-03 2002-04 2003-05 2004-06 2005-07 2006-08 2007-09 2008-10 2009-110
250
500
750
1,000
1,250
1,500
1,750
2,000
2,250
2,500
2,750
3,000
3,250
3,500
2046.23 2025.78
2317.64
1659.472010.26
1471.82
Nelson TJHD Virginia
Mo
tor
Ve
hic
le A
ccid
en
ts p
er
10
0,0
00
Pe
rso
ns
Liv
ing
in L
oca
lity

Motor Vehicle Crash Fatality RatesNelson, TJHD, and Virginia, 2000-2011
Source: Virginia Department of Motor Vehicles
Five Year Averages
2000-04 2001-05 2002-06 2003-07 2004-08 2005-09 2006-10 2007-110
5
10
15
20
25
30
35
40
45
50
30.31 30.74
19.98
16.20
12.73
10.38
Nelson TJHD Virginia
Mo
tor
Ve
hic
le C
rash
Fa
talit
ies
pe
r 1
00
,00
0 P
er-
son
s L
ivin
g in
Lo
calit
y

Percent of Alcohol-Related Motor Vehicle Crashes, Nelson, TJHD, and Virginia, 2000-2011
Source: Virginia Department of Motor Vehicles
2000-02 2001-03 2002-04 2003-05 2004-06 2005-07 2006-08 2007-09 2008-10 2009-110%
2%
4%
6%
8%
10%
12%
14%
16%
18%
20%
11.3%9.2%
8.1%8.5%
7.9%7.4%
Nelson TJHD Virginia
Pe
rce
nt
of
To
tal M
oto
r V
eh
icle
Cra
she
s b
y P
lace
o
f O
ccu
rre
nce

Percent of Alcohol-Related Motor Vehicle Crash Fatalities, TJHD and Virginia, 2000-2011
Source: Virginia Department of Motor Vehicles
2000-02 2001-03 2002-04 2003-05 2004-06 2005-07 2006-08 2007-09 2008-10 2009-110%
10%
20%
30%
40%
50%
60%
70%
80%
90%
100%
44.5%
33.0%
38.3%
37.0%
TJHD Virginia
Pe
rce
nt o
f To
tal M
oto
r V
eh
icle
Cra
sh F
ata
litie
s in
w
hic
h A
lco
ho
l wa
s In
volv
ed
--
by
Pla
ce o
f O
ccu
rre
nce
v

Infectious Diseases

Rates of Reportable Communicable Diseases, TJHD and Virginia, 2000-2010
CommunicableDisease
TJHD Virginia
AverageNumber of
Cases
Average RatePer 100,000*
AverageNumber of
Cases
Average RatePer 100,000*
Chlamydia 559 260.2 23,406 306.7
Gonorrhea 134 62.3 8,723 119.3
Pertussis 56 26.3 246 3.3
Salmonellosis 35 16.3 1,186 15.8
Giardiasis 33 15.5 489 6.5
Chicken Pox 25 11.7 1,079 14.3
Campylobacteriosis 21 9.8 687 9.2
Lyme Disease 20 9.1 514 6.7
Source: Virginia Department of Health, Division of Surveillance and Investigation
*Population data based on U.S. Census Data for TJHD and State of Virginia (2000-2010)

Chlamydia Incidence RatesNelson County, TJHD, and Virginia,1997-2010
1997-99 1998-00 1999-01 2000-02 2001-03 2002-04 2003-05 2004-06 2005-07 2006-08 2007-09 2008-100
25
50
75
100
125
150
175
200
225
250
275
300
325
350
375
400
425
Nelson; 189.2
167.5
219.6
280.7
Virginia 189.3
397.7
Nelson TJHD VirginiaRe
po
rte
d C
ase
s o
f Ch
lam
ydia
pe
r 1
00
,00
0 P
ers
on
s L
ivin
g in
Lo
cal-
ity
Source: Virginia Department of Health, Division of Disease Prevention

Gonorrhea Incidence RatesNelson County, TJHD, and Virginia,1997-2010
1997-99 1998-00 1999-01 2000-02 2001-03 2002-04 2003-05 2004-06 2005-07 2006-08 2007-09 2008-100
20
40
60
80
100
120
140
160
45.5
28.2
94.3
68.6
134.4
109.4
Nelson TJHD VirginiaRe
po
rte
d C
ase
s o
f Go
no
rrh
ea
pe
r 1
00
,00
0 P
ers
on
s L
ivin
g in
Lo
cal-
ity
Source: Virginia Department of Health, Division of Disease Prevention

HIV and AIDS Incidence RatesTJHD and Virginia, 1997-2009
Source: Virginia Department of Health, Division of Disease Prevention
1997-99 1998-00 1999-01 2000-02 2001-03 2002-04 2003-05 2004-06 2005-07 2006-08 2007-090
1
2
3
4
5
6
7
8
9
10
11
12
13
14
15
16
8.2
5.9
10.2
6.1
13.5 13.4
15.1
8.9
TJHD HIV TJHD AIDS Virginia HIV Virginia AIDSRe
po
rte
d C
ase
s o
f HIV
/AID
S p
er
10
0,0
00
Pe
rso
ns
Liv
ing
in L
oca
l-ity

Syphilis (early) Incidence RatesTJHD and Virginia,1999-2010
Source: Virginia Department of Health, Division of Surveillance and Investigation
1999-01 2000-02 2001-03 2002-04 2003-05 2004-06 2005-07 2006-08 2007-09 2008-100
1
2
3
4
5
6
7
8
0.5
2.8
4.1
6.8
TJHD Virginia
Rep
orte
d C
ases
of
Syp
hilis
per
100
,000
Per
sons
Liv
ing
in L
ocal
ity

Pertussis Incidence RatesTJHD, and Virginia, 1999-2010
Source: Virginia Department of Health, Division of Surveillance and Investigation
1999-01 2000-02 2001-03 2002-04 2003-05 2004-06 2005-07 2006-08 2007-09 2008-100
5
10
15
20
25
30
35
40
45
50
20.4 16.4
2.23.5
TJHD VirginiaRe
po
rte
d C
ase
s o
f Pe
rtu
ssis
pe
r 1
00
,00
0 P
ers
on
s L
ivin
g in
Lo
cal-
ity

Chicken Pox Incidence RatesTJHD and Virginia, 1999-2010
Source: Virginia Department of Health, Division of Surveillance and Investigation
1999-01 2000-02 2001-03 2002-04 2003-05 2004-06 2005-07 2006-08 2007-09 2008-100
5
10
15
20
25
30
2.1
16.3
12.7
12.1
TJHD VirginiaRep
orte
d C
ases
of C
hick
en P
ox p
er 1
00,0
00 P
erso
ns L
ivin
g in
Loc
ality

Hepatitis B Incidence RatesTJHD and Virginia, 1999-2010
Source: Virginia Department of Health, Division of Surveillance and Investigation
1999-01 2000-02 2001-03 2002-04 2003-05 2004-06 2005-07 2006-08 2007-09 2008-100.0
0.5
1.0
1.5
2.0
2.5
3.0
3.5
4.0
2.3
0.4
2.4
1.4
TJHD Virginia
Healthy People 2020
Re
po
rte
d C
ase
s o
f He
pa
titis
B p
er
10
0,0
00
Pe
rso
ns
Liv
ing
in L
o-
calit
y

Salmonellosis Incidence RatesTJHD and Virginia,1999-2010
Source: Virginia Department of Health, Division of Surveillance and Investigation
1999-01 2000-02 2001-03 2002-04 2003-05 2004-06 2005-07 2006-08 2007-09 2008-100
2
4
6
8
10
12
14
16
18
20
22
18.5
14.0
17.4
14.9
TJHD Virginia
Healthy People 2020
Rep
orte
d C
ases
of
Sal
mon
ello
sis
per
100,
000
Per
sons
Liv
ing
in L
ocal
ity

Campylobacteriosis Incidence Rates TJHD and Virginia,1999-2010
Source: Virginia Department of Health, Division of Surveillance and Investigation
1999-01 2000-02 2001-03 2002-04 2003-05 2004-06 2005-07 2006-08 2007-09 2008-100
2
4
6
8
10
12
14
16
18
14.2
11.7
8.5 9.5
TJHD Virginia
Rep
orte
d C
ases
of
Cam
pylo
bact
erio
sis
per
100,
000
Per
sons
Li
ving
in L
ocal
ity

E. Coli O157:H7 Incidence Rates TJHD and Virginia, 1999-2010
Source: Virginia Department of Health, Division of Surveillance and Investigation
1999-01 2000-02 2001-03 2002-04 2003-05 2004-06 2005-07 2006-08 2007-09 2008-100.0
0.5
1.0
1.5
2.0
2.5
3.0
3.5
4.0
2.7
3.4
1.0
2.3
TJHD Virginia
Healthy People 2020
Rep
orte
d C
ases
of
E.
Col
i O15
7:H
7 pe
r 10
0,00
0 P
erso
ns L
ivin
g in
Loc
ality
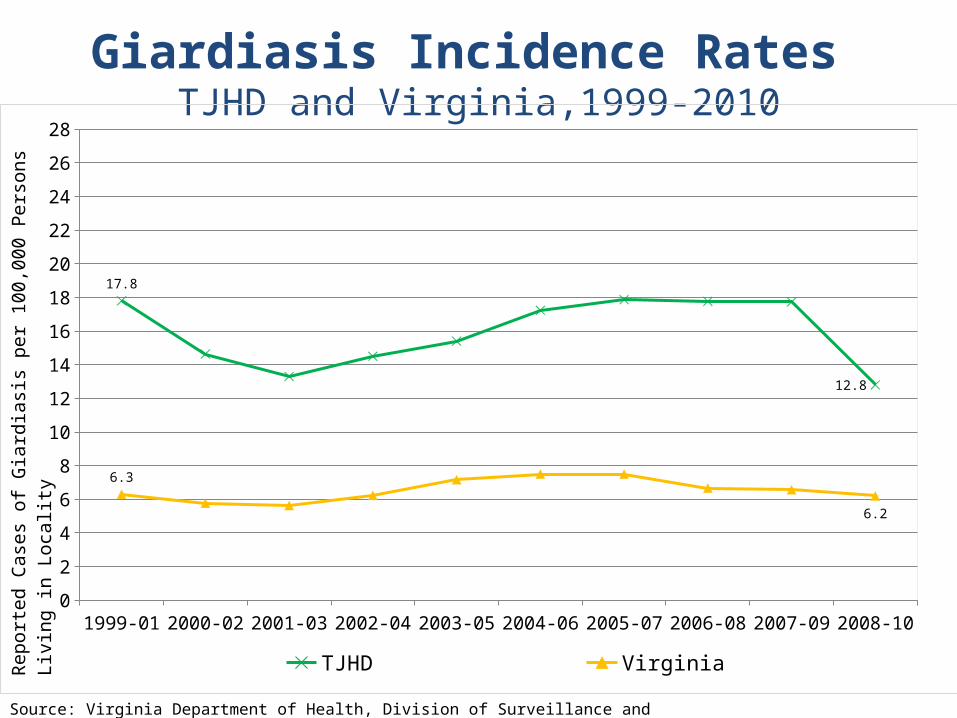
Giardiasis Incidence Rates TJHD and Virginia,1999-2010
Source: Virginia Department of Health, Division of Surveillance and Investigation
1999-01 2000-02 2001-03 2002-04 2003-05 2004-06 2005-07 2006-08 2007-09 2008-100
2
4
6
8
10
12
14
16
18
20
22
24
26
28
17.8
12.8
6.3
6.2
TJHD VirginiaRe
po
rte
d C
ase
s o
f Gia
rdia
sis
pe
r 1
00
,00
0 P
ers
on
s L
ivin
g in
Lo
-ca
lity

Legionellosis Incidence Rates TJHD and Virginia, 1999-2010
Source: Virginia Department of Health, Division of Disease Prevention
1999-01 2000-02 2001-03 2002-04 2003-05 2004-06 2005-07 2006-08 2007-09 2008-100.0
0.5
1.0
1.5
2.0
2.5
3.0
3.5
1.932.1
1.87
0.9
TJHD VirginiaRe
po
rte
d C
ase
s o
f Le
gio
ne
llosi
s p
er
10
0,0
00
Pe
rso
ns
Liv
ing
in L
o-
calit
y

Lyme Disease Incidence Rates TJHD and Virginia, 1999-2010
Source: Virginia Department of Health, Division of Surveillance and Investigation
1999-01 2000-02 2001-03 2002-04 2003-05 2004-06 2005-07 2006-08 2007-09 2008-100
5
10
15
20
25
30
TJHD 1.7
25.3
Virginia 2.0
13.2
TJHD VirginiaRep
orte
d C
ases
of
Lym
e D
isea
se p
er 1
00,0
00 P
ers
on
s Li
ving
in L
ocal
ity
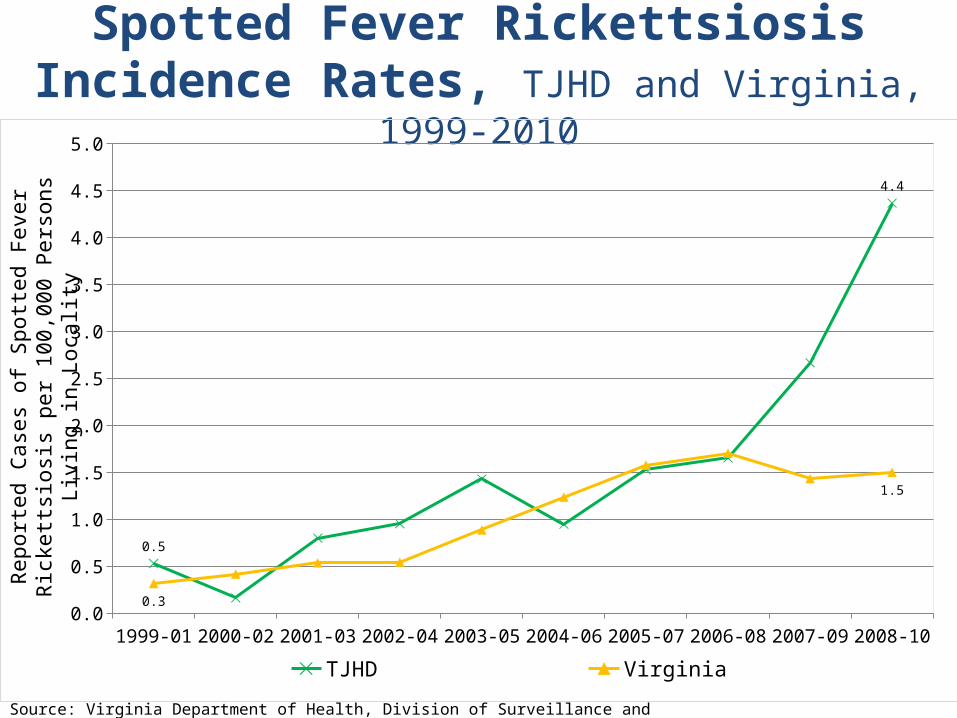
Spotted Fever Rickettsiosis Incidence Rates, TJHD and Virginia, 1999-2010
Source: Virginia Department of Health, Division of Surveillance and Investigation
1999-01 2000-02 2001-03 2002-04 2003-05 2004-06 2005-07 2006-08 2007-09 2008-100.0
0.5
1.0
1.5
2.0
2.5
3.0
3.5
4.0
4.5
5.0
0.5
4.4
0.3
1.5
TJHD Virginia
Rep
orte
d C
ases
of S
potte
d F
ever
Ric
ketts
iosi
s pe
r 10
0,00
0 P
erso
ns L
ivin
g in
Loc
ality

Tuberculosis Incidence RatesTJHD and Virginia, 1999-2010
Source: Virginia Department of Health, Division of Disease Prevention
1999-01 2000-02 2001-03 2002-04 2003-05 2004-06 2005-07 2006-08 2007-09 2008-100.0
0.5
1.0
1.5
2.0
2.5
3.0
3.5
4.0
4.5
5.0
1.8
2.9
4.4
3.6
TJHD Virginia
Healthy People 2020
Re
po
rte
d C
ase
s o
f Tu
be
rcu
losi
s p
er
10
0,0
00
Pe
rso
ns
Liv
ing
in L
o-
calit
y

Ambulatory Care-Sensitive Conditions

Source: Virginia Department of Health, Virginia Behavioral Risk Factor Surveillance System
Percent of Adults Diagnosed with Diabetes (Self-Reported), TJHD and Virginia, 2000-2010
2000-2002 2001-2003 2002-2004 2003-2005 2004-2006 2005-2007 2006-2008 2007-2009 2008-20100%
1%
2%
3%
4%
5%
6%
7%
8%
9%
10%
3.9%
8.7%
6.1%
7.8%
TJHD Virginia
Pe
rce
nt
of
To
tal A
du
lts A
ge
d 2
0 a
nd
Ove
r L
ivin
g
in L
oca
lity

Hospital Discharge Rates for DiabetesTJHD and Virginia, 2000-2011
Source: VDH Data Warehouse; Virginia Hospital Information Systems
2000-02 2001-03 2002-04 2003-05 2004-06 2005-07 2006-08 2007-09 2008-10 2009-110
2
4
6
8
10
12
14
16
18
20
22
24
26
28
30
32
34
TJHD 15.8317.01
Virginia 15.4614.82
TJHD Virginia
Ag
e-A
dju
ste
d H
osp
ital D
isch
arg
es
for
Dia
be
tes
p
er
10
,00
0 P
ers
on
s L
ivin
g in
Lo
calit
y

Hospital Discharge Rates for DiabetesTJHD by Locality, 2000-2010
Source: Virginia Hospital Information Systems
2000-02 2001-03 2002-04 2003-05 2004-06 2005-07 2006-08 2007-09 2008-100
2
4
6
8
10
12
14
16
18
20
22
24
26
28
30
32
34
23.84
24.65
Albemarle Charlottesville FluvannaGreene Louisa Nelson
Ag
e-A
dju
ste
d H
osp
ital D
isch
arg
es
for
Dia
be
tes
p
er
10
,00
0 P
ers
on
s L
ivin
g in
Lo
calit
y

Hospital Discharge Rates for AsthmaNelson County, TJHD, and Virginia, 2000-2010
2000-02 2001-03 2002-04 2003-05 2004-06 2005-07 2006-08 2007-09 2008-100
2
4
6
8
10
12
14
16
18
20
22
18.80
16.5015.85
11.94
14.9912.66
Nelson TJHD Virginia
Ag
e-A
dju
ste
d H
osp
ital D
isch
arg
es
for
Ast
hm
a p
er
10
,00
0 P
ers
on
s L
ivin
g in
Lo
calit
y
Source: Virginia Hospital Information Systems

Hospital Discharge Rates for Hypertension, TJHD and Virginia, 2000-2011
Source: VDH Data Warehouse; Virginia Hospital Information Systems
2000-02 2001-03 2002-04 2003-05 2004-06 2005-07 2006-08 2007-09 2008-10 2009-110
1
2
3
4
5
6
7
8
9
10
TJHD; 2.69 TJHD; 2.68
Virginia; 2.68 Virginia; 2.64
TJHD Virginia
Age
-Adj
uste
d H
ospi
tal D
isch
arge
s fo
r H
yper
tens
ion
per
10,0
00 P
erso
ns L
ivin
g in
Loc
ality

Hospital Discharge Rates for COPDNelson County, TJHD, and Virginia, 2000-2010
2000-02 2001-03 2002-04 2003-05 2004-06 2005-07 2006-08 2007-09 2008-100
5
10
15
20
25
30
23.30
26.10
22.49
17.69
21.52
18.18
Nelson TJHD Virginia
Ag
e-A
dju
ste
d H
osp
ital D
isch
arg
es
for
CO
PD
pe
r 1
0,0
00
Pe
rso
ns
Liv
ing
in L
oca
lity
Source: Virginia Hospital Information Systems

Mental Health Indicators

Average Number of Poor Physical/Mental Health in the Last 30 Days (Self-reported)
TJHD by Locality, TJHD and Virginia, 2004-2010
Source: County Health Rankings
*Numbers are self-reported
Albemarle Charlottesville Fluvanna Greene Louisa Nelson TJHD Average Virginia0
0.5
1
1.5
2
2.5
3
3.5
4
4.5
5
2.2
2.9
3.4
2.9
4.7
1.2
2.883.2
2.5 2.8
2.1
2.8
3.7
2.5 2.73
3.2
Average Number of Physically Unhealthy Days reported in past 30 daysAverage Number of Poor Mental Health Days reported in past 30 daysNational Benchmark for Physically Unhealthy DaysNational Benchmark for Poor Mental Health Days
Nu
mb
er*
of
Ph
ysic
ally
Un
he
alth
y/P
oo
r M
en
tal H
ea
lth D
ays

0%
5%
10%
15%
20%
25%
30%
25%
12%11%
9%
7% 7%
3%2%
Pe
rce
nt
of
To
tal R
eg
ion
Te
n P
atie
nts
Se
rve
d
Region Ten Community Services Board’s Most Frequent Diagnosed Disorders, 2011
Source: Region Ten Community Services Board

Number of Emergency Services Delivered by Region 10 Community Services Board by Type of Service
1996-2009
Source: Region Ten Community Services Board
1996 1997 1998 1999 2000 2001 2002 2003 2004 2005 2006 2007 2008 20090
500
1000
1500
2000
2500
3000
1453
2306
1042
629
Emergency Custody Order Evaluations Temporary Detention Orders IssuedTotal Evaluations Hospital AdmissionsWellness Recovery Center Referrals
Nu
mb
er
of
Re
gio
n T
en
Se
rvic
es
De
live
red

Source: Substance Abuse and Mental Health Services Administration
Adults with a co-occuring MH and AOD disorder
Children with a co-occurring MH and AOD disorder
0%
5%
10%
15%
20%
25%
30%
35%32.8%
7.6%
20.0%
4.6%
Virginia US
Per
cent
of
Tot
al A
dult
s/C
hild
ren
Ser
ved
thro
ugh
Sta
te M
enta
l Hea
lth
Age
ncie
sPercent of Persons Served though State Mental
Health Agencies with Co-Occurring Mental Health and Substance Abuse Disorders, Virginia and U.S., 2010
MH = Mental Health; AOD = Alcohol and Other Drug

Source: Substance Abuse and Mental Health Services Administration
Adults with a SMI and a substance abuse disorder
Children with a SMI and a substance abuse disorder
0%
5%
10%
15%
20%
25%
30%
35%31.8%
7.9%
24.4%
8.7%
Virginia US
Pe
rce
nt
of
To
tal A
du
lts/C
hild
ren
Se
rve
d
thro
ug
h S
tate
Me
nta
l He
alth
Ag
en
cie
sPercent of Persons Served though State Mental Health Agencies with Co-Occurring Severe Mental Health and
Substance Abuse Disorder, Virginia and U.S., 2010
Adults with a serious mental illness (SMI) are Persons 18 years and Over who, “at any time during a given year, had a diagnosable mental, behavioral, or emotional disorder without the benefit of treatment or other support services … that has resulted in functional impairment which substantially interferes with or limits one or more major life activities.…"

Hospital Discharge Rates for PsychosesTJHD and Virginia, 2000-2011
Source: VDH Data Warehouse; Virginia Hospital Information Systems
2000 2001 2002 2003 2004 2005 2006 2007 2008 2009 2010 20110
100
200
300
400
500
600
700
800
677.19
418.60
586.01
563.09
TJHD VA
Ho
spita
l Dis
cha
rge
s p
er
10
0,0
00
Pe
rso
ns
Liv
ing
in L
oca
l-ity

Hospital Discharge Rates for Neurotic Disorders, Personality Disorders, and other Nonpsychotic Mental Disorders
TJHD and Virginia, 2000-2011
Source: VDH Data Warehouse; Virginia Hospital Information Systems
2000 2001 2002 2003 2004 2005 2006 2007 2008 2009 2010 20110
50
100
150
200
250
300
257.45
206.30199.55
140.88
TJHD VAHo
spita
l Dis
cha
rge
s p
er
10
0,0
00
Pe
rso
ns
Liv
ing
in L
oca
l-ity

Section Four: What are community members’ perceptions of health in their
communities?
Thomas Jefferson Area Community Survey
MAPP 2 Health Focus Groups
Louisa County Qualitative Data

Thomas Jefferson Area Community Survey

Thomas Jefferson Area Community Survey (TJACS)
TJHD, 2012
Source: UVA Center for Survey Research
• Conducted by the UVA Center for Survey Research (CSR)
• Conducted in January 2012• Survey of 1,098 individuals living in
Charlottesville City and Albemarle, Nelson, Fluvanna, Greene, and Louisa Counties
• Conducted through a Random Digit Dial (RDD) sample of landline and cell-phone numbers – Also included a random sample of directory-listed
landline households

Medical Doctors DentistsCounselors for
Mental Health or Substance Abuse
Urgent Care
FacilitiesHospitals
Nelson 7.7% 9.8% 17.6% 27.3% 37.6%
TJHD11.3% 13.4% 20.7% 17.9% 14.9%
19.7% Insists No Problems
Question 1: Thinking about Nelson County, which of the following
services is most difficult to get care from?
Source: UVA Center for Survey Research
• Open-ended response: “All of them. I live in Nelson County and it would take an hour to come get me if something ever happened to me.”
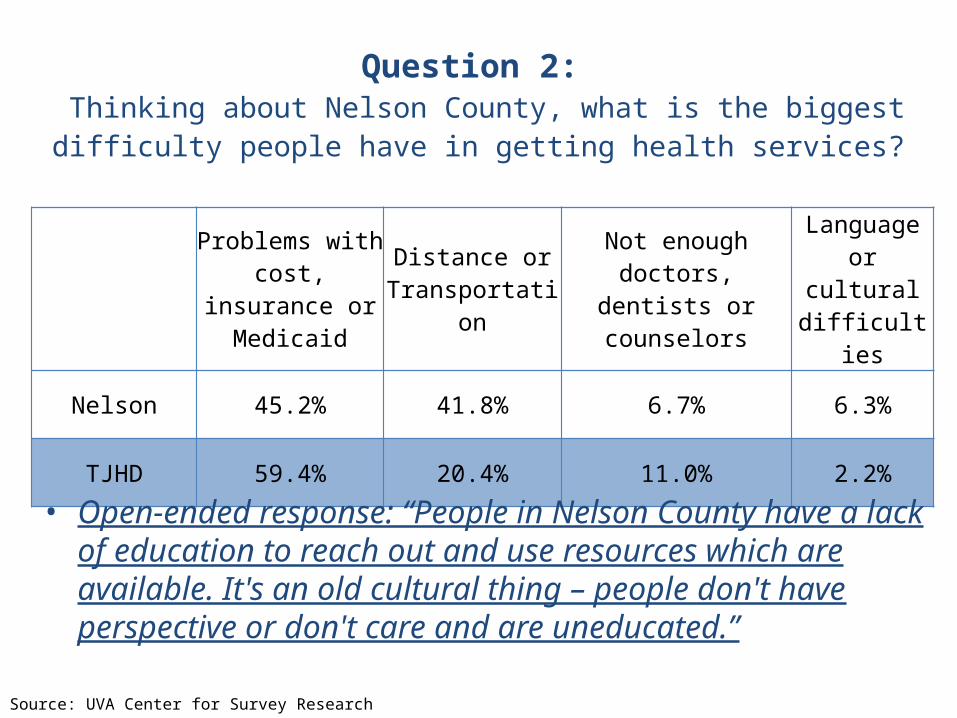
Problems with cost, insurance
or Medicaid
Distance or Transportation
Not enough doctors, dentists or counselors
Language or cultural
difficulties
Nelson 45.2% 41.8% 6.7% 6.3%
TJHD 59.4% 20.4% 11.0% 2.2%
Question 2: Thinking about Nelson County, what is the biggest
difficulty people have in getting health services?
Source: UVA Center for Survey Research
• Open-ended response: “People in Nelson County have a lack of education to reach out and use resources which are available. It's an old cultural thing – people don't have perspective or don't care and are uneducated.”

SmokingWeight and
obesityAlcohol/ drug use
Infant Death
Mental Health
Nelson 3.8% 43.1% 40.7% 0.0% 12.4%
TJHD 7.8% 36.0% 32.7% 3.1% 20.3%
Question 3: Which of the following public health concerns is the most
important for Nelson County to give more attention to?
Source: UVA Center for Survey Research

MAPP 2 Health Focus Groups
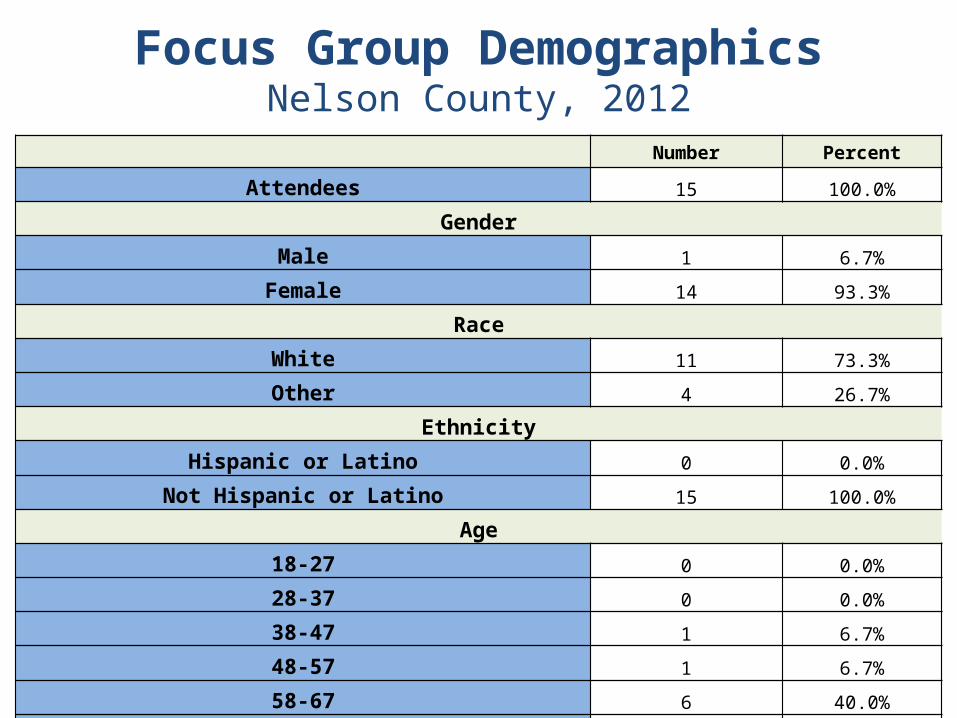
Focus Group DemographicsNelson County, 2012
Number Percent
Attendees 15 100.0%
Gender
Male 1 6.7%
Female 14 93.3%
Race
White 11 73.3%
Other 4 26.7%
Ethnicity
Hispanic or Latino 0 0.0%
Not Hispanic or Latino 15 100.0%
Age
18-27 0 0.0%
28-37 0 0.0%
38-47 1 6.7%
48-57 1 6.7%
58-67 6 40.0%
68-77 7 46.7%
Unknown 0 0.0%

Focus Group DemographicsNelson County, 2012
Number Percent
Marital Status
Married 6 40.0%
Widowed 2 13.3%
Divorced 4 26.7%
Never Married 2 13.3%
No Answer 1 6.7%
Employment status
Employed 7 46.7%
Retired 4 26.7%
Unemployed 3 20.0%
Disabled/ Unable to Work 1 6.7%
No Answer 0 0.0%

Focus Group DemographicsNelson County, 2012
Number Percent
Education Completed
Less than eighth grade 1 6.7%
High school diploma or GED 2 13.3%
College degree (4 years or less of college) 8 53.3%
Advanced degree 4 26.7%
No Answer 0 0.0%
Income
< $15,000 5 33.3%
$15,000–$29,000 2 13.3%
$30,000–$44,000 0 0.0%
$45,000–$59,000 1 6.7%
$60,000–$74,000 2 13.3%
$75,000–$89,000 1 6.7%
>$90,000 1 6.7%
No answer 3 20.0%

Focus Group Health Care CharacteristicsNelson County, 2012
Number Percent
Medical Insurance
None 2 13.3%
Medicare 7 46.7%
Medicaid 4 26.7%
Private 3 20.0%
Employment-based 3 20.0%
Other 2 13.3%
No Answer 0 0.0%
On average, how many times each month do you use health care services (doctor, dentist, hospital, etc)?
1- 4 9 60.0%
5-9 1 6.7%
10-14 0 0.0%
15 or more 0 0.0%
Other: 1-4/year 5 33.3%
Never 0 0.0%
No Answer 0 0.0%

Focus Group Health Care CharacteristicsNelson County, 2012
Number Percent
Do you have any of the following conditions? Check all that apply:
Smoking 1 6.7%
Diabetes 3 20.0%
Heart Disease 0 0.0%
Cancer 1 6.7%
Asthma 1 6.7%
High Blood Pressure 5 33.3%
Other 2 13.3%

Nelson County Focus Group Results2012
• Weight and Obesity– This issue can be ameliorated through education
• Nutritional education has helped before• Participants only knew of one rural health class
available to the community
– Poverty contributes to this problem – people purchase foods that are cheaper rather than healthier
– A lack of walking trails/sidewalks is a barrier to becoming fit within the community

Nelson County Focus Group Results2012
• Transportation– Participants reported being unable to use resources
offered, mainly due to limits to their use • e.g., solely for medical appointments, always booked, not
enough time, and not enough volunteers
– One solution suggested was a more informal system in which community residents would be able to carpool, and those with cars could offer to take those without

Nelson County Focus Group Results2012
• Alcohol and Drug Use– It is a cultural issue: parents are enabling their
children – making it a generational problem – and alcoholism is culturally engrained in the population
– The problem may be due to a lack of activities available for community members to be involved in
– Though people are more educated about the issue, drinking and driving is a major concern in the community