Embed Size (px)
Citation preview

Communicating for Results
9e
13Key Ideas
•Benefits of visual aids•Selecting visual aids•Designing visual aids•Using PowerPoint
Professional Visual Aids
1Copyright Cengage © 2011
Consider this . . .Consider this . . .
The art of creating a The art of creating a PowerPoint brief frequently PowerPoint brief frequently has become a substitute for has become a substitute for real planning, thoughtful real planning, thoughtful discussion, and cogent discussion, and cogent analysis.analysis.
Copyright Cengage © 2011 2
Wooldridge, Order a PowerPoint Stand-down, Oxford, 2004 , p. 85
PowerPoint Poisoning?
Read or describe the case study Answer the following questions:
How can PowerPoint presentations be improved without banning them?
What lessons can public speakers learn from this case study?
PowerPoint Case StudyPowerPoint Case Study
3Copyright Cengage © 2011
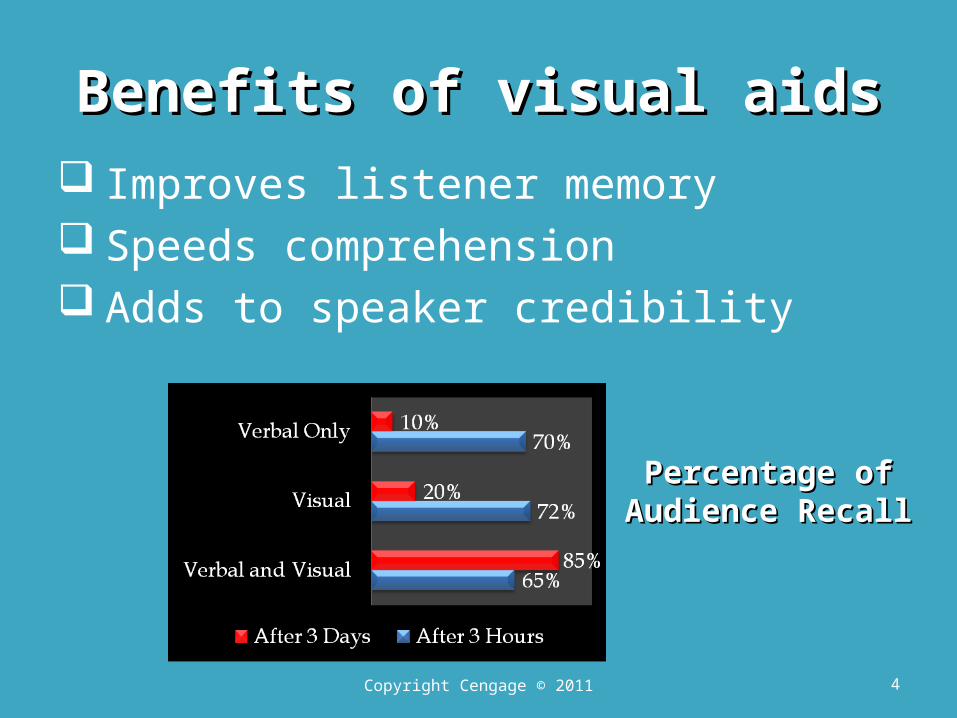
Benefits of visual aidsBenefits of visual aids Improves listener memory Speeds comprehension Adds to speaker credibility
Copyright Cengage © 2011 4
Percentage of Percentage of Audience RecallAudience Recall
Types of Visual AidsTypes of Visual Aids
Audiovisual aidsElectronic and multimedia aidsFlip chartsMarker boards and chalkboardsObjects, models and handouts
Copyright Cengage © 2011 5
Using audiovisual aidsUsing audiovisual aids
Have them cued to right location Omit sound on videotape—use own
words If sound necessary, check volume Insert clips into your PPT folder Limit clips to 15-30 seconds
6Copyright Cengage © 2011
Using Electronic/Multimedia Aids Using Electronic/Multimedia Aids
Simplify, simplify, simplify—6 second rule!
Use sounds sparingly, if at all Give transition before clicking to next
slide
7Copyright Cengage © 2011
Using Electronic/Multimedia Aids Using Electronic/Multimedia Aids Maintain eye contact & conversational
style Use light so you can be seen Bring a backup
8Copyright Cengage © 2011
Using flipcharts and postersUsing flipcharts and posters
Include one idea per page Use water-based markers on flip
charts or leave blank pages between List all items, then discuss each in
detail When finished, cover or reverse to
blank side
Copyright Cengage © 2011 9
Using marker and chalk boardsUsing marker and chalk boards
Include one idea per page Use water-based markers on flip
charts or leave blank pages between
List all items, then discuss each in
detail When finished, cover or
reverse to blank sideCopyright Cengage © 2011 10
Using objects, models and handoutsUsing objects, models and handouts
Make large enough to be seen
Keep small enough to be easily
displayed Usually wait until end of speech to
pass around or hand out copies
Copyright Cengage © 2011 11
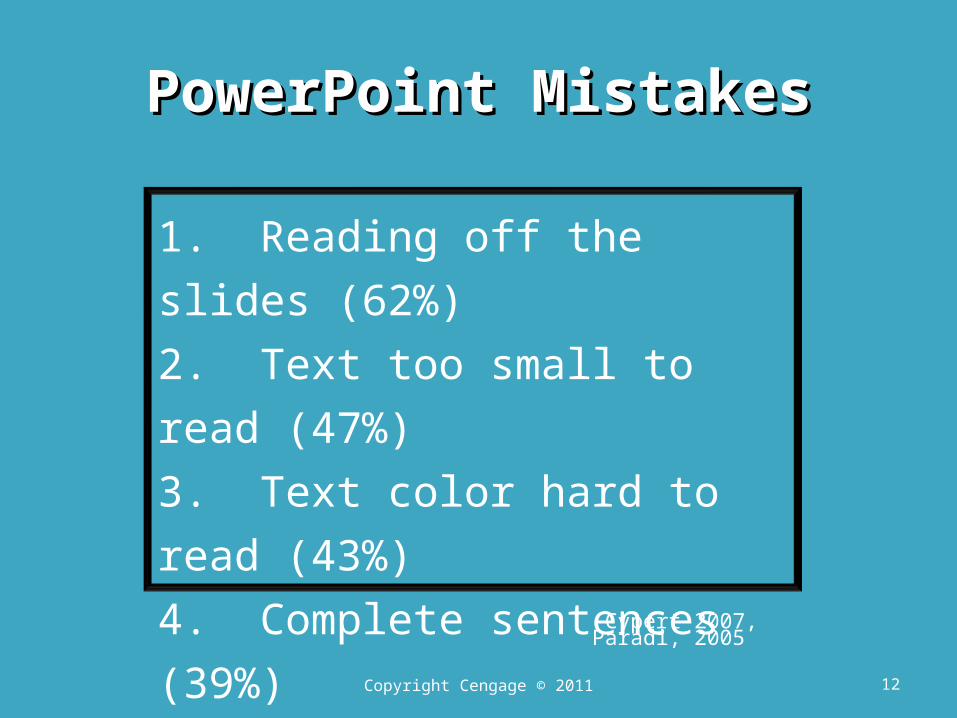
PowerPoint MistakesPowerPoint Mistakes
Copyright Cengage © 2011 12
1. Reading off the slides
(62%)
2. Text too small to read
(47%)
3. Text color hard to read
(43%)
4. Complete sentences
(39%)
5. Too much motion (25%)
6. Charts too complex (22%)
Cypert 2007, Paradi, 2005
Choose text or graphic visualsChoose text or graphic visuals
Text visualsMainly for text or printed wordsOne or two pieces of clip art
Graphic VisualsOrganizational charts, diagrams, mapsEnough words to clarify visuals
Copyright Cengage © 2011 13
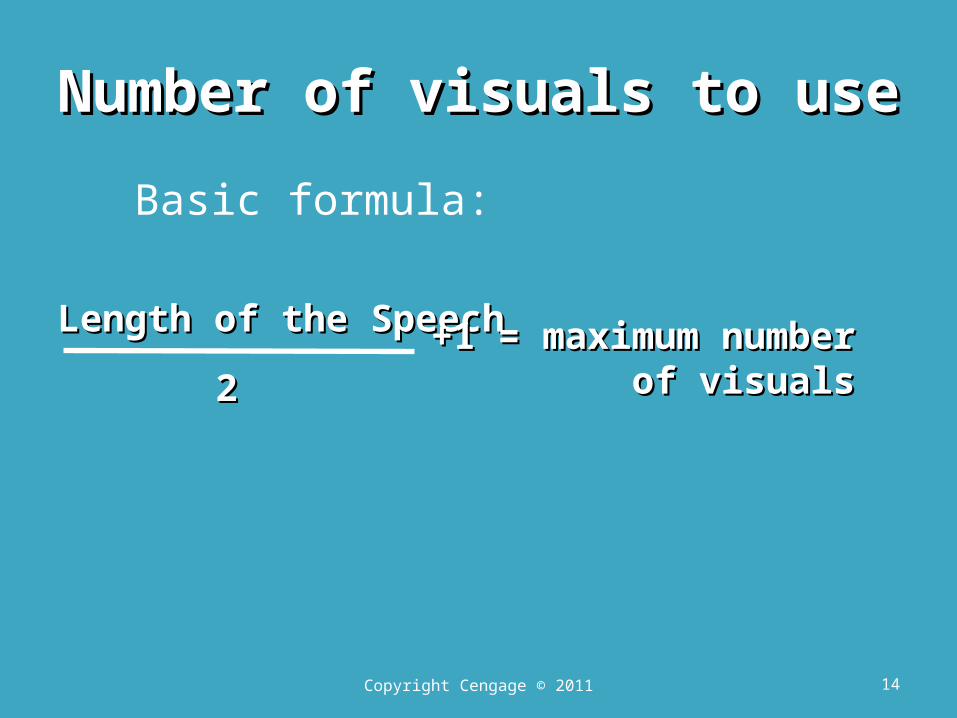
Number of visuals to useNumber of visuals to use
Basic formula:
Length of the SpeechLength of the Speech
Copyright Cengage © 2011 14
22+1 = maximum number +1 = maximum number of visualsof visuals
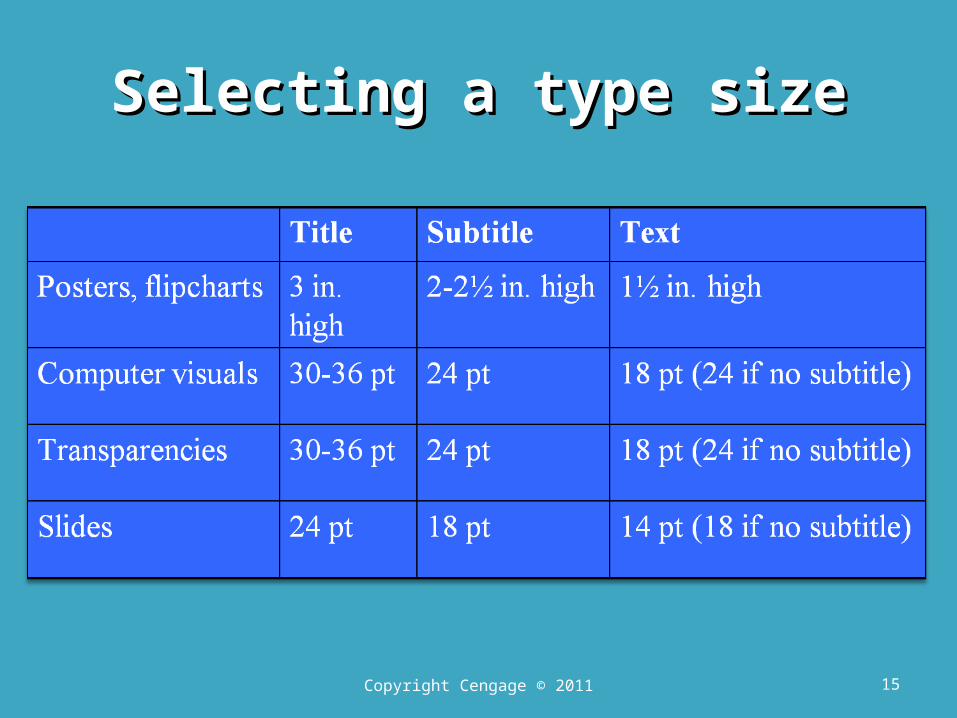
Selecting a type sizeSelecting a type size
15Copyright Cengage © 2011
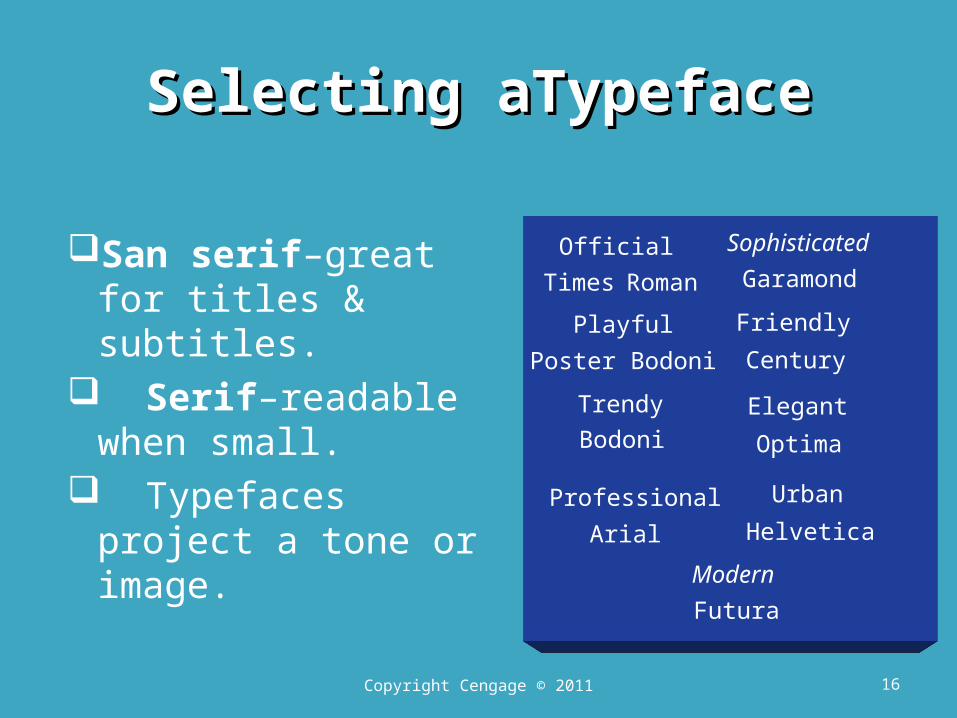
Selecting aTypefaceSelecting aTypeface
San serif–great for titles & subtitles.
Serif–readable when small.
Typefaces project a tone or image.
OfficialTimes Roman
Sophisticated
Garamond
Playful
Poster Bodoni
Trendy
Bodoni
Professional
Arial
Friendly
Century
Elegant
Optima
Urban
Helvetica
Modern
Futura
16Copyright Cengage © 2011
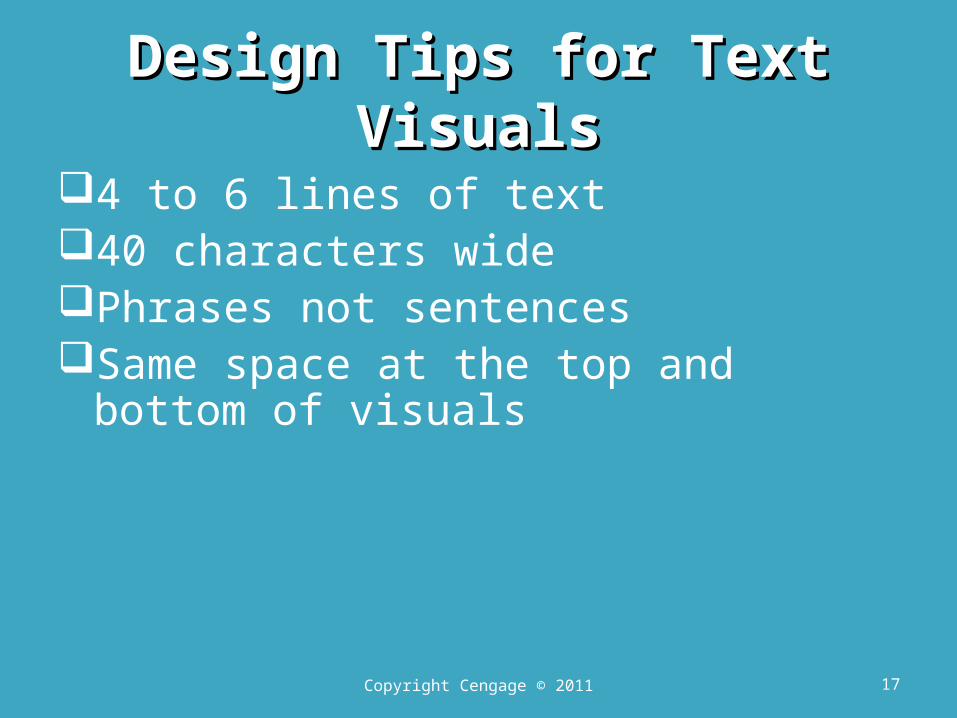
Design Tips for Text VisualsDesign Tips for Text Visuals
4 to 6 lines of text40 characters widePhrases not sentencesSame space at the top and bottom of
visuals
17Copyright Cengage © 2011
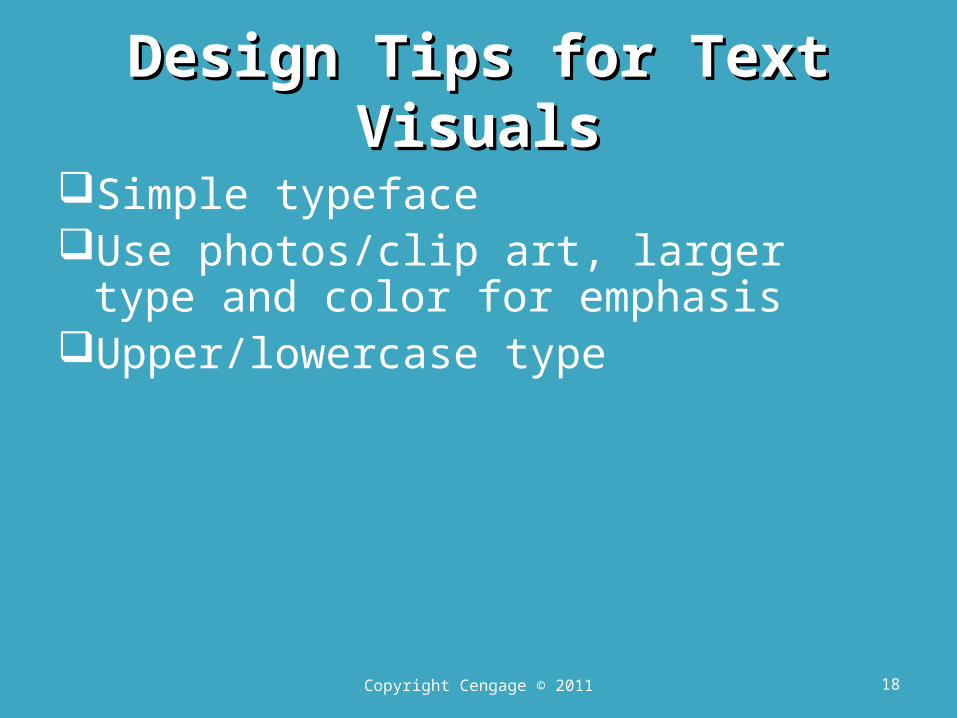
Design Tips for Text VisualsDesign Tips for Text Visuals
Simple typefaceUse photos/clip art, larger type and
color for emphasisUpper/lowercase type
18Copyright Cengage © 2011
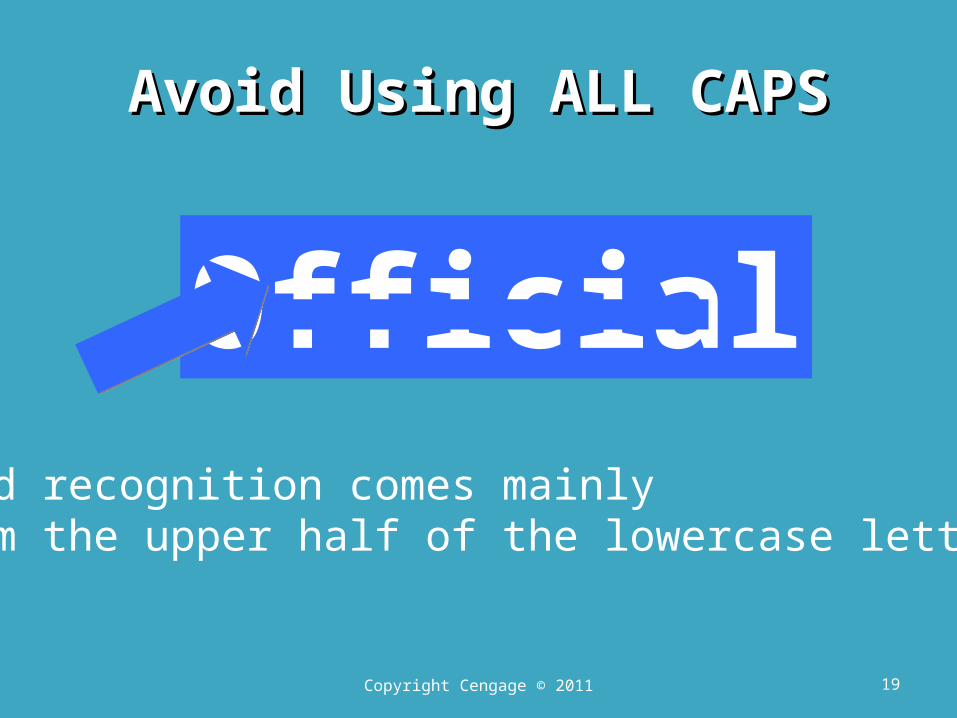
Avoid Using ALL CAPSAvoid Using ALL CAPS
OfficialWord recognition comes mainlyfrom the upper half of the lowercase letters
19Copyright Cengage © 2011
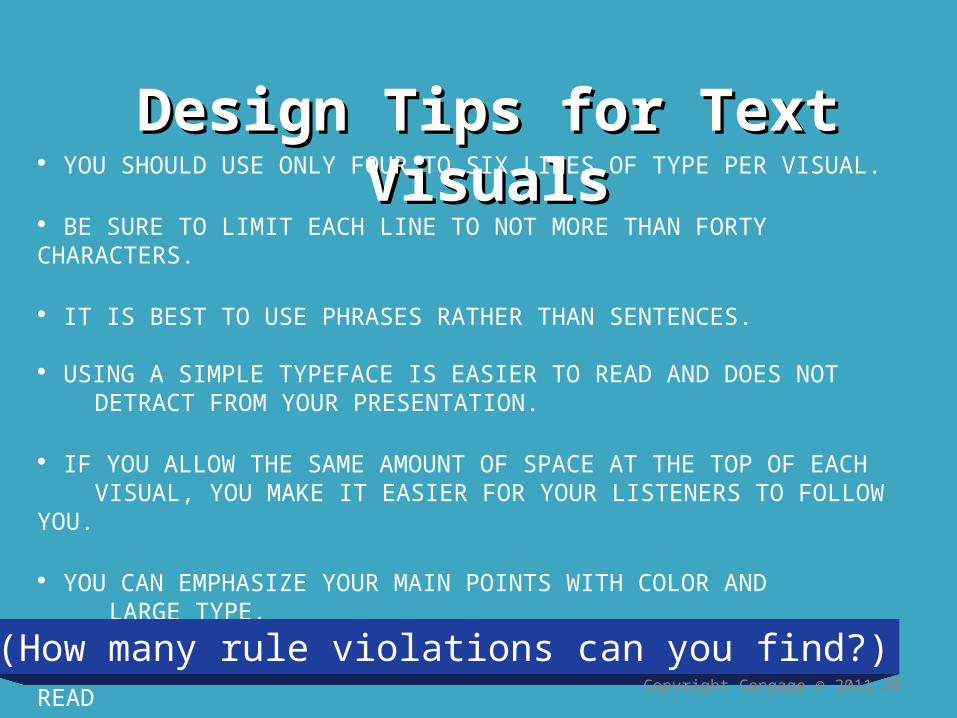
Design Tips for Text VisualsDesign Tips for Text Visuals YOU SHOULD USE ONLY FOUR TO SIX LINES OF TYPE PER VISUAL.
BE SURE TO LIMIT EACH LINE TO NOT MORE THAN FORTY CHARACTERS.
IT IS BEST TO USE PHRASES RATHER THAN SENTENCES.
USING A SIMPLE TYPEFACE IS EASIER TO READ AND DOES NOT DETRACT FROM YOUR PRESENTATION.
IF YOU ALLOW THE SAME AMOUNT OF SPACE AT THE TOP OF EACH VISUAL, YOU MAKE IT EASIER FOR YOUR LISTENERS TO FOLLOW YOU.
YOU CAN EMPHASIZE YOUR MAIN POINTS WITH COLOR AND LARGE TYPE. • IF YOU USE UPPER- AND LOWER CASE TYPE, IT IS EASIER TO READ
(How many rule violations can you find?)20Copyright Cengage © 2011
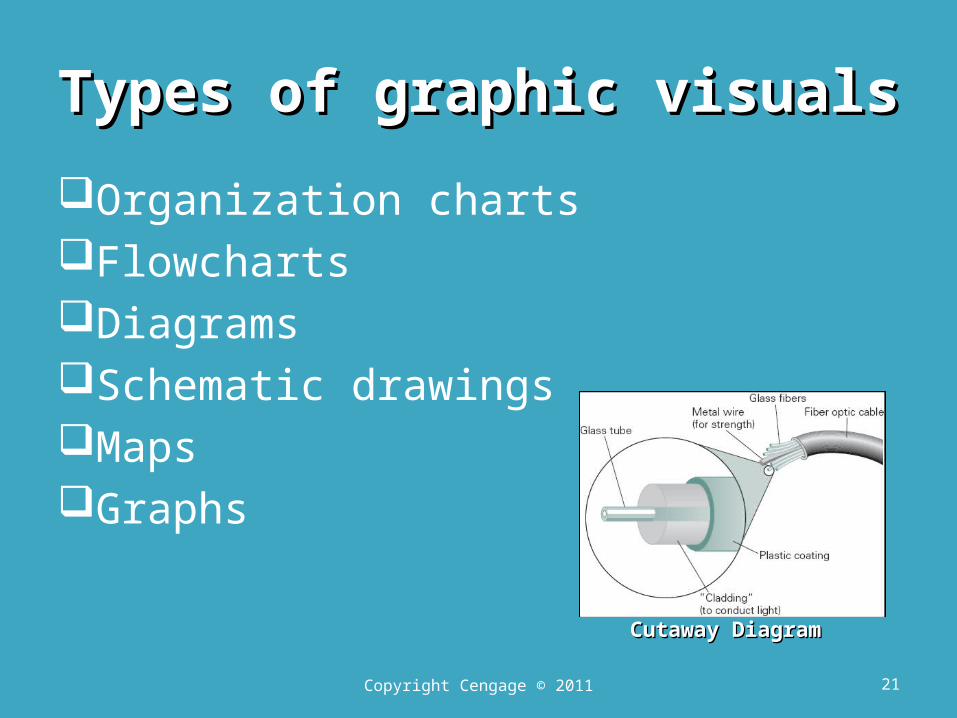
Types of graphic visualsTypes of graphic visuals
Organization chartsFlowchartsDiagramsSchematic drawingsMapsGraphs
Copyright Cengage © 2011 21
Cutaway DiagramCutaway Diagram
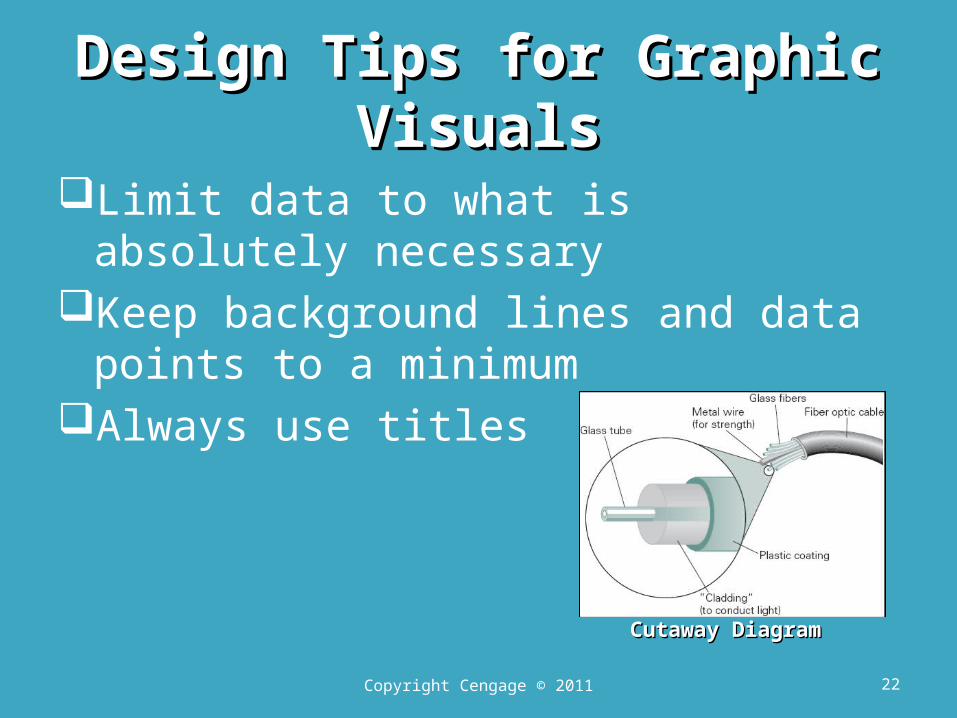
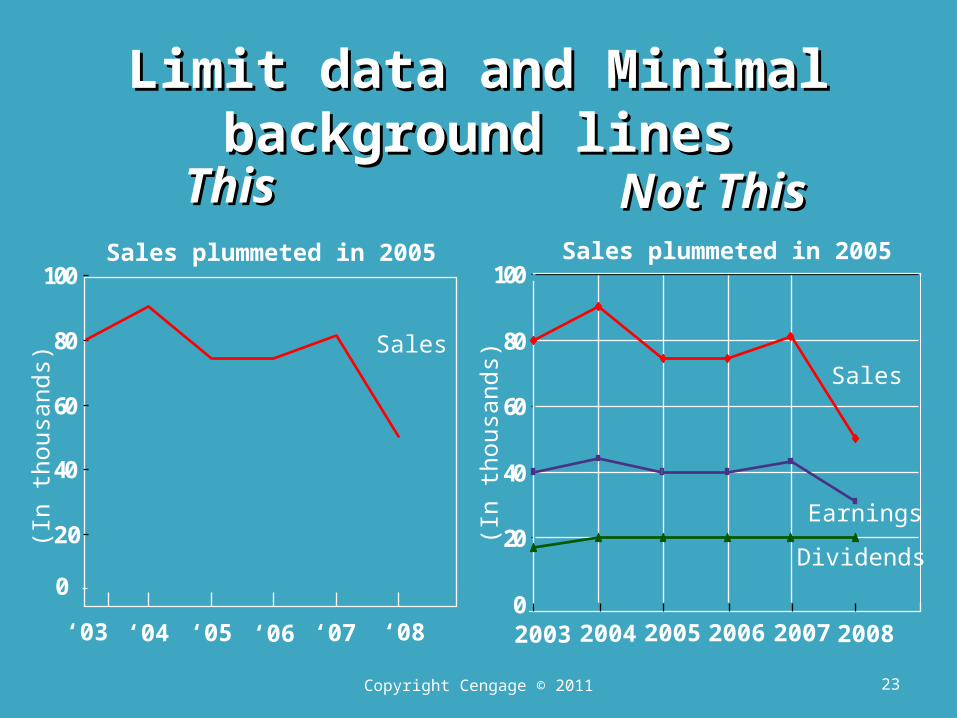
Design Tips for Graphic VisualsDesign Tips for Graphic Visuals
Limit data to what is absolutely necessary
Keep background lines and data points to a minimum
Always use titles
22Copyright Cengage © 2011
Cutaway DiagramCutaway Diagram
Not Not ThisThis
ThisThisSales plummeted in 2005
0
20
40
60
80
100
2003 2004 2005 2006 2007
Sales
Earnings
Dividends
(In th
ousa
nds)
(In th
ousa
nds)
Sales plummeted in 2005
60
80
100
0
20
40
‘04‘03 ‘05 ‘06 ‘07
Sales
‘08 2008
Limit data and Minimal background linesLimit data and Minimal background lines
23Copyright Cengage © 2011
Design Tips for Graphic VisualsDesign Tips for Graphic Visuals
Make bars wider than spaces between them
Always use headingsGroup data when possible
24Copyright Cengage © 2011
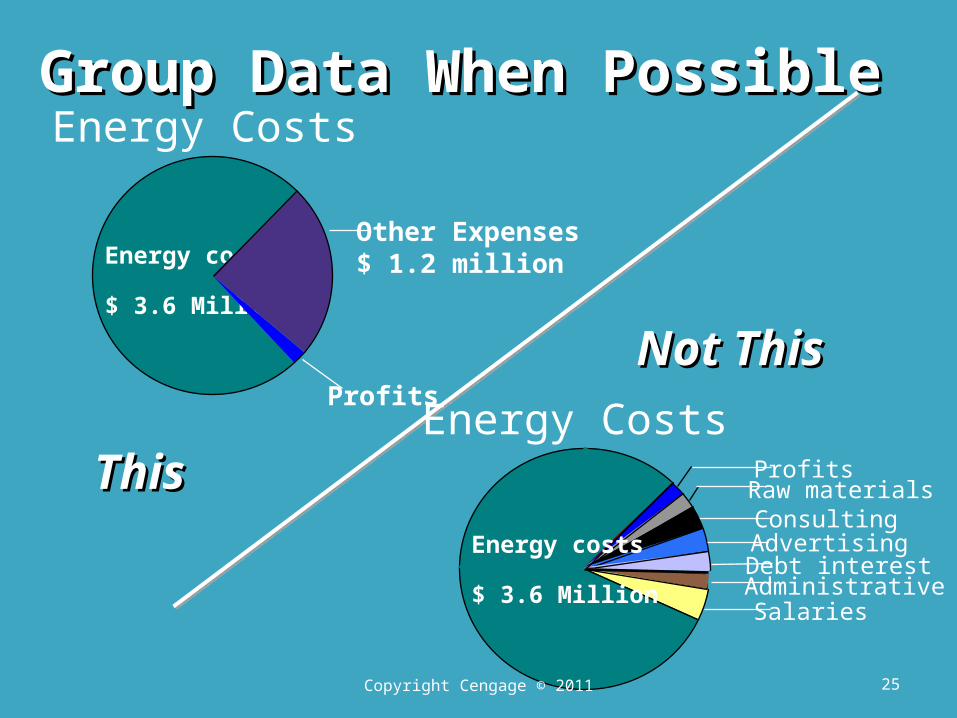
ThisThis
Energy Costs
Energy costs
$ 3.6 Million
Profits
Other Expenses$ 1.2 million
Energy Costs
Not Not ThisThis
Energy costs
$ 3.6 Million
ProfitsRaw materialsConsultingAdvertising
Debt interestAdministrativeSalaries
Group Data When PossibleGroup Data When Possible
25Copyright Cengage © 2011
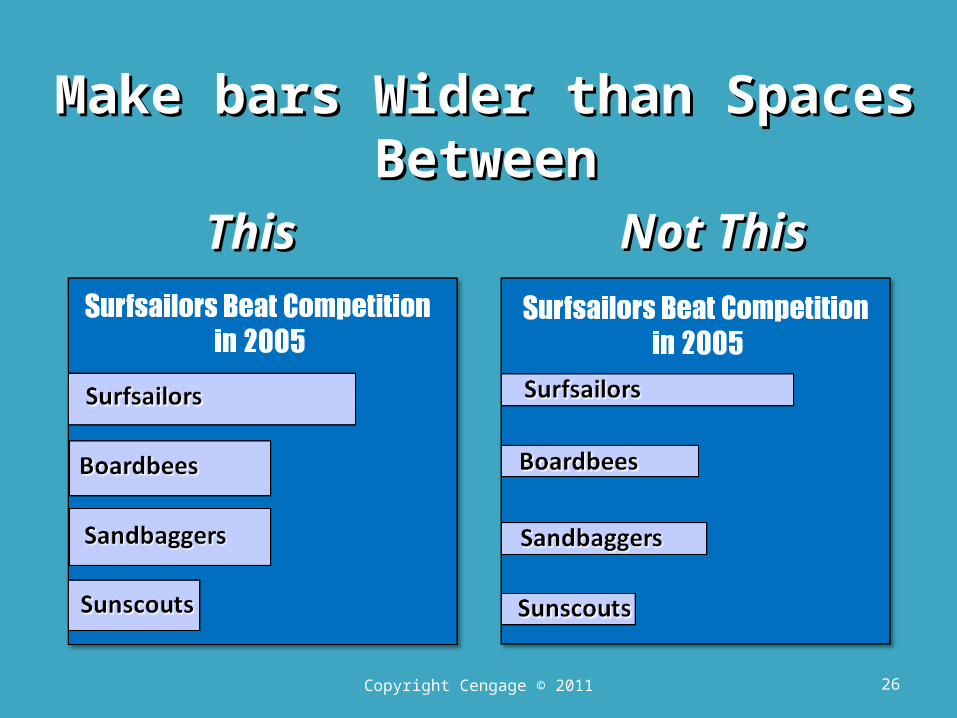
Make bars Wider than Spaces BetweenMake bars Wider than Spaces Between
ThisThis Not ThisNot This
26Copyright Cengage © 2011
General Design PrinciplesGeneral Design Principles
ContrastColor, size, line thickness, shape and
space the sameContrast important to visual attraction
ContrastRepeat visual elements of design
through the pieceHelps develop organization and unity
Copyright Cengage © 2011 27
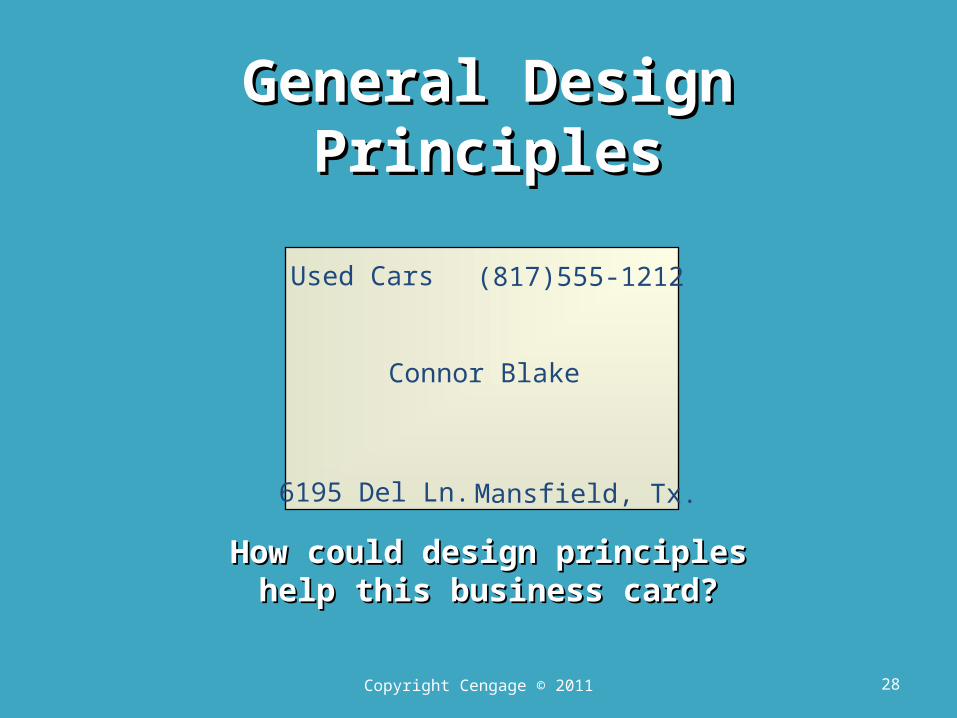
How could design principles How could design principles help this business card?help this business card?
(817)555-1212Used Cars
Connor Blake
6195 Del Ln. Mansfield, Tx.
General Design PrinciplesGeneral Design Principles
28Copyright Cengage © 2011
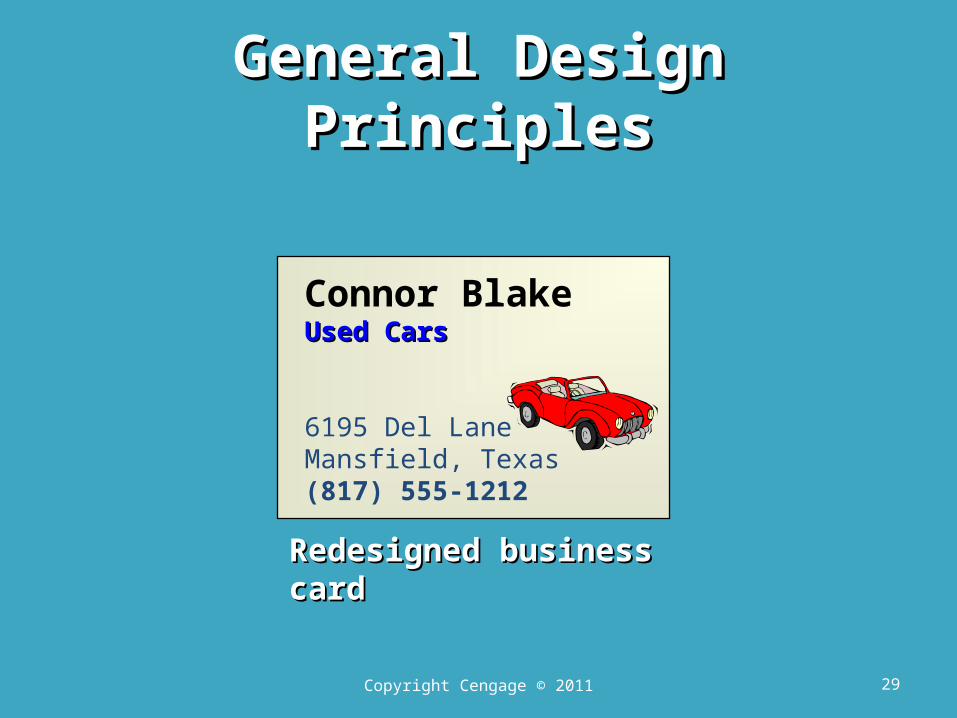
Redesigned business Redesigned business cardcard
General Design PrinciplesGeneral Design Principles
Copyright Cengage © 2011 29
Connor BlakeUsed CarsUsed Cars
6195 Del LaneMansfield, Texas(817) 555-1212
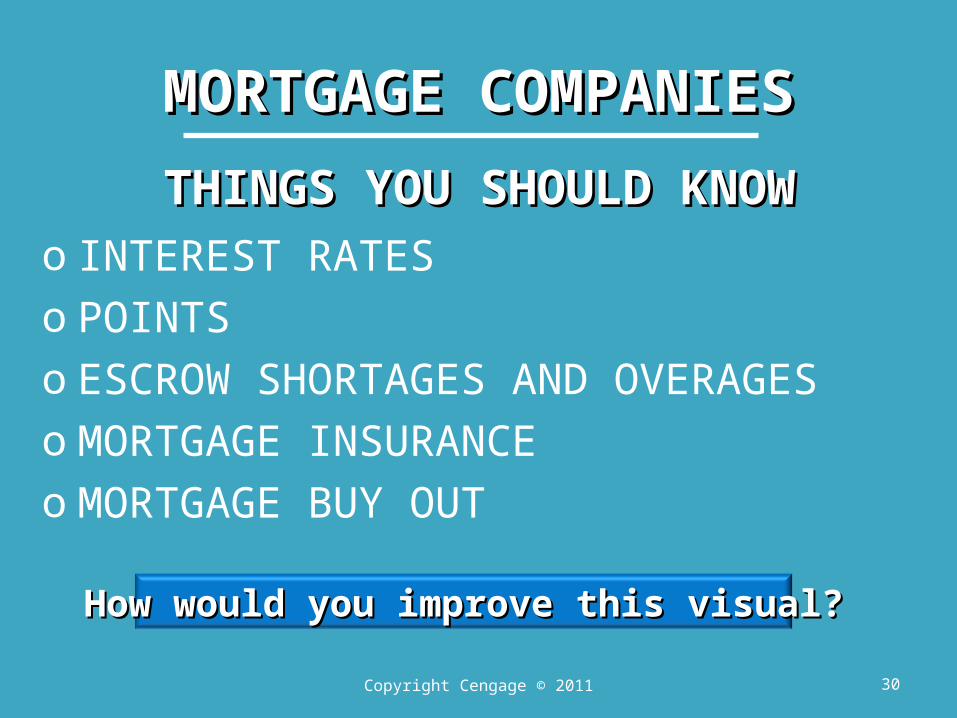
MORTGAGE COMPANIESMORTGAGE COMPANIES
o INTEREST RATESo POINTSo ESCROW SHORTAGES AND OVERAGESo MORTGAGE INSURANCEo MORTGAGE BUY OUT
Copyright Cengage © 2011 30
THINGS YOU SHOULD KNOWTHINGS YOU SHOULD KNOW
How would you improve this visual?How would you improve this visual?

MortgagesMortgagesWhat You Should Know . . What You Should Know . . ..
Escrow Shortages and Overages
Mortgage Insurance
Mortgage Buy Out
Interest Rates
Points FORSALE
Why is this visual better?Why is this visual better?
31Copyright Cengage © 2011
Benefits of Using ColorBenefits of Using Color
Color visuals are more persuasiveColor advertisements are more
persuasiveColors add spatial dimensionsColors produce emotional response
32Copyright Cengage © 2011
Guidelines for Selecting ColorGuidelines for Selecting Color
Use the same color scheme for all visuals in speech
Know the difference between hue and saturationHue – an actual colorSaturation – the amount of color for a
selected hueUse different hues for unrelated items
33Copyright Cengage © 2011
Guidelines for Selecting ColorGuidelines for Selecting Color
Use single hue with different saturation for related items
Use fully saturated hues for graphs and charts
Use low saturated hues for backgrounds and texts
Contrast text and figures with background
34Copyright Cengage © 2011
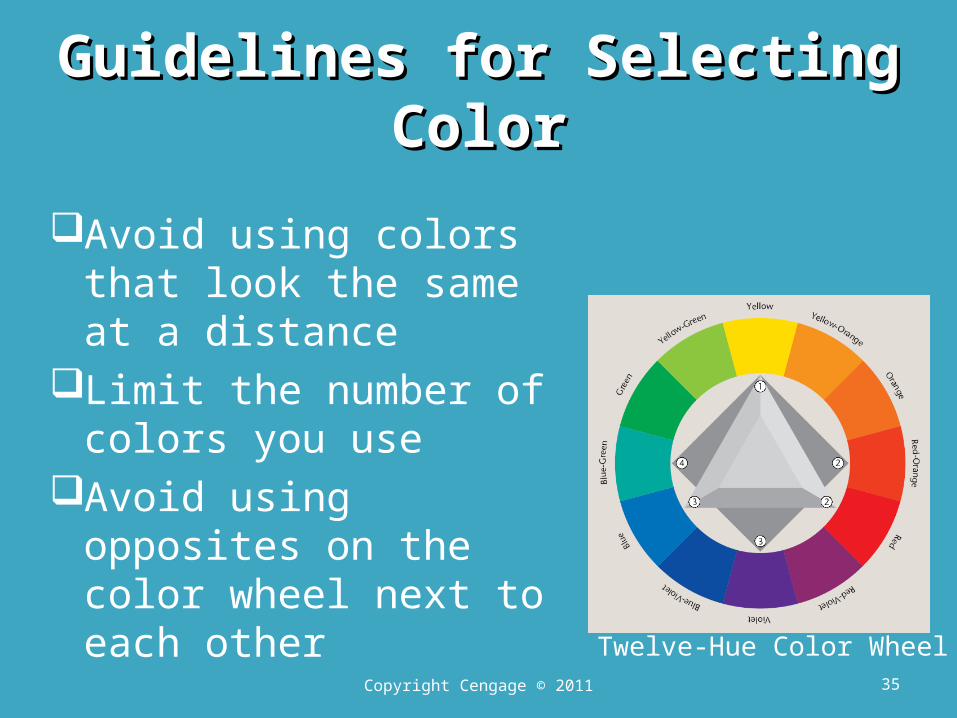
Guidelines for Selecting ColorGuidelines for Selecting Color
Avoid using colors that look the same at a distance
Limit the number of colors you use
Avoid using opposites on the color wheel next to each other
Twelve-Hue Color Wheel35Copyright Cengage © 2011
Communicating for Results
9e
13Key Ideas
•Benefits of visual aids•Selecting visual aids•Designing visual aids•Using PowerPoint
Professional Visual Aids
36Copyright Cengage © 2011