Embed Size (px)
Citation preview
2 0 19 V o l u m e 4 3https://doi.org/10.33321/cdi.2019.43.48
Influenza epidemiology in patients admitted to sentinel Australian hospitals in 2018: the Influenza Complications Alert Network (FluCAN)Allen C Cheng, Mark Holmes, Dominic E Dwyer, Sanjaya Senanayake, Louise Cooley, Louis B Irving, Graham Simpson, Tony Korman, Kristine Macartney, N Deborah Friedman, Peter Wark, Anna Holwell, Christopher C Blyth, Nigel Crawford, Jim Buttery, Simon Bowler, John W Upham, Grant W Waterer, Tom Kotsimbos and Paul M Kelly
Communicable Diseases Intelligence ISSN: 2209-6051 Online
This journal is indexed by Index Medicus and Medline.
Creative Commons Licence - Attribution-NonCommercial-NoDerivatives CC BY-NC-ND
© 2019 Commonwealth of Australia as represented by the Department of Health
This publication is licensed under a Creative Commons Attribution- Non-Commercial NoDerivatives 4.0 International Licence from https://creativecommons.org/licenses/by-nc-nd/4.0/legalcode (Licence). You must read and understand the Licence before using any material from this publication.
Restrictions The Licence does not cover, and there is no permission given for, use of any of the following material found in this publication (if any):
• the Commonwealth Coat of Arms (by way of information, the terms under which the Coat of Arms may be used can be found at www.itsanhonour.gov.au);
• any logos (including the Department of Health’s logo) and trademarks;
• any photographs and images;
• any signatures; and
• any material belonging to third parties.
Disclaimer Opinions expressed in Communicable Diseases Intelligence are those of the authors and not necessarily those of the Australian Government Department of Health or the Communicable Diseases Network Australia. Data may be subject to revision.
Enquiries Enquiries regarding any other use of this publication should be addressed to the Communication Branch, Department of Health, GPO Box 9848, Canberra ACT 2601, or via e-mail to: [email protected]
Communicable Diseases Network Australia Communicable Diseases Intelligence contributes to the work of the Communicable Diseases Network Australia. http://www.health.gov.au/cdna
Communicable Diseases Intelligence (CDI) is a peer-reviewed scientific journal published by the Office of Health Protection, Department of Health. The journal aims to disseminate information on the epidemiology, surveillance, prevention and control of communicable diseases of relevance to Australia.
Editor Cindy Toms
Deputy Editor Simon Petrie
Design and Production Kasra Yousefi
Editorial Advisory Board David Durrheim, Mark Ferson, John Kaldor, Martyn Kirk and Linda Selvey
Website http://www.health.gov.au/cdi
Contacts Communicable Diseases Intelligence is produced by: Health Protection Policy Branch Office of Health Protection Australian Government Department of Health GPO Box 9848, (MDP 6) CANBERRA ACT 2601
Email: [email protected]
Submit an Article You are invited to submit your next communicable disease related article to the Communicable Diseases Intelligence (CDI) for consideration. More information regarding CDI can be found at: http://health.gov.au/cdi.
Further enquiries should be directed to: [email protected].

1 of 14 health.gov.au/cdi Commun Dis Intell (2018) 2019;43(https://doi.org/10.33321/cdi.2019.43.48) Epub 18/11/2019
Annual report
Influenza epidemiology in patients admitted to sentinel Australian hospitals in 2018: the Influenza Complications Alert Network (FluCAN)Allen C Cheng, Mark Holmes, Dominic E Dwyer, Sanjaya Senanayake, Louise Cooley, Louis B Irving, Graham Simpson, Tony Korman, Kristine Macartney, N Deborah Friedman, Peter Wark, Anna Holwell, Christopher C Blyth, Nigel Crawford, Jim Buttery, Simon Bowler, John W Upham, Grant W Waterer, Tom Kotsimbos and Paul M Kelly
Abstract
The Influenza Complications Alert Network (FluCAN) is a sentinel hospital-based surveillance pro-gram that operates at sites in all jurisdictions in Australia. This report summarises the epidemiology of hospitalisations with laboratory-confirmed influenza during the 2018 influenza season.
In this observational surveillance system, cases were defined as patients admitted to any of the 17 sentinel hospitals with influenza confirmed by nucleic acid detection. Data were also collected on a frequency-matched control group of influenza-negative patients admitted with acute respiratory infection.
During the period 3 April to 31 October 2018 (the 2018 influenza season), 769 patients were admitted with confirmed influenza to one of 17 FluCAN sentinel hospitals. Of these, 30% were elderly (≥65 years), 28% were children (<16 years), 6.4% were Aboriginal and Torres Strait Islander peoples, 2.2% were pregnant and 66% had chronic comorbidities. A small proportion of FluCAN admissions were due to influenza B (13%). Estimated vaccine coverage was 77% in the elderly (≥65 years), 45% in non-elderly adults with medical comorbidities and 26% in children (<16 years) with medical comorbidities. The estimated vaccine effectiveness (VE) in the target population was 52% (95% CI: 37%, 63%).
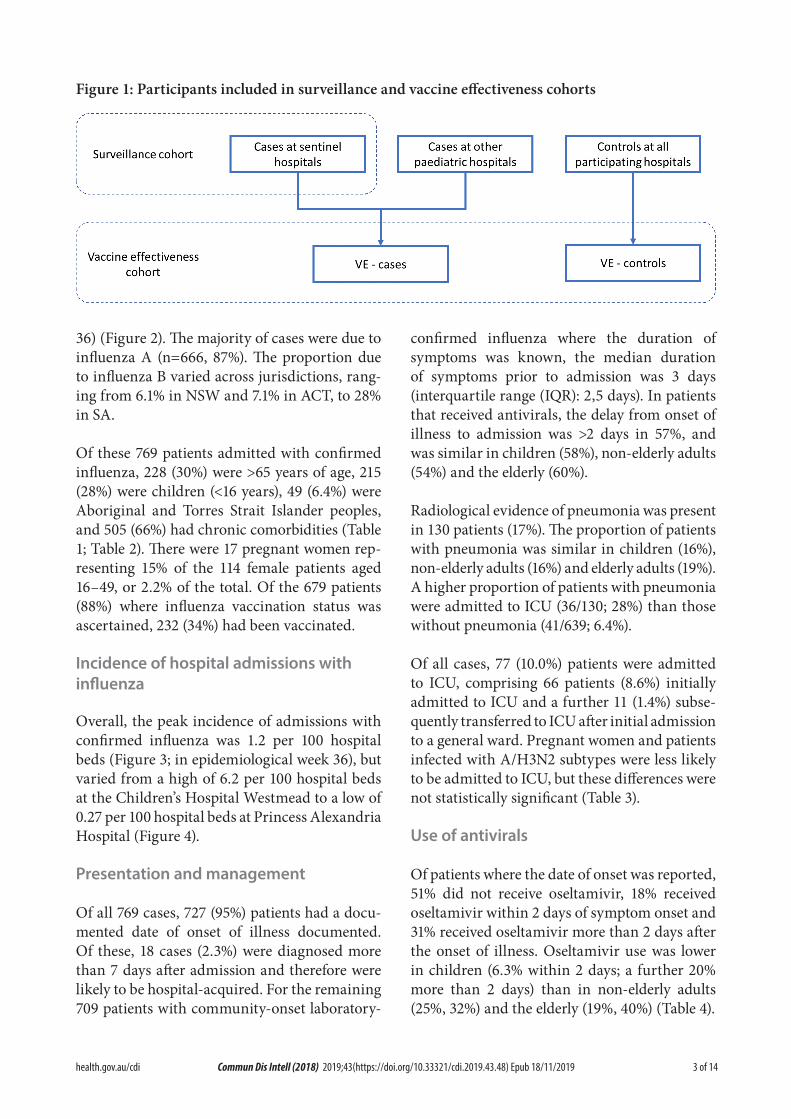
There were a smaller number of hospital admissions detected with confirmed influenza in this national observational surveillance system in 2018 than in 2017, with the demographic profile reflecting the change in circulating subtype from A/H3N2 to A/H1N1.
Keywords: influenza, public health surveillance, influenza vaccines, vaccination coverage, vaccine effectiveness
Introduction
Influenza is an acute respiratory viral infection caused by influenza viruses. The Global Burden of Disease study has estimated that around 9.5 million hospitalisations and 145,000 deaths were due to influenza in 2017.1 European studies have suggested that, among 31 common infec-tious diseases, influenza was responsible for the highest burden of disease, assessed by both dis-
ability-adjusted life years and years of life lost.2 In Australia, administrative data suggest that influenza is diagnosed in up to 10,000 hospital admissions annually, with the highest incidence in children and the elderly.3 In this report, we describe the epidemiology of hospitalisation with laboratory-confirmed influenza in the 2018 season in Australia.
2 of 14 health.gov.au/cdiCommun Dis Intell (2018) 2019;43(https://doi.org/10.33321/cdi.2019.43.48) Epub 18/11/2019
Methods
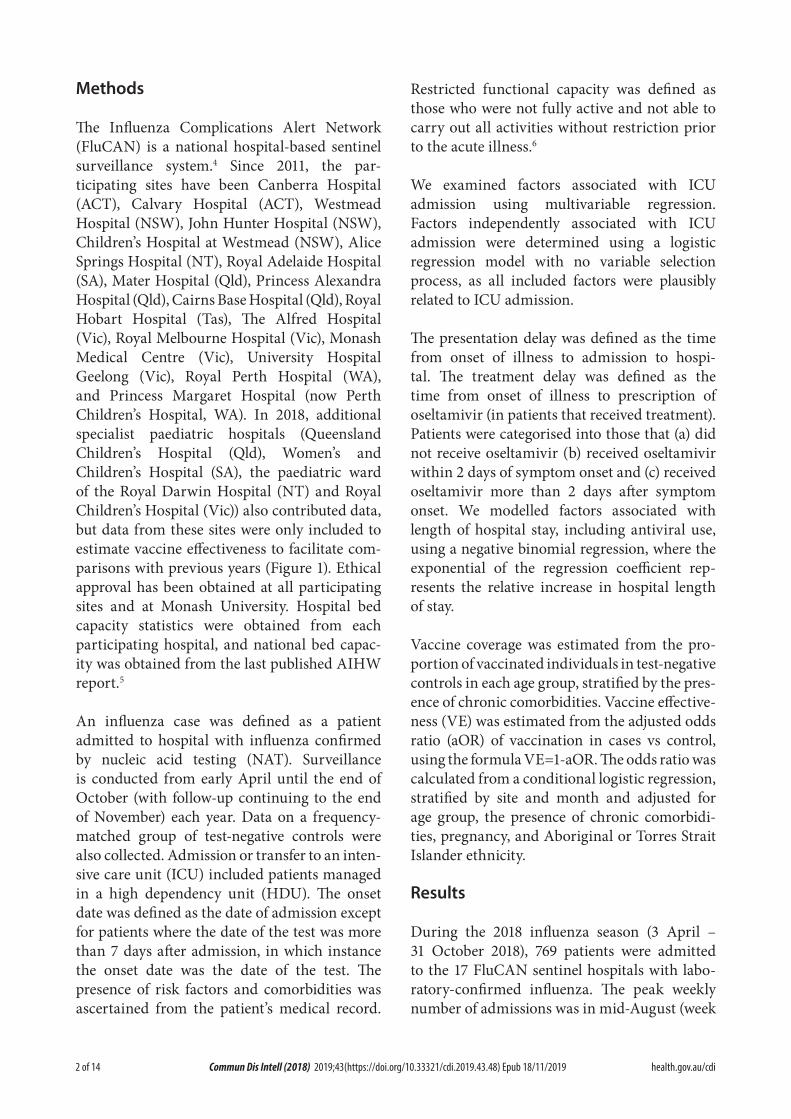
The Influenza Complications Alert Network (FluCAN) is a national hospital-based sentinel surveillance system.4 Since 2011, the par-ticipating sites have been Canberra Hospital (ACT), Calvary Hospital (ACT), Westmead Hospital (NSW), John Hunter Hospital (NSW), Children’s Hospital at Westmead (NSW), Alice Springs Hospital (NT), Royal Adelaide Hospital (SA), Mater Hospital (Qld), Princess Alexandra Hospital (Qld), Cairns Base Hospital (Qld), Royal Hobart Hospital (Tas), The Alfred Hospital (Vic), Royal Melbourne Hospital (Vic), Monash Medical Centre (Vic), University Hospital Geelong (Vic), Royal Perth Hospital (WA), and Princess Margaret Hospital (now Perth Children’s Hospital, WA). In 2018, additional specialist paediatric hospitals (Queensland Children’s Hospital (Qld), Women’s and Children’s Hospital (SA), the paediatric ward of the Royal Darwin Hospital (NT) and Royal Children’s Hospital (Vic)) also contributed data, but data from these sites were only included to estimate vaccine effectiveness to facilitate com-parisons with previous years (Figure 1). Ethical approval has been obtained at all participating sites and at Monash University. Hospital bed capacity statistics were obtained from each participating hospital, and national bed capac-ity was obtained from the last published AIHW report.5
An influenza case was defined as a patient admitted to hospital with influenza confirmed by nucleic acid testing (NAT). Surveillance is conducted from early April until the end of October (with follow-up continuing to the end of November) each year. Data on a frequency-matched group of test-negative controls were also collected. Admission or transfer to an inten-sive care unit (ICU) included patients managed in a high dependency unit (HDU). The onset date was defined as the date of admission except for patients where the date of the test was more than 7 days after admission, in which instance the onset date was the date of the test. The presence of risk factors and comorbidities was ascertained from the patient’s medical record.
Restricted functional capacity was defined as those who were not fully active and not able to carry out all activities without restriction prior to the acute illness.6
We examined factors associated with ICU admission using multivariable regression. Factors independently associated with ICU admission were determined using a logistic regression model with no variable selection process, as all included factors were plausibly related to ICU admission.
The presentation delay was defined as the time from onset of illness to admission to hospi-tal. The treatment delay was defined as the time from onset of illness to prescription of oseltamivir (in patients that received treatment). Patients were categorised into those that (a) did not receive oseltamivir (b) received oseltamivir within 2 days of symptom onset and (c) received oseltamivir more than 2 days after symptom onset. We modelled factors associated with length of hospital stay, including antiviral use, using a negative binomial regression, where the exponential of the regression coefficient rep-resents the relative increase in hospital length of stay.
Vaccine coverage was estimated from the pro-portion of vaccinated individuals in test-negative controls in each age group, stratified by the pres-ence of chronic comorbidities. Vaccine effective-ness (VE) was estimated from the adjusted odds ratio (aOR) of vaccination in cases vs control, using the formula VE=1-aOR. The odds ratio was calculated from a conditional logistic regression, stratified by site and month and adjusted for age group, the presence of chronic comorbidi-ties, pregnancy, and Aboriginal or Torres Strait Islander ethnicity.
Results
During the 2018 influenza season (3 April – 31 October 2018), 769 patients were admitted to the 17 FluCAN sentinel hospitals with labo-ratory-confirmed influenza. The peak weekly number of admissions was in mid-August (week
3 of 14 health.gov.au/cdi Commun Dis Intell (2018) 2019;43(https://doi.org/10.33321/cdi.2019.43.48) Epub 18/11/2019
36) (Figure 2). The majority of cases were due toinfluenza A (n=666, 87%). The proportion dueto influenza B varied across jurisdictions, rang-ing from 6.1% in NSW and 7.1% in ACT, to 28%in SA.
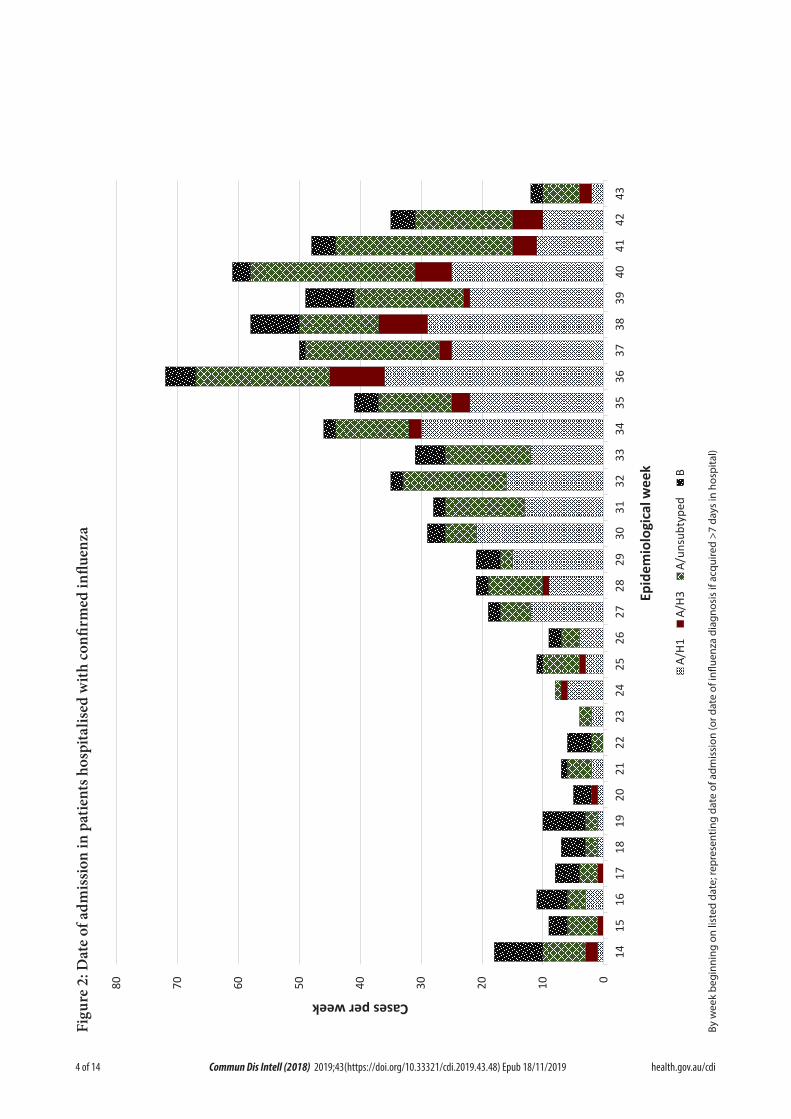
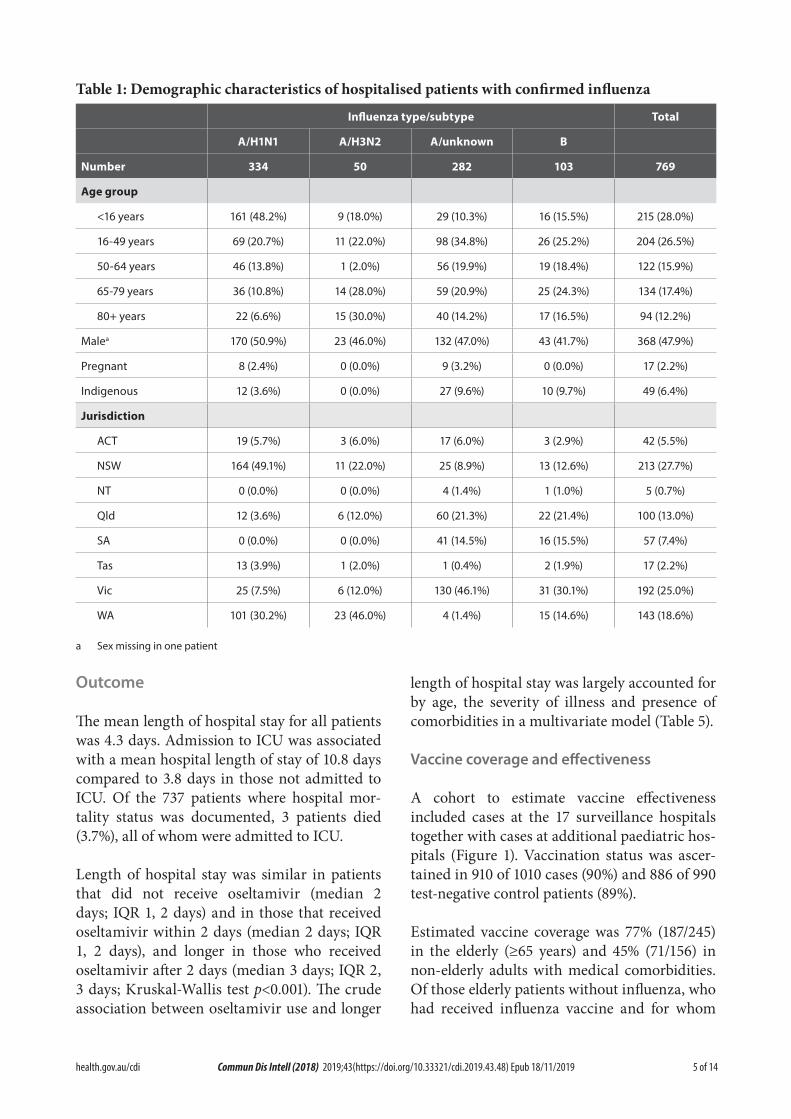
Of these 769 patients admitted with confirmed influenza, 228 (30%) were >65 years of age, 215 (28%) were children (<16 years), 49 (6.4%) were Aboriginal and Torres Strait Islander peoples, and 505 (66%) had chronic comorbidities (Table 1; Table 2). There were 17 pregnant women rep-resenting 15% of the 114 female patients aged 16–49, or 2.2% of the total. Of the 679 patients (88%) where influenza vaccination status was ascertained, 232 (34%) had been vaccinated.
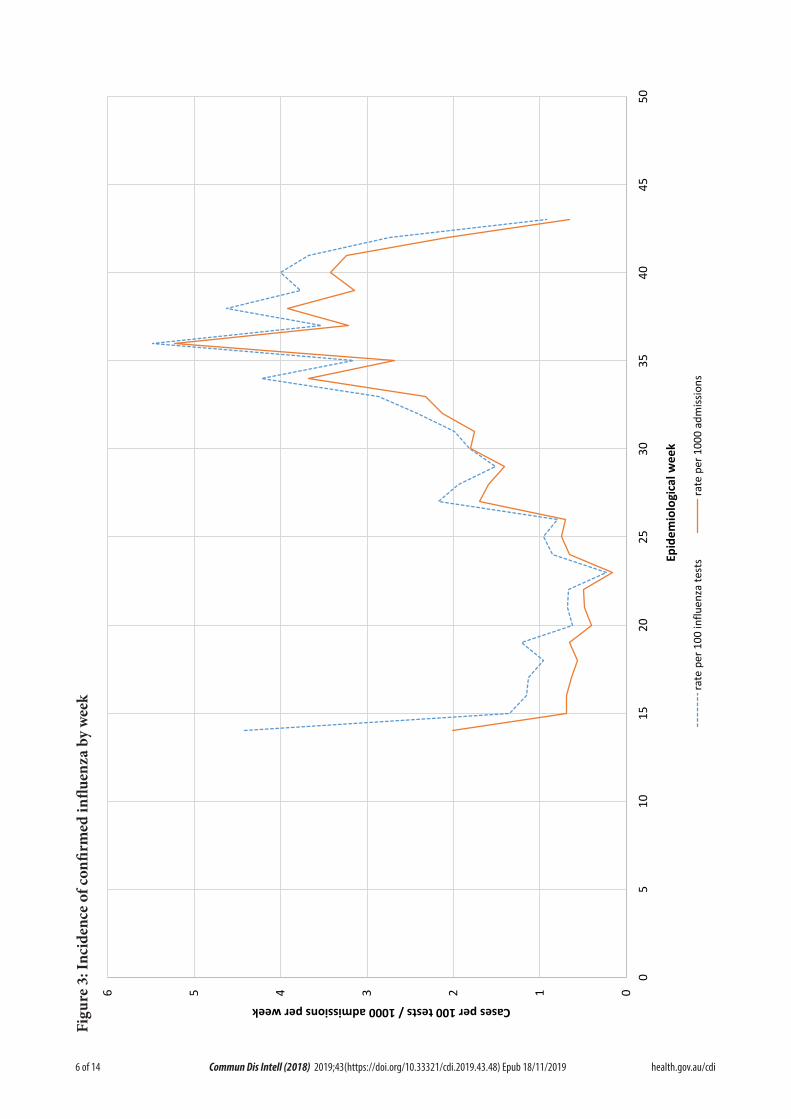
Incidence of hospital admissions with influenza
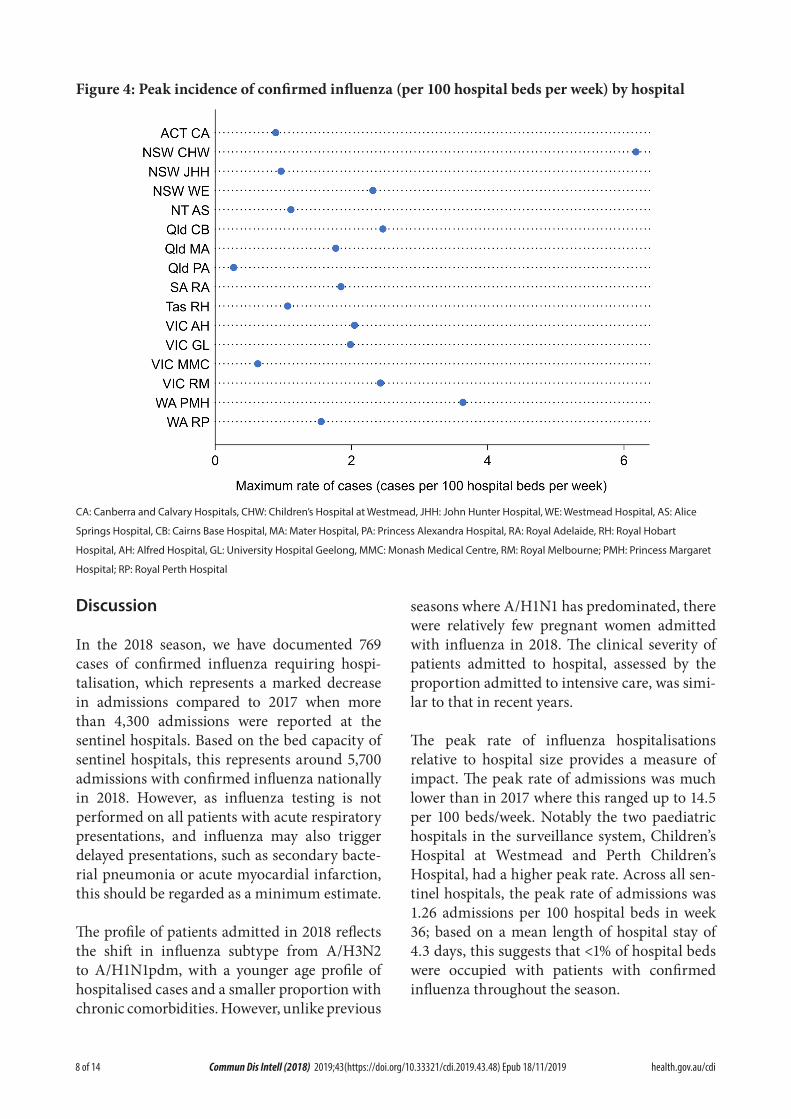
Overall, the peak incidence of admissions with confirmed influenza was 1.2 per 100 hospital beds (Figure 3; in epidemiological week 36), but varied from a high of 6.2 per 100 hospital beds at the Children’s Hospital Westmead to a low of 0.27 per 100 hospital beds at Princess Alexandria Hospital (Figure 4).
Presentation and management
Of all 769 cases, 727 (95%) patients had a docu-mented date of onset of illness documented. Of these, 18 cases (2.3%) were diagnosed more than 7 days after admission and therefore were likely to be hospital-acquired. For the remaining 709 patients with community-onset laboratory-
confirmed influenza where the duration of symptoms was known, the median duration of symptoms prior to admission was 3 days (interquartile range (IQR): 2,5 days). In patients that received antivirals, the delay from onset of illness to admission was >2 days in 57%, and was similar in children (58%), non-elderly adults (54%) and the elderly (60%).
Radiological evidence of pneumonia was present in 130 patients (17%). The proportion of patients with pneumonia was similar in children (16%), non-elderly adults (16%) and elderly adults (19%). A higher proportion of patients with pneumonia were admitted to ICU (36/130; 28%) than those without pneumonia (41/639; 6.4%).
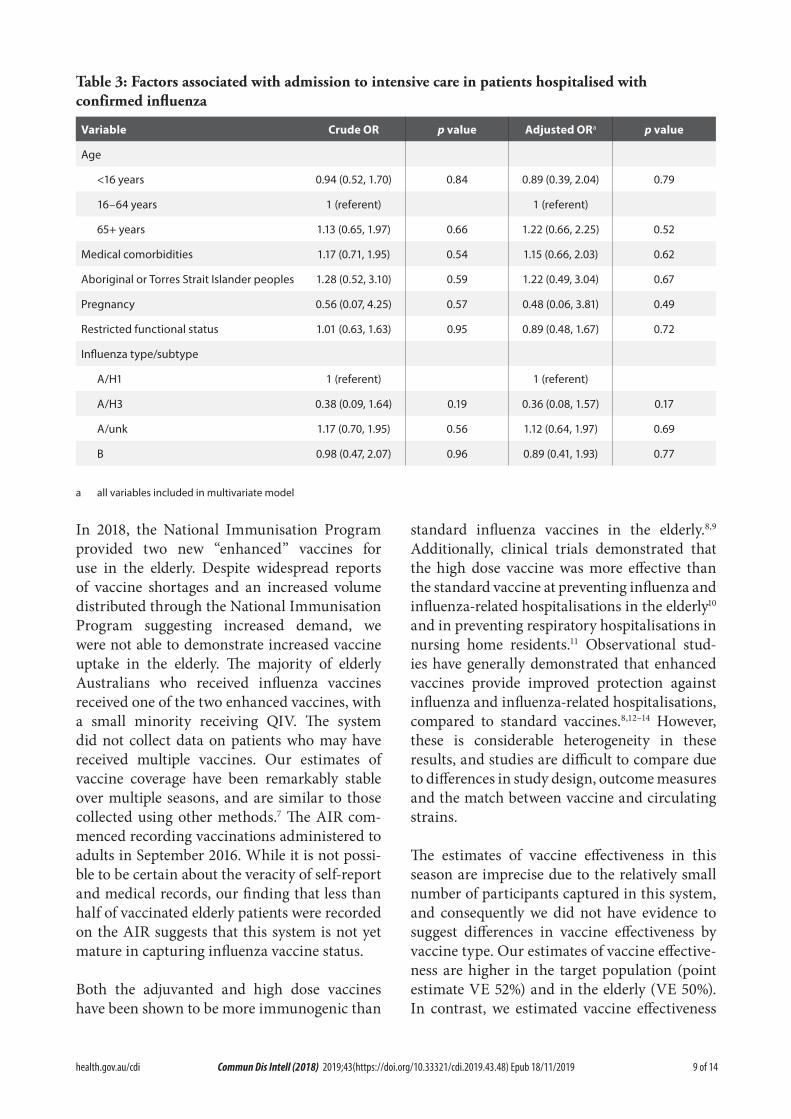
Of all cases, 77 (10.0%) patients were admitted to ICU, comprising 66 patients (8.6%) initially admitted to ICU and a further 11 (1.4%) subse-quently transferred to ICU after initial admission to a general ward. Pregnant women and patients infected with A/H3N2 subtypes were less likely to be admitted to ICU, but these differences were not statistically significant (Table 3).
Use of antivirals
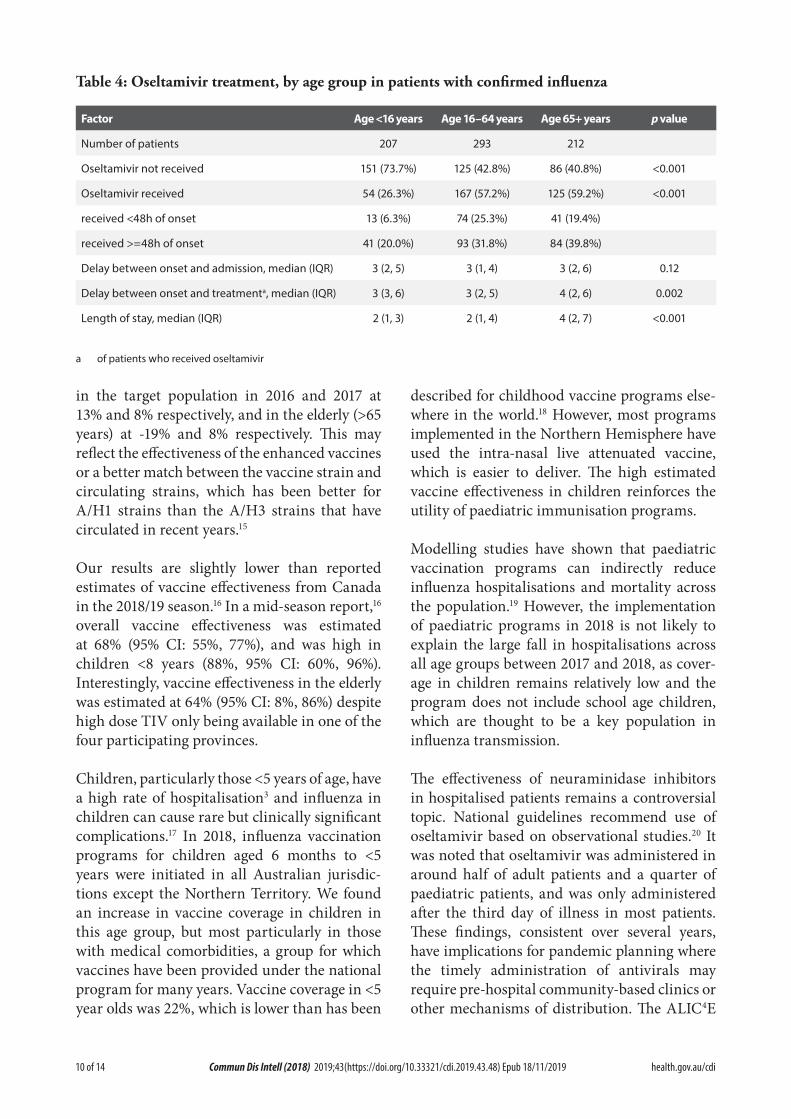
Of patients where the date of onset was reported, 51% did not receive oseltamivir, 18% received oseltamivir within 2 days of symptom onset and 31% received oseltamivir more than 2 days after the onset of illness. Oseltamivir use was lower in children (6.3% within 2 days; a further 20% more than 2 days) than in non-elderly adults (25%, 32%) and the elderly (19%, 40%) (Table 4).
Figure 1: Participants included in surveillance and vaccine effectiveness cohorts
4 of 14 health.gov.au/cdiCommun Dis Intell (2018) 2019;43(https://doi.org/10.33321/cdi.2019.43.48) Epub 18/11/2019
Figu
re 2
: Dat
e of
adm
issio
n in
pat
ient
s hos
pita
lised
with
confi
rmed
influ
enza
01020304050607080
1415
1617
1819
2021
2223
2425
2627
2829
3031
3233
3435
3637
3839
4041
4243
Cases per week
Epid
emio
logi
cal w
eek
A/H1
A/H3
A/un
subt
yped
B
By w
eek
begi
nnin
g on
list
ed d
ate;
repr
esen
ting
date
of a
dmis
sion
(or d
ate
of in
fluen
za d
iagn
osis
if a
cqui
red
>7 d
ays
in h
ospi
tal)
5 of 14 health.gov.au/cdi Commun Dis Intell (2018) 2019;43(https://doi.org/10.33321/cdi.2019.43.48) Epub 18/11/2019
Table 1: Demographic characteristics of hospitalised patients with confirmed influenza
Influenza type/subtype Total
A/H1N1 A/H3N2 A/unknown B
Number 334 50 282 103 769
Age group
<16 years 161 (48.2%) 9 (18.0%) 29 (10.3%) 16 (15.5%) 215 (28.0%)
16-49 years 69 (20.7%) 11 (22.0%) 98 (34.8%) 26 (25.2%) 204 (26.5%)
50-64 years 46 (13.8%) 1 (2.0%) 56 (19.9%) 19 (18.4%) 122 (15.9%)
65-79 years 36 (10.8%) 14 (28.0%) 59 (20.9%) 25 (24.3%) 134 (17.4%)
80+ years 22 (6.6%) 15 (30.0%) 40 (14.2%) 17 (16.5%) 94 (12.2%)
Malea 170 (50.9%) 23 (46.0%) 132 (47.0%) 43 (41.7%) 368 (47.9%)
Pregnant 8 (2.4%) 0 (0.0%) 9 (3.2%) 0 (0.0%) 17 (2.2%)
Indigenous 12 (3.6%) 0 (0.0%) 27 (9.6%) 10 (9.7%) 49 (6.4%)
Jurisdiction
ACT 19 (5.7%) 3 (6.0%) 17 (6.0%) 3 (2.9%) 42 (5.5%)
NSW 164 (49.1%) 11 (22.0%) 25 (8.9%) 13 (12.6%) 213 (27.7%)
NT 0 (0.0%) 0 (0.0%) 4 (1.4%) 1 (1.0%) 5 (0.7%)
Qld 12 (3.6%) 6 (12.0%) 60 (21.3%) 22 (21.4%) 100 (13.0%)
SA 0 (0.0%) 0 (0.0%) 41 (14.5%) 16 (15.5%) 57 (7.4%)
Tas 13 (3.9%) 1 (2.0%) 1 (0.4%) 2 (1.9%) 17 (2.2%)
Vic 25 (7.5%) 6 (12.0%) 130 (46.1%) 31 (30.1%) 192 (25.0%)
WA 101 (30.2%) 23 (46.0%) 4 (1.4%) 15 (14.6%) 143 (18.6%)
a Sex missing in one patient
Outcome
The mean length of hospital stay for all patients was 4.3 days. Admission to ICU was associated with a mean hospital length of stay of 10.8 days compared to 3.8 days in those not admitted to ICU. Of the 737 patients where hospital mor-tality status was documented, 3 patients died (3.7%), all of whom were admitted to ICU.
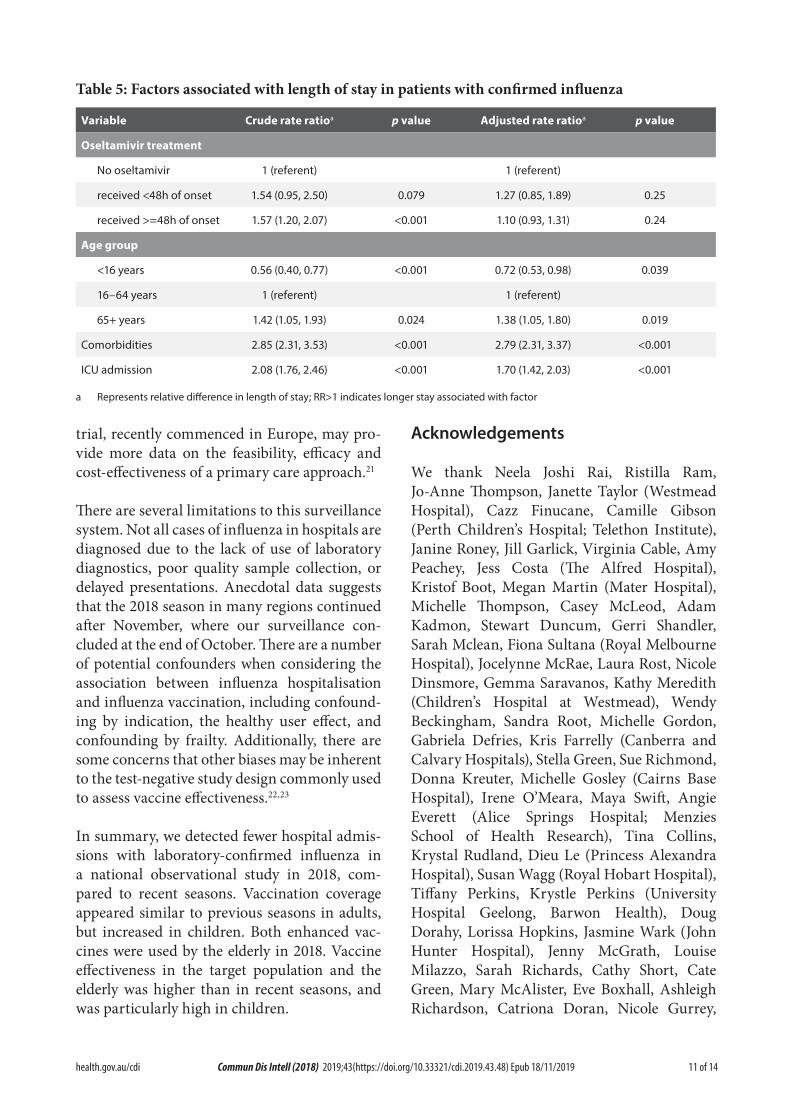
Length of hospital stay was similar in patients that did not receive oseltamivir (median 2 days; IQR 1, 2 days) and in those that received oseltamivir within 2 days (median 2 days; IQR 1, 2 days), and longer in those who received oseltamivir after 2 days (median 3 days; IQR 2, 3 days; Kruskal-Wallis test p<0.001). The crude association between oseltamivir use and longer
length of hospital stay was largely accounted for by age, the severity of illness and presence of comorbidities in a multivariate model (Table 5).
Vaccine coverage and effectiveness
A cohort to estimate vaccine effectiveness included cases at the 17 surveillance hospitals together with cases at additional paediatric hos-pitals (Figure 1). Vaccination status was ascer-tained in 910 of 1010 cases (90%) and 886 of 990 test-negative control patients (89%).
Estimated vaccine coverage was 77% (187/245) in the elderly (≥65 years) and 45% (71/156) in non-elderly adults with medical comorbidities. Of those elderly patients without influenza, who had received influenza vaccine and for whom
6 of 14 health.gov.au/cdiCommun Dis Intell (2018) 2019;43(https://doi.org/10.33321/cdi.2019.43.48) Epub 18/11/2019
Figu
re 3
: Inc
iden
ce o
f con
firm
ed in
fluen
za b
y w
eek
0123456
05
1015
2025
3035
4045
50
Cases per 100 tests / 1000 admissions per week
Epid
emio
logi
cal w
eek
rate
per
100
influ
enza
test
sra
te p
er 1
000
adm
issio
ns
7 of 14 health.gov.au/cdi Commun Dis Intell (2018) 2019;43(https://doi.org/10.33321/cdi.2019.43.48) Epub 18/11/2019
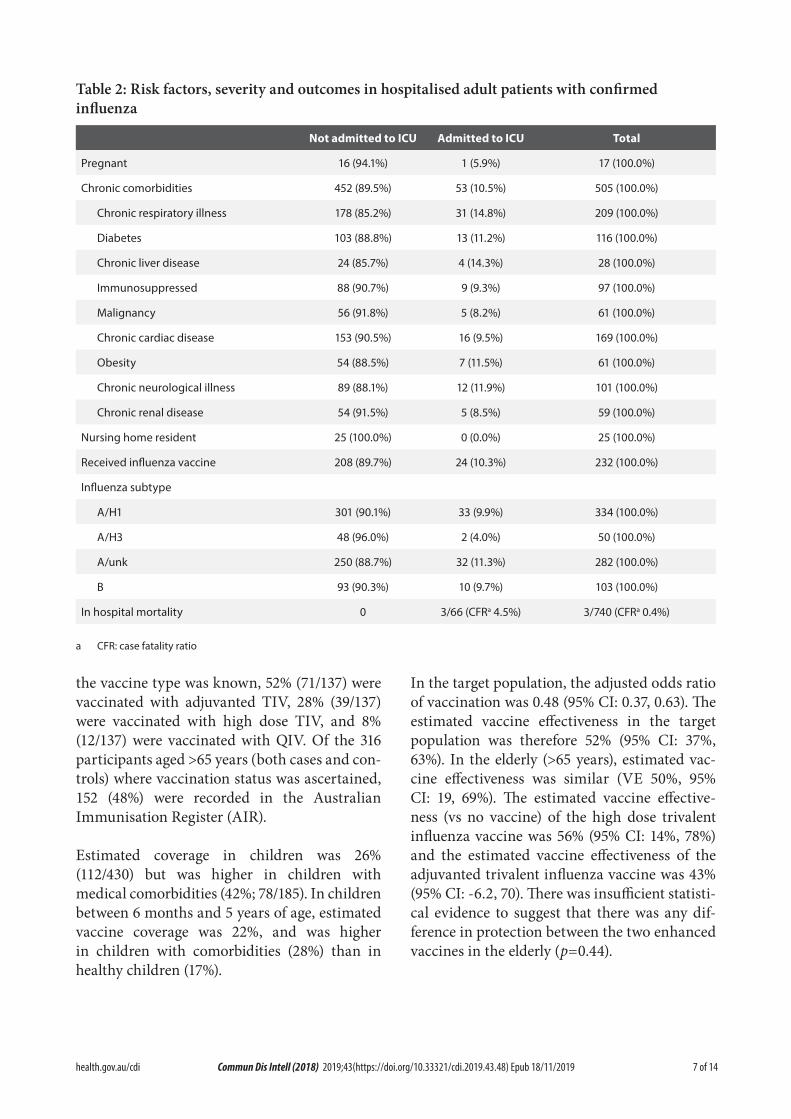
Table 2: Risk factors, severity and outcomes in hospitalised adult patients with confirmed influenza
Not admitted to ICU Admitted to ICU Total
Pregnant 16 (94.1%) 1 (5.9%) 17 (100.0%)
Chronic comorbidities 452 (89.5%) 53 (10.5%) 505 (100.0%)
Chronic respiratory illness 178 (85.2%) 31 (14.8%) 209 (100.0%)
Diabetes 103 (88.8%) 13 (11.2%) 116 (100.0%)
Chronic liver disease 24 (85.7%) 4 (14.3%) 28 (100.0%)
Immunosuppressed 88 (90.7%) 9 (9.3%) 97 (100.0%)
Malignancy 56 (91.8%) 5 (8.2%) 61 (100.0%)
Chronic cardiac disease 153 (90.5%) 16 (9.5%) 169 (100.0%)
Obesity 54 (88.5%) 7 (11.5%) 61 (100.0%)
Chronic neurological illness 89 (88.1%) 12 (11.9%) 101 (100.0%)
Chronic renal disease 54 (91.5%) 5 (8.5%) 59 (100.0%)
Nursing home resident 25 (100.0%) 0 (0.0%) 25 (100.0%)
Received influenza vaccine 208 (89.7%) 24 (10.3%) 232 (100.0%)
Influenza subtype
A/H1 301 (90.1%) 33 (9.9%) 334 (100.0%)
A/H3 48 (96.0%) 2 (4.0%) 50 (100.0%)
A/unk 250 (88.7%) 32 (11.3%) 282 (100.0%)
B 93 (90.3%) 10 (9.7%) 103 (100.0%)
In hospital mortality 0 3/66 (CFRa 4.5%) 3/740 (CFRa 0.4%)
a CFR: case fatality ratio
the vaccine type was known, 52% (71/137) were vaccinated with adjuvanted TIV, 28% (39/137) were vaccinated with high dose TIV, and 8% (12/137) were vaccinated with QIV. Of the 316 participants aged >65 years (both cases and con-trols) where vaccination status was ascertained, 152 (48%) were recorded in the Australian Immunisation Register (AIR).
Estimated coverage in children was 26% (112/430) but was higher in children with medical comorbidities (42%; 78/185). In children between 6 months and 5 years of age, estimated vaccine coverage was 22%, and was higher in children with comorbidities (28%) than in healthy children (17%).
In the target population, the adjusted odds ratio of vaccination was 0.48 (95% CI: 0.37, 0.63). The estimated vaccine effectiveness in the target population was therefore 52% (95% CI: 37%, 63%). In the elderly (>65 years), estimated vac-cine effectiveness was similar (VE 50%, 95% CI: 19, 69%). The estimated vaccine effective-ness (vs no vaccine) of the high dose trivalent influenza vaccine was 56% (95% CI: 14%, 78%) and the estimated vaccine effectiveness of the adjuvanted trivalent influenza vaccine was 43% (95% CI: -6.2, 70). There was insufficient statisti-cal evidence to suggest that there was any dif-ference in protection between the two enhanced vaccines in the elderly (p=0.44).
8 of 14 health.gov.au/cdiCommun Dis Intell (2018) 2019;43(https://doi.org/10.33321/cdi.2019.43.48) Epub 18/11/2019
Discussion
In the 2018 season, we have documented 769 cases of confirmed influenza requiring hospi-talisation, which represents a marked decrease in admissions compared to 2017 when more than 4,300 admissions were reported at the sentinel hospitals. Based on the bed capacity of sentinel hospitals, this represents around 5,700 admissions with confirmed influenza nationally in 2018. However, as influenza testing is not performed on all patients with acute respiratory presentations, and influenza may also trigger delayed presentations, such as secondary bacte-rial pneumonia or acute myocardial infarction, this should be regarded as a minimum estimate.
The profile of patients admitted in 2018 reflects the shift in influenza subtype from A/H3N2 to A/H1N1pdm, with a younger age profile of hospitalised cases and a smaller proportion with chronic comorbidities. However, unlike previous
seasons where A/H1N1 has predominated, there were relatively few pregnant women admitted with influenza in 2018. The clinical severity of patients admitted to hospital, assessed by the proportion admitted to intensive care, was simi-lar to that in recent years.
The peak rate of influenza hospitalisations relative to hospital size provides a measure of impact. The peak rate of admissions was much lower than in 2017 where this ranged up to 14.5 per 100 beds/week. Notably the two paediatric hospitals in the surveillance system, Children’s Hospital at Westmead and Perth Children’s Hospital, had a higher peak rate. Across all sen-tinel hospitals, the peak rate of admissions was 1.26 admissions per 100 hospital beds in week 36; based on a mean length of hospital stay of 4.3 days, this suggests that <1% of hospital beds were occupied with patients with confirmed influenza throughout the season.
Figure 4: Peak incidence of confirmed influenza (per 100 hospital beds per week) by hospital
CA: Canberra and Calvary Hospitals, CHW: Children’s Hospital at Westmead, JHH: John Hunter Hospital, WE: Westmead Hospital, AS: Alice
Springs Hospital, CB: Cairns Base Hospital, MA: Mater Hospital, PA: Princess Alexandra Hospital, RA: Royal Adelaide, RH: Royal Hobart
Hospital, AH: Alfred Hospital, GL: University Hospital Geelong, MMC: Monash Medical Centre, RM: Royal Melbourne; PMH: Princess Margaret
Hospital; RP: Royal Perth Hospital
9 of 14 health.gov.au/cdi Commun Dis Intell (2018) 2019;43(https://doi.org/10.33321/cdi.2019.43.48) Epub 18/11/2019
Table 3: Factors associated with admission to intensive care in patients hospitalised with confirmed influenza
Variable Crude OR p value Adjusted ORa p value
Age
<16 years 0.94 (0.52, 1.70) 0.84 0.89 (0.39, 2.04) 0.79
16–64 years 1 (referent) 1 (referent)
65+ years 1.13 (0.65, 1.97) 0.66 1.22 (0.66, 2.25) 0.52
Medical comorbidities 1.17 (0.71, 1.95) 0.54 1.15 (0.66, 2.03) 0.62
Aboriginal or Torres Strait Islander peoples 1.28 (0.52, 3.10) 0.59 1.22 (0.49, 3.04) 0.67
Pregnancy 0.56 (0.07, 4.25) 0.57 0.48 (0.06, 3.81) 0.49
Restricted functional status 1.01 (0.63, 1.63) 0.95 0.89 (0.48, 1.67) 0.72
Influenza type/subtype
A/H1 1 (referent) 1 (referent)
A/H3 0.38 (0.09, 1.64) 0.19 0.36 (0.08, 1.57) 0.17
A/unk 1.17 (0.70, 1.95) 0.56 1.12 (0.64, 1.97) 0.69
B 0.98 (0.47, 2.07) 0.96 0.89 (0.41, 1.93) 0.77
a all variables included in multivariate model
In 2018, the National Immunisation Program provided two new “enhanced” vaccines for use in the elderly. Despite widespread reports of vaccine shortages and an increased volume distributed through the National Immunisation Program suggesting increased demand, we were not able to demonstrate increased vaccine uptake in the elderly. The majority of elderly Australians who received influenza vaccines received one of the two enhanced vaccines, with a small minority receiving QIV. The system did not collect data on patients who may have received multiple vaccines. Our estimates of vaccine coverage have been remarkably stable over multiple seasons, and are similar to those collected using other methods.7 The AIR com-menced recording vaccinations administered to adults in September 2016. While it is not possi-ble to be certain about the veracity of self-report and medical records, our finding that less than half of vaccinated elderly patients were recorded on the AIR suggests that this system is not yet mature in capturing influenza vaccine status.
Both the adjuvanted and high dose vaccines have been shown to be more immunogenic than
standard influenza vaccines in the elderly.8,9 Additionally, clinical trials demonstrated that the high dose vaccine was more effective than the standard vaccine at preventing influenza and influenza-related hospitalisations in the elderly10 and in preventing respiratory hospitalisations in nursing home residents.11 Observational stud-ies have generally demonstrated that enhanced vaccines provide improved protection against influenza and influenza-related hospitalisations, compared to standard vaccines.8,12–14 However, these is considerable heterogeneity in these results, and studies are difficult to compare due to differences in study design, outcome measures and the match between vaccine and circulating strains.
The estimates of vaccine effectiveness in this season are imprecise due to the relatively small number of participants captured in this system, and consequently we did not have evidence to suggest differences in vaccine effectiveness by vaccine type. Our estimates of vaccine effective-ness are higher in the target population (point estimate VE 52%) and in the elderly (VE 50%). In contrast, we estimated vaccine effectiveness
10 of 14 health.gov.au/cdiCommun Dis Intell (2018) 2019;43(https://doi.org/10.33321/cdi.2019.43.48) Epub 18/11/2019
Table 4: Oseltamivir treatment, by age group in patients with confirmed influenza
Factor Age <16 years Age 16–64 years Age 65+ years p value
Number of patients 207 293 212
Oseltamivir not received 151 (73.7%) 125 (42.8%) 86 (40.8%) <0.001
Oseltamivir received 54 (26.3%) 167 (57.2%) 125 (59.2%) <0.001
received <48h of onset 13 (6.3%) 74 (25.3%) 41 (19.4%)
received >=48h of onset 41 (20.0%) 93 (31.8%) 84 (39.8%)
Delay between onset and admission, median (IQR) 3 (2, 5) 3 (1, 4) 3 (2, 6) 0.12
Delay between onset and treatmenta, median (IQR) 3 (3, 6) 3 (2, 5) 4 (2, 6) 0.002
Length of stay, median (IQR) 2 (1, 3) 2 (1, 4) 4 (2, 7) <0.001
a of patients who received oseltamivir
in the target population in 2016 and 2017 at 13% and 8% respectively, and in the elderly (>65 years) at -19% and 8% respectively. This may reflect the effectiveness of the enhanced vaccines or a better match between the vaccine strain and circulating strains, which has been better for A/H1 strains than the A/H3 strains that have circulated in recent years.15
Our results are slightly lower than reported estimates of vaccine effectiveness from Canada in the 2018/19 season.16 In a mid-season report,16 overall vaccine effectiveness was estimated at 68% (95% CI: 55%, 77%), and was high in children <8 years (88%, 95% CI: 60%, 96%). Interestingly, vaccine effectiveness in the elderly was estimated at 64% (95% CI: 8%, 86%) despite high dose TIV only being available in one of the four participating provinces.
Children, particularly those <5 years of age, have a high rate of hospitalisation3 and influenza in children can cause rare but clinically significant complications.17 In 2018, influenza vaccination programs for children aged 6 months to <5 years were initiated in all Australian jurisdic-tions except the Northern Territory. We found an increase in vaccine coverage in children in this age group, but most particularly in those with medical comorbidities, a group for which vaccines have been provided under the national program for many years. Vaccine coverage in <5 year olds was 22%, which is lower than has been
described for childhood vaccine programs else-where in the world.18 However, most programs implemented in the Northern Hemisphere have used the intra-nasal live attenuated vaccine, which is easier to deliver. The high estimated vaccine effectiveness in children reinforces the utility of paediatric immunisation programs.
Modelling studies have shown that paediatric vaccination programs can indirectly reduce influenza hospitalisations and mortality across the population.19 However, the implementation of paediatric programs in 2018 is not likely to explain the large fall in hospitalisations across all age groups between 2017 and 2018, as cover-age in children remains relatively low and the program does not include school age children, which are thought to be a key population in influenza transmission.
The effectiveness of neuraminidase inhibitors in hospitalised patients remains a controversial topic. National guidelines recommend use of oseltamivir based on observational studies.20 It was noted that oseltamivir was administered in around half of adult patients and a quarter of paediatric patients, and was only administered after the third day of illness in most patients. These findings, consistent over several years, have implications for pandemic planning where the timely administration of antivirals may require pre-hospital community-based clinics or other mechanisms of distribution. The ALIC4E
11 of 14 health.gov.au/cdi Commun Dis Intell (2018) 2019;43(https://doi.org/10.33321/cdi.2019.43.48) Epub 18/11/2019
Table 5: Factors associated with length of stay in patients with confirmed influenza
Variable Crude rate ratioa p value Adjusted rate ratioa p value
Oseltamivir treatment
No oseltamivir 1 (referent) 1 (referent)
received <48h of onset 1.54 (0.95, 2.50) 0.079 1.27 (0.85, 1.89) 0.25
received >=48h of onset 1.57 (1.20, 2.07) <0.001 1.10 (0.93, 1.31) 0.24
Age group
<16 years 0.56 (0.40, 0.77) <0.001 0.72 (0.53, 0.98) 0.039
16–64 years 1 (referent) 1 (referent)
65+ years 1.42 (1.05, 1.93) 0.024 1.38 (1.05, 1.80) 0.019
Comorbidities 2.85 (2.31, 3.53) <0.001 2.79 (2.31, 3.37) <0.001
ICU admission 2.08 (1.76, 2.46) <0.001 1.70 (1.42, 2.03) <0.001
a Represents relative difference in length of stay; RR>1 indicates longer stay associated with factor
trial, recently commenced in Europe, may pro-vide more data on the feasibility, efficacy and cost-effectiveness of a primary care approach.21
There are several limitations to this surveillance system. Not all cases of influenza in hospitals are diagnosed due to the lack of use of laboratory diagnostics, poor quality sample collection, or delayed presentations. Anecdotal data suggests that the 2018 season in many regions continued after November, where our surveillance con-cluded at the end of October. There are a number of potential confounders when considering the association between influenza hospitalisation and influenza vaccination, including confound-ing by indication, the healthy user effect, and confounding by frailty. Additionally, there are some concerns that other biases may be inherent to the test-negative study design commonly used to assess vaccine effectiveness.22,23
In summary, we detected fewer hospital admis-sions with laboratory-confirmed influenza in a national observational study in 2018, com-pared to recent seasons. Vaccination coverage appeared similar to previous seasons in adults, but increased in children. Both enhanced vac-cines were used by the elderly in 2018. Vaccine effectiveness in the target population and the elderly was higher than in recent seasons, and was particularly high in children.
Acknowledgements
We thank Neela Joshi Rai, Ristilla Ram, Jo-Anne Thompson, Janette Taylor (Westmead Hospital), Cazz Finucane, Camille Gibson (Perth Children’s Hospital; Telethon Institute), Janine Roney, Jill Garlick, Virginia Cable, Amy Peachey, Jess Costa (The Alfred Hospital), Kristof Boot, Megan Martin (Mater Hospital), Michelle Thompson, Casey McLeod, Adam Kadmon, Stewart Duncum, Gerri Shandler, Sarah Mclean, Fiona Sultana (Royal Melbourne Hospital), Jocelynne McRae, Laura Rost, Nicole Dinsmore, Gemma Saravanos, Kathy Meredith (Children’s Hospital at Westmead), Wendy Beckingham, Sandra Root, Michelle Gordon, Gabriela Defries, Kris Farrelly (Canberra and Calvary Hospitals), Stella Green, Sue Richmond, Donna Kreuter, Michelle Gosley (Cairns Base Hospital), Irene O’Meara, Maya Swift, Angie Everett (Alice Springs Hospital; Menzies School of Health Research), Tina Collins, Krystal Rudland, Dieu Le (Princess Alexandra Hospital), Susan Wagg (Royal Hobart Hospital), Tiffany Perkins, Krystle Perkins (University Hospital Geelong, Barwon Health), Doug Dorahy, Lorissa Hopkins, Jasmine Wark (John Hunter Hospital), Jenny McGrath, Louise Milazzo, Sarah Richards, Cathy Short, Cate Green, Mary McAlister, Eve Boxhall, Ashleigh Richardson, Catriona Doran, Nicole Gurrey,
12 of 14 health.gov.au/cdiCommun Dis Intell (2018) 2019;43(https://doi.org/10.33321/cdi.2019.43.48) Epub 18/11/2019
Sophie Whitehead, Jiayas Lin, Rebecca Glover, Segun Kandel, Monima Pamang, Kate Shelton (Royal Adelaide Hospital), Johnathon Bircham, Ellen MacDonald, Sophie Damianopoulos, Helen Hammersley and Fiona Seroney (Royal Perth Hospital). We also thank Rebecca Doyle, Sara Cook, Sonia Dougherty (Queensland Children’s Hospital), Chris Heath, Mary Walker (Women & Childrens Hospital Adelaide), Laura Francis (Royal Darwin Hospital) and Gowri Selvaraj, Karen Bellamy (Monash Children’s Hospital). Alissa McMinn, Donna Lee, Margie Gibson (Royal Children’s Hospital Melbourne). We acknowledge the support of the Australian Government Department of Health and the Victorian Department of Health and Human Services for funding this system.
Author details
Prof Allen C Cheng, Alfred Health; Monash University
Prof Mark Holmes, University of Adelaide, Royal Adelaide Hospital
Prof Dominic E Dwyer, NSW Health Pathology-ICPMR, University of Sydney, Westmead Hospital
A/Prof Sanjaya Senenayake, Australian National University, The Canberra Hospital
Dr Louise Cooley, Royal Hobart Hospital
A/Prof Louis Irving, Royal Melbourne Hospital, University of Melbourne
Dr Graham Simpson, Cairns Base Hospital
A/Prof Tony Korman, Monash Medical Centre; Monash University
Prof Kristine Macartney, Children’s Hospital at Westmead
A/Prof N. Deborah Friedman, University Hospital Geelong
Prof Peter Wark, University of Newcastle, John Hunter Hospital
Dr Anna Holwell, Alice Springs Hospital
A/Prof Christopher Blyth, Perth Children’s Hospital, University of Western Australia, Telethon Kids Institute
Dr Nigel Crawford, Royal Children’s Hospital, Melbourne; Murdoch Children’s Research Institute
Prof Jim Buttery, Monash Children’s Hospital, Monash University
Dr Simon Bowler, Mater Hospitals
Prof John W Upham, Princess Alexandra Hospital, University of Queensland
Prof Grant Waterer, University of Western Australia, Royal Perth Hospital
A/Prof Tom Kotsimbos, Alfred Health; Monash University
Adjunct Prof Paul Kelly, Therapeutic Goods Administration, Australian Department of Health
Corresponding author
Prof Allen Cheng, Department of Epidemiology and Preventive Medicine, Monash University, Commercial Road, Melbourne Vic 3004. Email: [email protected]
References
1. GBD 2017 Influenza Collaborators. Mortality,morbidity, and hospitalisations due to influ-enza lower respiratory tract infections, 2017:an analysis for the Global Burden of DiseaseStudy 2017. Lancet Respir Med. 2019;7(1):69–89.
2. Cassini A, Colzani E, Pini A, Mangen MJ,Plass D, McDonald SA et al. Impact of infec-
13 of 14 health.gov.au/cdi Commun Dis Intell (2018) 2019;43(https://doi.org/10.33321/cdi.2019.43.48) Epub 18/11/2019
tious diseases on population health using incidence-based disability-adjusted life years (DALYs): results from the Burden of Communicable Diseases in Europe study, European Union and European Economic Area countries, 2009 to 2013. Euro Surveill. 2018;23(16). https://doi.org/10.2807/1560-7917.ES.2018.23.16.17-00454.
3. Li-Kim-Moy J, Yin JK, Patel C, Beard FH,Chiu C, Macartney KK et al. Australianvaccine preventable disease epidemiologicalreview series: Influenza 2006 to 2015. Com-mun Dis Intell Q Rep. 2016;40(4):E482–95.
4. Kelly PM, Kotsimbos T, Reynolds A, Wood-Baker R, Hancox B, Brown SG et al. FluCAN2009: initial results from sentinel surveil-lance for adult influenza and pneumoniain eight Australian hospitals. Med J Aust.2011;194(4):169–74.
5. AIHW. Hospital resources 2016–17: Austral-ian hospital statistics. Canberra: AustralianInstitute for Health and Welfare; 2018. Avail-able from: https://www.aihw.gov.au/reports/hospitals/ahs-2016-17-hospital-resources/contents/table-of-contents
6. Oken MM, Creech RH, Tormey DC, HortonJ, Davis TE, McFadden ET et al. Toxicityand response criteria of the Eastern Coop-erative Oncology Group. Am J Clin Oncol.1982;5(6):649–55.
7. Dyda A, Karki S, Hayen A, MacIntyre CR,Menzies R, Banks E et al. Influenza andpneumococcal vaccination in Australianadults: a systematic review of coverage andfactors associated with uptake. BMC InfectDis. 2016;16(1):515.
8. Domnich A, Arata L, Amicizia D, Puig-Bar-bera J, Gasparini R, Panatto D. Effectivenessof MF59-adjuvanted seasonal influenza vac-cine in the elderly: A systematic review andmeta-analysis. Vaccine. 2017;35(4):513–20.
9. Wilkinson K, Wei Y, Szwajcer A, Rabbani R,
Zarychanski R, Abou-Setta AM et al. Efficacy and safety of high-dose influenza vaccine in elderly adults: A systematic review and meta-analysis. Vaccine. 2017;35(21):2775–80.
10. DiazGranados CA, Dunning AJ, Kimmel M,Kirby D, Treanor J, Collins A et al. Efficacyof high-dose versus standard-dose influ-enza vaccine in older adults. N Engl J Med.2014;371(7):635–45.
11. Gravenstein S, Davidson HE, Taljaard M,Ogarek J, Gozalo P, Han L et al. Comparativeeffectiveness of high-dose versus standard-dose influenza vaccination on numbers of USnursing home residents admitted to hospital:a cluster-randomised trial. Lancet RespirMed. 2017;5(9):738–46.
12. Shay DK, Chillarige Y, Kelman J, ForsheeRA, Foppa IM, Wernecke M et al. Compara-tive effectiveness of high-dose versus stand-ard-dose influenza vaccines among US Medi-care beneficiaries in preventing postinfluenzadeaths during 2012–2013 and 2013–2014. JInfect Dis. 2017;215(4):510–7.
13. Izurieta HS, Thadani N, Shay DK, Lu Y,Maurer A, Foppa IM et al. Comparativeeffectiveness of high-dose versus standard-dose influenza vaccines in US residents aged65 years and older from 2012 to 2013 usingMedicare data: a retrospective cohort analy-sis. Lancet Infect Dis. 2015;15(3):293–300.
14. Mannino S, Villa M, Apolone G, Weiss NS,Groth N, Aquino I et al. Effectiveness ofadjuvanted influenza vaccination in elderlysubjects in northern Italy. Am J Epidemiol.2012;176(6):527–33.
15. Belongia EA, Simpson MD, King JP, Sunda-ram ME, Kelley NS, Osterholm MT et al.Variable influenza vaccine effectiveness bysubtype: a systematic review and meta-anal-ysis of test-negative design studies. LancetInfect Dis. 2016;16(8):942–51.
16. Skowronski DM, Leir S, Sabaiduc S, Murti
14 of 14 health.gov.au/cdiCommun Dis Intell (2018) 2019;43(https://doi.org/10.33321/cdi.2019.43.48) Epub 18/11/2019
M, Dickinson JA, Olsha R et al. Interim estimates of 2018/19 vaccine effectiveness against influenza A(H1N1)pdm09, Canada, January 2019. Euro Surveill. 2019;24(4). https://doi.org/10.2807/1560-7917.ES.2019.24.4.1900055.
17. Britton PN, Blyth CC, Macartney K, DaleRC, Li-Kim-Moy J, Khandaker G, et al. Thespectrum and burden of influenza-associatedneurological disease in children: combinedencephalitis and influenza sentinel site sur-veillance from Australia, 2013–2015. ClinInfect Dis. 2017;65(4):653–60.
18. Rajaram S, Steffey A, Blak B, Hickman M,Christensen H, Caspard H. Uptake of child-hood influenza vaccine from 2012–2013to 2014–2015 in the UK and the implica-tions for high-risk children: a retrospec-tive observational cohort study. BMJ Open.2016;6(8):e010625.
19. Rajaram S, Wiecek W, Lawson R, Blak BT,Zhao Y, Hackett J et al. Impact of increasedinfluenza vaccination in 2-3-year-old chil-dren on disease burden within the generalpopulation: A Bayesian model-based ap-proach. PLoS One. 2017;12(12):e0186739.
20. Muthuri SG, Venkatesan S, Myles PR,Leonardi-Bee J, Al Khuwaitir TS,Al Mamun A et al. Effectiveness of neurami-nidase inhibitors in reducing mortality in pa-tients admitted to hospital with influenza AH1N1pdm09 virus infection: a meta-analysisof individual participant data. Lancet RespirMed. 2014;2(5):395–404.
21. Bongard E, van der Velden AW, Cook J,Saville B, Beutels P, Munck Aabenhus Ret al. Antivirals for influenza-Like Illness?A randomised Controlled trial of Clini-cal and Cost effectiveness in primary CarE(ALIC4E): the ALIC4E protocol. BMJ Open.2018;8(7):e021032.
22. Ainslie KEC, Shi M, Haber M, OrensteinWA. On the bias of estimates of influenza
vaccine effectiveness from test-negative stud-ies. Vaccine. 2017;35(52):7297–301.
23. Lewnard JA, Tedijanto C, Cowling BJ,Lipsitch M. Measurement of vaccine directeffects under the test-negative design. Am JEpidemiol. 2018;187(12):2686–97.