Embed Size (px)
Citation preview
Commissioner’s Monthly ReportNovember 2017
CommissionerAllison Blake, Ph.D., L.S.W
2
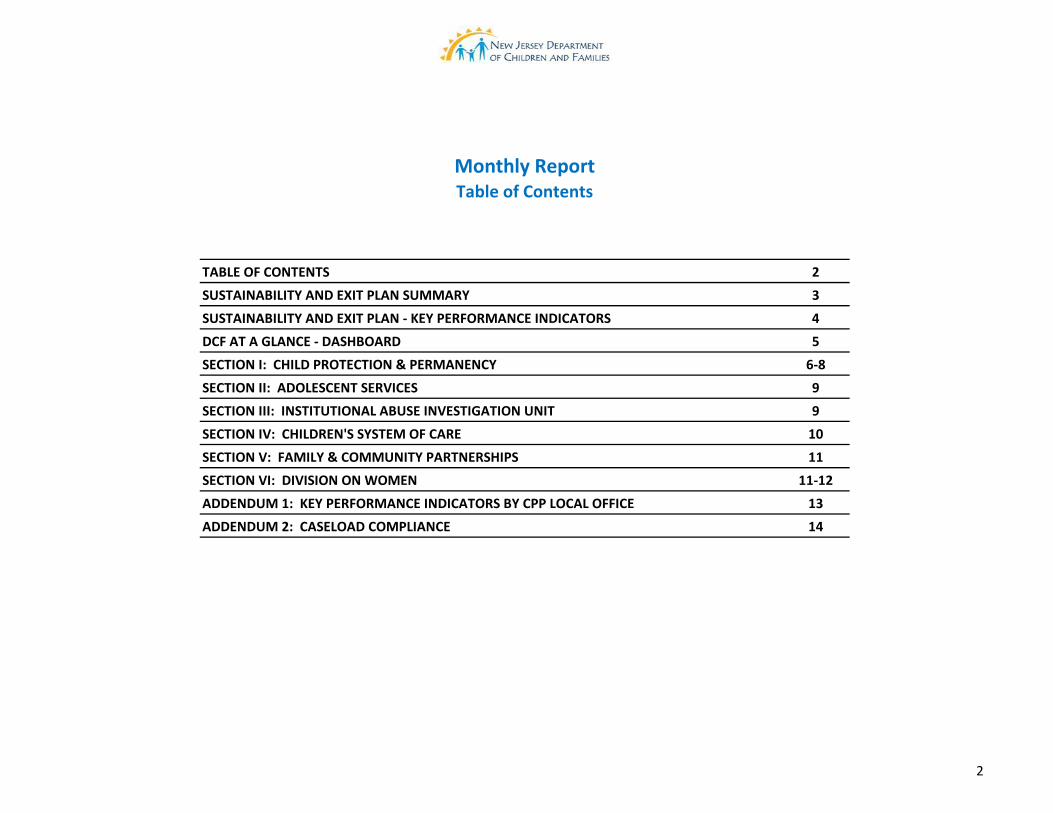
TABLE OF CONTENTS 2SUSTAINABILITY AND EXIT PLAN SUMMARY 3SUSTAINABILITY AND EXIT PLAN - KEY PERFORMANCE INDICATORS 4DCF AT A GLANCE - DASHBOARD 5SECTION I: CHILD PROTECTION & PERMANENCY 6-8SECTION II: ADOLESCENT SERVICES 9SECTION III: INSTITUTIONAL ABUSE INVESTIGATION UNIT 9SECTION IV: CHILDREN'S SYSTEM OF CARE 10SECTION V: FAMILY & COMMUNITY PARTNERSHIPS 11SECTION VI: DIVISION ON WOMEN 11-12ADDENDUM 1: KEY PERFORMANCE INDICATORS BY CPP LOCAL OFFICE 13ADDENDUM 2: CASELOAD COMPLIANCE 14
Monthly ReportTable of Contents

3
Measure Type Measure Description Target Performance ∆
Intake workers Caseload (Local Offices) 95% 100% 0%
Intake workers Caseload 90% 93% 0%
Permanency Workers Caseload (Local Offices) 95% 100% 0%
Permanency Workers Caseload 95% 100% 0%
Adoption Workers Caseload (Local Offices) 95% 100% 0%
Adoption Workers Caseload 95% 94% -1%
Supervisor/Worker Ratio 95% 100% 0%
IAIU Investigators Caseload 95% 100% 0%
Adequacy of DAsG Staffing 100% 100% 0%
Child Health Units Met Met 0%
Timeliness of Investigation Completion (60 days) 85% 86% 0%
Timeliness of Investigation Completion (90 days) 95% 95% 0%
IAIU Timeliness of Investigation Completion (60 days) 80% 87% 0%
Initial Family Team Meetings 80% 85% 0%
Subsequent FTMs within 12 months 80% 86% 0% Measure Type Measure Description Target Performance ∆
Subsequent FTMs after 12 months –Reunification Goal 90% 100% 0% Subsequent FTMs after 12 months – Other than Reunification Goal
90% 83% -7%
Initial Case Plans- for Children Entering Placement 95% 96% 0% Caseworker Contacts with Family When Goal is Reunification
90% 74% -16%
Timeliness of Current Plans 95% 96% 0% Child Visits with Siblings 85% 71% -14%
Caseworker Contacts with Children – NewPlacement/Placement Change
93% 94% 0% Quality Investigations 85% 83% -2%
Caseworker Contact with Children in Placement 93% 96% 0% Quality of Teaming 75% 51% -24%
Parent-Child Visits –weekly 60% 84% 0% Quality of Case Plans 80% 53% -27%
Parent-Child Visits – biweekly 85% 89% 0% Services to Support Transitions 80% 68% -12%
Independent Living Assessments 90% 95% 0% Housing 95% 91% -4%
Educational Needs 80% 85% 0% Employment/Education 85% 83% -2%
Quality of Case Planning and Services 75% 74% -1% Needs Assessment n/a Partial n/a
Placing Siblings groups of 2&3 80% 79% 0% Placement Stability- First 12 Months in Care 84% 82% -2%
Placing Siblings groups of 4 or More 80% 84% 0% Maltreatment Post-Reunification 6.9% 7.7% 0.8%
Recruitment for Sibling Homes Serving Four or More Met Met 0% Re-entry to Placement 9.0% 11.5% 2.5%
Placement Stability- Children in Care 13 –24 Months 88% 95% 0% Permanency within 24 Months 66% 64% -2%
Abuse and Neglect of Children in Foster Care 0.49% 0.11% 0% Permanency within 36 Months 80% 78% -2%
Repeat Maltreatment (In-home) 7.2% 6.5% 0% Permanency within 48 Months 86% 85% -1%
Permanency within 12 Months 42% 41% -1%
Permanency successfully maintained
SUSTAINABILTY AND EXIT PLAN SUMMARYAs of June 30, 2016
"TO BE MAINTAINED"Successfully Maintained
FOUNDATIONAL ELEMENTSSuccessfully Maintained
Data Transparency successfully maintained
CaseloadsMonthly
Case Practice Model successfully maintained
State Central Registry successfully maintained
Appropriate Placements successfully maintained
Service Array successfully maintained
Medical/Behavioral Health Services successfully maintained
Training successfully maintained
Flexible Funding successfully maintained
Resource Family Care Support Rates successfully maintained
Outcome MeasuresAnnually
Outcome MeasuresAnnually
Adoption Practice successfully maintained
Key Performance IndicatorsMonthly
"TO BE ACHIEVED"
Key Performance IndicatorsMonthly
Quality MeasuresAnnually
Quality MeasuresAnnually

4
Month 1 PerformanceExit Plan
Target% to Meet
TargetSubsequent FTMs after 12 Months - Other than Reunification Goal September '17 97% 90% 0%CW visits Parent 2x/Month September '17 70% 90% -20%Child Visit with Siblings September '17 68% 85% -17%
Month PerformanceExit Plan
Target% to Meet
TargetInitial FTMs within 45 days August '17 83% 80% 0%Subsequent FTMs within 12 Months September '17 80% 80% 0%Subsequent FTMs after 12 Months - Reunification Goal (n=32) September '17 78% 90% -12%Investigation Timeliness CP&P 60 days July '17 85% 85% 0%Investigation Timeliness CP&P 90 days July '17 94% 95% -1%Investigation Timeliness IAIU September '17 85% 80% 0%Initial Case Plans September '17 95% 95% 0%Ongoing Case Plans September '17 94% 95% -1%Parent-Child Weekly Visit 2 September '17 60% 60% 0%Parent-Child Visits Biweekly September '17 73% 85% -12%CW visits Child Monthly (at placement site) 3 September '17 96% 93% 0%CW visits Child 2x/Month for first 2 Months in placement July '17 93% 93% 0%Ind. Living Assessments 14-18 yrs September '17 93% 90% 0%Supervisor Worker Ratio September '17 100% 95% 0%Caseloads: IAIU Investigators September '17 100% 95% 0%Caseloads: Intake September '17 97% 90% 0%Caseloads: Permanency September '17 100% 95% 0%Caseloads: Adoption September '17 98% 95% 0%
¹ Reported performance understates actual performance in some measures because data does not exclude all instances where an event could not occur.2 Compliance for Parent-Child Weekly Visits is measured by percent of children with weekly visits averaged over the number of weeks in the month.3 Caseworker visits with Children in Placement (all locations) September 2017 ( 98% )
The blue bar indicates DCF performance in the current month. The red bar indicates the difference between the current performance and the Exit Plan target.
SUSTAINABILTY AND EXIT PLANKey Performance Indicators
On or About September 30th , 2017
"To Be Maintained" Measures
"To Be Achieved" Measures
5
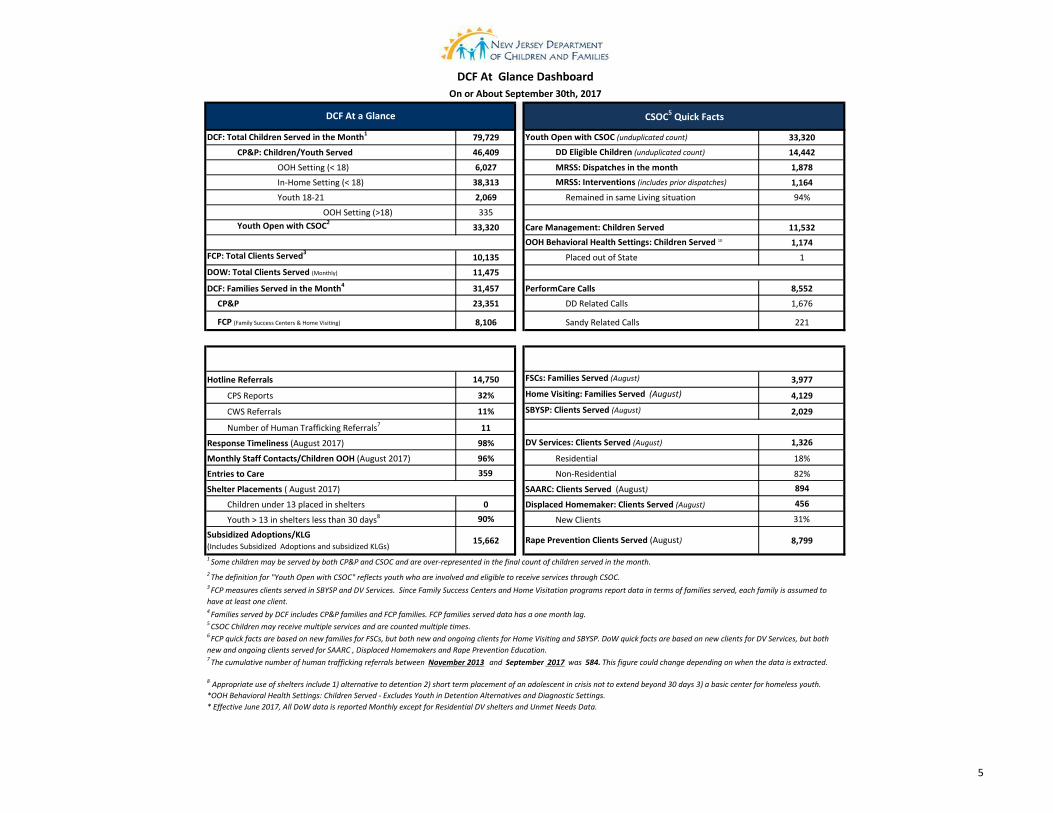
79,729 33,320
46,409 14,442
6,027 1,878
38,313 1,1642,069 94%
335Youth Open with CSOC2
33,320 11,532
1,174FCP: Total Clients Served3
10,135 Placed out of State 1
11,475
31,457 8,552
23,351 DD Related Calls 1,676
8,106 221
14,750 FSCs: Families Served (August) 3,977
32% Home Visiting: Families Served (August) 4,129
11% SBYSP: Clients Served (August) 2,029
11
98% DV Services: Clients Served (August) 1,326
96% Residential 18%359 Non-Residential 82%
894
0 456
90% 31%
15,662 8,799
OOH Setting (>18)
DCF At Glance Dashboard
8 Appropriate use of shelters include 1) alternative to detention 2) short term placement of an adolescent in crisis not to extend beyond 30 days 3) a basic center for homeless youth.
Response Timeliness (August 2017)
2 The definition for "Youth Open with CSOC" reflects youth who are involved and eligible to receive services through CSOC.
Entries to Care
1 Some children may be served by both CP&P and CSOC and are over-represented in the final count of children served in the month.
Number of Human Trafficking Referrals7
Children under 13 placed in shelters Displaced Homemaker: Clients Served (August)
Youth > 13 in shelters less than 30 days8 New Clients
SAARC: Clients Served (August)
3 FCP measures clients served in SBYSP and DV Services. Since Family Success Centers and Home Visitation programs report data in terms of families served, each family is assumed to have at least one client.4 Families served by DCF includes CP&P families and FCP families. FCP families served data has a one month lag. 5 CSOC Children may receive multiple services and are counted multiple times.6 FCP quick facts are based on new families for FSCs, but both new and ongoing clients for Home Visiting and SBYSP. DoW quick facts are based on new clients for DV Services, but both new and ongoing clients served for SAARC , Displaced Homemakers and Rape Prevention Education.7 The cumulative number of human trafficking referrals between November 2013 and September 2017 was 584. This figure could change depending on when the data is extracted.
Monthly Staff Contacts/Children OOH (August 2017)
CPS Reports
CWS Referrals
CP&P Quick Facts FCP & DoW Quick Facts7
CP&P
FCP (Family Success Centers & Home Visiting) Sandy Related Calls
Care Management: Children ServedOOH Behavioral Health Settings: Children Served 10
DOW: Total Clients Served (Monthly)
*OOH Behavioral Health Settings: Children Served - Excludes Youth in Detention Alternatives and Diagnostic Settings.* Effective June 2017, All DoW data is reported Monthly except for Residential DV shelters and Unmet Needs Data.
Shelter Placements ( August 2017)
Hotline Referrals
Subsidized Adoptions/KLG(Includes Subsidized Adoptions and subsidized KLGs)
Rape Prevention Clients Served (August)
DCF: Families Served in the Month4 PerformCare Calls
On or About September 30th, 2017
DCF At a Glance CSOC5 Quick Facts
DCF: Total Children Served in the Month1 Youth Open with CSOC (unduplicated count)
Youth 18-21 Remained in same Living situation
CP&P: Children/Youth Served DD Eligible Children (unduplicated count)
OOH Setting (< 18) MRSS: Dispatches in the month
In-Home Setting (< 18) MRSS: Interventions (includes prior dispatches)

6
Sep-17∆ from Sep
2016
23,351 1%
46,409 1%
40,047 3%
(52.8%)(38.3%)(7.4%)(1.5%)
1,099 -2%
686 -6%
1,817 -4%
13,845 0%
359 -2%391 -3%
Release Date: November 15, 2016
Section I: Child Protection & Permanency
Entries to Care Exits from Care
-9%Resource Family (non-Kin)
Resource Family Kinship
Group and Residential
Independent Living
Children Legally Free for Adoption (Excludes TPR Appeals)
Children Under CP&P Supervision
Children Receiving CP&P In-Home Services
Children in CP&P Out-of-Home Placement
6,362
Children in Subsidized Kinship Legal Guardianship
Children in Subsidized Adoptions
CP&P Quick Facts
Data in this chart includes children up to age 20.99
Families Under CP&P Supervision
Finalized Adoptions to date (CY2017) - As 9/30/2017
8,846
7,900
7,171 7,018 7,361 7,330 7,322
6,955 6,663 6,690 6,740 6,695 6,684 6,709 6,607 6,539 6,415 6,362
4,366
4,716
2,000
3,000
4,000
5,000
6,000
7,000
8,000
9,000
10,000
11,000
2008 2009 2010 2011 2012 2013 2014 2015 2016 Jan'17
Feb'17
Mar'17
Apr'17
May'17
Jun'17
Jul'17
Aug'17
Sept'17
Children in Out-of-Home Placement: Annual Entries, Exits and Monthly Point in Time Children in Placement
Children in Placement-Point in Time Entries Exits Point In Time data is based on data as of the last day of each month. Axis begins at 2,000 to enhance separation of data.
32%
11%
57%
CPS Reports CWS Referrals Non CPS/CWS Child Related Calls
Total SCR Intakes n = 14,750
3,000
3,500
4,000
4,500
5,000
5,500
6,000
6,500
7,000
7,500
8,000
Apr May Jun Jul Aug Sept
CPS & CWS Referrals
2014 2015 2016 2017
500
700
900
1,100
1,300
1,500
1,700
1,900
Apr May Jun Jul Aug Sept
CWS Referrals Assigned to Local Offices
2014 2015 2016 2017
7
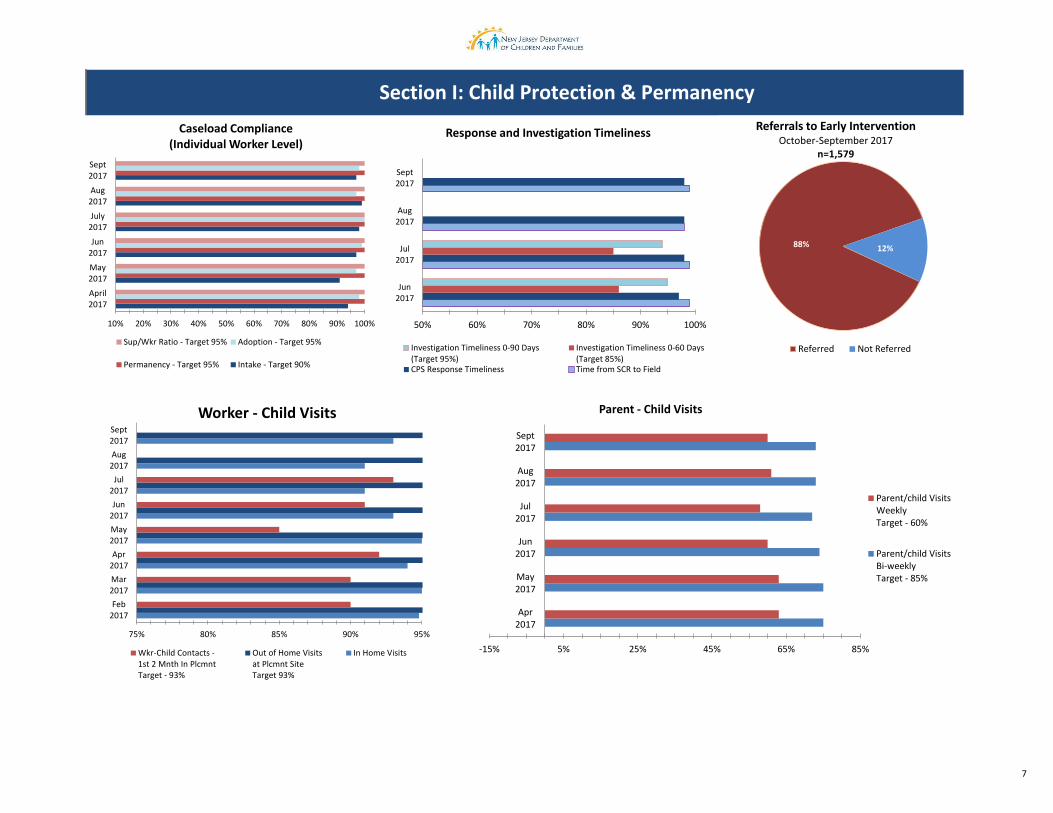
Section I: Child Protection & Permanency
10% 20% 30% 40% 50% 60% 70% 80% 90% 100%
April2017
May2017
Jun2017
July2017
Aug2017
Sept2017
Caseload Compliance (Individual Worker Level)
Sup/Wkr Ratio - Target 95% Adoption - Target 95%
Permanency - Target 95% Intake - Target 90%
88% 12%
Referrals to Early Intervention October-September 2017
n=1,579
Referred Not Referred
-15% 5% 25% 45% 65% 85%
Apr2017
May2017
Jun2017
Jul2017
Aug2017
Sept2017
Parent - Child Visits
Parent/child VisitsWeeklyTarget - 60%
Parent/child VisitsBi-weeklyTarget - 85%
75% 80% 85% 90% 95%
Feb2017
Mar2017
Apr2017
May2017
Jun2017
Jul2017
Aug2017
Sept2017
Worker - Child Visits
Wkr-Child Contacts -1st 2 Mnth In PlcmntTarget - 93%
Out of Home Visitsat Plcmnt SiteTarget 93%
In Home Visits
50% 60% 70% 80% 90% 100%
Jun2017
Jul2017
Aug2017
Sept2017
Response and Investigation Timeliness
Investigation Timeliness 0-90 Days(Target 95%)
Investigation Timeliness 0-60 Days(Target 85%)
CPS Response Timeliness Time from SCR to Field

8
Section I: Child Protection & Permanency
10% 20% 30% 40% 50% 60% 70% 80% 90% 100%
April2017
May2017
Jun2017
Jul2017
Aug2017
Sept2017
Initial & Subsequent Family Team Meetings
Subsequent FTM after12 Months(Other than reunification goal)Target 90%
Subsequent FTM after12 Months(Reunification Goal)Target 90%
Subsequent FTM within12 MonthsTarget 80%
Initial FTM within 45 daysTarget 80%
40% 50% 60% 70% 80% 90% 100%
Apr2017
May2017
Jun2017
Jul2017
Aug2017
Sept2017
Initial & Ongoing Case Plans
Ongoing Case PlanTarget 95%
Initial Case PlanTarget 95%
10%
20%
30%
40%
50%
60%
70%
80%
90%
Apr2017
May2017
Jun2017
Jul2017
Aug2017
Sept2017
Worker- Parent Visits & Sibling Visits
Wkr-ParentContacts -Reun. Goal (2x/month)Target - 90%
Child Visitswith SiblingsTarget - 85%
40%
60%
80%
100%
Nov2016
Dec2016
Jan2017
Feb2017
Mar2017
Apr2017
May2017
June2017
July2017
Medical Assessments for Children in Out of Home Placement (OOHP)
Pre-Placement Medical Assessments in Appropriate Settings
Comprehensive Medical Examinations Within 30 Days
40% 60% 80% 100%
Q4 '16
Q1 '17
Q2 '17
Q3 '17
Immunizations for Children in OOHP
Immunizations Up To Date
97%
3%
Children in OOHP with Annual Dental Exams
June 2017 n=4,003

9
2,069
Family Based Setting (56%)Congregate Care Setting (21%)Independent Living (22%)
623
Nov-16
Release
Section III: Institutional Abuse Investigation Unit
Section II: Adolescent ServicesOAS Quick Facts (September 2017)
Youth 18-21Youth 18-21 years old served by CP&P⁴Youth served “In Home” living with a parent/relative or living independently⁵
1,734
Youth served "Out-of-Home"
335
Youth Receiving Adoption or KLG Subsidy4 The data includes all 18-21 year olds who are active participants in an open CP&P case as of the end of the month.
5 The terms “out-of-home” and “in-home” may not be appropriate for all 18-21 year olds. Youth identified as “in-home” can either be residing with a parent/relative, or living independently. Any of these youth may be receiving services. These definitions are currently being reviewed to better understand how we capture DCF’s work with this population. The goal of this ongoing work is to create three meaningful categories for 18-21 year olds 1) Youth in a formal out-of-home placement setting, 2) Youth that achieved permanency, and 3) Youth that never achieved permanency.
0
100
200
300
400
Apr May Jun Jul Aug Sep
Num
ber o
f Rep
orts
Per
Mon
th
IAIU Child Protective Service Reports
2014 2015 2016 201740%
60%
80%
100%
April2017
May2017
Jun2017
Jul2017
Aug2017
Sept2017
IAIU Investigation Timeliness
Exit Plan Target
100% 99% 100% 100% 100% 100%
40%
60%
80%
100%
April2017
May2017
Jun2017
Jul2017
Aug2017
Sept2017
IAIU Caseload Report Statewide
No more than 8 new investigations and 12 cases/month
0% 10% 20% 30% 40% 50% 60% 70% 80% 90% 100%
Central
Metro
Northern
Southern
IAIU Caseload Report by Region September 2017
91%
93% 95% 94% 94% 93%
70%
80%
90%
100%
Apr2017
May2017
Jun2017
Jul2017
Aug2017
Sept2017
Completed Independent Living Assessments of Youth Ages 14-18 years
Exit Plan Target
10
Nov-16
Release Date: November 15, 2016
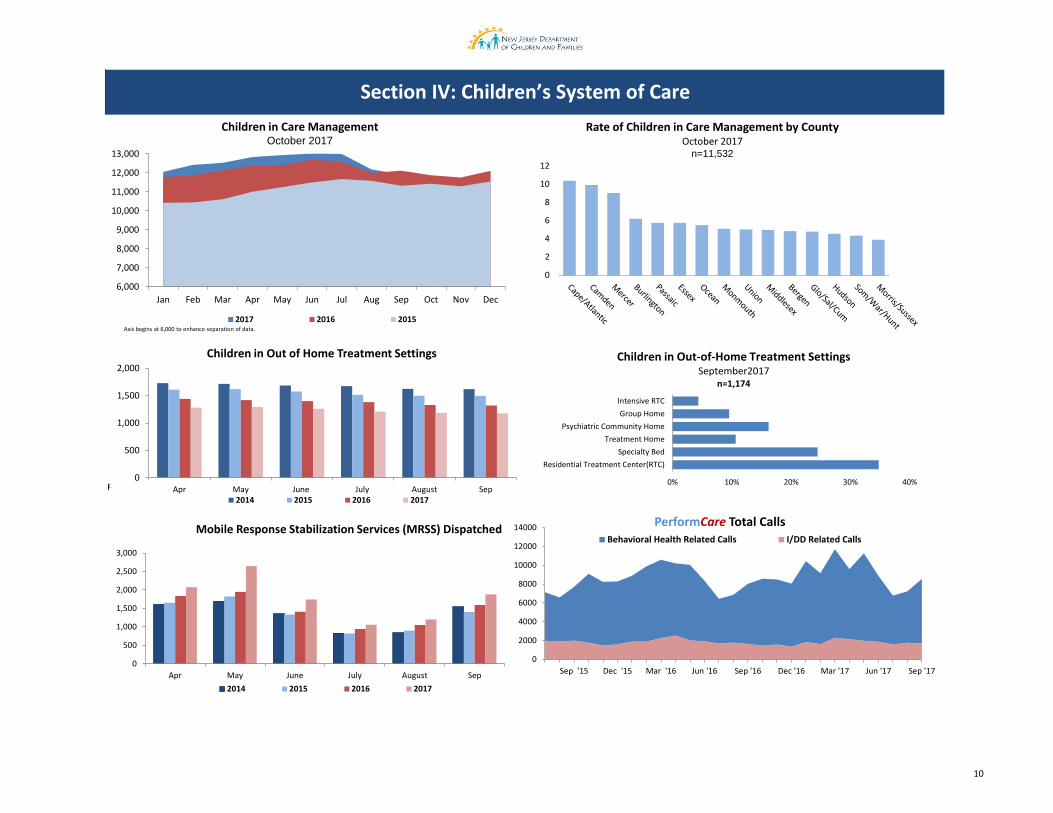
Section IV: Children’s System of Care
6,000
7,000
8,000
9,000
10,000
11,000
12,000
13,000
Jan Feb Mar Apr May Jun Jul Aug Sep Oct Nov Dec
Children in Care Management October 2017
2017 2016 2015Axis begins at 6,000 to enhance separation of data.
0
2
4
6
8
10
12
Rate of Children in Care Management by County October 2017
n=11,532
Residential Treatment Center(RTC)Specialty Bed
Treatment HomePsychiatric Community Home
Group HomeIntensive RTC
0% 10% 20% 30% 40%
Children in Out-of-Home Treatment Settings September2017
n=1,174
0
500
1,000
1,500
2,000
Apr May June July August Sep
Children in Out of Home Treatment Settings
2014 2015 2016 2017
0
500
1,000
1,500
2,000
2,500
3,000
Apr May June July August Sep
Mobile Response Stabilization Services (MRSS) Dispatched
2014 2015 2016 2017
0
2000
4000
6000
8000
10000
12000
14000
Sep '15 Dec '15 Mar '16 Jun '16 Sep '16 Dec '16 Mar '17 Jun '17 Sep '17
PerformCare Total Calls Behavioral Health Related Calls I/DD Related Calls

11
Nov-16
Release Date: November 15, 2016
Section V: Family & Community Partnerships
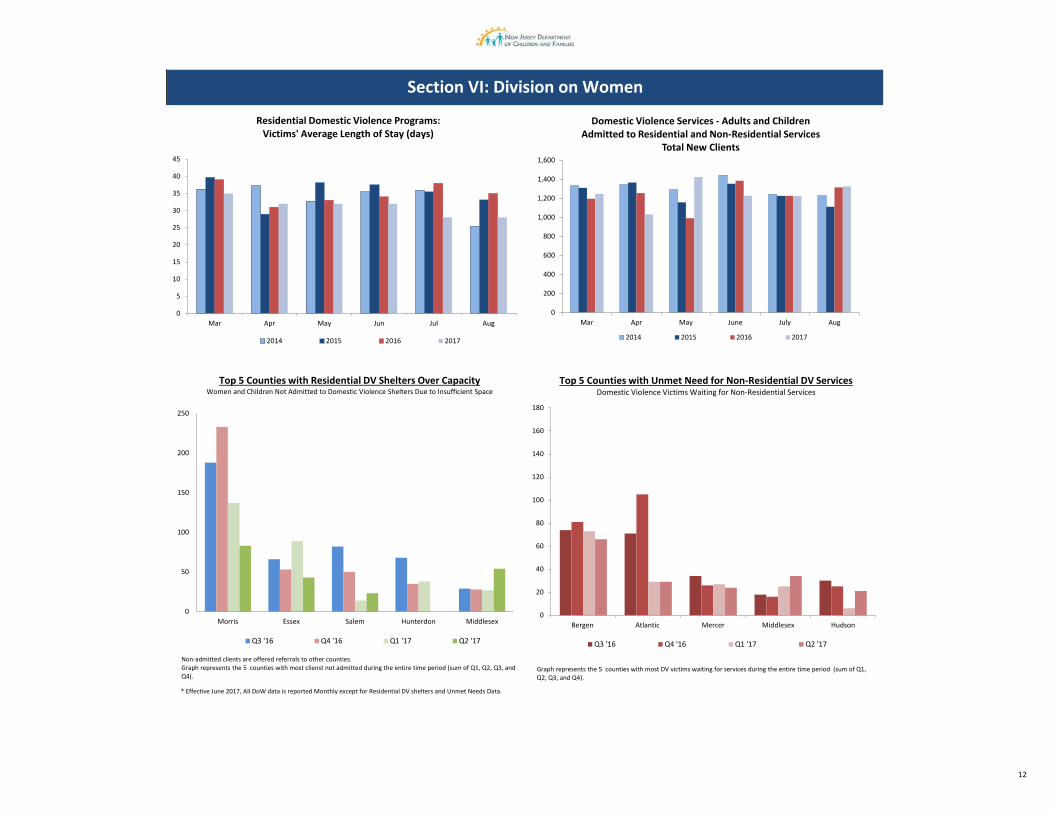
Section VI: Division on Women
313
390
293
272
300
326
59
85
56
58
48
41
419
407
502
360
331
458
106
56
77
73
72
69
0 100 200 300 400 500 600 700 800 900 1,000
Mar
Apr
May
Jun
Jul
Aug
Sexual Assault, Abuse and Rape Care Programs (SAARC)
# New Victims Served # New Significant Others Served
# Ongoing Victims Served # Ongoing Significant Others Served
0
3,000
6,000
9,000
12,000
15,000
18,000
Mar Apr May June July Aug
School-Based Youth Services Programs - New and Ongoing Clients Served
2014 2015 2016 2017
0
200
400
600
800
1,000
Apr May Jun Jul Aug
Displaced Homemaker Program Clients Served
New Clients Served Ongoing Clients Served
0500
1,0001,5002,0002,5003,0003,5004,0004,500
Mar Apr May June July Aug
Family Success Centers - Families Served
2014 2015 2016 2017
1%
83%
13% 3%
Individuals Served by Rape Prevention and Education Programs (RPE) n=8,799
Curriculum Multi Session DoseAttendees
Curriculum Single Dose SessionAttendees
Outreach Events Attendees
Coalition/Community MobilizationMeeting Attendees
12
Section VI: Division on Women
* Effective June 2017, All DoW data is reported Monthly except for Residential DV shelters and Unmet Needs Data.
0
200
400
600
800
1,000
1,200
1,400
1,600
Mar Apr May June July Aug
Domestic Violence Services - Adults and Children Admitted to Residential and Non-Residential Services
Total New Clients
2014 2015 2016 2017
0
50
100
150
200
250
Morris Essex Salem Hunterdon Middlesex
Q3 '16 Q4 '16 Q1 '17 Q2 '17
Non-admitted clients are offered referrals to other counties. Graph represents the 5 counties with most clienst not admitted during the entire time period (sum of Q1, Q2, Q3, and Q4).
Top 5 Counties with Residential DV Shelters Over Capacity Women and Children Not Admitted to Domestic Violence Shelters Due to Insufficient Space
0
5
10
15
20
25
30
35
40
45
Mar Apr May Jun Jul Aug
2014 2015 2016 2017
Residential Domestic Violence Programs: Victims' Average Length of Stay (days)
0
20
40
60
80
100
120
140
160
180
Bergen Atlantic Mercer Middlesex Hudson
Q3 '16 Q4 '16 Q1 '17 Q2 '17
Graph represents the 5 counties with most DV victims waiting for services during the entire time period (sum of Q1, Q2, Q3, and Q4).
Top 5 Counties with Unmet Need for Non-Residential DV Services Domestic Violence Victims Waiting for Non-Residential Services

Local Office Measure 6
Measure9
Measure 10
Measure 13
Measure14
Measure16
Measure 17
Measure 18
Measure 19
Measure 22
Measure 28
Measure 29
Measure 30
Atlantic East 97% 96% 98% 93% 97% 100% 90% 100% 100% 100% 83% 63% 78%Atlantic West 92% 91% 98% 92% 98% 66% 57% 98% 97% 66% 49% 66%Bergen Central 100% 93% 99% 98% 100% 100% 100% 100% 100% 89% 73% 83%Bergen South 100% 96% 100% 98% 98% 97% 97% 90% 100% 89% 72% 84%Burlington East 87% 96% 92% 71% 92% 91% 53% 100% 53% 94% 80% 61% 79%Burlington West 91% 89% 93% 56% 86% 69% 46% 100% 65% 88% 71% 73% 78%Camden Central 96% 94% 94% 84% 94% 90% 97% 100% 100% 82% 80% 56% 76%Camden East 96% 91% 97% 68% 89% 96% 92% 100% 100% 67% 69% 75%Camden North 81% 85% 95% 46% 70% 61% 22% 83% 77% 63% 60% 73%Camden South 85% 88% 99% 88% 97% 94% 35% 100% 82% 91% 83% 67% 82%Cape May 100% 95% 97% 88% 96% 85% 85% 89% 98% 83% 59% 75%Cumberland East 94% 92% 97% 83% 90% 86% 42% 97% 94% 75% 66% 78%Cumberland West 96% 95% 98% 74% 90% 92% 66% 100% 81% 94% 75% 57% 74%Essex Central 96% 87% 92% 91% 96% 86% 27% 100% 70% 78% 62% 48% 64%Essex North 88% 92% 100% 90% 98% 69% 33% 58% 81% 77% 54% 77%Essex South 96% 86% 95% 90% 96% 61% 64% 100% 64% 74% 61% 49% 65%Gloucester East 100% 98% 99% 71% 92% 100% 100% 100% 100% 97% 73% 64% 78%Gloucester West 99% 97% 98% 94% 98% 96% 98% 100% 97% 90% 70% 57% 70%Hudson Central 100% 85% 100% 94% 97% 100% 86% 80% 100% 80% 86% 59% 77%Hudson North 96% 100% 98% 90% 94% 80% 50% 100% 100% 100% 79% 83% 87%Hudson South 99% 95% 98% 79% 91% 92% 93% 75% 88% 100% 83% 63% 74%Hudson West 100% 100% 99% 92% 96% 100% 83% 33% 96% 100% 90% 68% 83%Hunterdon 100% 85% 95% 78% 95% 100% 67% 100% 100% 71% 68% 81%Mercer North 96% 65% 86% 64% 93% 71% 23% 80% 85% 80% 44% 44% 61%Mercer South 92% 84% 98% 77% 95% 77% 86% 100% 97% 82% 74% 69% 81%Middlesex Central 88% 77% 96% 91% 97% 73% 67% 100% 67% 67% 67% 53% 71%Middlesex Coastal 100% 98% 100% 96% 99% 58% 68% 100% 90% 97% 71% 66% 78%Middlesex West 72% 76% 96% 88% 95% 92% 10% 100% 85% 84% 56% 49% 65%Monmouth North 99% 100% 100% 93% 98% 100% 100% 100% 100% 100% 71% 63% 71%Monmouth South 96% 96% 98% 92% 98% 96% 50% 100% 100% 100% 87% 57% 71%Morris East 100% 100% 99% 94% 96% 83% 100% 100% 83% 82% 80% 74% 79%Morris West 90% 95% 98% 86% 95% 71% 55% 74% 50% 82% 70% 82%Newark Center City 94% 81% 91% 84% 95% 76% 36% 50% 70% 93% 56% 55% 68%Newark Northeast 100% 78% 93% 75% 94% 78% 74% 64% 71% 97% 60% 57% 73%Newark South 94% 84% 96% 76% 92% 99% 88% 60% 98% 94% 49% 56% 63%Ocean North 100% 93% 98% 88% 96% 96% 86% 100% 95% 100% 66% 62% 78%Ocean South 100% 96% 99% 93% 99% 83% 84% 100% 95% 100% 65% 57% 77%Passaic Central 91% 86% 97% 87% 95% 94% 80% 100% 100% 96% 54% 43% 57%Passaic North 92% 89% 96% 95% 98% 77% 70% 100% 100% 86% 65% 55% 68%Salem 97% 96% 99% 93% 99% 83% 88% 100% 91% 88% 65% 83%Somerset 100% 88% 96% 86% 95% 72% 95% 89% 100% 100% 82% 81% 87%Sussex 100% 89% 98% 90% 97% 64% 50% 60% 100% 74% 71% 80%Union Central 99% 74% 98% 90% 98% 75% 75% 75% 100% 71% 75% 60% 81%Union East 98% 92% 95% 83% 94% 86% 54% 57% 77% 92% 65% 58% 66%Union West 100% 100% 99% 94% 99% 100% 93% 93% 92% 71% 54% 69%Warren 95% 85% 87% 84% 95% 73% 56% 100% 100% 82% 76% 68% 80%Statewide 95% 90% 96% 85% 95% 85% 71% 82% 89% 91% 70% 60% 74%
Blank cells mean that the office did not have any children eligible for that messure during that period.
Measure # Final
TargetM# 6 95%M# 9 93%M# 10 93%M# 13 85%M# 14 95%M# 16 80%M# 17 80%M# 18 90%M# 19 90%M# 22 95%M# 28 90%M# 29 60%M# 30 85%
¹Compliance for Parent-Child Weekly Visits is now measured by percent of children with weekly visits averaged over 6 weeks. Bi-weekly Parent-Child Visits April'17-September'17
Initial Case Plans within 30 Days of Child Removal April'17-September'17
Caseworker visits Parent 2x/Month April'17-September'17
Weekly Parent/Child Visits - Average weekly visits for 6 weeks. 8/26/2017-9/30/2017
3 Subsequent FTMs within 12 Months of Child Removal April'17-September'17
3 Subsequent FTMs after 12 Months in Placement - Reunification Goal April'17-September'17
2 Subsequent FTMs after 12 Months in Placement - Non - Reunification Goal April'17-September'17
Investigation Completion within 60 days February'17-July'17 Investigation Completion within 90 days February'17-July'17
Initial Family Team Meeting (FTMs) within 45 days of Child Removal March'17-August'17
Ongoing Case Plans April'17-September'17
Caseworker Visits with Children 2x/Month in 1st& 2nd Months of placement February'17-July'17 Monthly Caseworker Visits with Children at child's placement site² April'17-September'17
CP&P Key Performance Indicators by Local Office - 6 Months View
Met Target Within 10% of Meeting Target < 60% of Final Target
Description of the Measure Time Period Analyzed
14
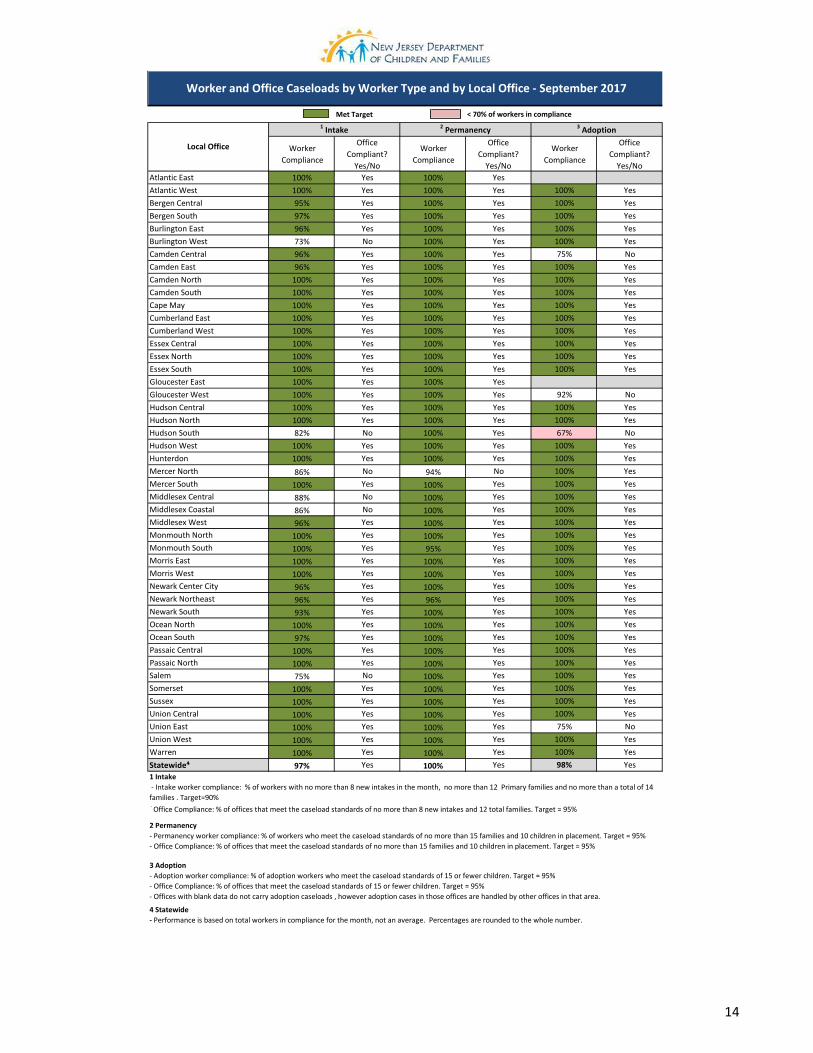
Met Target < 70% of workers in compliance
Worker Compliance
Office Compliant?
Yes/No
Worker Compliance
Office Compliant?
Yes/No
Worker Compliance
Office Compliant?
Yes/NoAtlantic East 100% Yes 100% YesAtlantic West 100% Yes 100% Yes 100% YesBergen Central 95% Yes 100% Yes 100% YesBergen South 97% Yes 100% Yes 100% YesBurlington East 96% Yes 100% Yes 100% YesBurlington West 73% No 100% Yes 100% YesCamden Central 96% Yes 100% Yes 75% NoCamden East 96% Yes 100% Yes 100% YesCamden North 100% Yes 100% Yes 100% YesCamden South 100% Yes 100% Yes 100% YesCape May 100% Yes 100% Yes 100% YesCumberland East 100% Yes 100% Yes 100% YesCumberland West 100% Yes 100% Yes 100% YesEssex Central 100% Yes 100% Yes 100% YesEssex North 100% Yes 100% Yes 100% YesEssex South 100% Yes 100% Yes 100% YesGloucester East 100% Yes 100% YesGloucester West 100% Yes 100% Yes 92% NoHudson Central 100% Yes 100% Yes 100% YesHudson North 100% Yes 100% Yes 100% YesHudson South 82% No 100% Yes 67% NoHudson West 100% Yes 100% Yes 100% YesHunterdon 100% Yes 100% Yes 100% YesMercer North 86% No 94% No 100% YesMercer South 100% Yes 100% Yes 100% YesMiddlesex Central 88% No 100% Yes 100% YesMiddlesex Coastal 86% No 100% Yes 100% YesMiddlesex West 96% Yes 100% Yes 100% YesMonmouth North 100% Yes 100% Yes 100% YesMonmouth South 100% Yes 95% Yes 100% YesMorris East 100% Yes 100% Yes 100% YesMorris West 100% Yes 100% Yes 100% YesNewark Center City 96% Yes 100% Yes 100% YesNewark Northeast 96% Yes 96% Yes 100% YesNewark South 93% Yes 100% Yes 100% YesOcean North 100% Yes 100% Yes 100% YesOcean South 97% Yes 100% Yes 100% YesPassaic Central 100% Yes 100% Yes 100% YesPassaic North 100% Yes 100% Yes 100% YesSalem 75% No 100% Yes 100% YesSomerset 100% Yes 100% Yes 100% YesSussex 100% Yes 100% Yes 100% YesUnion Central 100% Yes 100% Yes 100% YesUnion East 100% Yes 100% Yes 75% NoUnion West 100% Yes 100% Yes 100% YesWarren 100% Yes 100% Yes 100% YesStatewide⁴ 97% Yes 100% Yes 98% Yes
4 Statewide - Performance is based on total workers in compliance for the month, not an average. Percentages are rounded to the whole number.
1 Intake - Intake worker compliance: % of workers with no more than 8 new intakes in the month, no more than 12 Primary families and no more than a total of 14 families . Target=90% - Office Compliance: % of offices that meet the caseload standards of no more than 8 new intakes and 12 total families. Target = 95%
2 Permanency- Permanency worker compliance: % of workers who meet the caseload standards of no more than 15 families and 10 children in placement. Target = 95%- Office Compliance: % of offices that meet the caseload standards of no more than 15 families and 10 children in placement. Target = 95%
3 Adoption- Adoption worker compliance: % of adoption workers who meet the caseload standards of 15 or fewer children. Target = 95%- Office Compliance: % of offices that meet the caseload standards of 15 or fewer children. Target = 95%- Offices with blank data do not carry adoption caseloads , however adoption cases in those offices are handled by other offices in that area.
Worker and Office Caseloads by Worker Type and by Local Office - September 2017
Local Office
1 Intake 2 Permanency 3 Adoption