Embed Size (px)
Citation preview
ORGANIZATIONAL RESEARCH METHODSCurrall et al. / QUALITATIVE AND QUANTITATIVE METHODOLOGIES
Combining Qualitative and QuantitativeMethodologies to Study Group Processes: An Illustrative Study of a Corporate Board of Directors
STEVEN C. CURRALLRice University
TOVE HELLAND HAMMERCornell University
L. SCOTT BAGGETTGLEN M. DONIGERRice University
In this demonstration article, the authors explain procedures for combining therichness of detail that is characteristic of qualitative data collection with thehypothesis testing advantage of statistical inference techniques. Qualitative datacame from a 5-year participant observation study of a corporate board ofdirectors. Quantification of the participant observer’s qualitative field notes wasachieved by using content analysis to code directors’ verbal behaviors. Based oncounts of directors’ verbal behaviors, the authors tested illustrative hypothesesconcerning group process within the board. Univariate (Cox-Stuart’s test of trend),bivariate (Kendall’s nonparametric correlation), and multivariate (log Poissonregression with post hoc contrasts) analyses were conducted. The study’s use ofqualitative and quantitative information promoted both “discovery” (i.e., theorydevelopment) and “justification” (i.e., theory evaluation) and facilitated a “dis-covery-justification-discovery cycle” that was particularly useful for under-standing group processes with the corporate board.
Group processes in organizational settings have been studied extensively for manyyears in laboratory and field settings (e.g., Argote & McGrath, 1993; Forsyth, 1990).Qualitative studies of groups have the advantage of rich detail but, generally, do not
Authors’ Note: We are grateful to Ralph C. Hybels for serving as Coder 3 in the content analysis. KarenSchnietz and Robert Westbrook provided useful feedback on an earlier draft of this article. We thank Larry J.Williams and three anonymous reviewers for helpful comments and suggestions. Correspondence concern-ing this article should be addressed to Steven C. Currall at the Jones Graduate School of Management, RiceUniversity, MS-531, Houston, TX 77005-1892; e-mail: [email protected].
Organizational Research Methods, Vol. 2 No. 1, January 1999 5-36© 1999 Sage Publications, Inc.
5
at SAGE Publications on April 20, 2015orm.sagepub.comDownloaded from
allow for hypothesis testing using statistical inference techniques. Quantitative stud-ies, conducted in the laboratory or in the field, permit extensive statistical analyses yetare sometimes criticized for being “sanitized” and lacking in contextual realism. Thepurpose of this article is to illustrate how qualitative and quantitative techniques canbe combined to study groups. Specifically, we explain procedures we used to combinequalitative data collection with quantitative statistical analysis to examine groupprocesses within a corporate board of directors.
To briefly overview our study, a participant observer collected qualitative fieldnotes on group processes within the corporate board. The field notes were transcribedinto verbatim transcripts of who said what to whom inside the boardroom. Contentanalysis of the transcripts was used to code board members’ verbal behaviors on thebasis of exhaustive and mutually exclusive categories. Interrater reliability was as-sessed. The transcripts were quantified by recording counts of different types of verbalbehaviors exhibited by board members. Based on counts of directors’ verbal behaviors,hypotheses about group processes were tested using statistical techniques appropriatefor count data.
The aim of our study was to use qualitative and quantitative methods to accomplishboth “discovery” and “justification” within a single research project. McCall andBobko (1990) define discovery as “anything related to the creation of new theories orinterpretive applications, including anything related to adopting novel approaches tomeasurement, inventing or uncovering new constructs, or inventing or uncoveringoriginal theoretical perspectives from which to view organizational phenomena”(p. 382). In the present study, discovery was achieved by using qualitative data tosharpen our theoretical ideas about the subtleties of conflict, power struggles, andinterest group advocacy displayed by board members inside the board room. Justifi-cation is defined as “the empirical evaluation and confirmation of theory” (McCall &Bobko, 1990, p. 382). To justify (i.e., evaluate) our theoretical propositions, we firstcontent analyzed our transcripts to quantify them and then applied statistical inferencetechniques to conduct hypothesis tests. Unlike much research in the field of organiza-tional studies that focuses either on discovery (i.e., most qualitative research) orjustification (i.e., most quantitative research), the present study’s key contributionstems from its dual emphasis on both discovery and justification.
Advantages and Disadvantages of Qualitative VersusQuantitative Methods for Studying Group Processes
Although the advantages and disadvantages of qualitative and quantitative researchhave been discussed in detail elsewhere (e.g., Jick, 1979; Larsson, 1993; McCall &Bobko, 1990; Miles & Huberman, 1994; Stevenson & Cooper, 1997), we provide abrief summary as background for a discussion of our methods.
“Typically, ‘qualitative observation’ identifies the presence or absence of some-thing, in contrast to ‘quantitative observation,’ which involves measuring the degreeto which some feature is present” (Kirk & Miller, 1986, p. 9). As noted by Lee (1999),qualitative researchers (e.g., in fields such as anthropology and business policy) havegone beyond simple use of categorical data to apply a rich variety of methods such asin-depth case analyses, narrative analysis, symbolic interactionism, phenomenologicalstudies, and deconstruction of texts. Furthermore, qualitative researchers routinely
6 ORGANIZATIONAL RESEARCH METHODS
at SAGE Publications on April 20, 2015orm.sagepub.comDownloaded from
collect qualitative data that are then quantitatively analyzed using, for example, oddsratios or χ2 analyses (Lee, 1999, provides an overview of such analytical techniques).
Qualitative observation has several advantages for investigating group processes.First, observation data are rich in detail about group member behavior and interactionsamong group members. That is, qualitative observational techniques involve “sus-tained interaction with the people being studied in their own language, and on theirown turf” (Kirk & Miller, 1986). Second, the observer’s intimate knowledge of grouphistory and norms provides an interpretive framework with which to decipher theactions of group members (Adler & Adler, 1994). Without such a framework, theiractions would be frequently misconstrued. Third, observation allows the researcher tocollect data on a group as it unfolds over time, making it possible to conduct alongitudinal investigation.
Observational techniques, however, suffer from several methodological disadvan-tages. First, the cognitive information processing limitations of an observer dictate thatthe behaviors of some group members may go unrecorded. Second, although observersoften provide explicit descriptions of techniques used to record field notes (e.g.,Whyte, 1973), it is almost impossible for other researchers to see exactly how theobserver makes interpretations from the field notes. A third disadvantage is that,traditionally, field notes have not been used to test hypotheses using statisticalinference techniques. Observational findings have been limited to the observer’s “thickdescription” of events and behaviors (Strauss, 1987). Thus, although observation canyield a wealth of fine-grained information about what happens inside a group, in rawform the field notes do not lend themselves to hypothesis evaluation using statisticalinference. Moreover, without hypothesis evaluation, the prospects are dim for devel-oping a cumulative body of research findings about group processes.
Correlational designs and experiments are the primary quantitative tools used bygroup researchers (Forsyth, 1990). Both methods involve the use of standardizedmeasures of variables that allow the researcher to state with precision the strength anddirection of relationships between variables (Pedhazur & Schmelkin, 1991). Stand-ardized measures pave the way for the use of inferential statistics (e.g., correlationsand regression coefficients), which can be compared across studies. Moreover, statis-tical inference allows the researcher to make estimates concerning the probability thata relationship between variables was detected by chance. Be they correlational orexperimental, quantitative studies lend themselves to the development of cumulativefindings because of the use of standardized statistical indices. Correlational designsallow the researcher to examine the relationship between two variables (e.g., groupcohesion and group productivity) without disrupting or manipulating any aspect of thegroup (Forsyth, 1990). The greatest advantage of experiments, of course, is that theyallow the researcher to make statements about causation between variables because ofthe researcher’s ability to control extraneous factors.
Correlational and experimental studies, however, also have their disadvantages. Forexample, correlational studies provide limited information about causation betweenvariables. Only statistical (as opposed to experimental) control can be achieved withcorrelational designs. Experimental studies are typically one-shot enterprises; they arerarely used to conduct longitudinal research. Additionally, the central strength ofexperiments, maintaining control, can undermine the value of experimental findingsbecause, in the process of seeking rigorous control, the researcher may create highly
Currall et al. / QUALITATIVE AND QUANTITATIVE METHODOLOGIES 7
at SAGE Publications on April 20, 2015orm.sagepub.comDownloaded from

artificial group situations (Forsyth, 1990). Moreover, Van Maanen (1979) pointed outthat quantitative procedures run the risk of becoming so ritualized that the researcherloses touch with the necessary connection between a concept and its measure. Finally,there is some distrust and skepticism that conventional data collection techniques (e.g.,the questionnaire, formal interview, laboratory study, and official statistics) actuallydistort and falsely portray the phenomena that such methods seek to study (VanMaanen, 1979).
Toward a New Methodological Frontier: CombiningQualitative and Quantitative Techniques Within a Single Study
Although it is possible to identify different characteristics of qualitative andquantitative methods, as we have discussed above, researchers often claim that neithermethod is inherently superior. The dictum is that one’s research objectives mustdetermine the appropriate method(s). Yet, in reality, there remains in our field anunproductive bifurcation between qualitative and quantitative methods. Much re-search on group processes has adopted the positivist stance of the natural sciences asshown in the attempt to define research on groups within a scientific paradigmemphasizing statistical analyses. In fact, McCall and Bobko (1990) have argued thatthis is true of the field of organizational studies in general. This positivist stanceexplains why, historically, qualitative methods have been seen by some as techniquesof ill repute whereas quantitative techniques have been embraced to a fault. Bouchard(1976) captured this point stating that “the context of discovery has hardly been minedwhile the context of justification has been overburdened with trivial investigations”(p. 366).
McCall and Bobko (1990) have emphasized balance between qualitative andquantitative methods by arguing that no method has “superiority over the others” andthat “there is no advantage to limiting our thinking about research methods to theprocedures used in statistical analyses and verification processes. Doing whateverneeds to be done to enhance discovery is also a critical part of methodology” (p. 412).Recently, some progress toward balance has been made. The methodological pendu-lum has swung slightly in the direction of greater appreciation for qualitative methods(Bartunek, Bobko, & Venkatraman, 1993). Despite movement toward greater balance,however, qualitative and quantitative methods have largely continued to operate onseparate tracks. In particular, procedures for linking qualitative and quantitativetechniques within a single study have received little attention.
We believe that a new methodological frontier lies, neither in the qualitative norquantitative domain exclusively, but rather in how the two techniques can be inter-woven to maximize the “knowledge yield” (McCall & Bobko, 1990) of a researchendeavor. A study’s knowledge yield is enhanced when a range of hypotheses areformulated, precise hypothesis tests are conducted, detailed explanations for thephenomenon being studied are provided, alternative explanations for relationshipsamong variables are eliminated, and other researchers can build upon the study’sfindings in a cumulative manner. We sought to maximize the knowledge yield of ourresearch by combining qualitative participant observation data and quantitative statis-tical techniques appropriate for frequency count data.
The present article contributes to extant literature on combining qualitative andquantitative methods by (a) explicating methodological challenges involved in quali-
8 ORGANIZATIONAL RESEARCH METHODS
at SAGE Publications on April 20, 2015orm.sagepub.comDownloaded from
tative-quantitative designs, (b) describing how nonparametric statistics may be appliedto count data collected through participant observation, and (c) identifying how ourmethodological procedures compare with past empirical studies that used qualitative-quantitative designs. We discuss these points below.
First, our article explicates in detail what were the methodological challengesinvolved in integrating qualitative and quantitative methods as well as how we soughtto address those challenges. Explication of methodological challenges in mixed-meth-ods designs is needed because, as Jick (1979) pointed out, researchers using multiplemethods generally do not explain their techniques in sufficient detail for otherresearchers to understand how mixed data are collected or integrated. Thus, our articleexplains the full range of the methodological process from how we collected qualita-tive field data concerning group processes to how we used quantitative techniques toempirically evaluate hypotheses about group processes. In particular, we illuminatethe numerous “judgment calls” (McGrath, Martin, & Kulka, 1982) we made along theway about how we recorded field notes, how we developed the content analysisscheme, how we identified the appropriate interrater reliability index, and the choiceswe made about which statistical techniques were appropriate for hypothesis testing.Taken separately, none of these individual methodological elements (e.g., contentanalysis) was novel. Yet, our article is unique because we demonstrate for otherresearchers how both qualitative and quantitative methodological elements can beassembled synergistically to enhance the knowledge yield of a study of group processes.Our aim is to stimulate future researchers to use our methods, or consider analogousways of combining qualitative and quantitative techniques, to study groups in organ-izational settings.
Our second contribution involves the statistical treatment of frequency count dataon group processes that were collected using participant observation. Observationalmethods for studying groups typically involve frequency counts of behaviors by groupmembers (Forsyth, 1990). Therefore, how to conduct hypothesis tests using count datapresents an analytical challenge because widely used methods (e.g., ordinary leastsquares regression) are not appropriate (Agresti, 1990; McCullagh & Nelder, 1989).Although many researchers are familiar with some nonparametric statistics (e.g.,nonparametric correlation), less familiar are nonparametric statistical techniques thatenable the researcher to “model” (i.e., statistically control for) possible alternativeexplanations for relationships among hypothesized variables (Lee, 1999). Our articleillustrates how log Poisson regression, a technique appropriate for count data, can beused to statistically control for effects of potentially confounding variables therebyreducing alternative explanations for our results. As a further contribution, within logPoisson regression, we introduce a new procedure for using post hoc contrast tests.The post hoc contrast tests enabled us to examine hypotheses about the behavior ofmultiple subgroups. The rationale for contrasts was akin to post hoc tests (e.g., Sheffe)often seen in the analysis of variance.
In terms of our third contribution, identifying how our methodological procedurescompared with previous qualitative-quantitative studies, we begin by previewingCreswell’s (1994, pp. 177-178) three types of research designs that combine bothmethods. First, in “two-phase designs,” the researcher conducts, for example, aqualitative phase followed by a quantitative phase (or vice versa). The assumptions ofboth paradigms are well delineated and separate. Ancona and Caldwell’s (1992) studyof ways that groups interacted with their external environments was an example of a
Currall et al. / QUALITATIVE AND QUANTITATIVE METHODOLOGIES 9
at SAGE Publications on April 20, 2015orm.sagepub.comDownloaded from
two-phase design. They used qualitative interview data to describe groups’ externalactivities and used those data to generate hypotheses about external activities, groupperformance, and internal group processes. Quantitative survey data were then col-lected for hypothesis testing. In a second type of research design, the “dominant–lessdominant design,” the researcher presents a study based largely on a single methodwith small components drawn from alternative methods. Sutton and Hargadon’s(1996) study of brainstorming groups is an example of a dominant–less dominantdesign. Their study relied on qualitative ethnographic data, yet they used quantitativesurvey data as a supplement. Third, the “mixed-method design” signifies the greatestextent of combining methods. Aspects of qualitative and quantitative methods are usedat all or many steps in the study. The mixed-method design represents the greatestchallenge for the researcher because it requires extensive knowledge of both methods.Moreover, the mixed-method design is challenging because it requires the researcherto convey a combination of techniques that may be unfamiliar to many readers(Creswell, 1994). Jick (1979) approximated a mixed-method design in his research onthe effect of a merger on employee anxiety. He used triangulation of multiple sourcesof both qualitative data (e.g., unobtrusive observation, archival data) and quantitativedata (surveys, behavioral incidents) to study employee anxiety.
In terms of the three types of qualitative-quantitative designs, our study was akinto a two-phase design in that we began with a qualitative phase followed by aquantitative phase. Although similar to previous two-phase qualitative-quantitativestudies of groups, it is important to note how our methodological procedures differedfrom, and extended, previous approaches. As mentioned previously, an example of atwo-phase qualitative-quantitative approach was Ancona and Caldwell (1992). Aprimary way our work differed from Ancona and Caldwell was with respect to theform of data used for quantitative hypothesis testing. Whereas Ancona and Caldwellused group members’ perceptions of group processes for hypothesis testing, we testedhypotheses about group processes on the basis of observational data. Use of observa-tional data is advantageous because it taps group members’ actual behavior duringgroup meetings (Adler & Adler, 1994; Forsyth, 1990). Other researchers also havemade extensive use of qualitative observational data on groups. For example, Balesand colleagues (Bales, 1988; Bales & Cohen, 1979) collected qualitative observationaldata on categories of group members’ behaviors, which were then quantified asfrequencies of behaviors and compiled with other quantitative indices (e.g., personal-ity assessment of group members) to depict group members’ interactions. One wayour study differed from Bales’s approach was with respect to the types of behavioralcategories used. Although behavioral categories from Bales and Cohen (1979) in-formed initial development of behavioral coding categories in our content analysisscheme, previous research on boards (Hammer, Currall, & Stern, 1991; Hammer &Stern, 1986) showed that our scheme required fine-grained (i.e., less generic) catego-ries for coding idiosyncratic behaviors inside the boardroom such as when directorsadvocated the interests of stakeholder groups (e.g., employees) and when directorsused subtle power moves. A final example of a previous qualitative-quantitativeapproach was Barley (1986) who used observational methods to examine the effectsof new technology on workplace behaviors among groups of physicians and medicaltechnicians. Our study differed from Barley’s with respect to the quantitative treatmentof count data from behavioral observation. Although the quantitative phase of Barley’sstudy included regression analysis on proportions of types of observed behaviors, his
10 ORGANIZATIONAL RESEARCH METHODS
at SAGE Publications on April 20, 2015orm.sagepub.comDownloaded from
regressions did not include statistical control of potential confounding variables. Bycontrast, our use of log Poisson regression allowed us to statistically control forpotentially confounding variables.
Setting for the Present Study: The Corporate Board
Because of norms against the dissemination of information on board deliberationsand legal constraints against dissemination of information about corporate actionsaffecting financial performance of a firm, nonboard members are seldom privy toinformation about what happens inside a boardroom. Furthermore, it is difficult togather data on group processes that occur inside board meetings because neitherboardrooms nor directors are easily accessible to researchers. Previous board studieshave used retrospective interview data (e.g., Demb & Neubauer, 1992; Pettigrew &McNulty, 1995), a combination of retrospective interview data and questionnaire data(e.g., Lorsch & MacIver, 1989), and archival data (e.g., Goodstein, Gautam, & Boeker,1994; Main, O’Reilly, & Wade, 1995; Westphal & Zajac, 1997; Zajac & Westphal,1996). However, Pettigrew (1992) argued that directors’ retrospective accounts andarchival data used to make inferences about the exercise of power inside the boardroomare too far removed from actual activity occurring inside the boardroom. Instead, hecalled for longitudinal studies designed to collect behavioral evidence of boardroomprocesses. To meet this call, we examined what happens in and around a boardroomduring board meetings—how directors deliberated, how decisions were made, andhow power was exercised and with what results—over a 5-year period.
Our study was based on observation of the corporate board of a large meatpackingfirm in the midwestern United States. During the data collection period, the early tomid-1980s, the firm had sales of roughly $425 million and a workforce of 3,000. Toavoid closing the main production facility, the company traded stock ownership forseats on the corporate board to its unionized employees (see Hammer & Stern, 1986,for details). The board, with employee representation, had a maximum of 17 directorsincluding 10 of whom were added because of the employee stock ownership plan(ESOP). Of these 10, 3 were rank-and-file union workers, and 7 were outside directors.All 10 were selected by the local union leadership, endorsed by company managementand the existing board of directors, and duly elected by the stockholders.
Qualitative Data Collection,Validity, and Hypothesis Generation
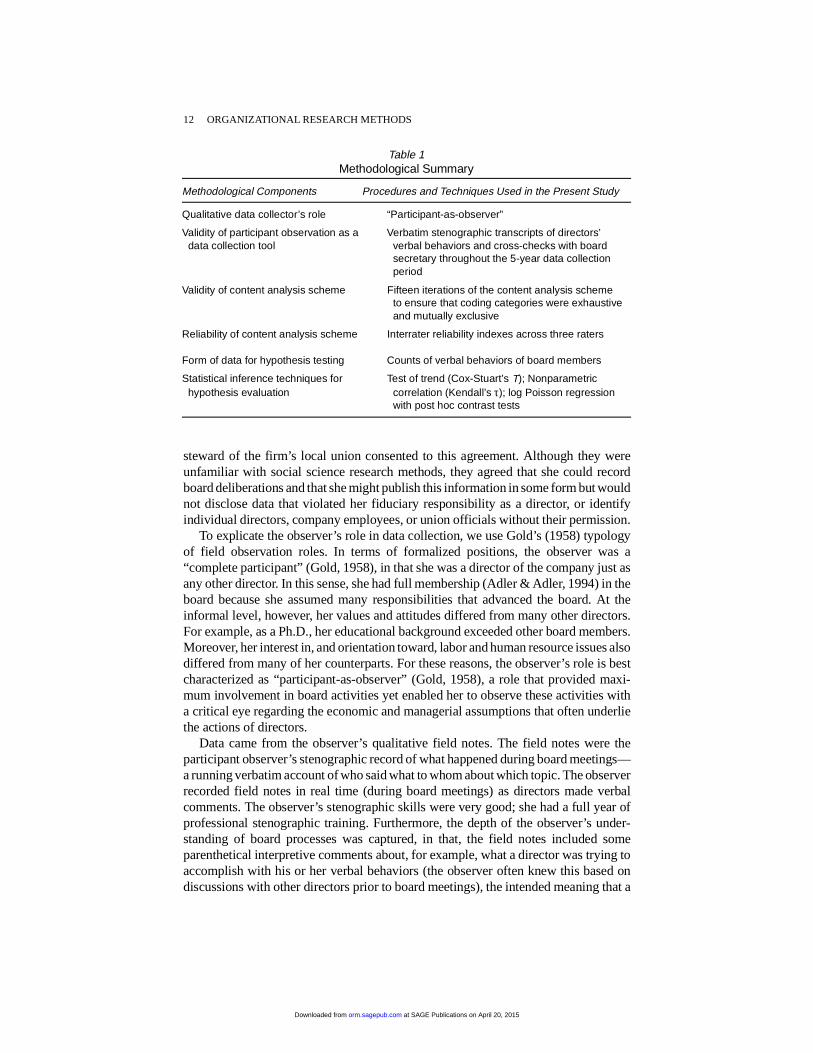
As an overview, Table 1 shows the major methodological components of our study:data collector’s role, validity of qualitative data, validity of content analysis scheme,reliability of the content analysis scheme, form of data for hypothesis evaluation, andstatistical inference techniques.
Qualitative Data Collection
The observer, a Ph.D. industrial/organizational psychologist, was asked to serve asa director on the board because of her research on firms with ESOPs. She accepted onthe condition that she was allowed to study the board as a participant observer. Thechairperson of the board, the chief executive officer, and both the president and chief
Currall et al. / QUALITATIVE AND QUANTITATIVE METHODOLOGIES 11
at SAGE Publications on April 20, 2015orm.sagepub.comDownloaded from
steward of the firm’s local union consented to this agreement. Although they wereunfamiliar with social science research methods, they agreed that she could recordboard deliberations and that she might publish this information in some form but wouldnot disclose data that violated her fiduciary responsibility as a director, or identifyindividual directors, company employees, or union officials without their permission.
To explicate the observer’s role in data collection, we use Gold’s (1958) typologyof field observation roles. In terms of formalized positions, the observer was a“complete participant” (Gold, 1958), in that she was a director of the company just asany other director. In this sense, she had full membership (Adler & Adler, 1994) in theboard because she assumed many responsibilities that advanced the board. At theinformal level, however, her values and attitudes differed from many other directors.For example, as a Ph.D., her educational background exceeded other board members.Moreover, her interest in, and orientation toward, labor and human resource issues alsodiffered from many of her counterparts. For these reasons, the observer’s role is bestcharacterized as “participant-as-observer” (Gold, 1958), a role that provided maxi-mum involvement in board activities yet enabled her to observe these activities witha critical eye regarding the economic and managerial assumptions that often underliethe actions of directors.
Data came from the observer’s qualitative field notes. The field notes were theparticipant observer’s stenographic record of what happened during board meetings—a running verbatim account of who said what to whom about which topic. The observerrecorded field notes in real time (during board meetings) as directors made verbalcomments. The observer’s stenographic skills were very good; she had a full year ofprofessional stenographic training. Furthermore, the depth of the observer’s under-standing of board processes was captured, in that, the field notes included someparenthetical interpretive comments about, for example, what a director was trying toaccomplish with his or her verbal behaviors (the observer often knew this based ondiscussions with other directors prior to board meetings), the intended meaning that a
Table 1Methodological Summary
Methodological Components Procedures and Techniques Used in the Present Study
Qualitative data collector’s role “Participant-as-observer”
Validity of participant observation as a Verbatim stenographic transcripts of directors’ data collection tool verbal behaviors and cross-checks with board
secretary throughout the 5-year data collection period
Validity of content analysis scheme Fifteen iterations of the content analysis scheme to ensure that coding categories were exhaustive and mutually exclusive
Reliability of content analysis scheme Interrater reliability indexes across three raters
Form of data for hypothesis testing Counts of verbal behaviors of board members
Statistical inference techniques for Test of trend (Cox-Stuart’s T); Nonparametric hypothesis evaluation correlation (Kendall’s τ); log Poisson regression
with post hoc contrast tests
12 ORGANIZATIONAL RESEARCH METHODS
at SAGE Publications on April 20, 2015orm.sagepub.comDownloaded from

director had when speaking, or whether a director succeeded or failed in convincingthe board of his or her viewpoint.1
Although not as complete as video or audio recordings, the use of stenographyproved to be a useful alternative to electronic recording, which was prohibited by thechairperson of the board. The observer’s constant note taking elicited little attentionfrom other board members, in part because it was typical for directors to take notesduring board meetings. Early on, there were some comments that the notes werestenographic symbols and were therefore unreadable by others. Interest in the ob-server’s notes, however, faded quickly because the demands of board deliberationsrequired directors’ complete attention.
Field notes were recorded during regularly scheduled board meetings. The fieldnotes came from 31 board meetings held between July 1980 and December 1985. Thelength of board meetings ranged from 3 hours to two full 8-hour days. On the dayfollowing a board meeting, the stenographic field notes were dictated onto audiocassette tape exactly as they appeared in the field notes. The contents of the tapes werethen typed into transcript form. On average, the textual transcript from a board meetingwas approximately 20 type-written double-spaced pages. For the duration of the study,the same method of collecting, organizing, and transcribing the field notes was used.2
Validity of Qualitative Data Collection
“In the case of qualitative observations, the issue of validity is . . . a question ofwhether the researcher sees what he or she thinks he or she sees” (Kirk & Miller, 1986,p. 21). In the present study, one question was whether the observer accurately capturedverbal behaviors by board members. The main contribution to validity was theobserver’s use of stenography to record verbatim statements made by board members.Furthermore, we cross-checked the transcripts against the unedited board minutesfrom the board secretary, which were more detailed than the official versions of boardminutes edited by the chairperson. The observer also corroborated the accuracy of thefield notes through postmeeting discussions with the board secretary. These procedureswere intended to maximize the validity of the field notes as a data collection tool byensuring that the participant observer did not miss aspects of board deliberations.Finally, the observer could not write down all of her own arguments and activities asthey took place. Instead, she wrote them down from memory immediately after hercomments (still during the board meeting) and later corroborated these notes with theboard secretary.
Hypothesis Generation
From the existing literature, and our previous empirical research on corporateboards (Hammer et al., 1991; Hammer & Stern, 1986), we had developed a set ofresearch questions about group processes within the board we studied (e.g., wereworker directors relatively inactive?). The role of the rich information in our qualitativefield notes was to aid in the discovery process by sharpening our theoretical ideas andcrystallizing our thoughts with respect to the specification of hypotheses. The hypothe-ses we discuss below were established after we had completed the content analysis yetbefore we conducted the hypothesis tests.
Currall et al. / QUALITATIVE AND QUANTITATIVE METHODOLOGIES 13
at SAGE Publications on April 20, 2015orm.sagepub.comDownloaded from

Central to our conceptualization of hypotheses was the idea that boards are the“power groups” in organizations (Ross, 1989). Within all boards there are subgroupsof directors with different values, priorities, and visions for the company’s future(Anderson & Anthony, 1986). These subgroups often engage in power struggles. Weformulated hypotheses concerning conflict and power struggles among subgroupswithin the board. In our board, the introduction of union workers as directors set thestage for conflict and power struggles between subgroups (see also Batstone, Ferner,& Terry, 1983). Subgroups were composed of (a) executive directors, (b) preexistentoutside directors (i.e., directors who were not employees of the firm and who wereboard members prior to the introduction of the ESOP), (c) new outside directors (i.e.,directors who were not employees of the firm and who became board members withthe introduction of the ESOP), and (d) worker directors. The four subgroups withinthe board are listed in Table 2. The observer was part of the new outside directorsubgroup.
We posited an overall pattern whereby executive directors wanted to control theboard and used a variety of power and influence tactics to limit the impact of othersubgroups in making decisions that diverged from the executives’ interests. Thispattern was consistent with “managerial hegemony theory” (Herman, 1981; Kosnik,1987). Below, we present three hypotheses that are intended as illustrations ofhypotheses about subgroup power struggles and executive dominance. Hypothesis 1is univariate in that it concerns a change in a single variable over time. Hypothesis 2focuses on a bivariate relationship. Hypothesis 3 depicts a multivariate analysis thatincludes statistical control of potential confounding variables.
Hypothesis 1. This hypothesis concerns changes (i.e., trends) in participation rates,or activity levels, of director subgroups. Because executive directors had the advantageof experience with the firm and the industry, they were most active in board delibera-tions. On the other hand, we expected that as time of service by new outside directorsincreased, they would become more familiar with the firm, would gain more knowl-edge about the firm’s environment, and would become more accustomed to other boardmembers. As a result, the activity level of new outside directors was expected toincrease over time. In contrast, worker directors were disadvantaged in educationalbackground, business training, and managerial experience (see also Hammer et al.,1991; Hammer & Stern, 1986). These factors hampered work directors’ acquisition ofbusiness knowledge of the firm and left them deficient in the understanding necessary
Table 2Subgroups of Directors
1. Executive directors (4 directors): chairman of the board, chief executive officer, vice president for marketing and sales, and chief financial officer2. Preexistent outside directors (2-3a directors): directors not employed by the firm who were on the board prior to the ESOP3. New outside directors (6-7a directors): directors not employed by the firm who joined the board after the ESOP4. Worker directors (3-5a directors): union workers who joined the board after the ESOP
a. Over the 5-year study, the number in some subgroups changed slightly as directors resignedor were not reelected.
14 ORGANIZATIONAL RESEARCH METHODS
at SAGE Publications on April 20, 2015orm.sagepub.comDownloaded from
to make substantial contributions to board deliberations. Therefore, the activity levelof worker directors was expected not to increase over time.
Hypothesis 1: The overall activity level of new outside directors, but not worker directors,will increase over time.
Hypothesis 2. As discussed previously, within the board there were subgroups ofdirectors with different values, priorities, and interests (Anderson & Anthony, 1986).In particular, effects of stakeholder representation and interest group conflict wereexpected (Hammer et al., 1991). Some topics of board deliberation were particularlyprone to generate interest-group arguments, which in turn often would elicit disagree-ments and open conflict. For example, from our qualitative data, it was clear thatexecutive directors were promanagement with respect to compensation and promo-tions decisions. New outside directors, on the other hand, often were critical ofpersonnel decisions about managers. Second, because they represented the interestsof employee owners as well as common stockholders, new outside directors oftenadvocated the full implementation of the financial and employee involvement aspectsof the ESOP. Executive directors, on the other hand, were not as enthusiastic aboutsome details of the ESOP. Third, because workerer directors defined their role partlyas advocates of worker interests, their focus was on topics such as union contract andlabor issues, manufacturing processes, and employee performance. Executive direc-tors, in contrast, argued that labor interest group advocacy inside the board room wasinappropriate (Hammer & Stern, 1986). Therefore,
Hypothesis 2: High interest group activity and conflict will be associated with topics of boarddeliberations that affect directors’ self-interest or financial interest.
Hypothesis 3. Managerial hegemony theory (Kosnik, 1987) posits that executivedominance stems from an effect of “information is power” from executives’ intimateknowledge of the functional areas of business such as finance, accounting, marketing,and industry regulation. Similarly, our qualitative data revealed a pattern of dominanceby the executive director subgroup in the specific domain of “discussion, debate, andargumentation.” Thus, if this explanation for executive dominance were true, wewould expect that their dominance would be strong on topics of board deliberationthat required firm-specific knowledge (e.g., finance and marketing). These were topicson which workers suffered the greatest disadvantage because of their lack of manage-rial experience. Furthermore, perusing the totality of the transcripts over the 5-yeardata-collection period led us to make more specific statements about dominance bythe executive director subgroup. We perceived that the overall pattern of dominanceby the executive subgroup existed (a) even though the executive subgroup was smallin terms of the number of directors, (b) even though the prevalence of topics ofdeliberation differed across board meetings, and (c) even though some subgroups weremore dominant than others on certain topics of deliberation. Thus,
Hypothesis 3: Executive directors will be more dominant in board discussion, debate, andargumentation than will preexistent outside, new outside, or worker directors, particularlyon topics that require firm-specific knowledge. Worker directors will be the leastdominant of the subgroups.
Currall et al. / QUALITATIVE AND QUANTITATIVE METHODOLOGIES 15
at SAGE Publications on April 20, 2015orm.sagepub.comDownloaded from
Content Analysis and Interrater Reliability
Development of the Content Analysis Scheme
The central purpose of any content analysis scheme is to guide the conversion ofqualitative data into quantified variables that can be used in hypothesis evaluation(Larsson, 1993). In the present study, content analysis provided for quantification ofboard members’ verbal behaviors in the form of counts.
Qualitative observation draws the observer into the phenomenologically complexsocial world of those being observed (Adler & Adler, 1994). As a result, the observeris not constrained by predetermined categories of behaviors to be recorded. Rather,the observer uncovers behavioral categories and dynamics that are meaningful to thesubjects (Adler & Adler, 1994; Gersick, 1988). In constructing our content analysisscheme, we sought to maximize the trade-off between reliable simplicity from theuse of a small number of coding categories and information-rich complexity from alarge number of categories (Larsson, 1993, provides a detailed discussion of suchtrade-offs).
Development of a valid content analysis scheme is based on (a) the scheme’s abilityto categorize all verbal behaviors that occurred inside the boardroom and (b) the mutualexclusivity of coding categories (i.e., content analysis coding categories must exhibitdefinitional precision so that a verbal behavior can fit the definition of one and onlyone category). Thus, the first task in developing our content analysis scheme was tocapture exhaustively all the different types of verbal behaviors by board members. Webegan by consulting existing coding schemes (e.g., Bales & Cohen, 1979) to identifygeneral verbal behavior coding categories. Also, based on the observer’s qualitativedata collection, as well as previous literature on corporate boards (e.g., Hammer et al.,1991; Lorsch & MacIver, 1989; Ross, 1989; Scott, Mitchell, & Peery, 1981; Vance,1983; Zander, Forward, & Albert, 1969), we included coding categories that capturedsubgroup conflict and power dynamics. Second, to develop mutually exclusive codingcategories, we began with a small set of verbal behavior categories based on ourknowledge of the board. We selected transcripts of board meetings at random andcoded them, progressively expanding the coding categories as it became clear thatverbal behaviors did not fit initial definitions of coding categories. Through thisiterative process, we developed precise definitional boundaries among coding catego-ries. The content analysis scheme underwent 15 iterations to ensure that the contentanalysis categories were both exhaustive and mutually exclusive.
The Three-Dimensional Content Analysis Scheme: Individuals × Topics × Contributions
The following is an explanation of the three dimensions used to code units of verbalbehavior exhibited by board members.
Individuals. The first dimension of the content analysis scheme involved assigningverbal behaviors to individuals. The transcripts contained the verbal behaviors of atotal of the 45 individuals who were present at board meetings at one time or another.These individuals included all board members, company managers, officers of the
16 ORGANIZATIONAL RESEARCH METHODS
at SAGE Publications on April 20, 2015orm.sagepub.comDownloaded from
local union, legal and financial advisors to the company, various other consultants tothe board, and persons making business presentations to the board.
Topics. The second dimension involved coding verbal behaviors according to theirtopic areas. There were 13 different topic areas. These are listed and defined in Table 3.
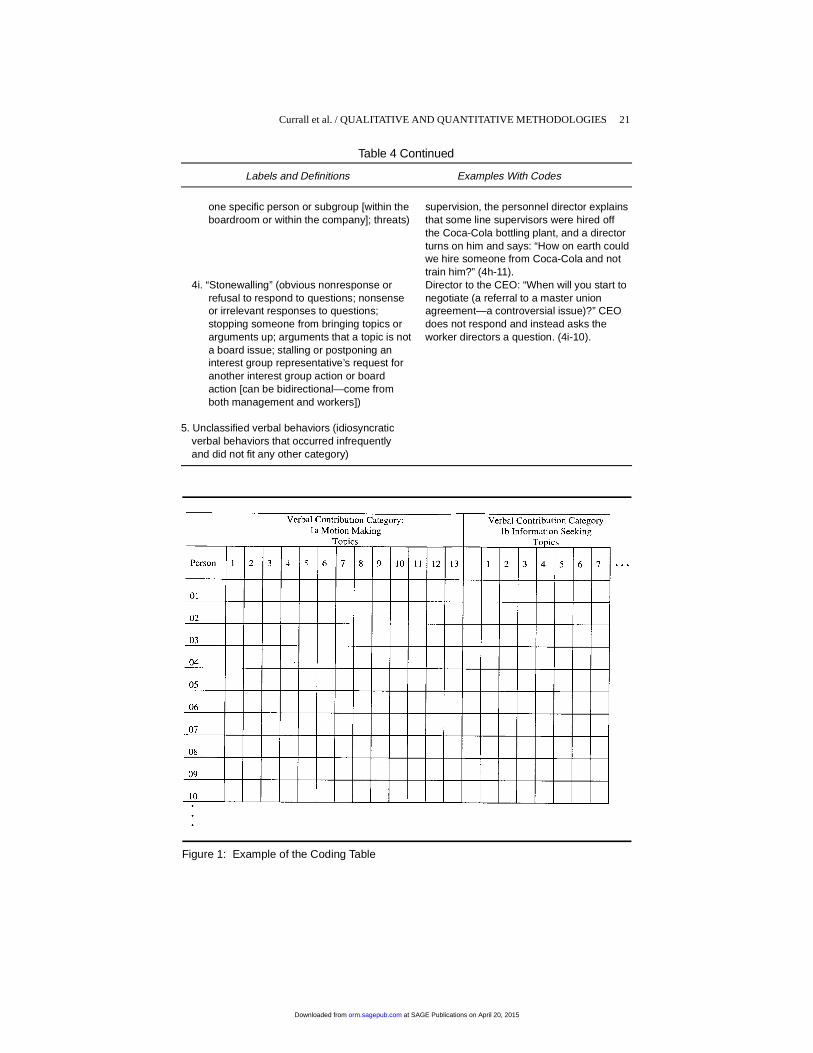
Verbal contributions. After coding verbal behaviors according to individuals andtopics, verbal behaviors were coded according to the type of the verbal contribution.This involved coders’ judgments about the form of contribution an individual wasmaking with his or her verbal behavior. Examples of different types of contributionswere information seeking, disagreeing, arguing using evidence, attacking, and dealingwith tension. There were 21 contribution categories. Of these, 6 captured conflict andpower dynamics: special interest group gains and positions (4e1-3), attempts topropose new board topics (4f), disagreements, conflict, attacks, (4h), and stonewalling(4i).3 Table 4 lists all categories with definitions and examples. An illustration of anexcerpt from the transcripts is contained in the appendix.
THE PROCESS OF CONTENT ANALYZING THE TRANSCRIPTS
There are four assumptions of content analysis (Cohen, 1960). First, codingjudgments must be independent. In other words, raters must view each coding unit asdistinct and independent from neighboring coding units. A unit was defined as aninstance of verbal behavior that had a specific purpose or served a specific functionfor an individual board member. Second, coding categories must be mutually exclusiveand exhaustive. For the present study, there was no overlap between categories. Also,the categories covered all types of verbal behaviors of board members. Third, raters apriori must be deemed to be equal in their intellectual capacity to make codingjudgments. Fourth, raters should be unrestricted on the distribution of coding judg-ments over categories (i.e., raters must be free to assign coding units to any codingcategory).
For the present study, coding the transcripts involved two operations: (a) separatingthe verbal behaviors by board members into units and (b) assigning verbal behaviorsto the coding categories (see Guetzkow, 1950). Based on Krippendorff’s (1980)framework, a verbal behavior unit was defined “thematically” (p. 62) on the basis ofthe dominant content of a board member’s verbal behavior. The dominant content wasdefined in terms of the topic addressed by a director and the purpose the behavior wasintended to serve (labeled “verbal contribution”). Breaks in verbal units occurred whenthe board member changed either topic or verbal contribution. We content analyzedonly information in the transcripts that referred to identifiable verbal behaviors byboard members.
THE CODING TABLE
We used a table composed of 12,285 cells (45 individuals × 13 topic categories ×21 contribution categories) to record the frequency of verbal behaviors for each boardmeeting. Figure 1 shows a segment of the coding table. Each unit of verbal behaviorwas placed in one and only one coding cell based on definitions of Topics and Verbal
(text continues on p. 22)
Currall et al. / QUALITATIVE AND QUANTITATIVE METHODOLOGIES 17
at SAGE Publications on April 20, 2015orm.sagepub.comDownloaded from
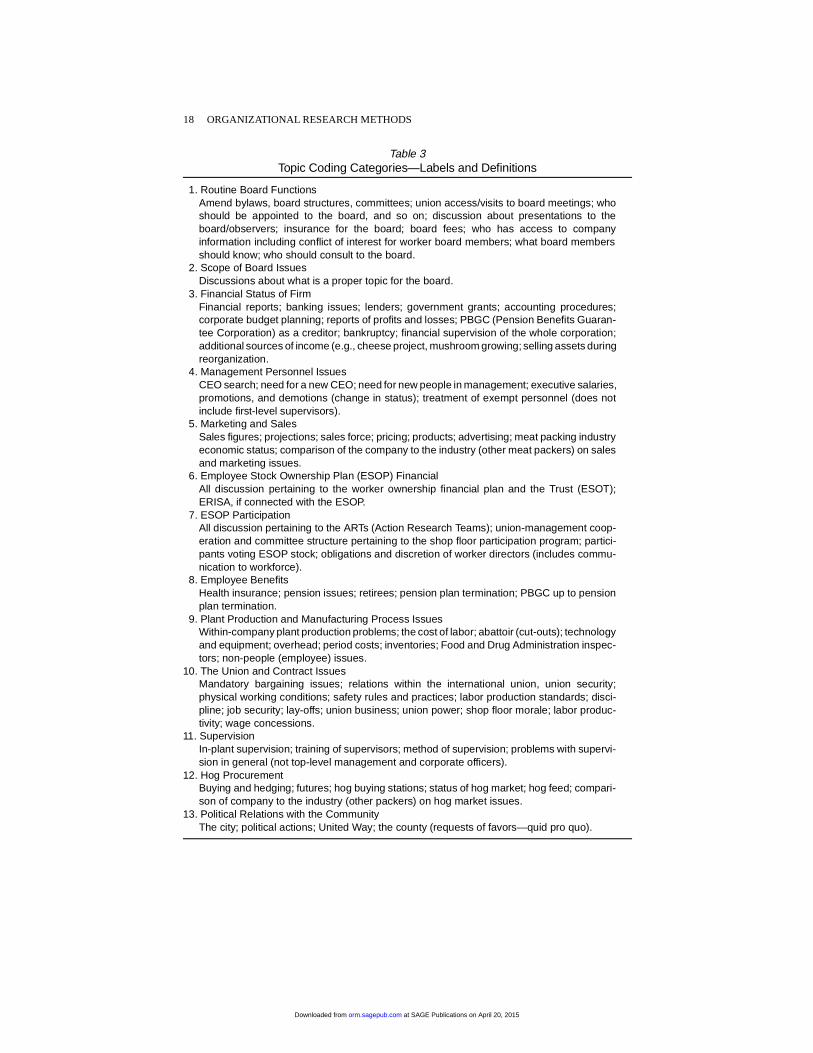
Table 3Topic Coding Categories—Labels and Definitions
1. Routine Board FunctionsAmend bylaws, board structures, committees; union access/visits to board meetings; whoshould be appointed to the board, and so on; discussion about presentations to theboard/observers; insurance for the board; board fees; who has access to companyinformation including conflict of interest for worker board members; what board membersshould know; who should consult to the board.
2. Scope of Board IssuesDiscussions about what is a proper topic for the board.
3. Financial Status of FirmFinancial reports; banking issues; lenders; government grants; accounting procedures;corporate budget planning; reports of profits and losses; PBGC (Pension Benefits Guaran-tee Corporation) as a creditor; bankruptcy; financial supervision of the whole corporation;additional sources of income (e.g., cheese project, mushroom growing; selling assets duringreorganization.
4. Management Personnel IssuesCEO search; need for a new CEO; need for new people in management; executive salaries,promotions, and demotions (change in status); treatment of exempt personnel (does notinclude first-level supervisors).
5. Marketing and SalesSales figures; projections; sales force; pricing; products; advertising; meat packing industryeconomic status; comparison of the company to the industry (other meat packers) on salesand marketing issues.
6. Employee Stock Ownership Plan (ESOP) FinancialAll discussion pertaining to the worker ownership financial plan and the Trust (ESOT);ERISA, if connected with the ESOP.
7. ESOP ParticipationAll discussion pertaining to the ARTs (Action Research Teams); union-management coop-eration and committee structure pertaining to the shop floor participation program; partici-pants voting ESOP stock; obligations and discretion of worker directors (includes commu-nication to workforce).
8. Employee BenefitsHealth insurance; pension issues; retirees; pension plan termination; PBGC up to pensionplan termination.
9. Plant Production and Manufacturing Process IssuesWithin-company plant production problems; the cost of labor; abattoir (cut-outs); technologyand equipment; overhead; period costs; inventories; Food and Drug Administration inspec-tors; non-people (employee) issues.
10. The Union and Contract IssuesMandatory bargaining issues; relations within the international union, union security;physical working conditions; safety rules and practices; labor production standards; disci-pline; job security; lay-offs; union business; union power; shop floor morale; labor produc-tivity; wage concessions.
11. SupervisionIn-plant supervision; training of supervisors; method of supervision; problems with supervi-sion in general (not top-level management and corporate officers).
12. Hog ProcurementBuying and hedging; futures; hog buying stations; status of hog market; hog feed; compari-son of company to the industry (other packers) on hog market issues.
13. Political Relations with the CommunityThe city; political actions; United Way; the county (requests of favors—quid pro quo).
18 ORGANIZATIONAL RESEARCH METHODS
at SAGE Publications on April 20, 2015orm.sagepub.comDownloaded from
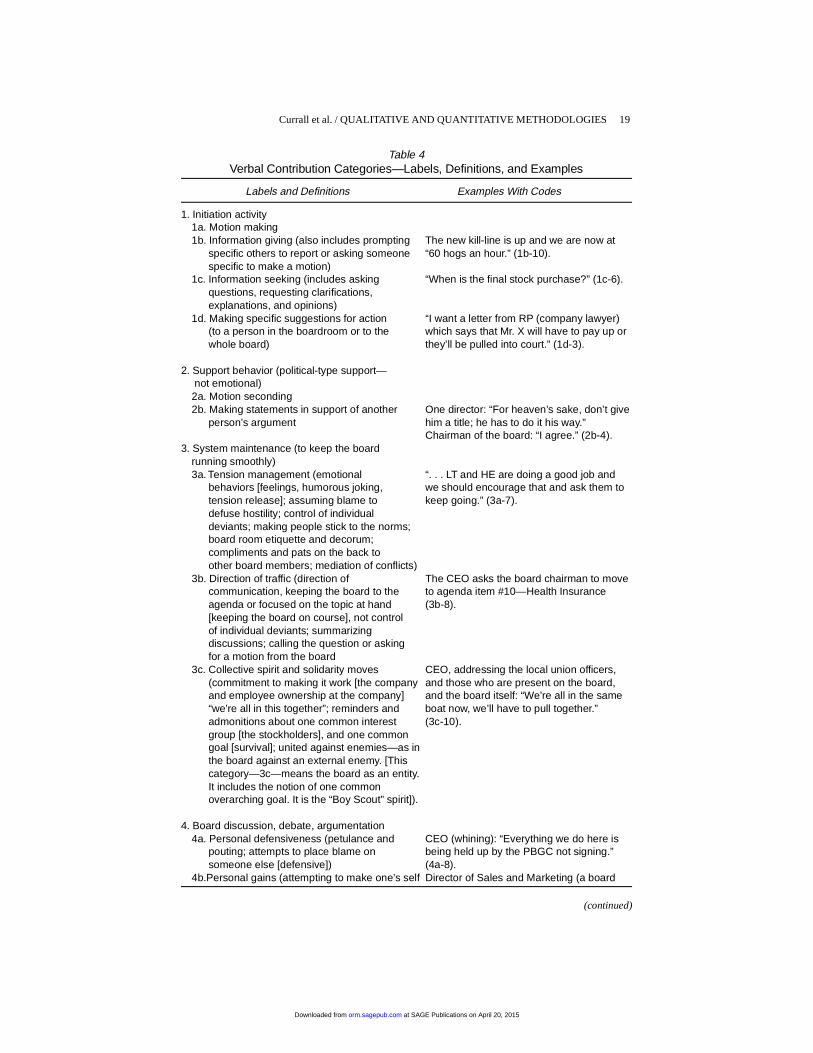
Table 4Verbal Contribution Categories—Labels, Definitions, and Examples
Labels and Definitions Examples With Codes
1. Initiation activity 1a. Motion making 1b. Information giving (also includes prompting The new kill-line is up and we are now at specific others to report or asking someone “60 hogs an hour.” (1b-10). specific to make a motion) 1c. Information seeking (includes asking “When is the final stock purchase?” (1c-6). questions, requesting clarifications, explanations, and opinions) 1d. Making specific suggestions for action “I want a letter from RP (company lawyer) (to a person in the boardroom or to the which says that Mr. X will have to pay up or whole board) they’ll be pulled into court.” (1d-3).
2. Support behavior (political-type support— not emotional) 2a. Motion seconding 2b. Making statements in support of another One director: “For heaven’s sake, don’t give person’s argument him a title; he has to do it his way.”
Chairman of the board: “I agree.” (2b-4).3. System maintenance (to keep the board running smoothly) 3a. Tension management (emotional “. . . LT and HE are doing a good job and behaviors [feelings, humorous joking, we should encourage that and ask them to tension release]; assuming blame to keep going.” (3a-7). defuse hostility; control of individual deviants; making people stick to the norms; board room etiquette and decorum; compliments and pats on the back to other board members; mediation of conflicts) 3b. Direction of traffic (direction of The CEO asks the board chairman to move communication, keeping the board to the to agenda item #10—Health Insurance agenda or focused on the topic at hand (3b-8). [keeping the board on course], not control of individual deviants; summarizing discussions; calling the question or asking for a motion from the board 3c. Collective spirit and solidarity moves CEO, addressing the local union officers, (commitment to making it work [the company and those who are present on the board, and employee ownership at the company] and the board itself: “We’re all in the same “we’re all in this together”; reminders and boat now, we’ll have to pull together.” admonitions about one common interest (3c-10). group [the stockholders], and one common goal [survival]; united against enemies—as in the board against an external enemy. [This category—3c—means the board as an entity. It includes the notion of one common overarching goal. It is the “Boy Scout” spirit]).
4. Board discussion, debate, argumentation 4a. Personal defensiveness (petulance and CEO (whining): “Everything we do here is pouting; attempts to place blame on being held up by the PBGC not signing.” someone else [defensive]) (4a-8). 4b.Personal gains (attempting to make one’s self Director of Sales and Marketing (a board
(continued)
Currall et al. / QUALITATIVE AND QUANTITATIVE METHODOLOGIES 19
at SAGE Publications on April 20, 2015orm.sagepub.comDownloaded from
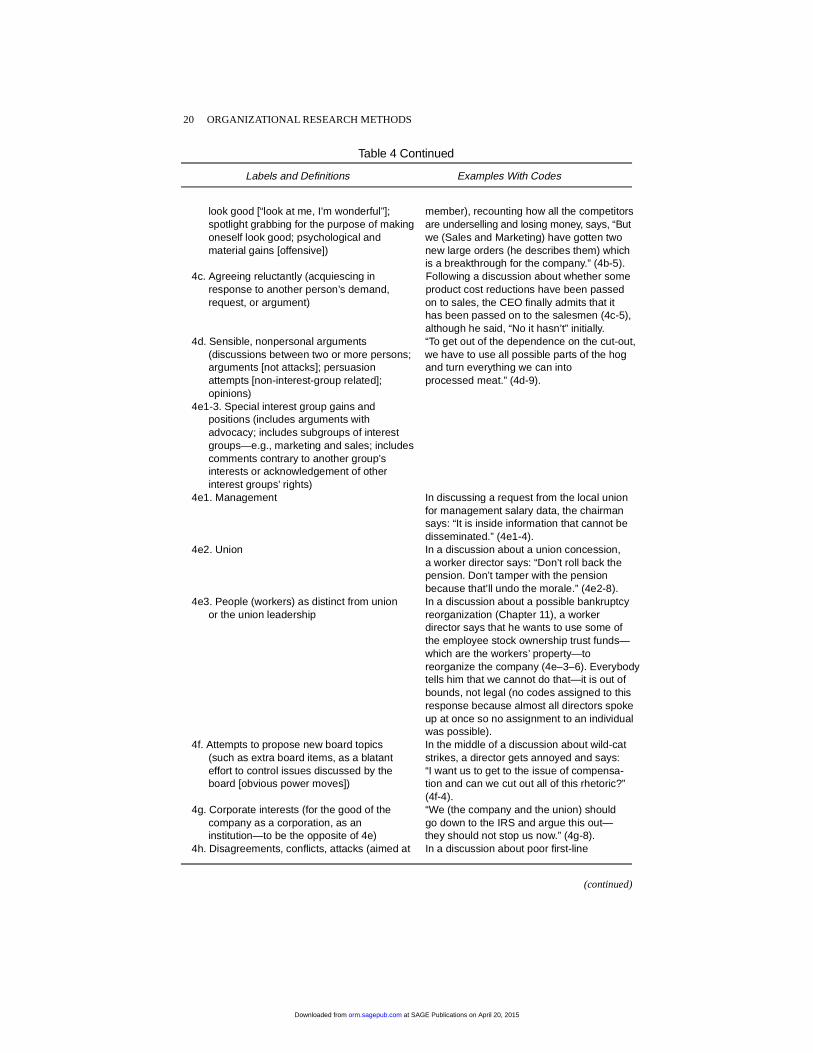
look good [“look at me, I’m wonderful”]; member), recounting how all the competitors spotlight grabbing for the purpose of making are underselling and losing money, says, “But oneself look good; psychological and we (Sales and Marketing) have gotten two material gains [offensive]) new large orders (he describes them) which
is a breakthrough for the company.” (4b-5). 4c. Agreeing reluctantly (acquiescing in Following a discussion about whether some response to another person’s demand, product cost reductions have been passed request, or argument) on to sales, the CEO finally admits that it
has been passed on to the salesmen (4c-5),although he said, “No it hasn’t” initially.
4d. Sensible, nonpersonal arguments “To get out of the dependence on the cut-out, (discussions between two or more persons; we have to use all possible parts of the hog arguments [not attacks]; persuasion and turn everything we can into attempts [non-interest-group related]; processed meat.” (4d-9). opinions) 4e1-3. Special interest group gains and positions (includes arguments with advocacy; includes subgroups of interest groups—e.g., marketing and sales; includes comments contrary to another group’s interests or acknowledgement of other interest groups’ rights) 4e1. Management In discussing a request from the local union
for management salary data, the chairman says: “It is inside information that cannot bedisseminated.” (4e1-4).
4e2. Union In a discussion about a union concession, a worker director says: “Don’t roll back the pension. Don’t tamper with the pension because that’ll undo the morale.” (4e2-8).
4e3. People (workers) as distinct from union In a discussion about a possible bankruptcy or the union leadership reorganization (Chapter 11), a worker
director says that he wants to use some of the employee stock ownership trust funds—which are the workers’ property—to reorganize the company (4e–3–6). Everybody tells him that we cannot do that—it is out of bounds, not legal (no codes assigned to thisresponse because almost all directors spokeup at once so no assignment to an individualwas possible).
4f. Attempts to propose new board topics In the middle of a discussion about wild-cat (such as extra board items, as a blatant strikes, a director gets annoyed and says: effort to control issues discussed by the “I want us to get to the issue of compensa- board [obvious power moves]) tion and can we cut out all of this rhetoric?”
(4f-4). 4g. Corporate interests (for the good of the “We (the company and the union) should company as a corporation, as an go down to the IRS and argue this out— institution—to be the opposite of 4e) they should not stop us now.” (4g-8). 4h. Disagreements, conflicts, attacks (aimed at In a discussion about poor first-line
Table 4 Continued
Labels and Definitions Examples With Codes
(continued)
20 ORGANIZATIONAL RESEARCH METHODS
at SAGE Publications on April 20, 2015orm.sagepub.comDownloaded from
one specific person or subgroup [within the supervision, the personnel director explains boardroom or within the company]; threats) that some line supervisors were hired off
the Coca-Cola bottling plant, and a director turns on him and says: “How on earth couldwe hire someone from Coca-Cola and not train him?” (4h-11).
4i. “Stonewalling” (obvious nonresponse or Director to the CEO: “When will you start to refusal to respond to questions; nonsense negotiate (a referral to a master union or irrelevant responses to questions; agreement—a controversial issue)?” CEO stopping someone from bringing topics or does not respond and instead asks the arguments up; arguments that a topic is not worker directors a question. (4i-10). a board issue; stalling or postponing an interest group representative’s request for another interest group action or board action [can be bidirectional—come from both management and workers])
5. Unclassified verbal behaviors (idiosyncratic verbal behaviors that occurred infrequently and did not fit any other category)
Table 4 Continued
Labels and Definitions Examples With Codes
Figure 1: Example of the Coding Table
Currall et al. / QUALITATIVE AND QUANTITATIVE METHODOLOGIES 21
at SAGE Publications on April 20, 2015orm.sagepub.comDownloaded from
Contributions. The resultant data set consisted of counts of verbal behaviors withincells of the coding table.
Assessment of the Content Analysis Scheme: Interrater Reliability
Reliability refers to the degree to which different researchers code the data consis-tently (Kirk & Miller, 1986). Below, two indices of interrater reliability—proportionof agreement and Cohen’s (1960) κ—are considered, and their disadvantages for thepresent study are explained. We then discuss the advantages of Scott’s (1955) π, theindex of reliability that was appropriate for our study.
REQUIREMENTS FOR A MEASURE OF INTERRATER RELIABILITY
Jones, Johnson, Butler, and Main (1983) discuss the requirements of interraterreliability measures, of which several were critical for our choice of which measureto use for the present study. First, the measure of interrater reliability must beunaffected by the number of categories; only the extent of agreement between the ratersshould affect the measure. For example, a comparison of interrater reliability for ourTopic codes (13 categories) and Verbal Contribution codes (21 categories) would beimpossible if the measure was affected by the number of categories. Second, themeasure of interrater reliability must be unaffected by the number of times eachcategory is used. Third, the measure must be comparable with other commonly usedmeasures of interrater reliability. A final requirement was that the measure appropri-ately correct for chance agreement. Because in our case there was no preexistinginformation from a similar study of a corporate board, the final condition was that themeasure not require preexisting data concerning the proportions of various types ofdirectors’ verbal behaviors.
DISADVANTAGES OF PROPORTION OF AGREEMENT AND COHEN’S κ
The simplest measure of interrater reliability is proportion of agreement. It isdefined as the number of times raters agreed on a code divided by the total number ofcoding judgments. This measure is easy to calculate and easily interpretable (i.e., thescale of agreement ranges from 0 to 1.0). There are, however, significant drawbacksto using proportion of agreement (Brennan & Prediger, 1981; Cohen, 1968; Jones etal., 1983; Scott, 1955). First, the measure is highly influenced by the number ofcategories. With proportion of agreement, if there are relatively few categories and ahighly skewed distribution of judgments between the categories, there is a greaterlikelihood of agreement due to chance (Jones et al., 1983). Thus, proportion ofagreement does not indicate the same level of reliability across content analysisdimensions with different numbers of categories.
Perhaps the most common measure of interrater reliability in the social scienceliterature is Cohen’s (1960) κ. Kappa ranges from 0 to 1.0 and, unlike proportion ofagreement, κ corrects for chance agreement. Unfortunately, κ’s method of correctingfor chance agreement is inappropriate for the present study. For κ, chance agreementis the product of the “fixed” marginal probabilities calculated for cells along thediagonal of a matrix of coding data. The marginal proportions that arise from the
22 ORGANIZATIONAL RESEARCH METHODS
at SAGE Publications on April 20, 2015orm.sagepub.comDownloaded from
coding are termed fixed because they are expected to fall within a fixed range basedupon preexisting information on marginal proportions for coding categories (Brennan& Prediger, 1981). However, as indicated previously, our study requires a measure ofinterrater reliability that involves no preexisting information of marginal proportions.We require a measure in which the marginal proportions are free to vary.
ADVANTAGES OF SCOTT’S π
Scott’s (1955) π, a measure akin to κ, meets all the requirements for the presentstudy. The formula for π is
π = po − pe
1 − pe,
where po is observed proportion of agreement, and pe is the proportion of agreementexpected by chance. Unaffected by the number of coding categories, π is comparableacross coding dimensions with different numbers of categories. Also, π is unaffectedby the frequency with which categories are used, an important advantage for a measureof interrater reliability (Jones et al., 1983) because in our study, some categories wereused with greater frequency than others. Like proportion of agreement and κ, π is easilyinterpretable, ranging from 0 to 1.0.
The most important advantage of π is that it corrects for chance agreement withoutpreexistent information on the marginal proportions of coding categories. In fact, πhas two advantages over κ. First, chance agreement from π uses all the coding data inthe frequency matrix. Chance agreement from κ uses only data from cells on thediagonal. Second, chance agreement from π is not calculated from fixed marginalproportions, as is true of chance agreement from κ. Calculation of π’s chanceagreement component can be calculated solely upon the frequency with which ratersused each content analysis category. Based on these considerations, π was the appro-priate measure of interrater reliability for the present study.
Interrater Reliability Results
A total of three persons coded the data. Coder 1 was the observer of the board.Coder 2 had no personal experience with the board but jointly developed the contentanalysis scheme with Coder 1. Coder 3 had no personal experience with the board andwas not involved in development of the content analysis scheme. Moreover, Coder 3was blind to any theoretical ideas concerning board processes. Having at least onecoder who is blind to theory concerning the phenomenon under study is critical forestablishing the integrity of a content analysis scheme (Larsson, 1993).
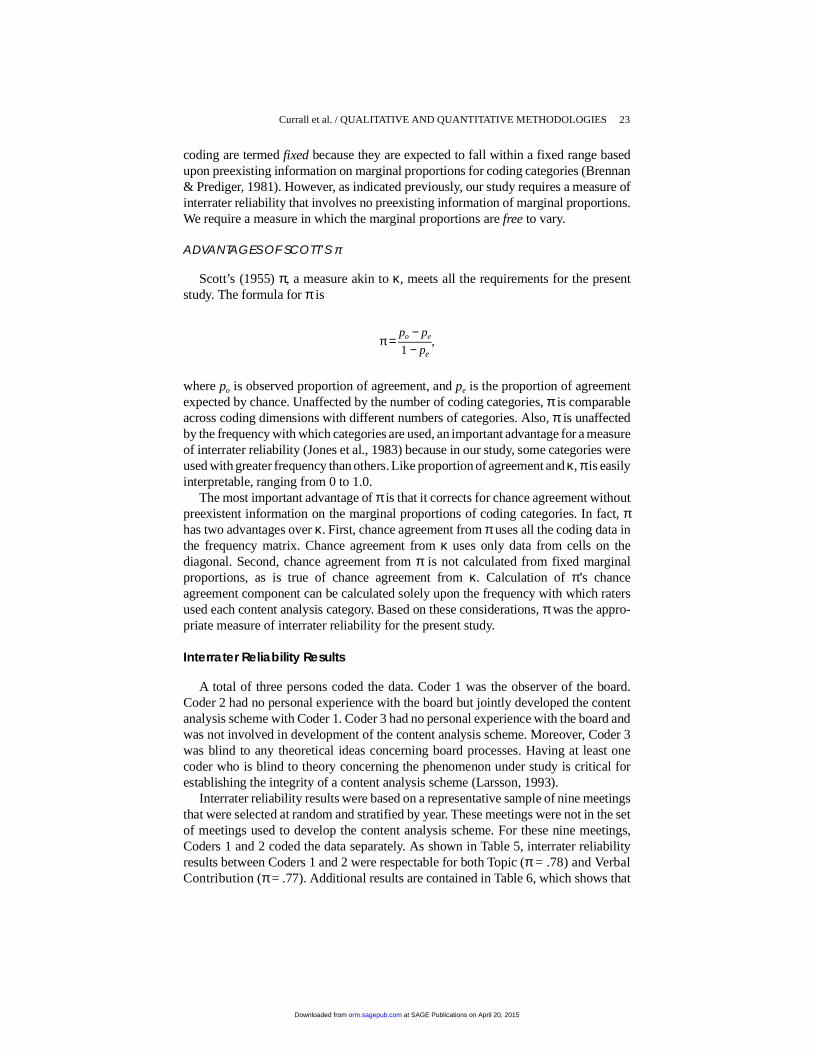
Interrater reliability results were based on a representative sample of nine meetingsthat were selected at random and stratified by year. These meetings were not in the setof meetings used to develop the content analysis scheme. For these nine meetings,Coders 1 and 2 coded the data separately. As shown in Table 5, interrater reliabilityresults between Coders 1 and 2 were respectable for both Topic (π = .78) and VerbalContribution (π = .77). Additional results are contained in Table 6, which shows that
Currall et al. / QUALITATIVE AND QUANTITATIVE METHODOLOGIES 23
at SAGE Publications on April 20, 2015orm.sagepub.comDownloaded from
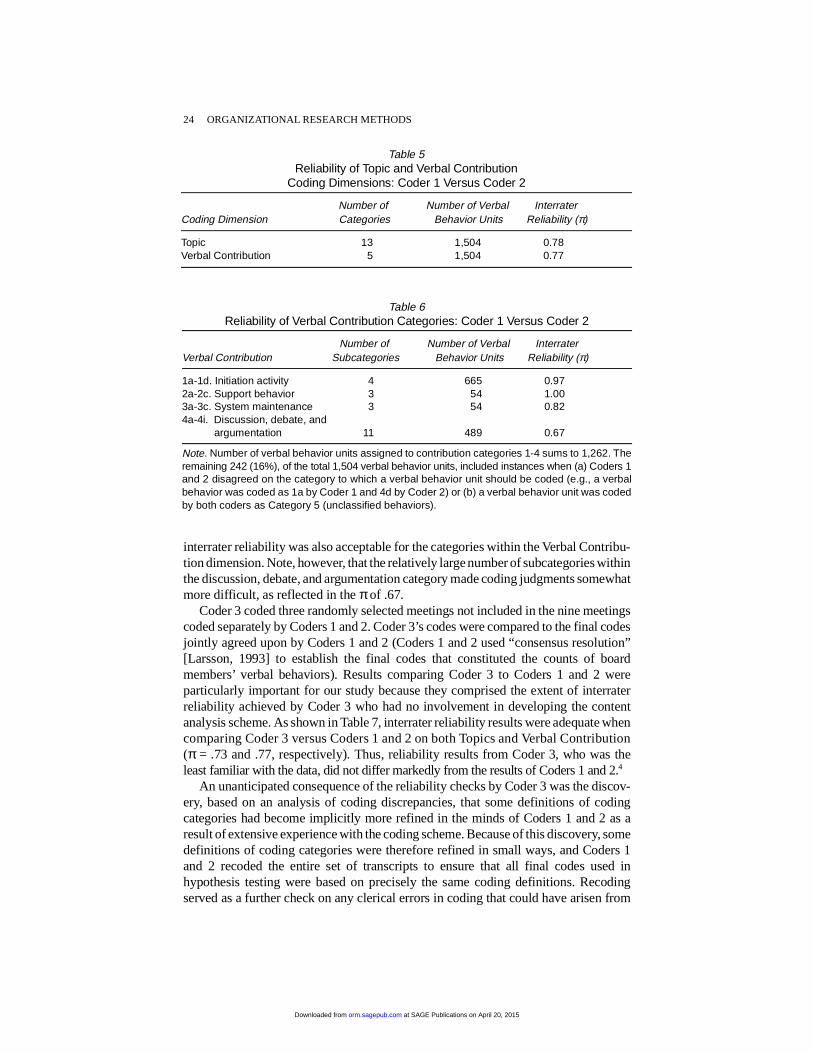
interrater reliability was also acceptable for the categories within the Verbal Contribu-tion dimension. Note, however, that the relatively large number of subcategories withinthe discussion, debate, and argumentation category made coding judgments somewhatmore difficult, as reflected in the π of .67.
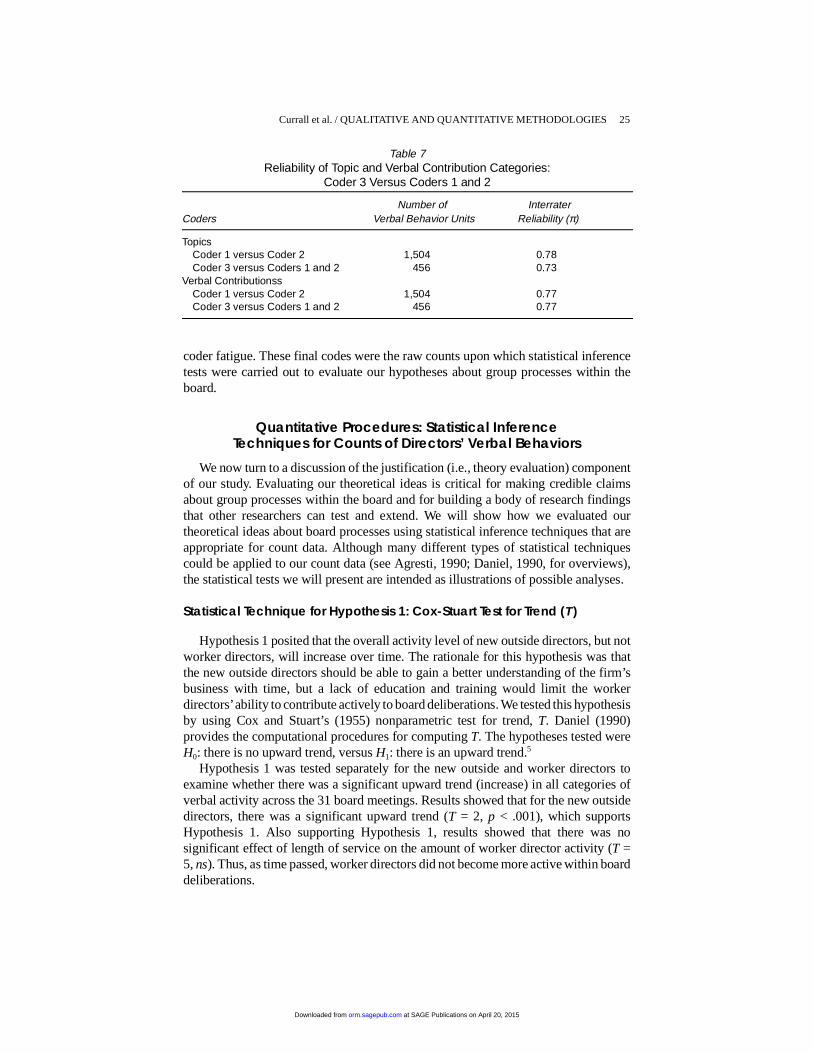
Coder 3 coded three randomly selected meetings not included in the nine meetingscoded separately by Coders 1 and 2. Coder 3’s codes were compared to the final codesjointly agreed upon by Coders 1 and 2 (Coders 1 and 2 used “consensus resolution”[Larsson, 1993] to establish the final codes that constituted the counts of boardmembers’ verbal behaviors). Results comparing Coder 3 to Coders 1 and 2 wereparticularly important for our study because they comprised the extent of interraterreliability achieved by Coder 3 who had no involvement in developing the contentanalysis scheme. As shown in Table 7, interrater reliability results were adequate whencomparing Coder 3 versus Coders 1 and 2 on both Topics and Verbal Contribution(π = .73 and .77, respectively). Thus, reliability results from Coder 3, who was theleast familiar with the data, did not differ markedly from the results of Coders 1 and 2.4
An unanticipated consequence of the reliability checks by Coder 3 was the discov-ery, based on an analysis of coding discrepancies, that some definitions of codingcategories had become implicitly more refined in the minds of Coders 1 and 2 as aresult of extensive experience with the coding scheme. Because of this discovery, somedefinitions of coding categories were therefore refined in small ways, and Coders 1and 2 recoded the entire set of transcripts to ensure that all final codes used inhypothesis testing were based on precisely the same coding definitions. Recodingserved as a further check on any clerical errors in coding that could have arisen from
Table 5Reliability of Topic and Verbal Contribution
Coding Dimensions: Coder 1 Versus Coder 2
Number of Number of Verbal Interrater Coding Dimension Categories Behavior Units Reliability (π)
Topic 13 1,504 0.78Verbal Contribution 5 1,504 0.77
Table 6Reliability of Verbal Contribution Categories: Coder 1 Versus Coder 2
Number of Number of Verbal Interrater Verbal Contribution Subcategories Behavior Units Reliability (π)
1a-1d. Initiation activity 4 665 0.972a-2c. Support behavior 3 54 1.003a-3c. System maintenance 3 54 0.824a-4i. Discussion, debate, and argumentation 11 489 0.67
Note. Number of verbal behavior units assigned to contribution categories 1-4 sums to 1,262. Theremaining 242 (16%), of the total 1,504 verbal behavior units, included instances when (a) Coders 1and 2 disagreed on the category to which a verbal behavior unit should be coded (e.g., a verbalbehavior was coded as 1a by Coder 1 and 4d by Coder 2) or (b) a verbal behavior unit was codedby both coders as Category 5 (unclassified behaviors).
24 ORGANIZATIONAL RESEARCH METHODS
at SAGE Publications on April 20, 2015orm.sagepub.comDownloaded from
coder fatigue. These final codes were the raw counts upon which statistical inferencetests were carried out to evaluate our hypotheses about group processes within theboard.
Quantitative Procedures: Statistical InferenceTechniques for Counts of Directors’ Verbal Behaviors
We now turn to a discussion of the justification (i.e., theory evaluation) componentof our study. Evaluating our theoretical ideas is critical for making credible claimsabout group processes within the board and for building a body of research findingsthat other researchers can test and extend. We will show how we evaluated ourtheoretical ideas about board processes using statistical inference techniques that areappropriate for count data. Although many different types of statistical techniquescould be applied to our count data (see Agresti, 1990; Daniel, 1990, for overviews),the statistical tests we will present are intended as illustrations of possible analyses.
Statistical Technique for Hypothesis 1: Cox-Stuart Test for Trend (T )
Hypothesis 1 posited that the overall activity level of new outside directors, but notworker directors, will increase over time. The rationale for this hypothesis was thatthe new outside directors should be able to gain a better understanding of the firm’sbusiness with time, but a lack of education and training would limit the workerdirectors’ ability to contribute actively to board deliberations. We tested this hypothesisby using Cox and Stuart’s (1955) nonparametric test for trend, T. Daniel (1990)provides the computational procedures for computing T. The hypotheses tested wereH0: there is no upward trend, versus H1: there is an upward trend.5
Hypothesis 1 was tested separately for the new outside and worker directors toexamine whether there was a significant upward trend (increase) in all categories ofverbal activity across the 31 board meetings. Results showed that for the new outsidedirectors, there was a significant upward trend (T = 2, p < .001), which supportsHypothesis 1. Also supporting Hypothesis 1, results showed that there was nosignificant effect of length of service on the amount of worker director activity (T =5, ns). Thus, as time passed, worker directors did not become more active within boarddeliberations.
Table 7Reliability of Topic and Verbal Contribution Categories:
Coder 3 Versus Coders 1 and 2
Number of Interrater Coders Verbal Behavior Units Reliability (π)
Topics Coder 1 versus Coder 2 1,504 0.78 Coder 3 versus Coders 1 and 2 456 0.73Verbal Contributionss Coder 1 versus Coder 2 1,504 0.77 Coder 3 versus Coders 1 and 2 456 0.77
Currall et al. / QUALITATIVE AND QUANTITATIVE METHODOLOGIES 25
at SAGE Publications on April 20, 2015orm.sagepub.comDownloaded from
Statistical Technique for Hypothesis 2: Kendall’s Nonparametric Correlation (τ)
Hypothesis 2 predicted that high interest group activity and conflict would beassociated with certain topics. Our expectation was that interest group arguments andconflict would emerge around topics such as management compensation and promo-tions, the ESOP, union contract, and manufacturing processes. Accordingly, of the 13topics identified in the content analysis scheme, we operationalized high interest groupactivity topics as Management Personnel Issues, ESOP-Financial, ESOP-Participa-tion, Employee Benefits, Plant Production and Manufacturing Process Issues, andUnion and Contract Issues. To test the association between the amount of interest grouparguments and open conflict relative to the total amount of activity on a topic, weoperationalized interest group arguments as counts of directors’ verbal behaviors incategories 4e1, 4e2, and 4e3 and conflict as category 4h. Within each board meeting,we summed 4e1, 4e2, 4e3, and 4h for each of the 13 topics. We correlated this sumwith the sum of all verbal behaviors within each topic. Therefore, 13 correlations wereperformed, one for each topic. Within high interest group activity topics, we expectedsignificant correlations between the sum of interest group arguments and conflict andthe sum of total activity. The sample size for each correlation was 31, correspondingto the number of board meetings.
Kendall (1938) proposed τ as a nonparametric measure of correlation (ranging from–1 to 1) based upon rank statistics. The computational procedures for the test statisticare described in Daniel (1990). Kendall’s τ provides a better estimate of the populationcorrelation than Spearman’s ρ (Daniel, 1990). The values we report are estimates ofthe population correlation coefficient. Hypotheses tested were H0: τ = 0, versus H1:τ ≠ 0. Results showed that Hypothesis 2 was supported by significant correlations onthe following topics: Management Personnel Issues, τ = .28 (p < .05), EmployeeBenefits, τ = .26 (p < .05), and Union and Contract Issues, τ = .27 (p < .05). Alsoconsistent with Hypothesis 2, there were nonsignificant correlations on most topicsthat were expected to show little interest group activity and conflict.
Inconsistent with Hypothesis 2, however, were nonsignificant correlations for twotopics expected to generate interest group arguments and conflict: ESOP-Financial,τ = –.04 (ns) and ESOP-Participation, τ = .15 (ns). Also, Plant Production andManufacturing Process Issues reached only marginal significance (τ = .23, p < .09).Apparently, these three topics did not elicit significant interest group arguments bynew outside directors, nor were these topics characterized by conflict within the board.Also inconsistent with Hypothesis 2 was a marginally significant correlation (τ = .25,p < .07) for Hog Procurement, a topic not hypothesized to generate interest grouparguments and conflict. This correlation was stronger than expected. Hog procurement(e.g., prices paid for hogs) was a critical issue for the firm because it involved the pricepaid for raw materials. This directly affected the financial position of the firm. Inrevisiting our board meeting transcripts, we found that this topic did not generatesubstantial interest group arguments, but it did generate conflict in the form ofdisagreements between executives (who defended their decisions about hog procure-ment) and both preexistent and new outside directors (who often criticized executives’decisions).
26 ORGANIZATIONAL RESEARCH METHODS
at SAGE Publications on April 20, 2015orm.sagepub.comDownloaded from
Statistical Technique for Hypothesis 3: Poisson Regression
Hypothesis 3 posited that executive directors were more active in board discussion,debate, and argumentation than were preexistent outside, new outside, or workerdirectors. Worker directors were expected to be the least active of the subgroups.Furthermore, we expected that the overall pattern of dominance by the executivesubgroup existed (a) even though the executive subgroup was small in terms of thenumber of directors, (b) even though the prevalence of topics of deliberation differedacross board meetings, and (c) even though some other subgroups were more activethan others on certain topics of deliberation.
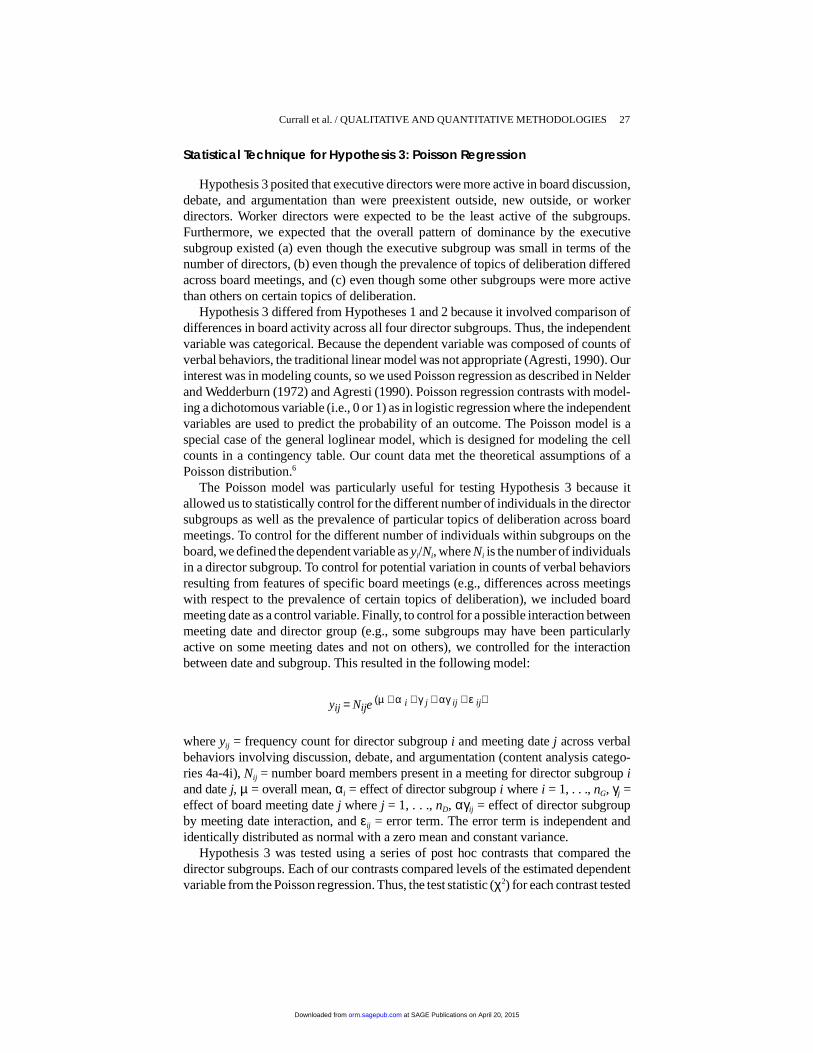
Hypothesis 3 differed from Hypotheses 1 and 2 because it involved comparison ofdifferences in board activity across all four director subgroups. Thus, the independentvariable was categorical. Because the dependent variable was composed of counts ofverbal behaviors, the traditional linear model was not appropriate (Agresti, 1990). Ourinterest was in modeling counts, so we used Poisson regression as described in Nelderand Wedderburn (1972) and Agresti (1990). Poisson regression contrasts with model-ing a dichotomous variable (i.e., 0 or 1) as in logistic regression where the independentvariables are used to predict the probability of an outcome. The Poisson model is aspecial case of the general loglinear model, which is designed for modeling the cellcounts in a contingency table. Our count data met the theoretical assumptions of aPoisson distribution.6
The Poisson model was particularly useful for testing Hypothesis 3 because itallowed us to statistically control for the different number of individuals in the directorsubgroups as well as the prevalence of particular topics of deliberation across boardmeetings. To control for the different number of individuals within subgroups on theboard, we defined the dependent variable as yi/Ni, where Ni is the number of individualsin a director subgroup. To control for potential variation in counts of verbal behaviorsresulting from features of specific board meetings (e.g., differences across meetingswith respect to the prevalence of certain topics of deliberation), we included boardmeeting date as a control variable. Finally, to control for a possible interaction betweenmeeting date and director group (e.g., some subgroups may have been particularlyactive on some meeting dates and not on others), we controlled for the interactionbetween date and subgroup. This resulted in the following model:
yij = Nije (µ + α i + γ j + αγ ij + ε ij)
where yij = frequency count for director subgroup i and meeting date j across verbalbehaviors involving discussion, debate, and argumentation (content analysis catego-ries 4a-4i), Nij = number board members present in a meeting for director subgroup iand date j, µ = overall mean, αi = effect of director subgroup i where i = 1, . . ., nG, γj =effect of board meeting date j where j = 1, . . ., nD, αγij = effect of director subgroupby meeting date interaction, and εij = error term. The error term is independent andidentically distributed as normal with a zero mean and constant variance.
Hypothesis 3 was tested using a series of post hoc contrasts that compared thedirector subgroups. Each of our contrasts compared levels of the estimated dependentvariable from the Poisson regression. Thus, the test statistic (χ2) for each contrast tested
Currall et al. / QUALITATIVE AND QUANTITATIVE METHODOLOGIES 27
at SAGE Publications on April 20, 2015orm.sagepub.comDownloaded from

H0: the frequency of response of executive directors = the frequency of response ofanother director group versus H1: the frequency of response of executive directors ≠the frequency of response of the other director group.
Poisson regression findings, presented in Table 8, indicated that the three predictorvariables were significant as shown by their χ2 values. Having estimated the dependentvariable accounting for possible confounding variables, Hypothesis 3 was tested usingpost hoc contrasts. The tests of contrasts are presented at the bottom of Table 8. Thesignificant χ2 values for contrasts indicated that the executive subgroup occupied asignificantly larger proportion of board discussion and debate than other subgroups,thereby supporting Hypothesis 3. Moreover, this relationship was found after we hadstatistically controlled for possible alternative explanatory factors concerning thenumber of directors within subgroups, the prevalence of certain topics across differentboard meetings, and the possibility that subgroups were particularly active on certaintopics.7
Discussion
In this demonstration article, we have advocated the application of quantitativeanalyses to data from participant observation research and have described a set ofmethodological procedures that can be used to combine qualitative and quantitativetechniques to study groups in organizational field settings. We explicated proceduresfor merging the richness of detail that is characteristic of qualitative data collectionwith the hypothesis evaluation advantage of statistical inference techniques. Our hope
Table 8Results From Poisson Regression and Tests of Contrasts
Log Ratio Statistics From Poisson Regressiona
df χ 2
Subgroup 3 517.10*b
Date 30 264.50*Subgroup × Date 90 240.02*
Contrast Results
Contrast df χ 2
H0: Executive = Preexisting outside 1 134.21*H0: Executive = New outside 1 410.71*H0: Executive = Workers 1 413.57*
Note. N = 31.a. Log ratio statistics from Poisson regression are from the sequential model, which shows resultsthat are sequentially determined beginning with the intercept. Each predictor in the model issequentially added, and the likelihood ratio statistic, χ2, is determined for each successive pair ofmodels.b. To maintain constancy in Type I error (α) across all three contrasts, α is .05/3 = .0167. Thus, anyp value below .0167 is significant.*p < .0001.
28 ORGANIZATIONAL RESEARCH METHODS
at SAGE Publications on April 20, 2015orm.sagepub.comDownloaded from

is that other researchers can adapt the procedures outlined in this article to suit theirown studies of groups in naturally occurring organizational settings.
The qualitative data we collected over a 5-year period gave a more vivid under-standing of group processes within the corporate board than would have been possibleusing other data collection techniques such as surveys or interviews of board members.Our decision to quantify our qualitative field notes, however, may be viewed as asomewhat unconventional way to treat qualitative data. Yet, by quantifying ourqualitative data, a methodological synergy was created between the two methodsthereby adding to the knowledge yield of our study in ways that reliance on purelyqualitative or quantitative techniques would not have provided. For example, in goingbeyond “thick description” of traditional qualitative analysis, we demonstrated the useof statistical techniques to conduct a univariate analysis regarding a change in a singlevariable over time, a bivariate relationship concerning the association between twovariables, and a multivariate analysis that used statistical control to eliminate thepotential effects of confounding variables. Statistical inference techniques allowed usto determine the probability of detecting relationships among variables by chance. Theuse of statistical control comprised the study’s most sophisticated quantitative analysisand enabled us to make stronger statements about associations between variables thanwould have been possible otherwise. This further strengthened the knowledge yieldof the study. Finally, the use of statistical inference techniques means that our findingscan be compared to future studies of corporate boards.
In terms of specific statistics, we used Cox-Stuart’s test for trend and Kendall’snonparametric correlation to demonstrate how nonparametric statistics such as thesecan be applied to count data on group processes such as ours. Poisson regressionenabled us to statistically control for different numbers of individuals in the directorsubgroups and the prevalence of particular topics of deliberation across board meetingsin our test of Hypothesis 3. Others have applied Poisson regression to firm-levelarchival data to statistically control for confounding variables (e.g., Zajac & Westphal,1996), yet our aim was to raise the visibility of such a modeling approach applied toresearch on group processes. Finally, to the best of our knowledge, our use of post hoccontrasts in conjunction with Poisson regression to test subgroup differences was thefirst application of it kind.
The Discovery-Justification-Discovery Cycle
A main contribution of the article is its combination of qualitative and quantitativemethods to emphasize both discovery (i.e., theory development) and justification (i.e.,theory evaluation) within a single study. Perhaps most important, the use of statisticalinference had the advantage of allowing us to support or disconfirm our hypotheses.Hypotheses 1 and 3 were clearly supported. Hypothesis 2 received some support, butcontrary to our expectations, we found that there were not significant amounts ofinterest group arguments and conflict in the board’s deliberations about the firm’sESOP. Also, we found a stronger than expected result on deliberations concerning HogProcurement. This surprising finding led us to revisit our qualitative transcripts, wherewe found that conflict was not due only to interest group arguments, but to criticismsof management decisions by outside (both preexistent and new) directors. Thus, withrespect to Hypothesis 2, qualitative data contributed to our thinking about the hypothe-
Currall et al. / QUALITATIVE AND QUANTITATIVE METHODOLOGIES 29
at SAGE Publications on April 20, 2015orm.sagepub.comDownloaded from
sis, quantitative analyses indicated that the hypothesis needed refinement, and ourqualitative data then were used a second time to interpret the analyses and reconcep-tualize the hypothesized relationship. This interplay of qualitative and quantitativeinformation constituted a discovery-justification-discovery cycle, which was particu-larly useful in developing the knowledge yield of our study. Research using only onetype of data would have been more limited to either discovery or justification.
It is worth noting that the distinction between discovery and justification canbecome blurred in a qualitative-quantitative study that combines participant observa-tion and inferential statistics. That is, although a strength of the participant observationmethod is its capacity to yield deep understanding based on the interpretative insightsof the observer, some degree of bias is inevitable in an observer’s interpretations. Ifthese interpretations are used as data upon which inferential statistics are based, theresearcher must acknowledge that a violation of statistical assumptions occurredbecause of bias in observer interpretation. (We did not use observer interpretativecomments as data in our statistical tests; we used only data based on verbatimstatements made by directors.) In sum, if combining observer interpretations andinferential statistics, discovery and justification are best seen as complementary modesof analysis; a strict distinction between the two cannot be claimed.
Contribution to Literature on Corporate Boards
In terms of the study’s contribution to literature on boards, collecting qualitativedata from inside the boardroom gave us a textured understanding of group processeswithin the board. This enabled us to refine our hypotheses in a way that would not bepossible without direct access to board meetings. Moreover, the participant observa-tion method of data collection provided information with which to decipher the actionsof board members; without an insider’s knowledge of board members, misconstrualof their actions would have been more likely. Finally, our use of statistical inferencetechniques facilitates the development of a cumulative body of theory-testing researchabout group processes inside the corporate boardroom.
Limitations
The methodological strategy we adopted for the present study had limitations. Aprimary limitation was the labor intensity of our approach. The data collection for thisstudy took 5 years and began with the opportunity to join the board of a majorcorporation. After data collection was finished, the coding, reliability checks, andrecoding of the transcripts took 5 years of regular painstaking work.
A second limitation was that this was a study of a single board. Although our focushad advantages (e.g., we achieved a deep understanding of the board’s patterns andtrends over time), the use of a single board raises questions about the generalizabilityof our results. Strictly speaking, our findings are generalizable only to other boardssimilarly made up of executive directors, outside directors, and employee directors. Apreliminary survey of such firms in the United States lists their number at 25 (Hunter,1998). There are reasons, however, that our study may have broader applicability toresearch on other boards. For example, the use of participant observation to study boardprocesses could be (and should be) used to study other boards. Furthermore, ourcontent analysis scheme could be used to code the verbal behaviors of directors in
30 ORGANIZATIONAL RESEARCH METHODS
at SAGE Publications on April 20, 2015orm.sagepub.comDownloaded from
other boards. At a minimum, our scheme could be used as a point of departure for otherresearchers who wish to develop their own behavioral coding system. Also, ourempirical findings may be applicable to other boards because the characteristics ofdirectors within our board (e.g., executive positions currently or formerly held,educational level) were similar to directors who serve on other boards. Last, the boardwe studied was facing a financial downturn. Many other manufacturing firms werefacing similar conditions in the early to mid-1980s when our study was conducted.Today, many boards face similar financial stresses.
As a final caution about our qualitative-quantitative method, it should be noted that,although previous research literature on boards of directors was the origin of ourtheoretical research questions, we used our qualitative field notes to sharpen ourtheoretical ideas. Because the field notes were the basis of frequency count data onwhich our statistical tests were conducted, there was not, strictly speaking, perfectseparation between development of theoretical ideas (and hypotheses) and data onwhich statistical tests were based. Although this could create a possible bias in favorof confirmation of hypotheses, we minimized such bias by establishing our hypothesesafter the content analysis scheme had been created yet prior to conducting statisticaltests used to evaluate the hypotheses. Also, if such bias had been the explanation forour statistical results, we would not have observed a partial disconfirmation ofHypothesis 2.
Combining Qualitative and Quantitative Methods:Implications for Graduate Training
As a final point, we believe that the merits of combining qualitative and quantitativemethods make a compelling argument for greater breadth of methods training forfuture researchers. In addition to traditional training regarding theory testing based onstatistical techniques, it seems appropriate for graduate programs in organizationstudies to place emphasis on tools that facilitate the discovery process, namely,developing new approaches to measurement, uncovering new constructs, or creatingnovel theoretical viewpoints from which to see organizations. This suggestion parallelsMcCall and Bobko’s (1990) belief that the question of “what to study” has receivedinsufficient attention in our training (see also Campbell, Daft, & Hulin, 1982). Coupledwith traditional statistics coursework, in-depth training concerning the discoveryprocess (e.g., qualitative observational techniques or case studies) has the advantageof enabling researchers to think fully about what types of research questions areinnovative, interesting, and practically relevant.
APPENDIXExcerpts From the Field Notes
Below is an excerpt from the field notes from a board meeting (October 21-22, 1981) at apoint where the company’s financial officer (BS) was giving his financial report to the board(board members are noted by initials and their positions are noted in brackets):
. . . BS: “In September we had a loss of $2.2 mill. That means that for the fourthquarter, we had a loss of $4.8 mill.” DC [outside director] asks about last year. [BSanswers]: “Last year we had a $3.48 mill profit due to $5 mill from workers. In 1979,
Currall et al. / QUALITATIVE AND QUANTITATIVE METHODOLOGIES 31
at SAGE Publications on April 20, 2015orm.sagepub.comDownloaded from

we had a $1.25 mill loss.” AF [outside director]: “September’s loss is unusually large.”BS says that $547,000 of loss is due to inventory. In September we had a 16% increasein processed sales, so we need some inventory because sales figures are increasing.HE [CEO]: “Cut-outs in September were worse than in August.”
Later in the same meeting, the issue of inventory came up again:
. . . EM [worker director to BS]: “Do you keep tight control on the supply inventory?We have found a 3-year supply of Cry-Vac bags in our place.” BS: “Sometimes peopleorder more than they should, or there may have been a special advantage—a specialprice—to make them order more than normal.” EM says a fellow worker wanted totake him on a tour to show him inventory but he didn’t feel it was his place to go.Said he almost called HE [CEO] but decided not to. EM: “We are paying 25% intereston borrowings, so if there is a 3-year lead time on supplies, is that really justified?”BF [outside director to BS]: “Look, you made a mistake and you might as well admitit.”
The following shows how verbal behaviors in the second part of the excerpt were codedaccording to individual, topic, and verbal contribution. The coding assignment is in bracketswith Verbal Contribution listed first followed by Topic.
. . . EM (worker director to BS): “Do you keep tight control on the supply inventory?[1c-9] We have found a 3-year supply of Cry-Vac bags in our place.” [1b-9] BS:“Sometimes people order more than they should, or there may have been a specialadvantage—a special price—to make them order more than normal.” [4a-9] EM saysa fellow worker wanted to take him on a tour to show him inventory but he didn’t feelit was his place to go. Said he almost called HE (CEO) but decided not to. [1b-9] EM:“We are paying 25% interest on borrowings, so if there is a 3-year lead time onsupplies, is that really justified?” [4d-9] BF (outside director to BS): “Look you madea mistake and you might as well admit it.” [4h-9]
Notes
1. An observer makes interpretive comments through his or her own perceptual lens.Therefore, bias is inevitable in interpretive comments. In the effort to retain the objectivity ofour data for hypothesis evaluation, we did not content analyze information in the observer’sinterpretive comments.
2. Among the various observational paradigms discussed by Adler and Adler (1994) (e.g.,formal sociology and dramaturgical sociology), the observational procedure used in the presentstudy was most closely akin to ethnomethodology. Compared to observations made from aninterpretive framework (e.g., dramaturgical sociology), ethnomethodologists seek data that aremore objective and less mediated by subjective inferences made by the interpretive researcher(Adler & Adler, 1994). Data collection techniques used by ethnomethodologists are designedto enable the researcher to examine data in detail after observation has been completed.Typically, data involve transcriptions of language, including the speech and pauses of conver-sations. Moreover, these forms of data are advantageous because they can be reexaminedrepeatedly by multiple researchers.
3. One category (5) was reserved for highly idiosyncratic verbal behaviors that occurredinfrequently and did not fit another category. These constituted only 1.3% of all verbalbehaviors.
4. Interrater reliability is interpreted as any other reliability estimate (P. Shrout, personalcommunication, December 8, 1997). Thus, Nunnally and Bernstein’s (1994, p. 265) guidelineof .70 for “modest” reliability for coefficient alpha works as well for interrater reliability. Onecan note that .70 means that about 70% of the observed variance is “true score” variance.
32 ORGANIZATIONAL RESEARCH METHODS
at SAGE Publications on April 20, 2015orm.sagepub.comDownloaded from
Generally, our interrater reliability results were similar to those obtained by Gersick (1989) whoshowed a range of reliability from .70 to 1.0.
5. Besides the Cox-Stuart test for trend, other tests for trend also exist. As discussed byConover (1980), assessment of adequacy of a nonparametric test of trend may be accomplishedby comparing it to its parametric counterparts under the same probabilities of Type I error(rejecting H0 when it is true, alpha) and Type II error (accepting H0 when it is false, beta). Thisis done by examining the asymptotic relative efficiency (ARE) of nonparametric versusparametric tests. The ARE is the ratio (in the limit) of the sample sizes required to maintain aconstant alpha and beta across both tests. The ARE of the Cox-Stuart test is .78 (i.e., the bestparametric test requires .78 times the number of observations as the Cox-Stuart test in order tomaintain the same alpha and beta levels). Two tests with greater ARE are Kendall’s τ, which isreferred to as the Mann test when one set of the paired observations is time or sequence. Anothertest is Spearman’s ρ, which is referred to as Daniel’s test for trend when one of the pairedobservations is time or sequence number. Both of these tests have an ARE of .98 but are not aswidely applicable as the Cox-Stuart test because an assumption of these tests is mutualindependence of the observations. We chose the Cox-Stuart test because it is unbiased andconsistent in a statistical sense, widely applicable, and requires a minimum of assumptions.
6. As pointed out by Haunschild (1994), some researchers prefer negative binomial regres-sion in place of Poisson regression. Negative binomial regression is not subject to Poissonregression’s assumption that the variance of the dependent variable is equal to its mean.Therefore, as a further check of our analysis, we also conducted negative binomial regression.The results of the Poisson regression and negative binomial regression were nearly identical.
7. We tested for a possible “observer effect” in the data, which could have arisen from theobserver’s presence inside the board. We reanalyzed the data by removing the observer. Theresults did not change.
References
Adler, P. A., & Adler, P. (1994). Observational techniques. In N. K. Denzin & Y. S. Lincoln(Eds.), Handbook of qualitative research (pp. 377-392). Thousand Oaks, CA: Sage.
Agresti, A. A. (1990). Categorical data analysis. New York: Wiley Interscience.Ancona, D. G., & Caldwell, D. F. (1992). Bridging the boundary: External activity and
performance in organizational teams. Administrative Science Quarterly, 37, 634-665.Anderson, C. A., & Anthony, R. N. (1986). The new corporate directors: Insights for board
members and executives. New York: John Wiley.Argote, L., & McGrath, J. E. (1993). Group processes in organizations: Continuity and change.
In C. L. Cooper & I. T. Robertson (Eds.), International Review of Industrial and Organ-izational Psychology, 8, 333-389.
Bales, R. F. (1988). A new overview of the SYMLOG system: Measuring and changing behaviorin groups. In R. B. Polley, A. P. Hare, and P. J. Stone (Eds.). The SYMLOG practitioner:Applications of small group research. New York: Praeger.
Bales, R. F., & Cohen, S. P. (1979). SYMLOG: A system for the multiple level observation ofgroups. New York: Free Press.
Barley, S. R. (1986). Technology as an occasion for structuring: Evidence from observations ofCT scanners and the social order of radiology departments. Administrative Science Quar-terly, 31, 78-108.
Bartunek, J. M., Bobko, P., & Venkatraman, N. (1993). Toward innovation and diversity inmanagement research methods. Academy of Management Journal, 36, 1362-1373.
Batstone, E., Ferner, A., & Terry, M. (1983). Unions on the board: An experiment in industrialdemocracy. Oxford: Basil Blackwell.
Currall et al. / QUALITATIVE AND QUANTITATIVE METHODOLOGIES 33
at SAGE Publications on April 20, 2015orm.sagepub.comDownloaded from
Bouchard, T. J. (1976). Field research methods: Interviewing, questionnaires, participantobservation, systematic observation, unobtrusive measures. In M. D. Dunnette (Ed.),Handbook of industrial and organizational psychology (1st ed., pp. 363-414). Chicago:Rand McNally.
Brennan, R. L., & Prediger, D. J. (1981). Coefficient kappa: Some uses, misuses, and alterna-tives. Educational and Psychological Measurement, 41, 687-699.
Campbell, J. P., Daft, R. L., & Hulin, C. L. (1982). What to study: Generating and developingresearch questions. Beverly Hills, CA: Sage.
Cohen, J. A. (1960). A coefficient of agreement for nominal scales. Educational and Psycho-logical Measurement, 20, 37-46.
Cohen, J. A. (1968). Weighted kappa: Nominal scale agreement with provision for scaleddisagreement or partial credit. Psychological Bulletin, 70, 213-220.
Conover, W. J. (1980). Practical nonparametric statistics (2nd ed.). New York: John Wiley.Cox, D. R., & Stuart, A. (1955). Some quick sign tests for trend in location and dispersion.
Biometrika, 42, 80-85.Creswell, J. (1994). Research design: Qualitative and quantitative approaches. Thousand Oaks,
CA: Sage.Daniel, W. (1990). Applied nonparametric statistics (2nd ed.). Boston: PWS-Kent.Demb, A., & Neubauer, F. (1992). The corporate board: Confronting the paradoxes. New York:
Oxford University Press.Forsyth, D. R. (1990). Group dynamics (2nd ed.). Pacific Grove, CA: Brooks/Cole.Gersick, C.J.G. (1988). Time and transition in work teams: Toward a new model of group
development. Academy of Management Journal, 31, 9-41.Gersick, C.J.G. (1989). Marking time: Predictable transitions in task groups. Academy of
Management Journal, 32, 274-309.Gold, R. L. (1958). Roles in sociological field observation. Social Forces, 36, 217-223.Goodstein, J., Gautam, K., & Boeker, W. (1994). The effects of board size and diversity on
strategic change. Strategic Management Journal, 15, 241-250.Guetzkow, H. (1950). Unitizing and categorizing problems in coding qualitative data. Journal
of Clinical Psychology, 6, 47-58.Hammer, T. H., Currall, S. C., & Stern, R. N. (1991). Worker representation on boards of
directors: A competing roles model. Industrial and Labor Relations Review, 44, 661-680.Hammer, T. H., & Stern, R. N. (1986). A yo-yo model of cooperation: Union participation in
management at the Rath Packing Company. Industrial and Labor Relations Review, 39,337-349.
Haunschild, P. (1994). How much is that company worth? Interorganizational relationships,uncertainty, and acquisition premiums. Administrative Science Quarterly, 39, 391-411.
Herman, E. S. (1981). Corporate control, corporate power. New York: Cambridge UniversityPress.
Hunter, L. W. (1998). Can strategic participation be institutionalized? Union representation onAmerican corporate boards. Industrial and Labor Relations Review, 51, 557-578.
Jick, T. D. (1979). Mixing qualitative and quantitative methods: Triangulation in action.Administrative Science Quarterly, 24, 602-611.
Jones, A. P., Johnson, L. A., Butler, M. C., & Main, D. S. (1983). Apples and oranges: Anempirical comparison of commonly used indices of interrater agreement. Academy ofManagement Journal, 26, 507-519.
Kendall, M. G. (1938). A new measure of rank correlation. Biometrika, 30, 81-93.Kirk, J., & Miller, M. L. (1986). Reliability and validity in qualitative research. Beverly Hills,
CA: Sage.Kosnik, R. (1987). Greenmail: A study of board performance in corporate governance. Admin-
istrative Science Quarterly, 32, 163-185.
34 ORGANIZATIONAL RESEARCH METHODS
at SAGE Publications on April 20, 2015orm.sagepub.comDownloaded from
Krippendorff, K. (1980). Content analysis. An introduction to its methodology. Beverly Hills,CA: Sage.
Larsson, R. (1993). Case survey methodology: Quantitative analysis of patterns across casestudies. Academy of Management Journal, 36, 1515-1546.
Lee, T. (1999). Using qualitative methods in organizational research. Thousand Oaks, CA:Sage.
Lorsch, J. W., & MacIver, E. (1989). Pawns or potentates: The reality of America’s corporateboards. Cambridge, MA: Harvard Business School.
Main, B. G., O’Reilly, C. A., & Wade, J. (1995). The CEO, the board, and executive compen-sation: Economic and psychological issues. Industrial and Corporate Change, 4, 293-332.
McCall, M. W., & Bobko, P. (1990). Research methods in the service of discovery. In M. D.Dunnette & L. M. Hough (Eds.), Handbook of industrial and organizational psychology(2nd ed., Vol. 1, pp. 381-418). Palo Alto, CA: Consulting Psychologists Press.
McCullagh, P., & Nelder, J. A. (1989). Generalized linear models. London: Chapman and Hall.McGrath, J. E., Martin, J., & Kulka, R. A. (1982). Judgment calls in research. Beverly Hills,
CA: Sage.Miles, M. B., & Huberman, A. M. (1994). Qualitative analysis: An expanded sourcebook.
Thousand Oaks, CA: Sage.Nelder, J. A., & Wedderburn, R. W. (1972). Generalized linear models. Journal of the Royal
Statistical Society, 135, 370-384.Nunnally, J., & Bernstein, I. (1994). Psychometric theory (3rd. ed.). New York: McGraw-Hill.Pedhazur, E. J., & Schmelkin, L. P. (1991). Measurement, design, and analysis: An integrated
approach. Hillsdale, NJ: Lawrence Erlbaum.Pettigrew, A. (1992). On studying managerial elites. Strategic Management Journal, 13,
163-182.Pettigrew, A., & McNulty, T. (1995). Power and influence in and around the boardroom. Human
Relations, 48, 845-873.Ross, R. S. (1989). Small groups in organizational settings. Englewood Cliffs, NJ: Prentice
Hall.Scott, W. A. (1955, fall). Reliability of content analysis: The case of nominal scale coding. Public
Opinion Quarterly, pp. 321-325.Scott, W. G., Mitchell, T. R., & Peery, N. S. (1981). Organizational governance. In P. C. Nystrom
& W. H. Starbuck (Eds.), Handbook of organizational design (pp. 135-151). New York:Oxford University Press.
Stevenson, C., & Cooper, N. (1997). Qualitative and quantitative research. The Psychologist:Bulletin of the British Psychological Society, 10, 159-160.
Strauss, A. (1987). Qualitative analysis for social scientists. Cambridge: Cambridge UniversityPress.
Sutton, R. & Hargadon, A. (1996). Brainstorming groups in context: Effectiveness in a productdesign firm. Administrative Science Quarterly, 41, 685-718.
Van Maanen, J. (1979). Reclaiming qualitative methods for organizational research: A preface.Administrative Science Quarterly, 24, 520-526.
Vance, S. C. (1983). Corporate leadership: Boards, directors, and strategy. New York:McGraw-Hill.
Westphal, J. D., & Zajac, E. J. (1997). Defections from the inner circle: Social exchange,reciprocity, and the diffusion of board independence in U.S. corporations. AdministrativeScience Quarterly, 42, 161-183.
Whyte, W. F. (1973). Street-corner society (3rd ed.). Chicago: University of Chicago Press.Zajac, E. J., & Westphal, J. D. (1996). Director reputation, CEO-board power, and the dynamics
of board interlocks. Administrative Science Quarterly, 41, 507-529.
Currall et al. / QUALITATIVE AND QUANTITATIVE METHODOLOGIES 35
at SAGE Publications on April 20, 2015orm.sagepub.comDownloaded from
Zander, A., Forward, J., & Albert, R. (1969). Adaptation of board members to repeated failureor success by their organization. Organizational Behavior and Human Performance, 4,56-76.
Steven C. Currall is assistant professor of management and psychology at the Jones Graduate School ofManagement at Rice University. He received his Ph.D. in organizational behavior from Cornell University.His research interests are in the areas of interpersonal and interorganizational trust, conflict and groupdecision making processes within corporate boards of directors, and research designs for integratingqualitative and quantitative methods.
Tove Helland Hammer is professor of organizational behavior in the New York State School of Industrialand Labor Relations at Cornell University. She received her Ph.D. in industrial and organizationalpsychology from the University of Maryland. Her research interests include the evaluation of employeeparticipation programs and forms of employee stock ownership, leadership effectiveness in trade unions,and the effects of management values on employment relations and organizational change. She is the editorof the Industrial and Labor Relations Review.
L. Scott Baggett is a research associate at the Jones Graduate School of Management and a doctoralcandidate in the Department of Statistics at Rice University.
Glen M. Doniger is a doctoral student in the Department of Psychology at New York University. He wasformerly a research assistant at the Jones Graduate School of Management, Rice University.
36 ORGANIZATIONAL RESEARCH METHODS
at SAGE Publications on April 20, 2015orm.sagepub.comDownloaded from