Embed Size (px)
Citation preview

www.wi-next.com
COMBINING PREDICTIVE ANALYTICSWITH INDUSTRIAL INTERNET-OF-THINGS TO DELIVER OPERATIONAL EXCELLENCE

DISTRIBUTED CONTROL IN THE HERITAGE FACTORY
In any industrial environment involving the production of goods, the organization’s goals must include optimizing the manufacturing process and managing its costs to ensure the widest margins that drive bottom line profitability. However, many latent issues bury hidden costs within the manufacturing process. Operational improvement within a manufacturing environment can reduce overall manufacturing costs, increase productivity, and lead to increased profitability.
While there may be many opportunities for improvement, there are three key aspects of optimization that can widen the margin:
IMPROVE PRODUCT QUALITY: Poor product quality increases overall costs in a number of ways. End products that do not meet desired specifications are not suitable for sale, and at best may be sold at a discount, may be repaired, and at worst must be discarded. Not only are there additional costs associated with repairing defective items, the need to repair introduces delays in the production cycle and affects delivery, and ultimately cash flow. Therefore it is critical to ensure consistent product quality and minimize defects.
INCREASE PRODUCTION CAPACITY AND CAPABILITIES: Part failures, missing raw materials, or errors in the process can lead to unexpected stoppages, which reduce the overall productivity and efficiency of automated production lines. Determining where and why stoppages occur allows preventative measures to be taken to reduce down time and increase production capacity.
OPTIMIZING THE PRODUCTION CYCLE: As opposed to unexpected stoppages, there are going to be periods in which the production lines are not operating, whether that is for scheduled maintenance, cleaning, or set-up/format changes for switching items to be produced. Better scheduling of known downtimes can also improve productivity and throughput.
22
Achieving the desired levels of optimization requires visibility into granular details of the manufacturing processes. Finding impediments to productivity is just the first step in identifying and remediating their root causes.
Few, enlightened companies use six-sigma and lean manufacturing techniques to determine where defects are introduced and where product quality is diminished: however these techniques are quite complex to learn and apply, besides they often show the lack of the right process KPIs, therefore the durability of the improvement in time is challenged.
This paper considers opportunities for proactively identifying leading indicators of decreased productivity that can be preemptively addressed to reduce unexpected stoppages, improve overall equipment effectiveness, and continuously increase overall productivity.
3
IMPROVING PRODUCTIVITY AND QUALITY:STATISTICAL PROCESS CONTROLThere are methods used to prevent diminished productivity and poor product quality from impacting the bottom line. Many of these approaches measure overall equipment effectiveness and the quality of produced items but require continuous monitoring. Some examples of these types of analysis include:
PROCESS ORDER MANAGEMENT. This analysis provides views of the entire end-to-end activity from the time that an order was made, through the planning stages for production, the actual time for production, and expected completion of manufacturing and the ability to deliver the product. This analysis tracks the sched-uled start time, the times for production, any issues related to inventory of raw materials, delays associated with shift switchovers, and other typical delays
SETUP AND CHANGEOVER MONITORING. For companies whose industrial environments are used for a wide range of materials, the same machines are often used for different production runs, and must be properly cleaned and reconfig-ured before each run. Delays in setup and changeover times introduce production delays, so moni-toring the efficiency of these processes can help highlight opportunities for time savings.
DOWNTIME MONITORING. This process identifies and tracks stoppage events such as part failures, production faults, or shutdowns associated with environmental risks (such as high temperatures that would impact product quality).
PRODUCT QUALITY MONITORING. Defined key performance indicators (KPIs) associated with the quality of the product can be meas-ured. This includes numbers of items whose characteristics vary from predefined specifications (such as package volume, item weight, or color of the product).
OVERHEAD COSTS. This can be reflected in terms of variables such as power usage, scrap, waste, unexpected repairs, and the cost of fixing low quality items, among others.
Many organizations employ the concepts of statistical process control (SPC) as way to detect changes in a process or its outcomes over time. SPC is a fundamental component of conventional quality improvement initiatives. This technique is employed in measuring aspects of quality of a process or a product over time to gain insight into the differences between expected, common variations, and the unexpected special variations, and produces control charts that represent the behavior of a process over time and highlight the occurrence of anomalous events as well as help in ensuring process stability and predictability.
4
GOING BEYOND SPCThe theory behind statistical process control is that there is an expectation of variance associated with any process. A process is stable when the faults are related to chance events and lead to results that can be easily remedied, and that the degree of variation is essentially predictable. Observing a process and evaluating the occurrence of faults and effects over time allows one to determine when the number of errors exceeds the expected degree of variance means that the process is unstable, and that there are real issues that need to be identified and addressed.
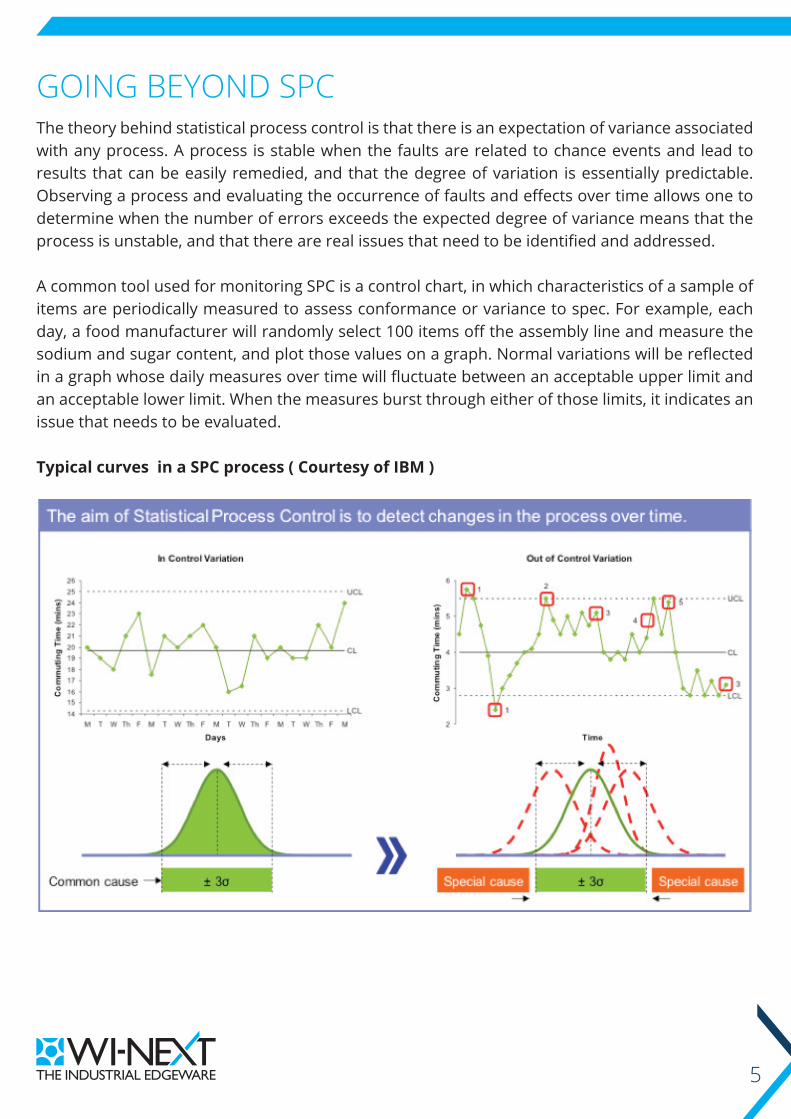
A common tool used for monitoring SPC is a control chart, in which characteristics of a sample of items are periodically measured to assess conformance or variance to spec. For example, each day, a food manufacturer will randomly select 100 items off the assembly line and measure the sodium and sugar content, and plot those values on a graph. Normal variations will be reflected in a graph whose daily measures over time will fluctuate between an acceptable upper limit and an acceptable lower limit. When the measures burst through either of those limits, it indicates an issue that needs to be evaluated.
Typical curves in a SPC process ( Courtesy of IBM )
5
When there are a large number of data points in a control chart that are outside the scope of the control limits, it means that the process is very unstable, which may indicate root cause issues that need to be reviewed and addressed. SPC is a reasonable method of identifying process problems when the environment is generally unstable. Yet, as environments are improved, normal statistical variance in measures are not unexpected, and these statistical anomalies are not necessarily indicative of a real process issue.
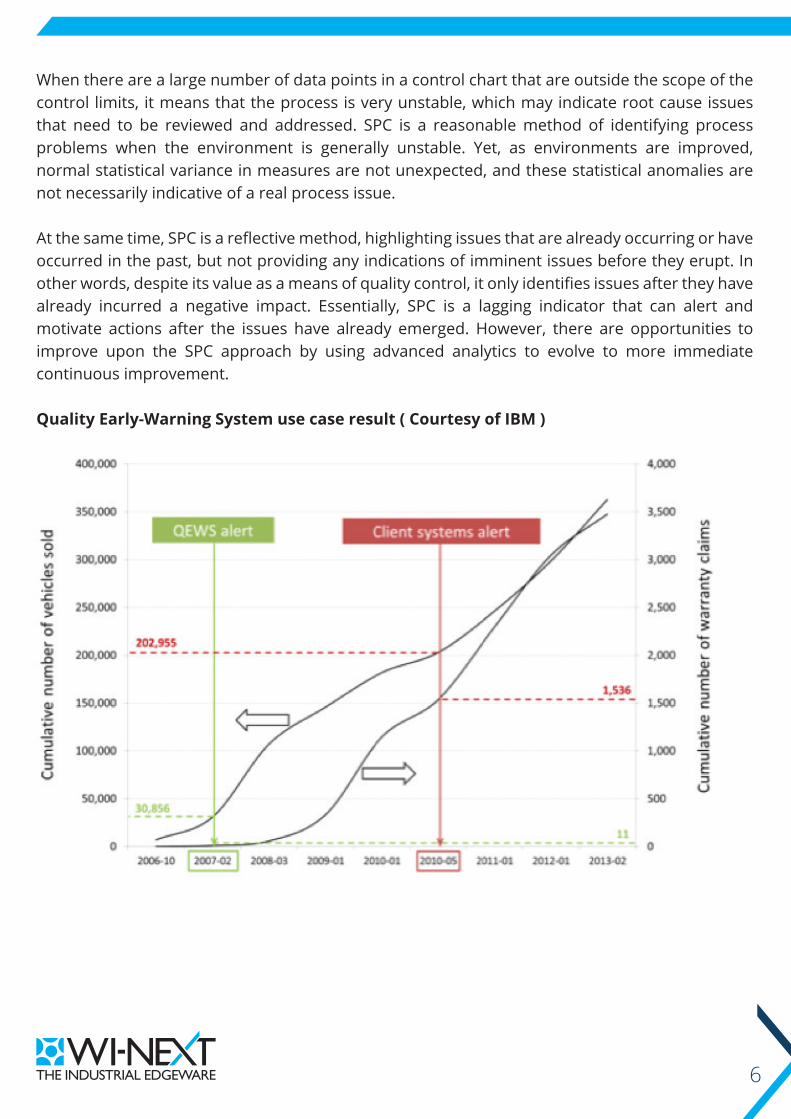
At the same time, SPC is a reflective method, highlighting issues that are already occurring or have occurred in the past, but not providing any indications of imminent issues before they erupt. In other words, despite its value as a means of quality control, it only identifies issues after they have already incurred a negative impact. Essentially, SPC is a lagging indicator that can alert and motivate actions after the issues have already emerged. However, there are opportunities to improve upon the SPC approach by using advanced analytics to evolve to more immediate continuous improvement.
Quality Early-Warning System use case result ( Courtesy of IBM )
6

PREDICTIVE ANALYTICS IN THE MANUFACTURINGENVIRONMENT
Root cause analysis of identified control variances enables you to identify the sources of productivity degradation, but only after the impacts have already occurred. It would be significantly preferred to identify those root issues as they happen and address them right away, long before their negative affects propagate across the industrial environment. An emerging approach is to use predictive analytics as a way of identifying potential impediments to optimal production capacity and product quality before they erupt and fester, and adapting prescriptive techniques to trigger actions to foster continuous machine uptime.
This “early-warning system” relies on continuously streaming device data (such as time-stamping when the device is active, duration, power usage, ambient temperatures, air quality, or device productivity) to a centralized server. This server runs applications using analytical models to identify collective machine and device behavior patterns common to known productivity or quality issues, as well as ways that environmental characteristics affect the efficiency of machine components. Examples include issues like unexpected stoppages, increased time to change over a production line, unplanned downtime, part failure, or product quality variations.
Predictive analytics supports two different facets of the process: discovery of risk patterns, followed by instituting controls to detect imminent issues. Simply stated, once these analytics applications have access to time-series data from a multitude of intelligent machines, they evaluate historical event streams occurring prior to undesired circumstances to identify sentinel events and sequences that are indicative of potential issues.
These patterns are then integrated with real-time stream analysis to monitor the data communicated across the intelligent factory. When sentinel event or sequence is seen, an alert can be generated to notify an individual to take some preventative measures, thereby allowing quicker problem identification and resolution. In some cases, the remedy can be automatically triggered, further reducing the total costs.
7
RETROFITTING THE MANUFACTURING ENVIRONMENT WITH WI-FI ENABLED SENSORSSupporting this solution requires two key infrastructure components. The first is using machinery with sensors and communications to continuously monitor and communicate measurements to a centralized server. The second is the integration of predictive and prescriptive analytics applications to consume the streamed data, devise the appropriate models, and to deploy distributed controls across the industrial enterprise.
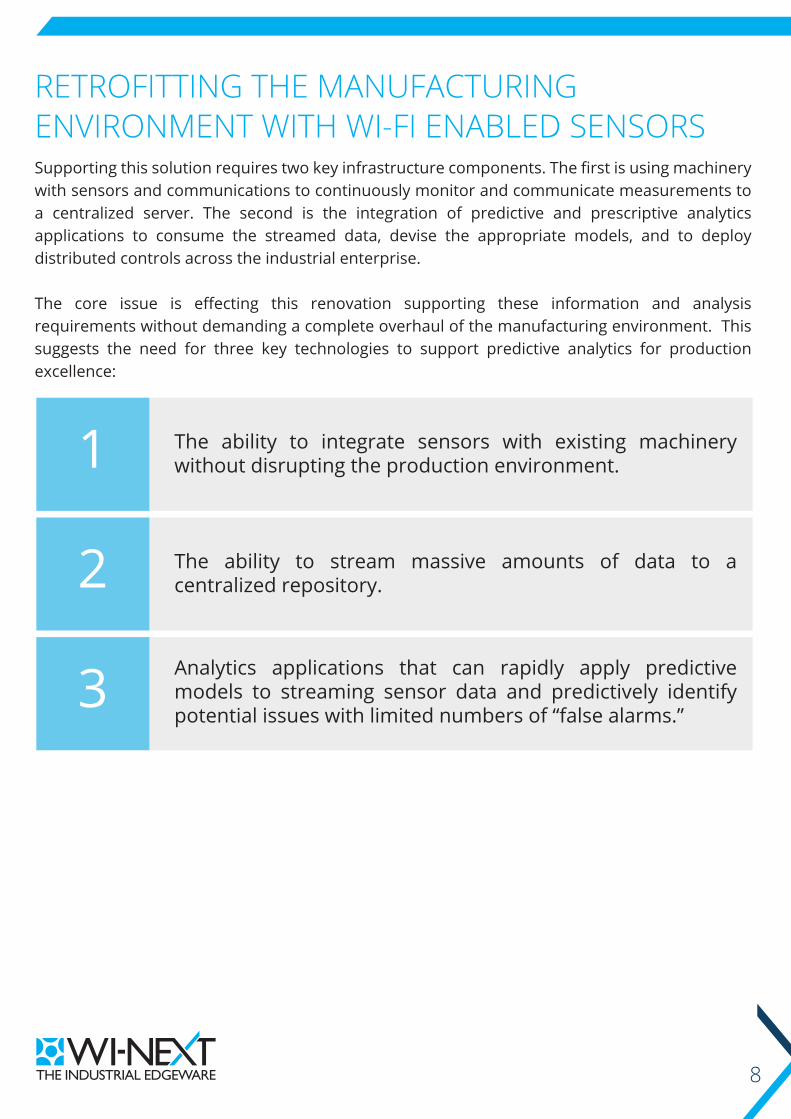
The core issue is effecting this renovation supporting these information and analysis requirements without demanding a complete overhaul of the manufacturing environment. This suggests the need for three key technologies to support predictive analytics for production excellence:
8
Analytics applications that can rapidly apply predictive models to streaming sensor data and predictively identify potential issues with limited numbers of “false alarms.”
The ability to stream massive amounts of data to a centralized repository.
The ability to integrate sensors with existing machinery without disrupting the production environment.1
2
3
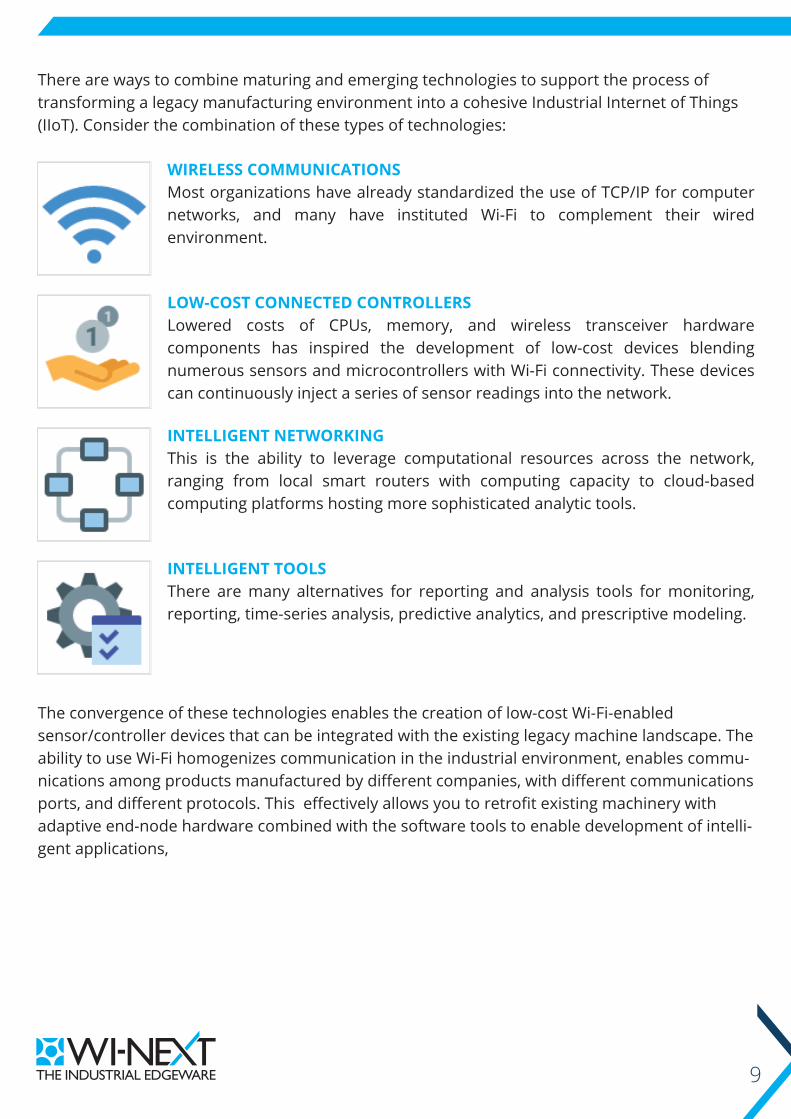
There are ways to combine maturing and emerging technologies to support the process of transforming a legacy manufacturing environment into a cohesive Industrial Internet of Things (IIoT). Consider the combination of these types of technologies:
The convergence of these technologies enables the creation of low-cost Wi-Fi-enabled sensor/controller devices that can be integrated with the existing legacy machine landscape. The ability to use Wi-Fi homogenizes communication in the industrial environment, enables commu-nications among products manufactured by different companies, with different communications ports, and different protocols. This effectively allows you to retrofit existing machinery with adaptive end-node hardware combined with the software tools to enable development of intelli-gent applications,
9
WIRELESS COMMUNICATIONS Most organizations have already standardized the use of TCP/IP for computer networks, and many have instituted Wi-Fi to complement their wired environment.
LOW-COST CONNECTED CONTROLLERS Lowered costs of CPUs, memory, and wireless transceiver hardware components has inspired the development of low-cost devices blending numerous sensors and microcontrollers with Wi-Fi connectivity. These devices can continuously inject a series of sensor readings into the network.
INTELLIGENT NETWORKING This is the ability to leverage computational resources across the network, ranging from local smart routers with computing capacity to cloud-based computing platforms hosting more sophisticated analytic tools.
INTELLIGENT TOOLS There are many alternatives for reporting and analysis tools for monitoring, reporting, time-series analysis, predictive analytics, and prescriptive modeling.
PUTTING IT ALL TOGETHERIn summary, the future approach to increased productivity and quality control leverages an Industrial Internet of Things with predictive and prescriptive analytics tools. Not only will this approach help to generally improve operational excellence, it can help minimize machine downtime, shrink operating costs, lengthen machine and part life, improve Overall Equipment Effectiveness, as well as help monitor product parameters to ensure acceptable levels of product quality.
Should you be interested in adopting a technology solution that can provide these desired effects, the first step is identifying vendor partners who can deliver the end-to-end solution, comprising:
Real-time sensors for device monitoring that can be retrofitted to existing machinery.
Easy to install and maintain end node components comprising a small footprint with the ability to collect and share streaming sensor data.
Centralized server applications that can ingest and manage data from massive numbers of streaming data sources.
Information presentation methods such as real-time dashboards and remote asset management.
Intelligence embedded within the components of the network, from the end nodes, through the edge nodes, to the servers.
Predictive analytic models for quality monitoring, asset health, operational process monitoring, machine utilization and effectiveness, etc.
Automation of alerts and automated triggers for remediation.
As these predictive analytics application demonstrate value, the deployment is bound to grow, so it is also important to consider alternatives that are amenable to extensibility, scalability, and most importantly, deliver a complete package with a clear benefits to the business.
10

11
ABOUT THE AUTHORDavid Loshin, president of Knowledge Integrity, Inc, (www.knowledge-integrity.com), is a recognized thought leader and expert consultant in the areas of analytics, big data, data governance, data quality, master data management, and business intelligence.
Along with consulting on numerous data management projects over the past 15 years, David is also a prolific author regarding business intelligence best practices, as the author of numerous books and papers on data management, including the recently published “Big Data Analytics: From Strategic Planning to Enterprise Integration with Tools, Techniques, NoSQL, and Graph,” the second edition of “Business Intelligence – The Savvy Manager’s Guide,” as well as other books and articles on data quality, master data management, big data, and data governance.
David is a frequent invited speaker at conferences, web seminars, and sponsored web sites and channels including www.searchBusinessAnaytics.techtarget.com, and share additional content at his notes and articles at www.dataqualitybook.com.
David can be reached at [email protected], or at (301) 754-6350.

[email protected] @winextcom
ITALY OFFICEPiazzale Biancamano 8, 20121 Milano - Italy Ph. +39 02 62032044
NOTE© 2015 Wi-NEXT. All rights reserved. This document may be reproduced in whole but not in part. The information contained in this document is subject to change without notice and is made available in good faith without liability on the part of Wi-NEXT. All trademarks acknowledged.
CONTACTS:
US OFFICE530 Lytton Avenue, 94301 Palo Alto, California USA Ph. +1 (650) 617-3491