Embed Size (px)
Citation preview
Combined Space and Water CO2 Heat Pump SystemPerformance Research
Final Report
Bonneville Power AdministrationTechnology Innovation Project 326
Organization
Washington State University –WSU Energy Program in Olympia, WA
Co-SponsorsAvista Corp.
The Energy Trust of OregonNorthwest Energy Efficiency Alliance
Puget Sound EnergyTacoma Public Utilities
Sanden International USA
Prepared by
Ken Eklund and Adria Banks, WSU Energy Program
Ben Larson and Michael Logsdon, Ecotope, Analysis Consultant and Reviewer
360-956-2019, [email protected]
Publication Date: September 30, 2016WSUEEP15-023, Rev. 11-2016

i
ContentsA Technology Innovation Project Report............................................................................................iv
Acknowledgements.................................................................................................................................. ivAbstract .................................................................................................................................................... iv
Executive Summary............................................................................................................................1Introduction ......................................................................................................................................2Basis for Combined Space and Water Heating Experiment ..................................................................3Field Study.........................................................................................................................................5
Description ................................................................................................................................................5Site Selection......................................................................................................................................... 5Code Issues and Solutions.....................................................................................................................5System Design and Installation.............................................................................................................6Challenges in Monitoring......................................................................................................................7
Field Study Details..................................................................................................................................... 8Site Summaries ..................................................................................................................................... 8
Monitoring Setup ...................................................................................................................................... 9Field Study Data Analyses ................................................................................................................10
Domestic Hot Water ...........................................................................................................................10Space Heat ..........................................................................................................................................11Overall System Efficiencies .................................................................................................................11Space and Water Heating Efficiencies ................................................................................................11
Field Study Results ...........................................................................................................................12Daily DHW Use by Site ............................................................................................................................13Daily Average Outside Air Temperature by Site .....................................................................................13Daily Heat Pump Energy Use (kWh) by Site ............................................................................................13Daily Auxiliary Heat Energy Use (kWh) by Site .......................................................................................15Daily Field Energy Factor by Outside Air Temperature .........................................................................16Energy Use ..............................................................................................................................................17
Issues Impacting System Performance ..............................................................................................19Defrost ....................................................................................................................................................19Power-Out Freeze Protection .................................................................................................................19Capacity...................................................................................................................................................20Taco X-Block Programming .....................................................................................................................22Destratification .......................................................................................................................................23Cross Flow ...............................................................................................................................................25Auxiliary Heaters .....................................................................................................................................29Preheating Cold Water............................................................................................................................30
ii
Combined Space and Water Heating Lab Test ...................................................................................31Introduction ............................................................................................................................................31Test Methods ..........................................................................................................................................32
Conclusion.......................................................................................................................................35Recommendations ...........................................................................................................................36References.......................................................................................................................................37Appendix A: Laboratory Assessment...................................................................................................1Appendix B: Climate-Destroying Refrigerants .....................................................................................1
TablesTable 1. Heating Zones of Ten Test Sites ...................................................................................................... 8Table 2. Test Site Characteristics ..................................................................................................................8Table 3. Measured Flow and Average Temperature Values Used to Calculate System Loads...................11Table 4. Average Daily Values for Heating (H) and Non-heating (NH) Seasons for Select Sites.................16Table 5. Energy Inputs by Function.............................................................................................................17Table 6. Performance of Each System ........................................................................................................21Table 7. Recommended X-Block Programming for Hydronic Heat Pump at Three Locations....................22Table 8. Performance Impacted by Cross Flow...........................................................................................28Table 9. Performance Predictions by Climate.............................................................................................28Table 10. Auxiliary Heat Analysis ................................................................................................................29Table 11. Performance Predictions by Climate...........................................................................................34
FiguresFigure 1. Hot Water Load During 9-Day Below-freezing OATs – Montana Site............................................3Figure 2. Percentage of Time HPWH On/Off During Cold Weather Period..................................................4Figure 3. Ability of HPWH to Deliver Hot Water at Setpoint Temperature ..................................................4Figure 4. Schematic of the Combined Space and Water Heating System ....................................................6Figure 5. Diversion Fitting .............................................................................................................................7Figure 6. Field Monitoring Setup ................................................................................................................10Figure 7. Daily Tempered Water Flow ........................................................................................................14Figure 8. Daily Average OAT........................................................................................................................14Figure 9. Daily Heat Pump Energy Use by Site............................................................................................15Figure 10. Daily Auxiliary Heat Energy by Site ............................................................................................15Figure 11. Daily Field Energy Factor (including freeze protection).............................................................16Figure 12. Daily Heat Pump Electricity Usage .............................................................................................20Figure 13. Auxiliary Electricity Use per Day ................................................................................................21Figure 14. Impact of Water Temperature on Heat Transfer.......................................................................23Figure 15. Impact of Water Temperature on COP ......................................................................................24Figure 16. System Schematic with Cross Flow Dynamic Superimposed.....................................................25Figure 17. Progressive Temperature Increases at Succeeding Tank Levels as Heating Cycle Progresses ..26Figure 18. System Temperatures and Operation at Site 9 on One Day in May 2016 .................................27
iii
Figure 19. Tank Installed .............................................................................................................................29Figure 20. Average Cold Water Supply Temperature in Bellingham, WA (mean = 77.8°F) ........................30Figure 21. Illustration of Thermocouples Placed in Tank to Examine Tank Stratification ..........................32Figure 22. Space Heat Demand Profile .......................................................................................................33Figure 23. Combined Space and Water Heating Test Demand Profile .......................................................33
AbbreviationsAC alternating currentASHRAE American Society of Heating, Refrigerating and Air-Conditioning EngineersBPA Bonneville Power AdministrationBtu British thermal unitCO2 carbon dioxideCOP coefficient of performanceDOE U.S. Department of EnergyDHW domestic hot waterDR demand responseEF energy factorER electric resistanceFEF Field Energy FactorGPD gallon per dayGPM gallons per minuteGWP Global Warming PotentialHFC hydrofluorocarbonsHPWH heat pump water heaterHSPF Heating Seasonal Performance FactorkWh kilowatt hourNEEA Northwest Energy Efficiency AllianceNSH NEEA's Next Step Home ProgramOAT outside air temperaturesPNNL Pacific Northwest National LaboratoryPSI pound per square inchSEEM Simple Energy and Enthalpy ModelTIP Technology Innovation ProgramUL Underwriters LaboratoryWSU Washington State UniversityXPB Heat Exchange Pump Block
iv
A Technology Innovation Project ReportThe research described in this report was funded by Bonneville Power Administration (BPA) to:
• Assess the potential for emerging technologies, and• Provide for development of those technologies to increase the efficiency of electricity use and
provide other benefits, such as capacity reduction and demand response services.
BPA is undertaking a multi-year effort to identify, assess, and develop emerging technologies withsignificant potential for contributing to the goals of efficiency, capacity reduction, demand response,and climate change remediation.
Neither Washington State University (WSU) nor BPA endorse specific products or manufacturers. Anymention of a particular product or manufacturer should not be construed as an implied endorsement.The information, statements, representations, graphs, and data presented in these reports are providedas a public service. For more reports and background on BPA’s efforts to “fill the pipeline” withemerging, energy-efficient technologies, visit Energy Efficiency’s Emerging Technology (E3T) website athttp://www.bpa.gov/energy/n/emerging_technology/.
Ken Eklund is the Building Science and Standards Team Lead for the WSU Energy Program. His backgroundincludes research organization and management spanning 40 years in the energy-efficiency field. His workat WSU includes facilitating and coordinating staff involved in building science research, and developingand implementing research projects like the current one, which leverages the experience and capabilitiesof WSU staff and of skilled subcontractors – all blended into a collaborative team.
AcknowledgementsThis project was greatly helped by the management of Janice Peterson, Project Manager, and JamesHillegas-Elting, COTR. WSU staff David Hales, monitoring expert, Adria Banks, analyst, and MelindaSpencer, editor, were key to the project success, together with Ecotope’s Ben Larson and MichaelLogsdon. Mr. Larson managed the lab test at Cascade Engineering Services, and analyzed and reportedthe data. Special thanks to Mark Jerome of CLEAResult who is the guiding light at all system installations.Thanks to Thomas Anreise and Trevor Frick of CLEAResult for their support in finding sites, working withbuilders, and providing heat loss analysis for candidate homes. Thanks also to the utility partnerrepresentatives: Bruce Carter, Tacoma Power; Fred Gordon, ETO; Tom Lienhard, Avista; and RemHusted, PSE. And great appreciation goes to Charlie Stephens at NEEA for providing support for siterecruitment, monitoring installation and maintenance, and system optimization at each site. Thanks alsoto John Miles of Sanden and Dave Sweet of Taco for their engagement and expertise.
AbstractThe CO2 refrigerant, split-system heat pump water heater was evaluated both in lab tests and in 10 new,high-efficiency homes representing the three heating zones in the Pacific Northwest. This technologyserved as the heat source in a combined space and water heating system concept design. This reportincludes both the lab and the field test results, as well as the data and experience collected after thehomes were built. This is a promising technology; if optimized it can be part of a comprehensive, lowclimate impact, space and water heating solution for the Pacific Northwest.
1
Executive SummaryThis report was prepared for Technology Innovation Project (TIP) 326 conducted by Washington StateUniversity (WSU) and funded by Bonneville Power Administration (BPA). The research created aprototype combined space and water heating system using a CO2 refrigerant split system heat pumpwater heater (HPWH) manufactured by Sanden International (Sanden) and other commercially availablecomponents. The system was tested in both lab and field studies. This report describes the research andanalysis, delivers results, and offers conclusions and recommendations.
The field study included 10 sites located in all three regional heating climate zones. These new low-loadhomes were primarily recruited through the Northwest Energy Efficiency Alliance’s (NEEA) Next StepHome (NSH) program, and most were built during the project.
The field tests were a voyage of discovery. The cold weather sites revealed defrost and capacity issues.In response, the manufacturer redesigned the split system heat pump and offered a unit with over twicethe capacity for cold climates and higher-load homes. After the first site, back-up auxiliary tanks wereabandoned in favor of on-demand electric heaters—this decision is now being revisited due to issueswith the demand heaters. System control issues plagued system operation until the standardprogramming designed for condensing gas boilers was customized for hydronic heat pumps. Near theend of the project, cross flow of hot water to the tank inlet from the tempering valves was discoveredand suspected of contributing to poor system efficiency at most sites.
The lab test protocol was developed in the context of the first site system design, and includedquestions arising from that design process. The most important questions were the way in which watershould be returned from the heating system to the storage tank and the impact of high- and low-temperature return water on system performance.
The preliminary lab test results (provided in Appendix A) showed that low-temperature water should bereturned to the bottom of the tank. Three systems were re-plumbed to implement this change and twosystems in progress were plumbed that way. The other five systems retained the original plumbing.
In addition, the lab test recommended that the best heat distribution systems are low temperature, andthat storage tanks for combined split systems should be increased to 120 gallons with multiple ports forreturn water of different temperatures.
The research found major issues in installation that must be solved for basic system functionality,Including:
• Heat pump capacity—not including auxiliary heat—must match design load,• X-Block programming must be modified to optimize hydronic heat pump performance,• Tank stratification must be maintained, and• Cross flow at the tempering valve must be eliminated to allow proper heat pump function.
The system created and tested in this project works for homes with design loads within the heat pumpcapacity. It is not a solution for cold climates or higher-load homes in other climates. A higher-capacityCO2 heat pump is needed for these situations.

2
IntroductionThis is the final report on the Washington State University (WSU) Energy Program research into theperformance of CO2 refrigerant heat pumps used for combined space and water heating in high-efficiency new homes. The research was funded by the Bonneville Power Administration (BPA) throughits Technology Innovation Program (TIP). The equipment tested in this study was manufactured bySanden International in Australia.
This research is based on previous research into CO2 refrigerant heat pump technology conducted byWSU as TIP 292, which demonstrated the ability of the system to provide hot water to a large familyduring extremely cold weather while operating only 25% of the time. This capacity was corroboratedduring the demand response (DR) testing under TIP 302 at Pacific Northwest National Laboratory (PNNL)Lab Homes Test Center. The tests used an unusually high daily draw of 130 gallons, and the split systemwas able to meet the demand while turned off for up to 12 hours.
This research consisted of a field study and lab test focused specifically on combined space and waterheating in homes with design load temperatures within the capacity of the heat pump where possible.At the coldest sites, the load was within the combined capacity of the heat pump and auxiliary heat. Thelab test took place at Cascade Engineering Services and was conducted by Ecotope, Inc.
Because of the long timeline needed to build the homes, site recruitment began as soon as the projectstarted on October 1, 2014 and continued until June 2015. Multiple leads were pursued to obtain the sixsites proposed for the field study, resulting in a total of ten sites. Of these, seven were located in thecoastal climate zone; one in the cold inland zone; and two in the very cold, mountainous zone. The siteswere selected primarily from builders participating in NEEA’s Next Step Home (NSH) program. WSUcoordinated the development of engineering and monitoring plans by the project team, which includedWSU, CLEAResult, NEEA, and Ecotope.
The lab test was delayed until the project design choices were clear. It was then used to address theresearch questions defined in the project proposal, and to obtain data on alternative design choices andtheir performance implications. The test results impacted the system installation at the two last homesconstructed, and at the three homes that were retrofitted to implement the findings on heating loopreturn water configuration. Five homes retained the original configuration for heating loop return.
The project succeeded in:• Developing a workable design for combined systems,• Identifying system operation, distribution and heat pump equipment issues,• Collecting sufficient data to obtain basic operating characteristics of the projects,• Identifying key variables, and• Defining development opportunities and design recommendations.
The region desperately needs a natural refrigerant solution for space and water heating. Every heatpump or heat pump water heater (HPWH) installed with climate-destroying refrigerants is a step in thewrong direction (described further in Appendix B). A solid set of natural refrigerant solutions must bedeveloped and implemented.
3
Basis for Combined Space and Water Heating ExperimentThis research is based on the performance of the CO2 refrigerant heat pump documented as noted in:
Lab and field tests done under TIP 292: Laboratory Assessment of Sanden GAU Heat PumpWater Heater (Larson, September 2013).
Performance of HPWHs: Advanced Heat Pump Water Heater Final Report (Eklund and Banks,December 2015).
Controlled field tests performed by PNNL and lab tests conducted by Ecotope for TIP 302 tostudy the demand response (DR) performance of these systems while they functioned asHPWHs: Demand-Response Performance of Sanden HPWH (Sullivan, July 2015).
In these studies, specific findings indicated the technology had the capacity to provide heat to end useswhile also meeting a substantial hot water load.
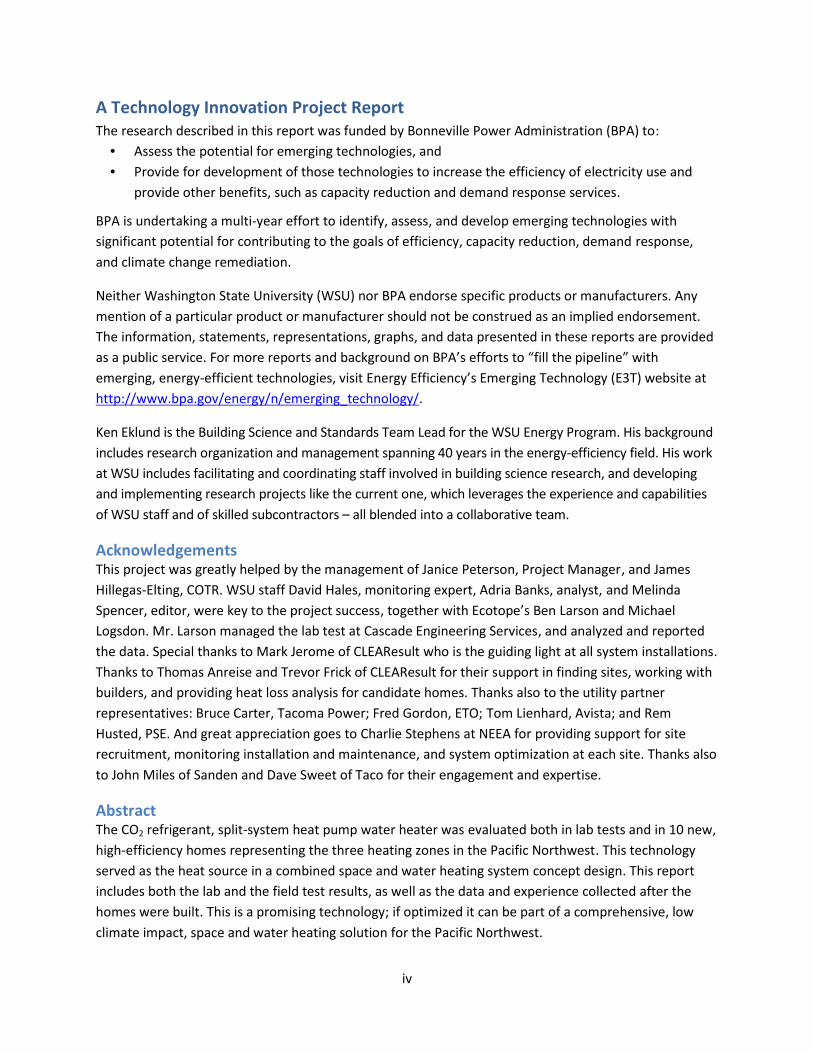
In the original research under TIP 292, the specific finding was a very cold nine-day period at theMontana site when the outside air temperature (OAT) remained almost entirely below freezing andwent as low as -16.5°F. The hot water load consisted of a family of four, including two teenagers, whotake an average of 22 showers per week. Figure 1 shows this period. The top graph is the energy use bythe system and when it was operating; the bottom graph shows the OAT (including total daily temperedwater use along the x-axis) during this period, showing that compressor use was fairly regular.
Figure 1. Hot Water Load During 9-Day Below-freezing OATs – Montana Site
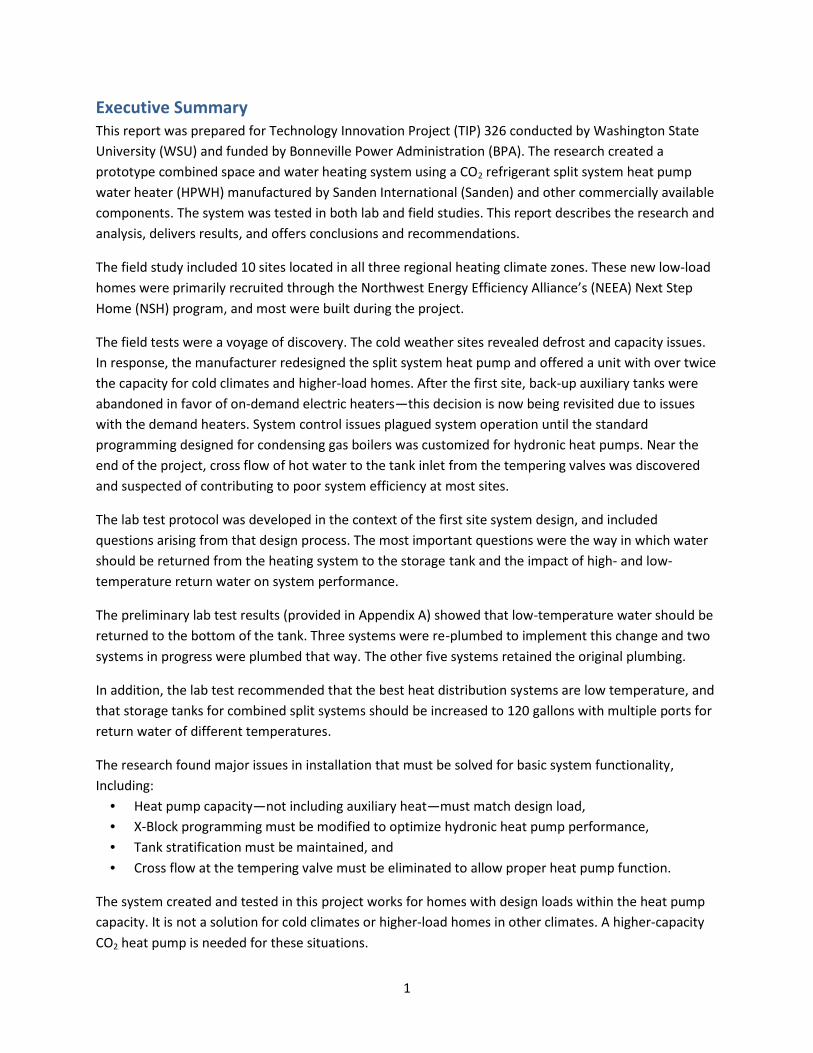
It would seem that a system drawing all of the heat for this end use from this cold air source would beoperating frequently. Figure 2 answers this question by showing the percentage of time the system wason versus the time it was off. The tall bar represents the 75% of the nine-day period when the heatpump was not operating, suggesting that the heat pump could be providing heat for another use. Thiswas the first solid evidence that the system could serve as a combined space and water heating systembecause it has this heating capacity even during very cold weather.
4
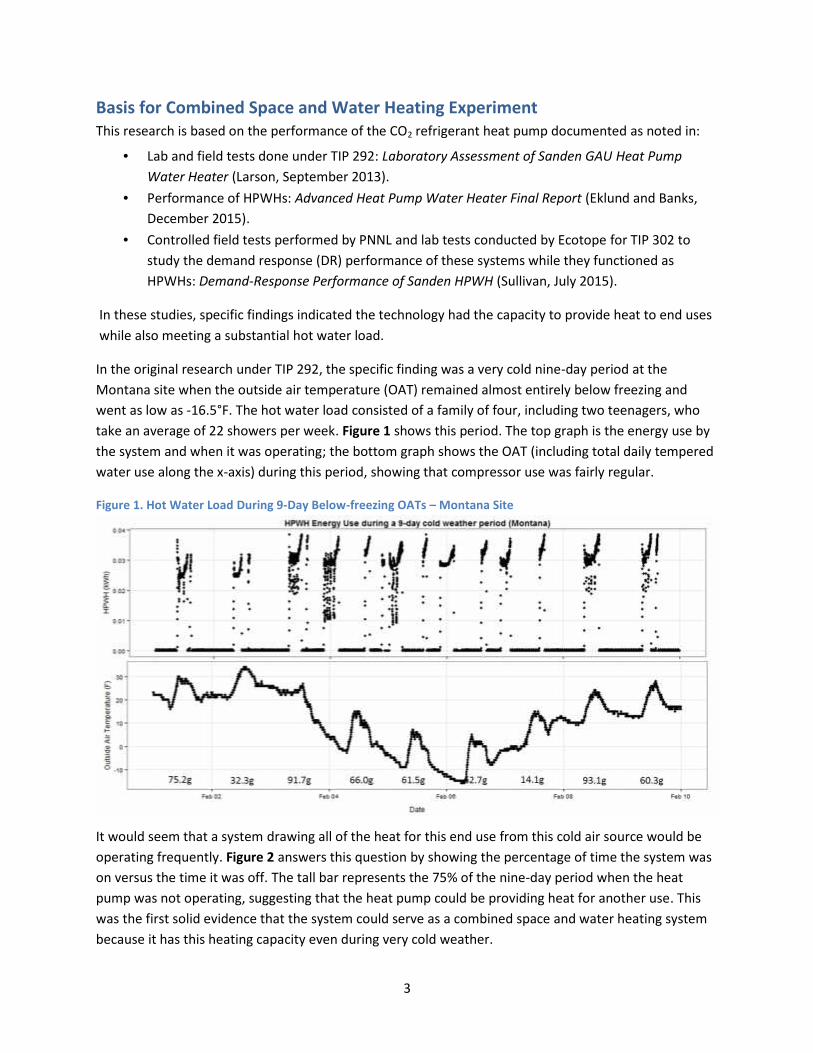
The second specific finding was from the DR research at PNNL for TIP 302. This set of experiments wasbased on a daily draw of 130 gallons of hot water in order to test the system under very high-useconditions. Given that the average hot water use in the Pacific Northwest is 42 gallons per day (GPD),the test condition could be considered extreme.
The Oversupply Mitigation test was designed to test the capacity of systems to store energy when thereis a surplus of generation.To create a storage bankfor nighttime generation,the split system waterheater was turned off forup to 12 hours while stillsupplying 130 GPD. Figure3 shows its ability todeliver water at the settemperature withoutmissing a draw. This abilitycorroborates the fieldresults at the Montanasite.
Figure 3. Ability of HPWH to Deliver Hot Water at Setpoint Temperature
Figure 2. Percentage of Time HPWH On/Off During Cold Weather Period
Status
5
Field StudyTen split system CO2 refrigerant HPWHs were installed in nine highly insulated new homes and onehighly-insulated deep retrofit home across the region beginning in fall 2014. These homes are located inBellingham, WA; Coeur d’Alene, ID; McCall, ID; Milwaukie, OR; Olympia, WA; Seattle, WA; and Tacoma,WA. The field study was designed to test the performance of the technology in all three of the PacificNorthwest’s heating climate zones. The host organizations were Avista, Energy Trust of Oregon, PugetSound Energy, and Tacoma Public Utilities.
DescriptionSite SelectionTen sites were recruited and analyzed through NEEA’s NSH program, which is managed by CLEAResult.For each home, CLEAResult staff determined the heat loss rate and annual load using SEEM™, asimulation tool developed by Ecotope, Inc. They also calculated the design heat load using SpecPro©, byBruce Manclark. The final determination of whether the home would be part of the combined space andwater heating experiment was made by Ken Eklund of WSU.
Five of the homes are in the NSH program and built according to its specifications. The four other newhomes were built to Passive House™ standards. The one retrofit home in the program, located inOlympia, is a prototype for retrofit application of the combined space and water heating concept. Thegoal of the project was to sample three primary heating climate zones corresponding to InternationalEnergy Conservation Code (IECC) Zones 4C, 5, and 6.
Code Issues and SolutionsThe CO2 HPWH used in these experiments was not yet UL listed. Electrical and building permits wereobtained for each of the ten installations. The situation was complicated by the fact that the HPWH wasproviding space heat as well as hot water. The addition of the second use made obtaining permits inmost jurisdictions more difficult than installing the systems simply as water heaters, as was done in TIP292 and TIP 302. As in those earlier projects, the building official was required to exercise discretionunder Section 104 of the International Residential Code, which allows use of alternate materials andsystems.
Ken Eklund worked with building officials. The initial permit in Bellingham took eight months to obtain. Itrequired engineered drawings of the system, which proved instrumental in obtaining that permit and allthe ones that followed. The engineering was done by Jonathan Heller, PE, at Ecotope. At the Idaho sites,the building official was local and the electrical official was a state inspector. Obtaining these permitsrequired working with both jurisdictions, but once the Coeur d’Alene site was permitted, the McCallpermits proved easy because the state officials were already educated and on board.
Sanden International, the manufacturer of the HPWH, has since obtained UL listing for the split systeminstalled in these projects. It was a long and expensive process, and much of the knowledge andexperience from these TIP projects was incorporated into the product that is UL listed and sold in NorthAmerica.
6
System Design and InstallationThe main source of space and water heating was a Sanden GAUS-315EQTD, CO2 refrigerant, split systemHPWH equipped with an 83-gallon storage tank. An inverter-driven, variable-speed compressor, gascooler (heat exchange from CO2 transcritical gas refrigerant to water), evaporator, and water pump arelocated in the outdoor unit. Plumbing lines transport water between the tank and the outdoor unit.
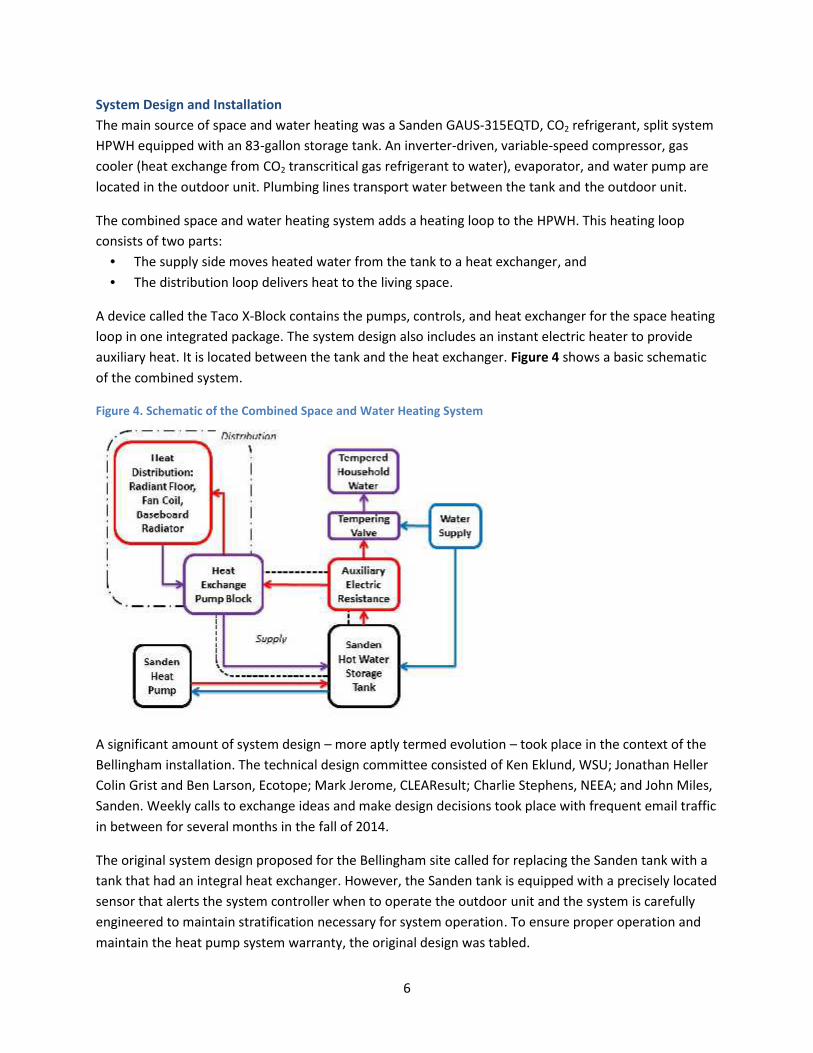
The combined space and water heating system adds a heating loop to the HPWH. This heating loopconsists of two parts:
• The supply side moves heated water from the tank to a heat exchanger, and• The distribution loop delivers heat to the living space.
A device called the Taco X-Block contains the pumps, controls, and heat exchanger for the space heatingloop in one integrated package. The system design also includes an instant electric heater to provideauxiliary heat. It is located between the tank and the heat exchanger. Figure 4 shows a basic schematicof the combined system.
Figure 4. Schematic of the Combined Space and Water Heating System
A significant amount of system design – more aptly termed evolution – took place in the context of theBellingham installation. The technical design committee consisted of Ken Eklund, WSU; Jonathan HellerColin Grist and Ben Larson, Ecotope; Mark Jerome, CLEAResult; Charlie Stephens, NEEA; and John Miles,Sanden. Weekly calls to exchange ideas and make design decisions took place with frequent email trafficin between for several months in the fall of 2014.
The original system design proposed for the Bellingham site called for replacing the Sanden tank with atank that had an integral heat exchanger. However, the Sanden tank is equipped with a precisely locatedsensor that alerts the system controller when to operate the outdoor unit and the system is carefullyengineered to maintain stratification necessary for system operation. To ensure proper operation andmaintain the heat pump system warranty, the original design was tabled.
7
A great deal of discussion took place concerning the best way to return water from the space heatingdistribution system to the Sanden tank. Sanden’s concern was that returning warm water to the bottomof the tank would:
• Interfere with defrost function in cold weather, because warmer water causes the system tomisread the temperature and turn off the defrost (this issue was solved in the UL listed system); and
• Reduce efficiency in operation, which depends on maintaining a temperature gradient in the tankto deliver cool water to the outside heat exchanger.
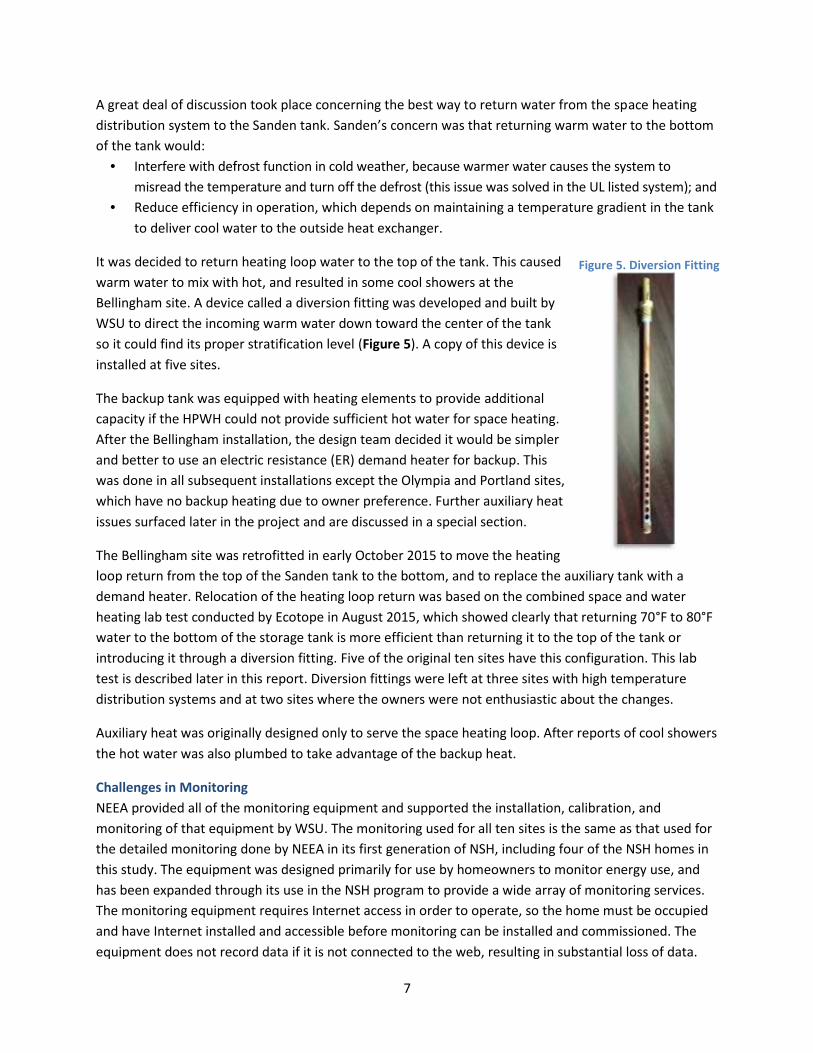
It was decided to return heating loop water to the top of the tank. This causedwarm water to mix with hot, and resulted in some cool showers at theBellingham site. A device called a diversion fitting was developed and built byWSU to direct the incoming warm water down toward the center of the tankso it could find its proper stratification level (Figure 5). A copy of this device isinstalled at five sites.
The backup tank was equipped with heating elements to provide additionalcapacity if the HPWH could not provide sufficient hot water for space heating.After the Bellingham installation, the design team decided it would be simplerand better to use an electric resistance (ER) demand heater for backup. Thiswas done in all subsequent installations except the Olympia and Portland sites,which have no backup heating due to owner preference. Further auxiliary heatissues surfaced later in the project and are discussed in a special section.
The Bellingham site was retrofitted in early October 2015 to move the heatingloop return from the top of the Sanden tank to the bottom, and to replace the auxiliary tank with ademand heater. Relocation of the heating loop return was based on the combined space and waterheating lab test conducted by Ecotope in August 2015, which showed clearly that returning 70°F to 80°Fwater to the bottom of the storage tank is more efficient than returning it to the top of the tank orintroducing it through a diversion fitting. Five of the original ten sites have this configuration. This labtest is described later in this report. Diversion fittings were left at three sites with high temperaturedistribution systems and at two sites where the owners were not enthusiastic about the changes.
Auxiliary heat was originally designed only to serve the space heating loop. After reports of cool showersthe hot water was also plumbed to take advantage of the backup heat.
Challenges in MonitoringNEEA provided all of the monitoring equipment and supported the installation, calibration, andmonitoring of that equipment by WSU. The monitoring used for all ten sites is the same as that used forthe detailed monitoring done by NEEA in its first generation of NSH, including four of the NSH homes inthis study. The equipment was designed primarily for use by homeowners to monitor energy use, andhas been expanded through its use in the NSH program to provide a wide array of monitoring services.The monitoring equipment requires Internet access in order to operate, so the home must be occupiedand have Internet installed and accessible before monitoring can be installed and commissioned. Theequipment does not record data if it is not connected to the web, resulting in substantial loss of data.
Figure 5. Diversion Fitting
8
The biggest monitoring challenges were flow meter accuracy and data gaps caused by the monitoringsystem. Calibration of flow meters on site using a micro-weir or an ultrasonic flow meter isrecommended to test flow measurement and provide correction factors if needed. Loss of data by themonitoring system and by failure of Internet connections on which they depended was not expected,and this loss affected some sites more than others. Temperature sensors incorporated into the flowmeters were also subject to failure; in some cases, plumbing and electrical system reconfiguration wasnot accompanied by monitoring adjustments. Notwithstanding these issues, usable data was availablefor over half the sites. The data analyzed in this report is carefully selected and filtered to provideaccurate information representing all types of heat distribution systems in the study.
Data collection at the cold climate sites in McCall and Coeur d’Alene was limited by the cessation ofproper function of the outdoor unit defrost cycle after below-freezing weather set in. Ultimately thesites were decommissioned. This is discussed in more detail in the results section of this report.
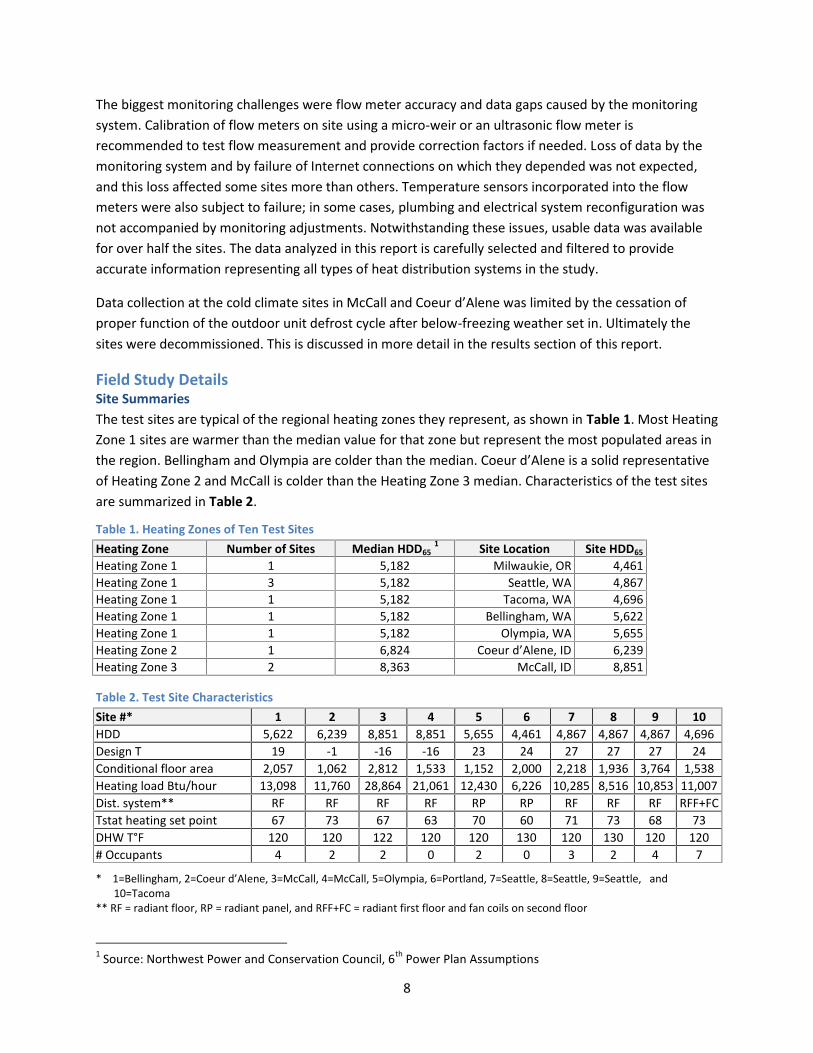
Field Study DetailsSite SummariesThe test sites are typical of the regional heating zones they represent, as shown in Table 1. Most HeatingZone 1 sites are warmer than the median value for that zone but represent the most populated areas inthe region. Bellingham and Olympia are colder than the median. Coeur d’Alene is a solid representativeof Heating Zone 2 and McCall is colder than the Heating Zone 3 median. Characteristics of the test sitesare summarized in Table 2.
Table 1. Heating Zones of Ten Test SitesHeating Zone Number of Sites Median HDD65
1 Site Location Site HDD65
Heating Zone 1 1 5,182 Milwaukie, OR 4,461Heating Zone 1 3 5,182 Seattle, WA 4,867Heating Zone 1 1 5,182 Tacoma, WA 4,696Heating Zone 1 1 5,182 Bellingham, WA 5,622Heating Zone 1 1 5,182 Olympia, WA 5,655Heating Zone 2 1 6,824 Coeur d’Alene, ID 6,239Heating Zone 3 2 8,363 McCall, ID 8,851
Table 2. Test Site CharacteristicsSite #* 1 2 3 4 5 6 7 8 9 10HDD 5,622 6,239 8,851 8,851 5,655 4,461 4,867 4,867 4,867 4,696Design T 19 -1 -16 -16 23 24 27 27 27 24Conditional floor area 2,057 1,062 2,812 1,533 1,152 2,000 2,218 1,936 3,764 1,538Heating load Btu/hour 13,098 11,760 28,864 21,061 12,430 6,226 10,285 8,516 10,853 11,007Dist. system** RF RF RF RF RP RP RF RF RF RFF+FCTstat heating set point 67 73 67 63 70 60 71 73 68 73DHW T°F 120 120 122 120 120 130 120 130 120 120# Occupants 4 2 2 0 2 0 3 2 4 7
* 1=Bellingham, 2=Coeur d’Alene, 3=McCall, 4=McCall, 5=Olympia, 6=Portland, 7=Seattle, 8=Seattle, 9=Seattle, and10=Tacoma
** RF = radiant floor, RP = radiant panel, and RFF+FC = radiant first floor and fan coils on second floor
1 Source: Northwest Power and Conservation Council, 6th Power Plan Assumptions
9
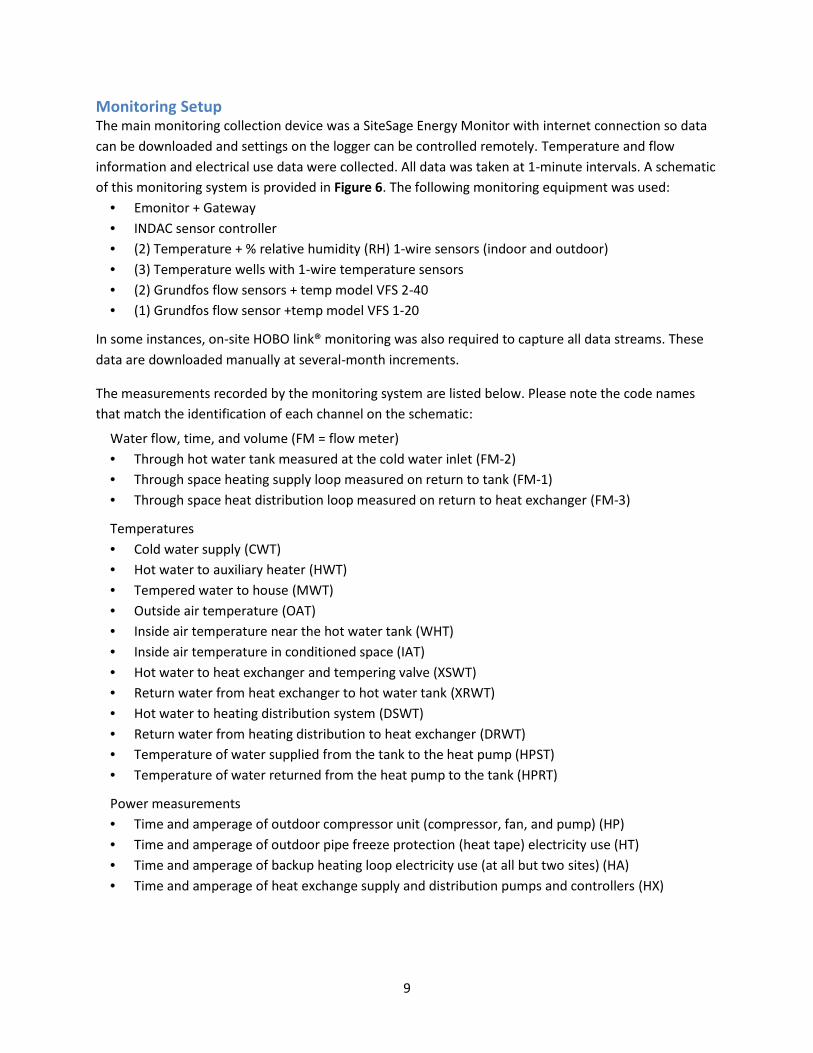
Monitoring SetupThe main monitoring collection device was a SiteSage Energy Monitor with internet connection so datacan be downloaded and settings on the logger can be controlled remotely. Temperature and flowinformation and electrical use data were collected. All data was taken at 1-minute intervals. A schematicof this monitoring system is provided in Figure 6. The following monitoring equipment was used:
• Emonitor + Gateway• INDAC sensor controller• (2) Temperature + % relative humidity (RH) 1-wire sensors (indoor and outdoor)• (3) Temperature wells with 1-wire temperature sensors• (2) Grundfos flow sensors + temp model VFS 2-40• (1) Grundfos flow sensor +temp model VFS 1-20
In some instances, on-site HOBO link® monitoring was also required to capture all data streams. Thesedata are downloaded manually at several-month increments.
The measurements recorded by the monitoring system are listed below. Please note the code namesthat match the identification of each channel on the schematic:
Water flow, time, and volume (FM = flow meter)• Through hot water tank measured at the cold water inlet (FM-2)• Through space heating supply loop measured on return to tank (FM-1)• Through space heat distribution loop measured on return to heat exchanger (FM-3)
Temperatures• Cold water supply (CWT)• Hot water to auxiliary heater (HWT)• Tempered water to house (MWT)• Outside air temperature (OAT)• Inside air temperature near the hot water tank (WHT)• Inside air temperature in conditioned space (IAT)• Hot water to heat exchanger and tempering valve (XSWT)• Return water from heat exchanger to hot water tank (XRWT)• Hot water to heating distribution system (DSWT)• Return water from heating distribution to heat exchanger (DRWT)• Temperature of water supplied from the tank to the heat pump (HPST)• Temperature of water returned from the heat pump to the tank (HPRT)
Power measurements• Time and amperage of outdoor compressor unit (compressor, fan, and pump) (HP)• Time and amperage of outdoor pipe freeze protection (heat tape) electricity use (HT)• Time and amperage of backup heating loop electricity use (at all but two sites) (HA)• Time and amperage of heat exchange supply and distribution pumps and controllers (HX)
10
Figure 6. Field Monitoring Setup
Field Study Data AnalysesThe period covered by this analysis is from the time monitoring began at the Bellingham site onDecember 30, 2014 through June 30, 2016.
The analysis examined the performance of the system for both space and water heating, and a numberof its operating parameters, including: the temperature of the system cold water supply, heated water,and tempered water; and the calculated volume of water used to temper the hot water before use. Thetotal volume of water used and daily use averages were also calculated for domestic hot water (DHW).In addition, the characteristics of the space heating loop were examined for temperatures, operatingparameters, and energy used under representative conditions.
Domestic Hot WaterCalculating DHW use requires the following elements:
• Average temperatures by flow event or by day for cold water supply, hot water, and temperedwater for the DHW supply.
• Thermal energy required to heat cold supply water for each flow event.• Volume of water added to temper hot water for each flow event.• Volume of total water for each flow event.
To calculate accurate temperatures for cold supply water, hot water, and tempered water for DHW, atleast 3 minutes of consecutive flow was required. Temperatures were then calculated by dropping theinitial reading and averaging over the remaining readings for a given flow event (or draw). Daily averageswere used as the representative temperatures for short-duration draws that were less than 3consecutive minutes. When only short draws occurred during a given day, the daily average watertemperatures from adjacent days were used.
Only water volume flowing into and out of the HPWH tank was metered via data loggers, so additionalwater added to temper the hot water was calculated for each flow event by using the known water flow(gallons) and the difference between the average daily tempered water flow and the average daily cold

11
or hot water temperatures, respectively. Total tempered water flow for each flow event was the sum ofthe cold water flow and the added water.
Average water temperatures were used to calculate the thermal energy needed to heat the cold waterfor each draw. The energy is calculated via the familiar calorimetric equation shown below where p isthe density and Cp is the heat capacity of water.
Equation 1: Energy = Volume x p x Cp x (Temperature 1 - Temperature 2)
In the specific case of DHW use, the energy in Btu is defined as Qdhw, Temperature 1 is the tank outlet(HWT), and Temperature 2 is the tank inlet (CWT) temperature.
Space HeatThe relevant energy values for the space heating system were calculated using Equation 1 but withvalues substituted as shown in Table 3.
Table 3. Measured Flow and Average Temperature Values Used to Calculate System LoadsCalculated Variable Flow Volume Temperature 1 Temperature 2
QauxSupply return after heatexchange (FM-1) Auxiliary heat outlet (XSWT) Hot water from tank (HWT)
QsystemSupply return after heatexchange (FM-1) Hot water from tank (HWT) Supply return after heat
exchange (XRWT)
QdistributionDistribution return before heatexchange (FM-3)
Distribution after heatexchange (DSWT)
Distribution return beforeheat exchange (DRWT)
Overall System EfficienciesWater heating is rated with Energy Factors; space heating is rated by Coefficient of Performance (COP)or Heating Season Performance Factor (HSPF). The combined system performance has been designatedas a Field Energy Factor (FEF). This accounts for all system inefficiencies such as tank loss, pipe loss,pump energy, controls, defrost, and freeze protection. FEF efficiencies are calculated as:
Equation 2: FEF = (Qdhw + Qsystem) / Qinput
where Qinput is the sum of energy inputs to the HPWH (HP), auxiliary heat (HA), heat exchanger block(HX), and heat tape (HT).
When data was unavailable for the supply side of the heat exchanger, an FEF was calculated using datafrom the distribution side of the system:
Equation 3: FEFdis = (Qdhw + Qdistribution) / Qinput.
Space and Water Heating EfficienciesGiven that heat is simultaneously provided by one heat source through a single tank for both space andwater heating, it is impossible to calculate a definitive efficiency for each end use. This is particularly truefor a heat pump because its efficiency varies with OAT, supply water temperature, and load. Thus, a periodof water heating only during the summer cannot be used to determine its portion of the load in winter.The lab test was designed to quantify the individual efficiencies for space and water heating as well ascombined function efficiencies.
12
Field Study ResultsThe project began October 1, 2014, with the goal to conduct a field study on six new homes.Recruitment was successful and a total of nine new homes plus a major thermal remodel comprised thefinal cohort. These homes were completed over a period of a year and monitored as they were finished.A great deal was learned about system design and performance, which resulted in changes to thesystem plumbing at some sites during the monitoring period.
Auxiliary heat strategy: The first site had an ER tank for auxiliary heat. Monitoring showed that most ofthe minimal auxiliary energy at this site was used to keep the tank warm. A demand electric water heaterthen became the standard design. Eight sites adopted this system and two sites have no auxiliary heat.
Heating supply water return location: Potable water is taken from the bottom of the 84-gallon tank tothe outdoor unit, where it is heated and then delivered to the top of the tank. Hot water is taken fromthe top of the tank for both DHW and space heat. At the first site, the return water from the radiantfloor, averaging 83°F, was initially returned to the top of the tank. On cold days the home occupants hadcool showers due to mixing of this cool return with the hot water.
An additional concern in determining return water location was the warning by the heat pumpmanufacturer that both efficiency and defrost function depended on cold water supply to the heatpump, making it vital to maintain tank stratification. The heating system return water was cooler thanthe 149°F water at the top of the tank, but hotter than the normal cold water supply. The ideal locationfor the return was thought to be in the central portion of the tank, but no port was available. A fitting todivert heating supply return water to the center of the tank was installed at Site 1, where it cured thecold showers. This strategy was adopted at the next six sites.
Subsequently, a lab test was conducted to compare the impact on tank temperature stratification ofthree different return strategies: top of the tank, top of the tank with diversion fitting, and bottom ofthe tank. The best location among these choices for maintaining tank stratification with lowertemperature distribution systems (radiant floors) was found to be at the bottom of the tank; secondbest was the diversion fitting; and third was the top of the tank. For high temperature systems(radiators) the bottom entry and the diversion fitting perform almost the same. The ultimaterecommendation was that a tank designed for combined systems should have multiple ports to allowinstallers to match the return to the proper temperature level in the tank. The two sites constructedafter this finding had return water from the heating system plumbed to the bottom of the tank, and theplumbing was revised at three existing sites – all with radiant floors – to implement this design change.
It should be noted that the need for cold water supply to optimize performance of the heat pump isincompatible with strategies to preheat the supply water. Site 1 had such effective pre-heatingstrategies, that its supply water was often hotter than the return water from the heating system. This ispart of the reason for its reduced system performance.
Auxiliary heat for DHW: The original system design provided auxiliary heat only to the space heatingsystem. As sites in colder locations came online, home occupants experienced cool showers when space

13
heat was operating. Five of the sites were re-plumbed to connect the DHW to the electric demandauxiliary heat source. Site 9 had auxiliary heat only for DHW while Sites 5 and 6 had no backup heat.
Monitoring combined systems: Several challenges in monitoring the systems limited the data setavailable for analysis:
• This is the first time scientific monitoring has been done with the monitoring system used, andmany days of data were lost due to data collection issues. The system was used, because it waspart of an effort by NEEA, which provided the equipment and its installation, to develop low costmonitoring options.
• The system plumbing revisions resulted in loss of data and changed operation. Moving theheating return to the bottom of the tank caused the temperature sensor, which was integratedinto the flow meter, to end up on the upstream side of the return entry point, resulting in loss ofthe incoming water temperature at three sites.
• Some temperature sensors and flow meters malfunctioned, preventing calculation of keyvariables, and it was difficult to obtain replacement parts.
• The monitoring required Internet service to collect and store data, and the provider cut service atSite 1 in November, 2015. It took four months to fully restore service.
The resulting analysis was conducted on sites that had complete data sets for the periods analyzed, anddata were screened to ensure that periods with missing data were not used. Sites were excluded fromthe analysis because of failures in the systems. The sites used in the analysis are 1, 4, 5, 6, 7, and 10which represent all distribution system types and two climate locations.
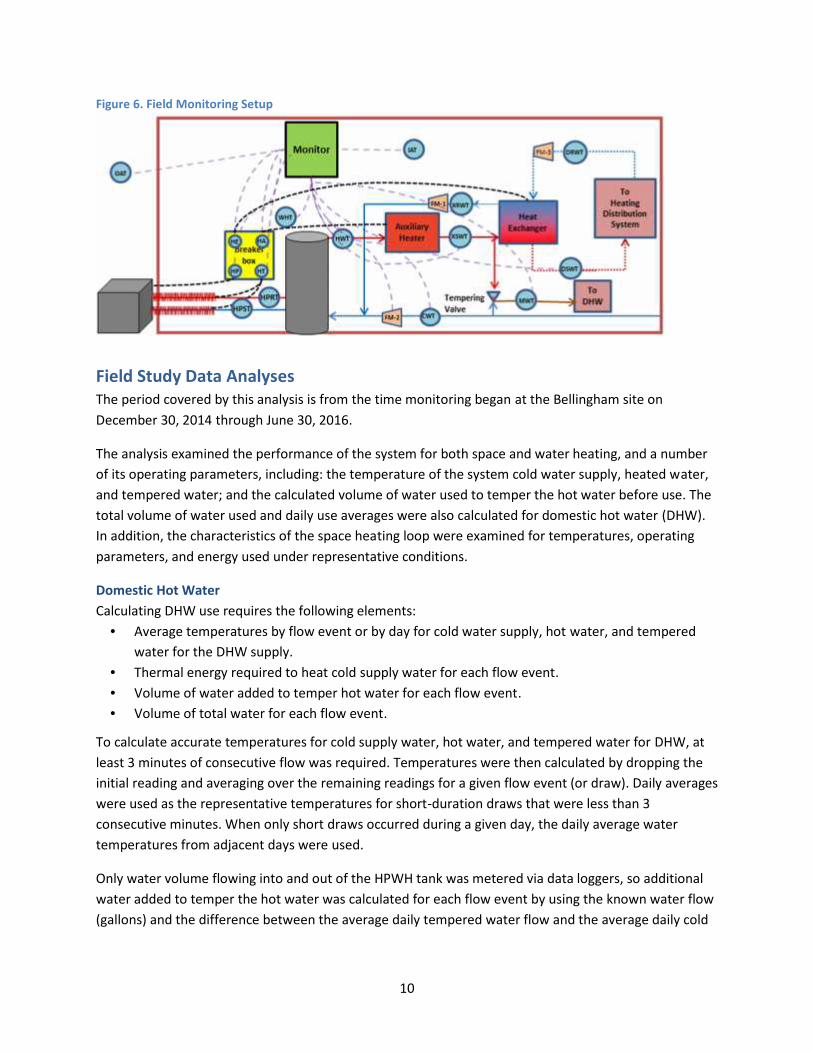
Daily DHW Use by SiteAverage daily hot water use in the Pacific Northwest is approximately 15 gallons per person per day(totaling 45 GPD for a family of three), as illustrated in Figure 7. Several of the sites have water uselower than average. Site 10 used substantially more hot water than other sites. Sites 4 and 6 wereunoccupied during monitoring, so any domestic hot water use was related to construction cleanup.
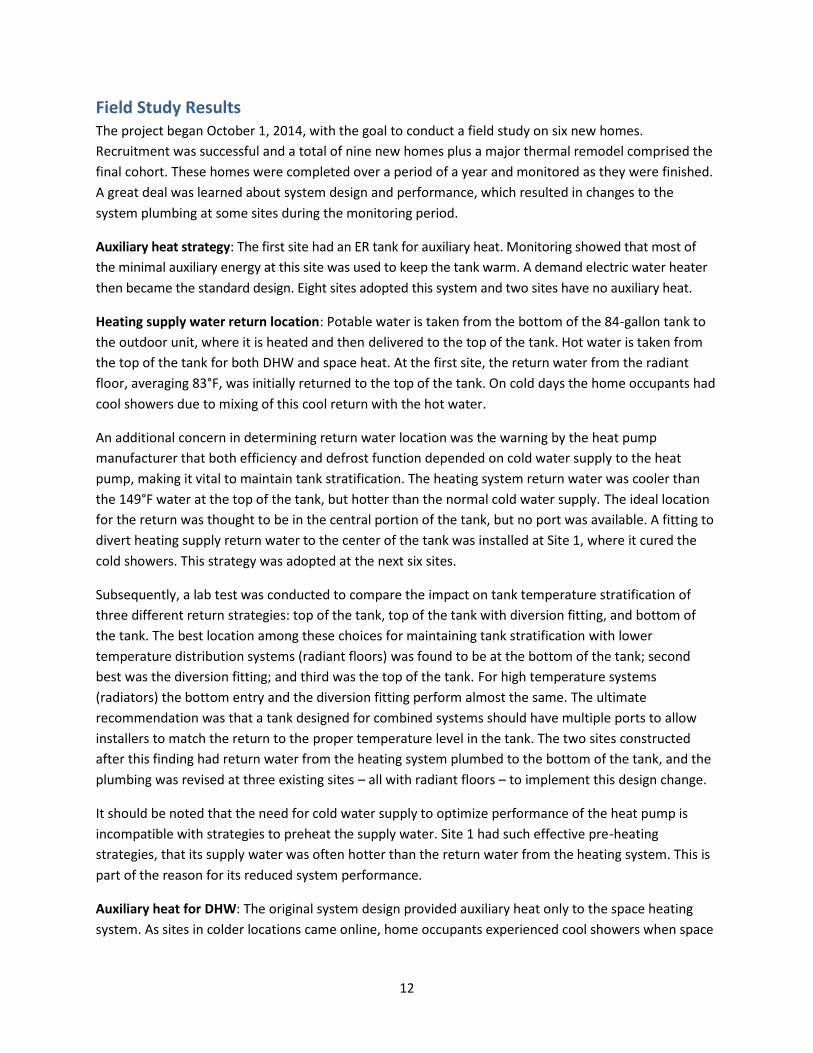
Daily Average Outside Air Temperature by SiteSites 1, 5, 6, 7, and 10 are in the Maritime Northwest; Site 4 is in McCall, ID, a cold location, and one ofthe last systems to come online where it operated only a short time. The longest-term location is Site 1in Bellingham. Its data flow was interrupted when the Internet provider cut service. These findings areshown in Figure 8.
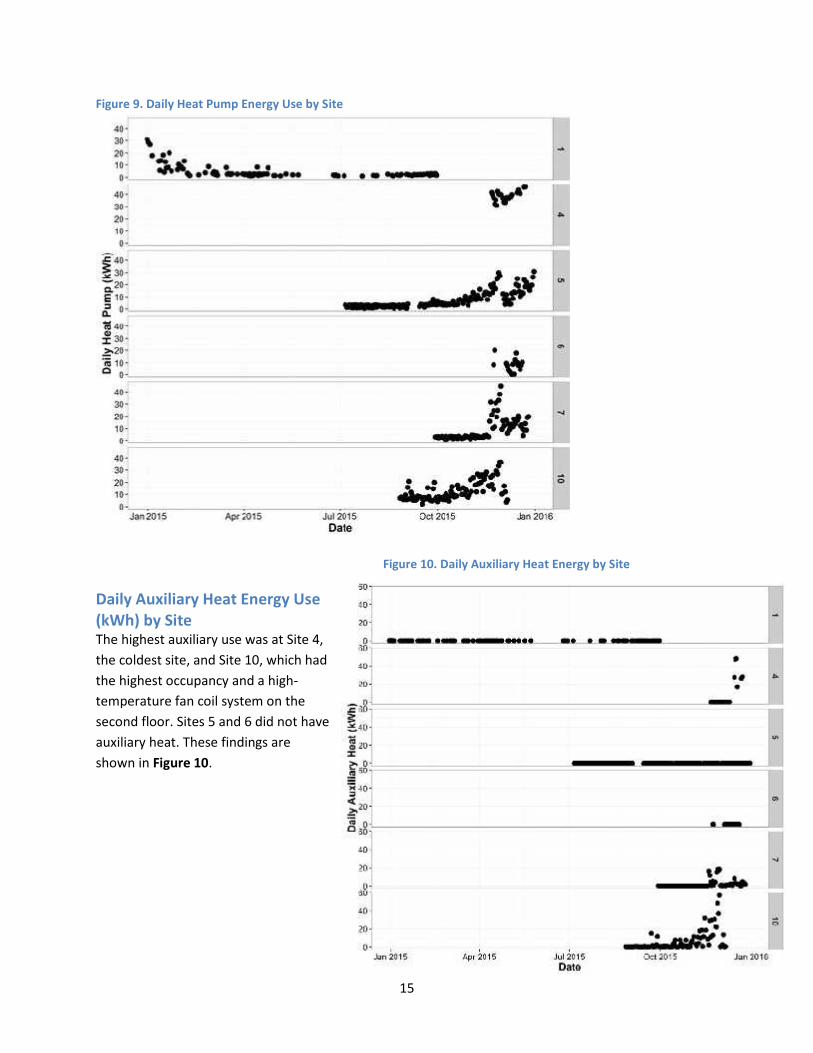
Daily Heat Pump Energy Use (kWh) by SiteFigure 9 shows the energy use by site. Site 4 in McCall, ID, the coldest location, shows the highest dailyenergy use in the 40 kWh per day range. Site 6 in Portland, OR, shows much lower energy use during thesame period, with a high of 20 kWh per day. These sites were both unoccupied during the monitoringperiod and, therefore, all heat pump energy use is for space heating. Regardless of the OAT, the systemswere able to operate and produce heat. At all the sites in the coastal climates, the systems – includingauxiliary heat – were able to provide space and water heating. At the very cold location for Sites 3 and 4,a larger-capacity heat pump would be an asset.
14
Figure 7. Daily Tempered Water Flow
Figure 8. Daily Average OAT
15
Figure 9. Daily Heat Pump Energy Use by Site
Figure 10. Daily Auxiliary Heat Energy by Site
Daily Auxiliary Heat Energy Use(kWh) by SiteThe highest auxiliary use was at Site 4,the coldest site, and Site 10, which hadthe highest occupancy and a high-temperature fan coil system on thesecond floor. Sites 5 and 6 did not haveauxiliary heat. These findings areshown in Figure 10.
16
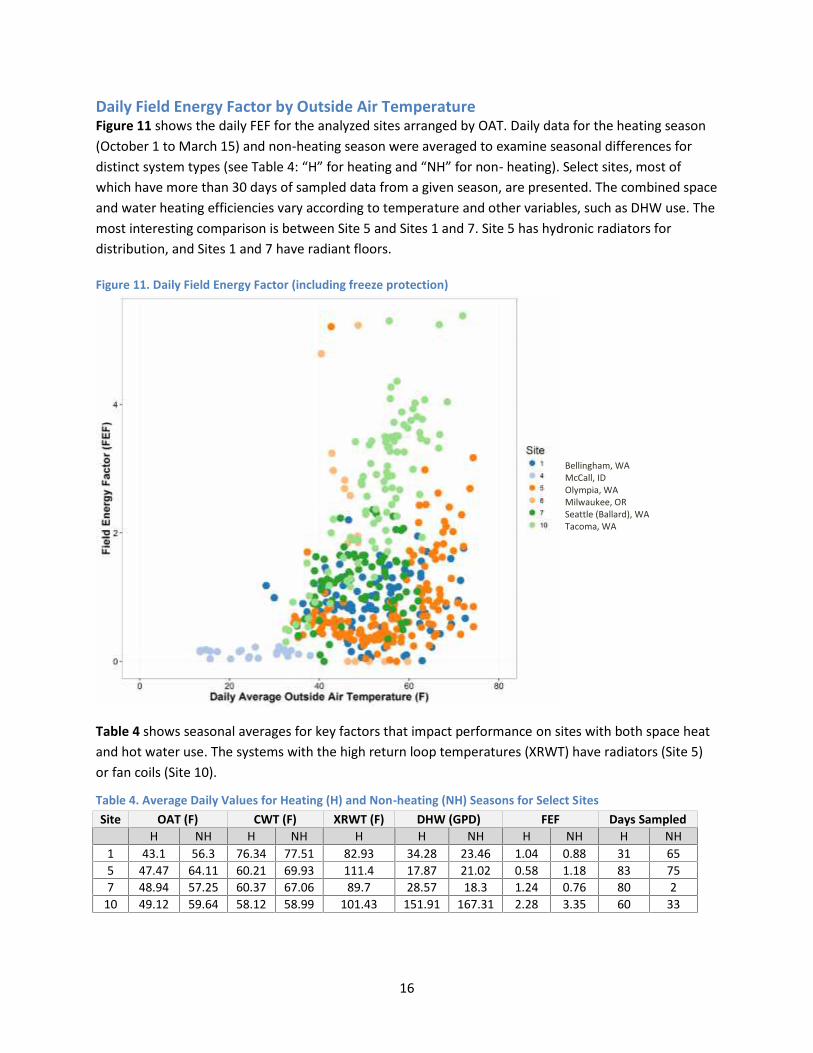
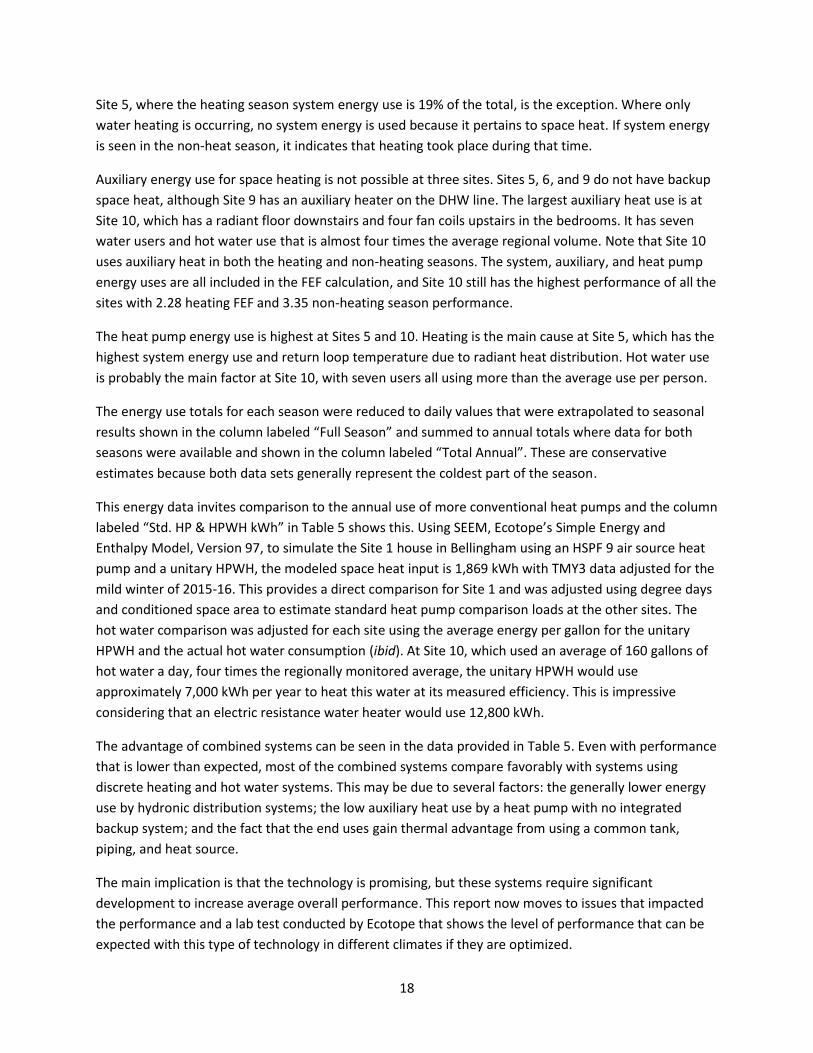
Daily Field Energy Factor by Outside Air TemperatureFigure 11 shows the daily FEF for the analyzed sites arranged by OAT. Daily data for the heating season(October 1 to March 15) and non-heating season were averaged to examine seasonal differences fordistinct system types (see Table 4: “H” for heating and “NH” for non- heating). Select sites, most ofwhich have more than 30 days of sampled data from a given season, are presented. The combined spaceand water heating efficiencies vary according to temperature and other variables, such as DHW use. Themost interesting comparison is between Site 5 and Sites 1 and 7. Site 5 has hydronic radiators fordistribution, and Sites 1 and 7 have radiant floors.
Figure 11. Daily Field Energy Factor (including freeze protection)
Table 4 shows seasonal averages for key factors that impact performance on sites with both space heatand hot water use. The systems with the high return loop temperatures (XRWT) have radiators (Site 5)or fan coils (Site 10).
Table 4. Average Daily Values for Heating (H) and Non-heating (NH) Seasons for Select SitesSite OAT (F) CWT (F) XRWT (F) DHW (GPD) FEF Days Sampled
H NH H NH H H NH H NH H NH1 43.1 56.3 76.34 77.51 82.93 34.28 23.46 1.04 0.88 31 655 47.47 64.11 60.21 69.93 111.4 17.87 21.02 0.58 1.18 83 757 48.94 57.25 60.37 67.06 89.7 28.57 18.3 1.24 0.76 80 2
10 49.12 59.64 58.12 58.99 101.43 151.91 167.31 2.28 3.35 60 33
Bellingham, WAMcCall, IDOlympia, WAMilwaukee, ORSeattle (Ballard), WATacoma, WA
17
The system with the lowest average heating season performance in Table 4 is Site 5, which has thehighest return water temperature. Its FEF doubled during the non-heating season, due in large part tothe reduction in supply water temperature going to the outdoor unit.
The non-heating season average FEFs for Sites 1 and 7 are lower than those for the heating season. Thisappears to be related to the drop in daily water use at these sites. (Although there are only two non-heating season days in this sample for Site 7, it is considered instructive on this point.) A contributingreason is that tank and pipe losses continue while there is less useful energy delivered to allocate it to.At sites 5 and 10, daily hot water use and FEF increased during the non-heating season.
The large daily water use at Site 10 coincides with the only outstanding performance in this sample; thisperformance was despite the fact that its system operated at a higher return loop temperature thansites with only radiant floors. Hot water use brings cold water into the storage tank, which results incolder water going to the heat exchange with the refrigerant in the outdoor unit resulting in higher heattransfer. The cold water also reduces tank loss.
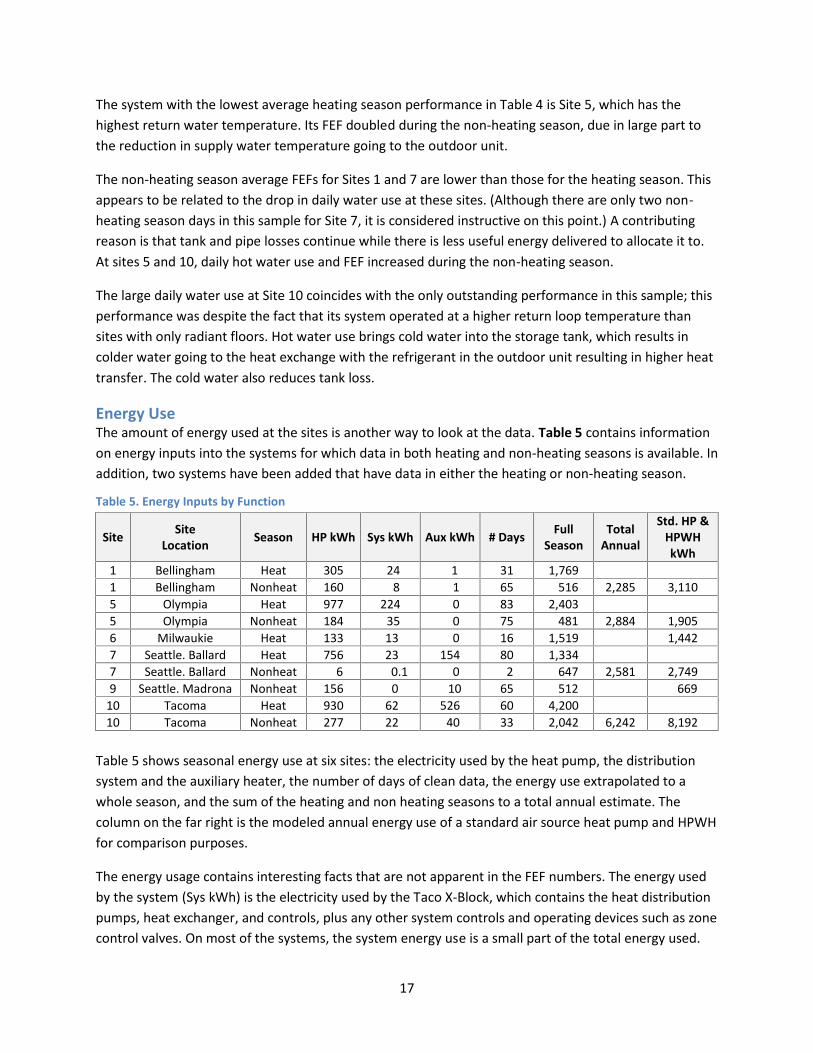
Energy UseThe amount of energy used at the sites is another way to look at the data. Table 5 contains informationon energy inputs into the systems for which data in both heating and non-heating seasons is available. Inaddition, two systems have been added that have data in either the heating or non-heating season.
Table 5. Energy Inputs by Function
Site SiteLocation Season HP kWh Sys kWh Aux kWh # Days Full
SeasonTotal
Annual
Std. HP &HPWHkWh
1 Bellingham Heat 305 24 1 31 1,7691 Bellingham Nonheat 160 8 1 65 516 2,285 3,1105 Olympia Heat 977 224 0 83 2,4035 Olympia Nonheat 184 35 0 75 481 2,884 1,9056 Milwaukie Heat 133 13 0 16 1,519 1,4427 Seattle. Ballard Heat 756 23 154 80 1,3347 Seattle. Ballard Nonheat 6 0.1 0 2 647 2,581 2,7499 Seattle. Madrona Nonheat 156 0 10 65 512 669
10 Tacoma Heat 930 62 526 60 4,20010 Tacoma Nonheat 277 22 40 33 2,042 6,242 8,192
Table 5 shows seasonal energy use at six sites: the electricity used by the heat pump, the distributionsystem and the auxiliary heater, the number of days of clean data, the energy use extrapolated to awhole season, and the sum of the heating and non heating seasons to a total annual estimate. Thecolumn on the far right is the modeled annual energy use of a standard air source heat pump and HPWHfor comparison purposes.
The energy usage contains interesting facts that are not apparent in the FEF numbers. The energy usedby the system (Sys kWh) is the electricity used by the Taco X-Block, which contains the heat distributionpumps, heat exchanger, and controls, plus any other system controls and operating devices such as zonecontrol valves. On most of the systems, the system energy use is a small part of the total energy used.
18
Site 5, where the heating season system energy use is 19% of the total, is the exception. Where onlywater heating is occurring, no system energy is used because it pertains to space heat. If system energyis seen in the non-heat season, it indicates that heating took place during that time.
Auxiliary energy use for space heating is not possible at three sites. Sites 5, 6, and 9 do not have backupspace heat, although Site 9 has an auxiliary heater on the DHW line. The largest auxiliary heat use is atSite 10, which has a radiant floor downstairs and four fan coils upstairs in the bedrooms. It has sevenwater users and hot water use that is almost four times the average regional volume. Note that Site 10uses auxiliary heat in both the heating and non-heating seasons. The system, auxiliary, and heat pumpenergy uses are all included in the FEF calculation, and Site 10 still has the highest performance of all thesites with 2.28 heating FEF and 3.35 non-heating season performance.
The heat pump energy use is highest at Sites 5 and 10. Heating is the main cause at Site 5, which has thehighest system energy use and return loop temperature due to radiant heat distribution. Hot water useis probably the main factor at Site 10, with seven users all using more than the average use per person.
The energy use totals for each season were reduced to daily values that were extrapolated to seasonalresults shown in the column labeled “Full Season” and summed to annual totals where data for bothseasons were available and shown in the column labeled “Total Annual”. These are conservativeestimates because both data sets generally represent the coldest part of the season.
This energy data invites comparison to the annual use of more conventional heat pumps and the columnlabeled “Std. HP & HPWH kWh” in Table 5 shows this. Using SEEM, Ecotope’s Simple Energy andEnthalpy Model, Version 97, to simulate the Site 1 house in Bellingham using an HSPF 9 air source heatpump and a unitary HPWH, the modeled space heat input is 1,869 kWh with TMY3 data adjusted for themild winter of 2015-16. This provides a direct comparison for Site 1 and was adjusted using degree daysand conditioned space area to estimate standard heat pump comparison loads at the other sites. Thehot water comparison was adjusted for each site using the average energy per gallon for the unitaryHPWH and the actual hot water consumption (ibid). At Site 10, which used an average of 160 gallons ofhot water a day, four times the regionally monitored average, the unitary HPWH would useapproximately 7,000 kWh per year to heat this water at its measured efficiency. This is impressiveconsidering that an electric resistance water heater would use 12,800 kWh.
The advantage of combined systems can be seen in the data provided in Table 5. Even with performancethat is lower than expected, most of the combined systems compare favorably with systems usingdiscrete heating and hot water systems. This may be due to several factors: the generally lower energyuse by hydronic distribution systems; the low auxiliary heat use by a heat pump with no integratedbackup system; and the fact that the end uses gain thermal advantage from using a common tank,piping, and heat source.
The main implication is that the technology is promising, but these systems require significantdevelopment to increase average overall performance. This report now moves to issues that impactedthe performance and a lab test conducted by Ecotope that shows the level of performance that can beexpected with this type of technology in different climates if they are optimized.
19
Issues Impacting System PerformanceA number of issues impacted performance of the combined systems in the study. Discovering issues isexpected when researching a brand new system made up of components repurposed from the originaluses. The goal is to learn enough to determine what needs to be done to enhance the system so that itruns efficiently and can be easily installed.
The issues began to appear as soon as the first system was installed (this discussion is presented onpages 5 and 6). More issues surfaced as more systems were installed. This section brings together all ofthe performance issues and the action or resolution taken. The main issues that were examined are:
• Defrost failure caused systems in cold climates to undergo repeated manual defrost to continuesystem operation. Systems in McCall and Coeur d’Alene, ID, were removed at the homeowner’srequest.
• Power-out freezing caused one system in McCall to be disabled and shut down during a 10-hourpower outage at 20°F.
• Systems worked best where design load was within heat pump limits.• Standard programming for combined heat exchange, control, and pump (Taco X-Block) did not
operate the system properly.• Tank destratification occurred, especially in cold climates and with high-temperature heating
systems, which reduced efficiency.• Cross flow through tempering valves resulted in reduced operating efficiency.• The auxiliary demand heaters developed water leaks at several sites.• Cold Water preheating is incompatible with optimum hydronic heat pump performance.
DefrostSanden warned that the defrost system on the outdoor unit would be disabled by water above 100°Fsupplied to the outdoor unit. Efforts were made to keep the return water as cool as possible, especiallyat the cold temperature sites. Radiant concrete floors generally returned water at 90°F or lower. Forreasons that are not altogether clear, the defrost logic on the heat pump was tricked into not defrostingthe unit as it would if only water heating was taking place at the sites in McCall and Coeur d’Alene. Thecauses may have been cross flow or tank destratification delivering high-temperature water to the heatexchanger in the outdoor unit.
Sanden has squarely faced this defrost issue and redesigned the heat pump operation logic to allowdefrost operation regardless of the temperature of the water entering the outdoor unit. The UL listedunit will soon contain this change and other design improvements.
Power-Out Freeze ProtectionA system to protect the outdoor water lines between the tank and outdoor unit, the inner piping, waterpump, and heat exchanger in the outdoor unit from freezing during a power outage in cold weather wasrecommended in the final report for TIP 292. It was to be installed at the cold weather sites in thisproject, but before it could be done, one of the sites in McCall was subjected to 10 hours of 20°Ftemperature without electricity. The water pump in the outdoor unit cracked due to ice expansion,requiring system shutdown. The other system in McCall was not impacted.
20
A solenoid automatic drain system has been developed by Sanden for installation in cold climates. It hasbeen tested as part of a marketability study funded by BPA for WSU to conduct on the UL listed system.The solenoid drains the system, does not cause air locks, and uses negligible electricity. A full report onthis and other tests will be issued in early 2017 by Ecotope and WSU.
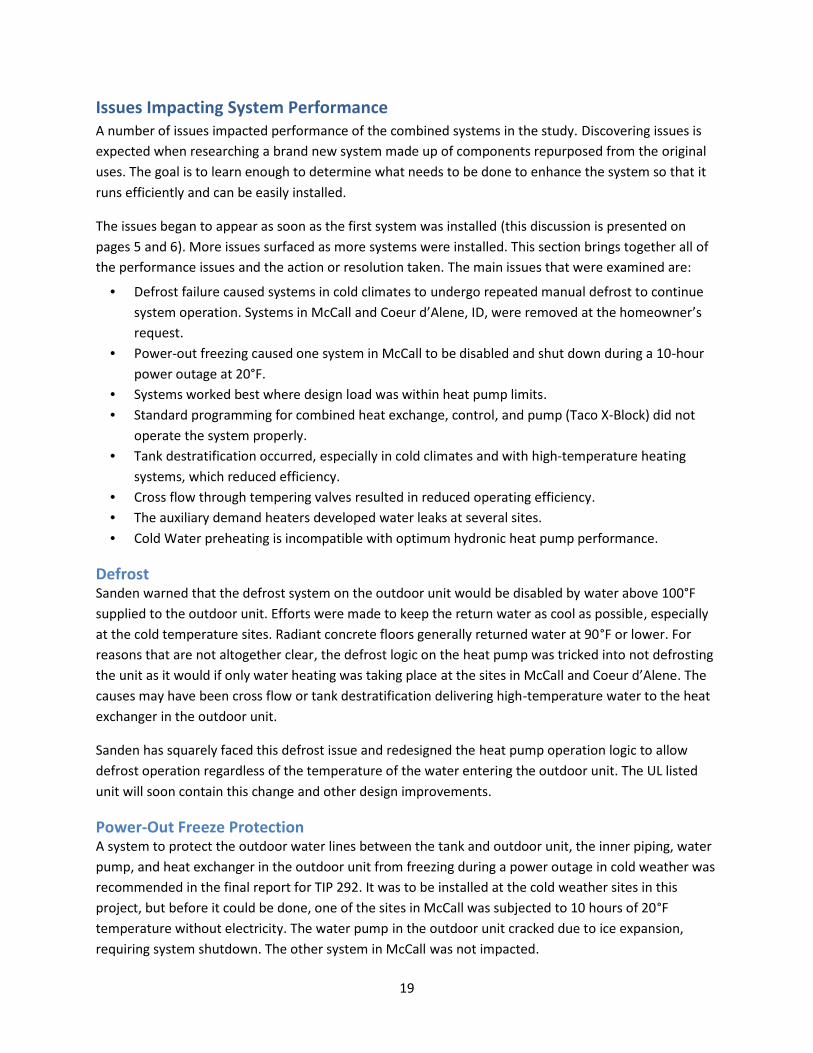
CapacitySystem capacity – the output in Btu per hour – is relatively constant, with the main determinant beingOAT. That output is 13,000 Btu per hour below freezing and 15,000 Btu per hour at highertemperatures. An example is provided by two unoccupied homes with the combined systems that wereheated during the same period in winter 2015:
• Site 4 is located in McCall, ID, which has a design temperature of -16°F and a design load of21,061 Btu per hour.
• Site 6 is located in Milwaukie, OR, with a design temperature of 24°F and a design load of 6,226Btu per hour.
Figure 12 shows the daily heat pump electricity usage during the period from November 21 throughDecember 21, 2015. The data is not normalized to weather, but provides a comparison of the capacitydemands during the same window of time when both sites were in space heating-only mode.
Figure 12. Daily Heat Pump Electricity Usage
21
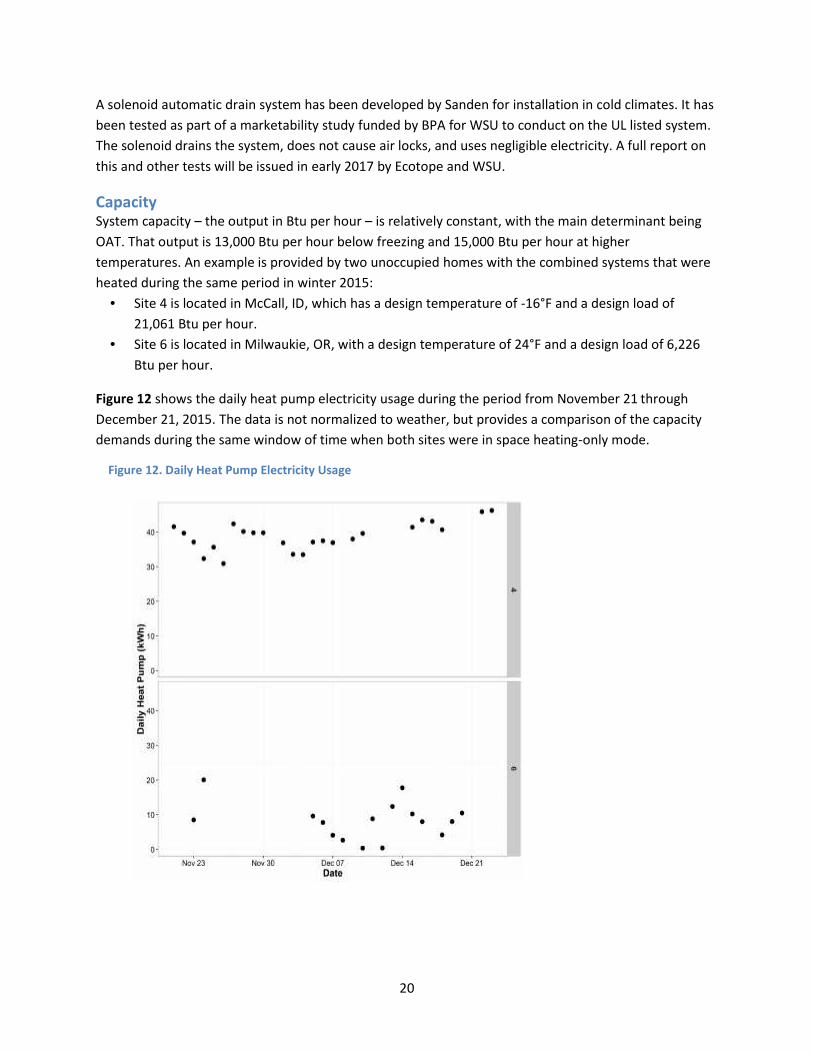
Figure 13 shows the auxiliary electricity use per day at each of the two sites. Note that the heat pumphandled the load at Site 4 until mid-December, when backup energy use soared to almost 50 kWh perday. The heat pump and backup heat operated simultaneously as the temperature plunged from a meantemperature of 28°F and a low of 24°F on December 14, to a mean of 8°F with a low of -8°F onDecember 17. The heat pump began having defrost issues as the tank destratified and highertemperature water was sent to the outdoor unit. It had to be turned off and manually defrosted whichtook it out of commission and put the entire load on the auxiliary heat.
The performance of each system is compared in Table 6. Note that the average OAT at Site 4 was closeto 25°F during the period, while at Site 6 it was almost 48°F. The supply water temperature was alsomuch colder at Site 4. Interestingly, the heating system at Site 4 returned much colder water to the tankthan the Site 6 system, showing the performance difference between the radiant floor and radiantpanels. Lower temperatures indicate better performance, but when the overall performance iscompared, the Site 6 system shows an FEF over 2 while the Site 4 system was 0.13, clearly indicating thesystem was not capable of performing adequately under the circumstances to which it was subjected atSite 4. Note that the FEF includes the auxiliary heat.
Table 6. Performance of Each SystemSite OAT (°F) CWT (°F) XRWT (°F) FEF Days sampled
4 24.89 50.3 79.85 0.13 246 47.83 62.71 105.99 2.05 16
Figure 13. Auxiliary Electricity Use per Day
22
At Site 6, the 15,000 Btu capacity heat pump was more than twice the design load, while the Site 4 loadexceeded its 13,000 Btu capacity by about 8,000 Btu. With backup heat, the Site 4 system capacity was36,884 Btu per hour (almost twice the design load), but this did not solve the capacity issue because theheat pump operated at all times if not turned off manually, regardless of its ability to operateeffectively. The best solution for very cold climates appears to be a heat pump that better matches thedesign load and is not at the mercy of tank destratification.
The heat pump at Site 4 was destroyed by freezing during a power outage in late December 2015. It wasreplaced by a 28 kW Seisco instant electric heater, which is providing all space and water heat until alarger CO2 hydronic heat pump is available.
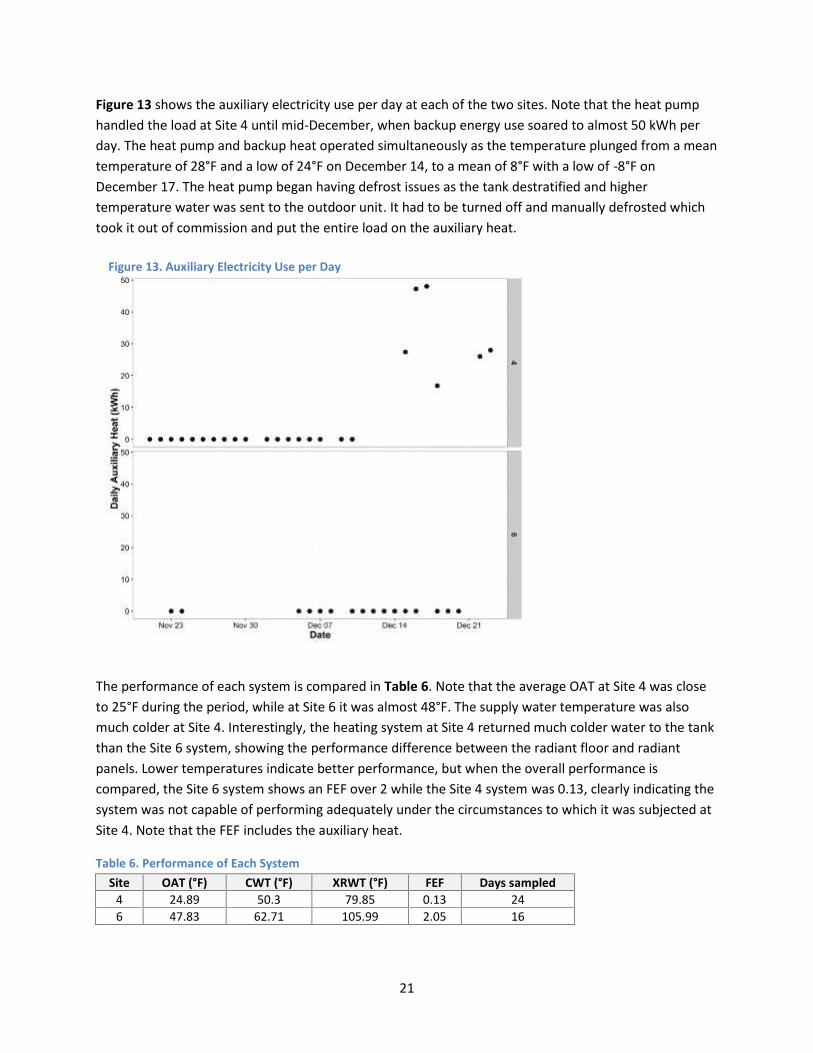
Taco X-Block ProgrammingThe X-Block by Taco is an integrated heat exchanger, pump system, and controller that exchanges heatfrom the source fluid to the working fluid that serves the heat load. It performs that function at all of theresearch sites. Many plumbers and heating contractors automatically program the X-Block to operate asit would with a gas boiler. This destroys the efficiency of a hydronic heat pump by increasing flow ratesand inducing tank destratification. During fall 2015, five systems came online, and the X-Blocks at all ofthese sites required reprogramming.
The recommended setup is to use Outdoor Reset, which requires an outdoor air temperature sensor.This allows the system to vary the heating delivery temperature to match outdoor conditions. Thesystem should also be set up to enable rather than control the heat source. Heat source protection isdesigned for condensing boilers, and should be turned off.
Programming the X-Block requires moving through a series of screens in sequence. Table 7 shows therecommended X-Block programming for a hydronic heat pump at three locations representing the coldest(McCall), cold (Spokane), and moderate (Olympia) climates, according to source at Taco.
Table 7. Recommended X-Block Programming for Hydronic Heat Pump at Three LocationsFor McCall For Spokane For Olympia
VIEW MIX Targ "- - - "- - - "- - -VIEW MIX SUPP DEM 77 77 77VIEW MIX Targ DEM 83 83 83VIEW BOIL MIN DEM OFF OFF OFFVIEW OUT DEM 37 37 37
ADJUST OUT DSGN DEM 0 10 20ADJUST MIX DSGN DEM 100 100 100ADJUST MIX MAX DEM 115 115 115ADJUST MIX MIN DEM OFF OFF OFFADJUST BOIL MIN DEM OFF OFF OFFADJUST WWSD 70 70 70
DEMADJUST DEM
If programming fails to provide improved function, the sensor should be checked for accuracy. A sensorreading high can shut down the supply pump when heat is needed by falsely showing the mix designtemperature is met.
23
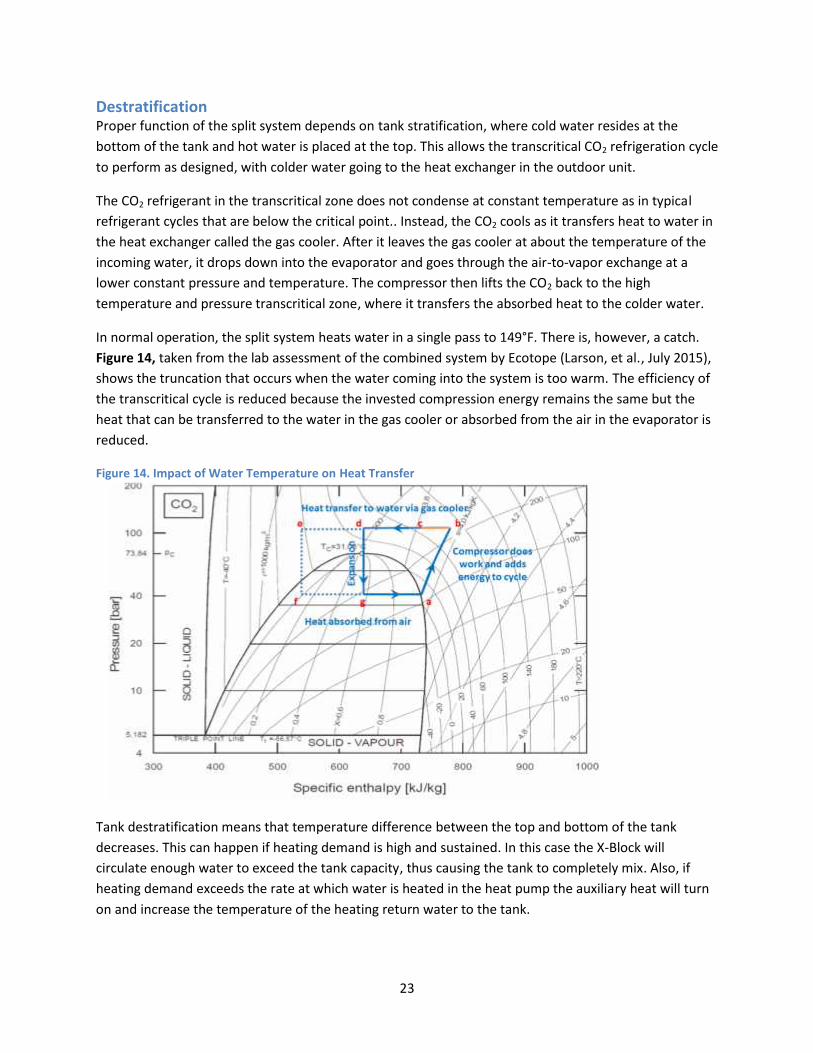
DestratificationProper function of the split system depends on tank stratification, where cold water resides at thebottom of the tank and hot water is placed at the top. This allows the transcritical CO2 refrigeration cycleto perform as designed, with colder water going to the heat exchanger in the outdoor unit.
The CO2 refrigerant in the transcritical zone does not condense at constant temperature as in typicalrefrigerant cycles that are below the critical point.. Instead, the CO2 cools as it transfers heat to water inthe heat exchanger called the gas cooler. After it leaves the gas cooler at about the temperature of theincoming water, it drops down into the evaporator and goes through the air-to-vapor exchange at alower constant pressure and temperature. The compressor then lifts the CO2 back to the hightemperature and pressure transcritical zone, where it transfers the absorbed heat to the colder water.
In normal operation, the split system heats water in a single pass to 149°F. There is, however, a catch.Figure 14, taken from the lab assessment of the combined system by Ecotope (Larson, et al., July 2015),shows the truncation that occurs when the water coming into the system is too warm. The efficiency ofthe transcritical cycle is reduced because the invested compression energy remains the same but theheat that can be transferred to the water in the gas cooler or absorbed from the air in the evaporator isreduced.
Tank destratification means that temperature difference between the top and bottom of the tankdecreases. This can happen if heating demand is high and sustained. In this case the X-Block willcirculate enough water to exceed the tank capacity, thus causing the tank to completely mix. Also, ifheating demand exceeds the rate at which water is heated in the heat pump the auxiliary heat will turnon and increase the temperature of the heating return water to the tank.
Figure 14. Impact of Water Temperature on Heat Transfer
24
The temperature ranges that optimize performance depend on system operation. In general, low-temperature distribution systems, such as radiant floors that return water below 90°F, have higherperformance than higher-temperature systems such as radiant panels that return water above 100°F.Optimum performance depends on return temperatures no higher than 80°F, which implies a radiantslab for heat delivery and a moderate (68°F to 70°F) thermostat setting.
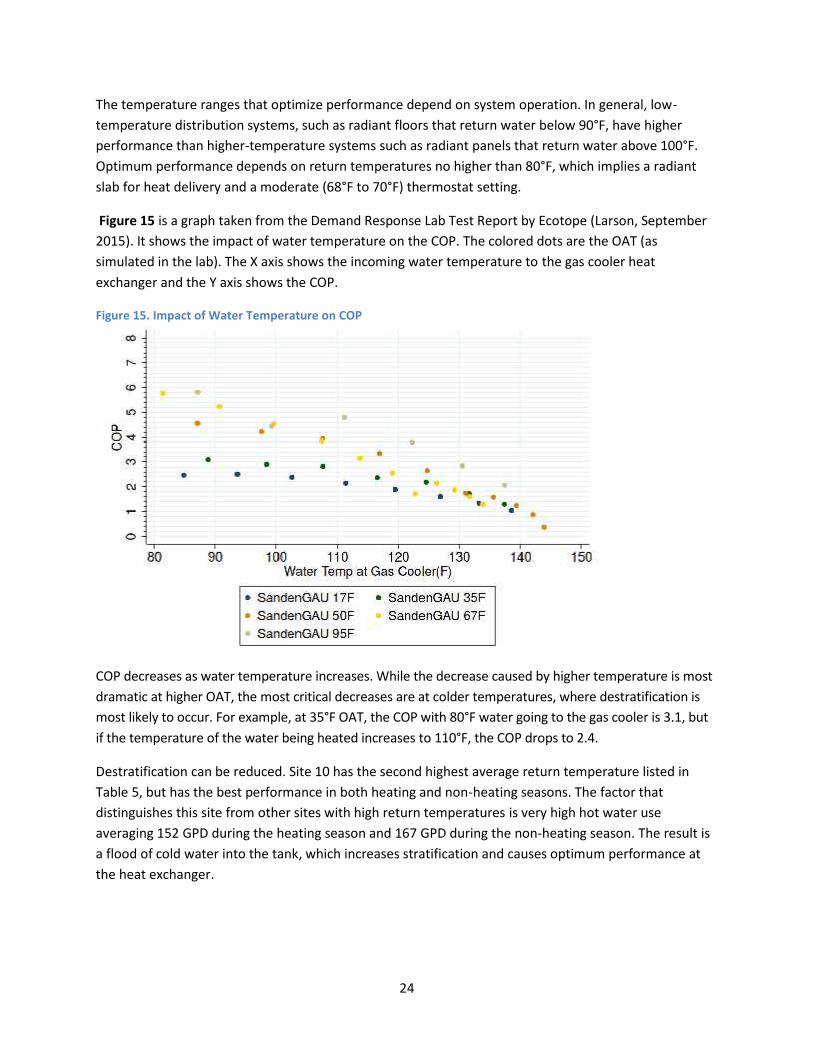
Figure 15 is a graph taken from the Demand Response Lab Test Report by Ecotope (Larson, September2015). It shows the impact of water temperature on the COP. The colored dots are the OAT (assimulated in the lab). The X axis shows the incoming water temperature to the gas cooler heatexchanger and the Y axis shows the COP.
Figure 15. Impact of Water Temperature on COP
COP decreases as water temperature increases. While the decrease caused by higher temperature is mostdramatic at higher OAT, the most critical decreases are at colder temperatures, where destratification ismost likely to occur. For example, at 35°F OAT, the COP with 80°F water going to the gas cooler is 3.1, butif the temperature of the water being heated increases to 110°F, the COP drops to 2.4.
Destratification can be reduced. Site 10 has the second highest average return temperature listed inTable 5, but has the best performance in both heating and non-heating seasons. The factor thatdistinguishes this site from other sites with high return temperatures is very high hot water useaveraging 152 GPD during the heating season and 167 GPD during the non-heating season. The result isa flood of cold water into the tank, which increases stratification and causes optimum performance atthe heat exchanger.
25
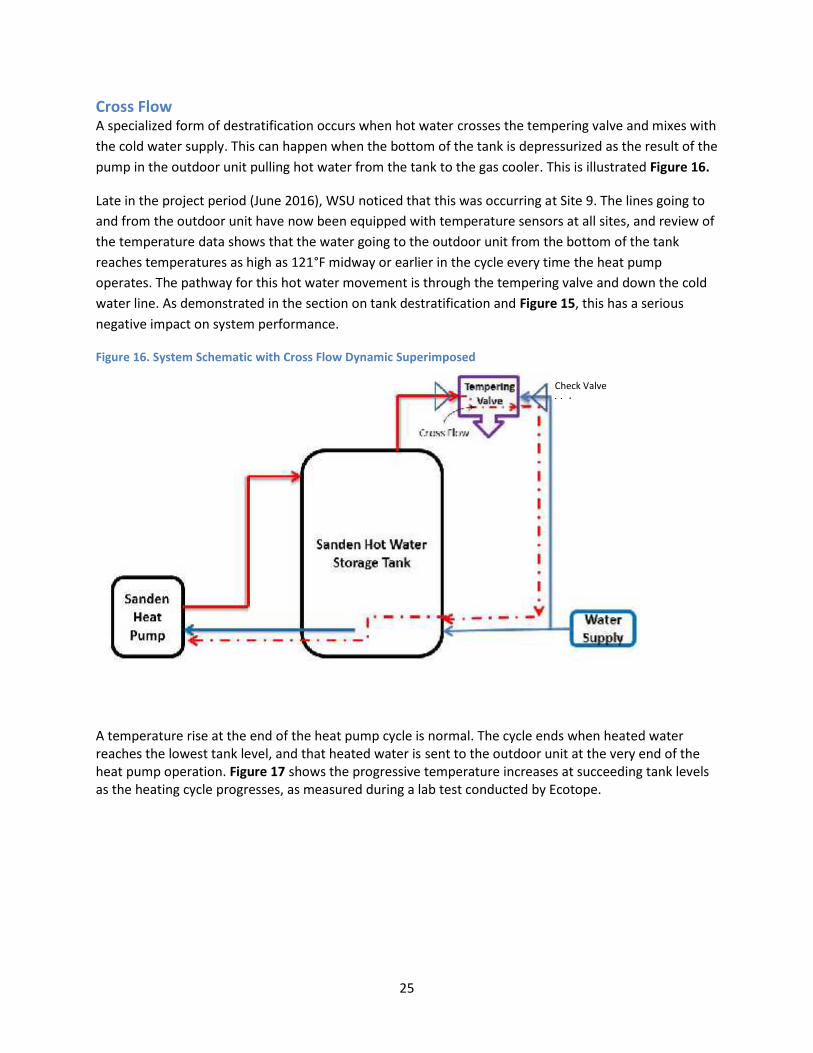
Cross FlowA specialized form of destratification occurs when hot water crosses the tempering valve and mixes withthe cold water supply. This can happen when the bottom of the tank is depressurized as the result of thepump in the outdoor unit pulling hot water from the tank to the gas cooler. This is illustrated Figure 16.
Late in the project period (June 2016), WSU noticed that this was occurring at Site 9. The lines going toand from the outdoor unit have now been equipped with temperature sensors at all sites, and review ofthe temperature data shows that the water going to the outdoor unit from the bottom of the tankreaches temperatures as high as 121°F midway or earlier in the cycle every time the heat pumpoperates. The pathway for this hot water movement is through the tempering valve and down the coldwater line. As demonstrated in the section on tank destratification and Figure 15, this has a seriousnegative impact on system performance.
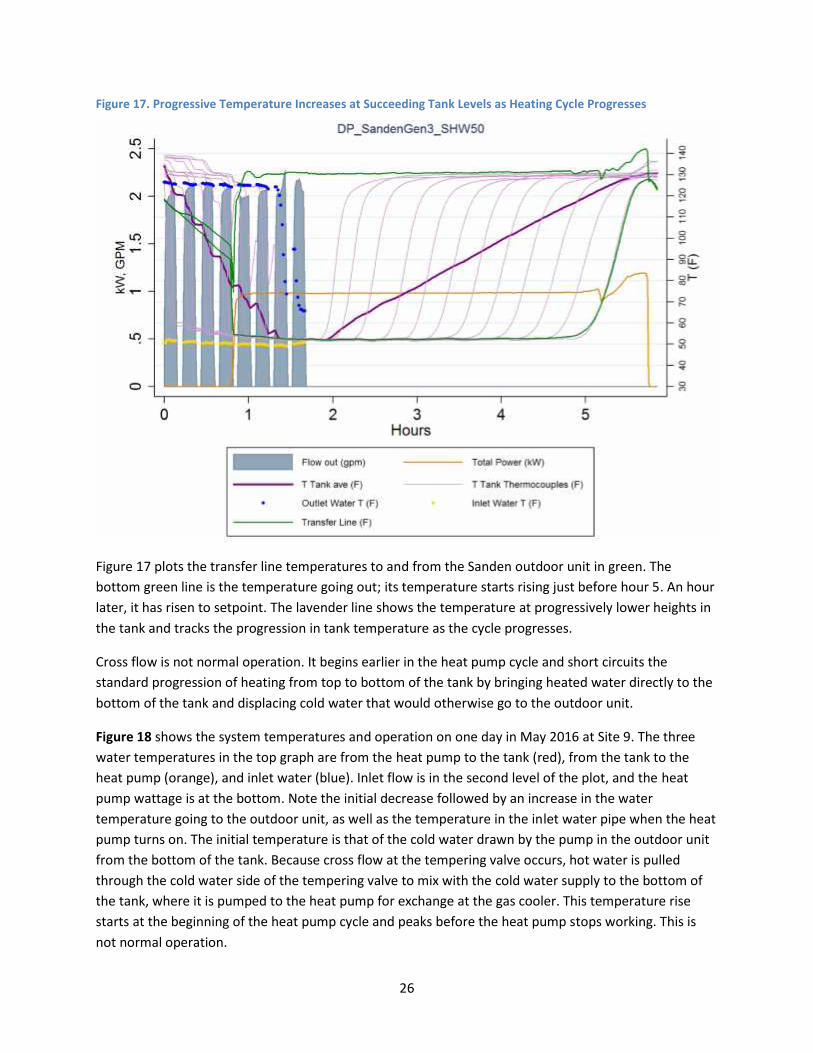
A temperature rise at the end of the heat pump cycle is normal. The cycle ends when heated waterreaches the lowest tank level, and that heated water is sent to the outdoor unit at the very end of theheat pump operation. Figure 17 shows the progressive temperature increases at succeeding tank levelsas the heating cycle progresses, as measured during a lab test conducted by Ecotope.
Figure 16. System Schematic with Cross Flow Dynamic Superimposed
Check Valve
Valves
26
Figure 17. Progressive Temperature Increases at Succeeding Tank Levels as Heating Cycle Progresses
Figure 17 plots the transfer line temperatures to and from the Sanden outdoor unit in green. Thebottom green line is the temperature going out; its temperature starts rising just before hour 5. An hourlater, it has risen to setpoint. The lavender line shows the temperature at progressively lower heights inthe tank and tracks the progression in tank temperature as the cycle progresses.
Cross flow is not normal operation. It begins earlier in the heat pump cycle and short circuits thestandard progression of heating from top to bottom of the tank by bringing heated water directly to thebottom of the tank and displacing cold water that would otherwise go to the outdoor unit.
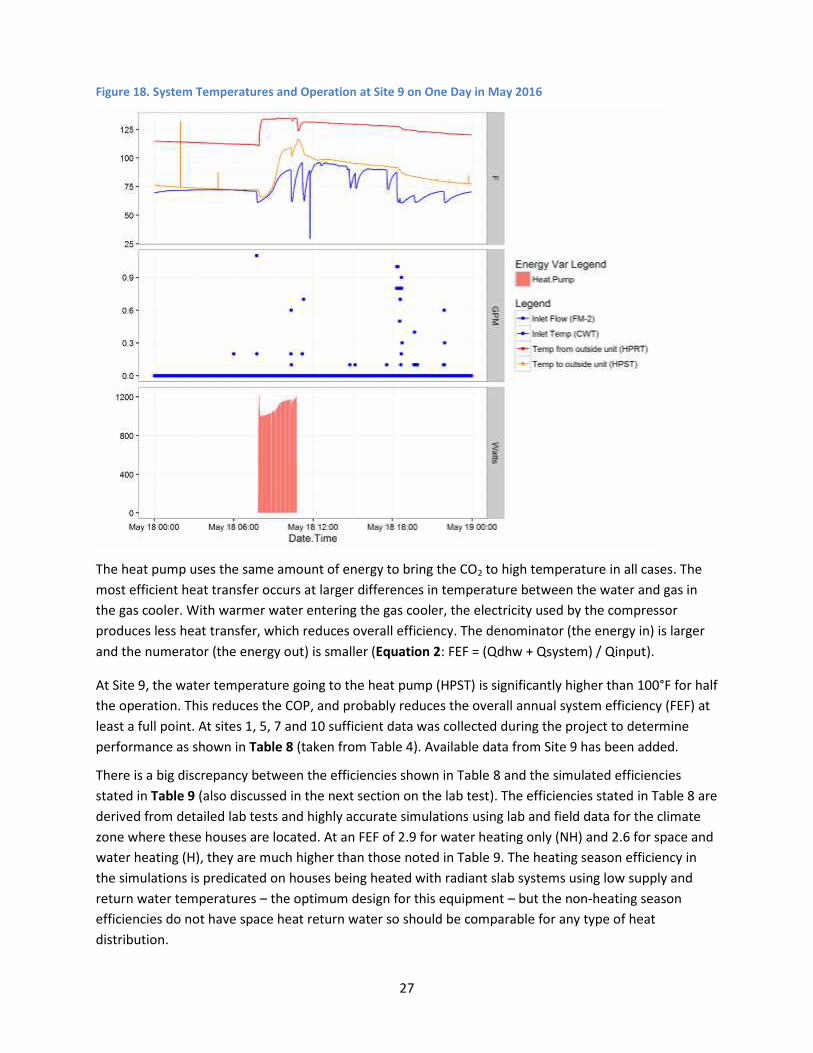
Figure 18 shows the system temperatures and operation on one day in May 2016 at Site 9. The threewater temperatures in the top graph are from the heat pump to the tank (red), from the tank to theheat pump (orange), and inlet water (blue). Inlet flow is in the second level of the plot, and the heatpump wattage is at the bottom. Note the initial decrease followed by an increase in the watertemperature going to the outdoor unit, as well as the temperature in the inlet water pipe when the heatpump turns on. The initial temperature is that of the cold water drawn by the pump in the outdoor unitfrom the bottom of the tank. Because cross flow at the tempering valve occurs, hot water is pulledthrough the cold water side of the tempering valve to mix with the cold water supply to the bottom ofthe tank, where it is pumped to the heat pump for exchange at the gas cooler. This temperature risestarts at the beginning of the heat pump cycle and peaks before the heat pump stops working. This isnot normal operation.
27
The heat pump uses the same amount of energy to bring the CO2 to high temperature in all cases. Themost efficient heat transfer occurs at larger differences in temperature between the water and gas inthe gas cooler. With warmer water entering the gas cooler, the electricity used by the compressorproduces less heat transfer, which reduces overall efficiency. The denominator (the energy in) is largerand the numerator (the energy out) is smaller (Equation 2: FEF = (Qdhw + Qsystem) / Qinput).
At Site 9, the water temperature going to the heat pump (HPST) is significantly higher than 100°F for halfthe operation. This reduces the COP, and probably reduces the overall annual system efficiency (FEF) atleast a full point. At sites 1, 5, 7 and 10 sufficient data was collected during the project to determineperformance as shown in Table 8 (taken from Table 4). Available data from Site 9 has been added.
There is a big discrepancy between the efficiencies shown in Table 8 and the simulated efficienciesstated in Table 9 (also discussed in the next section on the lab test). The efficiencies stated in Table 8 arederived from detailed lab tests and highly accurate simulations using lab and field data for the climatezone where these houses are located. At an FEF of 2.9 for water heating only (NH) and 2.6 for space andwater heating (H), they are much higher than those noted in Table 9. The heating season efficiency inthe simulations is predicated on houses being heated with radiant slab systems using low supply andreturn water temperatures – the optimum design for this equipment – but the non-heating seasonefficiencies do not have space heat return water so should be comparable for any type of heatdistribution.
Figure 18. System Temperatures and Operation at Site 9 on One Day in May 2016

28
These efficiencies are much higher than those noted in Table 8. While low domestic hot water use maycontribute to the measured lower efficiencies, it is likely that the inefficiency caused by feeding hotwater to the gas cooler every time the heat pump operates also impacts the performance. Solving thisproblem will likely bring these systems closer to the forecast efficiency.
Tempering valves are designed to prevent a burst of scalding water from going out the hot water tap.Manufacturers of tempering valves claim to make models containing integrated check valves. WSUfound an integral check valve stuck in the open position on the cold water inlet at Site 9. This findingdemonstrates that valves should be field tested to ensure they actually block the cross flow – many donot or cease to do so after a period of time. The recommended approach is to install independentspring-loaded check valves on every tempering valve feed line.
Table 8. Performance Impacted by Cross FlowSite XRWT (°F) HPST DHW (GPD) FEF Days Sampled
H Peak T on Av. Day H NH H NH H NH1 82.93 110 34.28 23.46 1.04 0.88 31 655 111.4 121 17.87 21.02 0.58 1.18 83 757 89.7 121 28.57 18.3 1.24 0.76 80 29 116 28 1.7 65
10 101.43 124 151.91 167.31 2.28 3.35 60 33
Table 9. Performance Predictions by Climate
ClimateAnnual Efficiency
Water Heating Space Heating CombinedBoise 2.9 2.3 2.5Kalispell 2.6 2.1 2.2Portland 3.0 2.6 2.7Seattle 2.9 2.6 2.7Spokane 2.8 2.2 2.4Heating Zone 1 2.9 2.5 2.6Heating Zone 2 2.8 2.2 2.4Heating Zone 3 2.6 2.1 2.2
The space heating values in Table 9 are directly comparable only to low-temperature distributionsystems such as radiant floors. Compare the Seattle space heating values to the heating season (H) FEFvalues in Table 8 for Sites 1 and 7. All of the non-heating season (NH) FEF values in Table 8 may becompared to Seattle’s water heating annual efficiency. The qualifier there is that values in Table 9 werecalculated using average daily hot water consumption of 46 gallons. Four sites are substantially belowthat value, which reduces water heating efficiency. The higher efficiency values provided for Site 10 inTable 8 are certainly related to the high hot water use at the site.
29
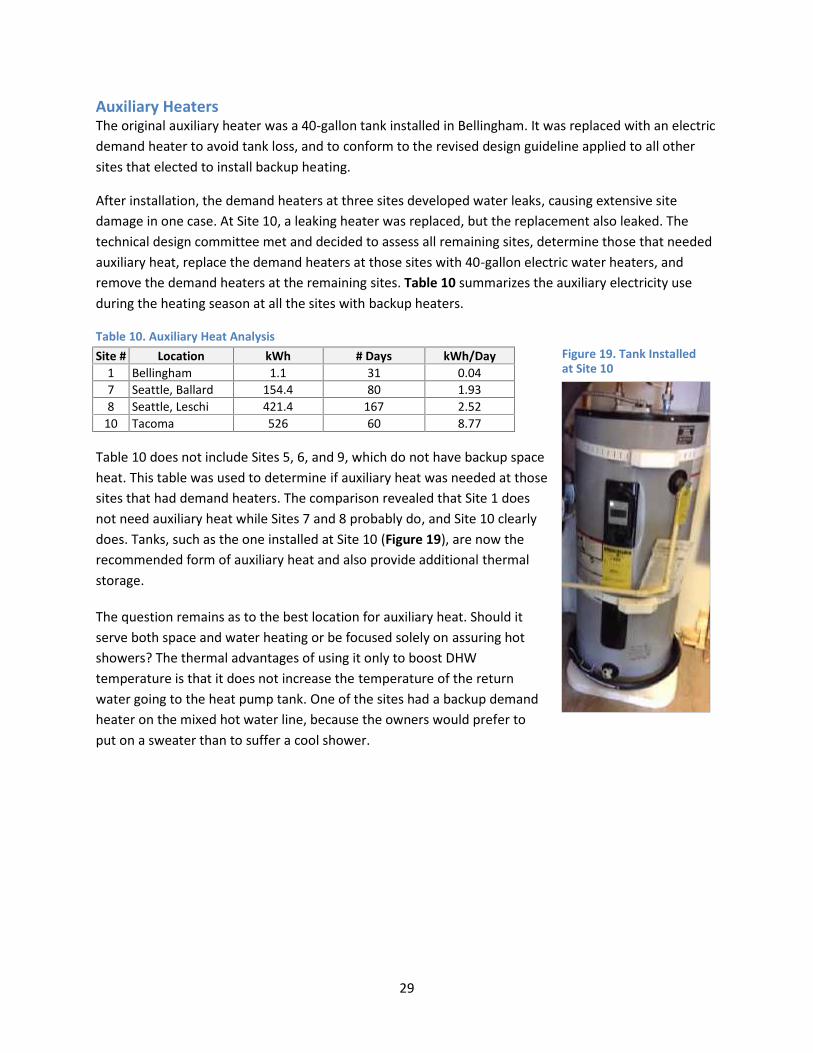
Auxiliary HeatersThe original auxiliary heater was a 40-gallon tank installed in Bellingham. It was replaced with an electricdemand heater to avoid tank loss, and to conform to the revised design guideline applied to all othersites that elected to install backup heating.
After installation, the demand heaters at three sites developed water leaks, causing extensive sitedamage in one case. At Site 10, a leaking heater was replaced, but the replacement also leaked. Thetechnical design committee met and decided to assess all remaining sites, determine those that neededauxiliary heat, replace the demand heaters at those sites with 40-gallon electric water heaters, andremove the demand heaters at the remaining sites. Table 10 summarizes the auxiliary electricity useduring the heating season at all the sites with backup heaters.
Table 10. Auxiliary Heat AnalysisSite # Location kWh # Days kWh/Day
1 Bellingham 1.1 31 0.047 Seattle, Ballard 154.4 80 1.938 Seattle, Leschi 421.4 167 2.52
10 Tacoma 526 60 8.77
Table 10 does not include Sites 5, 6, and 9, which do not have backup spaceheat. This table was used to determine if auxiliary heat was needed at thosesites that had demand heaters. The comparison revealed that Site 1 doesnot need auxiliary heat while Sites 7 and 8 probably do, and Site 10 clearlydoes. Tanks, such as the one installed at Site 10 (Figure 19), are now therecommended form of auxiliary heat and also provide additional thermalstorage.
The question remains as to the best location for auxiliary heat. Should itserve both space and water heating or be focused solely on assuring hotshowers? The thermal advantages of using it only to boost DHWtemperature is that it does not increase the temperature of the returnwater going to the heat pump tank. One of the sites had a backup demandheater on the mixed hot water line, because the owners would prefer toput on a sweater than to suffer a cool shower.
Figure 19. Tank Installedat Site 10
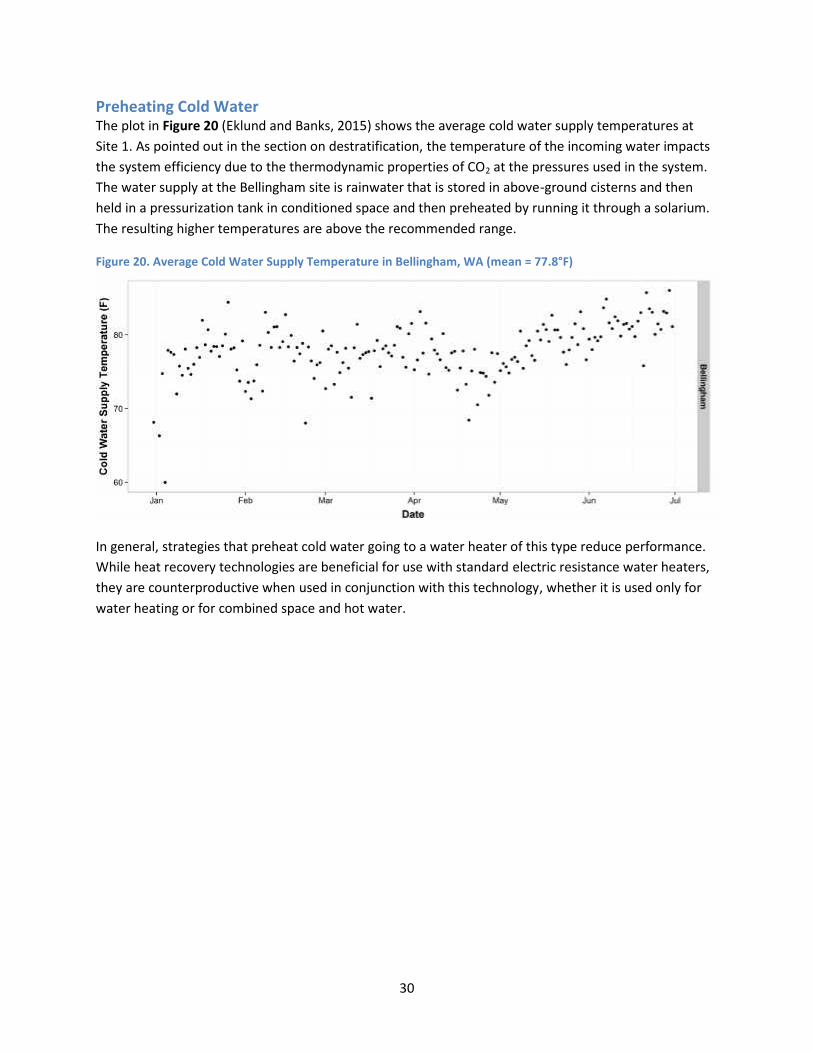
30
Preheating Cold WaterThe plot in Figure 20 (Eklund and Banks, 2015) shows the average cold water supply temperatures atSite 1. As pointed out in the section on destratification, the temperature of the incoming water impactsthe system efficiency due to the thermodynamic properties of CO2 at the pressures used in the system.The water supply at the Bellingham site is rainwater that is stored in above-ground cisterns and thenheld in a pressurization tank in conditioned space and then preheated by running it through a solarium.The resulting higher temperatures are above the recommended range.
Figure 20. Average Cold Water Supply Temperature in Bellingham, WA (mean = 77.8°F)
In general, strategies that preheat cold water going to a water heater of this type reduce performance.While heat recovery technologies are beneficial for use with standard electric resistance water heaters,they are counterproductive when used in conjunction with this technology, whether it is used only forwater heating or for combined space and hot water.
31
Combined Space and Water Heating Lab TestAs part of TIP 326, Ecotope was subcontracted to perform lab tests on the combined space and waterheating system based on the Sanden split system HPWH. The lab tests were designed to test the abilityof the combined system as designed to provide space and water heating. It also examined thealternatives available for returning the heating loop water in terms of impact on tank stratification. Thissynopsis provides a detailed overview of the test report, including procedure and findings. The fullreport is provided as a link in Appendix A.
IntroductionThe report begins with an explanation of why CO2 is used as a refrigerant (see also Appendix B). Itreviews the history of refrigerants and ozone depletion, and the contribution of hydrofluorocarbons(HFCs) to climate change because of their high Global Warming Potential (GWP). It notes that they arebeing phased out and concludes that “carbon dioxide is an unusually environmentally friendlyrefrigerant,” noting that it is not toxic, flammable, or corrosive; is inexpensive and readily available; andhas no impact on the ozone layer. The report discusses the transcritical vapor compression cycle.
The research plan addressed the following research questions:• What is the best way to test a combined hydronic system with two different loads?• What is the COP of each load?• What impact do the two loads have on each other and on system performance?• How does the system perform over a wide range of OATs?• How do the individual functions perform compared to dedicated systems previously tested?
The following questions were added to address issues noted in the first site installation:• Where in the storage tank should the water returning from the heat exchanger be delivered?• What happens to the system under high temperature and low temperature space heating
applications?• What is the heat exchanger heat transfer effectiveness?• How much energy do the circulating pumps use and what are their flow rates?
The report then discusses the equipment tested and previous test results for the Sanden system in itsdedicated function as a water heater.
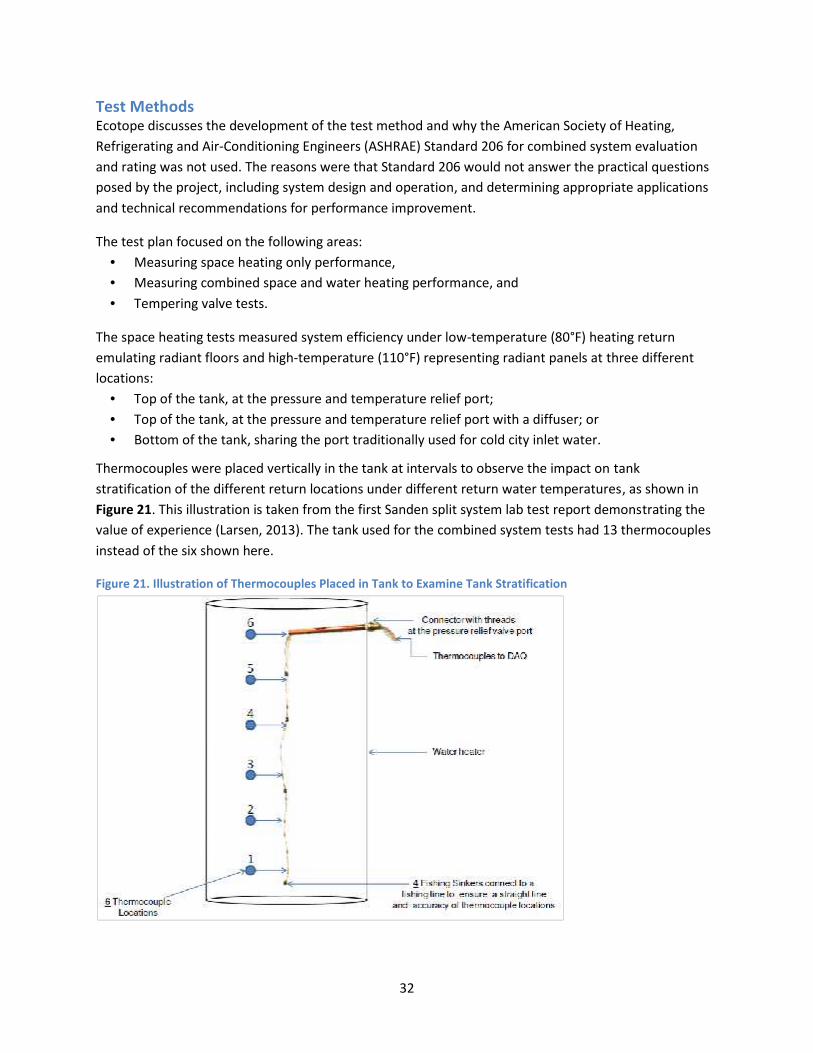
32
Test MethodsEcotope discusses the development of the test method and why the American Society of Heating,Refrigerating and Air-Conditioning Engineers (ASHRAE) Standard 206 for combined system evaluationand rating was not used. The reasons were that Standard 206 would not answer the practical questionsposed by the project, including system design and operation, and determining appropriate applicationsand technical recommendations for performance improvement.
The test plan focused on the following areas:• Measuring space heating only performance,• Measuring combined space and water heating performance, and• Tempering valve tests.
The space heating tests measured system efficiency under low-temperature (80°F) heating returnemulating radiant floors and high-temperature (110°F) representing radiant panels at three differentlocations:
• Top of the tank, at the pressure and temperature relief port;• Top of the tank, at the pressure and temperature relief port with a diffuser; or• Bottom of the tank, sharing the port traditionally used for cold city inlet water.
Thermocouples were placed vertically in the tank at intervals to observe the impact on tankstratification of the different return locations under different return water temperatures, as shown inFigure 21. This illustration is taken from the first Sanden split system lab test report demonstrating thevalue of experience (Larsen, 2013). The tank used for the combined system tests had 13 thermocouplesinstead of the six shown here.
Figure 21. Illustration of Thermocouples Placed in Tank to Examine Tank Stratification
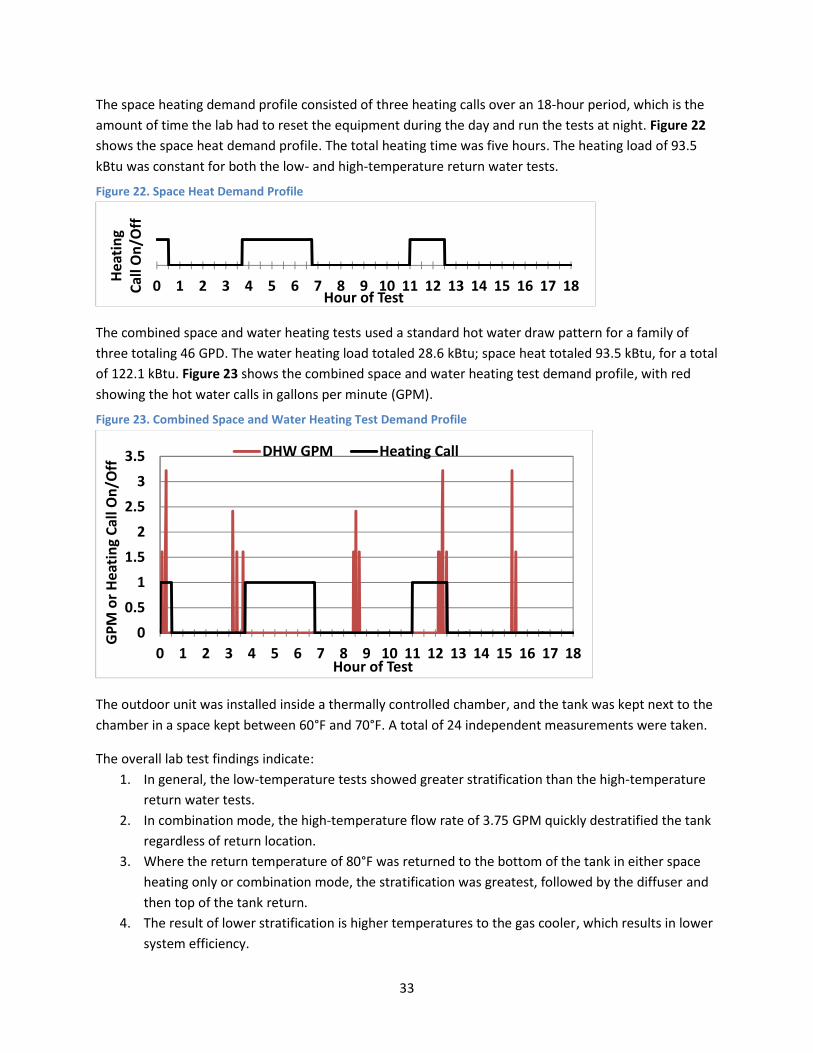
33
The space heating demand profile consisted of three heating calls over an 18-hour period, which is theamount of time the lab had to reset the equipment during the day and run the tests at night. Figure 22shows the space heat demand profile. The total heating time was five hours. The heating load of 93.5kBtu was constant for both the low- and high-temperature return water tests.
Figure 22. Space Heat Demand Profile
The combined space and water heating tests used a standard hot water draw pattern for a family ofthree totaling 46 GPD. The water heating load totaled 28.6 kBtu; space heat totaled 93.5 kBtu, for a totalof 122.1 kBtu. Figure 23 shows the combined space and water heating test demand profile, with redshowing the hot water calls in gallons per minute (GPM).
Figure 23. Combined Space and Water Heating Test Demand Profile
The outdoor unit was installed inside a thermally controlled chamber, and the tank was kept next to thechamber in a space kept between 60°F and 70°F. A total of 24 independent measurements were taken.
The overall lab test findings indicate:1. In general, the low-temperature tests showed greater stratification than the high-temperature
return water tests.2. In combination mode, the high-temperature flow rate of 3.75 GPM quickly destratified the tank
regardless of return location.3. Where the return temperature of 80°F was returned to the bottom of the tank in either space
heating only or combination mode, the stratification was greatest, followed by the diffuser andthen top of the tank return.
4. The result of lower stratification is higher temperatures to the gas cooler, which results in lowersystem efficiency.
0 1 2 3 4 5 6 7 8 9 10 11 12 13 14 15 16 17 18Heat
ing
Call
On/
Off
Hour of Test
00.5
11.5
22.5
33.5
0 1 2 3 4 5 6 7 8 9 10 11 12 13 14 15 16 17 18
GPM
or H
eatin
g Ca
ll O
n/O
ff
Hour of Test
DHW GPM Heating Call
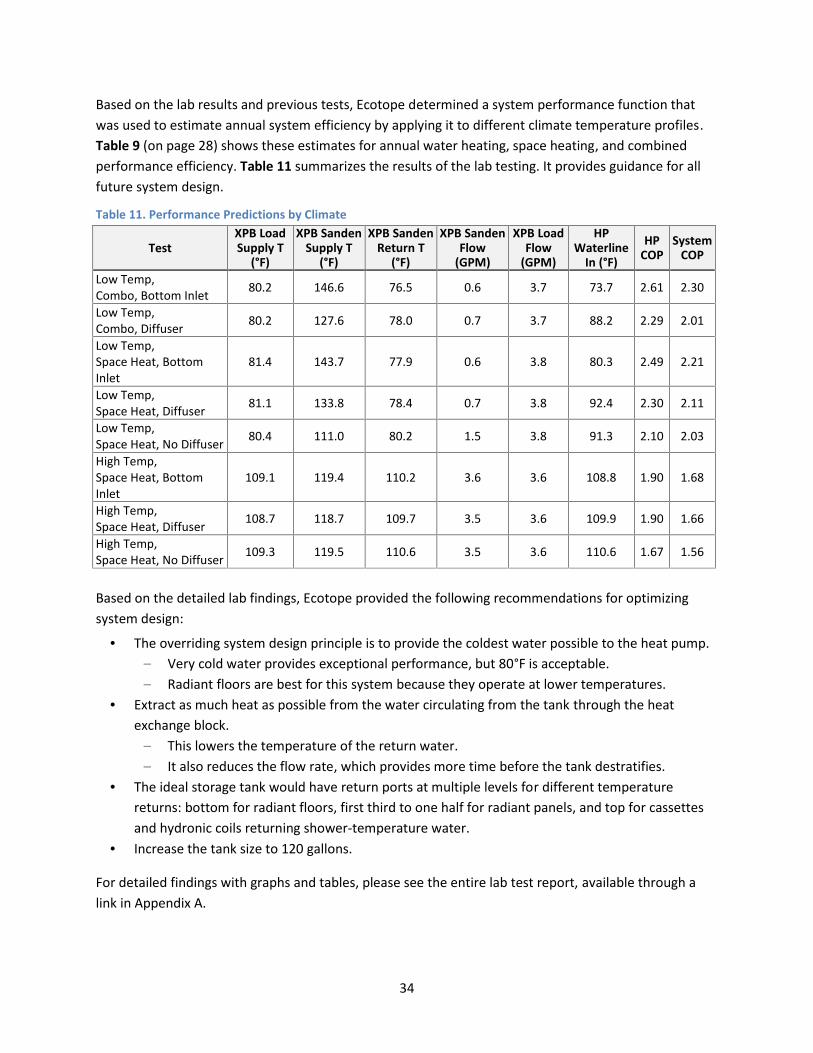
34
Based on the lab results and previous tests, Ecotope determined a system performance function thatwas used to estimate annual system efficiency by applying it to different climate temperature profiles.Table 9 (on page 28) shows these estimates for annual water heating, space heating, and combinedperformance efficiency. Table 11 summarizes the results of the lab testing. It provides guidance for allfuture system design.
Table 11. Performance Predictions by Climate
TestXPB LoadSupply T
(°F)
XPB SandenSupply T
(°F)
XPB SandenReturn T
(°F)
XPB SandenFlow
(GPM)
XPB LoadFlow
(GPM)
HPWaterline
In (°F)
HPCOP
SystemCOP
Low Temp,Combo, Bottom Inlet 80.2 146.6 76.5 0.6 3.7 73.7 2.61 2.30
Low Temp,Combo, Diffuser 80.2 127.6 78.0 0.7 3.7 88.2 2.29 2.01
Low Temp,Space Heat, BottomInlet
81.4 143.7 77.9 0.6 3.8 80.3 2.49 2.21
Low Temp,Space Heat, Diffuser 81.1 133.8 78.4 0.7 3.8 92.4 2.30 2.11
Low Temp,Space Heat, No Diffuser 80.4 111.0 80.2 1.5 3.8 91.3 2.10 2.03
High Temp,Space Heat, BottomInlet
109.1 119.4 110.2 3.6 3.6 108.8 1.90 1.68
High Temp,Space Heat, Diffuser 108.7 118.7 109.7 3.5 3.6 109.9 1.90 1.66
High Temp,Space Heat, No Diffuser 109.3 119.5 110.6 3.5 3.6 110.6 1.67 1.56
Based on the detailed lab findings, Ecotope provided the following recommendations for optimizingsystem design:
• The overriding system design principle is to provide the coldest water possible to the heat pump.– Very cold water provides exceptional performance, but 80°F is acceptable.– Radiant floors are best for this system because they operate at lower temperatures.
• Extract as much heat as possible from the water circulating from the tank through the heatexchange block.
– This lowers the temperature of the return water.– It also reduces the flow rate, which provides more time before the tank destratifies.
• The ideal storage tank would have return ports at multiple levels for different temperaturereturns: bottom for radiant floors, first third to one half for radiant panels, and top for cassettesand hydronic coils returning shower-temperature water.
• Increase the tank size to 120 gallons.
For detailed findings with graphs and tables, please see the entire lab test report, available through alink in Appendix A.
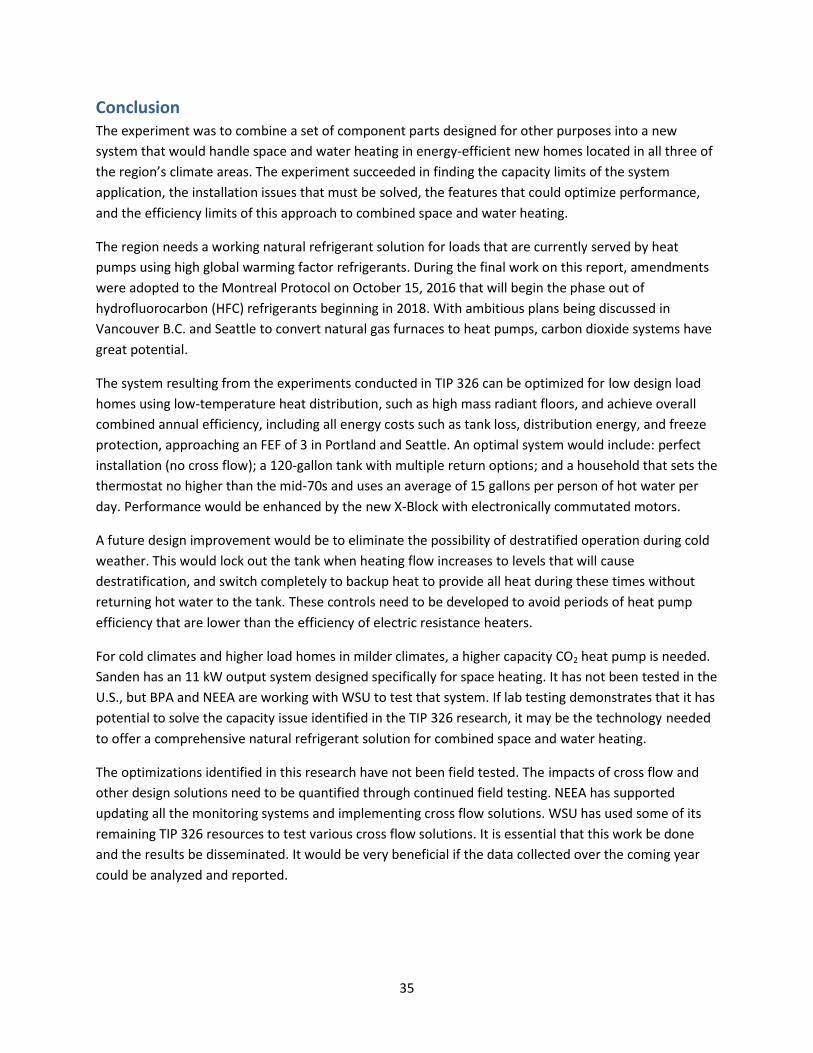
35
ConclusionThe experiment was to combine a set of component parts designed for other purposes into a newsystem that would handle space and water heating in energy-efficient new homes located in all three ofthe region’s climate areas. The experiment succeeded in finding the capacity limits of the systemapplication, the installation issues that must be solved, the features that could optimize performance,and the efficiency limits of this approach to combined space and water heating.
The region needs a working natural refrigerant solution for loads that are currently served by heatpumps using high global warming factor refrigerants. During the final work on this report, amendmentswere adopted to the Montreal Protocol on October 15, 2016 that will begin the phase out ofhydrofluorocarbon (HFC) refrigerants beginning in 2018. With ambitious plans being discussed inVancouver B.C. and Seattle to convert natural gas furnaces to heat pumps, carbon dioxide systems havegreat potential.
The system resulting from the experiments conducted in TIP 326 can be optimized for low design loadhomes using low-temperature heat distribution, such as high mass radiant floors, and achieve overallcombined annual efficiency, including all energy costs such as tank loss, distribution energy, and freezeprotection, approaching an FEF of 3 in Portland and Seattle. An optimal system would include: perfectinstallation (no cross flow); a 120-gallon tank with multiple return options; and a household that sets thethermostat no higher than the mid-70s and uses an average of 15 gallons per person of hot water perday. Performance would be enhanced by the new X-Block with electronically commutated motors.
A future design improvement would be to eliminate the possibility of destratified operation during coldweather. This would lock out the tank when heating flow increases to levels that will causedestratification, and switch completely to backup heat to provide all heat during these times withoutreturning hot water to the tank. These controls need to be developed to avoid periods of heat pumpefficiency that are lower than the efficiency of electric resistance heaters.
For cold climates and higher load homes in milder climates, a higher capacity CO2 heat pump is needed.Sanden has an 11 kW output system designed specifically for space heating. It has not been tested in theU.S., but BPA and NEEA are working with WSU to test that system. If lab testing demonstrates that it haspotential to solve the capacity issue identified in the TIP 326 research, it may be the technology neededto offer a comprehensive natural refrigerant solution for combined space and water heating.
The optimizations identified in this research have not been field tested. The impacts of cross flow andother design solutions need to be quantified through continued field testing. NEEA has supportedupdating all the monitoring systems and implementing cross flow solutions. WSU has used some of itsremaining TIP 326 resources to test various cross flow solutions. It is essential that this work be doneand the results be disseminated. It would be very beneficial if the data collected over the coming yearcould be analyzed and reported.
36
Recommendations1. The cross flow issue may impact all of the seven systems that remain in operation. It must be
thoroughly investigated and a practical solution found because it appears to a have a significantimpact on system performance. To date, three different Honeywell tempering valve models withintegral check valves, including the model that Sanden is shipping with every split system sold,have failed to consistently stop cross flow.
2. The recommendations by Ecotope from its lab test should be field tested. Foremost amongthese is the large 120-gallon tank with return ports at different levels to optimize performanceto the heating system type.
3. Power-out freeze protection requirements need to be carefully considered. This adds cost to thesystem, and it needs to be determined if it should be required at all locations regardless ofclimate. Freeze time was investigated by Ecotope in the lab test for TIP 302 (Larson, September2015, p. 25).
4. The TIP 326 field test with the seven surviving sites should be continued for another ninemonths. The data gathered and analyzed in this report was impacted by monitoring equipmentissues, re-design and re-plumbing issues, and cross flow issues. None of these issues wererelated to the heat pump, details of its performance are really unknown.
a. The metering equipment is now updated and operational at all sites. The monitoringlicenses have been extended by NEEA and the homeowner agreements all extend toJune 30, 2017.
b. It will provide an opportunity to determine an effective cross flow solution and install itat all sites in October and early November of 2016. This will allow data from most of theensuing heating season, spring, and summer to be collected without interference fromthis performance debilitating issue.
c. Monitoring, data analysis, and an updated report could be obtained at modest cost,considering that the major investment is already made. It was overly optimistic toattempt to build new homes, design and install a new prototype unit, and monitor itduring this process and expect that representative data would be obtained.
5. The two remaining cold weather sites in McCall, ID, need to undergo testing of the large-capacity unit design specifically for space heating. The monitoring systems are installed andfunctioning. NEEA is committed to installing the large-capacity units. Time and funding areneeded to collect and analyze the data and report the results. Once again, the major part of theinvestment is already made or committed.
37
ReferencesEcotope and NEEA (March 2015). Heat Pump Water Heater Model Validation Study.http://neea.org/docs/default-source/reports/heat-pump-water-heater-saving-validation-study.pdf?sfvrsn=8
Eklund, K., Banks, A. (December 2015). Advanced Heat Pump Water Heater Research Final Report –Technology Innovation Project 292. Prepared by the Washington State University Energy Program.http://www.energy.wsu.edu/Documents/Final%20Report%20TIP%20292_Dec%202015.pdf
Eklund, K. (September 2016). Assessment of Demand Response Potential of Heat Pump Water HeatersFinal Report. Prepared by the Washington State University Energy Program.
Eklund, K. and Banks, A. (September 2015). Combined Space and Water CO2 Heat Pump SystemPerformance Research – First Midterm Field Study Report, Technology Innovation Project 326, Preparedby the Washington State University Energy Program.
Eklund, K. and Banks, A. (October 2014). Advanced Heat Pump Water Heater Research First MidtermField Study Report. Updated March 2015. Prepared by the Washington State University Energy Program.http://www.energy.wsu.edu/documents/FirstMidtermReportonMonitoringofAdvancedHPWHfromInstallationthruMarch2014-Final.pdf
Fluid Market Strategies and NEEA (October 2013). NEEA Heat Pump Water Heater Field Study Report.http://neea.org/docs/default-source/reports/heat-pump-water-heater-field-study-report.pdf?sfvrsn=5
Larson, B. (September 2015). Laboratory Assessment of Demand Response Characteristics of Two CO2
Heat Pump Water Heaters. A Report of BPA Technology Innovation Project #302. Prepared by Ecotope.
Larson, B., et al. (July 2015). Laboratory Assessment of Combination Space and Water HeatingApplications of a CO2 Heat Pump Water Heater. Prepared by Ecotope.
Larson, B. (September 2013). Laboratory Assessment of Sanden GAU Heat Pump Water Heater. A Reportof BPA Technology Innovation Project #292. Prepared by Ecotope, Inc. for the WSU Energy Programunder contract to BPA.http://www.energy.wsu.edu/documents/Sanden_CO2_split_HWPH_lab_report_Final_Sept%202013.pdf
Sullivan, G. (July 2015). Demand-Response Performance of Sanden HPWH. Prepared by PNNL.
Thompson, M. and Kujak, S. (August 2016). Merging the Transition to Next Generation HVAC RefrigerantTechnology with Effective Climate Policy. Proceedings ACEEE 2016 Summer Study in Buildings.

Appendix A-1
Appendix A: Laboratory AssessmentThe Laboratory Assessment of Combination Space and Water Heating Applications of a CO2 Heat PumpWater Heater, July 2016, is provided as a link: Lab Test Report for Combined Space and Water HeatingSystems
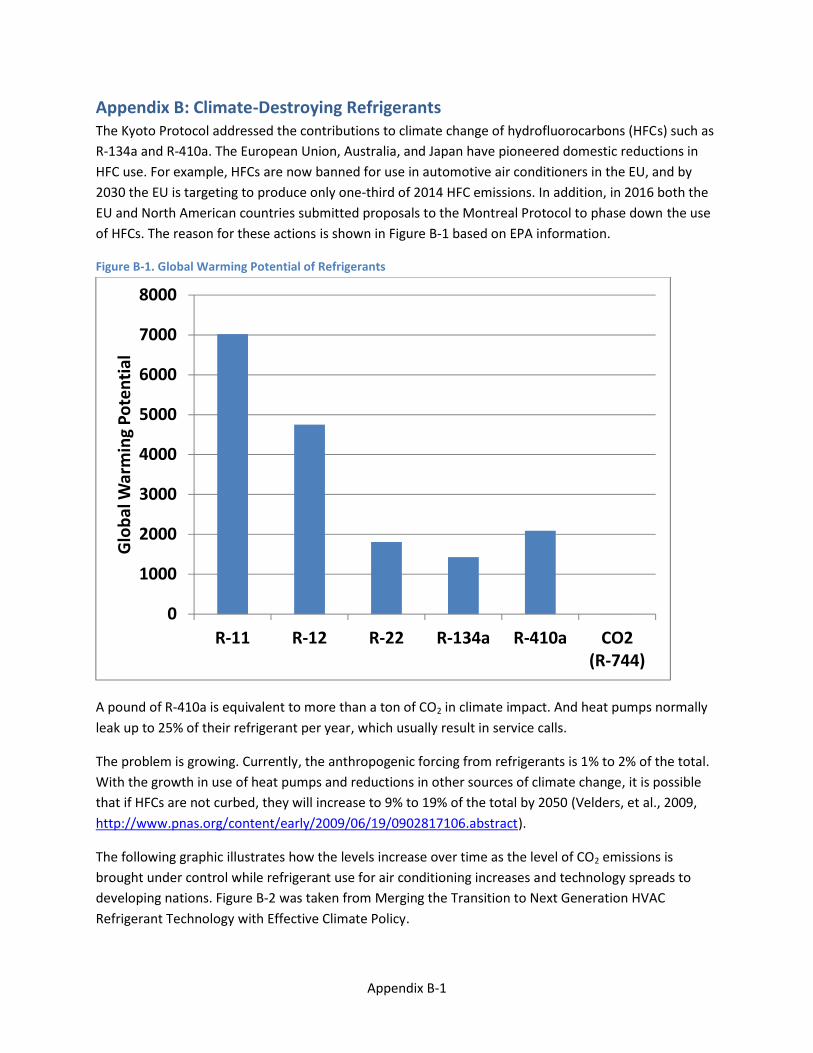
Appendix B-1
Appendix B: Climate-Destroying RefrigerantsThe Kyoto Protocol addressed the contributions to climate change of hydrofluorocarbons (HFCs) such asR-134a and R-410a. The European Union, Australia, and Japan have pioneered domestic reductions inHFC use. For example, HFCs are now banned for use in automotive air conditioners in the EU, and by2030 the EU is targeting to produce only one-third of 2014 HFC emissions. In addition, in 2016 both theEU and North American countries submitted proposals to the Montreal Protocol to phase down the useof HFCs. The reason for these actions is shown in Figure B-1 based on EPA information.
Figure B-1. Global Warming Potential of Refrigerants
A pound of R-410a is equivalent to more than a ton of CO2 in climate impact. And heat pumps normallyleak up to 25% of their refrigerant per year, which usually result in service calls.
The problem is growing. Currently, the anthropogenic forcing from refrigerants is 1% to 2% of the total.With the growth in use of heat pumps and reductions in other sources of climate change, it is possiblethat if HFCs are not curbed, they will increase to 9% to 19% of the total by 2050 (Velders, et al., 2009,http://www.pnas.org/content/early/2009/06/19/0902817106.abstract).
The following graphic illustrates how the levels increase over time as the level of CO2 emissions isbrought under control while refrigerant use for air conditioning increases and technology spreads todeveloping nations. Figure B-2 was taken from Merging the Transition to Next Generation HVACRefrigerant Technology with Effective Climate Policy.
0
1000
2000
3000
4000
5000
6000
7000
8000
R-11 R-12 R-22 R-134a R-410a CO2(R-744)
Glo
bal W
arm
ing
Pote
ntia
l
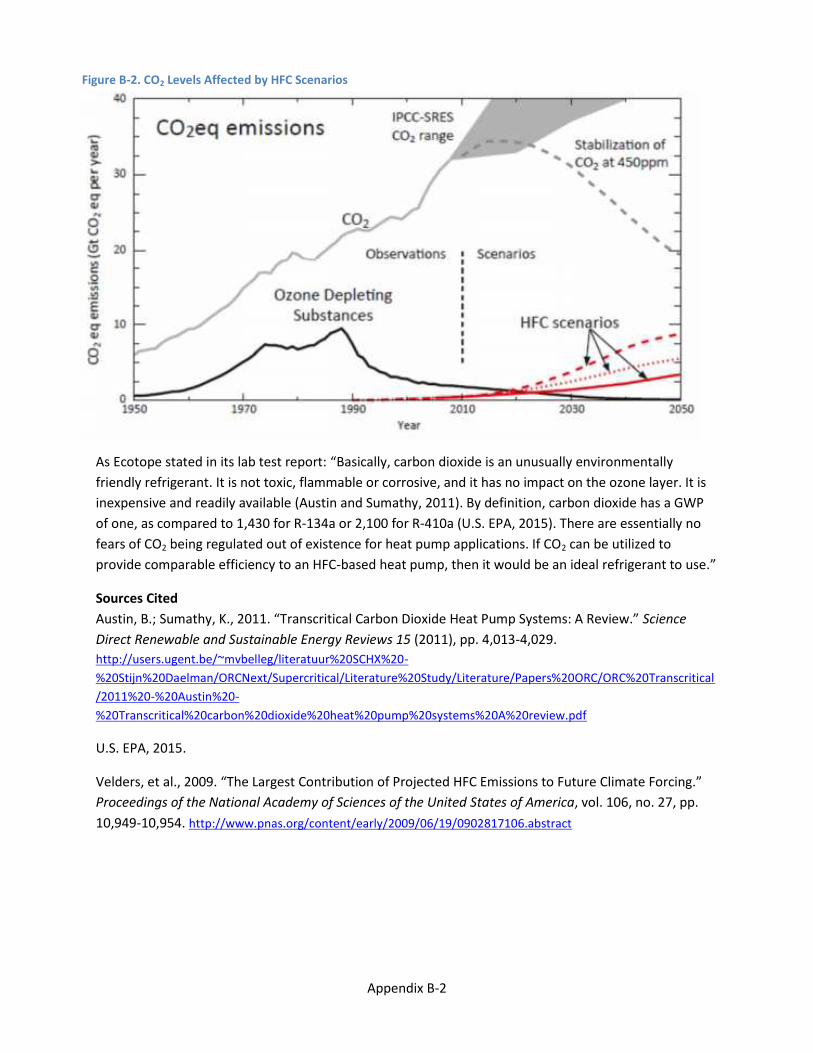
Appendix B-2
As Ecotope stated in its lab test report: “Basically, carbon dioxide is an unusually environmentallyfriendly refrigerant. It is not toxic, flammable or corrosive, and it has no impact on the ozone layer. It isinexpensive and readily available (Austin and Sumathy, 2011). By definition, carbon dioxide has a GWPof one, as compared to 1,430 for R-134a or 2,100 for R-410a (U.S. EPA, 2015). There are essentially nofears of CO2 being regulated out of existence for heat pump applications. If CO2 can be utilized toprovide comparable efficiency to an HFC-based heat pump, then it would be an ideal refrigerant to use.”
Sources CitedAustin, B.; Sumathy, K., 2011. “Transcritical Carbon Dioxide Heat Pump Systems: A Review.” ScienceDirect Renewable and Sustainable Energy Reviews 15 (2011), pp. 4,013-4,029.http://users.ugent.be/~mvbelleg/literatuur%20SCHX%20-%20Stijn%20Daelman/ORCNext/Supercritical/Literature%20Study/Literature/Papers%20ORC/ORC%20Transcritical/2011%20-%20Austin%20-%20Transcritical%20carbon%20dioxide%20heat%20pump%20systems%20A%20review.pdf
U.S. EPA, 2015.
Velders, et al., 2009. “The Largest Contribution of Projected HFC Emissions to Future Climate Forcing.”Proceedings of the National Academy of Sciences of the United States of America, vol. 106, no. 27, pp.10,949-10,954. http://www.pnas.org/content/early/2009/06/19/0902817106.abstract
Figure B-2. CO2 Levels Affected by HFC Scenarios