Embed Size (px)
Citation preview
ARTICLE
Combined In Silico Modeling and MetabolomicsAnalysis to Characterize Fed-Batch CHO CellCulture
Suresh Selvarasu,1 Ying Swan Ho,1 William P. K. Chong,1 Niki S. C. Wong,1
Faraaz N. K. Yusufi,1 Yih Yean Lee,1 Miranda G. S. Yap,1,2 Dong-Yup Lee1,2
1Bioprocessing Technology Institute, Agency for Science, Technology and Research
(A�STAR), 20 Biopolis Way, #06-01, Centros, Singapore 138668, Singapore;
telephone: þ65-6516-6907; fax: þ65-6779-1936; e-mail: [email protected] of Chemical and Biomolecular Engineering, National University of Singapore,
4 Engineering Drive 4, Singapore 117576, Singapore
Received 6 October 2011; revision received 11 January 2012; accepted 12 January 2012
Published online 31 January 2012 in Wiley Online Library (wileyonlinelibrary.com). DOI 10.1002/bit.24445
ABSTRACT: The increasing demand for recombinant ther-apeutic proteins highlights the need to constantly improvethe efficiency and yield of these biopharmaceutical productsfrom mammalian cells, which is fully achievable onlythrough proper understanding of cellular functioning. To-wards this end, the current study exploited a combinedmetabolomics and in silico modeling approach to gain adeeper insight into the cellular mechanisms of Chinesehamster ovary (CHO) fed-batch cultures. Initially, extracel-lular and intracellular metabolite profiling analysis short-listed key metabolites associated with cell growth limitationwithin the energy, glutathione, and glycerophospholipidpathways that have distinct changes at the exponential-stationary transition phase of the cultures. In addition,biomass compositional analysis newly revealed differentamino acid content in the CHO cells from other mammaliancells, indicating the significance of accurate protein compo-sition data in metabolite balancing across required nutrientassimilation, metabolic utilization, and cell growth. Subse-quent in silico modeling of CHO cells characterized internalmetabolic behaviors attaining physiological changes duringgrowth and non-growth phases, thereby allowing us toexplore relevant pathways to growth limitation and identifymajor growth-limiting factors including the oxidative stressand depletion of lipid metabolites. Such key informationon growth-related mechanisms derived from the currentapproach can potentially guide the development of newstrategies to enhance CHO culture performance.
Biotechnol. Bioeng. 2012;109: 1415–1429.
� 2012 Wiley Periodicals, Inc.
KEYWORDS: mammalian systems biotechnology; CHOcells; constraints-based flux analysis; metabolomics;genome-scale metabolic model
Introduction
The majority of recombinant protein drugs currentlyavailable are predominantly produced by mammalian cellsunder various cell culture modes (Butler, 2005; Reff, 1993).In order to meet the increasing demand of suchbiopharmaceutical products, significant efforts have beenmade for improving the recombinant protein productionyield from mammalian cell cultures (Barnes and Dickson,2006; Ma et al., 2009). Among available mammalian celllines, Chinese hamster ovary (CHO) cells play a major rolein the industrial production of recombinant therapeutics(Jayapal et al., 2007). To date, various approaches havebeen explored to enhance CHO culture performance byinvestigating the effect of genetic/environmental perturba-tion on the cell growth and productivity via changes in geneexpression (Schaub et al., 2009), studying the correlationof glucose and lactate metabolism with cell density underdifferent culture conditions (Tsao et al., 2005) andexamining the impact of replacing glutamine with alternatecarbon sources such as glutamate or pyruvate on the cellgrowth (Altamirano et al., 2001; Genzel et al., 2005). Whilethese approaches help to characterize the functionalbehavior of CHO cells qualitatively, quantitative improve-ments may not be easily achieved due to the limitedunderstanding of intracellular metabolic activities (Dinnisand James, 2005). To address this limitation, a number of
Suresh Selvarasu and Ying Swan Ho contributed equally to this work.
Correspondence to: D.-Y. Lee
Contract grant sponsor: Agency for Science, Technology and Research, Singapore
Contract grant sponsor: Next-Generation BioGreen 21 Program
Contract grant number: PJ008184
Contract grant sponsor: Rural Development Administration, Republic of Korea
Additional supporting information may be found in the online version of this article.
� 2012 Wiley Periodicals, Inc. Biotechnology and Bioengineering, Vol. 109, No. 6, June, 2012 1415
‘‘-omics’’ profiling technologies such as transcriptomics(Schaub et al., 2009), proteomics (Yizhak et al., 2010), andmost recently, metabolomics (Chong et al., 2009; Ma et al.,2009) have been utilized to gain a more in-depth insightinto the complex mechanisms involved in the regulationof major cellular processes. Of the different ‘‘-omics’’technologies, metabolomics analysis enabled us to directlyidentify key metabolites and pathways closely associatedwith growth limitation and apoptosis (Chong et al., 2011).
Concurrently, advances in genomic technologies havealso led to the development of computational models ofcellular organisms that allow for the systematic elucidationof their genotype–phenotype characteristics (Lee et al., 2005;Price et al., 2003). The primary requirement of thesemodeling approaches includes the incorporation of genomeannotation, biochemical and cell physiological data (Ma andZeng, 2003). Such models have been developed for a widerange of microbes (Covert et al., 2003; Lee et al., 2005; Priceet al., 2004) and only a handful of mammalian systems suchas Homo sapiens, Mus musculus, and Cannis fabris (Duarteet al., 2007; Price et al., 2004; Selvarasu et al., 2010a; Wahlet al., 2008). Indeed, these models have been successfullyexploited in understanding the cell physiological activities ofvarious microorganisms in conjunction with ‘‘-omics’’ datafor biotechnological and biomedical applications within thecontext of systems biology (Lee et al., 2005; O’Callaghan andJames, 2008). Similarly, for mammalian cell culture, it isnow possible to combine in silico metabolic modeling withglobal ‘‘-omics’’ data for better understanding of cell cultureprocesses at the extracellular and intracellular levels (Leeet al., 2006; Mo et al., 2009).
In this study, as illustrated in Figure 1, we present anintegrated framework where CHO fed-batch culture dataare analyzed and combined with metabolomics profiles,followed by in silico modeling and analysis of mammaliancells to investigate their metabolic states and cellularphysiology during the culture (Selvarasu et al., 2010a).
Materials and Methods
Cell Lines and Media
CHO cell lines expressing recombinant monoclonal anti-body (IgG) against Rhesus D antigen were in-housegenerated (Chusainow et al., 2009). CHO mAb M250-9(M250-9) was a sub-clone derived from additional roundsof methothrexate (MTX) amplification at 250 nM. For themeasurement of CHO cell composition, M250-9 cells werecultured in a mixture consisting of a 1:1 (v/v) ratio of HyQPF-CHO (Hyclone, Logan, UT) and CD CHO (Gibco-Invitrogen, Carlsbad, CA) supplemented with 6mML-glutamine (Sigma–Aldrich, St. Louis, MO) and 0.05% (v/v)Pluronic1 F-68 (Invitrogen, Carlsbad, CA). Additional250 nM MTX (Sigma–Aldrich) was added to the culture.The cell line was maintained in a humidified incubatorcontrolled at 378C under 8% CO2 overlay. In addition, other
CHO cell lines (CHO mAb M500-7, CHO K1, CHO DG44,and CHO DXB11) were also prepared for biomass com-positional analysis. The method to determine cell composi-tion of these cell lines is described in Supplementary 1.
Bioreactor Operations
The cultures were conducted in a 5 L double-walled, round-bottom glass vessel (B. Braun, Melsungen, Germany) witha heated water jacket. The reactor was inoculated with aseeding density of 3� 105 cells/mL at a working volume of4 L. The bubble-less aeration was effected through the useof a silicon membrane tubing basket (B. Braun) and thedissolved oxygen (DO) concentration maintained at 50% ofair saturation using an Air/N2 mix (early phase) or O2/Airmix (late phase) set at 1 L/min. The agitation rate wasset at 120 rpm using a three-blade segmented impeller. Theculture pH was maintained at 6.9 using intermittent CO2
addition to the gas mix or 8.6% (w/v) NaHCO3 (Sigma–Aldrich) solution.
The M250-9 cells were adapted to in-house proprietaryprotein-free, chemically defined (PFCD) media before thebioreactor runs and the protein-free feed was formulatedbased on a fortified 10� DMEM/F12 (Sigma–Aldrich).Glutamine and glutamate concentrations in the culture weretracked online using an automated aseptic online samplingloop as previously described (Lee et al., 2003). Onlinesampling of glutamine/glutamate level was done every 1.5 hwith YSI 7100 biochemical analyzer (Yellow SpringsInstruments, Yellow Springs, OH) and an online algorithmcalculated the amount of concentrated feed required tomaintain cultures at a pre-set glutamine level of 0.6mM.Online oxygen uptake rate (OUR) estimation was doneusing the stationary liquid phase balance, maintaining aconstant oxygen mass transfer coefficient (kLA) across theaeration membrane via control of DO in the reactor at afixed point (Miller et al., 1988). The overall mass transfercoefficient for oxygen across the aeration membrane, kLA,was determined previously in a separate experiment (datanot shown).
Cell Density Determination and Metabolite Analysis
Cell density was determined by cell counting using animproved Neubauer hemocytometer (Weber, England) andthe viability of cells was estimated using the trypan blueexclusion method. The concentrations of glucose, lactate,glutamine, glutamate and ammonium in the culturesupernatant were determined using YSI 7100 biochemicalanalyzer (Yellow Springs Instruments). Analysis of aminoacids from supernatant samples was carried out by reverse-phase HPLC using a Shimpack VP-ODS column (Shimadzu,Japan) and detected at 395 nm using a fluorescent detector(Shimadzu). Amino acid derivatization prior to the HPLCanalysis was performed using the Waters AccQ FluorReagent Kit (Millipore, Billerica, MA).
1416 Biotechnology and Bioengineering, Vol. 109, No. 6, June, 2012
Metabolomics Data Analysis
For extracellular metabolomics analysis, culture supernatantwas obtained daily from replicate M250-9 fed-batch culturesand filtered through a 10 kDa molecular weight cut-offdevice (Vivaspin 500 PES membrane, Sartorius AG,Germany) by centrifugation at 48C for 30min. The filteredsamples were diluted 1:1 with sample buffer comprisingof 20% (v/v) methanol (Optima grade, Fisher Scientific,Singapore) in water prior to analysis.
For intracellular metabolomics analysis, 1� 107 cells wereobtained daily from the fed-batch cultures beginning at 24 h.The cells were quenched in five volumes of ice-cold 150mMsodium chloride (Sigma–Aldrich) solution and centrifugedfor 3min at 1,250g and 48C. The resulting solution was
aspirated and 400mL of ice-cold methanol (Merck,Whitehouse Station, NJ) added to the cell pellet. Theresuspended cells-methanol mixture was transferred to a2mL sample tube containing 200mL of chloroform (J.T.Baker, Center Valley, PA). Subsequently, 900mL of coldmethanol, 3.8mM tricine (Sigma–Aldrich) (9:10) mixture,and 400mL of chloroform were added to the sample tube.The mixture was vortexed for 30 to 60 s after the addition ofeach solution. The sample was then centrifuged at 18,000gfor 20min at 48C. 800mL aqueous methanol–tricine layerwas transferred to a clean tube. A further 700mL of coldmethanol and 3.8mM tricine (9:10) mixture was added tothe chloroform phase, which was then centrifuged at 18,000gfor another 10min at 48C. 1mL of the aqueous layer wasextracted, combined with the first aqueous extract and
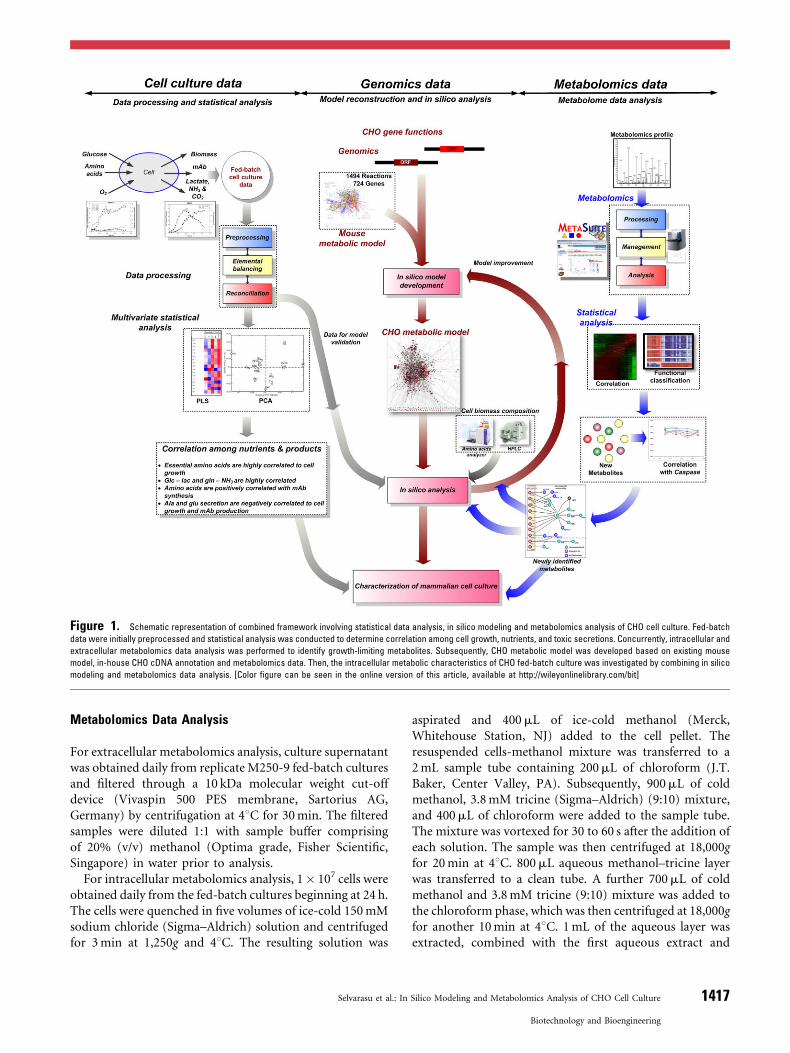
Figure 1. Schematic representation of combined framework involving statistical data analysis, in silico modeling and metabolomics analysis of CHO cell culture. Fed-batch
data were initially preprocessed and statistical analysis was conducted to determine correlation among cell growth, nutrients, and toxic secretions. Concurrently, intracellular and
extracellular metabolomics data analysis was performed to identify growth-limiting metabolites. Subsequently, CHO metabolic model was developed based on existing mouse
model, in-house CHO cDNA annotation and metabolomics data. Then, the intracellular metabolic characteristics of CHO fed-batch culture was investigated by combining in silico
modeling and metabolomics data analysis. [Color figure can be seen in the online version of this article, available at http://wileyonlinelibrary.com/bit]
Selvarasu et al.: In Silico Modeling and Metabolomics Analysis of CHO Cell Culture 1417
Biotechnology and Bioengineering

stored at�808C. Prior to analysis, the aqueous extracts weredried and concentrated four times by adding the appropriatevolume of sample buffer (20% methanol in water).
Both extracellular and intracellular samples were analyzedin replicates using an ultra performance liquid chromatog-raphy (UPLC) system (Acquity; Waters Corp., Milford,MA) coupled to a mass spectrometer (MS; LTQ-Orbitrap;Thermo Scientific, Bremen, Germany). A reversed phase(C18) UPLC column with polar end-capping (AcquityUPLC HSS T3 column, 2.1� 100mm, 1.7mm; WatersCorp.) was used with two solvents: ‘‘A’’ being water with0.1% formic acid (Merck), and ‘‘B’’ being methanol(Optima grade, Fisher Scientific, Pittsburgh, PA) with0.1% formic acid. The UPLC program was as follows: thecolumn was first equilibrated for 0.5min at 0.1% B. Thegradient was then increased from 0.1% B to 50% B over8min before being held at 98% B for 3min. The column waswashed for a further 3min with 98% acetonitrile (Optimagrade, Fisher Scientific) with 0.1% formic acid and finallyequilibrated with 0.1% B for 1.5min. The solvent flow ratewas set at 400mL/min; a column temperature of 308C wasused. The eluent from the UPLC system was directed intotheMS. Electrospray ionization (ESI) was conducted in bothpositive and negative modes in full scan with a mass rangeof 80 to 1,000m/z at a resolution of 15,000. Sheath andauxiliary gas flow was set at 40.0 and 15.0 (arbitrary units)respectively, with a capillary temperature of 4008C. TheESI source and capillary voltages were 4.5 kV and 40V,respectively, for positive mode ionization, and 3.2 kV and�15V, respectively, for negative mode ionization. Masscalibration was performed using standard LTQ-Orbitrapcalibration solution (Thermo Scientific) prior to injection ofthe samples. The raw LC-MS data obtained was then pre-processed and analyzed using an in-house software whichincorporated the XCMS peak finding algorithm (Smithet al., 2006). Detected mass peaks were assigned putativemetabolite identities by matching the respective masses(< 10 ppm error) with the KEGG and Human MetabolomeDatabase (HMDB). The pre-processed data was furtheranalyzed using hierarchical clustering for the classificationof common trends, which led to the identification ofmetabolites that were associated with cell growth. Wherepossible, the metabolite identities were confirmed by MS2
spectral comparison with commercially available metabolitestandards (all standards purchased from Sigma–Aldrichunless otherwise stated).
Metabolic Network Development and In Silico Analysis
Recently available genome-scale metabolic model formammalian cells accounts for 1,494 metabolic reactions,724 ORFs and 715 enzymes (Selvarasu et al., 2010a). Weexpanded the network model by adding reactions obtainedfrom CHO cDNA annotation, resulting in the addition of 35new reactions from various metabolic subsystems. We alsoexamined the model for missing links and improved the
network connectivity by filling the gaps with necessaryreactions that were identified based onmetabolome analysis,while some reactions were excluded since their existencein CHO cell metabolism is not clear. As a result, wereconstructed a stoichiometrically balanced metabolicnetwork model comprising 1,540 reactions and 1,302metabolites (see Supplementary 2 for full list of reactions.The model is also available as Systems Biology MarkupLanguage (SBML) file (level 2, version 1, http://sbml.org) inSupplementary 3. In addition to metabolic reactions, weincluded two balance equations representing biomass andIgG synthesis, both mainly composed of the biosyntheticprecursors and relevant cofactors with appropriate coeffi-cients, that are experimentally measured or obtainedelsewhere for mammalian cells. Then, the steady state fluxdistributions across the network were quantitatively pre-dicted by resorting to constraints-based flux analysis. Thegrowth and non-growth conditions during the culturecan be simulated by maximizing biomass and minimizingerrors between experimental measurements and prediction,respectively, while satisfying thermodynamic and physico-chemical constraints, using the linear programmingtechnique (Edwards and Palsson, 1998). The detailedmathematical formulations pertinent to in silico analysisare available in Supplementary 1.
Results
Physiological Behavior of CHO Fed-Batch Cell Culture
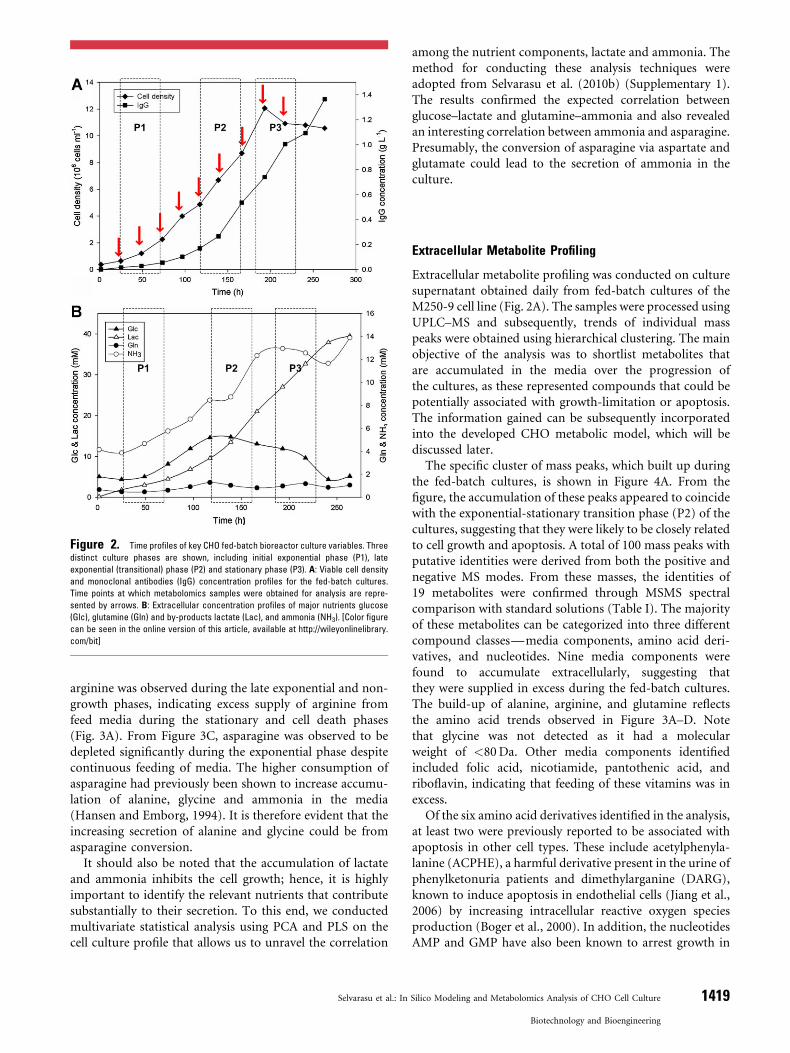
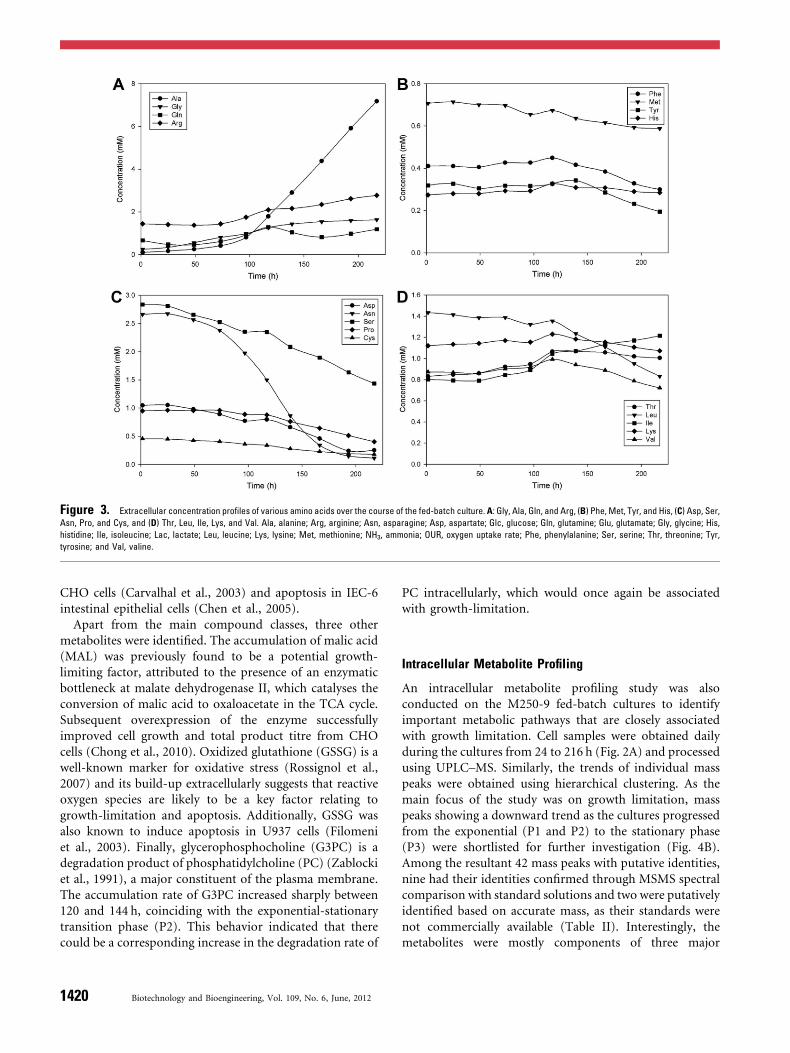
Fed-batch bioreactor cultures of a CHO cell line producingrecombinant monoclonal antibody (IgG) against Rhesus Dantigen (M250-9) were conducted using an in-houseproprietary protein free chemically defined medium.Concentrated feed media was supplied to the culture basedon online monitoring of glutamine, with a set point of0.6mM to minimize the secretion of toxic metabolites likeammonia. The initial exponential (P1) and transition (P2)phases lasted until 190 h during which cell density reached amaximum of 1.2� 107 cells/mL, followed by shift to shortstationary phase (P3) up to 250 h and finally approachingdeath phase (Fig. 2A). The IgG concentration increasedgradually during the exponential and stationary phase,reaching a maximum of 1.3 g/L after 260 h (Fig. 2A). Lactateand ammonia concentrations during the mid-exponentialphase were 9.5mM and 8.44mM respectively, correspond-ing to secretion rates (P1) of 0.121mmol/gDCW/h and0.083mmol/gDCW/h. During the exponential-stationarytransition phase from 120 to 194 h, lactate and ammoniaconcentration increased significantly (secretion rates duringP2 at 0.121 and 0.083mmol/gDCW/h) and eventuallyreached a maximum of 39.5mMg/L and 13.88mM,respectively (Fig. 2B). Among various amino acids, alanineand glycine had the largest increases, while asparagine show-ed the most significant decrease as the fed-batch culturesprogressed (Fig. 3A and C). Additionally, accumulation of
1418 Biotechnology and Bioengineering, Vol. 109, No. 6, June, 2012
arginine was observed during the late exponential and non-growth phases, indicating excess supply of arginine fromfeed media during the stationary and cell death phases(Fig. 3A). From Figure 3C, asparagine was observed to bedepleted significantly during the exponential phase despitecontinuous feeding of media. The higher consumption ofasparagine had previously been shown to increase accumu-lation of alanine, glycine and ammonia in the media(Hansen and Emborg, 1994). It is therefore evident that theincreasing secretion of alanine and glycine could be fromasparagine conversion.
It should also be noted that the accumulation of lactateand ammonia inhibits the cell growth; hence, it is highlyimportant to identify the relevant nutrients that contributesubstantially to their secretion. To this end, we conductedmultivariate statistical analysis using PCA and PLS on thecell culture profile that allows us to unravel the correlation
among the nutrient components, lactate and ammonia. Themethod for conducting these analysis techniques wereadopted from Selvarasu et al. (2010b) (Supplementary 1).The results confirmed the expected correlation betweenglucose–lactate and glutamine–ammonia and also revealedan interesting correlation between ammonia and asparagine.Presumably, the conversion of asparagine via aspartate andglutamate could lead to the secretion of ammonia in theculture.
Extracellular Metabolite Profiling
Extracellular metabolite profiling was conducted on culturesupernatant obtained daily from fed-batch cultures of theM250-9 cell line (Fig. 2A). The samples were processed usingUPLC–MS and subsequently, trends of individual masspeaks were obtained using hierarchical clustering. The mainobjective of the analysis was to shortlist metabolites thatare accumulated in the media over the progression ofthe cultures, as these represented compounds that could bepotentially associated with growth-limitation or apoptosis.The information gained can be subsequently incorporatedinto the developed CHO metabolic model, which will bediscussed later.
The specific cluster of mass peaks, which built up duringthe fed-batch cultures, is shown in Figure 4A. From thefigure, the accumulation of these peaks appeared to coincidewith the exponential-stationary transition phase (P2) of thecultures, suggesting that they were likely to be closely relatedto cell growth and apoptosis. A total of 100 mass peaks withputative identities were derived from both the positive andnegative MS modes. From these masses, the identities of19 metabolites were confirmed through MSMS spectralcomparison with standard solutions (Table I). The majorityof these metabolites can be categorized into three differentcompound classes—media components, amino acid deri-vatives, and nucleotides. Nine media components werefound to accumulate extracellularly, suggesting thatthey were supplied in excess during the fed-batch cultures.The build-up of alanine, arginine, and glutamine reflectsthe amino acid trends observed in Figure 3A–D. Notethat glycine was not detected as it had a molecularweight of <80Da. Other media components identifiedincluded folic acid, nicotiamide, pantothenic acid, andriboflavin, indicating that feeding of these vitamins was inexcess.
Of the six amino acid derivatives identified in the analysis,at least two were previously reported to be associated withapoptosis in other cell types. These include acetylphenyla-lanine (ACPHE), a harmful derivative present in the urine ofphenylketonuria patients and dimethylarganine (DARG),known to induce apoptosis in endothelial cells (Jiang et al.,2006) by increasing intracellular reactive oxygen speciesproduction (Boger et al., 2000). In addition, the nucleotidesAMP and GMP have also been known to arrest growth in
Figure 2. Time profiles of key CHO fed-batch bioreactor culture variables. Three
distinct culture phases are shown, including initial exponential phase (P1), late
exponential (transitional) phase (P2) and stationary phase (P3). A: Viable cell density
and monoclonal antibodies (IgG) concentration profiles for the fed-batch cultures.
Time points at which metabolomics samples were obtained for analysis are repre-
sented by arrows. B: Extracellular concentration profiles of major nutrients glucose
(Glc), glutamine (Gln) and by-products lactate (Lac), and ammonia (NH3). [Color figure
can be seen in the online version of this article, available at http://wileyonlinelibrary.
com/bit]
Selvarasu et al.: In Silico Modeling and Metabolomics Analysis of CHO Cell Culture 1419
Biotechnology and Bioengineering
CHO cells (Carvalhal et al., 2003) and apoptosis in IEC-6intestinal epithelial cells (Chen et al., 2005).
Apart from the main compound classes, three othermetabolites were identified. The accumulation of malic acid(MAL) was previously found to be a potential growth-limiting factor, attributed to the presence of an enzymaticbottleneck at malate dehydrogenase II, which catalyses theconversion of malic acid to oxaloacetate in the TCA cycle.Subsequent overexpression of the enzyme successfullyimproved cell growth and total product titre from CHOcells (Chong et al., 2010). Oxidized glutathione (GSSG) is awell-known marker for oxidative stress (Rossignol et al.,2007) and its build-up extracellularly suggests that reactiveoxygen species are likely to be a key factor relating togrowth-limitation and apoptosis. Additionally, GSSG wasalso known to induce apoptosis in U937 cells (Filomeniet al., 2003). Finally, glycerophosphocholine (G3PC) is adegradation product of phosphatidylcholine (PC) (Zablockiet al., 1991), a major constituent of the plasma membrane.The accumulation rate of G3PC increased sharply between120 and 144 h, coinciding with the exponential-stationarytransition phase (P2). This behavior indicated that therecould be a corresponding increase in the degradation rate of
PC intracellularly, which would once again be associatedwith growth-limitation.
Intracellular Metabolite Profiling
An intracellular metabolite profiling study was alsoconducted on the M250-9 fed-batch cultures to identifyimportant metabolic pathways that are closely associatedwith growth limitation. Cell samples were obtained dailyduring the cultures from 24 to 216 h (Fig. 2A) and processedusing UPLC–MS. Similarly, the trends of individual masspeaks were obtained using hierarchical clustering. As themain focus of the study was on growth limitation, masspeaks showing a downward trend as the cultures progressedfrom the exponential (P1 and P2) to the stationary phase(P3) were shortlisted for further investigation (Fig. 4B).Among the resultant 42 mass peaks with putative identities,nine had their identities confirmed through MSMS spectralcomparison with standard solutions and two were putativelyidentified based on accurate mass, as their standards werenot commercially available (Table II). Interestingly, themetabolites were mostly components of three major
Figure 3. Extracellular concentration profiles of various amino acids over the course of the fed-batch culture. A: Gly, Ala, Gln, and Arg, (B) Phe, Met, Tyr, and His, (C) Asp, Ser,
Asn, Pro, and Cys, and (D) Thr, Leu, Ile, Lys, and Val. Ala, alanine; Arg, arginine; Asn, asparagine; Asp, aspartate; Glc, glucose; Gln, glutamine; Glu, glutamate; Gly, glycine; His,
histidine; Ile, isoleucine; Lac, lactate; Leu, leucine; Lys, lysine; Met, methionine; NH3, ammonia; OUR, oxygen uptake rate; Phe, phenylalanine; Ser, serine; Thr, threonine; Tyr,
tyrosine; and Val, valine.
1420 Biotechnology and Bioengineering, Vol. 109, No. 6, June, 2012
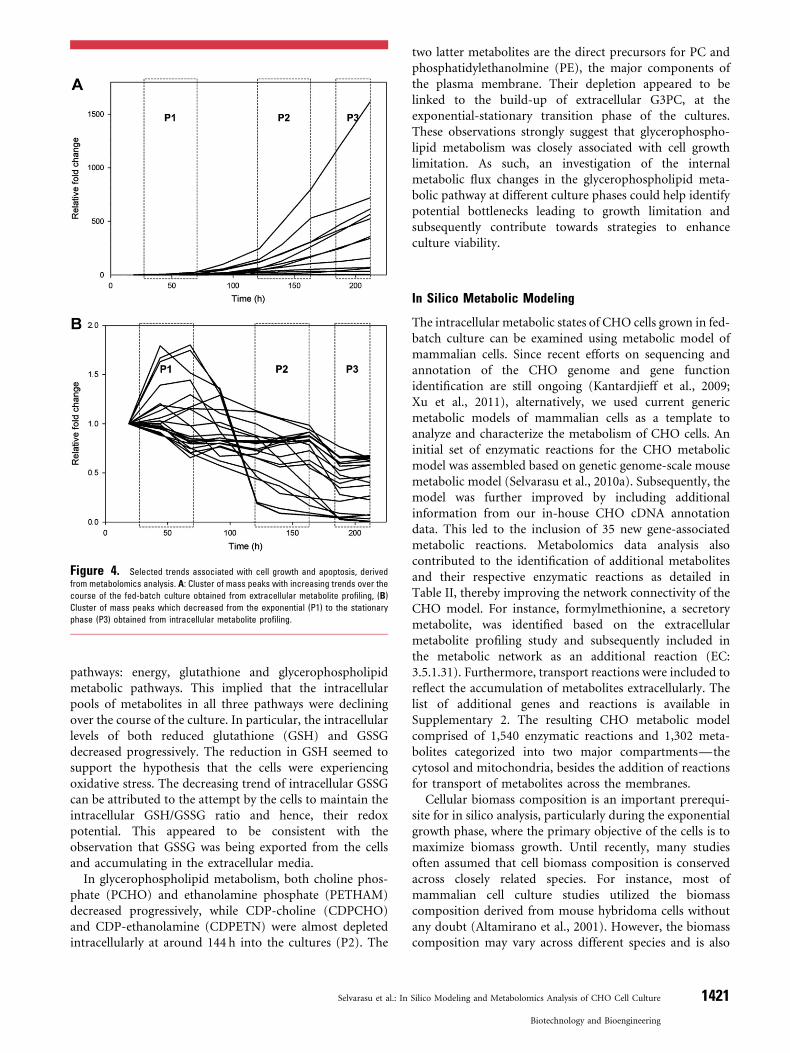
pathways: energy, glutathione and glycerophospholipidmetabolic pathways. This implied that the intracellularpools of metabolites in all three pathways were decliningover the course of the culture. In particular, the intracellularlevels of both reduced glutathione (GSH) and GSSGdecreased progressively. The reduction in GSH seemed tosupport the hypothesis that the cells were experiencingoxidative stress. The decreasing trend of intracellular GSSGcan be attributed to the attempt by the cells to maintain theintracellular GSH/GSSG ratio and hence, their redoxpotential. This appeared to be consistent with theobservation that GSSG was being exported from the cellsand accumulating in the extracellular media.
In glycerophospholipid metabolism, both choline phos-phate (PCHO) and ethanolamine phosphate (PETHAM)decreased progressively, while CDP-choline (CDPCHO)and CDP-ethanolamine (CDPETN) were almost depletedintracellularly at around 144 h into the cultures (P2). The
two latter metabolites are the direct precursors for PC andphosphatidylethanolmine (PE), the major components ofthe plasma membrane. Their depletion appeared to belinked to the build-up of extracellular G3PC, at theexponential-stationary transition phase of the cultures.These observations strongly suggest that glycerophospho-lipid metabolism was closely associated with cell growthlimitation. As such, an investigation of the internalmetabolic flux changes in the glycerophospholipid meta-bolic pathway at different culture phases could help identifypotential bottlenecks leading to growth limitation andsubsequently contribute towards strategies to enhanceculture viability.
In Silico Metabolic Modeling
The intracellular metabolic states of CHO cells grown in fed-batch culture can be examined using metabolic model ofmammalian cells. Since recent efforts on sequencing andannotation of the CHO genome and gene functionidentification are still ongoing (Kantardjieff et al., 2009;Xu et al., 2011), alternatively, we used current genericmetabolic models of mammalian cells as a template toanalyze and characterize the metabolism of CHO cells. Aninitial set of enzymatic reactions for the CHO metabolicmodel was assembled based on genetic genome-scale mousemetabolic model (Selvarasu et al., 2010a). Subsequently, themodel was further improved by including additionalinformation from our in-house CHO cDNA annotationdata. This led to the inclusion of 35 new gene-associatedmetabolic reactions. Metabolomics data analysis alsocontributed to the identification of additional metabolitesand their respective enzymatic reactions as detailed inTable II, thereby improving the network connectivity of theCHO model. For instance, formylmethionine, a secretorymetabolite, was identified based on the extracellularmetabolite profiling study and subsequently included inthe metabolic network as an additional reaction (EC:3.5.1.31). Furthermore, transport reactions were included toreflect the accumulation of metabolites extracellularly. Thelist of additional genes and reactions is available inSupplementary 2. The resulting CHO metabolic modelcomprised of 1,540 enzymatic reactions and 1,302 meta-bolites categorized into two major compartments—thecytosol and mitochondria, besides the addition of reactionsfor transport of metabolites across the membranes.
Cellular biomass composition is an important prerequi-site for in silico analysis, particularly during the exponentialgrowth phase, where the primary objective of the cells is tomaximize biomass growth. Until recently, many studiesoften assumed that cell biomass composition is conservedacross closely related species. For instance, most ofmammalian cell culture studies utilized the biomasscomposition derived from mouse hybridoma cells withoutany doubt (Altamirano et al., 2001). However, the biomasscomposition may vary across different species and is also
Figure 4. Selected trends associated with cell growth and apoptosis, derived
from metabolomics analysis. A: Cluster of mass peaks with increasing trends over the
course of the fed-batch culture obtained from extracellular metabolite profiling, (B)
Cluster of mass peaks which decreased from the exponential (P1) to the stationary
phase (P3) obtained from intracellular metabolite profiling.
Selvarasu et al.: In Silico Modeling and Metabolomics Analysis of CHO Cell Culture 1421
Biotechnology and Bioengineering
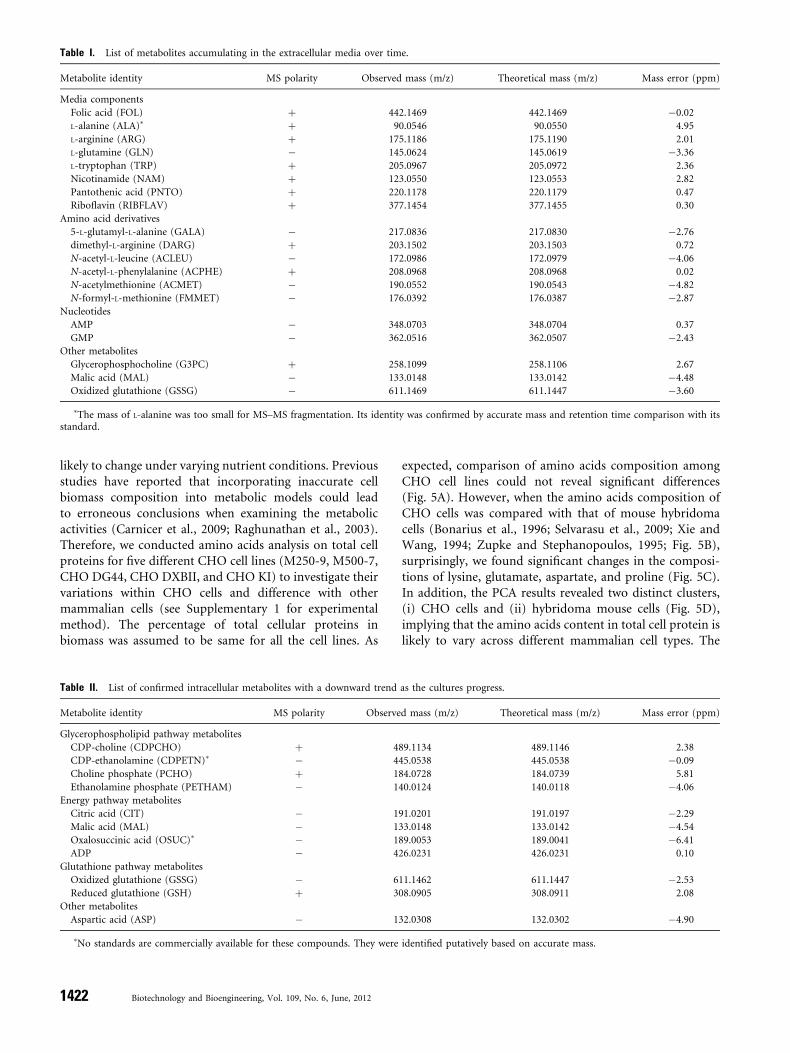
likely to change under varying nutrient conditions. Previousstudies have reported that incorporating inaccurate cellbiomass composition into metabolic models could leadto erroneous conclusions when examining the metabolicactivities (Carnicer et al., 2009; Raghunathan et al., 2003).Therefore, we conducted amino acids analysis on total cellproteins for five different CHO cell lines (M250-9, M500-7,CHO DG44, CHO DXBII, and CHO KI) to investigate theirvariations within CHO cells and difference with othermammalian cells (see Supplementary 1 for experimentalmethod). The percentage of total cellular proteins inbiomass was assumed to be same for all the cell lines. As
expected, comparison of amino acids composition amongCHO cell lines could not reveal significant differences(Fig. 5A). However, when the amino acids composition ofCHO cells was compared with that of mouse hybridomacells (Bonarius et al., 1996; Selvarasu et al., 2009; Xie andWang, 1994; Zupke and Stephanopoulos, 1995; Fig. 5B),surprisingly, we found significant changes in the composi-tions of lysine, glutamate, aspartate, and proline (Fig. 5C).In addition, the PCA results revealed two distinct clusters,(i) CHO cells and (ii) hybridoma mouse cells (Fig. 5D),implying that the amino acids content in total cell protein islikely to vary across different mammalian cell types. The
Table I. List of metabolites accumulating in the extracellular media over time.
Metabolite identity MS polarity Observed mass (m/z) Theoretical mass (m/z) Mass error (ppm)
Media components
Folic acid (FOL) þ 442.1469 442.1469 �0.02
L-alanine (ALA)� þ 90.0546 90.0550 4.95
L-arginine (ARG) þ 175.1186 175.1190 2.01
L-glutamine (GLN) � 145.0624 145.0619 �3.36
L-tryptophan (TRP) þ 205.0967 205.0972 2.36
Nicotinamide (NAM) þ 123.0550 123.0553 2.82
Pantothenic acid (PNTO) þ 220.1178 220.1179 0.47
Riboflavin (RIBFLAV) þ 377.1454 377.1455 0.30
Amino acid derivatives
5-L-glutamyl-L-alanine (GALA) � 217.0836 217.0830 �2.76
dimethyl-L-arginine (DARG) þ 203.1502 203.1503 0.72
N-acetyl-L-leucine (ACLEU) � 172.0986 172.0979 �4.06
N-acetyl-L-phenylalanine (ACPHE) þ 208.0968 208.0968 0.02
N-acetylmethionine (ACMET) � 190.0552 190.0543 �4.82
N-formyl-L-methionine (FMMET) � 176.0392 176.0387 �2.87
Nucleotides
AMP � 348.0703 348.0704 0.37
GMP � 362.0516 362.0507 �2.43
Other metabolites
Glycerophosphocholine (G3PC) þ 258.1099 258.1106 2.67
Malic acid (MAL) � 133.0148 133.0142 �4.48
Oxidized glutathione (GSSG) � 611.1469 611.1447 �3.60
�The mass of L-alanine was too small for MS–MS fragmentation. Its identity was confirmed by accurate mass and retention time comparison with itsstandard.
Table II. List of confirmed intracellular metabolites with a downward trend as the cultures progress.
Metabolite identity MS polarity Observed mass (m/z) Theoretical mass (m/z) Mass error (ppm)
Glycerophospholipid pathway metabolites
CDP-choline (CDPCHO) þ 489.1134 489.1146 2.38
CDP-ethanolamine (CDPETN)� � 445.0538 445.0538 �0.09
Choline phosphate (PCHO) þ 184.0728 184.0739 5.81
Ethanolamine phosphate (PETHAM) � 140.0124 140.0118 �4.06
Energy pathway metabolites
Citric acid (CIT) � 191.0201 191.0197 �2.29
Malic acid (MAL) � 133.0148 133.0142 �4.54
Oxalosuccinic acid (OSUC)� � 189.0053 189.0041 �6.41
ADP � 426.0231 426.0231 0.10
Glutathione pathway metabolites
Oxidized glutathione (GSSG) � 611.1462 611.1447 �2.53
Reduced glutathione (GSH) þ 308.0905 308.0911 2.08
Other metabolites
Aspartic acid (ASP) � 132.0308 132.0302 �4.90
�No standards are commercially available for these compounds. They were identified putatively based on accurate mass.
1422 Biotechnology and Bioengineering, Vol. 109, No. 6, June, 2012
results also clearly highlight the need for a cautious approachin deriving the cell biomass equation for a specific cell type,especially while calculating the amino acids composition intotal cell proteins for metabolite balancing.
In Silico Simulation of Metabolic Behavior duringGrowth and Non-Growth Phases
The intracellular metabolic characteristics of CHO celllines producing monoclonal antibodies (IgG) were exam-ined using the metabolic model under both exponentialgrowth and non-growth phases. This could possibly explain
unique features of the varying metabolic states during theculture.
Initial and Late Exponential Phases
The major cellular objective in the exponential phase ofa culture is to maximize cell growth. Thus, the metabolicmodel can be simulated to mimic the experimentalconditions by maximizing cell growth rate subjected toconstraints such as nutrient uptake rates and by-productproduction rates. For this, the uptake rates of nutrients,glucose, glutamine, amino acids and oxygen and secretionrates of cell biomass, IgG, ammonia, lactate and CO2 were
Figure 5. Amino acids composition in total cell proteins for various mammalian cells. A: CHO cell lines, (B) mouse hybridoma cell lines. C: average amino acids composition in
CHO (red) and mouse hybridoma cells (blue). D: Principal component analysis of amino acid composition in the total cell proteins of CHO and mouse hybridoma cell lines. [Color
figure can be seen in the online version of this article, available at http://wileyonlinelibrary.com/bit]
Selvarasu et al.: In Silico Modeling and Metabolomics Analysis of CHO Cell Culture 1423
Biotechnology and Bioengineering
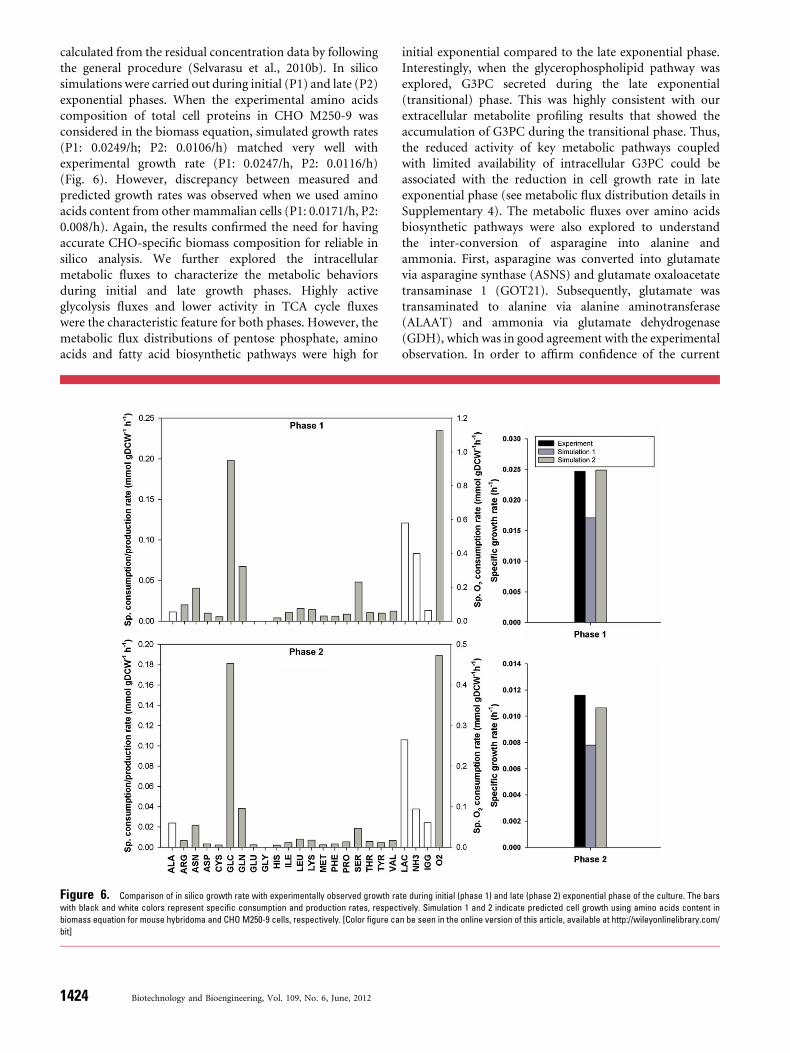
calculated from the residual concentration data by followingthe general procedure (Selvarasu et al., 2010b). In silicosimulations were carried out during initial (P1) and late (P2)exponential phases. When the experimental amino acidscomposition of total cell proteins in CHO M250-9 wasconsidered in the biomass equation, simulated growth rates(P1: 0.0249/h; P2: 0.0106/h) matched very well withexperimental growth rate (P1: 0.0247/h, P2: 0.0116/h)(Fig. 6). However, discrepancy between measured andpredicted growth rates was observed when we used aminoacids content from other mammalian cells (P1: 0.0171/h, P2:0.008/h). Again, the results confirmed the need for havingaccurate CHO-specific biomass composition for reliable insilico analysis. We further explored the intracellularmetabolic fluxes to characterize the metabolic behaviorsduring initial and late growth phases. Highly activeglycolysis fluxes and lower activity in TCA cycle fluxeswere the characteristic feature for both phases. However, themetabolic flux distributions of pentose phosphate, aminoacids and fatty acid biosynthetic pathways were high for
initial exponential compared to the late exponential phase.Interestingly, when the glycerophospholipid pathway wasexplored, G3PC secreted during the late exponential(transitional) phase. This was highly consistent with ourextracellular metabolite profiling results that showed theaccumulation of G3PC during the transitional phase. Thus,the reduced activity of key metabolic pathways coupledwith limited availability of intracellular G3PC could beassociated with the reduction in cell growth rate in lateexponential phase (see metabolic flux distribution details inSupplementary 4). The metabolic fluxes over amino acidsbiosynthetic pathways were also explored to understandthe inter-conversion of asparagine into alanine andammonia. First, asparagine was converted into glutamatevia asparagine synthase (ASNS) and glutamate oxaloacetatetransaminase 1 (GOT21). Subsequently, glutamate wastransaminated to alanine via alanine aminotransferase(ALAAT) and ammonia via glutamate dehydrogenase(GDH), which was in good agreement with the experimentalobservation. In order to affirm confidence of the current
Figure 6. Comparison of in silico growth rate with experimentally observed growth rate during initial (phase 1) and late (phase 2) exponential phase of the culture. The bars
with black and white colors represent specific consumption and production rates, respectively. Simulation 1 and 2 indicate predicted cell growth using amino acids content in
biomass equation for mouse hybridoma and CHO M250-9 cells, respectively. [Color figure can be seen in the online version of this article, available at http://wileyonlinelibrary.com/
bit]
1424 Biotechnology and Bioengineering, Vol. 109, No. 6, June, 2012
simulation, we also conducted flux variability analysis(Mahadevan and Schilling, 2003) for initial exponentialphase (P1). The results revealed 345 active reactions andtheir ranges of possible flux variations achieving the samephenotypic state (maximum cell growth) possibly throughalternative pathways (see details in Supplementary 4).However, the small and consistent flux variation in centralmetabolism and very little or no variation in lipid and someamino acids pathways clearly indicated that the characteristicmetabolic behavior discussed herein based on the simulatedflux distributions would be highly plausible. Nevertheless,the actual flux determination must await experimentalverification by isotope-based labeling measurements.
Non-Growth Phase
It is not appropriate to describe the stationary cellular phaseby maximizing cell growth, as viable cell numbers tended toremain static, with either zero or negligible growth rates.Thus, we should consider an alternative approach tocharacterize the metabolic behavior during the non-growthphase. Based on previous studies, least square minimization(LSM) of error between experimental measurements andin silico simulations was successfully used to examinemetabolic characteristics when the correct cellular objectivecould not be ascertained (Blank et al., 2005; Bonarius et al.,1996). Therefore, LSM was similarly applied in this studyto evaluate the intracellular metabolic fluxes of CHOcells during the stationary culture phase. The uptake ratesof measured nutrients and production rates of otherby-products were first calculated as described earlier.Subsequently, LSM was conducted and the results indicatedthat flux distributions in energy and carbohydrate meta-bolism were similar to the growth phase. Although the cellgrowth was negligible during stationary phase, the consis-tent use of carbohydrate (glycolysis) pathways could bepossibly utilized to meet energy demands arising from othercellular functions such as heat shock resistance and signaltransduction. It is evident from the in silico simulationsthat further experiments aimed at examining the energymaintenance during the later phase of mammalian cellculture is worthwhile as it can provide clues to reengineercells to enhance their viability, thereby optimizing recom-binant productivity. Moreover, the results revealed signifi-cant reduction in metabolic fluxes of lipid and nucleotidespathways compared to their fluxes during exponentialgrowth phase, suggesting that a slowdown in the activities ofthese pathways occurred during the non-growth culturephase. Additionally, in silico simulation also revealed thesecretion of amino acid derivatives, which was consistentwith the observed accumulation of these derivativesextracellularly based on the metabolomics analysis.
Discussion
This study describes how a combined metabolomics andmodeling approach can be utilized to understand the
intracellular behaviors of CHO cell culture. To date, themajority of mammalian cell culture studies focused on theanalysis of extracellular glucose, lactate, glutamine, ammo-nia, and other amino acids. While these trends allow foran overview of cell metabolism, a more in-depth study ofmetabolites is required for better understanding of keyintracellular mechanisms in relation to cell growth anddeath processes. As such, the extracellular and intracellularmetabolite profiling studies have facilitated the detectionof previously unmeasured metabolites, hence allowing forimproved characterization of intracellular metabolic states.Specifically, the extracellular study resulted in the identifi-cation of previously unmeasured media components thatwere accumulating in the extracellular media. Additionally,a group of amino acid derivatives, nucleotides and otherkey metabolites were also found to build up extracellularly.This information could contribute towards improvingthe predictive capability of the CHO cell metabolic model,particularly during the non-growth culture phase.
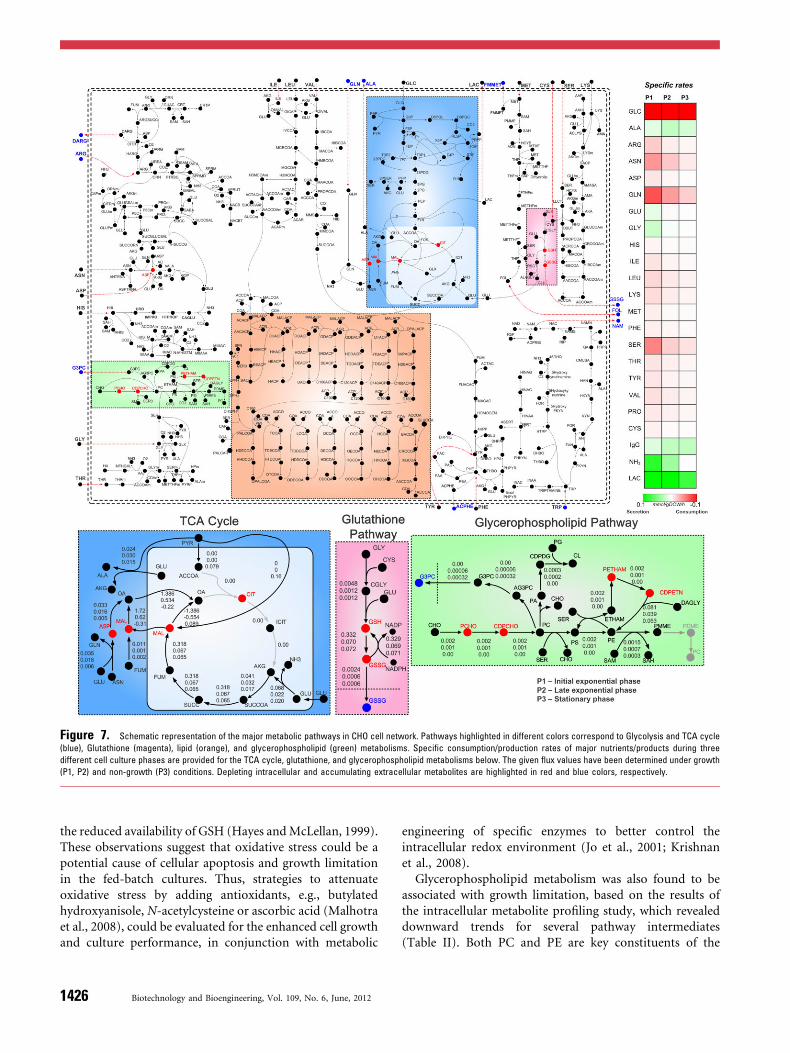
The intracellular metabolite profiling study allowed us toidentify key pathways potentially associated with cell growthlimitation; metabolites participating in the energy, glutathi-one and glycerophospholipid metabolic pathways werefound to show decreasing trends as the culture progressed.To derive a better understanding of this behavior, thecorresponding fluxes for the three pathways were investi-gated using the in silico CHO model (Fig. 7). In terms ofenergy metabolism, the fluxes in the TCA cycle appear to bedistinctly smaller than those of glycolysis. This is in goodagreement with the largely known fact that glycolysis isthe main energy production pathway in CHO cells, withbuild-up of lactate extracellularly (Xie and Wang, 1996).Additionally, the TCA cycle fluxes reduced from the late-exponential phase, further decreasing its contributiontowards cellular energy production during the later culturephases.
Glutathione metabolism has been previously reported tobe associated with the removal of reactive oxygen species inmammalian cells (O’Donovan and Fernandes, 2000). Theintracellular metabolite profiling study revealed decreasingtrends for both GSH and GSSG, while the latter was alsoshown to accumulate extracellularly, thereby suggesting thatGSSG was secreted from the cells as the culture progressed.This observation was supported by in silico analysis results,shown by the positive transport flux of GSSG to theextracellular media in Figure 7. Interestingly, the resultsalso indicated that the GSH formation flux, based onthe conversion of glycine, glutamate, and cysteine via theenzymes D-aminoacid oxidase and aldehyde dehydrogenase,was relatively less during the later culture phases incomparison to the early exponential phase. This suggestedthat in order to maintain the reductive-oxidative potentialintracellularly, GSSG had to be expelled from the cells.In addition, the reduction in the intracellular GSH poolalso coincided with the transition of the cultures fromexponential phase to stationary phase, which implied thatthe cells could have been undergoing oxidative stress due to
Selvarasu et al.: In Silico Modeling and Metabolomics Analysis of CHO Cell Culture 1425
Biotechnology and Bioengineering
the reduced availability of GSH (Hayes andMcLellan, 1999).These observations suggest that oxidative stress could be apotential cause of cellular apoptosis and growth limitationin the fed-batch cultures. Thus, strategies to attenuateoxidative stress by adding antioxidants, e.g., butylatedhydroxyanisole, N-acetylcysteine or ascorbic acid (Malhotraet al., 2008), could be evaluated for the enhanced cell growthand culture performance, in conjunction with metabolic
engineering of specific enzymes to better control theintracellular redox environment (Jo et al., 2001; Krishnanet al., 2008).
Glycerophospholipid metabolism was also found to beassociated with growth limitation, based on the results ofthe intracellular metabolite profiling study, which revealeddownward trends for several pathway intermediates(Table II). Both PC and PE are key constituents of the
Figure 7. Schematic representation of the major metabolic pathways in CHO cell network. Pathways highlighted in different colors correspond to Glycolysis and TCA cycle
(blue), Glutathione (magenta), lipid (orange), and glycerophospholipid (green) metabolisms. Specific consumption/production rates of major nutrients/products during three
different cell culture phases are provided for the TCA cycle, glutathione, and glycerophospholipid metabolisms below. The given flux values have been determined under growth
(P1, P2) and non-growth (P3) conditions. Depleting intracellular and accumulating extracellular metabolites are highlighted in red and blue colors, respectively.
1426 Biotechnology and Bioengineering, Vol. 109, No. 6, June, 2012
plasma membrane and intracellular transport vesicles;hence, their synthesis is likely to be an important factorfor cell growth and protein production. In particular,CDPCHO and CDPETN, the direct precursors to PC andPE, respectively, were found to be depleted during theexponential-stationary phase transition period. It should behighlighted that in silico analysis of CHO model allowed usto characterize metabolic states in the glycerophospholipidpathway. An overall reduction in the glycerophospholipidpathway fluxes was observed during the late exponentialand stationary phases in comparison to the initialexponential phase (Fig. 7). In particular, the fluxes forthe conversion of PCHO to CDPCHO and PETHAM toCDPETN were both zero in the stationary phase, suggestingthat the synthesis of the PC and PE precursors could indeedhave become limiting. A closer look at the fluxes alsoindicated that G3PC was being secreted continuously afterthe initial exponential phase of the culture, resulting in itsaccumulation extracellularly. These combined trends appearto point towards a slowdown in the production of PC andPE, which may potentially initiate the transition of cells tothe stationary phase. However, more in-depth studies arerequired to further evaluate this hypothesis and to identifypossible causes of the flux reductions in PC and PE synthesis.For instance, a potential focus could be on investigatingthe presence of enzymatic bottlenecks at the PCHO toCDPCHO and the PETN to CDPETN junctions in thepathway. This would enable the development of strategies tomaintain PC and PE synthesis, which could subsequentlylead to the extension of culture viability and in turn,improved culture performance.
From the discussion of the abovementioned metabolicpathways, the simulated fluxes derived from the in silicomodel have been successfully utilized to improve ourunderstanding of key metabolic pathways presumablyassociated with the cell growth limitation. However, thecurrent model has not accounted for compartmentlocalization other than cytosol and mitochondria. Thus,inclusion of compartmental information could be beneficial,particularly, for investigating protein glycosylation mecha-nism with metabolic details corresponding to golgi andendoplasmic reticulum. Further improvements to the modelcan be made based on the recent availability of the CHO-K1genome (Xu et al., 2011), in which the authors focusedspecifically on important gene functions relevant to proteinglycosylation. With this information, glycosylation genescan be investigated using the metabolic model, whichwould eventually lead to enhancing the protein quality ofrecombinant therapeutics. Besides this, the consortiumfor CHO Cell Genomics, established by the BioprocessingTechnology Institute of Singapore and University ofMinnesota in 2006 (Jayapal et al., 2007), has built arepertoire of approximately 80,000 EST sequences obtainedfrom both traditional Sanger sequencing and next genera-tion sequencing technologies such as Roche 454 and SolexaIllumina (Kantardjieff et al., 2009). This collection of ESTscan be subsequently used to examine the transcriptional
activity of CHO cells. In the future, CHO specific genomesequences could be annotated with the availability oflarge amount of data. Such identified gene function fromannotations can be added to improve the metabolic modelrepresenting CHO metabolism more precisely. Thus, thecurrent limitations of the model can be overcome and it canbe employed to identify strategies for cellular engineering.
Concluding Remarks
Mammalian cells are widely used for industrial productionof recombinant therapeutics owing to their ability toperform post-translational modifications, including glyco-sylation. In this work, a combined metabolomics and insilico modeling approach was used to improve understand-ing of the intracellular mechanisms of CHO fed-batchcultures. Metabolites associated with cell growth limitationwere first shortlisted based on both extracellular andintracellular metabolite profiling studies. A metabolic modelrepresenting the key metabolic functions of CHO cells wasalso developed using a template mouse genome-scale modeland subsequently improved through integration of theextracellular metabolite profiling data. The in silico analysisof different fed-batch culture phases additionally high-lighted the importance of obtaining accurate amino acidcompositions in cell biomass. Finally, three key metabolicfunctions, including energy, glutathione, and glyceropho-spholipid pathways, potentially associated with cell growthlimitation were studied in detail. Additional insights intothese pathways were gained successfully based on thecombined analysis of the experimental metabolite trendsand the flux data obtained from the in silico model. Infuture, such an understanding could potentially facilitatethe development of additional metabolic strategies forimprovement of CHO cell culture productivity.
This work was supported by the Biomedical Research Council of
A�STAR (Agency for Science, Technology and Research), Singapore
and a grant from the Next-Generation BioGreen 21 Program (No.
PJ008184), Rural Development Administration, Republic of Korea.
References
Altamirano C, Illanes A, Casablancas A, Gamez X, Cairo JJ, Godia C. 2001.
Analysis of CHO cells metabolic redistribution in a glutamate-based
defined medium in continuous culture. Biotechnol Prog 17:1032–1041.
Barnes LM, Dickson AJ. 2006. Mammalian cell factories for efficient and
stable protein expression. Curr Opin Biotechnol 17(4):381–386.
Blank L, Kuepfer L, Sauer U. 2005. Large-scale 13C-flux analysis reveals
mechanistic principles of metabolic network robustness to null muta-
tions in yeast. Genome Biol 6(6).
Boger RH, Bode-Boger SM, Tsao PS, Lin PS, Chan JR, Cooke JP. 2000. An
endogenous inhibitor of nitric oxide synthase regulates endothelial
adhesiveness for monocytes. J Am Coll Cardiol 36(7):2287–2295.
Bonarius HPJ, Hatzimanikatis V, Meesters KPH, de Gooijer CD, Schmid G,
Tramper J. 1996. Metabolic flux analysis of hybridoma cells in different
culture media using mass balances. Biotechnol Bioeng 50(3):299–318.
Selvarasu et al.: In Silico Modeling and Metabolomics Analysis of CHO Cell Culture 1427
Biotechnology and Bioengineering
Butler M. 2005. Animal cell cultures: Recent achievements and perspectives
in the production of biopharmaceuticals. Appl Microbiol Biotechnol
68(3):283–291.
Carnicer M, Baumann K, Toplitz I, Sanchez-Ferrando F, Mattanovich D,
Ferrer P, Albiol J. 2009. Macromolecular and elemental composition
analysis and extracellular metabolite balances of Pichia pastoris growing
at different oxygen levels. Microb Cell Factories 8:65.
Carvalhal AV, Santos SS, Calado J, Haury M, Carrondo MJ. 2003. Cell
growth arrest by nucleotides, nucleosides and bases as a tool for
improved production of recombinant proteins. Biotechnol Prog
19(1):69–83.
Chen XG, Wang RS, Deng MX, Ran XZ. 2005. Effects of exogenerous
nucleotides on the apoptosis of intestinal epithelial cells IEC-6. Wei
Sheng Yan Jiu 34(6):701–704.
Chong WP, Goh LT, Reddy SG, Yusufi FN, Lee DY, Wong NS, Heng CK,
Yap MG, Ho YS. 2009. Metabolomics profiling of extracellular meta-
bolites in recombinant Chinese hamster ovary fed-batch culture. Rapid
Commun Mass Spectrom 23(23):3763–3771.
Chong WPK, Reddy SG, Yusufi FNK, Lee D-Y, Wong NSC, Heng CK, Yap
MGS, Ho YS. 2010. Metabolomics-driven approach for the improve-
ment of Chinese hamster ovary cell growth: Overexpression of malate
dehydrogenase II. J Biotechnol 147(2):116–121.
Chong WP, Yusufi FN, Lee DY, Reddy SG, Wong NS, Heng CK, Yap MG,
Ho YS. 2011. Metabolomics-based identification of apoptosis-inducing
metabolites in recombinant fed-batch CHO culturemedia. J Biotechnol
151(2):218–224.
Chusainow J, Yang YS, Yeo JH, Toh PC, Asvadi P,WongNS, YapMG. 2009.
A study of monoclonal antibody-producing CHO cell lines: What
makes a stable high producer? Biotechnol Bioeng 102(4):1182–1196.
Covert MW, Famili I, Palsson BO. 2003. Identifying constraints that govern
cell behavior: A key to converting conceptual to computational models
in biology? Biotechnol Bioeng 84(7):763–772.
Dinnis DM, James DC. 2005. Engineering mammalian cell factories for
improved recombinant monoclonal antibody production; lessons from
nature? Biotechnol Bioeng 91(2):180–189.
Duarte NC, Becker SA, Jamshidi N, Thiele I, Mo ML, Vo TD, Srivas R,
Palsson BO. 2007. Global reconstruction of the human metabolic
network based on genomic and bibliomic data. Proc Natl Acad Sci
104(6):1777–1782.
Edwards JS, Palsson BO. 1998. How will bioinformatics influence metabolic
engineering? Biotechnol Bioeng 58(2–3):162–169.
Filomeni G, Rotilio G, Ciriolo MR. 2003. Glutathione disulfide induces
apoptosis in U937 cells by a redox-mediated p38 MAP kinase pathway.
FASEB J 17(1):64–66.
Genzel Y, Friffer JB, Konig S, Alt R, Reichl U. 2005. Substitution of
glutamine by pyruvate to reduce ammonia formation and growth
inhibition of mammalian cells. Biotechnol Prog 21:58–69.
Hansen HA, Emborg C. 1994. Extra- and intracellular amino acid con-
centrations in continuous Chinese hamster ovary cell culture. Appl
Microbiol Biotechnol 41(5):560–564.
Hayes JD, McLellan LI. 1999. Glutathione and glutathione-dependent
enzymes represent a co-ordinately regulated defence against oxidative
stress. Free Radic Res 31(4):273–300.
Jayapal KP, Wlaschin KF, Yap MGS, Hu W-S. 2007. Recombinant protein
therapeutics from CHO cells-20 years and counting. Chem Eng Prog
103(7):40–47.
Jiang DJ, Jia SJ, Dai Z, Li YJ. 2006. Asymmetric dimethylarginine induces
apoptosis via p38 MAPK/caspase-3-dependent signaling pathway in
endothelial cells. J Mol Cell Cardiol 40(4):529–539.
Jo SH, Son MK, Koh HJ, Lee SM, Song IH, Kim YO, Lee YS, Jeong KS, Kim
WB, Park JW, Song BJ, Huh TL. 2001. Control of mitochondrial redox
balance and cellular defense against oxidative damage by mitochondrial
NADPþ-dependent isocitrate dehydrogenase. J Biol Chem 276(19):
16168–16176.
Kantardjieff A, Nissom PM, Chuah SH, Yusufi F, Jacob NM,Mulukutla BC,
Yap M, Hu W-S. 2009. Developing genomic platforms for Chinese
hamster ovary cells. Biotechnol Adv 27(6):1028–1035.
Krishnan N, Dickman MB, Becker DF. 2008. Proline modulates the
intracellular redox environment and protects mammalian cells against
oxidative stress. Free Radic Biol Med 44(4):671–681.
Lee YY, Yap MGS, Hu W-S, Wong KTK. 2003. Low-glutamine fed-batch
cultures of 293-HEK serum-free suspension cells for adenovirus pro-
duction. Biotechnol Prog 19(2):501–509.
Lee SY, Lee D-Y, Kim TY. 2005. Systems biotechnology for strain improve-
ment. Trends Biotechnol 23:349–358.
Lee JM, Gianchandani EP, Papin JA. 2006. Flux balance analysis in the era of
metabolomics. Brief Bioinform 7(2):140–150.
Ma H, Zeng A-P. 2003. Reconstruction of metabolic networks from genome
data and analysis of their global structure for various organisms.
Bioinformatics 19(2):270–277.
Ma N, Ellet J, Okediadi C, Hermes P, McCormick E, Casnocha S. 2009. A
single nutrient feed supports both chemically defined NS0 and CHO
fed-batch processes: Improved productivity and lactate metabolism.
Biotechnol Prog 25(5):1353–1363.
Mahadevan R, Schilling CH. 2003. The effects of alternate optimal solutions
in constraint-based genome-scale metabolic models. Metabolic Eng
5(4):264–276.
Malhotra JD, Miao H, Zhang K, Wolfson A, Pennathur S, Pipe SW,
Kaufman RJ. 2008. Antioxidants reduce endoplasmic reticulum stress
and improve protein secretion. Proc Natl Acad Sci 105(47):18525–
18530.
Miller W, Wilke C, Blanch H. 1988. Transient responses of hybridoma
metabolism to changes in the oxygen supply rate in continuous culture.
Bioprocess Biosyst Eng 3(3):103–111.
Mo M, Palsson BO, Herrgard M. 2009. Connecting extracellular metabo-
lomic measurements to intracellular flux states in yeast. BMC Syst Biol
3(1):37.
O’Callaghan PM, James DC. 2008. Systems biotechnology of mammalian
cell factories. Brief Funct Genomic Proteomic 7(2):95–110.
O’Donovan DJ, Fernandes CJ. 2000. Mitochondrial glutathione and oxida-
tive stress: Implications for pulmonary oxygen toxicity in premature
infants. Mol Genet Metabol 71(1–2):352–358.
Price ND, Papin JA, Schilling CH, Palsson BO. 2003. Genome-scale
microbial in silico models: The constraints-based approach. Trends
Biotechnol 21:162–169.
Price ND, Reed JL, Palsson BO. 2004. Genome-scale models of microbial
cells: Evaluating the consequences of constraints. Nat Rev Microbiol
2:886–897.
Raghunathan AU, Perez-Correa JR, Bieger LT. 2003. Data reconciliation
and parameter estimation in flux-balance analysis. Biotechnol Bioeng
84(6):700–709.
Reff ME. 1993. High-level production of recombinant immunoglobulins in
mammalian cells. Curr Opin Biotechnol 4(5):573–576.
Rossignol P, Collier S, Bush M, Shaw P, Doonan JH. 2007. Arabidopsis
POT1A interacts with TERT-V(I8), an N-terminal splicing variant of
telomerase. J Cell Sci 120(Pt 20):3678–3687.
Schaub J, Clemens C, Schorn P, Hildebrandt T, Rust W, Mennerich D,
Kaufmann H, Schulz TW. 2009. CHO gene expression profiling in
biopharmaceutical process analysis and design. Biotechnol Bioeng
105(2):431–438.
Selvarasu S, Wong VVT, Karimi IA, Lee D-Y. 2009. Elucidation of metabo-
lism in hybridoma cells grown in fed-batch culture by genome-scale
modeling. Biotechnol Bioeng 102(5):1494–1594.
Selvarasu S, Karimi IA, Ghim GH, Lee DY. 2010a. Genome-scale modeling
and in silico analysis of mouse cell metabolic network. Mol Biosyst
6(1):142–151.
Selvarasu S, Kim DY, Karimi IA, Lee DY. 2010b. Combined data preproces-
sing and multivariate statistical analysis characterizes fed-batch culture
of mouse hybridoma cells for rational medium design. J Biotechnol
150(1):94–100.
Smith CA, Want EJ, O’Maille G, Abagyan R, Siuzdak G. 2006. XCMS:
Processing mass spectrometry data for metabolite profiling using
nonlinear peak alignment, matching, and identification. Anal Chem
78(3):779–787.
1428 Biotechnology and Bioengineering, Vol. 109, No. 6, June, 2012
Tsao YS, Cardoso AG, Condon RGG, Voloch M, Lio P, Lagos JC, Kearns
BG, Liu Z. 2005. Monitoring Chinese hamster ovary cell culture by the
analysis of glucose and lactate metabolism. J Biotechnol 118(3):316–327.
Wahl A, Sidorenko Y, Dauner M, Genzel Y, Reichl U. 2008. Metabolic flux
model for an anchorage-dependent MDCK cell line: Characteristic
growth phases and minimum substrate consumption flux distribution.
Biotechnol Bioeng 101(1):135–152.
Xie L,Wang DIC. 1994. Stoichiometric analysis of animal cell growth and its
application in medium design. Biotechnol Bioeng 43(11):1164–1174.
Xie L, Wang DIC. 1996. Energy metabolism and ATP balance in animal cell
cultivation using a stoichiometrically based reaction network. Biotech-
nol Bioeng 52(5):591–601.
Xu X, Nagarajan H, Lewis NE, Pan S, Cai Z, Liu X, Chen W, Xie M, Wang
W, Hammond S, Andersen MR, Neff N, Passarelli B, Koh W, Fan HC,
Wang J, Gui Y, Lee KH, Betenbaugh MJ, Quake SR, Famili I, Palsson
BO,Wang J. 2011. The genomic sequence of the Chinese hamster ovary
(CHO)-K1 cell line. Nat Biotechnol 29(8):735–741.
Yizhak K, Benyamini T, Liebermeister W, Ruppin E, Shlomi T. 2010.
Integrating quantitative proteomics and metabolomics with a ge-
nome-scale metabolic network model. Bioinformatics 26(12):i255–
i260.
Zablocki K, Miller SP, Garcia-Perez A, Burg MB. 1991. Accumulation of
glycerophosphocholine (GPC) by renal cells: Osmotic regulation
of GPC:choline phosphodiesterase. Proc Natl Acad Sci 88(17):7820–
7824.
Zupke C, Stephanopoulos G. 1995. Intracellular flux analysis in hybridomas
using mass balances and in vitro 13C NMR. Biotechnol Bioeng
45(4):292–303.
Selvarasu et al.: In Silico Modeling and Metabolomics Analysis of CHO Cell Culture 1429
Biotechnology and Bioengineering


![Metabolomics Basics[1]](https://img.dokumen.tips/doc/110x75/553de2815503466f378b4864/metabolomics-basics1.jpg)