Embed Size (px)
Citation preview
1© SAPIENT CORPORATION 2015
COLLATERAL MANAGEMENT: WHEN DOES IT MAKE SENSE TO OUTSOURCE?
Authored by:
Maurice Schuster, Thomas Schiebe, Chris Ekonomidis and Neil Wright
May 2015
2COLLATERAL MANAGEMENT: WHEN DOES IT MAKE SENSE TO OUTSOURCE?
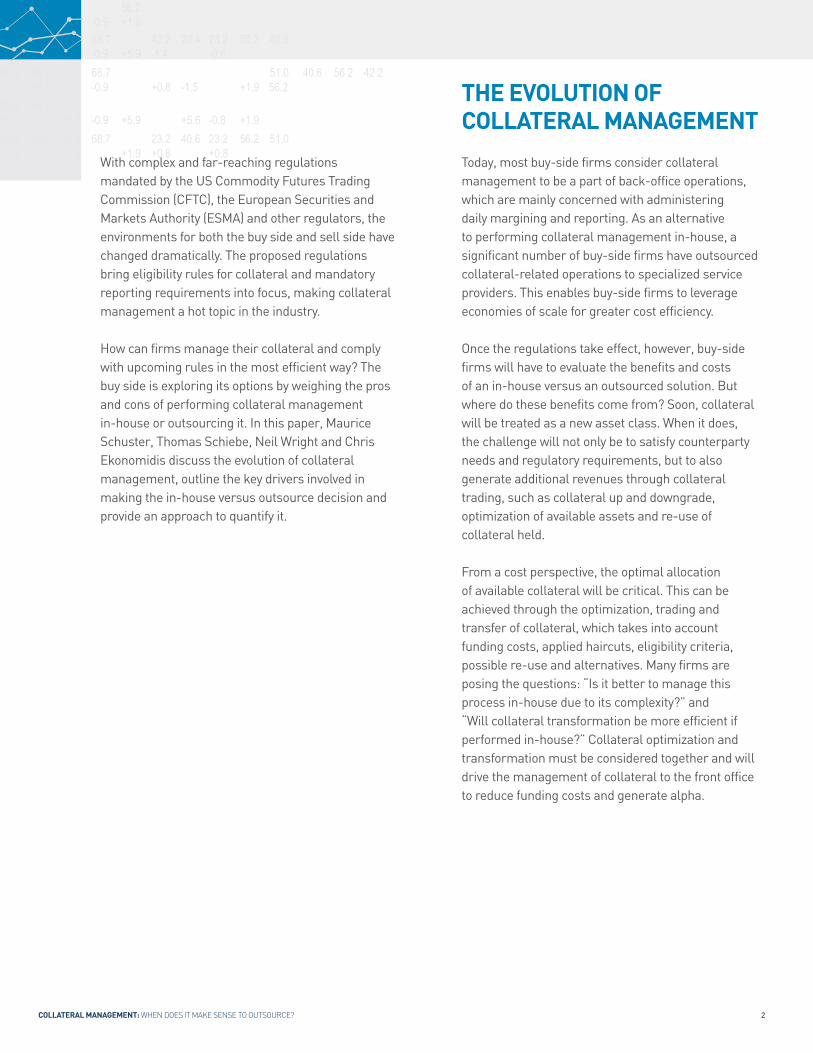
Today, most buy-side firms consider collateral management to be a part of back-office operations, which are mainly concerned with administering daily margining and reporting. As an alternative to performing collateral management in-house, a significant number of buy-side firms have outsourced collateral-related operations to specialized service providers. This enables buy-side firms to leverage economies of scale for greater cost efficiency.
Once the regulations take effect, however, buy-side firms will have to evaluate the benefits and costs of an in-house versus an outsourced solution. But where do these benefits come from? Soon, collateral will be treated as a new asset class. When it does, the challenge will not only be to satisfy counterparty needs and regulatory requirements, but to also generate additional revenues through collateral trading, such as collateral up and downgrade, optimization of available assets and re-use of collateral held.
From a cost perspective, the optimal allocation of available collateral will be critical. This can be achieved through the optimization, trading and transfer of collateral, which takes into account funding costs, applied haircuts, eligibility criteria, possible re-use and alternatives. Many firms are posing the questions: “Is it better to manage this process in-house due to its complexity?” and “Will collateral transformation be more efficient if performed in-house?” Collateral optimization and transformation must be considered together and will drive the management of collateral to the front office to reduce funding costs and generate alpha.
With complex and far-reaching regulations mandated by the US Commodity Futures Trading Commission (CFTC), the European Securities and Markets Authority (ESMA) and other regulators, the environments for both the buy side and sell side have changed dramatically. The proposed regulations bring eligibility rules for collateral and mandatory reporting requirements into focus, making collateral management a hot topic in the industry.
How can firms manage their collateral and comply with upcoming rules in the most efficient way? The buy side is exploring its options by weighing the pros and cons of performing collateral management in-house or outsourcing it. In this paper, Maurice Schuster, Thomas Schiebe, Neil Wright and Chris Ekonomidis discuss the evolution of collateral management, outline the key drivers involved in making the in-house versus outsource decision and provide an approach to quantify it.
THE EVOLUTION OF COLLATERAL MANAGEMENT
3© SAPIENT CORPORATION 2015
The high degree of complexity of impending and overlapping regulations, combined with the uncertainty of future regulations, such as the proposal from the Basel Committee on Banking Supervision (BCBS) and the International Organization of Securities Commissions (IOSCO) for uncleared OTC derivatives, increases the risk of rising costs. These costs can be outsourced to become more predictable. In order to develop this outsourcing business case, assumptions must be made about the drivers and indicators of future development with respect to quantitative (e.g., trade volumes) and qualitative aspects (e.g., additional regulatory requirements).
From a cost perspective, the optimal allocation of available collateral will be critical. This can be achieved through the optimization, trading and transfer of collateral, which takes into account funding costs, applied haircuts, eligibility criteria, possible re-use and alternatives.
The decision drivers for outsourcing collateral management are similar to those for general outsourcing. These drivers must be evaluated and quantified as part of the build-versus-outsource decision. The following specific criteria need to be applied by a buy-side firm evaluating an outsourcing strategy in detail.
• Qualified personnel: Firms that are considering anin-house collateral management solution will need qualified personnel to run the operations. If these experts aren’t already in-house, companies will incur hiring and/or training costs. For in-house collateral management, IT systems specialists are required to manage specific workflows. The more complex the organization and workflows and the more limited the functionalities of the IT system, the more personnel a firm will need to support the collateral function.
• Internal workflow: Firms must standardize dailyoperational tasks in order to handle peak volume days more effectively and minimize the risk of upcoming issues or failures. The resolution of issues can often be performed more efficiently internally rather than by an external service provider. In general, highly standardized workflows are suitable for outsourcing and do not have to be performed in-house.
• Frequent change: Frequent changes in requirementscan lead to more uncertainty and increase risks and costs. These changes can be initiated by market regulators as well as by the buy-side firm’s clients. Adequate service-level agreements and Key Performance Indicators (KPIs) for measurement of effectiveness must be developed and adopted.
MAKING AN INFORMED OUTSOURCING DECISION
4COLLATERAL MANAGEMENT: WHEN DOES IT MAKE SENSE TO OUTSOURCE?
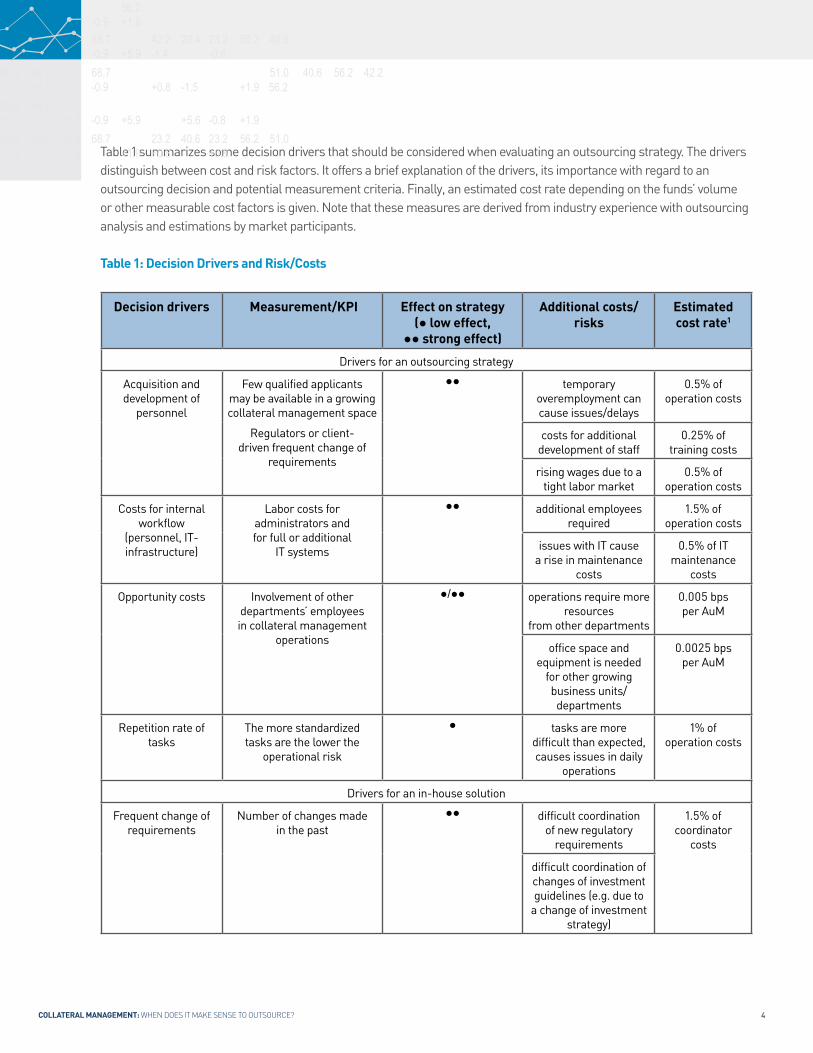
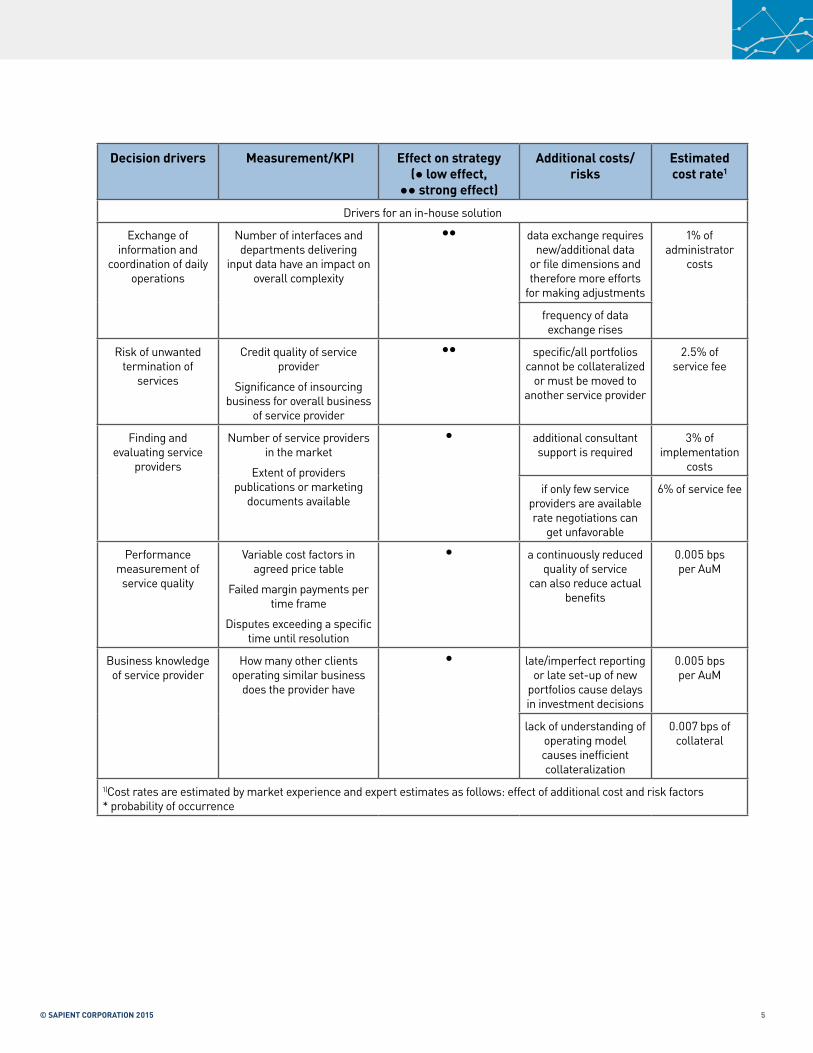
Table 1 summarizes some decision drivers that should be considered when evaluating an outsourcing strategy. The drivers distinguish between cost and risk factors. It offers a brief explanation of the drivers, its importance with regard to an outsourcing decision and potential measurement criteria. Finally, an estimated cost rate depending on the funds’ volume or other measurable cost factors is given. Note that these measures are derived from industry experience with outsourcing analysis and estimations by market participants.
Table 1: Decision Drivers and Risk/Costs
Decision drivers Measurement/KPI Effect on strategy(● low effect,
●● strong effect)
Additional costs/risks
Estimated cost rate1
Drivers for an outsourcing strategy
Acquisition and development of
personnel
Few qualified applicants may be available in a growing collateral management space
Regulators or client-driven frequent change of
requirements
●● temporary overemployment can cause issues/delays
0.5% of operation costs
costs for additional development of staff
0.25% of training costs
rising wages due to a tight labor market
0.5% of operation costs
Costs for internal workflow
(personnel, IT-infrastructure)
Labor costs for administrators andfor full or additional
IT systems
●● additional employees required
1.5% of operation costs
issues with IT cause a rise in maintenance
costs
0.5% of IT maintenance
costs
Opportunity costs Involvement of other departments’ employees in collateral management
operations
●/●● operations require more resources
from other departments
0.005 bps per AuM
office space and equipment is needed
for other growing business units/
departments
0.0025 bps per AuM
Repetition rate of tasks
The more standardized tasks are the lower the
operational risk
● tasks are more difficult than expected, causes issues in daily
operations
1% of operation costs
Drivers for an in-house solution
Frequent change of requirements
Number of changes made in the past
●● difficult coordination of new regulatory
requirements
1.5% of coordinator
costs
difficult coordination of changes of investment guidelines (e.g. due to
a change of investment strategy)
5© SAPIENT CORPORATION 2015
Decision drivers Measurement/KPI Effect on strategy(● low effect,
●● strong effect)
Additional costs/risks
Estimated cost rate1
Drivers for an in-house solution
Exchange of information and
coordination of daily operations
Number of interfaces and departments delivering
input data have an impact on overall complexity
●● data exchange requires new/additional data
or file dimensions and therefore more efforts
for making adjustments
1% of administrator
costs
frequency of data exchange rises
Risk of unwanted termination of
services
Credit quality of service provider
Significance of insourcing business for overall business
of service provider
●● specific/all portfolios cannot be collateralized
or must be moved to another service provider
2.5% of service fee
Finding and evaluating service
providers
Number of service providers in the market
Extent of providers publications or marketing
documents available
● additional consultant support is required
3% of implementation
costs
if only few service providers are available rate negotiations can
get unfavorable
6% of service fee
Performance measurement of
service quality
Variable cost factors in agreed price table
Failed margin payments per time frame
Disputes exceeding a specific time until resolution
● a continuously reduced quality of service
can also reduce actual benefits
0.005 bps per AuM
Business knowledge of service provider
How many other clients operating similar business
does the provider have
● late/imperfect reporting or late set-up of new
portfolios cause delays in investment decisions
0.005 bps per AuM
lack of understanding of operating model causes inefficient collateralization
0.007 bps of collateral
1)Cost rates are estimated by market experience and expert estimates as follows: effect of additional cost and risk factors* probability of occurrence
6COLLATERAL MANAGEMENT: WHEN DOES IT MAKE SENSE TO OUTSOURCE?
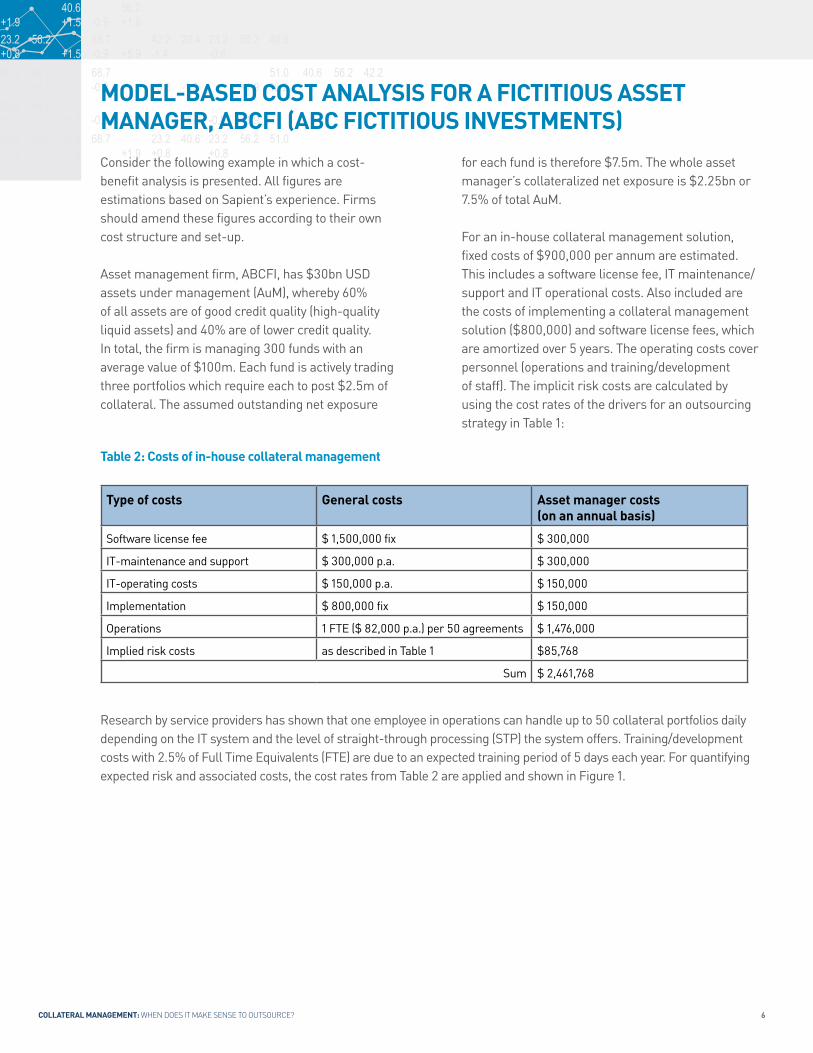
Table 2: Costs of in-house collateral management
Type of costs General costs Asset manager costs(on an annual basis)
Software license fee $ 1,500,000 fix $ 300,000
IT-maintenance and support $ 300,000 p.a. $ 300,000
IT-operating costs $ 150,000 p.a. $ 150,000
Implementation $ 800,000 fix $ 150,000
Operations 1 FTE ($ 82,000 p.a.) per 50 agreements $ 1,476,000
Implied risk costs as described in Table 1 $85,768
Sum $ 2,461,768
Research by service providers has shown that one employee in operations can handle up to 50 collateral portfolios daily depending on the IT system and the level of straight-through processing (STP) the system offers. Training/development costs with 2.5% of Full Time Equivalents (FTE) are due to an expected training period of 5 days each year. For quantifying expected risk and associated costs, the cost rates from Table 2 are applied and shown in Figure 1.
for each fund is therefore $7.5m. The whole asset manager’s collateralized net exposure is $2.25bn or 7.5% of total AuM.
For an in-house collateral management solution, fixed costs of $900,000 per annum are estimated. This includes a software license fee, IT maintenance/support and IT operational costs. Also included are the costs of implementing a collateral management solution ($800,000) and software license fees, which are amortized over 5 years. The operating costs cover personnel (operations and training/development of staff). The implicit risk costs are calculated by using the cost rates of the drivers for an outsourcing strategy in Table 1:
Consider the following example in which a cost-benefit analysis is presented. All figures are estimations based on Sapient’s experience. Firms should amend these figures according to their own cost structure and set-up.
Asset management firm, ABCFI, has $30bn USD assets under management (AuM), whereby 60% of all assets are of good credit quality (high-quality liquid assets) and 40% are of lower credit quality. In total, the firm is managing 300 funds with an average value of $100m. Each fund is actively trading three portfolios which require each to post $2.5m of collateral. The assumed outstanding net exposure
MODEL-BASED COST ANALYSIS FOR A FICTITIOUS ASSET MANAGER, ABCFI (ABC FICTITIOUS INVESTMENTS)

7© SAPIENT CORPORATION 2015
$-
$0.50
$1.00
$1.50
$2.00
$2.50
$3.00
1 4 7 10 13 16 19 22 25 28
Cost
s
Mill
ions
Assets under Management in bn $
Structure of Costs for In-house Collateral Management
fixed costs running costs
Figure 1: Estimated costs of in-house collateral management
A considerable portion of in-house costs are fixed, including software license fees and implementation costs. The main drivers for variable costs are related to personnel costs (linearized), which are volume driven and can overshadow fixed costs. However, the relation between costs and volume may not be linear, depending on a firm’s specific cost structure.
Table 3 depicts a similar approach for the outsourcing option. The first four rows of the table are part of a typical service provider’s price schedule:
Table 3: Estimated costs of outsourced collateral management
Type of costs General costs Asset manager costs(on an annual basis)
Initial set-up/change fee $ 120 fix per portfolio set up/change fee $ 180,000
Fixed portfolio fee $2,000 p.a. $ 1,800,000
Collateral administration fee 0.5 bps p.a. on collateral value $ 112,500
Annual rebates 10% - 40% (progressive on rising portfolio fee)
($ 561,750)
Software license fee $ 400,000 fix $ 80,000
IT-maintenance/support $ 80,000 p.a. $ 80,000
IT-operating costs $ 65,000 p.a. $ 65,000
Implementation $ 200,000 fix $ 40,000
Outsourcing coordinator 1 FTE ($ 80,000 p.a.) per 150 agreements
$ 480,000
IT-administrator 1 FTE ($ 80,000 p.a.) $ 80,000
Implied risk costs as described in Table 1 $ 185,064
Sum $ 2,540,814
8COLLATERAL MANAGEMENT: WHEN DOES IT MAKE SENSE TO OUTSOURCE?
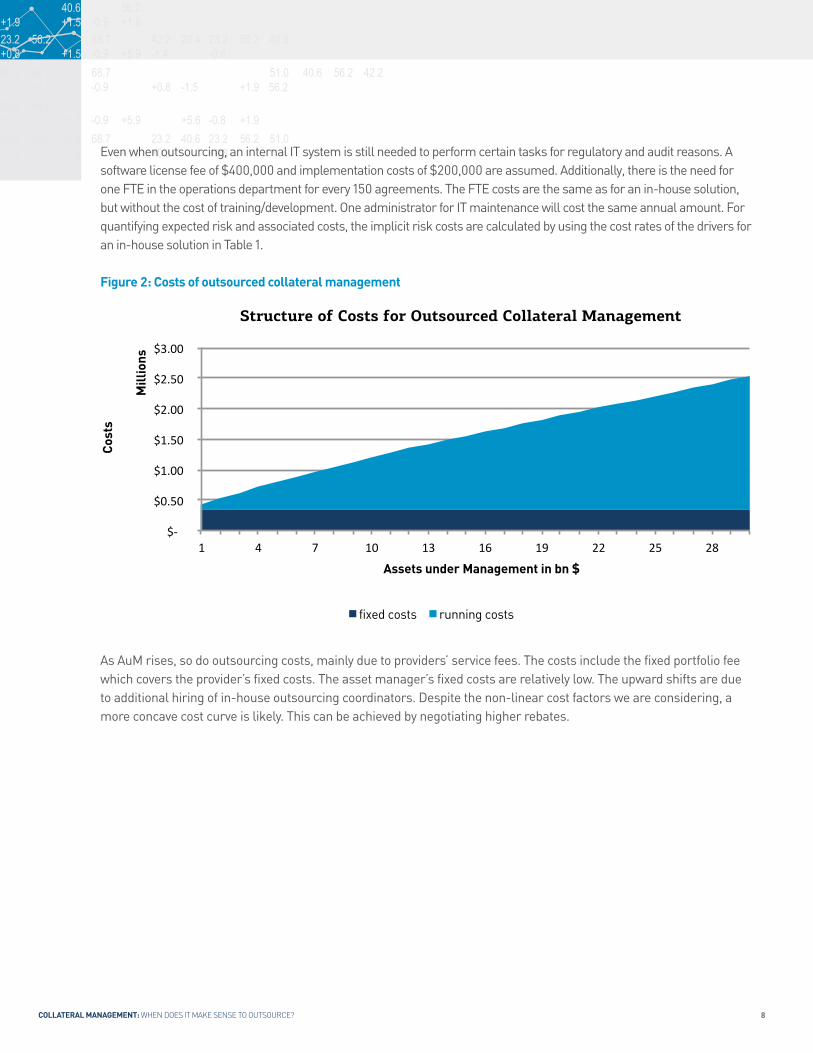
Even when outsourcing, an internal IT system is still needed to perform certain tasks for regulatory and audit reasons. A software license fee of $400,000 and implementation costs of $200,000 are assumed. Additionally, there is the need for one FTE in the operations department for every 150 agreements. The FTE costs are the same as for an in-house solution, but without the cost of training/development. One administrator for IT maintenance will cost the same annual amount. For quantifying expected risk and associated costs, the implicit risk costs are calculated by using the cost rates of the drivers for an in-house solution in Table 1.
Figure 2: Costs of outsourced collateral management
As AuM rises, so do outsourcing costs, mainly due to providers’ service fees. The costs include the fixed portfolio fee which covers the provider’s fixed costs. The asset manager’s fixed costs are relatively low. The upward shifts are due to additional hiring of in-house outsourcing coordinators. Despite the non-linear cost factors we are considering, a more concave cost curve is likely. This can be achieved by negotiating higher rebates.
$-
$0.50
$1.00
$1.50
$2.00
$2.50
$3.00
1 4 7 10 13 16 19 22 25 28
Cost
s
Mill
ions
Assets under Management in bn $
Structure of Costs for Outsourced Collateral Management
fixed costs running costs
9© SAPIENT CORPORATION 2015
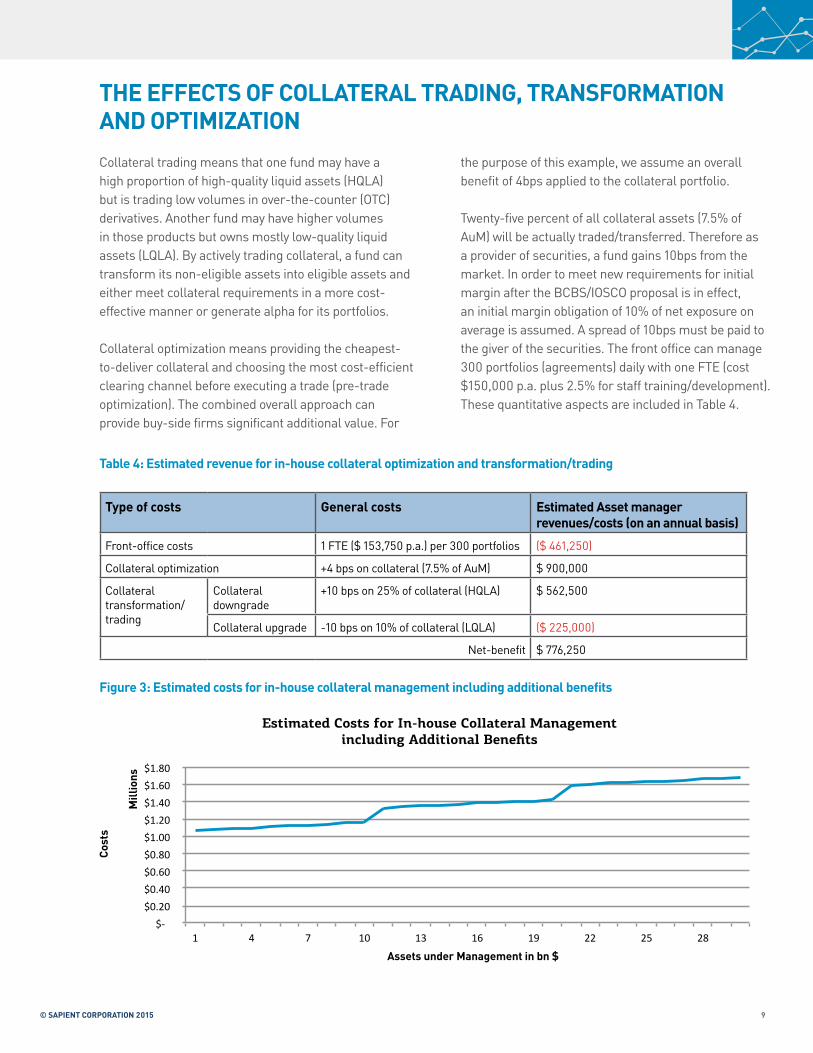
Collateral trading means that one fund may have a high proportion of high-quality liquid assets (HQLA) but is trading low volumes in over-the-counter (OTC) derivatives. Another fund may have higher volumes in those products but owns mostly low-quality liquid assets (LQLA). By actively trading collateral, a fund can transform its non-eligible assets into eligible assets and either meet collateral requirements in a more cost-effective manner or generate alpha for its portfolios.
Collateral optimization means providing the cheapest-to-deliver collateral and choosing the most cost-efficient clearing channel before executing a trade (pre-trade optimization). The combined overall approach can provide buy-side firms significant additional value. For
the purpose of this example, we assume an overall benefit of 4bps applied to the collateral portfolio.
Twenty-five percent of all collateral assets (7.5% of AuM) will be actually traded/transferred. Therefore as a provider of securities, a fund gains 10bps from the market. In order to meet new requirements for initial margin after the BCBS/IOSCO proposal is in effect, an initial margin obligation of 10% of net exposure on average is assumed. A spread of 10bps must be paid to the giver of the securities. The front office can manage 300 portfolios (agreements) daily with one FTE (cost $150,000 p.a. plus 2.5% for staff training/development). These quantitative aspects are included in Table 4.
THE EFFECTS OF COLLATERAL TRADING, TRANSFORMATION AND OPTIMIZATION
Table 4: Estimated revenue for in-house collateral optimization and transformation/trading
Type of costs General costs Estimated Asset manager revenues/costs (on an annual basis)
Front-office costs 1 FTE ($ 153,750 p.a.) per 300 portfolios ($ 461,250)
Collateral optimization +4 bps on collateral (7.5% of AuM) $ 900,000
Collateraltransformation/trading
Collateral downgrade
+10 bps on 25% of collateral (HQLA) $ 562,500
Collateral upgrade -10 bps on 10% of collateral (LQLA) ($ 225,000)
Net-benefit $ 776,250
Figure 3: Estimated costs for in-house collateral management including additional benefits
$-$0.20$0.40$0.60$0.80$1.00$1.20$1.40$1.60$1.80
1 4 7 10 13 16 19 22 25 28
Cost
s
Mill
ions
Assets under Management in bn $
Estimated Costs for In-house Collateral Managementincluding Additional Benefits
10COLLATERAL MANAGEMENT: WHEN DOES IT MAKE SENSE TO OUTSOURCE?
Estimated Costs for Outsourced Collateral Managementincluding Additional Benefits
$-
$0.50
$1.00
$1.50
$2.00
$2.50
1 4 7 10 13 16 19 22 25 28
Cost
s
Mill
ions
Assets under Management in bn $
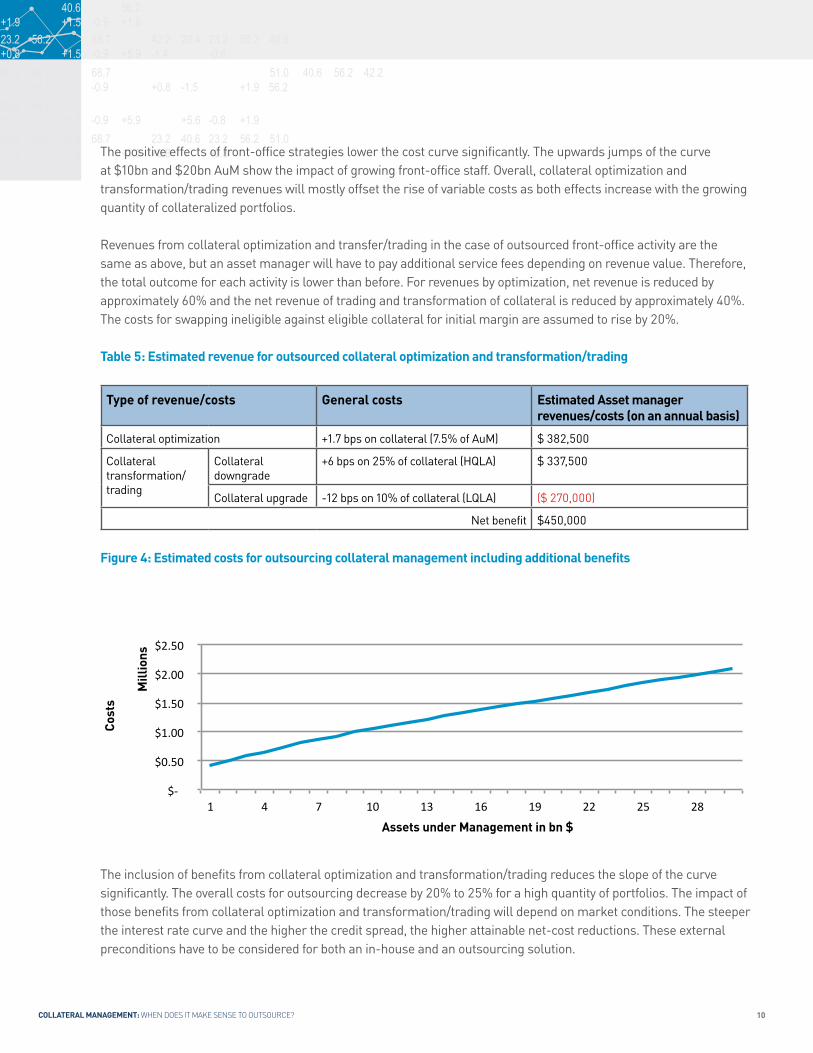
The positive effects of front-office strategies lower the cost curve significantly. The upwards jumps of the curve at $10bn and $20bn AuM show the impact of growing front-office staff. Overall, collateral optimization and transformation/trading revenues will mostly offset the rise of variable costs as both effects increase with the growing quantity of collateralized portfolios. Revenues from collateral optimization and transfer/trading in the case of outsourced front-office activity are the same as above, but an asset manager will have to pay additional service fees depending on revenue value. Therefore, the total outcome for each activity is lower than before. For revenues by optimization, net revenue is reduced by approximately 60% and the net revenue of trading and transformation of collateral is reduced by approximately 40%. The costs for swapping ineligible against eligible collateral for initial margin are assumed to rise by 20%.
Table 5: Estimated revenue for outsourced collateral optimization and transformation/trading
Type of revenue/costs General costs Estimated Asset manager revenues/costs (on an annual basis)
Collateral optimization +1.7 bps on collateral (7.5% of AuM) $ 382,500
Collateraltransformation/trading
Collateral downgrade
+6 bps on 25% of collateral (HQLA) $ 337,500
Collateral upgrade -12 bps on 10% of collateral (LQLA) ($ 270,000)
Net benefit $450,000
Figure 4: Estimated costs for outsourcing collateral management including additional benefits
The inclusion of benefits from collateral optimization and transformation/trading reduces the slope of the curve significantly. The overall costs for outsourcing decrease by 20% to 25% for a high quantity of portfolios. The impact of those benefits from collateral optimization and transformation/trading will depend on market conditions. The steeper the interest rate curve and the higher the credit spread, the higher attainable net-cost reductions. These external preconditions have to be considered for both an in-house and an outsourcing solution.
11© SAPIENT CORPORATION 2015
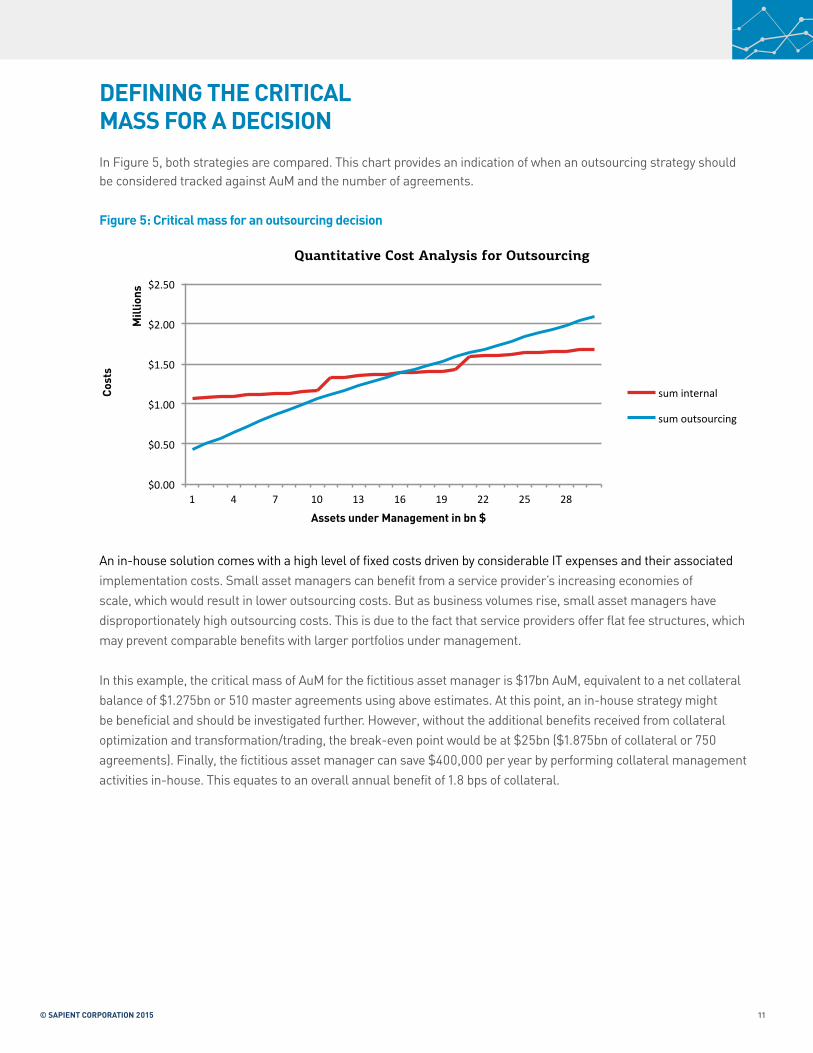
In Figure 5, both strategies are compared. This chart provides an indication of when an outsourcing strategy should be considered tracked against AuM and the number of agreements.
An in-house solution comes with a high level of fixed costs driven by considerable IT expenses and their associated implementation costs. Small asset managers can benefit from a service provider’s increasing economies of scale, which would result in lower outsourcing costs. But as business volumes rise, small asset managers have disproportionately high outsourcing costs. This is due to the fact that service providers offer flat fee structures, which may prevent comparable benefits with larger portfolios under management.
In this example, the critical mass of AuM for the fictitious asset manager is $17bn AuM, equivalent to a net collateral balance of $1.275bn or 510 master agreements using above estimates. At this point, an in-house strategy might be beneficial and should be investigated further. However, without the additional benefits received from collateral optimization and transformation/trading, the break-even point would be at $25bn ($1.875bn of collateral or 750 agreements). Finally, the fictitious asset manager can save $400,000 per year by performing collateral management activities in-house. This equates to an overall annual benefit of 1.8 bps of collateral.
DEFINING THE CRITICAL MASS FOR A DECISION
Figure 5: Critical mass for an outsourcing decision
$0.00
$0.50
$1.00
$1.50
$2.00
$2.50
1 4 7 10 13 16 19 22 25 28
Cost
s
Mill
ions
Assets under Management in bn $
Quantitative Cost Analysis for Outsourcing
sum internal
sum outsourcing
12COLLATERAL MANAGEMENT: WHEN DOES IT MAKE SENSE TO OUTSOURCE?
CONCLUSION AND OUTLOOK
Whether firms should outsource collateral management or keep it in-house depends on a number of factors and associated risks. Firms focused on capital efficiencies will want to weigh the pros and cons and crunch the numbers, keeping the following findings in mind:
• There are some generic drivers that should beconsidered when evaluating an outsourcing strategy. Including the effects of these drivers into decision making helps buy-side firms to choose the appropriate strategy. If outsourcing is considered, this approach gives buy-side firms an orientation for a fair pricing of services.
• The benefits gained by front-office activities, suchas collateral optimization and transfer/trading, have a positive effect on the overall cost structure. It effectively decreases net costs in both in-house and outsourcing options and both cost curves flattened significantly.
• An outsourcing solution can be more beneficialeven for a higher value of AuM if collateral optimization and transformation/trading are performed. Depending on the individual cost structure of a buy-side firm and the actual fee structure of possible service providers, the final results will differ. Current market conditions measured by the steepness of interest rate curves and credit spreads will also have an impact. However, collateral optimization and transformation/trading will have a significant influence on an outsourcing decision and should be included in the evaluation process.
This paper includes a model and approach that buy-side firms can use to understand the factors involved in the outsourcing versus in-house decision for collateral management. It provides a framework to quantify the costs involved and what could impact those costs. Finally, it can help firms define fair pricing and investment risk should they choose to outsource.
ABOUT SAPIENT GLOBAL MARKETSSapient Global Markets, a part of Publicis.Sapient, is a leading provider of services to today’s evolving financial and commodity markets. We provide a full range of capabilities to help our clients grow and enhance their businesses, create robust and transparent infrastructure, manage operating costs, and foster innovation throughout their organizations. We offer services across Advisory, Analytics, Technology, and Process, as well as unique methodologies in program management, technology development, and process outsourcing. Sapient Global Markets operates in key financial and commodity centers worldwide, including Boston, Calgary, Chicago, Düsseldorf, Frankfurt, Houston, London, Los Angeles, Milan, New York, Singapore, Washington D.C. and Zürich, as well as in large technology development and operations outsourcing centers in Bangalore, Delhi, and Noida, India.
For more information, visit sapientglobalmarkets.com.
© 2015 Sapient Corporation.Trademark Information: Sapient and the Sapient logo are trademarks or registered trademarks of Sapient Corporation or its subsidiaries in the U.S. and other countries. All other trade names are trademarks or registered trademarks of their respective holders.
Sapient is not regulated by any legal, compliance or financial regulatory authority or body. You remain solely responsible for obtaining independent legal, compliance and financial advice in respect of the Services.
13© SAPIENT CORPORATION 2015
THE AUTHORS
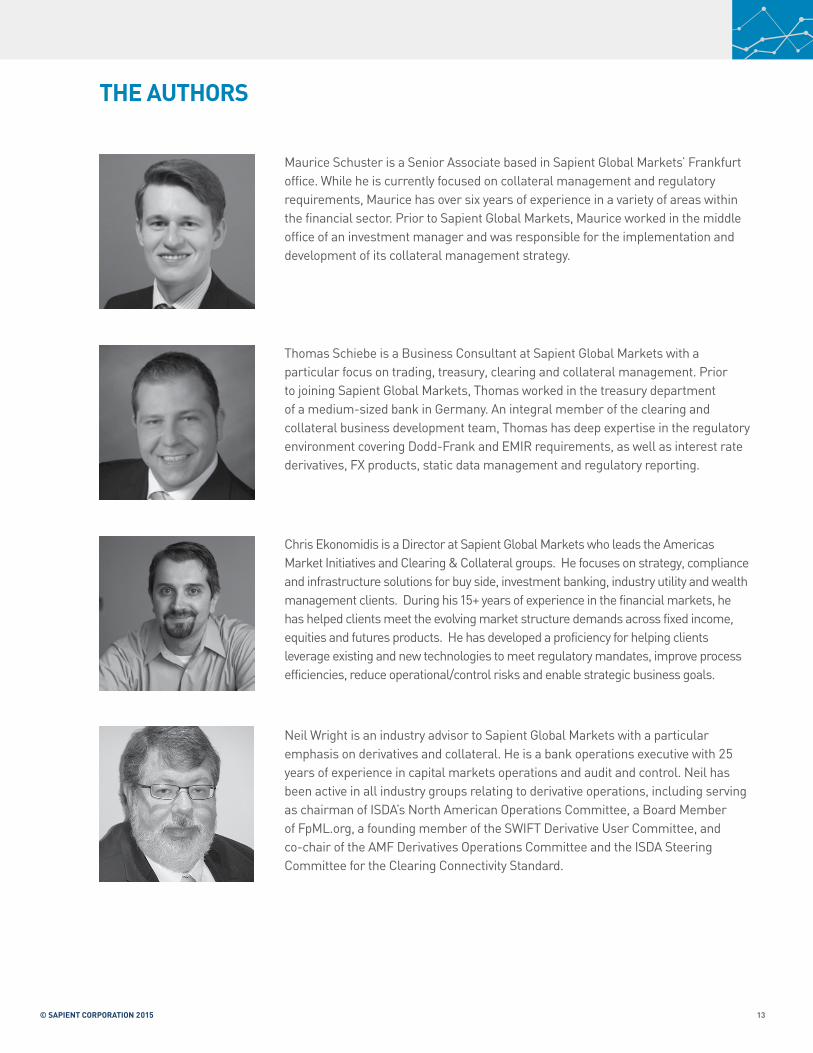
Maurice Schuster is a Senior Associate based in Sapient Global Markets’ Frankfurt office. While he is currently focused on collateral management and regulatory requirements, Maurice has over six years of experience in a variety of areas within the financial sector. Prior to Sapient Global Markets, Maurice worked in the middle office of an investment manager and was responsible for the implementation and development of its collateral management strategy.
Thomas Schiebe is a Business Consultant at Sapient Global Markets with a particular focus on trading, treasury, clearing and collateral management. Prior to joining Sapient Global Markets, Thomas worked in the treasury department of a medium-sized bank in Germany. An integral member of the clearing and collateral business development team, Thomas has deep expertise in the regulatory environment covering Dodd-Frank and EMIR requirements, as well as interest rate derivatives, FX products, static data management and regulatory reporting.
Chris Ekonomidis is a Director at Sapient Global Markets who leads the Americas Market Initiatives and Clearing & Collateral groups. He focuses on strategy, compliance and infrastructure solutions for buy side, investment banking, industry utility and wealth management clients. During his 15+ years of experience in the financial markets, he has helped clients meet the evolving market structure demands across fixed income, equities and futures products. He has developed a proficiency for helping clients leverage existing and new technologies to meet regulatory mandates, improve process efficiencies, reduce operational/control risks and enable strategic business goals.
Neil Wright is an industry advisor to Sapient Global Markets with a particular emphasis on derivatives and collateral. He is a bank operations executive with 25 years of experience in capital markets operations and audit and control. Neil has been active in all industry groups relating to derivative operations, including serving as chairman of ISDA’s North American Operations Committee, a Board Member of FpML.org, a founding member of the SWIFT Derivative User Committee, and co-chair of the AMF Derivatives Operations Committee and the ISDA Steering Committee for the Clearing Connectivity Standard.

14COLLATERAL MANAGEMENT: WHEN DOES IT MAKE SENSE TO OUTSOURCE?
GLOBAL OFFICES
GenevaSuccursale Genèvec/o Florence Thiébaud, avocaterue du Cendrier 151201 GenevaSwitzerlandTel: +41 (0) 58 206 06 00
HoustonHeritage Plaza1111 Bagby Street Suite 1950Houston, TX 77002Tel: +1 (713) 493 6880
LondonEden House8 Spital SquareLondon, E1 6DUUnited KingdomTel: + 44 (0) 207 786 4500
Los Angeles1601 Cloverfield Blvd.Suite 400 SouthSanta Monica, CA 90404Tel: +1 (310) 264 6900
MilanSapient Italy S.r.lViale Bianca Maria 2320122 MilanItalyTel: +39-02-00681538
MumbaiSapient Consulting Pvt. LtdR-Tech Park, Goregaon(E)13th Floor, Building 2,Off Western Express HighwayMumbai, Maharashtra - 400063IndiaTel: +91-22-44764567
Munich Arnulfstrasse 6080335 MünchenGermanyTel: +49 (0) 89 552 987 0
Noida(NCR of Delhi)“Oxygen”, Tower C,Ground - 3rd floorPlot No. 7,Sector 144 ExpresswayNoida 201304Uttar PradeshIndiaTel: +91 (120) 479 5000
New York40 Fulton Street22nd FloorNew York, NY 10038Tel: +1 (212) 206 1005
Singapore158 Cecil Street, #03-01Singapore 069545Tel: +65 6671 4933
Toronto129 Spadina Avenue Suite 500Toronto, Ontario M5V 2L3CanadaTel: +1 (416) 645 1500
Washington DC1515 North Courthouse Road4th FloorArlington, VA 22201-2909Tel: +1 (703) 908 2400
ZürichSeefeldstrasse 358008 ZürichSwitzerlandTel: +41 (58) 206 06 00
HeadquartersBoston131 Dartmouth Street3rd FloorBoston, MA 02116Tel: +1 (617) 621 0200
BangaloreSalarpuria GR Tech Park6th Floor, “VAYU” Block#137, Bengaluru 560066KarnatakaIndiaTel: +91 (080) 410 47 000
Calgary888 3rd Street SWSuite 1000Calgary, Alberta T2P 5C5CanadaTel: +1 (403) 444 5574
Chicago30 West Monroe,12th FloorChicago, IL 60603Tel: +1 (312) 458 1800
DelhiUnitech InfospaceGround Floor, Tower ABuilding 2, Sector 21Old Delhi - Gurgaon RoadDundahera, Gurgaon 122016HaryanaIndiaTel: +91 (124) 499 6000
DüsseldorfSpeditionstrasse 2140221 DüsseldorfGermanyTel: +49 (0) 211 540 34 0
FrankfurtSkyper Villa Taunusanlage 1 60329 Frankfurt Germany Tel: +49 (0)69 505060594