Embed Size (px)
Citation preview

COLGATE PALMOLIVE INDIA LTD.
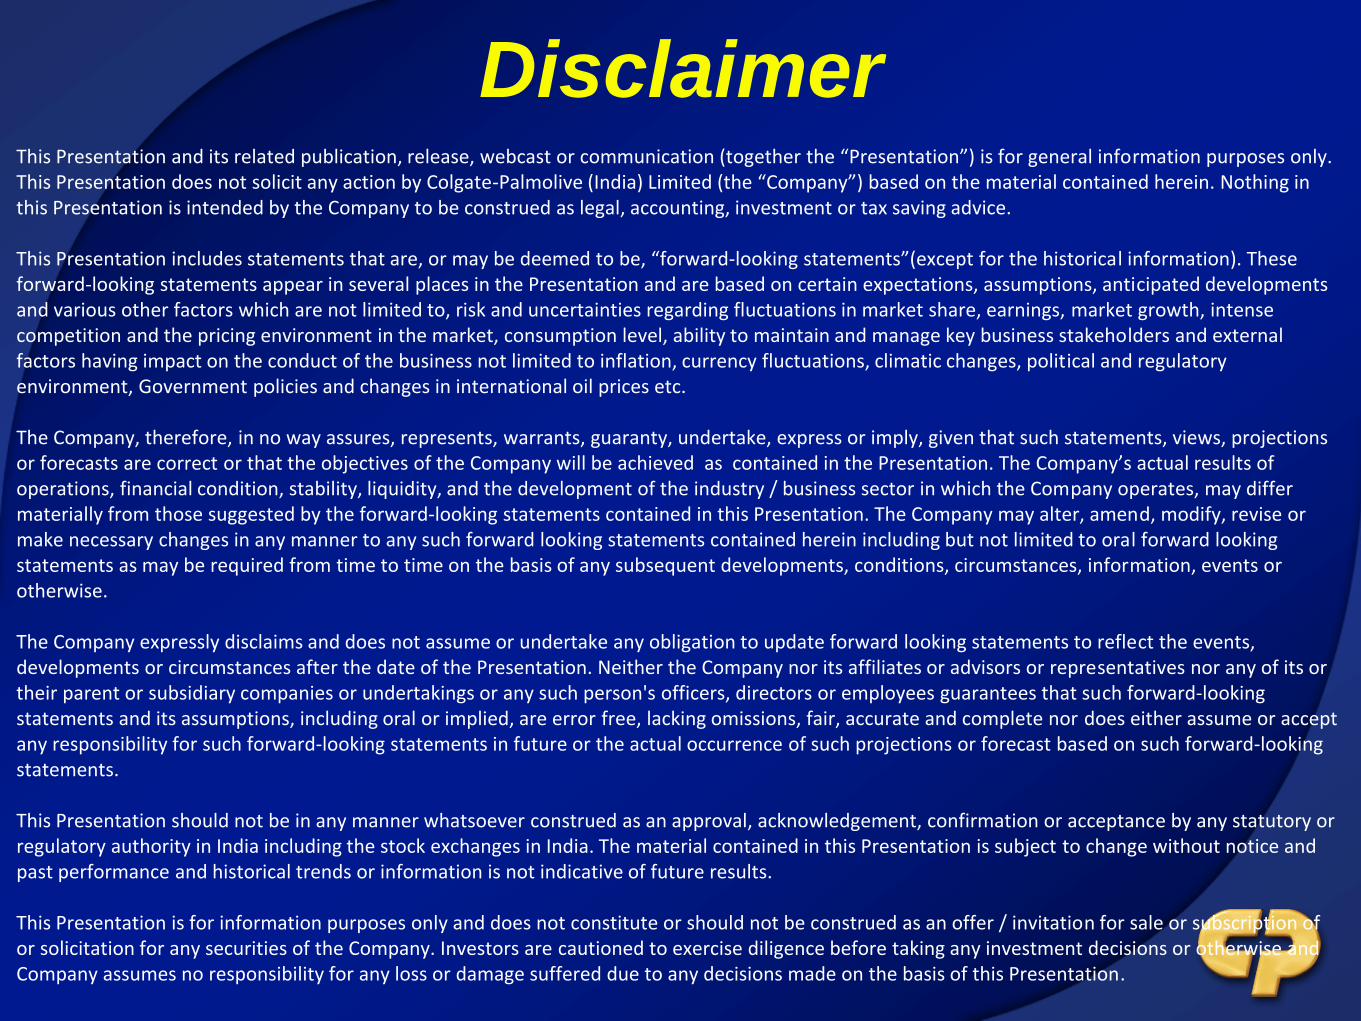
Disclaimer This Presentation and its related publication, release, webcast or communication (together the “Presentation”) is for general information purposes only. This Presentation does not solicit any action by Colgate-Palmolive (India) Limited (the “Company”) based on the material contained herein. Nothing in this Presentation is intended by the Company to be construed as legal, accounting, investment or tax saving advice. This Presentation includes statements that are, or may be deemed to be, “forward‐looking statements”(except for the historical information). These forward-looking statements appear in several places in the Presentation and are based on certain expectations, assumptions, anticipated developments and various other factors which are not limited to, risk and uncertainties regarding fluctuations in market share, earnings, market growth, intense competition and the pricing environment in the market, consumption level, ability to maintain and manage key business stakeholders and external factors having impact on the conduct of the business not limited to inflation, currency fluctuations, climatic changes, political and regulatory environment, Government policies and changes in international oil prices etc. The Company, therefore, in no way assures, represents, warrants, guaranty, undertake, express or imply, given that such statements, views, projections or forecasts are correct or that the objectives of the Company will be achieved as contained in the Presentation. The Company’s actual results of operations, financial condition, stability, liquidity, and the development of the industry / business sector in which the Company operates, may differ materially from those suggested by the forward‐looking statements contained in this Presentation. The Company may alter, amend, modify, revise or make necessary changes in any manner to any such forward looking statements contained herein including but not limited to oral forward looking statements as may be required from time to time on the basis of any subsequent developments, conditions, circumstances, information, events or otherwise.
The Company expressly disclaims and does not assume or undertake any obligation to update forward looking statements to reflect the events, developments or circumstances after the date of the Presentation. Neither the Company nor its affiliates or advisors or representatives nor any of its or their parent or subsidiary companies or undertakings or any such person's officers, directors or employees guarantees that such forward‐looking statements and its assumptions, including oral or implied, are error free, lacking omissions, fair, accurate and complete nor does either assume or accept any responsibility for such forward‐looking statements in future or the actual occurrence of such projections or forecast based on such forward-looking statements. This Presentation should not be in any manner whatsoever construed as an approval, acknowledgement, confirmation or acceptance by any statutory or regulatory authority in India including the stock exchanges in India. The material contained in this Presentation is subject to change without notice and past performance and historical trends or information is not indicative of future results. This Presentation is for information purposes only and does not constitute or should not be construed as an offer / invitation for sale or subscription of or solicitation for any securities of the Company. Investors are cautioned to exercise diligence before taking any investment decisions or otherwise and Company assumes no responsibility for any loss or damage suffered due to any decisions made on the basis of this Presentation.

Financial Results

Financial Strategy
Sales/ Volume
Margin
Non Variable
Overheads
Advertising
Operating Profit

4Q 2015

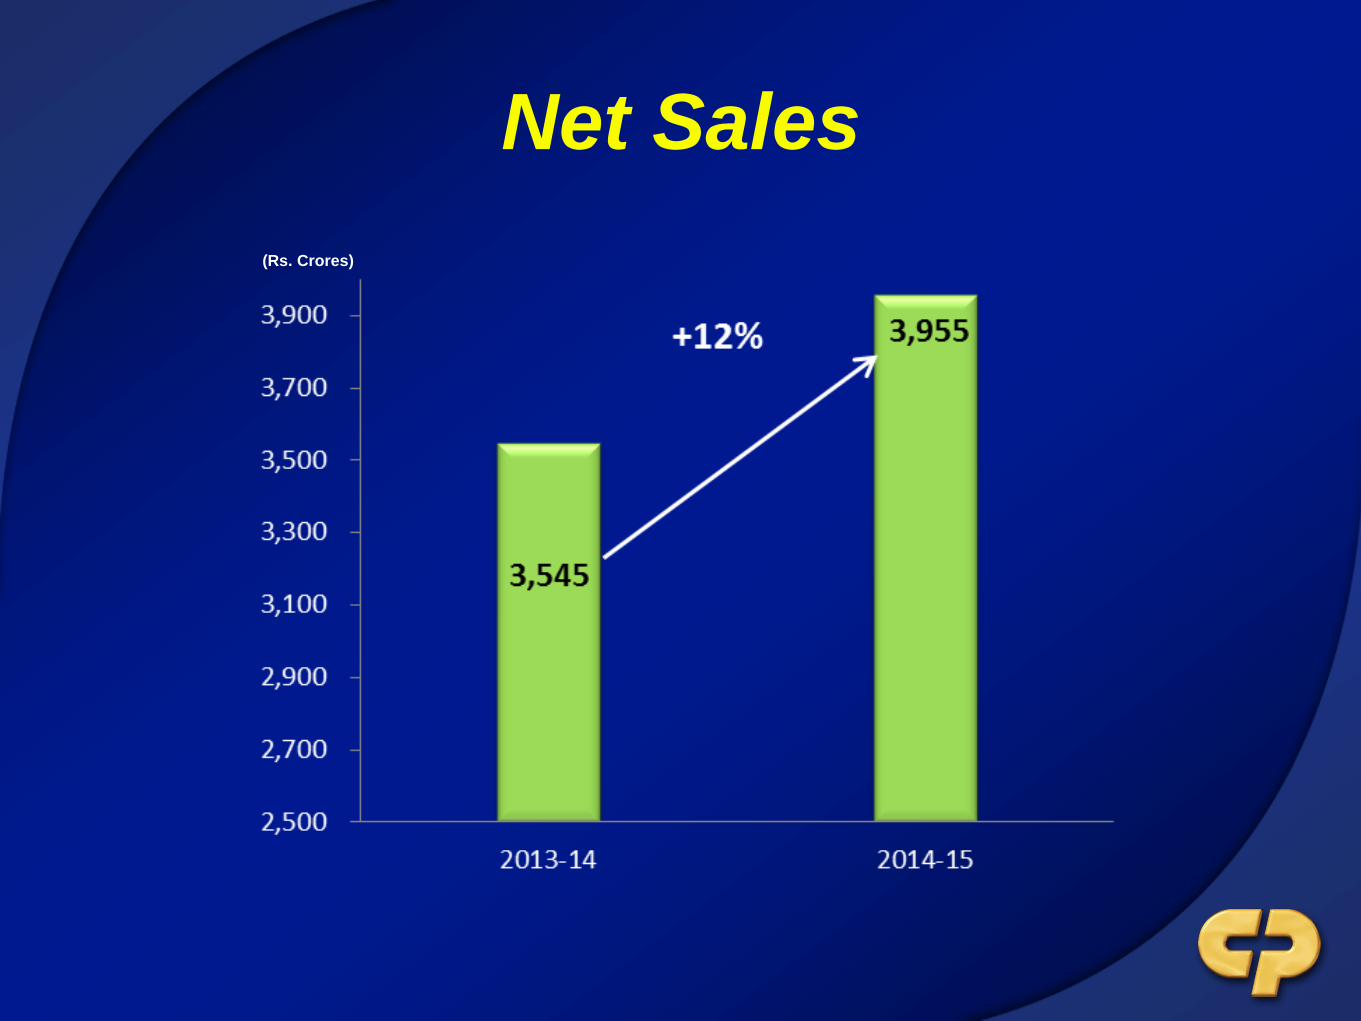
Net Sales
(Rs. Crores)

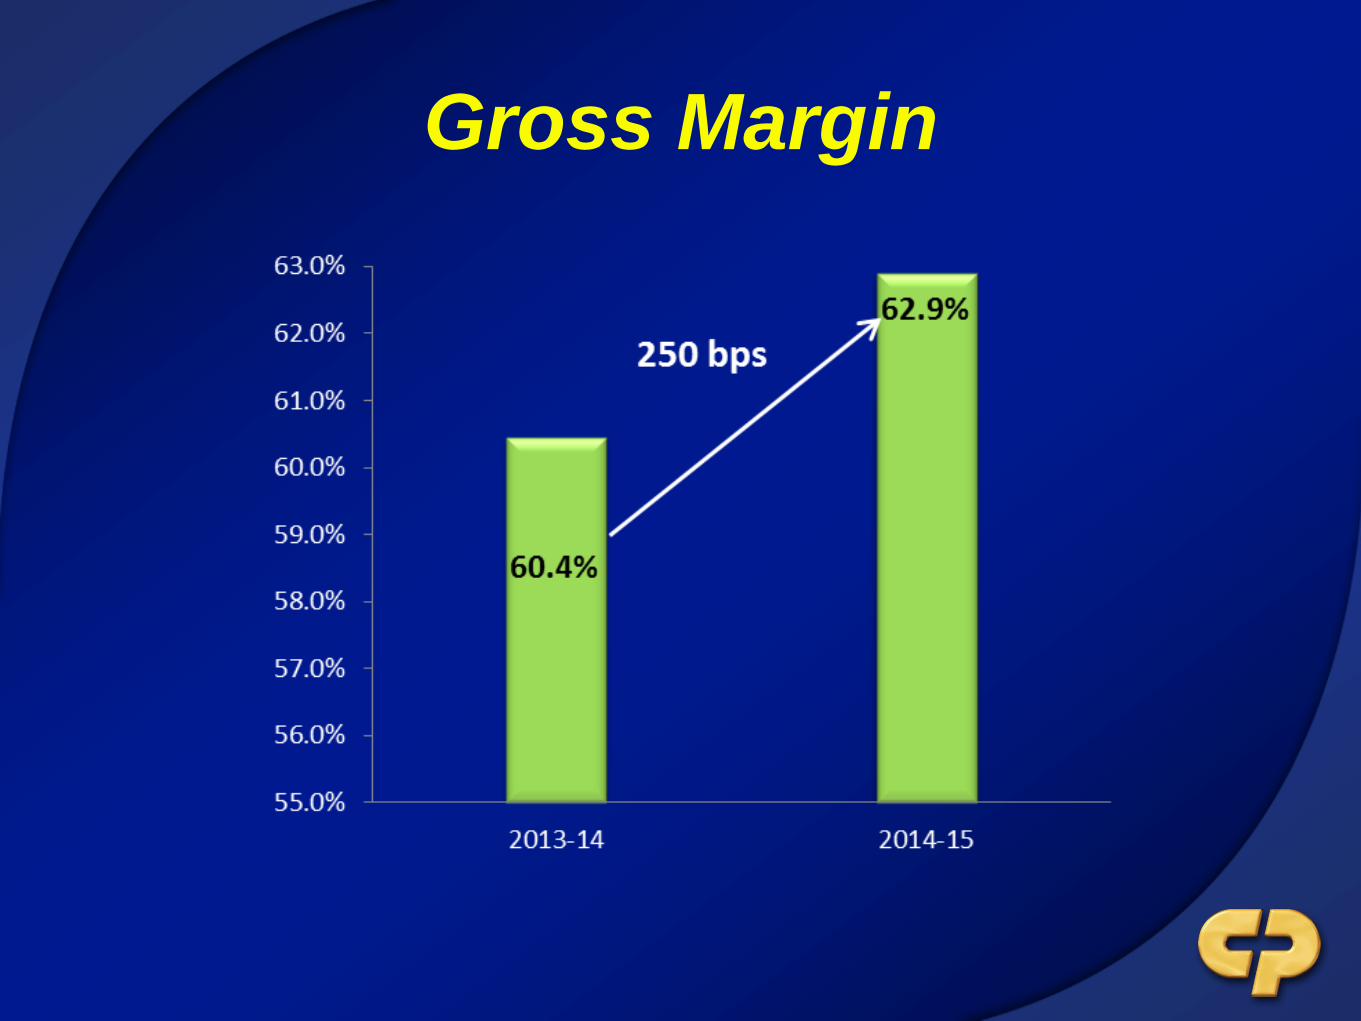
Gross Margin
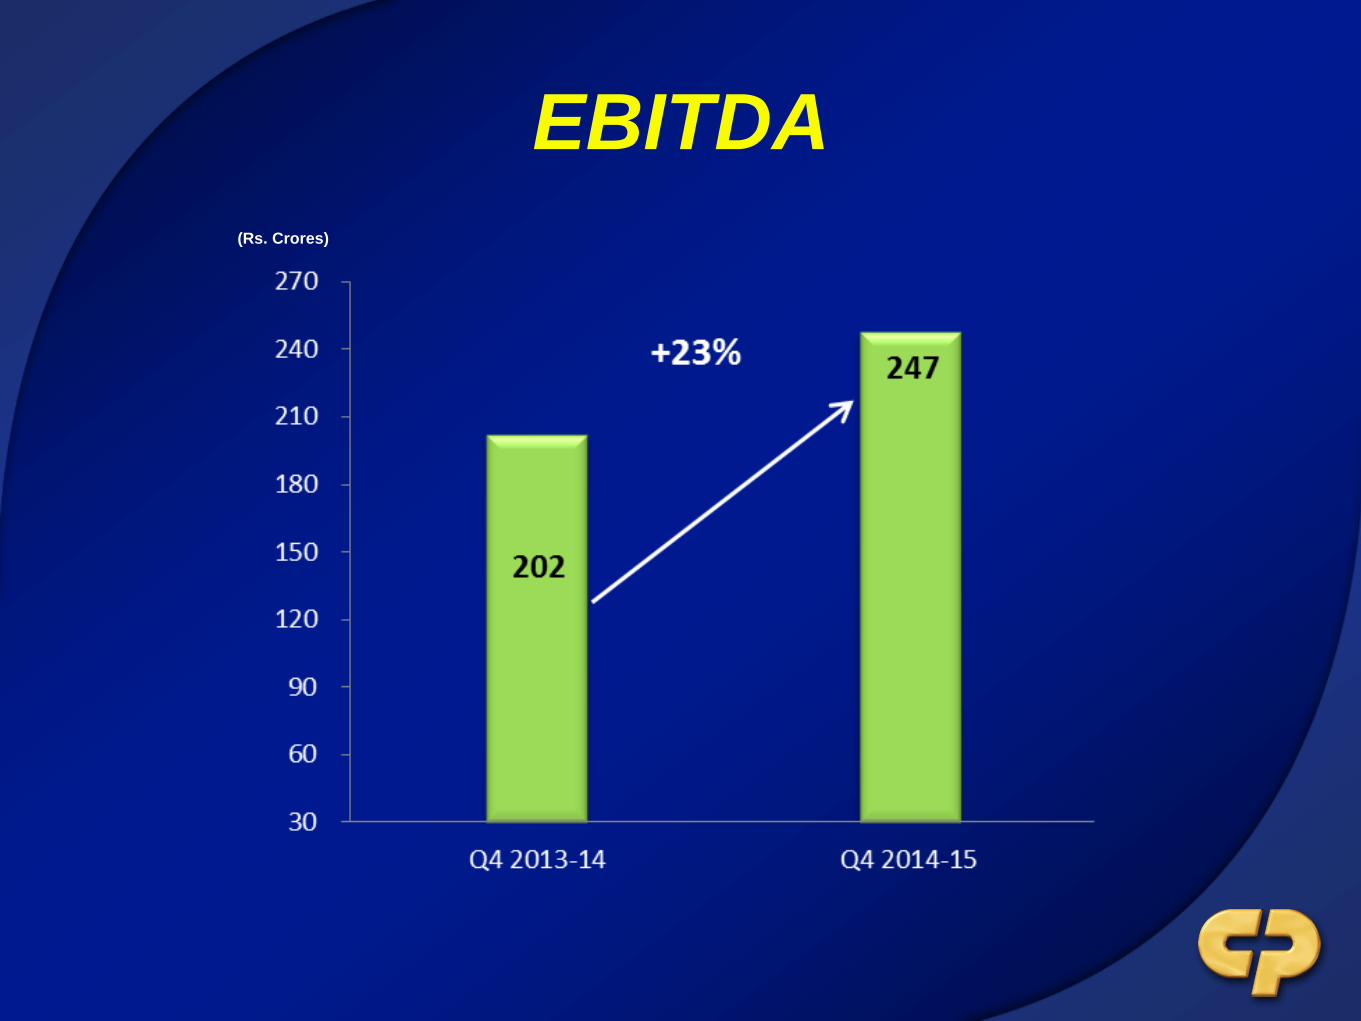
EBITDA
(Rs. Crores)
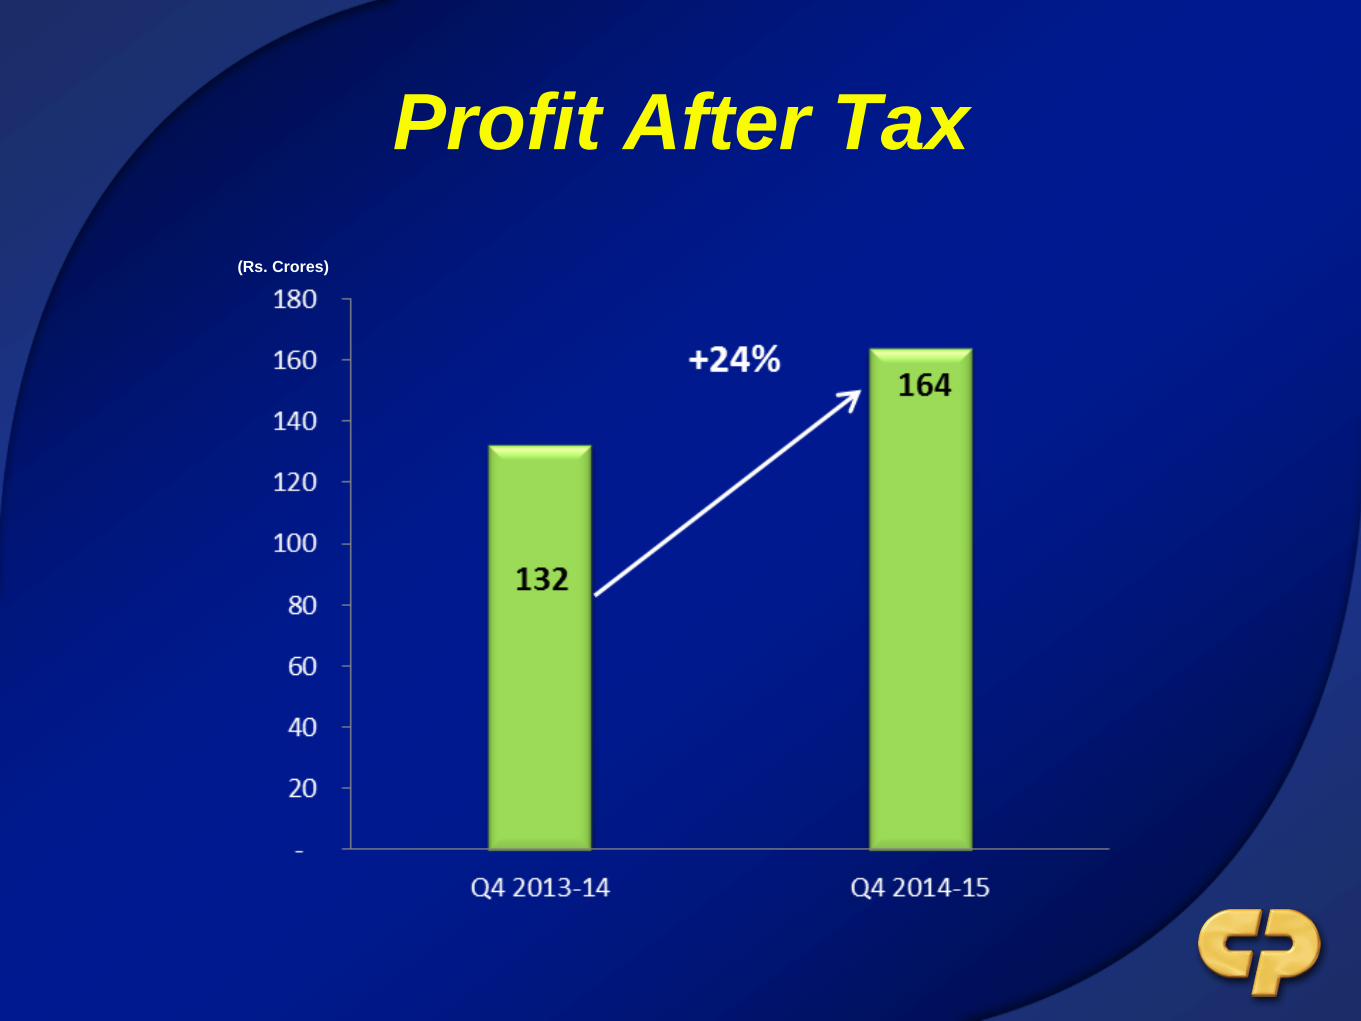
Profit After Tax
(Rs. Crores)
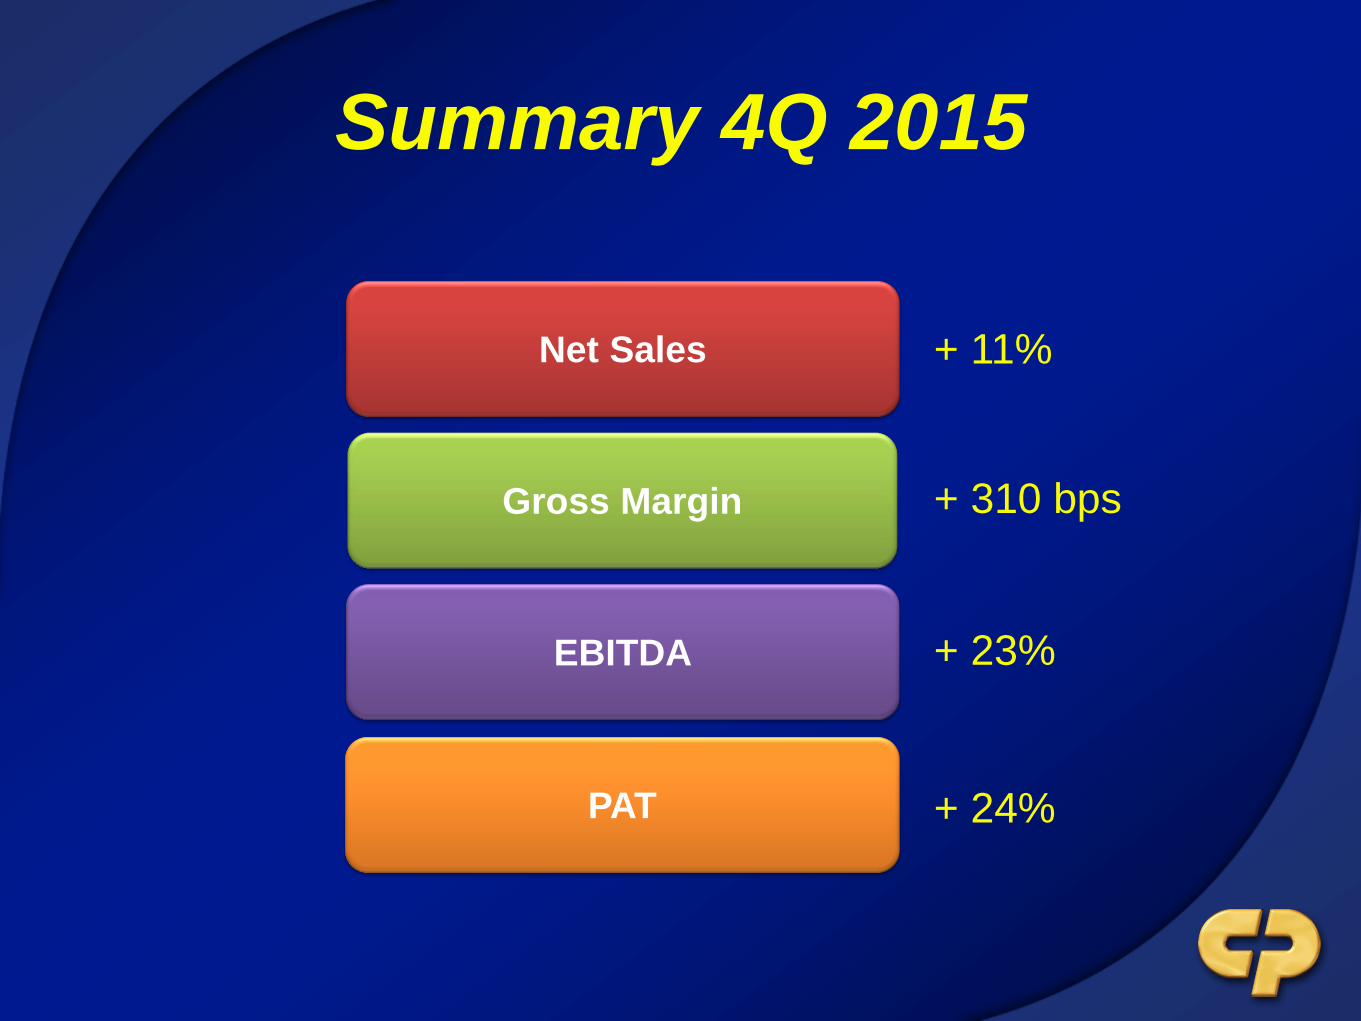
Summary 4Q 2015
Net Sales
Gross Margin
PAT
EBITDA
+ 11%
+ 310 bps
+ 23%
+ 24%

Full Year 2014-2015
Net Sales
(Rs. Crores)
Gross Margin

EBITDA
(Rs. Crores)

Profit After Tax
- 2013-14 PAT is excluding exceptional items due to GSSO slump sale
(Rs. Crores)

Summary 2014-2015
Net Sales
Gross Margin
PAT
EBITDA
+ 12%
+ 250 bps
+ 24%
+ 14%

It has been a challenging
environment

GDP Growth
9.5 9.6 9.3
6.7
8.6 8.9
6.7
4.7 5.0 5.6
FY0
6
FY0
7
FY0
8
FY0
9
FY1
0
FY1
1
FY1
2
FY1
3
FY1
4
FY1
5E
Source: Citibank Macro Flash reports (old series)

FMCG Growth
7.5%
4.8%
9.1% 8.5%
6.8%
5.4% 4.5% 4.4%
4.9% 5.0% 4.5% 4.6%
4.3%
2.3%
4.0%
4.2%
3.2% 5.8%
4.3%
1.0%
1.2%
2.9% 4.3%
5.7%
11.7%
7.1%
13.2% 12.6%
10.0%
11.2%
8.8%
5.4% 6.1%
8.0%
8.8%
10.3%
Price led growth Consumption growth Value growth
Source: Nielsen RMS All India (U+R)
FMCG nos. does not include Soft Drinks/ Liquor/ Juices

We continue to focus on our
proven strategic initiatives
Key Strategic Initiatives
• Engage to build our brands
• Innovation for growth
• Effectiveness & Efficiency
• Leading to Win

Our consumer franchise &
equity continue to grow

Toothpaste shares
54.5 55.9 56.7 57.8
23.8 22.8 21.5 19.9
13.9 13.5 13.4 13.4
2012 2013 2014 YTD 2015
Competitor 1
Competitor 2
Source: AC Nielsen Retail Audit YTD April 2015; Volume Shares

Toothbrush shares
39.8 41.6 42.4 42.1
18.8 18.4 18.3 18.3
6.7 7.4 7.9 8.8
2012 2013 2014 YTD 2015
Source: AC Nielsen Retail Audit YTD April 2015; Volume Shares
Competitor 1
Competitor 2
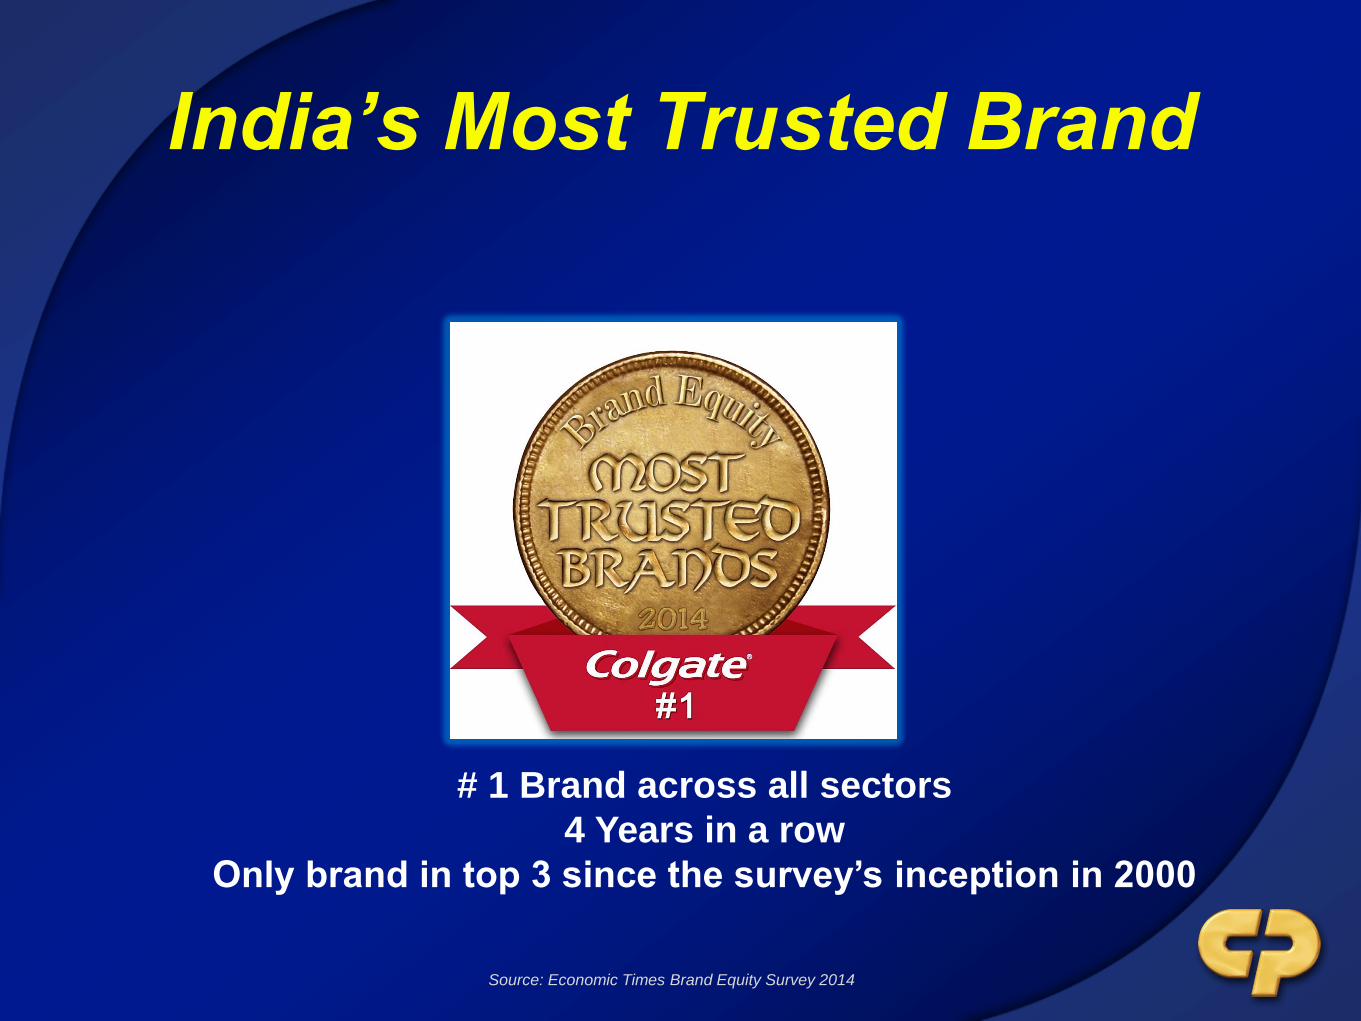
India’s Most Trusted Brand
# 1 Brand across all sectors
4 Years in a row
Only brand in top 3 since the survey’s inception in 2000
Source: Economic Times Brand Equity Survey 2014

India’s Most Purchased Brand
Source: Kantar Worldpanel Report 2014
And we are
Investing to Grow

Key Growth Drivers
• Innovation
• Engaging with consumers to build
our brands
• Winning on the Ground
• Strong professional partnerships

Innovating to create new segments
Whitening
Whiter + Shinier Teeth in 1 week

Innovating to create new segments
Sensitivity
Repairs Enamel for Lasting Sensitivity Relief
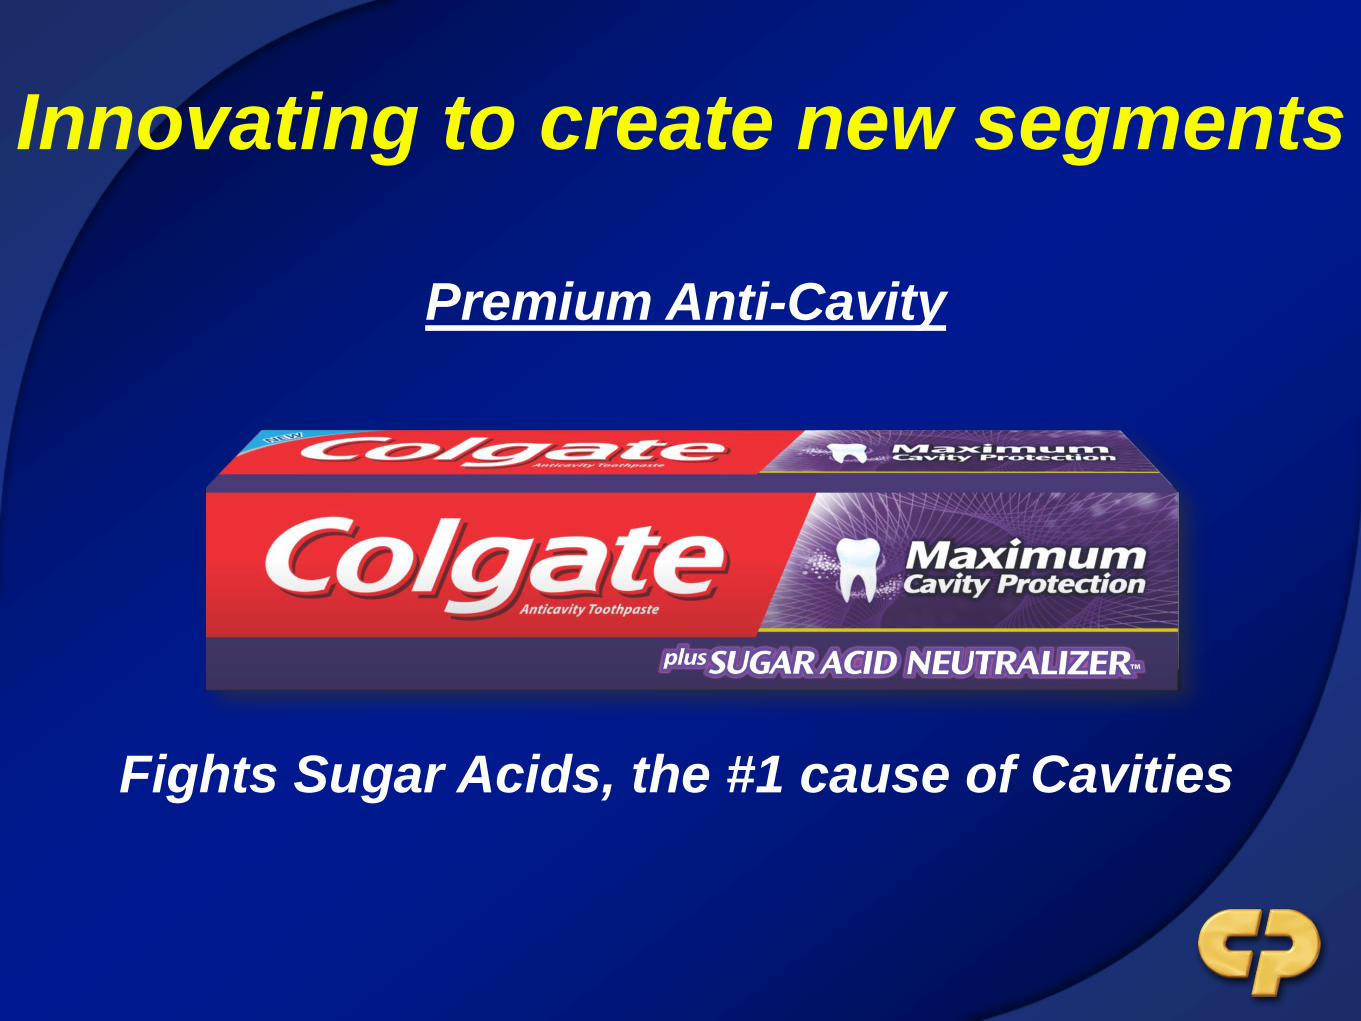
Innovating to create new segments
Premium Anti-Cavity
Fights Sugar Acids, the #1 cause of Cavities

Innovating to create new segments
Deep & Gentle Cleaning, with
Charcoal Infused Bristles
A Nielsen Survey
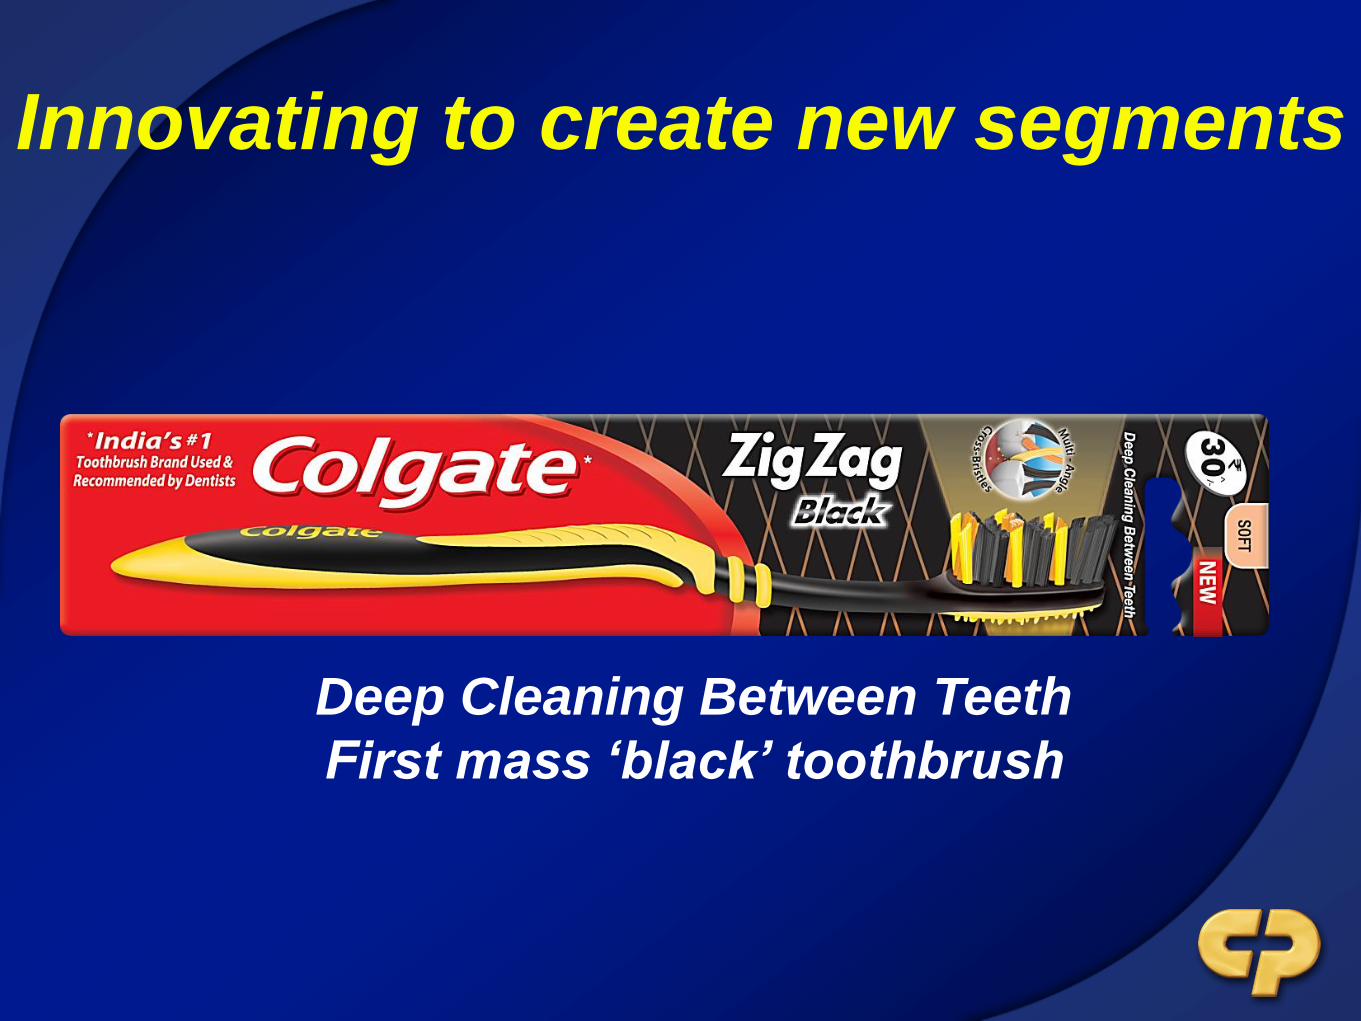
Innovating to create new segments
Deep Cleaning Between Teeth
First mass ‘black’ toothbrush

Innovating to drive premiumization P
ric
e
Rs.5
15g
Rs.10
35g
Rs.17
50g
Rs.20
50g
Rs.46
100g
Rs.60
70g
Rs.85
100g
Rs.95
70g
Benefits
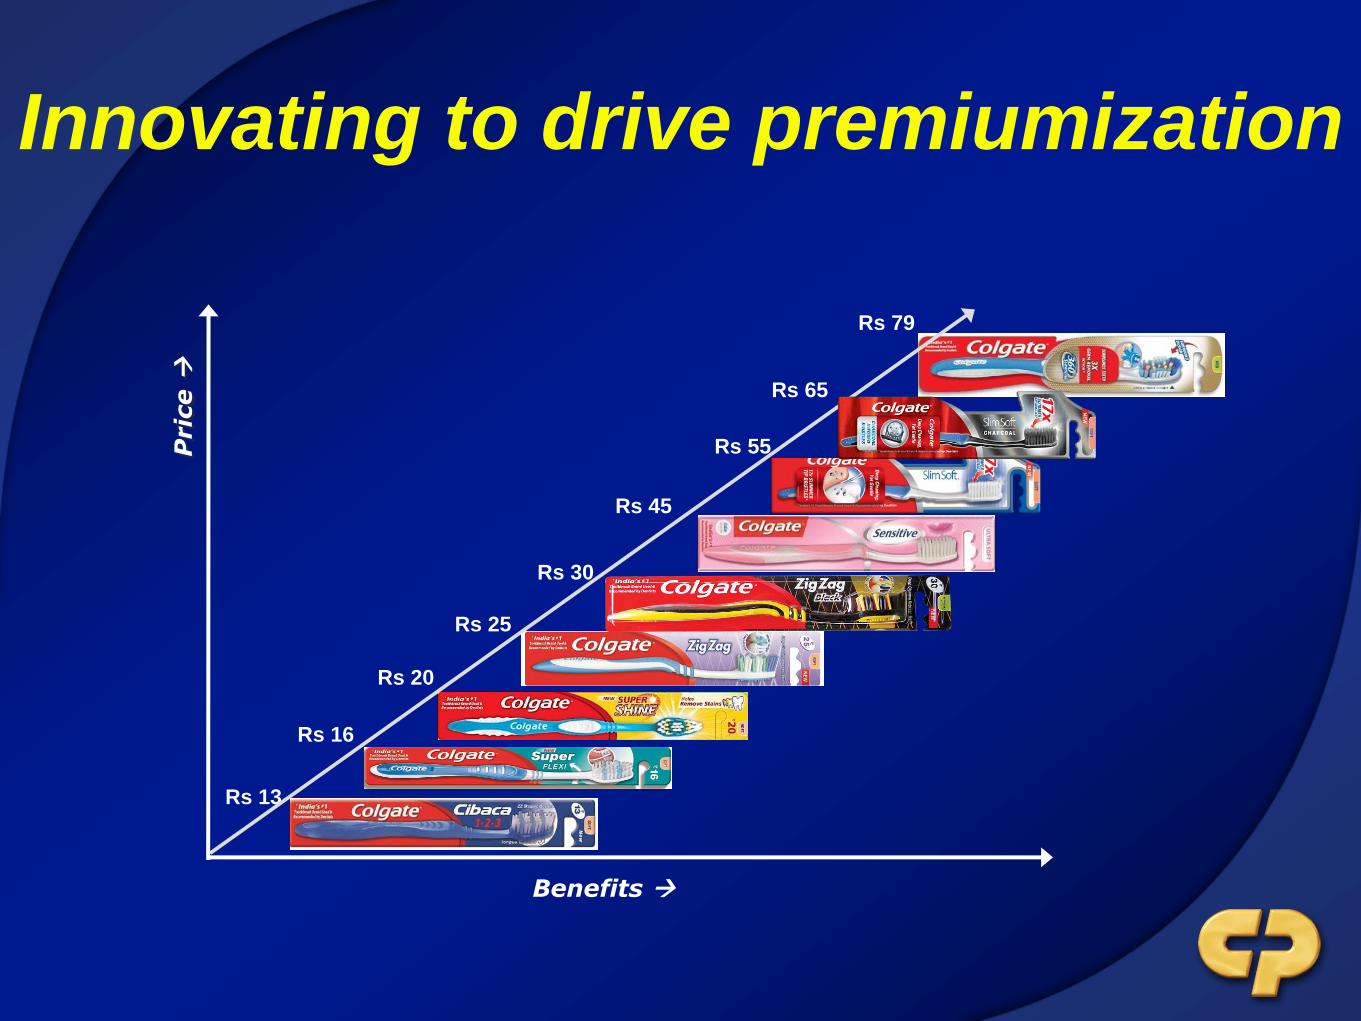
Innovating to drive premiumization
Rs 13
Rs 16
Rs 20
Rs 25
Rs 30
Rs 45
Rs 65
Rs 79
Pric
e
Benefits
Rs 55
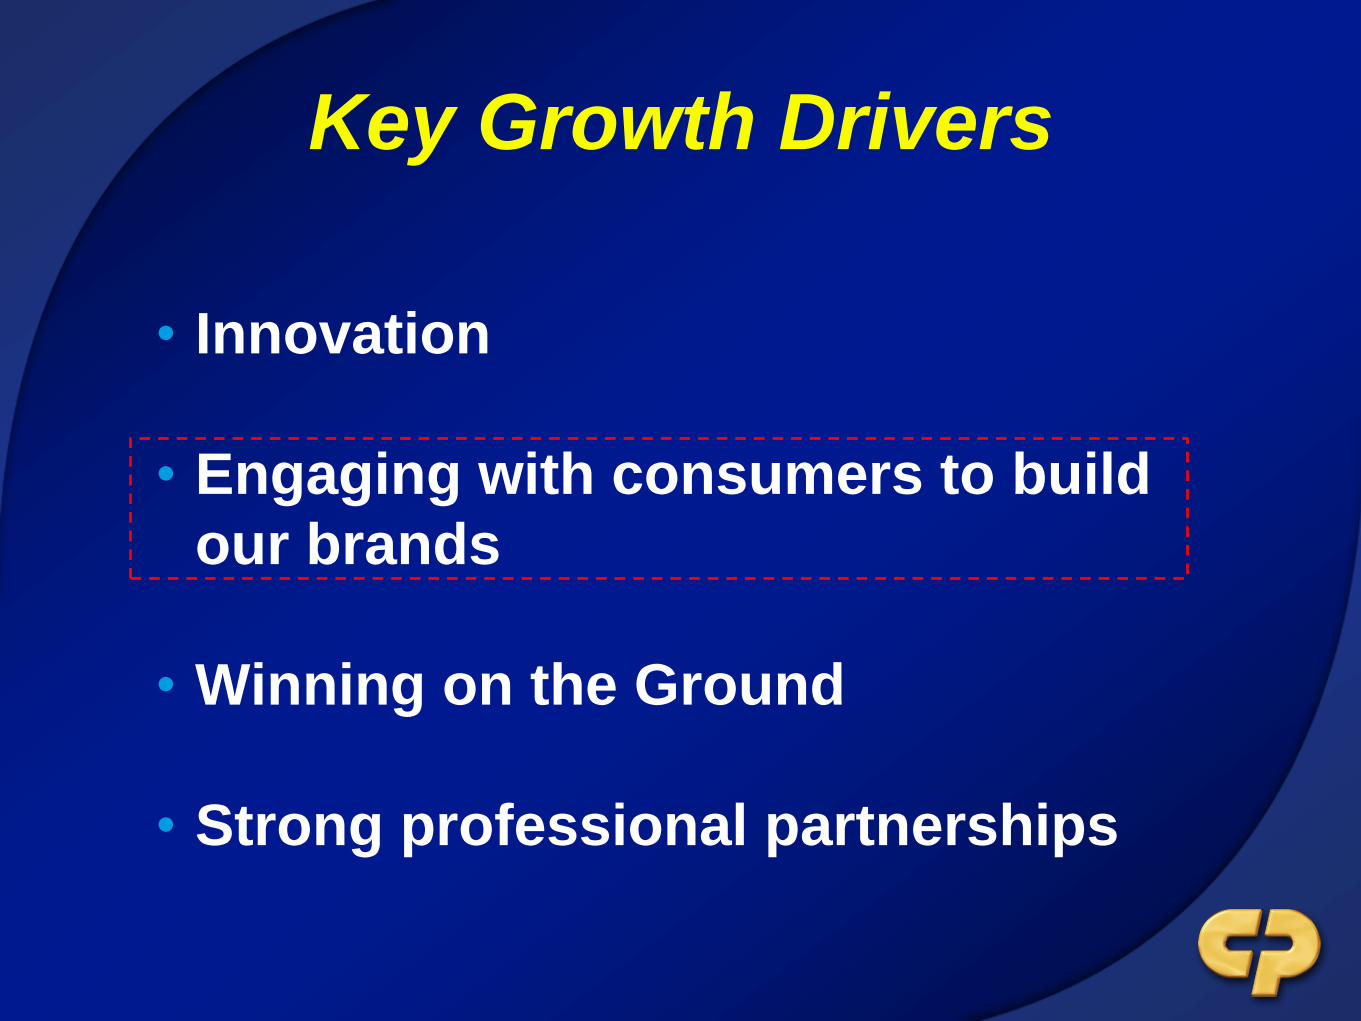
Key Growth Drivers
• Innovation
• Engaging with consumers to build
our brands
• Winning on the Ground
• Strong professional partnerships

Engaging with consumers on
digital
Over 3.1 MM fans on India Facebook pages
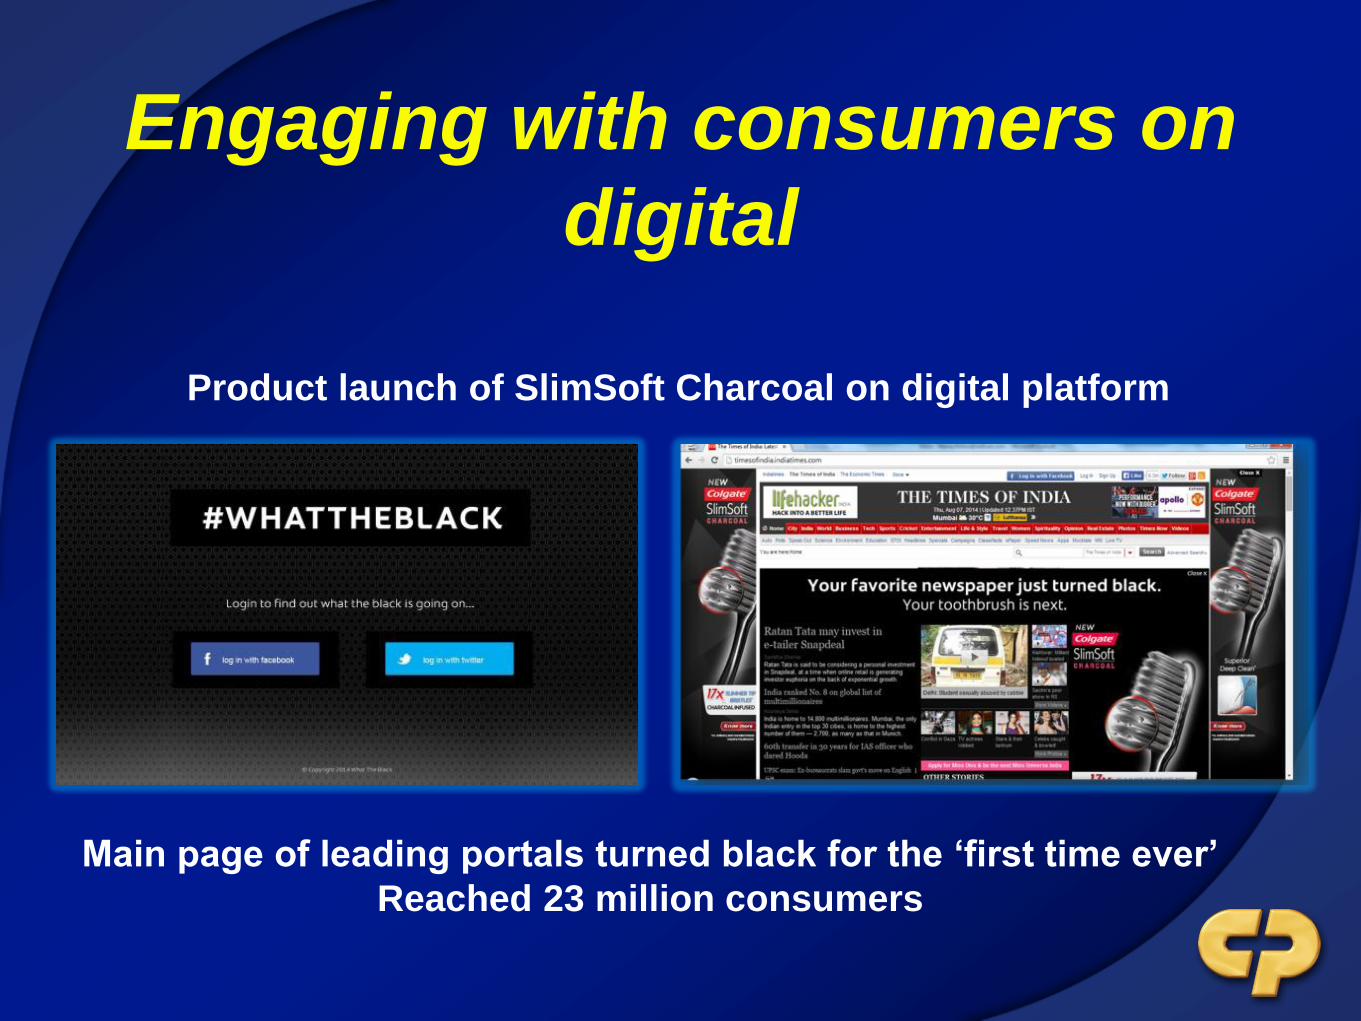
Engaging with consumers on
digital
Main page of leading portals turned black for the ‘first time ever’
Reached 23 million consumers
Product launch of SlimSoft Charcoal on digital platform

Engaging with consumers on
Mobile
Colgate Scholarship Offer
Over 1.5 Million call-ins
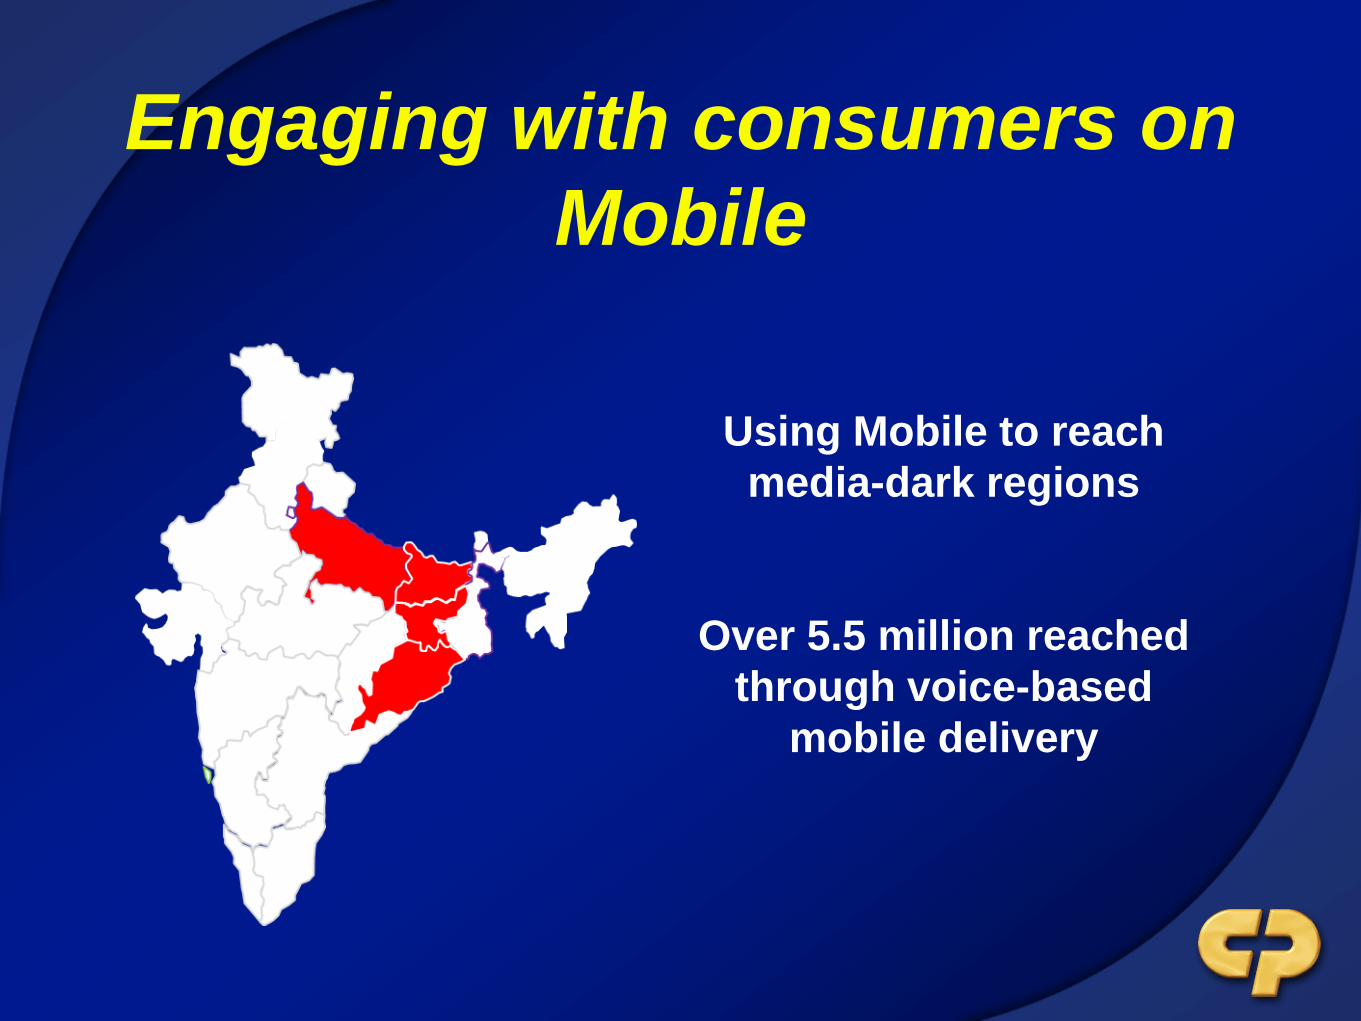
Engaging with consumers on
Mobile
Using Mobile to reach
media-dark regions
Over 5.5 million reached
through voice-based
mobile delivery

Key Growth Drivers
• Innovation
• Engaging with consumers to build
our brands
• Winning on the Ground
• Strong professional partnerships

Increasing distribution &
availability
Colgate available in 4.8MM outlets

Increasing distribution &
availability
Invested behind infrastructure
340
801 951
2012 2013 2014
No. of rural vans

Servicing the Growth
Toothpaste facility at Sanand, Gujarat.
Commissioned from March 2014

Servicing the Growth
Toothbrush facility at Sricity, Andhra Pradesh.
Commissioned from March 2015

Superior In-Store Execution
Making our brands…
• Available
• Visible
• Irresistable
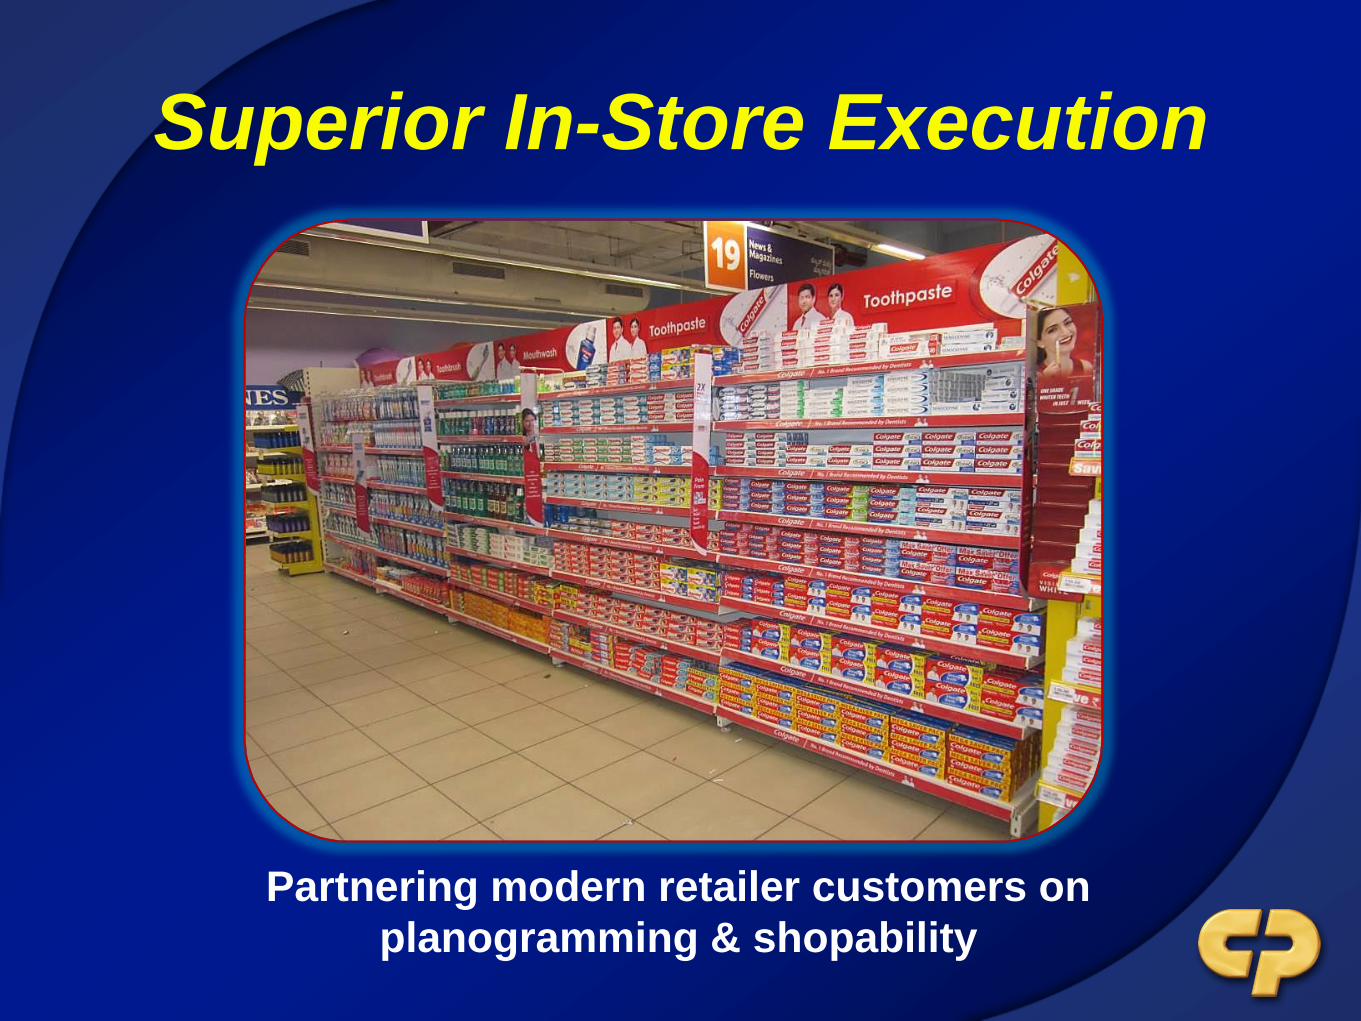
Superior In-Store Execution
Partnering modern retailer customers on
planogramming & shopability

Superior In-Store Execution
Impactful In-store visibility for new launches

Superior In-Store Execution
Impactful In-store visibility for new IMCs

Superior In-Store Execution
Customised hanger packs for traditional trade
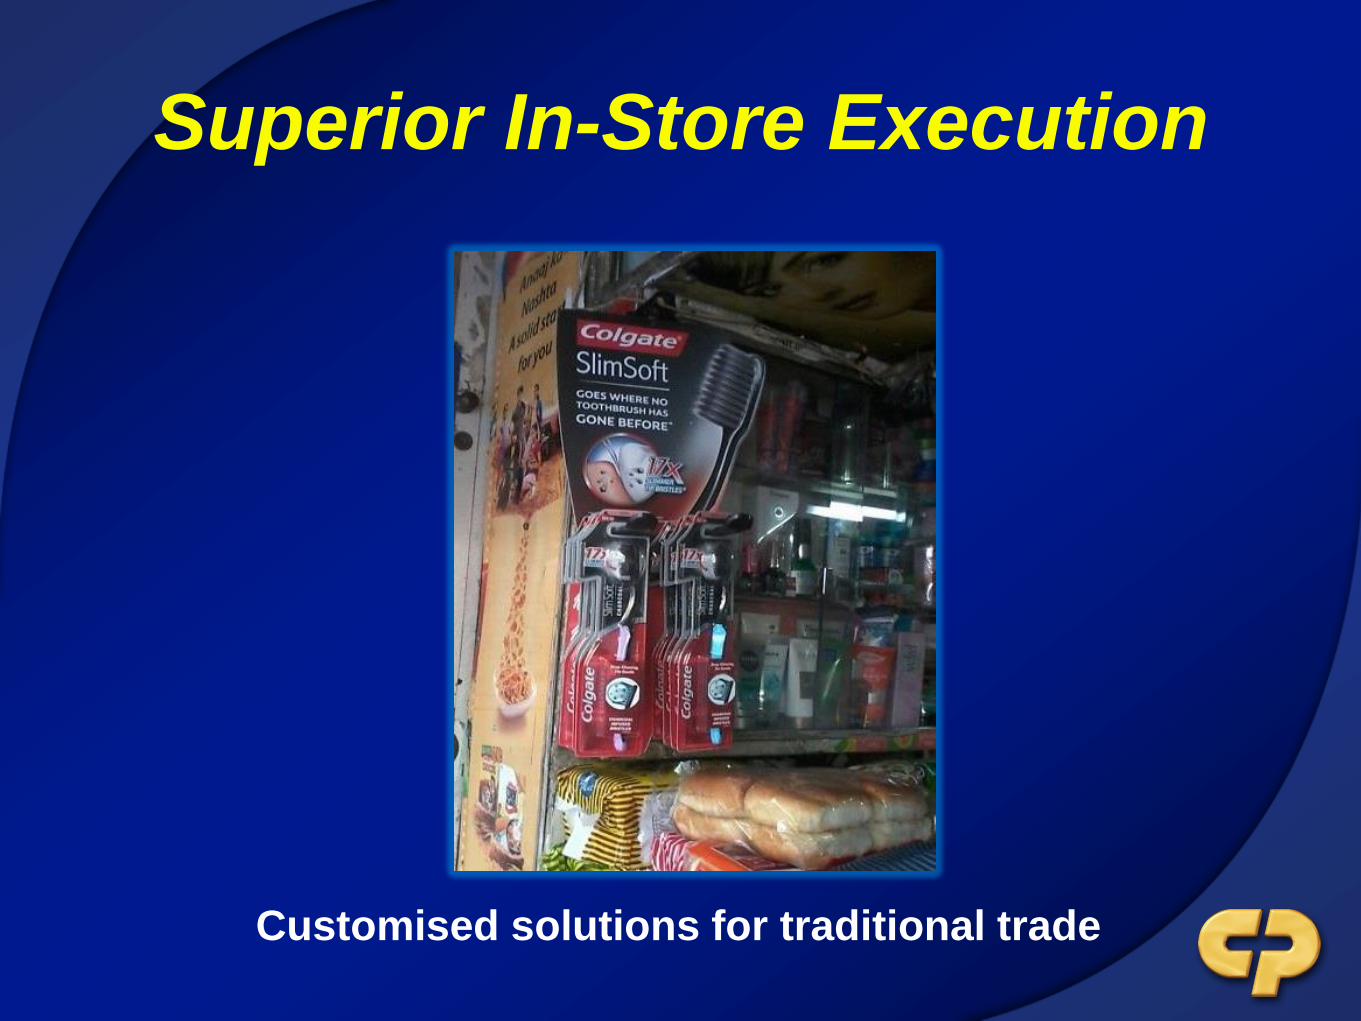
Superior In-Store Execution
Customised solutions for traditional trade

Superior In-Store Execution

Key Growth Drivers
• Innovation
• Engaging with consumers to build
our brands
• Winning on the Ground
• Strong professional partnerships
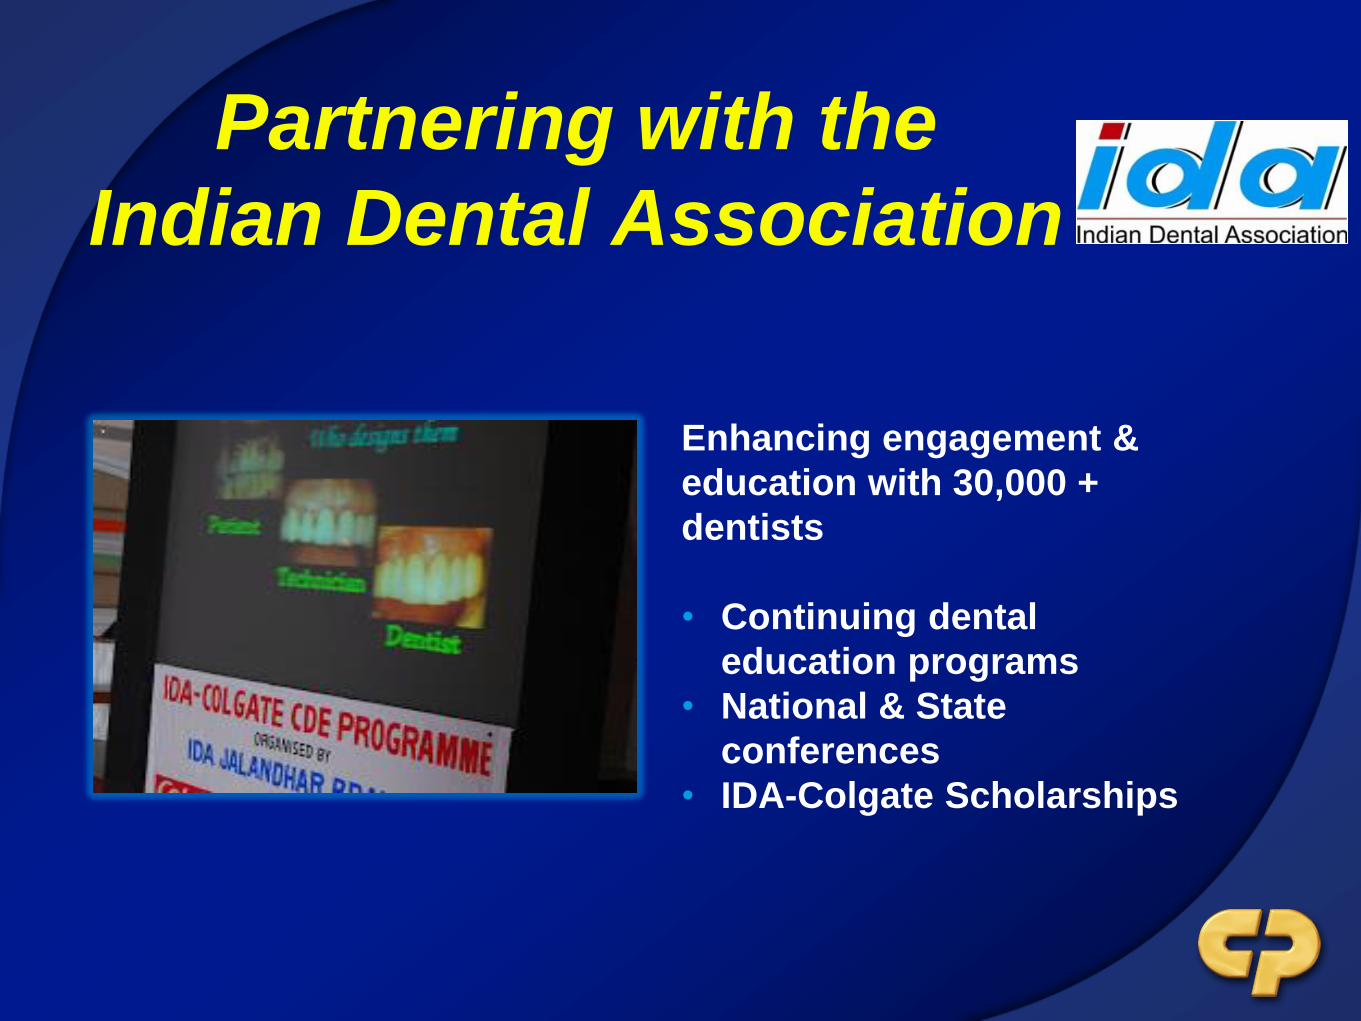
Partnering with the
Indian Dental Association
Enhancing engagement &
education with 30,000 +
dentists
• Continuing dental
education programs
• National & State
conferences
• IDA-Colgate Scholarships

Alliance for a Cavity-Free Future
Creating an external voice to raise awareness
on dental caries
Academicians + Dentists + Pediatrician + NGO Partners

Leading with the Profession on
recommendations & usage
CP Competitior 1 Competitior 2 Competitior 3
65
7 4 3
CP Competitior 1 Competitior 2 Competitior 3
74
3 6 4
Brand Recommended Most Often by Dentists
Brand Used Most Often by Dentists
Source: Ipsos Dentist Track Dec 2014

Key Growth Drivers
• Innovation
• Engaging with consumers to build
our brands
• Winning on the Ground
• Strong professional partnerships

Huge Headroom for Growth

Penetration
250MM
consumers do not
use Toothpaste 91.2 92.3
2013 2014
72.8 74.1
2013 2014
Urban
Source: Indian Readership Survey (HHs), IMRB**
Rural
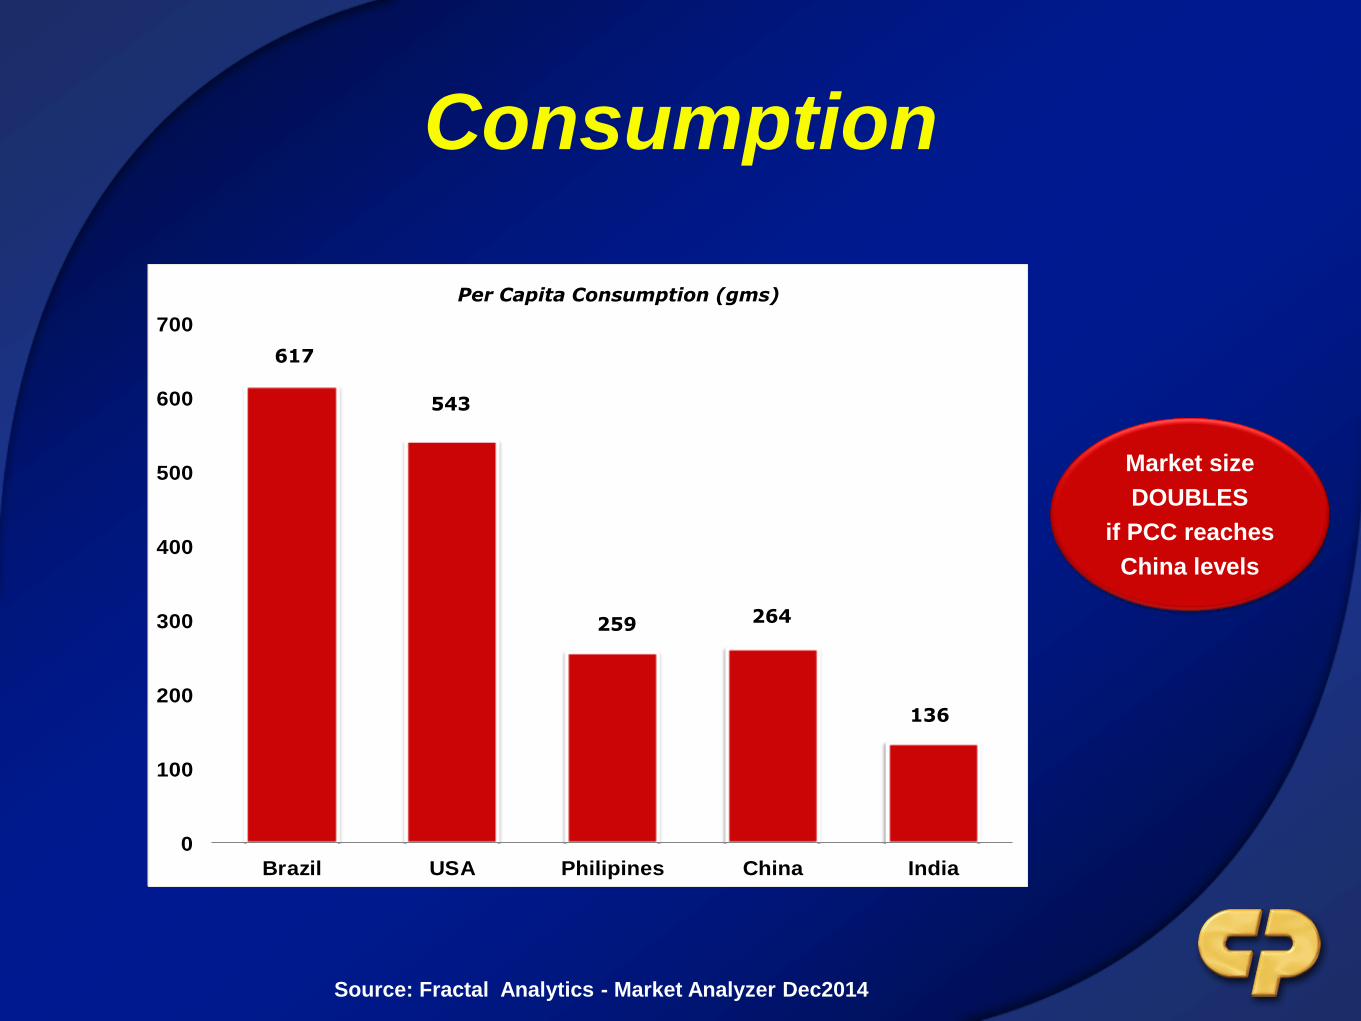
Consumption
0
100
200
300
400
500
600
700
Brazil USA Philipines China India
Chart Title
Market size
DOUBLES
if PCC reaches
China levels
Per Capita Consumption (gms)
617
543
259 264
136
Source: Fractal Analytics - Market Analyzer Dec2014

Premiumization
Average Selling
Price($) Per KG of
Toothpaste
18
13
11 6
3X 2.2X 1.8X X
Average Selling
Price($)
Per Toothbrush
2.7 1.7 0.6 0.2
13.5X 8.5X 3X X
Source: Fractal Analytics - Market Analyzer Dec2014
Market size
DOUBLES
if ASP reaches
China levels

Leading to Win Working with our Community

Bright Smiles, Bright Futures
Over 125 million school children
contacted in the program

Oral Health Month
In association with IDA, over 5.5 Million
free dental check-ups done in 2014

Working with NGO Partners
Conservation of Natural Resources,
Vocational training for self sustenance
of villagers, Girl child empowerment.
Addressing Inequalities- Payroll
giving program to sponsor
children affected and infected by
HIV.
Providing quality education to
underprivileged of children ;
Program ‘Read India’- improve basic
reading, writing and arithmetic skills

In closing,
a summary of our long term
performance
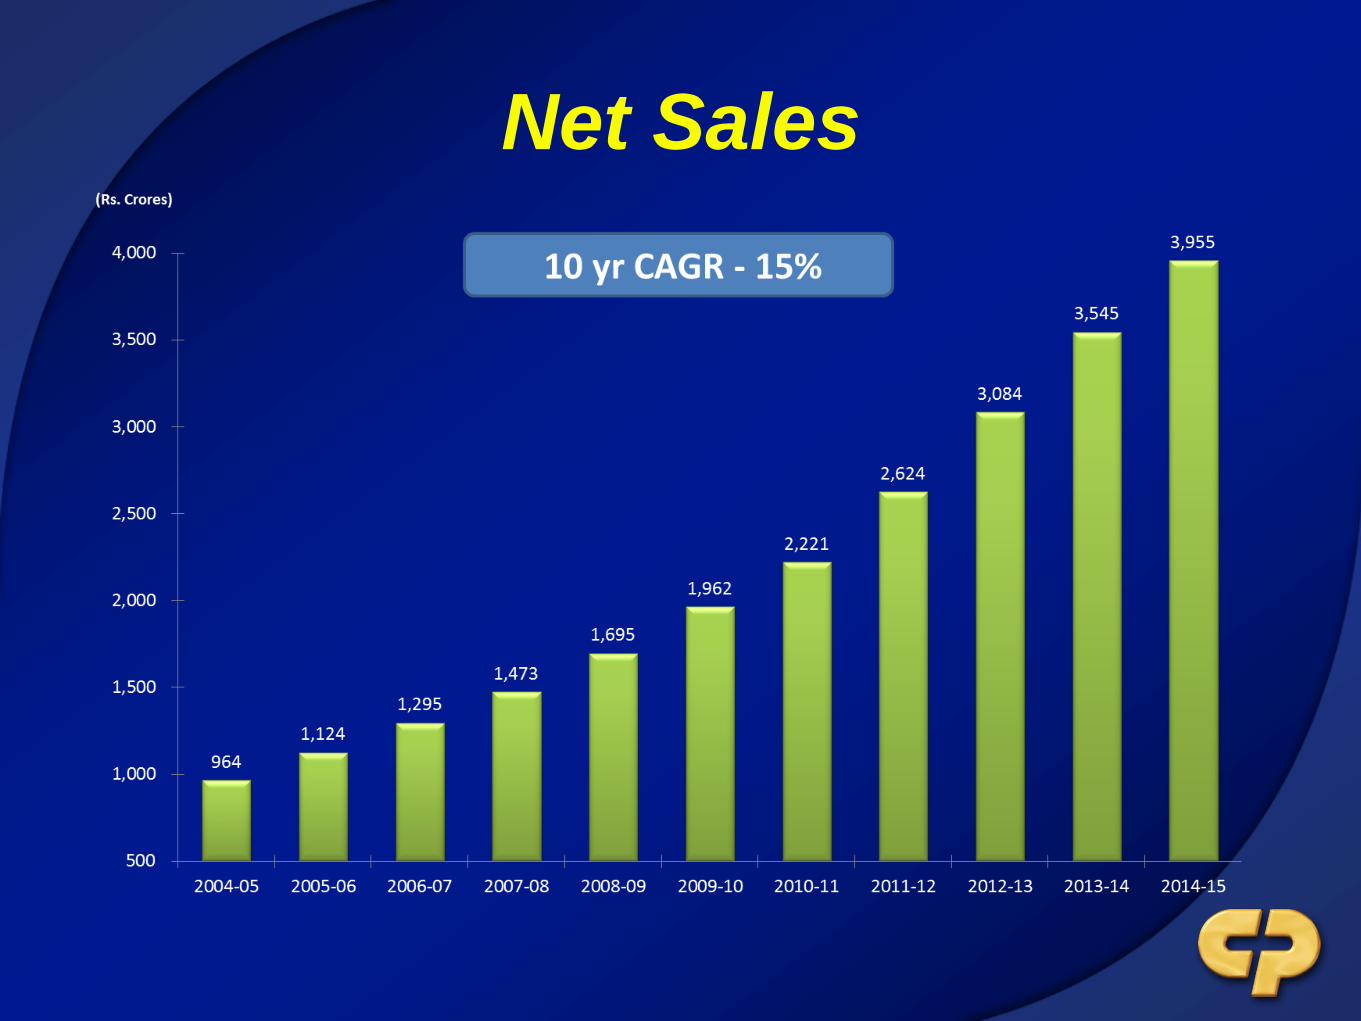
Net Sales

Gross Margin
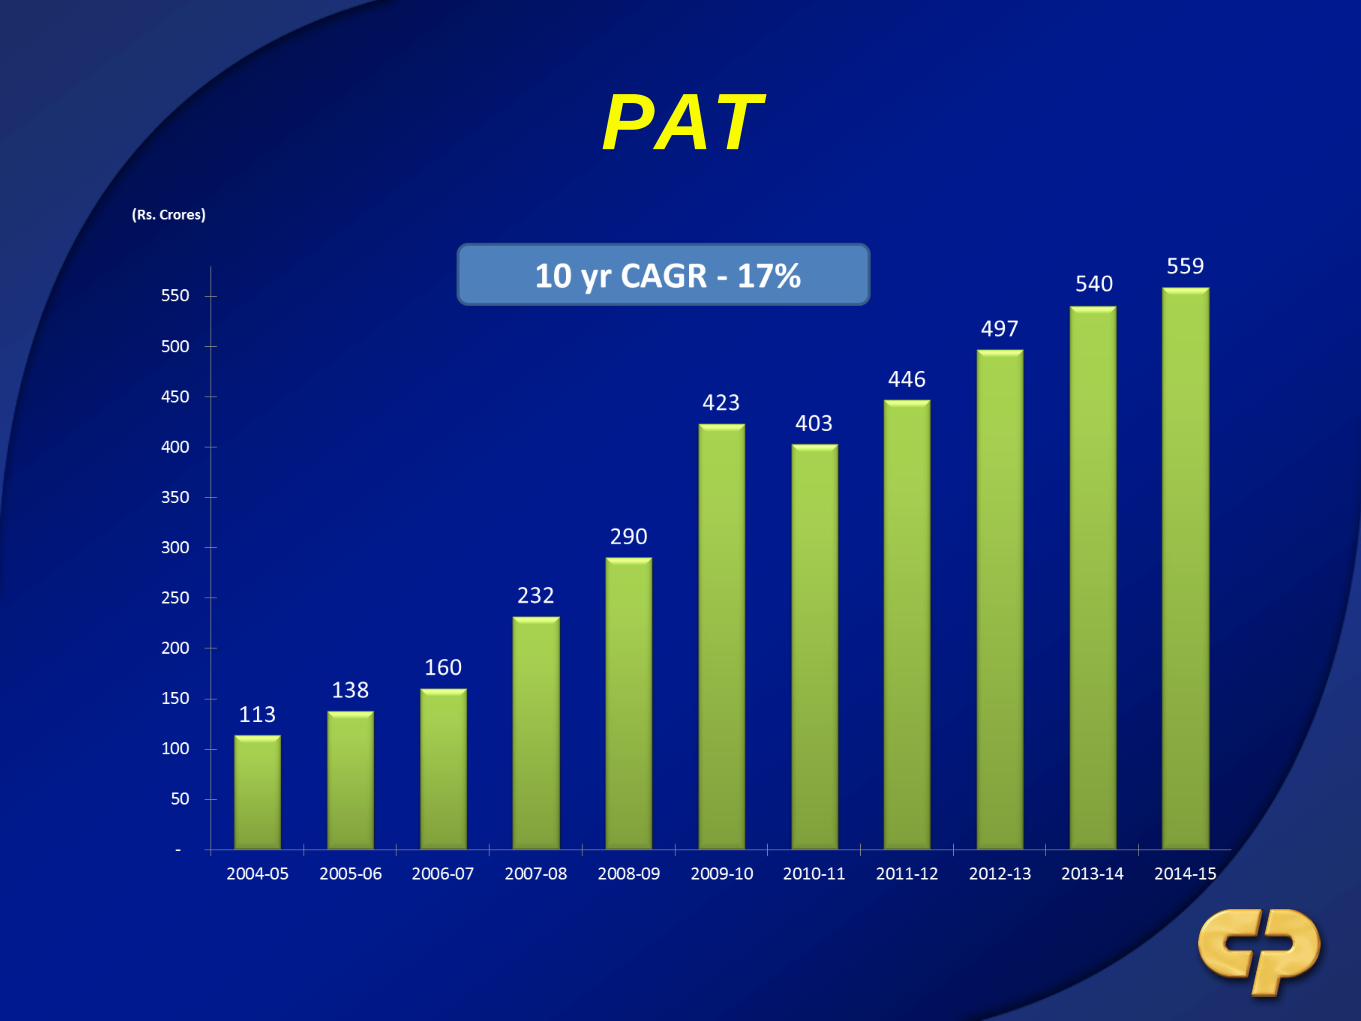
PAT

EPS

DPS
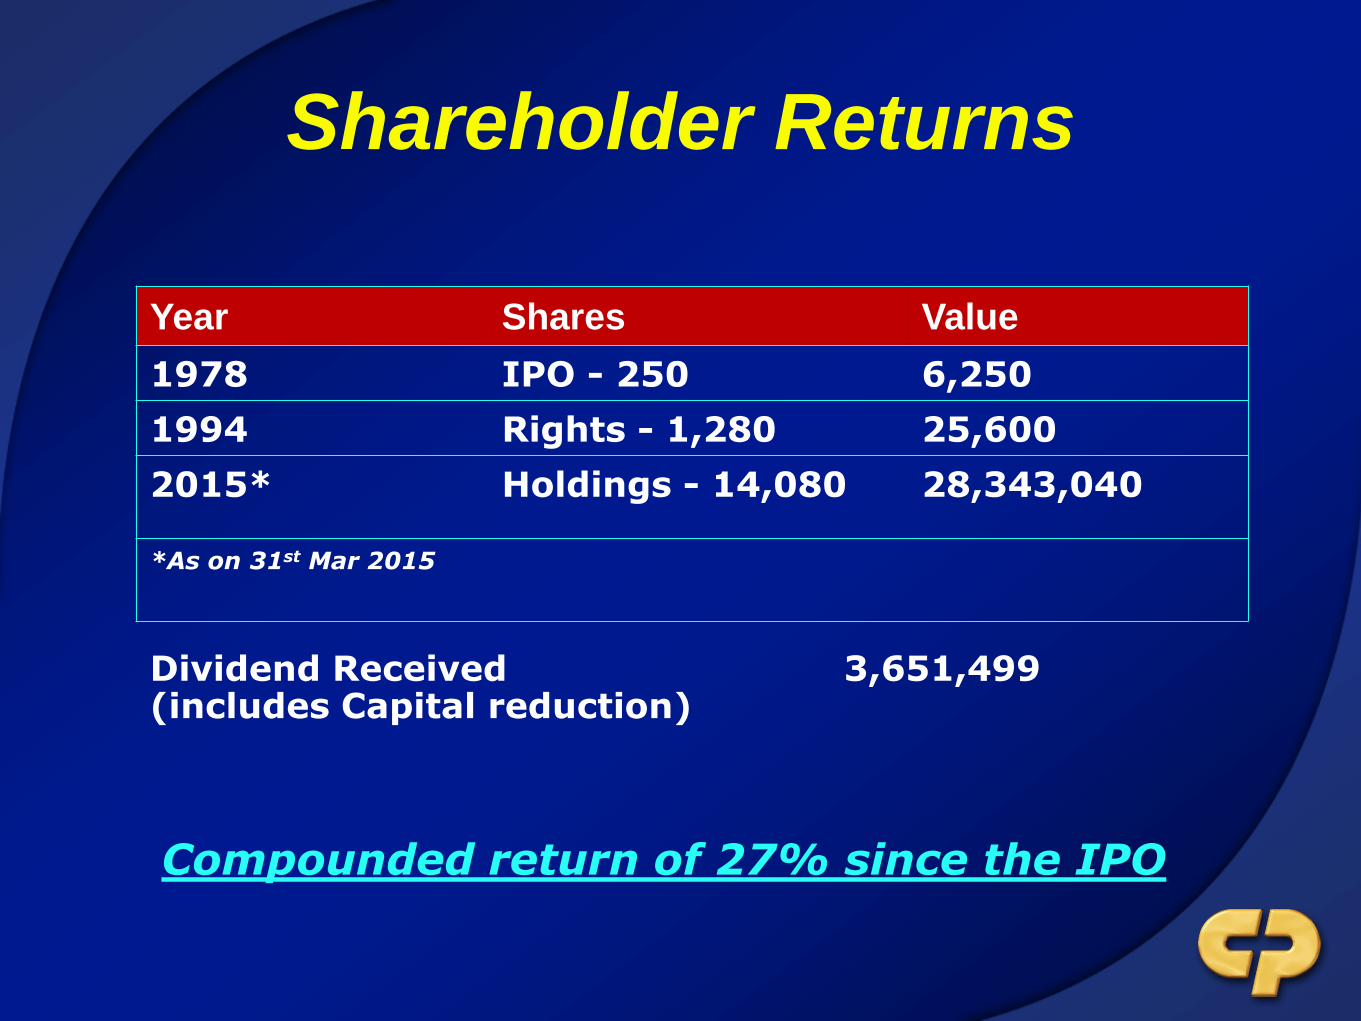
Shareholder Returns
Year Shares Value
1978 IPO - 250 6,250
1994 Rights - 1,280 25,600
2015* Holdings - 14,080 28,343,040
*As on 31st Mar 2015
Dividend Received 3,651,499 (includes Capital reduction)
Compounded return of 27% since the IPO

Well-poised to continue to grow
shareholder value

Lets Talk


![colgate palmolive (india) - WordPress.com · [COLGATE PALMOLIVE (INDIA)] Colgate is a large global dental hygiene brand. Colgate is an equally strong brand in India and enjoys almost](https://img.dokumen.tips/doc/110x75/5e1519190e008e148238feef/colgate-palmolive-india-colgate-palmolive-india-colgate-is-a-large-global.jpg)