Embed Size (px)
DESCRIPTION
oil and gas- cold and hot forging methods. byTaylan Altan, ERC/NSM, Ohio State University Gracious Ngaile, North Carolina State University Gangshu Shen, Ladish Company, Inc.Great care is taken in the compilation and production of this book, but it should be made clear that NO WARRANTIES, EXPRESS OR IMPLIED, INCLUDING, WITHOUT LIMITATION, WARRANTIES OF MERCHANTABILITY OR FITNESS FOR A PARTICULAR PURPOSE, ARE GIVEN IN CONNECTION WITH THIS PUBLICATION. Although this information is believed to be accurate by ASM, ASM cannot guarantee that favorable results will be obtained from the use of this publication alone. This publication is intended for use by persons having technical skill, at their sole discretion and risk. Since the conditions of product or material use are outside of ASM’s control, ASM assumes no liability or obligation in connection with any use of this information. No claim of any kind, whether as to products or information in this publication, and whether or not based on negligence, shall begreaterin amountthanthepurchase price of this product or publication in respect of which damages are claimed. THE REMEDY HEREBY PROVIDED SHALL BE THE EXCLUSIVE AND SOLE REMEDY OF BUYER, AND IN NO EVENT SHALL EITHER PARTY BE LIABLE FOR SPECIAL, INDIRECT OR CONSEQUENTIAL DAMAGES WHETHERORNOTCAUSEDBYORRESULTINGFROM THE NEGLIGENCE OF SUCH PARTY. As with any material, evaluation of the materialunder end-use conditions prior to specification is essential. Therefore, specific testing under actual conditions is recommended.Nothing contained in this book shall be construed as a grant of any right of manufacture, sale, use, or reproduction, in connection with any method, process, apparatus, product, composition, or system, whether or not covered by letters patent, copyright, or trademark, and nothing contained in this book shall be construed as a defense against any alleged infringement of letters patent, copyright, or trademark, or as a defense against liability for such infringement.Comments, criticisms, and suggestions are invited, and should be forwarded to ASM International. Prepared under the direction of theASMInternational TechnicalBooksCommittee(2004–2005), Yip-Wah Chung, FASM, Chair.ASM International staff who worked on this project include Scott Henry, Senior Manager of Product and Service Development; Bonnie Sanders, Manager of Production; Carol Polakowski,
Citation preview

Cold and Hot ForgingFundamentals and Applications
Edited byTaylan Altan, ERC/NSM, Ohio State University
Gracious Ngaile, North Carolina State UniversityGangshu Shen, Ladish Company, Inc.
Materials Park, Ohio 44073-0002www.asminternational.org
© 2005 ASM International. All Rights Reserved.Cold and Hot Forgings: Fundamentals and Applications (#05104G)
www.asminternational.org
Copyright � 2004by
ASM International�All rights reserved
No part of this book may be reproduced, stored in a retrieval system, or transmitted, in any formor by any means, electronic, mechanical, photocopying, recording, or otherwise, without thewritten permission of the copyright owner.
First printing, February 2005
Great care is taken in the compilation and production of this book, but it should be made clearthat NO WARRANTIES, EXPRESS OR IMPLIED, INCLUDING, WITHOUT LIMITATION,WARRANTIES OF MERCHANTABILITY OR FITNESS FOR A PARTICULAR PURPOSE,ARE GIVEN IN CONNECTION WITH THIS PUBLICATION. Although this information isbelieved to be accurate by ASM, ASM cannot guarantee that favorable results will be obtainedfrom the use of this publication alone. This publication is intended for use by persons havingtechnical skill, at their sole discretion and risk. Since the conditions of product or material useare outside of ASM’s control, ASM assumes no liability or obligation in connection with anyuse of this information. No claim of any kind, whether as to products or information in thispublication, and whether or not based on negligence, shall be greater in amount than the purchaseprice of this product or publication in respect of which damages are claimed. THE REMEDYHEREBY PROVIDED SHALL BE THE EXCLUSIVE AND SOLE REMEDY OF BUYER,AND IN NO EVENT SHALL EITHER PARTY BE LIABLE FOR SPECIAL, INDIRECT ORCONSEQUENTIAL DAMAGES WHETHER OR NOT CAUSED BY OR RESULTING FROMTHE NEGLIGENCE OF SUCH PARTY. As with any material, evaluation of the material underend-use conditions prior to specification is essential. Therefore, specific testing under actualconditions is recommended.
Nothing contained in this book shall be construed as a grant of any right of manufacture, sale,use, or reproduction, in connection with any method, process, apparatus, product, composition,or system, whether or not covered by letters patent, copyright, or trademark, and nothing con-tained in this book shall be construed as a defense against any alleged infringement of letterspatent, copyright, or trademark, or as a defense against liability for such infringement.
Comments, criticisms, and suggestions are invited, and should be forwarded to ASM Interna-tional.Prepared under the direction of the ASM International Technical Books Committee (2004–2005),Yip-Wah Chung, FASM, Chair.
ASM International staff who worked on this project include Scott Henry, Senior Manager ofProduct and Service Development; Bonnie Sanders, Manager of Production; Carol Polakowski,Production Supervisor; and Pattie Pace, Production Coordinator.
Library of Congress Cataloging-in-Publication Data
Cold and hot forging : fundamentals and applications / edited by Taylan Altan, GraciousNgaile, Gangshu Shen.
p. cm.Includes bibliographical references and index.ISBN: 0-87170-805-11. Forging. I. Altan, Taylan. II. Ngaile, Gracious. III. Shen, Gangshu.
TS225.C63 2004671.3�32—dc22 2004055439
SAN: 204-7586
ASM International�Materials Park, OH 44073-0002
www.asminternational.org
Printed in the United States of America
© 2005 ASM International. All Rights Reserved.Cold and Hot Forgings: Fundamentals and Applications (#05104G)
www.asminternational.org
Contents
Preface .............................................................................................. viii
Chapter 1 Metal Forming Processes in Manufacturing ...........................11.1 Classification of Manufacturing Processes .......................................11.2 Characteristics of Manufacturing Processes ......................................21.3 Metal Forming Processes in Manufacturing ......................................4
Chapter 2 Forging Processes: Variables and Descriptions .......................72.1 Introduction ...............................................................................72.2 Forging Operation as a System ......................................................72.3 Types of Forging Processes ...........................................................9
Chapter 3 Plastic Deformation: Strain and Strain Rate ........................ 173.1 Introduction ............................................................................. 173.2 Stress Tensor ............................................................................ 173.3 Properties of the Stress Tensor ..................................................... 183.4 Plane Stress or Biaxial Stress Condition ........................................ 193.5 Local Deformations and the Velocity Field .................................... 203.6 Strains ..................................................................................... 203.7 Velocities and Strain Rates .......................................................... 213.8 Homogeneous Deformation ......................................................... 213.9 Plastic (True) Strain and Engineering Strain ................................... 23
Chapter 4 Flow Stress and Forgeability .............................................. 254.1 Introduction ............................................................................. 254.2 Tensile Test .............................................................................. 274.3 Compression Test ...................................................................... 294.4 Ring Test ................................................................................. 354.5 Torsion Test ............................................................................. 364.6 Representation of Flow Stress Data .............................................. 36
Appendices (CD-ROM only)4.1 Determination of Flow Stress by Compression Test at Room
Temperature4.2 Determination of Flow Stress at High Temperature4.3 Forgeability and Damage Factor in Cold Forging
© 2005 ASM International. All Rights Reserved.Cold and Hot Forgings: Fundamentals and Applications (#05104G)
www.asminternational.org
Chapter 5 Plastic Deformation: Complex State of Stress andFlow Rules ....................................................................... 51
5.1 State of Stress ........................................................................... 515.2 Yield Criteria ............................................................................ 525.3 Flow Rules .............................................................................. 555.4 Power and Energy of Deformation ............................................... 565.5 Effective Strain and Effective Strain Rate ...................................... 57
Chapter 6 Temperatures and Heat Transfer ........................................ 596.1 Introduction ............................................................................. 596.2 Heat Generation and Heat Transfer in Metal Forming Processes ........ 596.3 Temperatures in Forging Operations ............................................. 606.4 Measurement of Temperatures at the Die/Material Interface .............. 606.5 Measurement of Interface Heat Transfer Coefficient ........................ 626.6 Influence of Press Speed and Contact Time on Heat Transfer ............ 64
Appendices (CD-ROM only)6.1 Upset Forging of Cylinders
Chapter 7 Friction and Lubrication ................................................... 677.1 Introduction ............................................................................. 677.2 Lubrication Mechanisms in Metal Forming .................................... 687.3 Friction Laws and Their Validity in Forging ................................... 697.4 Parameters Influencing Friction and Lubrication ............................. 697.5 Characteristics of Lubricants Used ............................................... 707.6 Lubrication Systems for Cold Forging .......................................... 707.7 Lubrication Systems for Warm and Hot Forging ............................. 737.8 Methods for Evaluation of Lubricants ........................................... 74
Appendices (CD-ROM only)7.1 Ring Compression Test7.2 Double Cup Extrusion Test
Chapter 8 Inverse Analysis for Simultaneous Determination ofFlow Stress and Friction .................................................... 83
8.1 Introduction ............................................................................. 838.2 Inverse Analysis in Metal Forming ............................................... 838.3 Flow Stress Determination in Forging by Inverse Analysis ............... 858.4 Inverse Analysis for Simultaneous Determination of Flow Stress
and Friction .............................................................................. 868.5 Example of Inverse Analysis ....................................................... 86
Chapter 9 Methods of Analysis for Forging Operations ........................ 919.1 Introduction ............................................................................. 919.2 Slab Method of Analysis ............................................................ 939.3 Upper Bound Method and Its Application to Axisymmetric
Upsetting ................................................................................. 979.4 Finite Element Method in Metal Forming ...................................... 98
Chapter 10 Principles of Forging Machines .......................................10710.1 Introduction ...........................................................................10710.2 Interaction between Process Requirements and Forming
Machines ..............................................................................107
iv / Cold and Hot Forging: Fundamentals and Applications
© 2005 ASM International. All Rights Reserved.Cold and Hot Forgings: Fundamentals and Applications (#05104G)
www.asminternational.org

10.3 Load and Energy Requirements in Forming .................................10810.4 Classification and Characteristics of Forming Machines .................11010.5 Characteristic Data for Load and Energy .....................................11110.6 Time-Dependent Characteristic Data ..........................................11210.7 Characteristic Data for Accuracy ...............................................112
Chapter 11 Presses and Hammers for Cold and Hot Forging ...............11511.1 Introduction ...........................................................................11511.2 Hydraulic Presses ...................................................................11511.3 Screw Presses ........................................................................13111.4 Hammers ..............................................................................135
Chapter 12 Special Machines for Forging ..........................................14112.1 Introduction ...........................................................................14112.2 Transverse or Cross-Rolling Machines .......................................14212.3 Electric Upsetters ...................................................................14212.4 Ring-Rolling Mills ..................................................................14312.5 Horizontal Forging Machines or Upsetters ..................................14412.6 Rotary or Orbital Forging Machines ...........................................14512.7 Radial Forging Machines .........................................................145
Chapter 13 Billet Separation and Shearing ........................................15113.1 Introduction ...........................................................................15113.2 Billet and Sheared Surface Quality ............................................15113.3 Shearing Force, Work, and Power ..............................................15413.4 Shearing Equipment ................................................................154
Chapter 14 Process Design in Impression Die Forging .........................15914.1 Introduction ...........................................................................15914.2 Forging Process Variables ........................................................16014.3 Shape Complexity in Forging ...................................................16414.4 Design of Finisher Dies ...........................................................16514.5 Prediction of Forging Stresses and Loads ....................................16914.6 Design of Blocker (Preform) Dies .............................................171
Appendix A Example of Load for Forging of a Connecting Rod ...............177A.1 Introduction ............................................................................177A.2 Estimation of the Flow Stress ....................................................178A.3 Estimation of the Friction Factor ................................................181A.4 Estimation of the Forging Load ..................................................181A.5 Comparison of Predictions with Data from Actual Forging Trials .....181
Appendices (CD-ROM only)14.1 Preform Design in Closed Die Forging14.2 Flash Design in Closed Die Forging
Chapter 15 A Simplified Method to Estimate Forging Load inImpression-Die Forging ..................................................185
15.1 Introduction ...........................................................................18515.2 Effect of Process Parameters on Forging Load .............................18515.3 Methods for Load Estimation ...................................................18615.4 Simplified Method for Load Estimation ......................................19015.5 Example of Load Estimation ....................................................191
Contents / v
© 2005 ASM International. All Rights Reserved.Cold and Hot Forgings: Fundamentals and Applications (#05104G)
www.asminternational.org

Appendices (CD-ROM only)15.1 ForgePAL: A Computer Program for Estimating Forces in
Hot Forging with Flash
Chapter 16 Process Modeling in Impression-Die Forging UsingFinite-Element Analysis ..................................................193
16.1 Introduction ...........................................................................19316.2 Information Flow in Process Modeling .......................................19416.3 Process Modeling Input ...........................................................19416.4 Characteristics of the Simulation Code .......................................19616.5 Process Modeling Output .........................................................19716.6 Examples of Modeling Applications ..........................................200
Chapter 17 Cold and Warm Forging .................................................21117.1 Introduction ...........................................................................21117.2 Cold Forging as a System ........................................................21317.3 Materials for Cold Forging .......................................................21317.4 Billet Preparation and Lubrication in Cold Forging of Steel
and Aluminum .......................................................................21417.5 Upsetting ..............................................................................21517.6 Load Estimation for Flashless Closed-Die Upsetting .....................21617.7 Extrusion ..............................................................................21817.8 Estimation of Friction and Flow Stress .......................................22117.9 Prediction of Extrusion Loads from Selected Formulas ..................22217.10 Prediction of Extrusion Loads from Model Test .........................22417.11 Tooling for Cold Forging .......................................................22517.12 Punch Design for Cold Forging ...............................................22717.13 Die Design and Shrink Fit ......................................................22817.14 Process Sequence Design .......................................................22917.15 Parameters Affecting Tool Life ................................................23017.16 Warm Forging ......................................................................233
Appendices (CD-ROM only)17.1 Examples of Forging Sequences17.2 Forward Rod Extrusion17.3 Backward Rod Extrusion
Chapter 18 Process Modeling in Cold Forging Using Finite-ElementAnalysis ........................................................................237
18.1 Introduction ...........................................................................23718.2 Process Modeling Input ...........................................................23718.3 Process Modeling Output .........................................................23918.4 Process Modeling Examples .....................................................239
Chapter 19 Microstructure Modeling in Superalloy Forging ................24719.1 Introduction ...........................................................................24719.2 Experiments for Microstructure Model Development ....................24719.3 Microstructure Model Formulation ............................................24819.4 Prediction of Microstructure in Superalloy Forging .......................25419.5 Nomenclature of Microstructure Model ......................................254
vi / Cold and Hot Forging: Fundamentals and Applications
© 2005 ASM International. All Rights Reserved.Cold and Hot Forgings: Fundamentals and Applications (#05104G)
www.asminternational.org

Chapter 20 Isothermal and Hot Die Forging ......................................25720.1 Introduction ...........................................................................25720.2 Isothermal Forging ..................................................................25720.3 Hot-Die Forging .....................................................................25820.4 Benefits of Isothermal and Hot-Die Forging ................................25820.5 High-Temperature Materials for Isothermal and Hot-Die Forging ....25920.6 Equipment and Tooling ...........................................................26320.7 Postforging Heat Treatment ......................................................26920.8 Production of Isothermal/Hot-Die Forging ..................................27120.9 Economic Benefits of Isothermal and Hot-Die Forging ..................27220.10 Summary ..............................................................................273
Chapter 21 Die Materials and Die Manufacturing ..............................27721.1 Introduction ...........................................................................27721.2 Die and Tool Materials For Hot Forging .....................................27721.3 Heat Treatment ......................................................................28521.4 Die and Tool Materials for Cold Forging ....................................28521.5 Die Manufacture ....................................................................28921.6 Surface Treatments .................................................................292
Chapter 22 Die Failures in Cold and Hot Forging ..............................29522.1 Introduction ...........................................................................29522.2 Classification of Die Failures ....................................................29522.3 Fracture Mechanisms ..............................................................29622.4 Wear Mechanisms ...................................................................29622.5 Analytical Wear Models ...........................................................29722.6 Parameters Influencing Die Failure ............................................29722.7 Prediction of Die Fatigue Fracture and Enhancement of Die Life
in Cold Forging Using Finite-Element Modeling (FEM) ................30722.8 Prediction of Die Wear and Enhancement of Die Life Using FEM ..311
Chapter 23 Near-Net Shape Forging and New Developments ...............31923.1 Introduction ...........................................................................31923.2 Tolerances in Precision Forging ................................................31923.3 Advances in Tool Design .........................................................32323.4 Advances in Forging Machines .................................................32623.5 Innovative Forging Processes ....................................................32823.6 Future of Forging Technology in the Global Marketplace ..............331
Index ................................................................................................337
Contents / vii
© 2005 ASM International. All Rights Reserved.Cold and Hot Forgings: Fundamentals and Applications (#05104G)
www.asminternational.org

Preface
Among all manufacturing processes, forging technology has a special place becauseit helps to produce parts of superior mechanical properties with minimum waste ofmaterial. In forging, the starting material has a relatively simple geometry; this materialis plastically deformed in one or more operations into a product of relatively complexconfiguration. Forging to net or to net shape dimensions drastically reduces metal re-moval requirements, resulting in significant material and energy savings. Forging usu-ally requires relatively expensive tooling. Thus, the process is economically attractivewhen a large number of parts must be produced and/or when the mechanical propertiesrequired in the finished product can be obtained only by a forging process.
The ever-increasing costs of material, energy, and, especially, manpower require thatforging processes and tooling be designed and developed with minimum amount oftrial and error with shortest possible lead times. Therefore, to remain competitive, thecost-effective application of computer-aided techniques, i.e., CAD, CAM, CAE, and,especially, finite element analysis (FEA)-based computer simulation is an absolute ne-cessity. The practical use of these techniques requires a thorough knowledge of theprincipal variables of the forging process and their interactions. These variables include:a) the flow behavior of the forged material under processing conditions, b) die geometryand materials, c) friction and lubrication, d) the mechanics of deformation, i.e., strainsand stresses, e) the characteristics of the forging equipment, f ) the geometry, tolerances,surface finish and mechanical properties of the forging, and g) the effects of the processon the environment.
There are many excellent handbooks and technical papers on the technology of theforging. These principles are reviewed briefly in this book, but major emphasis is onthe latest developments in the design of forging operations and dies. Thus, processmodeling using FEA has been discussed in all appropriate chapters. The subject isintroduced in Chapter 1 with a discussion of the position of metal forming processesin manufacturing. Chapter 2 considers forging process as a system consisting of severalvariables that interact with one another. This chapter also includes an overall review ofthe forging operations. The fundamentals of plastic deformation, i.e., metal flow, flowstress of materials, testing methods to determine materials properties, and flow rulesare discussed in Chapters 3, 4, and 5. Chapters 6 and 8 cover the significant variablesof the forging process such as friction, lubrication, and temperatures. Chapter 9 isdevoted to approximate methods for analyzing simple forging operations. Chapters 10through 13 discuss forging machines, including machines for shearing and pre-formingor materials distribution. Process and die design, methods for estimating forging loads,and the application of FEA-based process modeling in hot forging are discussed inChapters 14, 15, and 16.
Chapters 17 and 18 cover cold and warm forging, including the application of FEAsimulation in these processes. Microstructure modeling, using forging of high tempera-ture alloys as example, is covered in Chapter 19, while Chapter 20 is devoted to iso-
© 2005 ASM International. All Rights Reserved.Cold and Hot Forgings: Fundamentals and Applications (#05104G)
www.asminternational.org
Preface / ix
thermal and hot die forging of aerospace alloys. Die materials, die manufacturing, anddie wear in hot and cold forging are discussed in Chapters 21 and 22.
Finally, Chapter 23 reviews the near-net shape forging technology, including encloseddie forging, multiple-action tooling, and the most recent developments in forgingpresses. This chapter also discusses briefly the future of forging technology in the globaleconomy, the importance of information technology in the forge shop, and, finally, theneed to continuously acquire knowledge on new methods and techniques to remaincompetitive.
Several chapters of the book (Chapters 4, 6, 7, 14, 15 and 17) contain appendixesthat consist of presentation slides and computer animations. The animations representthe results of FEA simulations for various forging operations. They are given in a CDthat is included with this book. The reader is encouraged to use the CD and theseappendixes in order to understand better and easier some of the fundamental issuesdiscussed in corresponding chapters.
The preparation of this book has been supported partially by the Jacob WallenbergFoundation Prize, awarded to Dr. Taylan Altan by the Royal Swedish Academy ofEngineering Sciences. The staff and the students of the Engineering Research Centerfor Net Shape Manufacturing (ERC/NSM) of The Ohio State University contributedsignificantly to the preparation of the book. Specifically, Mr. Pinak Barve, GraduateResearch Associate, provided valuable assistance in preparing the text and the figures.Considerable information has been supplied by a large number of companies that sup-port the forging research and development at the ERC/NSM. On behalf of the authorsand the editors, I would like to thank all who made our work so much easier. Finally,I would like to thank my wife, Susan Altan, who has offered me enormous support andencouragement throughout the preparation of this book.
Taylan AltanDecember 2004
© 2005 ASM International. All Rights Reserved.Cold and Hot Forgings: Fundamentals and Applications (#05104G)
www.asminternational.org

ASM International is the society for materials engineers and scientists,
a worldwide network dedicated to advancing industry, technology, and
applications of metals and materials.
ASM International, Materials Park, Ohio, USA
www.asminternational.org
This publication is copyright © ASM International®
. All rights reserved.
Publication title Product code
Cold and Hot Forging: Fundamentals and
Applications
05104G
To order products from ASM International:
Online Visit www.asminternational.org/bookstore
Telephone 1-800-336-5152 (US) or 1-440-338-5151 (Outside US)
Fax 1-440-338-4634
MailCustomer Service, ASM International
9639 Kinsman Rd, Materials Park, Ohio 44073, USA
Email [email protected]
In Europe
American Technical Publishers Ltd.
27-29 Knowl Piece, Wilbury Way, Hitchin Hertfordshire SG4 0SX, United
Kingdom
Telephone: 01462 437933 (account holders), 01462 431525 (credit card)
www.ameritech.co.uk
In Japan
Neutrino Inc.
Takahashi Bldg., 44-3 Fuda 1-chome, Chofu-Shi, Tokyo 182 Japan
Telephone: 81 (0) 424 84 5550
Terms of Use. This publication is being made available in PDF format as a benefit to members and customers of ASM
International. You may download and print a copy of this publication for your personal use only. Other use and distribution is
prohibited without the express written permission of ASM International.
No warranties, express or implied, including, without limitation, warranties of merchantability or fitness for a particular purpose,
are given in connection with this publication. Although this information is believed to be accurate by ASM, ASM cannot
guarantee that favorable results will be obtained from the use of this publication alone. This publication is intended for use by
persons having technical skill, at their sole discretion and risk. Since the conditions of product or material use are outside of
ASM's control, ASM assumes no liability or obligation in connection with any use of this information. As with any material,
evaluation of the material under end-use conditions prior to specification is essential. Therefore, specific testing under actual
conditions is recommended.
Nothing contained in this publication shall be construed as a grant of any right of manufacture, sale, use, or reproduction, in
connection with any method, process, apparatus, product, composition, or system, whether or not covered by letters patent,
copyright, or trademark, and nothing contained in this publication shall be construed as a defense against any alleged
infringement of letters patent, copyright, or trademark, or as a defense against liability for such infringement.

CHAPTER 1
Metal FormingProcesses in ManufacturingManas Shirgaokar
1.1 Classification ofManufacturing Processes
The term metal forming refers to a group ofmanufacturing methods by which the given ma-terial, usually shapeless or of a simple geometry,is transformed into a useful part without changein the mass or composition of the material. Thispart usually has a complex geometry with well-defined (a) shape, (b) size, (c) accuracy and tol-erances, (d) appearance, and (e) properties.
The manufacture of metal parts and assem-blies can be classified, in a simplified manner,into five general areas:
● Primary shaping processes, such as casting,melt extrusion, die casting, and pressing ofmetal powder. In all these processes, the ma-terial initially has no shape but obtains awell-defined geometry through the process.
● Metal forming processes such as rolling, ex-trusion, cold and hot forging, bending, anddeep drawing, where metal is formed byplastic deformation.
● Metal cutting processes, such as sawing,turning, milling and broaching where remov-ing metal generates a new shape.
● Metal treatment processes, such as heat treat-ing, anodizing and surface hardening, wherethe part remains essentially unchanged inshape but undergoes change in properties orappearance.
● Joining processes, including (a) metallurgi-cal joining, such as welding and diffusionbonding, and (b) mechanical joining, such asriveting, shrink fitting, and mechanical as-
sembly. Metallurgical joining processes,such as welding, brazing, and soldering,form a permanent and robust joint betweencomponents. Mechanical joining processes,such as riveting and mechanical assembly,bring two or more parts together to build asubassembly that can be disassembled con-veniently.
Among all manufacturing processes, metalforming technology has a special place becauseit helps to produce parts of superior mechanicalproperties with minimum waste of material. Inmetal forming, the starting material has a rela-tively simple geometry. The material is plasti-cally deformed in one or more operations into aproduct of relatively complex configuration.Forming to near-net- or to net-shape dimensionsdrastically reduces metal removal requirements,resulting in significant material and energy sav-ings. Metal forming usually requires relativelyexpensive tooling. Thus, the process is eco-nomically attractive only when a large numberof parts must be produced and/or when the me-chanical properties required in the finished prod-uct can be obtained only by a forming process.
Metal forming includes a large number ofmanufacturing processes producing industrialproducts as well as military components andconsumer goods. These processes include (a)massive forming operations such as forging,rolling, and drawing, and (b) sheet forming pro-cesses, such as brake forming, deep drawing,and stretch forming. Unlike machining, metalforming processes do not involve extensivemetal removal to achieve the desired shape of
Cold and Hot Forging Fundamentals and ApplicationsTaylan Altan, Gracious Ngaile, Gangshu Shen, editors, p1-5 DOI:10.1361/chff2005p001
Copyright © 2005 ASM International® All rights reserved. www.asminternational.org
2 / Cold and Hot Forging: Fundamentals and Applications
the workpiece. Forming processes are frequentlyused together with other manufacturing pro-cesses, such as machining, grinding, and heattreating, in order to complete the transformationfrom the raw material to the finished andassembly-ready part. Desirable material prop-erties for forming include low yield strength andhigh ductility. These properties are affected bytemperature and rate of deformation (strain rate).When the work temperature is raised, ductilityis increased and yield strength is decreased. Theeffect of temperature gives rise to distinctionsamong cold forming (workpiece initially atroom temperature), warm forming (workpieceheated above room temperature, but below therecrystallization temperature of the workpiecematerial), and hot forming (workpiece heatedabove the recrystallization temperature). For ex-ample, the yield stress of a metal increases withincreasing strain (deformation) during coldforming. In hot forming, however, the yieldstress, in general, increases with strain (defor-mation) rate.
Forming processes are especially attractive incases where:
● The part geometry is of moderate complexityand the production volumes are large, so thattooling costs per unit product can be keptlow (e.g., automotive applications).
● The part properties and metallurgical in-tegrity are extremely important (e.g., load-carrying aircraft, jet engine, and turbinecomponents).
The design, analysis, and optimization of form-ing processes require:
● Engineering knowledge regarding metalflow, stresses, and heat transfer
● Technological information related to lubri-cation, heating and cooling techniques, ma-terial handling, die design, and formingequipment [Altan et al., 1983]
The development in forming technology hasincreased the range of shapes, sizes, and prop-erties of the formed products enabling them tohave various design and performance require-ments. Formed parts are required specificallywhen strength, reliability, economy, and resis-tance to shock and fatigue are essential. Theproducts can be determined from materials withthe required temperature performance, ductility,hardness, and machinability [ASM Handbook].
1.2 Characteristics ofManufacturing Processes
There are four main characteristics of anymanufacturing process—namely, geometry, tol-erances, production rates, and human and envi-ronmental factors.
1.2.1 Geometry
Each manufacturing process is capable of pro-ducing a family of geometries. Within this fam-ily there are geometries, which can be producedonly with extraordinary cost and effort. For ex-ample, the forging process allows production ofparts, which can be easily removed from a dieset, that is, upper and lower die. By use of a“split die” design, it is possible to manufactureforgings with undercuts and with more complexshapes.
1.2.2 Tolerances
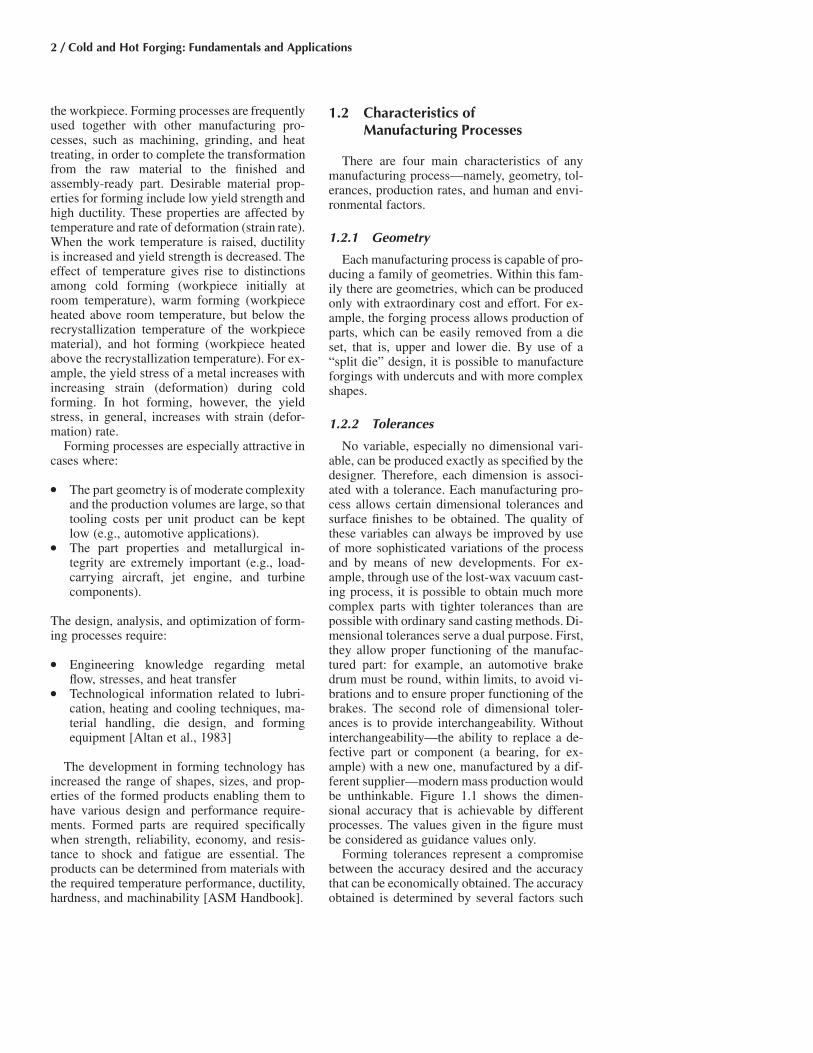
No variable, especially no dimensional vari-able, can be produced exactly as specified by thedesigner. Therefore, each dimension is associ-ated with a tolerance. Each manufacturing pro-cess allows certain dimensional tolerances andsurface finishes to be obtained. The quality ofthese variables can always be improved by useof more sophisticated variations of the processand by means of new developments. For ex-ample, through use of the lost-wax vacuum cast-ing process, it is possible to obtain much morecomplex parts with tighter tolerances than arepossible with ordinary sand casting methods. Di-mensional tolerances serve a dual purpose. First,they allow proper functioning of the manufac-tured part: for example, an automotive brakedrum must be round, within limits, to avoid vi-brations and to ensure proper functioning of thebrakes. The second role of dimensional toler-ances is to provide interchangeability. Withoutinterchangeability—the ability to replace a de-fective part or component (a bearing, for ex-ample) with a new one, manufactured by a dif-ferent supplier—modern mass production wouldbe unthinkable. Figure 1.1 shows the dimen-sional accuracy that is achievable by differentprocesses. The values given in the figure mustbe considered as guidance values only.
Forming tolerances represent a compromisebetween the accuracy desired and the accuracythat can be economically obtained. The accuracyobtained is determined by several factors such

Metal Forming Processes in Manufacturing / 3
Fig. 1.1 Approximate values of dimensional accuracies achievable in various processes. [Lange et al., 1985]
as the initial accuracy of the forming dies andtooling, the complexity of the part, the type ofmaterial being formed, and the type of formingequipment that is used. Another factor determin-ing the forming accuracy is the type of part be-ing produced.
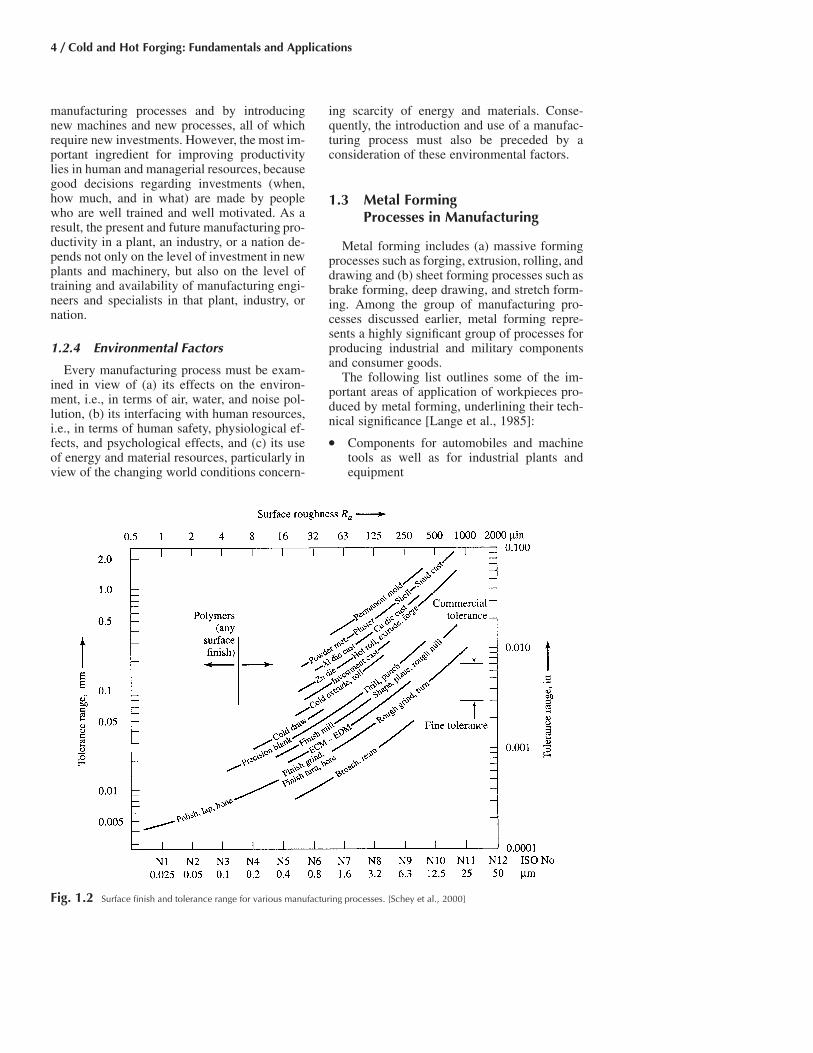
Manufacturing costs are directly proportionalto tolerances and surface finish specifications.Under typical conditions, each manufacturingprocess is capable of producing a part to a cer-tain surface finish and tolerance range withoutextra expenditure. Some general guidance onsurface finish and tolerance range is given in Fig.1.2. The tolerances given apply to a 25 mm(1 in.) dimension. For larger or smaller dimen-sions, they do not necessarily increase or de-crease linearly. In a production situation it is bestto take the recommendations published by vari-ous industry associations or individual compa-nies. Surface roughness in Fig. 1.2 is given interms of Ra (arithmetic average). In many appli-cations the texture (lay) of the surface is alsoimportant, and for a given Ra value, differentprocesses may result in quite different finishes.
It used to be believed that cost tends to riseexponentially with tighter tolerances and surfacefinish. This is true only if a process sequenceinvolving processes and machine tools of lim-ited capability is used to achieve these toler-ances. There are, however, processes and ma-
chine tools of inherently greater accuracy andbetter surface finish. Thus, higher-quality prod-ucts can be obtained with little extra cost and, ifthe application justifies it, certainly with greatercompetitiveness. Still, a fundamental rule of thecost-conscious designer is to specify the loosestpossible tolerances and coarsest surfaces thatstill accomplish the intended function. The spec-ified tolerances should, if possible, be within therange obtainable by the intended manufacturingprocess (Fig. 1.2) so as to avoid additional fin-ishing operations [Schey et al., 2000].
1.2.3 Production RateThe rate of production that can be attained
with a given manufacturing operation is proba-bly the most significant feature of that operation,because it indicates the economics of and theachievable productivity with that manufacturingoperation. In industrialized countries, manufac-turing industries represent 25 to 30% of grossnational product. Consequently, manufacturingproductivity, i.e., production of discrete parts,assemblies, and products per unit time, is thesingle most important factor that influences thestandard of living in a country as well as thatcountry’s competitive position in internationaltrade in manufactured goods.
The rate of production or manufacturing pro-ductivity can be increased by improving existing
4 / Cold and Hot Forging: Fundamentals and Applications
Fig. 1.2 Surface finish and tolerance range for various manufacturing processes. [Schey et al., 2000]
manufacturing processes and by introducingnew machines and new processes, all of whichrequire new investments. However, the most im-portant ingredient for improving productivitylies in human and managerial resources, becausegood decisions regarding investments (when,how much, and in what) are made by peoplewho are well trained and well motivated. As aresult, the present and future manufacturing pro-ductivity in a plant, an industry, or a nation de-pends not only on the level of investment in newplants and machinery, but also on the level oftraining and availability of manufacturing engi-neers and specialists in that plant, industry, ornation.
1.2.4 Environmental Factors
Every manufacturing process must be exam-ined in view of (a) its effects on the environ-ment, i.e., in terms of air, water, and noise pol-lution, (b) its interfacing with human resources,i.e., in terms of human safety, physiological ef-fects, and psychological effects, and (c) its useof energy and material resources, particularly inview of the changing world conditions concern-
ing scarcity of energy and materials. Conse-quently, the introduction and use of a manufac-turing process must also be preceded by aconsideration of these environmental factors.
1.3 Metal FormingProcesses in Manufacturing
Metal forming includes (a) massive formingprocesses such as forging, extrusion, rolling, anddrawing and (b) sheet forming processes such asbrake forming, deep drawing, and stretch form-ing. Among the group of manufacturing pro-cesses discussed earlier, metal forming repre-sents a highly significant group of processes forproducing industrial and military componentsand consumer goods.
The following list outlines some of the im-portant areas of application of workpieces pro-duced by metal forming, underlining their tech-nical significance [Lange et al., 1985]:
● Components for automobiles and machinetools as well as for industrial plants andequipment

Metal Forming Processes in Manufacturing / 5
● Hand tools, such as hammers, pliers, screw-drivers, and surgical instruments
● Fasteners, such as screws, nuts, bolts, andrivets
● Containers, such as metal boxes, cans, andcanisters
● Construction elements used in tunneling,mining, and quarrying (roofing and wallingelements, pit props, etc.)
● Fittings used in the building industry, suchas for doors and windows
A common way of classifying metal formingprocesses is to consider cold (room temperature)and hot (above recrystallization temperature)forming. Most materials behave differently un-der different temperature conditions. Usually,the yield stress of a metal increases with increas-ing strain (or deformation) during cold formingand with increasing strain rate (or deformationrate) during hot forming. However, the generalprinciples governing the forming of metals atvarious temperatures are basically the same;therefore, classification of forming processesbased on initial material temperature does notcontribute a great deal to the understanding andimprovement of these processes. In fact, tool de-sign, machinery, automation, part handling, andlubrication concepts can be best considered bymeans of a classification based not on tempera-ture, but rather on specific input and output ge-ometries and material and production rate con-ditions.
Complex geometries, in both massive andsheet forming processes, can be obtained equallywell by hot or cold forming. Of course, due tothe lower yield strength of the deforming ma-terial at elevated temperatures, tool stresses andmachine loads are, in a relative sense, lower inhot forming than in cold forming.
Forming is especially attractive in caseswhere (a) the part geometry is of moderate com-plexity and the production volumes are large, sothat tooling costs per unit product can be keptlow—for example, in automotive applications;
and (b) the part properties and metallurgical in-tegrity are extremely important, in examplessuch as load-carrying aircraft and jet engine andturbine components.
The design, analysis, and optimization offorming processes require (a) analytical knowl-edge regarding metal flow, stresses, and heattransfer as well as (b) technological informationrelated to lubrication, heating, and cooling tech-niques; material handling; die design and man-ufacture; and forming equipment. A consider-able amount of information on the generalaspects of metal forming is available in the lit-erature.
REFERENCES
[Altan et al., 1983]: Altan, T., Oh, S.-I., Gegel,H.L., Metal Forming Fundamentals and Ap-plications, ASM International, 1983.
[ASM Handbook]: Forming and Forging, Vol14, ASM Handbook, ASM International,1988, p 6.
[Lange et al., 1985]: Lange, K., et al., Hand-book of Metal Forming, McGraw-Hill, 1985,p 2.3, 9.19.
[Schey et al., 2000]: Schey, J.A., et al., Intro-duction to Manufacturing Processes, Mc-Graw-Hill, 2000, p 67–69.
SELECTED REFERENCES
[Altan, 2002]: Altan, T., “Short Course on NearNet Shape Cold, Warm and Hot ForgingWithout Flash,” Engineering Research Centerfor Net Shape Manufacturing, The Ohio StateUniversity, 2002.
[Kalpakjian et al., 2001]: Kalpakjian, S.,Schmid, S., Manufacturing Engineering andTechnology, Prentice Hall, 2001.
[SME Handbook, 1989]: Tool and Manufac-turers Engineering Handbook, Desk Edition(1989), 4th ed., Society of Manufacturing En-gineers, 1989, p 15-8.

CHAPTER 2
Forging Processes:Variables and DescriptionsManas Shirgaokar
2.1 Introduction
In forging, an initially simple part—a billet,for example—is plastically deformed betweentwo tools (or dies) to obtain the desired finalconfiguration. Thus, a simple part geometry istransformed into a complex one, whereby thetools “store” the desired geometry and impartpressure on the deforming material through thetool/material interface. Forging processes usu-ally produce little or no scrap and generate thefinal part geometry in a very short time, usuallyin one or a few strokes of a press or hammer. Asa result, forging offers potential savings in en-ergy and material, especially in medium andlarge production quantities, where tool costs canbe easily amortized. In addition, for a givenweight, parts produced by forging exhibit bettermechanical and metallurgical properties and re-liability than do those manufactured by castingor machining.
Forging is an experience-oriented technology.Throughout the years, a great deal of know-howand experience has been accumulated in thisfield, largely by trial-and-error methods. Nev-ertheless, the forging industry has been capableof supplying products that are sophisticated andmanufactured to very rigid standards fromnewly developed, difficult-to-form alloys.
The physical phenomena describing a forgingoperation are difficult to express with quantita-tive relationships. The metal flow, the friction atthe tool/material interface, the heat generationand transfer during plastic flow, and the rela-tionships between microstructure/properties and
process conditions are difficult to predict and an-alyze. Often in producing discrete parts, severalforging operations (preforming) are required totransform the initial “simple” geometry into a“complex” geometry, without causing materialfailure or degrading material properties. Con-sequently, the most significant objective of anymethod of analysis is to assist the forging engi-neer in the design of forging and/or preformingsequences. For a given operation (preforming orfinish forging), such design essentially consistsof (a) establishing the kinematic relationships(shape, velocities, strain rates, strains) betweenthe deformed and undeformed part, i.e., predict-ing metal flow, (b) establishing the limits offormability or producibility, i.e., determiningwhether it is possible to form the part withoutsurface or internal failure, and (c) predicting theforces and stresses necessary to execute the forg-ing operation so that tooling and equipment canbe designed or selected.
For the understanding and quantitative designand optimization of forging operations it is use-ful to (a) consider forging processes as a systemand (b) classify these processes in a systematicway [Altan et al., 1983].
2.2 Forging Operation as a System
A forging system comprises all the input vari-ables such as the billet or blank (geometry andmaterial), the tooling (geometry and material),the conditions at the tool/material interface, themechanics of plastic deformation, the equipment
Cold and Hot Forging Fundamentals and ApplicationsTaylan Altan, Gracious Ngaile, Gangshu Shen, editors, p7-15 DOI:10.1361/chff2005p007
Copyright © 2005 ASM International® All rights reserved. www.asminternational.org

8 / Cold and Hot Forging: Fundamentals and Applications
Fig. 2.1 One-blow impression-die forging considered as asystem: (1) billet, (2) tooling, (3) tool/material inter-
face, (4) deformation zone, (5) forging equipment, (6) product, (7)plant environment
used, the characteristics of the final product, andfinally the plant environment where the processis being conducted.
The “systems approach” in forging allowsstudy of the input/output relationships and theeffect of the process variables on product qualityand process economics. Figure 2.1 shows thedifferent components of the forging system. Thekey to a successful forging operation, i.e., to ob-taining the desired shape and properties, is theunderstanding and control of the metal flow. Thedirection of metal flow, the magnitude of defor-mation, and the temperatures involved greatlyinfluence the properties of the formed compo-nents. Metal flow determines both the mechan-ical properties related to local deformation andthe formation of defects such as cracks and foldsat or below the surface. The local metal flow isin turn influenced by the process variables sum-marized below:
Billet
● Flow stress as a function of chemical com-position, metallurgical structure, grain size,segregation, prior strain history, temperatureof deformation, degree of deformation orstrain, rate of deformation or strain, and mi-crostructure
● Forgeability as a function of strain rate, tem-perature, deformation rate
● Surface texture● Thermal/physical properties (density, melt-
ing point, specific heat, thermal conductivityand expansion, resistance to corrosion andoxidation)
● Initial conditions (composition, temperature,history/prestrain)
● Plastic anisotropy● Billet size and thickness
Tooling/Dies
● Tool geometry● Surface conditions, lubrication● Material/heat treatment/hardness● Temperature
Conditions at the Die/Billet Interface
● Lubricant type and temperature● Insulation and cooling characteristics of the
interface layer● Lubricity and frictional shear stress● Characteristics related to lubricant applica-
tion and removal
Deformation Zone
● The mechanics of deformation, model usedfor analysis
● Metal flow, velocities, strain, strain rate (kin-ematics)
● Stresses (variation during deformation)● Temperatures (heat generation and transfer)
Equipment
● Speed/production rate● Binder design and capabilities● Force/energy capabilities● Rigidity and accuracy
Product
● Geometry● Dimensional accuracy/tolerances● Surface finish● Microstructure, metallurgical and mechani-
cal properties
Environment
● Available manpower● Air, noise, and wastewater pollution● Plant and production facilities and control
2.2.1 Material Characterization
For a given material composition and defor-mation/heat treatment history (microstructure),the flow stress and the workability (or forge-ability) in various directions (anisotropy) are themost important material variables in the analysisof a metal forging process.
For a given microstructure, the flow stress,is expressed as a function of strain, strainr, e,
rate, and temperature, T:˙e,
Forging Processes: Variables and Descriptions / 9
˙r � f(e, e, T) (Eq 2.1)
To formulate the constitutive equation (Eq 2.1),it is necessary to conduct torsion, plane-straincompression, and uniform axisymmetric com-pression tests. During any of these tests, plasticwork creates a certain increase in temperature,which must be considered in evaluating and us-ing the test results.
Workability, forgeability, or formability is thecapability of the material to deform without fail-ure; it depends on (a) conditions existing duringdeformation processing (such as temperature,rate of deformation, stresses, and strain history)and (b) material variables (such as composition,voids, inclusions, and initial microstructure). Inhot forging processes, temperature gradients inthe deforming material (for example, due to lo-cal die chilling) also influence metal flow andfailure phenomena.
2.2.2 Tooling and Equipment
The selection of a machine for a given processis influenced by the time, accuracy, and load/energy characteristics of that machine. Optimalequipment selection requires consideration ofthe entire forging system, including lot size, con-ditions at the plant, environmental effects, andmaintenance requirements, as well as the re-quirements of the specific part and process underconsideration.
The tooling variables include (a) design andgeometry, (b) surface finish, (c) stiffness, and (d)mechanical and thermal properties under con-ditions of use.
2.2.3 Friction and Lubrication at theDie/Workpiece Interface
The mechanics of interface friction are verycomplex. One way of expressing friction quan-titatively is through a friction coefficient, l, ora friction shear factor, m. Thus, the frictionalshear stress, s, is:
s � lr (Eq 2.2)n
or
ms � f r � r (Eq 2.3)
3�
where rn is the normal stress at the interface,is the flow stress of the deforming materialr
and f is the friction factor There(f � m/ 3).�are various methods of evaluating friction, i.e.,estimating the value of l or m. In forging, themost commonly used tests are the ring com-pression test, spike test, and cold extrusion test.
2.2.4 DeformationZone/Mechanics of Deformation
In forging, material is deformed plastically togenerate the shape of the desired product. Metalflow is influenced mainly by (a) tool geometry,(b) friction conditions, (c) characteristics of thestock material, and (d) thermal conditions exist-ing in the deformation zone. The details of metalflow influence the quality and the properties ofthe formed product and the force and energy re-quirements of the process. The mechanics of de-formation, i.e., the metal flow, strains, strainrates, and stresses, can be investigated by usingone of the approximate methods of analysis(e.g., finite-element analysis, finite difference,slab, upper bound, etc.).
2.2.5 Product Geometry and Properties
The macro- and microgeometry of the prod-uct, i.e., its dimensions and surface finish, areinfluenced by the process variables. The pro-cessing conditions (temperature, strain, strainrate) determine the microstructural variationstaking place during deformation and often influ-ence the final product properties. Consequently,a realistic systems approach must include con-sideration of (a) the relationships between prop-erties and microstructure of the formed materialand (b) the quantitative influences of processconditions and heat treatment schedules on mi-crostructural variations.
2.3 Types of Forging Processes
There are a large number of forging processesthat can be summarized as follows:
● Closed/impression die forging with flash● Closed/impression die forging without flash● Electro-upsetting● Forward extrusion● Backward extrusion● Radial forging● Hobbing● Isothermal forging● Open-die forging

10 / Cold and Hot Forging: Fundamentals and Applications
Fig. 2.2 Closed-die forging with flash. (a) Schematic diagram with flash terminology. (b) Forging sequence in closed-die forging ofconnecting rods
● Orbital forging● Powder metal (P/M) forging● Upsetting● Nosing● Coining
2.3.1 Closed-Die Forging with Flash(Fig. 2.2a and 2.2b)
Definition. In this process, a billet is formed(hot) in dies (usually with two halves) such thatthe flow of metal from the die cavity is re-stricted. The excess material is extruded througha restrictive narrow gap and appears as flasharound the forging at the die parting line.
Equipment. Anvil and counterblow ham-mers, hydraulic, mechanical, and screw presses.
Materials. Carbon and alloy steels, aluminumalloys, copper alloys, magnesium alloys, beryl-lium, stainless steels, nickel alloys, titanium andtitanium alloys, iron and nickel and cobalt su-peralloys, niobium and niobium alloys, tantalumand tantalum alloys, molybdenum and molyb-denum alloys, tungsten alloys.
Process Variations. Closed-die forging withlateral flash, closed-die forging with longitudinalflash, closed-die forging without flash.
Application. Production of forgings for au-tomobiles, trucks, tractors, off-highway equip-ment, aircraft, railroad and mining equipment,general mechanical industry, and energy-relatedengineering production.
2.3.2 Closed-DieForging without Flash (Fig. 2.3)
Definition. In this process, a billet with care-fully controlled volume is deformed (hot or
cold) by a punch in order to fill a die cavitywithout any loss of material. The punch and thedie may be made of one or several pieces.
Equipment. Hydraulic presses, multiram me-chanical presses.
Materials. Carbon and alloy steels, aluminumalloys, copper alloys.
Process Variations. Core forging, precisionforging, cold and warm forging, P/M forging.
Application. Precision forgings, hollow forg-ings, fittings, elbows, tees, etc.
2.3.3 Electro-Upsetting (Fig. 2.4)
Definition. Electro-upsetting is the hot forg-ing process of gathering a large amount of ma-terial at one end of a round bar by heating thebar end electrically and pushing it against a flatanvil or shaped die cavity.
Equipment. Electric upsetters.Materials. Carbon and alloy steels, titanium.Application. Preforms for finished forgings.
2.3.4 Forward Extrusion (Fig. 2.5)
Definition. In this process, a punch com-presses a billet (hot or cold) confined in a con-tainer so that the billet material flows through adie in the same direction as the punch.
Equipment. Hydraulic and mechanicalpresses.
Materials. Carbon and alloy steels, aluminumalloys, copper alloys, magnesium alloys, tita-nium alloys.
Process Variations. Closed-die forging with-out flash, P/M forging.
Application. Stepped or tapered-diametersolid shafts, tubular parts with multiple diameter

Forging Processes: Variables and Descriptions / 11
Fig. 2.3 Closed-die forging without flashFig. 2.4 Electro-upsetting. A, anvil electrode; B, gripping
electrode; C, workpiece; D, upset end of workpiece
Application. Hollow parts having a closedend, cupped parts with holes that are cylindrical,conical, or of other shapes.
2.3.6 Radial Forging (Fig. 2.6)
Definition. This hot or cold forging processutilizes two or more radially moving anvils ordies for producing solid or tubular componentswith constant or varying cross sections alongtheir length.
Equipment. Radial forging machines.Materials. Carbon and alloy steels, titanium
alloys, tungsten, beryllium, and high-tempera-ture superalloys.
Process Variations. Rotary swaging.Application. This is a technique that is used
to manufacture axisymmetrical parts. Reducingthe diameters of ingots and bars, forging ofstepped shafts and axles, forging of gun and riflebarrels, production of tubular components withand without internal profiles.
2.3.7 Hobbing (Fig. 2.7)
Definition. Hobbing is the process of in-denting or coining an impression into a cold orhot die block by pressing with a punch.
Equipment. Hydraulic presses, hammers.Materials. Carbon and alloy steels.Process Variations. Die hobbing, die typing.Application. Manufacture of dies and molds
with relatively shallow impressions.
2.3.8 Isothermal Forging (Fig. 2.8)
Definition. Isothermal forging is a forgingprocess where the dies and the forging stock areat approximately the same high temperature.
Equipment. Hydraulic presses.
holes that are cylindrical, conical, or other non-round shapes.
2.3.5 Backward Extrusion (Fig. 2.5)
Definition. In this process, a moving punchapplies a steady pressure to a slug (hot or cold)confined in a die and forces the metal to flowaround the punch in a direction opposite the di-rection of punch travel (Fig. 2.5).
Equipment. Hydraulic and mechanicalpresses.
Materials. Carbon and alloy steels, aluminumalloys, copper alloys, magnesium alloys, tita-nium alloys.
Process Variations. Closed-die forging with-out flash, P/M forging.
12 / Cold and Hot Forging: Fundamentals and Applications
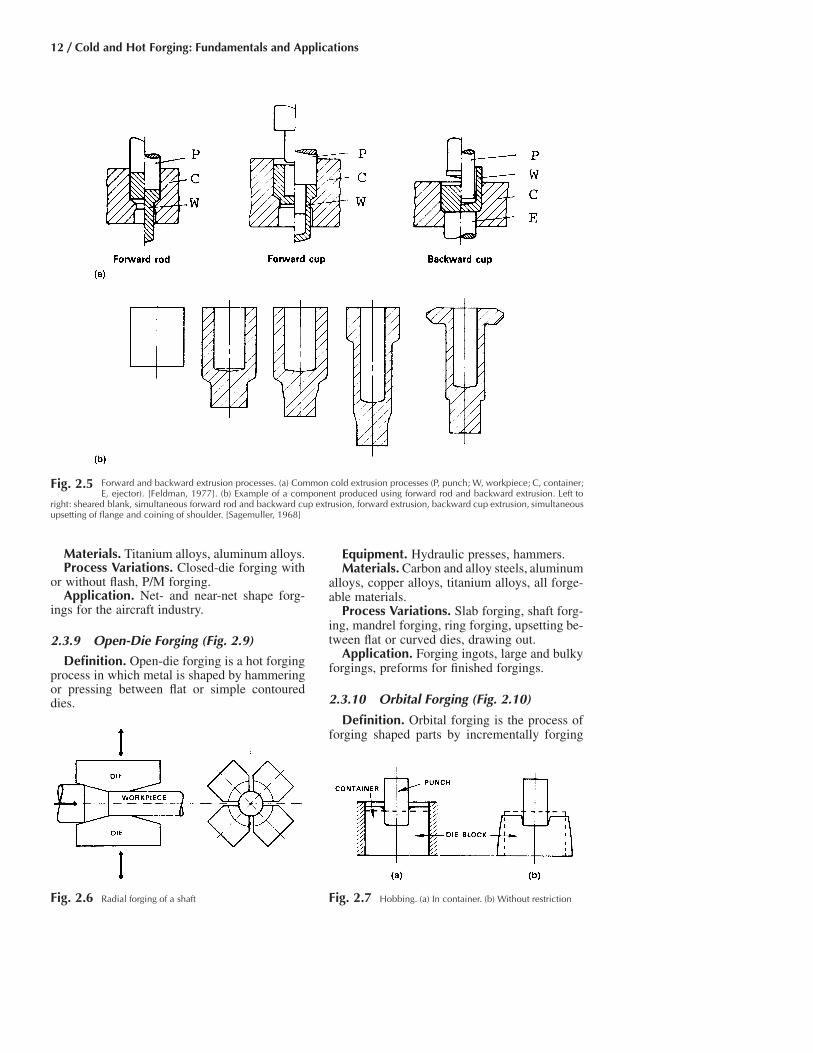
Fig. 2.5 Forward and backward extrusion processes. (a) Common cold extrusion processes (P, punch; W, workpiece; C, container;E, ejector). [Feldman, 1977]. (b) Example of a component produced using forward rod and backward extrusion. Left to
right: sheared blank, simultaneous forward rod and backward cup extrusion, forward extrusion, backward cup extrusion, simultaneousupsetting of flange and coining of shoulder. [Sagemuller, 1968]
Fig. 2.6 Radial forging of a shaft Fig. 2.7 Hobbing. (a) In container. (b) Without restriction
Materials. Titanium alloys, aluminum alloys.Process Variations. Closed-die forging with
or without flash, P/M forging.Application. Net- and near-net shape forg-
ings for the aircraft industry.
2.3.9 Open-Die Forging (Fig. 2.9)
Definition. Open-die forging is a hot forgingprocess in which metal is shaped by hammeringor pressing between flat or simple contoureddies.
Equipment. Hydraulic presses, hammers.Materials. Carbon and alloy steels, aluminum
alloys, copper alloys, titanium alloys, all forge-able materials.
Process Variations. Slab forging, shaft forg-ing, mandrel forging, ring forging, upsetting be-tween flat or curved dies, drawing out.
Application. Forging ingots, large and bulkyforgings, preforms for finished forgings.
2.3.10 Orbital Forging (Fig. 2.10)
Definition. Orbital forging is the process offorging shaped parts by incrementally forging

Forging Processes: Variables and Descriptions / 13
Fig. 2.8 Isothermal forging with dies and workpiece at ap-proximately the same temperature
Fig. 2.9 Open-die forging
Fig. 2.10 Stages in orbital forging
Fig. 2.11 Powder metal (P/M) forging
Fig. 2.12 Upset forging
Application. Bevel gears, claw clutch parts,wheel disks with hubs, bearing rings, rings ofvarious contours, bearing-end covers.
2.3.11 Powder Metal(P/M) Forging (Fig.2.11)
Definition. P/M forging is the process ofclosed-die forging (hot or cold) of sintered pow-der metal preforms.
Equipment. Hydraulic and mechanicalpresses.
Materials. Carbon and alloy steels, stainlesssteels, cobalt-base alloys, aluminum alloys, ti-tanium alloys, nickel-base alloys.
Process Variations. Closed-die forging with-out flash, closed-die forging with flash.
Application. Forgings and finished parts forautomobiles, trucks, and off-highway equip-ment.
2.3.12 Upsetting or Heading (Fig. 2.12)
Definition. Upsetting is the process of forg-ing metal (hot or cold) so that the cross-sectionalarea of a portion, or all, of the stock is increased.
Equipment. Hydraulic, mechanical presses,screw presses; hammers, upsetting machines.
Materials. Carbon and alloy steels, stainlesssteels, all forgeable materials.
Process Variations. Electro-upsetting, upsetforging, open-die forging.
(hot or cold) a slug between an orbiting upperdie and a nonrotating lower die. The lower dieis raised axially toward the upper die, which isfixed axially but whose axis makes orbital, spi-ral, planetary, or straight-line motions.
Equipment. Orbital forging presses.Materials. Carbon and low-alloy steels, alu-
minum alloys and brasses, stainless steels, allforgeable materials.
Process Variations. This process is alsocalled rotary forging, swing forging, or rockingdie forging. In some cases, the lower die mayalso rotate.

14 / Cold and Hot Forging: Fundamentals and Applications
Fig. 2.15 Ironing operation
Fig. 2.14 Coining operation
Fig. 2.13 Nosing of a shell
Application. Finished forgings, includingnuts, bolts; flanged shafts, preforms for finishedforgings.
2.3.13 Nosing (Fig. 2.13)
Definition. Nosing is a hot or cold forgingprocess in which the open end of a shell or tu-bular component is closed by axial pressing witha shaped die.
Equipment. Mechanical and hydraulicpresses, hammers.
Materials. Carbon and alloy steels, aluminumalloys, titanium alloys.
Process Variations. Tube sinking, tube ex-panding.
Applications. Forging of open ends of am-munition shells; forging of gas pressure contain-ers.
2.3.14 Coining (Fig. 2.14)
Definition. In sheet metal working, coiningis used to form indentations and raised sectionsin the part. During the process, metal is inten-tionally thinned or thickened to achieve the re-quired indentations or raised sections. It iswidely used for lettering on sheet metal or com-ponents such as coins. Bottoming is a type ofcoining process where bottoming pressurecauses reduction in thickness at the bendingarea.
Equipment. Presses and hammers.Materials. Carbon and alloy steels, stainless
steels, heat-resistant alloys, aluminum alloys,copper alloys, silver and gold alloys.
Process Variations. Coining without flash,coining with flash, coining in closed die, sizing.
Applications. Metallic coins; decorativeitems, such as patterned tableware, medallionsand metal buttons; sizing of automobile and air-craft engine components.
2.3.15 Ironing (Fig. 2.15)
Definition. Ironing is the process of smooth-ing and thinning the wall of a shell or cup (coldor hot) by forcing the shell through a die with apunch.
Equipment. Mechanical presses and hydrau-lic presses.
Materials. Carbon and alloy steels, aluminumand aluminum alloys, titanium alloys.
Applications. Shells and cups for varioususes.
REFERENCES
[Altan et al., 1983]: Altan, T., Oh, S.-I., Gegel,H.L., Metal Forming Fundamentals and Ap-plications, ASM International, 1983.
[Feldman, 1977]: Feldman, H.D., Cold Extru-sion of Steel, Merkblatt 201, Dusseldorf, 1977(in German).
[Sagemuller, 1968]: Sagemuller, Fr., “Cold Im-pact Extrusion of Large Formed Parts,” Wire,No. 95, June 1968, p 2.
SELECTED REFERENCES
[Altan, 2002]: Altan, T., “The Greenfield Coa-lition Modules,” Engineering Research Cen-

Forging Processes: Variables and Descriptions / 15
ter for Net Shape Manufacturing, The OhioState University, 2002.
[ASM, 1989]: Production to Near Net ShapeSource Book, American Society for Metals1989, p 33–80.
[ASM Handbook]: Forming and Forging, Vol14, ASM Handbook, ASM International,1988, p 6.
[Kalpakjian, 1984]: Kalpakjian, S., Manufac-turing Processes for Engineering Materials,Addison-Wesley, 1984, p 381–409.
[Lange et al., 1985]: Lange, K., et al., Hand-book of Metal Forming, McGraw-Hill, 1985,p 2.3, 9.19.
[Lindberg, 1990]: Lindberg, Processes and Ma-terials of Manufacture, 4th ed., Allyn and Ba-con, 1990, p 589–601.
[Niebel et al., 1989]: Niebel, B.W.,Draper, A.B., Wysk, R.A., Modern Manu-facturing Process Engineering, 1989, p 403–425.
[Schuler Handbook, 1998]: Schuler, MetalForging Handbook, Springer, Goppingen,Germany, 1998.
[SME Handbook, 1989]: Tool and Manufac-turers Engineering Handbook, Desk Edition(1989), 4th ed., Society of Manufacturing En-gineers, 1989, p 15-8.

CHAPTER 3
Plastic Deformation:Strain and Strain RateManas ShirgaokarGracious Ngaile
3.1 Introduction
The purpose of applying the plasticity theoryin metal forming is to investigate the mechanicsof plastic deformation in metal forming pro-cesses. Such investigation allows the analysisand prediction of (a) metal flow (velocities,strain rates, and strains), (b) temperatures andheat transfer, (c) local variation in materialstrength or flow stress, and (d) stresses, formingload, pressure, and energy. Thus, the mechanicsof deformation provide the means for determin-ing how the metal flows, how the desired ge-ometry can be obtained by plastic forming, andwhat are the expected mechanical properties ofthe part produced by forming.
In order to arrive at a manageable mathemat-ical description of the metal deformation, sev-eral simplifying (but reasonable) assumptionsare made:
● Elastic deformations are neglected. How-ever, when necessary, elastic recovery (forexample, in the case of springback in bend-ing) and elastic deflection of the tooling (inthe case of precision forming to very closetolerances) must be considered.
● The deforming material is considered to bein continuum (metallurgical aspects such asgrains, grain boundaries, and dislocations arenot considered).
● Uniaxial tensile or compression test data arecorrelated with flow stress in multiaxial de-formation conditions.
● Anisotropy and Bauschinger effects are ne-glected.
● Volume remains constant.● Friction is expressed by a simplified expres-
sion such as Coulomb’s law or by a constantshear stress. This is discussed later.
3.2 Stress Tensor
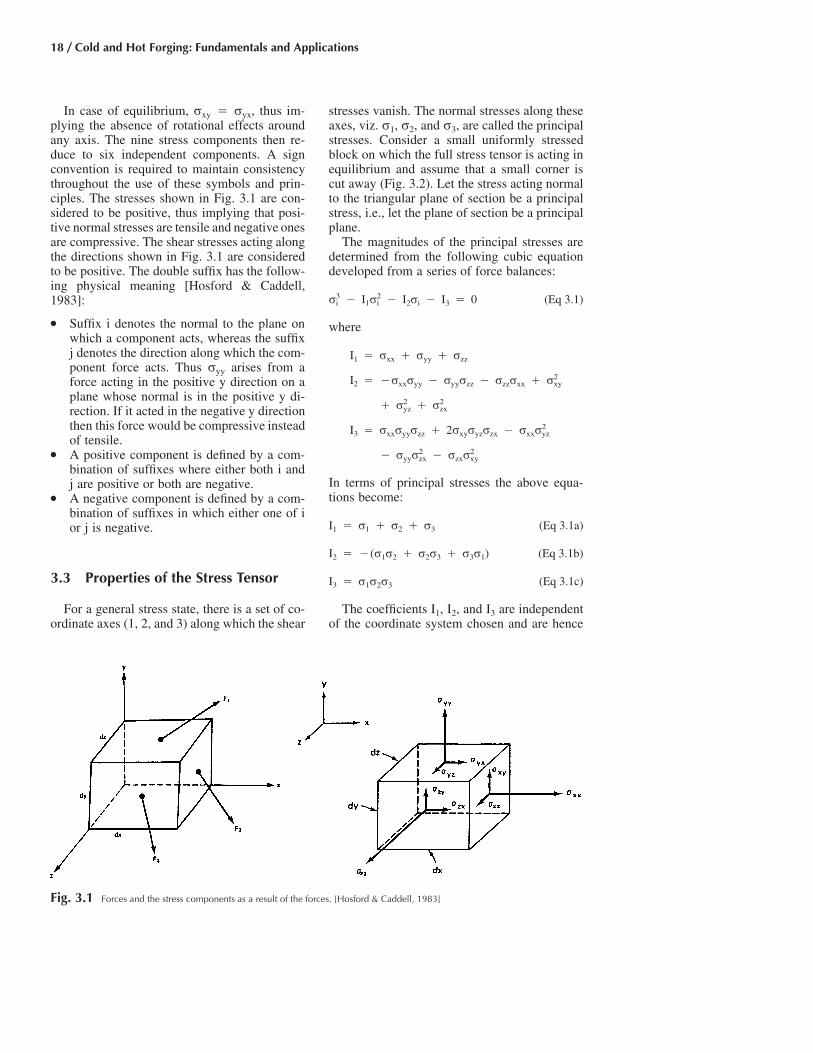
Consider a general case, where each face of acube is subjected to the three forces F1, F2, andF3 (Fig. 3.1). Each of these forces can be re-solved into the three components along the threecoordinate axes. In order to determine thestresses along these axes, the force componentsare divided by the area of the face upon whichthey act, thus giving a total of nine stress com-ponents, which define the total state of stress onthis cuboidal element.
This collection of stresses is referred to as thestress tensor (Fig. 3.1) designated as rji and isexpressed as:
r r rxx yx zx
r � r r rij xy yy zy� �r r rxz yz zz
A normal stress is indicated by two identicalsubscripts, e.g., rxx, while a differing pair indi-cates a shear stress. This notation can be sim-plified by denoting the normal stresses by a sin-gle subscript and shear stresses by the symbol s.Thus one will have rxx � rx and rxy � sxy.
Cold and Hot Forging Fundamentals and ApplicationsTaylan Altan, Gracious Ngaile, Gangshu Shen, editors, p17-23 DOI:10.1361/chff2005p017
Copyright © 2005 ASM International® All rights reserved. www.asminternational.org
18 / Cold and Hot Forging: Fundamentals and Applications
Fig. 3.1 Forces and the stress components as a result of the forces. [Hosford & Caddell, 1983]
In case of equilibrium, rxy � ryx, thus im-plying the absence of rotational effects aroundany axis. The nine stress components then re-duce to six independent components. A signconvention is required to maintain consistencythroughout the use of these symbols and prin-ciples. The stresses shown in Fig. 3.1 are con-sidered to be positive, thus implying that posi-tive normal stresses are tensile and negative onesare compressive. The shear stresses acting alongthe directions shown in Fig. 3.1 are consideredto be positive. The double suffix has the follow-ing physical meaning [Hosford & Caddell,1983]:
● Suffix i denotes the normal to the plane onwhich a component acts, whereas the suffixj denotes the direction along which the com-ponent force acts. Thus ryy arises from aforce acting in the positive y direction on aplane whose normal is in the positive y di-rection. If it acted in the negative y directionthen this force would be compressive insteadof tensile.
● A positive component is defined by a com-bination of suffixes where either both i andj are positive or both are negative.
● A negative component is defined by a com-bination of suffixes in which either one of ior j is negative.
3.3 Properties of the Stress Tensor
For a general stress state, there is a set of co-ordinate axes (1, 2, and 3) along which the shear
stresses vanish. The normal stresses along theseaxes, viz. r1, r2, and r3, are called the principalstresses. Consider a small uniformly stressedblock on which the full stress tensor is acting inequilibrium and assume that a small corner iscut away (Fig. 3.2). Let the stress acting normalto the triangular plane of section be a principalstress, i.e., let the plane of section be a principalplane.
The magnitudes of the principal stresses aredetermined from the following cubic equationdeveloped from a series of force balances:
3 2r � I r � I r � I � 0 (Eq 3.1)i 1 i 2 i 3
where
I � r � r � r1 xx yy zz
2I � �r r � r r � r r � r2 xx yy yy zz zz xx xy
2 2� r � ryz zx
2I � r r r � 2r r r � r r3 xx yy zz xy yz zx xx yz
2 2� r r � r ryy zx zx xy
In terms of principal stresses the above equa-tions become:
I � r � r � r (Eq 3.1a)1 1 2 3
I � �(r r � r r � r r ) (Eq 3.1b)2 1 2 2 3 3 1
I � r r r (Eq 3.1c)3 1 2 3
The coefficients I1, I2, and I3 are independentof the coordinate system chosen and are hence

Plastic Deformation: Strain and Strain Rate / 19
Fig. 3.4 Cut at an arbitrary angle h in the x-y plane. [Hosford& Caddell, 1983]
Fig. 3.3 Stresses in the x-y plane. [Hosford & Caddell, 1983]
Fig. 3.2 Equilibrium in a three-dimensional stress state.[Backofen, 1972]
Fig. 3.5 Metal flow in certain forming processes. (a) Non-steady-state upset forging. (b) Steady-state extrusion.
[Lange, 1972]
called invariants. Consequently, the principalstresses for a given stress state are unique. Thethree principal stresses can only be determinedby finding the three roots of the cubic equation.The invariants are necessary in determining theonset of yielding.
3.4 Plane Stress orBiaxial Stress Condition
Consider Fig. 3.1 with the nine stress com-ponents and assume that any one of the threereference planes (x, y, z) vanishes (Fig. 3.3). As-suming that the z plane vanishes, one has rz �szy � szx and a biaxial state of stress exists. Tostudy the variation of the normal and shear stresscomponents in the x-y plane, a cut is made atsome arbitrary angle h as shown in Fig. 3.4, andthe stresses on this plane are denoted by rh andsh.
r � r r � rx y x yr � � cos 2hh 2 2
� s sin 2h (Eq 3.2)xy
r � rx ys � � sin 2h � s cos 2h (Eq 3.3)h xy� �2
The two principal stresses in the x-y plane arethe values of rh on planes where the shear stresssh � 0. Thus, under this condition,
2sxytan 2h � (Eq 3.4)r � rx y

20 / Cold and Hot Forging: Fundamentals and Applications
Fig. 3.6 Displacement in the x-y plane. [Altan et al., 1983]
Thus, with the values of sin 2h and cos 2h theequation becomes
1r , r � (r � r )1 2 x y2
1 2 2 1/2� [(r � r ) � 4s ] (Eq 3.5)x y xy2
To find the planes where the shear stress sh ismaximum, differentiate Eq 3.3 with respect to hand equate to zero. Thus,
1 2 2 1/2s � [(r � r ) � 4s ] (Eq 3.6)max x y xy2
3.5 Local Deformations and theVelocity Field
The local displacement of the volume ele-ments is described by the velocity field, e.g., ve-locities, strain rates, and strains (Fig. 3.5). Tosimplify analysis, it is often assumed that thevelocity field is independent of the materialproperties. Obviously, this is not correct.
3.6 Strains
In order to investigate metal flow quantita-tively, it is necessary to define the strains (ordeformations), strain rates (deformation rates),and velocities (displacements per unit time).Figure 3.6 illustrates the deformation of an in-finitesimal rectangular block, abcd, into a par-allelogram, a�b�c�d�, after a small amount ofplastic deformation. Although this illustration isin two dimensions, the principles apply also tothree-dimensional cases.
The coordinates of a point are initially x andy (and z in three dimensions). After a small de-formation, the same point has the coordinates x�and y� (and z� in 3-D). By neglecting the higher-order components, one can determine the mag-nitude of the displacement of point b, ubx, as afunction of the displacement of point a. Thisvalue, ubx, is different from the displacement ofpoint a, ux, about the variation of the functionux over the length dx, i.e.,
�uxu � u � dx (Eq 3.7)bx x �x
Note that ux also depends on y and z.
The relative elongation of length ab (which isoriginally equal to dx), or the strain in the x di-rection, ex, is now:
(u � u )bx xe �x dx
or
�u �ux xe � u � dx � u dx � (Eq 3.8a)x x x� ���u �x
Similarly, in the y and z directions,
�u �uy ze � ; e � (Eq 3.8b)y z�y �z
The angular variations due to the small de-formation considered in Fig. 3.6 are infinitesi-mally small. Therefore, tan �xy � �xy and tan�yx � �yx. Thus:
� � (u � u )/(u � dx � u ) (Eq 3.9)xy by y bx x
The expression for ubx is given in Eq 3.7, andthat for uby can be obtained similarly as:
�uyu � u � dy (Eq 3.10)by y �y
Using Eq 3.7 and 3.10, and considering thatex � �ux/�x is considerably smaller than 1, Eq3.9 leads to:
�uy� � (Eq 3.11a)xy �x

Plastic Deformation: Strain and Strain Rate / 21
and similarly,
�ux� � (Eq 3.11b)yx �y
Thus, the total angular deformation in the xyplane, or the shear strain, cxy, is:
�u �uy xc � � � � � � (Eq 3.12a)xy xy yx �x �y
Similarly:
�u �uy zc � � (Eq 3.12b)yz �z �y
and
�u �uz xc � � (Eq 3.12c)xz �x �z
3.7 Velocities and Strain Rates
The distribution of velocity components (vx,vy, vz) within a deforming material describes themetal flow in that material. The velocity is thevariation of the displacement in time or in the x,y, and z directions [Backofen, 1972, and Rowe,1977].
�u �u �ux y zv � ; v � ; v � (Eq 3.13)x y z�t �t �t
The strain rates, i.e., the variations in strainwith time, are:
�e � �(u ) � �u �vx x x xe � � � �x � ��t �t �x �x �t �x
Similarly,
�v �v �vx y ze � ; e � ; e � (Eq 3.14a)x y z�x �y �z
�v �vx yc � � (Eq 3.14b)xy �y �x
�v �vy zc � � (Eq 3.14c)yz �z �y
�v �vx zc � � (Eq 3.14d)xz �z �x
The state of deformation in a plastically de-forming metal is fully described by the displace-ments, u, velocities, v, strains, e, and strain rates,
(in an x, y, z coordinate system). It is possibleeto express the same values in an x�, y�, z� sys-tem, provided that the angle of rotation from x,y, z to x�, y�, z� is known. Thus, in every smallelement within the plastically deforming body,it is possible to orient the coordinate system suchthat the element is not subjected to shear butonly to compression or tension. In this case, thestrains cxy, cyz, cxz all equal zero, and the ele-ment deforms along the principal axes of defor-mation.
In uniaxial tension and compression tests (nonecking, no bulging), deformation is also in thedirections of the principal axes.
The assumption of volume constancy madeearlier neglects the elastic strains. This assump-tion is reasonable in most forming processeswhere the amount of plastic strain is much largerthan the amount of elastic strain. This assump-tion can also be expressed, for the deformationalong the principal axes, as follows:
e � e � e � 0 (Eq 3.15)x y z
and
e � e � e � 0 (Eq 3.16)x y z
3.8 Homogeneous Deformation
Figure 3.7 considers “frictionless” upset forg-ing of a rectangular block. The upper die is mov-ing downward at velocity VD. The coordinateaxes x, y, and z have their origins on the lowerplaten, at the center of the lower rectangular sur-face.
The initial and final dimensions of the blockare designated by the subscripts 0 and 1, respec-tively. The instantaneous height of the blockduring deformation is h. The velocity compo-nents vx, vy, and vz, describing the motion ofeach particle within the deforming block, can beexpressed as the linear function of the coordi-nates x, y, and z as follows:
V x V y V zD D Dv � ; v � ; v � � (Eq 3.17)x y z2h 2h h
In order to demonstrate that the velocity fielddescribed by Eq 3.17 is acceptable, it is neces-
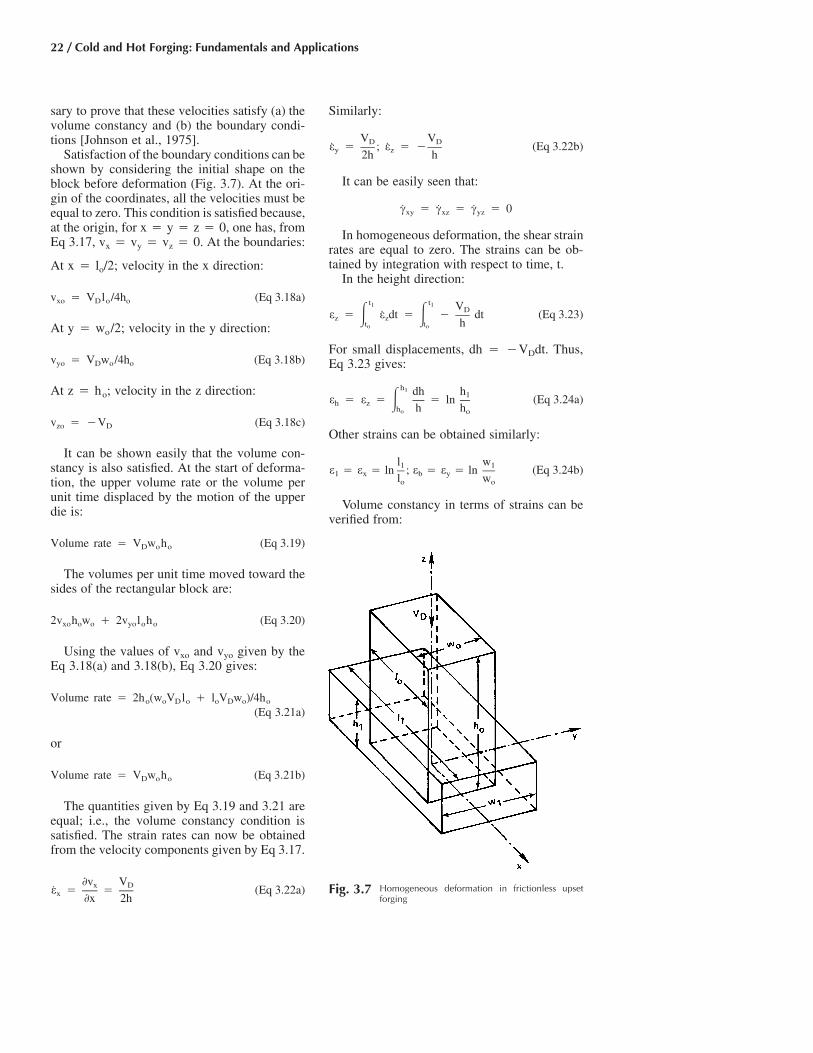
22 / Cold and Hot Forging: Fundamentals and Applications
Fig. 3.7 Homogeneous deformation in frictionless upsetforging
sary to prove that these velocities satisfy (a) thevolume constancy and (b) the boundary condi-tions [Johnson et al., 1975].
Satisfaction of the boundary conditions can beshown by considering the initial shape on theblock before deformation (Fig. 3.7). At the ori-gin of the coordinates, all the velocities must beequal to zero. This condition is satisfied because,at the origin, for x � y � z � 0, one has, fromEq 3.17, vx � vy � vz � 0. At the boundaries:
At x � lo/2; velocity in the x direction:
v � V l /4h (Eq 3.18a)xo D o o
At y � wo/2; velocity in the y direction:
v � V w /4h (Eq 3.18b)yo D o o
At z � ho; velocity in the z direction:
v � �V (Eq 3.18c)zo D
It can be shown easily that the volume con-stancy is also satisfied. At the start of deforma-tion, the upper volume rate or the volume perunit time displaced by the motion of the upperdie is:
Volume rate � V w h (Eq 3.19)D o o
The volumes per unit time moved toward thesides of the rectangular block are:
2v h w � 2v l h (Eq 3.20)xo o o yo o o
Using the values of vxo and vyo given by theEq 3.18(a) and 3.18(b), Eq 3.20 gives:
Volume rate � 2h (w V l � l V w )/4ho o D o o D o o
(Eq 3.21a)
or
Volume rate � V w h (Eq 3.21b)D o o
The quantities given by Eq 3.19 and 3.21 areequal; i.e., the volume constancy condition issatisfied. The strain rates can now be obtainedfrom the velocity components given by Eq 3.17.
�v Vx De � � (Eq 3.22a)x �x 2h
Similarly:
V VD De � ; e � � (Eq 3.22b)y z2h h
It can be easily seen that:
c � c � c � 0xy xz yz
In homogeneous deformation, the shear strainrates are equal to zero. The strains can be ob-tained by integration with respect to time, t.
In the height direction:
t t1 1 VDe � e dt � � dt (Eq 3.23)z z� �t t ho o
For small displacements, dh � �VDdt. Thus,Eq 3.23 gives:
h1 dh h1e � e � � ln (Eq 3.24a)h z �h h ho o
Other strains can be obtained similarly:
l w1 1e � e � ln ; e � e � ln (Eq 3.24b)1 x b yl wo o
Volume constancy in terms of strains can beverified from:

Plastic Deformation: Strain and Strain Rate / 23
Fig. 3.8 Comparison of engineering and true stress-straincurve. [Hosford & Caddell, 1983]
h w lo o oV � h w l � h w l r � 1o o o 1 1 1 h w l1 1 1
or, taking the natural logarithm
h b lo o oln � ln � ln � e � e � e � 0h b 1h b l1 1 1
(Eq 3.25)
3.9 Plastic (True) Strain andEngineering Strain (Fig. 3.8)
The results of Eq 3.24 can also be obtainedthrough a different approach. In the theory ofstrength of materials—during uniform elonga-tion in tension, for example—the infinitesimalengineering strain, de, is considered with respectto the original length, l0, or:
l1dl dl l � l1 ode � r e � � (Eq 3.26)�l l l loo o o
In the theory of metal forming plasticity, the ini-tial condition cannot be used as a frame of ref-erence; therefore, the change in the length mustbe related to instantaneous length, or:
l1dl dl l1de � r e � � ln (Eq 3.27)�l l l lo o
Equations 3.26 and 3.27 give:
l1e � ln � ln (e � 1) (Eq 3.28)lo
The relations between e and e can be illustratedby considering the following example uniformdeformations, where a bar is uniformly (or ho-mogeneously) compressed to half its originallength or is elongated to twice its original length:
Compression for l1 � lo/2 Tension for l1 � 2lo
e � lnl1lo
�0.693 �0.693
e �l � l1 o
lo
�0.5 �1
REFERENCES
[Altan et al., 1983]: Altan, T., Oh, S.-I., Gegel,H.L., Metal Forming Fundamentals and Ap-plications, ASM International, 1983.
[Backofen, 1972]: Backofen, W., DeformationProcessing, Addison-Wesley, 1972.
[Hosford & Caddell, 1983]: Hosford, W.F.,Caddell, R.M., Metal Forming: Mechanicsand Metallurgy, Prentice-Hall, 1983.
[Johnson et al., 1975]: Johnson, W., Mellor,P.B., Engineering Plasticity, Van NostrandReinhold Co., London, 1975.
[Lange, 1972]: Lange, K., Ed., Study Book ofForming Technology, (in German), Vol 1,Fundamentals, Springer-Verlag, 1972.
[Rowe, 1977]: Rowe, G.W., Principles of In-dustrial Metalworking Processes, Edward Ar-nold Publishers, London, 1975.

CHAPTER 4
Flow Stress and ForgeabilityManas Shirgaokar
4.1 Introduction
In order to understand the forces and stressesinvolved in metal forming processes it is nec-essary to (a) become familiar with the conceptof flow stress and (b) start with the study of plas-tic deformation under conditions where a simplestate of stress exists.
For studying the plastic deformation behaviorof a metal it is appropriate to consider homo-geneous or uniform deformation conditions. Theyield stress of a metal under uniaxial conditions,
as a function of strain, strain rate, and tempera-ture, can also be considered as the “flow stress.”The metal starts flowing or deforming plasticallywhen the applied stress (in uniaxial tension with-out necking and in uniaxial compression withoutbulging) reaches the value of the yield stress orflow stress. The flow stress is very important be-cause in metal forming processes the loads andstresses are dependent on (a) the part geometry,(b) friction, and (c) the flow stress of the de-forming material. The flow stress of a metal isinfluenced by:
Fig. 4.1 Representation of data in tensile test. (a) Engineering stress-strain curve. (b) True stress-strain curve. (c) Schematic of di-mensional change of the specimen during the test. [Thomsen et al., 1965]
Cold and Hot Forging Fundamentals and ApplicationsTaylan Altan, Gracious Ngaile, Gangshu Shen, editors, p25-49 DOI:10.1361/chff2005p025
Copyright © 2005 ASM International® All rights reserved. www.asminternational.org

26 / Cold and Hot Forging: Fundamentals and Applications
● Factors unrelated to the deformation process,such as chemical composition, metallurgicalstructure, phases, grain size, segregation, andprior strain history
● Factors explicitly related to the deformationprocess, such as temperature of deformation,degree of deformation or strain, and rate ofdeformation or strain rate
Thus, the flow stress, can be expressed as ar,function of the temperature, h, strain, e, thestrain rate, and the microstructure, S. For a˙e,given microstructure, i.e., heat treatment andprior deformation history:
˙r � f(h, e, e) (Eq 4.1)
In hot forming of metals at temperaturesabove the recrystallization temperature the effectof strain on flow stress is insignificant and the
influence of strain rate (i.e., rate of deformation)becomes increasingly important. Conversely, atroom temperature (i.e., in cold forming) the ef-fect of strain rate on flow stress is negligible.The degree of dependency of flow stress on tem-perature varies considerably among differentmaterials. Therefore, temperature variations dur-ing the forming process can have different ef-fects on load requirements and metal flow fordifferent materials. The increase in the flowstress for titanium alloy Ti-8Al-1Mo-1V that
Fig. 4.4 Compression test specimen. (a) View of specimen, showing lubricated shallow grooves on the ends. (b) Shape of thespecimen before and after the test
Fig. 4.2 Schematic representation of condition of necking insimple tension. [Thomsen et al., 1965]
Fig. 4.3 Axial stress distribution in the necked portion of atensile specimen. [Thomsen et al., 1965]
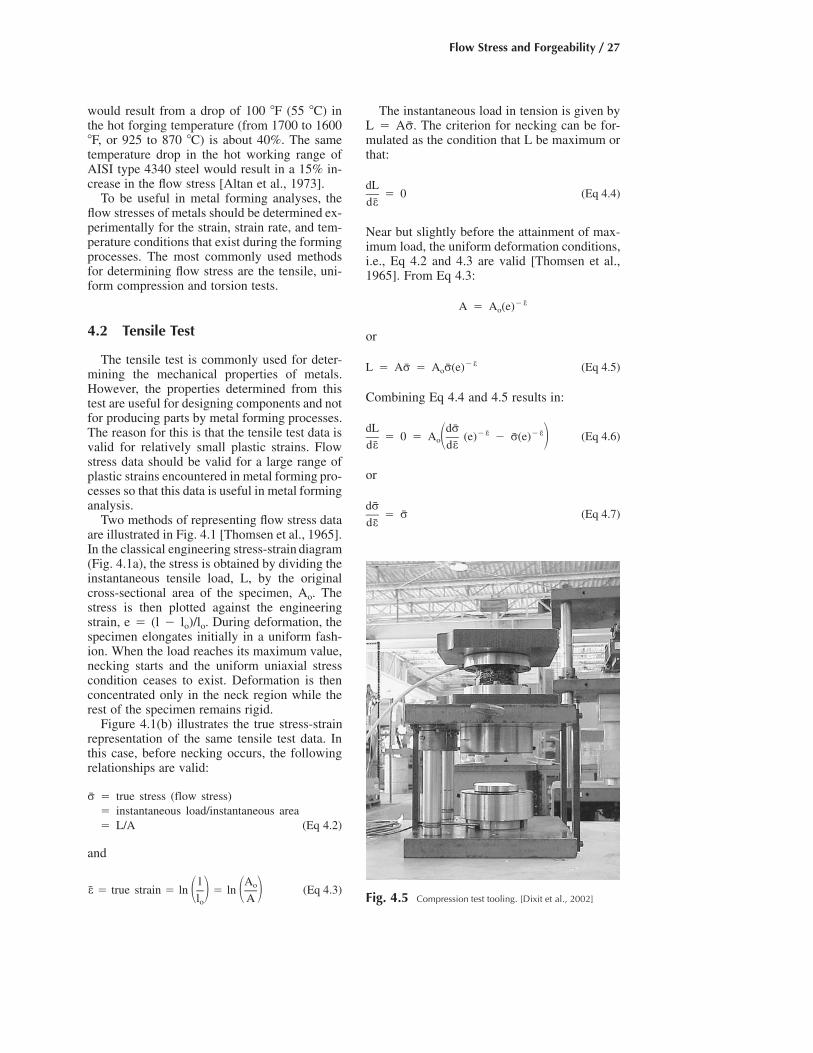
Flow Stress and Forgeability / 27
would result from a drop of 100 �F (55 �C) inthe hot forging temperature (from 1700 to 1600�F, or 925 to 870 �C) is about 40%. The sametemperature drop in the hot working range ofAISI type 4340 steel would result in a 15% in-crease in the flow stress [Altan et al., 1973].
To be useful in metal forming analyses, theflow stresses of metals should be determined ex-perimentally for the strain, strain rate, and tem-perature conditions that exist during the formingprocesses. The most commonly used methodsfor determining flow stress are the tensile, uni-form compression and torsion tests.
4.2 Tensile Test
The tensile test is commonly used for deter-mining the mechanical properties of metals.However, the properties determined from thistest are useful for designing components and notfor producing parts by metal forming processes.The reason for this is that the tensile test data isvalid for relatively small plastic strains. Flowstress data should be valid for a large range ofplastic strains encountered in metal forming pro-cesses so that this data is useful in metal forminganalysis.
Two methods of representing flow stress dataare illustrated in Fig. 4.1 [Thomsen et al., 1965].In the classical engineering stress-strain diagram(Fig. 4.1a), the stress is obtained by dividing theinstantaneous tensile load, L, by the originalcross-sectional area of the specimen, Ao. Thestress is then plotted against the engineeringstrain, e � (l � lo)/lo. During deformation, thespecimen elongates initially in a uniform fash-ion. When the load reaches its maximum value,necking starts and the uniform uniaxial stresscondition ceases to exist. Deformation is thenconcentrated only in the neck region while therest of the specimen remains rigid.
Figure 4.1(b) illustrates the true stress-strainrepresentation of the same tensile test data. Inthis case, before necking occurs, the followingrelationships are valid:
r � true stress (flow stress)� instantaneous load/instantaneous area� L/A (Eq 4.2)
and
l Aoe � true strain � ln � ln (Eq 4.3)� � � �l Ao
The instantaneous load in tension is given byL � The criterion for necking can be for-Ar.mulated as the condition that L be maximum orthat:
dL� 0 (Eq 4.4)
de
Near but slightly before the attainment of max-imum load, the uniform deformation conditions,i.e., Eq 4.2 and 4.3 are valid [Thomsen et al.,1965]. From Eq 4.3:
�eA � A (e)o
or
�eL � Ar � A r(e) (Eq 4.5)o
Combining Eq 4.4 and 4.5 results in:
dL dr �e �e� 0 � A (e) � r(e) (Eq 4.6)o� �de de
or
dr� r (Eq 4.7)
de
Fig. 4.5 Compression test tooling. [Dixit et al., 2002]

28 / Cold and Hot Forging: Fundamentals and Applications
As is discussed later, very often the flow stresscurve obtained at room temperature can be ex-pressed in the form of an exponential equationor power law:
nr � K(e) (Eq 4.8)
where K and n are constants.
Combining Eq 4.7 and 4.8 results in:
dr n�1 n� Kn(e) � r � K(e) (Eq 4.9)de
or
e � n (Eq 4.10)
Fig. 4.6 Dimensions of the specimens used for flow stress determination using the compression test at the ERC/NSM. (a) Specimenwith spiral groove. (b) Rastegaev specimen. [Dahl et al., 1999]

Flow Stress and Forgeability / 29
This condition is shown schematically in Fig.4.2. From this figure and from Eq 4.10, it is evi-dent that at low forming temperatures, where Eq4.8 is valid, a material with a large n or strainhardening exponent, has greater formability; i.e.,it sustains a large amount of uniform deforma-tion in tension than a material with a smaller n.It should be noted, however, that this statementis not correct for materials and conditions wherethe flow stress cannot be expressed by Eq 4.8.
The calculation of true stress after the neckingstrain (Fig. 4.1b) requires a correction becausea triaxial state of stress is induced. Such a cor-rection, derived by Bridgman, is given by:
�1L 2R rr � r � 1 � ln 1 �s 2 �� � � ��pr r 2R
(Eq 4.11)
The quantities r and R are defined in Fig. 4.3. Itcan be clearly seen that, for evaluation of Eq4.11, the values of r and R must be measuredcontinuously during the test. This is quite cum-bersome and prone to error. Therefore, othertests, which provide the true stress-strain data atlarger strains relative to the tensile test, are usedfor metal forming applications.
4.3 Compression Test
The compression test is used to determine theflow stress data (true-stress/true-strain relation-ships) for metals at various temperatures andstrain rates. In this test, the flat platens and thecylindrical sample are maintained at the sametemperature so that die chilling, with its influ-ence on metal flow, is prevented. To be appli-cable without corrections or errors, the cylin-drical sample must be upset without anybarreling; i.e., the state of uniform stress in thesample must be maintained as shown in Fig.4.4. Barreling is prevented by using adequatelubrication, e.g., Teflon or machine oil at roomtemperature and at hot working temperatures,graphite in oil for aluminum alloys, and glassfor steel, titanium, and high-temperature alloys.The load and displacement, or sample height,are measured during the test. From this infor-mation the flow stress is calculated at eachstage of deformation, or for increasing strain.Figure 4.5 shows the tooling used for compres-sion tests conducted at the Engineering Re-search Center for Net Shape Manufacturing(ERC/NSM) of the Ohio State University [Dixitet al., 2002].
Fig. 4.7 Load-displacement curve obtained in uniform upsetting of annealed 1100 aluminum cylinders. [Lee et al., 1972]

30 / Cold and Hot Forging: Fundamentals and Applications
Similar to the uniform elongation portion ofthe tensile test, the following relationships arevalid for the uniform compression test:
h Aoe � ln � ln (Eq 4.12)h Ao
Lr � (Eq 4.13)
A
eA � A (e) (Eq 4.14)o
de dh V˙e � � � (Eq 4.15)dt hdt h
where V is instantaneous deformation velocity;ho and h are initial and instantaneous heights,respectively, and Ao and A are initial and in-stantaneous surface areas, respectively.
As discussed earlier the flow stress values de-termined at high strains in the tensile test requirea correction because of necking. Therefore, thecompression test, which can be conducted with-out barreling up to about 50% reduction inheight � 0.693 or more), is widely used to(e
obtain flow stress data for metal forming appli-cations.
At room temperature, the flow stresses ofmost metals (except that of lead) are onlyslightly strain-rate dependent. Therefore, anytesting machine or press can be used for thecompression test, regardless of its ram speed.Adequate lubrication of the platens is usuallyaccomplished by (a) using lubricants such as Tef-lon, molybdenum disulfide, or high-viscosity oiland (b) by using Rastegaev specimens (Fig. 4.6)or specimens with spiral grooves machined onboth the flat surfaces of the specimen to hold thelubricant (Fig. 4.6). A typical load-displacementcurve obtained in the uniform compression testof aluminum alloy (Al 1100, annealed) at roomtemperature in a testing machine is shown in Fig.4.7. The data obtained from this curve arer-eshown in Fig. 4.8.
At hot working temperatures, i.e., above therecrystallization temperature, the flow stressesof nearly all metals are very much strain-ratedependent. Therefore, whenever possible, hotcompression tests are conducted on a machinethat provides a velocity-displacement profilesuch that the condition � velocity/sample˙e
Fig. 4.8 Flow stress-strain curve for annealed 1100 aluminum obtained from uniform cylinder and ring upset tests. [Lee et al., 1972]
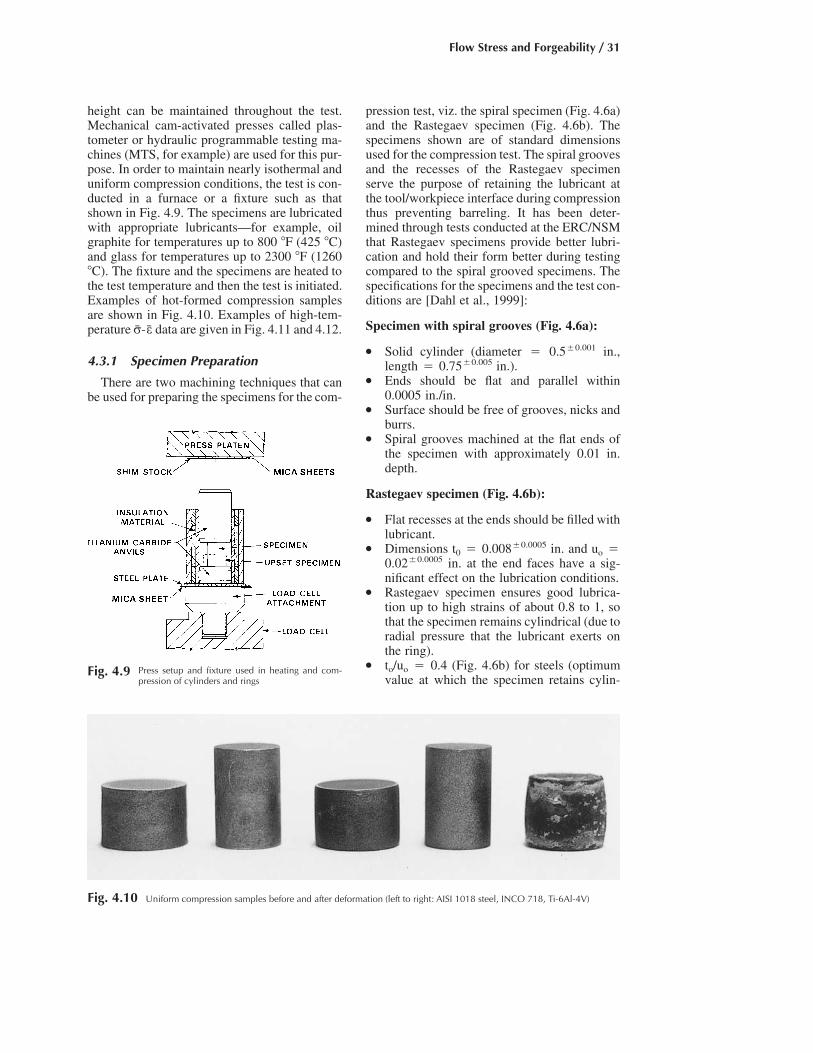
Flow Stress and Forgeability / 31
Fig. 4.9 Press setup and fixture used in heating and com-pression of cylinders and rings
Fig. 4.10 Uniform compression samples before and after deformation (left to right: AISI 1018 steel, INCO 718, Ti-6Al-4V)
height can be maintained throughout the test.Mechanical cam-activated presses called plas-tometer or hydraulic programmable testing ma-chines (MTS, for example) are used for this pur-pose. In order to maintain nearly isothermal anduniform compression conditions, the test is con-ducted in a furnace or a fixture such as thatshown in Fig. 4.9. The specimens are lubricatedwith appropriate lubricants—for example, oilgraphite for temperatures up to 800 �F (425 �C)and glass for temperatures up to 2300 �F (1260�C). The fixture and the specimens are heated tothe test temperature and then the test is initiated.Examples of hot-formed compression samplesare shown in Fig. 4.10. Examples of high-tem-perature data are given in Fig. 4.11 and 4.12.r-e
4.3.1 Specimen Preparation
There are two machining techniques that canbe used for preparing the specimens for the com-
pression test, viz. the spiral specimen (Fig. 4.6a)and the Rastegaev specimen (Fig. 4.6b). Thespecimens shown are of standard dimensionsused for the compression test. The spiral groovesand the recesses of the Rastegaev specimenserve the purpose of retaining the lubricant atthe tool/workpiece interface during compressionthus preventing barreling. It has been deter-mined through tests conducted at the ERC/NSMthat Rastegaev specimens provide better lubri-cation and hold their form better during testingcompared to the spiral grooved specimens. Thespecifications for the specimens and the test con-ditions are [Dahl et al., 1999]:
Specimen with spiral grooves (Fig. 4.6a):
● Solid cylinder (diameter � 0.5�0.001 in.,length � 0.75�0.005 in.).
● Ends should be flat and parallel within0.0005 in./in.
● Surface should be free of grooves, nicks andburrs.
● Spiral grooves machined at the flat ends ofthe specimen with approximately 0.01 in.depth.
Rastegaev specimen (Fig. 4.6b):
● Flat recesses at the ends should be filled withlubricant.
● Dimensions t0 � 0.008�0.0005 in. and uo �0.02�0.0005 in. at the end faces have a sig-nificant effect on the lubrication conditions.
● Rastegaev specimen ensures good lubrica-tion up to high strains of about 0.8 to 1, sothat the specimen remains cylindrical (due toradial pressure that the lubricant exerts onthe ring).
● to/uo � 0.4 (Fig. 4.6b) for steels (optimumvalue at which the specimen retains cylin-
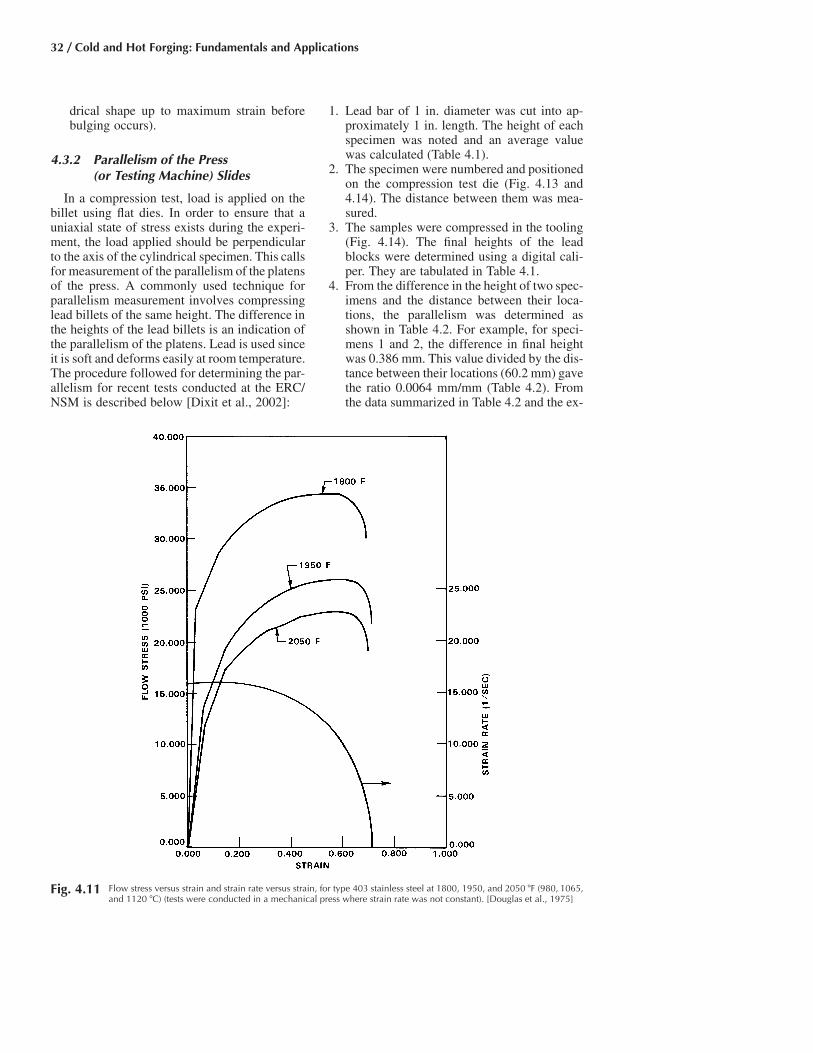
32 / Cold and Hot Forging: Fundamentals and Applications
Fig. 4.11 Flow stress versus strain and strain rate versus strain, for type 403 stainless steel at 1800, 1950, and 2050 �F (980, 1065,and 1120 �C) (tests were conducted in a mechanical press where strain rate was not constant). [Douglas et al., 1975]
drical shape up to maximum strain beforebulging occurs).
4.3.2 Parallelism of the Press(or Testing Machine) Slides
In a compression test, load is applied on thebillet using flat dies. In order to ensure that auniaxial state of stress exists during the experi-ment, the load applied should be perpendicularto the axis of the cylindrical specimen. This callsfor measurement of the parallelism of the platensof the press. A commonly used technique forparallelism measurement involves compressinglead billets of the same height. The difference inthe heights of the lead billets is an indication ofthe parallelism of the platens. Lead is used sinceit is soft and deforms easily at room temperature.The procedure followed for determining the par-allelism for recent tests conducted at the ERC/NSM is described below [Dixit et al., 2002]:
1. Lead bar of 1 in. diameter was cut into ap-proximately 1 in. length. The height of eachspecimen was noted and an average valuewas calculated (Table 4.1).
2. The specimen were numbered and positionedon the compression test die (Fig. 4.13 and4.14). The distance between them was mea-sured.
3. The samples were compressed in the tooling(Fig. 4.14). The final heights of the leadblocks were determined using a digital cali-per. They are tabulated in Table 4.1.
4. From the difference in the height of two spec-imens and the distance between their loca-tions, the parallelism was determined asshown in Table 4.2. For example, for speci-mens 1 and 2, the difference in final heightwas 0.386 mm. This value divided by the dis-tance between their locations (60.2 mm) gavethe ratio 0.0064 mm/mm (Table 4.2). Fromthe data summarized in Table 4.2 and the ex-
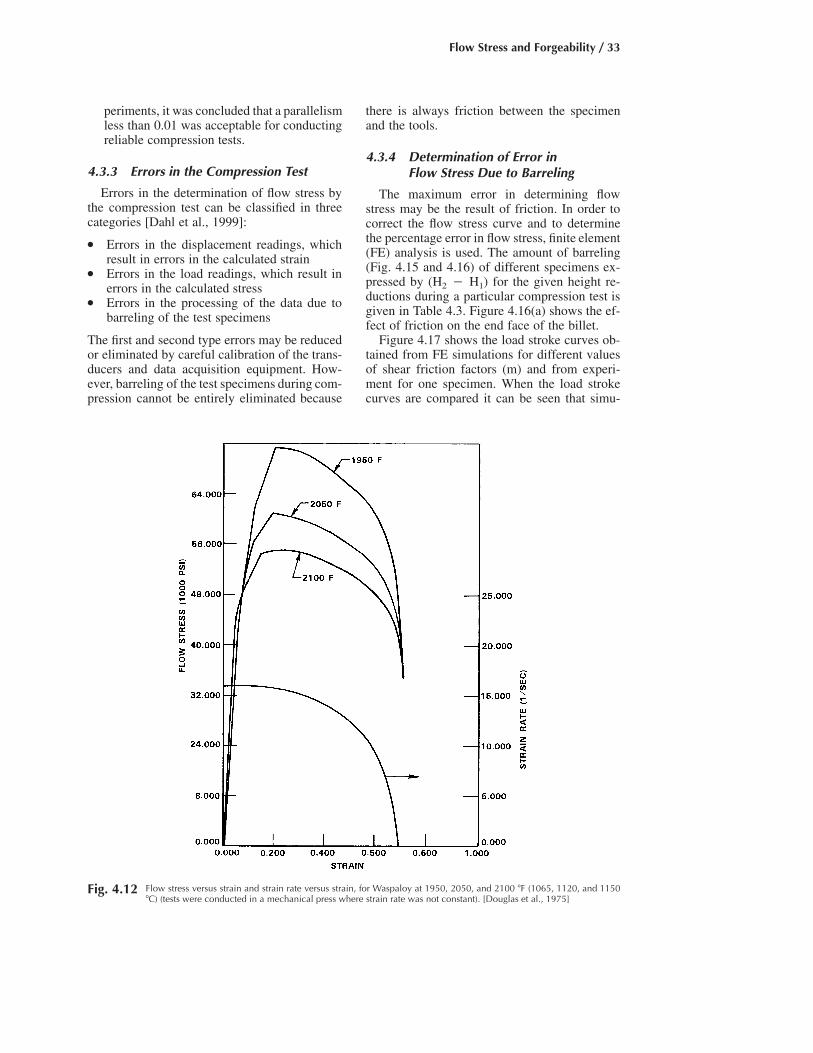
Flow Stress and Forgeability / 33
Fig. 4.12 Flow stress versus strain and strain rate versus strain, for Waspaloy at 1950, 2050, and 2100 �F (1065, 1120, and 1150�C) (tests were conducted in a mechanical press where strain rate was not constant). [Douglas et al., 1975]
periments, it was concluded that a parallelismless than 0.01 was acceptable for conductingreliable compression tests.
4.3.3 Errors in the Compression Test
Errors in the determination of flow stress bythe compression test can be classified in threecategories [Dahl et al., 1999]:
● Errors in the displacement readings, whichresult in errors in the calculated strain
● Errors in the load readings, which result inerrors in the calculated stress
● Errors in the processing of the data due tobarreling of the test specimens
The first and second type errors may be reducedor eliminated by careful calibration of the trans-ducers and data acquisition equipment. How-ever, barreling of the test specimens during com-pression cannot be entirely eliminated because
there is always friction between the specimenand the tools.
4.3.4 Determination of Error inFlow Stress Due to Barreling
The maximum error in determining flowstress may be the result of friction. In order tocorrect the flow stress curve and to determinethe percentage error in flow stress, finite element(FE) analysis is used. The amount of barreling(Fig. 4.15 and 4.16) of different specimens ex-pressed by (H2 � H1) for the given height re-ductions during a particular compression test isgiven in Table 4.3. Figure 4.16(a) shows the ef-fect of friction on the end face of the billet.
Figure 4.17 shows the load stroke curves ob-tained from FE simulations for different valuesof shear friction factors (m) and from experi-ment for one specimen. When the load strokecurves are compared it can be seen that simu-
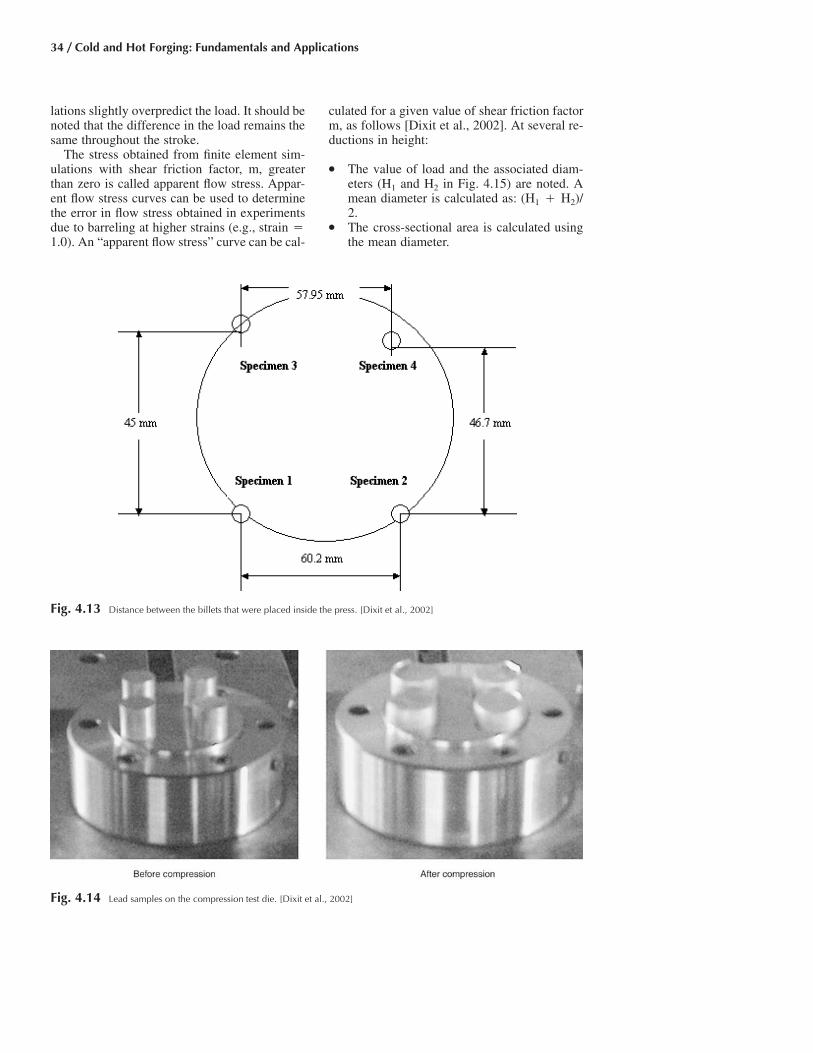
34 / Cold and Hot Forging: Fundamentals and Applications
lations slightly overpredict the load. It should benoted that the difference in the load remains thesame throughout the stroke.
The stress obtained from finite element sim-ulations with shear friction factor, m, greaterthan zero is called apparent flow stress. Appar-ent flow stress curves can be used to determinethe error in flow stress obtained in experimentsdue to barreling at higher strains (e.g., strain �1.0). An “apparent flow stress” curve can be cal-
culated for a given value of shear friction factorm, as follows [Dixit et al., 2002]. At several re-ductions in height:
● The value of load and the associated diam-eters (H1 and H2 in Fig. 4.15) are noted. Amean diameter is calculated as: (H1 � H2)/2.
● The cross-sectional area is calculated usingthe mean diameter.
Fig. 4.14 Lead samples on the compression test die. [Dixit et al., 2002]
Fig. 4.13 Distance between the billets that were placed inside the press. [Dixit et al., 2002]

Flow Stress and Forgeability / 35
Table 4.2 Parallelism between different pointsthat are shown in Fig. 4.13
Parallelism between points 1 and 2 (mm/mm) 0.0064Parallelism between points 2 and 4 (mm/mm) 0.0080Parallelism between points 3 and 4 (mm/mm) 0.0019Parallelism between points 3 and 1 (mm/mm) 0.0145Parallelism between points 1 and 4 (mm/mm) 0.0096Parallelism between points 2 and 3 (mm/mm) 0.0035
Source: [Dixit et al., 2002]
Table 4.1 Height of the lead specimens used in tests conducted at the ERC/NSM
Specimen No. 1 Specimen No. 2 Specimen No. 3 Specimen No. 4
Initial height, in. (mm)
0.9933 (25.23) 1.0071 (25.58) 1.0181 (25.86) 1.0185 (25.87)0.9894 (25.13) 1.0075 (25.59) 1.0157 (25.8) 1.0197 (25.9)0.9929 (25.22) 1.0071 (25.58) 1.0169 (25.83) 1.0236 (26)0.9913 (25.18) 1.0075 (25.59) 1.0177 (25.85) 1.0232 (25.99)0.9937 (25.24) 1.0067 (25.57) 1.0169 (25.83) 1.0217 (25.95)
Average 0.992 (25.2) 1.0072 (25.582) 1.0171 (25.834) 1.0213 (25.942)
Final height, in. (mm)
0.5594 (14.21) 0.5594 (14.21) 0.5591 (14.2) 0.5591 (14.2)0.5610 (14.22) 0.5610 (14.22) 0.5587 (14.19) 0.5587 (14.19)0.5610 (14.22) 0.5594 (14.21) 0.5594 (14.21) 0.5594 (14.21)
Average 0.5597 (14.217) 0.5596 (14.213) 0.5591 (14.2) 0.5591 (14.2)Difference in height 0.4324 (10.983) 0.4476 (11.369) 0.4580 (11.634) 0.4623 (11.742)
Source: [Dixit et al., 2002]
● The “apparent stress” is calculated using theload at that height reduction and cross-sec-tional area (� Load/Area).
● The value of strain is calculated as loge(original height/instantaneous height).
● A particular value of shear friction factor, m,results in an “apparent flow stress” that ishigher in magnitude than the value obtainedwith zero friction. A graph of stress versusstrain plotted for different values of shearfriction factor m can be drawn as shown inFig. 4.18. As the value of m increases, the“apparent flow stress” increases.
● The barreling of the specimen at a strain of1.0 is noted down.
The “apparent flow stress” curves obtainedabove can be used to calculate the error in flowstress obtained due to nonhomogenous defor-mation (barreling) during the tests at a strain of1.0 as follows:
1. Conduct cylinder compression tests until astrain of 1.0.
2. Determine the amount of barreling in thespecimen at a strain of 1.0.
3. By comparing the barreling of the actualspecimen with the “apparent flow stress”curves given in Fig. 4.18, the value of stressin the experiments can be noted.
4. Thus, the error in flow stress obtained froman experiment can be calculated with respectto the stress in the curve with m � 0 (Fig.4.18) as a percentage value at a strain of 1.0.
If needed, the “apparent flow stress” curves canbe generated for higher strains and the procedurecan be repeated for estimating stress at that par-ticular higher strain.
4.4 Ring Test
The ring test consists of compressing a flatring shaped specimen to a known reduction (Fig.4.19). The changes in the external and internaldiameters of the ring are very much dependenton the friction at the tool/specimen interface[Lee et al., 1972]. If the friction were equal tozero, the ring would deform in the same way asa solid disk, with each element flowing radiallyoutward at a rate proportional to its distancefrom the center. With increasing deformation,the internal diameter of the ring is reduced iffriction is large and is increased if friction is low.Thus, the change in the internal diameter rep-resents a simple method for evaluating interfacefriction. This method of estimating the frictionfactor using the ring test is discussed in detail ina later chapter.
The ring test can also be used for determiningdata for practical applications. For this pur-r-e
pose it is necessary to perform an analysis or amathematical simulation of the ring test. Thissimulation allows the prediction of a load-strokecurve, if the and the friction are unknown.r-eInversely, by using this mathematical model ofthe ring test, it is possible to calculate the r-ecurve if the load-stroke curve and the frictionare known.
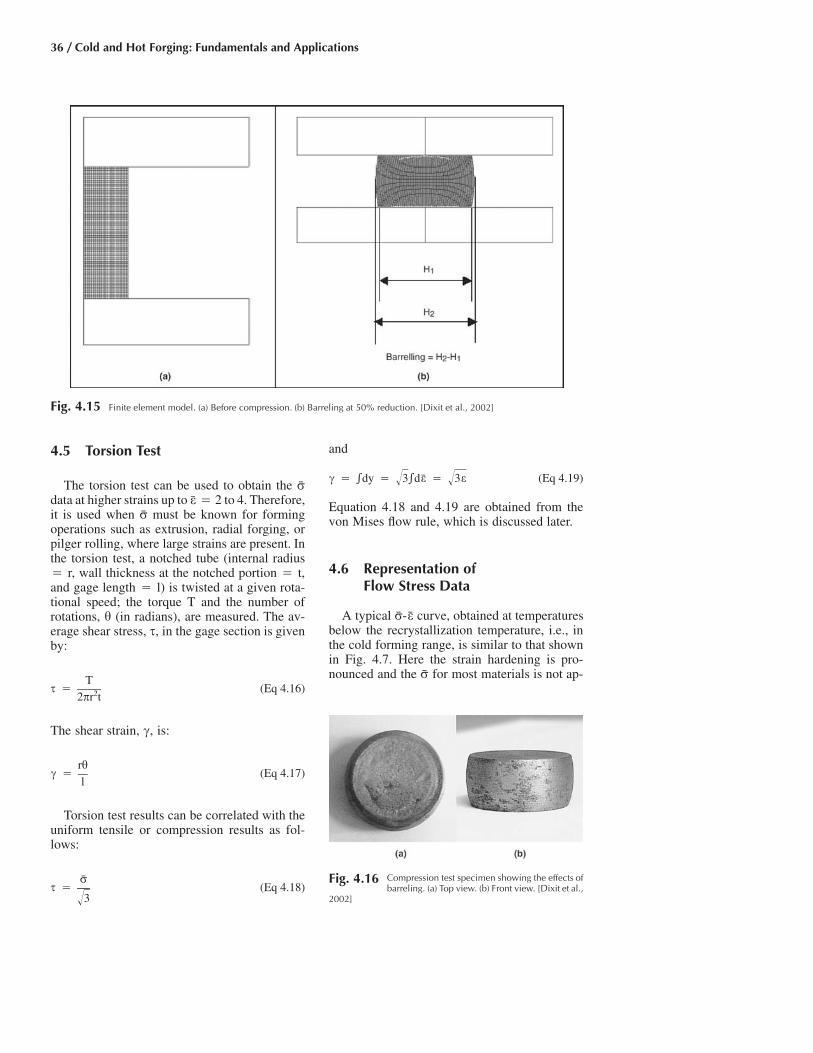
36 / Cold and Hot Forging: Fundamentals and Applications
Fig. 4.16 Compression test specimen showing the effects ofbarreling. (a) Top view. (b) Front view. [Dixit et al.,
2002]
Fig. 4.15 Finite element model. (a) Before compression. (b) Barreling at 50% reduction. [Dixit et al., 2002]
4.5 Torsion Test
The torsion test can be used to obtain the rdata at higher strains up to � 2 to 4. Therefore,eit is used when must be known for formingroperations such as extrusion, radial forging, orpilger rolling, where large strains are present. Inthe torsion test, a notched tube (internal radius� r, wall thickness at the notched portion � t,and gage length � l) is twisted at a given rota-tional speed; the torque T and the number ofrotations, h (in radians), are measured. The av-erage shear stress, s, in the gage section is givenby:
Ts � (Eq 4.16)22pr t
The shear strain, c, is:
rhc � (Eq 4.17)
l
Torsion test results can be correlated with theuniform tensile or compression results as fol-lows:
rs � (Eq 4.18)
3�
and
c � �dy � 3�de � 3e (Eq 4.19)� �
Equation 4.18 and 4.19 are obtained from thevon Mises flow rule, which is discussed later.
4.6 Representation ofFlow Stress Data
A typical curve, obtained at temperaturesr-ebelow the recrystallization temperature, i.e., inthe cold forming range, is similar to that shownin Fig. 4.7. Here the strain hardening is pro-nounced and the for most materials is not ap-r
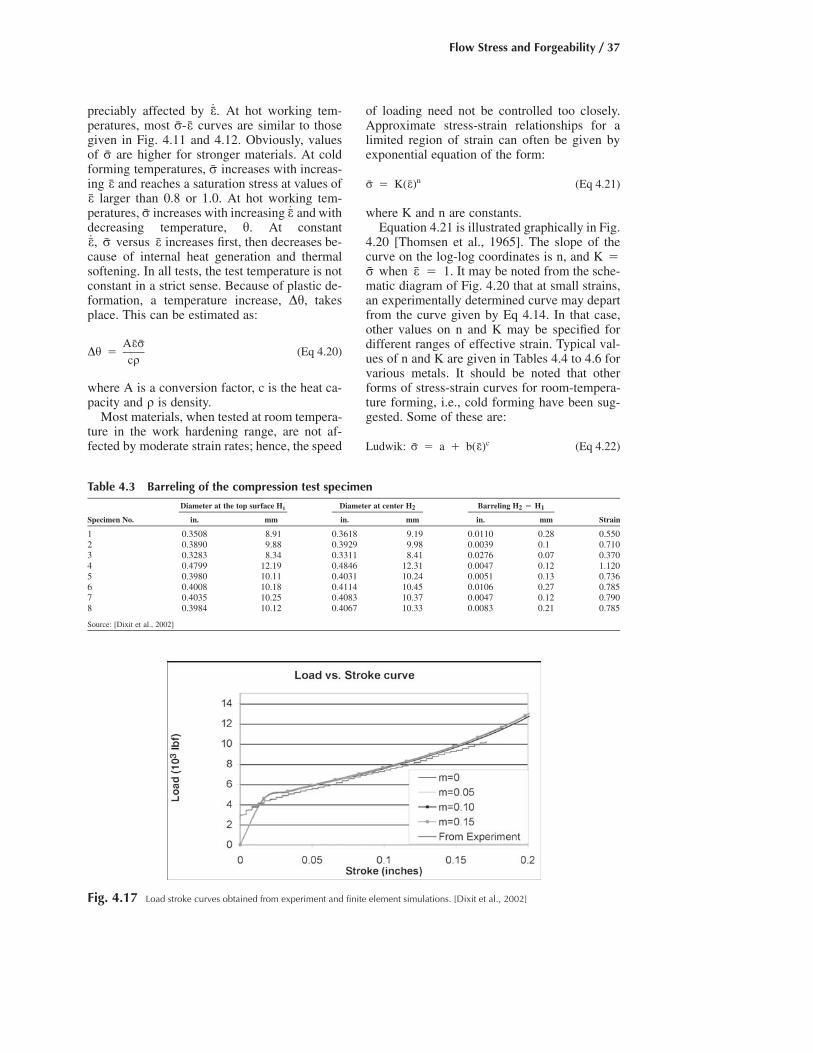
Flow Stress and Forgeability / 37
Fig. 4.17 Load stroke curves obtained from experiment and finite element simulations. [Dixit et al., 2002]
Table 4.3 Barreling of the compression test specimen
Diameter at the top surface H1 Diameter at center H2 Barreling H2 � H1
Specimen No. in. mm in. mm in. mm Strain
1 0.3508 8.91 0.3618 9.19 0.0110 0.28 0.5502 0.3890 9.88 0.3929 9.98 0.0039 0.1 0.7103 0.3283 8.34 0.3311 8.41 0.0276 0.07 0.3704 0.4799 12.19 0.4846 12.31 0.0047 0.12 1.1205 0.3980 10.11 0.4031 10.24 0.0051 0.13 0.7366 0.4008 10.18 0.4114 10.45 0.0106 0.27 0.7857 0.4035 10.25 0.4083 10.37 0.0047 0.12 0.7908 0.3984 10.12 0.4067 10.33 0.0083 0.21 0.785
Source: [Dixit et al., 2002]
preciably affected by At hot working tem-˙e.peratures, most curves are similar to thoser-egiven in Fig. 4.11 and 4.12. Obviously, valuesof are higher for stronger materials. At coldrforming temperatures, increases with increas-ring and reaches a saturation stress at values ofe
larger than 0.8 or 1.0. At hot working tem-eperatures, increases with increasing and with˙r edecreasing temperature, h. At constant
increases first, then decreases be-˙e, r versus ecause of internal heat generation and thermalsoftening. In all tests, the test temperature is notconstant in a strict sense. Because of plastic de-formation, a temperature increase, Dh, takesplace. This can be estimated as:
AerDh � (Eq 4.20)
cq
where A is a conversion factor, c is the heat ca-pacity and q is density.
Most materials, when tested at room tempera-ture in the work hardening range, are not af-fected by moderate strain rates; hence, the speed
of loading need not be controlled too closely.Approximate stress-strain relationships for alimited region of strain can often be given byexponential equation of the form:
nr � K(e) (Eq 4.21)
where K and n are constants.Equation 4.21 is illustrated graphically in Fig.
4.20 [Thomsen et al., 1965]. The slope of thecurve on the log-log coordinates is n, and K �
It may be noted from the sche-r when e � 1.matic diagram of Fig. 4.20 that at small strains,an experimentally determined curve may departfrom the curve given by Eq 4.14. In that case,other values on n and K may be specified fordifferent ranges of effective strain. Typical val-ues of n and K are given in Tables 4.4 to 4.6 forvarious metals. It should be noted that otherforms of stress-strain curves for room-tempera-ture forming, i.e., cold forming have been sug-gested. Some of these are:
cLudwik: r � a � b(e) (Eq 4.22)

38 / Cold and Hot Forging: Fundamentals and Applications
Fig. 4.19 The ring test. (a) Schematic of metal flow. (b) Example rings upset to various reductions in height
Fig. 4.18 Apparent flow stress for curves for tested specimens. [Dixit et al., 2002]
where a, b, and c are arbitrary constants. Thisform approximates the stress-strain curves forannealed materials, but tends to underestimate
the stress where strains are small (�0.2) and tooverestimate the actual stress for larger strains.For heavily prestrained materials, c � 1.

Flow Stress and Forgeability / 39
Table 4.4 Summary of K and n values describing the flow stress-strain relation, fornr � K(e) ,various steels
Composition(a), % Material
Tempera-ture
Strainrate, Strain K,
Steel C Mn P S Si N Al V Ni Cr Mo W history(b) F C 1/s range 103 psi n
Armcoiron
0.02 0.03 0.021 0.010 Tr A 68 20 (c) 0.1–0.7 88.2 0.25
1006 0.06 0.29 0.02 0.042 Tr 0.004 A 68 20 (c) 0.1–0.7 89.6 0.311008 0.08 0.36 0.023 0.031 0.06 0.007 A 68 20 (c) 0.1–0.7 95.3 0.24
0.07 0.28 0.27 A 68 20 (c) 0.1–0.7 95.3 0.171010 0.13 0.31 0.010 0.022 0.23 0.004 A 68 20 (c) 0.1–0.7 103.8 0.221015 0.15 0.40 0.01 0.016 Tr F,A 32 0 30 0.2–0.7 91.4 0.1161015 0.15 0.40 0.01 0.016 Tr F,A 390 200 30 0.2–0.6 73.7 0.1401015(d) 0.15 0.40 0.045 0.045 0.25 A 68 20 1.6 113.8 0.101015(d) 0.15 0.40 0.045 0.045 0.25 A 572 300 1.6 115.2 0.111020 0.22 0.44 0.017 0.043 Tr 0.005 A 68 20 (c) 0.1–0.7 108.1 0.201035 0.36 0.69 0.025 0.032 0.27 0.004 A 68 20 (c) 0.1–0.7 130.8 0.17
A 68 20 1.6 139.4 0.11A 572 300 1.6 122.3 0.16
1045(d) 0.45 0.65 0.045 0.045 0.25 A 68 20 1.6 147.9 0.11A 68 20 1.5 137.9 0.14A 572 300 1.6 126.6 0.15
1050(e) 0.51 0.55 0.016 0.041 0.28 0.0062 0.03 A 68 20 (c) 0.1–0.7 140.8 0.161060 A 68 20 1.6 163.5 0.09
A 68 20 1.5 157.8 0.122317(e) 0.19 0.55 0.057 0.023 0.26 0.016 A 68 20 (c) 0.2–1.0 111.2 0.1705115 0.14 0.53 0.028 0.027 0.37 0.71 A 68 20 (c) 0.1–0.7 115.2 0.18
A 68 20 1.6 123.7 0.09A 572 300 1.6 102.4 0.15
5120(e) 0.18 1.13 0.019 0.023 0.27 0.86 A 68 20 (c) 0.1–0.7 126.6 0.18A 68 20 1.6 116.6 0.09A 572 300 1.6 98.1 0.16
5140 0.41 0.67 0.04 0.019 0.35 1.07 A 68 20 (c) 0.1–0.7 125.1 0.15A 68 20 1.6 133.7 0.09A 572 300 1.6 112.3 0.12
D2 toolsteel(e)
1.60 0.45 0.24 0.46 11.70 0.75 0.59 A 68 20 (c) 0.2–1.0 191.0 0.157
L6 toolsteel
0.56 0.14 1.60 1.21 0.47 A 68 20 (c) 0.2–1.0 170.2 0.128
W1-1.0Cspecial
1.05 0.21 0.16 A 68 20 (c) 0.2–1.0 135.6 0.179
302 SS 0.08 1.06 0.037 0.005 0.49 9.16 18.37 HR,A 32 0 10 0.25–0.7 186.7 0.295HR,A 390 200 30 0.25–0.7 120.8 0.278HR,A 750 400 30 0.25–0.7 92.7 0.279
302 SS 0.053 1.08 0.027 0.015 0.27 10.2 17.8 A 68 20 (c) 0.1–0.7 210.5 0.6304 SS(e) 0.030 1.05 0.023 0.014 0.47 10.6 18.7 A 68 20 (c) 0.1–0.7 210.5 0.6316 SS 0.055 0.92 0.030 0.008 0.49 12.9 18.1 2.05 A 68 20 (c) 0.1–0.7 182.0 0.59410 SS 0.093 0.31 0.026 0.012 0.33 13.8 A 68 20 (c) 0.1–0.7 119.4 0.2
A 68 20 1.6 137.9 0.09431 SS 0.23 0.38 0.020 0.006 0.42 1.72 16.32 A 68 20 (c) 0.1–0.7 189.1 0.11
(a) Tr � trace. (b) A � annealed, F � forged, HR � hot rolled. (c) Low-speed testing machine; no specific rate given. (d) Composition given is nominal (analysisnot given in original reference). (e) Approximate composition.
Voce: r � a � [b � a]*[1 � exp(�ce)](Eq 4.23)
This gives a good fit, but is not suitable for usein analysis because of its complexity.
nSwift: r � c(a � e) (Eq 4.24)
This is a more realistic equation than Eq 4.21.However, algebraic manipulations resultingfrom such an expression may be difficult.
For strain-rate-sensitive materials, the mostcommonly used expression is:
m˙r � C(e) (Eq 4.25)
The coefficients C and m of this curve would beobtained at various temperatures and strains, sothat C and m would have different values at agiven temperature for various strains. As ex-amples, C and m values for some metals aregiven in Tables 4.7 through 4.11 [Altan et al.,1973]. For predicting forces and stresses in prac-tical forming operations, very often it is suffi-cient to specify an average or maximum valueof to be used in equations for predicting thermaximum forming load. In such practical cases,use of a constant average value for is justified.rIf are not accurately known, then the˙e and e

40 / Cold and Hot Forging: Fundamentals and Applications
Table 4.5 Summary of K and n values describing the flow stress-strain relation, � fornr K(e) ,various aluminum alloys
Composition, % Material
Tempera-ture
Strainrate, Strain K,
Alloy Al Cu Si Fe Mn Mg Zn Ti Cr Pb history(a) F C 1/s range 103 psi n
1100 99.0 0.10 0.15 0.50 0.01 0.01 CD,A 32 0 10 0.25–0.7 25.2 0.3041100 Rem 0.01 0.10 0.16 0.01 0.01 0.03 A 68 20 (b) 0.2–1.0 17.3 0.297EC 99.5 0.01 0.092 0.23 0.026 0.033 0.01 A(c) 68 20 4 0.2–0.8 22.4 0.2042017 Rem 4.04 0.70 0.45 0.55 0.76 0.22 0.06 A 68 20 (b) 0.2–1.0 45.2 0.1802024(d) Rem 4.48 0.60 0.46 0.87 1.12 0.20 0.056 A 68 20 (b) 0.2–1.0 56.1 0.1545052 Rem 0.068 0.10 0.19 0.04 2.74 0.01 0.003 A(e) 68 20 4 0.2–0.8 29.4 0.1345052(d) Rem 0.09 0.13 0.16 0.23 2.50 0.05 A 68 20 (b) 0.2–1.0 55.6 0.1895056 Rem 0.036 0.15 0.22 0.04 4.83 0.01 0.14 A(e) 68 20 4 0.2–0.7 57.0 0.1305083 Rem 0.01 0.10 0.16 0.77 4.41 0.01 0.002 0.13 A 68 20 4 0.2–0.8 65.2 0.1315454 Rem 0.065 0.12 0.18 0.81 2.45 �0.01 0.002 A(e) 68 20 4 0.2–0.8 49.9 0.1376062 Rem 0.03 0.63 0.20 0.63 0.68 0.065 0.08 68 20 (b) 0.2–1.0 29.7 0.122
(a) CD � cold drawn, A � annealed. (b) Low-speed testing machine; no specific rate given. (c) Annealed for 4 h at 752 F (400 C). (d) Approximate composition. (e)Annealed for 4 h at 788 F (420 C)
Fig. 4.20 Effective stress versus effective strain curve in log-log scale
value of C in Eq 4.25 may be used as an ap-proximation for Such values for hot workingr.temperatures are given for a few materials inTables 4.12 and 4.13 [Douglas et al., 1975]. Thedata given in Table 4.10 were obtained from uni-form isothermal compression tests, whereas that
in Table 4.13 were obtained from nonisothermalring tests. In these tests the ring dimensions arealso important, because the average ring speci-men temperature varies during the test and isinfluenced by the heat transfer and thickness ofthe ring.
Table 4.6 Summary of K and n values describing the flow stress-strain relation, fornr � K(e) ,various copper alloys
Composition(b), %Tempera-
ture MaterialStrainrate, Strain K,
Alloy(a) Cu Si Fe Sb Sn Zn S Pb Ni F C history(c) 1/s range 103 psi n
CDA110 99.94 0.0025 0.0003 0.0012 0.0012 0.001 64 18 HR,A 2.5 0.25–0.7 65.5 0.328CDA110 68 20 F (d) 0.2–1.0 54.0 0.275CDA230 84.3 15.7 68 20 A (d) 0.2–1.0 76.7 0.373CDA260 70.8 29.2 68 20 A (d) 0.2–1.0 98.1 0.412CDA260 70.05 Tr Tr Rem 390 200 HR,A 0.25–0.7 71.7 0.414CDA272 63.3 36.7 68 20 A (d) 0.2–1.0 103.9 0.394CDA377 58.6 Tr 39.6 1.7 68 20 A (d) 0.2–1.0 115.3 0.334CDA521(e) 91.0 9.0 68 20 F (d) 0.2–1.0 130.8 0.486CDA647 97.0 0.5 2.0 68 20 F (d) 0.2–1.0 67.2 0.282CDA757 65.1 22.4 �0.05 12.4 68 20 A (d) 0.2–1.0 101.8 0.401CDA794 61.7 Tr 20.6 Tr 17.5 68 20 A (d) 0.2–1.0 107.0 0.336
(a) CDA � Copper Development Association. (b) Tr � trace. (c) HR � hot rolled, A � annealed, F � forged. (d) Low-speed testing machine; no specific rate given.(e) Approximate composition.

Flow Stress and Forgeability / 41
Table 4.7 Summary of C (ksi) and m values describing the flow stress-strain rate relation, r �
for steels at various temperatures (C is in 103 psi)m˙C(e) ,
SteelMaterialhistory
Strain raterange, 1/s Strain C m C m C m C m C m
Test temperature, F (C): 1110 (600) 1470 (800) 1830 (1000) 2190 (1200)
1015 Forged, 0.2–30 0.2 36.8 0.1120.15 C, trace Si, 0.40 annealed 0.25 19.9 0.105 17.0 0.045 7.2 0.137Mn, 0.01 P, 0.016 S 0.4 40.6 0.131
0.5 21.5 0.104 18.8 0.058 6.8 0.1690.6 40.0 0.1210.7 39.5 0.114 21.1 0.109 18.3 0.068 5.7 0.181
Test temperature, F (C): 1650 (900) 1830 (1000) 2010 (1100) 2190 (1200)
1016 Hot rolled, 1.5–100 0.10 16.6 0.092 13.4 0.100 9.9 0.124 7.5 0.1430.15 C, 0.12 Si, 0.68 annealed 0.30 22.7 0.082 18.2 0.085 13.3 0.115 9.4 0.153Mn, 0.034 S, 0.025 P 0.50 23.7 0.087 18.2 0.105 12.7 0.146 8.5 0.191
0.70 23.1 0.099 16.1 0.147 11.9 0.166 7.5 0.2181016 Hot rolled, 0.05 11.8 0.133 10.7 0.124 9.0 0.117 6.4 0.150
0.15 C, 0.12 Si, 0.68 annealed 0.1 16.5 0.099 13.7 0.099 9.7 0.130 7.1 0.157Mn, 0.034 S, 0.025 P 0.2 20.8 0.082 16.5 0.090 12.1 0.119 9.1 0.140
0.3 22.8 0.085 18.2 0.088 13.4 0.109 9.5 0.1480.4 23.0 0.084 18.2 0.098 12.9 0.126 9.1 0.1640.5 23.9 0.088 18.1 0.109 12.5 0.141 8.2 0.1890.6 23.3 0.097 16.9 0.127 12.1 0.156 7.8 0.2050.7 22.8 0.104 17.1 0.127 12.4 0.151 8.1 0.196
Test temperature, F (C): 1600 (870) 1800 (980) 2000 (1090) 2200 (1205) 2150 (1180)
1018 25.2 0.07 15.8 0.152 11.0 0.192 9.2 0.201025 Forged, 3.5–30 0.25 33.7 0.004 16.2 0.075 9.3 0.077
0.25 C, 0.08 Si, 0.45 annealed 0.50 41.4 �0.032 17.2 0.080 9.6 0.094Mn, 0.012 P, 0.025 S 0.70 41.6 �0.032 17.5 0.082 8.8 0.105
1043 Hot rolled,asreceived
0.1–100 0.3/0.5/0.7 10.8 0.21
Test temperature, F (C): 1650 (900) 1830 (1000) 2010 (1100) 2190 (1200)
1045(a) 0.05 25.4 0.080 15.1 0.089 11.2 0.100 8.0 0.1750.46 C, 0.29 Si, 0.73 0.10 28.9 0.082 18.8 0.103 13.5 0.125 9.4 0.168Mn, 0.018 P, 0.021 S, 0.20 33.3 0.086 22.8 0.108 15.4 0.128 10.5 0.1670.08 Cr, 0.01 Mo, 0.30 35.4 0.083 24.6 0.110 15.8 0.162 10.8 0.1800.04 Ni 0.40 35.4 0.105 24.7 0.134 15.5 0.173 10.8 0.188
Test temperature, F (C): 1110 (600) 1470 (800) 1830 (1000) 2190 (1200)
1055 Forged, 3.5–30 29.4 0.087 14.9 0.126 7.4 0.1450.55 C, 0.24 Si, 0.73 annealed 32.5 0.076 13.3 0.191 7.4 0.178Mn, 0.014 P, 0.016 S 32.7 0.066 11.5 0.237 6.4 0.229
Test temperature, F (C): 1650 (900) 1830 (1000) 2010 (1100) 2190 (1200)
1060(a) Hot rolled, 1.5–100 0.10 18.5 0.127 13.3 0.143 10.1 0.147 7.4 0.1720.56 C, 0.26 Si, 0.28 annealed 0.30 23.3 0.114 16.9 0.123 12.6 0.135 8.9 0.158Mn, 0.014 S, 0.013 P, 0.50 23.3 0.118 16.4 0.139 12.0 0.158 8.6 0.1800.12 Cr, 0.09 Ni 0.70 21.3 0.132 14.9 0.161 10.4 0.193 7.8 0.207
1060(a) 0.05 16.2 0.128 10.8 0.168 8.7 0.161 6.5 0.1900.56 C, 0.26 Si, 0.28 0.10 18.3 0.127 13.2 0.145 10.1 0.149 7.5 0.165Mn, 0.014 S, 0.013 0.20 21.8 0.119 16.1 0.125 12.1 0.126 8.5 0.157P, 0.12 Cr, 0.09 Ni 0.30 23.3 0.114 17.1 0.125 12.8 0.132 8.8 0.164
0.40 23.7 0.112 16.8 0.128 12.5 0.146 8.8 0.1710.50 23.6 0.110 16.6 0.133 12.7 0.143 8.7 0.1760.60 22.8 0.129 17.1 0.127 11.7 0.169 8.4 0.1890.70 21.3 0.129 16.2 0.138 10.7 0.181 7.8 0.204
1095(a) Hot rolled, 1.5–100 0.10 18.3 0.146 13.9 0.143 9.8 0.159 7.1 0.184100 C, 0.19 Si, 0.17 annealed 0.30 21.9 0.133 16.6 0.132 11.7 0.147 8.0 0.183Mn, 0.027 S, 0.023 0.50 21.8 0.130 15.7 0.151 10.6 0.176 7.3 0.209P, 0.10 Cr, 0.09 Ni 0.70 21.0 0.128 13.6 0.179 9.7 0.191 6.5 0.232
Test temperature, F (C): 1705 (930) 1830 (1000) 1940 (1060) 2075 (1135) 2190 (1200)
1115 Hot rolled, 4.4–23.1 0.105 16.3 0.088 13.0 0.108 10.9 0.112 9.1 0.123 7.6 0.1160.17 C, 0.153 Si, 0.62 as 0.223 19.4 0.084 15.6 0.100 12.9 0.107 10.5 0.129 8.6 0.122Mn, 0.054 S, 0.032 P received 0.338 20.4 0.094 17.3 0.090 14.0 0.117 11.2 0.138 8.8 0.141
0.512 20.9 0.099 18.0 0.093 14.4 0.127 11.0 0.159 8.3 0.1730.695 20.9 0.105 16.9 0.122 13.6 0.150 9.9 0.198 7.6 0.196
(continued)
(a) Approximate composition.

42 / Cold and Hot Forging: Fundamentals and Applications
Table 4.7 (continued)
SteelMaterialhistory
Strain raterange, 1/s Strain C m C m C m C m C m
Test temperature, F (C): 1650 (900) 1830 (1000) 2010 (1100) 2190 (1200)
Alloy steel 0.05 16.6 0.102 12.2 0.125 9.4 0.150 7.4 0.1610.35 C, 0.27 Si, 1.49 0.10 19.9 0.091 14.8 0.111 11.5 0.121 8.1 0.149Mn, 0.041 S, 0.037 0.20 23.0 0.094 17.6 0.094 13.5 0.100 9.4 0.139P, 0.03 Cr, 0.11 Ni, 0.30 24.9 0.092 19.1 0.093 14.4 0.105 10.2 0.1300.28 Mo 0.40 26.0 0.088 19.6 0.095 14.5 0.112 10.4 0.139
0.50 25.9 0.091 19.6 0.100 14.4 0.112 10.1 0.1470.60 25.9 0.094 19.5 0.105 14.2 0.122 9.7 0.1590.70 25.5 0.099 19.2 0.107 13.9 0.126 9.2 0.165
4337(a) Hot rolled, 1.5–100 0.10 22.1 0.080 16.6 0.109 12.1 0.115 8.2 0.1650.35 C, 0.27 Si, 0.66 annealed 0.30 28.1 0.077 20.8 0.098 15.0 0.111 10.7 0.138Mn, 0.023 S, 0.029 0.50 29.2 0.075 21.8 0.096 15.7 0.112 11.3 0.133P, 0.59 Cr, 2.45 Ni, 0.70 28.1 0.080 21.3 0.102 15.5 0.122 11.3 0.1350.59 Mo
926(a) Hot rolled, 1.5–100 0.10 22.9 0.109 17.1 0.106 11.8 0.152 8.6 0.1680.61 C, 1.58 Si, 0.94 annealed 0.30 28.2 0.101 20.4 0.106 14.3 0.140 10.1 0.162Mn, 0.038 S, 0.035 0.50 27.8 0.104 20.0 0.120 13.8 0.154 9.1 0.193P, 0.12 Cr, 0.27 Ni, 0.70 25.8 0.112 18.2 0.146 11.8 0.179 7.5 0.2350.06 Mo
50100(a) 0.05 16.1 0.155 12.4 0.155 8.2 0.175 6.3 0.1991.00 C, 0.19 Si, 0.17 0.10 18.6 0.145 14.1 0.142 9.5 0.164 6.8 0.191Mn, 0.027 S, 0.023 0.20 20.9 0.135 15.9 0.131 11.4 0.141 8.1 0.167P, 0.10 Cr, 0.09 Ni 0.30 21.8 0.135 16.6 0.134 11.7 0.142 8.0 0.174
0.40 22.0 0.134 16.8 0.134 11.2 0.155 8.4 0.1640.50 21.5 0.131 15.6 0.150 11.1 0.158 7.4 0.1990.60 21.3 0.132 14.6 0.163 10.0 0.184 7.0 0.2120.70 20.9 0.131 13.5 0.176 9.7 0.183 6.7 0.220
52100 Hot rolled, 1.5–100 0.10 20.9 0.123 14.3 0.146 9.5 0.169 6.7 0.2031.06 C, 0.22 Si, 0.46 annealed 0.30 25.5 0.107 17.7 0.127 12.0 0.143 8.3 0.171Mn, 0.019 S, 0.031 0.50 25.9 0.107 17.7 0.129 12.3 0.143 8.3 0.178P, 1.41 Cr, 0.17 Ni 0.70 23.3 0.131 16.8 0.134 12.0 0.148 7.7 0.192
Test temperature, F(C): 1650 (900) 1830 (1000) 2010 (1100) 2190 (1200)
Mn-Si steel 0.05 19.2 0.117 14.8 0.119 9.7 0.172 7.5 0.1810.61 C, 1.58 Si, 0.94 0.10 22.6 0.112 17.1 0.108 11.8 0.151 8.7 0.166Mn, 0.038 S, 0.035 0.20 25.7 0.108 19.5 0.101 13.5 0.139 9.7 0.160P, 0.12 Cr, 0.27 Ni, 0.30 27.6 0.108 20.5 0.109 14.8 0.126 10.0 0.1610.06 Mo 0.40 27.6 0.114 20.2 0.114 14.4 0.141 9.5 0.179
0.50 27.2 0.113 19.8 0.125 14.1 0.144 9.1 0.1880.60 26.0 0.121 18.8 0.137 12.8 0.162 8.2 0.2090.70 24.7 0.130 17.8 0.152 11.9 0.178 7.5 0.228
Cr-Si steel 0.05 19.9 0.118 23.9 0.104 15.1 0.167 10.0 0.2060.47 C, 3.74 Si, 0.58 0.10 19.9 0.136 25.6 0.120 16.8 0.162 11.1 0.189Mn, 8.20 Cr 20 Ni 0.20 19.9 0.143 27.6 0.121 18.5 0.153 11.9 0.184
0.30 19.9 0.144 28.4 0.119 19.1 0.148 12.1 0.1820.40 19.3 0.150 28.2 0.125 18.9 0.150 12.1 0.1780.50 18.5 0.155 26.6 0.132 18.5 0.155 11.8 0.1820.60 17.5 0.160 25.2 0.142 17.5 0.160 11.5 0.1820.70 16.1 0.163 23.3 0.158 16.1 0.162 10.7 0.199
D3(a) Hot rolled, 1.5–100 0.10 39.2 0.087 29.0 0.108 21.0 0.123 14.6 0.1212.23 C, 0.43 Si, 0.37 annealed 0.30 43.7 0.087 30.4 0.114 21.0 0.139 13.9 0.130Mn, 13.10 Cr, 0.33 0.50 39.7 0.101 27.1 0.125 18.4 0.155 12.2 0.124Ni 0.70 33.3 0.131 22.5 0.145 15.3 0.168 10.7 0.108
Test temperature, F (C): 1290 (700) 1510 (820) 1650 (900) 1830 (1000)
H-13 290–906 0.1 19.1 0.232 10.2 0.305 6.0 0.373 4.8 0.3740.39 C, 1.02 Si, 0.60 0.2 30.1 0.179 13.7 0.275 8.2 0.341 9.0 0.295Mn, 0.016 P, 0.020 0.3 31.0 0.179 15.1 0.265 10.8 0.305 11.6 0.267S, 5.29 Cr, 0.04 Ni, 0.4 25.9 0.204 12.3 0.295 12.5 0.287 11.8 0.2691.35 Mo, 0.027 N,0.83 V
Test temperature, F (C): 1650 (900) 1830 (1000) 2010 (1100) 2190 (1200)
H-26(a) Hot rolled, 1.5–100 0.10 46.7 0.058 37.4 0.072 26.2 0.106 18.7 0.1250.80 C, 0.28 Si, 0.32 annealed 0.30 49.6 0.075 38.1 0.087 26.0 0.121 18.3 0.140Mn, 4.30 Cr, 0.18 0.50 44.6 0.096 33.7 0.102 23.6 0.131 16.2 0.151Ni, 0.55 Mo, 18.40 0.70 39.1 0.115 27.9 0.124 20.1 0.149 13.8 0.162W, 1.54 V
(continued)
(a) Approximate composition.

Flow Stress and Forgeability / 43
Table 4.7 (continued)
SteelMaterialhistory
Strain raterange, 1/s Strain C m C m C m C m C m
Test temperature, F (C): 1110 (600) 1470 (800) 1830 (1000) 2190 (1200)
301 SS(a) Hot rolled, 0.8–100 0.25 40.5 0.051 16.3 0.117 7.6 0.1610.08 C, 0.93 Si, 1.10 annealed 0.50 39.3 0.062 17.8 0.108 7.6 0.177Mn, 0.009 P, 0.014 0.70 37.8 0.069 17.4 0.102 6.6 0.192S, 16.99 Cr, 6.96 Ni,0.31 Mo, 0.93 Al.0.02 N, 0.063 Se
302 SS Hot rolled, 310–460 0.25 26.5 0.147 25.1 0.129 11.0 0.206 4.6 0.2810.07 C, 0.71 Si, 1.07 annealed 0.40 31.3 0.153 30.0 0.121 13.5 0.188 4.7 0.284Mn, 0.03 P, 0.005 0.60 17.5 0.270 45.4 0.063 16.8 0.161 4.1 0.310S, 18.34 Cr, 9.56 Ni
302 SS Hot rolled, 0.2–30 0.25 52.2 0.031 36.6 0.042 23.1 0.040 12.8 0.0820.08 C, 0.49 Si, 1.06 annealed 0.40 58.9 0.022 40.4 0.032 24.7 0.050 13.6 0.083Mn, 0.037 P, 0.005 0.60 63.2 0.020 41.9 0.030 24.9 0.053 13.5 0.091S, 18.37 Cr, 9.16 0.70 64.0 0.023 42.0 0.031 24.7 0.052 13.4 0.096Ni
Test temperature, F (C): 1650 (900) 1830 (1000) 2010 (1100) 2190 (1200)
302 SS 1.5–100 0.05 24.6 0.023 16.8 0.079 13.7 0.093 9.7 0.1390.07 C, 0.43 Si, 0.48 0.10 28.4 0.026 21.2 0.068 15.6 0.091 11.1 0.127Mn, 18.60 Cr, 7.70 0.20 33.6 0.031 25.2 0.067 18.1 0.089 12.5 0.120Ni 0.30 35.3 0.042 26.3 0.074 19.5 0.089 13.5 0.115
0.40 35.6 0.055 26.9 0.084 19.9 0.094 14.2 0.1100.50 35.6 0.060 27.0 0.093 19.6 0.098 14.2 0.1150.60 34.1 0.068 26.4 0.092 19.3 0.102 13.8 0.1180.70 33.6 0.072 25.7 0.102 18.9 0.108 13.9 0.120
Test temperature, F (C): 1110 (600) 1470 (800) 1830 (1000) 2190 (1200) 1650 (900)
309 SS Hot drawn, 200–525 0.25 39.4 0.079 8.7 0.1840.13 C, 0.42 Si, 1.30 annealed 0.40 45.1 0.074 9.6 0.178Mn, 0.023 P, 0.008 0.60 48.1 0.076 9.5 0.185S, 22.30 Cr, 12.99 Ni
310 SS Hot drawn, 310–460 0.25 50.3 0.080 32.3 0.127 27.5 0.101 12.0 0.1540.12 C, 1.26 Si, 1.56 annealed 0.40 56.5 0.080 32.2 0.142 22.8 0.143 10.8 0.175Mn, 0.01 P, 0.009 0.60 61.8 0.067 21.9 0.212 9.7 0.284 4.5 0.326S, 25.49 Cr, 21.28 Ni
316 SS Hot drawn, 310–460 0.25 13.5 0.263 22.2 0.149 6.4 0.317 8.0 0.2040.06 C, 0.52 Si, 1.40 annealed 0.40 28.8 0.162 26.8 0.138 3.7 0.435 7.4 0.227Mn, 0.035 P, 0.005 0.60 39.3 0.128 30.1 0.133 6.1 0.365 6.5 0.254S, 17.25 Cr, 12.23 Ni,2.17 Mo
403 SS Hot rolled, 0.8–100 0.25 26.3 0.079 15.4 0.125 7.3 0.1570.16 C, 0.37 Si, 0.44 annealed 0.50 26.9 0.076 16.0 0.142 7.8 0.152Mn, 0.024 P, 0.007 0.70 24.6 0.090 15.3 0.158 7.5 0.155S, 12.62 Cr
SS Hot rolled, 0.8–100 0.25 28.7 0.082 17.2 0.082 11.9 0.0790.12 C, 0.12 Si, 0.29 annealed 0.50 29.1 0.093 20.7 0.073 11.6 0.117Mn, 0.014 P, 0.016 0.70 28.7 0.096 22.5 0.067 11.2 0.131S, 12.11 Cr, 0.50 Ni,0.45 Mo
SS Hot rolled, 3.5–30 0.25 19.5 0.099 8.9 0.128 28.3 0.1140.08 C, 0.45 Si, 0.43 annealed 0.50 22.3 0.097 9.5 0.145 34.9 0.105Mn, 0.031 P, 0.005 0.70 23.2 0.098 9.2 0.158 37.1 0.107S, 17.38 Cr, 0.31 Ni
Test temperature, F (C): 1600 (870) 1700 (925) 1800 (980) 2000 (1095) 2100 (1150)
Maraging 300 43.4 0.077 36.4 0.095 30.6 0.113 21.5 0.145 18.0 0.165
Test temperature, F (C): 2200 (1205)
Maraging 300 12.8 0.185
(a) Approximate composition.

44 / Cold and Hot Forging: Fundamentals and Applications
Table 4.8 Summary of C (ksi) and m values describing the flow stress-strain rate relation, � m˙r C(e) ,for aluminum alloys at various temperatures
Alloy Material historyStrain raterange, 1/s Strain C m C m C m C m C m
Test temperature, F (C): 390 (200) 570 (300) 750 (400) 930 (500) 1110 (600)
Super-pure Cold rolled, 0.4–31199.98 Al, 0.0017 Cu, annealed 1/2 h 0.288 5.7 0.110 4.3 0.120 2.8 0.140 1.6 0.155 0.6 0.2300.0026 Si, 0.0033 Fe, at 1110 F 2.88 8.7 0.050 4.9 0.095 2.8 0.125 1.6 0.175 0.6 0.2150.006 Mn
Test temperature, F (C): 465 (240) 645 (360) 825 (480)
EC Annealed 3h at 0.25–630.01 Cu, 0.026 Mn, 750 F 0.20 10.9 0.066 5.9 0.141 3.4 0.1680.033 Mg, 0.092 Si, 0.40 12.3 0.069 6.3 0.146 3.3 0.1690.23 Fe, 0.01 Zn, 0.60 13.1 0.067 6.4 0.147 3.2 0.17399.5 Al 0.80 13.8 0.064 6.7 0.135 3.4 0.161
Test temperature, F (C): 390 (200) 750 (400) 930 (500)
1100 Cold drawn, 0.25–4099.0 Al (min), 0.10 annealed 0.25 9.9 0.066 4.2 0.115 2.1 0.211Cu, 0.15 Si, 0.50 Fe, 0.50 11.6 0.071 4.4 0.132 2.1 0.2270.01 Mn, 0.01 Mg 0.70 12.2 0.075 4.5 0.141 2.1 0.224
Test temperature, F (C): 300 (150) 480 (250) 660 (350) 840 (450) 1020 (550)
1100(a) Extruded, 4–400.10 Cu, 0.20 Si, 0.02 annealed 1 h 0.105 11.4 0.022 9.1 0.026 6.3 0.055 3.9 0.100 2.2 0.130Mn, 0.46 Fe, 0.01 Zn, at 750 F 0.223 13.5 0.022 10.5 0.031 6.9 0.061 4.3 0.098 2.4 0.130Rem Al 0.338 15.0 0.021 11.4 0.035 7.2 0.073 4.5 0.100 2.5 0.141
0.512 16.1 0.024 11.9 0.041 7.3 0.084 4.4 0.116 2.4 0.1560.695 17.0 0.026 12.3 0.041 7.4 0.088 4.3 0.130 2.4 0.155
Test temperature, F (C): 390 (200) 750 (400) 930 (500)
2017 Cold drawn, 0.2–3094.95 Al, 3.50 Cu, annealed 0.250 34.5 0.014 14.8 0.110 5.8 0.1260.10 Si, 0.50 Fe, 0.50 0.500 32.2 �0.025 13.2 0.121 5.2 0.121Mn, 0.45 Mg 0.700 29.5 �0.038 12.5 0.128 5.1 0.119
Test temperature, F (C): 570 (300) 660 (350) 750 (400) 840 (450) 930 (500)
2017(a) Solution treated 0.4–3110.89 Mg, 4.17 Cu, 1 h at 950 F, 0.115 10.8 0.695 9.1 0.100 7.5 0.110 6.2 0.145 5.1 0.1550.61 Si, 0.41 Fe, 0.80 water 2.660 10.0 0.100 9.2 0.100 7.7 0.080 6.8 0.090 4.6 0.155Mn, 0.052 Zn, 0.01Pb, 92.9 Al
quenchedannealed 4 hat 750 F
Test temperature, F (C): 465 (240) 645 (360) 825 (480)
5052 Annealed 3 h at 0.25–630.068 Cu, 0.04 Mn, 790 F 0.20 14.3 0.038 8.9 0.067 5.6 0.1252.74 Mg, 0.10 Si, 0.40 15.9 0.035 9.3 0.071 5.3 0.1300.19 Fe, 0.01 Zn, 0.60 16.8 0.035 9.0 0.068 5.1 0.1340.003 Ti, Rem Al 0.80 17.5 0.038 9.4 0.068 5.6 0.125
5056 Annealed 3 h at 0.25–630.036 Cu, 0.04 Mn, 790 F 0.20 42.6 �0.032 20.9 0.138 11.7 0.2004.83 Mg, 0.15 Si, 0.40 44.0 �0.032 20.8 0.138 10.5 0.2050.22 Fe, 0.01 Zn, 0.60 44.9 �0.031 19.9 0.143 10.3 0.2020.14 Cr, Rem Al 0.70 45.6 �0.034 20.3 0.144 10.3 0.203
5083 Annealed 3 h at 0.25–630.01 Cu, 0.77 Mn, 790 F 0.20 43.6 �0.006 20.5 0.095 9.3 0.1824.41 Mg, 0.10 Si, 0.40 43.6 �0.001 19.7 0.108 8.3 0.2080.16 Fe, 0.01 Zn, 0.60 41.9 0.003 18.8 0.111 8.5 0.2010.13 Cr, 0.002 Ti, 0.80 40.2 0.002 19.1 0.105 9.7 0.161Rem Al
5454 Annealed 3 h at 0.25–630.065 Cu, 0.81 Mn, 790 F 0.20 33.6 �0.005 16.8 0.093 10.8 0.1822.45 Mg, 0.12 Si, 0.40 36.0 �0.009 16.3 0.104 10.7 0.1880.18 Fe, �0.01 Zn, 0.60 36.9 �0.009 16.0 0.102 10.0 0.1910.002 Ti, Rem Al 0.80 37.0 �0.009 16.2 0.097 10.2 0.183
Test temperature, F (C): 750 (400) 840 (450) 930 (500) 1020 (550)
7075(a) Solution treated 0.4–31189.6 Al, 1.31 Cu, 1 h at 870 F, 0.115 10.0 0.090 6.0 0.135 3.9 0.150 2.9 0.1702.21 Mg, 0.21 Si, water 2.66 9.7 0.115 6.2 0.120 4.8 0.115 2.7 0.1150.30 Fe, 0.34 Mn,5.75 Zn, 0.01 Pb
quenched,aged at 285 Ffor 16 h
(a) Approximate composition.

Flow Stress and Forgeability / 45
Table 4.9 Summary of C (ksi) and m values describing the flow stress-strain rate relation, � m˙r C(e) ,for copper alloys at various temperatures
Alloy Material historyStrain raterange, 1/s Strain C m C m C m C m C m
Test temperature, F (C): 570 (300) 840 (450) 1110 (600) 1380 (750) 1650 (900)
Copper Cold drawn, 4–40 0.105 20.2 0.016 17.0 0.010 12.7 0.050 7.6 0.096 4.7 0.1340.018 P, 0.0010 Ni, annealed 2 h 0.223 26.5 0.018 22.5 0.004 16.8 0.043 9.7 0.097 6.3 0.1100.0003 Sn, 0.0002 Sb, at 1110 F 0.338 30.2 0.017 25.1 0.008 18.9 0.041 10.0 0.128 6.1 0.1540.0005 Pb 0.0010 Fe, 0.512 32.2 0.025 26.6 0.014 19.4 0.056 8.5 0.186 5.5 0.1950.0020 Mn �0.0005 0.695 34.4 0.024 26.8 0.031 19.0 0.078 8.2 0.182 5.2 0.190Mg, �0.0005 As,�0.0001 Bi, 0.0014S, less than 0.003 O2,Se � Te not detected
Test temperature, F (C): 800 (427)
OFHC Copper 26.7 0.0413
Test temperature, F (C): 750 (400) 930 (500) 1110 (600)
CDA 110 Hot rolled, 0.25–40 0.25 23.0 0.046 12.9 0.136 6.6 0.16099.94 Cu, 0.0003 Sb, annealed 0.50 27.4 0.049 13.7 0.150 6.9 0.1680.0012 Pb 0.0012 S, 0.70 28.8 0.057 13.3 0.165 6.8 0.1760.0025 Fe, 0.001 Ni
Test temperature, F (C): 390 (200) 750 (400) 1110 (600) 1470 (800)
CDA 220 Extruded, cold 0.1–10 0.25 41.0 0.017 34.1 0.018 22.6 0.061 11.2 0.13490.06 Cu, 0.033 Fe, drawn 30%; 0.50 46.7 0.029 39.9 0.032 24.4 0.084 11.0 0.1560.004 Pb, 0.003 Sn, annealed 650 0.70 48.1 0.034 40.7 0.024 24.6 0.086 11.4 0.140Rem Zn C, 90 min
CDA 260 Hot rolled, 3.5–30 0.25 34.9 0.036 16.0 0.194 7.1 0.14470.05 Cu, trace Fe � annealed 0.50 42.3 0.031 14.8 0.237 7.0 0.148Sn, Rem Zn 0.70 42.4 0.045 14.3 0.228 6.3 0.151
CDA 280 Hot rolled, 3.5–30 0.25 49.0 0.028 26.9 0.083 7.6 0.189 3.1 0.22860.44 Cu, 0.01 Pb, annealed 0.50 58.6 0.027 28.6 0.075 5.4 0.281 2.8 0.2390.02 Fe, trace Sn, 0.70 60.3 0.027 26.7 0.081 4.7 0.291 2.7 0.220Rem Zn
CDA 365 Hot rolled, 3.5–30 0.25 45.8 0.038 28.6 0.065 9.8 0.106 2.4 0.16659.78 Cu, 0.90 Pb, annealed 0.50 57.2 0.032 28.9 0.085 8.5 0.137 2.1 0.1970.02 Fe, trace Sn, 0.70 59.1 0.035 26.6 0.078 8.4 0.113 1.8 0.222Rem Zn

46 / Cold and Hot Forging: Fundamentals and Applications
Table 4.10 Summary of C (ksi) and m values describing the flow stress-strain rate relation, �r
for titanium alloys at various temperaturesm˙C(e) ,
AlloyMaterialhistory
Strain raterange, 1/s Strain C m C m C m C m C m C m C m
Test temperature, F (C): 68 (20) 392 (200) 752 (400) 1112 (600) 1472 (800) 1652 (900) 1832 (1000)
Type 1 Annealed 0.25–16.0 0.2 92.8 0.029 60.9 0.046 39.8 0.074 25.3 0.097 12.8 0.167 5.4 0.230 3.0 0.3870.04 Fe, 0.02 15 min at 0.4 113.7 0.029 73.3 0.056 48.8 0.061 29.6 0.115 14.6 0.181 5.5 0.248 3.6 0.289C, 0.005 H2, 1200 F in 0.6 129.6 0.028 82.2 0.056 53.9 0.049 32.1 0.105 14.9 0.195 5.5 0.248 3.5 0.2890.01 N2, 0.04 high 0.8 142.5 0.027 87.7 0.058 56.3 0.042 32.7 0.099 15.4 0.180 5.9 0.186 3.2 0.264O2, Rem Ti vacuum 1.0 150.6 0.027 90.7 0.054 56.6 0.044 32.5 0.099 15.9 0.173 5.9 0.167 3.0 0.264
Type 2 Annealed 0.25–16.0 0.2 143.3 0.021 92.7 0.043 54.5 0.051 33.6 0.092 17.5 0.167 6.9 0.135 4.2 0.2200.15 Fe, 0.02 15 min at 0.4 173.2 0.021 112.1 0.042 63.1 0.047 36.3 0.101 18.4 0.190 7.2 0.151 4.9 0.167C, 0.005 H2, 1200 F in 0.6 193.8 0.024 125.3 0.045 65.6 0.047 36.9 0.104 18.4 0.190 7.8 0.138 4.5 0.1670.02 N2, 0.12 high 0.8 208.0 0.023 131.9 0.051 66.0 0.045 37.0 0.089 18.4 0.190 7.6 0.106 3.9 0.195O2, Rem Ti vacuum 1.0 216.8 0.023 134.8 0.056 65.3 0.045 36.9 0.092 18.6 0.190 6.8 0.097 3.7 0.167
Test temperature, F (C): 1110 (600) 1290 (700) 1470 (800) 1650 (900)
Unalloyed Hot rolled, 0.1–10 0.25 23.4 0.062 14.3 0.115 8.2 0.236 1.8 0.3240.03 Fe, annealed 0.50 27.9 0.066 17.8 0.111 10.0 0.242 2.1 0.3260.0084 N, 800 C, 0.70 30.1 0.065 20.0 0.098 12.2 0.185 2.5 0.3160.0025 H,Rem Ti
90 min
Test temperature, F (C): 68 (20) 392 (200) 752 (400) 1112 (600) 1472 (800) 1652 (900) 1832 (1000)
Ti-5Al-2.5 Sn Annealed 0.25–16.0 0.1 173.6 0.046 125.6 0.028 97.6 0.0285.1 Al, 2.5 Sn, 30 min at 0.2 197.9 0.048 138.8 0.022 107.4 0.026 86.1 0.025 58.5 0.034 44.2 0.069 5.4 0.3080.06 Fe, 0.03 1470 F in 0.3 215.6 0.046 147.4 0.021 112.5 0.027 92.8 0.020C, 0.01 H2, high 0.4 230.6 0.039 151.4 0.022 116.0 0.022 95.6 0.019 58.7 0.040 44.8 0.082 5.1 0.2940.03 N2, 0.1 vacuum 0.5 96.7 0.021O2, Rem Ti 0.6 96.6 0.024 55.6 0.042 43.0 0.078 5.2 0.264
0.8 50.2 0.033 39.1 0.073 5.2 0.2640.9 46.8 0.0251.0 35.2 0.056 5.3 0.280
Ti-6Al-4V Annealed 0.25–16.0 0.1 203.3 0.017 143.8 0.026 119.4 0.0256.4 Al, 4.0 V, 120 min 0.2 209.7 0.015 151.0 0.021 127.6 0.022 94.6 0.064 51.3 0.146 23.3 0.143 9.5 0.1310.14 Fe, 0.05 at 1200 F 0.3 206.0 0.015 152.0 0.017 126.2 0.017 91.2 0.073C, 0.01 H2, in high 0.4 118.7 0.014 84.6 0.079 39.8 0.175 21.4 0.147 9.4 0.1180.015 N2, 0.1 vacuum 0.5 77.9 0.080O2, Rem Ti 0.6 30.4 0.205 20.0 0.161 9.6 0.118
0.8 26.6 0.199 19.5 0.172 9.3 0.1540.9 24.9 0.2011.0 20.3 0.146 8.9 0.192
Test temperature, F (C): 1550 (843) 1750 (954) 1800 (982)
Ti-6Al-4V 38.0 0.064 12.3 0.24 9.4 0.29
Test temperature, F (C): 68 (20) 392 (200) 752 (400) 1112 (600) 1472 (800) 1652 (900) 1832 (1000)
Ti-13V-11Cr-3Al Annealed 0.25–16.0 0.1 173.1 0.0413.6 Al, 14.1 V, 30 min at 0.2 188.2 0.037 150.5 0.030 136.5 0.035 118.4 0.040 65.4 0.097 44.6 0.147 32.4 0.15310.6 Cr, 0.27 1290 F in 0.3 202.3 0.034Fe, 0.02 C, high 0.4 215.2 0.029 174.2 0.024 153.9 0.030 107.5 0.039 59.5 0.096 42.1 0.139 30.9 0.1420.014 H2, 0.03 vacuum 0.5 226.3 0.026 181.1 0.023N2, 0.11 O2, 0.6 183.5 0.026 147.9 0.046 92.8 0.045 56.7 0.088 40.9 0.127 29.2 0.155Rem Ti 0.7 181.4 0.029
0.8 136.3 0.045 84.7 0.036 53.9 0.081 39.3 0.125 27.8 0.1670.9 52.9 0.0801.0 38.8 0.127 28.0 0.159

Flow Stress and Forgeability / 47
Table 4.11 Summary of C (ksi) and m values describing the flow stress-strain rate relation, �r
for various materialsm˙C(e) ,
AlloyMaterialhistory
Strain raterange, 1/s Strain C m C m C m C m C m C m C m
Test temperature, F (C): 72 (22) 230 (110) 335 (170) 415 (215) 500 (260) 570 (300)
Lead 0.115 2.0 0.040 1.56 0.065 1.21 0.085 0.70 0.130 0.47 0.160 0.40 0.18099.98 Pb, 2.66 4.0 0.055 1.47 0.100 1.04 0.125 0.55 0.135 0.36 0.180 0.28 0.2250.003 Cu,0.003 Fe,0.002 Zn,0.002 Ag
Test temperature, F (C): 390 (200) 570 (300) 750 (400) 930 (400)
Magnesium Extruded, (13) (14) (13) (14)0.010 Al, cold 0.1–10 0.25 19.1 0.069 9.8 0.215 4.1 0.263 1.7 0.3370.003 Zn, drawn 0.50 17.2 0.093 8.4 0.211 4.0 0.234 1.7 0.3020.008 Mn, 15%, 0.70 15.5 0.094 8.3 0.152 4.3 0.215 2.1 0.2100.004 Si,0.003 Cu,0.0008 Ni,Rem Mg
annealed550 C 90min
Test temperature, F (C): 1975 (1080) 2030 (1166)
U-700 26.6 0.21 22.1 0.21
Test temperature, F (C): 68 (20) 392 (200) 752 (400) 1112 (600) 1472 (800) 1652 (900) 1832 (1000)
Zirconium Annealed 0.25–16.0 0.2 117.4 0.031 74.0 0.052 40.2 0.050 23.8 0.069 16.8 0.069 6.8 0.227 4.6 0.30199.8 Zr, 0.009 15 min at 0.3 143.7 0.022 92.2 0.058Hf, 0.008 Al, 1380 F in 0.4 159.5 0.017 105.1 0.046 54.4 0.085 29.4 0.09 18.2 0.116 7.1 0.252 4.0 0.3870.038 Fe, high 0.5 169.3 0.017 112.8 0.041 58.2 0.0930.0006 H2, vacuum 0.6 118.5 0.042 60.2 0.095 31.3 0.089 18.8 0.118 7.2 0.264 4.0 0.3870.0025 N2, 0.7 61.9 0.0950.0825 O2, 0.0 0.8 32.0 0.081 19.4 0.101 6.9 0.252 4.1 0.403Ni 1.0 32.1 0.085 19.7 0.108 6.9 0.252 4.1 0.403
Zircaloy 2 Annealed 0.25–16.0 0.1 96.8 0.031 65.9 0.04698.35 Zr, 15 min at 0.2 136.9 0.025 105.8 0.035 58.3 0.065 30.4 0.049 16.6 0.147 7.5 0.325 3.9 0.3620.015 Hf, 1.4 1380 F in 0.3 178.5 0.034 131.4 0.035 67.9 0.056Zn, 0.01 Al, high 0.4 202.7 0.027 145.4 0.036 73.5 0.056 37.8 0.053 18.7 0.172 7.8 0.342 4.0 0.3870.06 Fe, 0.045 vacuum 0.5 154.2 0.034 77.3 0.057Ni, 0.0006 H2, 0.6 79.9 0.055 39.2 0.059 18.8 0.178 7.2 0.387 4.0 0.3870.0023 N2, 0.8 40.4 0.057 18.8 0.178 7.9 0.342 4.8 0.3330.0765 O2 1.0 40.7 0.053 18.8 0.178 8.5 0.310 4.8 0.333
Test temperature, F (C): 68 (20) 212 (100) 392 (200) 572 (300) 932 (500) 1292 (900) 1652 (900)
Uranium Annealed 2 0.25–16.0 0.2 151.0 0.043 113.0 0.042 77.4 0.034 45.9 0.044 31.9 0.051 16.0 0.081 4.5 0.06999.8 U, hr at 0.4 173.9 0.033 132.7 0.049 91.0 0.031 53.3 0.047 33.1 0.059 16.1 0.089 4.5 0.0690.0012 Mn, 1110 F in 0.6 184.9 0.023 143.1 0.047 98.1 0.032 56.0 0.056 33.4 0.054 16.1 0.089 4.5 0.0690.0012 Ni, high 0.8 189.8 0.018 149.5 0.048 102.0 0.036 58.3 0.057 33.3 0.049 16.2 0.097 4.5 0.0690.00074 Cu, vacuum 1.0 59.0 0.056 32.5 0.055 16.4 0.097 4.5 0.0690.00072 Cr,0.0001 Co,0.0047 H2,0.0041 N2,0.1760 O2
(free ofcadmium andboron)

48 / Cold and Hot Forging: Fundamentals and Applications
Table 4.12 Average flow stress values determined in the uniform compression test that might beused in practical load-predicting applications
Material Flow stress, 103 psi Temperature, F Strain range (ln), h0/h1 Strain rate range, 1/s
403 stainless steel 33.0 1800 0.3–0.7 10.0–14.025.0 1950 0.3–0.7 10.0–14.021.0 2050 0.3–0.7 10.0–14.0
Waspaloy 62.0 1950 0.2–0.4 13.0–15.056.0 1950 0.4–0.6 10.0–13.052.0 2050 0.1–0.3 12.0–15.048.0 2050 0.3–0.6 10.0–13.046.0 2100 0.1–0.3 13.0–15.042.0 2100 0.3–0.6 10.0–13.0
Ti-6Al-2Sn-4Zr-2Mo 56.0 1600 0.1–0.4 13.0–15.052.0 1600 0.4–0.6 10.0–13.052.0 1675 0.1–0.4 13.0–15.046.0 1675 0.4–0.6 10.0–13.038.0 1750 0.1–0.4 13.0–15.034.0 1750 0.4–0.6 10.0–13.0
Inconel 718 54.0 2000 0.1–0.4 13.0–15.048.0 2000 0.4–0.6 10.0–13.046.0 2100 0.1–0.4 13.0–15.040.0 2100 0.4–0.6 10.0–13.0
Ti-8Mo-8V-2Fe-3Al 40.0 1650 0.1–0.6 10.0–15.028.0 1850 0.1–0.6 10.0–15.024.0 2000 0.1–0.6 10.0–15.0
AISI 4340 25.0 1900 0.2–0.7 10.0–14.021.0 2000 0.3–0.8 12.0–17.0
Table 4.13 Average flow stress values obtained from ring compression tests suggested for use inpractical applications
Material Flow stress(a), 103 psi Temperature, F Strain rate range, 1/s Frictional shear factor, m Contact time, s Ring dimensions(b)
6061 Al 9 800 18–22 0.4 0.038 A9 800 15–17 0.31 0.047 B7 800 10–13 0.53 0.079 C
Ti-7Al-4Mo 48 1750 13 0.42 0.033 D30 1750 18–23 0.42 0.044 E30 1750 15–18 0.7 0.056 F
403 SS 37 1800 25–28 0.23 0.029 D33 1800 25–27 0.24 0.037 E33 1800 16–18 0.34 0.047 F
403 SS 32 1950 20 0.28 0.06 F28 1950 16 0.29 0.07 F25 2050 20 0.35 0.06 F19 2050 16 0.43 0.07 F
Waspaloy 55 2100 20 0.18 0.06 F50 2100 13–16 0.21–0.24 0.07–0.09 F
17-7PH SS 34 1950 13–20 0.22–0.28 0.06–0.09 F22 2100 16–20 0.35 0.06–0.07 F18 2100 13 0.31 0.09 F
Ti-6Al-4V 43 1700 20 0.30 0.06 F35 1700 13–16 0.29–0.34 0.07–0.09 F27 1750 16–20 0.32–0.46 0.06–0.07 F20 1750 13 0.38 0.09 F
Inconel 718 65 2000 16–20 0.17–0.18 0.06–0.07 F58 2000 13 0.18 0.09 F50 2100 20 0.33 0.06 F48 2100 13–16 0.29–0.30 0.07–0.09 F
Ti-8Al-1Mo-1V 50 1750 13–16 0.22–0.26 0.07–0.09 F47 1750 20 0.27 0.06 F40 1800 13–16 0.27–0.32 0.07–0.09 F27 1800 20 0.27 0.06 F
7075 Al 19 700 13–20 0.36–0.42 0.06–0.09 G16 800 13–20 0.31–0.49 0.06–0.09 G
Udimet 65 2050 14–17 0.4 (c) F
(a) At 10 to 30% reduction. (b) Dimensions, OD:ID:thickness, in inches: A � 6:3:0.5, B � 6:3:1.0, C� 6:3:2.0, D � 3:1.5:0.25, E � 3:1.5:0.5, F � 3:1.5:1.0, G� 5:3:1. (c) Not measured.

Flow Stress and Forgeability / 49
REFERENCES
[Altan et al., 1973]: Altan, T., Boulger, F.W.,“Flow Stress of Metals and Its Application inMetal Forming Analyses,” Trans. ASME, J.Eng. Ind., Nov 1973, p 1009.
[Dahl et al., 1999]: Dahl, C., Vazquez, V., Al-tan, T., “Determination of Flow Stress of 1524Steel at Room Temperature using the Com-pression Test,” Engineering Research Centerfor Net Shape Manufacturing, ERC/NSM-99-R-22, 1999.
[Dixit et al., 2002]: Dixit, R., Ngaile, G., Altan,T., “Measurement of Flow Stress for ColdForging,” Engineering Research Center forNet Shape Manufacturing, ERC/NSM-01-R-05, 2002.
[Douglas et al., 1975]: Douglas, J.R., Altan, T.,“Flow Stress Determination of Metals atForging Rates and Temperatures,” Trans.ASME, J. Eng. Ind., Feb 1975, p 66.
[Lee et al., 1972]: Lee, C.H., Altan, T., “Influ-ence of Flow Stress and Friction upon Metal
Flow in Upset Forging of Rings and Cylin-ders,” Trans. ASME, J. Eng. Ind., Aug 1972,p 775.
[Thomsen et al., 1965]: Thomsen, E.G., Yang,C.T., Kobayashi, S., Mechanics of Plastic De-formation in Metal Processing, The Macmil-lan Company, 1965.
SELECTED REFERENCES
[Altan et al., 1981]: Altan, T., Semiatin, S.L.,Lahoti, G.D., “Determination of Flow StressData for Practical Metal Forming Analysis,”Ann. CIRP, Vol 30 (No. 1), 1981, p 129.
[Altan et al., 1983]: Altan, T., Oh, S.-I., Gegel,H.L., Metal Forming Fundamentals and Ap-plications, ASM International, 1983.
[Lahoti et al., 1975]: Lahoti, G.D., Altan, T.,“Prediction of Temperature Distributions inAxisymmetric Compression and Torsion,” J.Eng. Mater. Technol., April 1975, p 113.
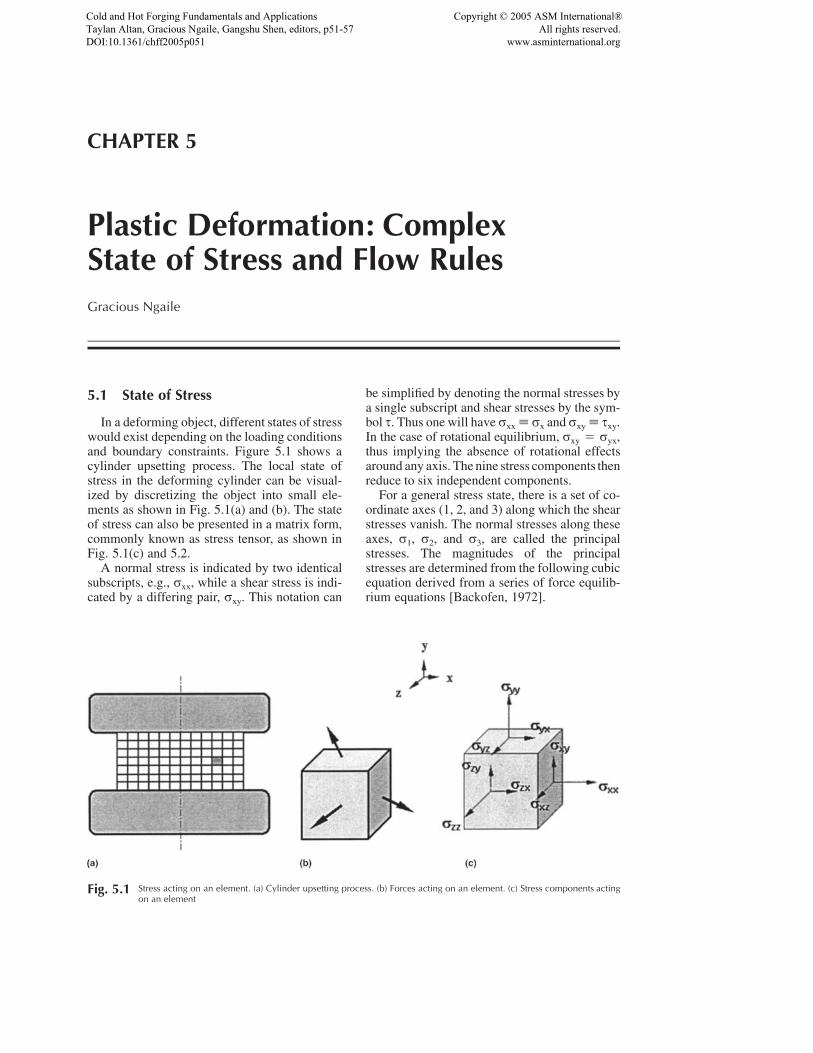
CHAPTER 5
Plastic Deformation: ComplexState of Stress and Flow RulesGracious Ngaile
Fig. 5.1 Stress acting on an element. (a) Cylinder upsetting process. (b) Forces acting on an element. (c) Stress components actingon an element
5.1 State of Stress
In a deforming object, different states of stresswould exist depending on the loading conditionsand boundary constraints. Figure 5.1 shows acylinder upsetting process. The local state ofstress in the deforming cylinder can be visual-ized by discretizing the object into small ele-ments as shown in Fig. 5.1(a) and (b). The stateof stress can also be presented in a matrix form,commonly known as stress tensor, as shown inFig. 5.1(c) and 5.2.
A normal stress is indicated by two identicalsubscripts, e.g., rxx, while a shear stress is indi-cated by a differing pair, rxy. This notation can
be simplified by denoting the normal stresses bya single subscript and shear stresses by the sym-bol s. Thus one will have rxx � rx and rxy � sxy.In the case of rotational equilibrium, rxy � ryx,thus implying the absence of rotational effectsaround any axis. The nine stress components thenreduce to six independent components.
For a general stress state, there is a set of co-ordinate axes (1, 2, and 3) along which the shearstresses vanish. The normal stresses along theseaxes, r1, r2, and r3, are called the principalstresses. The magnitudes of the principalstresses are determined from the following cubicequation derived from a series of force equilib-rium equations [Backofen, 1972].
Cold and Hot Forging Fundamentals and ApplicationsTaylan Altan, Gracious Ngaile, Gangshu Shen, editors, p51-57 DOI:10.1361/chff2005p051
Copyright © 2005 ASM International® All rights reserved. www.asminternational.org
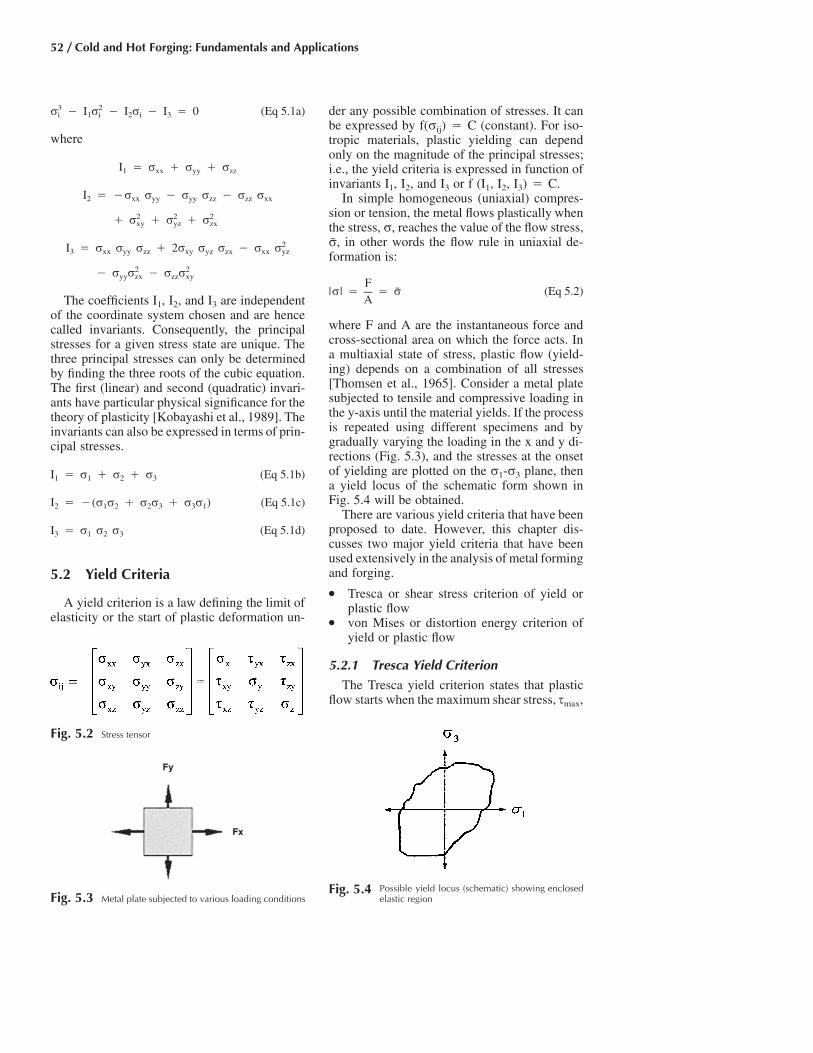
52 / Cold and Hot Forging: Fundamentals and Applications
Fig. 5.4 Possible yield locus (schematic) showing enclosedelastic regionFig. 5.3 Metal plate subjected to various loading conditions
3 2r � I r � I r � I � 0 (Eq 5.1a)i 1 i 2 i 3
where
I � r � r � r1 xx yy zz
I � �r r � r r � r r2 xx yy yy zz zz xx
2 2 2� r � r � rxy yz zx
2I � r r r � 2r r r � r r3 xx yy zz xy yz zx xx yz
2 2� r r � r ryy zx zz xy
The coefficients I1, I2, and I3 are independentof the coordinate system chosen and are hencecalled invariants. Consequently, the principalstresses for a given stress state are unique. Thethree principal stresses can only be determinedby finding the three roots of the cubic equation.The first (linear) and second (quadratic) invari-ants have particular physical significance for thetheory of plasticity [Kobayashi et al., 1989]. Theinvariants can also be expressed in terms of prin-cipal stresses.
I � r � r � r (Eq 5.1b)1 1 2 3
I � �(r r � r r � r r ) (Eq 5.1c)2 1 2 2 3 3 1
I � r r r (Eq 5.1d)3 1 2 3
5.2 Yield Criteria
A yield criterion is a law defining the limit ofelasticity or the start of plastic deformation un-
der any possible combination of stresses. It canbe expressed by f(rij) � C (constant). For iso-tropic materials, plastic yielding can dependonly on the magnitude of the principal stresses;i.e., the yield criteria is expressed in function ofinvariants I1, I2, and I3 or f (I1, I2, I3) � C.
In simple homogeneous (uniaxial) compres-sion or tension, the metal flows plastically whenthe stress, r, reaches the value of the flow stress,
in other words the flow rule in uniaxial de-r,formation is:
F|r | � � r (Eq 5.2)
A
where F and A are the instantaneous force andcross-sectional area on which the force acts. Ina multiaxial state of stress, plastic flow (yield-ing) depends on a combination of all stresses[Thomsen et al., 1965]. Consider a metal platesubjected to tensile and compressive loading inthe y-axis until the material yields. If the processis repeated using different specimens and bygradually varying the loading in the x and y di-rections (Fig. 5.3), and the stresses at the onsetof yielding are plotted on the r1-r3 plane, thena yield locus of the schematic form shown inFig. 5.4 will be obtained.
There are various yield criteria that have beenproposed to date. However, this chapter dis-cusses two major yield criteria that have beenused extensively in the analysis of metal formingand forging.
● Tresca or shear stress criterion of yield orplastic flow
● von Mises or distortion energy criterion ofyield or plastic flow
5.2.1 Tresca Yield CriterionThe Tresca yield criterion states that plastic
flow starts when the maximum shear stress, smax,
Fig. 5.2 Stress tensor

Plastic Deformation: Complex State of Stress and Flow Rules / 53
Fig. 5.5 Representation of state of stress through the Mohrcircle
reaches a certain critical value, k, or when |smax|� k, where k is the shear flow stress that ischaracteristic of a given material and its micro-structure and depends on shear strain rate, strain,and deformation temperature. This yield crite-rion can easily be described by the aid of Mohrcircles for stresses.
Figure 5.5 shows a Mohr circle that representsthe stresses in a plane whose coordinate axes arechosen to be the shear stress s (ordinate) and thenormal stress r (abscissa). In the physical x-yplane, the “principal” stresses are perpendicularto each other, and in the direction of “principal”stresses the shear stresses are zero, as can beseen in Fig. 5.1(b).
In the Mohr circle representation, i.e., in thes-r plane, the maximum principal stress, r1, andthe minimum principal stress, r3, define the sizeof the Mohr circle (Fig. 5.5a). The subscripts 1and 3 are arbitrary and indicate only that r3 �r2 � r1. As can be seen in Fig. 5.5, the largestshear stress, smax, acting on the s-r plane isgiven by one radius of the Mohr circle. Thus:smax � (r1 � r3)/2. The states of stress, whichcause plastic deformation, are illustrated withthe Mohr circle of radius k.
Figures 5.6(a) and 5.6(b) show Mohr circlesfor uniaxial tension (no necking) and compres-sion (no bulging). With r2 � r3 � 0 (uniaxialdeformation), plastic flow starts when
F rr � � r � 2k or k � (Eq 5.3)1 A 2
where F is the tensile or compressive force, A isthe instantaneous cross-sectional area of thesample, and is the flow stress (or instantaneousryield stress).
If the principal stresses are arranged such thatr1 � r2 � r3, then the Tresca yield criterioncan be expressed as:
r � r � r (Eq 5.4)1 3
Equation 5.4 shows that, according to Tresca’srule, plastic flow or yielding starts if the differ-ence of maximum (r1) and minimum (r3) prin-cipal stresses is equal to the flow stress, Fig-r.ure 5.6 shows that the position of the Mohrcircle, i.e., the hydrostatic stress, is not impor-tant for the start of plastic flow.
The mean principal stress is
r � r � r1 2 3r � (Eq 5.5)m 3
and the hydrostatic pressure is
P � �r (Eq 5.6)m
Figure 5.7 shows Mohr circles for biaxial andtriaxial states of stress, respectively. Note thatonly principal stresses are shown in these fig-ures. Details on Mohr circles and stress trans-formation can be found in solid mechanics text-books.
For plane stress condition (r2 � 0), theTresca’s yield criterion can be graphically rep-resented in two dimensions (Fig. 5.8). The hex-agonal diagram encloses the elastic region.
5.2.2 von Mises Yield Criterion
The von Mises yield criterion considers all thestresses acting on the deforming body and canbe expressed as follows. The start of plastic flow(yielding) must depend on a combination of nor-mal and shear stresses, which does not changeits value when transformed from one coordinatesystem into another [Lange, 1972] and [Johnson

54 / Cold and Hot Forging: Fundamentals and Applications
Fig. 5.7 Mohr circles. (a) Biaxial state of stress. (b) Triaxial state of stress. [Kalpakjian, 1997]
Fig. 5.6 Mohr circles. (a) Uniaxial tension. (b) Uniaxial compression
et al., 1975]. In terms of principal stresses, thevon Mises rule is given by:
1/21 2 2 2[(r � r ) � (r � r ) � (r � r ) ]1 2 2 3 1 3� �2
� r (Eq 5.6a)
In a general way:
1 2 2 2[(r � r ) � (r � r ) � (r � r )x y y z z x�21/2
2 2 2� 3(s � s � s )] � r (Eq 5.6b)xy yz zx �or, it can be given by:
1/23 2 2 2[(r � r ) � (r � r ) � (r � r ) ]1 m 2 m 3 m� �2
� r (Eq 5.6c)
where rm is the mean principal stress given by:
r � r � r1 2 3r �m 3
A physical interpretation of the von Misesyield criterion shows that the left side of Eq 5.6is proportional to the energy that is stored in theelastically deformed material prior to yielding.This is the energy necessary for elastic volumechange. The flow rule then states that plasticflow starts when this elastic energy reaches acritical value. That is why the von Mises rule isalso called the “distortion energy criterion.”
For the plane stress condition (r2 � 0), thevon Mises yield locus takes the form of an el-liptical curve as shown in Fig. 5.9.
5.2.3 Comparison ofTresca and von Mises Criteria
The comparison of Tresca and von Mises cri-teria can be expressed by superimposing the el-liptical yield locus (von Mises) and hexagonalyield locus (Tresca) together as shown in Fig.5.10. The shaded regions show the differencebetween the two yield criteria.
● Points A, B, C, D, and E shown in Fig. 5.10are used to describe the similarities and dif-ferences of the two yield criteria.

Plastic Deformation: Complex State of Stress and Flow Rules / 55
σσ1
σσ3
σσ1
σσ3
σ
σ
Fig. 5.9 von Mises yield locus for plane stress condition
● In uniaxial tension or compression (points Aand B), the von Mises and Tresca yield cri-teria exhibit the same values; i.e., when r1� F/A and r2 � r3 � 0, Eq 5.6(a) gives:
1 22r � r, or r � r (Eq 5.7)1 1� �� 2
which is the same as that obtained from Eq5.3.
● The state of stress for a balanced biaxialmode of deformation corresponds to point Cin Fig. 5.10. For this condition, the Trescaand von Mises yield criteria exhibit the sameresults.
● In pure shear (point D in Fig. 5.10), the twoyield criteria exhibit different yield stresses.Pure shear occurs when r3 � �r1, r2 �0. Thus, from Eq 5.6(a) the von Mises yieldcriterion gives:
1 2 2 2r � (r � r � 4r )1 1 1� �� 2
� 3 r � 1.73r (Eq 5.8)� 1 1
rs � r � � 0.577 r (Eq 5.9)max 1
3�Using Eq 5.3, one finds that the Tresca cri-terion gives:
rr � 2r and s � r � � 0.5r1 max 1 2
(Eq 5.10)
Thus, in pure shear, there is a 15% differencebetween values of smax obtained from theTresca and von Mises yield criteria rules.
● For a plane strain condition (point E in Fig.5.10), the stress required for deformation un-der Tresca’s yield criterion in still ry. How-ever, according to von Mises, the stress re-quired is higher, 1.15 ry.
Experiments (with combined shear and ten-sion) indicate that the von Mises rule is a bettercriterion (closer to reality) than Tresca’s flowrule.
In three-dimensional space, the yield surfacesfor von Mises and Tresca can be represented byinclined cylindrical and octagonal prisms, re-spectively (Fig. 5.11).
5.3 Flow Rules
When the stresses at a given point in the metalreach a certain level, as specified by a flow rule(Tresca or von Mises), then plastic flow, i.e.,plastic deformation, starts. Similar to theHooke’s law, which gives the relationship be-tween the stress and the corresponding defor-mation in the elastic range, analysis of plasticdeformation requires a certain relation betweenthe applied stresses and the velocity field (kin-ematics as described by velocity, e and fields).eSuch a relation exists between the stresses (inprincipal axes) and strain rates:
e � k(r � r ) (Eq 5.11a)1 1 m
e � k(r � r ) (Eq 5.11b)2 2 m
e � k(r � r ) (Eq 5.11c)3 3 m
Equations 5.11(a), (b), and (c) are called“plasticity equations” [Thomsen et al., 1965],
Fig. 5.8 Tresca’s yield locus for plane stress condition

56 / Cold and Hot Forging: Fundamentals and Applications
Fig. 5.12 Homogeneous deformation of a blockFig. 5.11 Physical representation of von Mises and Tresca
criterion in three dimensions
[Lange, 1972], [Backofen, 1972]. The variablek depends on direction of plastic flow, tempera-ture, material, strain, and strain rate. The plas-ticity equations—for example, Eq 5.11(a)—canalso be expressed in the form:
3 dede � (r � r ) (Eq 5.12)1 1 m2 r
where denote effective stress and strain.e and rEquation 5.11 can also be expressed as:
˙3 ee � (r � r ) (Eq 5.13)1 1 m2 r
5.4 Power and Energy of Deformation
The plastic deformation processes are irre-versible. The mechanical energy, consumed dur-ing deformation, is transformed largely intoheat. It is useful to consider again the homoge-neous deformation of a block (Fig. 5.12). Thefollowing relations, derived in Chapter 3, holdhere also [Lange, 1972].
h vhe � e � ln ; e �h 1 1h ho
w vwe � ln ; e �2 2w wo
l vle � ln ; e �3 3l lo
Following Fig. 5.12, the instantaneous powerof deformation (force times velocity) is givenby:
P � r wlv � r hlv � r whv1 h 2 w 3 1
� r wlhe � r wlhe � r wlhe1 1 2 2 3 3
� (r e � r e � r e ) V (Eq 5.14)1 1 2 2 3 3
where V is the volume of the deforming block.It follows that the energy of deformation, E, is:
t1
E � V (r e � r e � r e ) dt (5.15)1 1 2 2 3 3�t0
Compression
B
B
Balanced-biaxialstretching
Tension
Pure shear
Plane Straindeformation
E
E
E
E
D
D
A
Aσ1 σ1
σ3
σ3
σ
σ
von Mises
Tresca
C
C
Fig. 5.10 Tresca and von Mises yield loci for the same valueof showing several loading paths. Note: r2 � 0.r,

Plastic Deformation: Complex State of Stress and Flow Rules / 57
with dt � de, Eq 5.15 can also be written as:e
e e e1 2 3
E � V r de � r de � r de1 1 2 2 3 3�� � � �0 0 0
(Eq 5.16)
5.5 Effective Strain andEffective Strain Rate
The flow stress, is determined from a uni-r,axial test (compression or homogeneous ten-sion). Under multiaxial deformation conditions,it is necessary to relate uniaxial material behav-ior to multiaxial material behavior. Consideringan element and the principal directions, the de-formation energy, dW, expended during a timeelement Dt, is:
dW � (r de � r de � r de )V (Eq 5.17)1 1 2 2 3 3
or divided by dt, the deformation power, P, is:
dWP � � (r e � r e � r e )V (Eq 5.18)1 1 2 2 3 3dt
The effective strain, and strain rate, (both˙e, eindicated with overbar), are defined as:
dW � rdeV (Eq 5.19)
or
˙P � reV (Eq 5.20)
Equations 5.18 and 5.20 give:
˙re � r e � r e � r e (Eq 5.21)1 1 2 2 3 3
From volume constancy, it can be shown that:
e � e � e � 0 (Eq 5.22a)1 2 3
or
r (e � e � e ) � 0 (Eq 5.22b)m 1 2 3
Equations 5.20 and 5.22 give:
˙re � e (r � r ) � e (r � r )1 1 m 2 2 m
� e (r � r ) (Eq 5.23)3 3 m
Using the one form of the von Mises rule, Eq5.6(c), Eq 5.23 gives:
˙e �
e (r � r ) � e (r � r ) � e (r � r )1 1 m 2 2 m 3 3 m1/23 2 2 2[(r � r ) � (r � r ) � (r � r ) ]1 m 2 m 3 m� �2
(Eq 5.24)
Using the plasticity equations, Eq 5.11(a),5.11(b), and 5.11(c), which give r1 � rm �
etc., Eq 5.24 can be reduced to:e /k,1
2 2 2 2˙e � (e � e � e ) (Eq 5.25)1 2 3� �� 3
or by integration, to:t1
˙e � e dt (Eq 5.26)�t0
Equations 5.19 and 5.26 show how to calculatethe effective strain rate and the effective strainin principal directions.
REFERENCES
[Backofen, 1972]: Backofen, W.A., Deforma-tion Processing, Addison-Wesley, 1972.
[Johnson et al., 1975]: Johnson, W., Mellor,P.B., Engineering Plasticity, Van NostrandReinhold, London, 1975.
[Kalpakjian, 1997]: Kalpakjian, S., Manufac-turing Processes for Engineering Materials,Addison-Wesley, 1997.
[Kobayashi et al., 1989]: Kobayashi, S., Oh, S.,Altan, T., Metal Forming and the Finite Ele-ment Method, Oxford University Press, 1989.
[Lange, 1972]: Lange, K., Ed., Study Book ofForming Technology, (in German), Vol 1,Fundamentals, Springer-Verlag, 1972.
[Thomsen et al., 1965]: Thomsen, E.G., Yang,C.T., and Kobayashi, S., Mechanics of PlasticDeformation in Metal Processing, Macmillan,1965.

CHAPTER 6
Temperature and Heat TransferGangshu Shen
6.1 IntroductionIn metal forming processes, both plastic de-
formation and friction contribute to heat gener-ation. Approximately 90 to 95% of the mechan-ical energy involved in the process istransformed into heat [Farren et al., 1925]. Insome continuous forming operations such asdrawing and extrusion, performed at highspeeds, temperature increases of several hundreddegrees may be involved [Lahoti et al., 1978].Heat generation is also significant in forgingsproduced in high-speed equipment such as me-chanical press, screw press, and hammer. A partof generated heat remains in the deformed ma-terial, another part flows into the undeformed/less-deformed portion of the material wheretemperature is lower, while still an additionalpart may flow into the tooling. The temperaturesdeveloped during the forging operation influ-ence lubrication conditions, tool life, as well asmicrostructure and properties of the forged part.With the finite element based process modeling,the heat generation during deformation and heattransfer before, during, and after deformationcan all be calculated in a computer. To ensureaccurate heat transfer calculation, correct work-piece and die interface heat transfer coefficientmust be known. Using accurate process model-ing, the influence of press speed, contact time,and heat transfer in metal forming can be eval-uated.
6.2 Heat Generation andHeat Transfer inMetal Forming Processes
In metal forming, the magnitudes and distri-bution of temperatures depend mainly on:
● The initial workpiece and die temperatures● Heat generation due to plastic deformation
and friction at the workpiece/die interface● Heat transfer between the workpiece and
dies and between the workpiece and the en-vironment (air or lubricant and coolant, etc.)
In processes such as forging and extrusion,the average instantaneous temperature in the de-forming workpiece, hA, can be estimated by [Al-tan et al., 1970]:
h � h � h � h � h � h � h (Eq 6.1)A W D F T R C
where hW is the initial workpiece temperature,hD is the temperature increase due to plastic de-formation, hF is the temperature increase due tointerface friction, hT is the temperature drop dueto heat transfer into the dies, hR is the tempera-ture drop due to radiation to the environment,and hC is the temperature drop due to convectionto the environment.
The temperature increase due to the defor-mation, in a time interval Dt, is given by:
˙AreDt rDeh � b � b (Eq 6.2)D cq Jcq
where is the flow stress of the workpiece, is˙r ethe effective strain rate, is the effective strainDegenerated during Dt, A is a conversion factorbetween mechanical and thermal energies, c isthe specific heat of the workpiece, q is the spe-cific weight of the workpiece, and b is the frac-tion of deformation energy transformed into heat(0 � b � 1); usually, b � 0.95.
The temperature increase due to friction, hF,is given by:
Cold and Hot Forging Fundamentals and ApplicationsTaylan Altan, Gracious Ngaile, Gangshu Shen, editors, p59-66 DOI:10.1361/chff2005p059
Copyright © 2005 ASM International® All rights reserved. www.asminternational.org

60 / Cold and Hot Forging: Fundamentals and Applications
Fig. 6.1 Grid system for calculating velocity and temperaturefields in cold upsetting of a cylinder. [Lahoti et al.,
1975]
AfrvFDFh � (Eq 6.3)F cqqa
where, in addition to the symbols already de-scribed, f is the friction factor at the workpiece/tool interface, such that frictional shear stresss � v is the velocity at the workpiece/toolfr,interface, and Va is the volume of the workpiecewhich is subject to temperature increase.
6.3 Temperatures inForging Operations
In forging, the metal flow is non steady state.Contact between the deforming metal and thedies is intermittent. The length of contact timeand the nature of the heat transfer at the die/material interface influence temperatures verysignificantly. A simple example of an operationinvolving non-steady-state metal flow is the coldupsetting of a cylinder. In this process, a gridsystem is established for calculation of tempera-tures (Fig. 6.1). For various points, indicated inFig. 6.1, temperatures were calculated for coldupsetting of a steel cylinder initially at roomtemperature [Lahoti et al., 1975].
The calculated results for the grid points P1,1,P1,5, and P1,8 in Fig. 6.1 are compared with ex-perimental data in Fig. 6.2. As expected, tem-peratures increase with increasing deformation.
In hot forging operations, the contact time un-der pressure between the deforming material andthe dies is the most significant factor influencingtemperature conditions. This is illustrated in Fig.6.3, where the load-displacement curves aregiven for hot forging of a steel part using dif-ferent types of forging equipment [Altan et al.,1973]. These curves illustrate that, due to strainrate and temperature effects, for the same forg-ing process, different forging loads and energiesare required by different machines. For the ham-mer, the forging load is initially higher due tostrain-rate effects, but the maximum load islower than for either hydraulic or screw presses.The reason for this is that in the presses the flashcools rapidly, whereas in the hammer the flashtemperature remains nearly the same as the ini-tial stock temperature.
Thus, in hot forging, not only the material andthe formed shape but also the type of equipmentused (rate of deformation and die chilling ef-fects) determine the metal flow behavior and theforming load and energy required for the pro-
cess. Surface tearing and cracking or develop-ment of shear bands in the formed material oftencan be explained by excessive chilling of thesurface layers of the formed part near the die/material interface.
With the advancement of finite element mod-eling and the increase in computer speed, heattransfer in any forging and heat treatment con-dition can be simulated accurately in a very shorttime.
Figure 6.4 shows the temperature distributionat the end of a coupled deformation and heattransfer modeling of a Ti-64 cylinder upset testin a hydraulic press. The starting temperature ofthe Ti-64 workpiece was 1750 �F (955 �C), andthe starting tool steel die temperature was 300�F (150 �C). At the end of the cylinder upsetting,there was quite a temperature gradient insideboth the upset cylinder (or pancake) and thedies. The temperature range of the pancake atthe end of upsetting was 1044 to 1819 �F (560to 990 �C). The temperature range of the dies atthe end of upsetting was 298 to 723 �F (145 to385 �C).
6.4 Measurement of Temperatures atthe Die/Material Interface
Often it is desirable to measure the tempera-tures at the die/material interface in hot forgingoperations. A thermocouple for measuring in-

Temperature and Heat Transfer / 61
Fig. 6.2 Comparison of predicted temperature in axisymmetric compression with experimental data (refer to Fig. 6.1 for locationsof grid points Pi,j) (material, AISI type 1015 steel; specimen dimensions, 20 mm diam by 30 mm high; initial temperatures,
293 K). [Lahoti et al., 1975]
terface temperatures in hot forging must exhibitvery fast response (a few milliseconds), accu-racy, minimum interference with heat flow, andthe ability to sustain high normal and shearstresses under high temperatures. Such thermo-couples are available and were used for measur-ing die temperatures in forging of steel [Vigoret al., 1961]. The results are given in Fig. 6.5.These results clearly indicate that the tempera-ture gradient is very large at the vicinity of thedie/material interface.
In another study, fast response thermocoupleswere embedded in the bottom flat die of the up-set tooling as shown in Fig. 6.6. The output ofthe thermocouples was recorded on a light beamoscillograph along with the load required to up-set the specimens and the movements of thepress ram as determined by the potentiometricdisplacement transducers [Altan et al., 1970].Figure 6.6 shows the temperature-time traces forfour thermocouples—two in the die and two inthe 1020 steel billet forged at 2250 �F (1230 �C).
These data show that the interface (or insulated)thermocouple measures the billet surface tem-perature, but only under load. Evidently, a highcontact pressure is necessary to ensure goodthermal contact between the billet surface andthe thermocouple junction. After the load hadbeen removed, the interface thermocouple indi-cated a decrease in temperature, while the ther-mocouple placed in the sample actually showedan increase in the temperature at the bottom ofthe forging. It is interesting that the rate of thetemperature drop, as indicated by the interfacethermocouple, decreases significantly once theupper ram and the pressure are removed. As canbe expected, the rate of temperature drop furtherincreases after the sample is removed from thedie.
The results shown in Fig. 6.7 indicate that,during forging of steel at 2250 �F (1230 �C) withdies initially at 400 �F (205 �C), die surface tem-peratures can reach approximately 1200 �F(650 �C) in a fraction of a second while the billet
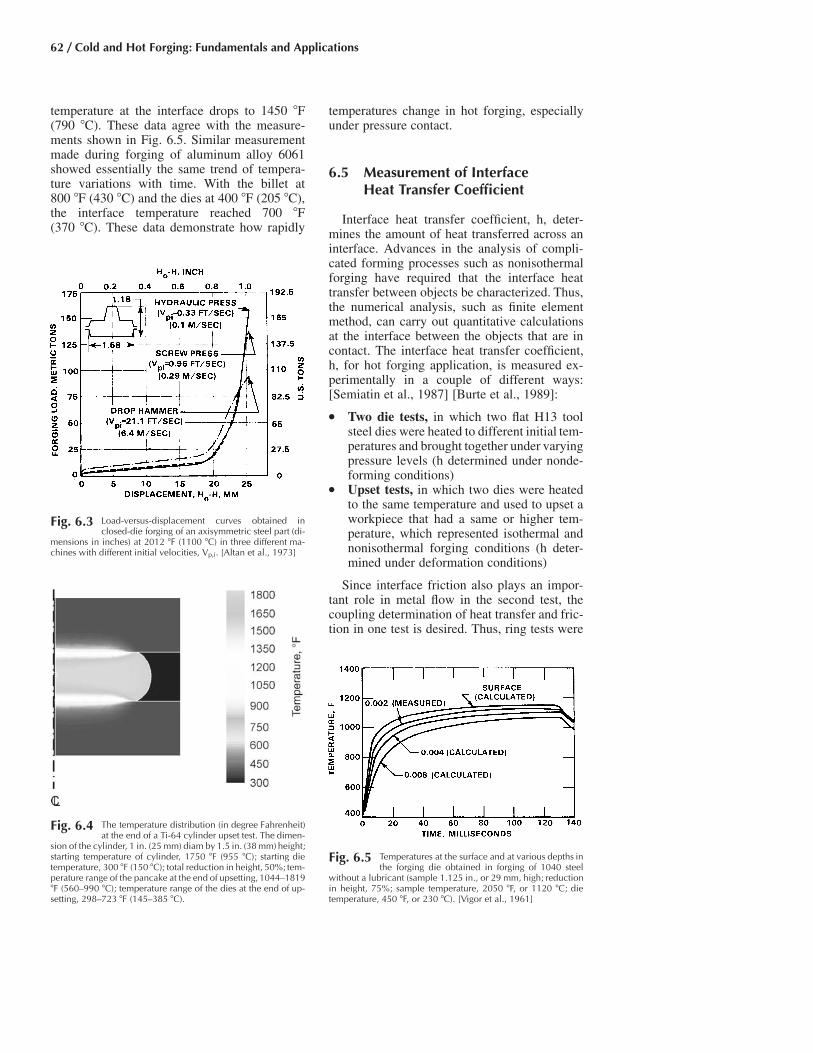
62 / Cold and Hot Forging: Fundamentals and Applications
Fig. 6.5 Temperatures at the surface and at various depths inthe forging die obtained in forging of 1040 steel
without a lubricant (sample 1.125 in., or 29 mm, high; reductionin height, 75%; sample temperature, 2050 �F, or 1120 �C; dietemperature, 450 �F, or 230 �C). [Vigor et al., 1961]
temperature at the interface drops to 1450 �F(790 �C). These data agree with the measure-ments shown in Fig. 6.5. Similar measurementmade during forging of aluminum alloy 6061showed essentially the same trend of tempera-ture variations with time. With the billet at800 �F (430 �C) and the dies at 400 �F (205 �C),the interface temperature reached 700 �F(370 �C). These data demonstrate how rapidly
temperatures change in hot forging, especiallyunder pressure contact.
6.5 Measurement of InterfaceHeat Transfer Coefficient
Interface heat transfer coefficient, h, deter-mines the amount of heat transferred across aninterface. Advances in the analysis of compli-cated forming processes such as nonisothermalforging have required that the interface heattransfer between objects be characterized. Thus,the numerical analysis, such as finite elementmethod, can carry out quantitative calculationsat the interface between the objects that are incontact. The interface heat transfer coefficient,h, for hot forging application, is measured ex-perimentally in a couple of different ways:[Semiatin et al., 1987] [Burte et al., 1989]:
● Two die tests, in which two flat H13 toolsteel dies were heated to different initial tem-peratures and brought together under varyingpressure levels (h determined under nonde-forming conditions)
● Upset tests, in which two dies were heatedto the same temperature and used to upset aworkpiece that had a same or higher tem-perature, which represented isothermal andnonisothermal forging conditions (h deter-mined under deformation conditions)
Since interface friction also plays an impor-tant role in metal flow in the second test, thecoupling determination of heat transfer and fric-tion in one test is desired. Thus, ring tests were
Fig. 6.4 The temperature distribution (in degree Fahrenheit)at the end of a Ti-64 cylinder upset test. The dimen-
sion of the cylinder, 1 in. (25 mm) diam by 1.5 in. (38 mm) height;starting temperature of cylinder, 1750 �F (955 �C); starting dietemperature, 300 �F (150 �C); total reduction in height, 50%; tem-perature range of the pancake at the end of upsetting, 1044–1819�F (560–990 �C); temperature range of the dies at the end of up-setting, 298–723 �F (145–385 �C).
Fig. 6.3 Load-versus-displacement curves obtained inclosed-die forging of an axisymmetric steel part (di-
mensions in inches) at 2012 �F (1100 �C) in three different ma-chines with different initial velocities, Vp,i. [Altan et al., 1973]

Temperature and Heat Transfer / 63
Fig. 6.8 Setup used in the ring test for the measurement ofinterface heat transfer coefficient. [Burte et al.,
1989]
selected in Burte’s experiments [Burte et al.,1989]. Using ring tests, the interface friction andinterface heat transfer coefficients were deter-mined at the same time. The effects of forgingpressure, deformation rate, and lubrication onthe heat transfer coefficient and the friction shearfactor were evaluated simultaneously.
A schematic of ring compression tests usedfor the measurement of interface heat transfercoefficient is shown in Fig. 6.8. Two pairs ofthermocouples were embedded in different
depths of the bottom die. The detailed ring com-pression process was simulated using finite ele-ment model (FEM) package ALPID (a parentversion of DEFORM�) [SFTC, 2002]. The ele-ments were generated such that there were twonodes having the exact locations as the two pairsof the thermocouples in real die for tracking thetemperature history. This kind of arrangement isno longer necessary at present time because thecurrent DEFORM� allows users to define anylocation of the workpiece or dies for tracking ofthe thermomechanical histories.
Figure 6.9 illustrates the method for the mea-surement of interface heat transfer coefficient.The interface heat transfer coefficient was de-termined by calibration curves. The increase inthe temperature of the bottom die (the instanta-neous die temperature T1 minus the initial dietemperature T10) versus time obtained from ex-periments was plotted as experimental data. Onthe same chart, the FEM generated calibrationcurves (h � 0.0068 btu/s/in.2/�F, or 20 kW/m2
• K, and h � 0.0136 btu/s/in.2/�F, or 40 kW/m2
• K) were also plotted. From the relative locationbetween the calibration curve and experimentaldata the interface heat transfer coefficient wasdetermined. The data shown in Fig. 6.8 wereobtained from nonisothermal ring tests with 304stainless steel. The process conditions used forthe ring tests are shown in Table 6.1.
From the calibration curves and experimentaldata displayed in Fig. 6.9, an interface heattransfer coefficient of 0.0068 btu/s/in.2/�F (20kW/m2 • K) was obtained.
Fig. 6.7 Variations in temperatures at various locations inforging of 1020 steel billets (3 in. diam by 3 in. high,
or 76 mm diam by 76 mm high) to 1 in. (25 mm) thickness at2250 �F (1230 �F) between dies at 400 �F (205 �C).
Fig. 6.6 Sketch of cross section through upset forging setup,showing location of fast response thermocouple in
bottom forging die
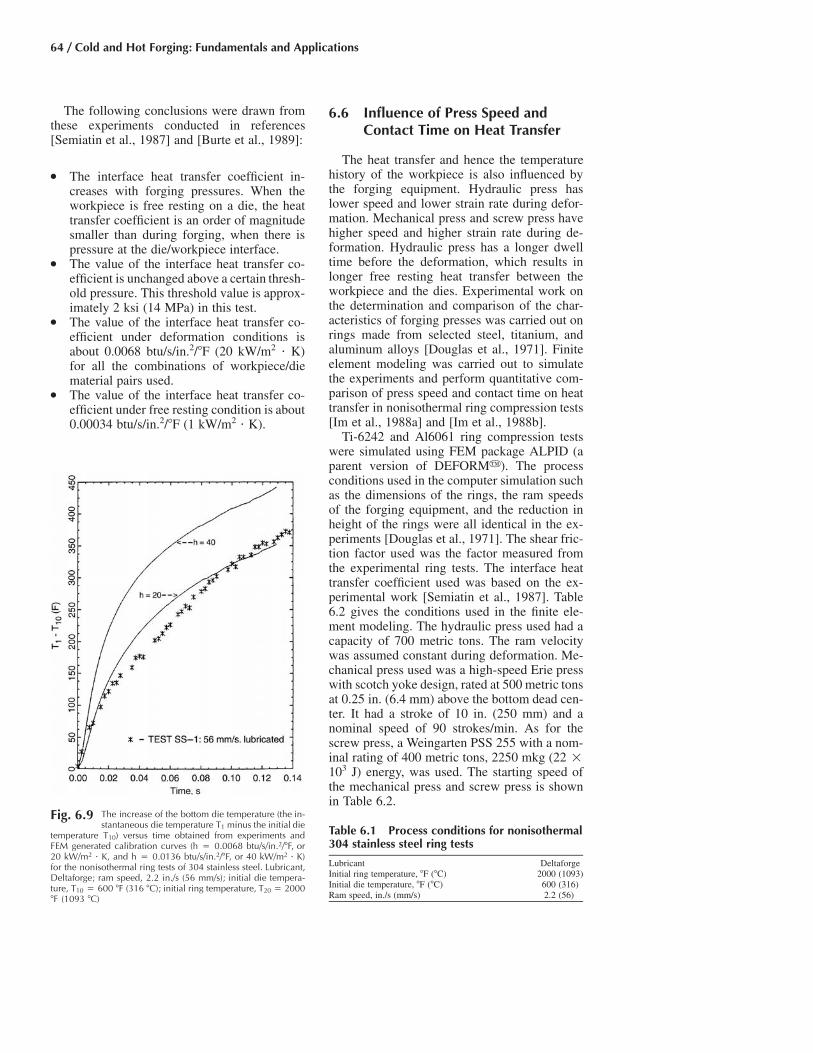
64 / Cold and Hot Forging: Fundamentals and Applications
Table 6.1 Process conditions for nonisothermal304 stainless steel ring tests
Lubricant DeltaforgeInitial ring temperature, �F (�C) 2000 (1093)Initial die temperature, �F (�C) 600 (316)Ram speed, in./s (mm/s) 2.2 (56)
Fig. 6.9 The increase of the bottom die temperature (the in-stantaneous die temperature T1 minus the initial die
temperature T10) versus time obtained from experiments andFEM generated calibration curves (h � 0.0068 btu/s/in.2/�F, or20 kW/m2 • K, and h � 0.0136 btu/s/in.2/�F, or 40 kW/m2 • K)for the nonisothermal ring tests of 304 stainless steel. Lubricant,Deltaforge; ram speed, 2.2 in./s (56 mm/s); initial die tempera-ture, T10 � 600 �F (316 �C); initial ring temperature, T20 � 2000�F (1093 �C)
The following conclusions were drawn fromthese experiments conducted in references[Semiatin et al., 1987] and [Burte et al., 1989]:
● The interface heat transfer coefficient in-creases with forging pressures. When theworkpiece is free resting on a die, the heattransfer coefficient is an order of magnitudesmaller than during forging, when there ispressure at the die/workpiece interface.
● The value of the interface heat transfer co-efficient is unchanged above a certain thresh-old pressure. This threshold value is approx-imately 2 ksi (14 MPa) in this test.
● The value of the interface heat transfer co-efficient under deformation conditions isabout 0.0068 btu/s/in.2/�F (20 kW/m2 • K)for all the combinations of workpiece/diematerial pairs used.
● The value of the interface heat transfer co-efficient under free resting condition is about0.00034 btu/s/in.2/�F (1 kW/m2 • K).
6.6 Influence of Press Speed andContact Time on Heat Transfer
The heat transfer and hence the temperaturehistory of the workpiece is also influenced bythe forging equipment. Hydraulic press haslower speed and lower strain rate during defor-mation. Mechanical press and screw press havehigher speed and higher strain rate during de-formation. Hydraulic press has a longer dwelltime before the deformation, which results inlonger free resting heat transfer between theworkpiece and the dies. Experimental work onthe determination and comparison of the char-acteristics of forging presses was carried out onrings made from selected steel, titanium, andaluminum alloys [Douglas et al., 1971]. Finiteelement modeling was carried out to simulatethe experiments and perform quantitative com-parison of press speed and contact time on heattransfer in nonisothermal ring compression tests[Im et al., 1988a] and [Im et al., 1988b].
Ti-6242 and Al6061 ring compression testswere simulated using FEM package ALPID (aparent version of DEFORM�). The processconditions used in the computer simulation suchas the dimensions of the rings, the ram speedsof the forging equipment, and the reduction inheight of the rings were all identical in the ex-periments [Douglas et al., 1971]. The shear fric-tion factor used was the factor measured fromthe experimental ring tests. The interface heattransfer coefficient used was based on the ex-perimental work [Semiatin et al., 1987]. Table6.2 gives the conditions used in the finite ele-ment modeling. The hydraulic press used had acapacity of 700 metric tons. The ram velocitywas assumed constant during deformation. Me-chanical press used was a high-speed Erie presswith scotch yoke design, rated at 500 metric tonsat 0.25 in. (6.4 mm) above the bottom dead cen-ter. It had a stroke of 10 in. (250 mm) and anominal speed of 90 strokes/min. As for thescrew press, a Weingarten PSS 255 with a nom-inal rating of 400 metric tons, 2250 mkg (22 �103 J) energy, was used. The starting speed ofthe mechanical press and screw press is shownin Table 6.2.
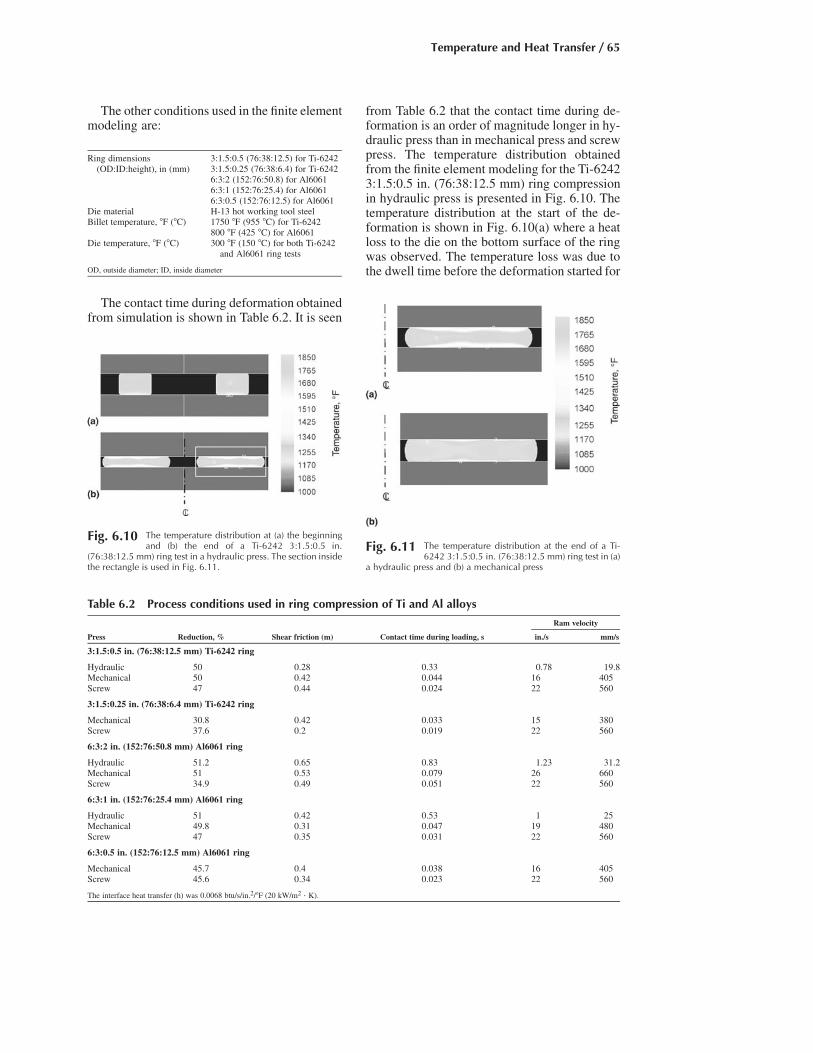
Temperature and Heat Transfer / 65
Fig. 6.10 The temperature distribution at (a) the beginningand (b) the end of a Ti-6242 3:1.5:0.5 in.
(76:38:12.5 mm) ring test in a hydraulic press. The section insidethe rectangle is used in Fig. 6.11.
Table 6.2 Process conditions used in ring compression of Ti and Al alloys
Ram velocity
Press Reduction, % Shear friction (m) Contact time during loading, s in./s mm/s
3:1.5:0.5 in. (76:38:12.5 mm) Ti-6242 ring
Hydraulic 50 0.28 0.33 0.78 19.8Mechanical 50 0.42 0.044 16 405Screw 47 0.44 0.024 22 560
3:1.5:0.25 in. (76:38:6.4 mm) Ti-6242 ring
Mechanical 30.8 0.42 0.033 15 380Screw 37.6 0.2 0.019 22 560
6:3:2 in. (152:76:50.8 mm) Al6061 ring
Hydraulic 51.2 0.65 0.83 1.23 31.2Mechanical 51 0.53 0.079 26 660Screw 34.9 0.49 0.051 22 560
6:3:1 in. (152:76:25.4 mm) Al6061 ring
Hydraulic 51 0.42 0.53 1 25Mechanical 49.8 0.31 0.047 19 480Screw 47 0.35 0.031 22 560
6:3:0.5 in. (152:76:12.5 mm) Al6061 ring
Mechanical 45.7 0.4 0.038 16 405Screw 45.6 0.34 0.023 22 560
The interface heat transfer (h) was 0.0068 btu/s/in.2/�F (20 kW/m2 • K).
The other conditions used in the finite elementmodeling are:
Ring dimensions(OD:ID:height), in (mm)
3:1.5:0.5 (76:38:12.5) for Ti-62423:1.5:0.25 (76:38:6.4) for Ti-62426:3:2 (152:76:50.8) for Al60616:3:1 (152:76:25.4) for Al60616:3:0.5 (152:76:12.5) for Al6061
Die material H-13 hot working tool steelBillet temperature, �F (�C) 1750 �F (955 �C) for Ti-6242
800 �F (425 �C) for Al6061Die temperature, �F (�C) 300 �F (150 �C) for both Ti-6242
and Al6061 ring tests
OD, outside diameter; ID, inside diameter
The contact time during deformation obtainedfrom simulation is shown in Table 6.2. It is seen
from Table 6.2 that the contact time during de-formation is an order of magnitude longer in hy-draulic press than in mechanical press and screwpress. The temperature distribution obtainedfrom the finite element modeling for the Ti-62423:1.5:0.5 in. (76:38:12.5 mm) ring compressionin hydraulic press is presented in Fig. 6.10. Thetemperature distribution at the start of the de-formation is shown in Fig. 6.10(a) where a heatloss to the die on the bottom surface of the ringwas observed. The temperature loss was due tothe dwell time before the deformation started for
Fig. 6.11 The temperature distribution at the end of a Ti-6242 3:1.5:0.5 in. (76:38:12.5 mm) ring test in (a)
a hydraulic press and (b) a mechanical press

66 / Cold and Hot Forging: Fundamentals and Applications
hydraulic press. Figures 6.11(a) and (b) showthe temperature distribution at the end of the Ti-6242 3:1.5:0.5 in. (76:38:12.5 mm) ring test inthe hydraulic press and the mechanical press.The hydraulic press has more die chilling due tolonger contact time of the workpiece to the diesbefore and during deformation. The ring com-pressed in the mechanical press shows a lot ofheat building up during deformation. There arezones inside the ring having temperatures above1850 �F (1010 �C), which is around 25 �F (14�C) higher than the beta transus of Ti-6242.However, the temperature gradient is less in thering forged in the mechanical press and the de-formation is more uniform and the bulge is lesspronounced in this ring. The forgers may makeuse of the difference in press speed and contacttime on heat transfer for different forging appli-cations. For alpha-beta titanium forging, thetemperature increase to above beta transus is notdesired. Therefore, hydraulic press forging isbeneficial. For beta titanium forging, steel forg-ing, and selected superalloy forging, tempera-ture increase during forging is not critical andhigh-speed forging machines such as mechani-cal press, screw press, and hammer can all beused.
REFERENCES
[Altan et al., 1970]: Altan, T., Gerds, A.F.,“Temperature Effects in Closed-Die Forging,”ASM Technical Report No. C70-30.1, Oct1970.
[Altan et al., 1973]: Altan, T., et al., “ForgingEquipment, Materials and Practices,” MCICHandbook HB-03, Battelle, Columbus, OH,1973.
[Burte et al., 1989]: Burte, P., Semiatin, S.L.,Altan, T., “Measurement and Analysis of HeatTransfer and Friction During Hot Forging,”Report No. ERC/NSM-B-89-20, ERC for NetShape Manufacturing, Ohio State University,June 1989.
[Douglas et al., 1971]: Douglas, J.R., Altan, T.,“Characteristics of Forging Presses: Deter-mination and Comparison,” Proceedings ofthe 13th M.T.D.R. Conference, Birmingham,England, September, 1971.
[Farren et al., 1925]: Farren, W.S., Taylor, G.I.,“The Heat Developed During Plastic Extru-sion of Metals,” Proc. R. Soc., Ser. A, Vol 107,1925, p 422–451.
[Im et al., 1988a]: Im, Y.T., Shen, G., “A Studyof the Influence of Press Speed, Contact Timeand Heat Transfer in Nonisothermal UpsetForging of Ti and Al Rings,” 16th NorthAmerica Manufacturing Research ConferenceProceedings, 1988, p 91–98.
[Im et al., 1988b]: Im, Y.T., Vardan, O., Shen,G., Altan, T., “Investigation of Non-Isother-mal Forging Using Ring and Spike Tests,”Ann. CIRP, Vol 37/1, 1988, p 225–230.
[Lahoti et al., 1975]: Lahoti, G.D., Altan, T.,“Prediction of Temperature Distribution inAxisymmetric Compression and Torsion,”ASME, J. Eng. Mater. Technol., Vol 97,1975.
[Lahoti et al., 1978]: Lahoti, G.D., Altan, T.,“Prediction of Metal Flow and Temperaturesin Axisymmetric Deformation Process,” Ad-vances in Deformation Processing, J.J. Burkeand V. Weiss, Ed., Plenum Publishing, 1978,p 113–120.
[Semiatin et al., 1987]: Semiatin, S.L., Coll-ings, E.W., Wood, V.E., Altan, T., “Determi-nation of the Interface Heat Transfer Coeffi-cient for Non-Isothermal Bulk-FormingProcesses,” Trans. ASME, J. Eng. Ind., Vol109A, Aug 1987, p 49–57.
[SFTC, 2002]: Scientific Forming TechnologiesCorporation, DEFORM 7.2 User Manual, Co-lumbus, OH, 2002.
[Vigor et al., 1961]: Vigor, C.W., Hornaday,J.W., “A Thermocouple for Measurement ofTemperature Transients in Forging Dies,” inTemperature, Its Measurement and Control,Vol 3, Part 2, Reinhold, 1961, p 625.
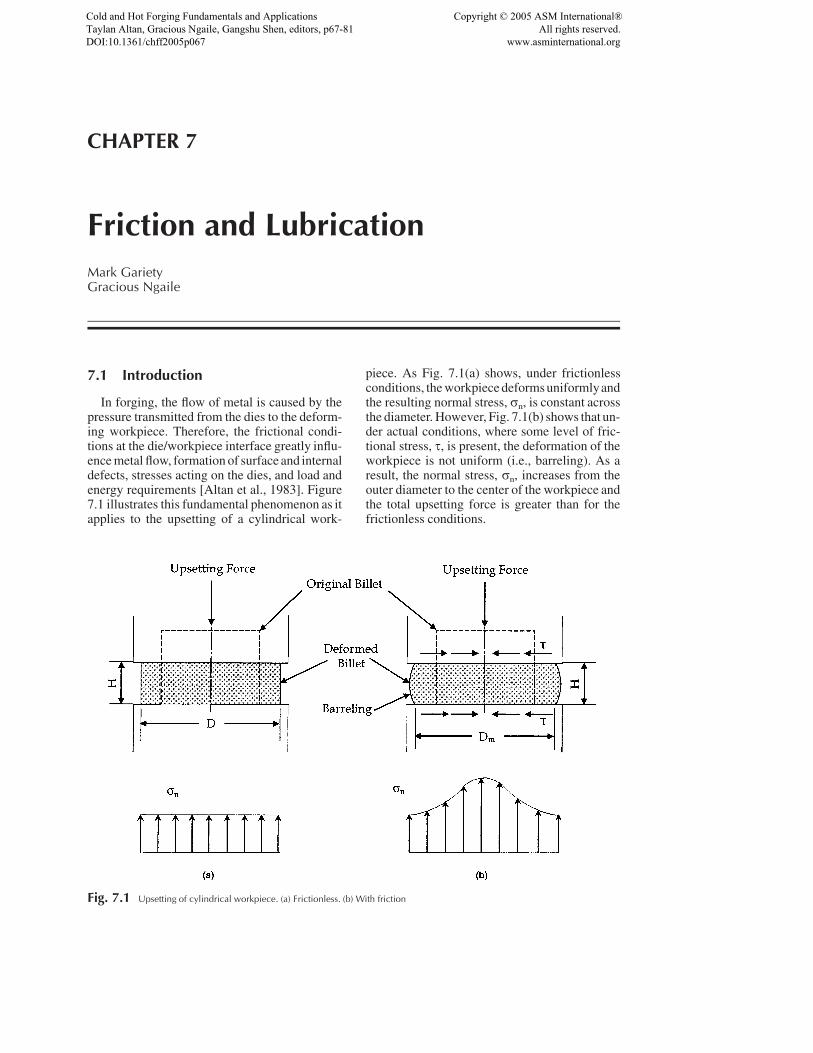
CHAPTER 7
Friction and LubricationMark GarietyGracious Ngaile
7.1 Introduction
In forging, the flow of metal is caused by thepressure transmitted from the dies to the deform-ing workpiece. Therefore, the frictional condi-tions at the die/workpiece interface greatly influ-ence metal flow, formation of surface and internaldefects, stresses acting on the dies, and load andenergy requirements [Altan et al., 1983]. Figure7.1 illustrates this fundamental phenomenon as itapplies to the upsetting of a cylindrical work-
piece. As Fig. 7.1(a) shows, under frictionlessconditions, the workpiece deformsuniformlyandthe resulting normal stress, rn, is constant acrossthe diameter. However, Fig. 7.1(b) shows that un-der actual conditions, where some level of fric-tional stress, s, is present, the deformation of theworkpiece is not uniform (i.e., barreling). As aresult, the normal stress, rn, increases from theouter diameter to the center of the workpiece andthe total upsetting force is greater than for thefrictionless conditions.
Fig. 7.1 Upsetting of cylindrical workpiece. (a) Frictionless. (b) With friction
Cold and Hot Forging Fundamentals and ApplicationsTaylan Altan, Gracious Ngaile, Gangshu Shen, editors, p67-81 DOI:10.1361/chff2005p067
Copyright © 2005 ASM International® All rights reserved. www.asminternational.org
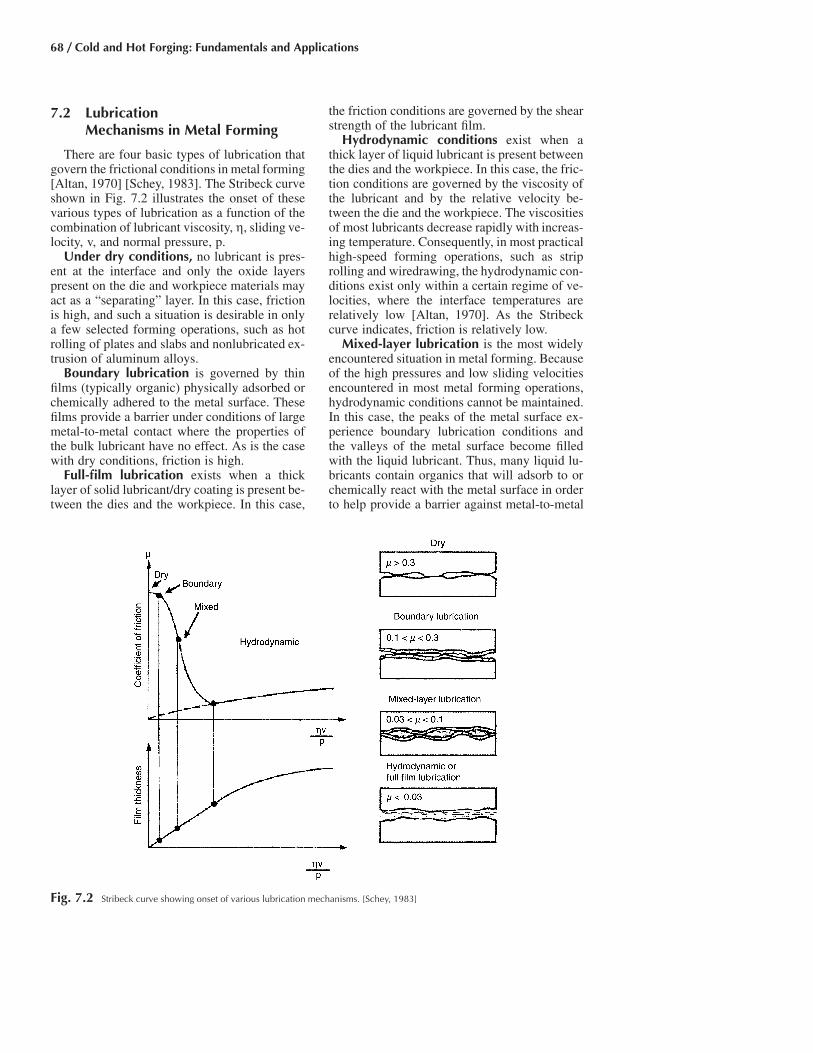
68 / Cold and Hot Forging: Fundamentals and Applications
Fig. 7.2 Stribeck curve showing onset of various lubrication mechanisms. [Schey, 1983]
7.2 LubricationMechanisms in Metal Forming
There are four basic types of lubrication thatgovern the frictional conditions in metal forming[Altan, 1970] [Schey, 1983]. The Stribeck curveshown in Fig. 7.2 illustrates the onset of thesevarious types of lubrication as a function of thecombination of lubricant viscosity, g, sliding ve-locity, v, and normal pressure, p.
Under dry conditions, no lubricant is pres-ent at the interface and only the oxide layerspresent on the die and workpiece materials mayact as a “separating” layer. In this case, frictionis high, and such a situation is desirable in onlya few selected forming operations, such as hotrolling of plates and slabs and nonlubricated ex-trusion of aluminum alloys.
Boundary lubrication is governed by thinfilms (typically organic) physically adsorbed orchemically adhered to the metal surface. Thesefilms provide a barrier under conditions of largemetal-to-metal contact where the properties ofthe bulk lubricant have no effect. As is the casewith dry conditions, friction is high.
Full-film lubrication exists when a thicklayer of solid lubricant/dry coating is present be-tween the dies and the workpiece. In this case,
the friction conditions are governed by the shearstrength of the lubricant film.
Hydrodynamic conditions exist when athick layer of liquid lubricant is present betweenthe dies and the workpiece. In this case, the fric-tion conditions are governed by the viscosity ofthe lubricant and by the relative velocity be-tween the die and the workpiece. The viscositiesof most lubricants decrease rapidly with increas-ing temperature. Consequently, in most practicalhigh-speed forming operations, such as striprolling and wiredrawing, the hydrodynamic con-ditions exist only within a certain regime of ve-locities, where the interface temperatures arerelatively low [Altan, 1970]. As the Stribeckcurve indicates, friction is relatively low.
Mixed-layer lubrication is the most widelyencountered situation in metal forming. Becauseof the high pressures and low sliding velocitiesencountered in most metal forming operations,hydrodynamic conditions cannot be maintained.In this case, the peaks of the metal surface ex-perience boundary lubrication conditions andthe valleys of the metal surface become filledwith the liquid lubricant. Thus, many liquid lu-bricants contain organics that will adsorb to orchemically react with the metal surface in orderto help provide a barrier against metal-to-metal

Friction and Lubrication / 69
Fig. 7.3 Friction at high normal pressures. Courtesy of N. Bay
contact. If there is enough lubricant present, thelubricant in the valleys of the metal surface canact as a hydrostatic medium. In this case, boththe contacting peaks of the metal surface and thehydrostatic pockets support the normal pressure.Thus, friction is moderate.
7.3 Friction Laws andTheir Validity in Forging
In order to evaluate the performances (lubric-ity) of various lubricants under various materialand process conditions and to be able to predictforming pressures, it is necessary to express theinterface friction quantitatively. There are twolaws that can be utilized for this purpose. Bothof these laws quantify interface friction by lump-ing all of the interface phenomena into one non-dimensional coefficient or factor. The Coulombfriction law uses a coefficient of friction, l, toquantify the interface friction. Equation 7.1shows that l is simply the ratio of the frictionalshear stress, s, and the normal stress (pressure),rn.
s � r l (Eq 7.1)n
As is illustrated in Fig. 7.3, the linear rela-tionship defined by Coulomb’s law is not validat all normal stress (pressure) levels because theshear stress, s, cannot exceed the shear strength,k, of the material. Thus, a second law named theinterface shear friction law has been developed[Schey, 1983].
The interface shear friction law uses a frictionfactor, f, or a shear factor, m, to quantify the in-terface friction. Equation 7.2 shows that the fric-tional shear stress, s, is dependent on the flowstress of the deforming material, and the fric-r,tion factor, f, or the shear factor, m. Thus, for africtionless condition, m � 0, and for a stickingfriction condition, m � 1. Sticking friction is thecase where sliding at the interface is preemptedby shearing of the bulk material [Schey, 1983].
ms � fr � r � mk (Eq 7.2)
3�
The shear factor, m, in Eq 7.2 is not to beconfused with the exponent, m, in the simpleexponential law, � used to express themr C(e) ,strain-rate dependency of flow stress, discussedin Chapter 4. Recent studies in forming me-
chanics indicate that Eq 7.2 adequately repre-sents the frictional shear stress in forging, wherethe normal stresses are high, and offers advan-tages in evaluating friction and in performingstress and load calculations [Altan et al., 1983][Schey, 1983] [Bhushan, 2001].
For various forming conditions, the shear fac-tor values, m, vary as follows [Altan et al.,1983]:
● m � 0.05 to 0.15 in cold forming of steels,aluminum alloys, and copper, using conven-tional phosphate-soap lubricants or oils.
● m � 0.2 to 0.4 in hot forming of steels, cop-per, and aluminum alloys with graphite-based (graphite-water or graphite-oil) lubri-cants.
● m � 0.1 to 0.3 in hot forming of titaniumand high-temperature alloys with glass lu-bricants.
● m � 0.7 to 1.0 when no lubricant is used,e.g., in hot rolling of plates or slabs and innonlubricated extrusion of aluminum alloys.
7.4 Parameters InfluencingFriction and Lubrication
There are numerous parameters that influencethe friction and lubrication conditions present atthe die/workpiece interface in a forging opera-tion. These parameters can be outlined as fol-lows [Schey, 1983] [Bay, 1995] [Ngaile et al.,1999] [Saiki et al., 1999] [Lenard, 2000]:
Tool/Workpiece Parameters
● The properties of the workpiece material(i.e., flow stress) influence how the work-
70 / Cold and Hot Forging: Fundamentals and Applications
piece deforms and thus how the lubricantmust flow. The properties of both the die andworkpiece material influence how the lubri-cant reacts with the surfaces (i.e., the bound-ary lubrication).
● The geometry of the die influences how theworkpiece deforms and thus how the lubri-cant must flow.
● The surface finish of both the tool and theworkpiece influence how hydrostatic lubri-cant pockets (i.e., mixed-layer lubrication)are formed.
● In hot forging, the scale present on the work-piece surface influences the interface condi-tions. If the scale is soft and ductile, it mayact as a lubricant. If it is hard and brittle, itmay cause an abrasive wear mechanism.
Lubricant Parameters
● The composition of the lubricant influencesthe viscosity (i.e., hydrodynamic lubrication)and how the viscosity changes when sub-jected to extreme heat and pressure. The lu-bricant composition also influences how thelubricant reacts with both the die and theworkpiece (i.e., boundary lubrication).
● The viscosity of the lubricant influences howit flows as the workpiece is deformed (i.e.,hydrodynamic lubrication).
● The amount of lubricant influences how thelubricant spreads as the workpiece is de-formed and how hydrostatic lubricant pock-ets (i.e., mixed-layer lubrication) are formed.
Process Parameters
● The pressure exerted by the die on the work-piece influences the viscosity of the lubricant(i.e., hydrodynamic lubrication) and the de-formation of the surface asperities, which af-fects the formation of hydrostatic lubricantpockets (i.e., mixed-layer lubrication).
● The sliding velocity at which the die movesrelative to the workpiece influences the heatgeneration at the die/workpiece interface. Italso influences the onset of hydrodynamiclubrication.
● The sliding length at which the die movesover the workpiece influences the heat gen-eration at the die/workpiece interface, the ex-tent to which the lubricant must spread out,and the extent to which the lubricant willbreak down.
● The amount of surface expansion generatedduring the deformation process influencesthe extent to which the lubricant must spreadout.
● The heat generated due to the deformationprocess and the machine operation influ-ences the material properties (i.e., flowstress) of both the die and the workpiece andthe viscosity of the lubricant.
7.5 Characteristics of Lubricants Used
In metal forming, friction is controlled by useof appropriate lubricants for given applications.The lubricant is expected to have certain char-acteristics and to perform some, if not most, ofthe following significant functions [Schey,1983]:
● Reduce the sliding friction between the diesand the workpiece; this is achieved by usinga lubricant of high lubricity
● Act as a parting agent and prevent stickingand galling of the workpiece to the dies
● Possess good insulating properties, espe-cially in hot forming, so as to reduce heatlosses from the workpiece to the dies
● Possess inertness to prevent or minimize re-actions that will degrade the dies and theworkpiece materials at the forming tempera-tures used
● Be nonabrasive so as to reduce erosion of thedie surface and die wear
● Be free of polluting and poisonous compo-nents and not produce unpleasant or danger-ous gases
● Be easily applicable to and removable fromdies and workpiece
● Be commercially available at reasonable cost
7.6 LubricationSystems for Cold Forging
The choice of which lubricant to use for a coldforging process depends on the severity of theoperation (i.e., process parameters such as inter-face pressure and surface expansion) and the pa-rameters associated with the billet itself (i.e.,hardness). For example, upsetting to small di-ameter-to-height ratios does not require the samelubricant performance (lubricity) as backwardextrusion processes. In addition, the lubricationsystems used for steel may be very differentfrom those used for aluminum or titanium[Schey, 1983]. Figure 7.4 shows an example ofthis lubricant selection process for cold forgingof aluminum alloys [Bay, 1994].

Friction and Lubrication / 71
Fig. 7.4 Lubricant selection based on deformation severity. [Bay, 1994]
7.6.1 Ferrous Materials
Carbon Steels. Because of the severe defor-mation conditions typical of many cold forgingoperations, the most widely used lubrication sys-tem in the cold forging of carbon steels is a zincphosphate coating and soaping system (Fig.7.5). However, simple forging processes such aslight upsetting may be completed without lubri-cation or with a simple mineral oil. In the zincphosphate coating lubrication system, the basicworkpiece material is first cleaned to removegrease and scales and then dipped in a zinc phos-phate solution. Through chemical reaction, azinc phosphate layer on the order of 5 to 20 lmis formed. The coated billets are then dipped inan alkaline solution (usually sodium or calciumsoap), resulting in firmly adhered and adsorbedlayers of alkaline soap, zinc soap, and phosphatecrystals with very low shear strength. The typi-
cal procedure for applying this lubrication sys-tem to a billet is described in Table 7.1 [Altanet al., 1983] [Bay, 1994] [Manji, 1994] [ICFG,1996].
Process parameters such as bath age and tem-perature, process time for phosphating and lu-brication, and type of activators influence theproperties of the zinc phosphate coating andsoaping lubrication system. In general, thickercoating or soaping layers are obtained by allow-
Fig. 7.5 Zinc phosphate coating and soaping lubrication sys-tem. [Bay, 1994]
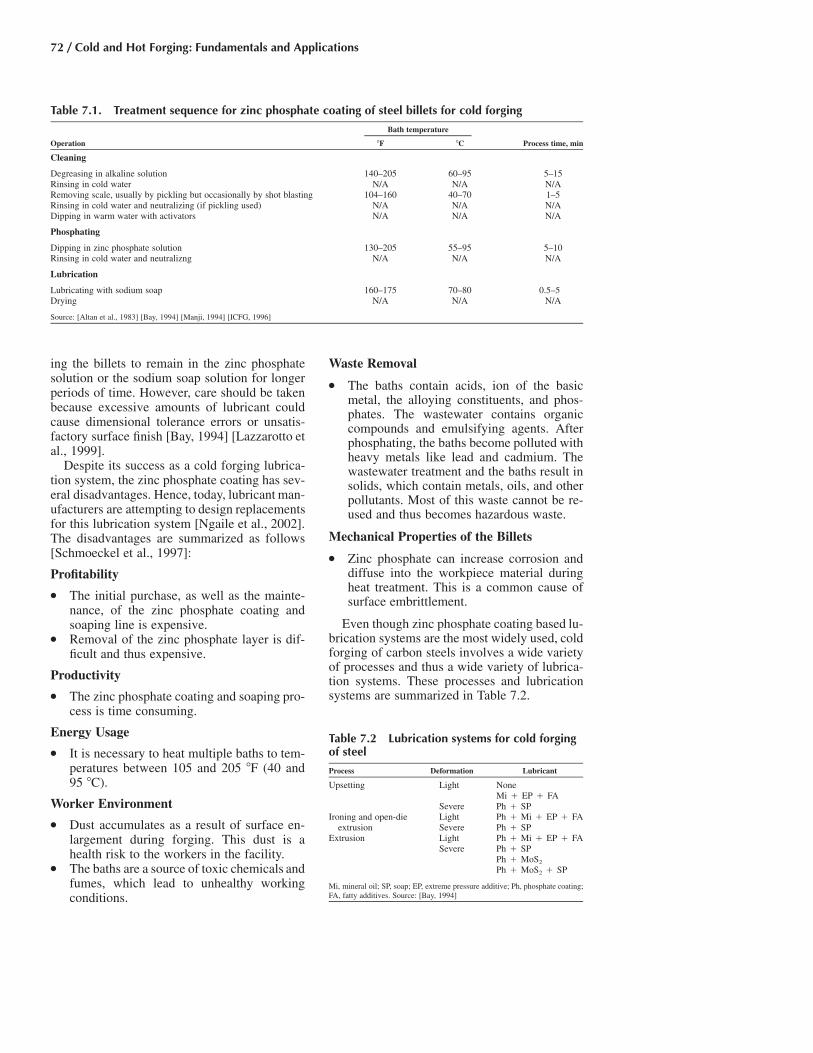
72 / Cold and Hot Forging: Fundamentals and Applications
Table 7.1. Treatment sequence for zinc phosphate coating of steel billets for cold forging
Bath temperature
Operation �F �C Process time, min
Cleaning
Degreasing in alkaline solution 140–205 60–95 5–15Rinsing in cold water N/A N/A N/ARemoving scale, usually by pickling but occasionally by shot blasting 104–160 40–70 1–5Rinsing in cold water and neutralizing (if pickling used) N/A N/A N/ADipping in warm water with activators N/A N/A N/A
Phosphating
Dipping in zinc phosphate solution 130–205 55–95 5–10Rinsing in cold water and neutralizng N/A N/A N/A
Lubrication
Lubricating with sodium soap 160–175 70–80 0.5–5Drying N/A N/A N/A
Source: [Altan et al., 1983] [Bay, 1994] [Manji, 1994] [ICFG, 1996]
ing the billets to remain in the zinc phosphatesolution or the sodium soap solution for longerperiods of time. However, care should be takenbecause excessive amounts of lubricant couldcause dimensional tolerance errors or unsatis-factory surface finish [Bay, 1994] [Lazzarotto etal., 1999].
Despite its success as a cold forging lubrica-tion system, the zinc phosphate coating has sev-eral disadvantages. Hence, today, lubricant man-ufacturers are attempting to design replacementsfor this lubrication system [Ngaile et al., 2002].The disadvantages are summarized as follows[Schmoeckel et al., 1997]:
Profitability
● The initial purchase, as well as the mainte-nance, of the zinc phosphate coating andsoaping line is expensive.
● Removal of the zinc phosphate layer is dif-ficult and thus expensive.
Productivity
● The zinc phosphate coating and soaping pro-cess is time consuming.
Energy Usage
● It is necessary to heat multiple baths to tem-peratures between 105 and 205 �F (40 and95 �C).
Worker Environment
● Dust accumulates as a result of surface en-largement during forging. This dust is ahealth risk to the workers in the facility.
● The baths are a source of toxic chemicals andfumes, which lead to unhealthy workingconditions.
Waste Removal
● The baths contain acids, ion of the basicmetal, the alloying constituents, and phos-phates. The wastewater contains organiccompounds and emulsifying agents. Afterphosphating, the baths become polluted withheavy metals like lead and cadmium. Thewastewater treatment and the baths result insolids, which contain metals, oils, and otherpollutants. Most of this waste cannot be re-used and thus becomes hazardous waste.
Mechanical Properties of the Billets
● Zinc phosphate can increase corrosion anddiffuse into the workpiece material duringheat treatment. This is a common cause ofsurface embrittlement.
Even though zinc phosphate coating based lu-brication systems are the most widely used, coldforging of carbon steels involves a wide varietyof processes and thus a wide variety of lubrica-tion systems. These processes and lubricationsystems are summarized in Table 7.2.
Table 7.2 Lubrication systems for cold forgingof steel
Process Deformation Lubricant
Upsetting Light NoneMi � EP � FA
Severe Ph � SPIroning and open-die Light Ph � Mi � EP � FA
extrusion Severe Ph � SPExtrusion Light Ph � Mi � EP � FA
Severe Ph � SPPh � MoS2
Ph � MoS2 � SP
Mi, mineral oil; SP, soap; EP, extreme pressure additive; Ph, phosphate coating;FA, fatty additives. Source: [Bay, 1994]

Friction and Lubrication / 73
Table 7.4 Lubrication systems for the coldforging of copper and titanium
Process Deformation Lubricant
Copper
Upsetting Light EmulsionSevere Mineral oil
Extrusion Light EmulsionMineral oil
Severe Soaps
Titanium
Upsetting Light Emulsion or mineral oilSevere Copper coating � soap
Fluoride-phosphate coating � soapExtrusion Light Copper coating � soap
Fluoride-phosphate coating � soapSevere Copper coating � graphite
Fluoride-phosphate coating � graphite
Source: [Schey, 1983]
Table 7.3 Alternative conversion coatings foraluminum billets for cold forging
Bath temperature Process time,Phosphating operation �F �C min
Dipping in zincphosphate solution
130–150 55–65 5–10
Dipping in calciumaluminate solution
140–175 60–80 5–15
Dipping in aluminumfluoride solution
185–195 85–90 5–10
Source: [Bay, 1994] [ICFG, 1996]
Extreme-pressure additives include chlorine,sulfur, and phosphorus. These additives reactwith carbon steel surfaces to produce excellentbarriers (boundary lubrication) against metal-to-metal contact. In severe extrusion operations,the bulk surface temperature may exceed themelting point of the soap. In these cases, mo-lybdenum disulfide (MoS2) is used in place ofthe soap. In the most severe operations, the en-tire phosphate coating is replaced by a thin cop-per coating [Schey, 1983].
Stainless Steels. For cold forging of stainlesssteels and other steels containing more than 5%Cr, an oxalate coating is used in place of thephosphate coating. This is done because it is dif-ficult to phosphate these materials [Schey,1983].
7.6.2 Nonferrous Materials
Aluminum. Lubrication in the cold forging ofaluminum is especially important because of thehigh adhesion between the aluminum and the diematerial. The lubrication systems used for thecold forging of aluminum are given in Fig. 7.4.In general, one of three conversion coatings areused with aluminum; namely, zinc phosphate,calcium aluminate, or aluminum fluoride. Thelubricants used with these conversion coatingsinclude soaps and molybdenum disulfide. Thegeneral treatment sequence for these conversioncoatings is the same as described in Table 7.1;however, the type of conversion coating deter-mines the bath temperature and process time asshown in Table 7.3 [Bay, 1994] [ICFG, 1996].
Copper. Lubrication systems for cold forgingof copper are summarized in Table 7.4. It shouldbe noted that many EP additives are uselesswhen used in a mineral oil for lubrication of acopper alloy because they do not react with thecopper surface to create a barrier (boundary lu-brication) to withstand metal-to-metal contact asthey do with carbon steels. In addition, sulfur
additives stain the copper [Schey, 1983] [Garietyet al., 2002].
Titanium. Cold forging of titanium has verylimited application. However, in those limitedapplications, the lubrication systems can besummarized as shown in Table 7.4 [Schey,1983].
7.7 Lubrication Systems forWarm and Hot Forging
The main difference in lubrication conditionsbetween cold and hot or warm forging is thetemperature range in which the lubricant mustfunction. Excessive die temperatures combinedwith high die stresses as the result of heat trans-fer from the billet to the dies and deformationstresses cause increased wear, plastic deforma-tion, and heat checking in the dies [Saiki, 1997].Thus, in order to increase tool life and part qual-ity, a good lubrication system should be capableof minimizing both the heat transfer to the diesand the shear stresses at the tool/workpiece in-terface.
Unlike cold forging, the application of the lu-bricant in hot forging is constrained by the totalforging cycle time, which is on the order of afew seconds. Figure 7.6 illustrates a typical dielubrication process [Doege et al., 1996].
It is therefore essential to apply the appropri-ate lubrication within the shortest amount oftime. Thus, factors such as spray pressure, lu-bricant flow rate, spray angle, spray distance,and spray pattern are of great importance for asuccessful warm or hot forging operation.

74 / Cold and Hot Forging: Fundamentals and Applications
The temperatures used in warm and hot forg-ing do not readily facilitate the use of organic-based lubrication systems (i.e., mineral oils) orsoaps. Organic-based lubricants will burn andsoap-based lubricants will melt at these tem-peratures. Thus, the choices of lubrication sys-tems are very limited [Schey, 1983].
The four most common lubrication systemsare MoS2, graphite, synthetics, and glass; how-ever, MoS2 is only useful at warm forging tem-peratures (up to 750 �F, or 400 �C). MoS2 andgraphite are solid lubricants. Because of theirlayered molecular structure, they demonstratelow frictional stresses. They are usually mixedinto an aqueous solution and sprayed onto thedies. This serves two purposes. First, the aque-ous solution evaporates upon contact with thedies, thus acting to cool the dies and protectthem against increased wear due to thermal soft-ening. Second, an MoS2 or graphite layer re-mains on the dies following evaporation of theaqueous solution. This layer not only acts as alubricant, but also as insulation against exces-sive die heating [Schey, 1983] [Manji, 1994].Today, concerns over the environmental friend-liness of graphite as well as the accumulation ofgraphite within the dies have led to the devel-opment of water-based synthetic lubricants[Manji, 1994].
If the lubricants were applied to the workpieceinstead of the dies, they would be destroyed dur-
ing the heating of the workpiece. There are someexceptions to this. In the hot forging of alumi-num and magnesium, lower forging tempera-tures permit the use of a graphite/mineral oilcombination applied directly to the workpiece.In steels, it is possible to use graphite-basedcoatings that are applied very rapidly to the bil-lets prior to induction heating. Glass can also beused as a lubricant and as a protective coatingin hot forging of titanium, nickel, and tungstenalloys for aerospace applications. When glass isused, it is applied to the workpiece from anaqueous slurry or to the preheated workpiecefrom a powder. The glass subsequently meltsinto a highly viscous liquid [Schey, 1983][Manji, 1994]. Because the dies are at muchlower temperatures than the workpiece, a sharptemperature gradient is created through the glassfilm, which produces a sharp viscosity gradient(molten glass near the workpiece and solid glassnear the dies) vital for lubrication.
The lubrication systems used for the warmand hot forging of steels are summarized in Ta-ble 7.5 [Schey, 1983]. The lubrication systemsused for the warm and hot forging of aluminum,magnesium, copper, titanium, nickel, and tung-sten are summarized in Table 7.6 [Schey, 1983].
7.8 Methods forEvaluation of Lubricants
The cost of lubricants is small compared tothe costs of items such as raw material, equip-ment, and labor. As a result, the economic in-centive to evaluate or change lubricants is notalways very significant. However, lubricantbreakdown resulting in excessive die wear or diefailure is one of the largest factors contributingto reduced production as a result of press down-time and part rejection. Therefore, it is essentialto evaluate the lubricants in use and to compare
Table 7.5 Lubrication systems for the warmand hot forging of steels
Material Process Deformation Lubricant
Carbon steel Warm forging Severe MoS2 in aqueoussolution
Graphite in aqueoussolution
Hot forging Severe Graphite in aqueoussolution
Stainless steel Hot forging Severe Glass in aqueousslurry or powder
Source: [Schey, 1983]
Fig. 7.6 Die lubrication process in warm and hot forging. [Doege et al., 1996]

Friction and Lubrication / 75
them to alternative types of lubricants. Such anevaluation is necessary in order to utilize effec-tively the large investment required for installinga coating and lubrication line for cold forging[Shen et al., 1992].
There are many bench-type simulation testsdesigned to evaluate friction and lubrication inforging operations [Schey, 1983]. Here, how-ever, only two of the most common tests arepresented, i.e., the ring compression test and the
Fig. 7.8 Finite element model of ring compression test. (a) Initial ring. (b) Compressed ring (50% height reduction) (shear factor m� 0.1). (Gariety et al., 2003)
Fig. 7.7 Metal flow in ring compression test. (a) Low friction. (b) High friction
Table 7.6 Lubrication systems for the warm and hot forging of aluminum, magnesium, copper,titanium, nickel, and tungsten
Material Process Deformation Lubricant
Aluminum Warm and hot forging Severe NoneGraphite in mineral oil
Magnesium Warm and hot forging Severe Graphite in mineral oilCopper Warm and hot forging Severe Graphite in aqueous solutionTitanium, nickel, and tungsten Warm forging Severe MoS2 compounds
Graphite compoundsHot forging Severe Graphite compounds
Most severe Glass in aqueous slurry or powder
Source: [Schey, 1983]
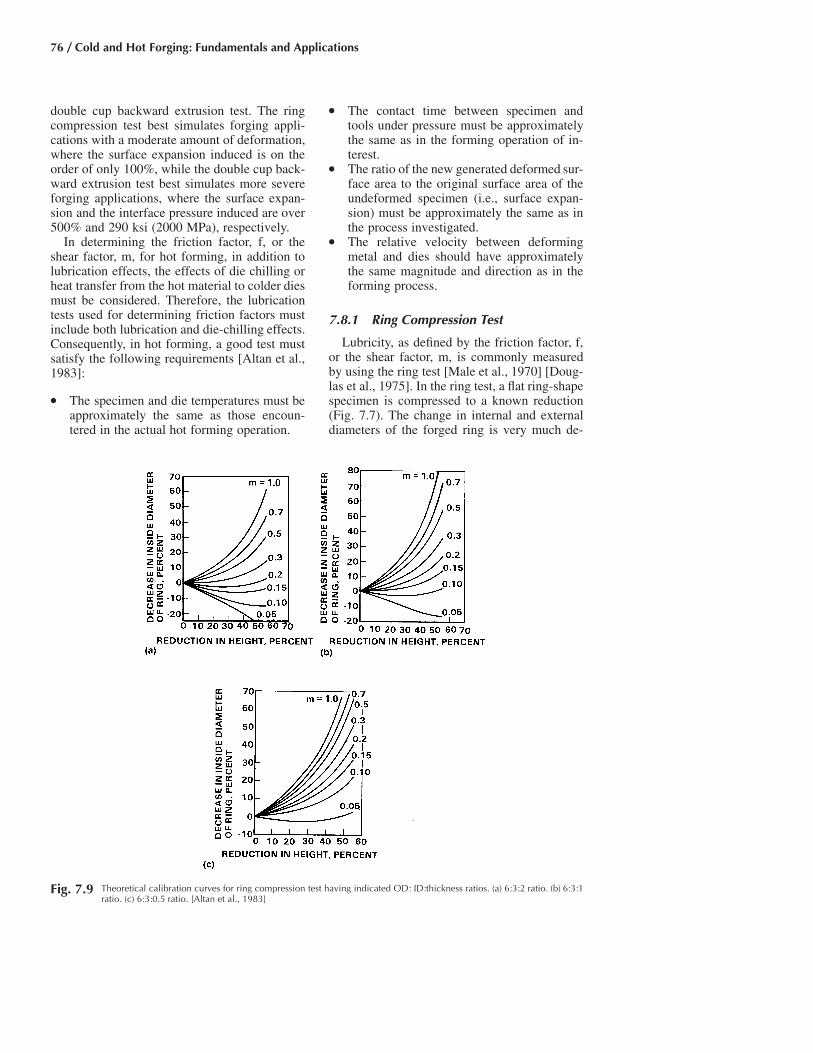
76 / Cold and Hot Forging: Fundamentals and Applications
double cup backward extrusion test. The ringcompression test best simulates forging appli-cations with a moderate amount of deformation,where the surface expansion induced is on theorder of only 100%, while the double cup back-ward extrusion test best simulates more severeforging applications, where the surface expan-sion and the interface pressure induced are over500% and 290 ksi (2000 MPa), respectively.
In determining the friction factor, f, or theshear factor, m, for hot forming, in addition tolubrication effects, the effects of die chilling orheat transfer from the hot material to colder diesmust be considered. Therefore, the lubricationtests used for determining friction factors mustinclude both lubrication and die-chilling effects.Consequently, in hot forming, a good test mustsatisfy the following requirements [Altan et al.,1983]:
● The specimen and die temperatures must beapproximately the same as those encoun-tered in the actual hot forming operation.
● The contact time between specimen andtools under pressure must be approximatelythe same as in the forming operation of in-terest.
● The ratio of the new generated deformed sur-face area to the original surface area of theundeformed specimen (i.e., surface expan-sion) must be approximately the same as inthe process investigated.
● The relative velocity between deformingmetal and dies should have approximatelythe same magnitude and direction as in theforming process.
7.8.1 Ring Compression Test
Lubricity, as defined by the friction factor, f,or the shear factor, m, is commonly measuredby using the ring test [Male et al., 1970] [Doug-las et al., 1975]. In the ring test, a flat ring-shapespecimen is compressed to a known reduction(Fig. 7.7). The change in internal and externaldiameters of the forged ring is very much de-
Fig. 7.9 Theoretical calibration curves for ring compression test having indicated OD: ID:thickness ratios. (a) 6:3:2 ratio. (b) 6:3:1ratio. (c) 6:3:0.5 ratio. [Altan et al., 1983]

Friction and Lubrication / 77
pendent on the friction at the die/ring interface.If friction were equal to zero, the ring woulddeform in the same way as a solid disk, witheach element flowing radially outward at a rateproportional to its distance from the center. Withincreasing deformation, the internal diameter ofthe ring is reduced if friction is high and is in-creased if friction is low. Thus, the change in theinternal diameter represents a simple method forevaluating interface friction.
Simulation of Cold Forging Conditions.The ring test has an advantage when applied tothe study of friction under cold forging condi-tions. In order to measure friction with this test,the force necessary to deform the ring and theflow stress of the specimen do not have to beknown. Thus, evaluation of test results is greatlysimplified. To obtain the magnitude of the fric-tion factor, the internal diameter of the com-pressed ring must be compared with the valuespredicted by using various friction factors, f, orshear factors, m. Today, these values are mostoften predicted by the finite element method(FEM). Figure 7.8 shows an example of an FEMmodel used for this purpose. The results are plot-ted in the form of “theoretical calibrationcurves,” as can be seen in Fig. 7.9, for ringshaving OD:ID:thickness ratios of 6:3:2, 6:3:1,and 6:3:0.5. The internal diameters used in thisfigure are the diameters at the internal bulge. Un-der cold forging conditions, these calibrationcurves may be considered as “universal” be-cause changes in material properties (i.e., strainhardening) have little effect on the curves. Indetermining the value of the shear factor, m, fora given experimental condition, the measured di-mensions (reduction in height and variation ininternal diameter) are plotted on the appropriatecalibration figure. From the position of that pointwith respect to theoretical curves given for vari-ous values of “m,” the value of the shear factor,m, which existed in the experiment is obtained.
Some results obtained from ring compressiontests conducted in a 160-ton hydraulic press witha ram velocity of 15 mm/s and a ring heightreduction of 50% are shown in Table 7.7.
Simulation of Hot Forging Conditions. Incontrast to the simulation of cold forging con-ditions, the simulation of hot forging conditionsdo not provide for a “universal” set of calibra-tion curves. The friction calibration curves mustbe generated for the specific ring material underthe specified ring and die temperatures and theram speed conditions. Hence, knowledge of theflow stress of the material is required [Lee et al.,1972].
The results from some ring compression testsconducted under hot forging conditions havebeen compiled. The results from ring compres-sion tests conducted for various materials in a500 ton mechanical press with a nominal speedof 90 strokes/min and a total stroke of 10 in.(255 mm) are shown in Table 7.8.
Fig. 7.10 Metal flow in double cup backward extrusion test
Table 7.7 Values of frictional shear factor, m, obtained from ring compression tests conducted in ahydraulic press
Specimen/dietemperatures Ring size OD:ID:h(a) Frictional shear
Material �F �C in. mm factor (m) Lubrication system
AISI 1018 200/200 95/95 1.75:1.13:0.5 44.5:28.7:12.7 0.040 Zinc phosphate coating � soap0.045 Metallic compounds � sulfur compounds(b)0.060 Mineral oil � EP additives
Copper 75/75 24/24 2:1:0.67 50.8:25.4:16.9 0.30 Emulsion0.27 Water-based synthetic
(a) OD, ring outside diameter; ID, ring inside diameter; h, ring height. (b) Environmentally friendly lubrication system developed to replace zinc phosphate coatingbased systems. Source: [Gariety et al., 2003] [Hannan et al., 2000]

78 / Cold and Hot Forging: Fundamentals and Applications
7.8.2 Double CupBackward Extrusion Test
Lubricity, as defined by the friction factor, f,or the shear factor, m, is also measured by usingthe double cup backward extrusion test. As
shown in Fig. 7.10, the test is a combination ofthe single cup forward and single cup backwardextrusion processes. The ratio of the cup heights,H1/H2, is very dependent on the friction at thebillet/die and billet/punch interfaces [Buschhau-sen et al., 1992] [Forcellese et al., 1994]. In par-
Fig. 7.11 Double cup backward extrusion test tooling at the ERC/NSM
Table 7.8 Values of frictional shear factor, m, obtained from ring compression tests conducted in amechanical press (die temperatures � 300 �F, or 150 �C)
Specimentemperature Ring ratio OD:ID:t Frictional shear
Material �F �C in. mm factor (m) Contact time, s Lubrication system
6061 Al 800 425 6:3:0.5 150:75:13 0.40 0.038 (a)6:3:1 150:75:25 0.31 0.047 (a)6:3:2 150:75:51 0.53 0.079 (a)
Ti-7Al-4Mo 1750 955 3:1.5:0.25 75:38:6.5 0.42 0.033 (b)3:1.5:0.5 75:38:13 0.42 0.044 (b)3:1.5:1 75:38:25 0.42 0.056 (b)
403 SS 1800 980 3:1.5:0.25 75:38:6.5 0.23 0.029 (b)3:1.5:0.5 75:38:13 0.24 0.039 (b)3:1.5:1 75:38:25 0.34 0.047 (b)
1950 1065 3:1.5:1 75:38:25 0.28 0.06 (b)2050 1120 3:1.5:1 75:38:25 0.35 0.06 (b)
Waspaloy 2100 1150 3:1.5:1 75:38:25 0.18 0.06 (b)17-7PH SS 1950 1065 3:1.5:1 75:38:25 0.28 0.06 (b)
2100 1150 3:1.5:1 75:38:25 0.35 0.06 (b)Ti-6Al-4V 1700 925 3:1.5:1 75:38:25 0.30 0.06 (b)
1750 955 3:1.5:1 75:38:25 0.46 0.06 (b)Inconel 718 2000 1095 3:1.5:1 75:38:25 0.18 0.06 (b)
2100 1150 3:1.5:1 75:38:25 0.33 0.06 (b)Ti-8Al-1Mo-1V 1750 955 3:1.5:1 75:38:25 0.27 0.06 (b)
1800 980 3:1.5:1 75:38:25 0.27 0.06 (b)Udimet 2050 1120 3:1.5:1 75:38:25 0.40 0.06 (b)7075 Al 700 370 5:3:1 125:75:25 0.37 0.06 (a)
800 425 5:3:1 125:75:25 0.31 0.06 (a)
SS, stainless steel. (a) Caustic precoat � graphite coating Dag 137 (Acheson) on the specimens and graphite spray Deltaforge 43 (Acheson) on the dies. (b) Glass-based coating Deltaforge 347 (Acheson) on the specimens and graphite spray Deltaforge 43 (Acheson) on the dies. Source: [Douglas et al., 1975]
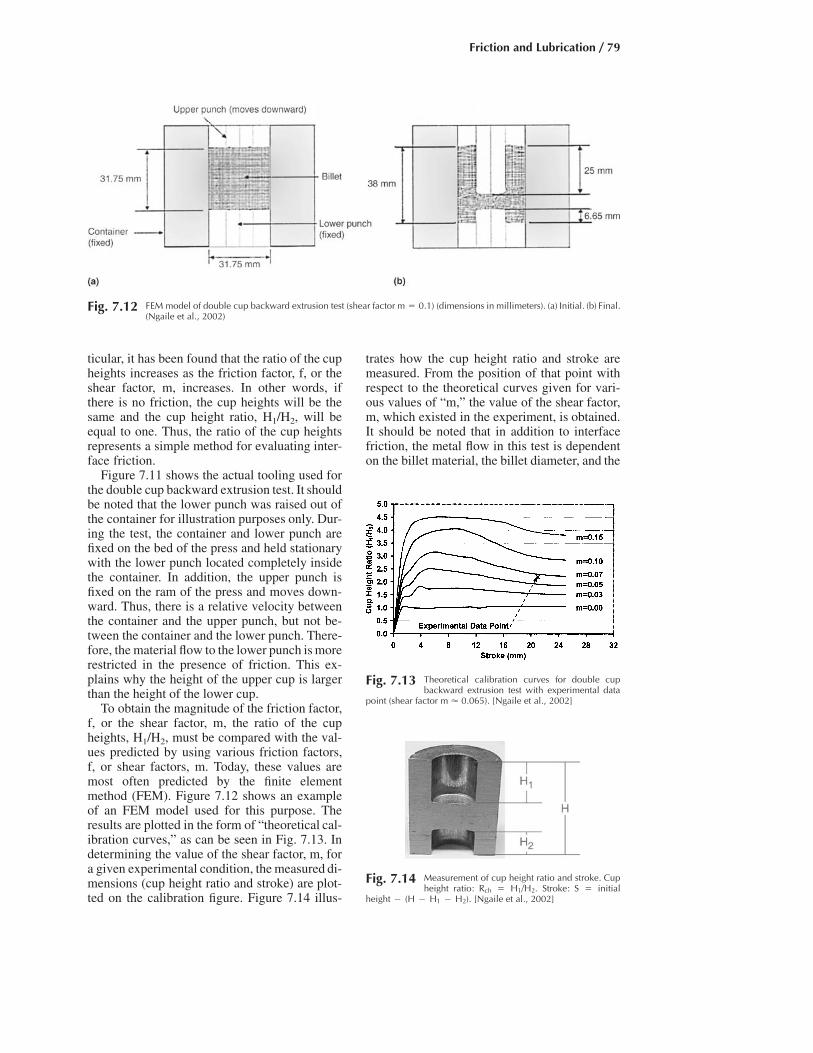
Friction and Lubrication / 79
ticular, it has been found that the ratio of the cupheights increases as the friction factor, f, or theshear factor, m, increases. In other words, ifthere is no friction, the cup heights will be thesame and the cup height ratio, H1/H2, will beequal to one. Thus, the ratio of the cup heightsrepresents a simple method for evaluating inter-face friction.
Figure 7.11 shows the actual tooling used forthe double cup backward extrusion test. It shouldbe noted that the lower punch was raised out ofthe container for illustration purposes only. Dur-ing the test, the container and lower punch arefixed on the bed of the press and held stationarywith the lower punch located completely insidethe container. In addition, the upper punch isfixed on the ram of the press and moves down-ward. Thus, there is a relative velocity betweenthe container and the upper punch, but not be-tween the container and the lower punch. There-fore, the material flow to the lower punch is morerestricted in the presence of friction. This ex-plains why the height of the upper cup is largerthan the height of the lower cup.
To obtain the magnitude of the friction factor,f, or the shear factor, m, the ratio of the cupheights, H1/H2, must be compared with the val-ues predicted by using various friction factors,f, or shear factors, m. Today, these values aremost often predicted by the finite elementmethod (FEM). Figure 7.12 shows an exampleof an FEM model used for this purpose. Theresults are plotted in the form of “theoretical cal-ibration curves,” as can be seen in Fig. 7.13. Indetermining the value of the shear factor, m, fora given experimental condition, the measured di-mensions (cup height ratio and stroke) are plot-ted on the calibration figure. Figure 7.14 illus-
trates how the cup height ratio and stroke aremeasured. From the position of that point withrespect to the theoretical curves given for vari-ous values of “m,” the value of the shear factor,m, which existed in the experiment, is obtained.It should be noted that in addition to interfacefriction, the metal flow in this test is dependenton the billet material, the billet diameter, and the
Fig. 7.13 Theoretical calibration curves for double cupbackward extrusion test with experimental data
point (shear factor m � 0.065). [Ngaile et al., 2002]
Fig. 7.12 FEM model of double cup backward extrusion test (shear factor m � 0.1) (dimensions in millimeters). (a) Initial. (b) Final.(Ngaile et al., 2002)
Fig. 7.14 Measurement of cup height ratio and stroke. Cupheight ratio: Rch � H1/H2. Stroke: S � initial
height � (H � H1 � H2). [Ngaile et al., 2002]
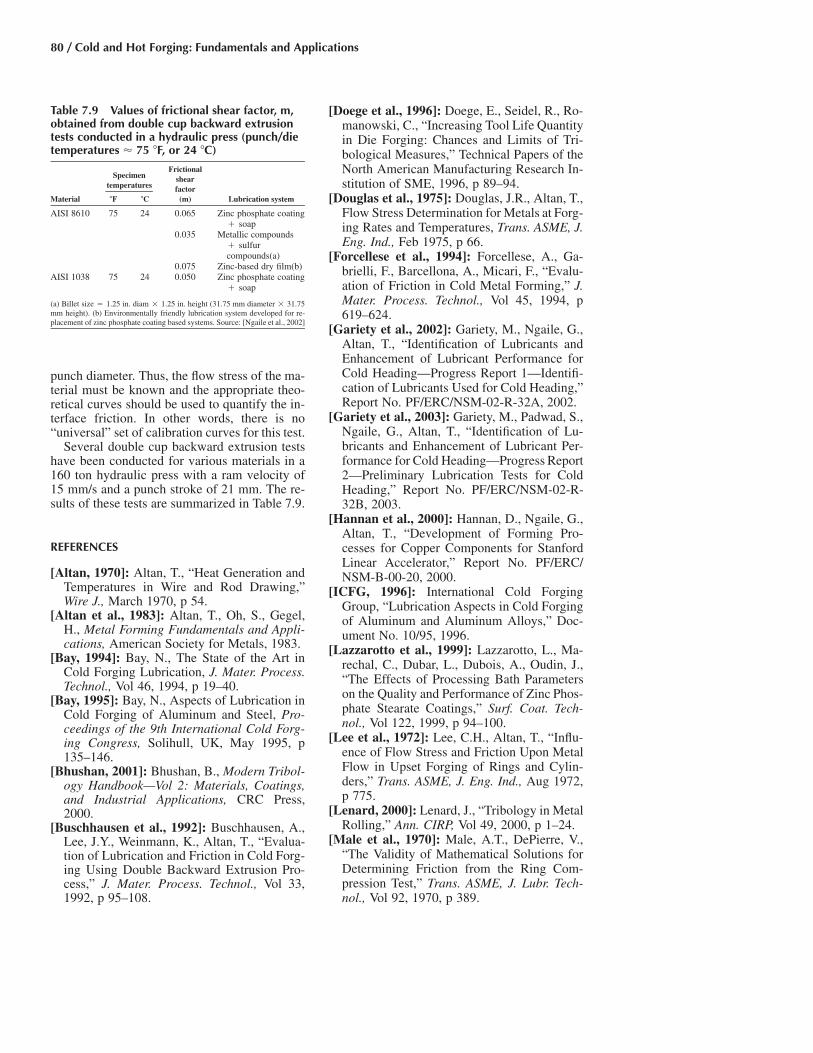
80 / Cold and Hot Forging: Fundamentals and Applications
punch diameter. Thus, the flow stress of the ma-terial must be known and the appropriate theo-retical curves should be used to quantify the in-terface friction. In other words, there is no“universal” set of calibration curves for this test.
Several double cup backward extrusion testshave been conducted for various materials in a160 ton hydraulic press with a ram velocity of15 mm/s and a punch stroke of 21 mm. The re-sults of these tests are summarized in Table 7.9.
REFERENCES
[Altan, 1970]: Altan, T., “Heat Generation andTemperatures in Wire and Rod Drawing,”Wire J., March 1970, p 54.
[Altan et al., 1983]: Altan, T., Oh, S., Gegel,H., Metal Forming Fundamentals and Appli-cations, American Society for Metals, 1983.
[Bay, 1994]: Bay, N., The State of the Art inCold Forging Lubrication, J. Mater. Process.Technol., Vol 46, 1994, p 19–40.
[Bay, 1995]: Bay, N., Aspects of Lubrication inCold Forging of Aluminum and Steel, Pro-ceedings of the 9th International Cold Forg-ing Congress, Solihull, UK, May 1995, p135–146.
[Bhushan, 2001]: Bhushan, B., Modern Tribol-ogy Handbook—Vol 2: Materials, Coatings,and Industrial Applications, CRC Press,2000.
[Buschhausen et al., 1992]: Buschhausen, A.,Lee, J.Y., Weinmann, K., Altan, T., “Evalua-tion of Lubrication and Friction in Cold Forg-ing Using Double Backward Extrusion Pro-cess,” J. Mater. Process. Technol., Vol 33,1992, p 95–108.
[Doege et al., 1996]: Doege, E., Seidel, R., Ro-manowski, C., “Increasing Tool Life Quantityin Die Forging: Chances and Limits of Tri-bological Measures,” Technical Papers of theNorth American Manufacturing Research In-stitution of SME, 1996, p 89–94.
[Douglas et al., 1975]: Douglas, J.R., Altan, T.,Flow Stress Determination for Metals at Forg-ing Rates and Temperatures, Trans. ASME, J.Eng. Ind., Feb 1975, p 66.
[Forcellese et al., 1994]: Forcellese, A., Ga-brielli, F., Barcellona, A., Micari, F., “Evalu-ation of Friction in Cold Metal Forming,” J.Mater. Process. Technol., Vol 45, 1994, p619–624.
[Gariety et al., 2002]: Gariety, M., Ngaile, G.,Altan, T., “Identification of Lubricants andEnhancement of Lubricant Performance forCold Heading—Progress Report 1—Identifi-cation of Lubricants Used for Cold Heading,”Report No. PF/ERC/NSM-02-R-32A, 2002.
[Gariety et al., 2003]: Gariety, M., Padwad, S.,Ngaile, G., Altan, T., “Identification of Lu-bricants and Enhancement of Lubricant Per-formance for Cold Heading—Progress Report2—Preliminary Lubrication Tests for ColdHeading,” Report No. PF/ERC/NSM-02-R-32B, 2003.
[Hannan et al., 2000]: Hannan, D., Ngaile, G.,Altan, T., “Development of Forming Pro-cesses for Copper Components for StanfordLinear Accelerator,” Report No. PF/ERC/NSM-B-00-20, 2000.
[ICFG, 1996]: International Cold ForgingGroup, “Lubrication Aspects in Cold Forgingof Aluminum and Aluminum Alloys,” Doc-ument No. 10/95, 1996.
[Lazzarotto et al., 1999]: Lazzarotto, L., Ma-rechal, C., Dubar, L., Dubois, A., Oudin, J.,“The Effects of Processing Bath Parameterson the Quality and Performance of Zinc Phos-phate Stearate Coatings,” Surf. Coat. Tech-nol., Vol 122, 1999, p 94–100.
[Lee et al., 1972]: Lee, C.H., Altan, T., “Influ-ence of Flow Stress and Friction Upon MetalFlow in Upset Forging of Rings and Cylin-ders,” Trans. ASME, J. Eng. Ind., Aug 1972,p 775.
[Lenard, 2000]: Lenard, J., “Tribology in MetalRolling,” Ann. CIRP, Vol 49, 2000, p 1–24.
[Male et al., 1970]: Male, A.T., DePierre, V.,“The Validity of Mathematical Solutions forDetermining Friction from the Ring Com-pression Test,” Trans. ASME, J. Lubr. Tech-nol., Vol 92, 1970, p 389.
Table 7.9 Values of frictional shear factor, m,obtained from double cup backward extrusiontests conducted in a hydraulic press (punch/dietemperatures � 75 �F, or 24 �C)
Specimentemperatures
Frictionalshearfactor
Material �F �C (m) Lubrication system
AISI 8610 75 24 0.065 Zinc phosphate coating� soap
0.035 Metallic compounds� sulfurcompounds(a)
0.075 Zinc-based dry film(b)AISI 1038 75 24 0.050 Zinc phosphate coating
� soap
(a) Billet size � 1.25 in. diam � 1.25 in. height (31.75 mm diameter � 31.75mm height). (b) Environmentally friendly lubrication system developed for re-placement of zinc phosphate coating based systems. Source: [Ngaile et al., 2002]
Friction and Lubrication / 81
[Manji, 1994]: Manji, J., “Die Lubricants,”Forging, Spring 1994, p 39–44.
[Ngaile et al., 1999]: Ngaile, G., Saiki, H.,“Cold Forging Tribo-Test Based on Variationof Deformation Patterns at the Tool-Work-piece Interface,” Lubr. Eng.: J. Soc. Tribol.Lubr. Eng., Feb 1999, p 23–31.
[Ngaile et al., 2002]: Ngaile, G., Schumacher,R., Gariety, M., Altan, T., Kolodziej, J., “De-velopment of Replacements for PhoscoatingUsed in Forging Extrusion and Metal Form-ing Processes,” 2002, Report No. PF/ERC/NSM-02-R-85.
[Saiki, 1997]: Saiki, H., “The Role of Tribologyfor Improvement of Tool Life in Hot Forg-ing,” Proceedings of the 1st InternationalConference on Tribology in ManufacturingProcesses, Gifu, Japan, 1997, p 22–31.
[Saiki et al., 1999]: Saiki, H., Ngaile, G., Ruan,L., Marumo, Y., “Evaluation of Cold ForgingLubricants Under Realistic Forging Tempera-ture Conditions,” Adv. Technol. Plast.: Ann.CIRP, Vol 1, p 377–382.
[Schey, 1983]: Schey, J., Tribology in Metal-working: Lubrication, Friction, and Wear,American Society for Metals, 1983.
[Schmoeckel et al., 1997]: Schmoeckel, D.,Rupp, M., ”More Environment Friendly ColdMassive Forming—Production of Steel with-out Zinc Phosphate Layer,” Symposium, Lat-est Developments in Massive Forming, Fell-bach near Stuttgart, 1997, p 183–200.
[Shen et al., 1992]: Shen, G., Vedhanayagam,A., Kropp, E., Altan, T., “A Method for Eval-uation of Friction Using a Backward Extru-sion Type Forging,” J. Mater. Process. Tech-nol., Vol 33, 1992, p 109–123.

CHAPTER 8
Inverse Analysis forSimultaneous Determination ofFlow Stress and FrictionHyunjoong Cho
8.1 Introduction
The finite element analysis (FEA) basedsimulation of metal forming processes has beenwidely used to predict metal flow and to opti-mize the manufacturing operations. In usinguser-friendly commercial FEA software, it isnecessary to assign input parameters for thesimulation. Among those inputs, the parametersin the flow stress equation, friction factor, andanisotropy coefficients of a material are usuallyobtained from the appropriate tests. The resultsof process simulation are extremely sensitive tothe accuracy of flow stress and interface frictionthat are input to FEM programs. Therefore, it isessential that these input values are determinedusing (a) reliable material tests and (b) accurateevaluation methods. A test used to determinematerial properties should replicate processingconditions that exist in practical applications.
A common method for the determination ofthe flow stress data for forging simulation is thecylinder upset test as discussed in Chapter 4 be-cause (a) during the test the deformation is donein a state of compressive stress, which representswell the true stress state of most forging pro-cesses and (b) the test can be done for a largestrain. However, even in the simplest cylinderupset test, interface friction leads to an inevitablebulging of the sample and thereby to an inac-curate flow stress determination. Thus, the eval-uation of the test results should be able to over-come difficulties introduced by friction and
inhomogeneous deformation. It is desirable toconsider the unavoidable friction at the tool/workpiece interface in the test and to identifythe friction together with flow stress using anappropriate evaluation method. In this chapter,an inverse analysis technique for the accuratedetermination of the input data for FEM simu-lation is introduced to determine material pa-rameters in the flow stress model and the frictionat the tool/workpiece interface.
8.2 Inverse Analysis in Metal Forming
8.2.1 Direct and Inverse Problems
An FEA of metal forming process as illus-trated in Fig. 8.1(a) is regarded as direct prob-lem. The required input data for direct problem(i.e., FE simulation) are geometry, process con-ditions, flow stress, interface friction, etc. In thedirect problem FEA predicts the metal flow,forming load, and energy by simulating theforming operation assuming that the flow stressand friction values are known. Compared withthe direct problem, in the inverse problem theauthors determine one or more of input data ofthe direct problem, leading to the best fit be-tween experimental measurements and FEMprediction. With experimental measurementsprovided to the inverse problem, the input dataare identified or calibrated (if initial guess isgiven). This inverse problem can be applied to
Cold and Hot Forging Fundamentals and ApplicationsTaylan Altan, Gracious Ngaile, Gangshu Shen, editors, p83-89 DOI:10.1361/chff2005p083
Copyright © 2005 ASM International® All rights reserved. www.asminternational.org
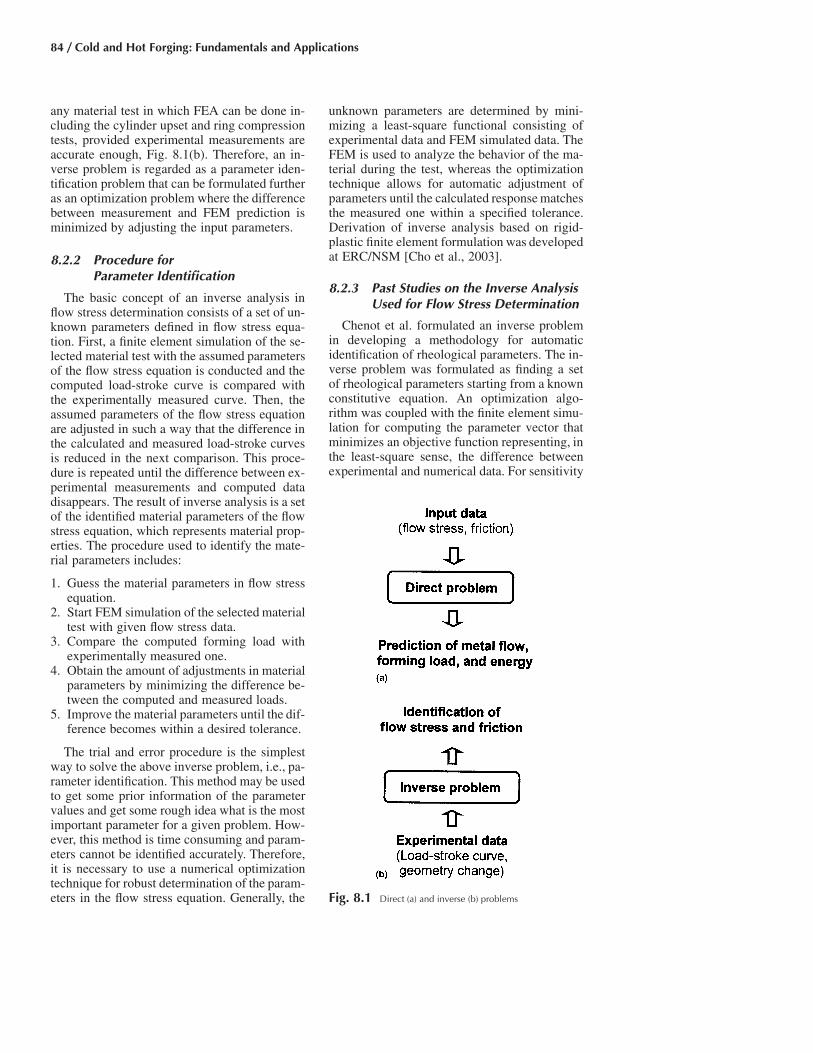
84 / Cold and Hot Forging: Fundamentals and Applications
Fig. 8.1 Direct (a) and inverse (b) problems
any material test in which FEA can be done in-cluding the cylinder upset and ring compressiontests, provided experimental measurements areaccurate enough, Fig. 8.1(b). Therefore, an in-verse problem is regarded as a parameter iden-tification problem that can be formulated furtheras an optimization problem where the differencebetween measurement and FEM prediction isminimized by adjusting the input parameters.
8.2.2 Procedure forParameter Identification
The basic concept of an inverse analysis inflow stress determination consists of a set of un-known parameters defined in flow stress equa-tion. First, a finite element simulation of the se-lected material test with the assumed parametersof the flow stress equation is conducted and thecomputed load-stroke curve is compared withthe experimentally measured curve. Then, theassumed parameters of the flow stress equationare adjusted in such a way that the difference inthe calculated and measured load-stroke curvesis reduced in the next comparison. This proce-dure is repeated until the difference between ex-perimental measurements and computed datadisappears. The result of inverse analysis is a setof the identified material parameters of the flowstress equation, which represents material prop-erties. The procedure used to identify the mate-rial parameters includes:
1. Guess the material parameters in flow stressequation.
2. Start FEM simulation of the selected materialtest with given flow stress data.
3. Compare the computed forming load withexperimentally measured one.
4. Obtain the amount of adjustments in materialparameters by minimizing the difference be-tween the computed and measured loads.
5. Improve the material parameters until the dif-ference becomes within a desired tolerance.
The trial and error procedure is the simplestway to solve the above inverse problem, i.e., pa-rameter identification. This method may be usedto get some prior information of the parametervalues and get some rough idea what is the mostimportant parameter for a given problem. How-ever, this method is time consuming and param-eters cannot be identified accurately. Therefore,it is necessary to use a numerical optimizationtechnique for robust determination of the param-eters in the flow stress equation. Generally, the
unknown parameters are determined by mini-mizing a least-square functional consisting ofexperimental data and FEM simulated data. TheFEM is used to analyze the behavior of the ma-terial during the test, whereas the optimizationtechnique allows for automatic adjustment ofparameters until the calculated response matchesthe measured one within a specified tolerance.Derivation of inverse analysis based on rigid-plastic finite element formulation was developedat ERC/NSM [Cho et al., 2003].
8.2.3 Past Studies on the Inverse AnalysisUsed for Flow Stress Determination
Chenot et al. formulated an inverse problemin developing a methodology for automaticidentification of rheological parameters. The in-verse problem was formulated as finding a setof rheological parameters starting from a knownconstitutive equation. An optimization algo-rithm was coupled with the finite element simu-lation for computing the parameter vector thatminimizes an objective function representing, inthe least-square sense, the difference betweenexperimental and numerical data. For sensitivity

Inverse Analysis for Simultaneous Determination of Flow Stress and Friction / 85
Table 8.1 Flow stress models and parameters
Forging type Flow stress equation Parameters
Cold � nr Ke K,n
Warm � n˙mr Ke e K,n,m
Hot � ˙mr Ke K,m
analysis of the objective function with respect tothe searching parameters during the optimiza-tion, Chenot differentiated the FEM code withrespect to the searching parameters [Chenot etal., 1996].
Boyer and Massoni developed the semianal-ytical method for sensitivity analysis of inverseproblem in material forming domain. Thismethod compromises between computation timeand effort of analytical code differentiation. Thistechnique proved to be a good alternative to thefinite difference method or analytical differen-tiation of the FEM code in conducting sensitiv-ity analysis. As a result of research, the identi-fication software CART (Computer AidedRheology and Tribology) was introduced [Boyer& Massoni, 2001].
Pietrzyk et al. used inverse analysis techniqueto evaluate the coefficients in the friction andflow stress model for metal forming processes.He identified parameters in the conventionalflow stress equation and in a dislocation densitybased internal variable model as well as frictionfactor from one set of ring compression test. Heconcluded that the determination of both rheo-logical and frictional parameters from one com-bined test is ideal because the interpretation oftests to determine the flow stress depends on anassumed value of the friction factor [Pietrzyk etal., 2001].
Zhiliang et al. introduced a new method com-bining compression tests with FEM simulation(C-FEM) to determine flow stress from the com-pression tests where inhomogeneous deforma-tion is present due to interface friction. In thismethod, the flow stress obtained from the com-pression test is improved by minimizing the tar-get function defined in load-stroke curves [Zhi-liang et al., 2002].
8.3 Flow Stress Determination inForging by Inverse Analysis
In a large plastic deformation problem, usu-ally encountered in most forging applications,the deformation behavior of the material can beassumed to be rigid-plastic by neglecting theelastic part. If the material shows strain hard-ening behavior in cold forging, the power-lawtype flow stress equation is used to describe astress-strain relationship for plastic range. At el-evated temperature, flow stress is sensitive torate of deformation. Thus, for warm and hotforgings, flow stress is expressed in function of
strain, strain-rate, and temperature. Examples offlow stress equations and material parametersare summarized in Table 8.1.
8.3.1 Material Parameters
In cold forging, K and n are the two materialparameters (i.e., the material strength coeffi-cient, K, and the strain hardening exponent, n)used to define the stress-strain relationship dur-ing plastic deformation. When the experimen-tally measured load-stroke curve is available,FEM simulations are made with initial guessesof K and n values, and then the two materialparameters are to be identified. Therefore, thematerial parameters become design variables inthe optimization problem.
8.3.2 Objective Function
The unknown material parameters are deter-mined by minimizing an objective function, E,representing the difference between the experi-mental and the simulated loads in a least-squaresense:
N 21 F � F (P )EXP COM kE � (Eq 8.1)� � �N Fi�1 EXP
where FEXP is the experimental load and FCOMis the computed load. N is the number of datasampling points selected from a load-stroke toconstruct the objective function. Figure 8.2 il-lustrates a definition of the objective function.The objective function, E, is a nonlinear implicitfunction of material parameters Pk. Therefore,the parameter identification problem is reducedto compute a set of the unknown parameter Pk� {K,n}, which leads to the best fit betweenexperimental measurements and correspondingcomputed data.
For given material parameters Pk, the objec-tive function E � E(Pk) will be minimum at:
�E(P )k� 0 for k � 1, 2 (Eq 8.2)
�Pk
where Pk are the P1 � K, P2 � n.
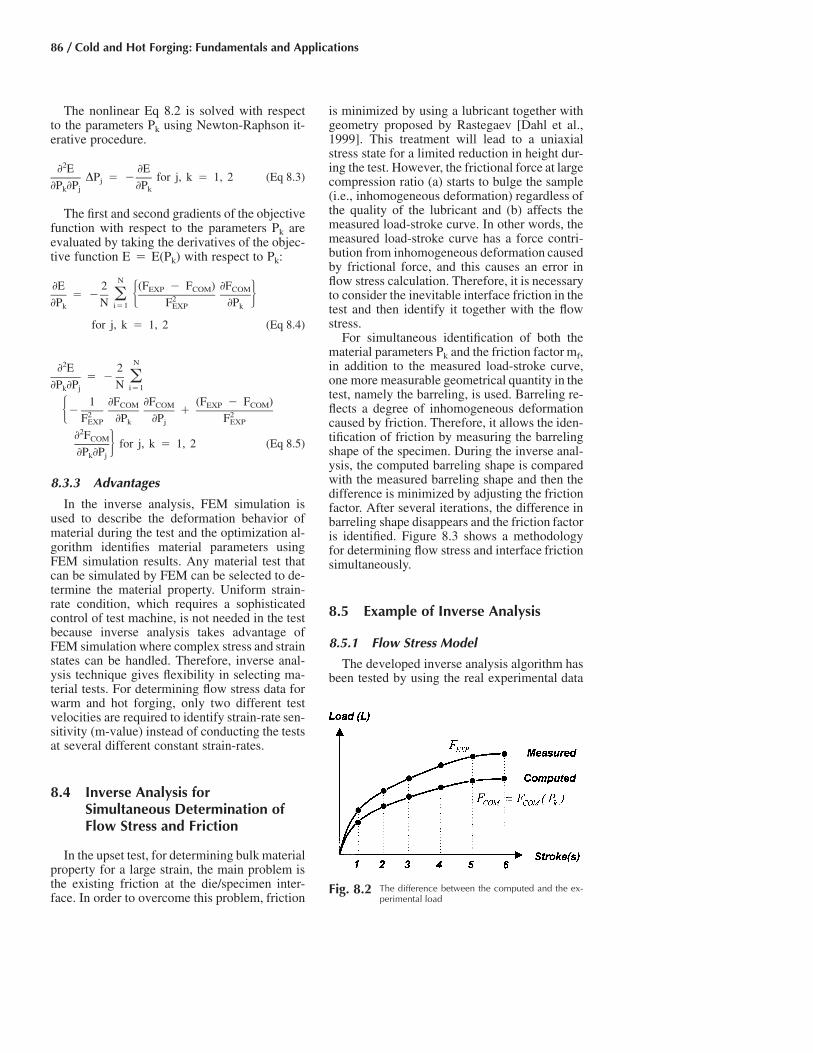
86 / Cold and Hot Forging: Fundamentals and Applications
Fig. 8.2 The difference between the computed and the ex-perimental load
The nonlinear Eq 8.2 is solved with respectto the parameters Pk using Newton-Raphson it-erative procedure.
2� E �EDP � � for j, k � 1, 2 (Eq 8.3)j�P �P �Pk j k
The first and second gradients of the objectivefunction with respect to the parameters Pk areevaluated by taking the derivatives of the objec-tive function E � E(Pk) with respect to Pk:
N�E 2 (F � F ) �FEXP COM COM
� � � � 2 ��P N F �Pi�1k EXP k
for j, k � 1, 2 (Eq 8.4)
N2� E 2� � ��P �P N i�1k j
1 �F �F (F � F )COM COM EXP COM� �� 2 2F �P �P FEXP k j EXP
2� FCOM for j, k � 1, 2 (Eq 8.5)��P �Pk j
8.3.3 Advantages
In the inverse analysis, FEM simulation isused to describe the deformation behavior ofmaterial during the test and the optimization al-gorithm identifies material parameters usingFEM simulation results. Any material test thatcan be simulated by FEM can be selected to de-termine the material property. Uniform strain-rate condition, which requires a sophisticatedcontrol of test machine, is not needed in the testbecause inverse analysis takes advantage ofFEM simulation where complex stress and strainstates can be handled. Therefore, inverse anal-ysis technique gives flexibility in selecting ma-terial tests. For determining flow stress data forwarm and hot forging, only two different testvelocities are required to identify strain-rate sen-sitivity (m-value) instead of conducting the testsat several different constant strain-rates.
8.4 Inverse Analysis forSimultaneous Determination ofFlow Stress and Friction
In the upset test, for determining bulk materialproperty for a large strain, the main problem isthe existing friction at the die/specimen inter-face. In order to overcome this problem, friction
is minimized by using a lubricant together withgeometry proposed by Rastegaev [Dahl et al.,1999]. This treatment will lead to a uniaxialstress state for a limited reduction in height dur-ing the test. However, the frictional force at largecompression ratio (a) starts to bulge the sample(i.e., inhomogeneous deformation) regardless ofthe quality of the lubricant and (b) affects themeasured load-stroke curve. In other words, themeasured load-stroke curve has a force contri-bution from inhomogeneous deformation causedby frictional force, and this causes an error inflow stress calculation. Therefore, it is necessaryto consider the inevitable interface friction in thetest and then identify it together with the flowstress.
For simultaneous identification of both thematerial parameters Pk and the friction factor mf,in addition to the measured load-stroke curve,one more measurable geometrical quantity in thetest, namely the barreling, is used. Barreling re-flects a degree of inhomogeneous deformationcaused by friction. Therefore, it allows the iden-tification of friction by measuring the barrelingshape of the specimen. During the inverse anal-ysis, the computed barreling shape is comparedwith the measured barreling shape and then thedifference is minimized by adjusting the frictionfactor. After several iterations, the difference inbarreling shape disappears and the friction factoris identified. Figure 8.3 shows a methodologyfor determining flow stress and interface frictionsimultaneously.
8.5 Example of Inverse Analysis
8.5.1 Flow Stress Model
The developed inverse analysis algorithm hasbeen tested by using the real experimental data
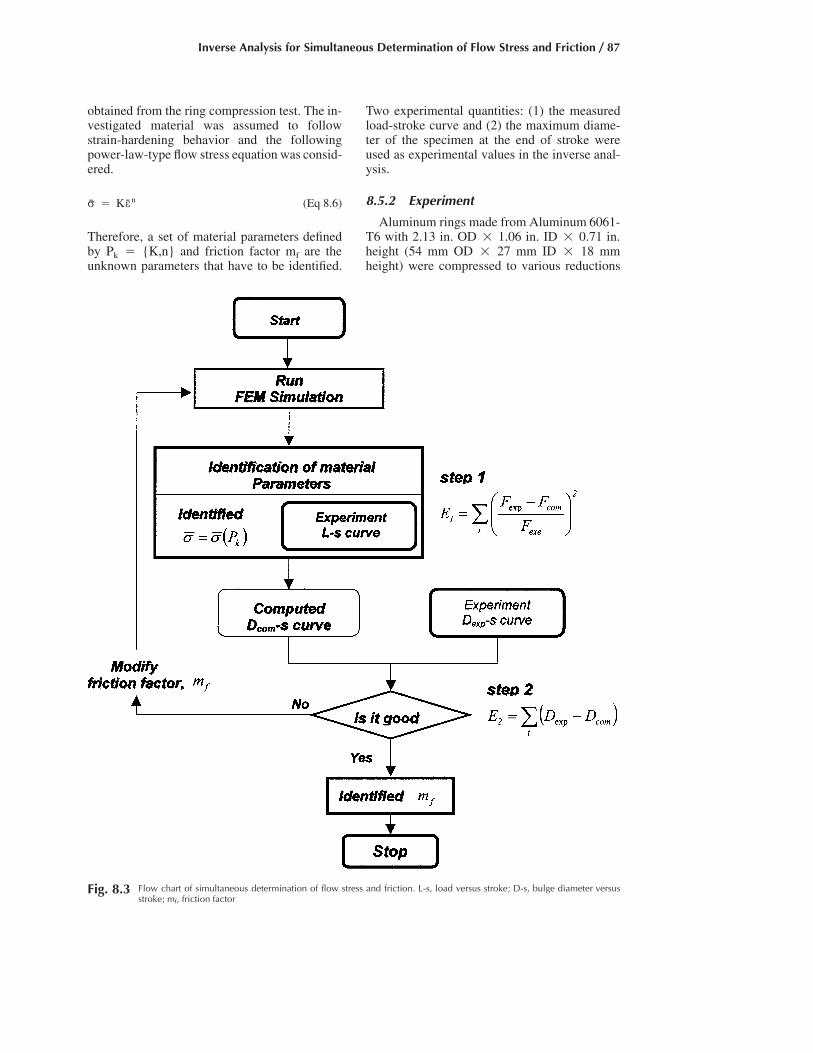
Inverse Analysis for Simultaneous Determination of Flow Stress and Friction / 87
Fig. 8.3 Flow chart of simultaneous determination of flow stress and friction. L-s, load versus stroke; D-s, bulge diameter versusstroke; mf, friction factor
obtained from the ring compression test. The in-vestigated material was assumed to followstrain-hardening behavior and the followingpower-law-type flow stress equation was consid-ered.
nr � Ke (Eq 8.6)
Therefore, a set of material parameters definedby Pk � {K,n} and friction factor mf are theunknown parameters that have to be identified.
Two experimental quantities: (1) the measuredload-stroke curve and (2) the maximum diame-ter of the specimen at the end of stroke wereused as experimental values in the inverse anal-ysis.
8.5.2 Experiment
Aluminum rings made from Aluminum 6061-T6 with 2.13 in. OD � 1.06 in. ID � 0.71 in.height (54 mm OD � 27 mm ID � 18 mmheight) were compressed to various reductions

88 / Cold and Hot Forging: Fundamentals and Applications
Fig. 8.4 Compressed ring samples
Table 8.2 Percent decrease in ID of ring
Reduction in height, % Decrease in ID of ring, %
7.2 �1.4822.2 �2.9640.0 �1.85
Table 8.3 Predicted inverse analysis results(ring test)
Decrease in ID K-value, MPa
Friction (mf) of ring, % ksi MPa n-value
0.2 �0.5 65 446 0.0730.15 �5.9 67 459 0.0760.175 �1.7 66 452 0.074 Fig. 8.5 Comparison of computed and experimental load-
stroke curves (ring test)
rized in Table 8.3. Three inverse analyses wereconducted by varying the friction factor from0.15 to 0.2. As initial guesses of material param-eters, K � 430 (MPa) and n � 0.1 were usedfor every case. When the friction factor 0.175was assumed, the inverse analysis predictionproduced only 8.1% underestimation in ID com-parison of the ring. Thus, a combination of fric-tion factor mf � 0.175 and flow stress �r
(MPa) gives the best minimum for the0.074452eobjective function. As can be seen in Fig. 8.5,after four optimization iterations, computed andexperimental loads are nearly identical.
8.5.4 Verification of theDetermined Friction Factor
To verify the accuracy of determined frictionfactor, FEM simulations using the determinedflow stress with friction factor of 0.175 wereconducted for various friction factors. Thus, thering calibration curves were generated as shownin Fig. 8.6. It is seen that measurements matchwell the curve obtained with the friction factorof 0.182, which is very close to 0.175.
8.5.5 Verification of theDetermined Flow Stress
In order to verify the flow stress determinedwith friction factor by the inverse analysis, thealuminum cylinders with a 30 mm diam � 30mm height were upset to 38% reduction inheight. To minimize interface friction, the inter-face was lubricated with Ecoform lubricantmade by Fuchs. As shown in Fig. 8.7, the lu-brication nearly eliminated bulging in upsettingof cylinder. Using the measured load-strokecurve, flow stress � (MPa) was ob-0.067r 437etained. The difference between the flow stress
in height. The rings were lubricated with Teflonspray on all surfaces of the samples and on thetop and bottom dies. In order to observe the in-ternal diameter variation the test was stopped atreductions of 7.2, 22.2, and 40%. Figure 8.4shows the compressed ring samples, and Table8.2 shows the decrease in ID of the ring at dif-ferent reductions.
8.5.3 Determination ofFlow Stress and Friction
The results of identifed parameters (K-valueand n-value) in the flow stress equation and fric-tion factor by the inverse analysis are summa-
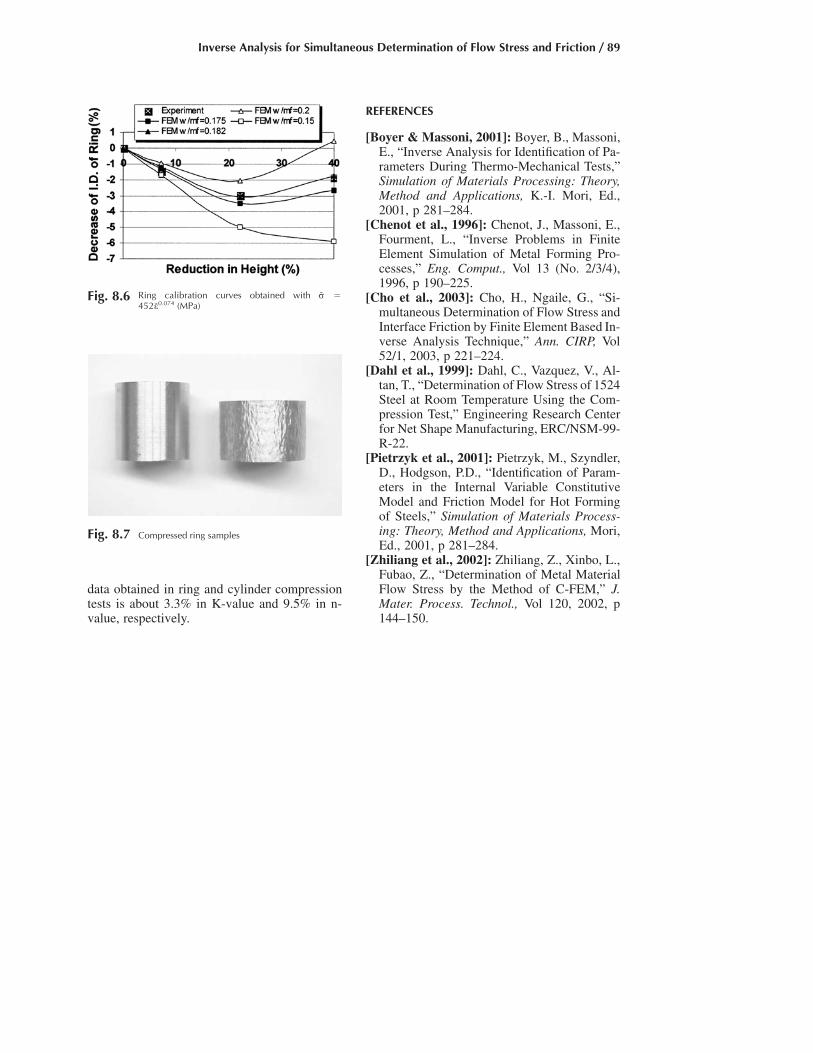
Inverse Analysis for Simultaneous Determination of Flow Stress and Friction / 89
Fig. 8.7 Compressed ring samples
data obtained in ring and cylinder compressiontests is about 3.3% in K-value and 9.5% in n-value, respectively.
REFERENCES
[Boyer & Massoni, 2001]: Boyer, B., Massoni,E., “Inverse Analysis for Identification of Pa-rameters During Thermo-Mechanical Tests,”Simulation of Materials Processing: Theory,Method and Applications, K.-I. Mori, Ed.,2001, p 281–284.
[Chenot et al., 1996]: Chenot, J., Massoni, E.,Fourment, L., “Inverse Problems in FiniteElement Simulation of Metal Forming Pro-cesses,” Eng. Comput., Vol 13 (No. 2/3/4),1996, p 190–225.
[Cho et al., 2003]: Cho, H., Ngaile, G., “Si-multaneous Determination of Flow Stress andInterface Friction by Finite Element Based In-verse Analysis Technique,” Ann. CIRP, Vol52/1, 2003, p 221–224.
[Dahl et al., 1999]: Dahl, C., Vazquez, V., Al-tan, T., “Determination of Flow Stress of 1524Steel at Room Temperature Using the Com-pression Test,” Engineering Research Centerfor Net Shape Manufacturing, ERC/NSM-99-R-22.
[Pietrzyk et al., 2001]: Pietrzyk, M., Szyndler,D., Hodgson, P.D., “Identification of Param-eters in the Internal Variable ConstitutiveModel and Friction Model for Hot Formingof Steels,” Simulation of Materials Process-ing: Theory, Method and Applications, Mori,Ed., 2001, p 281–284.
[Zhiliang et al., 2002]: Zhiliang, Z., Xinbo, L.,Fubao, Z., “Determination of Metal MaterialFlow Stress by the Method of C-FEM,” J.Mater. Process. Technol., Vol 120, 2002, p144–150.
Fig. 8.6 Ring calibration curves obtained with �r(MPa)0.074452e

CHAPTER 9
Methods ofAnalysis for Forging OperationsManas Shirgaokar
9.1 Introduction
The major process variables involved in forg-ing can be summarized as: (a) the billet materialproperties, (b) the tooling/dies, (c) tool/work-piece interface conditions, (d) forging equip-ment, (e) mechanics of the deformation zone,and (f) the environmental conditions. The majorobjectives of analyzing any forging operationare:
● Establish the kinematic relationships (shape,velocities, strain rates, and strain) betweenthe undeformed part (billet or preform) andthe deformed part (final forged product), i.e.,predict the metal flow during the formingoperation.
● Establish the limits of formability or produ-cibility, i.e., determine whether it is possibleto perform the forming operation withoutcausing any surface or internal failures(cracks or folds) in the deforming material.
● Predict the stresses, the forces, and the en-ergy necessary to carry out the formingoperation. This information is necessary fortool design and for selecting the appropriateequipment, with adequate force and energycapabilities, to perform the forming opera-tion.
There are several different approximate meth-ods, both analytical and numerical, for analyzingforging processes. None of these methods is per-fect because of the assumptions made in devel-
oping the mathematical approach. In addition,every method of analysis requires as input:
● A description of the material behavior underthe process conditions, i.e., the flow stressdata
● A quantitative value to describe the friction,i.e., the friction factor, m, or the friction co-efficient, l.
These two quantities themselves (flow stress andfriction) must be determined by experiment andare difficult to obtain accurately. Thus, any er-rors in flow stress measurement or uncertaintiesin the value of the friction factor are expected toinfluence the accuracy of the results of the anal-ysis.
Forging processes can be analyzed by severalmethods including the slab method, the slip-linemethod, the visioplasticity method, the upper-bound method, finite difference method, and thefinite element method. The capabilities and char-acteristics of these methods are summarized inTable 9.1 [Altan et al., 1979].
In the slab method, the workpiece being de-formed is decomposed into several slabs. Foreach slab, simplifying assumptions are mademainly with respect to stress distributions. Theresulting approximate equilibrium equations aresolved with imposition of stress compatibilitybetween slabs and boundary tractions. The finalresult is a reasonable load prediction with an ap-proximate stress distribution [Kobayashi et al.,1989].
The slip-line field method is used in planestrain for perfectly plastic materials (constant
Cold and Hot Forging Fundamentals and ApplicationsTaylan Altan, Gracious Ngaile, Gangshu Shen, editors, p91-105 DOI:10.1361/chff2005p091
Copyright © 2005 ASM International® All rights reserved. www.asminternational.org

92 / Cold and Hot Forging: Fundamentals and Applications
Table 9.1 Characteristics of various methods of analysis
InputOutput
Method Flow stress FrictionVelocity
fieldStressfield
Temperaturefield
Stresseson tools Comments
Slab Average (a)(b) No Yes No Yes Ignores redundant workUniform energy Average (b) No No No Average Redundant work can be included approximatelySlip line Average (a)(b) Yes Yes No Yes Valid for plane-strain problemsUpper bound Distribution (b) Yes No No Average Gives upper bound on loads, can determine
free boundariesHill’s Distribution (a)(b) Yes No No Average Can treat 3-D problemsFinite difference Distribution (a)(b) Yes Yes Yes Yes Requires considerable computer timeFinite element Distribution (a)(b) Yes Yes Yes Yes Same as aboveMatrix Distribution (a)(b) Yes Yes Yes Yes Treats rigid/plastic materialWeighted residuals Distribution (a)(b) Yes Yes Yes Yes Very general approach
(a) s � lrn. (b) s � . Source: [Altan et al., 1979]mr/ 3�
yield stress) and uses the hyperbolic propertiesthat the stress equations have in such cases. Theconstruction of slip-line fields, although produc-ing an “exact” stress distribution, is still quitelimited in predicting results that give good cor-relations with experimental work. From thestress distributions, velocity fields can be cal-culated through plasticity equations [Kobayashiet al., 1989].
The visioplasticity method [Thomsen et al.,1954] combines experiment and analysis. A gridis imprinted on the metal or modeling substancebefore deformation starts. Pictures taken at smallintervals during processing enable the investi-gator to construct a flow pattern. After the ve-locity vectors have been determined from an ac-tual test, strain rates are calculated and the stressdistributions are obtained from plasticity equa-tions. The method can be used to obtain reliablesolutions in detail for processes in which the ex-perimental determination of the velocity vectorswas possible.
The upper-bound method requires the“guessing” of admissible velocity fields (i.e.,satisfying the boundary conditions), amongwhich the best one is chosen by minimizing totalpotential energy. Information leading to a goodselection of velocity fields comes from experi-mental evidence and experience. This method,with experience, can deliver fast and relativelyaccurate prediction of loads and velocity distri-butions [Kobayashi et al., 1989].
All of the above highlighted methods of anal-ysis fail to consider temperature gradients,which are present in the deforming material dur-ing hot forming operations. As a result, the ef-fect of temperatures on flow stress and metalflow during hot forming are often not consideredadequately.
In the finite difference method, the deriv-atives in the governing partial differential equa-
tions are written in terms of difference equa-tions. Therefore, for a two-dimensional domain,a grid of cells is placed inside the domain andthe differencing approximation applied to eachinterior point. This results in a system of linearalgebraic equations (with a banded solution ma-trix), which yields a unique solution providedthe boundary conditions of the actual problemare satisfied. Though temperature gradients canbe taken into account, this method is limited toproblems with simple boundaries [Becker,1992].
In the finite element method, the entire so-lution domain is divided into small finite seg-ments (hence, the name “finite elements”). Overeach element, the behavior is described by thedifferential equations. All these small elementsare assembled together, and the requirements ofcontinuity and equilibrium are satisfied betweenneighboring elements. Provided the boundaryconditions of the actual problem are satisfied, aunique solution can be obtained to the overallsystem of linear algebraic equations (with asparsely populated solution matrix) [Becker,1992].
In recent years, the finite element method hasgained wide acceptance in the industry and ac-ademia. This can be attributed to the rapid ad-vancement in the computing technology, user-friendly commercial FE software and thedetailed information FEM can provide as com-pared to other methods of analysis. The FEmethod allows the user to incorporate in thesimulation: (a) the tool and workpiece tempera-tures, (b) the heat transfer during deformation,(c) strain-rate-dependent material properties, (d)strain hardening characteristics, and (e) capabil-ities for microstructure analysis. This results ina more accurate analysis of the forging process.Commercial FE software packages have been

Methods of Analysis for Forging Operations / 93
Fig. 9.1 Changes in shape during upsetting. Plane strain (initial width �o and initial height ho) and axisymmetric (initial radius Ro)
used successfully in simulating complex two-di-mensional (2-D) and three-dimensional (3-D)forging operations.
This chapter briefly discusses the slab, upper-bound, and the finite element (FE) methods.
9.2 Slab Method of Analysis
The following assumptions are made in usingthe slab method of analysis:
● The deforming material is isotropic and in-compressible.
● The elastic deformations of the deformingmaterial and the tool are neglected.
● The inertial forces are small and are ne-glected.
● The frictional shear stress, s, is constant atthe die/material interface and is defined ass � fr � mr/ 3.�
● The material flows according to the vonMises rule.
● The flow stress and the temperature are con-stant within the analyzed portion of the de-forming material.
The basic approach for the practical use of theslab method is as follows:
1. Estimate or assume a velocity or metal flowfield.
2. For this velocity field, estimate the averagestrains, strain rates, and temperatures withineach distinct time zone of the velocity field.
3. Thus, estimate an average value of the flowstress, within each distinct zone of de-r,formation.
4. Knowing and friction, derive or apply thernecessary equations for predicting the stressdistribution and the forming load (in theslab method) or the forming load and theaverage forming pressure (in the upper-bound method).
9.2.1 Application of SlabMethod to Plane-Strain Upsetting
The Velocity Field. In this case, deformationis homogeneous and takes place in the x-z plane(Fig. 9.1). The velocity field, with the velocitiesin the x, y, and z directions, is defined as:
v � �V z/h; v � V x/h; v � 0 (Eq 9.1)z D x D y
where VD is the velocity of the top die.The strain rates are:
�v Vz De � � � (Eq 9.2a)z �z h
�v Vx De � � � �e (Eq 9.2b)x z�x h
�vye � � 0 (Eq 9.2c)y �y
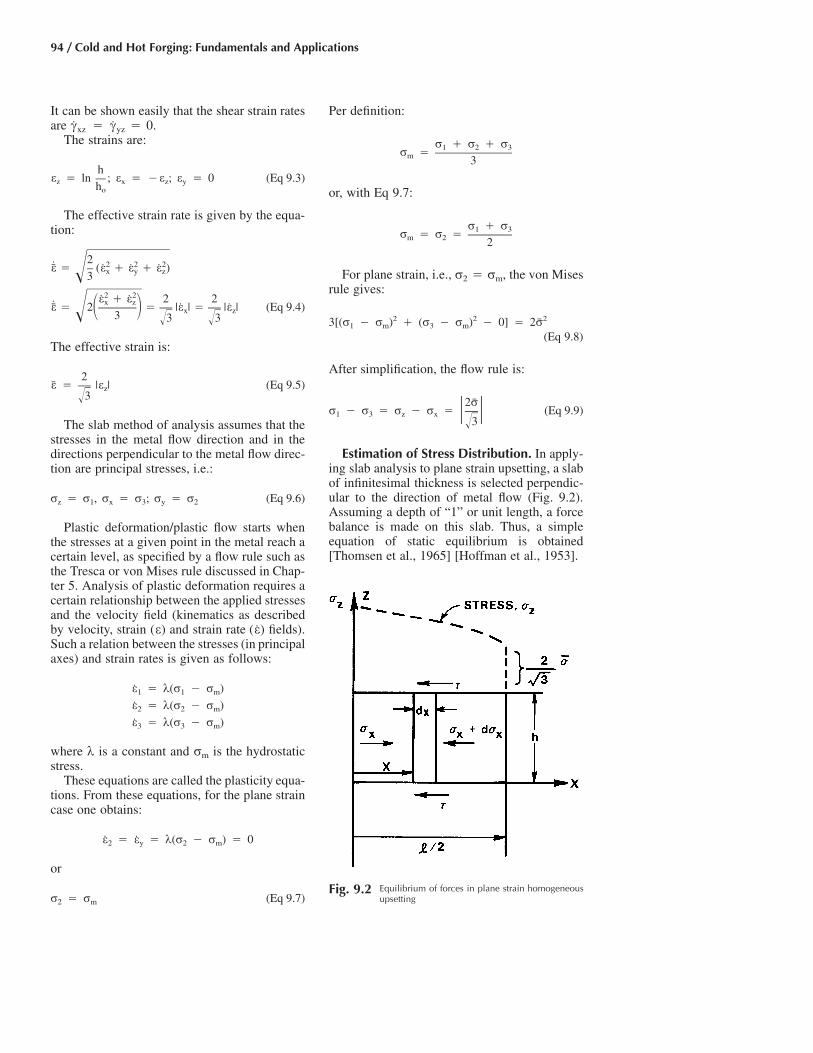
94 / Cold and Hot Forging: Fundamentals and Applications
Fig. 9.2 Equilibrium of forces in plane strain homogeneousupsetting
It can be shown easily that the shear strain ratesare � 0.c � cxz yz
The strains are:
he � ln ; e � �e ; e � 0 (Eq 9.3)z x z yho
The effective strain rate is given by the equa-tion:
2 2 2 2˙e � (e � e � e )x y z�3
2 2e � e 2 2x z˙e � 2 � |e | � |e | (Eq 9.4)x z� �� 3 3 3� �
The effective strain is:
2e � |e | (Eq 9.5)z
3�
The slab method of analysis assumes that thestresses in the metal flow direction and in thedirections perpendicular to the metal flow direc-tion are principal stresses, i.e.:
r � r , r � r ; r � r (Eq 9.6)z 1 x 3 y 2
Plastic deformation/plastic flow starts whenthe stresses at a given point in the metal reach acertain level, as specified by a flow rule such asthe Tresca or von Mises rule discussed in Chap-ter 5. Analysis of plastic deformation requires acertain relationship between the applied stressesand the velocity field (kinematics as describedby velocity, strain (e) and strain rate fields).(e)Such a relation between the stresses (in principalaxes) and strain rates is given as follows:
e � k(r � r )1 1 m
e � k(r � r )2 2 m
e � k(r � r )3 3 m
where k is a constant and rm is the hydrostaticstress.
These equations are called the plasticity equa-tions. From these equations, for the plane straincase one obtains:
e � e � k(r � r ) � 02 y 2 m
or
r � r (Eq 9.7)2 m
Per definition:
r � r � r1 2 3r �m 3
or, with Eq 9.7:
r � r1 3r � r �m 2 2
For plane strain, i.e., r2 � rm, the von Misesrule gives:
2 2 23[(r � r ) � (r � r ) � 0] � 2r1 m 3 m
(Eq 9.8)
After simplification, the flow rule is:
2rr � r � r � r � (Eq 9.9)1 3 z x � �
3�
Estimation of Stress Distribution. In apply-ing slab analysis to plane strain upsetting, a slabof infinitesimal thickness is selected perpendic-ular to the direction of metal flow (Fig. 9.2).Assuming a depth of “1” or unit length, a forcebalance is made on this slab. Thus, a simpleequation of static equilibrium is obtained[Thomsen et al., 1965] [Hoffman et al., 1953].
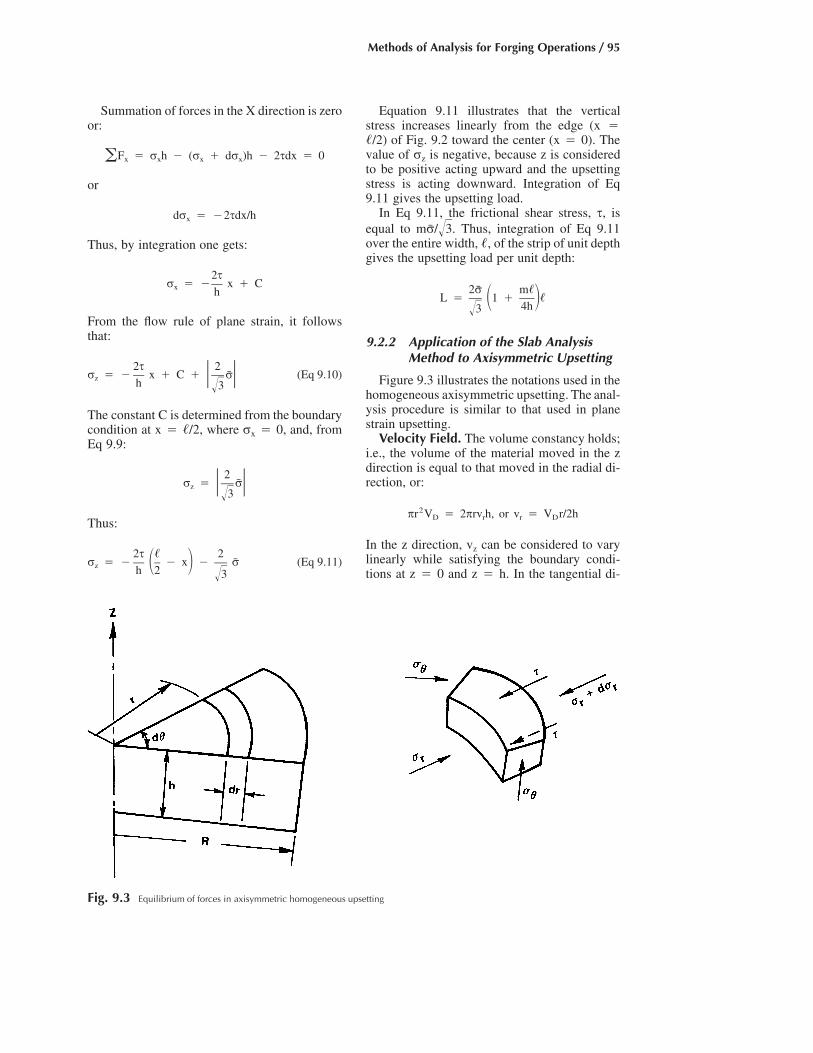
Methods of Analysis for Forging Operations / 95
Fig. 9.3 Equilibrium of forces in axisymmetric homogeneous upsetting
Summation of forces in the X direction is zeroor:
F � r h � (r � dr )h � 2sdx � 0� x x x x
or
dr � �2sdx/hx
Thus, by integration one gets:
2sr � � x � Cx h
From the flow rule of plane strain, it followsthat:
2s 2r � � x � C � r (Eq 9.10)z � �h 3�
The constant C is determined from the boundarycondition at x � �/2, where rx � 0, and, fromEq 9.9:
2r � rz � �
3�
Thus:
2s � 2r � � � x � r (Eq 9.11)z � �h 2 3�
Equation 9.11 illustrates that the verticalstress increases linearly from the edge (x ��/2) of Fig. 9.2 toward the center (x � 0). Thevalue of rz is negative, because z is consideredto be positive acting upward and the upsettingstress is acting downward. Integration of Eq9.11 gives the upsetting load.
In Eq 9.11, the frictional shear stress, s, isequal to Thus, integration of Eq 9.11mr/ 3.�over the entire width, �, of the strip of unit depthgives the upsetting load per unit depth:
2r m�L � 1 � �� �4h3�
9.2.2 Application of the Slab AnalysisMethod to Axisymmetric Upsetting
Figure 9.3 illustrates the notations used in thehomogeneous axisymmetric upsetting. The anal-ysis procedure is similar to that used in planestrain upsetting.
Velocity Field. The volume constancy holds;i.e., the volume of the material moved in the zdirection is equal to that moved in the radial di-rection, or:
2pr V � 2prv h, or v � V r/2hD r r D
In the z direction, vz can be considered to varylinearly while satisfying the boundary condi-tions at z � 0 and z � h. In the tangential di-

96 / Cold and Hot Forging: Fundamentals and Applications
rection, H, there is no metal flow. Thus, the ve-locities are:
v � V r/2h; v � �V z/h; v � 0 (Eq 9.13)r D z D H
In order to obtain the strain rate in the tan-gential direction, it is necessary to consider theactual metal flow since vH � 0 and cannot beused for taking a partial derivative. FollowingFig. 9.3, the increase in strain in the H direction,i.e., the length of the arc, is given by:
(r � dr)dH � rdH drde � � (Eq 9.14)H rdH r
or the strain rate is
de dr 1 v VH r De � � � � (Eq 9.14a)H dt dt r r 2h
The other strain rates are:
�v Vz De � � � (Eq 9.14b)z �z h
�v Vr De � � � e (Eq 9.14c)r H�r 2h
1 �v �vrc � � � 0 (Eq 9.14d)rz � �2 �z �r
c � c � 0 (Eq 9.14e)Hz rH
Thus, the effective strain rate is:
2 2 2 2˙e � (e � e � e ) � |e | (Eq 9.15)H r z z�3
The strains can be obtained by integrating thestrain rates with respect to time, i.e.:
t t V dtDe � e dt � �z z� �t t ho o
or with �dh � �VDdt:
h dh he � � � �ln (Eq 9.16a)z �
h h ho o
Similarly, the other strains can be obtained as:
1 h eze � e � ln � � (Eq 9.16b)H r 2 h 2o
In analogy with Eq 9.15, the effective strain is:
e � |e | (Eq 9.17)z
The flow rule for axisymmetric deformationis obtained by using a derivation similar to thatused in plane strain deformation. Because
, the plasticity equations give:e � er h
r � r or r � rr h 2 3
Thus, the von Mises flow rule for axisymmetricupsetting is:
r � r � |r | or r � r � |r | (Eq 9.18)1 2 z r
Estimation of Stress Distribution. The equi-librium of forces in the r direction (Fig. 9.3)gives [Thomsen et al., 1965] [Hoffman et al.,1953]:
F � r (dh)rh � (r � dr )� r r r r
dh(r � dr)hdh � 2r sinh 2
hdr � 2srdhdr � 0 (Eq 9.19)
The angle dh is very small. Thus, with sin dh/2� dh/2, and after canceling appropriate terms,Eq 9.19 reduces to:
dr 2sr�r � r � r � r � 0 (Eq 9.20)r hdr h
Since in axisymmetric deformation, e � e ,r h
the plasticity equations give:
dr 2srr � r , or � � 0 (Eq 9.21)r h dr h
Integration gives:
2sr � � r � Cr h
The constant C is determined from the conditionthat at the free boundary, r � R in Fig. 9.3, andthe radial stress rr � 0. Thus, integration of Eq9.21 gives:
2sr � (r � R) (Eq 9.22)r h
Methods of Analysis for Forging Operations / 97
With the flow rule, Eq 9.22 is transformedinto:
2sr � (r � R) � r (Eq 9.23)z h
Equation 9.23 illustrates that the stress increaseslinearly from the edge toward the center. Theupsetting load can now be obtained by integrat-ing the stress distribution over the circular sur-face of the cylindrical upset:
R
L � r 2prdrz�0
Considering that s � integration gives:mr/ 3,�
2mR2L � rpR 1 � (Eq 9.24)� �3h 3�
9.3 Upper Bound Method andIts Application toAxisymmetric Upsetting
9.3.1 Principles of the Method
This method can be used to estimate the de-formation load and the average forming pres-sure. For describing metal flow with the upper-bound method, it is necessary to make the usualassumptions, discussed earlier in the slabmethod, as well as perform the following steps:
1. Describe a family of admissible velocityfields (use parameters to be determined later);these must satisfy the conditions of: incom-pressibility, continuity, and velocity bound-aries.
2. Calculate the energy rates of deformation, in-ternal shear, and friction shear.
3. Calculate the total energy rate and minimizeit with respect to unknown parameters of ve-locity field formulation.
The load is then obtained by dividing the energyrate by the relative velocity between the die andthe deforming material.
The total energy rate, ET, is given by ET �load � die velocity, or [Avitzur, 1968]:
˙ ˙ ˙ ˙E � LV � E � E � ET D D S F
or
˙ ˙E � redV � s|Dv|ds � s v dsT i i� � �V SS SF
(Eq 9.25)
where ED, ES, and EF are the energy rates fordeformation, internal shear, and friction, respec-tively; L is the forming load; V is the volume ofdeforming material; v is the relative velocity be-tween two zones of material, when the velocityfield has internal shear surfaces; S indicates sur-face (internal or at die/material interface); vi isthe die material interface velocity in the “i” por-tion of the deforming material; s � andr/ 3;�si � � interface shear stress at the “i”m r/ 3�iportion of the deforming material.
Based on limit theorems [Avitzur, 1968], theload calculated with Eq 9.25 is necessarilyhigher than the actual load and therefore repre-sents an upper bound to the actual forming load.Thus, the lower this upper bound load is, thebetter the prediction. Often the velocity fieldconsidered includes one or more parameters thatare determined by minimizing the total energyrate with respect to those parameters. Thus, asomewhat better upper-bound velocity field andsolution are obtained. In general, with an in-creasing number of parameters in the velocityfield, the solution improves while the computa-tions become more complex. Consequently, inthe practical use of the upper-bound method,practical compromises are made in selecting anadmissible velocity field.
9.3.2 Application to AxisymmetricHomogeneous Upsetting
The velocity field for homogeneous upsettingis given by Eq 9.13 to 9.15. Thus, all the veloc-ities and strain rates are known. Assuming a con-stant flow stress, the deformation energy rater,is:
VD2˙ ˙E � redV � hpR r (Eq 9.26)D �v h
ES (internal shear energy rate) � 0, becausethere are no internal velocity discontinuities inthe present homogeneous velocity field.
The friction energy rate is:
E � 2 s v dsF i i�SF
where vi is the radial velocity, given in Eq 9.13,and ds � 2prdr. EF includes the friction energies

98 / Cold and Hot Forging: Fundamentals and Applications
on both the top and bottom surfaces of the de-forming part. Thus,
R RV 4ps VD i D 2E � 2 s r2prdr � r drF i� �0 2h 2h 0
or, with s � mr/ 3,�
2 r VD 3E � pm R (Eq 9.27)F 3 h3�
The total energy rate is:
˙ ˙ ˙E � E � ET D F
or
2 r VD2 3E � pR rV � pm R (Eq 9.28)T D 3 h3�
The load is:
E 2 RT 2L � � pR r 1 � m (Eq 9.29)� �V hD 3 3�
Comparison of Eq 9.29 and 9.24 indicates thatin axisymmetric homogeneous upsetting theloads calculated by the slab and upper-boundmethods both give the same end result.
9.3.3 Application toNonhomogeneous Upsetting
Homogeneous upsetting can only be achievedat low strains and with nearly perfect lubrica-tion. In all practical upsetting operations, thefriction at the die/material interface prevents themetal from flowing radially in a uniform fash-ion. As a result, bulging of the free surfaces oc-curs, and the radial and axial velocities are func-tions of z as well as of r. In this case, a velocityfield may be given by [Lee et al., 1972]:
v � 0 (Eq 9.30a)h
2v � �2Az(1 � bz /3) (Eq 9.30b)z
2v � A(1 � bz )r (Eq 9.30c)r
where b is a parameter representing the severityof the bulge, and A is determined from the ve-locity boundary condition at z � h, to be:
VDA �22h(1 � bh /3)
The strain rates are:
vr 2e � � A(1 � bz ) (Eq 9.31a)r r
vr 2e � � A(1 � bz ) (Eq 9.31b)h r
vz 2e � � �2A(1 � bz ) (Eq 9.31c)z z
c � c � 0;rh hz
�v �vr zc � � � �2Abzr (Eq 9.31d)rz �z �r
The effective strain rate is calculated from:
1/22 12 2 2 2˙e � e � e � e � cr h z rz� � �3 2
or
2A 2 2 2 1/2˙e � [3(1 � bz ) � (brz) ] (Eq 9.32)3�
The total energy dissipation, ET, given by Eq9.25 can now be calculated analytically or nu-merically. The exact value of b is determinedfrom the minimization condition, i.e., from:
˙�ET� 0
�b
The value of b, obtained from Eq 9.33, is usedto calculate the velocities and strain rates thatthen give the minimum value of the energy rate,Emin. The upsetting load is then given by:
˙L � E /Vmin D
9.4 Finite ElementMethod in Metal Forming
The basic approach of the finite element (FE)method is one of discretization. The FE modelis constructed in the following manner [Kobay-ashi et al., 1989]:
● A number of finite points are identified inthe domain of the function and the values of

Methods of Analysis for Forging Operations / 99
the function and its derivatives, when appro-priate, are specified at these points.
● The domain of the function is representedapproximately by a finite collection of sub-domains called finite elements.
● The domain is then an assemblage of ele-ments connected together appropriately ontheir boundaries.
● The function is approximated locally withineach element by continuous functions thatare uniquely described in terms of the nodalpoint values associated with the particularelement.
The path to the solution of a finite elementproblem consists of five specific steps: (1) iden-tification of the problem, (2) definition of theelement, (3) establishment of the element equa-tion, (4) the assemblage of element equations,and (5) the numerical solution of the globalequations. The formation of element equationsis accomplished from one of four directions: (a)direct approach, (b) variational method, (c)method of weighted residuals, and (d) energybalance approach.
The main advantages of the FE method are:
● The capability of obtaining detailed solu-tions of the mechanics in a deforming body,namely, velocities, shapes, strains, stresses,temperatures, or contact pressure distribu-tions
● The fact that a computer code, once written,can be used for a large variety of problemsby simply changing the input data
9.4.1 Basis for theFinite Element Formulation
The basis for the finite element metal formingformulation, using the “variational approach,” isto formulate the proper functional (function offunctions) depending on specific constitutive re-lations. The variational approach is based on oneof two variational principles. It requires thatamong admissible velocities ui that satisfy theconditions of compatibility and incompressibil-ity, as well as the velocity boundary conditions,the actual solution gives the following func-tional a stationary value [Kobayashi et al.,1989]:
˙p � redV � F u dS (Eq 9.35a)i i� �V SF
(for rigid-plastic materials) and:
p � E(e )dV � F u dS (Eq 9.35b)ij i i� �V SF
(for rigid-viscoplastic materials) where is thereffective stress, is the effective strain rate, Fi
˙erepresents surface tractions, is the workE(e )ijfunction, and V and S the volume and surfaceof the deforming workpiece, respectively. Thesolution of the original boundary-value problemis then obtained from the solution of the dual-variational problem, where the first-order vari-ation of the functional vanishes, namely:
˙dp � rdedV � F du dS � 0 (Eq 9.36)i i� �V SF
where for the rigid-˙r � r(e) and r � r(e,e)plastic and rigid-viscoplastic materials, respec-tively.
For an accurate finite element prediction ofmaterial flow in a forging process, the formula-tion must take into account the large plastic de-formation, incompressibility, workpiece-toolcontact, and, when necessary, temperature cou-pling.
The basic equations to be satisfied are theequilibrium equation, the incompressibility con-dition, and the constitutive relationship. Whenapplying the penalty method, the velocity is theprimary solution variable. The variational equa-tion is in the form [Li et al., 2001]:
˙dp(v) � rdedV � K e de dVv v� �V V
� F du dS � 0 (Eq 9.37)i i�SF
where K, a penalty constant, is a very large posi-tive constant.
An alternative method of removing the in-compressibility constraint is to use a Lagrangemultiplier [Washizu, 1968] and [Lee et al., 1973]and modifying the functional by adding the term
is the volumetric�ke dV, where e � e ,v v iistrain rate. Then:
˙dp � rdedV � kde dVv� �V V
� edkdV � F du dS � 0 (Eq 9.38)i i� �V SF
In the mixed formulation, both the velocityand pressure are solution variables. They are

100 / Cold and Hot Forging: Fundamentals and Applications
solved by the following variational equation [Liet al., 2001],
˙dp(v,p) � rdedV � pde dV � e dpv v� � �V V V
� F du dS � 0 (Eq 9.39)i i�SF
where p is the pressure.Equations 9.37 to 9.39 can be converted into
a set of algebraic equations by utilizing the stan-dard FEM discretization procedures. Due to thenonlinearity involved in the material propertiesand frictional contact conditions, this solution isobtained iteratively.
The temperature distribution of the workpieceand/or dies can be obtained readily by solvingthe energy balance equation rewritten by usingthe weighted residual method as [Li et al., 2001]:
˙kT dT dV � qcTdTdVij ij� �V V
˙� �redTdV � q dTdS (Eq 9.40)n� �V S
where k is the thermal conductivity, T the tem-perature, q the density, c the specific heat, � afraction of deformation energy that converts intoheat, and qn the heat flux normal to the boundary,including heat loss to the environment and fric-tion heat between two contacting objects. UsingFEM discretization, Eq 9.40 can also be con-verted to a system of algebraic equations andsolved by a standard method. In practice, thesolutions of mechanical and thermal problemsare coupled in a staggered manner. After thenodal velocities are solved at a given step, thedeformed configuration can be obtained by up-dating the nodal coordinates [Li et al., 2001].
9.4.2 Computer Implementation of theFinite Element Method
Computer implementation of the basic stepsin a standard finite element analysis consists ofthree distinct units, viz. the preprocessor, pro-cessor, and the postprocessor.
Preprocessor. This operation precedes theanalysis operation. It takes in minimal infor-mation from the user (input) to generate all nec-essary problem parameters (output) required fora finite element analysis.
The input to the preprocessor includes infor-mation on the solid model, discretization re-
quirements, material identification and parame-ters, and boundary conditions; whereas theoutput includes coordinates for nodes, elementconnectivity and element information, values ofmaterial parameters for each element, andboundary loading conditions on each node.
In the preprocessing stage, a continuum is di-vided into a finite number of subregions (or ele-ments) of simple geometry (triangles, rectan-gles, tetrahedral, etc.). Key points are thenselected on elements to serve as nodes whereproblem equations such as equilibrium and com-patibility are satisfied.
In general, preprocessing involves the follow-ing steps to run a successful simulation using acommercial FE package:
1. Select the appropriate geometry/section forsimulation based on the symmetry of thecomponent to be analyzed.
2. Assign workpiece material properties in theform of the flow stress curves. These may beuser defined or selected from the databaseprovided in the FE package.
3. Mesh the workpiece using mesh density win-dows, if necessary, to refine mesh in criticalareas.
4. Define the boundary conditions (velocity,pressure, force, etc.). Specify the movementand direction for the dies. Specify the inter-face boundary and friction conditions. Thisprevents penetration of the dies into theworkpiece and also affects the metal flow de-pending on the friction specified. In massiveforming processes such as forging, extrusion,etc., the shear friction factor “m” is specified.
Note: If die stress analysis or thermal analysisis required, one would need to mesh the dies andspecify the material properties for them. Alsodie and workpiece temperatures and interfaceheat transfer coefficients would need to be spec-ified. Material data at elevated temperatureswould be required for the tools and the work-piece. The die stress analysis procedure is de-scribed in Chapter 16 on process modeling inimpression die forging.
Processor. This is the main operation in theanalysis. The output from the preprocessor (in-cluding nodal coordinates, element connectivity,material parameters, and boundary/loading con-ditions) serves as the input to this module. Itestablishes a set of algebraic equations that areto be solved, from the governing equations ofthe boundary value problem. The governing

Methods of Analysis for Forging Operations / 101
Fig. 9.4 Flowchart of finite element implementation
equations include conservation principles, ki-nematic relations, and constitutive relations. TheFE engine/solver then solves the set of linear ornonlinear algebraic equations to obtain the statevariables at the nodes. It also evaluates the fluxquantities inside each element.
The following steps are pursued in this opera-tion:
1. A suitable interpolation function is assumedfor each of the dependent variables in termsof the nodal values.
2. Kinematic and constitutive relations are sat-isfied within each element.
3. Using work or energy principles, stiffnessmatrices and equivalent nodal loads are es-tablished.
4. Equations are solved for nodal values of thedependent variables.
Postprocessor. This operation prints andplots the values of state variables and fluxes inthe meshed domain. Reactions may be evalu-ated. Output may be in the form of data tablesor as contour plots.
Figure 9.4 shows a flowchart, which showsthe sequence of finite element implementationin analysis of metal forming processes.
In interpreting FE results, careful attention isrequired since the idealization of the physicalproblem to a mathematical one involves certainassumptions that lead to the differential equationgoverning the mathematical model. As illus-trated in Fig. 9.5, refinement of the mesh size,alteration of the boundary conditions, etc., maybe needed to increase the accuracy of the solu-tion.
9.4.3 Analysis of AxisymmetricUpsetting by the FE Method
The use of the FE method in analysis of forg-ing processes is discussed with the help of a sim-ple cylindrical compression simulation. Figure9.6(a) shows the cutaway of a cylinder, which isto be upset. Since the cylinder is symmetricabout the central axis, i.e., axisymmetric, a 2-Dsimulation is adequate to analyze the metal flowduring deformation. Figure 9.6(b) shows the halfmodel selected for simulation as a result of ro-tational symmetry, with the nodes along the axisof symmetry (centerline) restricted along the R-direction. This model can be further simplifiedto yield a quarter model (Fig. 9.6c) with veloc-ity/displacement boundary conditions restrictingthe movement of the nodes along the Z-direction
as shown. The boundary conditions necessary tobe prescribed for this problem under isothermalconditions can be summarized as:
● Velocity/displacement boundary conditionsdepending on the symmetry of the work-piece, to restrict to movement of nodes alongthe planes of symmetry as required
● Die movement and direction according to theprocess being analyzed
● Interface friction conditions at the surfacesof contact between the tools and the work-piece
9.4.4 Analysis ofPlane Strain Deformation
Figure 9.7 shows the setup of an FE modelfor a plane strain condition. In this case the parthas a uniform cross section along the length and

102 / Cold and Hot Forging: Fundamentals and Applications
Fig. 9.5 The process of finite element analysis. [Bathe, 1996]
the strain along the Z or length direction is neg-ligible; i.e., ez is negligible. Hence, only the two-dimensional cross section shown in Fig. 9.7(b)is selected for process simulation.
The procedure for simulation is the same asmentioned for the axisymmetric case. However,the velocity boundary conditions are differentsince the metal is free to flow in the X direction(Fig. 9.7b). If, however, the cross section is uni-form, a quarter model can be used for simulationas shown in Fig. 9.7(c) with velocity boundaryconditions similar to those used for the axisym-metric case discussed in the previous section. Itshould be noted, however, that the results ob-tained from the plane strain simulation have tobe multiplied by the length of the billet used forthe forging process to get the final results.
9.4.5 Three-DimensionalNonisothermal FE Analysis
Figure 9.8 shows the FE model of the hotforging process of an automotive component.The starting preform geometry is not axisym-metric; hence a 2-D simulation could not be usedto analyze the metal flow. The preform is, how-ever, symmetric, and hence a quarter modelcould be used for modeling the process. Sincethe forging process is performed at elevated tem-peratures, a nonisothermal simulation is con-ducted. The simulation input differs from thoseof an isothermal simulation in the followingways:
● Tool and workpiece temperatures have to beconsidered, and thermal properties such as

Methods of Analysis for Forging Operations / 103
Fig. 9.7 Analysis of plane strain upsetting by the FE method. (a) Part for plane strain upsetting. (b) Full model. (c) Quarter model
Fig. 9.6 Analysis of axisymmetric cylinder upsetting using the FE method. (a) Cutaway of the cylinder. (b) Half model. (c) Quartermodel
thermal conductivity, heat capacity, interfaceheat transfer coefficients, etc. have to bespecified.
● Die and workpiece material properties arespecified as a function of temperature andstrain rate. Dies (still considered as rigid)have to be meshed since heat transfer be-tween workpiece and tools is simulated.
The boundary conditions in a 3-D simulation aresimilar to those in a 2-D process:
● Velocity/displacement boundary conditionsneed to be specified depending on the work-
piece geometry. In Fig. 9.8(b), movement ofthe boundary nodes is restricted along theplanes of symmetry.
● Interface friction is specified depending onthe type of lubrication at the tool/workpieceinterface. In addition to the friction, the in-terface heat transfer coefficient is also a criti-cal input to the simulation.
9.4.6 Mesh Generation in FESimulation of Forging Processes
Bulk forming processes are generally char-acterized by large plastic deformation of the

104 / Cold and Hot Forging: Fundamentals and Applications
Fig. 9.8 Three-dimensional non-isothermal FE simulation of a forging process. (a) FE model. (b) Final part with temperature contour.
workpiece accompanied by significant relativemotion between the deforming material and thetool surfaces. The starting mesh in the FE simu-lation is generally well defined with the help ofmesh density windows to refine the mesh incritical areas. However, as the simulation pro-gresses the mesh tends to get significantly dis-torted. This calls for (a) the generation of a newmesh taking into consideration the updated ge-ometry of the workpiece and (b) interpolation ofthe deformation history from the old mesh to thenew mesh. Current commercial FE codes, suchas DEFORM� accomplish this using automaticmesh generation (AMG) subroutines. AMG ba-sically determines the optimal mesh density dis-tribution and generates the mesh based on thegiven density. Once the mesh density was de-fined, the mesh generation procedure considersthe following factors [Altan et al., 1979]:
● Geometry representation.● Density representation. The density specifi-
cation is accommodated in the geometry.● Identification of critical points (like sharp
corner points) for accurate representation ofthe geometry.
● Node generation. The number of nodes be-tween critical points are generated and re-positioned based on the density distribution.
● Shape improvement and bandwidth mini-mization. The shape of the elements after themesh generation procedure has to besmoothed to yield a usable mesh. Also thebandwidth of the stiffness matrix has to beimproved to obtain a computationally effi-cient mesh.
The FE modeling inputs and outputs are dis-cussed in detail in Chapter 16 on process mod-eling.
FE simulation is widely used in the industryfor the design of forging sequences, predictionof defects, optimization of flash dimensions, diestress analysis, etc. A number of commercial FEcodes are available in the market for simulationof bulk forming processes, viz. DEFORM�,FORGE�, QFORM�, etc. Some practical ap-plications of FE simulation in hot and cold forg-ing processes are presented in Chapters 16 and18.
REFERENCES
[Altan et al., 1979]: Altan, T., Lahoti, G.D.,“Limitations, Applicability and Usefulness ofDifferent Methods in Analyzing FormingProblems,” Ann. CIRP, Vol 28 (No. 2), 1979,p 473.
[Avitzur, 1968]: Avitzur, B., Metal Forming:Processes and Analysis, McGraw-Hill,1968.
[Bathe, 1996]: Bathe, K.J., Finite Element Pro-cedures, Prentice Hall, 1996.
[Becker, 1992]: Becker, A.A., The BoundaryElement Method in Engineering, McGraw-Hill International Editions, 1992.
[Hoffman et al., 1953]: Hoffman, O., Sachs, G.,Introduction to the Theory of Plasticity forEngineers, McGraw-Hill, 1953.
[Kobayashi et al., 1989]: Kobayashi, S., Oh,S.I., Altan, T., Metal Forming and the FiniteElement Method, Oxford University Press,1989.

Methods of Analysis for Forging Operations / 105
[Lee et al., 1972]: Lee, C.H., Altan, T., “Influ-ence of Flow Stress and Friction upon MetalFlow in Upset Forging of Rings and Cylin-ders,” ASME Trans., J. Eng. Ind., Aug 1972,p 775.
[Lee et al., 1973]: Lee, C.H., Kobayashi, S.,“New Solutions to Rigid-Plastic DeformationProblems using a Matrix Method,” Trans.ASME, J. Eng. Ind., Vol 95, p 865.
[Li et al., 2001]: Li, G., Jinn, J.T., Wu, W.T.,Oh, S.I., “Recent Development and Applica-tions of Three-Dimensional Finite ElementModeling in Bulk Forming Processes,” J. Ma-ter. Process. Technol., Vol 113, 2001, p 40–45.
[Thomsen et al., 1954]: Thomsen, E.G., Yang,C.T., Bierbower, J.B., “An Experimental In-
vestigation of the Mechanics of Plastic De-formation of Metals,” Univ. of CaliforniaPub. Eng., Vol 5, 1954.
[Thomsen et al., 1965]: Thomsen, E.G., Yang,C.T., Kobayashi, S., Mechanics of Plastic De-formation in Metal Processing, Macmillan,1965.
[Washizu, 1968]: Washizu, K., VariationalMethods in Elasticity and Plasticity, Perga-mon Press, Oxford, 1968.
SELECTED REFERENCE
[Altan et al., 1983]: Altan, T., Oh, S.I., Gegel,H., Metal Forming: Fundamentals and Appli-cations, ASM International, 1983.
CHAPTER 10
Principles of Forging MachinesManas Shirgaokar
10.1 Introduction
In a practical sense, each forming process isassociated with at least one type of forming ma-chine (or “equipment,” as it is sometimes calledin practice). The forming machines vary in fac-tors such as the rate at which energy is appliedto the workpiece and the capability to controlthe energy. Each type has distinct advantagesand disadvantages, depending on the number offorgings to be produced, dimensional precision,and the alloy being forged. The introduction ofa new process invariably depends on the costeffectiveness and production rate of the machineassociated with that process. Therefore, capabil-ities of the machine associated with the new pro-cess are of paramount consideration. The form-ing (industrial, mechanical, or metallurgical)engineer must have specific knowledge of form-ing machines so that he/she can:● Use existing machinery more efficiently● Define with accuracy the existing plant ca-
pacity● Better communicate with, and at times re-
quest improved performance from, the ma-chine builder
● If necessary, develop in-house proprietarymachines and processes not available in themachine-tool market
10.2 Interaction betweenProcess Requirements andForming Machines
The behavior and characteristics of the form-ing machine influence:● The flow stress and workability of the de-
forming material
● The temperatures in the material and in thetools, especially in hot forming
● The load and energy requirements for agiven product geometry and material
● The “as-formed” tolerances of the parts● The production rate
The interaction between the principal ma-chine and process variables is illustrated in Fig.10.1 for hot forming processes conducted inpresses. As can be seen in Fig. 10.1, the flowstress, the interface friction conditions, andr,the forging geometry (dimensions, shape) deter-mine (a) the load, LP, at each position of thestroke and (b) the energy, EP, required by theforming process.
The flow stress, increases with increasingr,deformation rate, and with decreasing tem-˙e,perature, h. The magnitudes of these variationsdepend on the specific forming material. Thefrictional conditions deteriorate with increasingdie chilling.
As indicated by lines connected to the tem-perature block, for a given initial stock tempera-ture, the temperature variations in the part arelargely influenced by (a) the surface area of con-tact between the dies and the part, (b) the partthickness or volume, (c) the die temperature, (d)the amount of heat generated by deformationand friction, and (e) the contact time under pres-sure.
The velocity of the slide under pressure, Vp,determines mainly the contact time under pres-sure, tp, and the deformation rate, The number˙e.of strokes per minute under no-load conditions,no, the machine energy, EM, and the deformationenergy, Ep, required by the process influence theslide velocity under load, Vp, and the number of
Cold and Hot Forging Fundamentals and ApplicationsTaylan Altan, Gracious Ngaile, Gangshu Shen, editors, p107-113 DOI:10.1361/chff2005p107
Copyright © 2005 ASM International® All rights reserved. www.asminternational.org

108 / Cold and Hot Forging: Fundamentals and Applications
Fig. 10.1 Relationships between process and machine variables in hot forming process conducted in presses. [Altan et al., 1973]
strokes under load, np; np determines the maxi-mum number of parts formed per minute (i.e.,the production rate) provided that feeding andunloading of the machine can be carried out atthat speed.
The relationships illustrated in Fig. 10.1 applydirectly to hot forming of discrete parts in hy-draulic, mechanical, and screw presses, whichare discussed later. However, in principle, mostof the same relationships apply also in other hotforming processes such as hot extrusion and hotrolling.
10.3 Load and EnergyRequirements in Forming
It is useful to consider forming load and en-ergy as related to forming equipment. For agiven material, a specific forming operation(such as closed-die forging with flash, forward,or backward extrusion, upset forging, bending,etc.) requires a certain variation of the formingload over the slide displacement (or stroke). This
fact is illustrated qualitatively in Fig. 10.2,which shows load versus displacement curvescharacteristic of various forming operations.
For a given part geometry, the absolute loadvalues will vary with the flow stress of the givenmaterial as well as with frictional conditions. Inthe forming operation, the equipment must sup-ply the maximum load as well as the energy re-quired by the process.
The load-displacement curves, in hot forginga steel part under different types of forgingequipment, are shown in Fig. 10.3. These curvesillustrate that, due to strain rate and temperatureeffects, for the same forging process, differentforging loads and energies are required by dif-ferent machines. For the hammer, the forgingload is initially higher, due to strain-rate effects,but the maximum load is lower than for eitherhydraulic or screw presses. The reason is thatthe extruded flash cools rapidly in the presses,while in the hammer, the flash temperature re-mains nearly the same as the initial stock tem-perature.
Thus, in hot forging, not only the material andthe forged shape, but also the rate of deformation
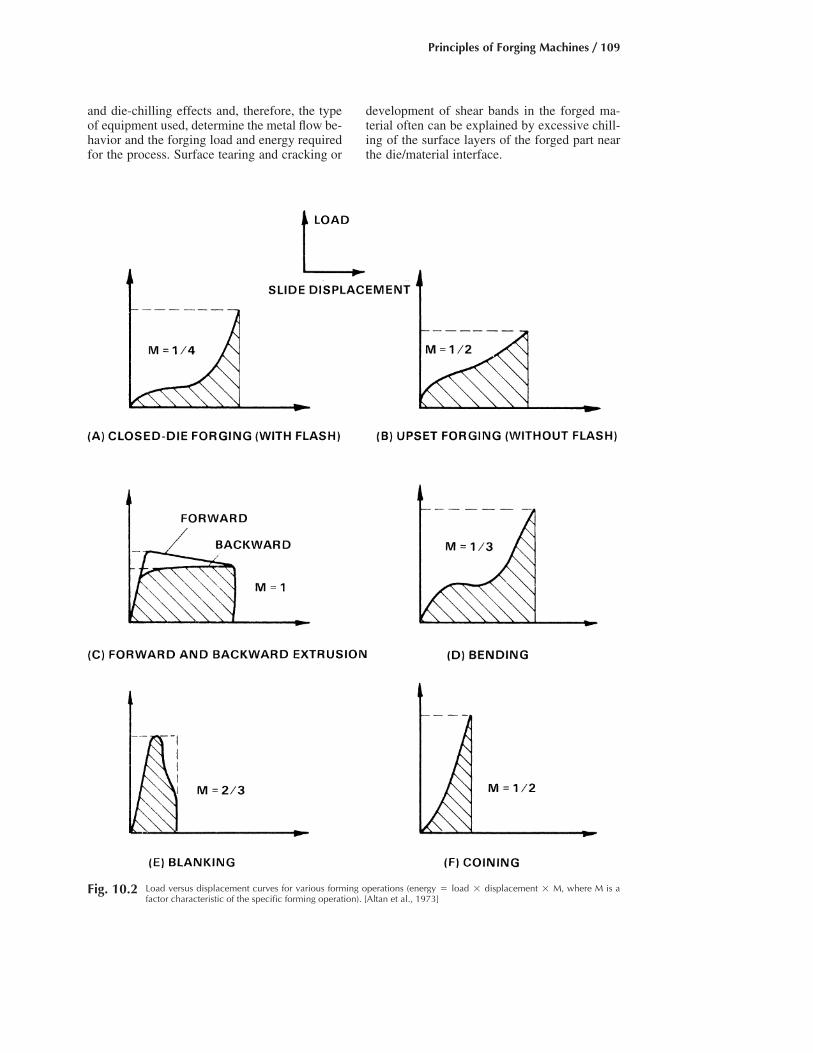
Principles of Forging Machines / 109
Fig. 10.2 Load versus displacement curves for various forming operations (energy � load � displacement � M, where M is afactor characteristic of the specific forming operation). [Altan et al., 1973]
and die-chilling effects and, therefore, the typeof equipment used, determine the metal flow be-havior and the forging load and energy requiredfor the process. Surface tearing and cracking or
development of shear bands in the forged ma-terial often can be explained by excessive chill-ing of the surface layers of the forged part nearthe die/material interface.

110 / Cold and Hot Forging: Fundamentals and Applications
Fig. 10.3 Load versus displacement curves obtained inclosed-die forging an axisymmetric steel part at
2012 �F (1100 �C) in three different machines with different initialvelocities (Vpi). [Altan et al., 1973]
10.4 Classification and Characteristicsof Forming Machines
In metal forming processes, workpieces aregenerally fully or nearly fully formed by usingtwo-piece tools. A metal forming machine toolis used to bring the two pieces together to formthe workpiece. The machine also provides thenecessary forces, energy, and torque for the pro-cess to be completed successfully, ensuringguidance of the two tool halves.
Based on the type of relative movement be-tween the tools or the tool parts, the metal form-ing machine tools can be classified mainly intotwo groups:
● Machines with linear relative tool movement● Machines with nonlinear relative tool move-
ment
Machines in which the relative tool move-ments cannot be classified into either of the twogroups are called special-purpose machines. Themachines belonging to this category are thoseoperated on working media and energy. Thevarious forming processes, discussed in Chapter2, are associated with a large number of formingmachines. These include:
● Rolling mills for plate, strip and shapes● Machines for profile rolling from strip● Ring rolling machines● Thread rolling and surface rolling machines● Magnetic and explosive forming machines● Draw benches for tube and rod; wire and rod
drawing machines● Machines for pressing-type operations, i.e.,
presses
Among those listed above, “pressing”-type ma-chines are most widely used and applied for avariety of different purposes. These machinescan be classified into three types [Kienzle, 1965][Kienzle, 1953]:
● Load-restricted machines (hydraulic presses)● Stroke-restricted machines (crank and eccen-
tric presses)● Energy-restricted machines (hammers and
screw presses)
Hydraulic presses are essentially load-re-stricted machines; i.e., their capability for car-rying out a forming operation is limited mainlyby the maximum load capacity. Mechanical (ec-
centric or crank) presses are stroke-restrictedmachines, since the length of the press strokeand the available load at various stroke positionsrepresent the capability of these machines. Ham-mers are energy-restricted machines, since thedeformation results from dissipating the kineticenergy of the hammer ram. The hammer frameguides the ram, but is essentially not stressedduring forging. The screw presses are also en-ergy-restricted machines but they are similar tothe hydraulic and mechanical presses since theirframes are subject to loading during forgingstroke. The speed range and the speed strokebehavior of different forging machines vary con-siderably according to machine design, as illus-trated in Table 10.1.
The significant characteristics of these ma-chines comprise all machine design and perfor-mance data, which are pertinent to the machine’seconomic use. These characteristics include:
● Characteristics for load and energy● Time-related characteristics● Characteristics for accuracy
In addition to these characteristic parameters,the geometric features of the machine such asthe stroke in a press or hammer and the dimen-sions and features of the tool-mounting space(shut height) are also important. Other importantvalues are the general machine data, space re-quirements, weight, and the associated power re-quirements.

Principles of Forging Machines / 111
Table 10.1 Speed-range and speed-stroke behavior of forging equipment
Speed range
Forging machine ft/s m/s Speed-stroke behavior
Hydraulic press 0.2–1.0(a) 0.06–0.30(a)
Mechanical press 0.2–5 0.06–1.5
Screw pressGravity drop hammerPower drop hammerCounterblow hammer (total speed)HERF machinesLow-speed Petroforge
2–412–1610–3015–3020–808–20
0.6–1.23.6–4.83.0–9.04.5–9.06.0–24.02.4–6.0
Source: [Altan et al., 1973]
Apart from the features mentioned previously,some of the basic requirements that are expectedof a good forging machine can be listed as:
● High tool pressure, which requires the stockto be tightly gripped and upsetting forcescompletely absorbed.
● Sufficient tool length to permit rigid bar re-ception apart from filling up the impression.
● The gripping tools must not open during theupsetting process.
● The device for moving the tools must be se-cured against overloading.
● The heading slide must be provided withlong and accurate guides.
● The whole machine must be elastically se-cured against overloading.
● Design of a crankshaft of special rigidity.● Readily interchangeable gripping and head-
ing tools.● The driving motor and the machine must be
connected through a security coupling.● The machine must have central lubrication.
10.5 Characteristic Data forLoad and Energy
Available energy, EM (in ft-lb or m-kg), is theenergy supplied by the machine to carry out thedeformation during an entire stroke. Availableenergy, EM, does not include either Ef, the en-ergy necessary to overcome the friction in thebearings and slides, or Ed, the energy lost be-cause of elastic deflections in the frame and driv-ing system.
Available load, LM (in tons), is the load avail-able at the slide to carry out the deformation
process. This load can be essentially constant asin hydraulic presses, but it may vary with theslide position in respect to “bottom dead center”(BDC) as in mechanical presses.
Efficiency factor, g, is determined by divid-ing the energy available for deformation, EM, bythe total energy, ET, supplied to the machine;i.e., g � EM/ET. The total energy, ET, also in-cludes in general: (a) the losses in the electricmotor, Ee, (b) the friction losses in the gibs andin the driving system, Ef, and (c) the losses dueto total elastic deflection of the machine, Ed.
The following two conditions must be satis-fied to complete a forming operation: first, at anytime during the forming operation,
L � L (Eq 10.1)M P
where LM is the available machine load and LPis the load required by the process; and second,for an entire stroke,
E � E (Eq 10.2)M P
where EM is the available machine energy andEP is the energy required by the process.
If the condition expressed by the former in-equality above (Eq 10.1) is not fulfilled in ahydraulic press, the press will stall without ac-complishing the required deformation. In a me-chanical press, the friction clutch would slip andthe press run would stop before reaching the bot-tom dead center position. If the condition ex-pressed by the latter inequality (Eq 10.2) is notsatisfied, either the flywheel will slow down tounacceptable speeds in a mechanical press or thepart will not be formed completely in one blowin a screw press or hammer.

112 / Cold and Hot Forging: Fundamentals and Applications
10.6 Time-DependentCharacteristic Data
Number of strokes per minute, n, is themost important characteristic of any machine,because it determines the production rate. Whena part is forged with multiple and successiveblows (in hammers, open-die hydraulic presses,and screw presses), the number of strokes perminute of the machine greatly influences theability to forge a part without reheating.
Contact time under pressure, tp, is the timeduring which the part remains in the die underthe deformation load. This value is especiallyimportant in hot forming. The heat transfer be-tween the hotter formed part and the cooler diesis most significant under pressure. Extensivestudies conducted on workpiece and die tem-peratures in hot forming clearly showed that theheat transfer coefficient is much larger underforming pressure than under free contact con-ditions. With increasing contact time under pres-sure, die wear increases. In addition, cooling ofthe workpiece results in higher forming load re-quirements.
Velocity under pressure, Vp, is the velocityof the slide under load. This is an important vari-able because it determines (a) the contact timeunder pressure and (b) the rate of deformationor the strain rate. The strain rate influences theflow stress of the formed material and conse-quently affects the load and energy required inhot forming.
10.7 Characteristic Data for Accuracy
Under unloaded conditions, the stationarysurfaces and their relative positions are estab-lished by (a) clearances in the gibs, (b) parallel-ism of upper and lower beds, (c) flatness of up-per and lower beds, (d) perpendicularity of slidemotion with respect to lower bed, and (e) con-centricity of tool holders. The machine charac-teristics influence the tolerances in formed parts.For instance, in backward extrusion a slight non-parallelism of the beds, or a slight deviation ofthe slide motion from ideal perpendicularity,would result in excessive bending stresses on thepunch and in nonuniform dimensions in ex-truded products.
Under loaded conditions, the tilting of theram and the ram and frame deflections, particu-
larly under off-center loading, might result inexcessive wear of the gibs, in thickness devia-tions in the formed part and in excessive toolwear. In multiple-operation processes, the tiltingand deflections across the ram might determinethe feasibility or the economics of forging agiven part. In order to reduce off-center loadingand ram tilting, the center of loading of a part,i.e., the point where the resultant total formingload vector is applied, should be placed underthe center of loading of the forming machine.
In presses (mechanical, hydraulic, or screw),where the press frame and the drive mechanismare subject to loading, the stiffness, C, of thepress is also a significant characteristic. Thestiffness is the ratio of the load, LM, to the totalelastic deflection, d, between the upper andlower beds of the press, i.e.:
C � L /d (Eq 10.3)M
In mechanical presses, the total elastic deflec-tion, d, includes the deflection of the press frame(�25 to 35% of the total) and the deflection ofthe drive mechanism (�65 to 75% of the total).The main influences of stiffness, C, on the form-ing process can be summarized as follows:
● Under identical forming load, LM, the de-flection energy, Ed, i.e., the elastic energystored in the press during buildup, is smallerfor a stiffer press (larger C). The deflectionenergy is given by:
2E � dL /2 � L /2C (Eq 10.4)d M M
● The higher the stiffness, the lower the de-flection of the press. Consequently, the var-iations in part thickness due to volume ortemperature changes in the stock are alsosmaller in a stiffer press.
● Stiffness influences the velocity versus timecurve under load. Since a less stiff machinetakes more time to build up and remove pres-sure, the contact time under pressure, tp, islonger. This fact contributes to the reductionof tool life in hot forming.
Using larger components in press design in-creases the stiffness of a press. Therefore,greater press stiffness is directly associated withincreased costs, and it should not be specifiedunless it can be justified by expected gains inpart tolerances or tool life.

Principles of Forging Machines / 113
REFERENCES
[Altan et al., 1973]: Altan, T., et al., ForgingEquipment, Materials and Practices, Metaland Ceramics Information Center, HB03,1973, p 4–7.
[Kienzle, 1965]: Kienzle, O., Characteristics ofData in Machine Tools for Closed Die Forg-ing, (in German), Werkstatttechnik, Vol 55,1965, p 509.
[Kienzle, 1953]: Kienzle, O., The CharacteristicData on Presses and Hammers (in German),Werkst. Maschin., Vol 43, 1953, p 1.
SELECTED REFERENCES
[Altan et al., 1983]: Altan, T., Oh, S.I., Gegel,H., Metal Forming: Fundamentals and Appli-cations, ASM International, 1983.
[FIA 1997]: Forging Industry Association,Product Design Guide for Forging, 1997.
[Geleji et al., 1967]: Geleji, A., et al., ForgeEquipment, Rolling Mills and Accessories (inEnglish), Akademiai Kiado, Budapest, 1967,p 168.
[Lange, 1972]: Lange, K., Ed., Study Book ofForming Technology, (in German), Vol 1,Fundamentals, Springer-Verlag, 1972.

CHAPTER 11
Presses and Hammers forCold and Hot ForgingManas Shirgaokar
11.1 Introduction
The continuous development of forging tech-nology requires a sound and fundamental un-derstanding of equipment capabilities and char-acteristics. The equipment, i.e., presses andhammers used in forging, influences the forgingprocess, since it affects the deformation rate andtemperature conditions, and it determines therate of production. The requirements of a givenforging process must be compatible with theload, energy, time, and accuracy characteristicsof a given forging machine.
There are basically three types of presses: hy-draulic, mechanical, and screw presses. Thesemachines are used for hot and cold forging, coldextrusion trimming, and coining.
Developments in the forging industry aregreatly influenced by the worldwide require-ments for manufacturing ever-larger and morecomplex components for more difficult-to-forgematerials. The present and future needs of theaerospace industry, the increase in demand forstationary power systems, jet engines, and air-crafts components, and the ever-increasing for-eign technological competition require continu-ous upgrading of today’s technology. Thus, themore efficient use of existing forging equipmentand the installation of more sophisticated ma-chinery have become unavoidable necessities.Development in all areas of forging has the ob-jectives of (a) increasing the production rate, (b)improving forging tolerances, (c) reducing costsby minimizing scrap losses, by reducing pre-forming steps, and by increasing tool life, and
(d) expanding capacity to forge larger and moreintricate parts.
The purchase of new forging equipment re-quires a thorough understanding of the effect ofequipment characteristics on the forging opera-tions, load and energy requirements of the spe-cific forging operation, and the capabilities andcharacteristics of the specific forging machine tobe used for that operation. Increased knowledgeon forging equipment would also specificallycontribute to:
● More efficient and economical use of exist-ing equipment
● More exact definition of the existing maxi-mum plant capacity
● Better communication between the equip-ment user and the equipment builder
● Development of more refined processes suchas precision forging of gears and of turbineand compressor blades
11.2 Hydraulic Presses
The operation of hydraulic presses is rela-tively simple and is based on the motion of ahydraulic piston guided in a cylinder [Geleji1967], [Mueller 1969], [Peters 1969]. Hydraulicpresses are essentially load-restricted machines;i.e., their capability for carrying out a formingoperation is limited mainly by the maximumavailable load. The following important featuresare offered by hydraulic presses:
● In direct-driven hydraulic presses, the max-imum press load is available at any point
Cold and Hot Forging Fundamentals and ApplicationsTaylan Altan, Gracious Ngaile, Gangshu Shen, editors, p115-139 DOI:10.1361/chff2005p115
Copyright © 2005 ASM International® All rights reserved. www.asminternational.org

116 / Cold and Hot Forging: Fundamentals and Applications
Fig. 11.1 Schematic illustration of drives for hydraulic presses. (a) Accumulator drive. (b) Direct drive. [Riemenschneider et al.,1959]
during the entire ram stroke. In accumulator-driven presses, the available load decreasesslightly depending on the length of the strokeand the load-displacement characteristics ofthe forming process.
● Since the maximum load is available duringthe entire stroke, relatively large energies areavailable for deformation. This is why thehydraulic press is ideally suited for extru-sion-type forming operations requiring anearly constant load over a long stroke.
● Within the capacity of a hydraulic press, themaximum load can be limited to protect thetooling. It is not possible to exceed the setload, because a pressure-release valve limitsthe fluid pressure acting on the ram.
● Within the limits of the machine, the ramspeed can be varied continuously at will dur-ing an entire stroke cycle. Adequate controlsystems can regulate the ram speed with re-spect to forming pressure or product tem-perature. This control feature can offer a con-siderable advantage in optimizing formingprocesses.
11.2.1 Drive Systems forHydraulic Presses
The operational characteristics of a hydraulicpress are essentially determined by the type and
design of its hydraulic drive system. As shownin Fig. 11.1, two types of hydraulic drive sys-tems give different time-dependent characteris-tic data [Hutson 1968] [Riemenschneider et al.,1959].
Direct-driven presses usually employ hy-draulic oil or water emulsion as the working me-dium. In earlier vertical press designs, at the startof the downstroke the upper ram falls undergravity and oil is drawn from the reservoir intothe ram cylinder through the suction of this fall.When the ram contacts the workpiece, the valvebetween the ram cylinder and the reservoir isclosed and the pump builds up pressure in theram cylinder. This mode of operation results inrelatively long dwell times prior to the start ofdeformation. As illustrated in Fig. 11.1(b), dur-ing the downstroke in modern direct-drivenpresses a residual pressure is maintained in thereturn cylinders or in the return line by meansof a pressure relief valve. Thus, the upper ramis forced down against pressure and the dwellinherent in the free fall is eliminated. When thepressure stroke is completed, i.e., when the up-per ram reaches a predetermined position, orwhen the pressure reaches a certain value, theoil pressure on the ram cylinder is released anddiverted to lift the ram.
Accumulator-driven presses usually em-ploy a water-oil emulsion as the working me-
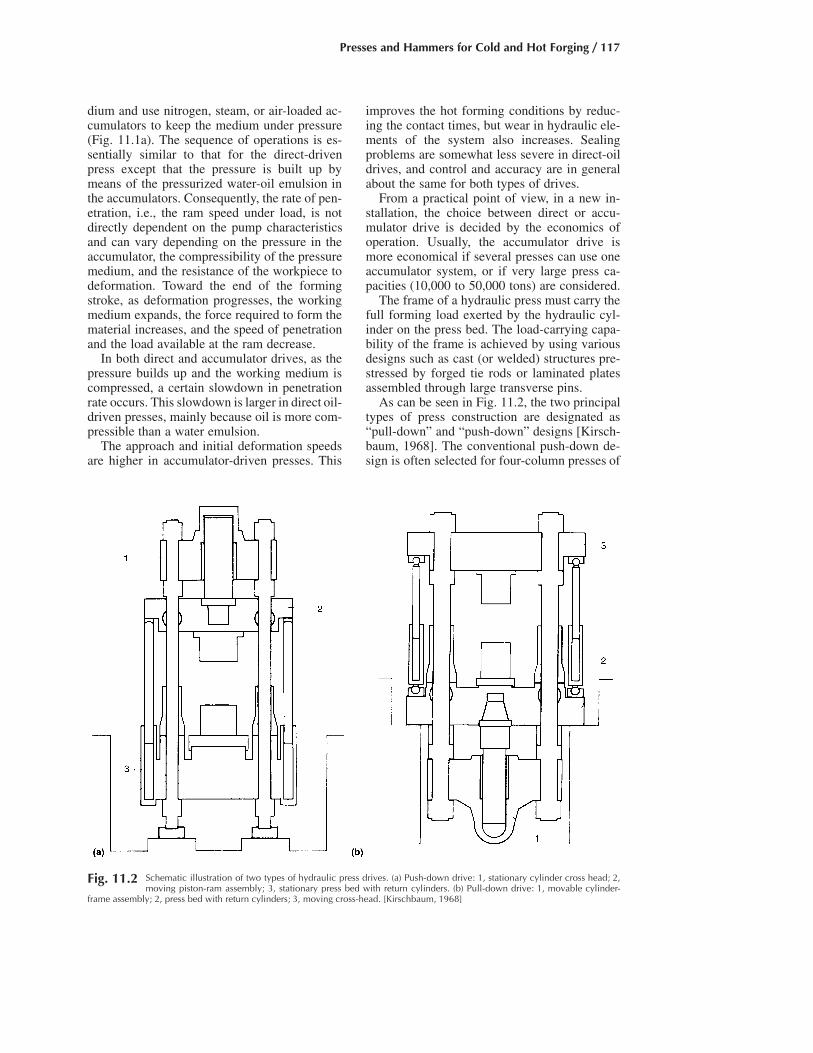
Presses and Hammers for Cold and Hot Forging / 117
Fig. 11.2 Schematic illustration of two types of hydraulic press drives. (a) Push-down drive: 1, stationary cylinder cross head; 2,moving piston-ram assembly; 3, stationary press bed with return cylinders. (b) Pull-down drive: 1, movable cylinder-
frame assembly; 2, press bed with return cylinders; 3, moving cross-head. [Kirschbaum, 1968]
dium and use nitrogen, steam, or air-loaded ac-cumulators to keep the medium under pressure(Fig. 11.1a). The sequence of operations is es-sentially similar to that for the direct-drivenpress except that the pressure is built up bymeans of the pressurized water-oil emulsion inthe accumulators. Consequently, the rate of pen-etration, i.e., the ram speed under load, is notdirectly dependent on the pump characteristicsand can vary depending on the pressure in theaccumulator, the compressibility of the pressuremedium, and the resistance of the workpiece todeformation. Toward the end of the formingstroke, as deformation progresses, the workingmedium expands, the force required to form thematerial increases, and the speed of penetrationand the load available at the ram decrease.
In both direct and accumulator drives, as thepressure builds up and the working medium iscompressed, a certain slowdown in penetrationrate occurs. This slowdown is larger in direct oil-driven presses, mainly because oil is more com-pressible than a water emulsion.
The approach and initial deformation speedsare higher in accumulator-driven presses. This
improves the hot forming conditions by reduc-ing the contact times, but wear in hydraulic ele-ments of the system also increases. Sealingproblems are somewhat less severe in direct-oildrives, and control and accuracy are in generalabout the same for both types of drives.
From a practical point of view, in a new in-stallation, the choice between direct or accu-mulator drive is decided by the economics ofoperation. Usually, the accumulator drive ismore economical if several presses can use oneaccumulator system, or if very large press ca-pacities (10,000 to 50,000 tons) are considered.
The frame of a hydraulic press must carry thefull forming load exerted by the hydraulic cyl-inder on the press bed. The load-carrying capa-bility of the frame is achieved by using variousdesigns such as cast (or welded) structures pre-stressed by forged tie rods or laminated platesassembled through large transverse pins.
As can be seen in Fig. 11.2, the two principaltypes of press construction are designated as“pull-down” and “push-down” designs [Kirsch-baum, 1968]. The conventional push-down de-sign is often selected for four-column presses of
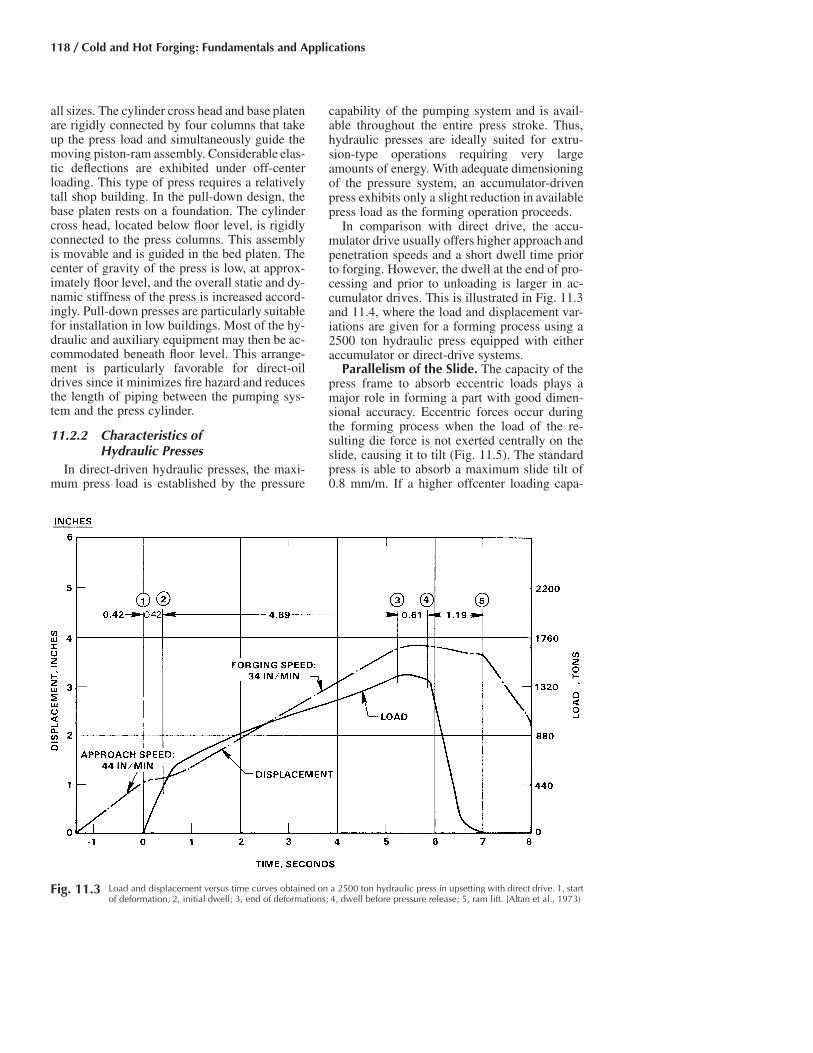
118 / Cold and Hot Forging: Fundamentals and Applications
Fig. 11.3 Load and displacement versus time curves obtained on a 2500 ton hydraulic press in upsetting with direct drive. 1, startof deformation; 2, initial dwell; 3, end of deformations; 4, dwell before pressure release; 5, ram lift. [Altan et al., 1973)
all sizes. The cylinder cross head and base platenare rigidly connected by four columns that takeup the press load and simultaneously guide themoving piston-ram assembly. Considerable elas-tic deflections are exhibited under off-centerloading. This type of press requires a relativelytall shop building. In the pull-down design, thebase platen rests on a foundation. The cylindercross head, located below floor level, is rigidlyconnected to the press columns. This assemblyis movable and is guided in the bed platen. Thecenter of gravity of the press is low, at approx-imately floor level, and the overall static and dy-namic stiffness of the press is increased accord-ingly. Pull-down presses are particularly suitablefor installation in low buildings. Most of the hy-draulic and auxiliary equipment may then be ac-commodated beneath floor level. This arrange-ment is particularly favorable for direct-oildrives since it minimizes fire hazard and reducesthe length of piping between the pumping sys-tem and the press cylinder.
11.2.2 Characteristics ofHydraulic Presses
In direct-driven hydraulic presses, the maxi-mum press load is established by the pressure
capability of the pumping system and is avail-able throughout the entire press stroke. Thus,hydraulic presses are ideally suited for extru-sion-type operations requiring very largeamounts of energy. With adequate dimensioningof the pressure system, an accumulator-drivenpress exhibits only a slight reduction in availablepress load as the forming operation proceeds.
In comparison with direct drive, the accu-mulator drive usually offers higher approach andpenetration speeds and a short dwell time priorto forging. However, the dwell at the end of pro-cessing and prior to unloading is larger in ac-cumulator drives. This is illustrated in Fig. 11.3and 11.4, where the load and displacement var-iations are given for a forming process using a2500 ton hydraulic press equipped with eitheraccumulator or direct-drive systems.
Parallelism of the Slide. The capacity of thepress frame to absorb eccentric loads plays amajor role in forming a part with good dimen-sional accuracy. Eccentric forces occur duringthe forming process when the load of the re-sulting die force is not exerted centrally on theslide, causing it to tilt (Fig. 11.5). The standardpress is able to absorb a maximum slide tilt of0.8 mm/m. If a higher offcenter loading capa-

Presses and Hammers for Cold and Hot Forging / 119
Fig. 11.5 Control system for maintaining slide parallelism. [Schuler Handbook, 1998]
Fig. 11.4 Load and displacement versus time curves obtained on a 2500 ton hydraulic press in upsetting with accumulator drive.1, start forming; 2, initial dwell; 3, end of forming; 4, dwell before pressure release; 5, ram lift. [Altan et al., 1973]
bility is desired, then the press design must bemore rigid. In this case, the slide gibs will havegreater stability, the press frame will be morerigid, and the slide will be higher.
Often it is necessary to use hydraulic paral-lelism control systems, using electronic controltechnology (Fig. 11.5), for example, in the caseof hydraulic transfer presses. The parallelism

120 / Cold and Hot Forging: Fundamentals and Applications
Fig. 11.6 Full-stroke parallelism control of the press slide.[Schuler Handbook, 1998]
control systems act in the die mounting area tocounter slide tilt. Position measurement sensorsmonitor the position of the slide and activate theparallelism control system (Fig. 11.5). The par-allelism controlling cylinders act on the cornersof the slide plate, and they are pushed during theforming process against a centrally applied pres-sure. If the electronic parallelism monitor sensordetects a position error, the pressure on the lead-ing side is increased by means of servo valves,and at the same time reduced on the oppositeside to the same degree. The sum of exerted par-allelism control forces remains constant, and theslide tilt balance is restored. Depending on thedeformation speed, a slide parallelism of 0.05 to0.2 mm/m is achieved. A central device adjuststhe system to different die heights by means ofspindles at the slide.
Full-stroke parallelism control involves theuse of parallel control cylinders, with their pis-tons permanently connected to the slide (Fig.11.6). These act over the entire stroke of theslide so that no setting spindles are required toadjust the working stroke. Two cylinders withthe same surface area, arranged well outside thecenter of the press, are subjected to a mean pres-sure. The tensile and compressive forces are bal-anced out by means of diagonal pipe connec-tions. The system is neutral in terms of forceexerted on the slide. If an off-center load is ex-erted by the die on the slide, a tilt moment isgenerated. The slide position sensor detects a de-viation from parallel and triggers the servovalve. The valve increases the pressure on theunderside of the piston acting on the leading sideof the slide and thus also on the opposite upperside of the piston. At the same time, the pressurein the other connecting pipe is reduced. The op-posing supporting torques exerted on the twosides counteract the tilt moment.
11.2.3 Mechanical Crank andEccentric Presses
All mechanical presses employ flywheel en-ergy, which is transferred to the workpiece by anetwork of gears, cranks, eccentrics, or levers(Fig. 11.7). The ability of mechanical presses todeform the workpiece material is determined bythe length of the press stroke and the availableforce at various stroke positions.
Two major groups of mechanical presses are:
● Presses with crank drive● Presses with cam drive
Crank presses may have either simple or ex-tended crank drives. Conventional crank presses(the total stroke cannot be varied) and eccentricpresses (the total stroke is variable) belong tothe simple drives. If either a knuckle or a leveris used to extend the crank drive, the designs arecalled knuckle joint or link drive presses. Mul-tipoint presses are those in which two or morecranks are used to drive the same ram.
Other methods of classification are:
● Frame type: C or closed frame● Number of useful motions: Single or more● Location of drive: Top drive (connecting rod
subjected to compression) and bottom drive(connecting rod subjected to tension)
● Position of drive shaft: Longitudinal or crossshaft
● Number of connecting rods: One-, two-, orfour-point drive
The drive system used in most mechanicalpresses (crank or eccentric) is based on a slider-crank mechanism that translates rotary motioninto reciprocating linear motion. The eccentric

Presses and Hammers for Cold and Hot Forging / 121
Fig. 11.7 Principal components of a mechanical forging press. [ASM Handbook, 1988]
shaft is connected through a clutch and brakesystem directly to the flywheel (Fig. 11.8). Indesigns for larger capacities, the flywheel is lo-cated on the pinion shaft, which drives the ec-centric shaft (Fig. 11.9). The constant clutchtorque, M, is available at the eccentric shaft,which transmits the torque and the flywheel en-ergy to the slide through the pitman arm or con-necting rod, as illustrated in Fig. 11.8. The fly-wheel, which is driven by an electric motor and“V” belts, stores energy that is used only duringa small portion of the crank revolution, namely,during deformation of the formed material.
Figure 11.10 shows the basic slider-crankmechanism. The clutch at the flywheel transmitsthe constant torque, M, to the eccentric (orcrank) shaft. The force diagram gives the rela-tions between the torque, M, the force on theconnecting rod, P, and the tangential force, T:
T � P sin (� � b) (Eq 11.1)
and
M � rT (Eq 11.2)
Usually, the ratio, k, of crank radius r to con-necting-rod length l is small, about:
r 1k � �
l 10
or
sin b 1� (Eq 11.3)
sin � 10
Using Eq 11.1 and considering that the totalpress stroke is S � 2r, the machine load, LM,acting on the ram is:
T cos bL � P cos b �M sin (� � b)
2M cos b� (Eq 11.4)
S sin (� � b)

122 / Cold and Hot Forging: Fundamentals and Applications
Fig. 11.8 Schematic of a mechanical press with eccentricdrive (clutch and brake on eccentric shaft). [Altan
et al., 1973]
Fig. 11.9 Schematic of a crank press with pinion-gear drive(clutch and brake are on pinion shaft; for large ca-
pacities this design is more stable and provides high flywheelenergy). [Altan et al., 1983]
When the angles � and b approach 0, i.e., towardbottom dead center (BDC), LM may go to infin-ity for constant torque, M. This is illustrated inFig. 11.11.
The stroke position, i.e., the distance, h, fromBDC, as a function of the crank angle, �, can bederived from the geometric relationships illus-trated in Fig. 11.10, to be:
2 2 2h � (r � 1) � (r cos � � l � r sin �)�
or
r 2h � r(1 � cos �) � l 1 � 1 � sin �� � � �� l(Eq 11.5)
Using the binomial expansion, the term underthe square root sign can be approximated as 1 �(r/l)2 sin2 �/2.
Thus, Eq 11.5 can be transformed into:
2r 2h � r(1 � cos �) � sin � (Eq 11.6)2l
For small values of �, i.e., near BDC, Eq 11.6is approximated as:
Sh � r(1 � cos �) � (1 � cos �) (Eq 11.7)
2
The ram velocity, V, is obtained from Eq 11.6by differentiation with respect to time, t:
dh dh d� dhV � � � x
dt d� dt d�
2r� r sin � � sin � cos � x (Eq 11.8)� �l
where, with n being the rotational speed of thecrank in revolutions per minute, the angular ve-locity x � 2pn/60 and the stroke S � 2r. Ne-glecting the second small term in Eq 11.8 gives:
SpnV � sin � (Eq 11.9)
60

Presses and Hammers for Cold and Hot Forging / 123
Fig. 11.12 Displacement and velocity in a simple slider-crank mechanism (stroke � 2r)
Fig. 11.11 Variations of clutch torque and machine loadwith crank angle in an eccentric or crank press.
[Altan et al., 1973]
Using the geometric relationships of Fig.11.10, the ram velocity can be expressed as:
pn SV � h � 1 (Eq 11.10)�30 h
Thus with Eq 11.6 and 11.10 the displacement,h, and the velocity, V, at each point of the ramstroke can be calculated. Figure 11.12 illustratesthe variation of these values with the crank angle� before BDC.
11.2.4 Load and Energy inMechanical Presses
With the symbols used in Fig. 11.10, Eq 11.4gives the ram or machine load, LM. Consideringthat angle b is much smaller than angle �, LMcan be approximated as:
2ML � (Eq 11.11)M S sin �
As shown in Fig. 11.11, Eq 11.11 illustratesthe variation of the slide load, LM, with the crankangle, �, before bottom dead center, BDC, forgiven values of torque, M, and stroke, S, of thepress. The torque, M, at the clutch has a constantvalue for which the drive mechanism (i.e., ec-centric shaft, pinion gear, clutch, brake, etc.) isdesigned. Thus, from Eq 11.11 it can be seenthat, as the slide approaches the BDC, i.e., asangle � approaches zero, the available machineload LM, may become infinitely large withoutexceeding the constant clutch torque, M, i.e.,without causing the friction clutch to slip.
From the observations made so far, the fol-lowing conclusions may be drawn:
● Crank and eccentric presses are displace-ment-restricted machines. The slide velocity,V, and the available slide load, LM, vary ac-cording to the position of the slide beforeBDC. Most manufacturers in the UnitedStates rate their presses by specifying thenominal load at 1⁄4 or 1⁄8 in. (6.4 or 3.2 mm)before BDC. For different applications, thenominal load may be specified at differentpositions before BDC according to the stan-dards established by the American Joint In-dustry Conference.
● If the load required by the forming processis smaller than the load available at the press(i.e., if curve EFG in Fig. 11.11 remains be-low curve NOP), the process can be carriedout provided that the flywheel can supply thenecessary energy per stroke.
● For small angles � before BDC, within theOP portion of curve NOP in Fig. 11.11, theslide load, LM, can become larger than the
Fig. 11.10 The basic slider-crank mechanism used in crankpresses. S, stroke; BDC, bottom dead center; �,
crank angle before bottom dead center (BDC); LM, machine load.[Altan et al., 1973]

124 / Cold and Hot Forging: Fundamentals and Applications
nominal press load if no overload safety (hy-draulic or mechanical) is available on thepress. In this case, the press stalls, the fly-wheel stops, and the entire flywheel energyis transformed into deflection energy bystraining the press frame, the pitman arm,and the drive mechanism. Usually, the presscan then be freed only by burning out thetooling.
● If the load curve EFG exceeds the press loadNOP (Fig. 11.11) before point O is reached,then the friction clutch slides and the pressslide stops, but the flywheel continues toturn. In this case, the press can be freed byincreasing the air pressure on the clutch andby reversing the flywheel rotation if the slidehas stopped before BDC.
The energy needed for the forming operationduring each stroke is supplied by the flywheel,which slows down to a permissible percent-age—usually 10 to 20%—of its idle speed. Thetotal energy stored in a flywheel is:
22Ix I pnE � � (Eq 11.12)FT � �2 2 30
where I is the moment of inertia of the flywheel,x is the angular velocity in radians per second,and n is the rotational speed of the flywheel inrevolutions per minute. The total energy, ES,used during one stroke is:
21 I p2 2 2 2E � I(x � x ) � (n � n )S 0 1 0 1� �2 2 30(Eq 11.13)
where x0 is initial angular velocity, x1 is angularvelocity after the work is done, n0 is initial fly-wheel speed in revolutions per minute, and n1 isflywheel speed after the work is done, also inrpm.
Note that the total energy, ES, also includesthe friction and elastic deflection losses. Theelectric motor must bring the flywheel from itslowered speed, n1, to its idle speed, n0, beforethe next forming stroke starts. The time avail-able between two strokes depends on whetherthe mode of operation is continuous or intermit-tent. In a continuously operating mechanicalpress, less time is available to bring the flywheelto its idle speed, and consequently a higher-horsepower motor is necessary.
Very often the allowable slowdown of the fly-wheel is given as a percentage of the nominal
speed. For instance, if a 13% slowdown is per-missible, then:
n � n 130 1� or n � 0.87 n1 0n 100�0
The percentage energy supplied by the flywheelis obtained by using Eq 11.12 and 11.13 to arriveat:
2 2E n � nS 0 1 2� � 1 � (0.87) � 0.252E nFT 0
The simple calculations given above illustratethat for a 13% slowdown of the flywheel, 25%of the flywheel energy will be used during onestroke.
As an example, the variation of load, displace-ment, and flywheel speed in upset forming of acopper sample under 1600 ton mechanical pressis illustrated in Fig. 11.13. This press was in-strumented with strain bars attached to the framefor measuring load, an inductive transducer(LVDT) for measuring ram displacement, and adc tachometer for measuring flywheel speed. InFig. 11.13 it can be seen that, due to frictionaland inertial losses in the press drive, the flywheelslows down by about (5 rpm) before deforma-tion begins. The flywheel requires 3.24 s to re-cover its idling speed; i.e., in forming this partthe press can be operated at a maximum speedof 18 (60/3.24) strokes/min. For each mechani-cal press, there is a unique relationship betweenstrokes per minute, or production rate, and theavailable energy per stroke. As shown in Fig.11.14, the strokes per minute available on themachine decreases with increasing energy re-quired per stroke. This relationship can be de-termined experimentally by upsetting samples,which require various amounts of deformationenergy, and by measuring load, displacement,and flywheel recovery time. The energy con-sumed by each sample is obtained by calculatingthe surface area under the load-displacementcurve.
11.2.5 Time-Dependent Characteristics ofMechanical Presses
The number of strokes per minute, n, was dis-cussed as part of the energy considerations. Ascan be seen in Eq 11.9, the ram velocity is di-rectly proportional to the number of strokes perminute, n, and to the press stroke, S. Thus, fora given press, i.e., a given stroke, the only way

Presses and Hammers for Cold and Hot Forging / 125
Fig. 11.14 Variation of strokes per minute with the energy available for forming in a 500 ton mechanical press. [Altan et al., 1972]
Fig. 11.13 Flywheel slowdown, ram displacement, and forming load in upsetting of copper samples in a 1600-ton mechanicalpress. [Altan et al., 1972]
to increase ram velocity during deformation isto increase the stroking rate, n.
For a given idle-flywheel speed, the contacttime under pressure, tp, and the velocity under
pressure, Vp, depend mainly on the dimensionsof the slide-crank mechanism and on the totalstiffness, C, of the press. The effect of press stiff-ness on contact time under pressure, tp, is illus-

126 / Cold and Hot Forging: Fundamentals and Applications
Fig. 11.15 Effect of press stiffness on contact time underpressure (Sth � theoretical displacement-time
curve under load). (a) Stiffer press. (b) Less stiff press. [Kienzle,1959]
Table 11.1 Total deflection under nominal loadon one- and two-point presses of the samecapacity
Relative deflection
One-pointeccentric press
Two-pointeccentric press
Slide � pitman arm 30 21Frame 33 31Drive shaft � bearings 37 33Total deflection 100 85
[Rau, 1967]
Fig. 11.16 Principle of the scotch-yoke type drive for me-chanical presses. [Altan et al., 1973]
Fig. 11.17 Principle of the wedge-type mechanical press.[Rau, 1967]
mized. Assuming the total deflection under loadfor a one-point eccentric press to be 100%, thedistributions of total deflection shown in Table11.1 were obtained from measurements undernominal load on one- and two-point presses ofthe same capacity [Rau, 1967]. It is interestingto note that a large percentage of the total de-flection is in the drive mechanism, i.e., slide, pit-man arm, drive shaft, and bearings.
Drive mechanisms that have considerablestiffness and off-center loading capability areprovided by (a) the scotch-yoke design (Fig.11.16) and (b) the wedge-type design (Fig.11.17). Both these press drives have large bear-ing surfaces above the slide and can maintainlarger off-center loads than the conventional ec-centric drive forging presses.
Determination of the Dynamic Stiffness ofa Mechanical Press. Unloaded machine con-
trated in Fig. 11.15. As the load builds up, thepress deflects elastically. A stiffer press (largerC) requires less time, tp1, for pressure buildupand also less time, tp2, for pressure release asshown in Fig. 11.15(a). Consequently, the totalcontact time under pressure (tp � tp1 � tp2) isless for a stiffer press.
11.2.6 Accuracy of Mechanical Presses
The working accuracy of an eccentric press issubstantially characterized by two features: thetilting angle of the ram under off-center loadingand the total deflection under load or stiffness ofthe press. Tilting of the ram produces skewedsurfaces and an offset on the part; stiffness in-fluences the thickness tolerance [Rau, 1967].Under off-center loading conditions, two- orfour-point presses perform better than single-point presses because the tilting of the ram andthe reduction forces into the gibways are mini-

Presses and Hammers for Cold and Hot Forging / 127
Table 11.2 Copper samples forged under on-center conditions in the 500 ton mechanical press
Sample size, in.
Sample Height Diameter Predicted load(a), tons Measured load, tons Predicted energy(b), tons Measured energy, tons
1 2.00 1.102 48 45 24 292 2.00 1.560 96 106 48 603 2.00 2.241 197 210 98 1204 2.00 2.510 247 253 124 1405 2.00 2.715 289 290 144 1636 2.00 2.995 352 350 176 175
(a) Based on an estimate of 50 ksi flowstress for copper at 50% reduction in height. (b) Estimated by assuming that the load-displacement curve has a triangular shape;that is, energy � 0.5 load � displacement. Source: [Douglas et al., 1972]
ditions such as parallelism and flatness of upperand lower beds, perpendicularity of slide mo-tion, etc. are important and affect the tolerancesof the forged part. However, much more signifi-cant are the quantities obtained under load andunder dynamic conditions. The stiffness of apress C (the ratio of the load to the total elasticdeflection between the upper and lower dies) in-fluences the energy lost in press deflection, thevelocity versus time curve under load and thecontact time. In mechanical presses, variationsin forging thickness due to volume or tempera-ture changes in the stock are also smaller in astiffer press. Very often the stiffness of a press(ton/in.) is measured under static loading con-ditions, but such measurements are misleading.For practical purposes the stiffness has to be de-termined under dynamic loading conditions.
To obtain the dynamic stiffness of a mechan-ical press, copper samples of various diameters,but of the same height were forged under on-center conditions. A 500 ton Erie scotch-yoketype press was used for this study [Douglas etal., 1972]. The samples of wrought pure electro-lytic copper were annealed for 1 h at 900 �F (480�C). The press setup was not changed throughoutthe tests. Lead samples of about 1 in.2 (645 cm2)and 1.5 in. (38 mm) height were placed near theforged copper sample, about 5 in. (125 mm) tothe side. As indicated in Table 11.2, with in-creasing sample diameter the load required forforging increased as well. The press deflectionis measured by the difference in heights of thelead samples forged with and without the copperat the same press setting. The variation of totalpress deflection versus forging load, obtainedfrom these experiments, is illustrated in Fig.11.18. During the initial nonlinear portion of thecurve, the play in the press driving system istaken up. The linear portion represents the actualelastic deflection of the press components. Theslope of the linear curve is the dynamic stiffness,which was determined as 5800 ton/in. for the500 ton Erie forging press.
The method described above requires themeasurement of load in forging annealed coppersamples. If instrumentation for load and dis-placement would be impractical for forgeshopmeasurements, the flow stress of the copper canbe used for estimating the load and energy for agiven height reduction.
Ram Tilting in Off-Center Loading. Off-center loading conditions occur often in me-chanical press forging when several operationsare performed in the same press. Especially inautomated mechanical presses, the finish blow(which requires the highest load) occurs on oneside of the press. Consequently, the investigationof off-center forging is particularly significant inmechanical press forging.
The off-center loading characteristics of the500 ton Erie press were evaluated using the fol-lowing procedure [Douglas et al., 1972]. Duringeach test, a copper specimen, which requires 220ton to forge, was placed 5 in. (125 mm) fromthe press center in one of the four directions viz.left, right, front, or back. A lead specimen,which requires not more than 5 ton, was placedan equal distance on the opposite side of the cen-ter. On repeating the test for the remaining threedirections, the comparison of the final height ofthe copper and lead forged during the same blowgave a good indication of the nonparallelity ofthe ram and bolster surfaces over a 10 in. (255mm) span. In conducting this comparison, thelocal elastic deflection of the dies in forging cop-per must be considered. Therefore, the finalthickness of the copper samples was correctedto counteract this local die deflection.
In off-center loading with 220 ton (or 44% orthe nominal capacity), an average ram-bed non-parallelity of 0.038 in./ft was measured in bothdirections, front-to-back and left-to-right. Incomparison, the nonparallelity under unloadedconditions was about 0.002 in./ft. Before con-ducting the experiments described above, theclearance in the press gibs was set to 0.010 in.(0.254 mm) [Douglas et al., 1972]. The nonpar-

128 / Cold and Hot Forging: Fundamentals and Applications
Fig. 11.18 Total press deflection versus press loading obtained under dynamic loading conditions for a 500 ton Erie scotch yoketype press. [Douglas et al., 1972]
allelity in off-center forging would be expectedto increase with increasing gib clearance.
11.2.7 Crank Presses withModified Drives
For a long time, eccentric or crank drive sys-tems were the only type of drive mechanismsused in mechanical presses. This section dis-cusses some modified drives such as theknuckle-joint drive and the linkage drive. Thesinusoidal slide displacement of an eccentricpress is compared with those of a knuckle-jointand a linkage-driven press (Fig. 11.19). Therelatively high impact speed on die closure andthe reduction of slide speed during the formingprocesses are drawbacks that often preclude theuse of eccentric or crank driven press for coldforging at high stroking rates. However, inpresses with capacities up to a nominal force of560 tonf (5000 kN), such as universal or blank-
ing presses used for trimming, eccentric or crankdrive is still the most effective drive system.This is especially true when using automatedsystems where the eccentric drive offers a goodcompromise between time necessary for pro-cessing and that required for part transport[Schuler Handbook, 1998].
Knuckle-Joint Drive Systems. The velocityversus stroke and the load versus stroke char-acteristics of crank presses can be modified byusing different press drives. A well-known vari-ation of the crank press is the knuckle-joint de-sign (Fig. 11.20). This design is capable of gen-erating high forces with a relatively small crankdrive. In the knuckle-joint drive, the ram veloc-ity slows down much more rapidly toward theBDC than in the regular crank drive. This ma-chine is successfully used for cold forming andcoining applications.
The knuckle-joint drive system consists of aneccentric or crank mechanism driving a knuckle
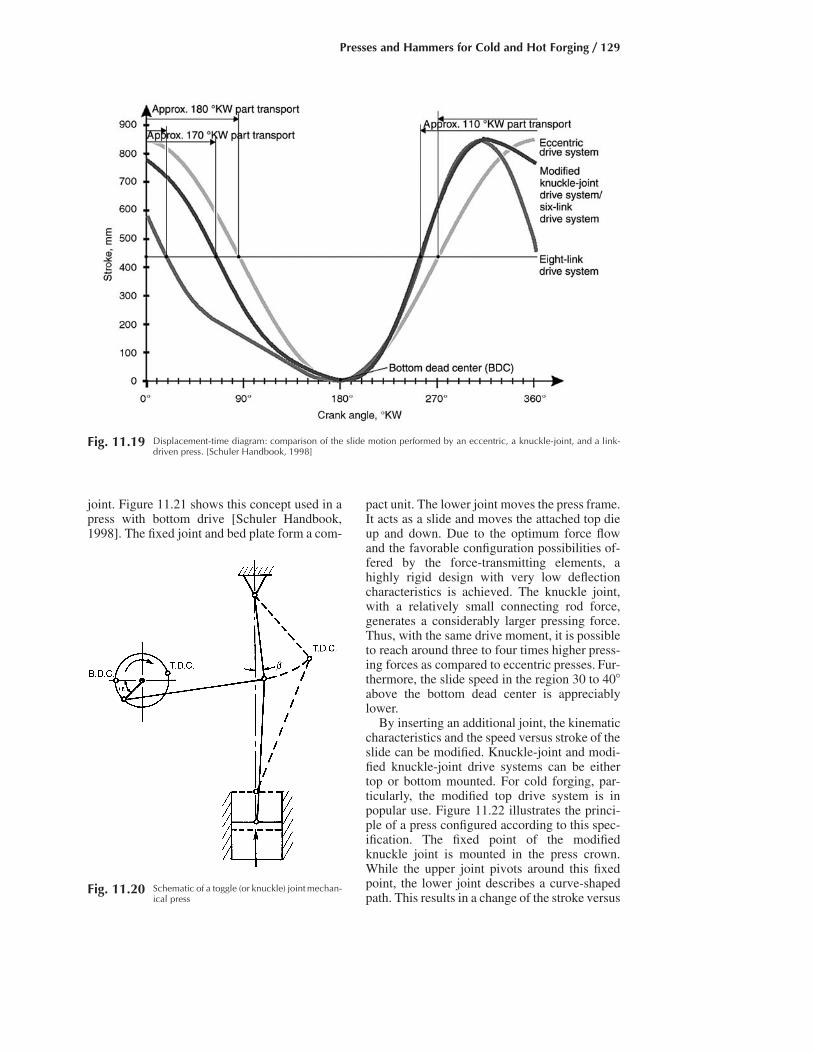
Presses and Hammers for Cold and Hot Forging / 129
Fig. 11.19 Displacement-time diagram: comparison of the slide motion performed by an eccentric, a knuckle-joint, and a link-driven press. [Schuler Handbook, 1998]
Fig. 11.20 Schematic of a toggle (or knuckle) joint mechan-ical press
pact unit. The lower joint moves the press frame.It acts as a slide and moves the attached top dieup and down. Due to the optimum force flowand the favorable configuration possibilities of-fered by the force-transmitting elements, ahighly rigid design with very low deflectioncharacteristics is achieved. The knuckle joint,with a relatively small connecting rod force,generates a considerably larger pressing force.Thus, with the same drive moment, it is possibleto reach around three to four times higher press-ing forces as compared to eccentric presses. Fur-thermore, the slide speed in the region 30 to 40�above the bottom dead center is appreciablylower.
By inserting an additional joint, the kinematiccharacteristics and the speed versus stroke of theslide can be modified. Knuckle-joint and modi-fied knuckle-joint drive systems can be eithertop or bottom mounted. For cold forging, par-ticularly, the modified top drive system is inpopular use. Figure 11.22 illustrates the princi-ple of a press configured according to this spec-ification. The fixed point of the modifiedknuckle joint is mounted in the press crown.While the upper joint pivots around this fixedpoint, the lower joint describes a curve-shapedpath. This results in a change of the stroke versus
joint. Figure 11.21 shows this concept used in apress with bottom drive [Schuler Handbook,1998]. The fixed joint and bed plate form a com-

130 / Cold and Hot Forging: Fundamentals and Applications
Fig. 11.22 Modified knuckle-joint drive system. [SchulerHandbook, 1998]
Fig. 11.21 Knuckle-joint press with bottom drive. [Schuler Handbook, 1998]
Fig. 11.23 Four-bar linkage mechanism for mechanicalpress drives
time characteristic of the slide, compared to thelargely symmetrical stroke-time curve of the ec-centric drive system (Fig. 11.19). This curve canbe altered by modifying the arrangement of the
joints (or possibly by integrating an additionaljoint).
Linkage Drive. The mechanical press driveshown in Fig. 11.23 uses a four-bar linkagemechanism. In this mechanism, the load-strokeand velocity-stroke behavior of the slide can beestablished, at the design stage, by adjusting thelength of one of the four links or by varying the

Presses and Hammers for Cold and Hot Forging / 131
Fig. 11.24 Load-stroke curves for a 750 ton four-bar linkagepress and a 1500 ton slider-crank press
connection point of the slider link with the draglink. Thus, with this press it is possible to main-tain the maximum load, as specified by presscapacity, over a relatively long deformationstroke. Using a conventional slider-crank-typepress, this capability can be achieved only byusing a much larger-capacity press. A compari-son is illustrated in Fig. 11.24, where the load-stroke curves for a four-bar linkage press and aconventional slider-crank press are shown. It canbe seen that a slider-crank press equipped witha 1700 ton-in. torque drive can generate a forceof about 1500 tons at 1⁄32 in. before BDC. Thefour-bar press equipped with a 600 ton-in. drivegenerates a force of about 750 tons at the samelocation. However, in both machines a 200 tonforce is available at 6 in. before BDC. Thus, a750 ton, four-bar press could perform the sameforming operation, requiring 200 tons over 6 in.,as a 1500 ton eccentric press. The four-bar press,which was originally developed for sheet metalforming and cold extrusion, is well suited forextrusion-type forming operations, where anearly constant load is required over a longstroke.
11.3 Screw Presses
The screw press uses a friction, gear, electric,or hydraulic drive to accelerate the flywheel andthe screw assembly, and it converts the angularkinetic energy into the linear energy of the slideor ram. Figure 11.25 shows two basic designs ofscrew presses [Bohringer et al., 1966].
In the friction-drive press, the driving disksare mounted on a horizontal shaft and are rotatedcontinuously. For a downstroke, one of the driv-ing disks is pressed against the flywheel by aservomotor. The flywheel, which is connected tothe screw either positively or by a friction slipclutch, is accelerated by this driving diskthrough friction. The flywheel energy and theram speed continue to increase until the ram hitsthe workpiece. Thus, the load necessary forforming is built up and transmitted through theslide, the screw, and the bed to the press frame.When the entire energy in the flywheel is usedin deforming the workpiece and elastically de-flecting the press, the flywheel, the screw, andthe slide stop. At this moment, the servomotoractivates the horizontal shaft and presses the up-stroke driving disk wheel against the flywheel.Thus, the flywheel and the screw are accelerated
in the reverse direction and the slide is lifted toits top position.
In the direct-electric-drive press, a reversibleelectric motor is built directly to the screw andon the frame, above the flywheel. The screw isthreaded into the ram or the slide and does notmove vertically. To reverse the direction of fly-wheel rotation, the electric motor is reversed af-ter each downstroke and upstroke.
11.3.1 Load and Energy in Screw Presses
In a screw press the load is transmittedthrough the slide, screw, and bed to the pressframe. The available load at a given stroke po-sition is supplied by the energy stored in the fly-wheel. At the end of a stroke, the flywheel andthe screw come to a standstill before reversingthe direction of rotation. Thus, the following re-lationship holds:
E � E � E � E (Eq 11.14)T P F d
where ET is total flywheel energy, EP is the en-ergy consumed by the forming process, EF is theenergy required for overcoming machine fric-tion, and Ed is the energy required for deflectionof the press (bed � columns � screw).
If the total flywheel energy, ET, is larger thannecessary for overcoming machine losses and

132 / Cold and Hot Forging: Fundamentals and Applications
Fig. 11.26 Load-energy relationships in forming in a press. Ep, energy required by process; LM, maximum machine load; Ed, elasticdeflection energy; d, press deflection. (a) With energy or load metering. (b) Without energy or load metering
Fig. 11.25 Two widely used screw press drives. (a) Friction drive. (b) Direct electric drive. [Bohringer et al., 1966]
for carrying out the forming process, the excessenergy is transformed into additional deflectionenergy and both the die and the press are sub-jected to unnecessarily high loading. This is il-lustrated in Fig. 11.26. To annihilate the excessenergy, which results in increased die wear andnoise, the modern screw press is equipped withan energy-metering device that controls the fly-wheel velocity and regulates the total flywheelenergy. The energy metering can also be pro-grammed so that the machine supplies differentamounts of energy during successive blows.
In a screw press, which is essentially an en-ergy-bound machine (like a hammer), load andenergy are in direct relation with each other. For
a given press (i.e., for the same friction losses,elastic deflection properties, and available fly-wheel energy), the load available at the end ofthe stroke depends mainly on the deformationenergy required by the process (i.e., on theshape, temperature, and material of the work-piece). Thus, for constant flywheel energy, lowdeformation energy, Ep, results in high end load,LM, and high deformation energy, Ep, results inlow end load, LM. These relations are illustratedin the load-energy diagram of a screw press, asshown in Fig. 11.27.
The screw press can sustain maximum loads,Lmax, up to 160 to 200% of its nominal load, LM.In this sense, the nominal load of a screw press
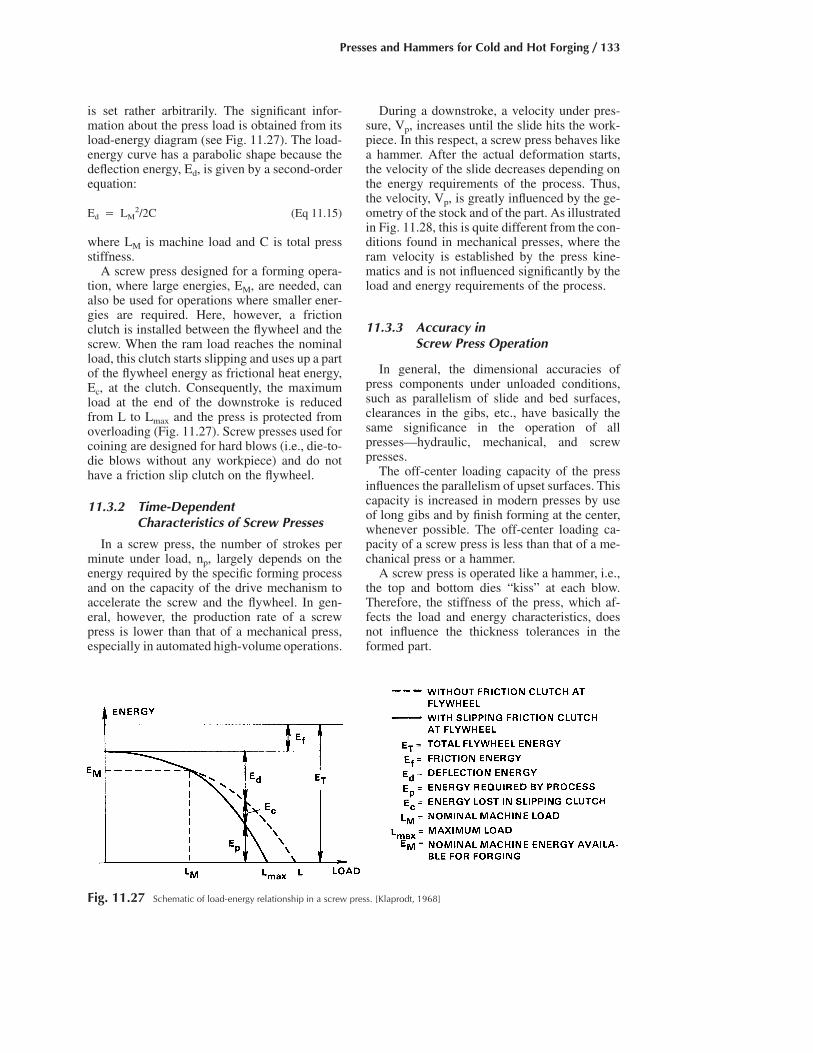
Presses and Hammers for Cold and Hot Forging / 133
Fig. 11.27 Schematic of load-energy relationship in a screw press. [Klaprodt, 1968]
is set rather arbitrarily. The significant infor-mation about the press load is obtained from itsload-energy diagram (see Fig. 11.27). The load-energy curve has a parabolic shape because thedeflection energy, Ed, is given by a second-orderequation:
2E � L /2C (Eq 11.15)d M
where LM is machine load and C is total pressstiffness.
A screw press designed for a forming opera-tion, where large energies, EM, are needed, canalso be used for operations where smaller ener-gies are required. Here, however, a frictionclutch is installed between the flywheel and thescrew. When the ram load reaches the nominalload, this clutch starts slipping and uses up a partof the flywheel energy as frictional heat energy,Ec, at the clutch. Consequently, the maximumload at the end of the downstroke is reducedfrom L to Lmax and the press is protected fromoverloading (Fig. 11.27). Screw presses used forcoining are designed for hard blows (i.e., die-to-die blows without any workpiece) and do nothave a friction slip clutch on the flywheel.
11.3.2 Time-DependentCharacteristics of Screw Presses
In a screw press, the number of strokes perminute under load, np, largely depends on theenergy required by the specific forming processand on the capacity of the drive mechanism toaccelerate the screw and the flywheel. In gen-eral, however, the production rate of a screwpress is lower than that of a mechanical press,especially in automated high-volume operations.
During a downstroke, a velocity under pres-sure, Vp, increases until the slide hits the work-piece. In this respect, a screw press behaves likea hammer. After the actual deformation starts,the velocity of the slide decreases depending onthe energy requirements of the process. Thus,the velocity, Vp, is greatly influenced by the ge-ometry of the stock and of the part. As illustratedin Fig. 11.28, this is quite different from the con-ditions found in mechanical presses, where theram velocity is established by the press kine-matics and is not influenced significantly by theload and energy requirements of the process.
11.3.3 Accuracy inScrew Press Operation
In general, the dimensional accuracies ofpress components under unloaded conditions,such as parallelism of slide and bed surfaces,clearances in the gibs, etc., have basically thesame significance in the operation of allpresses—hydraulic, mechanical, and screwpresses.
The off-center loading capacity of the pressinfluences the parallelism of upset surfaces. Thiscapacity is increased in modern presses by useof long gibs and by finish forming at the center,whenever possible. The off-center loading ca-pacity of a screw press is less than that of a me-chanical press or a hammer.
A screw press is operated like a hammer, i.e.,the top and bottom dies “kiss” at each blow.Therefore, the stiffness of the press, which af-fects the load and energy characteristics, doesnot influence the thickness tolerances in theformed part.

134 / Cold and Hot Forging: Fundamentals and Applications
Fig. 11.28 Representation of slide velocities for mechanical and screw presses in forming a thick and a thin part. Vb, Ve � velocityat the beginning and end of forming, respectively. [Altan et al., 1973]
11.3.4 Determination of DynamicStiffness of a Screw Press
The static stiffness of the screw press, asgiven by the manufacturer does not include thetorsional stiffness of the screw that occurs underdynamic conditions [Bohringer et al., 1968]. Aspointed out by Watermann [Watermann, 1963],who conducted an extensive study of the effi-ciency of screw presses, the torsional deflectionof the screw may contribute up to 30% of thetotal losses at maximum load (about 2.5 timesnominal load). Based on experiments conductedin a Weingarten press (Model P160, nominalload 180 metric ton, energy 800 kg-m), Water-man concluded that the dynamic stiffness was0.7 times the static stiffness [Watermann, 1963].Assuming that this ratio is approximately validfor the 400 ton press, the dynamic stiffness is0.7 � 8400 � 5900 ton/in.
During the downstroke the total energy sup-plied by the screw press, ET, is equal to the sumtotal of the machine energy used for the defor-mation process, EP, the energy necessary toovercome friction in the press drive, EF, and theenergy necessary elastically to deflect the press,ED (Eq 11.14). Expressing ED in terms of thepress stiffness, C, Eq 11.14 can be written as:
2LME � E � E � (Eq 11.16)T F P 2C
In a forging test, the energy used for the pro-cess EP (surface area under the load-displace-ment curve) and the maximum forging load LPcan be obtained from oscillograph recordings.By considering two tests simultaneously, and byassuming that EF remains constant during tests,one equation with one unknown C can be de-rived from Eq 11.16. However, in order to obtainreasonable accuracy, it is necessary that in bothtests considerable press deflection is obtained;that is, high loads LP and low deformation en-ergies EP are measured. Thus, errors in calculat-ing EP do not impair the accuracy of the stiffnesscalculations.
11.3.5 Variations in Screw Press Drives
In addition to direct friction and electricdrives (Fig. 11.25), there are several other typesof mechanical, electric, and hydraulic drives thatare commonly used in screw presses. A differentdesign is shown in Fig. 11.29. A flywheel (1),supported on the press frame, is driven by oneor several electric motors and rotates at a con-stant speed. When the stroke is initiated, an oil-operated clutch (2) engages the rotating flywheelagainst the stationary screw (3). This feature issimilar to what is used to initiate the stroke ofan eccentric forging press. On engagement ofthe clutch, the screw is rapidly accelerated andreaches the speed of the flywheel. As a result,the ram (4), which acts like a giant nut, moves
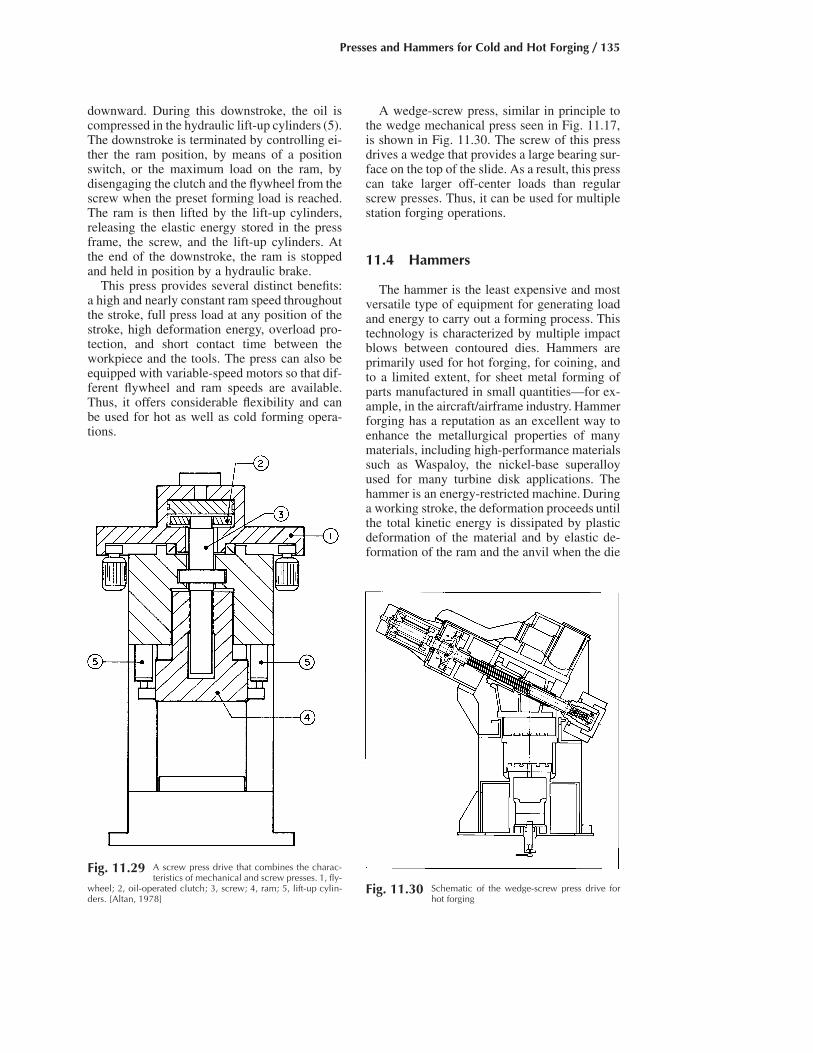
Presses and Hammers for Cold and Hot Forging / 135
Fig. 11.29 A screw press drive that combines the charac-teristics of mechanical and screw presses. 1, fly-
wheel; 2, oil-operated clutch; 3, screw; 4, ram; 5, lift-up cylin-ders. [Altan, 1978]
Fig. 11.30 Schematic of the wedge-screw press drive forhot forging
A wedge-screw press, similar in principle tothe wedge mechanical press seen in Fig. 11.17,is shown in Fig. 11.30. The screw of this pressdrives a wedge that provides a large bearing sur-face on the top of the slide. As a result, this presscan take larger off-center loads than regularscrew presses. Thus, it can be used for multiplestation forging operations.
11.4 Hammers
The hammer is the least expensive and mostversatile type of equipment for generating loadand energy to carry out a forming process. Thistechnology is characterized by multiple impactblows between contoured dies. Hammers areprimarily used for hot forging, for coining, andto a limited extent, for sheet metal forming ofparts manufactured in small quantities—for ex-ample, in the aircraft/airframe industry. Hammerforging has a reputation as an excellent way toenhance the metallurgical properties of manymaterials, including high-performance materialssuch as Waspaloy, the nickel-base superalloyused for many turbine disk applications. Thehammer is an energy-restricted machine. Duringa working stroke, the deformation proceeds untilthe total kinetic energy is dissipated by plasticdeformation of the material and by elastic de-formation of the ram and the anvil when the die
downward. During this downstroke, the oil iscompressed in the hydraulic lift-up cylinders (5).The downstroke is terminated by controlling ei-ther the ram position, by means of a positionswitch, or the maximum load on the ram, bydisengaging the clutch and the flywheel from thescrew when the preset forming load is reached.The ram is then lifted by the lift-up cylinders,releasing the elastic energy stored in the pressframe, the screw, and the lift-up cylinders. Atthe end of the downstroke, the ram is stoppedand held in position by a hydraulic brake.
This press provides several distinct benefits:a high and nearly constant ram speed throughoutthe stroke, full press load at any position of thestroke, high deformation energy, overload pro-tection, and short contact time between theworkpiece and the tools. The press can also beequipped with variable-speed motors so that dif-ferent flywheel and ram speeds are available.Thus, it offers considerable flexibility and canbe used for hot as well as cold forming opera-tions.

136 / Cold and Hot Forging: Fundamentals and Applications
Fig. 11.31 Principles of various types of gravity-drop hammers. (a) Board drop. (b) Belt drop. (c) Chain drop. (d) Air drop
faces contact each other. Therefore, it is neces-sary to rate the capacities of these machines interms of energy, i.e., foot-pounds, meter-kilo-grams, or meter-tons. The practice of specifyinga hammer by its ram weight is not useful for theuser. Ram weight can be regarded only as amodel or specification number.
There are basically two types of anvil ham-mers: gravity-drop hammers and power-drophammers. In a simple gravity-drop hammer, theupper ram is positively connected to a board(board-drop hammer), a belt (belt-drop ham-mer), a chain (chain-drop hammer), or a piston(oil-, air-, or steam-lift drop hammer); see Fig.11.31. The ram is lifted to a certain height andthen dropped on the stock placed on the anvil.During the downstroke, the ram is acceleratedby gravity and builds up the blow energy. Theupstroke takes place immediately after the blow;the force necessary to ensure quick lift-up of theram can be three to five times the ram weight.The operation principle of a power-drop ham-mer is similar to that of an air-drop hammer (Fig.11.31d). In the downstroke, in addition to grav-ity, the ram is accelerated by steam, cold air, orhot air pressure. In electrohydraulic gravity-drophammers, the ram is lifted with oil pressureagainst an air cushion. The compressed air slows
down the upstroke of the ram and contributes toits acceleration during the downstroke. Thus,electrohydraulic hammer also has a minor powerhammer action.
In the power-drop hammer, the accelerationof the ram is enhanced with air pressure appliedon the top side of the ram cylinder (Fig. 11.32).Today, most drop hammers are power or pres-sure drive. The air pressure and the ram heightare measured and electronically controlled as aresult. The energy per hammer blow can be me-tered automatically.
Counterblow hammers are widely used in Eu-rope while their use in the United States is lim-ited to a relatively small number of companies.The principles of two types of counterblow ham-mers are illustrated in Fig. 11.33. In both de-signs, the upper ram is accelerated downward bysteam, cold air, or hot air [Kuhn, 1963]. At thesame time, the lower ram is accelerated upwardby a steel band (for smaller capacities) or by ahydraulic coupling system (for larger capaci-ties). The lower ram, including the die assembly,is approximately 10% heavier than the upperram. Therefore, after the blow, the lower ramaccelerates downward and pulls the upper ramback up to its starting position. The combinedspeed of the rams is about 25 ft/s (7.5 m/s); both
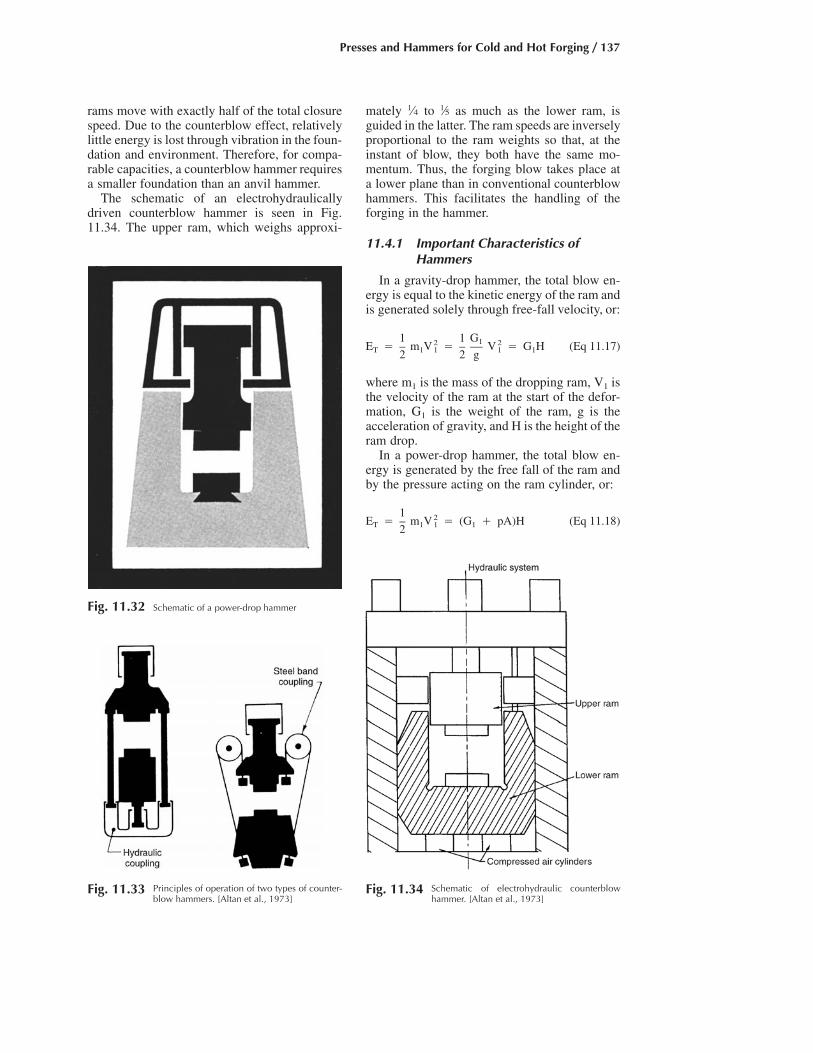
Presses and Hammers for Cold and Hot Forging / 137
Fig. 11.33 Principles of operation of two types of counter-blow hammers. [Altan et al., 1973]
Fig. 11.32 Schematic of a power-drop hammer
Fig. 11.34 Schematic of electrohydraulic counterblowhammer. [Altan et al., 1973]
rams move with exactly half of the total closurespeed. Due to the counterblow effect, relativelylittle energy is lost through vibration in the foun-dation and environment. Therefore, for compa-rable capacities, a counterblow hammer requiresa smaller foundation than an anvil hammer.
The schematic of an electrohydraulicallydriven counterblow hammer is seen in Fig.11.34. The upper ram, which weighs approxi-
mately 1⁄4 to 1⁄5 as much as the lower ram, isguided in the latter. The ram speeds are inverselyproportional to the ram weights so that, at theinstant of blow, they both have the same mo-mentum. Thus, the forging blow takes place ata lower plane than in conventional counterblowhammers. This facilitates the handling of theforging in the hammer.
11.4.1 Important Characteristics ofHammers
In a gravity-drop hammer, the total blow en-ergy is equal to the kinetic energy of the ram andis generated solely through free-fall velocity, or:
1 1 G12 2E � m V � V � G H (Eq 11.17)T 1 1 1 12 2 g
where m1 is the mass of the dropping ram, V1 isthe velocity of the ram at the start of the defor-mation, G1 is the weight of the ram, g is theacceleration of gravity, and H is the height of theram drop.
In a power-drop hammer, the total blow en-ergy is generated by the free fall of the ram andby the pressure acting on the ram cylinder, or:
1 2E � m V � (G � pA)H (Eq 11.18)T 1 1 12

138 / Cold and Hot Forging: Fundamentals and Applications
Fig. 11.35 Example of a load-stroke curve in a hammerblow
where, in addition to the symbols given above,p is the air, steam, or oil pressure acting on theram cylinder in the downstroke and A is the sur-face area of the ram cylinder.
In counterblow hammers, when both ramshave approximately the same weight, the totalenergy per blow is given by:
2 2 2m V m V G V1 1 1 t 1 tE � 2 � � (Eq 11.19)T � �2 4 4g
where m1 is the mass of one ram, V1 is the ve-locity of one ram, Vt is the actual velocity of theblow of two rams, which is equal to 2V1, andG1 is the weight of one ram.
During a working stroke, the total nominalenergy, ET, of a hammer is not entirely trans-formed into useful energy available for defor-mation, EA. Some small amount of energy is lostin overcoming friction of the guides, and a sig-nificant portion is lost in the form of noise andvibration to the environment. Thus, the blow ef-ficiency, g � EA/ET, of hammers is always lessthan one. The blow efficiency varies from 0.8 to0.9 for soft blows (small load and large displace-ment) and from 0.2 to 0.5 for hard blows (highload and small displacement).
The transformation of kinetic energy into de-formation energy during a working blow can de-velop considerable forces. For instance, considera deformation blow where the load, P, increasesfrom P/3 at the start to P at the end of the stroke,h. The available energy, EA, is the surface areaunder the curve in Fig. 11.35. Therefore:
P/3 � P 4PhE � h � (Eq 11.20)A 2 6
Consider a hammer with a total nominal en-ergy, ET, of 35,000 ft • lbf (47.5 kJ) and a blowefficiency, g, of 0.4; here, EA � ETg � 14,000ft • lbf (19 kJ). With this value, for a workingstroke, h, of 0.2 in., Eq 11.20 gives:
6EAP � � 1,260,000 lb � 630 tons4h
If the same energy were dissipated over a stroke,h, of 0.1 in., the load, P, would reach approxi-mately double the calculated value. The simplehypothetical calculations given above illustratethe capabilities of relatively inexpensive ham-mers in exerting high forming loads.
11.4.2 Computer-Controlled Hammers
Up to now, only small forging hammers andimpacters have benefited from sophisticatedcontrol systems that increase manufacturingspeed, reduce cost, and increase quality. Becauseof the many benefits possible on large hammers,computerized controls are now being adapted tolarge forging hammers.
Adding computerized controls to a forginghammer significantly improves the hammer pro-cess in three critical areas: microstructural qual-ity, operational uniformity and consistency, andcost containment for customers. However, trans-ferring small-hammer control technology tolarge industrial forging hammers is not a trivialundertaking. It requires extensive equipment en-gineering, and many issues arise in the transferof technology.
While hammer forging processes have alwaysoffered thermal-control-related advantages com-pared to press forging processes, these advan-tages are enhanced tremendously by the additionof microprocessor controls. These enhance-ments grow out of the ability to tailor the forgingsequence of a computerized hammer, openingthe door to process refinements that give engi-neers much greater control over the final micro-structural and mechanical properties.
Computerized hammer controls allow uniqueprocessing schemes to be developed for opti-mum results through computer process model-ing. Processing step combinations (blow energy,interblow dwell time, quantity of blows, etc.)can be engineered for best control of adiabaticheating, die chilling, strain, strain rate, recrys-tallization, and grain growth.

Presses and Hammers for Cold and Hot Forging / 139
The engineered processing steps are preciselycontrolled by the computerized forging hammercontrols, which also allow for greater under-standing of process and equipment parameters.This leads to greater computer process modelingcapability through precise boundary conditiondefinitions and outstanding simulation accuracy.The capabilities of this process have dramaticimplications for users of highly engineered forg-ings, and show why, metallurgically and eco-nomically, hammers are a tremendously valu-able piece of equipment.
REFERENCES
[Altan et al., 1972]: Altan, T., Nichols, D.E.,“Use of Standardized Copper Cylinders forDetermining Load and Energy in ForgingEquipment,” ASME Trans., J. Eng. Ind., Vol94, Aug 1972, p 769.
[Altan et al., 1973]: Altan, T., et al., “ForgingEquipment, Materials and Practices,” HB03,Metal and Ceramics Information Center,1973, p 4–7.
[Altan, 1978]: Altan, T., “Metalforming at2.EMO,” Am. Mach., Jan 1978, p 132.
[Altan et al., 1983]: Altan, T., Oh, S.-I., Gegel,H., Metal Forming: Fundamentals and Appli-cations, ASM International, 1983.
[ASM Handbook, 1988): Altan, T., “Hammerand Presses for Forging,” ASM Handbook,Vol 14, Forming and Forging, ASM Interna-tional, 1988, p 25–35.
[Bohringer et al., 1966]: Bohringer, H., Kilp,K.H., “Development of the Direct-Drive Per-cussion Press,” Sheet Metal Ind., Vol 43, Nov1966, p 857.
[Bohringer et al., 1968]: Bohringer, H., Kilp,K.H., “The Significant Characteristics of Per-cussion Presses and Their Measurements,”Sheet Metal Ind., May 1968, p 335.
[Douglas et al., 1972]: Douglas, J.R., Altan, T.,“Characteristics of Forging Presses: Deter-mination and Comparison,” Proceedings ofthe 13th M.T.D.R. Conference, Sept 1972,Birmingham, England, p. 536.
[Geleji, 1967]: Geleji, A., “Forge Equipment,Rolling Mills and Accessories” (in English),Akademaii Kiado, Budapest, 1967.
[Hutson, 1968]: Hutson, C., “An Investigationinto Press Driving Systems,” Metal Forming,Vol 35, March 1968, p 46.
[Kienzle, 1959]: Kienzle, O., “DevelopmentTrends in Forming Equipment” (in German),Werkstattstechnik, Vol 49, 1959, p 479.
[Kirschbaum, 1968]: Kirschbaum, Z., “AComparative Study of the Stability and Eco-nomic Construction of Pushdown, Pulldownand Horizontal Double Opposed ForgingPresses,” Iron Steel, Feb 1968, p 46.
[Klaprodt, 1968]: Klaprodt, Th., “Comparisonof Some Characteristics of Mechanical andScrew Presses for Die Forging” (in German),Indust.-Anzeig., Vol 90, 1968, p 1423.
[Kuhn, 1963]: “Counterblow Hammers forHeavy Forgings” (in German), Kleipzig Fach-berichte, No. 11, Dusseldorf, 1963.
[Mueller, 1969]: Mueller, E., Hydraulic ForgingPresses, Springer Verlag, Berlin, 1969.
[Peters, 1969]: Peters, K.H., “Design Featuresof the Hydraulic Press and its Field of Appli-cation,” Sheet Metal Ind., Vol 46, March1969, p 221–226.
[Rau, 1967]: Rau, G., A Die Forging Press witha New Drive, Metal Form., July 1967, p 194–198.
[Riemenschneider et al., 1959]: Riemenschnei-der, F., Nickrawietz, K., “Drives for ForgingPresses” (in German), Stahl Eisen, Vol 79,1959, p 494.
[Schuler Handbook, 1998]: Schuler, MetalForging Handbook, Springer, Goppingen,Germany, 1998.
[Watermann, 1963]: Watermann, H.D., “TheBlow Efficiency in Hammers and ScrewPresses” (in German), Indust.-Anzeig., No.77, 24 Sept 1963, p 53.
SELECTED REFERENCES
[Brauer, 1961]: Brauer, W., “The Developmentof Electrohydraulic Drop Hammers”(in Ger-man), Werkstattstechnik, 1961, p 105.
[Hamilton, 1960]: Hamilton, E., “PowerPresses, Their Design and Characteristics,”Sheet Metal Ind., Vol 37, July 1960, p 501–513.
[Pahnke]: Pahnke, H.J., “Technical and Eco-nomic Limitations of Conventional Four Col-umn Top Drive Forging Presses,” SME PaperMF70-589.
[Spachner]: Spachner, S.A., “Use of a Four BarLinkage as a Slide Drive for MechanicalPresses,” SME Paper MF70-216.

CHAPTER 12
Special Machines for ForgingPinak Barve
Fig. 12.2 Schematic of the reducer rolling operationFig. 12.1 Schematic of forging rolls for reducer rolling
12.1 Introduction
Prior to forging in an impression die, billetstock must be often preformed to achieve ade-quate material distribution, especially in hotforging with flash. Several special machines areused for the purpose of preforming the incomingstock. Some of these machines may also be usedfor finish forging.
The principle of forging rolls, or reducer rolls,is illustrated schematically in Fig. 12.1. This ma-chine is generally used for volume distributionin long and thin parts, prior to closed-die forg-ing. A typical operation on reducer rolls, suchas those of Fig. 12.2, is as follows.
The operator or a robot places the heatedstock on a table in the front of the machine,grasps the stock with the tongs, and starts themachine with a foot pedal or automatic signal.During the portion of the roll rotation, when therolls are in open position, the stock is placed
between the rolls against a stock gage and in linewith the first roll groove. As the rolls rotate,forging begins and the deformed stock is forcedtoward the front of the machine [Altan et al.,1973].
These sequences are repeated for the nextgrooves. Thus, the shape of the die segments onthe forging rolls determines the rolled configu-ration. An example illustrating the applicationof preforming by roll forging, or reducer rolling,is shown in Fig. 12.3. Another example, illus-trating preforming for a truck axle forging, isseen in Fig. 12.4.
In roll forging, the contact time between theworkpiece and the roll segments is extremelyshort due to the high speed of the rolls. There-fore, even after the final rolling operation, theworkpiece is still hot and can be finish forgedunder a hammer or press without reheating.
For high-volume production, the reducer roll-ing operation is automated. The stock is gripped,fed into the rolls, transferred from one die seg-ment to the other, and released on a conveyorusing a dedicated robot. In producing long parts,
Cold and Hot Forging Fundamentals and ApplicationsTaylan Altan, Gracious Ngaile, Gangshu Shen, editors, p141-150 DOI:10.1361/chff2005p141
Copyright © 2005 ASM International® All rights reserved. www.asminternational.org

142 / Cold and Hot Forging: Fundamentals and Applications
Fig. 12.3 Example of preforming by reducer rolling in forging of connecting rods. (a) Preforms prepared in reducer rolls. (b) Finishforging before and after trimming. [Altan et al., 1973]
such as crankshafts and front axles, it is possibleto use vertical reducer rollers, as seen in Fig.12.5.
The design of the roll segments needs consid-erable experience. Recently, three-dimensionalFEM codes have been used to (a) simulate thereducer rolling operation and (b) design and op-timize the configuration of the die segments.Figure 12.6 shows, as an example, two rollpasses, simulated by the commercial softwareDEFORM 3-D [SFTC, 2003]. The desired shapeis produced by rolling the heated billet betweentwo rotating dies having appropriately profiledgrooves. After the first pass, the billet is fed intothe roll segments of the second pass after 90�rotation.
12.2 Transverse orCross-Rolling Machines
Transverse rolling is used for producing pre-forms or finish forgings from round billets. Asseen in Fig 12.7, a round billet is inserted trans-versely between two or three rolls, which rotatein the same direction and drive the billet [Altanet al., 1973]. The rolls, which hold replaceabledie segments with appropriate impressions,make one revolution while the workpiece rotates
several times in the opposite direction. Thus, thetransverse rolling method can form axially sym-metrical shafts with complex geometry in oneoperation. As an example, a forging producedby this method is shown in Fig. 12.8. The trans-verse rolling machines are suitable for automaticproduction, using bar stock automatically fed tothe rolls through an induction heating unit.
There are two main types of transverse rollingmachines:
● The two- or-three-roll machine, (Fig. 12.7)● A transverse rolling machine that uses two
straight wedge-shaped tools (Fig. 12.9)
12.3 Electric Upsetters
Electric upsetters are used mostly in preformpreparation for gathering a large amount of ma-terial at one end of a round bar. The principle ofoperation is illustrated in Fig. 12.10. A bar ofcircular cross section (d) is gripped between thetools (b) of the electrode (c) and is pushed bythe hydraulically or pneumatically operated up-setting head against the anvil plate (f) on whichthe other electrode (e) is secured. On switchingon the current, the rod section contained be-tween the electrodes heats rapidly and the for-mation of the head begins. The cold bar is con-

Special Machines for Forging / 143
tinuously fed between the gripping electrodes(b), thus the metal accumulates continuously inthe head. The anvil electrode is gradually re-tracted to give enough space for the formationof the head. As soon as sufficient quantity ofmetal is gathered, the machine switches off andthe product can be removed by its cold end. Nor-mally, the head is formed to final shape in a me-chanical or screw-type press in the same heat.Thus, the process is suitable for manufacturingcomponents such as automotive exhaust valves,or steam turbine blades [Altan et al., 1973].
The flat anvil electrode can be replaced by awater-cooled copper mold into which material isgathered and formed to close shape and dimen-sions. Material can be gathered at any point onthe length of the bar by placing a sheath aroundone end. The only limitation on size is the avail-ability of electric current. Commercially avail-able equipment is capable of upsetting 0.5 to 5in. (12.5 to 125 mm) diameter bars. As time forupsetting a head of average size is 2 to 5 min,several units are required for achieving high vol-ume production.
12.4 Ring-Rolling Mills
The principle of operation of a horizontalring-rolling mill is illustrated in Fig. 12.11. Thevertical mills operate essentially in the sameway. The doughnut-shaped blank is placed overa mandrel with a diameter smaller than the in-side diameter of the blank. The mandrel, in mov-ing laterally toward the main roll, applies pres-sure on the blank. The main roll, which is driven,rotates the blank and the mandrel as the crosssection of the blank is reduced. The axial rollsprovide support to the deforming ring and con-trol its width and its squareness. As seen in Fig.12.12, by modifying the configurations of themandrel and the main roll, it is possible to rollrings with internal and external profiles [Beseler,1969].
For components required in large quantities,such as bearing races, completely automatedring-rolling installations are available. Such aninstallation may consist of a billet shear, a heat-ing furnace, a forging press, and a ring-rollingmill. The principles of an automatic horizontalring-rolling mill for manufacturing bearing races
Fig. 12.5 Schematic of a vertical reducer roller. 1, roll stand;2, holder on manipulator; 3, slide; 4, rolls; 5, part
transfer conveyor. [Haller, 1982]
Fig. 12.4 Deformation stages in reducer rolling of a forgingto produce a truck axle. (a) Starting billet. (b)–(e)
Several reducer roll passes. (1)–(3) Locations where more mate-rial needed in the final forging. [Haller, 1982]
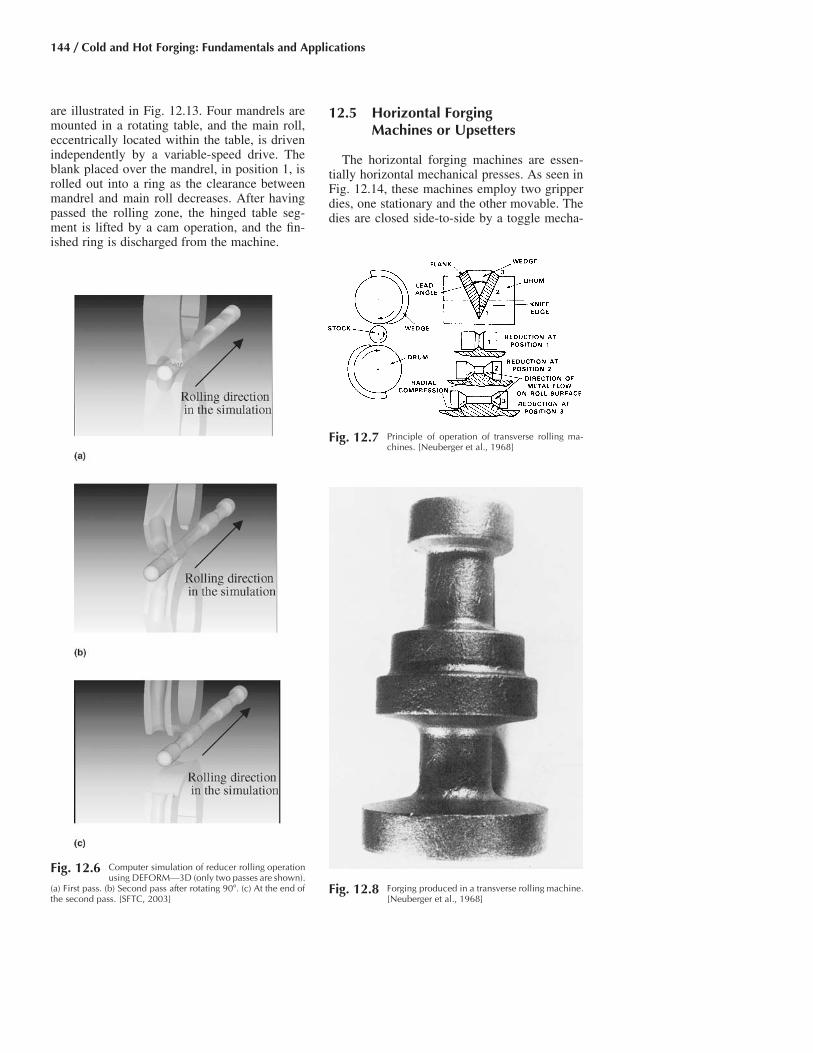
144 / Cold and Hot Forging: Fundamentals and Applications
Fig. 12.8 Forging produced in a transverse rolling machine.[Neuberger et al., 1968]
are illustrated in Fig. 12.13. Four mandrels aremounted in a rotating table, and the main roll,eccentrically located within the table, is drivenindependently by a variable-speed drive. Theblank placed over the mandrel, in position 1, isrolled out into a ring as the clearance betweenmandrel and main roll decreases. After havingpassed the rolling zone, the hinged table seg-ment is lifted by a cam operation, and the fin-ished ring is discharged from the machine.
12.5 Horizontal ForgingMachines or Upsetters
The horizontal forging machines are essen-tially horizontal mechanical presses. As seen inFig. 12.14, these machines employ two gripperdies, one stationary and the other movable. Thedies are closed side-to-side by a toggle mecha-
Fig. 12.7 Principle of operation of transverse rolling ma-chines. [Neuberger et al., 1968]
Fig. 12.6 Computer simulation of reducer rolling operationusing DEFORM—3D (only two passes are shown).
(a) First pass. (b) Second pass after rotating 90�. (c) At the end ofthe second pass. [SFTC, 2003]

Special Machines for Forging / 145
Fig. 12.10 Principle of operation of the electric upsetter.See text for details. [Altan et al., 1973]
nism operated by a cam or eccentric located onthe eccentric shaft. Several matching die insertsare placed in the gripper dies, while the slidecarrying the punches is moved by an eccentric-pitman mechanism. The operational sequence ofa horizontal forging machine is illustrated in Fig.12.15 for the upsetting process: (a) the hot endof the bar is placed into the stationary gripperdie against a stop, (b) the moving gripper diecloses and the stop retracts, (c) the heading toolbegins to deform the bar, and (d) completes theupsetting at the end of its stroke.
The upsetters are used for upset forging,piercing, and reducing of bars and tubes. In au-tomatic operation, the parts are transported byfinger-type cam-operated devices or walking-beam-type transfer devices from one die cavityto the next. Most horizontal forging machinesare designed such that the gripper dies are ori-ented vertically, i.e., during closing action, the
movable gripping die moves horizontally[Lange, 1958].
12.6 Rotary orOrbital Forging Machines
The principles of rotary forging machines areillustrated in Fig. 12.16 for a simple upsettingoperation.
Instead of the direct pressing action betweentwo flat platens, the workpiece is subjected to acombined rolling and pressing action between aflat bottom platen and a swiveling upper die witha conical working face. The cone axis is inclinedso that the narrow sector in contact with theworkpiece is parallel to the lower platen. As thecone rotates about the cone apex, the contactzone also rotates. At the same time, the platensare pressed toward each other so that the work-piece is progressively compressed by the rollingaction. Press loading is appreciably less than thatof conventional upsetting because of relativelysmall area of instantaneous contact. The appli-cation of a rotary forging machine to a closed-die forging operation is illustrated in Fig. 12.17.
12.7 Radial Forging Machines
In many applications, it is necessary to forge,as final product or as a preforming step, solid
Fig. 12.9 Principles of and tooling for transverse rolling ma-chine with straight dies. (a) Operation. (b) Assem-
bly of simple die. [Altan et al., 1973]
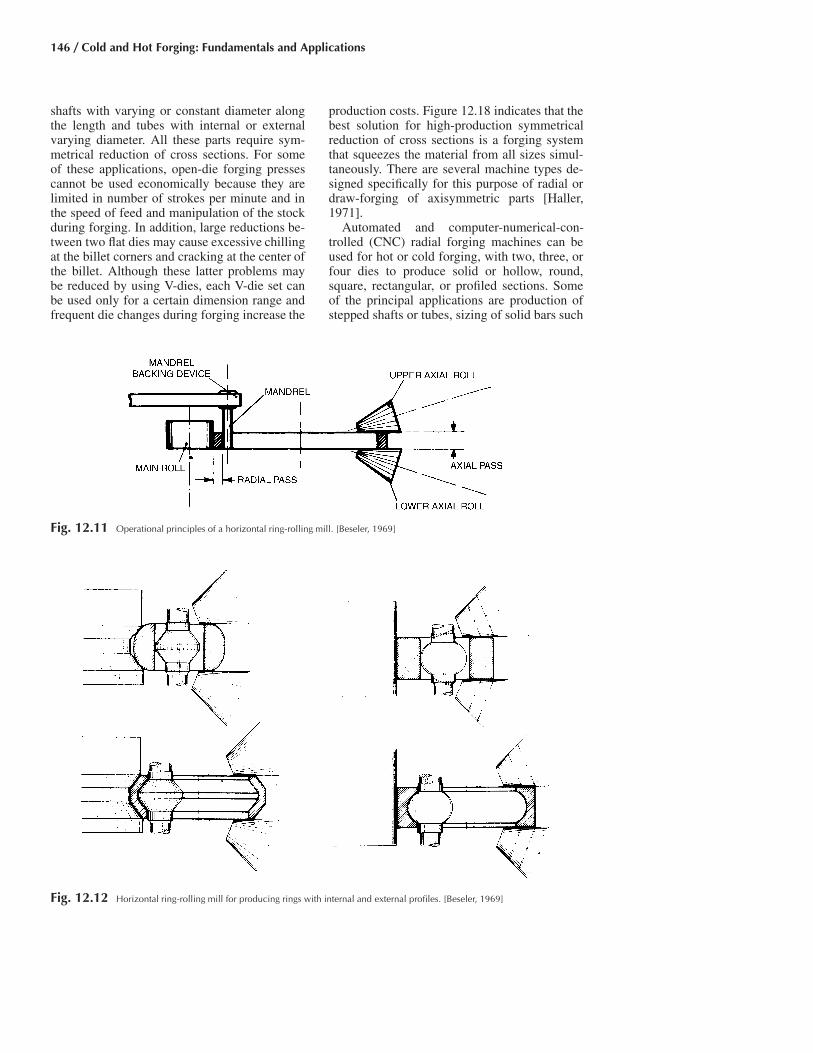
146 / Cold and Hot Forging: Fundamentals and Applications
Fig. 12.12 Horizontal ring-rolling mill for producing rings with internal and external profiles. [Beseler, 1969]
Fig. 12.11 Operational principles of a horizontal ring-rolling mill. [Beseler, 1969]
shafts with varying or constant diameter alongthe length and tubes with internal or externalvarying diameter. All these parts require sym-metrical reduction of cross sections. For someof these applications, open-die forging pressescannot be used economically because they arelimited in number of strokes per minute and inthe speed of feed and manipulation of the stockduring forging. In addition, large reductions be-tween two flat dies may cause excessive chillingat the billet corners and cracking at the center ofthe billet. Although these latter problems maybe reduced by using V-dies, each V-die set canbe used only for a certain dimension range andfrequent die changes during forging increase the
production costs. Figure 12.18 indicates that thebest solution for high-production symmetricalreduction of cross sections is a forging systemthat squeezes the material from all sizes simul-taneously. There are several machine types de-signed specifically for this purpose of radial ordraw-forging of axisymmetric parts [Haller,1971].
Automated and computer-numerical-con-trolled (CNC) radial forging machines can beused for hot or cold forging, with two, three, orfour dies to produce solid or hollow, round,square, rectangular, or profiled sections. Someof the principal applications are production ofstepped shafts or tubes, sizing of solid bars such
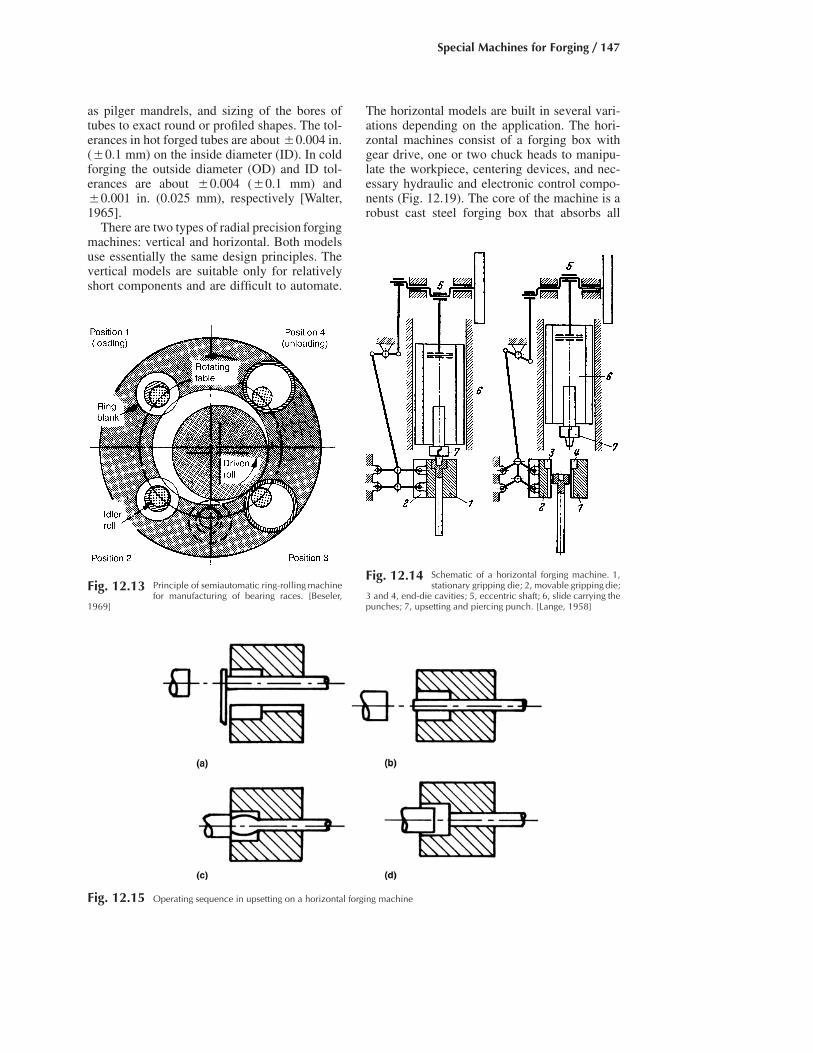
Special Machines for Forging / 147
Fig. 12.14 Schematic of a horizontal forging machine. 1,stationary gripping die; 2, movable gripping die;
3 and 4, end-die cavities; 5, eccentric shaft; 6, slide carrying thepunches; 7, upsetting and piercing punch. [Lange, 1958]
Fig. 12.13 Principle of semiautomatic ring-rolling machinefor manufacturing of bearing races. [Beseler,
1969]
as pilger mandrels, and sizing of the bores oftubes to exact round or profiled shapes. The tol-erances in hot forged tubes are about �0.004 in.(�0.1 mm) on the inside diameter (ID). In coldforging the outside diameter (OD) and ID tol-erances are about �0.004 (�0.1 mm) and�0.001 in. (0.025 mm), respectively [Walter,1965].
There are two types of radial precision forgingmachines: vertical and horizontal. Both modelsuse essentially the same design principles. Thevertical models are suitable only for relativelyshort components and are difficult to automate.
The horizontal models are built in several vari-ations depending on the application. The hori-zontal machines consist of a forging box withgear drive, one or two chuck heads to manipu-late the workpiece, centering devices, and nec-essary hydraulic and electronic control compo-nents (Fig. 12.19). The core of the machine is arobust cast steel forging box that absorbs all
Fig. 12.15 Operating sequence in upsetting on a horizontal forging machine

148 / Cold and Hot Forging: Fundamentals and Applications
Fig. 12.16 Principle of rotary or orbital forging machines.[Altan et al., 1973]
Fig. 12.17 Illustration of closed-die forging with a rotaryforging machine. 1, rotating upper platen; 2,
workpiece; 3, lower die; 4, ejector
Fig. 12.18 Deformation of a round cross section in stretchforging. P, load. (a) Between flat anvils. (b) Be-
tween four curves of a radial forging machine. [Haller, 1971]
forging forces (Fig. 12.20). It is mounted withthe gear box in a support bolted to the founda-tion frame. The forging box contains four rotat-able adjustment housings in which the eccentricshafts are mounted. The eccentric shafts, whichare driven by an electric motor through a gear
system, actuate the connecting rods and the forg-ing dies at a rate of 250 to 1800 strokes/min.The stroke position of the connecting rods (ordies) is adjusted in pairs independently (for rec-tangles or special shapes) or in unison (forrounds and squares) by rotating each adjustmenthousing through a link, screw, adjustment nut,and worm gear drive powered by one or twohydraulic motors. Each adjustment nut rests,through a piston, on an oil cushion of a hydrauliccylinder. During operation, the forging pressuregenerates in this oil cushion a pressure propor-tional (about 20%) to the forging pressure. Thepressure in this oil cushion is continuouslymonitored, and if it exceeds a certain limit theadjustment housings are immediately rotated tobring the dies to open position while the move-ment of the chuck heads is stopped simulta-neously. This system protects the machine fromoverloading [Altan et al., 1973].
Depending on the machine type, one or twohydraulically driven chuck heads are provided
Fig. 12.19 Schematic of a GFM radial precision forging machine with two chuck heads. [Walter, 1965]
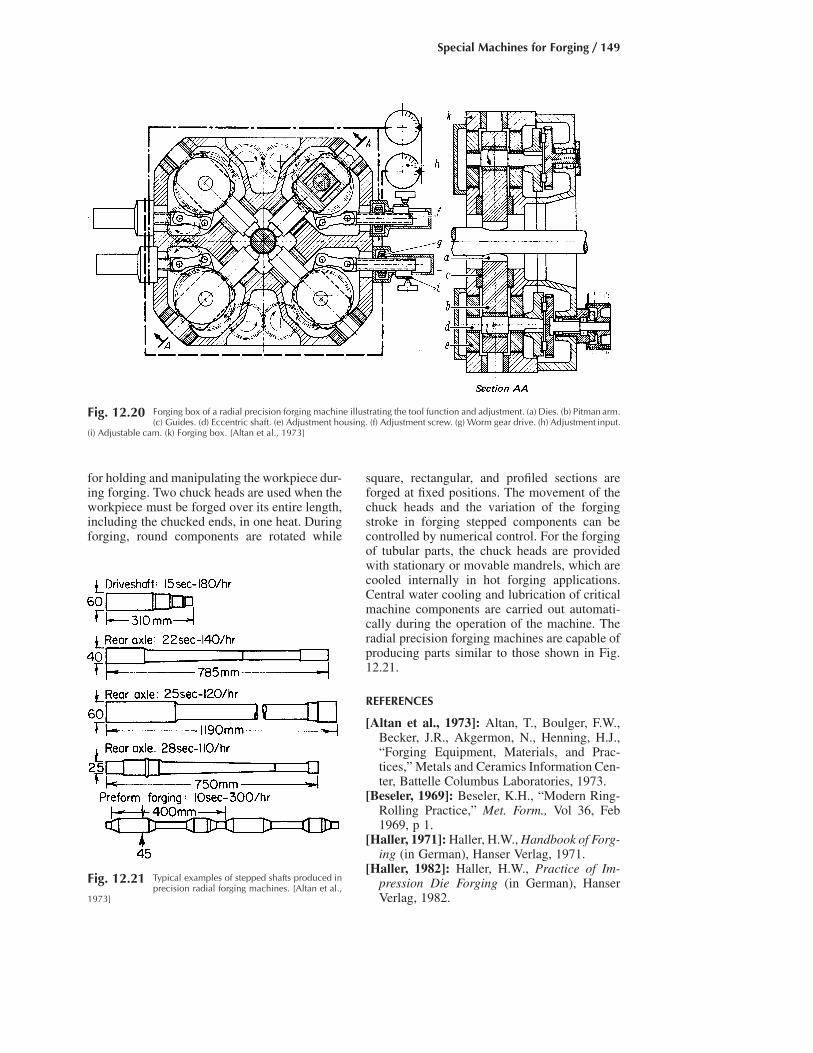
Special Machines for Forging / 149
Fig. 12.20 Forging box of a radial precision forging machine illustrating the tool function and adjustment. (a) Dies. (b) Pitman arm.(c) Guides. (d) Eccentric shaft. (e) Adjustment housing. (f) Adjustment screw. (g) Worm gear drive. (h) Adjustment input.
(i) Adjustable cam. (k) Forging box. [Altan et al., 1973]
Fig. 12.21 Typical examples of stepped shafts produced inprecision radial forging machines. [Altan et al.,
1973]
for holding and manipulating the workpiece dur-ing forging. Two chuck heads are used when theworkpiece must be forged over its entire length,including the chucked ends, in one heat. Duringforging, round components are rotated while
square, rectangular, and profiled sections areforged at fixed positions. The movement of thechuck heads and the variation of the forgingstroke in forging stepped components can becontrolled by numerical control. For the forgingof tubular parts, the chuck heads are providedwith stationary or movable mandrels, which arecooled internally in hot forging applications.Central water cooling and lubrication of criticalmachine components are carried out automati-cally during the operation of the machine. Theradial precision forging machines are capable ofproducing parts similar to those shown in Fig.12.21.
REFERENCES
[Altan et al., 1973]: Altan, T., Boulger, F.W.,Becker, J.R., Akgermon, N., Henning, H.J.,“Forging Equipment, Materials, and Prac-tices,” Metals and Ceramics Information Cen-ter, Battelle Columbus Laboratories, 1973.
[Beseler, 1969]: Beseler, K.H., “Modern Ring-Rolling Practice,” Met. Form., Vol 36, Feb1969, p 1.
[Haller, 1971]: Haller, H.W., Handbook of Forg-ing (in German), Hanser Verlag, 1971.
[Haller, 1982]: Haller, H.W., Practice of Im-pression Die Forging (in German), HanserVerlag, 1982.

150 / Cold and Hot Forging: Fundamentals and Applications
[Lange, 1958]: Lange, K., Closed-Die Forgingof Steel (in German), Springer-Verlag, Berlin,1958.
[Neuberger et al., 1968]: Neuberger, F., et al.,“Transverse Rolling,” Met. Form., Vol 35, Oct1968, p 1.
[SFTC, 2003]: Scientific Forming TechnologiesCorp., DEFORM 2D and 3D Software, Co-lumbus, OH, 2003.
[Walter, 1965]: Walter, L., “Use of PrecisionForging Machines,” Met. Treat., Aug 1965, p296.

CHAPTER 13
Billet Separation and ShearingSerdar IsbirPinak Barve
Fig. 13.1 Sheared surface of a billet [Duvari et al., 2003]
13.1 Introduction
Forging stock must be cut from the initial millproducts, usually rolled round or round-corneredsquare bars, into billets of exact lengths and vol-umes prior to forging. The method of cutting offbars is determined by the edge condition re-quired for subsequent operations. Sawing usu-ally produces a uniform cut edge with little orno damage to the microstructure in the imme-diate area. Gas cutting produces an edge that re-sembles a sawed edge in smoothness and square-ness. However, the cut edge of some steelsbecomes hardened during gas cutting, thus mak-ing subsequent processing difficult. Separationof billets by shearing is a process without ma-terial loss and with considerably higher outputwith respect to sawing, abrasive cutting, or flamecutting.
Billets and bar sections are sheared betweenthe lower and upper blades of a machine inwhich only the upper blade is movable. Thereare also shears, such as impact cutoff machines,that utilize a horizontal knife movement to shearthe bar sections. The shear blade plastically de-forms the material until its deformation limit inthe shearing zone has been exhausted, shearingcracks appear, and fracture occurs. Figure 13.1shows the appearance of a hot sheared round bar.The burnished area, or depth of shear action bythe blade, is usually one-fifth to one-fourth thediameter of the bar. In visual examination of asheared edge, the burnished portion appearssmooth, while the fractured portion is relativelyrough.
Many materials cannot be cut by simpleshearing into billets with exact lengths and vol-
umes. In general, high-strength steels havingtensile strength above 60,000 psi (414 MPa) areheated to between 600 and 750 �F (315 and400 �C) prior to shearing in order to eliminatethe danger of cracking. Aluminum, magnesium,and copper alloys require sawing or cutting witha friction wheel. Nickel-base alloys, superalloys,and titanium alloys also require sawing or abra-sive wheel cutting. Metal-cutting saws of vari-ous types, usually carbide tipped, are availablefor billet separation.
13.2 Billet andSheared Surface Quality
Straight blades can be used to shear bars andbar sections, but in this case, a considerableamount of distortion occurs, as seen in Fig. 13.1.
Cold and Hot Forging Fundamentals and ApplicationsTaylan Altan, Gracious Ngaile, Gangshu Shen, editors, p151-157 DOI:10.1361/chff2005p151
Copyright © 2005 ASM International® All rights reserved. www.asminternational.org
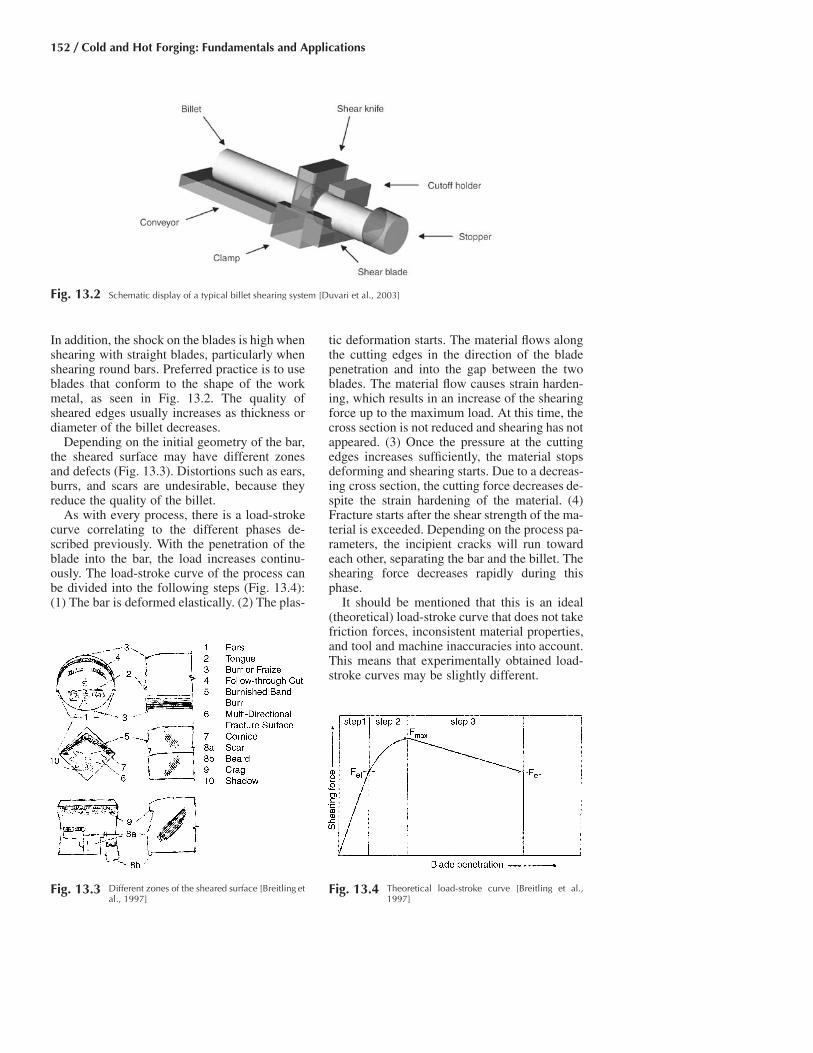
152 / Cold and Hot Forging: Fundamentals and Applications
Fig. 13.4 Theoretical load-stroke curve [Breitling et al.,1997]
Fig. 13.3 Different zones of the sheared surface [Breitling etal., 1997]
Fig. 13.2 Schematic display of a typical billet shearing system [Duvari et al., 2003]
In addition, the shock on the blades is high whenshearing with straight blades, particularly whenshearing round bars. Preferred practice is to useblades that conform to the shape of the workmetal, as seen in Fig. 13.2. The quality ofsheared edges usually increases as thickness ordiameter of the billet decreases.
Depending on the initial geometry of the bar,the sheared surface may have different zonesand defects (Fig. 13.3). Distortions such as ears,burrs, and scars are undesirable, because theyreduce the quality of the billet.
As with every process, there is a load-strokecurve correlating to the different phases de-scribed previously. With the penetration of theblade into the bar, the load increases continu-ously. The load-stroke curve of the process canbe divided into the following steps (Fig. 13.4):(1) The bar is deformed elastically. (2) The plas-
tic deformation starts. The material flows alongthe cutting edges in the direction of the bladepenetration and into the gap between the twoblades. The material flow causes strain harden-ing, which results in an increase of the shearingforce up to the maximum load. At this time, thecross section is not reduced and shearing has notappeared. (3) Once the pressure at the cuttingedges increases sufficiently, the material stopsdeforming and shearing starts. Due to a decreas-ing cross section, the cutting force decreases de-spite the strain hardening of the material. (4)Fracture starts after the shear strength of the ma-terial is exceeded. Depending on the process pa-rameters, the incipient cracks will run towardeach other, separating the bar and the billet. Theshearing force decreases rapidly during thisphase.
It should be mentioned that this is an ideal(theoretical) load-stroke curve that does not takefriction forces, inconsistent material properties,and tool and machine inaccuracies into account.This means that experimentally obtained load-stroke curves may be slightly different.

Billet Separation and Shearing / 153
Fig. 13.5 Important parameters in shearing [Duvari et al., 2003]
There are four ways a billet can be sheared:without bar and cutoff holder, with bar holder,with bar and cutoff holder, and with axial pres-sure application [Schuler, 1998]. In all the afore-mentioned methods, plastic flow lateral to theshearing direction is increasingly prevented,while compressive stress increases during theshearing operation. Both tendencies exercise apositive influence over the geometry (ovality,tolerance) of the sheared surface. Most accuratebillets are produced using the shearing principlewith bar and cutoff holder (Fig. 13.5). For coldforging, sheared billets should have the greatestpossible straightness, volume control, and littleplastic deformation. The sheared surfaces shouldbe free of shearing defects and exhibit only amoderate amount of strain hardening. The ap-pearance of the sheared surfaces is the result ofinteractions between workpiece characteristics,tool, machine, and friction.
Billets are usually supported on both sides ofthe shear blades by a roller conveyor table andplaced squarely against a gage stop securelybolted to the exit side of the machine. In such asetup, billets can ordinarily be cut to lengths ac-curate to �1⁄8, �0 in. (�3.2, �0 mm) onshears that can cut bars up to 4 in. (102 mm) indiameter. When larger shears are used, thebreakaway of the metal can cause a variation of�3⁄16 in. (�4.8 mm) [Wick et al., 1984]. Fairlyconsistent accuracy in the shearing of the slugscan be obtained by careful adjustment of the
gage setting, especially if the slugs are producedon a weight-per-piece basis. Supporting the freeend of the material on a spring-supported tablewill minimize bending during the shearingoperation, thus providing better control over thelength of the cut. Shearing clearance, cuttingspeed, knife and blade edge radii, gap clearance,draft angle, and billet temperature are the param-eters affecting sheared billet quality [Duvari etal., 2003, Camille et al., 1998].
Clearance. The shearing clearance exercisesa major influence in the surface quality ofsheared billets. The greater the strength of thesteel, the smaller is the shearing clearance. Thefollowing values may be taken as guidelines forshearing clearance of steel; the given values arepercentage of the starting material diameter inmillimeters:
● Soft steel types, 5–10%● Hard steel types, 3–5%● Brittle steel types, 1–3%
Rough fractured surfaces, tears, and seams in-dicate an excessively large shearing tool clear-ance. Cross-fractured surfaces and materialtongues indicate an insufficient tool clearance.With increasing shearing velocity, the deforma-tion zone reduces, the hardness distribution be-comes more uniform, and the hardness increasein the sheared surface becomes less pronounced,i.e. the material becomes more “brittle.”
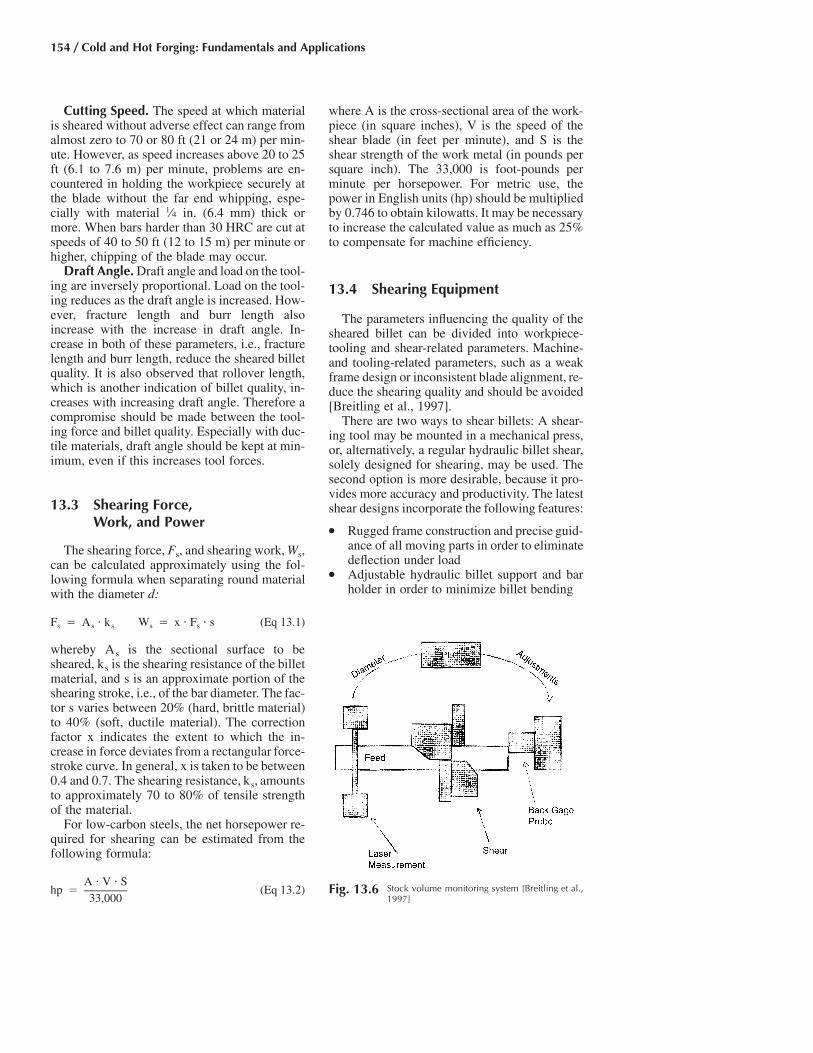
154 / Cold and Hot Forging: Fundamentals and Applications
Cutting Speed. The speed at which materialis sheared without adverse effect can range fromalmost zero to 70 or 80 ft (21 or 24 m) per min-ute. However, as speed increases above 20 to 25ft (6.1 to 7.6 m) per minute, problems are en-countered in holding the workpiece securely atthe blade without the far end whipping, espe-cially with material 1⁄4 in. (6.4 mm) thick ormore. When bars harder than 30 HRC are cut atspeeds of 40 to 50 ft (12 to 15 m) per minute orhigher, chipping of the blade may occur.
Draft Angle. Draft angle and load on the tool-ing are inversely proportional. Load on the tool-ing reduces as the draft angle is increased. How-ever, fracture length and burr length alsoincrease with the increase in draft angle. In-crease in both of these parameters, i.e., fracturelength and burr length, reduce the sheared billetquality. It is also observed that rollover length,which is another indication of billet quality, in-creases with increasing draft angle. Therefore acompromise should be made between the tool-ing force and billet quality. Especially with duc-tile materials, draft angle should be kept at min-imum, even if this increases tool forces.
13.3 Shearing Force,Work, and Power
The shearing force, Fs, and shearing work, Ws,can be calculated approximately using the fol-lowing formula when separating round materialwith the diameter d:
F � A • k W � x • F • s (Eq 13.1)s s s s s
whereby As is the sectional surface to besheared, ks is the shearing resistance of the billetmaterial, and s is an approximate portion of theshearing stroke, i.e., of the bar diameter. The fac-tor s varies between 20% (hard, brittle material)to 40% (soft, ductile material). The correctionfactor x indicates the extent to which the in-crease in force deviates from a rectangular force-stroke curve. In general, x is taken to be between0.4 and 0.7. The shearing resistance, ks, amountsto approximately 70 to 80% of tensile strengthof the material.
For low-carbon steels, the net horsepower re-quired for shearing can be estimated from thefollowing formula:
A • V • Shp � (Eq 13.2)
33,000
where A is the cross-sectional area of the work-piece (in square inches), V is the speed of theshear blade (in feet per minute), and S is theshear strength of the work metal (in pounds persquare inch). The 33,000 is foot-pounds perminute per horsepower. For metric use, thepower in English units (hp) should be multipliedby 0.746 to obtain kilowatts. It may be necessaryto increase the calculated value as much as 25%to compensate for machine efficiency.
13.4 Shearing Equipment
The parameters influencing the quality of thesheared billet can be divided into workpiece-tooling and shear-related parameters. Machine-and tooling-related parameters, such as a weakframe design or inconsistent blade alignment, re-duce the shearing quality and should be avoided[Breitling et al., 1997].
There are two ways to shear billets: A shear-ing tool may be mounted in a mechanical press,or, alternatively, a regular hydraulic billet shear,solely designed for shearing, may be used. Thesecond option is more desirable, because it pro-vides more accuracy and productivity. The latestshear designs incorporate the following features:
● Rugged frame construction and precise guid-ance of all moving parts in order to eliminatedeflection under load
● Adjustable hydraulic billet support and barholder in order to minimize billet bending
Fig. 13.6 Stock volume monitoring system [Breitling et al.,1997]
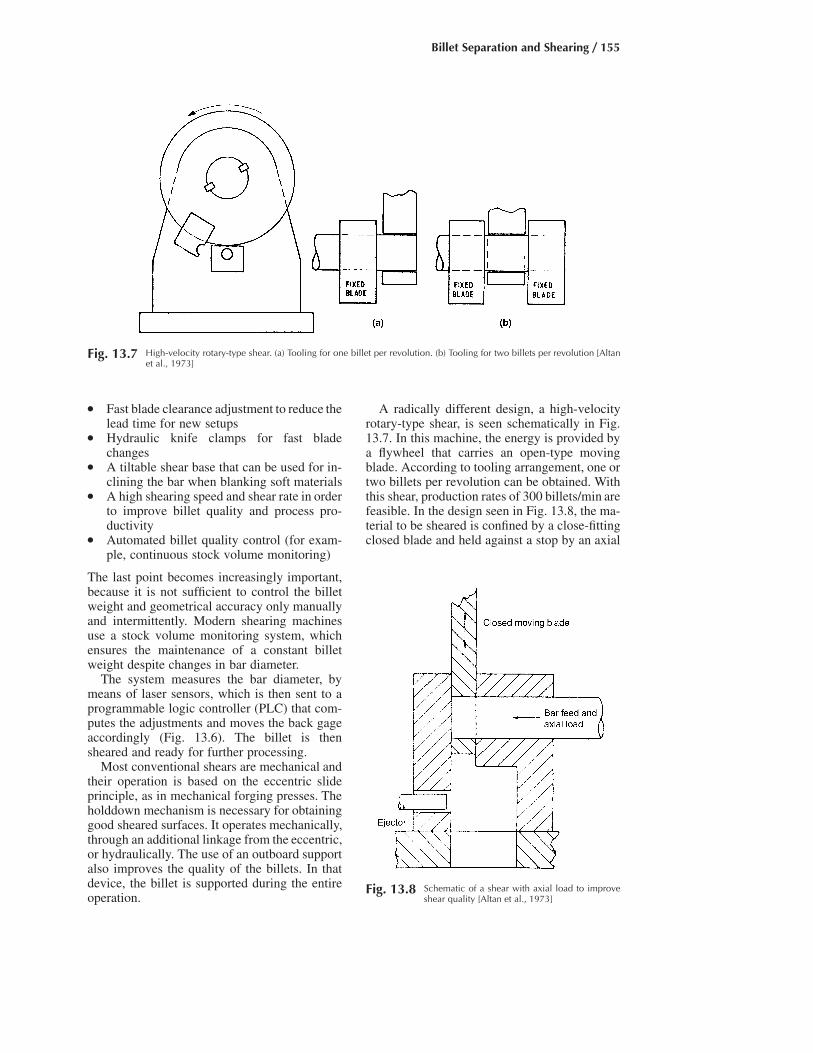
Billet Separation and Shearing / 155
● Fast blade clearance adjustment to reduce thelead time for new setups
● Hydraulic knife clamps for fast bladechanges
● A tiltable shear base that can be used for in-clining the bar when blanking soft materials
● A high shearing speed and shear rate in orderto improve billet quality and process pro-ductivity
● Automated billet quality control (for exam-ple, continuous stock volume monitoring)
The last point becomes increasingly important,because it is not sufficient to control the billetweight and geometrical accuracy only manuallyand intermittently. Modern shearing machinesuse a stock volume monitoring system, whichensures the maintenance of a constant billetweight despite changes in bar diameter.
The system measures the bar diameter, bymeans of laser sensors, which is then sent to aprogrammable logic controller (PLC) that com-putes the adjustments and moves the back gageaccordingly (Fig. 13.6). The billet is thensheared and ready for further processing.
Most conventional shears are mechanical andtheir operation is based on the eccentric slideprinciple, as in mechanical forging presses. Theholddown mechanism is necessary for obtaininggood sheared surfaces. It operates mechanically,through an additional linkage from the eccentric,or hydraulically. The use of an outboard supportalso improves the quality of the billets. In thatdevice, the billet is supported during the entireoperation.
A radically different design, a high-velocityrotary-type shear, is seen schematically in Fig.13.7. In this machine, the energy is provided bya flywheel that carries an open-type movingblade. According to tooling arrangement, one ortwo billets per revolution can be obtained. Withthis shear, production rates of 300 billets/min arefeasible. In the design seen in Fig. 13.8, the ma-terial to be sheared is confined by a close-fittingclosed blade and held against a stop by an axial
Fig. 13.8 Schematic of a shear with axial load to improveshear quality [Altan et al., 1973]
Fig. 13.7 High-velocity rotary-type shear. (a) Tooling for one billet per revolution. (b) Tooling for two billets per revolution [Altanet al., 1973]
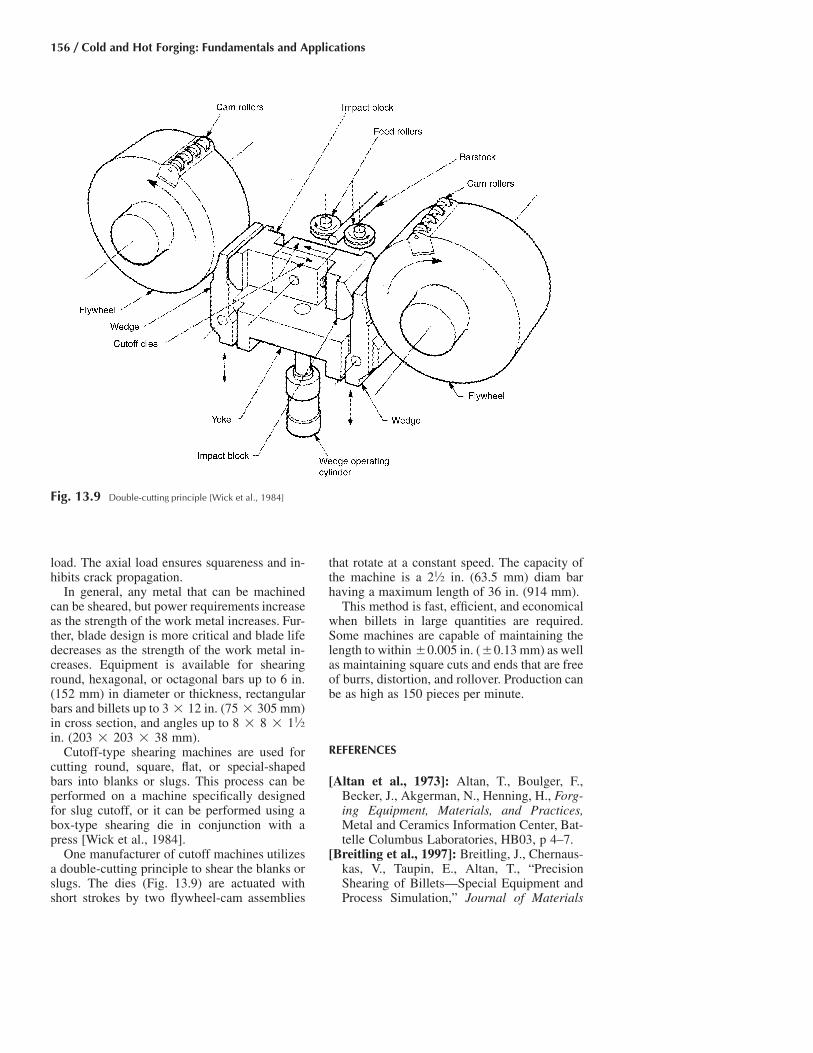
156 / Cold and Hot Forging: Fundamentals and Applications
load. The axial load ensures squareness and in-hibits crack propagation.
In general, any metal that can be machinedcan be sheared, but power requirements increaseas the strength of the work metal increases. Fur-ther, blade design is more critical and blade lifedecreases as the strength of the work metal in-creases. Equipment is available for shearinground, hexagonal, or octagonal bars up to 6 in.(152 mm) in diameter or thickness, rectangularbars and billets up to 3 � 12 in. (75 � 305 mm)in cross section, and angles up to 8 � 8 � 11⁄2in. (203 � 203 � 38 mm).
Cutoff-type shearing machines are used forcutting round, square, flat, or special-shapedbars into blanks or slugs. This process can beperformed on a machine specifically designedfor slug cutoff, or it can be performed using abox-type shearing die in conjunction with apress [Wick et al., 1984].
One manufacturer of cutoff machines utilizesa double-cutting principle to shear the blanks orslugs. The dies (Fig. 13.9) are actuated withshort strokes by two flywheel-cam assemblies
that rotate at a constant speed. The capacity ofthe machine is a 21⁄2 in. (63.5 mm) diam barhaving a maximum length of 36 in. (914 mm).
This method is fast, efficient, and economicalwhen billets in large quantities are required.Some machines are capable of maintaining thelength to within �0.005 in. (�0.13 mm) as wellas maintaining square cuts and ends that are freeof burrs, distortion, and rollover. Production canbe as high as 150 pieces per minute.
REFERENCES
[Altan et al., 1973]: Altan, T., Boulger, F.,Becker, J., Akgerman, N., Henning, H., Forg-ing Equipment, Materials, and Practices,Metal and Ceramics Information Center, Bat-telle Columbus Laboratories, HB03, p 4–7.
[Breitling et al., 1997]: Breitling, J., Chernaus-kas, V., Taupin, E., Altan, T., “PrecisionShearing of Billets—Special Equipment andProcess Simulation,” Journal of Materials
Fig. 13.9 Double-cutting principle [Wick et al., 1984]

Billet Separation and Shearing / 157
Processing Technology, Vol. 71, 1997, p 119–125.
[Camille et al., 1998]: Santiago-Vega, C., Vas-quez, V., Altan, T., “Simulation of Bar Shear-ing Process,” ERC/NSM-97-27, EngineeringResearch Center for Net Shape Manufactur-ing.
[Duvari et al., 2003]: Duvari, S., Isbir, S.,Ngaile, G., Altan, T., “Optimization of ToolDesign in Hot Shearing of Billets for Forg-ing,” ERC/NSM-03-R-09, Engineering Re-search Center for Net Shape Manufacturing.
[Schuler, 1998]: Schuler, H., Hoffman, H.,Frontzek, H., Metal Forging Handbook, Schu-ler Group, Springer, Goppingen, Germany, p457–459.
[Wick et al., 1984]: Wick, C., Benedict, J.T.,Veilleux, R., Tool and Manufacturing Engi-neers Handbook, Society of ManufacturingEngineers, Dearborn, MI, p 11-1–11-21.
SELECTED REFERENCES
● [ASM International, 1999]: Davis, J.R.,Ed., Forming and Forging, Vol 14, ASMHandbook, p 714–719.
● [Geleji et al., 1967]: Geleji, A., ForgeEquipment, Rolling Mills, and Accessories(in English), Akademiai Kiado, Budapest, p168.
● [Stotmann, 1968]: Stotmann, W., “Evolu-tion of Machines and Automation in theDrop Forging Industry,” Metal Forming,May, p 136.
WEB SITES
● www.bemcor.com, Bemcor, Inc.● www.ficep.it, Ficep Corp.● www.sms-eumuco.de, SMS Eumuco GmbH

CHAPTER 14
Process Design inImpression-Die ForgingManas Shirgaokar
14.1 Introduction
In impression-die forging, two or more diesare moved toward each other to form a metalbillet that has a relatively simple geometry toobtain a more complex shape. Usually, the billetis heated to an appropriate forging temperatureand the dies allow the excess billet material toflow outside of the die cavity to form a flash thatis later trimmed and discarded. This process iscapable of producing components of high qual-ity at moderate cost. Forgings offer a highstrength-to-weight ratio, toughness, and resis-tance to impact and fatigue. Forged componentsfind application in the automobile/automotiveindustry, aircraft, railroad, and mining equip-ment.
Some parts can be forged in a single set ofdies while others, due to shape complexity andmaterial flow limitations, must be shaped inmultiple sets of dies. In a common multistageforging process, the part is first forged in a setof busting dies, then moved to one or more setsof blocking dies, and finally forged in finisherdies. Finisher dies are used to enhance geomet-rical details without significant material flow.The quality of the finished part depends greatlyon the design of the previous stages. If the ma-terial has been improperly distributed during theblocking stage, defects may appear in the finish-ing stage. In a good-quality forging, all sectionsof the die cavity must be filled, and the part mustnot contain flow defects such as laps, cold shuts,or folds.
Before being used in production, forging diesare tested to verify proper filling of the die cav-
ities. The most commonly used method of pro-cess verification is die tryout in which full-scaledies are manufactured and prototype parts areforged to determine metal flow patterns and thepossible occurrence of defects. This often takesseveral iterations and is very costly in terms oftime, materials, facilities, and labor. Alterna-tively, two other methods for modeling metalflow, namely, physical modeling and processsimulation using finite-element method (FEM)-based software, can be used to obtain informa-tion about the effects of die design and processvariables on the forging process.
The design of any forging process begins withthe geometry of the finished part (Fig. 14.1).Consideration is given to the shape of the part,the material to be forged, the type of forgingequipment to be used, the number of parts to beforged, the application of the part, and the over-all economy of the process being designed. Thefinisher die is then designed with allowancesadded for flash, draft, shrinkage, fillet and cornerradii, and positioning of the parting line. Whenusing multistage forging, the shapes of the pre-forms are selected, the blocker dies are designed,and the initial billet geometry is determined. Inmaking these selections, the forging designerconsiders design parameters such as grain flow,parting line, flash dimensions, draft angles, andfillet and corner radii.
The terminology used to describe the flashzone in impression- and closed-die forging canbe seen in Fig. 14.2. The flash dimensions andbillet dimensions influence:● The flash allowance, that is, the material that
flows into the flash zone
Cold and Hot Forging Fundamentals and ApplicationsTaylan Altan, Gracious Ngaile, Gangshu Shen, editors, p159-183 DOI:10.1361/chff2005p159
Copyright © 2005 ASM International® All rights reserved. www.asminternational.org

160 / Cold and Hot Forging: Fundamentals and Applications
Fig. 14.1 A flow chart illustrating forging process design [Vasquez et al., 2000]
● The forging load● The forging energy● The die life
The overall design of a forging process re-quires the prediction of:
● Shape complexity and volume of the forging● Number and configurations of the preforms
or blockers● The flash dimensions in the dies and the ad-
ditional flash volume required in the stockfor preforming and finishing operations
● The forging load, energy, and center of load-ing for each of the forging operations
14.2 Forging Process Variables
The interaction of the most significant vari-ables in forging is shown in a simplified manner
in Fig. 14.3. It is seen that for a given billetmaterial and part geometry, the ram speed of theforging machine influences the strain rate andflow stress. Ram speed, part geometry, and dietemperature influence the temperature distribu-tion in the forged part. Finally, flow stress, fric-tion, and part geometry determine metal flow,forging load, and forging energy and conse-quently influence the loading and the design ofthe dies. Thus, in summary, the following threegroups of factors influence the forging process:
● Characteristics of the stock or preform to beforged, flow stress and the workability atvarious strain rates and deformation condi-tions, stock temperature, preform shape, etc.
● Variables associated with the tooling and lu-brication: tool materials, temperature, designof drafts and radii, configuration, flash de-
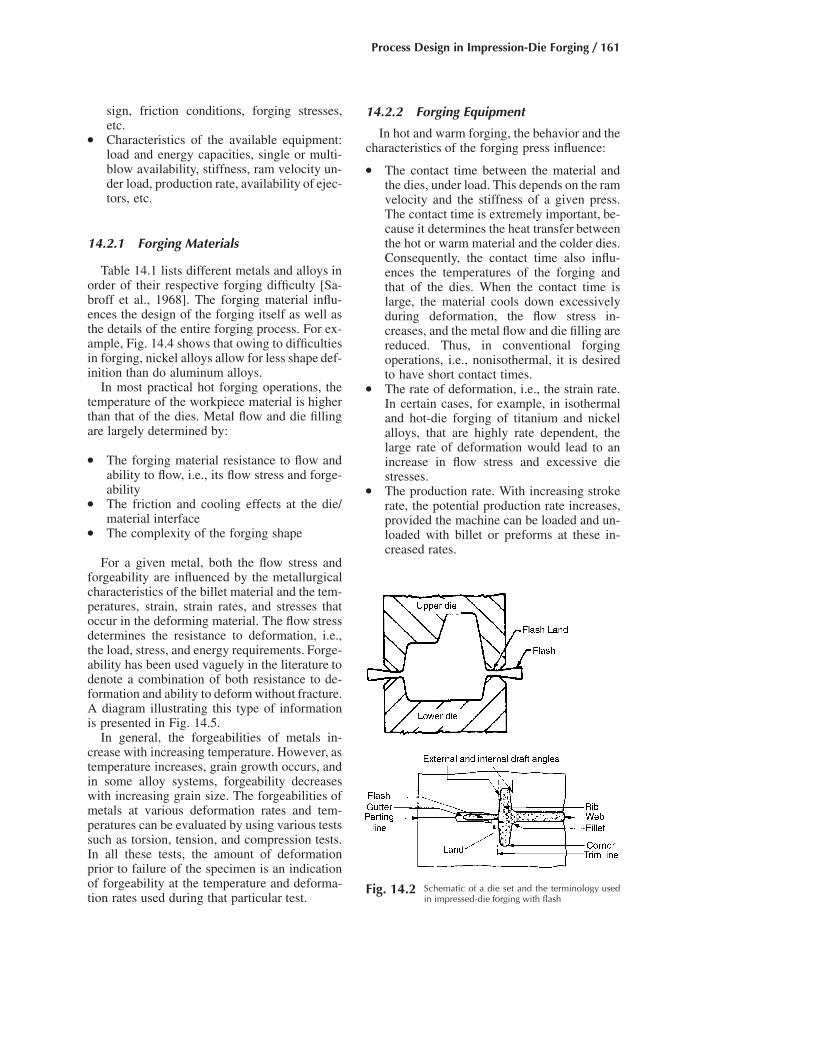
Process Design in Impression-Die Forging / 161
Fig. 14.2 Schematic of a die set and the terminology usedin impressed-die forging with flash
sign, friction conditions, forging stresses,etc.
● Characteristics of the available equipment:load and energy capacities, single or multi-blow availability, stiffness, ram velocity un-der load, production rate, availability of ejec-tors, etc.
14.2.1 Forging Materials
Table 14.1 lists different metals and alloys inorder of their respective forging difficulty [Sa-broff et al., 1968]. The forging material influ-ences the design of the forging itself as well asthe details of the entire forging process. For ex-ample, Fig. 14.4 shows that owing to difficultiesin forging, nickel alloys allow for less shape def-inition than do aluminum alloys.
In most practical hot forging operations, thetemperature of the workpiece material is higherthan that of the dies. Metal flow and die fillingare largely determined by:
● The forging material resistance to flow andability to flow, i.e., its flow stress and forge-ability
● The friction and cooling effects at the die/material interface
● The complexity of the forging shape
For a given metal, both the flow stress andforgeability are influenced by the metallurgicalcharacteristics of the billet material and the tem-peratures, strain, strain rates, and stresses thatoccur in the deforming material. The flow stressdetermines the resistance to deformation, i.e.,the load, stress, and energy requirements. Forge-ability has been used vaguely in the literature todenote a combination of both resistance to de-formation and ability to deform without fracture.A diagram illustrating this type of informationis presented in Fig. 14.5.
In general, the forgeabilities of metals in-crease with increasing temperature. However, astemperature increases, grain growth occurs, andin some alloy systems, forgeability decreaseswith increasing grain size. The forgeabilities ofmetals at various deformation rates and tem-peratures can be evaluated by using various testssuch as torsion, tension, and compression tests.In all these tests, the amount of deformationprior to failure of the specimen is an indicationof forgeability at the temperature and deforma-tion rates used during that particular test.
14.2.2 Forging Equipment
In hot and warm forging, the behavior and thecharacteristics of the forging press influence:
● The contact time between the material andthe dies, under load. This depends on the ramvelocity and the stiffness of a given press.The contact time is extremely important, be-cause it determines the heat transfer betweenthe hot or warm material and the colder dies.Consequently, the contact time also influ-ences the temperatures of the forging andthat of the dies. When the contact time islarge, the material cools down excessivelyduring deformation, the flow stress in-creases, and the metal flow and die filling arereduced. Thus, in conventional forgingoperations, i.e., nonisothermal, it is desiredto have short contact times.
● The rate of deformation, i.e., the strain rate.In certain cases, for example, in isothermaland hot-die forging of titanium and nickelalloys, that are highly rate dependent, thelarge rate of deformation would lead to anincrease in flow stress and excessive diestresses.
● The production rate. With increasing strokerate, the potential production rate increases,provided the machine can be loaded and un-loaded with billet or preforms at these in-creased rates.

162 / Cold and Hot Forging: Fundamentals and Applications
Fig. 14.3 Variables in forging
● The part tolerances. Hydraulic and screwpresses, for example, operate with kissingdies, i.e., the dies have flat surfaces that con-tact each other at the end of each workingstroke of the forging press. This allows veryclose control of the thickness tolerances evenif the flow stress and friction conditionschange during a production run. Ram guid-ing, stiffness of the press frame, and drivealso contribute to tolerances that can beachieved in forging.
14.2.3 Friction and Lubrication
The flow of metal in forging is caused by thepressure transmitted from the dies to the deform-ing material; therefore, the friction conditions atthe die/material interface are extremely impor-tant and influence the die stresses and the forg-ing load as well as the wear of the dies. In orderto evaluate the performances of various lubri-cants and to be able to predict forming pressures,it is necessary to express the interface frictionquantitatively, in terms of a factor or coefficient.In forging, the frictional shear stress, s, is mostcommonly expressed as:
ms � f r � r (Eq 14.1)
3�
where s is the frictional shear stress, f is the fric-tion factor, and m is the shear friction factor (0 �m � 1).
For various forming conditions, the values ofm vary as follows:
● m � 0.05 to 0.15 in cold forging of steels,aluminum alloys, and copper, using conven-tional phosphate soap lubricants or oils
● m � 0.2 to 0.4 in hot forging of steels, cop-per, and aluminum alloys with graphite-based lubricants
● m � 0.1 to 0.3 in hot forging of titaniumand high-temperature alloys with glass lu-bricants
● m � 0.7 to 1 when no lubricant is used, e.g.,in hot rolling of plates or slabs and in non-lubricated extrusion of aluminum alloys
14.2.4 Heat Transfer and Temperatures
Heat transfer between the forged material andthe dies influences the lubrication conditions, dielife, properties of the forged product, and die fill.Often, temperatures that exist in the materialduring forging are the most significant variablesinfluencing the success and economics of agiven forging operation. In forging, the magni-tudes and distribution of temperatures dependmainly on:

Process Design in Impression-Die Forging / 163
Fig. 14.4 Comparison of typical design limits for rib-web-type structural forgings of (a) aluminum alloys and
(b) nickel-base superalloys (all dimensions are in mm) [Sabroff etal., 1968]
Table 14.1 Hot forging temperatures of different metals and alloys [Sabroff et al., 1968]
Approximate range of forging temperature
Metal or alloy �F �C
Aluminum alloys (least difficult) 750–1020 400–550Magnesium alloys 480–660 250–350Copper alloys 1110–1650 600–900Carbon and low-alloy steels 1560–2100 850–1150Martensitic stainless steels 2010–2280 1100–1250Maraging steels 2010–2280 1100–1250Austenitic stainless steels 2010–2280 1100–1250Nickel alloys 1830–2100 1000–1150Semiaustenitic precipitation-hardenable stainless steels 2010–2280 1100–1250Titanium alloys 1290–1740 700–950Iron-base superalloys 1920–2160 1050–1180Cobalt-base superalloys 2160–2280 1180–1250Niobium alloys 1740–2100 950–1150Tantalum alloys 1920–2460 1050–1350Molybdenum alloys 2100–2460 1150–1350Nickel-base superalloys 1920–2190 1050–1200Tungsten alloys (most difficult) 2190–2370 1200–1300
Fig. 14.5 Generalized diagram illustrating the influence offorgeability and flow stress on die filling [Sabroff
et al., 1968]
● The initial material and die temperatures● Heat generated due to plastic deformation
and friction at the die/material interface● Heat transfer between the deforming mate-
rial and the dies as well as between the diesand the environment (air, coolant, lubricant)
The effect of contact time on temperaturesand forging load is illustrated in Fig. 14.6, wherethe load-displacement curves are given for hotforging of a steel part using different types offorging equipment. These curves illustrate that,due to strain rate and temperature effects, for thesame forging process, different forging loadsand energies are required by different presses.For the hammer, the forging load is initiallyhigher due to strain-rate effects, but the maxi-mum load is lower than for either hydraulic orscrew presses. The reason for this is that in thepresses, the extruded flash cools rapidly,
whereas in the hammer, the flash temperatureremains nearly the same as the initial stock tem-perature. Thus, in hot forming, not only the ma-terial and the formed shape but also the type ofequipment used (rate of deformation and diechilling effects) determine the metal flow behav-ior and the forming load and energy required forthe process. Surface tearing and cracking or de-velopment of shear bands on the formed materialoften can be explained by excessive chilling ofthe surface layers of the formed part near thedie/material interface.

164 / Cold and Hot Forging: Fundamentals and Applications
Fig. 14.7 Rectangular shape and three modifications show-ing increasing forging difficulty with increasing rib
height and decreasing web thickness [Sabroff et al., 1968]
Fig. 14.6 Load-displacement curves for the same part forgedin three different machines with three different ram
speeds (dimensions of the part in inches, initial temperature �2012 �F, or 1100 �C) [Altan et al., 1973]
14.2.5 Production LotSize and Tolerances
As is the case in all manufacturing operations,these two factors have a significant influence ondie design in forging. If the production lot sizeis large, the main reason for changing the dieswould be die wear. In this case, die materialsand their hardnesses would be selected to be es-pecially wear resistant even if they are madefrom somewhat expensive alloys. The preform-ing and the finishing dies are designed such thatrelatively little material movement is allowed inthe finisher dies; thus, the finisher dies, whichdetermine the final part dimensions, will notwear out easily.
If the production lot size is small, as is thecase in the aerospace forging industry, die wearis not a major problem, but die costs are verysignificant because these costs must be amor-tized over a smaller number of parts. As a result,some of the preforming or blocker dies may beomitted even if this would cause the use of morebillet material. Also, in this case, the dies mustbe changed more often than in large-scale pro-duction. Therefore, quick die-changing and au-tomatic die-holding mechanisms are required,for economic production.
Forging tolerances are very important in de-signing the die holders and die inserts, becausethey depend considerably on the manufacturingtolerances and elastic deflections of the dies dur-ing forging. Precision forging of gears and
blades, for example, require not only very closemanufacturing accuracies on the dies but alsoclose control of die temperatures. In addition,often it is necessary to estimate the changes indie dimensions under forging conditions so thatcorrections can be made while designing andmanufacturing these dies. Die dimensions varyduring the forging operation because of thermalexpansion, mechanical loading during assem-bling of the dies in a holder, and mechanicalloading during the forging process itself.
14.3 Shape Complexity in Forging
The main objective of forging process designis to ensure adequate metal flow in the dies sothat the desired finish part geometry can be ob-tained without any external or internal defects.Metal flow is greatly influenced by part or diegeometry. Often, several operations (preformingor blocking) are needed to achieve gradual flowof the metal from an initially simple shape (cyl-inder or round-cornered square billet) into themore complex shape of the final forging. In ageneral sense, spherical and blocklike shapes arethe easiest to forge in impression or closed dies.Parts with long thin sections or projections(webs and ribs) are more difficult to forge, be-cause they have more surface area per unit vol-ume. Such variations in shape maximize the ef-fects of friction and temperature changes andhence influence the final pressure required to fillthe die cavities. There is a direct relationship
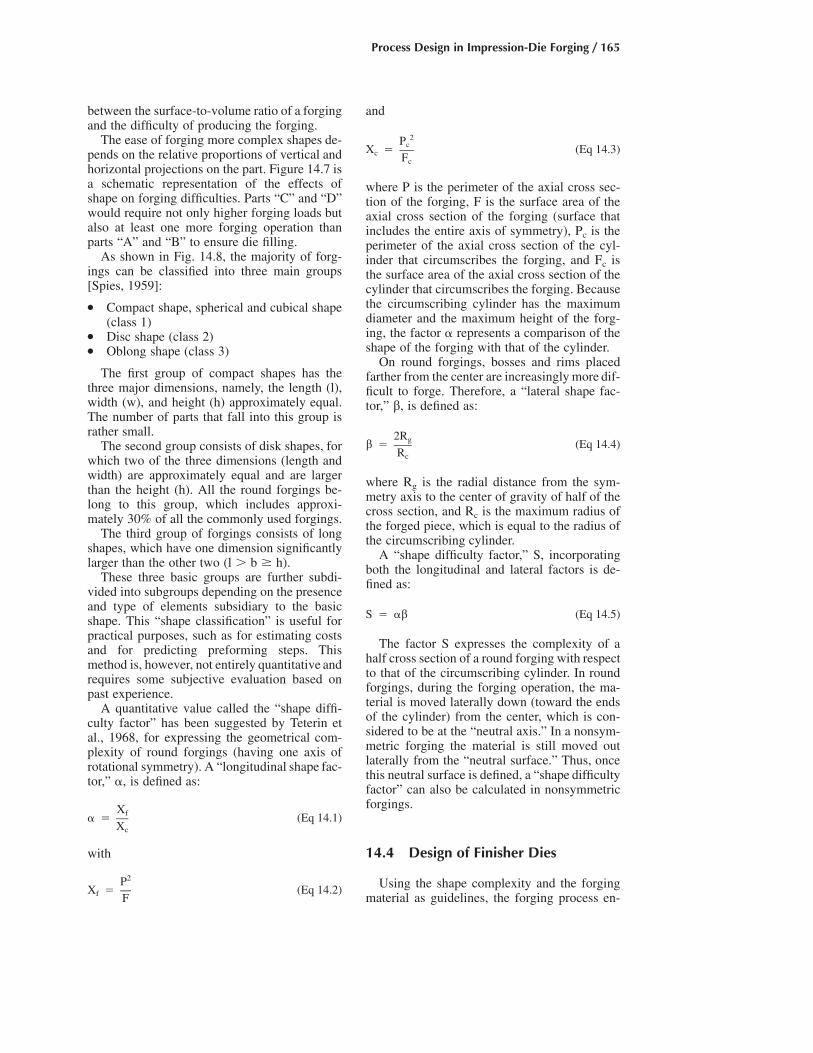
Process Design in Impression-Die Forging / 165
between the surface-to-volume ratio of a forgingand the difficulty of producing the forging.
The ease of forging more complex shapes de-pends on the relative proportions of vertical andhorizontal projections on the part. Figure 14.7 isa schematic representation of the effects ofshape on forging difficulties. Parts “C” and “D”would require not only higher forging loads butalso at least one more forging operation thanparts “A” and “B” to ensure die filling.
As shown in Fig. 14.8, the majority of forg-ings can be classified into three main groups[Spies, 1959]:
● Compact shape, spherical and cubical shape(class 1)
● Disc shape (class 2)● Oblong shape (class 3)
The first group of compact shapes has thethree major dimensions, namely, the length (l),width (w), and height (h) approximately equal.The number of parts that fall into this group israther small.
The second group consists of disk shapes, forwhich two of the three dimensions (length andwidth) are approximately equal and are largerthan the height (h). All the round forgings be-long to this group, which includes approxi-mately 30% of all the commonly used forgings.
The third group of forgings consists of longshapes, which have one dimension significantlylarger than the other two (l � b � h).
These three basic groups are further subdi-vided into subgroups depending on the presenceand type of elements subsidiary to the basicshape. This “shape classification” is useful forpractical purposes, such as for estimating costsand for predicting preforming steps. Thismethod is, however, not entirely quantitative andrequires some subjective evaluation based onpast experience.
A quantitative value called the “shape diffi-culty factor” has been suggested by Teterin etal., 1968, for expressing the geometrical com-plexity of round forgings (having one axis ofrotational symmetry). A “longitudinal shape fac-tor,” �, is defined as:
Xf� � (Eq 14.1)
Xc
with
2PX � (Eq 14.2)f F
and
2PcX � (Eq 14.3)c Fc
where P is the perimeter of the axial cross sec-tion of the forging, F is the surface area of theaxial cross section of the forging (surface thatincludes the entire axis of symmetry), Pc is theperimeter of the axial cross section of the cyl-inder that circumscribes the forging, and Fc isthe surface area of the axial cross section of thecylinder that circumscribes the forging. Becausethe circumscribing cylinder has the maximumdiameter and the maximum height of the forg-ing, the factor � represents a comparison of theshape of the forging with that of the cylinder.
On round forgings, bosses and rims placedfarther from the center are increasingly more dif-ficult to forge. Therefore, a “lateral shape fac-tor,” b, is defined as:
2Rgb � (Eq 14.4)Rc
where Rg is the radial distance from the sym-metry axis to the center of gravity of half of thecross section, and Rc is the maximum radius ofthe forged piece, which is equal to the radius ofthe circumscribing cylinder.
A “shape difficulty factor,” S, incorporatingboth the longitudinal and lateral factors is de-fined as:
S � �b (Eq 14.5)
The factor S expresses the complexity of ahalf cross section of a round forging with respectto that of the circumscribing cylinder. In roundforgings, during the forging operation, the ma-terial is moved laterally down (toward the endsof the cylinder) from the center, which is con-sidered to be at the “neutral axis.” In a nonsym-metric forging the material is still moved outlaterally from the “neutral surface.” Thus, oncethis neutral surface is defined, a “shape difficultyfactor” can also be calculated in nonsymmetricforgings.
14.4 Design of Finisher Dies
Using the shape complexity and the forgingmaterial as guidelines, the forging process en-

166 / Cold and Hot Forging: Fundamentals and Applications
Fig. 14.8 Classification of forging shapes [Spies, 1959]
gineer establishes the forging sequence (numberof forging operations) and designs the dies foreach operation, starting with the finisher dies.The most critical information necessary for forg-ing die design is the geometry and the materialof the forging to be produced. The forging ge-ometry in turn is obtained from the machinedpart drawing by modifying this part to facilitate
forging. Starting with the forging geometry, thedie designer first designs the finisher dies by:
● Selecting the appropriate die block size andthe flash dimensions
● Estimating the forging load and stresses toascertain that the dies are not subjected toexcessive loading

Process Design in Impression-Die Forging / 167
Fig. 14.10 Metal flow and the corresponding load-strokecurve. (a) Upsetting. (b) Filling. (c) End. (d) Load-
stroke curve [Altan et al., 1983]Fig. 14.9 Typical load-stroke curve for closed-die forging
[Altan et al., 1983]
The geometry of the finisher die is essentiallythat of the finish forging augmented by flashconfiguration. In designing finisher dies, the di-mensions of the flash should be optimized. Thedesigner must make a compromise: on the onehand, to fill the die cavity it is desirable to in-crease the die stresses by restricting the flash di-mensions (thinner and wider flash on the dies);but, on the other hand, the designer should notallow the forging pressure to reach a high value,which may cause die breakage due to mechani-cal fatigue. To analyze stresses, “slab method ofanalysis” or process simulation using finite-ele-ment method (FEM)-based computer codes isgenerally used. The FEM approach is discussedlater.
By modifying the flash dimensions, the dieand material temperatures, the press speed, andthe friction factor, the die designer is able toevaluate the influence of these factors on theforging stresses and loads. Thus, conditions thatappear most favorable can be selected. In addi-tion, the calculated forging stress distributioncan be utilized for estimating the local diestresses in the dies by means of elastic FEManalysis. After these forging stresses and loadsare estimated, it is possible to determine the cen-ter of loading for the forging in order to locatethe die cavities in the press, such that off-centerloading is reduced.
14.4.1 Flash Design and Forging Load
The flash dimensions and the billet dimen-sions influence the flash allowance, forging load,forging energy, and the die life. The selection ofthese variables influences the quality of theforged part and the magnitude of flash allow-ance, forging load, and the die life. The influenceof flash thickness and flash-land width on theforging pressure is reasonably well understoodfrom a qualitative point of view. The forgingpressure increases with:
● Decreasing flash thickness● Increasing flash-land width because of the
combinations of increasing restriction, in-creasing frictional forces, and decreasingmetal temperatures at the flash gap
A typical load-versus-stroke curve from animpression-die forging operation is shown inFig. 14.9. Loads are relatively low until the moredifficult details are partly filled and the metalreached the flash opening (Fig. 14.10). Thisstage corresponds to point P1 in Fig. 14.9. Forsuccessful forging, two conditions must be ful-filled when this point is reached: A sufficientvolume of metal must be trapped within the con-fines of the die to fill the remaining cavities, andextrusion of metal through the narrowing gap ofthe flash opening must be more difficult thanfilling of the more intricate detail in the die.
As the dies continue to close, the load in-creases sharply to point P2, the stage at whichthe die cavity is filled completely. Ideally, at thispoint the cavity pressure provided by the flashgeometry should be just sufficient to fill the en-

168 / Cold and Hot Forging: Fundamentals and Applications
Fig. 14.12 Relationships among flash width/thickness ratio,excess stock material, forging load, and energy
for a constant flash thickness, t, of 0.04 in. (1.0 mm) (same forgingas that shown in Fig. 14.11) [Vieregge, 1968]
Fig. 14.11 Relationships among excess stock material, flashthickness, flash width/thickness ratio, and forg-
ing load for mechanical press forging of a round part approxi-mately 3 in. (7.6 cm) in diameter by 3.5 in. (8.9 cm) high [Vi-eregge, 1968]
tire cavity, and the forging should be completed.However, P3 represents the final load reached innormal practice for ensuring that the cavity iscompletely filled and that the forging has theproper dimensions. During the stroke from P2 toP3, all the metal flow occurs near or in the flashgap, which in turn becomes more restrictive asthe dies close. In that respect, the detail mostdifficult to fill determines the minimum load forproducing a fully filled forging. Thus, the di-mensions of the flash determine the final loadrequired for closing the dies. Formation of theflash, however, is greatly influenced by theamount of excess material available in the cav-ity, because that amount determines the instan-taneous height of the extruded flash and, there-fore, the die stresses.
The effect of excess metal volume in flashformation was studied extensively [Vieregge,1968]. It was found that a cavity can be filledwith various flash geometries provided that thereis always a sufficient supply of material in thedie. Thus, it is possible to fill the same cavity byusing a less restrictive, i.e., thicker, flash and todo this at a lower total forging load if the nec-essary excess material is available (in this case,the advantages of lower forging load and lowercavity stress are offset by increased scrap loss)or if the workpiece is properly preformed (in
which case low stresses and material losses areobtained by extra preforming). These relation-ships are illustrated in Fig. 14.11 and 14.12.
14.4.2 Empirical Methods forFlash Design
The “shape classification” (Fig. 14.8) hasbeen utilized in systematic evaluation of flashdimensions in steel forgings. For this purpose,1500 forgings from eight different forging com-panies were classified into shape groups, asshown in Fig. 14.8. By evaluating the flash de-signs suggested for these forgings, an attemptwas made to establish a relationship betweenforging weight and flash dimensions. The resultsfor group 224 are presented in Fig. 14.13 as anexample [Altan et al., 1973]. This figure can beused for selecting the flash thickness based onthe forging weight, Q, of the forging. This graphalso shows the relationship between the flashwidth/thickness (w/t) ratio and the forgingweight. Thus, knowing the weight of the part tobe forged, it is possible to find the correspondingflash thickness and w/t ratio. Thus, the user canobtain the flash dimensions based on the weightof the forging.
There is no unique choice of the flash dimen-sions for a forging operation. The choice is vari-able within a range of values where the flashallowance and the forging load are not too high.There has to be a compromise between the two.In general, the flash thickness is shown to in-crease with increasing forging weight, while theratio of flash width to flash thickness (w/t) de-creases to a limiting value. In order to investi-

Process Design in Impression-Die Forging / 169
Fig. 14.13 Variations in flash-land-to-thickness ratio and in flash thickness, t, with weight, Q, of forgings of group 224 (materials:carbon and alloy steels)
gate the effect of forging shape on flash dimen-sions, other subgroups were studied, and it wasconcluded that the influence of shape is not assignificant as that of forging weight [Altan et al.,1973].
It is also possible to determine the flash di-mensions for round forgings, using the billet di-mensions. Thus, it is possible to obtain littleflash allowance and minimize the forging en-ergy. For round forgings, Eq 14.6 and 14.7 pre-dict the flash dimensions that are a good com-promise between the flash allowance and theforging load [Vieregge, 1968]:
1t � [0.017 • D] � (Eq 14.6)� �
D � 5�
W 30� (Eq 14.7)
2t 2 • D3 D 1 �� � ��� H(2R � D)h
where w is the flash width (mm), t is the flashthickness (mm), H is the height of the ribs orshaft (mm), D is the outside diameter of the forg-ing (mm), and Rh is the radial distance of thecenter of a rib from the axis of symmetry of theforging.
14.5 Prediction ofForging Stresses and Loads
Prediction of forging load and pressure inclosed- and impression-die forging operations isdifficult. Most forging operations are of non-steady-state type in terms of metal flow, stresses,and temperatures, i.e. all these variables varycontinuously during the process. In addition,forgings comprise an enormously large numberof geometrical shapes and materials, which re-quire different, even though similar, techniquesof engineering analysis. Because of these diffi-culties encountered in practice, forging loads areusually estimated on the basis of empirical pro-cedures using empirically developed formulae.

170 / Cold and Hot Forging: Fundamentals and Applications
Fig. 14.14 Forging pressure versus average forging height(Ha) for forging of carbon and low-alloy steels at
flash ratios, w/t, from 2 to 4 [Neuberger et al., 1962]
14.5.1 Empirical Methods for Estimationof Forging Pressure and Load
In estimating the forging load empirically, thesurface area of the forging, including the flashzone, is multiplied by an average forging pres-sure known from experience. The forging pres-sures encountered in practice vary from 20 to 70tons/in.2 depending on the material and the ge-ometry of the part. Neuberger and Pannasch[Neuberger et al., 1962] conducted forging ex-periments with various carbon steels (up to0.6% C) and with low-alloy steels using flashratios, w/t (where w is flash-land width and t isthe flash thickness), from 2 to 4 (Fig. 14.14).They found that the variable that most influencesthe forging pressure, Pa, is the average height,Ha, of the forging. The lower curve relates torelatively simple parts, whereas the upper curveto slightly difficult ones [Neuberger et al., 1962].
Most empirical methods, summarized interms of simple formulae or nomograms, are notsufficiently general to predict forging loads fora variety of parts and materials. Lacking a suit-able empirical formula, one may use suitable an-alytical techniques of varying degrees of com-plexity for calculating forging load and stresses.Among these techniques, the relatively simpleslab method has been proven to be very practicalfor predicting forging loads.
14.5.2 Simplified SlabMethod to Estimate Forging Load
The slab method has been successfully usedfor predicting forging loads and stresses with ac-ceptable engineering accuracy. For this purpose,a forging is divided into various plane strain andaxisymmetric sections, and then simplifiedequations are used to predict the average pres-sure and load for each section before all theseload components are added together. Thismethod used in the practical prediction of forg-ing loads is shown in Fig. 14.15 [Subramanianet al., 1980]. In this analysis, it is assumed thatthe cavity has a rectangular shape and the flashgeometry illustrated in Fig. 14.15. In actualpractice, where the cavity is not rectangular, thecross section is simplified to conform to thismodel.
As seen in Fig. 14.15, the cavity height is de-noted by H, the radius (or half width of the cav-ity) by r, the flash thickness by t, and the flashwidth by w. The stresses at various locations ofthe cross section and hence the load acting onthe cross section can be estimated as follows.
With the flow stress in the flash region de-noted by rf and the frictional shear factor by m,the stress at the entrance from the cavity into theflash of an axisymmetric cross section, rea, isgiven by:
2 wr � m � 1 r (Eq 14.8)ea f� �t3�
Because of rapid chilling and a high defor-mation rate, the flow stress in the flash region isconsidered to be different from the flow stressin the cavity. Hence, two different flow stressesare used for the flash and cavity regions. Thetotal load (Pta) on the cross section is the sum-mation of the load acting on the flash region andthe load acting on the die cavity:
2 m 1 3 3P � 2pr � (R � r )ta f� 3 t3�2 2m R R � r
� 1 � 2� � � ��t 23�
m r r rc ea2� 2pr � (Eq 14.9)� �3 H 23�
where R � r � w, rf is the flow stress in theflash region, and rc is the flow stress in the cav-ity.
For the plane-strain cross sections, the equa-tions corresponding to Eq 14.8 and 14.9 are:
2 wr � r 1 � m (Eq 14.10)ep f � �t3�

Process Design in Impression-Die Forging / 171
Fig. 14.16 Defect formation in forging when fillet radii aretoo small [Haller, 1971]
2 mw L mP � wr 2 � � r � r Ltp f ep c� � � �t 2H3 3� �
(Eq 14.11)
where L is the cavity width, i.e., L � 2r in Fig.14.15. The above equations are relatively simpleand can be programmed for practical use. Thefollowing information is required to performthese calculations:
● The geometry of the part● The flow stresses in the cavity and the flash
during the final stages of the forging opera-tion
● The friction at the die/forging interface
Appendix A gives an example of estimationof the load required for forging connecting rods.A comparison between the theoretical predictionand the actual data from forging trials is alsoprovided.
14.6 Design ofBlocker (Preform) Dies
One of the most important aspects of closed-die forging is the design of preforms or blockersto achieve adequate metal distribution [Altan etal., 1973]. Thus, in the finish forging operation,defect-free metal flow and complete die fillingcan be achieved, and metal losses into the flashcan be minimized. In preforming, round orround-cornered square stock with constant cross
section is deformed in such a manner that a de-sired volume distribution is achieved prior to im-pression-die forging. In blocking, the preform isforged in a blocker cavity prior to finish forging.
The determination of the preform configura-tion is an especially difficult task and an art initself, requiring skills achieved only by years ofextensive experience. Designing a correct pre-
Fig. 14.15 Schematic of a simple closed-die forging and forging stress distribution [Subramanian et al., 1980]

172 / Cold and Hot Forging: Fundamentals and Applications
Fig. 14.18 Preforming, blocking, and finish forging opera-tions for an example steel forging [Haller, 1971]
form allows the control of the volume distribu-tion of the part during forging as well as controlover the material flow. The main objective ofpreform design is to distribute the metal in thepreform in order to:
● Ensure defect-free metal flow and adequatedie filling. Figure 14.16 shows how a defectcan form with insufficient volume distribu-tion in an H-shaped cross section [Haller,1971]
● Minimize the amount of material lost as flash● Minimize die wear in the finish-forging cav-
ity by reducing the metal movement in thisoperation
● Achieve desired grain flow and control me-chanical properties
The common practice in preform design is toconsider planes of metal flow, i.e., selected crosssections of the forging (Fig. 14.17) [Altan et al.,1973]. Understanding the principles of the ma-terial flow during the forging operation can helpattain a better understanding of the design rules.Any complex shape can be divided into axisym-metric or plane-strain flow regions, dependingon the geometry in order to simplify the analy-sis.
The example steel forging presented in Fig.14.18 illustrates the various preforming opera-tions necessary to forge the part shown [Haller,1971]. The round bar from rolled stock is rolledin a special machine called a reducer roller forvolume distribution, bent in a die to provide theappropriate shape, blocked in a blocker die cav-ity, and finish forged.
In determining the forging steps for any part,it is first necessary to obtain the volume of theforging based on the areas of successive crosssections throughout the forging. The volume dis-tribution can be obtained in the following man-ner [Haller, 1971]:
1. Lay out a dimensioned drawing of the finishconfiguration, complete with flash.
Fig. 14.17 Planes of metal flow. (a) Planes of flow. (b) Finished forged shapes. (c) Directions of flow [Altan et al., 1973]

Process Design in Impression-Die Forging / 173
Fig. 14.19 Preform designs for two example parts. In bothexamples, (a) forging, (b) cross-sectional area vs.
length, (c) and (d) ideal preform, VE and qE, volume and crosssection of the finish forging, and VG and qG, volume and crosssection of the flash [Haller 1971]
2. Construct a baseline for area determinationparallel to the centerline of the part.
3. Determine the maximum and minimumcross-sectional areas perpendicular to thecenterline of the part.
4. Plot these area values at proportional dis-tances from the baseline.
5. Connect these points with a smooth curve (ininstances where it is not clear how the curvewould best show the changing cross-sec-tional areas, additional points should be plot-ted to assist in determining a smooth repre-sentation curve).
6. Above this curve, add the approximate areaof the flash at each cross section, giving con-sideration to those sections where the flashshould be widest. The flash will generally beof constant thickness but will be widest at thenarrower sections and smallest at the widersections (the proportional allowance for flashis illustrated by the examples in Fig. 14.19).
7. Convert the minimum and maximum areavalues to rounds or rectangular shapes havingthe same cross-sectional area.
Figure 14.19 shows two examples of obtain-ing a volume distribution through the above pro-cedure. In both examples, (a) is the forging, (b)is the cross-sectional area versus length, (c) and(d) are the ideal preform, VE and qE are the vol-ume and cross section of the finish forging, andVG and qG are the volume and cross section ofthe flash.
There are various methods of preforming i.e.,for distributing the metal prior to die forging ina blocker or finisher die [Altan et al., 1973,Haller, 1971, and Lange et al., 1977]. In forgingsteel parts, a correct preform can be designed byusing the following three general design rules(these rules do not apply to forging nonferrousmaterials) [Lange et al., 1977]:
● The area of cross section of the preform �the area of cross section of the finished prod-uct � the flash allowance (metal flowinginto flash). Thus, the initial stock distributionis obtained by determining the areas of crosssections along the main axis of the forging.
● All the concave radii, including the fillet ra-dii, on the preform must be greater than thecorresponding radii on the finished part.
● In the forging direction, the thickness of thepreform should be greater than that of thefinished part so that the metal flow is mostlyby upsetting rather than extrusion. Duringthe finishing stage, the material will then be
squeezed laterally toward the die cavitywithout additional shear at the die/materialinterface. Such conditions minimize frictionand forging load and reduce wear along thedie surfaces.
The application of these three design rules forpreforming of steel forgings is illustrated by ex-amples shown in Fig. 14.20 for H-shaped cross

174 / Cold and Hot Forging: Fundamentals and Applications
Fig. 14.21 The blocker and finish cross sections for variousshapes (P, preform; E, end) [Lange et al., 1977]
Fig. 14.20 Preforms for different H-shaped forgings [Langeet al., 1977]
sections of various rib heights and in Fig. 14.21for some solid cross sections [Lange et al.,1977].
The preform is the shape of the billet beforethe finish operation. In certain cases, dependingon the ratio of the height of the preform to itswidth, there might be more than one preformoperation involved.
Preform design guidelines differ from mate-rial to material. They are basically categorizedinto the following three categories.
● Carbon and low-alloy steel parts● Aluminum alloy rib-web-type parts● Titanium alloy rib-web-type parts
14.6.1 Guidelines forCarbon and Low-Alloy Steels
In hammer forging of carbon or low-alloysteels, the preform usually does not have flash.The blend-in radius (RP) of the preform at theparting line is influenced by the adjacent cavitydepth (Table 14.2). In the preform, the fillet ra-dius (RPF) between the web to a rib is larger thanthat in the finish forging (RFF), especially whenthe height of the rib over the web is larger thanthe rib width, i.e., DF � WF (Fig. 14.22).
14.6.2 Guidelines for Aluminum Parts
For rib-web-type aluminum alloy parts, therecommended preform dimensions fall into the
following ranges given in Table 14.3. The pre-form is usually designed to have the same draftangles as the finish part. However, when verydeep cavities are present in the finisher die,larger draft angles are provided in the preform.A greater web thickness in the preform is se-lected when the web area is relatively small andwhen the height of the adjoining ribs is verylarge. A comparison of the preform and the fin-ished part is illustrated in Fig. 14.23.
14.6.3 Guidelines for Titanium Alloys
The guidelines for designing the titanium al-loy preforms (Table 14.4) are similar to thosefor the aluminum alloys.
14.6.4 Guidelines for H Cross Sections
Most of the parts that are closed-die forgedare H cross-section-type parts or they can be de-composed into H cross sections. For this reasonit is good to have specific rules for these typesof cross sections. These rules are different fordifferent proportions in an H cross-section-typepart. The design guidelines for preform designfor rib-web-type sections must consider:
● Different rib-height (DF) to rib-width (WF)ratios
● Different distances between the ribs (WD)
Table 14.2 Preform dimensions for carbon or low-alloy steels [Altan et al., 1973]
Dimensions of the finish forgings Dimensions of the preforms
Flash No flashBlend-in radii (RF) RP � RF � C or HR/6 � RP � HR/4Fillet radii (RFF) RPF � 1.2 RFF � 0.125 in. (3.175 mm)Depth of the cavity (HR), in. (mm) �0.4 (10) 0.4 to 1 (10 to 25) 1 to 2 (25 to 51) �2 (51)Value of C, in. (mm) 0.08 (2.0) 0.12 (3.0) 0.16 (4.0) 0.2 (5.1)
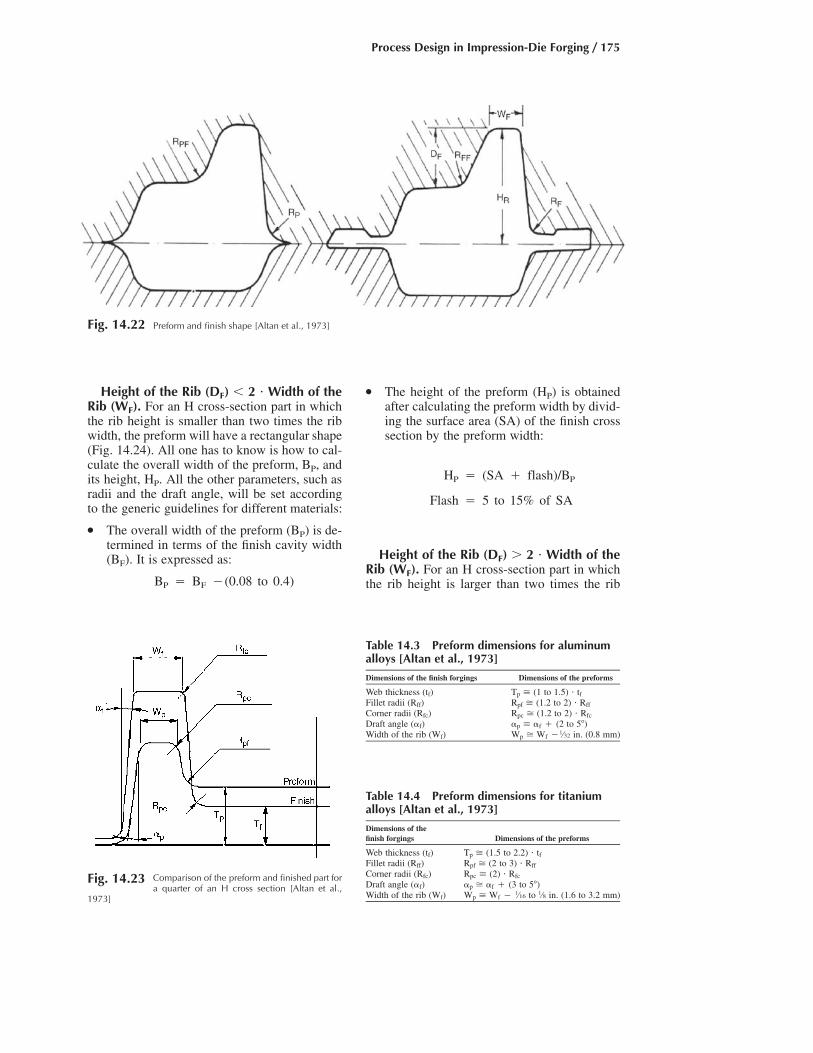
Process Design in Impression-Die Forging / 175
Fig. 14.22 Preform and finish shape [Altan et al., 1973]
Table 14.3 Preform dimensions for aluminumalloys [Altan et al., 1973]
Dimensions of the finish forgings Dimensions of the preforms
Web thickness (tf) Tp � (1 to 1.5) • tfFillet radii (Rff) Rpf � (1.2 to 2) • Rff
Corner radii (Rfc) Rpc � (1.2 to 2) • Rfc
Draft angle (�f) �p � �f � (2 to 5�)Width of the rib (Wf) Wp � Wf �1⁄32 in. (0.8 mm)
Fig. 14.23 Comparison of the preform and finished part fora quarter of an H cross section [Altan et al.,
1973]
Table 14.4 Preform dimensions for titaniumalloys [Altan et al., 1973]
Dimensions of thefinish forgings Dimensions of the preforms
Web thickness (tf) Tp � (1.5 to 2.2) • tfFillet radii (Rff) Rpf � (2 to 3) • Rff
Corner radii (Rfc) Rpc � (2) • Rfc
Draft angle (�f) �p � �f � (3 to 5�)Width of the rib (Wf) Wp � Wf � 1⁄16 to 1⁄8 in. (1.6 to 3.2 mm)
Height of the Rib (DF) � 2 • Width of theRib (WF). For an H cross-section part in whichthe rib height is smaller than two times the ribwidth, the preform will have a rectangular shape(Fig. 14.24). All one has to know is how to cal-culate the overall width of the preform, BP, andits height, HP. All the other parameters, such asradii and the draft angle, will be set accordingto the generic guidelines for different materials:
● The overall width of the preform (BP) is de-termined in terms of the finish cavity width(BF). It is expressed as:
B � B �(0.08 to 0.4)P F
● The height of the preform (HP) is obtainedafter calculating the preform width by divid-ing the surface area (SA) of the finish crosssection by the preform width:
H � (SA � flash)/BP P
Flash � 5 to 15% of SA
Height of the Rib (DF) � 2 • Width of theRib (WF). For an H cross-section part in whichthe rib height is larger than two times the rib
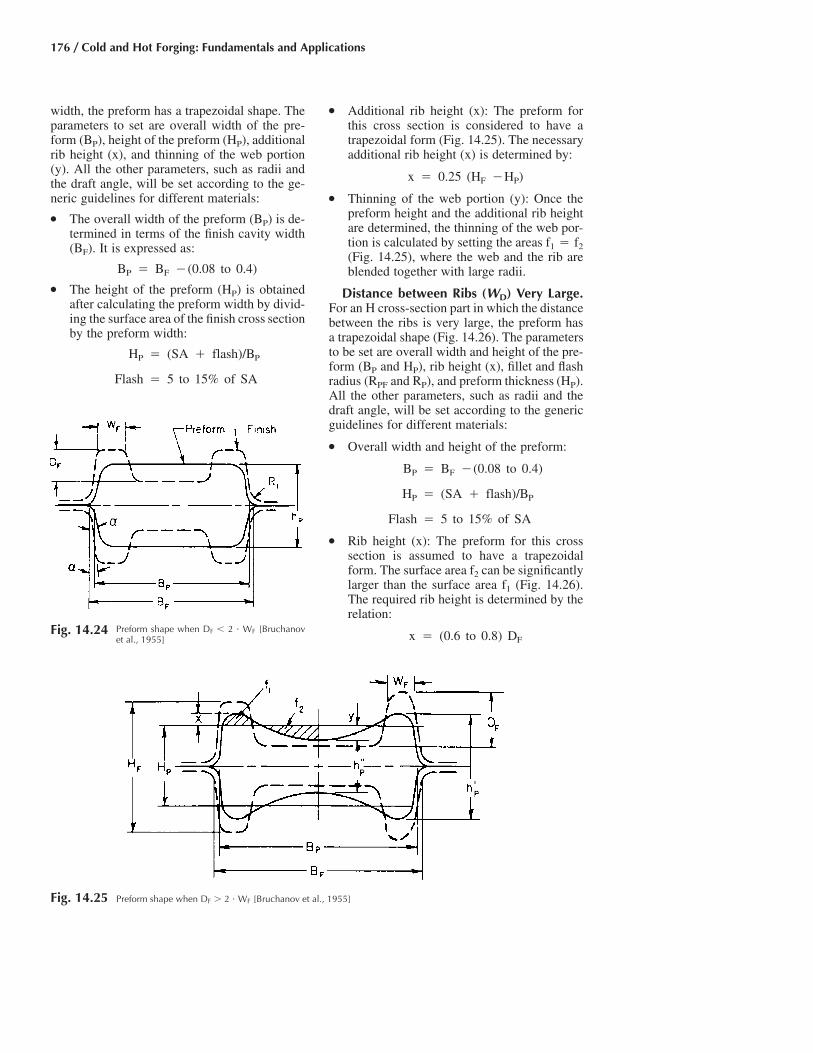
176 / Cold and Hot Forging: Fundamentals and Applications
Fig. 14.24 Preform shape when DF � 2 • WF [Bruchanovet al., 1955]
width, the preform has a trapezoidal shape. Theparameters to set are overall width of the pre-form (BP), height of the preform (HP), additionalrib height (x), and thinning of the web portion(y). All the other parameters, such as radii andthe draft angle, will be set according to the ge-neric guidelines for different materials:
● The overall width of the preform (BP) is de-termined in terms of the finish cavity width(BF). It is expressed as:
B � B �(0.08 to 0.4)P F
● The height of the preform (HP) is obtainedafter calculating the preform width by divid-ing the surface area of the finish cross sectionby the preform width:
H � (SA � flash)/BP P
Flash � 5 to 15% of SA
● Additional rib height (x): The preform forthis cross section is considered to have atrapezoidal form (Fig. 14.25). The necessaryadditional rib height (x) is determined by:
x � 0.25 (H �H )F P
● Thinning of the web portion (y): Once thepreform height and the additional rib heightare determined, the thinning of the web por-tion is calculated by setting the areas f1 � f2(Fig. 14.25), where the web and the rib areblended together with large radii.
Distance between Ribs (WD) Very Large.For an H cross-section part in which the distancebetween the ribs is very large, the preform hasa trapezoidal shape (Fig. 14.26). The parametersto be set are overall width and height of the pre-form (BP and HP), rib height (x), fillet and flashradius (RPF and RP), and preform thickness (HP).All the other parameters, such as radii and thedraft angle, will be set according to the genericguidelines for different materials:
● Overall width and height of the preform:
B � B �(0.08 to 0.4)P F
H � (SA � flash)/BP P
Flash � 5 to 15% of SA
● Rib height (x): The preform for this crosssection is assumed to have a trapezoidalform. The surface area f2 can be significantlylarger than the surface area f1 (Fig. 14.26).The required rib height is determined by therelation:
x � (0.6 to 0.8) DF
Fig. 14.25 Preform shape when DF � 2 • WF [Bruchanov et al., 1955]

Process Design in Impression-Die Forging / 177
Fig. 14.26 Preform design when the distance between the ribs is very large [Bruchanov et al., 1955]
● Fillet and flash radii (RPF, RP):
R � 1.2 R � 0.125 in. (3.175 mm)PF FF
R � R � CP F
● Preform thickness (HP): The preform thick-ness is determined by using the conditionthat the volume represented by f4 should belarger than the volume represented by f3 bythe excess of the flash material (Fig. 14.26).
APPENDIX AExample: Prediction ofLoad for Forging of aConnecting Rod
A.1 Introduction
A connecting rod (Fig. A.1) was selected asa component to be used for practical evaluationof the calculations described in section 14.5.2,“Simplified Slab Method to Estimate ForgingLoad,” in this chapter. The part was forged in a500 ton mechanical press, and the measuredloads were compared with the results obtained
from computer-aided analysis as well as with re-sults from the simplified slab method.
Three representative cross sections of the con-necting rod were chosen for the estimation ofthe forging load (Fig. A.1). All the cross sectionshad the same flash dimensions, namely, blocker:0.1 in. (2.5 mm) thick by 0.31 in. (7.9 mm) wide;finish: 0.06 in. (1.5 mm) thick by 0.31 in. (7.9mm) wide. These dimensions were the dimen-sions of the flash lands in the dies. The valuesof flash thickness used in the forging load esti-mations were those actually measured on theforged parts. All the cavity cross sections wereapproximated as rectangles, as shown in Fig.14.15 and A.1. The dimensions of the rectangles(in inches) used for load estimation were:
● Section A-A:Blocker: r � 0.96, H � 0.32Finish: L � 0.2, H � 0.18
● Section B-B:Blocker: L � 0.93, H � 0.32Finish: L � 0.95, H � 0.18
● Section C-C:Blocker: r � 0.53, H � 0.64Finish: r � 0.55, H � 0.59
During finish forging, in order to reduce theexcessive load resulting from forging a very thinweb, the central portion of cross-section A-Awas relieved. Hence, to estimate the load in thiscross section, only one-half of the section wasconsidered and was treated as a plane-strain
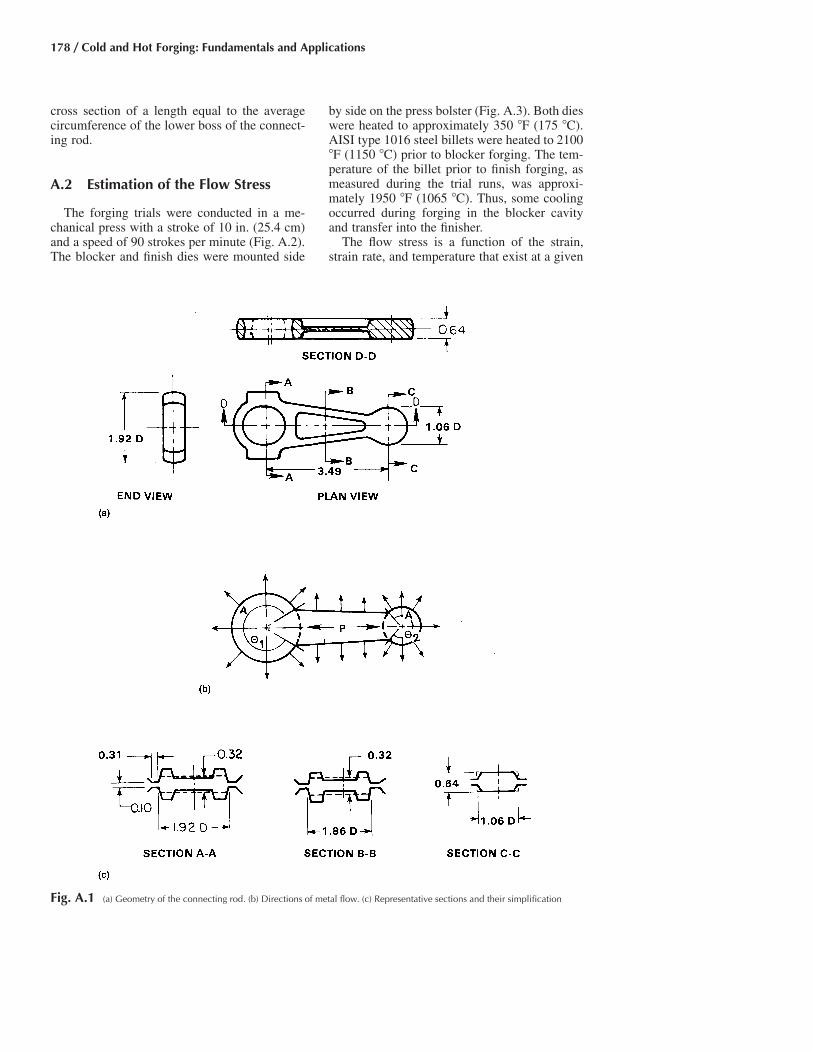
178 / Cold and Hot Forging: Fundamentals and Applications
Fig. A.1 (a) Geometry of the connecting rod. (b) Directions of metal flow. (c) Representative sections and their simplification
cross section of a length equal to the averagecircumference of the lower boss of the connect-ing rod.
A.2 Estimation of the Flow Stress
The forging trials were conducted in a me-chanical press with a stroke of 10 in. (25.4 cm)and a speed of 90 strokes per minute (Fig. A.2).The blocker and finish dies were mounted side
by side on the press bolster (Fig. A.3). Both dieswere heated to approximately 350 �F (175 �C).AISI type 1016 steel billets were heated to 2100�F (1150 �C) prior to blocker forging. The tem-perature of the billet prior to finish forging, asmeasured during the trial runs, was approxi-mately 1950 �F (1065 �C). Thus, some coolingoccurred during forging in the blocker cavityand transfer into the finisher.
The flow stress is a function of the strain,strain rate, and temperature that exist at a given

Process Design in Impression-Die Forging / 179
Fig. A.2 The 500 ton mechanical forging press used for forg-ing trials
time during the deformation process and can beexpressed approximately as:
m˙r � C.e (Eq A.1)
The values of C and m for the material usedfor the trials are given in Table A.1. These valuesvary significantly with temperature. Hence, inorder to estimate the flow stress accurately, thetemperature of the deforming material should beknown. The temperature of the stock at the endof the forging stroke depends on the stock tem-perature, die temperature, speed of deformation,and frictional conditions. Further, the tempera-ture varies across the forging due to die chillingand due to heat generation by friction and de-formation. However, if the temperature gradientis neglected and the forging is considered to bea thin plate of uniform temperature cooled sym-metrically from both sides, the average tempera-ture of the forging in the cavity or in the flashcan be expressed as follows:
�Th � h � (h � h ) exp � (Eq A.2)1 s 1 � �cqt
As an example, consider cross-section A-A ofthe blocker dies in Fig. A.1:
● h1 (initial die temperature) � 350 �F (175�C)
● hs (initial stock temperature) � 2100 �F(1150 �C)
● � (heat-transfer coefficient) � 0.0039 Btu/in.2/�F (3.1889 W/m2-�K) (estimated fromvalues obtained from the forging of steel)
● t (average forging or plate thickness) � 0.32in. (8.1 mm)
● c (specific heat of the billet material) �0.108 Btu/lb/�F (452 J/kg-�K)
● q (density of the billet material) � 0.285 lb/in.3 (7.89 g/cm3)
To estimate the duration of contact, the aver-age ram velocity during forging should beknown. This velocity is half of the velocity ofthe ram when it touches the billet. In this case,the billet has round sections with an average di-ameter of 0.75 in. (19 mm). The average thick-ness of the blocker is 0.32 in. (8.1 mm). Hence,the average distance of the ram from the bottomdead center (BDC) position during forging is:
0.75 � 0.32w � � 0.125 in. (3.175 mm)
2(Eq A.3)
Thus, the ram velocity with respect to the ramlocation (w) before BDC obtained from the kin-ematics of the crank slider mechanism is:
pn SV � w � 1�30 w
The mechanical press used for these trials hasa stroke of 10 in. (25.4 cm) and a speed of 90rpm. Hence:
p � 90 10V � 0.215 � 1�30 0.215
V � 13.67 in./s (0.35 m/s)
The duration of contact, T, is:
(Average billet thickness) � (Average forging thickness)T �
Average ram velocity
0.75 � 0.32� � 0.0315 s
13.67
The values of T can also be obtained from theload or stroke versus time curve similar to theone in Fig. A.4. The instantaneous average forg-ing temperature is:
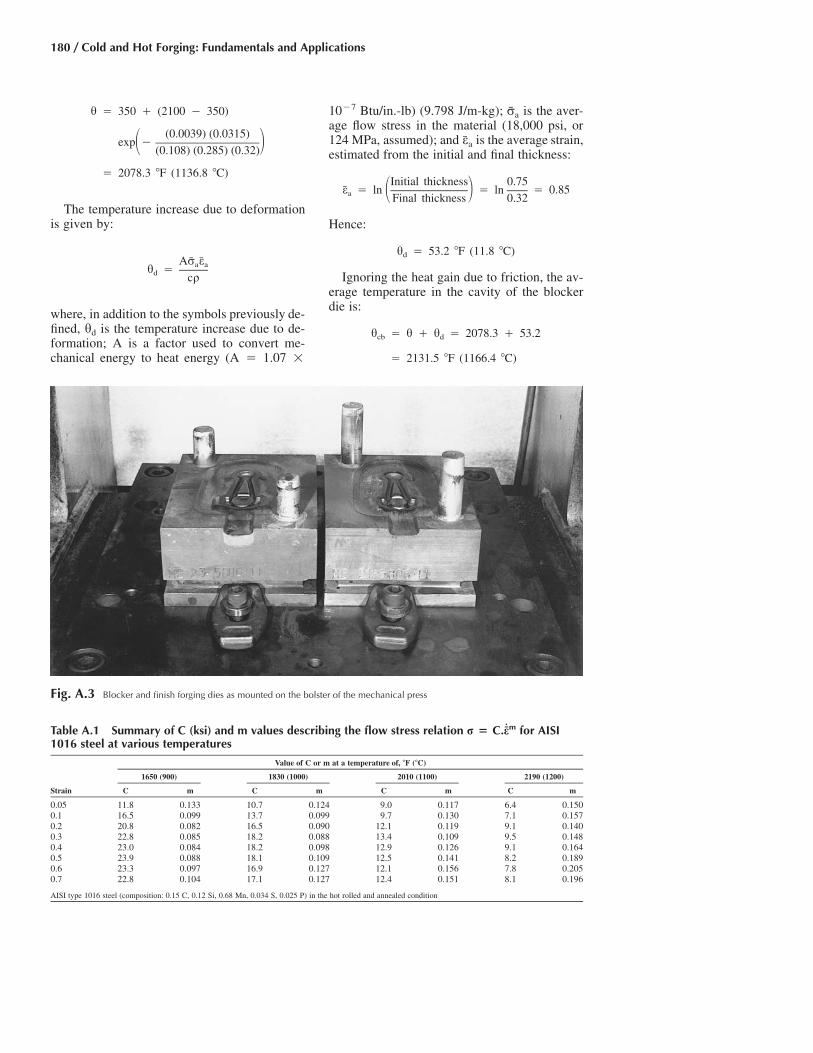
180 / Cold and Hot Forging: Fundamentals and Applications
Fig. A.3 Blocker and finish forging dies as mounted on the bolster of the mechanical press
Table A.1 Summary of C (ksi) and m values describing the flow stress relation r � for AISIm˙C.e1016 steel at various temperatures
Value of C or m at a temperature of, �F (�C)
1650 (900) 1830 (1000) 2010 (1100) 2190 (1200)
Strain C m C m C m C m
0.05 11.8 0.133 10.7 0.124 9.0 0.117 6.4 0.1500.1 16.5 0.099 13.7 0.099 9.7 0.130 7.1 0.1570.2 20.8 0.082 16.5 0.090 12.1 0.119 9.1 0.1400.3 22.8 0.085 18.2 0.088 13.4 0.109 9.5 0.1480.4 23.0 0.084 18.2 0.098 12.9 0.126 9.1 0.1640.5 23.9 0.088 18.1 0.109 12.5 0.141 8.2 0.1890.6 23.3 0.097 16.9 0.127 12.1 0.156 7.8 0.2050.7 22.8 0.104 17.1 0.127 12.4 0.151 8.1 0.196
AISI type 1016 steel (composition: 0.15 C, 0.12 Si, 0.68 Mn, 0.034 S, 0.025 P) in the hot rolled and annealed condition
h � 350 � (2100 � 350)
(0.0039) (0.0315)exp �� �(0.108) (0.285) (0.32)
� 2078.3 �F (1136.8 �C)
The temperature increase due to deformationis given by:
Ar ea ah �d cq
where, in addition to the symbols previously de-fined, hd is the temperature increase due to de-formation; A is a factor used to convert me-chanical energy to heat energy (A � 1.07 �
10�7 Btu/in.-lb) (9.798 J/m-kg); is the aver-raage flow stress in the material (18,000 psi, or124 MPa, assumed); and is the average strain,eaestimated from the initial and final thickness:
Initial thickness 0.75e � ln � ln � 0.85a � �Final thickness 0.32
Hence:
h � 53.2 �F (11.8 �C)d
Ignoring the heat gain due to friction, the av-erage temperature in the cavity of the blockerdie is:
h � h � h � 2078.3 � 53.2cb d
� 2131.5 �F (1166.4 �C)

Process Design in Impression-Die Forging / 181
Table A.3 Estimated loads in different crosssections of the connecting rod forging
Loads in section, lb Total
Forging A-A B-B C-C lb Tons
Blocker 337,214 196,998 89,285 623,497 311.7Finish 407,234 285,509 123,947 816,690 408.3
Table A.2 Estimated flow stresses in differentcross sections of the connecting rod forgingshown in Fig. A.1
Stock/blocker
temperatureFlow stress in section,
psi (MPa)
Forging �F �C A-A B-B C-C
Blocker 2100 1150 18,000 (124) 17,000 (117) 16,300 (112)Finish 1950 1065 22,000 (152) 21,600 (149) 20,200 (139)
From Table A.1, the values of C and m for atemperature of 2130 �F (1165 �C) and strain of0.85 are calculated by linear interpolation asC � 9.8 � 103 and m � 0.187.
The average strain rate in the deforming ma-terial is given by:
Velocity 13.67˙e � �Average thickness (0.75 � 0.32)/2
� 25.55/s
Using Eq A.1, the average flow stress is:
3 0.187r � 9.8 � 10 � 25.55
� 17,964 psi (124 MPa)
This is the value of the flow stress in the cav-ity of the section A-A in the blocker shape. Sim-ilarly, the corresponding values of flow stress forother sections are given in Table A.2.
A.3 Estimation of the Friction Factor
The frictional shear stress is given by:
mrs �
3�
The value of m varies between 0.25 and 0.4 formost hot steel forging operations. The simplifiedmodel assumes that metal flow occurs by slidingthe entire die/material interface. In reality, how-
ever, the metal deforms by sliding along the websurfaces, but internal shearing is inevitable in therib regions. Hence, to assume a nominal averagem value of 0.4, which is usual for sliding sur-faces in forging, would be unrealistic. In thepresent case, the length of the rib sections is al-most equal to that of the web regions in cross-sections A-A and B-B. Hence, considering aweighted average, the values for m are chosento be 0.7 for sections A-A and B-B and 0.4 forsection C-C of both blocker and finish forgings.
A.4 Estimation of the Forging Load
The average length of plane-strain cross-sec-tion B-B for both blocker and finish forgings is2 in. (5 cm). Substituting the appropriate valuesin Eq 14.8 to 14.11, the loads were estimated forthe cross sections as shown in Table A.3.
A.5 Comparison of Predictions withData from Actual Forging Trials
To evaluate the accuracy of the simplifiedforging load estimation procedure, forging trialswere conducted using a 500 ton Erie scotch-
Fig. A.4 Load and displacement versus time for a forgingoperation
Table A.4 Summary and comparison of forgingloads (tons)
Forging Simple analysis Experimental results
Blocker 311.7 320.67Finish 408.3 425.00

182 / Cold and Hot Forging: Fundamentals and Applications
Fig. A.5 Parts that were blocker and finish forged in forging trials
yoke-type mechanical press. Both the blockerand finisher dies were mounted side by side onthe press bolster. The dies were lubricated byspraying with Acheson’s Delta-forge 105 (Ach-eson Colloids Co.). The billets were heated inan induction coil to 2100 �F (1150 �C). The dieswere heated to 350 �F (175 �C) by infrared gas-fired burners. A typical load and displacementrecording is shown in Fig. A.4. The displace-ment curve shows the position of the ram as afunction of time. It is observed that the forgingload starts increasing when the upper die con-tacts the workpiece. The entire forging operationtakes place in less than 100 ms. Example forg-ings are shown in Fig. A.5.
The forging loads, measured in experimentsand predicted by the simplified slab method, arecompared in Table A.4. The experimental valuesrepresent averages of several measurements. Itcan be seen that the results of the simplified anal-ysis are within practical engineering accuracy.For simple to moderately complex forgings, thisanalysis can be used effectively for die materialselection and for press selection. However, itshould be noted that the accuracy of the finalresults depends largely on proper estimation ofthe flow stress and frictional shear factor. Someexperience and knowledge of forging analysesis necessary to make these estimates with ac-ceptable accuracy. If the capabilities of a high-speed computer are available, then detailed cal-culations of flow stress, forging stress, andforging load can be made accurately.
REFERENCES
[Altan et al., 1973]: Altan, T., Boulger, F.W.,Becker, J.R., Akgerman, N., Henning, H.J.,Forging Equipment, Materials and Practices,Batelle, 1973.
[Altan et al., 1983]: Altan, T., Oh, S.-I., Gegel,H.L., Metal Forming Fundamentals and Ap-plications, American Society for Metals,1983.
[Bruchanov et al., 1955]: Bruchanov, A.N., andRebelski, A.V., Closed-Die Forging andWarm Forging, Verlag Technik, 1955 (Ger-man translation from Russian).
[Haller, 1971]: Haller, H.W., Handbook of Forg-ing, Carl Hanser Verlag, 1971 (in German).
[Lange et al., 1977]: Lange, K., and Meyer-Nolkemper, H., Closed-Die Forging,Springer-Verlag, 1977 (in German).
[Neuberger et al., 1962]: Neuberger, F., andPannasch, S., “Material Consumption in DieForging of Steel,” Fertiegungstechnik und Be-trieb, Vol. 12, 1962, p 775–779 (in German).
[Sabroff et al., 1968]: Sabroff, A.M. et al.,Forging Materials and Practices, Reinhold,1968.
[Spies, 1959]: Spies, K., “Preforming in Forgingand Preparation of Reducer Rolling,” Doc-toral dissertation, University of Hannover,1959.
[Subramanian et al., 1980]: Subramanian,T.L., and Altan, T., “Practical Method for Es-timating Forging Loads with the Use of a Pro-

Process Design in Impression-Die Forging / 183
grammable Calculator,” Journal of AppliedMetalworking, Vol. 1, No. 2, Jan. 1980, p 60.
[Teterin et al., 1968]: Teterin, G.P., and Tar-novskij, I.J., “Calculation of Plastic Dimen-sions in Forging Axisymmetric Parts inHammers,” Kuznechno-Stampovochnoe Proiz-vodstvo, Vol 5, 1968, p 6 (in Russian).
[Vasquez et al., 2000]: Vasquez, V., and Altan,T., “New Concepts in Die Design—Physicaland Computer Modeling Applications,” Jour-nal of Materials Processing Technology, Vol.98, 2000, p 212–223.
[Vieregge, 1968]: Vieregge, K., “Contributionto Flash Design in Closed Die Forging,” Doc-toral dissertation, Technical University ofHannover, 1969.
SELECTED REFERENCES
● [Brucelle et al., 1999]: Brucelle, O., andBernhart, G., “Methodology for Service Life
Increase of Hot Forging Tools,” Journal ofMaterial, Processing Technology, Vol. 87,1999, p 237.
● [Feldman, 1977]: Feldman, H.D., Cold Ex-trusion of Steel, Merkblatt 201, Duseldorf,1977.
● [Jenkins et al., 1989]: Jenkins, B.L., Oh,S.I., Altan, T., “Investigation of Defect For-mation in a 3-Station Closed Die ForgingOperation,” CIRP Annals, Vol. 381, p 243.
● [Sagemuller, 1968]: Sagemuller, F., “ColdImpact Extrusion of Large Formed Parts,”Wire, No. 95, June, 1968, p. 2.
● [Shirgaokar et al., 2002]: Shirgaokar, M.,Ngaile, G., Altan, T., “Multi-Stage ForgingSimulations of Aircraft Components,” ERC/NSM-02-R-84, Engineering Research Cen-ter for Net Shape Manufacturing, 2002.
● [Snaith et al., 1986]: Snaith, B., Probert,S.D., O’Callaghan, P.W., “Thermal Resis-tances of Pressed Contacts,” Appl. Energy,Vol. 22, 1986, p 31–84.
CHAPTER 15
A Simplified Method toEstimate Forging Load inImpression-Die ForgingHyunjoong Cho
15.1 Introduction
In hot impression-die forging, forging loadand die stresses are important variables that af-fect die life and determine the selection of presscapacity. During the die design and processplanning stage, it is necessary to estimate thesevariables to avoid unexpected die failure andprovide for necessary forging load to fill the diecavity.
Forging load may be estimated by experience-based values, i.e., by multiplying the plan areaof the forging with an empirical pressure value,for example, 60 to 100 ksi (415 to 690 MPa) forforging steels and 20 to 30 ksi (140 to 205 MPa)for forging aluminum alloys, where higher val-ues are used for thinner forgings and strongeralloys.
The forging load and die stresses may be cal-culated using finite-element analysis that re-quires a rather sophisticated software package,elaborate input data preparation, and consider-able computer time. Therefore, it is often desir-able to use a simple method for making quickestimates by using the so called “slab method”of analysis. This method takes into account theeffects of material properties, friction and heattransfer at die/material interface, press ramspeed, flash dimensions, forging geometry, andbillet and die temperatures.
This method may help the designer to under-stand the effects of several forging parameters,such as flash dimensions, forging temperature,and friction (lubrication) on the forging load.
For example, if the effect of flash dimensions onthe forging load is known, then it is possible toreduce the forging pressure, within limits, by in-creasing the flash thickness or reducing the flashwidth. The effect of stock temperature on theforging load, if it is quantitatively known, canassist in optimizing the forging conditions. Insome instances, it may be possible to forge atlower stock temperatures. As a result, heatingcosts and scale formation can be reduced.
15.2 Effect of ProcessParameters on Forging Load
During the forging process, metal flow, diefill, and forging load are largely determined bythe flow stress of the forging materials, the fric-tion and cooling effect at the die/material inter-face, and the complexity of the forging shape.The interrelationships of the most significantforging variables are illustrated in the block di-agram in Fig. 15.1.
For a given part, the factors that affect theforging load, briefly discussed in Fig. 15.1, werediscussed in detail in Chapter 14, “Process De-sign in Impression-Die Forging.” The factors in-clude:
● The flow stress of the forged material asfunction of strain (or amount of deforma-tion), strain rate (rate of deformation), andforging temperature
Cold and Hot Forging Fundamentals and ApplicationsTaylan Altan, Gracious Ngaile, Gangshu Shen, editors, p185-192 DOI:10.1361/chff2005p185
Copyright © 2005 ASM International® All rights reserved. www.asminternational.org

186 / Cold and Hot Forging: Fundamentals and Applications
Fig. 15.1 Interaction of significant variables in closed-die forging process [Nagpal et al., 1975]
● Friction and heat transfer at the part/die in-terface
● Geometric complexity of the part and thenumber of forging operations used (pre-blocker, blocker, and finisher)
● Flash design, flash thickness and width (orflash land)
15.3 Methods for Load Estimation
In impression-die forging, the forging load isthe maximum at the end of the forging stroke.
As discussed in Chapter 14, “Process Design inImpression-Die Forging,” four broadly definedmethods are used in estimating this maximumload in hot forging.
● Applied experience: The load is estimatedbased on available data from previous forg-ing of similar parts. These estimations arevery conservative and lead to significant er-rors.
● Empirical methods: Use simple empiricalformulas and graphs or monographs to esti-mate the load for simple forging operations.These methods are quick but limited in theiraccuracy and are not sufficiently general topredict forging load for a variety of parts andmaterials.
● Analytical methods: A forging is viewed asbeing composed of several unit components.
Fig. 15.2 Planes and directions of metal flow for two simpleshapes. (a) Planes of flow. (b) Finish forging. (c)
Directions of flow [Altan et al., 1983] Fig. 15.3 Schematic of simple impression-die forging
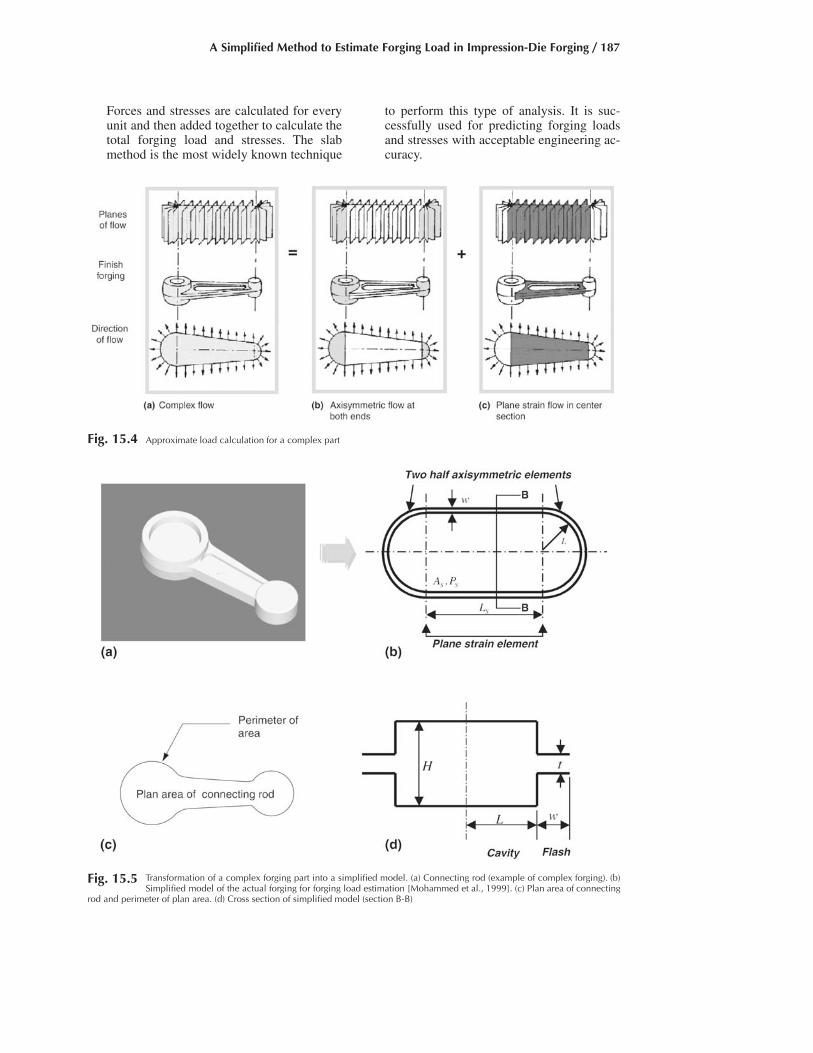
A Simplified Method to Estimate Forging Load in Impression-Die Forging / 187
Forces and stresses are calculated for everyunit and then added together to calculate thetotal forging load and stresses. The slabmethod is the most widely known technique
to perform this type of analysis. It is suc-cessfully used for predicting forging loadsand stresses with acceptable engineering ac-curacy.
Fig. 15.4 Approximate load calculation for a complex part
Fig. 15.5 Transformation of a complex forging part into a simplified model. (a) Connecting rod (example of complex forging). (b)Simplified model of the actual forging for forging load estimation [Mohammed et al., 1999]. (c) Plan area of connecting
rod and perimeter of plan area. (d) Cross section of simplified model (section B-B)
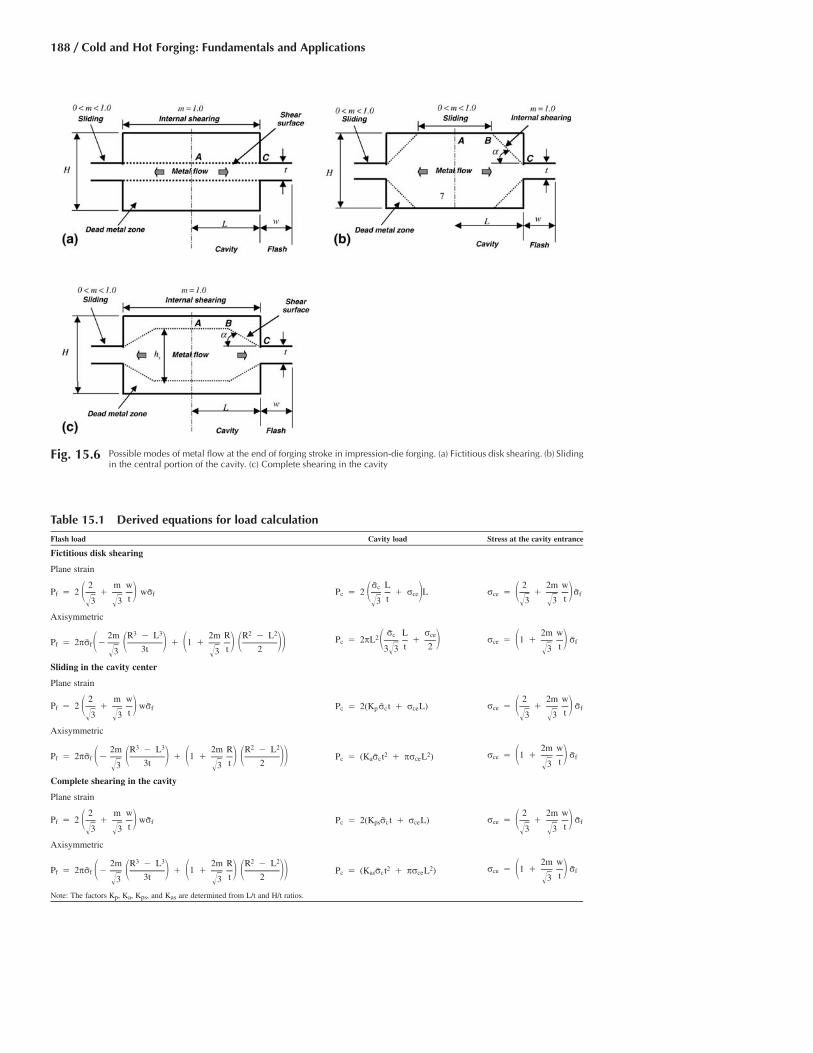
188 / Cold and Hot Forging: Fundamentals and Applications
Fig. 15.6 Possible modes of metal flow at the end of forging stroke in impression-die forging. (a) Fictitious disk shearing. (b) Slidingin the central portion of the cavity. (c) Complete shearing in the cavity
Table 15.1 Derived equations for load calculation
Flash load Cavity load Stress at the cavity entrance
Fictitious disk shearing
Plane strain
2 m wP � 2 � wrf f� �t3 3� �
r LcP � 2 � r Lc ce� �t3�
2 2m wr � � rce f� �t3 3� �
Axisymmetric
3 3 2 22m R � L 2m R R � LP � 2pr � � 1 �f f� � � � � � ��3t t 23 3� �
r L rc ce2P � 2pL �c � �t 23 3�
2m wr � 1 � rce f� �t3�
Sliding in the cavity center
Plane strain
2 m wP � 2 � wrf f� �t3 3� �
P � 2(K r t � r L)c p c ce2 2m w
r � � rce f� �t3 3� �Axisymmetric
3 3 2 22m R � L 2m R R � LP � 2pr � � 1 �f f � � � � � � ��3t t 23 3� �
2 2P � (K r t � pr L )c a c ce
2m wr � 1 � rce f� �t3�
Complete shearing in the cavity
Plane strain
2 m wP � 2 � wrf f� �t3 3� �
P � 2(K r t � r L)c ps c ce2 2m w
r � � rce f� �t3 3� �Axisymmetric
3 3 2 22m R � L 2m R R � LP � 2pr � � 1 �f f � � � � � � ��3t t 23 3� �
2 2P � (K r t � pr L )c as c ce
2m wr � 1 � rce f� �t3�
Note: The factors Kp, Ka, Kps, and Kas are determined from L/t and H/t ratios.
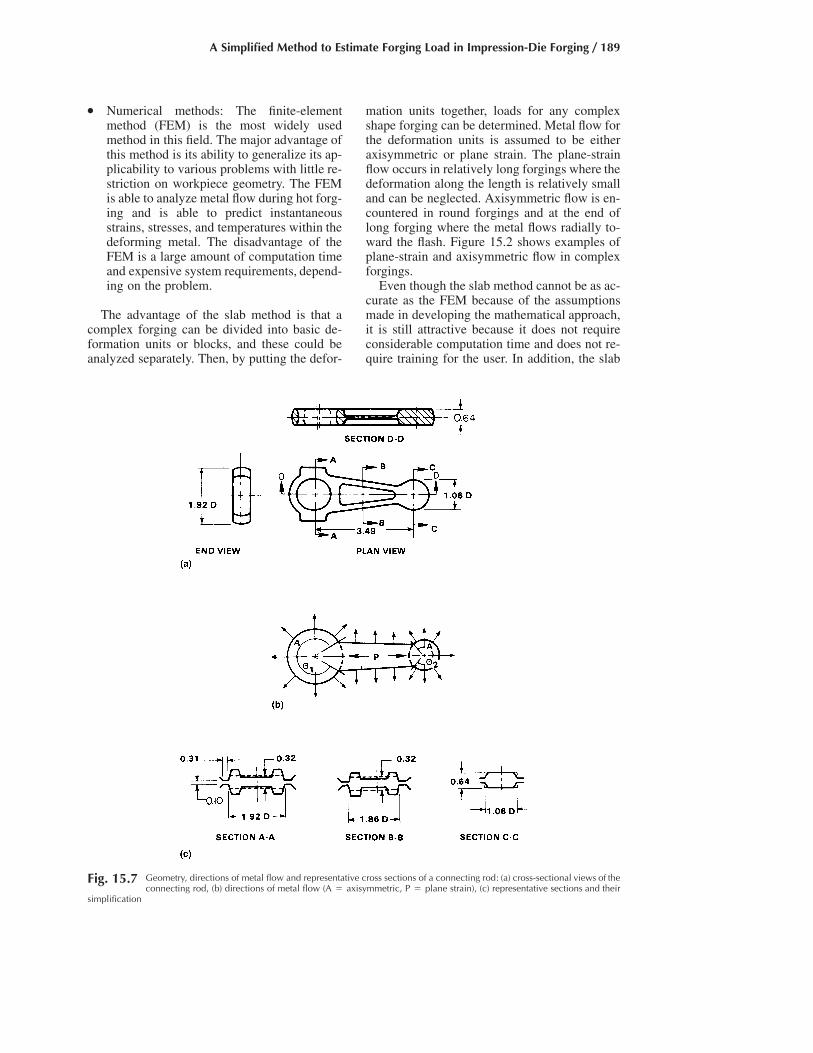
A Simplified Method to Estimate Forging Load in Impression-Die Forging / 189
● Numerical methods: The finite-elementmethod (FEM) is the most widely usedmethod in this field. The major advantage ofthis method is its ability to generalize its ap-plicability to various problems with little re-striction on workpiece geometry. The FEMis able to analyze metal flow during hot forg-ing and is able to predict instantaneousstrains, stresses, and temperatures within thedeforming metal. The disadvantage of theFEM is a large amount of computation timeand expensive system requirements, depend-ing on the problem.
The advantage of the slab method is that acomplex forging can be divided into basic de-formation units or blocks, and these could beanalyzed separately. Then, by putting the defor-
mation units together, loads for any complexshape forging can be determined. Metal flow forthe deformation units is assumed to be eitheraxisymmetric or plane strain. The plane-strainflow occurs in relatively long forgings where thedeformation along the length is relatively smalland can be neglected. Axisymmetric flow is en-countered in round forgings and at the end oflong forging where the metal flows radially to-ward the flash. Figure 15.2 shows examples ofplane-strain and axisymmetric flow in complexforgings.
Even though the slab method cannot be as ac-curate as the FEM because of the assumptionsmade in developing the mathematical approach,it is still attractive because it does not requireconsiderable computation time and does not re-quire training for the user. In addition, the slab
Fig. 15.7 Geometry, directions of metal flow and representative cross sections of a connecting rod: (a) cross-sectional views of theconnecting rod, (b) directions of metal flow (A � axisymmetric, P � plane strain), (c) representative sections and their
simplification

190 / Cold and Hot Forging: Fundamentals and Applications
method can show the trend in the calculation offorging load while the FEM only provides thefinal calculated results.
15.4 A SimplifiedMethod for Load Estimation
The present method, used in practical predic-tion of forging load, works on a simplifiedmodel of impression-die forging and uses theslab analysis technique. It is assumed that for allcross sections of forging, the cavity is rectan-gular and has the flash geometry, as illustratedin Fig. 15.3. In actual practice, where the cavityis not rectangular, the cross section is simplifiedto conform to this model. The load calculationis simplified by dividing a complex forging insimpler components where metal flow is eitheraxisymmetric or plane strain, as shown in Fig.15.4. Then the load is estimated by adding theloads calculated for each component. In load es-timation, to take into account the change of flow
stress due to temperature change during the hotforging operation, heat-transfer analysis is con-ducted. The advantage of this approach is thatthe effect of certain process parameters on theforging load can be investigated quickly. Thisenables an industrial designer to know the trendof design variables by conducting a parametricstudy when he is designing a new forging opera-tion. For example, the effect of dimensional pa-rameters such as flash thickness, t, and width, w,on the total forging load can be easily obtained(Fig. 15.3).
15.4.1 Simplification ofForging Geometry
Any arbitrary three-dimensional forging istransformed into a simplified forging model.This model, including the simplified plane-strainand axisymmetric metal flows, allows conduct-ing slab analysis for load estimation. As shownin Fig. 15.5(b), it is assumed that a simplifiedforging model is divided into an axisymmetriccomponent of radius L and a plane-strain com-ponent of length Ls. The plan area, As, of a sim-plified model is equal to the plan area of theactual forging and is represented by As � pL2
� 2LsL. Also, the perimeter, Ps, of a simplifiedmodel is equal to the perimeter of the plan areaof the actual forging and is expressed byPs �2pL � 2Ls. As and Ps of an actual forgingpart can be determined from any solid modelingsoftware commonly used in industry. Once As
Table 15.3 Estimated flow stresses and forging loads
Axisymmetric portion Plane-strain portion
Component Cavity Flash Cavity Flash
Temperature, �F (�C) 2,055 (1124) 2,013 (1101) 2,063 (1128) 2,015 (1102)Flow stress, psi (MPa) 15,298 (105) 18,467 (127) 14,958 (103) 18,409 (127)Forging load, tons 34 18 241 47
52 (cavity � flash) 288 (cavity � flash)Total forging load, tons 340 (axisymmetric � plane strain)
Table 15.2 Inputs for the load estimation ofconnecting rod
Material data
Flow stress SS 304Specific heat, Btu/lb•�F (J/kg•K) 0.116 (486)Density, lb/in.3 (g/cm3) 0.285 (7.8)
Equipment data
Press type MechanicalPress speed, rpm 50Press stroke, in. (cm) 14 (36)
Geometry data
Initial billet height, in. (mm) 1.12 (28)Flash thickness, in. (mm) 0.1 (2.5)Flash width, in. (mm) 0.3 (7.6)Perimeter, in. (cm) 13.67 (34.7)Projected area, in. (cm) 6.55 (16.6)Cavity height, in. (mm) 0.56 (14.2)
Interface data
Friction factor 0.3Heat-transfer coefficient 0.0039 Btu/in.2/s/�F
(3.1889 W/m2•�K)Initial billet temperature, �F (�C) 2050 (1120)Initial die temperature, �F (�C) 400 (205)
Fig. 15.8 Lead disk forging
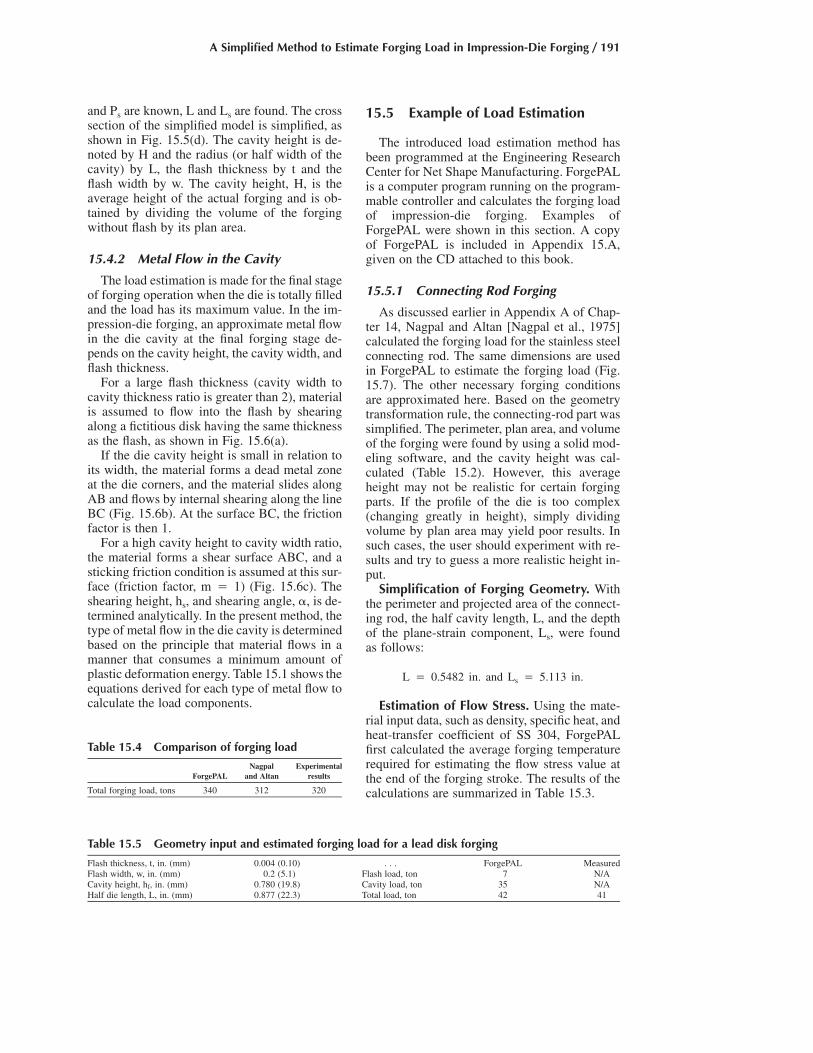
A Simplified Method to Estimate Forging Load in Impression-Die Forging / 191
and Ps are known, L and Ls are found. The crosssection of the simplified model is simplified, asshown in Fig. 15.5(d). The cavity height is de-noted by H and the radius (or half width of thecavity) by L, the flash thickness by t and theflash width by w. The cavity height, H, is theaverage height of the actual forging and is ob-tained by dividing the volume of the forgingwithout flash by its plan area.
15.4.2 Metal Flow in the Cavity
The load estimation is made for the final stageof forging operation when the die is totally filledand the load has its maximum value. In the im-pression-die forging, an approximate metal flowin the die cavity at the final forging stage de-pends on the cavity height, the cavity width, andflash thickness.
For a large flash thickness (cavity width tocavity thickness ratio is greater than 2), materialis assumed to flow into the flash by shearingalong a fictitious disk having the same thicknessas the flash, as shown in Fig. 15.6(a).
If the die cavity height is small in relation toits width, the material forms a dead metal zoneat the die corners, and the material slides alongAB and flows by internal shearing along the lineBC (Fig. 15.6b). At the surface BC, the frictionfactor is then 1.
For a high cavity height to cavity width ratio,the material forms a shear surface ABC, and asticking friction condition is assumed at this sur-face (friction factor, m � 1) (Fig. 15.6c). Theshearing height, hs, and shearing angle, �, is de-termined analytically. In the present method, thetype of metal flow in the die cavity is determinedbased on the principle that material flows in amanner that consumes a minimum amount ofplastic deformation energy. Table 15.1 shows theequations derived for each type of metal flow tocalculate the load components.
15.5 Example of Load Estimation
The introduced load estimation method hasbeen programmed at the Engineering ResearchCenter for Net Shape Manufacturing. ForgePALis a computer program running on the program-mable controller and calculates the forging loadof impression-die forging. Examples ofForgePAL were shown in this section. A copyof ForgePAL is included in Appendix 15.A,given on the CD attached to this book.
15.5.1 Connecting Rod Forging
As discussed earlier in Appendix A of Chap-ter 14, Nagpal and Altan [Nagpal et al., 1975]calculated the forging load for the stainless steelconnecting rod. The same dimensions are usedin ForgePAL to estimate the forging load (Fig.15.7). The other necessary forging conditionsare approximated here. Based on the geometrytransformation rule, the connecting-rod part wassimplified. The perimeter, plan area, and volumeof the forging were found by using a solid mod-eling software, and the cavity height was cal-culated (Table 15.2). However, this averageheight may not be realistic for certain forgingparts. If the profile of the die is too complex(changing greatly in height), simply dividingvolume by plan area may yield poor results. Insuch cases, the user should experiment with re-sults and try to guess a more realistic height in-put.
Simplification of Forging Geometry. Withthe perimeter and projected area of the connect-ing rod, the half cavity length, L, and the depthof the plane-strain component, Ls, were foundas follows:
L � 0.5482 in. and L � 5.113 in.s
Estimation of Flow Stress. Using the mate-rial input data, such as density, specific heat, andheat-transfer coefficient of SS 304, ForgePALfirst calculated the average forging temperaturerequired for estimating the flow stress value atthe end of the forging stroke. The results of thecalculations are summarized in Table 15.3.
Table 15.4 Comparison of forging load
ForgePALNagpal
and AltanExperimental
results
Total forging load, tons 340 312 320
Table 15.5 Geometry input and estimated forging load for a lead disk forging
Flash thickness, t, in. (mm) 0.004 (0.10) . . . ForgePAL MeasuredFlash width, w, in. (mm) 0.2 (5.1) Flash load, ton 7 N/ACavity height, hf, in. (mm) 0.780 (19.8) Cavity load, ton 35 N/AHalf die length, L, in. (mm) 0.877 (22.3) Total load, ton 42 41

192 / Cold and Hot Forging: Fundamentals and Applications
Estimation of Forging Load. The load cal-culation method for a complex part is based onthe addition of the loads calculated for eachcomponent. The forging load of each componentconsists of the cavity load and the flash load.Finally, the total forging load for the connectingrod is equal to the combination of the load forthe axisymmetric and plane-strain portions. Asis shown in Table 15.4, a total forging load of340 tons is predicted and its results are com-pared with experimental results.
15.5.2 Forging of a Lead Disk with Flash
[Schey et al.] measured separately the flashand the cavity loads in lead disk forging, asshown in Fig. 15.8. In this reference, the flowstress values in the cavity, and in the flash,r ,c
are given as:r ,f
r � 2,300 psi and r � 5,300 psic f
The part is symmetric and round about thecenter axis with flash at the periphery. Thus, theaxisymmetric model is selected for load calcu-lation in ForgePAL. The necessary axisymme-tric geometry inputs obtained from Fig. 15.8 andestimated forging loads are summarized in Table15.5.
REFERENCES
[Altan et al., 1983]: Altan, T., Oh, S.I., Gegel,H., Metal Forming Fundamentals and Appli-cations, American Society for Metals, 1983.
[Mohammed et al., 1999]: Asaduzzaman, M.,Demir, A., Vazquez, V., Altan, T., “Develop-
ment of Computer Program for Estimation ofForging Load and Die Pressures in Hot Forg-ing,” Report No. F/ERC/NSM-99-R-18, En-gineering Research Center for Net ShapeManufacturing, The Ohio State University,1999.
[Nagpal et al., 1975]: Nagpal, V., and Altan, T.,“Estimation of Forging Load in Closed-DieForging,” Battelle Columbus Laboratories,1975.
[Schey et al.]: Schey, J.A., et al., “Metal Flow inClosed-Die Press Forming of Steel,” ResearchReport to American Iron and Steel Institute, IITResearch Institute, Chicago, Illinois.
SELECTED REFERENCES
● [Douglas et al., 1989]: Douglas, J.R., andAltan, T., “Flow Stress Determination forMetals at Forging Rates and Temperatures,”Trans. ASME, J. Eng. Industry, Feb. 1975, p66, 1989.
● [Lange, 1985]: Lange, K., Handbook ofMetal Forming, McGraw-Hill Book Com-pany, 1985.
● [Schultes et al., 1981]: Schultes, T., Sev-enler, K., Altan, T., “Prediction of ForgingLoad and Stresses Using a ProgrammableCalculator,” Topical Report No. 4, BattelleColumbus Laboratories, 1981.
● [Subramanian et al., 1980]: Subramanian,T.L., and Altan, T., “Practical Method forEstimating Forging Loads with the Use ofa Programmable Calculator,” Journal ofApplied Metal Working, No. 2, Jan. 1980,p 60.
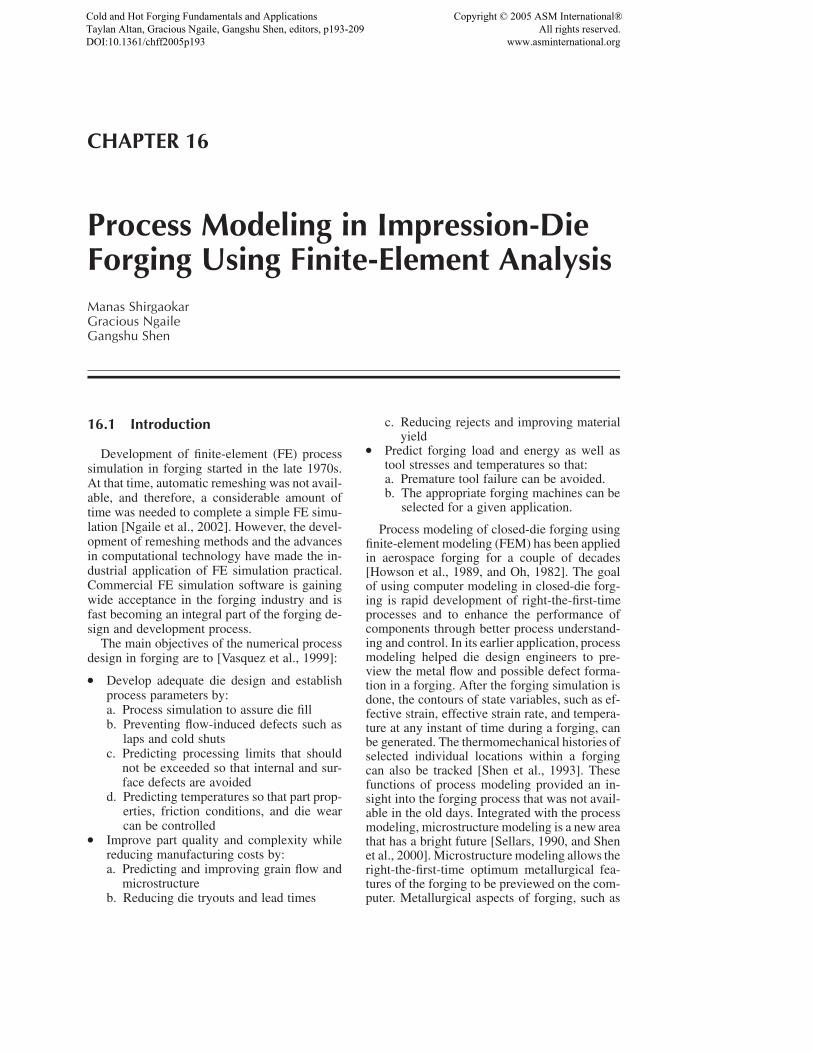
CHAPTER 16
Process Modeling in Impression-DieForging Using Finite-Element AnalysisManas ShirgaokarGracious NgaileGangshu Shen
16.1 Introduction
Development of finite-element (FE) processsimulation in forging started in the late 1970s.At that time, automatic remeshing was not avail-able, and therefore, a considerable amount oftime was needed to complete a simple FE simu-lation [Ngaile et al., 2002]. However, the devel-opment of remeshing methods and the advancesin computational technology have made the in-dustrial application of FE simulation practical.Commercial FE simulation software is gainingwide acceptance in the forging industry and isfast becoming an integral part of the forging de-sign and development process.
The main objectives of the numerical processdesign in forging are to [Vasquez et al., 1999]:
● Develop adequate die design and establishprocess parameters by:a. Process simulation to assure die fillb. Preventing flow-induced defects such as
laps and cold shutsc. Predicting processing limits that should
not be exceeded so that internal and sur-face defects are avoided
d. Predicting temperatures so that part prop-erties, friction conditions, and die wearcan be controlled
● Improve part quality and complexity whilereducing manufacturing costs by:a. Predicting and improving grain flow and
microstructureb. Reducing die tryouts and lead times
c. Reducing rejects and improving materialyield
● Predict forging load and energy as well astool stresses and temperatures so that:a. Premature tool failure can be avoided.b. The appropriate forging machines can be
selected for a given application.
Process modeling of closed-die forging usingfinite-element modeling (FEM) has been appliedin aerospace forging for a couple of decades[Howson et al., 1989, and Oh, 1982]. The goalof using computer modeling in closed-die forg-ing is rapid development of right-the-first-timeprocesses and to enhance the performance ofcomponents through better process understand-ing and control. In its earlier application, processmodeling helped die design engineers to pre-view the metal flow and possible defect forma-tion in a forging. After the forging simulation isdone, the contours of state variables, such as ef-fective strain, effective strain rate, and tempera-ture at any instant of time during a forging, canbe generated. The thermomechanical histories ofselected individual locations within a forgingcan also be tracked [Shen et al., 1993]. Thesefunctions of process modeling provided an in-sight into the forging process that was not avail-able in the old days. Integrated with the processmodeling, microstructure modeling is a new areathat has a bright future [Sellars, 1990, and Shenet al., 2000]. Microstructure modeling allows theright-the-first-time optimum metallurgical fea-tures of the forging to be previewed on the com-puter. Metallurgical aspects of forging, such as
Cold and Hot Forging Fundamentals and ApplicationsTaylan Altan, Gracious Ngaile, Gangshu Shen, editors, p193-209 DOI:10.1361/chff2005p193
Copyright © 2005 ASM International® All rights reserved. www.asminternational.org

194 / Cold and Hot Forging: Fundamentals and Applications
grain size and precipitation, can be predictedwith reasonable accuracy using computationaltools prior to committing the forging to shop tri-als. Some of the proven practical applications ofprocess simulation in closed-die forging include:
● Design of forging sequences in cold, warm,and hot forging, including the prediction offorming forces, die stresses, and preformshapes
● Prediction and optimization of flash dimen-sions in hot forging from billet or powdermetallurgy preforms
● Prediction of die stresses, fracture, and diewear; improvement in process variables anddie design to reduce die failure
● Prediction and elimination of failures, sur-face folds, or fractures as well as internalfractures
● Investigation of the effect of friction onmetal flow
● Prediction of microstructure and properties,elastic recovery, and residual stresses
16.2 Information Flow inProcess Modeling
It is a well-known fact that product designactivity represents only a small portion, 5 to15%, of the total production costs of a part.However, decisions made at the design stage de-termine the overall manufacturing, maintenance,and support costs associated with the specificproduct. Once the part is designed for a specificprocess, the following steps lead to a rationalprocess design:
1. Establish a preliminary die design and selectprocess parameters by using experience-based knowledge.
2. Verify the initial design and process condi-tions using process modeling. For this pur-pose it is appropriate to use well-establishedcommercially available computer codes.
3. Modify die design and initial selection ofprocess variables, as needed, based on the re-sults of process simulation.
4. Complete the die design phase and manufac-ture the dies.
5. Conduct die tryouts on production equip-ment.
6. Modify die design and process conditions, ifnecessary, to produce quality parts.
Hopefully, at this stage little or no modificationwill be necessary, since process modeling is ex-pected to be accurate and sufficient to make allthe necessary changes before manufacturing thedies.
Information flow in process modeling isshown schematically in Fig. 16.1 [Shen et al.,2001]. The input of the geometric parameters,process parameters, and material parameters setsup a unique case of a closed-die forging. Themodeling is then performed to provide infor-mation on the metal flow and thermomechanicalhistory of the forging, the distribution of thestate variables at any stage of the forging, andthe equipment response during forging. The his-tories of the state variables, such as strain, strainrate, temperature, etc., are then input to the mi-crostructure model for microstructural featureprediction. All of the information generated isused for judging the closed-die forging case. Thenonsatisfaction in any of these areas will requirea new model with a set of modified process pa-rameters until the satisfied results are obtained.Then, the optimum process is selected for shoppractice.
16.3 Process Modeling Input
Preparing correct input for process modelingis very important. There is a saying in computermodeling: garbage in and garbage out. Some-times, a time-consuming process modeling isuseless because of a small error in input prepa-ration. Process modeling input is discussed interms of geometric parameters, process param-eters, and material parameters [SFTC, 2002].
16.3.1 Geometric Parameters
The starting workpiece geometry and the diegeometry need to be defined in a closed-die forg-ing modeling. Depending on its geometricalcomplexity, a forging process can be simulatedeither as a two-dimensional, axisymmetric orplane-strain, or a three-dimensional problem. Ifthe process involves multiple stations, the diegeometry of each station needs to be provided.A typical starting workpiece geometry for aclosed-die forging is a cylinder with or withoutchamfers. The diameter and the height of thecylinder are defined in the preprocessing stage.A lot of closed-die forgings are axisymmetric,which need a two-dimensional geometry han-dling. Boundary conditions on specific segments

Process Modeling in Impression-Die Forging Using Finite-Element Analysis / 195
of the workpiece and dies that relate to defor-mation and heat transfer need to be defined. Forexample, for an axisymmetric cylinder to beforged in a pair of axisymmetric dies, the nodalvelocity in the direction perpendicular to thecenterline should be defined as zero, and the heatflux in that direction should also be defined aszero.
16.3.2 Process Parameters
The typical process parameters to be consid-ered in a closed-die forging include [SFTC,2002]:
● The environment temperature● The workpiece temperature● The die temperatures● The coefficients of heat transfer between the
dies and the billet and the billet and the at-mosphere
● The time used to transfer the workpiece fromthe furnace to the dies
● The time needed to have the workpiece rest-ing on the bottom die
● The workpiece and die interface heat-trans-fer coefficient during free resting
● The workpiece and die interface heat-trans-fer coefficient during deformation
● The workpiece and die interface friction, etc.
The die velocity is a very important parameterto be defined in the modeling of a closed-dieforging. If a hydraulic press is used, dependingon the actual die speed profiles, the die velocitycan be defined as a constant or series of veloc-ities that decrease during deformation. The ac-tual die speed recorded from the forging can alsobe used to define the die velocity profile. If amechanical press is used, the rpm of the fly-wheel, the press stroke, and the distance fromthe bottom dead center when the upper dietouches the part need to be defined. If a screwpress is used, the total energy, the efficiency, andthe ram displacement need to be defined. If ahammer is used, the blow energy, the blow ef-ficiency, the mass of the moving ram and die,the number of blows, and the time interval be-tween blows must be defined. Forgings per-formed in different machines, with unique ve-locity versus stroke characteristics, have beensimulated successfully using the commercial FEsoftware DEFORM (Scientific Forming Tech-nologies Corp.) [SFTC, 2002].
Fig. 16.1 Flow chart of modeling of closed-die forging [Shen et al., 2001]

196 / Cold and Hot Forging: Fundamentals and Applications
16.3.3 Tool and WorkpieceMaterial Properties
In order to accurately predict the metal flowand forming loads, it is necessary to use reliableinput data. The stress-strain relation or flowcurve is generally obtained from a compressiontest. However, the test is limited in achievablestrains. In order to obtain the flow stress at largestrains and strain rates, the torsion test can beused or, alternatively, the compression data isextrapolated with care.
In most simulations, the tools are consideredrigid; thus, die deformation and stresses are ne-glected. However, in precision forging opera-tions, the relatively small elastic deformations ofthe dies may influence the thermal and mechan-ical loading conditions and the contact stress dis-tribution at the die/workpiece interface. Thus,die stress analysis is a crucial part of processsimulation to verify the die design and the forg-ing process parameters.
16.3.4 Interface Conditions(Friction and Heat Transfer)
The friction and heat-transfer conditions atthe interface between the die and the billet havea significant effect on the metal flow and theloads required to produce the part. In forgingsimulations, due to the high contact stresses atthe interface between the workpiece and the die,the constant shear friction factor gives better re-sults than the coulomb friction coefficient.
The most common way to determine the shearfriction factor in forging is to perform ring com-pression tests. From these tests, it is possible toestimate the heat-transfer coefficient, flow stressand friction as a function of temperature, strainrate, strain, and forming pressure, as discussedin Chapter 6, “Temperatures and Heat Transfer.”
Friction factors measured with the ring com-pression test, however, are not valid for preci-sion forging processes (hot, warm, and cold)where the interface pressure is very high and thesurface generation is large. The friction condi-tions change during the process due to changesin the lubricant and the temperature at the die/workpiece interface. In such applications, thedouble cup extrusion test is recommended forestimation of the friction factor, as discussed inChapter 7, “Friction and Lubrication.”
16.3.5 Material Parameters
The closed-die hot forging modeling is a cou-pled heat-transfer and deformation simulation.
Material parameters that relate to both heattransfer and deformation need to be defined. Thematerial parameters commonly used for heat-transfer modeling are the thermal conductivity,heat capacity, and emissivity of the workpieceand die materials. These parameters are usuallydefined as a function of temperature, The flowstress of the workpiece material is very impor-tant for the correct prediction of metal flow be-havior. It is usually defined as a function ofstrain, strain rate, temperature, and possiblestarting microstructures. The Young’s modulus,the Poisson’s ratio as a function of temperature,and the thermal expansion of the die materialsare important parameters for die stress analysis.
16.4 Characteristics ofthe Simulation Code
16.4.1 Mesh Generation andAutomatic Remeshing
In forging processes, the workpiece generallyundergoes large plastic deformation, and therelative motion between the deforming materialand the die surface is significant. In the simu-lation of such processes, the starting mesh iswell defined and can have the desired mesh den-sity distribution. As the simulation progresses,the mesh tends to get distorted significantly.Hence, it is necessary to generate a new meshand interpolate the simulation data from the oldmesh to the new one to obtain accurate results.Automated mesh generation (AMG) schemeshave been incorporated in commercial FE codesfor metal forming simulations. In DEFORM,there are two tasks in AMG: 1) determination ofoptimal mesh density distribution and 2) gen-eration of the FE mesh based on the given den-sity. The mesh density should conform to thegeometrical features of the workpiece at eachstep of deformation [Wu et al., 1992]. In orderto maximize the geometric conformity, it is nec-essary to consider mesh densities that take intoaccount the boundary curvature and local thick-ness.
In DEFORM, two-dimensional (2-D) simu-lations use quadrilateral elements, whereasthree-dimensional (3-D) simulations use tetra-hedral elements for meshing and automatic re-meshing [Wu et al., 1996]. With this automaticremeshing capability, it is possible to set up asimulation model and run it to the end with verylittle interaction with the user.

Process Modeling in Impression-Die Forging Using Finite-Element Analysis / 197
duces defects in the forging. In real closed-dieforging, it is necessary to wait until the forgingis finished to see the forged part and the defect,if there is one. The advantage of computer simu-lation of forging is that the entire forging processis stored in a database file in the computer andcan be tracked. Whether there is a defect formedand how it is formed can be previewed beforethe actual forging. Figure 16.2 shows the lap for-mation for a rejected process in the design stage.The lap formation can be eliminated by chang-ing the workpiece geometry (the billet or pre-form), or the die geometry, or both. The com-puter modeling can again indicate if thecorrective measure works or not.
16.5.2 Distribution andHistory of State Variables
The distribution of the state variables, such asthe strain, strain rate, and temperature, at anystage of a closed-die forging can be plotted fromthe database file saved for the forging simula-tion. The history of these state variables can alsobe tracked.
Figure 16.3(a) shows the effective strain dis-tribution of a closed-die forging forged in an iso-thermal press. The effective strain has a value of0.4 to 0.9 in the bore die lock region. The regionthat is in contact with the upper die has an ef-fective strain value of 0.4 to 0.9, and the regionthat is in contact with the lower die, a value of0.7 to 0.9. With an effective strain of 2.0 to 2.8,the bore rim transition region has the largeststrain. The effective strain value is approxi-mately 1.5 for both the rim and the midheight ofthe bore region. From the state variable distri-bution plot, the state variable at a specific stageof the forging is known. This specific stage,
Fig. 16.2 Lap prediction using process modeling tool
16.4.2 Reliability andComputational Time
Several FE simulation codes are commer-cially available for numerical simulation of forg-ing processes, such as DEFORM (2-D and 3-D),FORGE (2-D and 3-D) (Ternion Corp.), Qform(2-D and 3-D), etc. In addition to a reliable FEsolver, the accurate and efficient use of metalflow simulations require [Knoerr et al., 1992]:
● Interactive preprocessing to provide the userwith control over the initial geometry, meshgeneration, and input data; automatic re-meshing to allow the simulation to continuewhen the distortion of the old mesh is ex-cessive; interactive postprocessing that pro-vides more advanced data analysis, such aspoint tracking and flow line calculation
● Appropriate input data describing the ther-mal and physical properties of die and billetmaterial the heat transfer and friction at thedie/workpiece interface under the processingconditions investigated, and the flow behav-ior of the deforming material at the relativelylarge strains that occur in practical forgingoperations
● Analysis capabilities that are able to performthe process simulation with rigid dies to re-duce calculation time and to use contactstresses and temperature distribution esti-mated with the process simulation usingrigid dies to perform elastic-plastic die stressanalysis
The time required to run a simulation dependson the computer used and the amount of memoryand workload the computer has. However, withtoday’s computers, it is possible to run a 2-Dsimulation in a couple of hours, while a 3-Dsimulation can take anywhere between a day toa week, depending on the part complexity [Wuet al., 1996].
16.5 Process Modeling Output
The process modeling provides extensive in-formation of the forging process. The output ofprocess modeling can be discussed in terms ofthe metal flow, the distribution and history ofstate variables, the equipment response duringforging, and the microstructure of the forging.
16.5.1 Metal Flow
The information on metal flow is very impor-tant for die design. Improper metal flow pro-
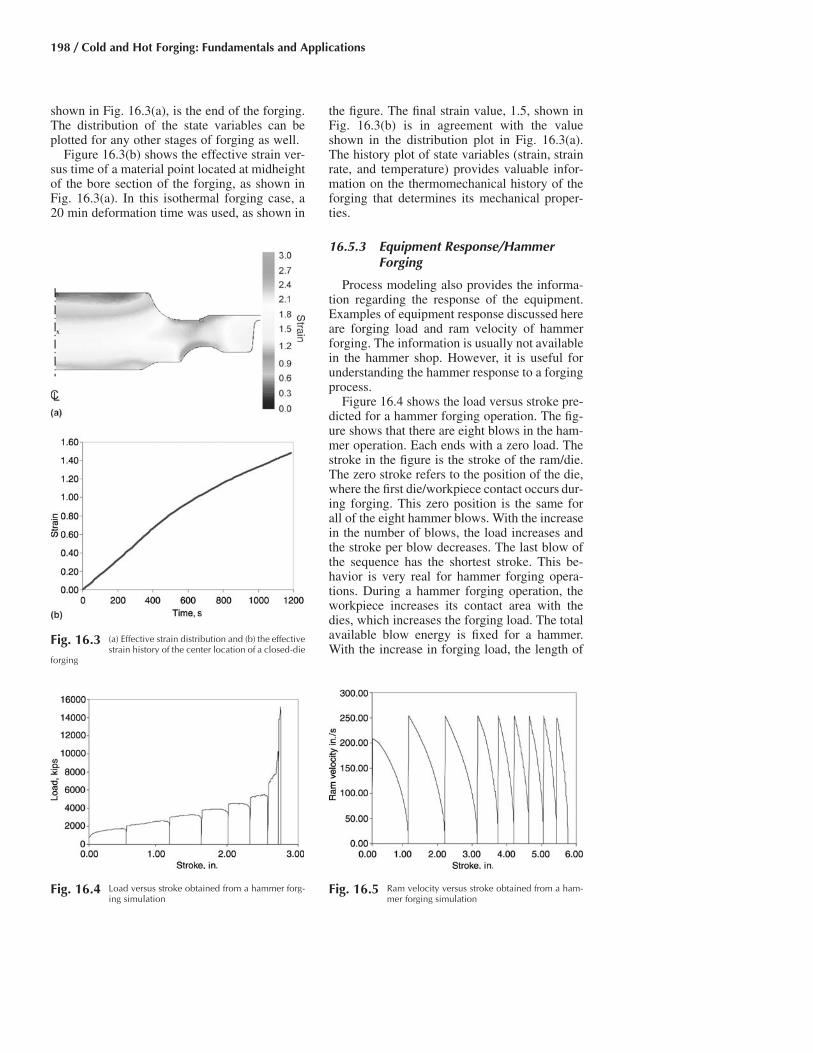
198 / Cold and Hot Forging: Fundamentals and Applications
shown in Fig. 16.3(a), is the end of the forging.The distribution of the state variables can beplotted for any other stages of forging as well.
Figure 16.3(b) shows the effective strain ver-sus time of a material point located at midheightof the bore section of the forging, as shown inFig. 16.3(a). In this isothermal forging case, a20 min deformation time was used, as shown in
the figure. The final strain value, 1.5, shown inFig. 16.3(b) is in agreement with the valueshown in the distribution plot in Fig. 16.3(a).The history plot of state variables (strain, strainrate, and temperature) provides valuable infor-mation on the thermomechanical history of theforging that determines its mechanical proper-ties.
16.5.3 Equipment Response/HammerForging
Process modeling also provides the informa-tion regarding the response of the equipment.Examples of equipment response discussed hereare forging load and ram velocity of hammerforging. The information is usually not availablein the hammer shop. However, it is useful forunderstanding the hammer response to a forgingprocess.
Figure 16.4 shows the load versus stroke pre-dicted for a hammer forging operation. The fig-ure shows that there are eight blows in the ham-mer operation. Each ends with a zero load. Thestroke in the figure is the stroke of the ram/die.The zero stroke refers to the position of the die,where the first die/workpiece contact occurs dur-ing forging. This zero position is the same forall of the eight hammer blows. With the increasein the number of blows, the load increases andthe stroke per blow decreases. The last blow ofthe sequence has the shortest stroke. This be-havior is very real for hammer forging opera-tions. During a hammer forging operation, theworkpiece increases its contact area with thedies, which increases the forging load. The totalavailable blow energy is fixed for a hammer.With the increase in forging load, the length of
Fig. 16.4 Load versus stroke obtained from a hammer forg-ing simulation
Fig. 16.5 Ram velocity versus stroke obtained from a ham-mer forging simulation
Fig. 16.3 (a) Effective strain distribution and (b) the effectivestrain history of the center location of a closed-die
forging

Process Modeling in Impression-Die Forging Using Finite-Element Analysis / 199
stroke is reduced. Moreover, the blow efficiency,which is the ratio between the energy used fordeformation and the total blow energy, is also
reduced with the increase in forging load. Thus,a smaller amount of energy is available towardthe end of a blow sequence and with the de-crease in the stroke per blow.
Figure 16.5 gives the ram velocity versusstroke obtained from a simulation of anotherhammer forging process. There are nine blowsfor this hammer operation. The velocity of thefirst blow was smaller than the other eight blows,because a soft blow was used initially to locatethe workpiece. In a soft blow, there is only aportion of blow energy applied to the workpiece.Thus, the first blow has a smaller starting ramvelocity. After the first blow, full energy was ap-plied to the forging. Thus, the starting ram ve-
Fig. 16.8 Rene 88 experimental part out of forging press[Hardwicke et al., 2000]
Fig. 16.7 Comparisons of hot-die forging and mechanicalpress forging of an experimental part using process
modeling
Fig. 16.9 Predicted model and optically measured grainsizes in the three developmental Rene 88DT disks
with (a) coarse, (b) medium, and (c) fine grains [Hardwicke et al.,2000]
Fig. 16.6 Prediction of the distribution of the size (lm) ofgamma prime for a Rene 88 experimental forging
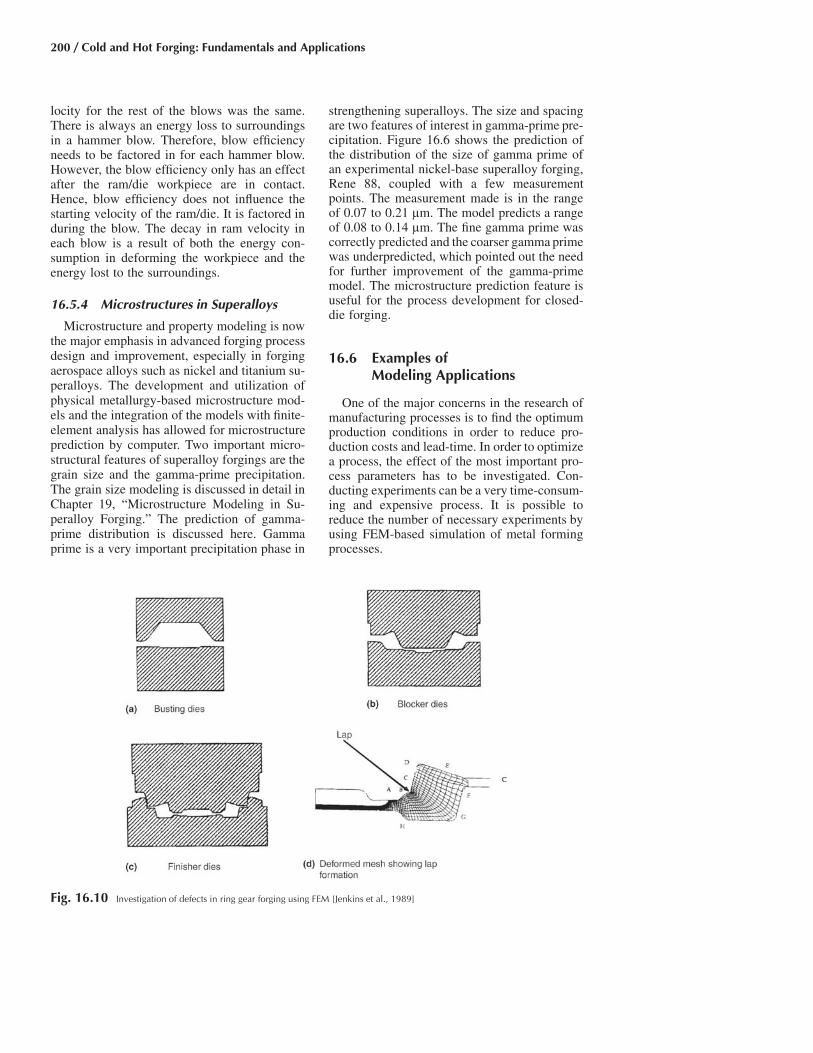
200 / Cold and Hot Forging: Fundamentals and Applications
locity for the rest of the blows was the same.There is always an energy loss to surroundingsin a hammer blow. Therefore, blow efficiencyneeds to be factored in for each hammer blow.However, the blow efficiency only has an effectafter the ram/die workpiece are in contact.Hence, blow efficiency does not influence thestarting velocity of the ram/die. It is factored induring the blow. The decay in ram velocity ineach blow is a result of both the energy con-sumption in deforming the workpiece and theenergy lost to the surroundings.
16.5.4 Microstructures in Superalloys
Microstructure and property modeling is nowthe major emphasis in advanced forging processdesign and improvement, especially in forgingaerospace alloys such as nickel and titanium su-peralloys. The development and utilization ofphysical metallurgy-based microstructure mod-els and the integration of the models with finite-element analysis has allowed for microstructureprediction by computer. Two important micro-structural features of superalloy forgings are thegrain size and the gamma-prime precipitation.The grain size modeling is discussed in detail inChapter 19, “Microstructure Modeling in Su-peralloy Forging.” The prediction of gamma-prime distribution is discussed here. Gammaprime is a very important precipitation phase in
strengthening superalloys. The size and spacingare two features of interest in gamma-prime pre-cipitation. Figure 16.6 shows the prediction ofthe distribution of the size of gamma prime ofan experimental nickel-base superalloy forging,Rene 88, coupled with a few measurementpoints. The measurement made is in the rangeof 0.07 to 0.21 lm. The model predicts a rangeof 0.08 to 0.14 lm. The fine gamma prime wascorrectly predicted and the coarser gamma primewas underpredicted, which pointed out the needfor further improvement of the gamma-primemodel. The microstructure prediction feature isuseful for the process development for closed-die forging.
16.6 Examples ofModeling Applications
One of the major concerns in the research ofmanufacturing processes is to find the optimumproduction conditions in order to reduce pro-duction costs and lead-time. In order to optimizea process, the effect of the most important pro-cess parameters has to be investigated. Con-ducting experiments can be a very time-consum-ing and expensive process. It is possible toreduce the number of necessary experiments byusing FEM-based simulation of metal formingprocesses.
Fig. 16.10 Investigation of defects in ring gear forging using FEM [Jenkins et al., 1989]
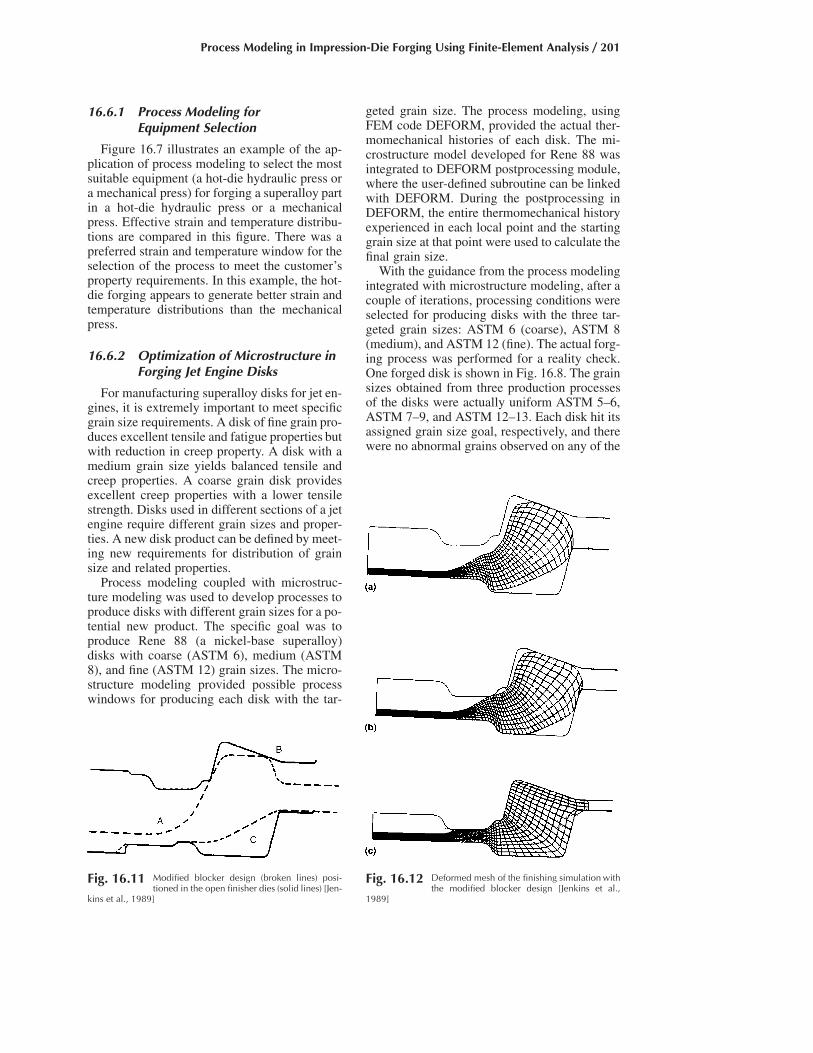
Process Modeling in Impression-Die Forging Using Finite-Element Analysis / 201
16.6.1 Process Modeling forEquipment Selection
Figure 16.7 illustrates an example of the ap-plication of process modeling to select the mostsuitable equipment (a hot-die hydraulic press ora mechanical press) for forging a superalloy partin a hot-die hydraulic press or a mechanicalpress. Effective strain and temperature distribu-tions are compared in this figure. There was apreferred strain and temperature window for theselection of the process to meet the customer’sproperty requirements. In this example, the hot-die forging appears to generate better strain andtemperature distributions than the mechanicalpress.
16.6.2 Optimization of Microstructure inForging Jet Engine Disks
For manufacturing superalloy disks for jet en-gines, it is extremely important to meet specificgrain size requirements. A disk of fine grain pro-duces excellent tensile and fatigue properties butwith reduction in creep property. A disk with amedium grain size yields balanced tensile andcreep properties. A coarse grain disk providesexcellent creep properties with a lower tensilestrength. Disks used in different sections of a jetengine require different grain sizes and proper-ties. A new disk product can be defined by meet-ing new requirements for distribution of grainsize and related properties.
Process modeling coupled with microstruc-ture modeling was used to develop processes toproduce disks with different grain sizes for a po-tential new product. The specific goal was toproduce Rene 88 (a nickel-base superalloy)disks with coarse (ASTM 6), medium (ASTM8), and fine (ASTM 12) grain sizes. The micro-structure modeling provided possible processwindows for producing each disk with the tar-
geted grain size. The process modeling, usingFEM code DEFORM, provided the actual ther-momechanical histories of each disk. The mi-crostructure model developed for Rene 88 wasintegrated to DEFORM postprocessing module,where the user-defined subroutine can be linkedwith DEFORM. During the postprocessing inDEFORM, the entire thermomechanical historyexperienced in each local point and the startinggrain size at that point were used to calculate thefinal grain size.
With the guidance from the process modelingintegrated with microstructure modeling, after acouple of iterations, processing conditions wereselected for producing disks with the three tar-geted grain sizes: ASTM 6 (coarse), ASTM 8(medium), and ASTM 12 (fine). The actual forg-ing process was performed for a reality check.One forged disk is shown in Fig. 16.8. The grainsizes obtained from three production processesof the disks were actually uniform ASTM 5–6,ASTM 7–9, and ASTM 12–13. Each disk hit itsassigned grain size goal, respectively, and therewere no abnormal grains observed on any of the
Fig. 16.11 Modified blocker design (broken lines) posi-tioned in the open finisher dies (solid lines) [Jen-
kins et al., 1989]
Fig. 16.12 Deformed mesh of the finishing simulation withthe modified blocker design [Jenkins et al.,
1989]
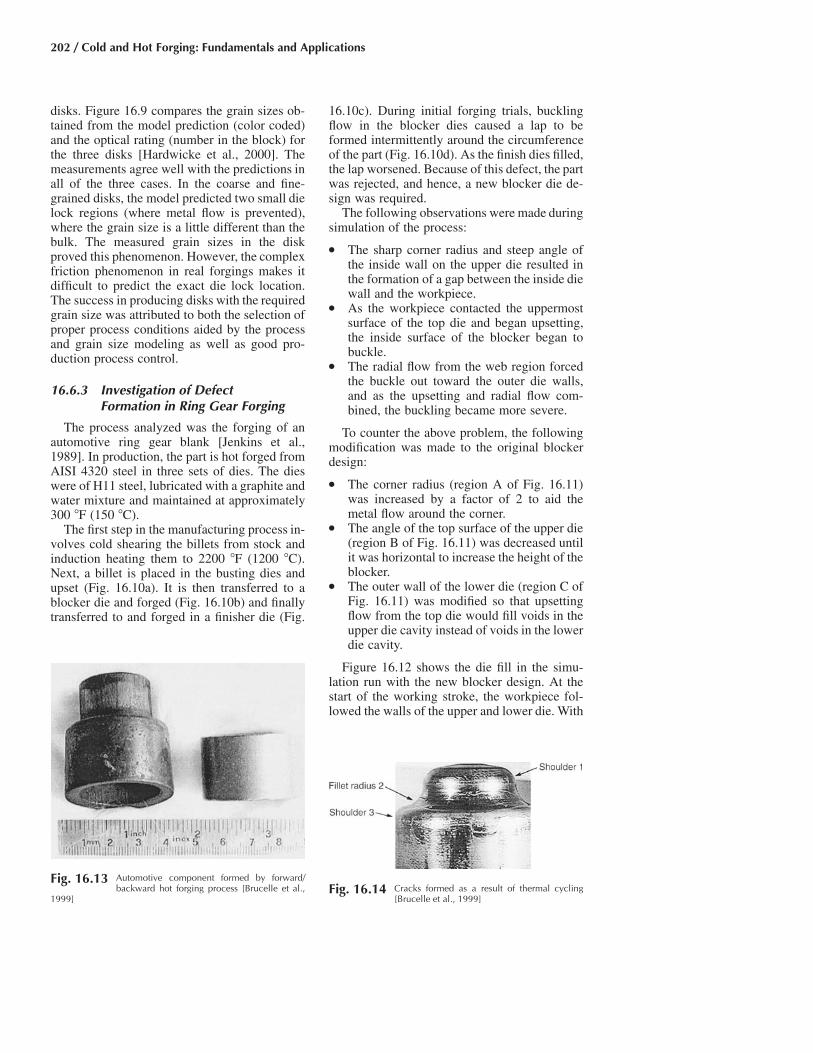
202 / Cold and Hot Forging: Fundamentals and Applications
disks. Figure 16.9 compares the grain sizes ob-tained from the model prediction (color coded)and the optical rating (number in the block) forthe three disks [Hardwicke et al., 2000]. Themeasurements agree well with the predictions inall of the three cases. In the coarse and fine-grained disks, the model predicted two small dielock regions (where metal flow is prevented),where the grain size is a little different than thebulk. The measured grain sizes in the diskproved this phenomenon. However, the complexfriction phenomenon in real forgings makes itdifficult to predict the exact die lock location.The success in producing disks with the requiredgrain size was attributed to both the selection ofproper process conditions aided by the processand grain size modeling as well as good pro-duction process control.
16.6.3 Investigation of DefectFormation in Ring Gear Forging
The process analyzed was the forging of anautomotive ring gear blank [Jenkins et al.,1989]. In production, the part is hot forged fromAISI 4320 steel in three sets of dies. The dieswere of H11 steel, lubricated with a graphite andwater mixture and maintained at approximately300 �F (150 �C).
The first step in the manufacturing process in-volves cold shearing the billets from stock andinduction heating them to 2200 �F (1200 �C).Next, a billet is placed in the busting dies andupset (Fig. 16.10a). It is then transferred to ablocker die and forged (Fig. 16.10b) and finallytransferred to and forged in a finisher die (Fig.
16.10c). During initial forging trials, bucklingflow in the blocker dies caused a lap to beformed intermittently around the circumferenceof the part (Fig. 16.10d). As the finish dies filled,the lap worsened. Because of this defect, the partwas rejected, and hence, a new blocker die de-sign was required.
The following observations were made duringsimulation of the process:
● The sharp corner radius and steep angle ofthe inside wall on the upper die resulted inthe formation of a gap between the inside diewall and the workpiece.
● As the workpiece contacted the uppermostsurface of the top die and began upsetting,the inside surface of the blocker began tobuckle.
● The radial flow from the web region forcedthe buckle out toward the outer die walls,and as the upsetting and radial flow com-bined, the buckling became more severe.
To counter the above problem, the followingmodification was made to the original blockerdesign:
● The corner radius (region A of Fig. 16.11)was increased by a factor of 2 to aid themetal flow around the corner.
● The angle of the top surface of the upper die(region B of Fig. 16.11) was decreased untilit was horizontal to increase the height of theblocker.
● The outer wall of the lower die (region C ofFig. 16.11) was modified so that upsettingflow from the top die would fill voids in theupper die cavity instead of voids in the lowerdie cavity.
Figure 16.12 shows the die fill in the simu-lation run with the new blocker design. At thestart of the working stroke, the workpiece fol-lowed the walls of the upper and lower die. With
Fig. 16.13 Automotive component formed by forward/backward hot forging process [Brucelle et al.,
1999]Fig. 16.14 Cracks formed as a result of thermal cycling
[Brucelle et al., 1999]

Process Modeling in Impression-Die Forging Using Finite-Element Analysis / 203
further deformation, the workpiece contactedthe uppermost wall of the top die, and a gapformed between the inside wall of the top dieand the workpiece. At the final stroke position,a small gap remained along the inside wall ofthe upper die, but no buckle was formed. Figure16.12(a–c) shows the finish die operation withthe modified blocker output. Upon deformation,the upper die pushes the workpiece down untilcontact is made with the outer wall of the lowerdie. With further reduction, the workpiece con-tacts the outer web region of the upper die. Asthe stroke continues, the inside corner fills upwithout any indication of defective flow pat-
terns. With further upsetting of the workpiece,the uppermost fillet of the top die and the outsidefillet of the bottom die continue to fill, and thedie cavity fills up completely. Hence, the resultfrom the finisher simulation indicates that themodified blocker workpiece fills the finisher diewithout defects.
16.6.4 Investigation of Tool Failure
Hot forging is a widely used manufacturingprocess in the automotive industry. High pro-duction rates result in severe thermomechanicalstresses in the dies. Either thermal cracking or
Fig. 16.16 Forging sequence of the aircraft wheel. Part geometry courtesy of Weber Metals Inc.
Fig. 16.15 Forging sequence of the titanium fitting. Part geometry courtesy of Weber Metals Inc.

204 / Cold and Hot Forging: Fundamentals and Applications
wear governs the life of the dies. In the forgingindustry, the tooling cost alone can constitute upto 10% of the total cost of the component.
This example deals with the investigation ofthe effect of thermomechanical stresses on thetool life in the hot extrusion of the automotivecomponent shown in Fig. 16.13 [Brucelle et al.,1999]. The workpiece was from austenitic stain-less steel AISI 316L. The punch was from toolsteel (X85 WCrMoV6-5-4-2). The resultingstresses in this process are a combination of thepurely mechanical stresses due to forging andthe thermomechanical stresses as a result of ther-mal cycling of the punch surface due to the al-ternating hot forging and waiting periods. Thestresses due to thermal cycling were found tocomprise approximately 75% of the total stressfield. This cycling causes tool damage, knownas heat checking. Originally, the punch had tobe changed approximately every 500 cycles dueto cracking as a result of thermal cycling (Fig.16.14). It is a commonly known fact that ge-ometry changes are not the best way to reducethe stress level with regard to thermal stresses.From this study, it was determined that increasedtool life could be achieved by modifying the hotforging process parameters such as billet tem-perature and the forging rate.
Finite-element modeling simulation and ex-perimental work were used to conduct a para-metric study to determine the optimum processparameters to achieve higher life expectancy ofthe tools. This combined numerical and experi-mental approach can be summarized as:
● A two-step numerical simulation:a. Process simulation to determine the
purely mechanical stresses, forging loads,and thermal boundary conditions for thepunch
b. Thermoelastic simulation for thermalstress analysis of the punch
● A two-step experimental stage:a. Metallurgical validation of the constitu-
tive laws of the workpiece materialb. Industrial forging test validation of the
thermal boundary conditions for thepunch
The surface temperatures on the punch are afactor of the heat-transfer coefficient at the tool/workpiece interface. This coefficient is a func-tion of various factors, such as surface topog-raphy, contact pressures, temperature difference,and duration of contact [Snaith et al., 1986].Forging tests were conducted on an industrialpress using a test punch with five thermocou-ples. Several numerical iterations (FEM simu-lations) were performed by using differentheat-transfer coefficients until the calculatedtemperature distribution was in agreement withthat from the experiments.
In order to reduce the thermal stresses, a re-duction of the thermal gradient during forgingmust be obtained. There are two options: 1)modification of process parameters to decreasethe temperature (reduction of the punch speed,thus reducing the flow stress, or decreasingworkpiece temperature, resulting in an increasein flow stress) or 2) use of lubricating/insulating
Fig. 16.17 Sections taken along the fitting to check for die filling at the blocker stage [Shirgaokar et al., 2002]

Process Modeling in Impression-Die Forging Using Finite-Element Analysis / 205
products during forging to reduce the heat trans-fer, which is an empirical approach. The firstoption was selected, since the available presscould handle increased forging loads as a resultof increased flow stress.
A parametric study was conducted to inves-tigate the influence of forging speed and initialworkpiece temperature on the final thermome-chanical stresses. The optimum process param-eters were thus determined, resulting in a 30%decrease in the stresses. Thus, a combination ofprocess simulation and experimental verificationresulted in an increase in the tool life for thepunch in this hot forging process.
16.6.5 Multistage Forging Simulations ofAircraft Components
Multistage forging simulations of two aircraftcomponents (a titanium fitting and an aluminumwheel) were run to study metal flow, tempera-ture distribution, die filling, and die stresses[Shirgaokar et al., 2002]. The commercial FEMcode DEFORM-3D was used for these simula-tions. The two components considered for thisstudy are produced by closed-die forging withflash. Since the parts are forged at elevated tem-peratures, it was necessary to run nonisothermalsimulations. Flash removal between the forgingstages also had to be considered for the simu-lations in order to ensure appropriate materialvolume in the dies for the subsequent forgingstage. Each of the components was forged inthree stages, namely, two blocker stages fol-lowed by a finisher stage. Figures 16.15 and16.16 show the forging sequence of the titaniumfitting and the aluminum wheel, respectively.The results obtained at the end of the simulationswere the effective stress distribution, die filling,metal flow during forging, temperature distri-bution, and strain distribution.
The simulation strategy adopted for the twocomponents was to remove the flash in-betweenstages. This was done by using the Boolean ca-pability of DEFORM, i.e., volume manipula-tion. Die filling was checked by examining vari-ous cross sections along the length of the forging(Fig. 16.17 and 16.18).
The simulations were stopped when die fillingwas achieved, and it was this stage of the simu-lation that was used to determine the stresses inthe dies. In order to reduce computational time,the dies were kept rigid throughout the simula-tion. At the last step, they were changed to elas-tic, and the stresses from the workpiece were
Fig. 16.18 Section A-A of the fitting after the first blockeroperation [Shirgaokar et al., 2002] Fig. 16.19 Forging of AISI 4340 aerospace component

206 / Cold and Hot Forging: Fundamentals and Applications
interpolated onto the dies. The results obtainedfrom the die stress analysis simulations were theeffective stress, the maximum principal stress,and the temperature distribution. Using these re-sults, an effective die design was established.
16.6.6 Precision Forging ofan Aerospace Component
The simulation of a precision-forged aero-space component was conducted as part of astudy to develop guidelines for the design ofprestressing containers for dies used in forgingof complex parts. The simulated part is shownin Fig. 16.19(b). Experiments for this compo-nent were conducted in a previous study con-ducted at Batelle Columbus Laboratories[Becker et al., 1972]. The results from the sim-ulations were compared to the experimentallydetermined loads and were found to be in goodagreement. The simulation results are used toobtain the loading on the die and the punch. Theload on the die is used to perform stress analysisand design a cost-effective prestressing con-tainer. The loading on the punch is used to per-form a stress analysis and correlate the punchdeflection to thickness measurements taken atvarious locations of the forgings.
16.6.7 Die Design for FlashlessForging of Connecting Rods
In conventional hot forging of connectingrods, the material wasted to the flash accounts
for approximately 20 to 40% of the originalworkpiece. It is essential to accurately controlthe volume distribution of the preform to avoidoverloading the dies and in order to fill the cav-ity. It is equally important that the preform besimple enough to be mass-produced. Thus, thedesign of a flashless forging operation is morecomplex than that of a conventional closed-dieforging with flash. In order to accelerate the de-velopment process and reduce prototyping costs,it is essential to conduct a substantial amount ofthe design process on the computer.
The requirements for conducting a successfulflashless forging process are [Vasquez et al.,2000]:
● The volume of the initial preform and thevolume of the die cavity at the final forgingstage must be approximately the same.
● There must be neither a local volume excessnor a shortage, which means that the massdistribution and positioning of the preformmust be precise.
● If there is a compensation space provided inthe die, the real cavity must be filled first.
The 2-D and 3-D FE simulations were usedextensively to analyze and optimize the metalflow in flashless forging of the connecting rodshown in Fig. 16.20(a). In order to verify theapplicability of the simulation results, physicalmodeling experiments were conducted usingplasticine. Figure 16.20(b) shows the initial pre-
Fig. 16.20 Development of the preform shape for flashless forging of a connecting rod [Vasquez et al., 2000]

Process Modeling in Impression-Die Forging Using Finite-Element Analysis / 207
form design along with the final modified pre-form. Finite-element simulation predicted un-derfilling with the initial preform, which wasmodified accordingly to give a defect-free con-necting rod (Fig. 16.21).
16.6.8 Integrated HeatTreatment Analysis
The forming of a medium-carbon manganesesteel bevel gear was analyzed using DEFORM3D. This gear was hot forged with flash. Thesimulation was conducted utilizing rotationalsymmetry. Thus, only 1⁄20th of the total volume
was simulated. Mesh density windows wereused for local mesh refinement during simula-tion. Contours of effective strain (darker areasindicate higher strain) are shown in Fig.16.22(a). After the forging simulation, the geargeometry was modified to account for the flashremoval and drilling the inside diameter.
The modified gear geometry was used to sim-ulate a heat treatment operation. In this simula-tion, the gear was austenized by heating to 1560�F (850 �C) and cooled in 60 s with a heat-transfercoefficient representative of an oil quench. Atime-temperature-transformation diagram formedium-carbon manganese steel determined the
Fig. 16.22 (a) The deformation simulation of a hot forged gear with flash. (b) The volume fraction of martensite (dark is higher) ina steel gear after quenching [Wu et al., 2001]
Fig. 16.21 Deformation sequence for flashless precision forging of a connecting rod [Takemasu et al., 1996]

208 / Cold and Hot Forging: Fundamentals and Applications
diffusion behavior during the austenite-pearlite/bainite transformation, whereas the Magee equa-tion was used to model the martensite response.In Fig. 16.22(b), the volume fraction of marten-site is shown after quenching. The dark regionsrepresent a more complete martensite transfor-mation, and the light areas indicate a mixture ofbainite and pearlite [Wu et al., 2001].
REFERENCES
[Becker et al., 1972]: Becker, J.R., Douglas,J.R., Simonen, F.A., “Effective Tooling De-signs for Production of Precision Forgings,”Technical Report AFML-TR-72-89, BattelleColumbus Laboratories, 1972.
[Brucelle et al., 1999]: Brucelle, O., and Bern-hart, G.,” Methodology for Service Life In-crease of Hot Forging Tools,” Journal of Ma-terials Processing Technology, Vol. 87, 1999,p 237.
[Hardwicke et al., 2000]: Hardwicke, C., andShen, G., “Modeling Grain Size Evolution ofP/M Rene 88DT Forgings,” Advanced Tech-nologies for Superalloy Affordability, K.-M.Chang, S.K. Srivastava, D.U. Furrer, and K.R.Bain, Ed., The Minerals, Metals, and Mate-rials Society, 2000.
[Howson et al., 1989]: Howson, T.E., and Del-gado, H.E., “Computer Modeling Metal Flowin Forging,” JOM, Feb. 1989, p 32–34.
[Jenkins et al., 1989]: Jenkins, B.L., Oh, S.I.,Altan, T., “Investigation of Defect Formationin a 3-Station Closed Die Forging Operation,”CIRP Annals, Vol. 381, p 243.
[Knoerr et al., 1992]: Knoerr, M., Lee, J., Al-tan, T., “Application of the 2D Finite ElementMethod to Simulation of Various FormingProcesses,” Journal of Materials ProcessingTechnology, Vol. 33, 1992, p 31.
[Ngaile et al., 2002]: Ngaile, G., and Altan, T.,“Simulations of Manufacturing Processes:Past, Present and Future,” Proceedings of theSeventh ICTP, Oct 2002, Japan, p 271.
[Oh, 1982]: Oh, S.I., “Finite Element Analysisof Metal Forming Problem with ArbitrarilyShaped Dies,” Int. J. Mech. Science, Vol. 24(No. 4) 1982, p 479.
[Sellars, 1990]: Sellars, C.M., “Modeling Mi-crostructural Development during Hot Roll-ing,” Materials Science and Technology, Vol.6, 1990, p 1072.
[SFTC, 2002]: DEFORM 7.2 User Manuals,Scientific Forming Technologies Corporation,Columbus, OH, 2002.
[Shen et al., 1993]: Shen, G., Shivpuri, R., Sem-iatin, S.L., Lee, J.Y., “Investigation of Micro-structure and Thermomechanical History inthe Hammer Forging of an Incoloy 901 Disk,”Annals of the CIRP, Vol. 42/1, 1993, p 343–346.
[Shen et al., 2000]: Shen, G., “MicrostructureModeling of Forged Components of IngotMetallurgy Nickel Based Superalloys,” Ad-vanced Technologies for Superalloy Afforda-bility, K.M. Chang, S.K. Srivastava, D.U.Furrer, and K.R. Bain, Ed., TMS, 2000, p223–231.
[Shen et al., 2001]: Shen, G., Denkenberger, R.,Furrer, D., “Aerospace Forging—Process andModeling,” Materials Design Approachesand Experiences, J.C. Zhao, M. Fahrmann,and T.M. Pollock, Ed., TMS, 2001, p 347–357.
[Shirgaokar et al., 2002]: Shirgaokar, M.,Ngaile, G., Altan, T., “Multi-Stage ForgingSimulations of Aircraft Components,” ERC/NSM–02-R-84, Engineering Research Centerfor Net Shape Manufacturing, 2002.
[Snaith et al., 1986]: Snaith, B., Probert, S.D.,O’Callaghan, P.W., “Thermal Resistances ofPressed Contacts,” Appl. Energy, Vol. 221986, p 31–84.
[Takemasu et al., 1996]: Takemasu, T., Vas-quez, V., Painter, B., Altan, T., “Investigationof Metal Flow and Preform Optimization inFlashless Forging of a Connecting Rod,”Journal of Materials Processing Technology,Vol. 59, 1996, p 95.
[Vasquez et al., 1999]: Vasquez, V., Walters, J.,and Altan, T., “Forging Process Simulation—State of the Art in USA,” Proceedings of theConference on New Developments in ForgingTechnology, Stuttgart, Germany, May 19–20,1999.
[Vasquez et al., 2000]: Vasquez, V., and Altan,T., “Die Design for Flashless Forging of Com-plex Parts,” Journal of Materials ProcessingTechnology, Vol. 98, 2000, p. 81.
[Wu et al., 1992]: Wu, W.T., Oh, S.I., Altan, T.,Miller, R.A., “Optimal Mesh Density Deter-mination for the FEM Simulation of FormingProcesses,” NUMIFORM ’92, Sept 14–18,1992, France.
[Wu et al., 1996]: Wu, W.T., Li, G.J., Arvind,A., Tang, G.P., “Development of a Three Di-mensional Finite Element Based ProcessSimulation Tool for the Metal Forming In-dustry,” Proceedings of the Third BiennialJoint Conference on Engineering Systems

Process Modeling in Impression-Die Forging Using Finite-Element Analysis / 209
Design and Analysis, Montpellier, France,1996.
[Wu et al., 2001]: Wu, W.T., Oh, S.I., Arimoto,K., “Recent Developments in Process Simu-lation for Bulk Forming Processes,” Journalof Materials Processing Technology, Vol. 111,2001, p 2–9.
SELECTED REFERENCES
● [Devadas et al., 1991]: Devadas, C., Sa-marasekera, I.V., Hawbolt, E.B., “The Ther-mal and Metallurgical State of Strip duringHot Rolling: Part III, Microstructural Evo-lution,” Met. Trans. A, Vol. 12, 1991, p 335–349.
● [Shen et al., 1989]: Shen, G., Im, Y.T., Al-tan, T., “Effect of Flash Dimensions and Bil-let Size in Closed-Die Forging of an Alu-minum Alloy Part,” Transactions of theNAMRI of SME, Society of ManufacturingEngineers, 1989, p 34–40.
● [Shen et al., 1995]: Shen, G., Semiatin, S.L.,Shivpuri, R., “Modeling Microstructural De-velopment during the Forging of Waspaloy,”Met. Trans. A, 26, 1995, p 1795–1802.
● [Shen et al., 2001]: Shen, G., Kahlke, D.,Denkenberger, R., Furrer, D., “Advances inthe State-of-the-Art of Hammer Forged Al-loy 718 Aerospace Components,” Superal-loys 718, 625, 706 and Various Derivatives,E.A. Loria, Ed., 2001, p 237–247.
● [Vasquez et al., 1996]: Vasquez, V., and Al-tan, T., “Investigation of Metal Flow andPreform Optimization in Flashless Forgingof a Connecting Rod,” Journal of MaterialsProcessing Technology, Vol. 59, 1996, p 95.
● [Walters et al., 1998]: Walters, J., Wu, W.T.,Arvind, A., Guoji, L., Lambert, D., Tang,J.P., “Recent Developments of ProcessSimulation for Industrial Applications,” Pro-ceedings of the Fourth International Confer-ence on Precision Forging—Cold, Warm andHot Forging, Oct 12–14, 1998, Columbus,Ohio.
● [Wu et al., 1985]: Wu, W.T., and Oh, S.I.,“ALPID—A General Purpose FEM Codefor Simulation of Non-isothermal ForgingProcesses,” Proceedings of North AmericanManufacturing Research Conference(NAMRC) XIII, Berkeley, CA, 1985, p 449–460.
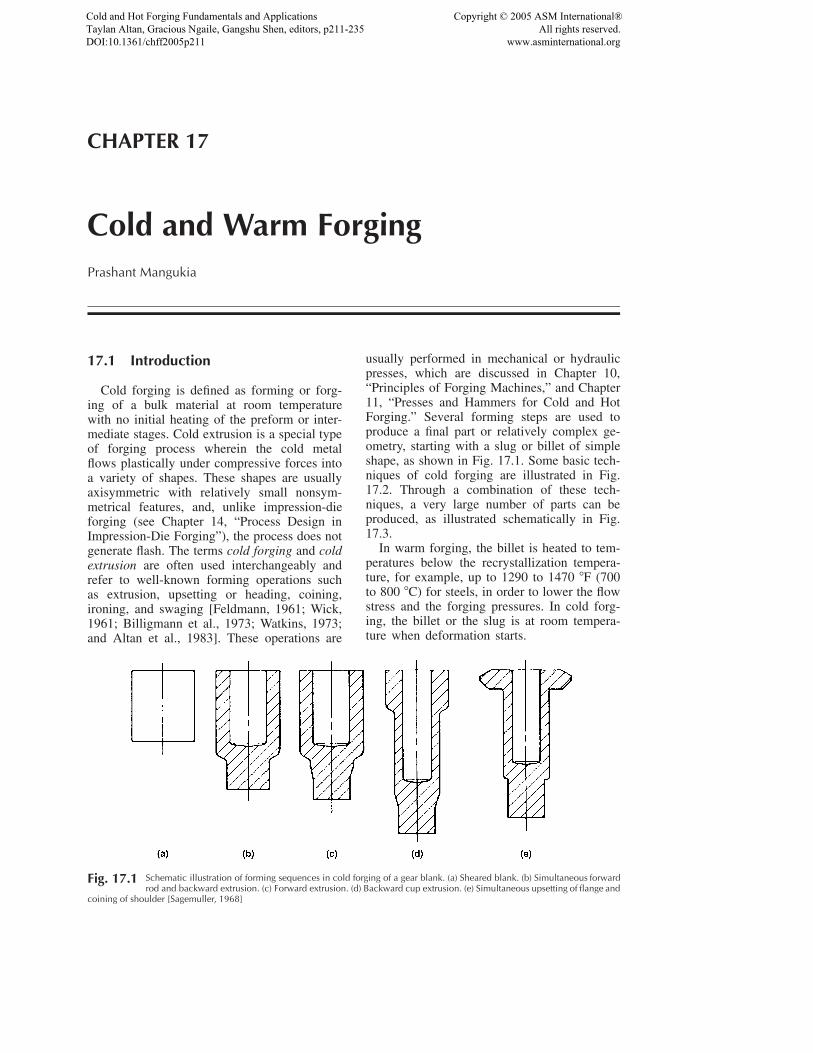
CHAPTER 17
Cold and Warm ForgingPrashant Mangukia
Fig. 17.1 Schematic illustration of forming sequences in cold forging of a gear blank. (a) Sheared blank. (b) Simultaneous forwardrod and backward extrusion. (c) Forward extrusion. (d) Backward cup extrusion. (e) Simultaneous upsetting of flange and
coining of shoulder [Sagemuller, 1968]
17.1 Introduction
Cold forging is defined as forming or forg-ing of a bulk material at room temperaturewith no initial heating of the preform or inter-mediate stages. Cold extrusion is a special typeof forging process wherein the cold metalflows plastically under compressive forces intoa variety of shapes. These shapes are usuallyaxisymmetric with relatively small nonsym-metrical features, and, unlike impression-dieforging (see Chapter 14, “Process Design inImpression-Die Forging”), the process does notgenerate flash. The terms cold forging and coldextrusion are often used interchangeably andrefer to well-known forming operations suchas extrusion, upsetting or heading, coining,ironing, and swaging [Feldmann, 1961; Wick,1961; Billigmann et al., 1973; Watkins, 1973;and Altan et al., 1983]. These operations are
usually performed in mechanical or hydraulicpresses, which are discussed in Chapter 10,“Principles of Forging Machines,” and Chapter11, “Presses and Hammers for Cold and HotForging.” Several forming steps are used toproduce a final part or relatively complex ge-ometry, starting with a slug or billet of simpleshape, as shown in Fig. 17.1. Some basic tech-niques of cold forging are illustrated in Fig.17.2. Through a combination of these tech-niques, a very large number of parts can beproduced, as illustrated schematically in Fig.17.3.
In warm forging, the billet is heated to tem-peratures below the recrystallization tempera-ture, for example, up to 1290 to 1470 �F (700to 800 �C) for steels, in order to lower the flowstress and the forging pressures. In cold forg-ing, the billet or the slug is at room tempera-ture when deformation starts.
Cold and Hot Forging Fundamentals and ApplicationsTaylan Altan, Gracious Ngaile, Gangshu Shen, editors, p211-235 DOI:10.1361/chff2005p211
Copyright © 2005 ASM International® All rights reserved. www.asminternational.org
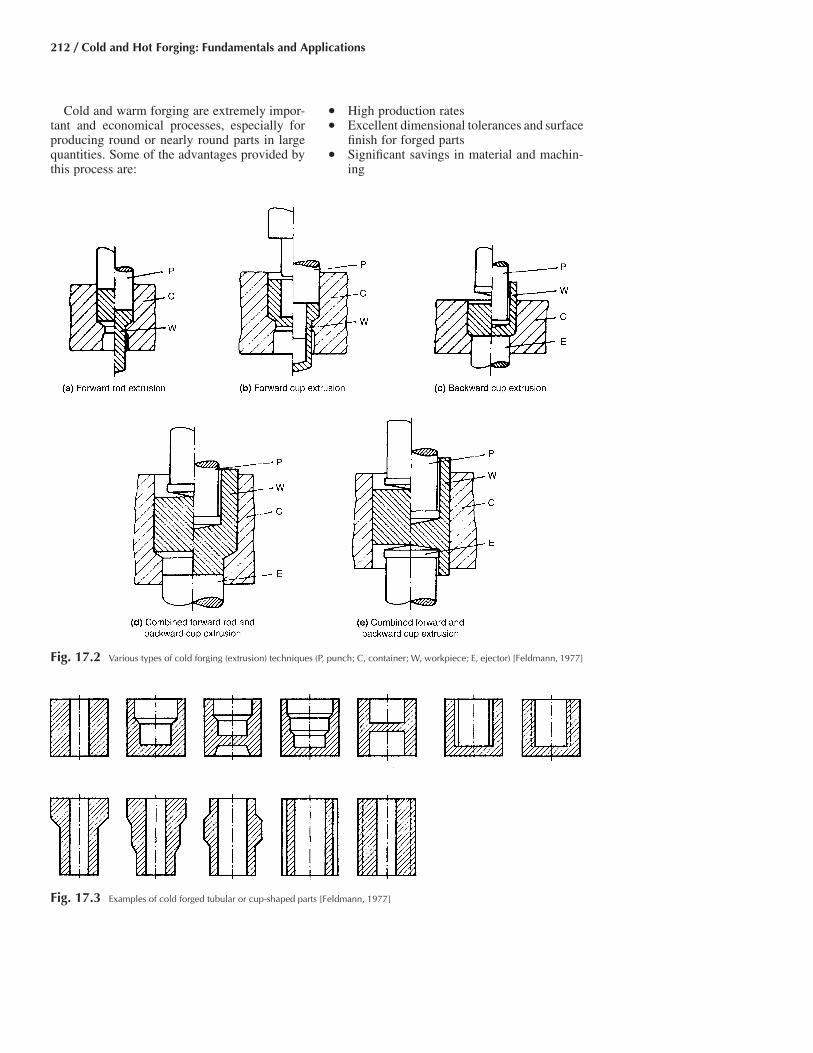
212 / Cold and Hot Forging: Fundamentals and Applications
Fig. 17.3 Examples of cold forged tubular or cup-shaped parts [Feldmann, 1977]
Fig. 17.2 Various types of cold forging (extrusion) techniques (P, punch; C, container; W, workpiece; E, ejector) [Feldmann, 1977]
Cold and warm forging are extremely impor-tant and economical processes, especially forproducing round or nearly round parts in largequantities. Some of the advantages provided bythis process are:
● High production rates● Excellent dimensional tolerances and surface
finish for forged parts● Significant savings in material and machin-
ing
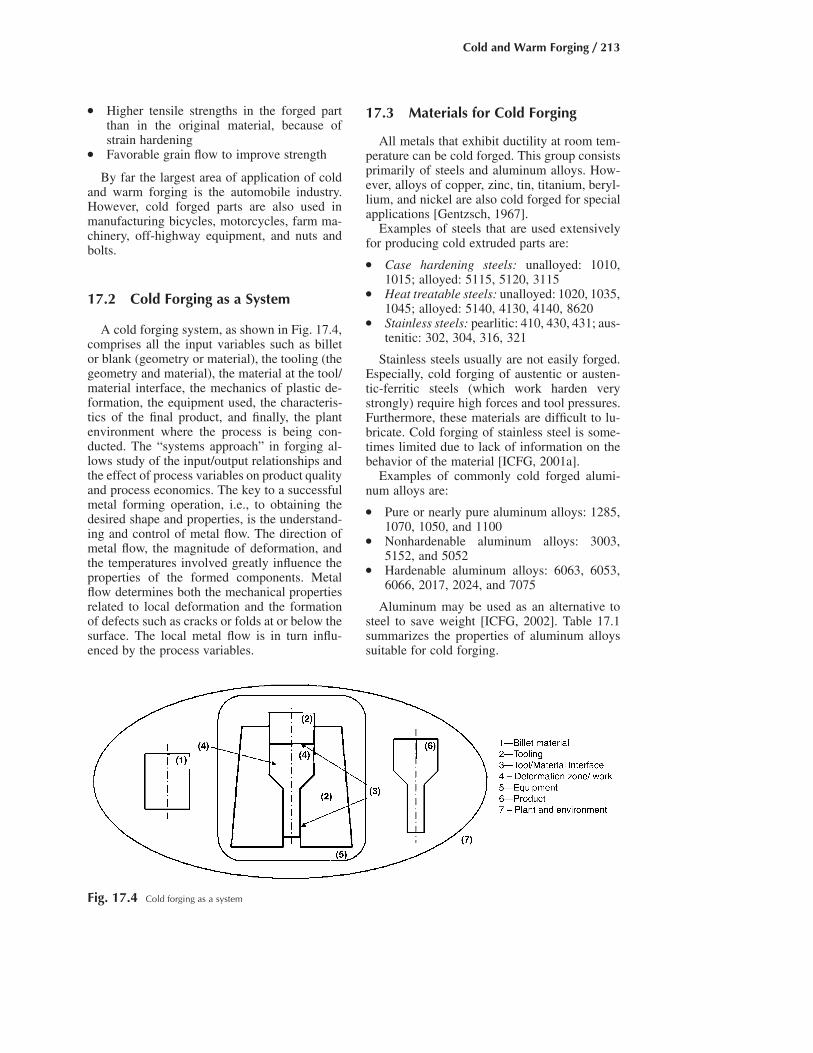
Cold and Warm Forging / 213
Fig. 17.4 Cold forging as a system
● Higher tensile strengths in the forged partthan in the original material, because ofstrain hardening
● Favorable grain flow to improve strength
By far the largest area of application of coldand warm forging is the automobile industry.However, cold forged parts are also used inmanufacturing bicycles, motorcycles, farm ma-chinery, off-highway equipment, and nuts andbolts.
17.2 Cold Forging as a System
A cold forging system, as shown in Fig. 17.4,comprises all the input variables such as billetor blank (geometry or material), the tooling (thegeometry and material), the material at the tool/material interface, the mechanics of plastic de-formation, the equipment used, the characteris-tics of the final product, and finally, the plantenvironment where the process is being con-ducted. The “systems approach” in forging al-lows study of the input/output relationships andthe effect of process variables on product qualityand process economics. The key to a successfulmetal forming operation, i.e., to obtaining thedesired shape and properties, is the understand-ing and control of metal flow. The direction ofmetal flow, the magnitude of deformation, andthe temperatures involved greatly influence theproperties of the formed components. Metalflow determines both the mechanical propertiesrelated to local deformation and the formationof defects such as cracks or folds at or below thesurface. The local metal flow is in turn influ-enced by the process variables.
17.3 Materials for Cold Forging
All metals that exhibit ductility at room tem-perature can be cold forged. This group consistsprimarily of steels and aluminum alloys. How-ever, alloys of copper, zinc, tin, titanium, beryl-lium, and nickel are also cold forged for specialapplications [Gentzsch, 1967].
Examples of steels that are used extensivelyfor producing cold extruded parts are:
● Case hardening steels: unalloyed: 1010,1015; alloyed: 5115, 5120, 3115
● Heat treatable steels: unalloyed: 1020, 1035,1045; alloyed: 5140, 4130, 4140, 8620
● Stainless steels: pearlitic: 410, 430, 431; aus-tenitic: 302, 304, 316, 321
Stainless steels usually are not easily forged.Especially, cold forging of austentic or austen-tic-ferritic steels (which work harden verystrongly) require high forces and tool pressures.Furthermore, these materials are difficult to lu-bricate. Cold forging of stainless steel is some-times limited due to lack of information on thebehavior of the material [ICFG, 2001a].
Examples of commonly cold forged alumi-num alloys are:
● Pure or nearly pure aluminum alloys: 1285,1070, 1050, and 1100
● Nonhardenable aluminum alloys: 3003,5152, and 5052
● Hardenable aluminum alloys: 6063, 6053,6066, 2017, 2024, and 7075
Aluminum may be used as an alternative tosteel to save weight [ICFG, 2002]. Table 17.1summarizes the properties of aluminum alloyssuitable for cold forging.

214 / Cold and Hot Forging: Fundamentals and Applications
Table 17.2 Typical procedure for phosphatingand lubricating billets of carbon and low-alloysteels for cold extrusion
1. Degrease and clean slugs in a hot alkaline solution for 1 to 5min at 151 to 203 �F (66 to 95 �C).
2. Rinse in cold water.3. Remove scale, usually by pickling.4. Rinse in cold water.5. Rinse in neutralizing solution if a pickling process was used.6. Dip in a zinc phosphate solution (usually of a proprietary type)
for approximately 5 min at 180 to 203 �F (82 to 95 �C) todevelop a uniform coating of appropriate thickness.
7. Rinse in cold water; neutralize if necessary.8. Lubricate the slugs, usually with stearate soap but sometimes
with other types of lubricants.9. Air dry the slugs to obtain a thin, adherent coating of lubricant
adsorbed on the zinc phosphate coating.
Table 17.1 Properties of aluminum alloys suitable for cold forging [ICFG, 2002]
Aluminum alloy Heat treatable Strength Elongation Corrosion resistance Machinability Weldability
1050 No * **** **** * ****3103 No ** * **** * ****5056 No *** ** **** ** **2014 Yes *** ** * *** *6061 Yes *** *** *** ** ****7075 Yes **** ** ** *** *
Note: * � poor; **** � best
Materials for cold forging are supplied asrolled or drawn rod or wire as well as in the formof sheared or sawed-off billets. The dimensions,weight, and surface finish of the sheared (orsawed) billet or preform must be closely con-trolled in order to maintain dimensional toler-ances in the cold forged part and to avoid ex-cessive loading of the forging press and tooling.
17.4 Billet Preparation andLubrication in ColdForging of Steel and Aluminum
By far, the largest area of application for coldforging is the production of steel parts. Coldforging plants usually receive small-diametermaterial in coils and large-diameter stock inbars. In very large-volume production, horizon-tal mechanical presses, called headers or upset-ters, are used. The coil, coated with lubricant, isfed into the machine, where it is sheared andforged in several steps. In forging of relativelysmall production lots, vertical presses are used,and individual billets (after being lubricated) arefed into the first die station. Billet volume orweight is closely controlled, and it is desirableto obtain square billet faces during shearing orsawing [Herbst, 1967].
In cold forging, the lubricant is required towithstand high pressures, on the order of 280 ksi(1930 Mpa) in extrusion of steel, so as to avoidmetal-to-metal contact between the tool and theextruded material. In cold forging of low-carbonand low-alloy steels, it is accepted practice tocoat the surface of the billet or coil with a lu-bricant carrier. This zinc phosphate coating pro-vides a good substrate for lubricants that with-stand high forming pressures. The phosphatingand lubricating steps given in Table 17.2 are al-most universally employed for cold extrusion ofsteels. The success of the zinc phosphatizingtreatment is influenced by the composition of thesteel, especially the chromium content. Conse-
quently, special procedures and other conversioncoatings, such as oxalates, are preferred for aus-tenitic stainless steels. Stearate-type soaps,which adhere tenaciously to the phosphate coat-ings, are commonly used as lubricants for forg-ing and extrusion of steel at room temperature.Solid lubricants such as MoS2 and graphite haveproved to be beneficial under severe forgingconditions, where surface generation and form-ing pressures are large [Doehring, 1972].
Lubrication for cold forging of aluminummay be divided into two categories:
● Lubrication without conversion coatings● Lubrication with a conversion coating
The lubricants applied without conversioncoatings are oil, grease, or alkali stearates (es-pecially zinc stearate). The most common con-version coatings are calcium aluminate and alu-minum fluoride coatings. In both cases, theconversion coating is combined with a lubricant,normally zinc stearate. It is essential that the slugsurfaces are completely clean when applying theconversion coating. This requires careful de-greasing and pickling of the surface before coat-ing [Bay, 1997, and Bay, 1994].
The types of alloys and the surface expansionhave a major influence on the choice of the lu-
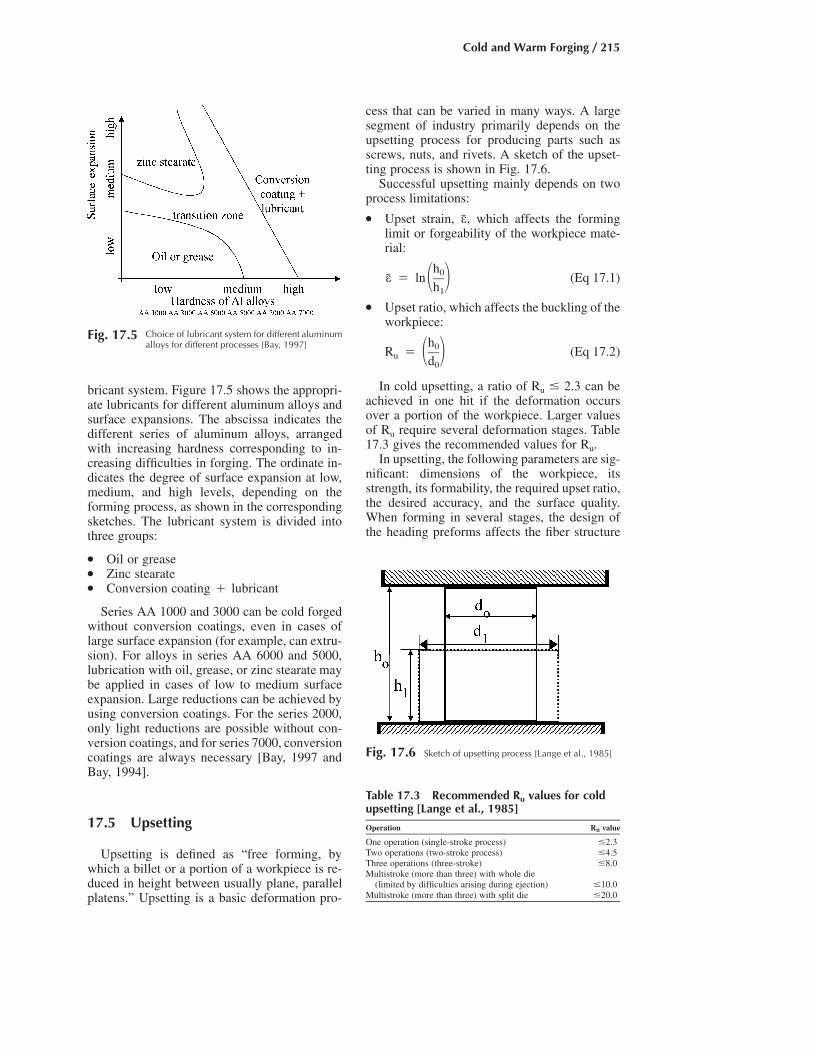
Cold and Warm Forging / 215
Table 17.3 Recommended Ru values for coldupsetting [Lange et al., 1985]
Operation Ru value
One operation (single-stroke process) �2.3Two operations (two-stroke process) �4.5Three operations (three-stroke) �8.0Multistroke (more than three) with whole die
(limited by difficulties arising during ejection) �10.0Multistroke (more than three) with split die �20.0
Fig. 17.6 Sketch of upsetting process [Lange et al., 1985]
Fig. 17.5 Choice of lubricant system for different aluminumalloys for different processes [Bay, 1997]
bricant system. Figure 17.5 shows the appropri-ate lubricants for different aluminum alloys andsurface expansions. The abscissa indicates thedifferent series of aluminum alloys, arrangedwith increasing hardness corresponding to in-creasing difficulties in forging. The ordinate in-dicates the degree of surface expansion at low,medium, and high levels, depending on theforming process, as shown in the correspondingsketches. The lubricant system is divided intothree groups:
● Oil or grease● Zinc stearate● Conversion coating � lubricant
Series AA 1000 and 3000 can be cold forgedwithout conversion coatings, even in cases oflarge surface expansion (for example, can extru-sion). For alloys in series AA 6000 and 5000,lubrication with oil, grease, or zinc stearate maybe applied in cases of low to medium surfaceexpansion. Large reductions can be achieved byusing conversion coatings. For the series 2000,only light reductions are possible without con-version coatings, and for series 7000, conversioncoatings are always necessary [Bay, 1997 andBay, 1994].
17.5 Upsetting
Upsetting is defined as “free forming, bywhich a billet or a portion of a workpiece is re-duced in height between usually plane, parallelplatens.” Upsetting is a basic deformation pro-
cess that can be varied in many ways. A largesegment of industry primarily depends on theupsetting process for producing parts such asscrews, nuts, and rivets. A sketch of the upset-ting process is shown in Fig. 17.6.
Successful upsetting mainly depends on twoprocess limitations:
● Upset strain, which affects the forminge,limit or forgeability of the workpiece mate-rial:
h0e � ln (Eq 17.1)� �h1
● Upset ratio, which affects the buckling of theworkpiece:
h0R � (Eq 17.2)u � �d0
In cold upsetting, a ratio of Ru � 2.3 can beachieved in one hit if the deformation occursover a portion of the workpiece. Larger valuesof Ru require several deformation stages. Table17.3 gives the recommended values for Ru.
In upsetting, the following parameters are sig-nificant: dimensions of the workpiece, itsstrength, its formability, the required upset ratio,the desired accuracy, and the surface quality.When forming in several stages, the design ofthe heading preforms affects the fiber structure

216 / Cold and Hot Forging: Fundamentals and Applications
Fig. 17.7 Different techniques for upsetting. (a) Unsup-ported working stock. (b) Stock supported in die
impression. (c) Stock supported in heading tool recess. (d) Stocksupported in heading tool recess and die impression [ASM, 1970]
of the final shape. Heading preforms are to beshaped such that the workpiece is guided cor-rectly to avoid buckling and folding [Lange etal., 1985].
Figure 17.7 illustrates different techniques forupsetting. The limits on the length of the unsup-ported stock may vary, depending on the type ofthe heading die and the flatness and squarenessof the end surface of the bar. Upsetting with ta-pered dies (Fig. 17.7c) is commonly used for theintermediate stages of a multistage upsettingprocess, because it allows greater upset ratiosthan cylindrical upsetting; thus, the number ofstages required may be reduced. In order to ap-ply the above rules to taper upsetting, an “equiv-alent diameter” must be calculated. The equiv-alent diameter (dm) is calculated as:
1/44 4d � d1 2d � (Eq 17.3)m � �2
where d1 and d2 are diameters of the tapered diecavity. This design method allows greater ma-terial to be gathered in a single stage for taperupsetting, and it corresponds to the conditionsfound in practice.
17.6 Load Estimation forFlashless Closed-Die Upsetting
In cold forming operations, the two primaryconsiderations in determining process feasibilityare the load and energy required to form the part.These two factors determine the press size andthe maximum production rate. It is important tocorrectly estimate the forming load for each diestation. Oversizing a header will result in un-necessarily large machine cost, lower productionrate, and higher part costs. Undersizing a headerwill lead to overloading the press, resulting infrequent downtime for maintenance and repairs[Altan et al., 1996]. The tooling used in this pro-cess is shown in Fig. 17.8. It consists of a flat-faced punch and a simple round die cavity. Atthe beginning of the stroke, the billet is cylin-drical and undergoes a process similar to anopen upset until it makes contact with the diecasing (Fig. 17.8a). At this point, the formingload increases dramatically as the corner fillingoccurs, as seen in the load-stroke curve (Fig.17.8b). The load required to fill the cavity is ex-tremely high (approximately 3 to 10 times theload necessary for forging the same part in thecavity without corner filling) [Altan et al., 1982,and Lange et al., 1985].
The amount of corner filling is expressed asthe ratio of the length of die wall in contact withthe deformed billet to the length of the die walland is termed in percentage of die wall contact(%DWC).
Slab method analysis is used to predict theforging load required, based on material prop-erties and process geometries. The maximumtooling load, L, based on geometry and materialproperties is [Altan et al., 1996]:
p md12L � d r 1 � (Eq 17.4a)1 f � �4 3 3h� 1
where L � maximum load on toolingd1 � final upset head diameterrf � material flow stress � � rf �nKe
K(ln h0/h1)n

Cold and Warm Forging / 217
Fig. 17.8 Tooling for flashless cold upsetting process and load-stroke curve [Altan et al., 1996]
m � shear friction factorh1 � final height of the upset headh0 � initial height of the billetK � strength coefficientn � material strain-hardening exponent
Equation 17.4(a) needs to be modified forclosed-die upsetting. Since the material flow isrestricted by the cavity in the closed-die upset,deformation is less than in the open upset.Hence, a modification of the traditional slabmethod is made to account for the reduced de-formation zone to predict the forging load.
Equation 17.4(a) is modified and presented as[Altan et al., 1996]:
p md12L � d r 1 � (Eq 17.4b)1 f � �4 3 32h�� 1
where, in addition to the symbols given above:
rf � material flow stress � � rf �nKeK(ln n2h�/2h�)0 1
h�1 � final height of layer 1 (or 3), as shown inFig. 17.9
h�0 � initial height corresponding to finalheight of layer 1 (or 3), as shown inFig. 17.9
To use the modified slab analysis, the initialhead diameter and the head height must beknown. Also, the final head diameter, height,and amount of die wall contact must be known.The final slab height, is found by using:h�,1
100% � %DWCh� � h (Eq 17.4c)1 1� �2
where h1 and are the same as in Eq 17.4(a)h�1and (b), respectively.
To find the corresponding initial slab height,, the volume constancy principle is used:h�0
4h� � V (Eq 17.4d)0 4pd0
The validity of Eq 17.4 was verified by com-paring the predictions with experiments [Altanet al., 1996].
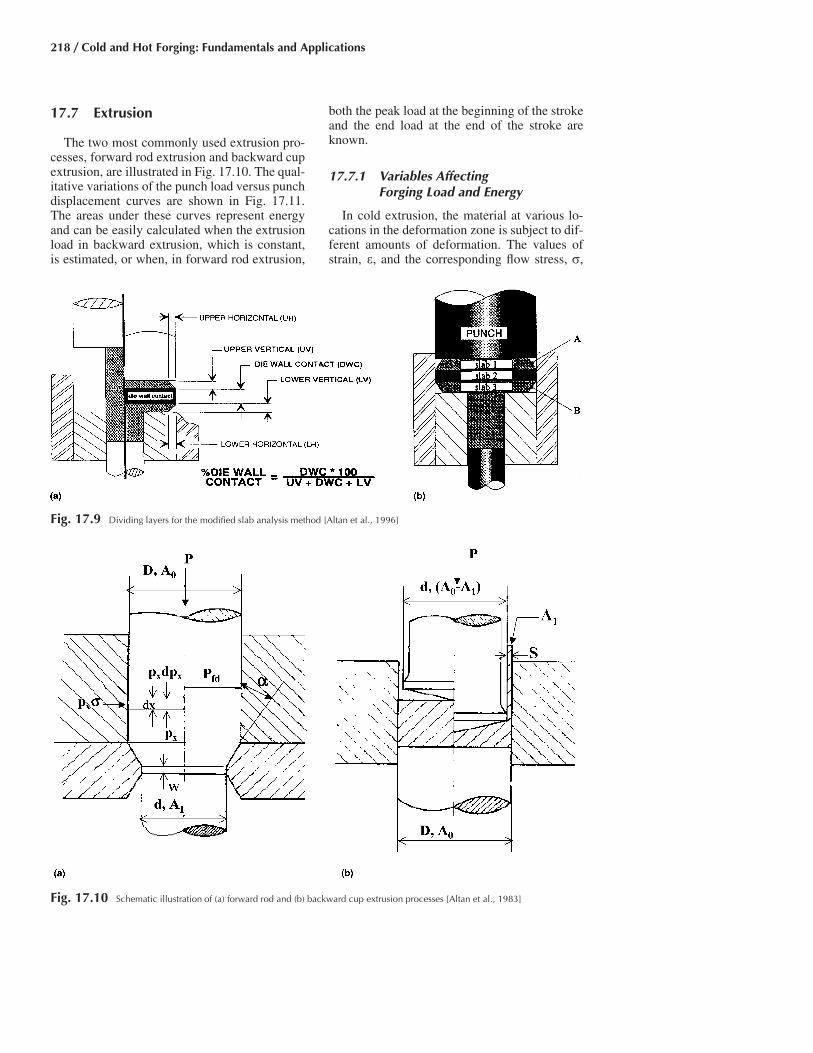
218 / Cold and Hot Forging: Fundamentals and Applications
Fig. 17.9 Dividing layers for the modified slab analysis method [Altan et al., 1996]
17.7 Extrusion
The two most commonly used extrusion pro-cesses, forward rod extrusion and backward cupextrusion, are illustrated in Fig. 17.10. The qual-itative variations of the punch load versus punchdisplacement curves are shown in Fig. 17.11.The areas under these curves represent energyand can be easily calculated when the extrusionload in backward extrusion, which is constant,is estimated, or when, in forward rod extrusion,
both the peak load at the beginning of the strokeand the end load at the end of the stroke areknown.
17.7.1 Variables AffectingForging Load and Energy
In cold extrusion, the material at various lo-cations in the deformation zone is subject to dif-ferent amounts of deformation. The values ofstrain, e, and the corresponding flow stress, r,
Fig. 17.10 Schematic illustration of (a) forward rod and (b) backward cup extrusion processes [Altan et al., 1983]
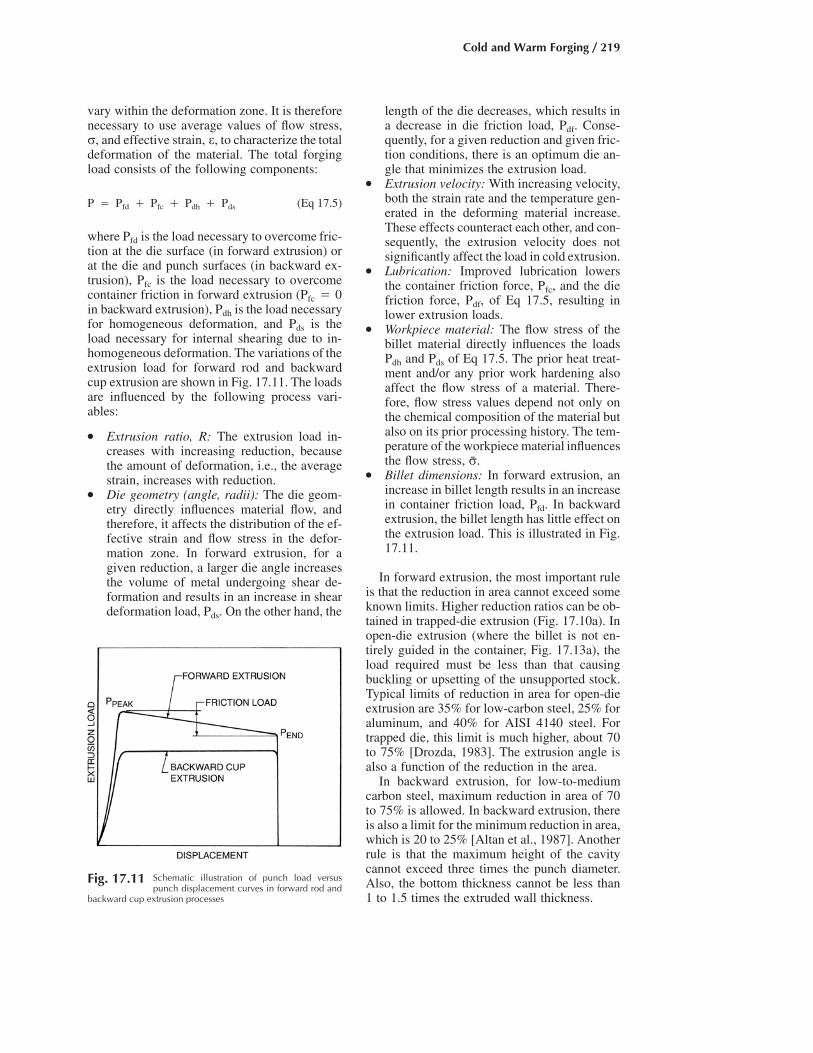
Cold and Warm Forging / 219
Fig. 17.11 Schematic illustration of punch load versuspunch displacement curves in forward rod and
backward cup extrusion processes
vary within the deformation zone. It is thereforenecessary to use average values of flow stress,r, and effective strain, e, to characterize the totaldeformation of the material. The total forgingload consists of the following components:
P � P � P � P � P (Eq 17.5)fd fc dh ds
where Pfd is the load necessary to overcome fric-tion at the die surface (in forward extrusion) orat the die and punch surfaces (in backward ex-trusion), Pfc is the load necessary to overcomecontainer friction in forward extrusion (Pfc � 0in backward extrusion), Pdh is the load necessaryfor homogeneous deformation, and Pds is theload necessary for internal shearing due to in-homogeneous deformation. The variations of theextrusion load for forward rod and backwardcup extrusion are shown in Fig. 17.11. The loadsare influenced by the following process vari-ables:
● Extrusion ratio, R: The extrusion load in-creases with increasing reduction, becausethe amount of deformation, i.e., the averagestrain, increases with reduction.
● Die geometry (angle, radii): The die geom-etry directly influences material flow, andtherefore, it affects the distribution of the ef-fective strain and flow stress in the defor-mation zone. In forward extrusion, for agiven reduction, a larger die angle increasesthe volume of metal undergoing shear de-formation and results in an increase in sheardeformation load, Pds. On the other hand, the
length of the die decreases, which results ina decrease in die friction load, Pdf. Conse-quently, for a given reduction and given fric-tion conditions, there is an optimum die an-gle that minimizes the extrusion load.
● Extrusion velocity: With increasing velocity,both the strain rate and the temperature gen-erated in the deforming material increase.These effects counteract each other, and con-sequently, the extrusion velocity does notsignificantly affect the load in cold extrusion.
● Lubrication: Improved lubrication lowersthe container friction force, Pfc, and the diefriction force, Pdf, of Eq 17.5, resulting inlower extrusion loads.
● Workpiece material: The flow stress of thebillet material directly influences the loadsPdh and Pds of Eq 17.5. The prior heat treat-ment and/or any prior work hardening alsoaffect the flow stress of a material. There-fore, flow stress values depend not only onthe chemical composition of the material butalso on its prior processing history. The tem-perature of the workpiece material influencesthe flow stress, .r
● Billet dimensions: In forward extrusion, anincrease in billet length results in an increasein container friction load, Pfd. In backwardextrusion, the billet length has little effect onthe extrusion load. This is illustrated in Fig.17.11.
In forward extrusion, the most important ruleis that the reduction in area cannot exceed someknown limits. Higher reduction ratios can be ob-tained in trapped-die extrusion (Fig. 17.10a). Inopen-die extrusion (where the billet is not en-tirely guided in the container, Fig. 17.13a), theload required must be less than that causingbuckling or upsetting of the unsupported stock.Typical limits of reduction in area for open-dieextrusion are 35% for low-carbon steel, 25% foraluminum, and 40% for AISI 4140 steel. Fortrapped die, this limit is much higher, about 70to 75% [Drozda, 1983]. The extrusion angle isalso a function of the reduction in the area.
In backward extrusion, for low-to-mediumcarbon steel, maximum reduction in area of 70to 75% is allowed. In backward extrusion, thereis also a limit for the minimum reduction in area,which is 20 to 25% [Altan et al., 1987]. Anotherrule is that the maximum height of the cavitycannot exceed three times the punch diameter.Also, the bottom thickness cannot be less than1 to 1.5 times the extruded wall thickness.
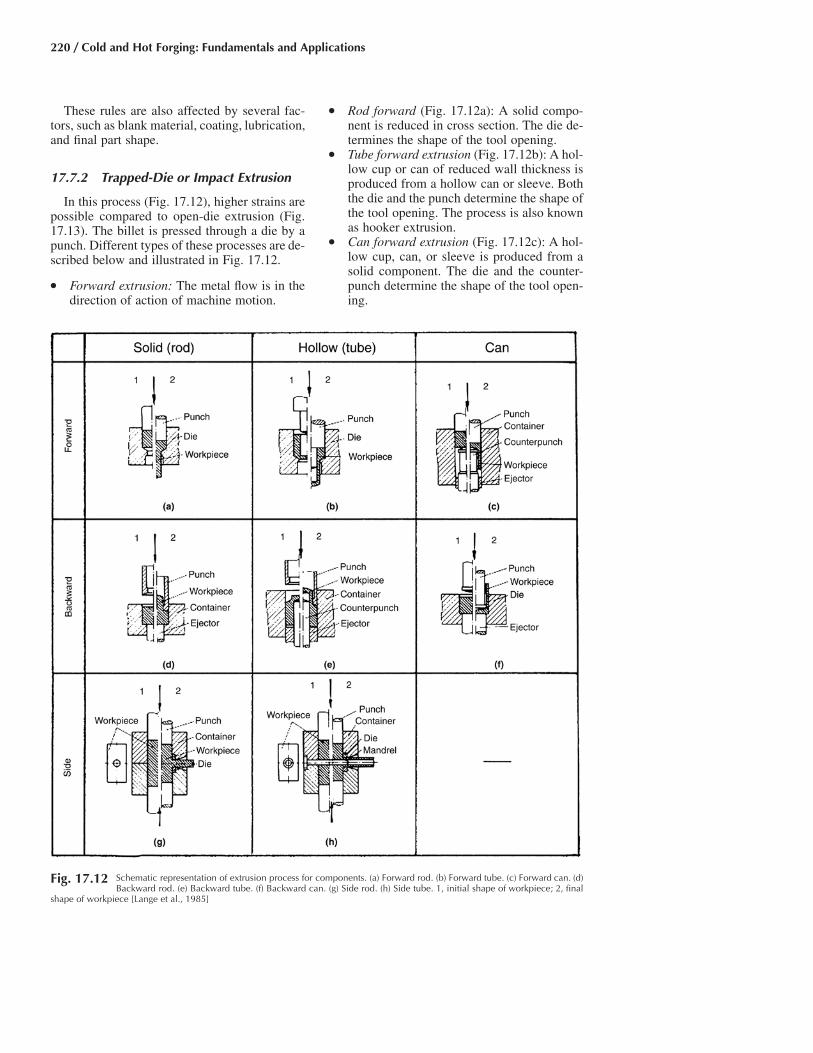
220 / Cold and Hot Forging: Fundamentals and Applications
Fig. 17.12 Schematic representation of extrusion process for components. (a) Forward rod. (b) Forward tube. (c) Forward can. (d)Backward rod. (e) Backward tube. (f) Backward can. (g) Side rod. (h) Side tube. 1, initial shape of workpiece; 2, final
shape of workpiece [Lange et al., 1985]
These rules are also affected by several fac-tors, such as blank material, coating, lubrication,and final part shape.
17.7.2 Trapped-Die or Impact Extrusion
In this process (Fig. 17.12), higher strains arepossible compared to open-die extrusion (Fig.17.13). The billet is pressed through a die by apunch. Different types of these processes are de-scribed below and illustrated in Fig. 17.12.
● Forward extrusion: The metal flow is in thedirection of action of machine motion.
● Rod forward (Fig. 17.12a): A solid compo-nent is reduced in cross section. The die de-termines the shape of the tool opening.
● Tube forward extrusion (Fig. 17.12b): A hol-low cup or can of reduced wall thickness isproduced from a hollow can or sleeve. Boththe die and the punch determine the shape ofthe tool opening. The process is also knownas hooker extrusion.
● Can forward extrusion (Fig. 17.12c): A hol-low cup, can, or sleeve is produced from asolid component. The die and the counter-punch determine the shape of the tool open-ing.

Cold and Warm Forging / 221
Fig. 17.13 Schematic representation of free-extrusion processes. (a) Solid bodies. (b) Hollow bodies (nosing). (c) Hollow bodies(sinking) with container. 1, initial shape of workpiece; 2, final shape of workpiece [Lange et al., 1985]
● Backward extrusion: The metal flow is op-posite to the direction of the action of themachine.
● Rod backward extrusion (Fig. 17.12d): Asolid component is reduced in cross section.The tool opening is determined by the punchonly.
● Tube backward extrusion (Fig. 17.12e): Asleeve or a can with reduced wall thicknessis produced from a sleeve or a can. Both thedie and the punch determine the tool open-ing.
● Can backward extrusion (Fig. 17.12f): Athin-walled hollow body (can, sleeve, orcup) is extruded from a solid component.Both the die and the punch determine thetool opening.
● Rod side extrusion (Fig. 17.12g): A solidbody with a solid protrusion of any profile isextruded. The split die determines the toolopening.
● Tube side extrusion (Fig. 17.12h): A work-piece with a hollow protrusion of any profileis extruded. The split die and the mandreldetermine the tool opening.
17.7.3 Free or Open-Die Extrusion
The process of free or open-die extrusion isused for relatively small extrusion ratios. Dif-ferent types of these processes are described be-low and illustrated in Fig. 17.13:
● Free-die extrusions of solid bodies (Fig.17.13a): Reduction of the cross section of asolid body without supporting the undefor-med portion of the component in the con-tainer. The unsupported portion should nei-ther upset nor buckle during the process.
● Free extrusion of hollow bodies, or nosing(Fig. 17.13b and c): This process consists ofextruding the hollow body (can, sleeve, ortube) at its end. The requirement of the con-tainer shape at the end of the hollow bodydepends on its wall thickness.
17.8 Estimation ofFriction and Flow Stress
There are a number of formulas for predictingthe pressures in forward and backward extrusion[Feldmann, 1961; Wick, 1961; and Gentzsch,1967]. These formulas are derived eitherthrough approximate methods of plasticity the-ory or empirically from a series of experiments.In both cases, in addition to the approximationinherent in a given formula, estimation of thematerial flow stress and of the friction factor fora specific process also introduces inaccuraciesinto the predictions.
Friction is discussed in detail in Chapter 7,“Friction and Lubrication.” The value of thefriction factor, f, used in expressing the frictionalshear stress:
s � f r � mr/ 3�
is in the order of 0.03 to 0.08 in cold extrusion.This value is approximately the same as thevalue of l (used in expressing s � rnl, with rnnormal stress) used in some literature references.
In the deformation zone, the strain and, con-sequently, the flow stress, vary with location.r,Due to inhomogeneous deformation and internalshearing, the volume of the material near the die

222 / Cold and Hot Forging: Fundamentals and Applications
Table 17.4 Formulas for calculation of load in forward rod extrusion
Source Formula Remarks
[Siebel, 1950][Feldmann, 1961] P � A0 • ln R � � � pD •
2 A r ln Rl0 ar �A r Lr la 0 a 0
3 cos � sin �
P includes loads due to homogeneousdeformation, shearing, die friction,container friction.
[P.E.R.A., 1973] P � ln R � 1.15)A r (3.450 0
P � • A0(ln R � 0.6) •pL
r 1.25 � 2la � ��A0
For 0.1 to 0.3% C steels
[Pugh et al., 1966] P � � 2.7A0H0.78(ln R)0.730.78 0.738.2A r (ln R)0 uOriginally derived for steels with zinc
phosphate � MoS2. H � hardness ofbillet before extrusion, kg/mm2. ru intons/in.2; 1 ton � 2240 lb (1016 kg); Pin tons
[James and Kottcamp, 1965]P � � ru • exp
4lL0.5A (r F )e0 0 n a
D
Fn �neea� �n
� 1.24 ln R � 0.53ea
Based on average strain, ea, determined inmodel test with lead and with � � 27�
e � 2.71828
surface is subject to more severe deformation.Near the interface, therefore, the local strainsand flow stresses are higher. Since the flow stressvaries over the deformation zone, most formulasuse a so-called “average” or “mean” flow stress,
which is difficult to determine accurately. Ar ,areasonable approximation of the average flowstress, can be obtained from the curve forr ,aflow stress, versus effective strain, as fol-r, e,lows:
lnR1 ar � rde � (Eq 17.6)a �ln R 0 ln R
where R is the ratio of the initial cross-sectionalarea, A0, to the final cross-sectional area, A1, i.e.,R � A0/A1:
lnR
a � rde (Eq 17.7)�0
The value “a” of the integral is the surfacearea under the effective stress/effective straincurve and corresponds to the specific energy forhomogeneous deformation up to the strain �eiln R. If the flow stress can be expressed in theexponential form, then:
nr � Ke (Eq 17.8)
and
nlnR1 K(ln R)nr � Ke rde � (Eq 17.9)a �ln R 0 n � 1
where n is the strain-hardening exponent, and Kis the flow stress at effective strain � 1. Sinceethe material flow is influenced by tool geometryand by interface lubrication conditions, thestrain distribution and consequently the averagestrain, and the average flow stress, are alsoe, r ,ainfluenced by tool geometry and lubrication.This fact, however, is not reflected in the ap-proximate estimation of the average flow stress,
described above.r ,a
17.9 Prediction of ExtrusionLoads from Selected Formulas
Various formulas for forward and backwardextrusion were evaluated in predicting loads for35 different material values (17 different steelswith various heat treatments). Values of con-tainer friction were included in predictions ofpressures in forward extrusion [Altan et al.,1972]. The formulas that gave the best resultsare summarized in Tables 17.4 and 17.5. The
Table 17.5 Formulas for calculation of forming load in backward cup extrusion
Source Formula Remarks
[P.E.R.A., 1973] P � A r (3.45 ln (A /A ) � 1.15)0 0 0 1 For 0.1 to 0.3% C steel[Pugh et al., 1966] P � 0.8 0.72A 6.0r (ln R)0 u
� A02.8H0.72(ln R)0.72
Steels with zinc phosphate � Bonderlube 235H, hardness in kg/mm2 r0 in tons/in.2
[James and Kottcamp, 1965]P �
r � r Fu n0A e0 a� �2.4ea � 2.36 ln R � 0.28
Fn � n(ee /n)a
Based on average strain, , determined in model testea
with lead and with 5% cone-nosed punch. e �2.71828
[Altan, 1970] P � A0Kcruln(A0/A1) Kc � 2.5 to 3 for low-carbon steel; used Kc � 3
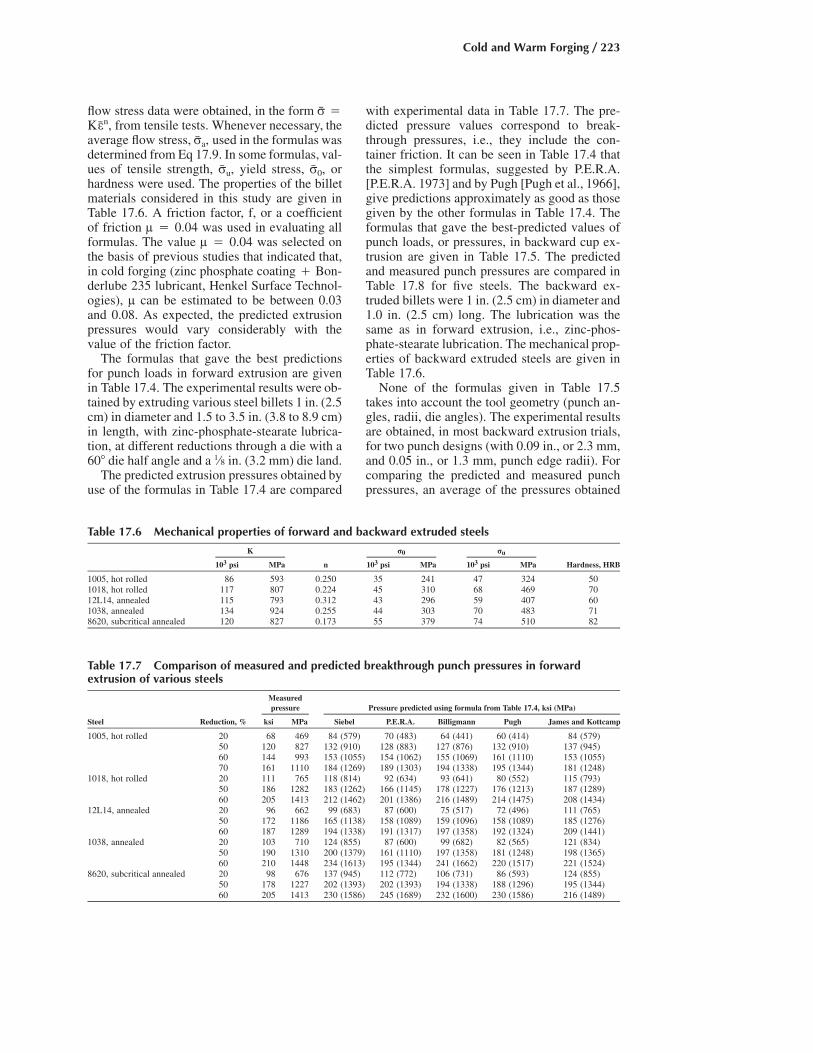
Cold and Warm Forging / 223
Table 17.7 Comparison of measured and predicted breakthrough punch pressures in forwardextrusion of various steels
Measuredpressure Pressure predicted using formula from Table 17.4, ksi (MPa)
Steel Reduction, % ksi MPa Siebel P.E.R.A. Billigmann Pugh James and Kottcamp
1005, hot rolled 20 68 469 84 (579) 70 (483) 64 (441) 60 (414) 84 (579)50 120 827 132 (910) 128 (883) 127 (876) 132 (910) 137 (945)60 144 993 153 (1055) 154 (1062) 155 (1069) 161 (1110) 153 (1055)70 161 1110 184 (1269) 189 (1303) 194 (1338) 195 (1344) 181 (1248)
1018, hot rolled 20 111 765 118 (814) 92 (634) 93 (641) 80 (552) 115 (793)50 186 1282 183 (1262) 166 (1145) 178 (1227) 176 (1213) 187 (1289)60 205 1413 212 (1462) 201 (1386) 216 (1489) 214 (1475) 208 (1434)
12L14, annealed 20 96 662 99 (683) 87 (600) 75 (517) 72 (496) 111 (765)50 172 1186 165 (1138) 158 (1089) 159 (1096) 158 (1089) 185 (1276)60 187 1289 194 (1338) 191 (1317) 197 (1358) 192 (1324) 209 (1441)
1038, annealed 20 103 710 124 (855) 87 (600) 99 (682) 82 (565) 121 (834)50 190 1310 200 (1379) 161 (1110) 197 (1358) 181 (1248) 198 (1365)60 210 1448 234 (1613) 195 (1344) 241 (1662) 220 (1517) 221 (1524)
8620, subcritical annealed 20 98 676 137 (945) 112 (772) 106 (731) 86 (593) 124 (855)50 178 1227 202 (1393) 202 (1393) 194 (1338) 188 (1296) 195 (1344)60 205 1413 230 (1586) 245 (1689) 232 (1600) 230 (1586) 216 (1489)
Table 17.6 Mechanical properties of forward and backward extruded steels
K r0 ru
103 psi MPa n 103 psi MPa 103 psi MPa Hardness, HRB
1005, hot rolled 86 593 0.250 35 241 47 324 501018, hot rolled 117 807 0.224 45 310 68 469 7012L14, annealed 115 793 0.312 43 296 59 407 601038, annealed 134 924 0.255 44 303 70 483 718620, subcritical annealed 120 827 0.173 55 379 74 510 82
flow stress data were obtained, in the form �rfrom tensile tests. Whenever necessary, thenKe ,
average flow stress, used in the formulas wasr ,adetermined from Eq 17.9. In some formulas, val-ues of tensile strength, yield stress, orr , r ,u 0hardness were used. The properties of the billetmaterials considered in this study are given inTable 17.6. A friction factor, f, or a coefficientof friction l � 0.04 was used in evaluating allformulas. The value l � 0.04 was selected onthe basis of previous studies that indicated that,in cold forging (zinc phosphate coating � Bon-derlube 235 lubricant, Henkel Surface Technol-ogies), l can be estimated to be between 0.03and 0.08. As expected, the predicted extrusionpressures would vary considerably with thevalue of the friction factor.
The formulas that gave the best predictionsfor punch loads in forward extrusion are givenin Table 17.4. The experimental results were ob-tained by extruding various steel billets 1 in. (2.5cm) in diameter and 1.5 to 3.5 in. (3.8 to 8.9 cm)in length, with zinc-phosphate-stearate lubrica-tion, at different reductions through a die with a60� die half angle and a 1⁄8 in. (3.2 mm) die land.
The predicted extrusion pressures obtained byuse of the formulas in Table 17.4 are compared
with experimental data in Table 17.7. The pre-dicted pressure values correspond to break-through pressures, i.e., they include the con-tainer friction. It can be seen in Table 17.4 thatthe simplest formulas, suggested by P.E.R.A.[P.E.R.A. 1973] and by Pugh [Pugh et al., 1966],give predictions approximately as good as thosegiven by the other formulas in Table 17.4. Theformulas that gave the best-predicted values ofpunch loads, or pressures, in backward cup ex-trusion are given in Table 17.5. The predictedand measured punch pressures are compared inTable 17.8 for five steels. The backward ex-truded billets were 1 in. (2.5 cm) in diameter and1.0 in. (2.5 cm) long. The lubrication was thesame as in forward extrusion, i.e., zinc-phos-phate-stearate lubrication. The mechanical prop-erties of backward extruded steels are given inTable 17.6.
None of the formulas given in Table 17.5takes into account the tool geometry (punch an-gles, radii, die angles). The experimental resultsare obtained, in most backward extrusion trials,for two punch designs (with 0.09 in., or 2.3 mm,and 0.05 in., or 1.3 mm, punch edge radii). Forcomparing the predicted and measured punchpressures, an average of the pressures obtained
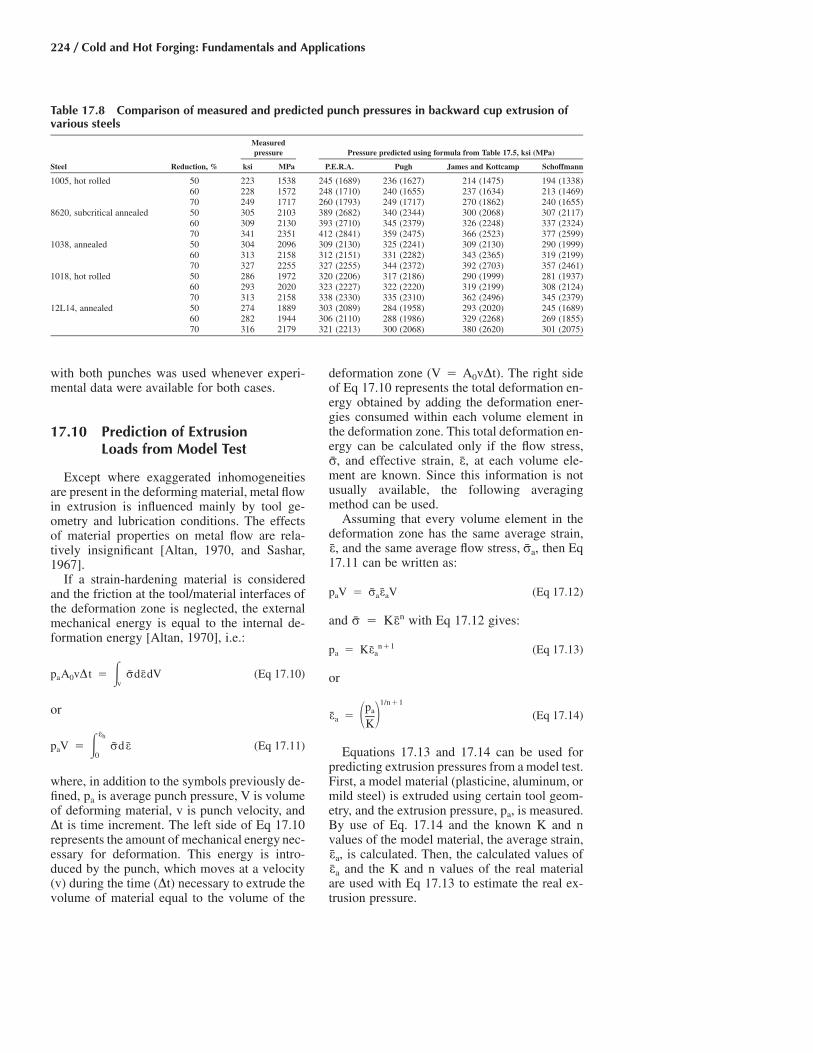
224 / Cold and Hot Forging: Fundamentals and Applications
Table 17.8 Comparison of measured and predicted punch pressures in backward cup extrusion ofvarious steels
Measuredpressure Pressure predicted using formula from Table 17.5, ksi (MPa)
Steel Reduction, % ksi MPa P.E.R.A. Pugh James and Kottcamp Schoffmann
1005, hot rolled 50 223 1538 245 (1689) 236 (1627) 214 (1475) 194 (1338)60 228 1572 248 (1710) 240 (1655) 237 (1634) 213 (1469)70 249 1717 260 (1793) 249 (1717) 270 (1862) 240 (1655)
8620, subcritical annealed 50 305 2103 389 (2682) 340 (2344) 300 (2068) 307 (2117)60 309 2130 393 (2710) 345 (2379) 326 (2248) 337 (2324)70 341 2351 412 (2841) 359 (2475) 366 (2523) 377 (2599)
1038, annealed 50 304 2096 309 (2130) 325 (2241) 309 (2130) 290 (1999)60 313 2158 312 (2151) 331 (2282) 343 (2365) 319 (2199)70 327 2255 327 (2255) 344 (2372) 392 (2703) 357 (2461)
1018, hot rolled 50 286 1972 320 (2206) 317 (2186) 290 (1999) 281 (1937)60 293 2020 323 (2227) 322 (2220) 319 (2199) 308 (2124)70 313 2158 338 (2330) 335 (2310) 362 (2496) 345 (2379)
12L14, annealed 50 274 1889 303 (2089) 284 (1958) 293 (2020) 245 (1689)60 282 1944 306 (2110) 288 (1986) 329 (2268) 269 (1855)70 316 2179 321 (2213) 300 (2068) 380 (2620) 301 (2075)
with both punches was used whenever experi-mental data were available for both cases.
17.10 Prediction of ExtrusionLoads from Model Test
Except where exaggerated inhomogeneitiesare present in the deforming material, metal flowin extrusion is influenced mainly by tool ge-ometry and lubrication conditions. The effectsof material properties on metal flow are rela-tively insignificant [Altan, 1970, and Sashar,1967].
If a strain-hardening material is consideredand the friction at the tool/material interfaces ofthe deformation zone is neglected, the externalmechanical energy is equal to the internal de-formation energy [Altan, 1970], i.e.:
p A vDt � rdedV (Eq 17.10)a 0 �v
or
eh
p V � rde (Eq 17.11)a �0
where, in addition to the symbols previously de-fined, pa is average punch pressure, V is volumeof deforming material, v is punch velocity, andDt is time increment. The left side of Eq 17.10represents the amount of mechanical energy nec-essary for deformation. This energy is intro-duced by the punch, which moves at a velocity(v) during the time (Dt) necessary to extrude thevolume of material equal to the volume of the
deformation zone (V � A0vDt). The right sideof Eq 17.10 represents the total deformation en-ergy obtained by adding the deformation ener-gies consumed within each volume element inthe deformation zone. This total deformation en-ergy can be calculated only if the flow stress,
and effective strain, at each volume ele-r, e,ment are known. Since this information is notusually available, the following averagingmethod can be used.
Assuming that every volume element in thedeformation zone has the same average strain,
and the same average flow stress, then Eqe, r ,a17.11 can be written as:
p V � r e V (Eq 17.12)a a a
and with Eq 17.12 gives:nr � Ke
n�1p � Ke (Eq 17.13)a a
or
1/n�1pae � (Eq 17.14)a � �K
Equations 17.13 and 17.14 can be used forpredicting extrusion pressures from a model test.First, a model material (plasticine, aluminum, ormild steel) is extruded using certain tool geom-etry, and the extrusion pressure, pa, is measured.By use of Eq. 17.14 and the known K and nvalues of the model material, the average strain,
is calculated. Then, the calculated values ofe ,aand the K and n values of the real materialea
are used with Eq 17.13 to estimate the real ex-trusion pressure.

Cold and Warm Forging / 225
Table 17.9 Comparison of measured and predicted (model test) punch pressures in backwardextrusion of various steels (model material, hot rolled 1005 steel; � psi)0.25r 86,000e
K Measured pressure Predicted pressure
Steel ksi MPa n Reduction, % ksi MPa ksi MPa
8620, subcritical annealed 120 827 0.173 50 305 2103 304 209660 309 2130 308 212470 341 2351 334 2303
1038, annealed 134 924 0.255 50 304 2096 347 239260 313 2158 357 246170 327 2255 387 2668
1018, hot rolled 117 807 0.244 50 286 1972 300 206860 293 2020 305 210370 313 2158 335 2310
12L14, annealed 115 793 0.312 50 274 1889 302 208260 282 1944 315 217270 316 2179 343 2365
Using 1005 hot rolled steel � 86,000(rpsi) as the model material, the model test0.25e
method described above was applied in order topredict punch pressures in forward extrusion fora series of the other steels. A comparison of theexperimental and predicted values is given inTable 17.9. It can be seen that the largest differ-ence between the two values does not exceed20%, while predictions are within 10% for mostextrusions. It should be noted that the extrusionpressure, pa, in Eq 17.13 is the same as the ejec-tor pressure. The punch pressure is obtainedfrom the extrusion ratio. For instance, for R �80%, punch pressure � pa/0.80.
In forward extrusion, only the deformationpressure, i.e., the end pressure, can be predictedfrom a model test. In order to predict the maxi-mum load, the friction in the extrusion containermust be considered. With the symbols listed inFig. 17.10(a), the equilibrium of forces in theaxial direction gives:
2pDdp � dxs pD (Eq 17.15)x f� �4
Assuming a constant frictional shear stress, sf,at the tool/material interface, sf � Eq 17.15fr ,0transforms into:
dp 4f rx 0� (Eq 17.16)
dx D
by integrating, Eq 17.16 gives:
4fr0p � x � C (Eq 17.17)x D
The integration constant C is determined fromthe condition for x � 0, px � pe in Eq 17.13,or, in forward extrusion:
4fr0p � p � L (Eq 17.18)x e D
Equation 17.18 illustrates that the peak pres-sure, pp, in forward rod extrusion is equal to thesum of the end pressure, pe, necessary for de-formation and the additional pressure, pfc �
L/D, necessary to overcome the container4fr0friction.
The shear friction factor, f, is to be determinedfrom Eq 17.18 for a given billet length, L, andfor the known yield stress, of the model ma-r ,0terial, in this case, 1005HR steel. It is reasonableto assume that the friction factor, f, would notsignificantly change from one steel to another.The average strain, is determined from Eqe,17.14, using the data for 1005 HR steel. The endpressure, pe, is then determined from Eq 17.13.Finally, the peak pressures, pp, are calculated fordifferent steels using Eq 17.18. The results arecompared with experimental values in Table17.10. The agreements between prediction andexperiment are, in most cases, within 10 to 15%and can be considered acceptable for practicalpurposes.
17.11 Tooling for Cold Forging [Langeet al., 1985, and ICFG, 1992]
A tooling setup for cold forging is shown inFig. 17.14.
17.11.1 Punch
The punch is the portion of the tool that formsthe internal surface of the workpiece in a canextrusion, or that pushes the workpiece througha die in a rod, tube, or open-die extrusion.
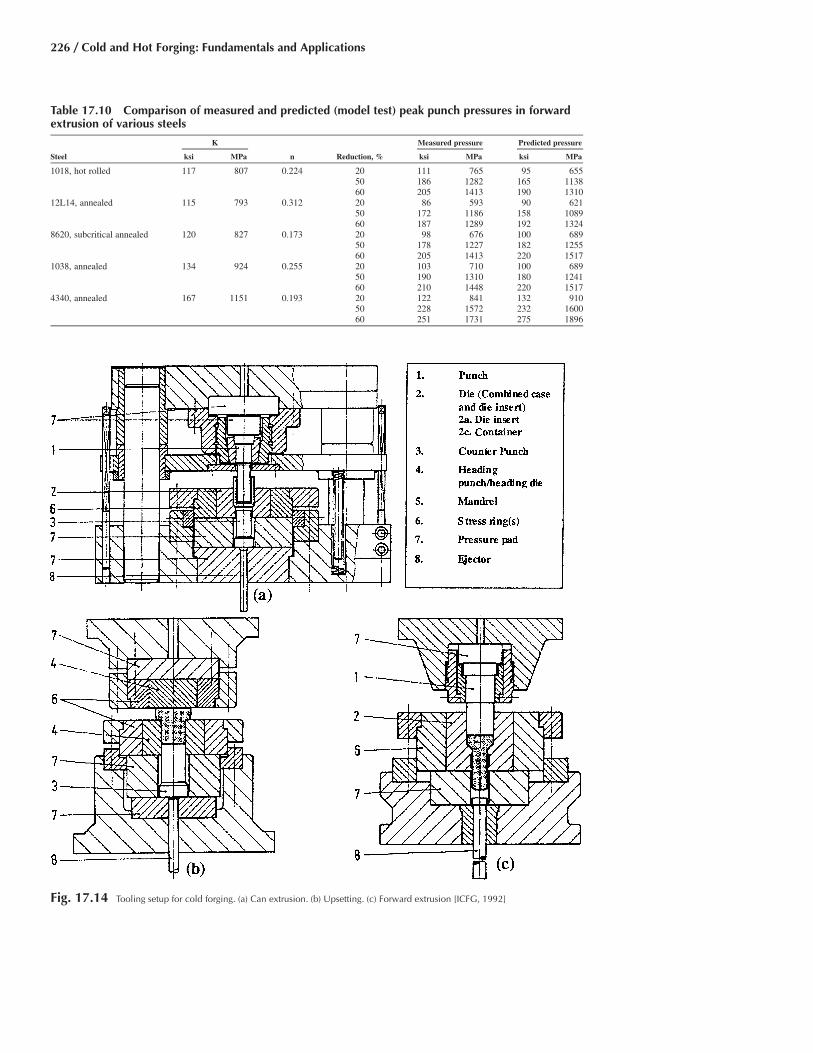
226 / Cold and Hot Forging: Fundamentals and Applications
Fig. 17.14 Tooling setup for cold forging. (a) Can extrusion. (b) Upsetting. (c) Forward extrusion [ICFG, 1992]
Table 17.10 Comparison of measured and predicted (model test) peak punch pressures in forwardextrusion of various steels
K Measured pressure Predicted pressure
Steel ksi MPa n Reduction, % ksi MPa ksi MPa
1018, hot rolled 117 807 0.224 20 111 765 95 65550 186 1282 165 113860 205 1413 190 1310
12L14, annealed 115 793 0.312 20 86 593 90 62150 172 1186 158 108960 187 1289 192 1324
8620, subcritical annealed 120 827 0.173 20 98 676 100 68950 178 1227 182 125560 205 1413 220 1517
1038, annealed 134 924 0.255 20 103 710 100 68950 190 1310 180 124160 210 1448 220 1517
4340, annealed 167 1151 0.193 20 122 841 132 91050 228 1572 232 160060 251 1731 275 1896
Cold and Warm Forging / 227
In forward rod extrusion, wear of the punchis normally not a problem. Compressive stressesrange up to 350 ksi (2413 MPa) and sometimesslightly more. In can extrusion, the punch is sub-jected to compressive and bending load as wellas heavy wear, which increases the temperatureat the punch nose, especially in high-speedpresses. During stripping, tensile stresses occur.In ironing, the punch pushes the workpiecethrough the die and forms its internal surface.Depending on size, shape, loading, and wear,both tool steels and cemented carbides may beselected as tool materials.
17.11.2 Die, Die Insert, Container, Case(Combined Case and Die Insert)
The die is the portion of the tool assembly thatcontains the workpiece and forms the externalsurfaces. The choice of the material depends onthe maximum internal pressure and fatigue aswell as the toughness and wear-resistance re-quirements.
Normally, dies are reinforced by one or morestress rings. Depending on the stress state, prin-cipal designs used in the industry are as follows:
● Die● Die with one-piece insert● Die with axially split insert● Die with transversely split insert
Depending on size and shape, both tool steelsand cemented carbides may be selected for thedie insert.
17.11.3 Counter Punch
The counter punch forms the base shape andis usually used to eject the workpiece from thedie. In both can extrusion and coining or sizing,the counter punch is subjected to compressivestresses similar to those occurring in punches.Both tool steels and cemented carbides may beselected.
17.11.4 Heading Punch/Heading Die
The heading punch upsets the head of theworkpiece. The heading die contains the shankand forms the underhead surface of the work-piece. Choice of the tool material and its heattreatment depends on the compressive stresses(up to 300 ksi, or 2068 MPa, and more), sectionsize, and the demand for wear resistance andtoughness. Besides tool steels, for a range ofsmall and medium section sizes, cemented car-
bides may be used when long runs demand highwear resistance.
17.11.5 Mandrel (Pilot)
The mandrel or pilot is that part of the punchassembly that enters a hollow billet and formsthe inside wall. The mandrel is subjected to wearand high tensile stresses, and therefore, thechoice of material is aimed at properties such aswear resistance and/or high yield strength. Dueto high tensile stresses, tool steels are normallyused.
17.11.6 Stress Rings
The stress rings form the intermediate andouter portions of the die assembly to prevent thedie from bursting. The tensile stresses willamount to 200 ksi (1379 MPa) and more. Nor-mally, tool steels are used.
17.11.7 Pressure Pads
The pressure pad is the block of material thatsupports and spreads the load behind the pad ordie. Sufficient thickness is important in order tospread the load properly and to avoid bending.An extreme degree of parallelism and square-ness is essential. The tool material should pro-vide high compressive strength up to 220 ksi(1517 MPa). Normally, tool steels are used.
17.11.8 Ejector
The ejector is the part of the tooling that ejectsthe workpiece from the die, usually without tak-ing part in the forming operation. The choice ofthe material depends on the section used and theejection pressure. Normally, tool steels are used.
17.12 Punch Design for Cold Forging
Figure 17.15 shows some punches and man-drels used for solid and hollow forward extru-sion.
The design process for punches and mandrelscan be divided into the following stages:
● Determining the forming load● Deciding the overall shape and proportions
of the tool. For can extrusion, the detailedshape of the punch nose is to be determined.
● Choosing an appropriate tool material, con-sidering the stresses, manufacturability, toollife, availability, and costs

228 / Cold and Hot Forging: Fundamentals and Applications
Fig. 17.15 General designs for punches used in cold extru-sion [ICFG, 1992]
● Verifying the design with model tests, pro-totyping, or finite-element simulations
For punches, an approximate design guidelineis to determine the maximum compressive stressexpected in the process and comparing this withthe compressive properties of the tool material.The punch face shape has a significant effect onthe friction force and the material flow. Figure17.16 shows different types of punch faceshapes. The advantage of using a flat/conicalpunch geometry (Fig. 17.16c) is that the lubri-cant carrier and the lubricant cannot be separatedeasily or overextended locally, as is the case withconical faces.
Some recommendations for designingpunches are as follows:
● Punches should be made as short as possible.The punch will buckle if the stress exceedsa certain level for a given length-to-diameterratio. The design should also avoid excessivebending stress that may occur due to buck-ling of the punch. Punches for can extrusionare more susceptible to buckling failure thanthose for rod or tube extrusion.
● Large and abrupt changes in cross sectionsshould be avoided over the whole punchlength in order to minimize undesirablestress concentration. The changes in thecross sections should be done using smallcone angles and large transition radii, nicelyrounded and polished.
● In forward extrusion, the diameter of thepunch at the deformation zone should bechosen such that:a. There is sufficient entry clearance for the
punch.b. The clearance between the punch and the
die should not be very large, to avoid burrformation.
c. The clearance should not be too small, orelse the punch will wear out due to elasticdeflection of the tooling.
Figure 17.17 shows the parameters involvedin design for backward can extrusion punches.The details of punch design and parameters cal-culation can be found in the literature [ICFG,1992, and Lange et al., 1985].
17.13 Die Design andShrink Fit [Lange et al.,1985, and ICFG, 1992]
Dies for cold extrusion can be of differentconfigurations, depending on the design prefer-ences or operational requirements. In general,
Fig. 17.16 Punch face shapes for backward can extrusion [Lange et al., 1985]

Cold and Warm Forging / 229
the design of dies and die assemblies requiresconsideration of the following:
● The flow stress of the workpiece material,which is affected by strain, temperature, andstrain rate
● The type of the process● The geometry of the die and the slug or pre-
form● Friction and lubrication
Figures 17.8(a) and (b) show the general no-menclature for extrusion dies. One half of eachfigure illustrates the use of split dies. The rec-ommended design guidelines for the parametersin Fig. 17.18 are as follows:
● The die entry radius should be as large aspossible so as to minimize high stress con-centrations.
● The included die angle for minimum extru-sion pressure should lie between 50 and 70�for extrusion ratios of approximately 2 and4, respectively.
● The die land radius should be fairly small,i.e., between 0.008 and 0.06 in. (0.2 and 1.5mm), depending on the diameter of the diethroat.
● The length of the die land should be between0.08 and 0.16 in. (2 and 4 mm), dependingon the throat diameter.
● The die relief should be kept small to provideguidance for the extruded rod and should behigher than the permitted wear allowance onthe die throat.
Extrusion dies are generally very highlystressed. One or more rings are used to assemblethe container with interference fits in order toapply compressive stresses to the die ring orliner. The number and diameter of the rings de-pend on the magnitude of stresses needed andthe overall die space available in the press. Fig-ure 17.19 shows the dies with two stress rings.Heat treatment of stress rings is very importantto develop the desired mechanical properties.Table 17.11 gives guidelines for the diametersof the stress rings.
In applications where the extrusion pressureis very high, in excess of 300 ksi (2068 MPa),it is recommended to use stress rings that arestrip wound. Plastic deformation in conventionalstress rings makes it difficult to control the com-pressive prestress and results in die failures.Strip-wound containers have strength that istwice or three times higher than the conventionalstress rings. This high strength of strip-woundcontainers makes it possible to provide optimum
prestress of the die inserts, leading to an im-provement of two to ten times in die life, de-pending on the cold forging operation [Groen-baek, 1997].
17.14 Process Sequence Design
In practice, cold forming requires severalstages to transform the initial simple billet ge-
Fig. 17.17 Can extrusion punch design guidelines [ICGF,1992]

230 / Cold and Hot Forging: Fundamentals and Applications
ometry into a more complex product. One of themajor efforts required in applying the use of thecold forging process successfully is the designof the forming sequences for multistage forgingoperations. Highly experienced die designers dothis work, and it requires both experienced judg-ment and the application of established designrules [Sevenler et al., 1987]. Computer-aidedtools, such as finite-element modeling (FEM)simulations, are used to assist the die designerswhile they establish the forming sequences incold forging [Altan et al., 1992].
In the early stages of forming sequence de-sign, the designer draws rough sketches of thepreforms for each station. The designer then cal-culates the volumes and tries to establish the ac-curate workpiece dimensions. The designer maythen want to change some part or preform di-mensions to examine various design alternativeswhile keeping the workpiece volume constant.The FEM simulation of metal flow and tool de-flection may be required at this stage of design.The FEM can be used as a validation tool beforetryouts. Figures 17.20 through 17.22 show someexamples of forging sequences. More examplescan be found on the CD available with this book.
17.15 Parameters Affecting Tool Life
Tool life in cold forging is important, as itaffects the tool cost and thereby increases theprocess and parts costs. Figure 17.23 shows the
various parameters that affect tool life [Yaman-aka et al., 2002].
Tool life depends on the production condi-tions, work material, human skills, and toolquality. Tool quality is affected by how well thetool is designed, the manufacturing of the tool,the material selected, and the heat and surfacetreatment conditions. Figure 17.24 shows thetypical tool defects encountered in cold forgingtooling.
Fig. 17.18 General nomenclature for extrusion dies. (a) Rod/tube extrusion. (b) Can extrusion [ICFG, 1992]
Fig. 17.19 Die with two stress rings [ICFG, 1992]
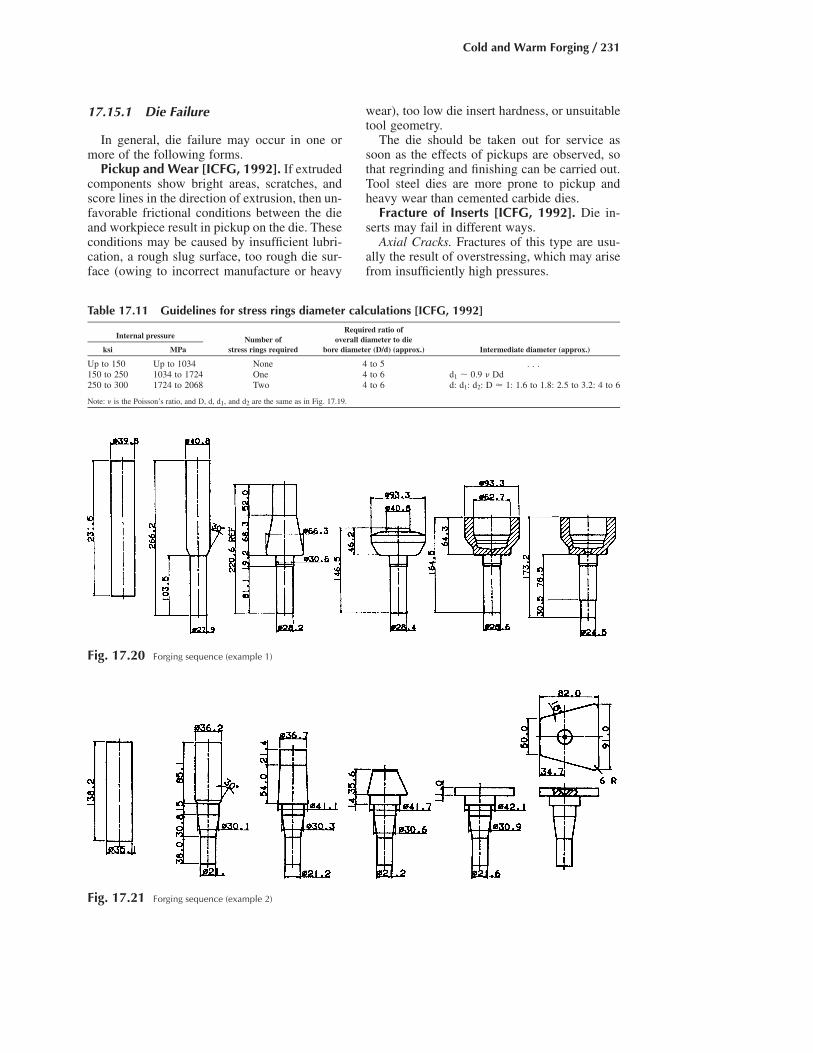
Cold and Warm Forging / 231
17.15.1 Die Failure
In general, die failure may occur in one ormore of the following forms.
Pickup and Wear [ICFG, 1992]. If extrudedcomponents show bright areas, scratches, andscore lines in the direction of extrusion, then un-favorable frictional conditions between the dieand workpiece result in pickup on the die. Theseconditions may be caused by insufficient lubri-cation, a rough slug surface, too rough die sur-face (owing to incorrect manufacture or heavy
wear), too low die insert hardness, or unsuitabletool geometry.
The die should be taken out for service assoon as the effects of pickups are observed, sothat regrinding and finishing can be carried out.Tool steel dies are more prone to pickup andheavy wear than cemented carbide dies.
Fracture of Inserts [ICFG, 1992]. Die in-serts may fail in different ways.
Axial Cracks. Fractures of this type are usu-ally the result of overstressing, which may arisefrom insufficiently high pressures.
Fig. 17.21 Forging sequence (example 2)
Fig. 17.20 Forging sequence (example 1)
Table 17.11 Guidelines for stress rings diameter calculations [ICFG, 1992]
Internal pressure Number ofRequired ratio of
overall diameter to dieksi MPa stress rings required bore diameter (D/d) (approx.) Intermediate diameter (approx.)
Up to 150 Up to 1034 None 4 to 5 . . .150 to 250 1034 to 1724 One 4 to 6 d1 � 0.9 � Dd250 to 300 1724 to 2068 Two 4 to 6 d: d1: d2: D � 1: 1.6 to 1.8: 2.5 to 3.2: 4 to 6
Note: � is the Poisson’s ratio, and D, d, d1, and d2 are the same as in Fig. 17.19.

232 / Cold and Hot Forging: Fundamentals and Applications
If insufficient prestressing is suspected, thenit could be increased by using additional stressrings, increasing the overall diameter of the as-sembly, or using stress rings of greater strength.In all the situations, the interference must be ad-justed appropriately.
If the die design is already considered as thebest possible, then fracture is due to excessiveextrusion pressure. The most frequent reason forthis could be high flow stress of the slug materialas a consequence of inadequate annealing or de-parture from correct material composition.
Transverse Cracks. A transverse crack, whichis most common, is usually in one-piece rod ex-trusion die inserts and occasionally in tube ex-trusion dies in the vicinity of the die shoulderentry. A similar type may also occur in the diebore at locations corresponding to the positionof the rear face of the slug at the beginning andend of the extrusion stroke. These are due to
stress concentration or triaxial stresses involvinga high component of axial tensile stress. In mostcases, fatigue failure (after the production of afairly large number of parts) is responsible.
To prevent transverse cracks, use of a tougherdie material, decreasing the hardness of a toolsteel insert by 2 to 5 points in the Rockwell Cscale, splitting the die or decreasing the die an-gle, and/or increasing the die entry radius couldbe helpful [ICFG, 1992].
17.15.2 Procedure to Improve Tool Life
Figure 17.25 describes a typical procedure toimprove tool life in the cold forging process. Ob-servation and proper inspection of the failed toolmust be done. Based on the causes of the failuresdiscussed above, knowledge, and experience, atool failure mechanism can be assumed. Usingexperience and finite-element simulations, a new
Fig. 17.23 Parameters affecting tool life in cold forging [Yamanaka, 2002]
Fig. 17.22 Forging sequence (example 3)

Cold and Warm Forging / 233
design can be suggested to overcome the toolfailure. If the new design gives a satisfactorytool life, then it could be finalized for the pro-cess.
17.16 Warm Forging
In cold forging of parts with relatively com-plex geometries from high-carbon and alloysteels, forging pressures are extremely high andthe ductility of the material is low. As a result,short tool life and defects formed during forginglimit the economic use of the cold forging pro-cesses. Consequently, in many cases, warm forg-ing, i.e., forging at temperatures below recrys-tallization temperature, is commonly used[Altan et al., 1983]. For warm forging, steels areusually heated between room temperature andusual hot forging temperature. The normal tem-perature range is considered to be 1110 to 1650�F (600 to 900 �C). An exception is the warmforging of austentic stainless steels, which usu-ally are forged between 390 and 570 �F (200 and300 �C) [ICFG, 2001b]. The process may be in-terpreted broadly as thermomechanical process-ing at elevated temperature to achieve the fol-lowing advantages:
● A reduction in flow stress. This is applicable,in particular, to high-alloy steels. As a result,tool stresses and forging loads are reduced(Fig. 17.26).
● Greater ductility of the forged part. This al-lows more complex shapes to be forged.
● A reduction in strain hardening. This mayreduce the number of forming and annealingoperations.
● Greater toughness of the forged part● Improved accuracy as compared to hot forg-
ing● Enhanced product properties through grain
refinement and controlled phase transfor-mations in heat treatable steels
As an example, variations of tensile stress andductility (as indicated by reduction of area) withtemperature are shown in Fig. 17.26 for 1045steel. It can be seen that the tensile stress doesnot decrease continuously with temperature.There is a temperature range, in this case, at ap-proximately 400 to 800 �F (205 to 425 �C),wherein forging would not be recommended.Warm forging requires determination of the op-timum forging temperature and the suitable lu-bricant. Selection of warm forging lubricants hasproved to be especially difficult. The factor thatlimits the use of warm forging is that the tech-
Fig. 17.24 Typical defects in cold forging tools [Yamanaka et al., 2002]

234 / Cold and Hot Forging: Fundamentals and Applications
nology is still undergoing development, particu-larly in aspects of surface treatment, lubrication,and tooling.
Tooling for warm forging is similar to that forcold forging, with some modifications made inthe die to allow increased temperatures, internaldie cooling, and venting of coolants.
REFERENCES
[Altan, 1970]: Altan, T., “The Use of ModelMaterials in Predicting Forming Loads inMetal Working,” Transactions ASME, May1970, p 444.
[Altan et al., 1972]: Altan, T., and Beckner,J.R., “Prediction of Punch Loads and Pres-sures in Cold Extrusion of Steel,” SME Tech-
nical Paper MF72-142, Society of Manufac-turing Engineers, 1972.
[Altan et al., 1982]: Raghupathi, P.S., Oh, S.I.,Altan, T., “Methods of Load Estimation inFlashless Forging Processes,” Topical ReportNo. 10, Battelle Columbus Laboratories,1982, p 94.
[Altan et al., 1983]: Altan, T., Oh, S.-I., Gegel,H.L., “Metal Forming Fundamentals and Ap-plications,” American Society for Metals,1983.
[Altan et al., 1987]: Sevenler, K., Raghupathi,P.S., Altan, T., “Forming Sequence Design forMultistage Cold Forging,” Journal of Me-chanical Working Technology, Vol. 14, 1987,p 121–135.
[Altan et al., 1992]: Kim, H., Sevenler, K., Al-tan, T., “Computer Aided Part and ProcessingSequence Design in Cold Forging,” J. of Ma-terials Processing Technology, Vol 33 (No. 1–2), 1992, p 57–76.
[Altan et al., 1996]: Altan, T., O’Connell, M.,Painter, B., Maul, G., “Flashless Closed-DieUpset Forging-Load Estimation for OptimalCold Header Selection,” Journal of MaterialsProcessing Technology, Vol 59, No. 1–2, May1996, p 81–94.
[ASM, 1970]: Forging and Casting, Vol. 5, Met-als Handbook, 8th ed., American Society forMetals, 1970, p 72.
[Bay, 1994]: Bay, N., “The State of the Art inCold Forging Lubrication,” Journal of Mate-rials Processing Technology, Vol 46, 1994, p19.
[Bay, 1997]: Bay, N., “Cold forming of Alu-minum—State of the Art,” Journal of Mate-rials Processing Technology, Vol 71, 1997, p76–90.
[Billigmann et al., 1973]: Billigmann, J., andFeldmann, H.D., “Upsetting and Pressing,”Carl Hansen Verlag, Munich, 1973 (in Ger-man).
[Doehring, 1972]: Doehring, R.C., “New De-velopments in Cold and Warm Forging,”SME Technical Paper MF72-526, Society ofManufacturing Engineers, 1972.
[Drozda, 1983]: Drozda, T.J., “Money SavingInnovations in Automatic Forming,” Manu-facturing Engineering, Vol 90, (No. 2), 1983,p. 32–39.
[Feldmann, 1961]: Feldmann, H.D., “ColdForging of Steel,” Hutchinson and CompanyLtd., London, 1961.
[Feldmann, 1977]: Feldmann, H.D., “Cold Ex-trusion of Steel,” Merkblatt 201, prepared for
Fig. 17.26 Effects of test temperature and test speed (strainrate) on tensile strength and reduction of areas
of hot rolled type 1045 [Altan et al., 1983]
Fig. 17.25 Procedure for improving tool life [Yamanaka etal., 2002]

Cold and Warm Forging / 235
Beratungsstelle fuer Stahlverwendung, Dus-seldorf, 1977 (in German).
[Gentzsch, 1967]: Gentzsch, G., “Cold Upset-ting, Cold Extrusion and Coining,” Vol. 1, Lit-erature Review; Vol. 2, References, VDI Ver-lag, Dusseldorf, 1967 (in German).
[Groenbaek, 1997]: Groenbaek, J., and Niel-sen, E.B., “Stripwound Containers for Com-bined Radial and Axial Prestressing,” Journalof Material Processing Technology, Vol 71(No. 1), 1997, p 30.
[Herbst, 1967]: Herbst, V., “Accurate Shearingof Workpiece Materials for Cold and WarmForging,” Doctoral dissertation, TechnicalUniversity, Hanover, Germany, 1967 (in Ger-man).
[ICFG, 1992]: “Objectives, History and Pub-lished Documents,” ISBN 3-87525-058-3, In-ternational Cold Forging Group, 1992.
[ICFG, 2001a]: “Steels for Cold Forging:Their Behavior and Selection,” DocumentNo. 11/01, International Cold ForgingGroup, 2001.
[ICFG, 2001b]: “Warm Forging of Steels,”Document No. 12/01, International ColdForging Group, 2001.
[ICFG, 2002]: “Cold Forging of Aluminum,”Document No. 13/02, International ColdForging Group, 2001.
[James and Kottcamp, 1965]: James, C.T., andKottcamp, E.H., “Selection of Steel and HeatTreatment for Ease of Cold Extrusion,” paperpresented at Chicago Technical Meeting ofthe American Meeting of the American Ironand Steel Institute, Oct. 20, 1965.
[Lange et al., 1985]: Lange, K., et al., “Hand-book of Metal Forming,” McGraw-Hill, 1985,p 2.3, 9.19.
[P.E.R.A., 1973]: “Cold Extrusion of CarbonSteels,” P.E.R.A. Report No. 69, 1973.
[Pugh et al., 1966]: Pugh, H., et al., “Some As-pects of Cold Extrusion of Steel,” Sheet MetalInd., Vol 43, 1966, p 268–305.
[Sagemuller, 1968]: Sagemuller, F., “Cold Im-pact Extrusion of Large Formed Parts,” Wire,No. 95, June 1968, p 2.
[Sahar, 1967]: “Prediction of Extrusion Pres-sures in the Cold Forging of Steel,” Trans.Metall. Society AIME, Vol 239, 1967, p 1461–1468.
[Sevenler et al., 1987]: Sevenler, K., Raghu-pathi, P.S., Altan, T., “Forming Sequence De-sign for Multi-Stage Cold Forging,” J. of Me-chanical Working Technology, Vol. 14, 1987,p 121–135.
[Siebel, 1950]: Siebel, E., “Fundamentals andConcepts of Forming,” Werkstattstechnik andMaschienbau, Vol 40, 1950, p 373 (in Ger-man).
[Watkins, 1973]: “Cold Forging and Extrusionof Steel,” Review 176, International Metal-lurgical Review, Vol 18, 1973 (Part I: BasicPrinciples, p 123; Part II: Properties and Tool-ing, p 147; Part III: Economics and FutureApplications, p 162).
[Wick, 1961]: Wick, C.H., ”Chipless Machin-ing,” Industrial Press, New York, 1961.
[Yamanaka et al., 2002]: Yamanaka, M., andSunami, F., “Tool Design for Precision Forg-ing,” presented at Cold and Warm PrecisionForging Workshop (Canton, MI), YamanakaEngineering Co., Ltd., Nov 14, 2002.
SELECTED REFERENCES
● [Wick, 1984]: Wick, C.H., “Tools andManufacturing Engineers Handbook: Vol-ume I, Forming,” Society of ManufacturingEngineers, 1984.
● [Witte, 1967]: “Investigation on the Varia-tions of Loads and Energies in Cold Extru-sion under Production Conditions, Influenceof Phosphate Coating Thickness and Lubri-cants,” Report No. 6, Institute for Forming,Technical University, Stuttgart, 1967, VerlagGirardet, Essen. (in German).

CHAPTER 18
Process Modeling in ColdForging Using Finite-Element AnalysisPrashant Mangukia
18.1 Introduction
The finite-element method (FEM) is one ofthe numerical techniques used for solving dif-ferential equations governing engineering prob-lems. This method has been applied to variousengineering processes, including metal forming.The effectiveness of this method is now widelyrecognized.
Finite-element methods for simulations ofmetal forming processes are classified into thosefor the elastic-plastic and rigid-plastic analyses.In the elastic-plastic simulation, material is mod-eled as deforming elastic-plastically. Thus, theresults are given for not only the plastic defor-mation but also for elastic deformation such asresidual stresses and springback. Rigid-plasticsimulation assumes material to deform onlyplastically, and, in comparison to elastic-plasticsimulations, it results in shorter computing time.
18.2 Process Modeling Input
As discussed in Chapter 16, “Process Mod-eling in Impression-Die Forging Using Finite-Element Analysis,” the accuracy of finite-ele-ment (FE) process simulation depends heavilyon the accuracy of the input data, namely, flowstress as a function of temperature, strain, strainrate, and microstructure, as well as friction char-acteristics at the interface. Other inputs requiredare the geometric parameters of the objects andthe process parameters. Several issues, such asmaterial properties, geometry representation,
computation time, and remeshing capability,must be considered in cost-effective and reliableapplication of numerical process modeling. Theinputs to FEM are discussed in detail in section16.3, “Process Modeling Input,” in Chapter 16of this book. A brief summary is presented be-low in terms of important inputs for modelingthe cold forging process.
18.2.1 Geometric Parameters
Depending on its geometrical complexity, aforging process can be simulated either as a two-dimensional, axisymmetric or plane-strain, or athree-dimensional problem. In general, in orderto have an efficient simulation it is necessary toremove all minor geometrical features, such assmall radii in the dies that do not have a signifi-cant effect on the metal flow [Altan et al., 1990].However, for some specific applications, such asmicroforming processes, the size effects shouldbe taken into account in the simulation [Messneret al., 1994].
18.2.2 Tool andWorkpiece Material Properties
In most cold forming simulations, tools areconsidered as rigid. Temperature increases incold forging have little influence on the process.Therefore, the simulations are usually carriedout under isothermal conditions. The stress-strain relation of materials, commonly referredto as the flow stress curve, is usually obtainedby the cylinder compression test. To be appli-cable without errors or corrections, the cylindri-
Cold and Hot Forging Fundamentals and ApplicationsTaylan Altan, Gracious Ngaile, Gangshu Shen, editors, p237-246 DOI:10.1361/chff2005p237
Copyright © 2005 ASM International® All rights reserved. www.asminternational.org

238 / Cold and Hot Forging: Fundamentals and Applications
Fig. 18.1 Correction of flow stress data obtained from a compression test [Altan et al., 2001]
cal sample must be upset without any barreling(Fig. 18.1), i.e., a state of uniform stress mustbe maintained in the sample at all times duringthe test. Use of adequate lubrication preventsbarreling to some extent. However, in practice,barreling is inevitable, and procedures for cor-recting flow stress errors due to barreling maybe necessary (see Chapter 4, “Flow Stress andForgeability,” in this book).
Figure 18.1(a) shows a sample that was upsetto 62% reduction (true strain of 0.96). This sam-ple shows significant barreling, implying that thelubricant applied was ineffective at this highlevel of strain. The failure of the lubricant is evi-dent by the two different regions (shiny and non-shiny areas) depicted on the surface of the sam-ple (Fig. 18.1a). In general, for processmodeling of precision forging, the experimentalflow stress curves were found to be reliable onlyup to a strain level of 0.5 [Altan et al., 2001].
One way of correcting the flow stress, or de-termining approximately the error magnitude athigh strain levels caused by inadequate lubri-cation (barreling), is to simulate the compressionprocess by FEM using various friction factors(Fig. 18.1c) [Altan et al., 2001]. By measuringthe amount of barreling (Fig. 18.1a) and com-paring the experimental data with FEM predic-tions, it is possible to obtain more reliable flowstress data at higher strain levels. This method,called the inverse analysis technique, has beenused to simultaneously determine friction andstress/strain data using a ring test [Altan et al.,2003].
Attention should also be given to othersources of flow stress error determined through
compression tests, such as variation in coil ma-terial properties, specimen preparation, surfacedefects, parallelism of platens, and specimensize.
Though in most FE simulations the tools areconsidered rigid, this assumption may not holdfor complicated forgings with tight tolerances,particularly in microforming applications.Hence, depending on the part complexity, elas-tic-plastic properties of the tools/dies become animportant component in the simulations. The de-tails of flow stress determination and inverseanalysis can be found in Chapter 8, “InverseAnalysis of Simultaneous Determination ofFlow Stress and Friction,” of this book.
18.2.3 Interface Conditions(Friction and Heat Transfer)
The friction and heat-transfer coefficient arenot readily available in literature. The most com-mon way to determine the shear friction factorin forging is to perform ring compression tests.Friction factors measured with the ring com-pression test, however, are not valid for preci-sion cold forging processes (hot, warm, andcold) where the interface pressure is very highand the surface generation is large. The frictionconditions change during the process due tochanges in the lubricant and the temperature atthe die/workpiece interface. In such applica-tions, the double-cup extrusion test is recom-mended for estimation of the friction factor (seeChapter 7, “Friction and Lubrication,” in thisbook).
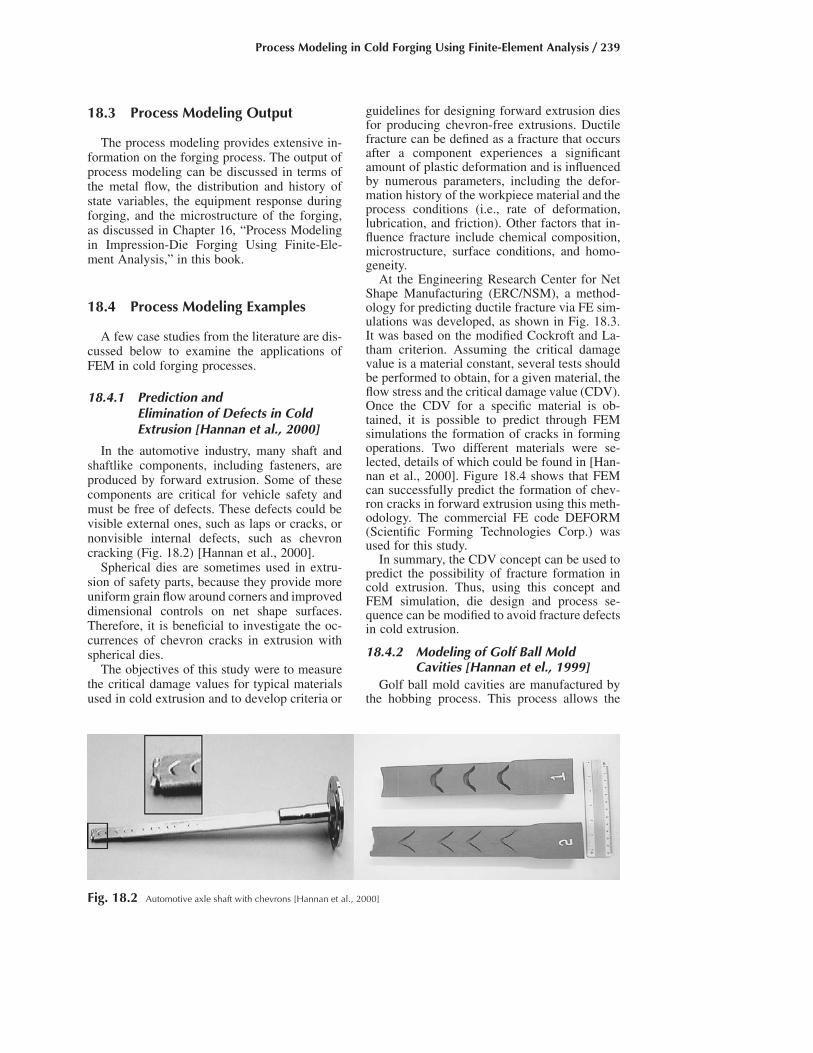
Process Modeling in Cold Forging Using Finite-Element Analysis / 239
Fig. 18.2 Automotive axle shaft with chevrons [Hannan et al., 2000]
18.3 Process Modeling Output
The process modeling provides extensive in-formation on the forging process. The output ofprocess modeling can be discussed in terms ofthe metal flow, the distribution and history ofstate variables, the equipment response duringforging, and the microstructure of the forging,as discussed in Chapter 16, “Process Modelingin Impression-Die Forging Using Finite-Ele-ment Analysis,” in this book.
18.4 Process Modeling Examples
A few case studies from the literature are dis-cussed below to examine the applications ofFEM in cold forging processes.
18.4.1 Prediction andElimination of Defects in ColdExtrusion [Hannan et al., 2000]
In the automotive industry, many shaft andshaftlike components, including fasteners, areproduced by forward extrusion. Some of thesecomponents are critical for vehicle safety andmust be free of defects. These defects could bevisible external ones, such as laps or cracks, ornonvisible internal defects, such as chevroncracking (Fig. 18.2) [Hannan et al., 2000].
Spherical dies are sometimes used in extru-sion of safety parts, because they provide moreuniform grain flow around corners and improveddimensional controls on net shape surfaces.Therefore, it is beneficial to investigate the oc-currences of chevron cracks in extrusion withspherical dies.
The objectives of this study were to measurethe critical damage values for typical materialsused in cold extrusion and to develop criteria or
guidelines for designing forward extrusion diesfor producing chevron-free extrusions. Ductilefracture can be defined as a fracture that occursafter a component experiences a significantamount of plastic deformation and is influencedby numerous parameters, including the defor-mation history of the workpiece material and theprocess conditions (i.e., rate of deformation,lubrication, and friction). Other factors that in-fluence fracture include chemical composition,microstructure, surface conditions, and homo-geneity.
At the Engineering Research Center for NetShape Manufacturing (ERC/NSM), a method-ology for predicting ductile fracture via FE sim-ulations was developed, as shown in Fig. 18.3.It was based on the modified Cockroft and La-tham criterion. Assuming the critical damagevalue is a material constant, several tests shouldbe performed to obtain, for a given material, theflow stress and the critical damage value (CDV).Once the CDV for a specific material is ob-tained, it is possible to predict through FEMsimulations the formation of cracks in formingoperations. Two different materials were se-lected, details of which could be found in [Han-nan et al., 2000]. Figure 18.4 shows that FEMcan successfully predict the formation of chev-ron cracks in forward extrusion using this meth-odology. The commercial FE code DEFORM(Scientific Forming Technologies Corp.) wasused for this study.
In summary, the CDV concept can be used topredict the possibility of fracture formation incold extrusion. Thus, using this concept andFEM simulation, die design and process se-quence can be modified to avoid fracture defectsin cold extrusion.
18.4.2 Modeling of Golf Ball MoldCavities [Hannan et el., 1999]
Golf ball mold cavities are manufactured bythe hobbing process. This process allows the

240 / Cold and Hot Forging: Fundamentals and Applications
Fig. 18.4 Simulation of chevron cracks and experimental validation [Hannan et al., 2000]
Fig. 18.3 Methodology to predict and prevent the formation of cracks in metal forming operations [Hannan et al., 2000]
molds to be manufactured more efficiently andreduces the cost. Finite-element modeling wasused in this study to design the tooling. A para-metric analysis was conducted to evaluate theeffect of various process conditions on the ma-terial flow and forming load for the hobbing pro-cess. For the parametric study, the tool designshown in Fig. 18.5 was used.
The results of FEM simulations showed thata design can be formulated that resulted in a
forming load that was realistic and did not sur-pass the yield strength of the tool material. How-ever, parametric analysis also showed problemswith material flow of the preform. In each simu-lation, dimples did not fill completely, as shownin Fig. 18.6.
Using the information from this study, a de-sign that resulted in good material flow (alldimples filled) and low forming loads was de-veloped. Two-dimensional (2-D) and three-di-

Process Modeling in Cold Forging Using Finite-Element Analysis / 241
Fig. 18.6 Incomplete filling of the dimples, as predicted by two-dimensional FEM simulations [Hannan et al., 1999]
Fig. 18.5 Tool setup and studied parameters in FEM [Hannan et al., 1999]
mensional (3-D) FEM simulations were used toanalyze the modified design that fills the dimplesof the lower punch completely and at realisticloads. The details of the study can be found in[Hannan et al., 1999].
18.4.3 Design of Automotive Parts
Net shape forging of power steering pinionswith helical teeth, helical gears, and inner racespresents a great challenge. However, the use ofcommercial 3-D FE software in process devel-opment has drastically reduced the productioncosts by eliminating multiple trials and, at thesame time, has improved part quality, tool life,and geometric complexity of forgings. Figure18.7 shows the application of FE simulations inthe design and development of the helical extru-sion process for manufacturing the pinion
shown. The advantages of using FEM to simu-late and hence design the optimum process were[Yamanaka et al., 2002]:
● Obtain a better drive feeling● Generate the tooth profile freely● Establish an iterative technique for die and
process design as well as heat treatment
Figure 18.8 shows the simulation of cold forg-ing of an automotive part. The actual part isshown, which has underfill and fracture. Theone-die two-blow process used to manufacturethis part was successfully simulated, and the re-sults show similar underfill and explain the frac-ture in the part.
18.4.4 Microforming of Surgical BladesThe trend in miniaturization allows the pro-
duction of cold forged parts with dimensions

242 / Cold and Hot Forging: Fundamentals and Applications
Fig. 18.8 Cold forging of an automotive part (a, b, c, and d are the stages of forming). Courtesy of DEFORM
Fig. 18.7 Development of steering pinion with the aid of FE simulation [Yamanaka et al., 2002]
less than 0.04 in. (1 mm) range for electronicsand biomedical applications. These parts arecurrently produced by 3-D etching and othermetal-removal processes. Microforming is a po-tential process for mass production of net shape/near-net shape microcomponents. However, formicroforming to be cost-effective and competi-
tive, a comprehensive knowledge pertaining tothe following factors is needed: scale effects/mi-croplasticity, effect of microstructure on the pro-cess, relative stiffness of the tooling, and processcontrol and capability.
With the aid of FEM, the interrelationshipsbetween these variables can be studied so as to
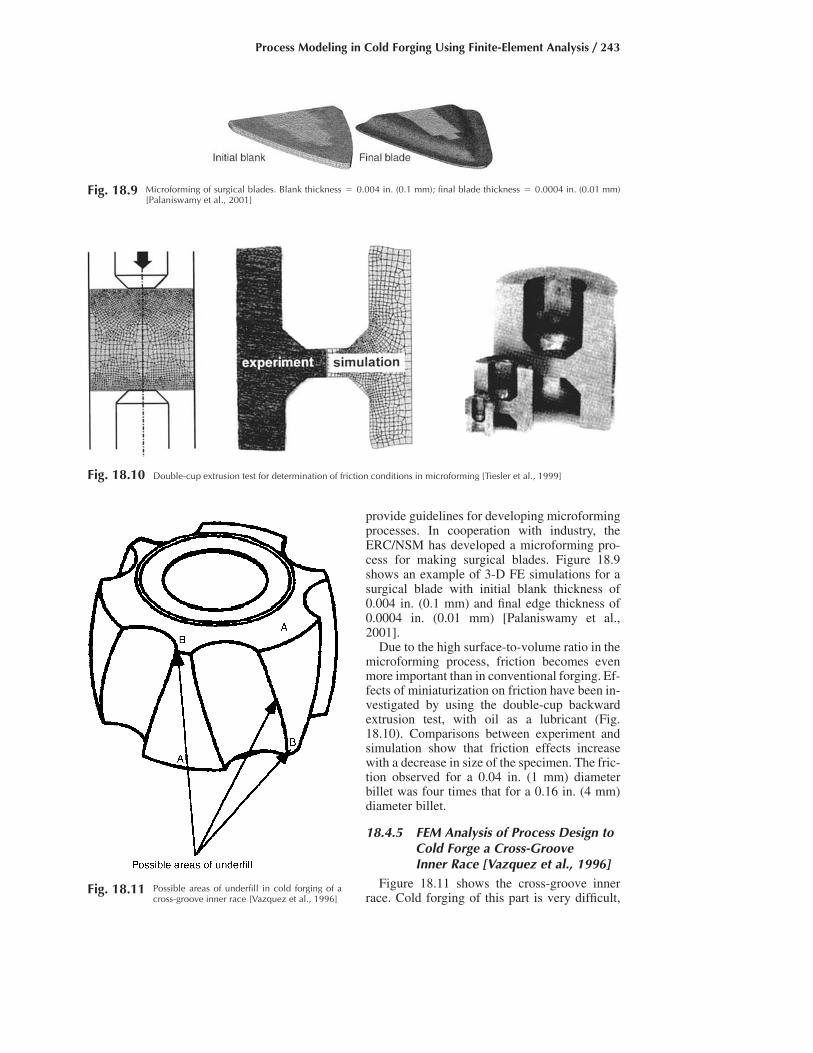
Process Modeling in Cold Forging Using Finite-Element Analysis / 243
Fig. 18.9 Microforming of surgical blades. Blank thickness � 0.004 in. (0.1 mm); final blade thickness � 0.0004 in. (0.01 mm)[Palaniswamy et al., 2001]
Fig. 18.10 Double-cup extrusion test for determination of friction conditions in microforming [Tiesler et al., 1999]
Fig. 18.11 Possible areas of underfill in cold forging of across-groove inner race [Vazquez et al., 1996]
provide guidelines for developing microformingprocesses. In cooperation with industry, theERC/NSM has developed a microforming pro-cess for making surgical blades. Figure 18.9shows an example of 3-D FE simulations for asurgical blade with initial blank thickness of0.004 in. (0.1 mm) and final edge thickness of0.0004 in. (0.01 mm) [Palaniswamy et al.,2001].
Due to the high surface-to-volume ratio in themicroforming process, friction becomes evenmore important than in conventional forging. Ef-fects of miniaturization on friction have been in-vestigated by using the double-cup backwardextrusion test, with oil as a lubricant (Fig.18.10). Comparisons between experiment andsimulation show that friction effects increasewith a decrease in size of the specimen. The fric-tion observed for a 0.04 in. (1 mm) diameterbillet was four times that for a 0.16 in. (4 mm)diameter billet.
18.4.5 FEM Analysis of Process Design toCold Forge a Cross-GrooveInner Race [Vazquez et al., 1996]
Figure 18.11 shows the cross-groove innerrace. Cold forging of this part is very difficult,

244 / Cold and Hot Forging: Fundamentals and Applications
Fig. 18.12 Example of FEM analysis of forging process sequence design [Kim et al., 1996]
as the grooves of the inner race act as undercuts.Thus, the objective of this study was to developa new design concept for tooling to improve thetolerance that is achievable in the cold forgedgroove. Figure 18.11 shows the possible areas(marked as B) of underfill. Two plausible de-signs were chosen for investigation from severalother designs. Physical modeling and FE anal-ysis were used to analyze the designs selected.Two-dimensional FEM simulations were per-formed for preliminary investigation of themetal flow. DEFORM was used for both 2-Dand 3-D FEM simulations. The results of 2-Dsimulations give a window of operation for fur-ther investigation, though they may not accu-rately predict all the parameters. In order to ob-tain a more accurate prediction of the metal flow,strains, and the contact pressure distribution be-tween the billet and the die, 3-D FEM simula-tions (one-sixth of the billet, due to symmetry)were conducted. The calculations showed that,at the end of the stroke, the die cavity pressureincreases considerably. Since the maximumpressure should not exceed a certain limit, it isnecessary to control the motion and pressures ofthe inner punches. This study clearly illustratedthat in the multiaction forming process of thecross-groove inner race, a compromise between
cavity filling and pressure must be achieved.Three-dimensional FEM simulations of differentconcepts for the punch motion help to select thebest tool design before the actual tooling is built.The details of this study are given in [Vazquezet al., 1996].
18.4.6 Computer-Aided DesignSystem and FEM Application forProcess Design inCold Forging [Kim et al., 1996]
Instead of trying to develop computer systemsto automate the forming sequence design, thegoal should be to develop computer-aided toolsto assist die designers, while they “do” the de-sign. Such a computer-aided design (CAD)system was developed at ERC/NSM. It consistsof three parts: a computer program calledFORMEX, a commercial CAD program, and acommercial FE program, DEFORM. In order toincrease the capabilities of FORMEX, forgingsequences collected from references and indus-try were entered in the “sequence library.” Fi-nite-element simulations were conducted toevaluate the sequence generated. Figure 18.12shows an example of FE simulation of such asequence. This shows that FE simulations of

Process Modeling in Cold Forging Using Finite-Element Analysis / 245
Fig. 18.13 Three-dimensional finite-element model for or-bital forming simulation [Cho et al., 2003]
metal forming processes can assist the designersin establishing and optimizing process variablesand die design. As a result, process developmenteffort and cost can be reduced.
18.4.7 Advanced Orbital FormingSimulations [Cho et al., 2003]
Orbital forging is an incremental forging pro-cess with a complicated die movement that canbe used to reduce axial load requirements foraxisymmetric or near-axisymmetric forgingoperations. At the ERC/NSM, orbital forgingsimulations were conducted to study and de-velop a robust assembly process of an automo-bile spindle. Orbital forming requires a numberof revolutions to form a part. Therefore, in FEM
simulation, a relatively large number of simu-lation steps are required to minimize the errorsin solution accuracy. Also, a full 3-D modelingis required, due to an asymmetric rotational toolmovement. Figure 18.13 shows the FE model.Figure 18.14 shows the predicted metal flow atintermediate stages of forming. Solution accu-racy was verified by comparing the predictedforces and tab outer diameters with experimentalmeasurements, and good agreement was ob-tained.
REFERENCES
[Altan et al., 1990]: Altan, T., Oh, S.I., “Appli-cation of FEM to 2-D Metal Flow Simulation:Practical Examples,” Advanced Technology ofPlasticity, Vol 4, p 1779, 1990.
[Altan et al., 2001]: Dixit, R., Ngaile, G., Altan,T., “Measurement of Flow Stress for ColdForging,” ERC/NSM-01-R-05, EngineeringResearch Center for Net Shape Manufactur-ing.
[Altan et al., 2003]: Cho, H., Ngaile, G., Altan,T., “Simultaneous Determination of FlowStress and Interface Friction by Finite Ele-ment Based Inverse Analysis Technique,” En-gineering Research Center for Net ShapeManufacturing, submitted for publication toCIRP.
[Cho et al., 2003]: Cho, H., Kim, N., Altan, T.,“Simulation of Orbital Forming Process Us-ing 3-D FEM and Inverse Analysis for Deter-mination of Reliable Flow Stress,” submitted
Fig. 18.14 Predicted metal flow at intermediate stages of simulation [Cho et al., 2003]

246 / Cold and Hot Forging: Fundamentals and Applications
to Third International Seminar for PrecisionForging, Japan Society for Technology ofPlasticity (Nagoya, Japan), 2003.
[Hannan et al., 1999]: Hannan, D., Vazquez, V.,Altan, T., “Precision Forging of Golf BallMold Cavities,” Report No. PF/ERC/NSM-99-R-12A, Engineering Reseach Center forNet Shape Manufacturing.
[Hannan et al., 2000]: Hannan, D., and Altan,T., “Prediction and Elimination of Defects inCold Forging Using Process Simulation,”Tenth International Cold Forging Congress,International Cold Forging Group, Sept 13–15, 2000 (Stuttgart).
[Kim et al., 1996]: Kim, H., and Altan, T.,“Cold Forging of Steel—Practical Examplesof Computerized Part and Process Design,”Journal of Materials Processing Technology,Vol 59, 1996, p 122.
[Messner et al., 1994]: Messner, A., Engel, U.,Kals, R., Vollertsen, F., “Size effect in the FEsimulation of microforming processes,”JMPT, Vol 45, p 374, 1994
[Palaniswamy et al., 2001]: Palaniswamy, H.,Ngaile, G., Altan, T., “Coining of Surgical SlitKnife,” F/ERC/NSM-01-R-26, Engineering
Research Center for Net Shape Manufactur-ing.
[Tiesler et al., 1999]: Tiesler, N., Engel, U.,Geiger, M., “Forming of Microparts—Effectsof Miniaturization on Friction,” AdvancedTechnology of Plasticity, Vol. 2, Proceedingsof the Sixth ICTP, Sept. 19–24, 1999.
[Vazquez et al., 1996]: Vazquez, V., Sweeney,K., Wallace, D., Wolff, C., Ober, M., Altan,T., ”Tooling and Process Design to ColdForge a Cross Groove Inner Race for a Con-stant Velocity Joint—Physical Modeling andFEM Process Simulation,” JMPT, Vol 59, p144–157.
[Yamanaka et al., 2002]: Yamanaka, M., andSunami, F., “Tool Design for Precision Forg-ing,” Cold and Warm Precision ForgingWorkshop, Schuler Inc., Yamanaka Engineer-ing, Scientific Forming Technologies Corp.,and ERC/NSM, Nov 14, 2002 (Canton, MI).
SELECTED REFERENCE
● [Hayama, 1969]: Hayama, M., Plasticityand Plastic Working, Ohmusha, 1969, p 125.

CHAPTER 19
MicrostructureModeling in Superalloy ForgingGangshu Shen
19.1 Introduction
In aerospace forging, in addition to meetingthe geometry requirements, meeting microstruc-ture and mechanical property requirements ofcomponents plays a major role in the develop-ment of the forging processes and sequences.The understanding and prediction of microstruc-tures that develop during the hot deformationprocessing has long been the “art” of forgingmetallurgists. Many tools, such as wedge tests,were used in the past to understand the impactof temperature, strain, and strain rate on micro-structures and properties and to guide metallur-gists in process development [Deridder andKoch, 1979]. These methods were good, butquantitative extraction of various processing pa-rameters on the resulting microstructures andproperties was not effectively accomplished.The application of finite-element modeling(FEM) to forging made it possible to obtain thedetailed thermomechanical histories at each in-dividual location of the forged components. Mi-crostructure modeling procedures were devel-oped to make use of this information for grainsize and property predictions for steels [Sellars,1979] and superalloys [Shen et al., 1995, andShen and Hardwicke, 2000].
In this chapter, the experimental procedure,microstructure model formulation, and the ap-plication of the microstructure model in super-alloy forgings are discussed.
19.2 Experiments for MicrostructureModel Development
Hot forging involves preheating, deformation,transfer, and dwell (resting) between operationsand final postforging cooldown. Small-scale ex-periments were run to simulate these operationsand to establish the relationship between vari-ables and microstructures and to generate datafor the development of a microstructure model.Real-scale tests were run to compare the modelprediction with reality. Three sets of experi-ments were used in the model development.
19.2.1 Preheating Tests
Heat treatment studies were conducted withdifferent temperatures and hold times to producethe as-preheated grain size for a forging opera-tion. From these tests, the grain growth modelfor preheating of a particular billet pedigree wasdeveloped. This model was then used to estab-lish the preheated grain size (d0) just prior tosubsequent forging operations.
19.2.2 Compression Tests
Laboratory upset tests were conducted withdifferent temperatures, strains, strain rates, as-preheated grain sizes, and postdeformation holdtimes to characterize dynamic recrystallizationduring forging and meta-dynamic recrystalliza-tion and static grain growth during postforging
Cold and Hot Forging Fundamentals and ApplicationsTaylan Altan, Gracious Ngaile, and Gangshu Shen, editors, p247-255 DOI:10.1361/chff2005p247
Copyright © 2005 ASM International® All rights reserved. www.asminternational.org

248 / Cold and Hot Forging: Fundamentals and Applications
cooldown. Both the MTS Systems Corporationcompression stand and Gleeble test unit wereused to perform these compression tests. The ad-vantage of the MTS test stand is that it can pro-vide more uniform temperature of the work-piece. The advantage of the Gleeble test is thatit can perform a fast postforging cooling with acontrolled manner. From these compressiontests with rapid postdeformation cooling, infor-mation related to dynamic recrystallization ki-netics was obtained. The kinetics information in-cluded: peak strain for dynamic recrystallization
which is related to the critical strain for(e ),pdynamic recrystallization the strain that(e );ccorresponds to 50% (0.5 fraction) dynamic re-crystallization the fraction of dynamic re-(e );0.5crystallization (Xdyn); and the size of dynami-cally recrystallized grains (ddyn). Informationregarding meta-dynamic recrystallization andpostforging grain growth was also obtained fromcompression tests with controlled postforge holdtimes. This information included: time for 50%meta-dynamic recrystallization (t0.5), fraction ofmeta-dynamic recrystallization (Xm-dyn), meta-dynamically recrystallized grain size (dm-dyn),and grain growth at a given temperature andtime after the completion of meta-dynamic re-crystallization.
19.2.3 Pancake and Generic Forgings
In addition to laboratory tests, large pancakesand generic component configurations were pro-duced on production equipment under variousforging conditions and methods to assess the mi-crostructure model.
Finite-element analysis was used for each ex-periment to provide detailed information foreach test. Thus, accurate thermal-mechanicalhistories of local points of forged samples wereused to develop the models for the microstruc-ture evolution of Waspaloy during the forgingprocess.
19.3 MicrostructureModel Formulation
The processes that control grain structure evo-lution during hot working of superalloys werefound to be dynamic recrystallization, meta-dy-namic recrystallization, and static grain growth.Microstructure model formulation is discussedin these three categories. Waspaloy formulas areused as examples here [Shen et al, 1995].
19.3.1 Dynamic Recrystallization
Dynamic recrystallization happens instanta-neously during high-temperature deformation.The fraction of dynamic recrystallization can beobtained by examining micrographs obtainedfrom samples quenched after the deformation.Under production conditions, pure dynamic re-crystallization is difficult to achieve. This is be-cause meta-dynamic recrystallization often fol-lows immediately. The amount of dynamicrecrystallization is related to the as-preheatedgrain size (d0), effective strain temperature(e),(T), and effective strain rate in a hot defor-˙(e)mation process. There are four important param-eters related to dynamic recrystallization: thepeak strain the strain for 50% dynamic re-(e ),pcrystallization the fraction of dynamic re-(e ),0.5crystallization (Xdyn), and the size of dynami-cally recrystallized grains (ddyn).
Peak Strain. The strain corresponding to thepeak stress in the flow stress curve is an(e )pimportant measure for the onset of dynamic re-crystallization. The occurrence of dynamic re-crystallization modifies the appearance of flowcurves. At the strain rates typical for forging ofWaspaloy, single-peak stress-strain curves aremost common. As a result of dynamic recrys-tallization, the stress diminishes to a value in-termediate between the yield stress and the peakstress once past the peak strain. The reason forthis curve following a single peak is that underthe condition of high Z (Zener-Hollomon pa-rameter, Z � for Waspaloy),˙e exp[468000/RT]the dislocation density can be built up very fast.Before recrystallization is complete, the dislo-cation densities at the center of recrystallizedgrains have increased sufficiently that anothercycle of nucleation occurs, and new grains beginto grow again. Thus, average flow stress inter-mediate between the yield stress and the peakstress is maintained. The equations developedfor the peak strain for Waspaloy are:
�4 0.54 0.106e � 5.375 � 10 d Zp 0
(sub- and in-c� solvus) (Eq 19.1)
�4 0.54 0.106e � 1.685 � 10 d Z (super-c� solvus)p 0
(Eq 19.2)
Strain for 50% Dynamic Recrystallization.Micrographs taken from quenched compressionsamples show that dynamic recrystallizationprogresses in a sigmoidal manner with respect

Microstructure Modeling in Superalloy Forging / 249
Fig. 19.1 Schematic of strain corresponding to 50% (0.5fraction) dynamic recrystallization (DRX) for a
given condition of temperature, strain rate, and as-preheatedgrain size
to strain. The Avrami equation can be used todescribe a sigmoidal curve for the fraction ofdynamic recrystallization versus strain:
nX � 1 � exp{�ln2[e/e ] } (Eq 19.3)dyn 0.5
When the constants and n are determined,e0.5the relation for the fraction of dynamic recrys-tallization is determined. The strain for 50% re-crystallization, can be obtained from com-e ,0.5pression tests with different magnitudes of strainfor a given condition of temperature, strain rate,and as-preheated grain size, as shown in Fig.19.1. The exponent can be obtained by takingthe logarithm of Eq 19.3. is related to as-e0.5preheated grain size, d0, and Z by:
0.32 0.03e � 0.145 d Z (sub-c� solvus) (Eq 19.4)0.5 0
0.32 0.03e � 0.056 d Z (in-c� solvus) (Eq 19.5)0.5 0
0.29 0.04e � 0.035 d Z (super-c� solvus)0.5 0
(Eq 19.6)
Fraction of Dynamic Recrystallization. Af-ter the strain for 50% dynamic recrystallizationand the exponent n for Eq 19.3 are determined,equations for the fraction of dynamically re-crystallized grains can be formulated for Was-paloy as below:
3.0X � 1 � exp{�ln2[e/e ] } (sub-c� solvus)dyn 0.5
(Eq 19.7)
2.0X � 1 � exp{�ln2[e/e ] } (in-c� solvus)dyn 0.5
(Eq 19.8)
1.8X � 1 � exp{�ln2[e/e ] } (super-c� solvus)dyn 0.5
(Eq 19.9)
Figures 19.2(a) and (b) summarize the exper-imental data and the fitted model for Waspaloydynamic recrystallization at 1850 and 1951 �F(1010 and 1066 �C), respectively.
The critical strain for the start of dynamic re-crystallization usually follows the relationship[Sellars, 1979]:
e � 0.8 e (Eq 19.10)c p
The Size of Dynamically RecrystallizedGrain. The dynamically recrystallized grain sizeis the function of the Zener-Hollomon parame-ter, Z, only. This is because Z defines the densityof the subgrains and the nuclei. Though the dy-namically recrystallized grain size is not relatedto strain, the strain has to reach the value ofsteady-state strain to result in full dynamic re-crystallization. The relationship between dy-namically recrystallized grain, ddyn, and Z isshown as follows:
�0.16d � 8103 Z (sub- and in-c� solvus)dyn
(Eq 19.11)
�0.0456d � 108.85 Z (super-c� solvus)dyn
(Eq 19.12)
Figure 19.3 shows the correlation between theexperimental data and Eq 19.11 and 19.12. It isseen that there is a difference between subsolvusforging and supersolvus forging in terms of thesizes of the dynamically recrystallized grains.The subsolvus forging results in finer grainsizes, while supersolvus forging results in coarsegrain sizes. However, subsolvus forging needslarge strains to finish dynamic recrystallization,as shown in Eq 19.4 and 19.7.
19.3.2 Meta-Dynamic Recrystallization
Meta-dynamic recrystallization is importantin the determination of the grain size obtainedunder practical forging conditions. Meta-dy-namic recrystallization occurs when a deforma-tion stops at a strain that passes the critical strainfor dynamic recrystallization but does not reachthe steady-state strain for dynamic recrystalli-zation [McQueen and Jonas, 1975], which is thecase for most regions in a forged part. Undermeta-dynamic recrystallization conditions, the
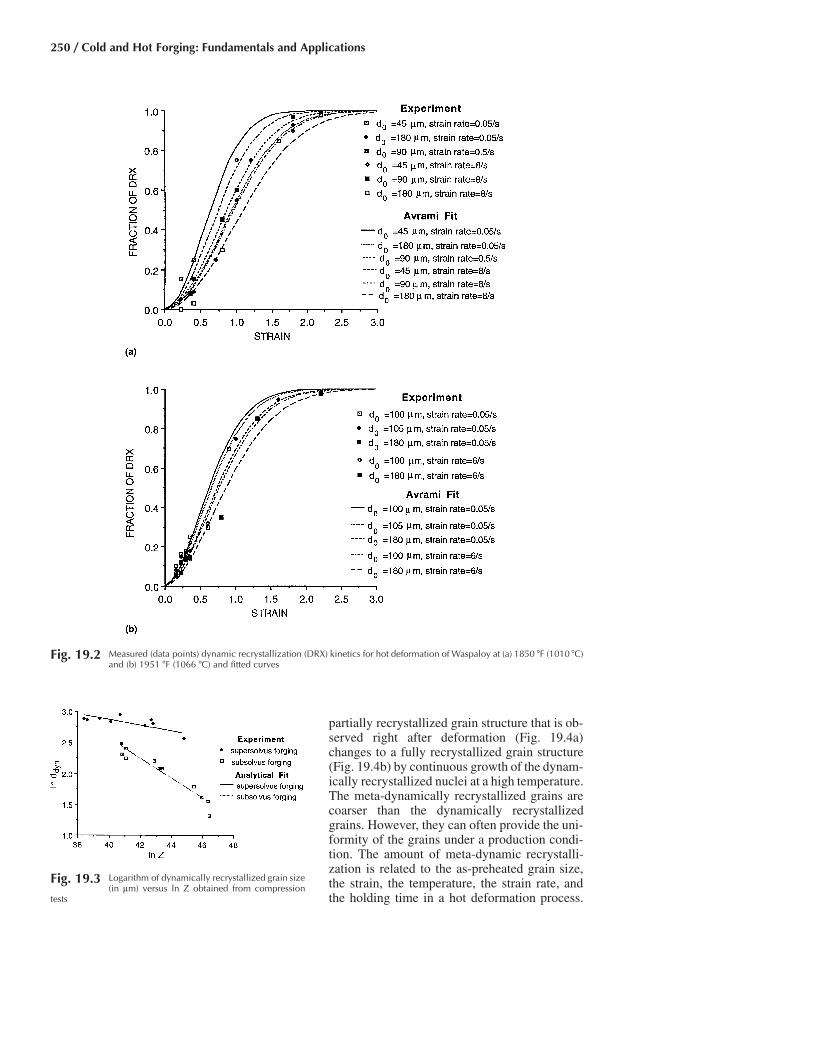
250 / Cold and Hot Forging: Fundamentals and Applications
Fig. 19.2 Measured (data points) dynamic recrystallization (DRX) kinetics for hot deformation of Waspaloy at (a) 1850 �F (1010 �C)and (b) 1951 �F (1066 �C) and fitted curves
Fig. 19.3 Logarithm of dynamically recrystallized grain size(in lm) versus ln Z obtained from compression
tests
partially recrystallized grain structure that is ob-served right after deformation (Fig. 19.4a)changes to a fully recrystallized grain structure(Fig. 19.4b) by continuous growth of the dynam-ically recrystallized nuclei at a high temperature.The meta-dynamically recrystallized grains arecoarser than the dynamically recrystallizedgrains. However, they can often provide the uni-formity of the grains under a production condi-tion. The amount of meta-dynamic recrystalli-zation is related to the as-preheated grain size,the strain, the temperature, the strain rate, andthe holding time in a hot deformation process.

Microstructure Modeling in Superalloy Forging / 251
Fig. 19.4 Micrographs obtained from Waspaloy samples with different cooling histories after forging. (a) Rapidly cooled immedi-ately after deformation. (b) Rapidly cooled after a 5 s hold at deformation temperature (1951 �F, or 1066 �C)
Important parameters related to meta-dynamicrecrystallization are the time for 50% meta-dy-namic recrystallization (t0.5), the fraction ofmeta-dynamic recrystallization (Xm-dyn), and thesize of the meta-dynamically recrystallized grain(dm-dyn).
Time for 50% Meta-Dynamic Recrystalli-zation. Meta-dynamic recrystallization is timedependent. For a given strain, strain rate, and as-preheated grain size, meta-dynamic recrystalli-zation progresses in the following manner withrespect to time:
nX � 1 � exp{�ln2[t/t ] } (Eq 19.13)m-dyn 0.5
The t0.5 can be obtained from compressiontests with different holding times for a giventemperature, strain, strain rate, and as-heatedgrain size. The empirical t0.5 for meta-dynamicrecrystallization follows:
�5 0.51 �1.28 �0.073˙t � 4.54 � 10 d e e exp(9705/T)0.5 0
(Eq 19.14)
The exponent, n, for meta-dynamic recrystal-lization is found to be 1 for Waspaloy. This num-ber is typical for meta-dynamic recrystallization[Jonas, 1976, and Devadas et al., 1991].
Fraction of Metadynamic Recrystalliza-tion. The fraction of meta-dynamic recrystalli-zation progresses according to:
1.0X � 1 � exp{�ln2[t/t ] } (Eq 19.15)m-dyn 0.5
Figures 19.5(a) and (b) show the fraction ofmeta-dynamic recrystallization versus time ob-tained from the experiments and the predictionsat 1951 �F (1066 �C) with different as-preheatedgrain size, strain, and strain-rate conditions. Themeta-dynamic recrystallization finishes soonerfor cases of larger strains, finer as-preheatedgrain sizes, higher strain rates, and higher tem-peratures.
Meta-Dynamic Recrystallized Grain Size.The grain size obtained at the end of meta-dy-namic recrystallization is found to have the fol-lowing relationship with the strain, the as-pre-heated grain size, and the Zener-Hollomonparameter, Z:
0.33 �0.44 �0.026d � 14.56d e Z (Eq 19.16)m-dyn 0
The meta-dynamic recrystallized grain size inASTM number versus strain under conditionswith different as-preheated grain sizes, tempera-tures, and strain rates is shown in Fig. 19.6.
19.3.3 Grain Growth
Under high-temperature deformation condi-tions, grain growth happens rapidly after thecompletion of meta-dynamic recrystallization.Grain-boundary energy is the driving force caus-ing grain-boundary motion at high temperature.Grain-boundary energy is comparable to the sur-face energy; i.e., it tends to minimize itselfwhenever possible by decreasing the grain-boundary area. In general, grain growth willcontinue to occur at elevated temperatures until

252 / Cold and Hot Forging: Fundamentals and Applications
Fig. 19.5 Fraction of meta-dynamic recrystallization (DRX) versus time at 1951 �F (1066 �C) with a strain of (a) 0.22 and (b) 0.6to 1.3
the balance between the grain-boundary energyand the pinning effects of precipitates (precipi-tate size and spacing) is reached.
Grain growth is characterized by compressiontests with different postforging hold times. Fromthe micrographs obtained from these tests, themicrostructural evolution from partial dynamicrecrystallization to full meta-dynamic recrystal-lization and to grain growth was observed. Thechange in grain size versus time after the com-pletion of meta-dynamic recrystallization isfound to follow:
3 3 26d � d � 2 � 10 t exp(�595000/[RT])m-dyn
(Eq 19.17)
The form of Eq 19.17 is well known for thecharacterization of grain growth. The reason for
emphasizing that the dm-dyn is the grain size aftercomplete meta-dynamic recrystallization is thatafter the completion of meta-dynamic recrystal-lization, the dislocations have essentially disap-peared, and the driving force for grain sizechanges is the grain-boundary energy only.
The experimentally obtained data and themodel prediction for the short-time grain growthare shown in Fig. 19.7. It is seen from this figurethat the grain growth at a temperature of ap-proximately 2050 �F (1121 �C) is very fast.There was not much difference in grain size afterthe completion of meta-dynamic recrystalliza-tion between the two samples obtained fromcompression tests at 1951 and 2050 �F (1066 and1121 �C) (Fig. 19.3 and 19.7). However, thegrain growth results in a large difference in thefinal grain size between the two sets of tests.

Microstructure Modeling in Superalloy Forging / 253
Fig. 19.7 Grain growth versus time after the completionof meta-dynamic recrystallization in Waspaloy
forging
Fig. 19.6 Meta-dynamic recrystallized grain size versus strain for various process conditions
19.3.4 Model Summary
It is seen from these equations that the majorfactors in the control of the grain size in the forg-ing of Waspaloy are strain, temperature-com-pensated strain rate, and the as-preheated grainsize.
Strains create localized high densities of dis-locations. To reduce their energy, dislocationsrearrange into subgrains. When the subgrainsreach a certain size, the nuclei of new grainsform. The higher the strain, the greater theamount of dislocations and the greater the num-ber of cycles of recrystallization. Hence, largerstrains result in a higher percentage of recrys-tallization.
The reason that deformation under high-Zconditions gives finer grain size is that an in-crease in Z results in the increase in the subgraindensity, which gives a higher density of nuclei.There are also more cycles of recrystallizationpresent under high values of Z. Thus, the size ofthe recrystallized grains decreases [McQueenand Jonas, 1975].
At a given strain, the as-preheated grain sizeplays an important role in the determination ofthe fraction of recrystallization and recrystalli-zed grain size, because when polycrystallinemetal is deformed, the grain boundaries interruptthe slip processes. Thus, the lattice adjacent tograin boundaries distorts more than the center ofthe grain. The smaller the as-preheated grain, thelarger the grain-boundary area and the volumeof distorted metal. As a consequence, the num-ber of possible sites of nucleation increases, the
rate of nucleation increases, and the size of therecrystallized grains decreases. Moreover, theuniformity of distortion increases with the de-crease in as-preheated grain size. Therefore,having a fine as-preheated initial grain size isvery important for obtaining a fine recrystallizedfinal grain size.
The equations developed for the quantitativeprediction of these phenomena for Waspaloy aresummarized in Table 19.1.

254 / Cold and Hot Forging: Fundamentals and Applications
Fig. 19.8 Comparison of model prediction and experimen-tal results. Fraction of recrystallization of a 718
developmental forging
Table 19.1 Mathematical model formicrostructure development in Waspaloyforging
Dynamic recrystallization
Z � exp(468000/RT)˙e�e 0.8ec p
Subsolvus forging� 5.375 � 10�4 d0
0.54 Z0.106ep
� 0.145 d00.32 Z0.03e0.5
Xdyn � 1 � exp{�ln2 3.0[e/e ] }0.5
ddyn � 8103 Z�0.16
In-solvus forging� 5.375 � 10�4 d0
0.54 Z0.106ep
� 0.056 d00.32 Z0.03e0.5
Xdyn � 1 � exp{�ln2 2.0[e/e ] }0.5
ddyn � 8103 Z�0.16
Supersolvus forging� 1.685 � 10�4 d0.54 Z0.106ep
� 0.035 d00.29 Z0.04e0.5
Xdyn � 1 � exp{�ln2 1.8[e/e ] }0.5
ddyn � 108.85 Z�0.0456
Meta-dynamic recrystallization
t0.5 � 4.54 � 10�5 d00.51 exp(9705/T)�1.28˙�0.073e e
Xm-dyn � 1 � exp{�ln2[t/t0.5]1.0}
dm-dyn � 14.56d00.33 �0.44 �0.026e Z
Grain Growth
d3 � dm-dyn3 � 2 � 1026 t exp(�595000/[RT])
19.4 Prediction of Microstructure inSuperalloy Forging
The methodology used in Waspaloy micro-structure model development has also been usedfor superalloy 718 [Shen, 2000]. The modelsare integrated into finite-element softwareDEFORM (Scientific Forming TechnologiesCorp.) to predict microstructures developed fordifferent forging processes [Wu and Oh, 1985,and Scientific Forming Technologies Corp.,2002].
Figures 19.8 and 19.9 are the comparison ofmodel prediction and experimentally obtainedvalues (numbers shown on the contours) of re-crystallization and average ASTM grain size ofa hammer-forged 718 disk [Shen et al., 2001].Multiple dies were used in this hammer forging.The blow-by-blow simulation was run for thehammer forging in the FEM code DEFORM thatallows the entire thermal-mechanical history ofthe hammer forging to be stored in the computer.The microstructure model uses the thermal-me-chanical history of the hammer forging to pre-dict the recrystallization and grain size of thehammer-forged 718 disk. Figures 19.8 and 19.9show that the fraction of recrystallization and theASTM average grain size predicted by themodel agree well with the experimentally mea-sured values.
Figure 19.10 shows the model-predictedASTM grain sizes and the experimentally mea-sured ASTM grain sizes for an experimentalWaspaloy disk. The forging process involved ahydraulic press isothermal forging followed bya hammer forging [Stewart, 1988]. Again, themodel predicted well the average grain size ofthe forged Waspaloy disk. These examples showthat the microstructure model is capable of pre-dicting the recrystallization and grain size forquite complex processes, such as hammer forg-ing with multiple blows and die sets and thecombination of press and hammer forgings.
19.5 Nomenclature ofMicrostructure Model
d final grain size, lmd0 as-preheated grain size, lm
Fig. 19.9 Comparison of model prediction and experimen-tal results. Average ASTM grain size of a 718 de-
velopmental forging

Microstructure Modeling in Superalloy Forging / 255
ddyn dynamically recrystallized grain, lmdm-dyn meta-dynamically recrystallized grain,
lmn exponent for Avrami equationQ activation energy, J/molR gas constant, 8.314 J/(mol•K)T temperature, Kt time, st0.5 time for 50% meta-dynamic recrystal-
lizationXdyn fraction of dynamic recrystallizationXm-dyn fraction of meta-dynamic recrystalli-
zationZ Zener-Hollomon parameter, 1/se effective straine0.5 effective strain for 50% dynamic re-
crystallizationec critical strain for dynamic recrystalli-
zationep peak strain for dynamic recrystalliza-
tion˙e effective strain rate
REFERENCES
[Deridder and Koch, 1979]: Deridder, A.J., andKoch, R., “Forging and Processing of HighTemperature Alloys,” MiCon 78: Optimiza-tion of Processing, Properties, and ServicePerformance through Microstructural Con-trol, STP 672, H. Abrams et. al, Ed., Ameri-can Society for Testing and Materials, p 547–563.
[Devadas et al., 1991]: Devadas, C., “The Ther-mal and Metallurgical State of Strip duringHot Rolling: Part III, Microstructural Evolu-tion,” Met. Trans. A., p 335–349.
[Jonas, 1976]: Jonas, J.J., “Recovery, Recrys-tallization and Precipitation under Hot Work-
ing Conditions,” Proceedings of the FourthInternational Conference on Strength of Met-als and Alloys (Nancy, France), p 976–1002.
[McQueen and Jonas, 1975]: McQueen, H.J.,and Jonas, J.J., “Recovery and Recrystalliza-tion during High Temperature Deformation,”Treatise on Materials Science and Technol-ogy, Vol. 6, Academic Press, p 393–493.
[Scientific Forming Technologies Corp.,2002]: DEFORM 7.2 User Manual, ScientificForming Technologies Corp., Columbus, OH.
[Sellars, 1979]: Sellars, C.M., Hot Working andForming Processes, C.M. Sellars and G.J. Da-vies, Ed., TMS, London, p 3–15.
[Shen, 2000]: Shen, G., “Microstructure Mod-eling of Forged Components of Ingot Metal-lurgy Nickel Based Superalloys,” AdvancedTechnologies for Superalloy Affordability,K.M. Chang et al., Ed., The Minerals, Metals,and Materials Society.
[Shen et al., 2001]: Shen, G., et al., “Advancesin the State-of-the-Art of Hammer Forged Al-loy 718 Aerospace Components,” Superalloys718, 625, 706 and Various Derivatives, E.A.Loria, Ed., TMA.
[Shen et al., 1995]: Shen, G., et al., “ModelingMicrostructural Development during theForging of Waspaloy,” Met. Trans. A., p1795–1802.
[Shen and Hardwicke, 2000]: Shen, G., andHardwicke, C., “Modeling Grain Size Evo-lution of P/M Rene 88DT Forgings,” Ad-vanced Technology for Superalloy Affordabil-ity, K.M. Chang et al., Ed., The MineralsMetals and Materials Society.
[Stewart, 1988]: Stewart, D., “ISOCON Manu-facturing of Waspaloy Turbine Discs,” Super-alloys, S. Reichman et al., Ed., TMS, p 545–551.
[Wu and Oh, 1985]: Wu, W.T., and Oh, S.I.,“ALPIDT—A General Purpose FEM Codefor Simulation of Nonisothermal Forging Pro-cesses,” Proceedings of North AmericanManufacturing Research Conference(NAMRC) XIII (Berkley, CA), p 449–460.
SELECTED REFERENCE
● [Shen et al., 1996]: Shen, G., et al., “Micro-structure Development in a Titanium Alloy,”The Proceedings of the Symposium on Ad-vances in Science and Technology of Tita-nium (Anaheim, CA), TMS.
Fig. 19.10 Comparison of model predicted and experimen-tally obtained. Average ASTM grain size of a
Waspaloy developmental forging
CHAPTER 20
Isothermal and Hot-Die ForgingManas ShirgaokarGangshu Shen
20.1 Introduction
The manufacturing processes used to produceaerospace forgings depend on several factors, in-cluding component geometry, property require-ments, and economics [Williams, 1996, andNoel et al., 1997]. With regard to economics, allforging operations must be optimized to reducethe amount of metal required to make the finalcomponent shape. Titanium and nickel-base su-peralloys, two widely used materials for aero-space components, are relatively expensive andhard to machine. Adding extra metal to the forg-ing configuration results in added input metaland machining costs to produce the final com-ponents. Isothermal forging was developed toprovide a near-net shape component geometryand well-controlled microstructures and prop-erties with accurate control of the working tem-perature and strain rate. Isothermal forging,however, requires a large initial capital invest-ment for equipment. Hot-die forging was devel-oped to make some sacrifice in die temperatureand net shape capability while lowering the ini-tial investment. All of the isothermal and hot-die forged aerospace parts require a stringentpostforging heat treatment to produce the opti-mum microstructure and properties of the com-ponents.
20.2 Isothermal Forging
Isothermal hydraulic press forging has beendeveloped for near-net shape forging of materi-als that are difficult to process. Isothermal forg-
ing was first practiced in production using IN-100 material. Alloys such as IN-100, Rene 95,Rene 88, N 18, U-720, Waspaloy, Gamma-TiAl,Ti-6-2-4-6, IMI 834, Ti-6Al-4V, and others canbe forged economically only by using the iso-thermal forging technique.
In an isothermal forging process, the dies areheated to the same temperature as the work-piece, allowing near-net shape configurations tobe formed, which results in the use of less rawmaterial and minimum postforging machining.In isothermal forging of titanium and nickel-base superalloys, since the forging temperaturesare very high (1700 to 2200 �F, or 925 to 1205�C), superalloys and molybdenum alloys are of-ten used as tooling materials. Since molybde-num alloys are prone to rapid oxidation at hightemperatures, a vacuum or inert atmosphere isused, which also increases the capital investmentin isothermal forging.
Nickel-base superalloys were developed forsuperior elevated-temperature strength andcreep resistance. Therefore, they are difficult toprocess in the wrought form. Highly alloyed castand wrought superalloys have a very narrowprocessing window. The new, even higher-alloy-content powder metallurgy (P/M) materials areeven more temperature and strain-rate sensitiveand require a low strain-rate superplastic forgingcondition to avoid abnormal structure being de-veloped during postforging heat treatments[Soucail et al., 1996]. The strain rate used inisothermal forging is usually low to reduce theadiabatic heating, maintain superplastic materialbehavior, and meet the processing requirementsof P/M superalloys. Though the strain rate is lowand the forging time is long in isothermal forg-
Cold and Hot Forging Fundamentals and ApplicationsTaylan Altan, Gracious Ngaile, Gangshu Shen, editors, p257-275 DOI:10.1361/chff2005p257
Copyright © 2005 ASM International® All rights reserved. www.asminternational.org

258 / Cold and Hot Forging: Fundamentals and Applications
ing, due to the fact that the dies are heated to thesame temperature as the workpiece, there is nodie chilling, as in conventional forging. Suc-cessful application of these processes demandsaccurate temperature and strain-rate control, ad-vances in titanium and nickel-base superalloymaterials, and stringent requirements on com-ponent microstructure and properties.
20.2.1 Gatorizing
Alloys destined for use in rotating machinerysuch as gas turbines are designed to have highstrength at elevated temperatures. Their perfor-mance characteristics make them a challenge toforge or machine using conventional techniques.Thus, an improved method for forging high-temperature alloys, known as Gatorizing, waspatented by Moore et al. in 1970. This methodconsists of [Altan et al., 1973]:
● Preconditioning the stock under controlledconditions to secure a temporary conditionof low strength and high ductility
● Hot working to the desired shape whilemaintaining those attributes
● Restoring normal properties to the work-piece through heat treatment
With Gatorizing, hard-to-work nickel alloyswere forged for the first time, and the higherstrength that could be obtained from these alloysresulted in higher strength-to-weight ratios inaircraft components such as jet engine disks.This process also led to development of tech-niques for isothermal forging of integrallybladed engine rotors (disks of superalloys forgedintegrally with ceramic blades) [Walker et al.,1976, and McLeod et al., 1980].
20.2.2 IsoCon
A process that combines isothermal forgingand hammer forging has been developed for theprocessing of Waspaloy, a nickel-base superal-loy material. This technique is referred to asIsoCon and is made up of a controlled isother-mal forging operation followed by a controlledconventional hammer forging operation [Stew-art, 1988]. The isothermal step results in the re-quired microstructure and general componentconfiguration, while the final hammer forgingstep results in controlled cold strain, which sig-nificantly increases the properties of the finalpart and imparts the final geometry refinement.This metallurgical-based process requires a high
degree of process control for both the isothermaland hammer forging operations. Utilization ofdeformation and metallurgical models forIsoCon process design optimization has beenbeneficial in obtaining the final component re-sults.
20.3 Hot-Die Forging
In addition to isothermal forging, hot-die hy-draulic press forging is also widely used for pro-ducing aerospace components. The die tempera-tures used in hot-die forging are usually a fewhundred degrees lower than the workpiece tem-perature. However, they are much higher thanthe die temperatures used in conventional forg-ing, ranging from 400 to 800 �F (205 to 425 �C).Higher die temperatures require stronger mate-rials for the dies. Superalloys are often used asdie materials for hot-die forging.
To keep a constant high temperature of thedies, consistent heating of the die is required.Induction, resistance, and radiant systems areusually used for die heating in hot-die forging.The strain rate used is usually an order of mag-nitude higher than that used in isothermal forg-ing, to reduce die chilling. Due to the higherstrain rates used in hot-die forging, P/M super-alloys are usually not forged by this process. Onthe other hand, titanium alloys and cast andwrought superalloys are often forged by hot-dieforging processes.
Since hot-die forging is not performed in avacuum/inert environment, fast post-forgingcooling processes, such as water quench and oilquench, can be applied immediately after forg-ing, which is not usually possible for isothermalforging. Whether an isothermal forging or a hot-die forging should be selected for a componentdepends on the material, the microstructure andproperty requirements, and the economics. Inthe forging of high-alloy-content P/M superal-loys, the isothermal forging process is the onlyproven method for success.
20.4 Benefits ofIsothermal and Hot-Die Forging
Forging basically involves the deformation ofa metal billet or a preform between two or moredies in order to obtain the final part. The defor-mation may be carried out by means of various

Isothermal and Hot-Die Forging / 259
machines, such as hammers or mechanical, hy-draulic, or screw presses. Parts with complex ge-ometries are forged in impression dies that havethe shape of the desired part. This may be donein one step or a sequence of steps (i.e., preform-ing and blocking), depending on the part com-plexity. This process results in very high diestresses and hence calls for the material to beforged at elevated temperatures in order to re-duce the flow stress, increase formability, andthus reduce die stresses. During hot forging, theheat transfer from the hot material to the colderdies can result in die chilling. Dies are thus nor-mally heated to approximately 600 to 800 �F(315 to 425 �C) to reduce the heat transfer. Con-ventional die materials do not allow the use oftemperatures higher than 800 �F (425 �C), sincethey lose their strength and hardness above thistemperature range [Semiatin et al., 1983]. Alu-minum alloys are generally isothermally forged,since the dies are readily heated to the same tem-perature range as the material (approximately800 �F, or 425 �C). Since isothermal forging ofaluminum alloys is a well-established state-of-the-art process, it is more appropriate to concen-trate on high-temperature alloys such as titaniumand nickel.
Forging of steels and high-temperature alloyscan be an expensive process due to the preform-ing and blocking operations needed to achievethe desired part geometry, especially in aero-space forging. This industry produces a rela-tively small number of parts, which does not jus-tify the high die costs. Thus, it is consideredeconomical to forge a part with high machiningallowances to reduce die costs while simulta-neously increasing machining costs and materiallosses. This approach is, however, not suitablefor titanium and nickel alloys that are more ex-pensive in comparison to steel and aluminum.This cost ratio has been a driving factor for thedevelopment of isothermal (dies and workpieceat the same temperature) and hot-die (die tem-perature close to that of the workpiece) forgingmethods.
Isothermal and hot-die forging offer the fol-lowing advantages [Semiatin et al., 1983]:
● Closer tolerances than conventional forgingdue to elimination of die chilling. Reductionof machining costs and material losses.These forging processes allow for smallercorner and fillet radii, smaller draft angles,and smaller forging envelope, consequentlyleading to materials savings and a reducedforging weight (Fig. 20.1 and 20.2).
● Elimination of die chilling also results in re-duction of preforming and blocking steps,thus reducing die costs.
● Since die chilling is not a problem, slow de-formation speeds can be used (e.g., a hy-draulic press). This reduces the strain rateand flow stress of the forged material. Dueto reduction of forging pressures, larger partscan be forged using existing equipment.
Figure 20.3 shows a comparison between iso-thermal forging and other conventional methodsof producing a typical rib-web-type aircraftstructural component.
20.5 High-Temperature Materials forIsothermal and Hot-Die Forging
An in-depth understanding of the plastic prop-erties of the forging material is extremely crucialfor the design of an isothermal forging process,since the selection of the other elements, such asequipment, die material, and lubricants, is basedon this knowledge.
At hot forging temperatures (T� Tm, whereTm is the melting point or solidus temperatureof the material), the flow stress is usually a func-tion of strain rate, except at very low strains.Consequently, the deformation behavior of amaterial is best understood by examining theflow stress dependence on strain rate [Chen etal., 1980, and Greenwood et al., 1978]. The de-pendence of the flow stress on temperature isminimal at very low (creep) as well as high (con-ventional hot forging) strain rates. At interme-diate strain rates, however, the flow stress de-pendence on is often large, and it is in thiseregion that superplastic behavior is predominant(Fig. 20.4). The high strain-rate sensitivity of su-perplastic materials promotes die filling and re-sists localized plastic deformation, making thesematerials extremely suitable for isothermal andhot-die forging. Also, the reduction of flowstress with decreasing strain rate lowers the forg-ing loads, thus making it possible to form a partisothermally with a smaller press than in con-ventional hot forging. Isothermal forging alsoreduces the number of forging steps and ancil-lary operations that are necessary in conven-tional forging.
20.5.1 Titanium Alloys
Titanium alloys are among the most com-monly used materials for isothermal and hot-die
0.6

260 / Cold and Hot Forging: Fundamentals and Applications
Fig. 20.1 Weight reduction obtained by forging a disk by isothermal methods rather than conventional forging. A 60 lb (27 kg)weight reduction was obtained [Shah, 1988].
forging. Unalloyed titanium occurs in twoforms, namely, the alpha phase (hexagonalclose-packed structure), which is stable up to ap-proximately 1615 �F (880 �C), and the betaphase (body-centered cubic structure), which isstable from 1615 �F (880 �C) to the meltingpoint. The temperature at which this transfor-mation occurs is known as the beta transus tem-perature. It is possible to increase or lower thistemperature by the use of alloying elementsknown as stabilizers (Table 20.1).
Titanium alloys are classified as either alpha(�) alloys, beta (�) alloys, or alpha � beta (�� �) alloys. Table 20.2 lists some of the com-mercially used titanium alloys with their classi-fication. The flow stress of these alloys is verysensitive to temperature and strain rate, espe-cially for the alpha � beta alloys and near-alphaalloys below the beta transus temperature. Thebeta transus temperatures for common titaniumalloys are given in Table 20.3.
The data given in Fig. 20.5 are indicative ofthe advantages of isothermal forging over con-ventional nonisothermal methods for alpha,near-alpha, and alpha � beta alloys. If Ti-6Al-4V were forged conventionally at a temperatureof 1725 �F (940 �C), chilling of the workpiece
surface to a temperature of 1600 �F (870 �C)could lead to severe deformation inhomogenei-ties. This is because the flow stress of this alloyat 1600 �F (870 �C) is approximately three timesthat at the desired forging temperature of 1725�F (940 �C). Also, a substantial reduction in theforging pressures is possible by reducing thestrain rate by a factor of a hundred or a thousand.Thus, for a given press capacity, parts can beforged isothermally at lower strain rates andlower preheat temperatures than in conventionalforging processes with higher strain rates, evenif die chilling could be avoided. This results inlower energy expenditure and less contamina-tion through alpha case formation at lower pre-heat temperatures [Semiatin et al., 1983]. Fig-ures 20.6 and 20.7 illustrate these points. Theforging pressures near the transus temperatureare similar to those encountered at a temperatureseveral hundred degrees lower when the strainrate is slowed down to those employed in creepforging. The practical use of these forging rates,however, is restricted by economic considera-tions.
Compared to the alpha, near-alpha, and alpha� beta alloys, the beta and near-beta titaniumalloys were developed and put into commercial

Isothermal and Hot-Die Forging / 261
Fig. 20.3 Comparison of various methods of producingtorque ribs [DuMond, 1975 and 1976)
Fig. 20.2 Comparison between conventional and hot-die forging of a Ti-6Al-4V structural part on the basis of raw material saved[Shah, 1988]
Fig. 20.4 Deformation regimes for superplastic materials[Chen et al., 1980]
application much later. These alloys contain mo-lybdenum, vanadium, or iron as beta stabilizers,i.e., to stabilize the high-temperature body-cen-tered cubic phase at room temperature. How-ever, it should be noted that the beta phase inthese alloys is only metastable. As shown in Ta-ble 20.3, the beta transus temperatures of thesealloys are relatively low, with a lower percentageof the alpha (hexagonally close-packed) phase.
The lower transus temperatures of the beta al-loys may lead one to conclude that these alloyswould have a lower flow stress compared to thealpha and alpha � beta alloys [Semiatin et al.,1983]. However, the data provided in Fig. 20.5does not support this conclusion. It is found thatthe beta alloy Ti-13V-11Cr-3Al does not showthis behavior, which could be due to high levelsof vanadium and chromium [Altan et al., 1973].The data for Ti-10V-2Fe-Al is, however, signifi-cantly lower in magnitude compared to that of
Ti-6Al-4V (Fig. 20.8). The figure shows that theflow stress data for the beta alloy at 1500 �F (815�C) are comparable to that of Ti-6Al-4V at the
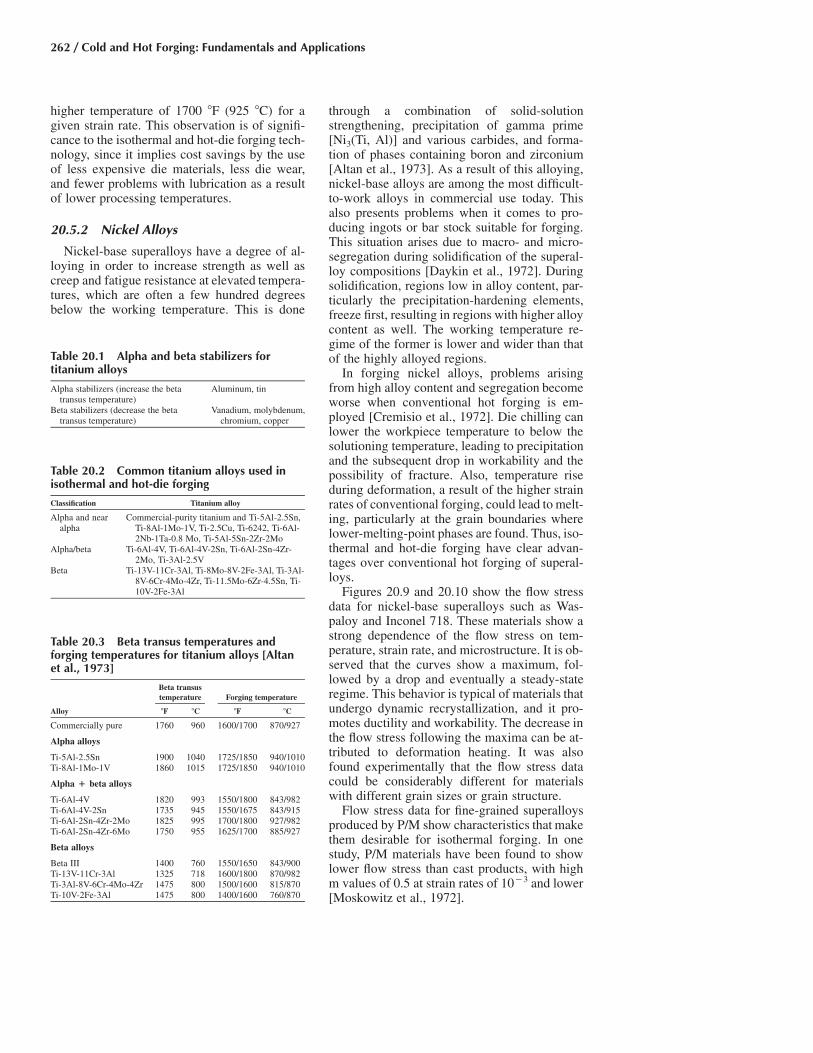
262 / Cold and Hot Forging: Fundamentals and Applications
Table 20.3 Beta transus temperatures andforging temperatures for titanium alloys [Altanet al., 1973]
Beta transustemperature Forging temperature
Alloy �F �C �F �C
Commercially pure 1760 960 1600/1700 870/927
Alpha alloys
Ti-5Al-2.5Sn 1900 1040 1725/1850 940/1010Ti-8Al-1Mo-1V 1860 1015 1725/1850 940/1010
Alpha � beta alloys
Ti-6Al-4V 1820 993 1550/1800 843/982Ti-6Al-4V-2Sn 1735 945 1550/1675 843/915Ti-6Al-2Sn-4Zr-2Mo 1825 995 1700/1800 927/982Ti-6Al-2Sn-4Zr-6Mo 1750 955 1625/1700 885/927
Beta alloys
Beta III 1400 760 1550/1650 843/900Ti-13V-11Cr-3Al 1325 718 1600/1800 870/982Ti-3Al-8V-6Cr-4Mo-4Zr 1475 800 1500/1600 815/870Ti-10V-2Fe-3Al 1475 800 1400/1600 760/870
Table 20.2 Common titanium alloys used inisothermal and hot-die forging
Classification Titanium alloy
Alpha and nearalpha
Commercial-purity titanium and Ti-5Al-2.5Sn,Ti-8Al-1Mo-1V, Ti-2.5Cu, Ti-6242, Ti-6Al-2Nb-1Ta-0.8 Mo, Ti-5Al-5Sn-2Zr-2Mo
Alpha/beta Ti-6Al-4V, Ti-6Al-4V-2Sn, Ti-6Al-2Sn-4Zr-2Mo, Ti-3Al-2.5V
Beta Ti-13V-11Cr-3Al, Ti-8Mo-8V-2Fe-3Al, Ti-3Al-8V-6Cr-4Mo-4Zr, Ti-11.5Mo-6Zr-4.5Sn, Ti-10V-2Fe-3Al
Table 20.1 Alpha and beta stabilizers fortitanium alloys
Alpha stabilizers (increase the betatransus temperature)
Aluminum, tin
Beta stabilizers (decrease the betatransus temperature)
Vanadium, molybdenum,chromium, copper
higher temperature of 1700 �F (925 �C) for agiven strain rate. This observation is of signifi-cance to the isothermal and hot-die forging tech-nology, since it implies cost savings by the useof less expensive die materials, less die wear,and fewer problems with lubrication as a resultof lower processing temperatures.
20.5.2 Nickel Alloys
Nickel-base superalloys have a degree of al-loying in order to increase strength as well ascreep and fatigue resistance at elevated tempera-tures, which are often a few hundred degreesbelow the working temperature. This is done
through a combination of solid-solutionstrengthening, precipitation of gamma prime[Ni3(Ti, Al)] and various carbides, and forma-tion of phases containing boron and zirconium[Altan et al., 1973]. As a result of this alloying,nickel-base alloys are among the most difficult-to-work alloys in commercial use today. Thisalso presents problems when it comes to pro-ducing ingots or bar stock suitable for forging.This situation arises due to macro- and micro-segregation during solidification of the superal-loy compositions [Daykin et al., 1972]. Duringsolidification, regions low in alloy content, par-ticularly the precipitation-hardening elements,freeze first, resulting in regions with higher alloycontent as well. The working temperature re-gime of the former is lower and wider than thatof the highly alloyed regions.
In forging nickel alloys, problems arisingfrom high alloy content and segregation becomeworse when conventional hot forging is em-ployed [Cremisio et al., 1972]. Die chilling canlower the workpiece temperature to below thesolutioning temperature, leading to precipitationand the subsequent drop in workability and thepossibility of fracture. Also, temperature riseduring deformation, a result of the higher strainrates of conventional forging, could lead to melt-ing, particularly at the grain boundaries wherelower-melting-point phases are found. Thus, iso-thermal and hot-die forging have clear advan-tages over conventional hot forging of superal-loys.
Figures 20.9 and 20.10 show the flow stressdata for nickel-base superalloys such as Was-paloy and Inconel 718. These materials show astrong dependence of the flow stress on tem-perature, strain rate, and microstructure. It is ob-served that the curves show a maximum, fol-lowed by a drop and eventually a steady-stateregime. This behavior is typical of materials thatundergo dynamic recrystallization, and it pro-motes ductility and workability. The decrease inthe flow stress following the maxima can be at-tributed to deformation heating. It was alsofound experimentally that the flow stress datacould be considerably different for materialswith different grain sizes or grain structure.
Flow stress data for fine-grained superalloysproduced by P/M show characteristics that makethem desirable for isothermal forging. In onestudy, P/M materials have been found to showlower flow stress than cast products, with highm values of 0.5 at strain rates of 10�3 and lower[Moskowitz et al., 1972].
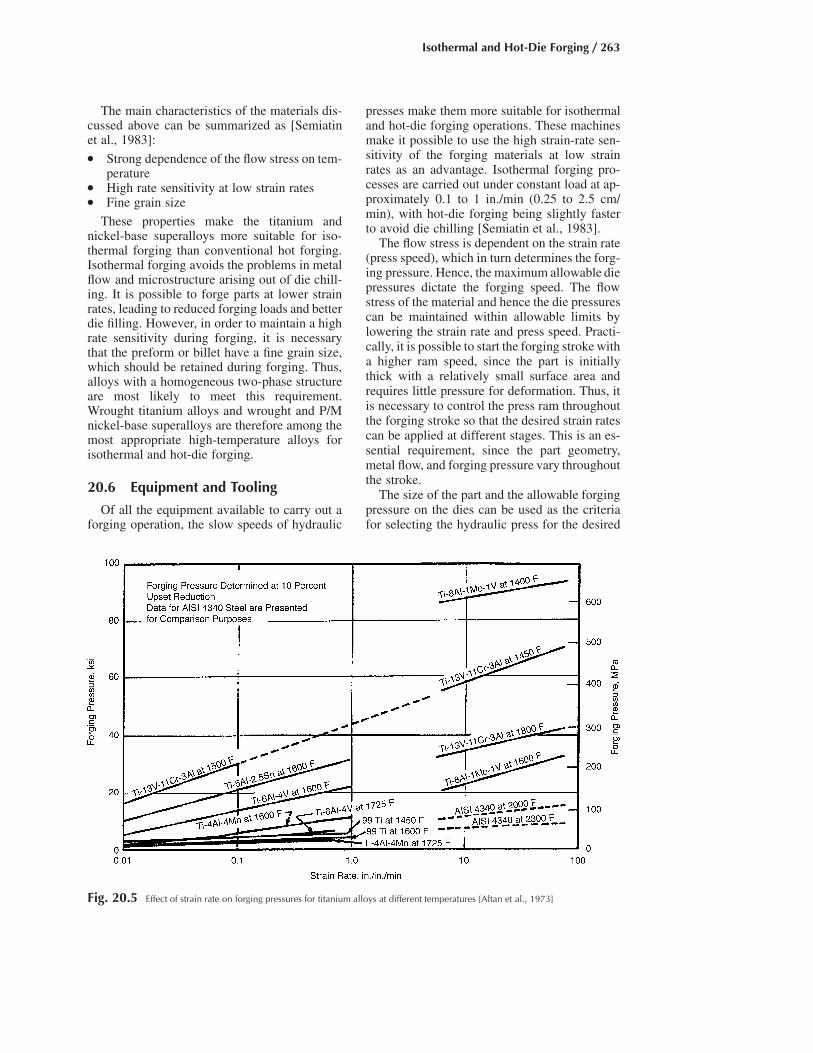
Isothermal and Hot-Die Forging / 263
Fig. 20.5 Effect of strain rate on forging pressures for titanium alloys at different temperatures [Altan et al., 1973]
The main characteristics of the materials dis-cussed above can be summarized as [Semiatinet al., 1983]:● Strong dependence of the flow stress on tem-
perature● High rate sensitivity at low strain rates● Fine grain size
These properties make the titanium andnickel-base superalloys more suitable for iso-thermal forging than conventional hot forging.Isothermal forging avoids the problems in metalflow and microstructure arising out of die chill-ing. It is possible to forge parts at lower strainrates, leading to reduced forging loads and betterdie filling. However, in order to maintain a highrate sensitivity during forging, it is necessarythat the preform or billet have a fine grain size,which should be retained during forging. Thus,alloys with a homogeneous two-phase structureare most likely to meet this requirement.Wrought titanium alloys and wrought and P/Mnickel-base superalloys are therefore among themost appropriate high-temperature alloys forisothermal and hot-die forging.
20.6 Equipment and Tooling
Of all the equipment available to carry out aforging operation, the slow speeds of hydraulic
presses make them more suitable for isothermaland hot-die forging operations. These machinesmake it possible to use the high strain-rate sen-sitivity of the forging materials at low strainrates as an advantage. Isothermal forging pro-cesses are carried out under constant load at ap-proximately 0.1 to 1 in./min (0.25 to 2.5 cm/min), with hot-die forging being slightly fasterto avoid die chilling [Semiatin et al., 1983].
The flow stress is dependent on the strain rate(press speed), which in turn determines the forg-ing pressure. Hence, the maximum allowable diepressures dictate the forging speed. The flowstress of the material and hence the die pressurescan be maintained within allowable limits bylowering the strain rate and press speed. Practi-cally, it is possible to start the forging stroke witha higher ram speed, since the part is initiallythick with a relatively small surface area andrequires little pressure for deformation. Thus, itis necessary to control the press ram throughoutthe forging stroke so that the desired strain ratescan be applied at different stages. This is an es-sential requirement, since the part geometry,metal flow, and forging pressure vary throughoutthe stroke.
The size of the part and the allowable forgingpressure on the dies can be used as the criteriafor selecting the hydraulic press for the desired

264 / Cold and Hot Forging: Fundamentals and Applications
Fig. 20.6 Effect of deformation rate and temperature on flow stress of Ti-6Al-6V-2Sn alloy under isothermal forging conditions [Fix,1972]
isothermal forging process. The size of the diesis governed by the limitations of the techniqueused to heat them as well as the cost of the diematerials, which are usually very expensive.
Sensors are used in conjunction with pressequipment to form a closed-loop control systemin the isothermal forging press. The high levelsof process control that are achieved through iso-thermal forging have allowed near-net forgingof complex components from alloys with verynarrow processing windows. Isothermal forgingcan be a very cost-effective manufacturing pro-cess for the manufacture of critical componentsthat are required to be produced from very ex-pensive and difficult-to-process materials. Vastquantities of quality jet engine parts have beenproduced by isothermal forging. Figure 20.11shows a jet engine disk being forged in an iso-thermal press.
Ladish Company designed and constructedtwo isothermal presses (5,000 and 10,000 ton).Between the two presses, the 10,000 ton pressis the largest isothermal press in the world (Fig.20.12). Pratt & Whitney-Georgia has one 3,000ton and two 8,000 ton isothermal presses. Wy-man-Gordon has one 8,000 ton isothermal press.Isothermal presses have been utilized for themost demanding aerospace component applica-tions.
20.6.1 Die Materials
Due to the very high temperatures of the diesin isothermal and hot-die forging, selection ofthe die materials is an extremely critical part ofthe forging process design. The various factorsto be taken into consideration during die mate-rial selection are wear and creep resistance, hot

Isothermal and Hot-Die Forging / 265
Fig. 20.8 Flow stress data for Ti-10V-2Fe-Al compared withthat of Ti-6Al-4V [Rosenberg, 1978]
Fig. 20.7 Effect of temperature on forging pressure in isothermal forging of Ti-6Al-6V-2Sn [Kulkarni et al., 1972]
hardness, toughness, and overall structural in-tegrity. When die temperatures are in the rangeof those encountered in conventional hot forg-ing, it is possible to use a variety of low-alloytool steels or hot working die steels. However,when forging titanium or nickel-base alloys,where temperatures are in the range of 1500 to2000 �F (815 to 1095 �C), one is restricted to alimited range of die materials, ranging from su-peralloys and refractory metal alloys to ceramics[Semiatin et al., 1983].
Due to their low strength and creep resistanceabove 1500 �F (815 �C), iron- and cobalt-basesuperalloys have been found, in general, to beunsuitable as die materials for isothermal forg-ing. Wrought nickel-base superalloys such asWaspaloy, Udimet 700, Astroloy, and UnitempAF2-1DA are well suited for isothermal forgingof titanium alloys at 1700 �F (925 �C) and lower.What makes these wrought nickel-base super-alloys attractive as die materials is their struc-tural integrity and resistance to defects such asporosity in large forged die blocks. They alsoretain their strength in the temperature range of1500 to 1700 �F (815 to 925 �C), unlike the iron-base materials (Fig. 20.13). However, in prac-tice, the temperatures for nickel-base superalloydies are maintained at approximately 1650 �F(900 �C) or lower to extend die life in case oflarge production runs. This makes it a case ofnear-isothermal forging instead of isothermal
forging. Figure 20.13 shows a drastic drop in thestrength of these die materials after a tempera-ture of 1700 �F (925 �C) because of reversion ofthe gamma-prime precipitates. Cast nickel-basesuperalloys such as IN-100, MAR-M-200, In-conel 713C, and TRW-NASA VIA [Simmons,1971] have also found acceptance as die mate-rials. Figure 20.14 shows that these alloys arecomparable and sometimes superior in strengthto the wrought alloys. Isothermal forging ofwrought nickel-base superalloys requires specialdie materials, such TZM molybdenum, TZC,and Mo-Hf-C [Clare et al., 1977–78]. TZM mo-
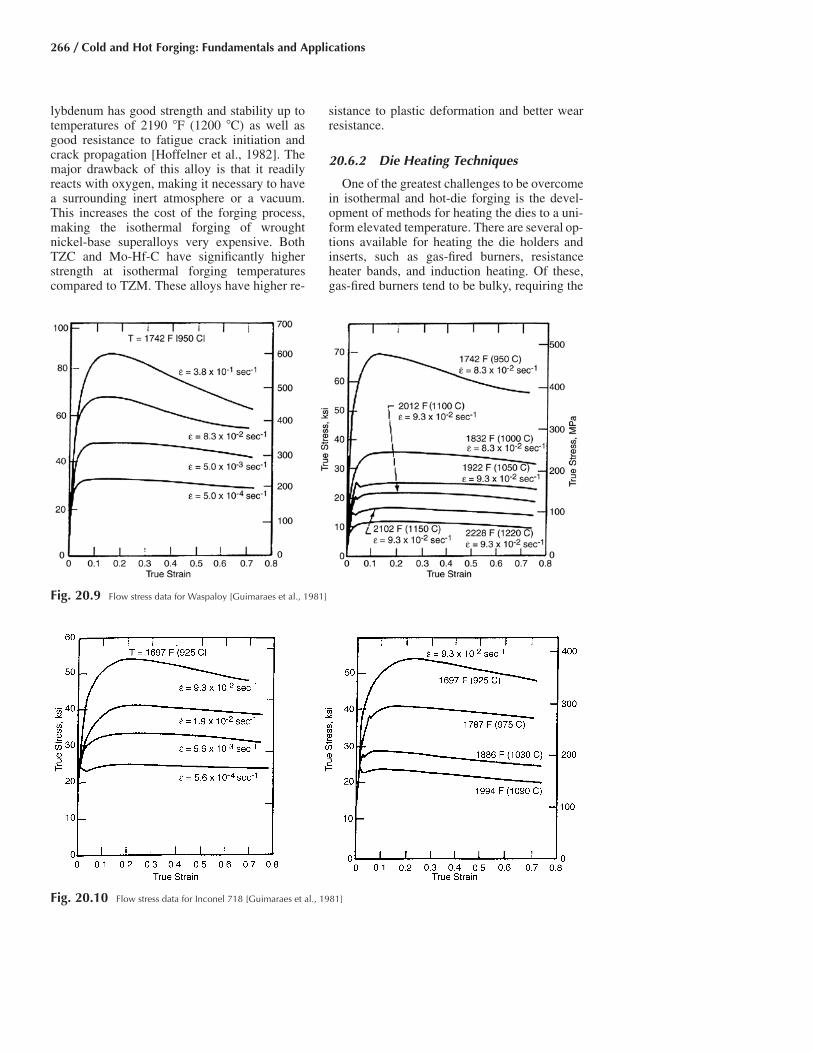
266 / Cold and Hot Forging: Fundamentals and Applications
Fig. 20.10 Flow stress data for Inconel 718 [Guimaraes et al., 1981]
Fig. 20.9 Flow stress data for Waspaloy [Guimaraes et al., 1981]
lybdenum has good strength and stability up totemperatures of 2190 �F (1200 �C) as well asgood resistance to fatigue crack initiation andcrack propagation [Hoffelner et al., 1982]. Themajor drawback of this alloy is that it readilyreacts with oxygen, making it necessary to havea surrounding inert atmosphere or a vacuum.This increases the cost of the forging process,making the isothermal forging of wroughtnickel-base superalloys very expensive. BothTZC and Mo-Hf-C have significantly higherstrength at isothermal forging temperaturescompared to TZM. These alloys have higher re-
sistance to plastic deformation and better wearresistance.
20.6.2 Die Heating Techniques
One of the greatest challenges to be overcomein isothermal and hot-die forging is the devel-opment of methods for heating the dies to a uni-form elevated temperature. There are several op-tions available for heating the die holders andinserts, such as gas-fired burners, resistanceheater bands, and induction heating. Of these,gas-fired burners tend to be bulky, requiring the

Isothermal and Hot-Die Forging / 267
Fig. 20.12 10,000 ton isothermal forging press, designed,constructed, and operated by Ladish. Courtesy
of Ladish Co.
Fig. 20.11 A jet engine part being forged in an isothermalpress at Ladish. Courtesy of Ladish Co.
use of nozzles and additional equipment, whichcan hamper easy access to the actual forging areaby occupying a large amount of space.
Figure 20.15 shows the heating setup for iso-thermal forging of titanium alloys using resis-tance heaters, which tend to be one of the sim-plest to implement [Antes, 1980]. In thisparticular case, die inserts of IN-100 are held inplace by die holders (IN-100) and backed bybolsters of IN-100 and H21 hot work die steel.
This combination of back-up materials is nec-essary because of the conduction of heat into thedie stack. Depending on the die geometry andoperating temperature, it is possible to usenickel-base superalloys as bolster materials,whereas the remainder of the die assembly canbe made from tool steels and stainless steels. Theuse of insulators, such as metallic sheets coatedwith ceramics such as zirconium oxide, and wa-ter cooling reduces heat losses and preventsdamage to the press. Alumina blocks and spacerplates are also effective means of reducing heatlosses.
Induction coils made of copper tubing are an-other simple means of die heating (Fig. 20.16)[Prasad et al., 1969]. These coils are usually wa-ter cooled and can be bent to various shapes de-pending on the die geometry. In induction heat-ing, the rate of heat generation is higher at diecircumference than the cavity. In order to getuniform heating, low frequencies of alternatingcurrent of 40 to 100 Hz are used. This makesuse of the property that difference in local heat-ing rates reduces when the frequency is reduced.The temperature gradients arising out of non-uniform heating may induce large thermalstresses, which may cause cracking. Susceptors,such as graphite used in the Gatorizing process,can also be used in conjunction with the induc-tion coils to promote uniform heating throughradiation.
It has been found that the use of a singlemethod of die heating often leads to nonuniformtemperature distribution in the die. Hence, moresophisticated heating systems utilizing two ormore heating methods can be implemented (Fig.20.17). In this setup, a portable dummy resis-tance furnace is used to heat the outer portion ofthe dies, thus making it possible to remove itduring the forging operation. The second part ofthe heating system consists of a set of gas burn-ers that are aimed toward the center of the die.Temperature variations were limited to within�50 �F (28 �C) for dies with an outer diameterof 42 in. (107 cm). A similar two-part systemwas implemented at Wyman-Gordon, consistingof devices surrounding the horizontal and ver-tical portions of the die assembly [Chen et al.,1977]. The vertical part contains gas-fired, in-frared heating elements, whereas the horizontalpart contains resistance heater rods set into Was-paloy heater plates directly above the top dieinsert and die holder and below the bottom dieinsert and holder (Fig. 20.18). This system en-abled precise temperature control over even thelargest die areas.
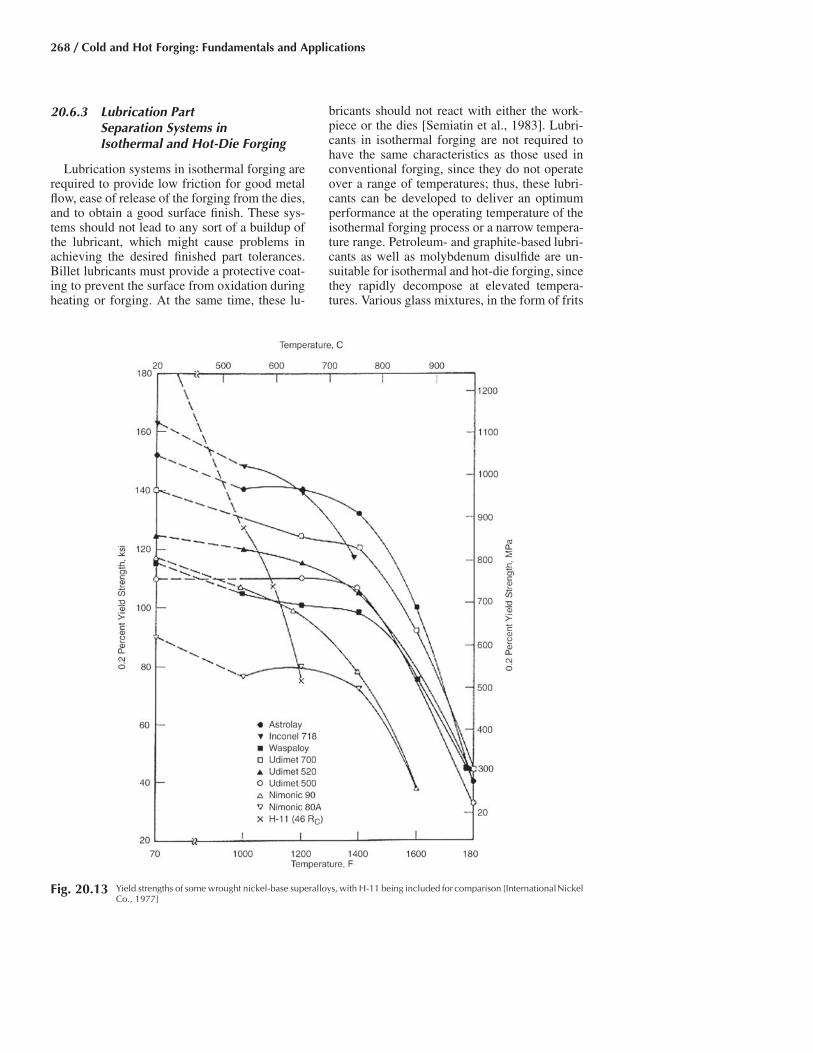
268 / Cold and Hot Forging: Fundamentals and Applications
Fig. 20.13 Yield strengths of some wrought nickel-base superalloys, with H-11 being included for comparison [InternationalNickelCo., 1977]
20.6.3 Lubrication PartSeparation Systems inIsothermal and Hot-Die Forging
Lubrication systems in isothermal forging arerequired to provide low friction for good metalflow, ease of release of the forging from the dies,and to obtain a good surface finish. These sys-tems should not lead to any sort of a buildup ofthe lubricant, which might cause problems inachieving the desired finished part tolerances.Billet lubricants must provide a protective coat-ing to prevent the surface from oxidation duringheating or forging. At the same time, these lu-
bricants should not react with either the work-piece or the dies [Semiatin et al., 1983]. Lubri-cants in isothermal forging are not required tohave the same characteristics as those used inconventional forging, since they do not operateover a range of temperatures; thus, these lubri-cants can be developed to deliver an optimumperformance at the operating temperature of theisothermal forging process or a narrow tempera-ture range. Petroleum- and graphite-based lubri-cants as well as molybdenum disulfide are un-suitable for isothermal and hot-die forging, sincethey rapidly decompose at elevated tempera-tures. Various glass mixtures, in the form of frits
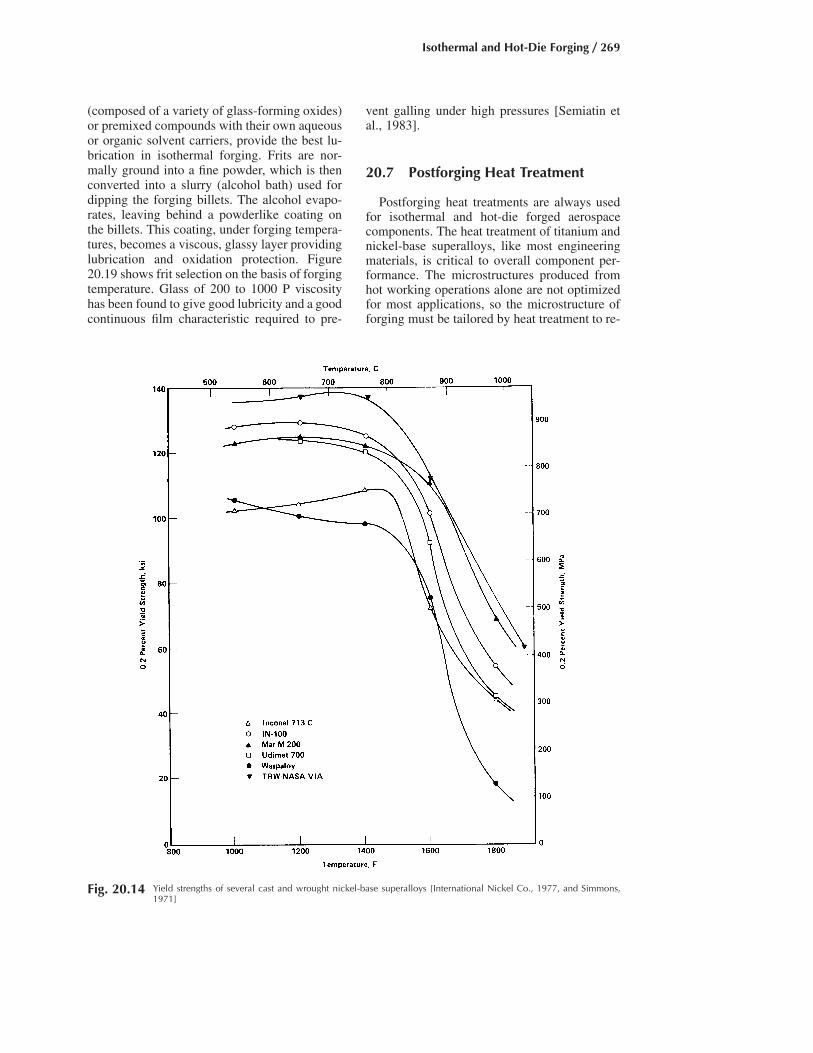
Isothermal and Hot-Die Forging / 269
Fig. 20.14 Yield strengths of several cast and wrought nickel-base superalloys [International Nickel Co., 1977, and Simmons,1971]
(composed of a variety of glass-forming oxides)or premixed compounds with their own aqueousor organic solvent carriers, provide the best lu-brication in isothermal forging. Frits are nor-mally ground into a fine powder, which is thenconverted into a slurry (alcohol bath) used fordipping the forging billets. The alcohol evapo-rates, leaving behind a powderlike coating onthe billets. This coating, under forging tempera-tures, becomes a viscous, glassy layer providinglubrication and oxidation protection. Figure20.19 shows frit selection on the basis of forgingtemperature. Glass of 200 to 1000 P viscosityhas been found to give good lubricity and a goodcontinuous film characteristic required to pre-
vent galling under high pressures [Semiatin etal., 1983].
20.7 Postforging Heat Treatment
Postforging heat treatments are always usedfor isothermal and hot-die forged aerospacecomponents. The heat treatment of titanium andnickel-base superalloys, like most engineeringmaterials, is critical to overall component per-formance. The microstructures produced fromhot working operations alone are not optimizedfor most applications, so the microstructure offorging must be tailored by heat treatment to re-

270 / Cold and Hot Forging: Fundamentals and Applications
Fig. 20.15 Die setup for isothermal/hot-die forging with re-sistance heaters [Antes, 1980]
Fig. 20.18 A two-part die heating system comprising gas-fired infrared heater and resistance heaters
[Shah, 1988]
Fig. 20.17 Die heating system utilizing resistance heatersand gas burners [Kulkarni, 1978]
Fig. 20.16 Die setup for isothermal/hot-die forging with in-duction coils [Prasad et al., 1969]
sult in the optimum grain size, grain-boundarymorphology, phases, and phase distributions.
One of the most important parameters in heattreatment is the cooling method and part coolingrate profile. The imposed cooling rate, alongwith the material transformation and phasegrowth kinetics, controls the development of therequired mechanical properties. Often, highcooling rates are required to produce highstrengths [Chang, 1997]. Other times, con-trolled, slower cooling rates are desired to de-velop serrated grain boundaries and optimummicrostructures in nickel-base materials [My-agawa, 1976, and Koul et al., 1985].
Although mechanical properties are often themost significant driving force for selecting vari-ous cooling methods and rates, other significantfactors deserve consideration. Large variationsin cooling rate within a given part will createlarge thermal stresses and hence high residualstresses [Chang, 1997 and 1996]. Thermal andresidual stresses can result in problems withquench cracking, machining distortion, or un-expected mechanical properties and perfor-mance in the final component. This issue has ledto engineering of specialty heat treat coolingmethods for forgings. Various quench media(air, oil, polymer, water), flow patterns impartedon the component, sequences of quench mediaand method used, and the component heat treat
geometry are all utilized to tailor the cooling rateand subsequently, the microstructure, mechani-cal properties, and residual stresses of a forging.The goal of modern heat treatment practices foraerospace forgings is to achieve the best balance
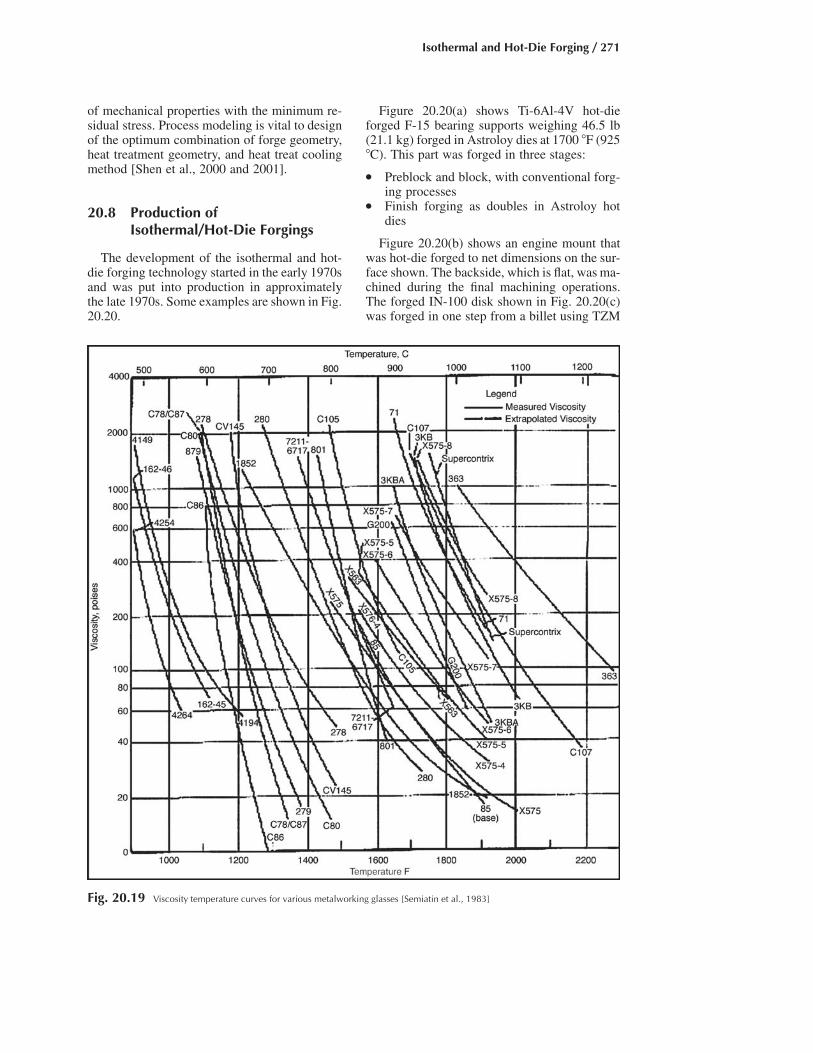
Isothermal and Hot-Die Forging / 271
Fig. 20.19 Viscosity temperature curves for various metalworking glasses [Semiatin et al., 1983]
of mechanical properties with the minimum re-sidual stress. Process modeling is vital to designof the optimum combination of forge geometry,heat treatment geometry, and heat treat coolingmethod [Shen et al., 2000 and 2001].
20.8 Production ofIsothermal/Hot-Die Forgings
The development of the isothermal and hot-die forging technology started in the early 1970sand was put into production in approximatelythe late 1970s. Some examples are shown in Fig.20.20.
Figure 20.20(a) shows Ti-6Al-4V hot-dieforged F-15 bearing supports weighing 46.5 lb(21.1 kg) forged in Astroloy dies at 1700 �F (925�C). This part was forged in three stages:
● Preblock and block, with conventional forg-ing processes
● Finish forging as doubles in Astroloy hotdies
Figure 20.20(b) shows an engine mount thatwas hot-die forged to net dimensions on the sur-face shown. The backside, which is flat, was ma-chined during the final machining operations.The forged IN-100 disk shown in Fig. 20.20(c)was forged in one step from a billet using TZM

272 / Cold and Hot Forging: Fundamentals and Applications
Fig. 20.20 Production examples of isothermal/hot-die forged aircraft components [Shah, 1988]
dies. This part was machined all over to yieldthe final shape, i.e., it had no net surfaces. Forge-ability and savings in material costs were thetwo driving forces behind selecting isothermalforging for this component.
20.9 Economic Benefits ofIsothermal and Hot-Die Forging
Isothermally forged parts are similar in prop-erties to conventionally forged parts. Thus, themain advantage of using isothermal forgingstems from the differences in the manufacturingcosts. The cost of making a forging can be splitup into the following categories [Semiatin et al.,1983]:
● Die material● Die machining and die installation (labor
costs)● Workpiece materials● Lubricants and lubrication systems● Preheating and forging (labor and energy
costs)● Rough and finish machining after forging
(labor costs)
Die materials for isothermal forging are muchmore expensive and difficult to machine thanconventional die materials. However, isothermalforging requires fewer number of forging stagesand therefore fewer die sets. This reduces theoverall tooling costs when compared to conven-tional forging. Another factor to be taken intoconsideration is the production run and the per-formance of the dies in runs of varying dura-

Isothermal and Hot-Die Forging / 273
Fig. 20.21 Cost comparison between conventional forging versus isothermal/hot-die forging [Shah, 1988]
tions. Though the die costs are high in isother-mal forging, the material input and costs arelower. The same is true for the machining costsrequired to produce the finished forging.
Figures 20.21(a) and (b) show the cost com-parison for two aircraft parts, namely, a con-necting link and a bearing support [Shah, 1988].It was seen that the forging for the connectinglink (Fig. 20.21a) using the conventional methodweighed 38.3 lb (17.4 kg), whereas a hot-dieforged part weighed in at 29 lb (13 kg). The hot-die forging process used a die stack with Astro-loy dies at approximately 1700 �F (925 �C), withsome net surfaces. Figure 20.21(a) shows sig-nificant savings in initial tooling costs and thatit took over 500 forgings for the higher toolingcosts of hot-die forging to be justified. Thus, hot-die forging was not economically viable for pro-duction runs of less than 500 parts in this case.
Figure 20.21(b) shows a similar cost compar-ison for the bearing support shown in Fig.20.20(a), which was also forged in Astroloy diesat 1700 �F (925 �C). However, due to its largersize compared to the link, the difference in diecosts between conventional and hot-die forgingwas greater. Due to significant reduction in ma-terial and machining costs, the break-even pointfor this part was less than 200 [Shah, 1988].
20.10 Summary
Isothermal and hot-die forging technologieswere developed in the 1970s and are used incurrent applications in production of precisionforgings, mostly in the aircraft industry. Theseprocesses have proven to be economically fea-sible for forging expensive high-temperature ti-tanium and nickel-base alloys contingent on:
● Proper understanding of the workpiece ma-terial properties and deformation character-istics
● Proper tool material selection and die designas well as process conditions such as tem-peratures and die-workpiece lubrication
● Costs, as shown in the examples of the com-parative studies between isothermal/hot-dieforging and conventional methods
Titanium and nickel-base superalloys are ex-cellent candidates for isothermal forging due tothe strong dependence of their flow stress ontemperature and strain rate. The high die costsassociated with isothermal and hot-die forgingare justified by the subsequent savings in mate-rial and machining.
Due to the advantages discussed earlier, iso-thermal and hot-die forging have found wide ac-

274 / Cold and Hot Forging: Fundamentals and Applications
ceptance in the production of aircraft compo-nents such as titanium structural members andturbine engine components made of titaniumand nickel-base superalloys.
REFERENCES
[Altan et al., 1973]: Altan, T., Boulger, F.W.,Becker, J.R., Akgermann, N., Henning, H.J.,“Forging Equipment, Materials and Prac-tices,” MCIC Report HB-03, Metals and Ce-ramics Information Center, Battelle’s Colum-bus Laboratories, Columbus, OH, Oct 1973.
[Antes, 1980]: Antes, H.W., “Complex Parts ofTitanium Alloy by Isothermal Forging,” In-dustrial Research/Development, Vol. 22 (No.11), Nov 1980, p 116–119.
[Chang, 1996]: Chang, K.-M., “Critical Issuesof Powder Metallurgy Turbine Disks,” ActaMetallurgica Sinica, Vol. 9, 1996, p 467–471.
[Chang, 1997]: Chang, K.-M., “Physical Simu-lation of Quench Cracking for P/M Superal-loy Turbine Disks,” Proceedings of SeventhInternational Symposium on Physical Simu-lation of Casting, Hot Rolling and Welding,National Research Institute for Metals (Ja-pan), Jan 21–23, 1997, p 509–512.
[Chen et al., 1977]: Chen, C.C., Couts, W.H.,Gure, C.P., Jain, S.C., unpublished research,Wyman-Gordon Co., Worcester, MA, Oct1977.
[Chen et al., 1980]: Chen, C.C., and Coyne,J.E., “Recent Developments in Hot Die Forg-ing of Titanium Alloys,” Titanium’80, Vol. 4,The Metallurgical Society of AIME, 1980, p2513–2522.
[Clare et al., 1977]: Clare, L.P., and Rhodes,R.H., “Superior Powder Metallurgy Molyb-denum Die Alloys for Isothermal Forging,”High Temperatures—High Pressures, Vol. 10,1978, p 347–348.
[Clare et al., 1978]: Clare, L.P., and Rhodes,R.H., “Superior P/M Mo Die Alloys for Iso-thermal Forging,” Proceedings of the NinthPlansee Seminar (III), Metallwerk Plansee(Reutte, Austria), 1977.
[Cremisio et al., 1972]: Cremisio, R.S., andMcQueen, H.J., “Some Observations of HotWorking Behavior of Superalloys Accordingto Various Types of Hot Workability Tests,”Superalloys Processing, Proceedings of theSecond International Conference, MCIC Re-port 72-10, Section F, Metals and CeramicsInformation Center, Battelle’s Columbus Lab-oratories, Columbus, OH, Sept 1972.
[Daykin et al., 1972]: Daykin, R.P., and De-
Ridder, A.J., “Primary Working of Superal-loys,” Superalloys Processing, Proceedings ofthe Second International Conference, MCICReport 72-10, Section F, Metals and CeramicsInformation Center, Battelle’s Columbus Lab-oratories, Columbus, OH, Sept 1972.
[DuMond, 1975]: DuMond, T.C., “Putting theSqueeze on Titanium Forging Costs,” IronAge Metalworking International, Vol. 216(No. 22), Dec 1975, p 46–48.
[DuMond, 1976]: DuMond, T.C., “IsothermalForging—New Ti Forming Process,” IronAge Metalworking International, Vol. 15 (No.7), July 1976, p 31–32.
[Fix, 1972]: Fix, D.K., “Titanium PrecisionForgings,” Titanium Science and Technology,Vol. 1, Plenum Press, 1972, p 441–451.
[Greenwood et al., 1978]: Greenwood, G.W.,Seeds, W.E., Yue, S., “Isothermal Forging ofTitanium Alloys for Aerospace Applications,”Proceedings of the Metals Society Conferenceon Forging and Properties of Aerospace Ma-terials, The Metals Society, London, 1978, p255–265, 341–349.
[Guimaraes et al., 1981]: Guimaraes, A.A., andJonas, J.J., “Recrystallization and Aging Ef-fects Associated with High Temperature De-formation of Waspaloy and Inconel 718,”Metallurgical Transactions A, Vol. 12, 1981,p 1655–1666.
[Hoffelner et al., 1982]: Hoffelner, W., Wuth-rich, C., Schroder, G., Gessinger, G.H., “TZMMolybdenum as a Die Material for IsothermalForging of Titanium Alloys,” High Tempera-tures—High Pressures, Vol. 14, 1982, p 33–40.
[International Nickel Co., 1977]: “High Tem-perature, High Strength, Nickel-Base Alloys,”The International Nickel Co., Inc., New York,1977.
[Koul et al., 1985]: Koul, A.K., and Thamburaj,R., “Serrated Grain Boundary Formation Po-tential of Ni-Based Superalloys and Its Im-plications,” Met. Trans. A, Vol. 16, Jan 1985,p 20–26.
[Kulkarni, 1978]: Kulkarni, K.M., “IsothermalForging—From Research to a Promising NewManufacturing Technology,” Proceedings ofthe Sixth North American Metalworking Re-search Conference, Society of ManufacturingEngineers, 1978, p 24–32.
[Kulkarni et al., 1972]: Kulkarni, K.M., Parikh,N.M., and Watmough, T., “Isothermal HotDie Forging of Complex Parts in a TitaniumAlloy,” Journal of Institute Metals, Vol. 100,May 1972, p 146–151.

Isothermal and Hot-Die Forging / 275
[McLeod et al., 1980]: McLeod, S.A., Walker,B.H., Mendelson, M.I., “Development of anIntegral Ceramic Blade Metal Disk with Cir-cumferential Blade Attachment,” Ceramicsfor Turbine Blade Applications, AGARDConference Proceedings No. 276, AGARD,France, 1980.
[Moore et al., 1970]: Moore, J.R., and Athey,R.L., U.S. Patent No. 3,519,503.
[Moskowitz et al., 1972]: Moskowitz, L.N.,Pelloux, R.M., Grant, N., “Properties of IN-100 Processed by Powder Metallurgy,” Su-peralloys—Processing, Proceedings of theSecond International Conference, MCIC Re-port 72-10, Section Z, Metals and CeramicsInformation Center, Battelle’s Columbus Lab-oratories, Columbus, OH, Sept 1972.
[Myagawa et al., 1976]: Myagawa, O., et al.,“Zigzag Grain Boundaries and Strength ofHeat Resisting Alloys,” Proceedings of theThird International Symposium on Metallurgyand Manufacturing of Superalloys, TMS,1976, p 245–254.
[Noel et al., 1997]: Noel, R., Furrer, D., Lem-sky, J., Shen, G., Hoffman, R., “Forging—Business & Technology Perspective,” Pro-ceedings of the Third ASM International ParisConference (Paris, France), 25–27 June,1997.
[Prasad et al., 1969]: Prasad, J.S., and Wat-mough, T., “Precision Cast Superalloy Diesfor Isothermal Forging of Titanium Alloys,”Transactions of American Foundrymen’s So-ciety, Vol. 77, May 5–9, 1969, p 289–296.
[Rosenberg, 1978]: Rosenberg, H.W., “Ti-10V-2Fe-3Al—A Forging Alloy Development,”Proceedings of the Metal Society Conferenceon Forging and Properties of Aerospace Ma-terials, The Metals Society, London, 1978, p279–299.
[Semiatin et al., 1983]: Semiatin, L., and Altan,T., “Isothermal and Hot-Die Forging of HighTemperature Alloys,” MCIC Report 83-47,Metals and Ceramics Information Center,Battelle’s Columbus Laboratories, Columbus,OH, Oct 1983.
[Shah, 1988]: Shah, S., “Isothermal and Hot-Die Forging,” Forming and Forging, Vol. 14,ASM Handbook, ASM International, 1988.
[Shen et al., 2000]: Shen, G., and Furrer, D.,“Manufacturing of Aerospace Forgings,”Journal of Materials Processing Technology,Vol. 98, 2000, p 189–195.
[Shen et al., 2001]: Shen, G., Denkenberger, R.,Furrer, D., “Aerospace Forging—Process andModeling,” Materials Design Approaches
and Experiences, J.-C. Zhao, M. Fahrmann,and T.M. Pollock, Ed., TMS, 2001.
[Simmons, 1971]: Simmons, W.F., “Descriptionand Engineering Characteristics of ElevenNew High Temperature Alloys,” DMICMemorandum 255, Defense Metal Informa-tion Center, Battelle’s Columbus Laborato-ries, Columbus, OH, June 1971.
[Soucail et al., 1996]: Soucail, M., Marty M.,Octor, H., “The Effect of High TemperatureDeformation on Grain Growth in a PM NickelBase Superalloy,” Superalloys 1996, R.D.Kissinger, D.J. Deye, D.L. Anton, A.D. Cetel,M.V. Nathal, T.M. Pollock, and D.A. Wood-ford, Ed., TMS, 1996, p 663–666.
[Stewart, 1988]: Stewart, D., “ISOCON Manu-facturing of Waspaloy Turbine Discs,” Super-alloys 1988, S. Reichman, D.N. Duhl, G.Maurer, S. Antolovich, and C. Lund, Ed.,TMS, 1988, p 545–551.
[Walker et al., 1976]: Walker, B.H., and Car-ruthers, W.D., “Development of a CeramicBlade Superalloys Disk Attachment for GasTurbine Rotors,” Paper No. 760240, Societyof Automotive Engineers, 1976.
[Williams, 1996]: Williams, J.C., “Business Di-rections and Materials Challenges for the Air-craft Engine Industry,” Acta MetallurgicaSinica, Vol. 9 (No. 6), Dec 1996, p 407.
SELECTED REFERENCES
● [DeRidder et al., 1979]: Deridder, A.J., andKoch, R., “Forging and Processing of HighTemperature Alloys,” MiCon 78: Optimiza-tion of Processing, Properties, and ServicePerformance Through Microstructural Con-trol, STP 672, H. Abrams, G.N. Maniar,D.A. Nail, and H.D. Soloman, Ed., Ameri-can Society for Testing and Materials, 1979,p 547–563.
● [Kuhlmann, 1988]: Kuhlmann, G.W.,“Forging of Titanium Alloys,” Forming andForging, Vol. 14, ASM Handbook, ASM In-ternational, 1988.
● [Lawley, 1986]: Lawley, A., “Trends in At-omization and Consolidation of Powders forHigh-Temperature Aerospace Materials,”MICON 86, ASTM, 1986, p 183–201.
● [Spiegelberg, 1977]: Spiegelberg, W.D.,“Interface Separation—Lubrication Sub-stances for Isothermal Forging at 1300 �F to1500 �F,” Technical Report AFML-TR-77-87, Westinghouse Electric Corporation,Pittsburgh, PA, April 1977.
CHAPTER 21
Die Materials and Die ManufacturingPrashant Mangukia
21.1 Introduction
The design and manufacture of dies and theselection of the die materials are very importantin the production of discrete parts by forging.The dies must be made by modern methods fromappropriate die materials in order to provide ac-ceptable die life at a reasonable cost. Often, theeconomic success of a forging process dependson die life and die costs per piece produced. Fora given application, selection of the appropriatedie material depends on three variables [Altan etal., 1983]:
● Variables related to the process itself, includ-ing factors such as size of the die cavity, typeof machine used, deformation speed, initialstock size and temperature, die temperatureto be used, lubrication, production rate, andnumber of parts to be produced
● Variables related to the type of die loading,including speed of loading, i.e., impact orgradual contact time between dies and de-forming metal (this contact time is especiallyimportant in hot forging), maximum loadand pressure on the dies, maximum and min-imum die temperatures, and number of load-ing cycles to which dies will be subjected
● Mechanical properties of the die material, in-cluding hardenability, impact strength, hotstrength (if hot forming is considered), andresistance to thermal and mechanical fatigue
These factors are summarized in Fig. 21.1,primarily for hot forging applications. Proper se-lection of the die materials and the die manufac-turing technique determines, to a large extent,the useful life of forming dies. Dies may haveto be replaced for a number of reasons, such as
changes in dimensions due to wear or plasticdeformation, determination of the surface finish,breakdown of lubrication, and cracking orbreakage. Classification of tool steels by theAmerican Iron and Steel Institute (AISI) is pre-sented in Table 21.1.
21.2 Die and ToolMaterials for Hot Forging
Table 21.2 provides a good summary of cer-tain material properties of dies for hot forgingand the corresponding failure mechanisms thatthey affect.
Die materials commonly used for hot forgingcan be grouped in terms of alloy content; thesematerials are listed in Tables 21.3 through 21.5.Low-alloy steels are listed in Table 21.3. Steelswith ASM designations 6G, 6F2, and 6F3 pos-sess good toughness and shock-resistance qual-ities, with reasonable resistance to abrasion andheat checking. However, these steels are tem-pered at relatively low temperatures, for exam-ple, die holders for hot forging or hammer dieblocks. Low-alloy steels with higher (2 to 4%)nickel contents, with ASM designations 6F5 and6F7, have higher hardenability and toughnessand can be used in more severe applications thansteels 6G, 6F2, and 6F3. The precipitation-hard-ening steel 6F4 can be hardened by a simpleaging operation (950 to 1050 �F, or 510 to 565�C) without any cracking or distortion. In hotforging in presses, heat transfer from the hotstock to the dies causes this steel to harden andbecome more abrasion resistant.
Hot work die steels are used at temperaturesof 600 to 1200 �F (315 to 650 �C) and contain
Cold and Hot Forging Fundamentals and ApplicationsTaylan Altan, Gracious Ngaile, Gangshu Shen, editors, p277-293 DOI:10.1361/chff2005p277
Copyright © 2005 ASM International® All rights reserved. www.asminternational.org

278 / Cold and Hot Forging: Fundamentals and Applications
Table 21.3 Low-alloy steels for hot forging[Altan et al., 1983]
Designation Nominal composition, %
(ASM) C Mn Si Co Cr Mo Ni V W
6G 0.55 0.80 0.25 . . . 1.00 0.45 . . . 0.10 . . .6F2 0.55 0.75 0.25 . . . 1.00 0.30 1.00 0.10 . . .6F3 0.55 0.60 0.85 . . . 1.00 0.75 1.80 0.10 . . .6F4 0.20 0.70 0.25 . . . . . . 3.35 3.00 . . . . . .6F5 0.55 1.00 1.00 . . . 0.50 0.50 2.70 0.10 . . .6F7 0.40 0.35 . . . . . . 1.5 0.75 4.25 . . . . . .Table 21.2 Critical die-related factors and
corresponding properties in the die materialused in hot forging [Krishnadev et al., 1997]
Critical die-related factor Critical properties in die material
Heat checking Hot strength (hot hardness)Tempering resistanceToughness/ductilityThermal expansionThermal conductivity
Gross cracking Toughness/ductilityErosion Hot strength (hot hardness)
Chemical resistancePlastic deformation Hot strength (hot hardness)
Tempering resistance
Table 21.1 AISI classification and compositionof tool steels [Krauss et al., 1998]
Group Identifying symbol
Water-hardening tool steels WShock-resisting tool steels SOil-hardening cool work tool steels OAir-hardening, medium-alloy cold work tool
steelA
High-carbon, high-chromium cold work toolsteels
D
Mold steels PHot work tool steels, chromium, tungsten, and
molybdenumH
Tungsten high-speed tool steels TMolybdenum high-speed tool steels M
Fig. 21.1 Factors affecting die steel selection [Nagpal et al., 1980]
chromium, tungsten, and, in some cases, vana-dium or molybdenum or both. These elementsinduce deep hardening characteristics and resis-tance to abrasion and softening. Generally, these
steels are hardened by quenching in air or mol-ten salt baths. The chromium-base steels contain5% Cr. (Table 21.4). High molybdenum contentgives these steels high resistance to softening;vanadium content increases resistance to heatchecking and abrasion. Tungsten improvestoughness and hot hardness; however, steelscontaining tungsten are not resistant to thermalshock and cannot be cooled intermittently withwater. The tungsten-base hot work steels contain9 to 18% W (Table 21.5); they also contain 2 to
Table 21.4 Chromium-base hot work die steels[Altan et al., 1983]
Designation Nominal composition, %
(ASM) C Mn Si Co Cr Mo Ni V W
H10 0.40 0.40 1.00 . . . 3.30 2.50 . . . 0.50 . . .H11 0.35 0.30 1.00 . . . 5.00 1.50 . . . 0.40 . . .H12 0.35 0.40 1.00 . . . 5.00 1.50 . . . 0.50 1.50H13 0.38 0.30 1.00 . . . 5.25 1.50 . . . 1.00 . . .H14 0.40 0.35 1.00 . . . 5.00 . . . . . . . . . 5.00H19 0.40 0.30 0.30 4.25 4.25 0.40 . . . 2.10 4.10

Die Materials and Die Manufacturing / 279
Table 21.6 Approximate relative rankings of 15 selected high-speed steels for three properties
Material evaluation Wear resistance Hot hardness Toughness
Highest T15; M15; M4; M42 T15; M15; T6; T5; M42 M2; T1; M1Medium M3; T6; M2 (H.C.); M10 (H.C.); M7;
M2; T5M4; T4; M3 M3; M4; M10; M10 (H.C.); M7;
M2 (H.C.)Lowest T1; M10; T4; M1 T1; M2; M10; M1; M7; M10 (H.C.);
M2 (H.C.)T4; T5; M42; T15; M15; T6
T, tungsten-type high-speed steels; M, molybdenum-type high-speed steels; (H.C.), high carbon
12% Cr and may have small amounts of vana-dium. The high tungsten content provides resis-tance to softening at high temperatures whilemaintaining adequate toughness; however, italso makes it possible to water cool these diesteels. High-speed steels, originally developedfor metal cutting, can also be used in warm orhot forging applications. There are two types ofhigh-speed steels: molybdenum-type high-speedsteels, designated by the letter M, and tungsten-type high-speed steels, designated by the letterT (Table 21.6). These steels offer good combi-nations of hardness, strength, and toughness atelevated temperatures.
21.2.1 Comparisons ofDie Steels for Hot Forging
Properties of materials that determine their se-lection as die materials for hot forging are:
● Ability to harden uniformly● Wear resistance (this is the ability of a die
steel to resist the abrasive action of hot metalduring forging)
● Resistance to plastic deformation (this is theability of a die steel to withstand pressureand resist deformation under load)
● Toughness● Ability to resist thermal fatigue and heat
checking● Ability to resist mechanical fatigue
Ability to Harden Uniformly. The higher thehardenability, the greater the depth to which a
material can be hardened. Hardenability de-pends on the composition of the tool steel. Ingeneral, the higher the alloy contents of a steel,the higher its hardenability, as measured by theDI factor (in inches). The DI of steel is the di-ameter of an infinitely long cylinder that wouldjust transform to a specific microstructure at thecenter, if heat transfer during cooling were ideal,i.e., if the surface attained the temperature of thequenching medium instantly. A larger harden-ability factor DI means that the steel will hardento a greater depth on quenching, not that it willhave a higher hardness. For example, the ap-proximate nominal hardenability factors DI(inches) for a few die steels are as follows:ASM-6G, 15; ASM-6F2, 15; ASM-6F3, 36;AISI-H10, 128; and AISI-H12, 88 [Altan et al.,1983].
Wear Resistance. Wear is a gradual changein dimensions or shape of a component causedby corrosion, dissolution, abrasion, and removalor transportation of the wear products. Abrasionresulting from friction is the most important ofthese mechanisms in terms of die wear. Thehigher the strength and hardening of the steelnear the surface of the die, the greater its resis-tance to abrasion. Thus, in hot forging, the diesteel should have a high hot hardness and shouldretain this hardness over extended periods of ex-posure to elevated temperatures.
Figure 21.2 shows the hot hardness of six hotwork die steels at various temperatures. All ofthese steels were heat treated to about the sameinitial hardness. Hardness measurements weremade after holding the specimens at testing tem-peratures for 30 min. Except for H12, all the diesteels considered have about the same hot hard-ness at temperatures less than about 600 �F (315�C). The differences in hot hardness show uponly at temperatures above 900 �F (482 �C).
Figure 21.3 shows the resistance of some hotwork die steels to softening at elevated tempera-tures for 10 h of exposure. All of these steelshave about the same initial hardness after heattreatment. For the die steels shown, there is notmuch variation in resistance to softening at tem-
Table 21.5 Tungsten-base hot work die steels[Altan et al., 1983]
Designation Nominal composition, %
(ASM) C Mn Si Co Cr Mo Ni V W
H21 0.30 0.30 0.30 . . . 3.50 . . . . . . 0.45 9.25H22 0.35 0.30 0.30 . . . 2.00 . . . . . . 0.40 11.00H23 0.30 0.30 0.30 . . . 12.00 . . . . . . 1.00 12.00H24 0.45 0.30 0.30 . . . 3.00 . . . . . . 0.50 15.00H25 0.25 0.30 0.30 . . . 4.0 . . . . . . 0.50 15.00H26 0.50 0.30 0.30 . . . 4.0 . . . . . . 1.00 18.00

280 / Cold and Hot Forging: Fundamentals and Applications
Fig. 21.3 Resistance of hot work die steels to softening during elevated-temperature exposure as measured by room-temperaturehardness. Courtesy of Universal Cyclops Steel Corp.
Fig. 21.2 Hot hardness of hot work die steels (measurements made after holding at testing temperature for 30 min.). Courtesy ofLatrobe Steel Co.
peratures below 1000 �F (538 �C). However, forlonger periods of exposure at higher tempera-tures, high-alloy hot work steels, such as H19,H21, and H10 modified, retain hardness betterthan the medium-alloy steels such as H11.
Resistance to Plastic Deformation. As canbe seen in Fig. 21.4, the yield strengths of steeldecrease at higher temperatures. However, yieldstrength is also dependent on prior heat treat-ment, composition, and hardness. The higher the

Die Materials and Die Manufacturing / 281
Fig. 21.4 Resistance of die steels to plastic deformation atelevated temperatures (values in parentheses in-
dicate hardness at room temperature). Courtesy of Universal Cy-clops Steel Corp. and A. Finkl and Sons Co.
Fig. 21.5 Variation of Charpy toughness with different hard-ness levels and testing temperatures on hot work
die steels (values in parentheses indicate hardness at room tem-perature) [Nagpal, 1976b]
initial hardness, the greater the yield strengths atvarious temperatures. In normal practice, thelevel to which die steel is hardened is deter-mined by the toughness of steel. Thus, in forgingapplications, the die block is hardened to a levelat which it should have enough toughness toavoid cracking. Figure 21.5 shows that, for thesame initial hardness, 5% Cr-Mo steels (H11,etc.) have better hot strengths than 6F2 and 6F3at temperatures greater than 700 �F (371 �C).Tensile strength, creep properties, and toughnessof various die steels are given in Fig. 21.6 and21.7.
Toughness is the ability of the material to ab-sorb energy without fracture. It is a combinationof strength and ductility. It increases with in-creasing temperature and is important in avoid-ing brittle fracture (Fig. 21.7 and 21.8). Mostmaterials exhibit a ductile-to-brittle transitiontemperature. To avoid immediate and cata-strophic failure, dies must be put into serviceabove this temperature. Ductility, as measuredby reduction in area measured in a tensile test,also increases with temperature (Fig. 21.8).
Figure 21.8 shows the ductility of various hotwork steels at elevated temperatures, as mea-sured by percent reduction in area of a specimen
before fracture in a standard tensile test. As thecurves show, high-alloy hot work steels, such asH19 and H21, have less ductility than medium-alloy hot work steels such as H11. This explainswhy H19 and H21 have lower toughness thanthat of H11.
Fracture toughness and resistance to shockloading are often measured by a notched-barCharpy test. This test measures the amount ofenergy absorbed in introducing and propagatingfracture, or toughness, of a material at high ratesof deformation (impact loading). Figure 21.5shows the results of V-notch Charpy tests onsome die steels. The data show that toughnessdecreases as the alloy content increases. Me-dium-alloy steels such as H11, H12, and H13have better resistance to brittle fracture in com-parison with H14, H19, and H21, which havehigher alloy contents. Increasing the hardness ofthe steel lowers its impact strength, as shown bydata on 6F7 steel hardened to two different lev-els. On the other hand, wear resistance and hotstrength decrease with decreasing hardness.Thus, a compromise is made in actual practice,and dies are tempered to near-maximum hard-

Fig. 21.6 Tensile strength and ductility versus test temperatures for selected die materials [Thyssen]
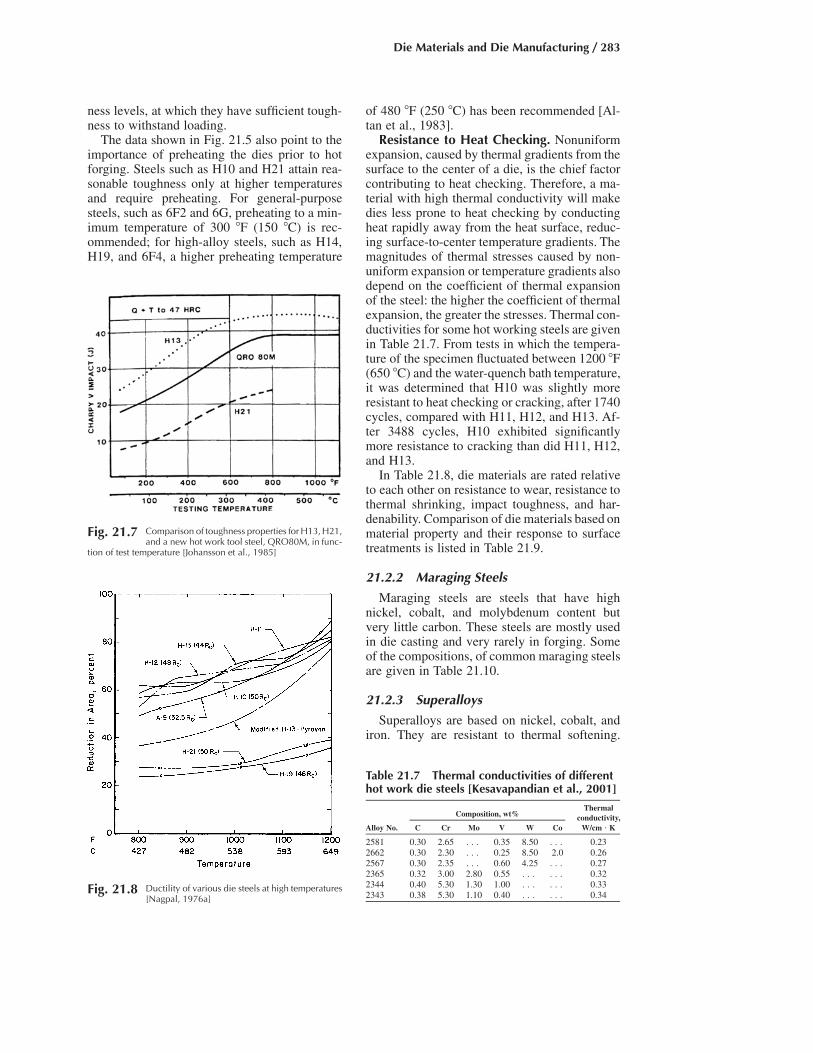
Die Materials and Die Manufacturing / 283
Fig. 21.8 Ductility of various die steels at high temperatures[Nagpal, 1976a]
Fig. 21.7 Comparison of toughness properties for H13, H21,and a new hot work tool steel, QRO80M, in func-
tion of test temperature [Johansson et al., 1985]
Table 21.7 Thermal conductivities of differenthot work die steels [Kesavapandian et al., 2001]
Composition, wt%Thermal
conductivity,Alloy No. C Cr Mo V W Co W/cm • K
2581 0.30 2.65 . . . 0.35 8.50 . . . 0.232662 0.30 2.30 . . . 0.25 8.50 2.0 0.262567 0.30 2.35 . . . 0.60 4.25 . . . 0.272365 0.32 3.00 2.80 0.55 . . . . . . 0.322344 0.40 5.30 1.30 1.00 . . . . . . 0.332343 0.38 5.30 1.10 0.40 . . . . . . 0.34
ness levels, at which they have sufficient tough-ness to withstand loading.
The data shown in Fig. 21.5 also point to theimportance of preheating the dies prior to hotforging. Steels such as H10 and H21 attain rea-sonable toughness only at higher temperaturesand require preheating. For general-purposesteels, such as 6F2 and 6G, preheating to a min-imum temperature of 300 �F (150 �C) is rec-ommended; for high-alloy steels, such as H14,H19, and 6F4, a higher preheating temperature
of 480 �F (250 �C) has been recommended [Al-tan et al., 1983].
Resistance to Heat Checking. Nonuniformexpansion, caused by thermal gradients from thesurface to the center of a die, is the chief factorcontributing to heat checking. Therefore, a ma-terial with high thermal conductivity will makedies less prone to heat checking by conductingheat rapidly away from the heat surface, reduc-ing surface-to-center temperature gradients. Themagnitudes of thermal stresses caused by non-uniform expansion or temperature gradients alsodepend on the coefficient of thermal expansionof the steel: the higher the coefficient of thermalexpansion, the greater the stresses. Thermal con-ductivities for some hot working steels are givenin Table 21.7. From tests in which the tempera-ture of the specimen fluctuated between 1200 �F(650 �C) and the water-quench bath temperature,it was determined that H10 was slightly moreresistant to heat checking or cracking, after 1740cycles, compared with H11, H12, and H13. Af-ter 3488 cycles, H10 exhibited significantlymore resistance to cracking than did H11, H12,and H13.
In Table 21.8, die materials are rated relativeto each other on resistance to wear, resistance tothermal shrinking, impact toughness, and har-denability. Comparison of die materials based onmaterial property and their response to surfacetreatments is listed in Table 21.9.
21.2.2 Maraging Steels
Maraging steels are steels that have highnickel, cobalt, and molybdenum content butvery little carbon. These steels are mostly usedin die casting and very rarely in forging. Someof the compositions, of common maraging steelsare given in Table 21.10.
21.2.3 Superalloys
Superalloys are based on nickel, cobalt, andiron. They are resistant to thermal softening.
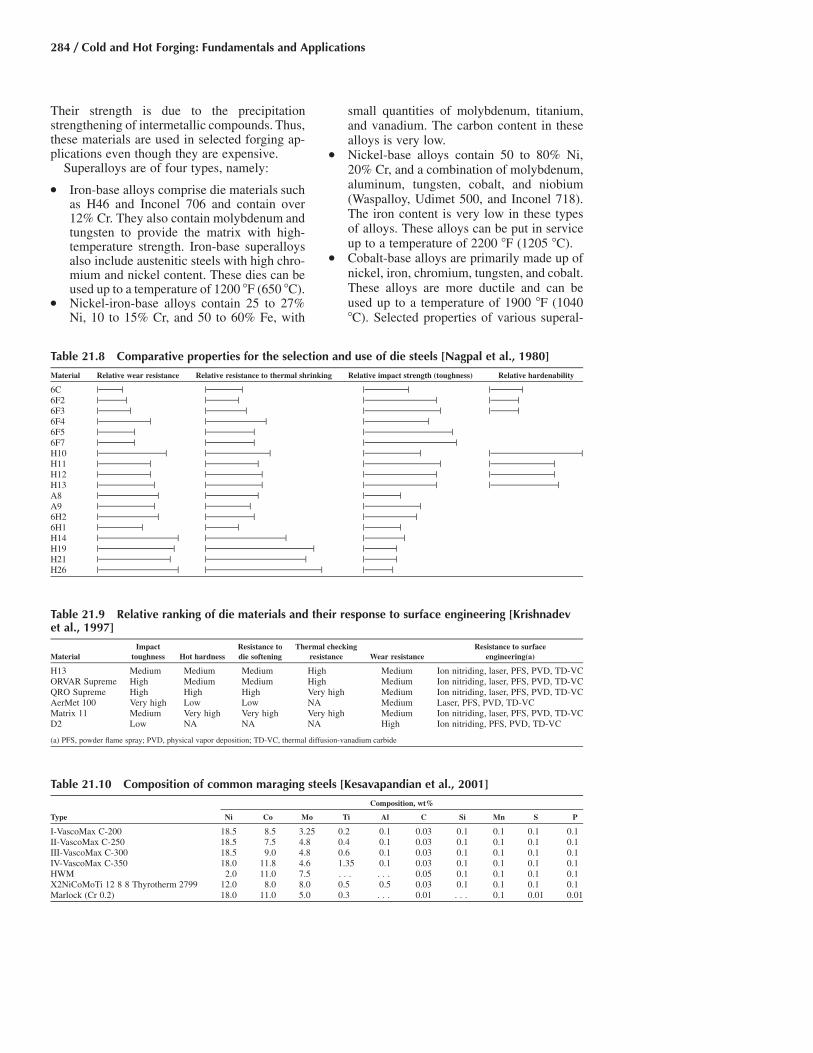
284 / Cold and Hot Forging: Fundamentals and Applications
Table 21.10 Composition of common maraging steels [Kesavapandian et al., 2001]
Composition, wt%
Type Ni Co Mo Ti Al C Si Mn S P
I-VascoMax C-200 18.5 8.5 3.25 0.2 0.1 0.03 0.1 0.1 0.1 0.1II-VascoMax C-250 18.5 7.5 4.8 0.4 0.1 0.03 0.1 0.1 0.1 0.1III-VascoMax C-300 18.5 9.0 4.8 0.6 0.1 0.03 0.1 0.1 0.1 0.1IV-VascoMax C-350 18.0 11.8 4.6 1.35 0.1 0.03 0.1 0.1 0.1 0.1HWM 2.0 11.0 7.5 . . . . . . 0.05 0.1 0.1 0.1 0.1X2NiCoMoTi 12 8 8 Thyrotherm 2799 12.0 8.0 8.0 0.5 0.5 0.03 0.1 0.1 0.1 0.1Marlock (Cr 0.2) 18.0 11.0 5.0 0.3 . . . 0.01 . . . 0.1 0.01 0.01
Table 21.9 Relative ranking of die materials and their response to surface engineering [Krishnadevet al., 1997]
MaterialImpact
toughness Hot hardnessResistance todie softening
Thermal checkingresistance Wear resistance
Resistance to surfaceengineering(a)
H13 Medium Medium Medium High Medium Ion nitriding, laser, PFS, PVD, TD-VCORVAR Supreme High Medium Medium High Medium Ion nitriding, laser, PFS, PVD, TD-VCQRO Supreme High High High Very high Medium Ion nitriding, laser, PFS, PVD, TD-VCAerMet 100 Very high Low Low NA Medium Laser, PFS, PVD, TD-VCMatrix 11 Medium Very high Very high Very high Medium Ion nitriding, laser, PFS, PVD, TD-VCD2 Low NA NA NA High Ion nitriding, PFS, PVD, TD-VC
(a) PFS, powder flame spray; PVD, physical vapor deposition; TD-VC, thermal diffusion-vanadium carbide
Table 21.8 Comparative properties for the selection and use of die steels [Nagpal et al., 1980]
Material Relative wear resistance Relative resistance to thermal shrinking Relative impact strength (toughness) Relative hardenability
6C | | | | | | | |6F2 | | | | | | | |6F3 | | | | | | | |6F4 | | | | | |6F5 | | | | | |6F7 | | | | | |H10 | | | | | | | |H11 | | | | | | | |H12 | | | | | | | |H13 | | | | | | | |A8 | | | | | |A9 | | | | | |6H2 | | | | | |6H1 | | | | | |H14 | | | | | |H19 | | | | | |H21 | | | | | |H26 | | | | | |
Their strength is due to the precipitationstrengthening of intermetallic compounds. Thus,these materials are used in selected forging ap-plications even though they are expensive.
Superalloys are of four types, namely:
● Iron-base alloys comprise die materials suchas H46 and Inconel 706 and contain over12% Cr. They also contain molybdenum andtungsten to provide the matrix with high-temperature strength. Iron-base superalloysalso include austenitic steels with high chro-mium and nickel content. These dies can beused up to a temperature of 1200 �F (650 �C).
● Nickel-iron-base alloys contain 25 to 27%Ni, 10 to 15% Cr, and 50 to 60% Fe, with
small quantities of molybdenum, titanium,and vanadium. The carbon content in thesealloys is very low.
● Nickel-base alloys contain 50 to 80% Ni,20% Cr, and a combination of molybdenum,aluminum, tungsten, cobalt, and niobium(Waspalloy, Udimet 500, and Inconel 718).The iron content is very low in these typesof alloys. These alloys can be put in serviceup to a temperature of 2200 �F (1205 �C).
● Cobalt-base alloys are primarily made up ofnickel, iron, chromium, tungsten, and cobalt.These alloys are more ductile and can beused up to a temperature of 1900 �F (1040�C). Selected properties of various superal-

Die Materials and Die Manufacturing / 285
loys are given in the literature [Semiatin etal., 1981].
21.2.4 Ceramic Dies
Some of the newer nonferrous alloys havemarked improvements over the traditional diematerials (Cr-Mo-V-base steels) used in hot forg-ing. For example, Nissan Motor Co. is using cer-met dies in extrusion [Kesavapandian et al.,2001]. The material is composed of MoB (ce-ramic) and nickel (metal.) Boron improves resis-tance to oxidation at high temperatures. The ma-terial is powder formed and sintered. Die lifeimprovements over traditional materials is 2 to 1.
Hot forging wear tests [Bramley et al., 1989]compare silicon-base ceramics to conventionaldie steels. Silicon-base ceramics exhibit far lesswear than the conventional die steels. These ma-terials are very pure, with fine grains and uni-form microstructures. They have high hardness,strength, and resistance to mechanical and ther-mal shock. However, these materials are brittleand must not be subjected to tensile stresses; inaddition, they are expensive. Therefore, they areused only in selected applications.
21.2.5 Nickel Aluminides
Nickel aluminides are attractive because theyderive their strength from their ordered micro-structure instead of heat treatments. Their yieldstrength increases with temperature up to about1560 �F (850 �C), and they have excellent resis-tance to oxidation up to 1830 �F (1000 �C). In-formation on the composition and properties ofvarious nickel aluminides is available in the lit-erature.
[Maddox et al., 1997] documented the resultsof a series of performance tests between thenickel aluminide alloys 221M-T and more tra-ditional die steels. Whereas H11 and H13 losestrength and hardness above 1000 �F (540 �C),nickel aluminide alloys have improved high-temperature strength, oxidation resistance, andthermal stability at temperatures ranging from1500 to 2300 �F (815 to 1260 �C). The compo-sition of this alloy is Ni3Al, with additions ofchromium for ductility and resistance to oxida-tion; molybdenum for strength; zirconium forstrength, resistance to oxidation, weldability,and castability; and boron for ductility. The alloyis stronger than Inconel 718 in both tension andcompression. The results of the performance testare impressive for the nickel aluminide die ma-terial. For the particular part being forged (at
2300 �F, or 1260 �C), conventional dies typicallyfailed after 5000 parts due to erosion, whereasthe nickel aluminide dies lasted for 35,000 parts(a sevenfold increase). After resinking the cav-ity, the nickel aluminide dies lasted for 50,000parts (a tenfold increase). Hardness in the flashactually also went up due to work hardening.This alloy keeps its hardness at high tempera-tures from the cast microstructure and notthrough a thermal treatment. Also important isthat, while heat checking was detected in thedies, it was not important, because of the highductility of the material.
21.3 Heat Treatment
Heat treatment of die steels involves the fol-lowing steps:
1. Austenitizing temperature of a hot work toolsteel ranges from 1830 to 2730 �F (1000 to1500 �C). During this phase, the structure ofsteel transforms from a ferrite-pearlite struc-ture to austenite. The dies are held at thesetemperatures for a long time, which is calleda “soak” or “hold” time, to convert the entirestructure uniformly to austenite. Carbides oralloying elements go into solution [Krauss etal., 1998 and Kesavapandian et al., 2001].
2. After soaking, the dies are quenched in aquench medium to a temperature below thetransformation temperature. Based on thecooling rate, the die transforms into differentphases. Martensite is the ideal final structure,but lower bainite, upper bainite, pearlite, orretained austenite can be present in the struc-ture.
3. During tempering, the martensite is temperedto a tougher structure. This can be done inseveral stages to maximize toughness with-out reducing hardness.
Hardening and tempering temperatures forvarious tool steels are available in literature andfrom die steel suppliers [Roberts et al., 1980].
21.4 Die and ToolMaterials for Cold Forging
The tooling for cold forging is described inChapter 17, “Cold and Warm Forging,” in thisbook. The back or pressure plates, which musthave high compressive strength, are made from

286 / Cold and Hot Forging: Fundamentals and Applications
Table 21.14 Steels for shrink rings [Lange,1976]
Designation (AISI) Required hardness, HB
H13 470 to 530440 to 510330 to 390
4340 330 to 390270 to 330
4140 270 to 330
Table 21.13 Tool steels and tungsten carbidesfor die inserts [Lange, 1976]
Tool steelsTungsten carbides
Designation(AISI)
Requiredhardness,
HRC Co, wt%Density,g/cm3
Hardness,DPH
D2 60 to 62 25 to 30 13.1 to 12.5 950 to 750M2 60 to 64 18 to 42 13.6 to 13.2 1050 to 950
15 to 18 14.0 to 13.7 1200 to 1100
Table 21.12 Tool steels for cold extrusionpunches [Lange, 1976]
Requiredstrength Tool steel
ksi MPa Designation (AISI) Required hardness, HRC
Forward extrusion
300 2100 M2 62 to 64285 2000 D2 60 to 62
O1 60 to 62230 1600 S1 56 to 58
Backward extrusion
315 2200 M4 63 to 65300 2100 M2 62 to 64285 2000 D2 60 to 62
Table 21.11 Tool steels for pressure plates[Lange, 1976]
Requiredstrength Designation Required hardness
ksi MPa (AISI) HRC HB
240 1700 A2 58 to 62 . . .D2 58 to 62 . . .D3 58 to 62 . . .O1 58 to 61 . . .
200 1400 H13 50 to 54 . . .O1 50 to 54 . . .
155 1100 A8 40 to 44 . . .O1 40 to 44 . . .
100 700 4340 . . . 270 to 3304140 . . . 270 to 330
Table 21.15 Tool steels for counterpunchesand ejectors [Lange, 1976]
Designation (AISI) Required hardness, HB
M2 62 to 64D2 60 to 62A2 60 to 62O1 60 to 62S1 56 to 58
steels hardened up to 62 HRC, as given in Table21.11. Selection of the punch material dependson the type of deformation. For example, in for-ward extrusion, the punch material must havehigh compressive strength, whereas in backwardextrusion, the punch must also have very good
wear resistance, as a considerable amount ofmetal flow occurs along the punch surface. Coldwork steels are a class of tool steels in which thesurface temperature does not exceed 390 �F (200�C) during use. These steels offer high hardness,good toughness, and good resistance to shock,pressure, or wear. The subdivisions of this classare water-hardened steels, medium-and high-al-loyed cold-worked steels, and high-carbon chro-mium steels. Tool steels commonly used for coldforging punches are given in Table 21.12. Thedies are subjected to high cycling pressure aswell as abrasion. Therefore, die materials musthave high fatigue strength and good resistanceto wear (Table 21.13). In cold extrusion, the dieinserts are prestressed with one or two shrinkrings so that they can withstand the high stressespresent in the die cavity. Materials suitable forshrink rings are given in Table 21.14. Tool steelsused for ejectors and counterpunches are givenin Table 21.15 [Lange, 1976]. Table 21.16 givesthe relative performance of different cold forg-ing tools.
The special-purpose steels are the materialsthat cannot be classified as either cold-workedor high-speed steels. They are required whencertain properties are particularly important,such as corrosion resistance. Hardenable hardmaterials are a class between high-speed steelsand carbides. They have good machinability, aslong as they have not been hardened, and a veryhigh resistance to wear in the hardened state.They are used to form very large cold forgings[ICFG, 1992].
21.4.1 Cemented Carbide
Cemented carbides are composite materialsconsisting of hard, wear-resistant material in amore ductile metallic matrix. The two elementsare formed into one through a sintering process.Tungsten carbide, which consists of tungsten ina cobalt matrix, is typical in tool and die appli-cations.
As manufacturing processes have improved,the use of tungsten and other cemented carbides

Die Materials and Die Manufacturing / 287
Table 21.16 Relative performance of tool steels [ICFG, 1992]
Tool steels Designation (AISI) Hardness, HRC Wear-resistance index Toughness index Machinability index Grindability index
Cold worked (CW)
Plain carbon W1 60 7 5 9 10W2 60 7 . . . 9 10
Medium/high-alloy CW A2 60 7 6 8 7O1 60 7 7 8 9S1 55 5 8 7 86F7 55 4 10 6 8
High-carbon chromium D2 60 8 4 3 4D3 60 8 3 6 3
Hot worked (HW)
Medium-alloy HW 6F2 45 2.5 10 6 8High-alloyed HW H13 45 4 9 8 8
H10 45 4 8 8 8H19 45 4 8 5 7
High-speed steel M2 60 9 4 4 5M3 64 10 2 3 2T15 64 10 2 1 1T42 64 10 2 1 1
Note: 10 � best; 1 � poor
has grown drastically. Today, the material isused for more complex shapes and many formsof extrusion tooling. Carbides are characterizedby high hardness, high modulus of elasticity, andgreat compressive strength, while the tensilestrength is limited. The hardness is typicallymeasured using the Vickers or Rockwell Ascale. It is important to note that Rockwell C iscompletely inadequate for measuring carbidehardness, and an attempt to do so could likelydamage the diamond tip on the hardness ma-chine.
The International Cold Forging Group hasbroken cemented carbides into six groups: A, B,C, D, E, and F. These classifications are basedon composition as relevant to cold forging ap-plications [ICFG, 1992]. Table 21.17 displaystypical ranges for the mechanical properties ofeach carbide class.
21.4.2 Material Selection forCold Forging Tools
The material used to produce each tool com-ponent can be selected once the dimensions ofthe tool have been selected. Important factors toconsider are the forming process, press param-eters, batch size, and forming load. Table 21.18displays common tool steels for each componentin the two most common processes. Table 21.19indicates which carbide groups are appropriatefor the individual components.
When choosing a die or insert material, thefirst decision is whether to use tool steel or car-bide. When deciding between the two, it is es-pecially important to consider the size of the die
insert, the geometry of the die profile, the tol-erances of the component to be manufactured,the batch size, and the operating conditions. Car-bide inserts must be under compressive stresses,since carbide cannot sustain tensile stresses.
In general, if the die insert is 1.2 in. (30 mm)in diameter or less, carbide can be used. Pro-cesses such as free extrusion permit die ofgreater size to be made from cemented carbide.Also, carbide is used almost exclusively for diesin high production.
With respect to geometry, all corners of a car-bide die must have generous radii. In general,the shapes must be simple in order to use car-bide. The ratio D/d1 that compares the overalldiameter of the die, D, and bore diameter of thedie insert, d1, must be greater than 4.5 for car-bide to be applicable. In the case of free extru-sion, the ratio can be reduced to 3. If the ratio isless than the critical value or the geometry is toocomplex for carbide, tool steel should be used.
Considerations for selecting the punch mate-rial are very similar to those accounted for in diematerial selection. Since cemented carbide has avery high compressive strength, it should beused if the maximum compressive stress isgreater than 365 ksi (2500 MPa). If the punchwill be used for can extrusion, cemented carbidemay be used if the H/D ratio is greater than 2.5,where H is the depth of the can bore hole, andD is the diameter of the punch. When carbide isused for backward extrusion, the length of thepunch should be kept as short as possible [ICFG,1992].
When selecting a material for warm forgingdies, the preliminary concerns must be the ther-

288 / Cold and Hot Forging: Fundamentals and Applications
Tabl
e21
.17
Cem
ente
dca
rbid
epr
oper
ties
[IC
FG,1
992]
Har
dnes
sT
rans
vers
eru
ptur
est
reng
thC
ompr
essi
vest
reng
th
Com
posi
tion
,wt%
WC
grai
nsi
ze,
Den
sity
,R
oom
tem
p.57
0�F
(300
�C)
Roo
mte
mp.
570
�F(3
00�C
)W
eibu
llR
oom
tem
p.57
0�F
(300
�C)
0.2%
proo
fY
oung
’sm
odul
usP
oiss
on’s
Coe
ffici
ent
ofth
erm
alG
roup
Co
CT
iCl
mg/
cm3
HV
HR
AH
VT
RE
ksi
MP
aks
iM
Pa
expo
nent
ksi
MP
aks
iM
Pa
stre
ssks
iM
Pa
rati
oex
pans
ion
A5–
70–
2.5
11–
514
.7–1
5.1
1450
–155
090
.5–9
112
00�
0.5
�26
0�
1800
�23
0�
1600
�9
�59
5�
4100
�45
0�
3100
�70
91,0
0063
0,00
00.
224.
9�
10�
6
B8–
100–
2.5
11–
514
.4–1
4.7
1300
–140
089
–90
1050
�0.
7�
290
�20
00�
260
�18
00�
9�
550
�38
00�
420
�29
00�
6588
,000
610,
000
0.22
5.0
�10
�6
C11
–13
0–2.
51
1–5
14.1
–14.
412
00–1
250
88–8
8.5
1000
�1.
0�
320
�22
00�
290
�20
00�
10�
520
�36
00�
405
�28
00�
6083
,000
570,
000
0.22
5.4
�10
�6
D14
–17
0–2.
51
1–5
13.8
–14.
211
00–1
150
87–8
7.5
900
�1.
2�
360
�25
00�
335
�23
00�
10�
480
�33
00�
390
�27
00�
5578
,000
540,
000
0.22
5.6
�10
�6
E18
–22
0–2.
51
1–5
13.3
–13.
895
0–10
0085
.5–8
675
0�
1.5
�36
0�
2500
�32
0�
2200
�11
�45
0�
3100
�36
0�
2500
�45
73,0
0050
0,00
00.
236.
3�
10�
6
F23
–30
0–2.
51
1–5
12.6
–13
800–
850
83.5
–84
600
�1.
9�
335
�23
00�
275
�19
00�
11�
390
�27
00�
335
�23
00�
3565
,000
450,
000
0.24
7.0
�10
�6
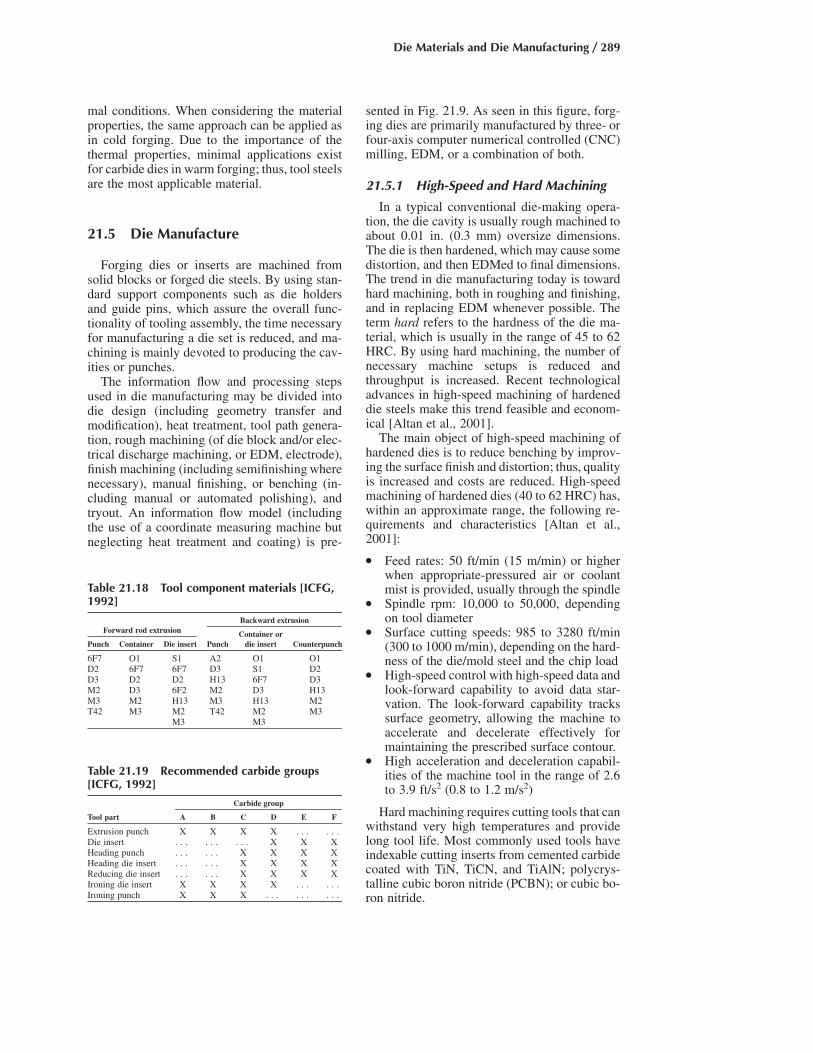
Die Materials and Die Manufacturing / 289
Table 21.19 Recommended carbide groups[ICFG, 1992]
Carbide group
Tool part A B C D E F
Extrusion punch X X X X . . . . . .Die insert . . . . . . . . . X X XHeading punch . . . . . . X X X XHeading die insert . . . . . . X X X XReducing die insert . . . . . . X X X XIroning die insert X X X X . . . . . .Ironing punch X X X . . . . . . . . .
Table 21.18 Tool component materials [ICFG,1992]
Forward rod extrusionBackward extrusion
Punch Container Die insert PunchContainer or
die insert Counterpunch
6F7 O1 S1 A2 O1 O1D2 6F7 6F7 D3 S1 D2D3 D2 D2 H13 6F7 D3M2 D3 6F2 M2 D3 H13M3 M2 H13 M3 H13 M2T42 M3 M2 T42 M2 M3
M3 M3
mal conditions. When considering the materialproperties, the same approach can be applied asin cold forging. Due to the importance of thethermal properties, minimal applications existfor carbide dies in warm forging; thus, tool steelsare the most applicable material.
21.5 Die Manufacture
Forging dies or inserts are machined fromsolid blocks or forged die steels. By using stan-dard support components such as die holdersand guide pins, which assure the overall func-tionality of tooling assembly, the time necessaryfor manufacturing a die set is reduced, and ma-chining is mainly devoted to producing the cav-ities or punches.
The information flow and processing stepsused in die manufacturing may be divided intodie design (including geometry transfer andmodification), heat treatment, tool path genera-tion, rough machining (of die block and/or elec-trical discharge machining, or EDM, electrode),finish machining (including semifinishing wherenecessary), manual finishing, or benching (in-cluding manual or automated polishing), andtryout. An information flow model (includingthe use of a coordinate measuring machine butneglecting heat treatment and coating) is pre-
sented in Fig. 21.9. As seen in this figure, forg-ing dies are primarily manufactured by three- orfour-axis computer numerical controlled (CNC)milling, EDM, or a combination of both.
21.5.1 High-Speed and Hard Machining
In a typical conventional die-making opera-tion, the die cavity is usually rough machined toabout 0.01 in. (0.3 mm) oversize dimensions.The die is then hardened, which may cause somedistortion, and then EDMed to final dimensions.The trend in die manufacturing today is towardhard machining, both in roughing and finishing,and in replacing EDM whenever possible. Theterm hard refers to the hardness of the die ma-terial, which is usually in the range of 45 to 62HRC. By using hard machining, the number ofnecessary machine setups is reduced andthroughput is increased. Recent technologicaladvances in high-speed machining of hardeneddie steels make this trend feasible and econom-ical [Altan et al., 2001].
The main object of high-speed machining ofhardened dies is to reduce benching by improv-ing the surface finish and distortion; thus, qualityis increased and costs are reduced. High-speedmachining of hardened dies (40 to 62 HRC) has,within an approximate range, the following re-quirements and characteristics [Altan et al.,2001]:
● Feed rates: 50 ft/min (15 m/min) or higherwhen appropriate-pressured air or coolantmist is provided, usually through the spindle
● Spindle rpm: 10,000 to 50,000, dependingon tool diameter
● Surface cutting speeds: 985 to 3280 ft/min(300 to 1000 m/min), depending on the hard-ness of the die/mold steel and the chip load
● High-speed control with high-speed data andlook-forward capability to avoid data star-vation. The look-forward capability trackssurface geometry, allowing the machine toaccelerate and decelerate effectively formaintaining the prescribed surface contour.
● High acceleration and deceleration capabil-ities of the machine tool in the range of 2.6to 3.9 ft/s2 (0.8 to 1.2 m/s2)
Hard machining requires cutting tools that canwithstand very high temperatures and providelong tool life. Most commonly used tools haveindexable cutting inserts from cemented carbidecoated with TiN, TiCN, and TiAlN; polycrys-talline cubic boron nitride (PCBN); or cubic bo-ron nitride.

290 / Cold and Hot Forging: Fundamentals and Applications
Fig. 21.9 Information flow and processing steps in die manufacturing. CMM, coordinate measuring machine; CNC, computernumerical control; EDM, electrical discharge machining
Ball-nosed end mills, from solid-coated car-bide or with inserts, are commonly used in theproduction of die cavities. The ball nose allowsthe machining of complex curves and surfacesin the die cavity. Using an appropriate step-over
distance and computer-aided tool-path genera-tion, most cavities can be machined with ac-ceptable surface finish.
In manufacturing cold forging dies from toolsteels, hard-turning PCBN tools are used. How-

Die Materials and Die Manufacturing / 291
Fig. 21.10 Schematic of electrodischarge machining [Altanet al., 1983]
ever, in manufacturing carbide inserts, EDMmust be utilized.
21.5.2 Electrodischarge Machining (EDM)
The EDM process is a versatile process fordie manufacturing. The process consists of apower supply that passes a current through anelectrode, creating a voltage potential betweenit and a conductive workpiece. As the electrodemoves closer to the workpiece, the gap betweenthe two will become sufficiently small, and aspark will pass from one material to the next.The spark vaporizes portions of both the elec-trode and the workpiece, and the removed ma-terial is washed away by a dielectric flushingfluid. There are two types of electrodischargemachines: sink and wire.
The sink EDM (SEDM), as shown in Fig.21.10, generates internal cavities by lowering agraphite or copper electrode into the die block.As the spark removes material, the workpiecebegins to take the form of the electrode. Theelectrodes are most frequently created by CNCmilling. Advantages of the SEDM are that it cre-ates a good surface finish; accuracy and repeat-ability are high; and the hardness of the materialdoes not influence the efficiency of the process.Therefore, the majority of die makers use EDMmainly for finishing of dies from already rough-machined and hardened die steels and for manu-facturing of carbide die inserts.
The disadvantages of the SEDM process be-gin with the lead time required to design andmanufacture the electrodes. Process concerns in-clude electrode wear, material removal rate, andparticle flushing. Electrode wear is caused, be-cause the process consumes it in addition to re-moving the workpiece material. This limits therepeatability of the process. The EDM technol-
ogy functions on a much smaller scale than con-ventional machining, which produces inherentlylower material removal rates. This reduces theefficiency of the process. Typically, the SEDMis used because the desired geometry requiresthe technology. As the workpiece material is re-moved, a flushing fluid is passed through the gapto remove the particles. The fluid also cools theworkpiece, the electrode, and the removed par-ticles. Particles resolidify to the workpiece sur-face during cooling and form a martensitic layerreferred to as the white layer. This surface iscomposed of high tensile residual stresses fromthe thermal cycle and may have numerous sur-face cracks, which severely reduce the fatiguelife of the die material. The dielectric fluid usedin the EDM process is filtered to collect the par-ticles flushed during the process. The cost of dis-carding this residue is high, because it is envi-ronmentally hazardous.
In the United States, the large majority of theelectrodes are made from graphite. Graphite isused because it is a soft material that can easilybe polished with sandpaper. When a better sur-face finish is required, copper is selected for theelectrode material. Copper is the second mostcommon material used in the United States, andmore common in Europe and Japan. In additionto an improved surface finish, copper electrodescan produce much tighter tolerances.
The wire EDM (WEDM) functions in muchthe same way as the SEDM. The primary dif-ference is that the electrode is a wire ranging indiameter from 0.002 to 0.012 in. (0.05 to 0.30mm). Today, almost all machines are four-axiscenters in which the upper and lower wire guidescan move independently of one another in boththe x- and y-directions. In addition, the table thatholds the workpiece can move in the same di-rections. Movement of the guides and worktableis controlled by numerical-controlled program-ming. In forging, WEDM is mainly used formanufacturing trimming dies.
21.5.3 Hobbing
In hobbing, a hardened (58 to 62 HRC) punchis pressed into an annealed, soft die steel block,using a hydraulic press. The process may be coldor at elevated temperatures (warm or hot hob-bing). A single hobbing punch can be used tomanufacture a large number of cavities. Thisprocess is particularly attractive for making dieswith shallow cavities or dies that can be hard-ened after the cavity has been produced. Major
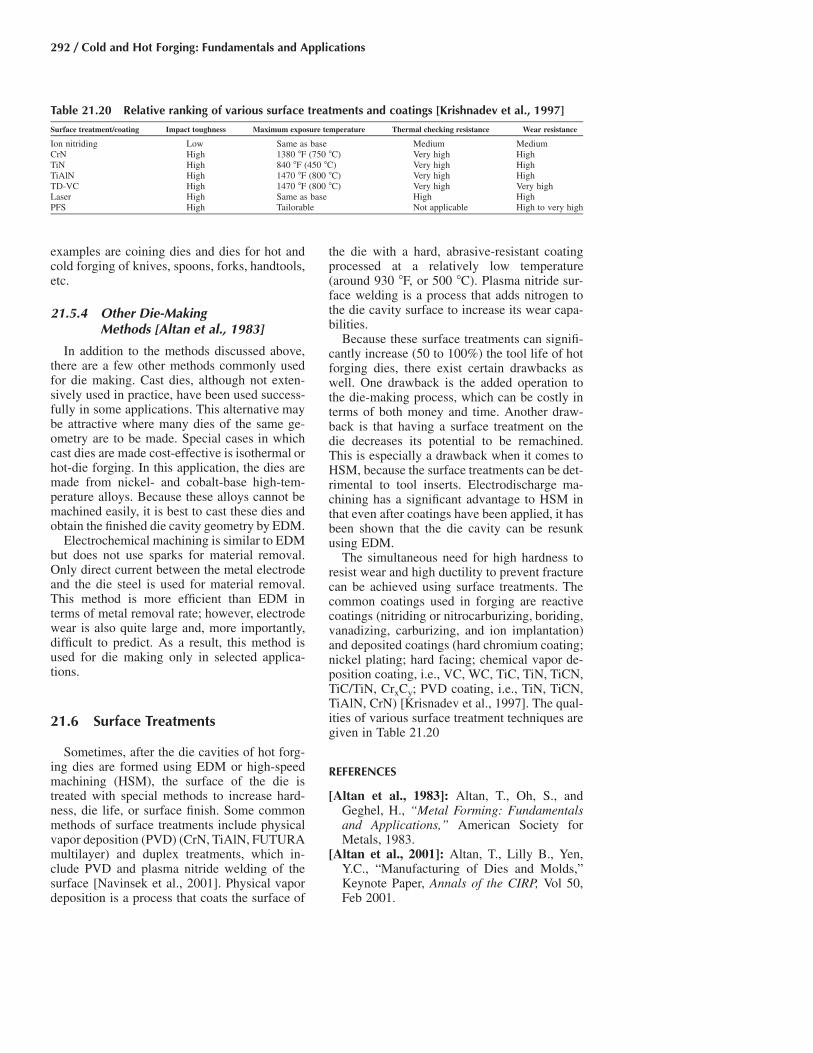
292 / Cold and Hot Forging: Fundamentals and Applications
Table 21.20 Relative ranking of various surface treatments and coatings [Krishnadev et al., 1997]
Surface treatment/coating Impact toughness Maximum exposure temperature Thermal checking resistance Wear resistance
Ion nitriding Low Same as base Medium MediumCrN High 1380 �F (750 �C) Very high HighTiN High 840 �F (450 �C) Very high HighTiAlN High 1470 �F (800 �C) Very high HighTD-VC High 1470 �F (800 �C) Very high Very highLaser High Same as base High HighPFS High Tailorable Not applicable High to very high
examples are coining dies and dies for hot andcold forging of knives, spoons, forks, handtools,etc.
21.5.4 Other Die-MakingMethods [Altan et al., 1983]
In addition to the methods discussed above,there are a few other methods commonly usedfor die making. Cast dies, although not exten-sively used in practice, have been used success-fully in some applications. This alternative maybe attractive where many dies of the same ge-ometry are to be made. Special cases in whichcast dies are made cost-effective is isothermal orhot-die forging. In this application, the dies aremade from nickel- and cobalt-base high-tem-perature alloys. Because these alloys cannot bemachined easily, it is best to cast these dies andobtain the finished die cavity geometry by EDM.
Electrochemical machining is similar to EDMbut does not use sparks for material removal.Only direct current between the metal electrodeand the die steel is used for material removal.This method is more efficient than EDM interms of metal removal rate; however, electrodewear is also quite large and, more importantly,difficult to predict. As a result, this method isused for die making only in selected applica-tions.
21.6 Surface Treatments
Sometimes, after the die cavities of hot forg-ing dies are formed using EDM or high-speedmachining (HSM), the surface of the die istreated with special methods to increase hard-ness, die life, or surface finish. Some commonmethods of surface treatments include physicalvapor deposition (PVD) (CrN, TiAlN, FUTURAmultilayer) and duplex treatments, which in-clude PVD and plasma nitride welding of thesurface [Navinsek et al., 2001]. Physical vapordeposition is a process that coats the surface of
the die with a hard, abrasive-resistant coatingprocessed at a relatively low temperature(around 930 �F, or 500 �C). Plasma nitride sur-face welding is a process that adds nitrogen tothe die cavity surface to increase its wear capa-bilities.
Because these surface treatments can signifi-cantly increase (50 to 100%) the tool life of hotforging dies, there exist certain drawbacks aswell. One drawback is the added operation tothe die-making process, which can be costly interms of both money and time. Another draw-back is that having a surface treatment on thedie decreases its potential to be remachined.This is especially a drawback when it comes toHSM, because the surface treatments can be det-rimental to tool inserts. Electrodischarge ma-chining has a significant advantage to HSM inthat even after coatings have been applied, it hasbeen shown that the die cavity can be resunkusing EDM.
The simultaneous need for high hardness toresist wear and high ductility to prevent fracturecan be achieved using surface treatments. Thecommon coatings used in forging are reactivecoatings (nitriding or nitrocarburizing, boriding,vanadizing, carburizing, and ion implantation)and deposited coatings (hard chromium coating;nickel plating; hard facing; chemical vapor de-position coating, i.e., VC, WC, TiC, TiN, TiCN,TiC/TiN, CrxCy; PVD coating, i.e., TiN, TiCN,TiAlN, CrN) [Krisnadev et al., 1997]. The qual-ities of various surface treatment techniques aregiven in Table 21.20
REFERENCES
[Altan et al., 1983]: Altan, T., Oh, S., andGeghel, H., “Metal Forming: Fundamentalsand Applications,” American Society forMetals, 1983.
[Altan et al., 2001]: Altan, T., Lilly B., Yen,Y.C., “Manufacturing of Dies and Molds,”Keynote Paper, Annals of the CIRP, Vol 50,Feb 2001.

Die Materials and Die Manufacturing / 293
[Blau, 1992]: Blau, P., Friction and Wear of Or-dered Intermetalic Alloys of Ni3Al, ASM In-ternational, 1992.
[Bramley et al., 1989]: Bramley, A., Lord, J.,and Davies, B., “Determination of Wear Re-sistance of Hot Work Die Materials,” Annalsof the CIRP, Vol 38/1, 1989, p 231–234.
[ICFG, 1992]: “Objectives, History and Pub-lished Documents,” ISBN 3-87525-058-3, In-ternational Cold Forging Group, 1992.
[Johansonn et al., 1985]: Johansson, B., Jons-son, L., et al., “Some Aspect in the Propertiesof QRO 80M and Die Casting Die Perfor-mance,” presented at the 13th InternationalDie Casting Congress and Exposition (Mil-waukee, WI), North American Die CastingAssociation, 1985.
[Kesavapandian et al., 2001]: Kesavapandian,G., Ngaile, G., Altan, T., “Evaluation of DieMaterials and Surface Treatments for Hot Pre-cision Forging,” ERC/NSM Report No. B/ERC/NSM-01-R-42A, The Ohio State Uni-versity, 2001.
[Krauss et al., 1998]: Roberts, G., Krauss, G.,et al., Tool Steels, ASM International, 1998.
[Krishnadev et al., 1997]: Krishnadev, andJain, C., “Enhancing Hot Forging Die Life,”Forging, winter 1997, p 67–72.
[Lange, 1976]: Lange, K., “Massive Forming,”Textbook of Metal Forming, Vol. 2, Springer-Verlag, New York, 1976 (in German).
[Maddox et al., 1997]: Maddox, G., and Orth,J., “Performance of Nickel Aluminide Forg-ing Dies,” Forging, winter 1997, p 75–78.
[Nagpal, 1976a]: Nagpal, V., “Selection ofSteels for Forging Dies,” Battelle, Columbus,OH, 1976.
[Nagpal, 1976b]: Nagpal, V., Selection of ToolSteels for Forging Dies, Battelle, Columbus,OH, 1976.
[Nagpal et al., 1980]: Nagpal, V., and Lahoti,G.D., “Application of the Radial Forging Pro-cess to Cold and Warm Forging of CommonTubes, Vol 1, Selection of Die and MandrelMaterials,” Final report, Contract No.DAAA22-78-C-0109, prepared for WatervlietArsenal by Battelle-Columbus Laboratories,Columbus, OH, May 1980.
[Navinsek et al., 2001]: Navinsek, B., et al.,“Improvement of Hot Forging Manufacturingwith PVD and DUPLEX Coatings,” Surface
and Coatings Technology, Vol 137, 2001, p255.
[Roberts et al., 1980]: Roberts, G.A., and Rob-ert, A.C., Tool Steels, American Society forMetals, 1980.
[Semiatin et al., 1981]: Semiatin, S.L., and La-hoti, G.D., “Forging Die Materials, Coatings,and Surface Treatments,” Battelle, Columbus,OH, 1981.
[Thyssen]: Thyssen, B., series of brochuresfrom Thyssen Company.
SELECTED REFERENCES
● [Aston et al., 1969]: Aston, J., and Barry,E., “A Further Consideration of Factors Af-fecting the Life of Drop Forging Dies,” J.Iron Steel Inst., Vol 210 (No. 7), July 1969,p 520–526.
● [Blackwood, 1973]: Blackwood, T.B., “TheRole of Tool Steels in Extrusion Tooling,”SME Technical Paper MF73-565, Society ofManufacturing Engineers, 1973.
● [Bramley et al., 1975]: Bramley, A., Lord,J., Beeley, P., “The Friction and Lubricationof Solids,” Vol I, Oxford University Press,London, 1975, p 38.
● [Cerwin, 1995]: Cerwin, N., “Finkl DieHandbook,” Vol 1–3 A. Finkl and Sons Co.,1995.
● [Cser et al., 1993]: Cser, L., Geiger, M.,Lange, K., Hansel, M., “Tool Life and ToolQuality in Bulk Metal Forming,” Proc. Instn.Mech. Engr., Vol 207, 1993.
● [Guobin et al., 1998]: Guobin, L., Jianjun,W., Xiangzhi, L., Guiyun, L., “The Proper-ties and Application of Bi-Metal Hot-Forg-ing Die,” J. Mat. Proc. Tech., Vol 75, 1998,p 152–156.
● [Horton et al.]: Horton, J., Liu, C., et al.,“Microstructures and Mechanical Propertiesof Ni3Al Alloyed with Iron Additions,”Oak Ridge National Laboratory, OakRidge, TN.
● [Klocke, 2000]: Klocke, F., “Fine Machin-ing of Cold Forging Tools,” Proceedings,Tenth ICFG Congress (Tagung Fellbach,Germany), Sept 3–15, 2000, InternationalCold Forging Group, p 175.

CHAPTER 22
Die Failures in Cold and Hot ForgingMark Gariety
22.1 Introduction
In forging, die failure can be a significant por-tion of the overall production cost. The dies thatfail must be either repaired or replaced. The costto replace a die includes the basic cost of the die,which encompasses the costs of material, ma-chining, coating, and surface treatment as wellas the cost of labor. In any case, the most im-portant cost of die failure is related to the down-time of the manufacturing system, which re-duces the overall productivity [Liou et al.,1988].
Precision forging processes are utilized toproduce complex-shaped parts that require littleor no finishing, thereby reducing manufacturingcosts. In order to achieve both accuracy andcomplexity in a forged part, the dies must beproduced with higher accuracy and tighter tol-erances than the part to be forged. As a conse-quence, the manufacturing time for the dies in-creases considerably, making the dies moreexpensive than those needed to produce partswith conventional tolerances [Dahl et al., 1998,and Dahl et al., 1999].
Complex precision-forged parts are almostexclusively produced in closed dies. Therefore,the dies have to withstand high contact pressureswell above the flow stress of the billet materialat the forging temperature. Also, the amount ofsurface generation and the sliding velocities atwhich the billet material moves along the diesurface are very large. In addition, in hot forgingoperations, the die surface is subjected to suddenchanges in temperature. These changes aremainly due to contact with the hot workpieceand the cooling and lubrication practices. Thehigh pressures and sliding velocities as well as
the sudden changes in temperature may inducedie failure due to several mechanisms. When afailure occurs, the production must stop to re-place or repair the die. Consequently, the pro-duction cost will be significantly reduced if thedie life can be increased.
22.2 Classification of Die Failures
In forging, die failures may be classified byone of the following three failure modes:
● The most common cause of die failure iswear. Die wear occurs as the result of the dieand the workpiece sliding relative to one an-other while in contact. Typically, die wear isthought of as removal of material from thedie surface, but it also may include buildupof material on the die surface or damage tothe die surface. Die wear results in the grad-ual loss of part tolerances. Eventually, thepart tolerances will not meet the customer’sspecifications, and a new die or die insertwill need to be manufactured.
● The second most common cause of die fail-ure is fatigue fracture. Fatigue occurs as theresult of the continual stress cycles that thedies are subjected to. The stress cycles areattributed to both mechanical and thermalloading and unloading of the dies. Fatigue isaccelerated in the vicinity of stress concen-trations, such as small radii.
● The third cause of die failure is plastic de-formation. Plastic deformation results fromforming pressures that exceed the yieldstrength of the die material.
Cold and Hot Forging Fundamentals and ApplicationsTaylan Altan, Gracious Ngaile, Gangshu Shen, editors, p295-317 DOI:10.1361/chff2005p295
Copyright © 2005 ASM International® All rights reserved. www.asminternational.org
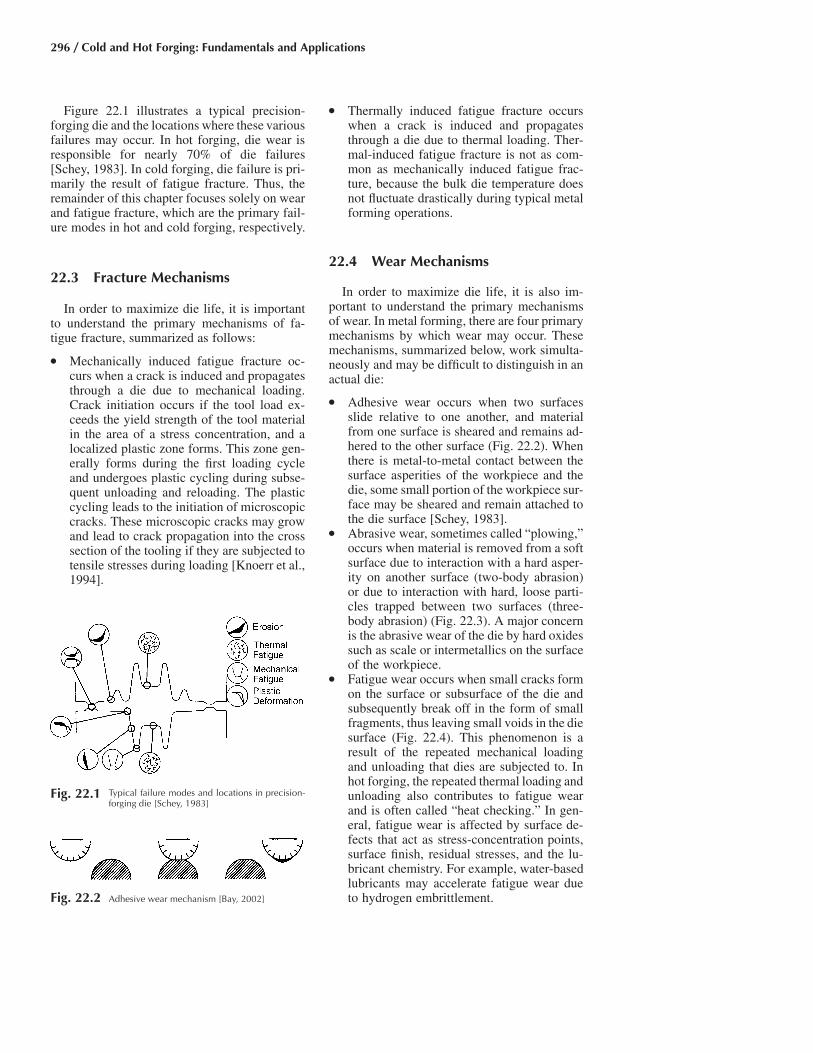
296 / Cold and Hot Forging: Fundamentals and Applications
Fig. 22.2 Adhesive wear mechanism [Bay, 2002]
Fig. 22.1 Typical failure modes and locations in precision-forging die [Schey, 1983]
Figure 22.1 illustrates a typical precision-forging die and the locations where these variousfailures may occur. In hot forging, die wear isresponsible for nearly 70% of die failures[Schey, 1983]. In cold forging, die failure is pri-marily the result of fatigue fracture. Thus, theremainder of this chapter focuses solely on wearand fatigue fracture, which are the primary fail-ure modes in hot and cold forging, respectively.
22.3 Fracture Mechanisms
In order to maximize die life, it is importantto understand the primary mechanisms of fa-tigue fracture, summarized as follows:
● Mechanically induced fatigue fracture oc-curs when a crack is induced and propagatesthrough a die due to mechanical loading.Crack initiation occurs if the tool load ex-ceeds the yield strength of the tool materialin the area of a stress concentration, and alocalized plastic zone forms. This zone gen-erally forms during the first loading cycleand undergoes plastic cycling during subse-quent unloading and reloading. The plasticcycling leads to the initiation of microscopiccracks. These microscopic cracks may growand lead to crack propagation into the crosssection of the tooling if they are subjected totensile stresses during loading [Knoerr et al.,1994].
● Thermally induced fatigue fracture occurswhen a crack is induced and propagatesthrough a die due to thermal loading. Ther-mal-induced fatigue fracture is not as com-mon as mechanically induced fatigue frac-ture, because the bulk die temperature doesnot fluctuate drastically during typical metalforming operations.
22.4 Wear Mechanisms
In order to maximize die life, it is also im-portant to understand the primary mechanismsof wear. In metal forming, there are four primarymechanisms by which wear may occur. Thesemechanisms, summarized below, work simulta-neously and may be difficult to distinguish in anactual die:
● Adhesive wear occurs when two surfacesslide relative to one another, and materialfrom one surface is sheared and remains ad-hered to the other surface (Fig. 22.2). Whenthere is metal-to-metal contact between thesurface asperities of the workpiece and thedie, some small portion of the workpiece sur-face may be sheared and remain attached tothe die surface [Schey, 1983].
● Abrasive wear, sometimes called “plowing,”occurs when material is removed from a softsurface due to interaction with a hard asper-ity on another surface (two-body abrasion)or due to interaction with hard, loose parti-cles trapped between two surfaces (three-body abrasion) (Fig. 22.3). A major concernis the abrasive wear of the die by hard oxidessuch as scale or intermetallics on the surfaceof the workpiece.
● Fatigue wear occurs when small cracks formon the surface or subsurface of the die andsubsequently break off in the form of smallfragments, thus leaving small voids in the diesurface (Fig. 22.4). This phenomenon is aresult of the repeated mechanical loadingand unloading that dies are subjected to. Inhot forging, the repeated thermal loading andunloading also contributes to fatigue wearand is often called “heat checking.” In gen-eral, fatigue wear is affected by surface de-fects that act as stress-concentration points,surface finish, residual stresses, and the lu-bricant chemistry. For example, water-basedlubricants may accelerate fatigue wear dueto hydrogen embrittlement.

Die Failures in Cold and Hot Forging / 297
Fig. 22.3 Two-body and three-body abrasive wear mechanisms [Bay, 2002]
● Corrosive/chemical wear occurs when sur-face films (i.e., oxidation) are removed as aresult of the relative sliding between the dieand the workpiece in a corrosive environ-ment (Fig. 22.5). In general, corrosive wearis accelerated by the use of lubricants. How-ever, this level of wear is generally acceptedin order to prevent the more severe forms ofadhesive wear that would result if lubricantswere not used.
22.5 Analytical Wear Models
Some of the earliest analytical wear modelswere developed by Holm (1940s), Archard(1950s), and Rabinowicz (1960s). In general,these models characterized adhesive and abra-sive wear as follows:
K • P • SV � (Eq 22.1)
H
where V is the wear volume, K is the experi-mental wear coefficient, P is the normal pres-sure, S is the sliding length, and H is the hard-ness of the softer material. Thus, it wasrecognized very early that adhesive and abrasivedie wear could be minimized by minimizing thewear coefficient, the normal pressure, and thesliding length and by maximizing the die hard-ness.
Approximate values of the experimental wearcoefficient, K, have been determined for manydie/workpiece material combinations. For ad-hesive wear, Kadh varies based on the materialpair and the lubricant used [Bay, 2002]. Table22.1 summarizes these values. For abrasivewear, Kabr depends on the size, shape, and ori-entation of the asperity/particle interacting with
the die surface and usually varies from 0.02 to0.2 for two-body abrasive wear and 0.001 to0.01 for three-body abrasive wear.
22.6 ParametersInfluencing Die Failure
There are numerous parameters that influencedie failure in cold and hot forging processes. Theinteraction of these parameters is complex. Theymay increase or decrease die failure, and thetrends are important to understand in order tomaximize die life. These parameters are dis-cussed in the following sections and shown inflow chart form in Fig. 22.6.
22.6.1 Incoming bar
Billet Material. The flow stress of the work-piece material influences the normal pressure atthe die/workpiece interface. Considering thatwear is proportional to interface pressure, a ma-terial with a lower flow stress will produce lesspressure at the die/workpiece interface and thusless die wear [Dahl et al., 1998].
In addition, adhesive wear is inversely pro-portional to the workpiece material hardness.Therefore, a material with a high hardness (butless than die hardness) will produce less adhe-sive die wear [Dahl et al., 1998].
Billet Surface. The scale present on the work-piece surface influences the interface conditions.It acts as an insulator and thus protects the dieagainst increased heating and thermal fatigue,but if it is hard and brittle, it causes abrasivewear. The properties of the scale are influencedby billet heating time and temperature [Dahl etal., 1998, and Schey, 1983].

298 / Cold and Hot Forging: Fundamentals and Applications
Fig. 22.4 Fatigue wear mechanism [Bay, 2002]
Fig. 22.5 Corrosive wear mechanism [Bay, 2002]
Table 22.1 Summary of wear coefficient, Kadh,for adhesive wear [Bay, 2002]
Surface condition Like metallic pairs Unlike metallic pairs
Clean 5 � 10�3 2 � 10�4
Poor lubrication 2 � 10�4 2 � 10�4
Average lubrication 2 � 10�5 2 � 10�5
Excellent lubrication 2 � 10�6 to 10�7 2 � 10�6 to 10�7
Billet Geometry. The geometry of the billetinfluences the amount of sliding that will takeplace during the forging process. Because abra-sive and adhesive wear are proportional to slid-ing length, the use of preforms where die wearis a concern will increase die life. A billet orpreform that requires a small amount of defor-mation can be forged with a lower load (pres-sure) and a shorter contact time. In large-volumeproduction, most of the forging deformation iscompleted in preform or blocker dies. Thus,there is little metal flow in the finisher die, whichis used for coining in order to reduce the diewear and maintain part tolerances [Dahl et al.,1998, and Schey, 1983].
Billet Weight and Weight Tolerances. Diewear increases with increasing billet weight.This is likely the effect of increased interfacepressure and contact time. In addition, if the bil-let weight exceeds the weight tolerances (i.e.,the volume of the billet is larger than the volumeof the die cavity), the die will fill prematurely,causing increased interface pressures and thusincreased wear and decreased fatigue life [Dahlet al., 1998].
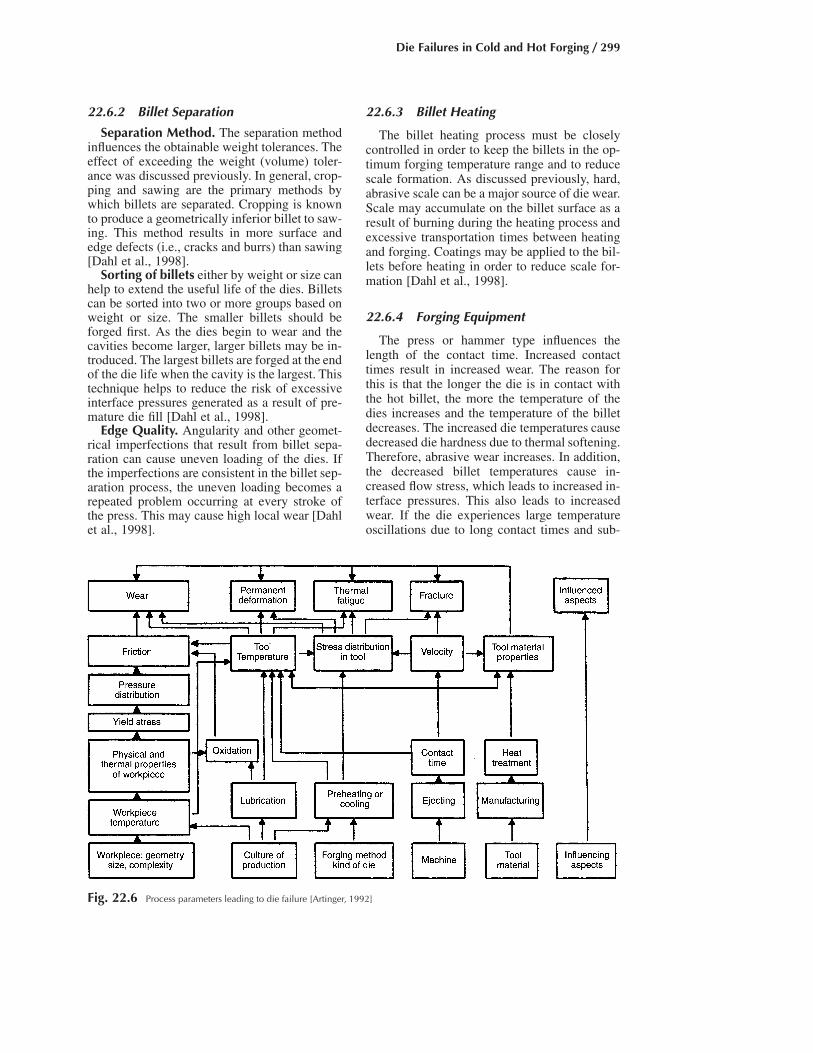
Die Failures in Cold and Hot Forging / 299
Fig. 22.6 Process parameters leading to die failure [Artinger, 1992]
22.6.2 Billet Separation
Separation Method. The separation methodinfluences the obtainable weight tolerances. Theeffect of exceeding the weight (volume) toler-ance was discussed previously. In general, crop-ping and sawing are the primary methods bywhich billets are separated. Cropping is knownto produce a geometrically inferior billet to saw-ing. This method results in more surface andedge defects (i.e., cracks and burrs) than sawing[Dahl et al., 1998].
Sorting of billets either by weight or size canhelp to extend the useful life of the dies. Billetscan be sorted into two or more groups based onweight or size. The smaller billets should beforged first. As the dies begin to wear and thecavities become larger, larger billets may be in-troduced. The largest billets are forged at the endof the die life when the cavity is the largest. Thistechnique helps to reduce the risk of excessiveinterface pressures generated as a result of pre-mature die fill [Dahl et al., 1998].
Edge Quality. Angularity and other geomet-rical imperfections that result from billet sepa-ration can cause uneven loading of the dies. Ifthe imperfections are consistent in the billet sep-aration process, the uneven loading becomes arepeated problem occurring at every stroke ofthe press. This may cause high local wear [Dahlet al., 1998].
22.6.3 Billet Heating
The billet heating process must be closelycontrolled in order to keep the billets in the op-timum forging temperature range and to reducescale formation. As discussed previously, hard,abrasive scale can be a major source of die wear.Scale may accumulate on the billet surface as aresult of burning during the heating process andexcessive transportation times between heatingand forging. Coatings may be applied to the bil-lets before heating in order to reduce scale for-mation [Dahl et al., 1998].
22.6.4 Forging Equipment
The press or hammer type influences thelength of the contact time. Increased contacttimes result in increased wear. The reason forthis is that the longer the die is in contact withthe hot billet, the more the temperature of thedies increases and the temperature of the billetdecreases. The increased die temperatures causedecreased die hardness due to thermal softening.Therefore, abrasive wear increases. In addition,the decreased billet temperatures cause in-creased flow stress, which leads to increased in-terface pressures. This also leads to increasedwear. If the die experiences large temperatureoscillations due to long contact times and sub-

300 / Cold and Hot Forging: Fundamentals and Applications
Fig. 22.8 Heat-transfer coefficient and temperature changesin a typical hot forging operation (A, heated billet
resting on lower die; B, contact time under pressure; C, forgingremoved from lower die; D, lubrication of die; E, dwell time withno billet on lower die before next cycle begins) [Knoerr et al.,1989]
Fig. 22.7 Contact time components in forging processes[Dahl et al., 1998]
sequent lubrication/cooling, thermal fatiguewear may also be a concern [Dahl et al., 1998,and Schey, 1983].
In general, hydraulic presses transfer energyfrom the ram to the workpiece and die slowerthan other press types. Thus, the contact time islonger. Hammers typically transfer energy veryquickly. Thus, the contact time is shorter; how-ever, fatigue fracture is a major concern for dieswith low toughness. In addition, the stiffness ofthe press influences the contact time. If a presshas low stiffness, there is more elastic deflectionduring loading. As a result, the contact time islonger [Kesavapandian et al., 2001].
The press (ram) speed influences the relativesliding velocity between the billet and the dies.
Increased sliding velocity results in increasedstrain rates, which cause increased flow stressand thus increased wear and decreased fatiguelife. However, if the press speed it too slow, longcontact times may become important [Dahl etal., 1998].
The effect of the press (ram) speed and thecontact time is extremely important for die life.The longer the contact time between the billetand the dies, especially under pressure, theshorter is the die life. It is useful to divide thetotal contact time, tT, in precision forging intoits various components, as follows (using forg-ing in a vertical press as an example) (Fig. 22.7)[Dahl et al., 1998]:
t � t � t � t � t � t (Eq 22.2)T 1 2 3 4 5
where:
● t1 � rest time. (The heated billet or preformis placed on the lower die. The pressure atthe die/workpiece interface is due to theworkpiece weight only.)
● t2 � initial dwell time under pressure. (Theupper die touches the workpiece. The ramstops for a very short time while the pressurebuilds up. This is the case in some hydraulicpresses, or when a mechanical press ram hassome excessive clearances in the eccentricbearings, or the lift-up cylinders are notfunctioning properly.)
● t3 � contact time under pressure. (Defor-mation occurs during this time. This time isinfluenced by the press stiffness. The effectof elastic deflection, i.e., press stiffness, isespecially important in mechanical andscrew presses.)
● t4 � final dwell time under pressure. (Theforging stroke is completed. The ram is atbottom dead center (BDC). The ram must belifted upward. This dwell time is due to elas-tic deflection of the press in mechanical and
Fig. 22.9 Temperature-hardness curve [Dahl et al., 1999]

Die Failures in Cold and Hot Forging / 301
screw presses and the time necessary to re-verse the hydraulic pressure to lift up the ramin some hydraulic presses.)
● t5 � final dwell time without pressure. (Theupper ram has lifted, but the forging is stillin the die before it is removed manually orlifted out by a knockout mechanism.)
As shown in Fig. 22.8, the heat-transfer co-efficient at the die/workpiece interface is differ-ent for the different contact time components.
22.6.5 Forging Dies
Die Material and Heat Treatment. Thestrength (i.e., flow stress), toughness, resistanceto thermal softening, and hot hardness of the hotforging die material influence its wear resis-tance. Recall that abrasive and adhesive wear areinversely proportional to the strength/hot hard-ness of the die material. In addition, good tough-ness is also important for resistance to fatiguewear/fatigue fracture. Because toughness is a
Fig. 22.10 Fatigue analysis method [Knoerr et al., 1994]
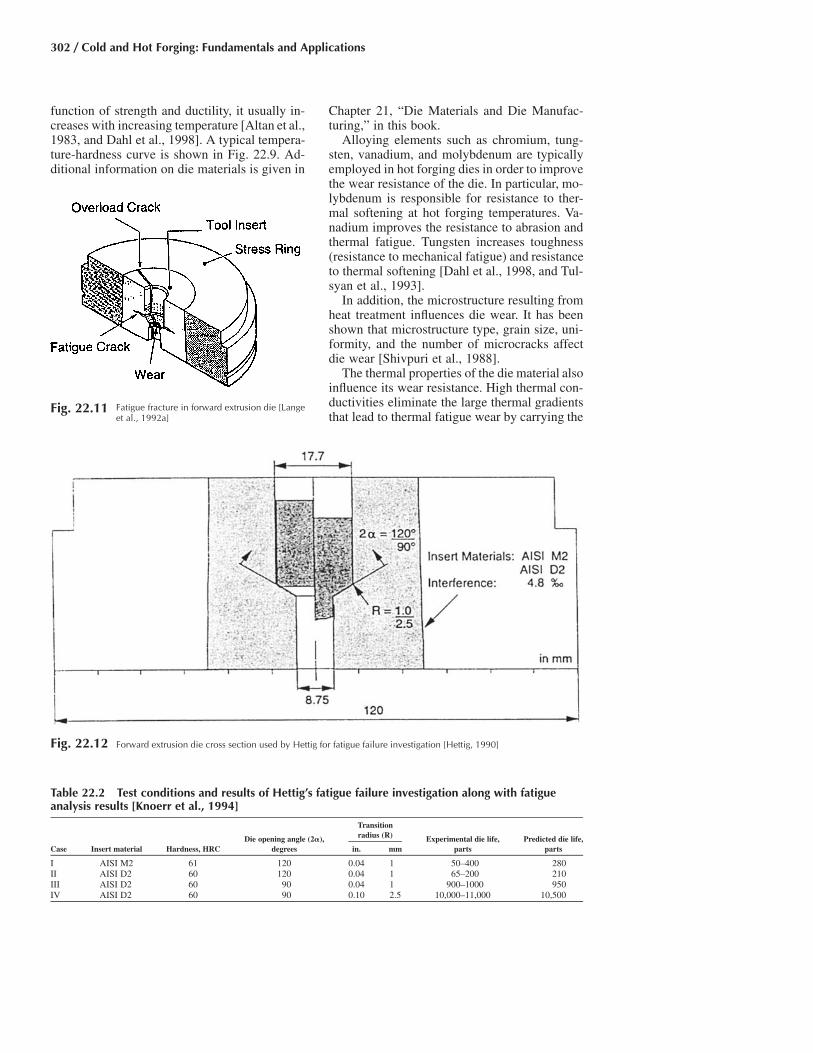
302 / Cold and Hot Forging: Fundamentals and Applications
function of strength and ductility, it usually in-creases with increasing temperature [Altan et al.,1983, and Dahl et al., 1998]. A typical tempera-ture-hardness curve is shown in Fig. 22.9. Ad-ditional information on die materials is given in
Chapter 21, “Die Materials and Die Manufac-turing,” in this book.
Alloying elements such as chromium, tung-sten, vanadium, and molybdenum are typicallyemployed in hot forging dies in order to improvethe wear resistance of the die. In particular, mo-lybdenum is responsible for resistance to ther-mal softening at hot forging temperatures. Va-nadium improves the resistance to abrasion andthermal fatigue. Tungsten increases toughness(resistance to mechanical fatigue) and resistanceto thermal softening [Dahl et al., 1998, and Tul-syan et al., 1993].
In addition, the microstructure resulting fromheat treatment influences die wear. It has beenshown that microstructure type, grain size, uni-formity, and the number of microcracks affectdie wear [Shivpuri et al., 1988].
The thermal properties of the die material alsoinfluence its wear resistance. High thermal con-ductivities eliminate the large thermal gradientsthat lead to thermal fatigue wear by carrying the
Fig. 22.11 Fatigue fracture in forward extrusion die [Langeet al., 1992a]
Fig. 22.12 Forward extrusion die cross section used by Hettig for fatigue failure investigation [Hettig, 1990]
Table 22.2 Test conditions and results of Hettig’s fatigue failure investigation along with fatigueanalysis results [Knoerr et al., 1994]
Transitionradius (R)
Case Insert material Hardness, HRCDie opening angle (2�),
degrees in. mmExperimental die life,
partsPredicted die life,
parts
I AISI M2 61 120 0.04 1 50–400 280II AISI D2 60 120 0.04 1 65–200 210III AISI D2 60 90 0.04 1 900–1000 950IV AISI D2 60 90 0.10 2.5 10,000–11,000 10,500
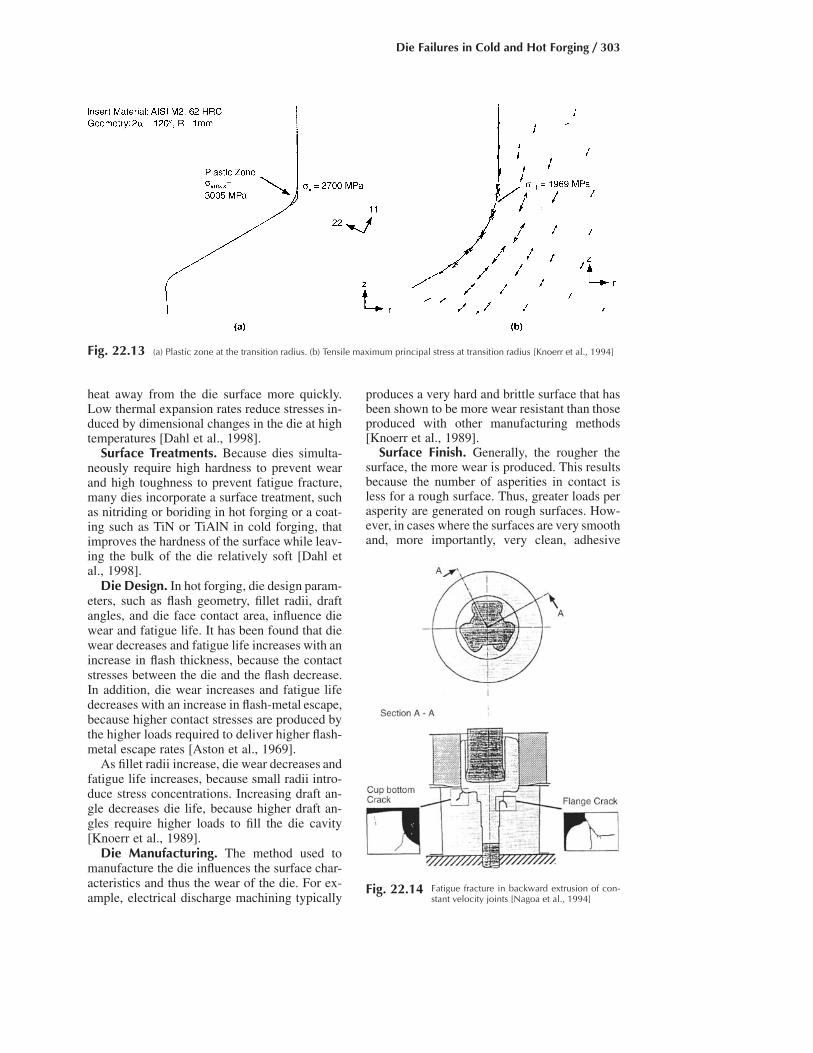
Die Failures in Cold and Hot Forging / 303
heat away from the die surface more quickly.Low thermal expansion rates reduce stresses in-duced by dimensional changes in the die at hightemperatures [Dahl et al., 1998].
Surface Treatments. Because dies simulta-neously require high hardness to prevent wearand high toughness to prevent fatigue fracture,many dies incorporate a surface treatment, suchas nitriding or boriding in hot forging or a coat-ing such as TiN or TiAlN in cold forging, thatimproves the hardness of the surface while leav-ing the bulk of the die relatively soft [Dahl etal., 1998].
Die Design. In hot forging, die design param-eters, such as flash geometry, fillet radii, draftangles, and die face contact area, influence diewear and fatigue life. It has been found that diewear decreases and fatigue life increases with anincrease in flash thickness, because the contactstresses between the die and the flash decrease.In addition, die wear increases and fatigue lifedecreases with an increase in flash-metal escape,because higher contact stresses are produced bythe higher loads required to deliver higher flash-metal escape rates [Aston et al., 1969].
As fillet radii increase, die wear decreases andfatigue life increases, because small radii intro-duce stress concentrations. Increasing draft an-gle decreases die life, because higher draft an-gles require higher loads to fill the die cavity[Knoerr et al., 1989].
Die Manufacturing. The method used tomanufacture the die influences the surface char-acteristics and thus the wear of the die. For ex-ample, electrical discharge machining typically
produces a very hard and brittle surface that hasbeen shown to be more wear resistant than thoseproduced with other manufacturing methods[Knoerr et al., 1989].
Surface Finish. Generally, the rougher thesurface, the more wear is produced. This resultsbecause the number of asperities in contact isless for a rough surface. Thus, greater loads perasperity are generated on rough surfaces. How-ever, in cases where the surfaces are very smoothand, more importantly, very clean, adhesive
Fig. 22.13 (a) Plastic zone at the transition radius. (b) Tensile maximum principal stress at transition radius [Knoerr et al., 1994]
Fig. 22.14 Fatigue fracture in backward extrusion of con-stant velocity joints [Nagoa et al., 1994]

304 / Cold and Hot Forging: Fundamentals and Applications
wear is likely to occur unless coatings are used[Tulsyan et al., 1993].
22.6.6 Lubrication
Die Lubricant Type. The lubricant type in-fluences the interface pressure and the heattransfer between the die and the billet. In gen-eral, decreasing lubricity results in increased in-terface pressure and thus increased die wear anddecreased fatigue life. Also, the lubricant acts asan insulator in order to protect the die againstextreme temperature changes and thermal fa-tigue wear [Schey, 1983, and Dahl et al., 1998].
Mode of Application. In hot forging, the lu-bricant application parameters, i.e., spray time,
spray angle, spray distance, and flow rate, influ-ence how the lubricant covers the die. Inade-quate lubrication results in increased interfacepressure and reduced insulation against extremedie-temperature changes. However, excessivelubricant can result in the buildup of solid lu-bricant particles in die cavities. This buildupmay cause premature die fill and increased in-terface pressure [Dahl et al., 1998].
22.6.7 Process Conditions
Die Temperature. The die temperature influ-ences the hardness of the die. In general, the diehardness is inversely proportional to the die tem-perature. Thus, because abrasive and adhesive
Fig. 22.15 (a) Plastic zone at the cup bottom. (b) Tensile maximum principal stress at cup bottom [Nagao et al., 1994]
Fig. 22.16 (a) Plastic zone at the flange area. (b) Tensile maximum principal stress at flange area [Nagao et al., 1994]
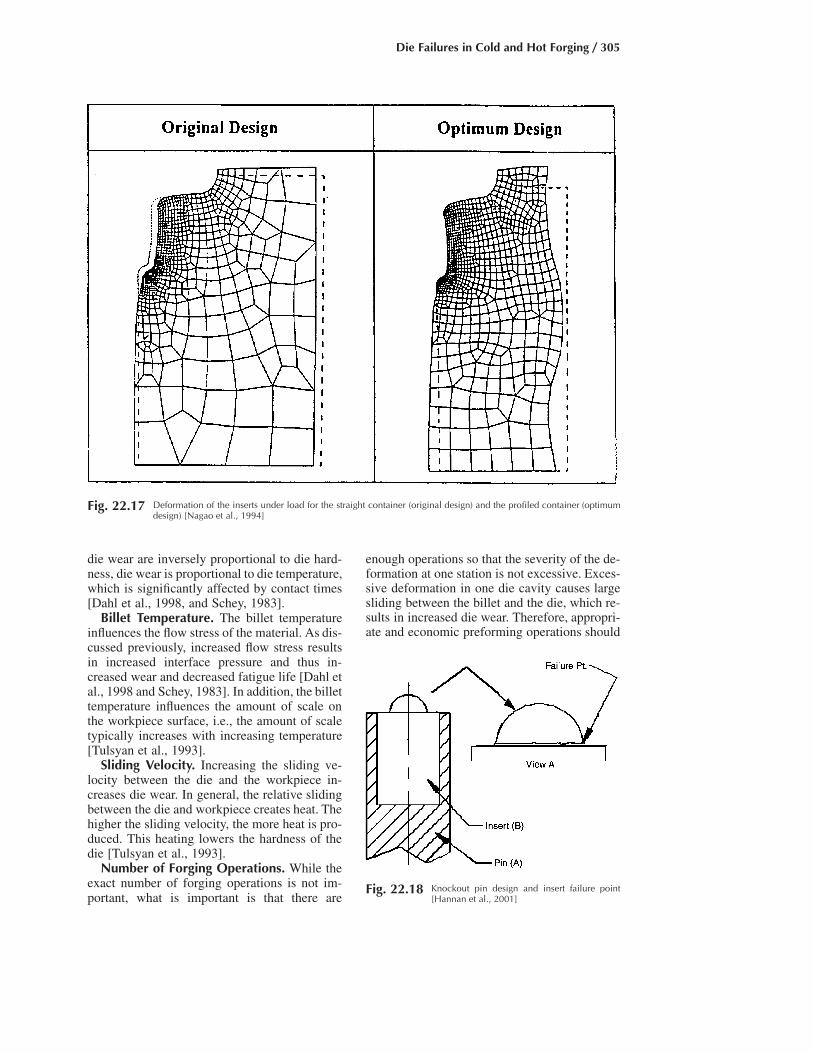
Die Failures in Cold and Hot Forging / 305
die wear are inversely proportional to die hard-ness, die wear is proportional to die temperature,which is significantly affected by contact times[Dahl et al., 1998, and Schey, 1983].
Billet Temperature. The billet temperatureinfluences the flow stress of the material. As dis-cussed previously, increased flow stress resultsin increased interface pressure and thus in-creased wear and decreased fatigue life [Dahl etal., 1998 and Schey, 1983]. In addition, the billettemperature influences the amount of scale onthe workpiece surface, i.e., the amount of scaletypically increases with increasing temperature[Tulsyan et al., 1993].
Sliding Velocity. Increasing the sliding ve-locity between the die and the workpiece in-creases die wear. In general, the relative slidingbetween the die and workpiece creates heat. Thehigher the sliding velocity, the more heat is pro-duced. This heating lowers the hardness of thedie [Tulsyan et al., 1993].
Number of Forging Operations. While theexact number of forging operations is not im-portant, what is important is that there are
enough operations so that the severity of the de-formation at one station is not excessive. Exces-sive deformation in one die cavity causes largesliding between the billet and the die, which re-sults in increased die wear. Therefore, appropri-ate and economic preforming operations should
Fig. 22.17 Deformation of the inserts under load for the straight container (original design) and the profiled container (optimumdesign) [Nagao et al., 1994]
Fig. 22.18 Knockout pin design and insert failure point[Hannan et al., 2001]
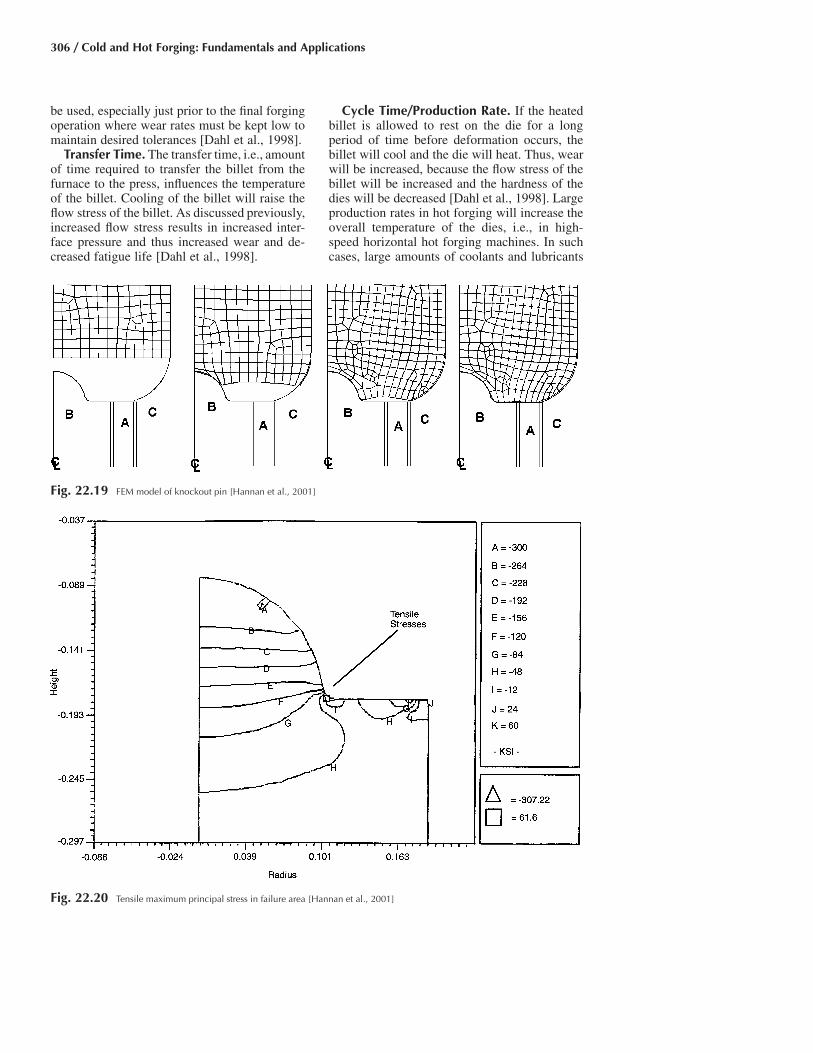
306 / Cold and Hot Forging: Fundamentals and Applications
be used, especially just prior to the final forgingoperation where wear rates must be kept low tomaintain desired tolerances [Dahl et al., 1998].
Transfer Time. The transfer time, i.e., amountof time required to transfer the billet from thefurnace to the press, influences the temperatureof the billet. Cooling of the billet will raise theflow stress of the billet. As discussed previously,increased flow stress results in increased inter-face pressure and thus increased wear and de-creased fatigue life [Dahl et al., 1998].
Cycle Time/Production Rate. If the heatedbillet is allowed to rest on the die for a longperiod of time before deformation occurs, thebillet will cool and the die will heat. Thus, wearwill be increased, because the flow stress of thebillet will be increased and the hardness of thedies will be decreased [Dahl et al., 1998]. Largeproduction rates in hot forging will increase theoverall temperature of the dies, i.e., in high-speed horizontal hot forging machines. In suchcases, large amounts of coolants and lubricants
Fig. 22.19 FEM model of knockout pin [Hannan et al., 2001]
Fig. 22.20 Tensile maximum principal stress in failure area [Hannan et al., 2001]

Die Failures in Cold and Hot Forging / 307
are needed in order to reduce die temperatures.Alternatively, it is also possible to leave oneforging station intermittently empty in order toprovide time for the dies to cool.
In order to produce an economically soundpart with prolonged die life by either cold or hotforging, a multitude of variables, as discussedabove, must be carefully considered. In partic-ular, the effect and importance of each variablebased on the nature of the given component mustbe assessed.
22.7 Prediction of Die FatigueFracture and Enhancement ofDie Life in Cold Forging UsingFinite-Element Modeling (FEM)
A reliable method to analyze, predict, prevent,and/or control die fatigue fracture has long beenone of the most important issues in cold forging.Therefore, a fatigue analysis method that can beutilized to estimate tool life has been developedand can be summarized as follows (Fig. 22.10)[Knoerr et al., 1994, and Matsuda, 2002]:
● The forging process is simulated using FEMin order to estimate the tool stresses.
● The tool stress values are used to completean elastic-plastic stress-strain analysis of thetooling using FEM.
● The stress-strain analysis is used to performa damage analysis and estimate the numberof cycles until fatigue fracture.
If the predicted tool life is insufficient,changes in the process and tooling design mustbe made in order to reduce the loading condi-tions. A significant increase in tool life can beachieved by reducing the stresses in the highestloaded zone below the yield strength of the toolmaterial. This may be achieved by the followingmeans [Knoerr et al., 1994]:
● Change material flow in the die to reduce thecontact stresses on the tool.
● Redesign the process to avoid drasticchanges in the direction of the material flow,which usually leads to peaks in the contactstress.
● Increase the transition radii to reduce thenotch effect.
● Split the tooling at the highest loaded zone.● Increase the interference of the stress ring.
● Apply advanced stress ring techniques, suchas strip-wound containers or profiled stressrings.
Several case studies where this fatigue anal-ysis method was employed are presented as fol-lows.
22.7.1 Forward Extrusion—A Case Study
In forward extrusion, fatigue cracks initiate atthe transition radius to the extrusion shoulderand propagate in the radial direction (Fig.22.11).
In order to verify the fatigue analysis methodfor evaluating tool life, an experimental inves-tigation of fatigue fracture of forward extrusiondies, performed at the Institute for Metal Form-ing (IFUM) at the University of Stuttgart, wasused [Hettig, 1990]. Figure 22.12 shows thecross section of the forward extrusion die, andTable 22.2 summarizes the test conditions andthe results obtained. In addition, Table 22.2 sum-marizes the results obtained from the fatigueanalysis for the same test conditions. As the ta-ble shows, the predicted die lives were in therange of those found experimentally. Thus, thefatigue analysis method was verified.
Table 22.2 illustrates that the die opening an-gle and the transition radius have a large effecton the die life. With FEM-based fatigue analy-sis, this effect is noted quickly and economi-cally. Also, the FEM-based fatigue analysis eas-ily determines the location where fatiguefracture will occur. Figure 22.13 shows the localplastic zone at the transition radius found duringthe FEM-based stress-strain analysis of the die.Figure 22.13 also shows that the maximum prin-cipal stresses in this same region are tensile,
Fig. 22.21 Split knockout pin insert design [Hannan et al.,2001]

308 / Cold and Hot Forging: Fundamentals and Applications
which facilitates the propagation of cracksformed in the plastic zone.
22.7.2 Backward Extrusion of ConstantVelocity Joints—A Case Study
In cold forging of outer races for constant ve-locity joints, tool stresses during the backward
extrusion operation lead to very high loadingconditions in the tool inserts. Therefore, fatiguefracture is the common failure mode for the tool-ing. Figure 22.14 illustrates the backward extru-sion process and the locations where fatiguefracture is experienced [Nagao et al., 1994].
Figure 22.15 shows the results from the fa-tigue analysis at the cup bottom, where fatigue
Fig. 22.23 (a) Finite-element model of original punch geometry. (b) Finite-element model of modified punch geometry (A, face;B, lower punch corner; C, cone angle; D, fillet radius; E, edge) [Lange et al., 1992b]
Fig. 22.22 (a) Bevel gear. (b) Punch used to form bevel gear [Lange et al., 1992b]

Die Failures in Cold and Hot Forging / 309
fracture was experienced under production con-ditions. Once again, there is a localized plasticzone and tensile maximum principal stresses inthis region. Both of these conditions contributeto the onset of fatigue fracture. Similar resultswere obtained in the flange region [Nagao et al.,1994].
In order to further verify the fatigue analysismethod, tooling capable of developing a stressstate similar to the actual tooling (Fig. 22.14)was manufactured and tested at Honda Engi-neering Co.
With this tooling, cracks were experienced inthe flange area after 7000 parts. Once again, fa-tigue analysis of the tooling showed a large plas-tic zone and tensile maximum principal stressesin the flange area (Fig. 22.16). In order to im-prove tool life, a new tooling geometry with aprofiled container was designed (Fig. 22.17).The results from the fatigue analysis on this tool-ing showed that there was no plastic zone in theflange area, and the maximum principal stressesremained compressive. With this new toolinggeometry, 21,000 parts were forged without ex-periencing any cracks.
22.7.3 Knockout Pin Insert—A Case Study
This case study analyzed a knockout pin in-sert that was used to indent a hole on the bottomof a workpiece in a cold heading operation. The
Fig. 22.24 (a) Normal stress distribution for original punch geometry. (b) Normal stress distribution for modified punch geometry(A, face; B, lower punch corner; C, cone angle; D, fillet radius; E, edge) [Lange et al., 1992b]
Table 22.3 Upset forging conditions used indie wear tests [Bobke, 1991, and Luig, 1993]
Press
Type: mechanicalCapacity: 3.09 MN (347 tonf )Stroke: 7 in. (180 mm)Stroke rate: 2/sCycle time(a): 13 s
Billet
Material: 1045 steelTemperature: 2010 �F (1100 �C)Diameter: 0.8 in. (20 mm)Height: 1.2 in. (30 mm)
Dies
Material: H-10Coating: variousTemperature: 430/570 �F (220/300 �C)Lubrication: various
(a) The cycle time included (Fig. 22.7) placing the billet on the lower die, thebillet resting on the lower die, the forging stroke, the forged billet resting on thelower die, removal of the forged billet, and lubrication (when applied).

310 / Cold and Hot Forging: Fundamentals and Applications
insert and original pin design are shown in Fig.22.18 along with the point of failure. The origi-nal insert had an average tool life of 53,000 parts[Hannan et al., 2001].
Figure 22.19 shows the FEM model of theknockout pin operation used for the fatigue anal-ysis. Figure 22.20 shows that there is a largetensile maximum principal stress in the regionof the failure point [Hannan et al., 2001].
One design change analyzed in this case studywas to split the pin insert where it was failing.The design is shown in Fig. 22.21. The radiuswhere failure occurs is eliminated using astraight pin (E) and a sleeve (D). This tool wasmanufactured for a production run. The resultingtool life increased from 53,000 parts to 200,000
parts. This is about a 300% increase in tool life[Hannan et al., 2001].
22.7.4 Bevel Gear Punch—A Case Study
This case study analyzed the fatigue fractureof a punch (Fig. 22.22b) used in the cold forging
Fig. 22.25 Upset forging process [Luig, 1993]Fig. 22.26 Typical wear profile for upset forging [Doege et
al., 1996]
Fig. 22.27 Comparison between predicted and experimental die wear [Liou et al., 1988]

Die Failures in Cold and Hot Forging / 311
of a straight bevel gear (Fig. 22.22a). The finite-element model is shown in Fig. 22.23(a). Fa-tigue analysis of the punch showed that veryhigh stresses were generated in the lower punchcorner and the upper fillet radius (Fig. 22.24a).By modifying the punch geometry (Fig. 22.23b),it was possible to reduce the peak stresses, es-pecially at the upper fillet radius where the fa-tigue fracture occurred (Fig. 22.24b). As a resultof these geometric changes, the punch life wasincreased by a factor of 6 to 8 [Lange et al.,1992b].
22.8 Prediction of Die Wear andEnhancement of DieLife in Hot Forging Using FEM
Several studies have been conducted in an at-tempt to estimate die life in hot forging [Liou etal., 1988]. The ability to predict die wear allowsfor the optimization of process variables suchthat die life is improved [Tulsyan et al., 1993].
Many researchers have applied FEM to esti-mate die wear in hot forging. In general, all of
Fig. 22.28 Exhaust valve forming process. (a) Initial billet. (b) Extrusion of valve stem. (c) Upsetting of valve head [Tulsyan et al.,1993]
Fig. 22.29 (a) Comparison between predicted and experimental die wear. (b) Axial position along extrusion die throat (picture isrotated 90�) [Painter et al., 1995]
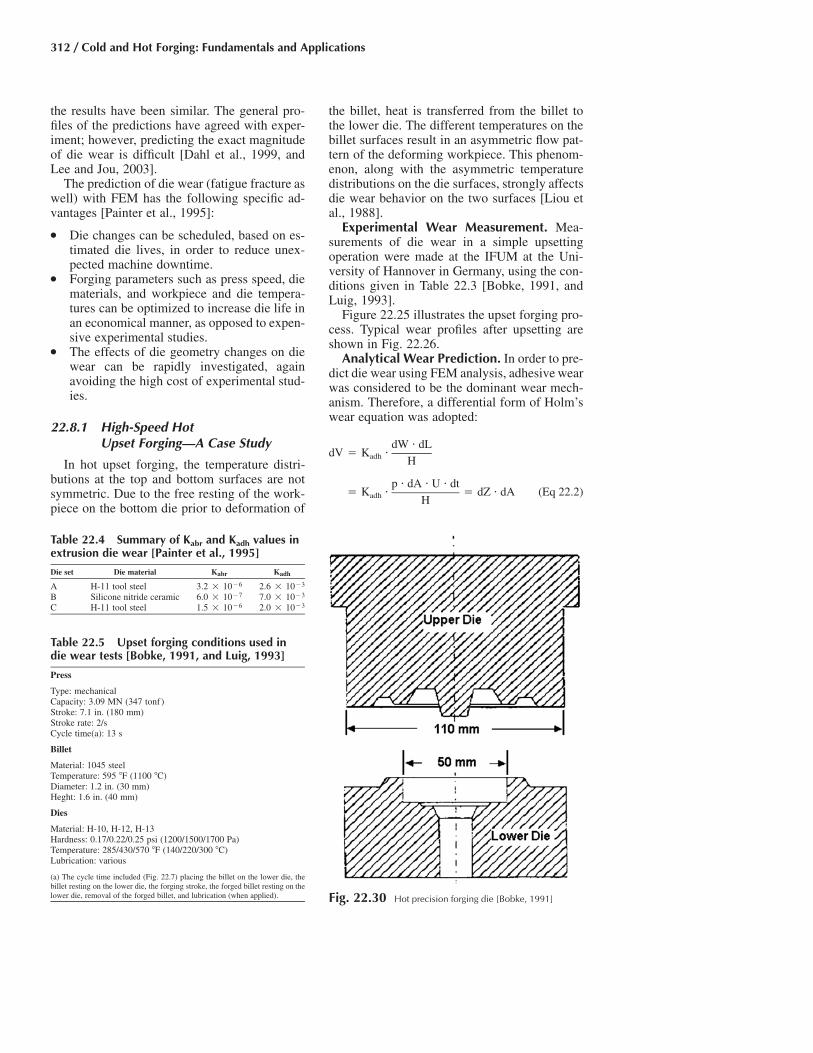
312 / Cold and Hot Forging: Fundamentals and Applications
the results have been similar. The general pro-files of the predictions have agreed with exper-iment; however, predicting the exact magnitudeof die wear is difficult [Dahl et al., 1999, andLee and Jou, 2003].
The prediction of die wear (fatigue fracture aswell) with FEM has the following specific ad-vantages [Painter et al., 1995]:
● Die changes can be scheduled, based on es-timated die lives, in order to reduce unex-pected machine downtime.
● Forging parameters such as press speed, diematerials, and workpiece and die tempera-tures can be optimized to increase die life inan economical manner, as opposed to expen-sive experimental studies.
● The effects of die geometry changes on diewear can be rapidly investigated, againavoiding the high cost of experimental stud-ies.
22.8.1 High-Speed HotUpset Forging—A Case Study
In hot upset forging, the temperature distri-butions at the top and bottom surfaces are notsymmetric. Due to the free resting of the work-piece on the bottom die prior to deformation of
the billet, heat is transferred from the billet tothe lower die. The different temperatures on thebillet surfaces result in an asymmetric flow pat-tern of the deforming workpiece. This phenom-enon, along with the asymmetric temperaturedistributions on the die surfaces, strongly affectsdie wear behavior on the two surfaces [Liou etal., 1988].
Experimental Wear Measurement. Mea-surements of die wear in a simple upsettingoperation were made at the IFUM at the Uni-versity of Hannover in Germany, using the con-ditions given in Table 22.3 [Bobke, 1991, andLuig, 1993].
Figure 22.25 illustrates the upset forging pro-cess. Typical wear profiles after upsetting areshown in Fig. 22.26.
Analytical Wear Prediction. In order to pre-dict die wear using FEM analysis, adhesive wearwas considered to be the dominant wear mech-anism. Therefore, a differential form of Holm’swear equation was adopted:
dW • dLdV � K •adh H
p • dA • U • dt� K • � dZ • dA (Eq 22.2)adh H
Table 22.4 Summary of Kabr and Kadh values inextrusion die wear [Painter et al., 1995]
Die set Die material Kabr Kadh
A H-11 tool steel 3.2 � 10�6 2.6 � 10�3
B Silicone nitride ceramic 6.0 � 10�7 7.0 � 10�3
C H-11 tool steel 1.5 � 10�6 2.0 � 10�3
Table 22.5 Upset forging conditions used indie wear tests [Bobke, 1991, and Luig, 1993]
Press
Type: mechanicalCapacity: 3.09 MN (347 tonf )Stroke: 7.1 in. (180 mm)Stroke rate: 2/sCycle time(a): 13 s
Billet
Material: 1045 steelTemperature: 595 �F (1100 �C)Diameter: 1.2 in. (30 mm)Heght: 1.6 in. (40 mm)
Dies
Material: H-10, H-12, H-13Hardness: 0.17/0.22/0.25 psi (1200/1500/1700 Pa)Temperature: 285/430/570 �F (140/220/300 �C)Lubrication: various
(a) The cycle time included (Fig. 22.7) placing the billet on the lower die, thebillet resting on the lower die, the forging stroke, the forged billet resting on thelower die, removal of the forged billet, and lubrication (when applied). Fig. 22.30 Hot precision forging die [Bobke, 1991]

Die Failures in Cold and Hot Forging / 313
where dV is the wear volume and is equal todZ • dA (wear depth • contact area), dW is thenormal load to compress the billet and is equalto p • dA (interface pressure • contact area), dLis the sliding distance and is equal to U • dt (slid-ing velocity • time), H is the die hardness, andKadh is the dimensionless adhesive wear coeffi-cient. It should be noted that the interface pres-sure and the sliding velocity are local values.Thus, the wear depth can be predicted as:
M p • U • Dtij ijZ � K • . . . i � 0, Ni � adh Hj�1 ij
(Eq 22.3)
where Zi is the accumulated wear depth at theith node, Dt is the time interval of the calculationstep, M is the total number of calculation steps,N is the total number of nodes on the die surface,i represents the ith node, and j represents the jthtime step [Liou et al., 1988].
In this case, the FEM simulation of the hotupset forging process was divided into ten steps.On completion of each step, the parametersneeded for the die wear model (Eq 22.3) wereextracted from the FEM simulation. In addition,based on the approximations given in Table22.1, the wear coefficient was assumed to beKadh � 7.0 � 10�5. With this data, Eq 22.3 wasused to calculate the predicted die wear at eachcontact node on the upper and lower die for theten simulation steps of one deformation cycle[Liou et al., 1988].
In order to compare the die wear predictionsto experimental results, the predicted resultswere scaled up to 2000 forging cycles. Figure22.27 shows the comparison between the pre-dicted and experimental die wear.
It is immediately noted that the maximum diewear depth was greater on the top die than onthe bottom die. As discussed previously, thismay be attributed to asymmetric temperature,
Fig. 22.31 Measured die wear profile vs. die temperature vs. number of forging cycles. [Bobke, 1991]

314 / Cold and Hot Forging: Fundamentals and Applications
sliding velocity, and interface pressure distribu-tion on the top and bottom die due to the die-chilling effect of the free resting billet on thelower die prior to deformation. The figure alsoshows that the die wear profile predicted by themodel closely resembled experimental results.
The difference between the maximum weardepth on the bottom die predicted by the modeland the experiment was explained by consider-ing the effect of consecutive forging cycles. Inthis analysis, FEM simulation of the heat trans-fer for the postfree resting and empty periods ofthe first upsetting cycle was performed. Thetemperature fields in the top and bottom die werethen used as the initial temperatures for the sec-ond upsetting simulation and so on. Simulationof three consecutive forging cycles predicted atemperature increase in the bottom die but notin the top die. Because the temperature of thebottom die increases, its hardness decreases, andthus, wear increases. This explains why scalingthe wear predicted on the bottom die for the firstforging cycle resulted in a maximum wear depthless than that indicated by experiment.
22.8.2 Extrusion and Forging ofExhaust Valves—A Case Study
As Fig. 22.28 shows, exhaust valves are typ-ically formed in two stages. In the first stage, the
valve stem is formed by extruding the bottom ofthe billet, and in the second stage, the valve headis formed by upsetting the top of the billet. Theprocess is generally completed in a 500 to 700ton mechanical press at 45 to 60 strokes per min-ute, with the billet heated to 2000 to 2100 �F(1100 to 1150 �C) [Tulsyan et al., 1993].
Experimental Wear Measurement. Mea-surements of die wear in the extrusion operationof the exhaust valve forming process were per-formed. The experiments were performed withthree different extrusion dies. Both the die ge-ometry and the die material varied from die todie because it was expected that different wearmechanisms would dominate in each die. Table22.4 summarizes the die materials used for theexperiments. The typical wear profile after ex-trusion is shown in Fig. 22.29. Because there isrelatively little movement between the work-piece and the die during the second stage, thedie wear measurement of the extrusion die usedin the first stage was the primary focus of thisstudy [Painter et al., 1995].
Analytical Wear Prediction. In high-speedhot extrusion and forging of exhaust valves,abrasive wear is assumed to be the dominantwear mechanism. Because of the success of theHolm’s-based adhesive wear equation for high-speed hot upsetting discussed previously, a simi-lar model was established for abrasive wear:
Fig. 22.32 Measured die wear at location I vs. die temperature vs. lubricant vs. number of forging cycles [Bobke, 1991]

Die Failures in Cold and Hot Forging / 315
dW • dLdV � K • � Kabr abrmH
p • dA • U • dt• � dZ • dA (Eq 22.4)mH
where all the variables are the same, except Kabris the dimensionless abrasive wear coefficient,and m is an exponent equal to 2 for steels. Thus,the wear depth can be predicted as:
M p • U • Dtij ijZ � K • . . . i � 0, Ni � abr mHj�1 ij
(Eq 22.5)
where all the variables are as defined previously[Tulsyan et al., 1993].
In this case, the FEM simulation was dividedinto 18 steps. On completion of each step, theparameters needed for both the adhesive wear
model (Eq 22.3) and the abrasive wear model(Eq 22.5) were extracted from the FEM simu-lation, and both the adhesive and the abrasivewear depths were predicted, as discussed pre-viously. Table 22.4 outlines the Kabr and Kadhvalues [Painter et al., 1995].
A comparison of the results from the experi-mental die wear measurements and the FEM diewear predictions showed that abrasive wear wasthe dominant wear mechanism in extrusion withceramic dies, while adhesion was the dominantwear mechanism in extrusion with tool steeldies. In order to make this comparison, the ex-perimental results were scaled down to one forg-ing cycle. Figure 22.29 shows the comparisonof the results for the ceramic extrusion die. Thepredicted die wear profile matched the die wearexperiment; however, the die wear magnitudesdid not exactly match because wear mechanismsother than abrasion were also acting [Painter etal., 1995].
Fig. 22.33 FEM model of hot precision forging process [Dahl et al., 1999]

316 / Cold and Hot Forging: Fundamentals and Applications
22.8.3 Hot PrecisionForging—A Case Study
Hot precision forging of complex shapes isthe focus of many manufacturers. The toleranceson these parts are especially critical. Therefore,die wear is exceedingly detrimental to these pro-cesses. Thus, prediction of die wear and en-hancement of die life is very important to thesemanufacturers.
Experimental Wear Measurement. Mea-surement of die wear for the hot precision forg-ing process was carried out at the IFUM at theUniversity of Hannover in Germany, under theconditions given in Table 22.5 [Bobke, 1991,and Luig, 1993].
Figure 22.30 shows the precision forging dieused in the experiments. Typical wear profilesafter forging are shown in Fig. 22.31. The ex-perimental wear depths for three different lubri-cants are summarized in Fig. 22.32.
Analytical Wear Prediction. It was assumedthat abrasive wear was the dominant wear mech-anism in hot precision forging. Therefore, thewear model in Eq 22.5 was used [Dahl et al.,1999].
Figure 22.33 shows the FEM model of the hotprecision forging process. On completion ofeach step, the parameters needed for the die wearmodel (Eq 22.5) were extracted from the FEMsimulation, and the wear depth was predicted, asdiscussed previously. Based on typical experi-mental values for two-body abrasion, the wearcoefficient was assumed to be Kabr � 0.02 [Dahlet al., 1999].
The maximum predicted die wear and themaximum measured die wear both occurred atthe corner of the upper die (Fig. 22.31, mea-surement location 18). In general, the model pre-dicted that die wear increases with decreasingcorner radius, decreases with increasing frictionfactor, and increases with decreasing die hard-ness (i.e., different materials have differenttemperature-hardness curves). This illustratesthe advantage of being able to predict die wear.It is not intuitive that die wear would decreasewith increasing friction factor. In the case of thevalve extrusion, it was shown that die wear in-creases with increasing friction factor becauseof the increased pressure developed on the die.In this case, die wear decreases because in-creased friction acts to decrease the slidinglength [Dahl et al., 1999].
REFERENCES
[Altan et al., 1983]: Altan, T., Oh, S., Gegel,H., Metal Forming Fundamentals and Appli-cations, American Society for Metals, 1983.
[Artinger, 1992]: Artinger, I., “Material Scienceand Tool-Life,” Budapest, 1992 (in Hungar-ian).
[Aston et al., 1969]: Aston, J., and Barry, E.,“A Further Consideration of Factors Affect-ing the Life of Drop Forging Dies,” J. IronSteel Inst., Vol 210 (No. 7), July 1969, p 520–526.
[Bay, 2002]: Bay, N., class notes, TechnicalUniversity of Denmark, 2002.
[Bobke, 1991]: Bobke, T., “Phenomenon ofEdge Layer at Sealing Process of Drop ForgeTools,” No. 237, IFUM, University of Han-nover, 1991.
[Dahl et al., 1998]: Dahl, C., Vazquez, V., Al-tan, T., “Effect of Process Parameters on DieLife and Die Failure in Precision Forging,”Report No. PF/ERC/NSM-98-R-15, Engi-neering Research Center for Net Shape Manu-facturing, April 1998.
[Dahl et al., 1999]: Dahl, C., Vazquez, V., Al-tan, T., “Analysis and Prediction of Die Wearin Precision Forging Operations,” Report No.PF/ERC/NSM-99-R-21, Engineering Re-search Center for Net Shape Manufacturing,May 1999.
[Doege et al., 1996]: Doege, E., Seidel, R., andRomanowski, C., “Increasing Tool LifeQuantity in Die Forging: Chances and Limitsof Tribological Measures,” NAMRC, 1996.
[Hannan et al., 2001]: Hannan, D., Ngaile, G.,Altan, T., “Elimination of Defects and Im-provement of Tool Life in Cold Forging—Case Studies,” New Developments in ForgingConference (Stuttgart, Germany), Institute forMetal Forming Technology (IFU), May 2001.
[Hettig, 1990]: Hettig, A., “Influencing Vari-ables of Tool Fracture at Impact Extrusion,”No. 106, Reports from the Institute of MetalForming, University of Stuttgart, Springer,1990.
[Kesavapandian et al., 2001]: Kesavapandian,G., Ngaile, G., Altan, T., “Die Wear in Pre-cision Hot Forging—Effect of Process Param-eters and Predictive Models,” Report No. PF/ERC/NSM-01-R-42, Engineering ResearchCenter for Net Shape Manufacturing, Aug2001.

Die Failures in Cold and Hot Forging / 317
[Knoerr et al., 1989]: Knoerr, M., and Shivpuri,R., “Failure in Forging Dies,” Report No.ERC/NSM-B-89-15, Engineering ResearchCenter for Net Shape Manufacturing, March1989.
[Knoerr et al., 1994]: Knoerr, M., Lange, K.,Altan, T., “Fatigue Failure of Cold ForgingTooling: Causes and Possible SolutionsThrough Fatigue Analysis,” J. of MaterialsProcessing Technology, Vol 46, 1994, p 57–71.
[Lange et al., 1992a]: Lange, K., Cser, L.,Geiger, M., Kals, J.A.G., Hansel, M., “ToolLife and Tool Quality in Bulk Metal Form-ing,” Annals of the CIRP, 1992, p 667–675.
[Lange et al., 1992b]: Lange, K., Hettig, A.,Knoerr, M., “Increasing Tool Life in ColdForging Through Advanced Design and ToolManufacturing Techniques,” J. of MaterialsProcessing Technology, Vol 35, 1992, p 495–513.
[Lee and Jou, 2003]: Lee, R.S., and Jou, J.L.,“Application of Numerical Simulation forWear Analysis of Warm Forging Die,” Jour-nal of Material Processing Technology, Vol.140, 2003, p 43–48.
[Liou et al., 1988]: Liou, M., and Hsiao, H.,“Prediction of Die Wear in High Speed HotUpset Forging,” Report No. ERC/NSM-88-33, Engineering Research Center for NetShape Manufacturing, Oct 1988.
[Liug, 1993]: Luig, H., “Influence of Wear Pro-
tective Coating and Scaling of Raw Parts onForging Wear,” No. 315, IFUM, University ofHannover, 1993.
[Matsuda, 2002]: Matsuda, T., “Improvementof Tool Life in Cold Forging,” AdvancedTechnology of Plasticity, Vol 1, 2002, p 73–78.
[Nagao et al., 1994]: Nagao, Y., Knoerr, M.,Altan, T., “Improvement of Tool Life in ColdForging of Complex Automotive Parts,” J. ofMaterials Processing Technology, Vol 46,1994, p 73–85.
[Painter et al., 1995]: Painter, B., Shivpuri, R.,Altan, T., “Computer-Aided Techniques forthe Prediction and Measurement of Die Wearduring Hot Forging of Automotive ExhaustValves,” Report No. ERC/NSM-B-95-06, En-gineering Research Center for Net ShapeManufacturing, Feb 1995.
[Schey, 1983]: Schey, J., Tribology in Metal-working: Friction, Lubrication, and Wear,American Society of Metals, 1983.
[Shivpuri et al., 1988]: Shivpuri, R., and Sem-iatin, S., “Wear of Dies and Molds in NetShape Manufacturing,” Report No. ERC/NSM-88-05, Engineering Research Center forNet Shape Manufacturing, June 1988.
[Tulsyan et al., 1993]: Tulsyan, R., Shivpuri,R., Altan, T., “Investigation of Die Wear inExtrusion and Forging of Exhaust Valves,”Report No. ERC/NSM-B-93-28, EngineeringResearch Center for Net Shape Manufactur-ing, Aug 1993.

CHAPTER 23
Near-Net ShapeForging and New DevelopmentsManas ShirgaokarGracious Ngaile
Fig. 23.1 Examples of net shape forged parts [Meidert et al.,2000]
23.1 Introduction
Net and near-net shape forging companiesgenerally produce for the automotive industry.These components are characterized by close di-mensional tolerances, minimal draft, and the ab-sence of flash during forging, with minimal orno postforging machining. This is a major ad-vantage when machining costs are taken intoconsideration. Net shape forging can be definedas the process of forging components to finaldimensions with no postforging machining nec-essary. Near-net shape forged components, onthe other hand, are forged as close as possible tothe final dimensions of the desired part, with lit-tle machining or only grinding after forging andheat treatment.
The possibility of eliminating the high costsof machining, combined with the inherent ad-vantages of cold forging regarding materialstrength and finish, make near-net forging veryattractive to the automotive industry.
Examples of typical near-net shape parts aregiven in Fig. 23.1. These parts are characterizedby complex geometries and very close toler-ances, in the range of 0.0004 to 0.002 in. (0.01to 0.05 mm), at complicated and functionallyimportant surfaces. The steering spider seen inthe forefront in Fig. 23.1 is a typical net shapepart. The other forgings require minor machin-ing or grinding. However, functional areas, suchas the gear tooth geometry of the bevel gear, areready for assembly [Meidert et al., 2000].
Some of the parameters affecting the qualityof near-net shape forged components are illus-trated in Fig. 23.2.
23.2 Tolerances in Precision Forging
To reduce cost, it is often desirable to replaceconventional forging that requires several sub-sequent machining and finishing operations withprecision forging, i.e., cold and warm forging,which yields parts with good dimensional tol-erances.
The current minimum dimensional error inpractical cold forging is �20 to 50 lm, whilethe error in machining has been reduced over theyears to less than �1 lm. For cold forging pro-cesses to compete with machining, the dimen-
Cold and Hot Forging Fundamentals and ApplicationsTaylan Altan, Gracious Ngaile, Gangshu Shen, editors, p319-335 DOI:10.1361/chff2005p319
Copyright © 2005 ASM International® All rights reserved. www.asminternational.org

320 / Cold and Hot Forging: Fundamentals and Applications
Fig. 23.2 Factors influencing the quality of near-net shape forged components. FE, finite element [Meidert et al., 2000]
sional accuracy would have to be increased towithin �10 lm. Some of the causes of dimen-sional variation in precision forging are [Osak-ada, 1999]:
● Die manufacturing: The dimensional accu-racy of the dies directly influences that of theparts being produced with them. Hence, diemanufacturing is a very crucial part of themanufacturing sequence of precision parts.The use of electrical discharge machining(EDM) and wire EDM machines in manu-facturing cold forging dies has considerablyimproved the accuracy of forging dies.
● Elastic deflection of the press and tools:When the forming load is applied, the pressand the tools undergo elastic deflection, thusaffecting the final tolerances on the part be-ing forged.
● Variation of process conditions: In practicalsituations, process variables such as forming
pressure, lubrication conditions, billet di-mensions, and material properties do not re-main constant. These fluctuations affect thedimensional accuracy of the forming pro-cess. The billet dimensions and materialproperties (flow stress) can be controlled byinvolving the suppliers in the design processto ensure procurement of billets with consis-tent dimensions and flow stress. The varia-tion in lubrication conditions can be reducedby using lubricants with consistent frictioncoefficients.
23.2.1 Precision Die Manufacturing
Electrical Discharge Machining. In preci-sion forging, cemented carbide is the die mate-rial of choice, rather than high-speed steel, be-cause of its high stiffness, low thermal effect,and high wear resistance. A flow chart for manu-facturing precision dies is shown in Fig. 23.3

Near-Net Shape Forging and New Developments / 321
Fig. 23.3 Flow chart of die manufacturing by electrical discharge machining (EDM). CAM, computer-aided manufacturing [Yosh-imura et al., 1997]
[Yoshimura et al., 1997]. The die insert impres-sion is first made by rough grinding, followedby electrical discharge die sinking. The com-pression ring is produced by machining andmilling, followed by hardening or quenching toincrease its stiffness. The die insert is thenshrink-fitted into the compression ring, and theassembled ring is machined for finishing. Thedie insert impression is made by die sinking us-ing a master electrode, followed by lapping toobtain a mirrored finish.
Surface coating is done to increase surfacehardness on the working portion of the tools, soas to reduce wear and damage in that area. Crackinitiation is delayed due to the hardness of thecoating, which prevents any lubricant or work-piece material from getting wedged in thesecracks. Two commonly used methods of surfacecoating are [Yoshimura et al., 1997]:
● Chemical vapor deposition: TiC, TiCN, TiN,Al2O3
● Physical vapor deposition: TiN
23.2.2 Die Deflection inNet Shape Forging
The stages of process planning, tool design,and manufacture in net shape forming requirenot only the use of a highly qualified engineerand sophisticated computer-aided design/com-puter-aided manufacturing (CAD/CAM) pack-ages but also strict control on the tool and presssettings. Process design in precision forging usu-ally requires extensive trials before the optimumsettings can be identified to yield the desired parttolerances. Thus, it is possible to compensate forthe errors in the dimensions by evaluating thevarious factors affecting the part tolerances.Some of the phenomena affecting die deflection/deformation are listed below in the order thatreflects the increasing dependence on productionrun-time [Kocanda et al., 1996]:
● Elastic deflection is a reversible change indimension brought about by the appliedload. It can be controlled by appropriate cal-culations and design.

322 / Cold and Hot Forging: Fundamentals and Applications
Fig. 23.4 Various stages and influencing factors of the forging process [Ishinaga, 1996]
● Plastic deformation is a permanent defor-mation as a result of an unintended increasein forming load or stress concentration. Thiscould be caused by improper tool alignment,inadequate lubrication, change in initialproperties of the workpiece, etc.
● Cyclic softening or hardening causes signifi-cant changes in the stress-strain response ofthe tool steel. This phenomenon should notbe ignored when the die geometry has stressconcentration features.
● Thermal expansion of the tooling is a resultof the heat generation during deformation.
● Relaxation and creep phenomena consider-ably decrease the prestresses in the die insert.
● Change in the modulus of elasticity may becaused by change in temperature of the toolsteel. Generally, the modulus of elasticity de-creases with increasing temperature.
● Cyclic plastic deformation, which occursnear areas of stress concentration, may resultin initiation of microcracks.
● Softening of tool steel by unwanted temper-ing. Tempering is a function of both tem-perature and time and can occur during colddeformation processing at temperatureslower than the tempering temperature chosenfor heat treatment of the tool.
23.2.3 Press Deflection inNet Shape Forging
Major factors that influence the part toler-ances are the tool and machine deflections andthe various process parameters, such as materialproperties, lubrication, temperatures, etc. Whilethe process parameters and tool design havebeen the subject of extensive research, the influ-
ence of press deflection on the accuracy of theformed part and methodologies to compensatefor these errors have yet to be standardized. Fi-nite-element (FE) simulation has been employedto calculate the stress and deflection behavior ofpress components such as guide layout, pressframe, and the construction of the crosshead[Doege et al., 1990]. However, the nonlinearcharacteristics of the load-deflection behaviorbetween adjacent components, the clearances inthe guiding system, and asymmetry in press as-sembly make it difficult to analyze the elasticbehavior of the press. The horizontal offset andtilting, which occur during multistage forging orforging of complex parts, have a detrimental ef-fect on the part tolerances. In order to quantifythe elastic characteristics of the press, it is nec-essary to measure the load-deflection relation-ship of the ram under center and off-center load-ing conditions together with superimposedhorizontal forces.
In one particular study [Balendra et al., 1996],a three-dimensional (3-D) FE simulation wasconducted to determine the elastic characteris-tics of a 400 metric ton screw press. The simu-lation considered the modeling of the press com-ponents, appropriate definition of the joints, andthe prestressing requirements for assembling theframe. The forming loads were obtained by con-ducting a two-dimensional closed-die, plane-strain, aerofoil forging simulation. This simula-tion enabled the determination of the horizontaloffset and tilting of the forging dies for variousorientations of the die parting line, and methodsto minimize the component form errors due toelastic behavior of the press and location and theelastic behavior of the forging dies.

Near-Net Shape Forging and New Developments / 323
23.2.4 Process Variables in Forging
Figure 23.4 shows the various stages in forg-ing, with the parameters affecting part attributesand tolerances [Ishinaga, 1996]. The variablefactors (enclosed in square brackets) affect eachother and cause variations in the dimensions ofthe forged part. The entire forging process is di-vided into three stages:
● The preprocessing stage addresses the vari-ables related to the billet. One way to controlthe part quality is to ensure minimum devi-ation in each of the billet factors, such asdimensions, flow stress, formability, etc.
● The forging process, which encompasses allthe variables related to the forming process(temperature, lubrication, etc.), tooling, andequipment. Variations in the forging pressurewould affect the thickness of the forging dueto elastic deflection of the press and tools.Off-center loading not only affects the ac-curacy of the process but is also detrimentalto tool life.
● The postprocessing stage deals with machin-ing, surface finishing, or heat treatment ofthe forged parts and affects the materialproperties, surface conditions, or chemicalcomposition of the part.
The growing demands for precision cold-forged products in the automotive industry ledto the development of economical means tomanufacture these parts. Apart from improve-ments in forging processes, there has been con-siderable progress in tooling and equipment de-sign, materials engineering, and lubricationtechniques in order to produce precise compo-nents. Some of these developments and futuretrends are discussed in the subsequent sections.
23.3 Advances in Tool Design
In order to produce precision-forged parts,factors related to the tooling, namely, elastic de-flection, eccentricity, thermal expansion, etc.,have to be considered during the process designstage. This is especially true in the case of coldforging, where precision die manufacturing isnecessary to ensure the production of parts toclose tolerances. The following factors have tobe considered in die manufacturing [Yoshimuraet al., 1997]:
● Proper equipment and process to ensure highaccuracy
● Proper design of die structure to achieve highstiffness
● Proper heat and surface treatments to elimi-nate the heterogeneity of the die material
● Proper control of heating conditions to main-tain constant temperature at the die
Tool life is also a major factor to be consid-ered while quoting a part. Since the cost ofmanufacturing a die is considerable, simultane-ous process design involving process planningand die design are essential to ensure that con-ditions such as loading pressure, stress concen-tration, etc. remain within the allowable limitsof die performance. Thus, tool wear, tool frac-ture, and process failure have to be consideredfor cost reduction.
23.3.1 Enclosed- or Trapped-Die Forging
Enclosed-die forging uses multiple-actiontooling as punches press the material in a pre-enclosed die to fill in the die space (Fig. 23.5).By controlling the motion of rams, metal flowcan be controlled to obtain the optimum defor-mation. The ram motions for upper and lowerpunches can be set as synchronous, asynchro-nous, or with back pressure to reduce formingload or to improve the filling of material. Someof the advantages of enclosed-die forging are:
● The ability to form complex shapes in oneprocess
● Elimination of flash, thus resulting in mate-rial savings. Since parts are formed to closedimensional tolerances, subsequent machin-ing operations are either reduced or, in somecases, eliminated.
● Low forming load is available where the areapenetrated by the punch is relatively small.
A Japanese tool supplier has recently devel-oped a special die set for forging radially ex-truded parts and a family of bevel gears (Fig.23.6 and 23.7) [Yamanaka et al., 2002]. The ad-vantages obtained from this die set were highproductivity, easy installation in nearly allpresses, the requirement of only compressed air,and low initial cost.
A similar concept in die design, developedearlier, incorporates a pantograph, as shown inthe schematic in Fig. 23.8 [Yoshimura et al.,1997 and 2000]. Hydraulic pressure generatedby an external hydraulic unit and an accumulatoris used for closing the upper and lower die toform the die cavity. The die-closing pressure isadjustable. However, if this pressure is too low,
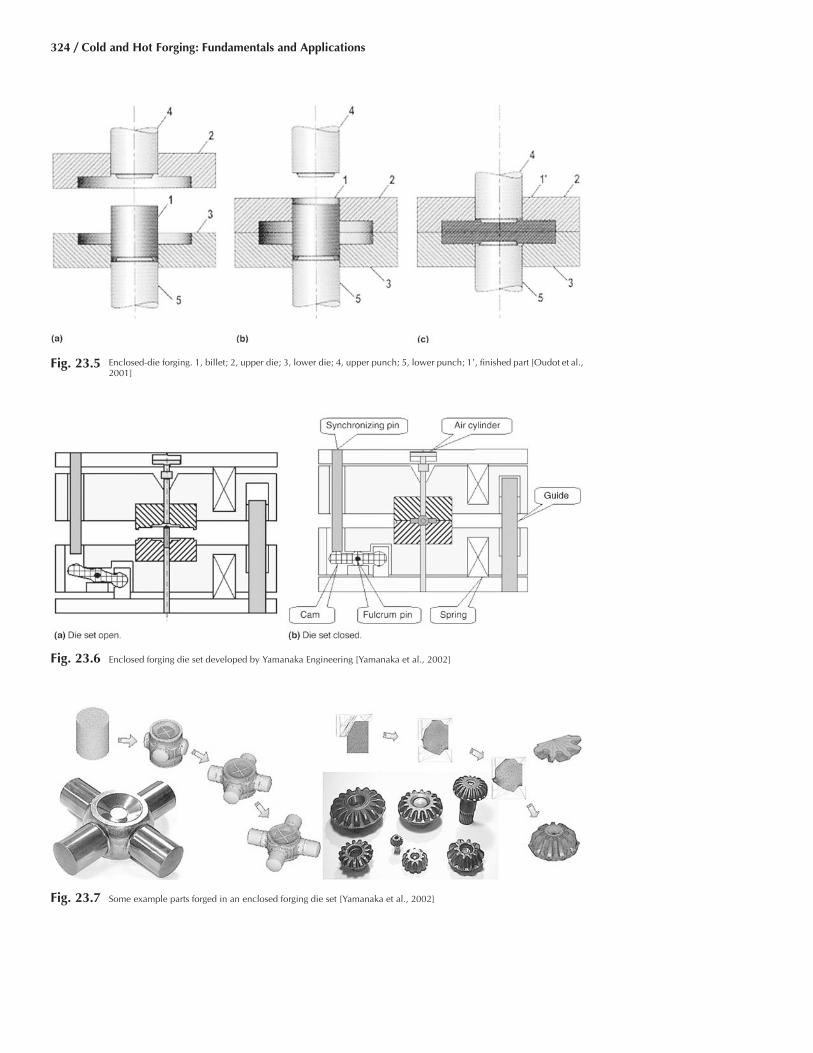
324 / Cold and Hot Forging: Fundamentals and Applications
Fig. 23.5 Enclosed-die forging. 1, billet; 2, upper die; 3, lower die; 4, upper punch; 5, lower punch; 1�, finished part [Oudot et al.,2001]
Fig. 23.6 Enclosed forging die set developed by Yamanaka Engineering [Yamanaka et al., 2002]
Fig. 23.7 Some example parts forged in an enclosed forging die set [Yamanaka et al., 2002]

Near-Net Shape Forging and New Developments / 325
Fig. 23.8 Die set for enclosed-die forging developed by Nichidai Corp. [Yoshimura et al., 1997]
it could result in flash formation in the die gapand cause chipping in the die. The die cavity,composed of the upper and lower dies, moves athalf the punch speed by the pantograph mecha-nism in order to obtain uniform deformation ofthe material in the axial direction [Yoshimura etal., 2000]. Similar die designs have been devel-oped at Institut fur Unformtechnik (Institute forMetal Forming Technology) at the University ofStuttgart as well as by European die and pressmakers [Siegert et al., 2003].
23.3.2 Innovations in CompressivePrestressing of Die Inserts
An important factor in enhancing die life isthe design of compressive prestressing containersystems, which house the die inserts. The con-ventional prestressing container normally con-sists of single or double stress rings. Dependingon the complexity of the part and the requiredtolerances, the compressive prestress generatedmay be too low. STRECON Technology has de-veloped strip-wound radially prestressed con-tainers with strength that is 2 to 3 times that ofconventional stress rings [Groenbaek et al.,1997]. The high strength makes it possible toprovide an optimum prestress for the die, lead-ing to two- to tenfold improvement in the die
life (Fig. 23.9a). Sometimes, in cold forgingdies, fracture may occur because the conven-tional radial prestressing does not have any ap-preciable effect on the stress condition in theaxial direction. To counteract this effect,STRECON has developed strip-wound contain-ers with integrated axial prestressing (Fig.23.9b) [Groenbaek et al., 1997].
The strip-wound containers are manufacturedby winding a thin strip of high-strength steelaround a core of tool steel or tungsten carbide.During the winding process, the steel strip is pre-loaded with a controlled winding tension. Thecore material has a structure and a hardness thatcan withstand high prestress and cyclic workingload. The strip steel is developed especially foroptimum combination of the physical and me-chanical properties. Optimum stress distributionis obtained by varying the winding tensionsfrom layer to layer. The prestressed condition inthe coiled strip is equal to that of a conventionalconstruction with ‘several hundred’ stress rings.Consequently, the strip-wound containers can beloaded with a higher internal pressure than aconventional multiple stress ring set before thematerial will deform plastically. Thus, it is pos-sible to obtain a higher interference when fittinga die into a strip-wound container than into aconventional multiple stress ring set.

326 / Cold and Hot Forging: Fundamentals and Applications
Fig. 23.9 Prestressed strip-wound containers developed by STRECON Technology [Groenbaek et al., 1997 and 2000]
23.3.3 Reduction of ForgingPressure by Divided Flow Method
To reduce forging load and tool stresses,Kondo et al. have developed the divided flowmethod and applied this concept in forging a va-riety of parts, such as the gear parts shown inFig. 23.10. There are two principles of flow re-lief shown in Fig. 23.10(a) and (b), namely, flowrelief hole and flow relief axis. In the former, ablank with a relief hole is compressed by flattools, resulting in a centripetal flow as an out-come of the hole shrinkage, thus creating di-vided flow. In the relief axis principle, a reduc-tion in working pressure occurs due to tworeasons: extrusion of the axis serves as flow re-lief and suppresses the increase in fractional re-duction in area, and the formation of a frictionhill is prevented due to the divided flow. Re-search shows that the relief hole principle ismore suitable for working pressure reduction,since the resistance to flow increases graduallyduring forming.
Manufacture of a helical gear utilizing flowrelief axis with back-up pressure is shown in Fig.23.11 [Kondo, 1999 and 2002]. The formingprocess was completed in one step, because theinner plate moved down with the die plate untilthe preset backup load. The final part with theboss is also shown in Fig. 23.11.
23.4 Advances in Forging Machines
Net shape forging of complex parts, such ashelical gears, helical-tooth pinions, etc., requiresnew concepts in press and tooling design, withconsideration of a multitude of interacting vari-ables such as those shown in Fig. 23.12. In orderto increase the accuracy of the product and toextend the service life of the tools, press buildershave developed multislide and multiaction hy-draulic presses [Nakano, 1997, and Ishinaga,1996].
23.4.1 Multislide Forging Press
Aida Engineering Co. has developed a mul-tislide forging press for the purpose of minimiz-ing the effect of off-center loading during mul-tiprocess transfer forming. The features of thispress are [Nakano, 1997]:
● Multislide construction: Each slide has itsown independent slide.
● Time difference operation: Each slidestrokes with a phase difference.
In model MF-7500, three independent slidesoperate with a phase difference of 30� and a ca-pacity per slide of 280 tonf (2500 kN). The totalcapacity is 845 tonf (7500 kN) with differentworking timing. A schematic of the press withthe slide and die area is shown in Fig. 23.13(a),

Near-Net Shape Forging and New Developments / 327
Fig. 23.10 Gear forging process utilizing divided flow [Kondo, 1999]
Fig. 23.11 One-step divided flow method with back-up pressure [Kondo, 1999 and 2002]

328 / Cold and Hot Forging: Fundamentals and Applications
Fig. 23.12 Characteristics of press and accuracy of formed products [Nakano, 1997, and Ishinaga, 1996]
whereas Fig. 23.13(b) shows the slide motion.As a result of these features it was possible to:
● Reduce the press capacity and reduce facilitycost due to reduction of total load and torqueof the press
● Reduce slide tilting and thus improve the ac-curacy of the formed parts, since the slidesperform independently without any mutualinterference
● Reduce the vibration and noise during pressoperation
Figure 23.14 shows a helical gear cup formedusing the MF-7500 press system [Nakano,1997]. These cups require a higher forming loadin the first and second stage and hence are idealcandidates for production in using this press.The cup, which traditionally required five form-ing stages, is formed in just three steps. Addi-tionally, two annealing processes and phosphatecoating were eliminated.
23.4.2 Multiaction Forging Press
Multiaction forging is an effective means ofnet shape forging parts with complex features.In multiaction forming, there is more than onepressure source to operate the dies and the slide.Also, the dies make several relative motions dur-ing one stroke. A multiaction press for forminghelical gears is shown in Fig. 23.15(a). This hy-
draulically operated press has five cylinders: onefor driving the slide, two cylinders in the slide,and two in the bed. Figure 23.15(b) shows theconstruction of a die for forming the helical gearseen in Fig. 23.15(c) [Nakano, 1997].
23.4.3 Servomotor Press
Figure 23.16 shows a servomotor press thatcombines a newly developed large-sized, high-torque servomotor drive with a crank mecha-nism. The press uses computer numerical con-trols for high functionality. It is thus possible toprogram the forming motion and speed in orderto set the optimum parameters required to formthe part (Fig. 23.17). This can be used advan-tageously to increase die life and produce hard-to-form materials. The press achieves reducedpower usage by using a capacitor to store energy(Fig. 23.16).
23.5 Innovative Forging Processes
Besides the conventional precision-forgingprocesses, which are commonly used in the in-dustry, new processes such as microforming andorbital forging are being further developed forpractical and economical applications.

Near-Net Shape Forging and New Developments / 329
Fig. 23.14 Helical gear cup formed using the MF-7500[Nakano, 1997]
Fig. 23.13 Multislide forging press MF-7500 [Nakano, 1997]
23.5.1 Microforming
The trend in miniaturization allows the pro-duction of cold-forged parts with dimensionsless than 0.04 in. (1 mm) range for electronicsand biomedical applications. These parts arecurrently produced by 3-D etching and othermetal-removal processes. Microforming is a po-tential process for mass production of net shape/near-net shape microcomponents. However, formicroforming to be cost-effective and competi-tive, a comprehensive knowledge pertaining tothe following factors is needed: scale effects/mi-croplasticity, effect of microstructure on the pro-cess, relative stiffness of the tooling, and processcontrol and capability.
With the aid of finite-element modeling(FEM), the interrelationships between thesevariables can be studied so as to provide guide-lines for developing microforming processes. Incooperation with industry, the Engineering Re-search Center for Net Shape Manufacturing(ERC/NSM) at Ohio State University has de-veloped a microforming process for productionof surgical blades. Figure 23.18 shows an ex-ample of 3-D FE simulations for a surgical bladewith initial blank thickness of 0.004 in. (0.1 mm)and final edge thickness of 0.0004 in. (0.01 mm)[Palaniswamy et al., 2001].
In microforming, due to a high surface-to-vol-ume ratio of parts, friction becomes even moreimportant than in conventional forging. Effectsof miniaturization on friction have been inves-tigated by using the double-cup backward extru-sion test, with oil as a lubricant (Fig. 23.19)[Tiesler et al., 1999]. Comparisons between ex-periment and simulation show that friction ef-
fects increase with a decrease in the size of thespecimen. The friction energy observed forforming a 0.04 in. (1 mm) diameter billet was,in proportion to total forming energy, 4 timeslarger than that needed for forging a 0.16 in. (4mm) diameter billet.
23.5.2 Orbital or Rotary Forging
Orbital or rotary forging is a very unique pro-cess with a complicated die movement that canbe used to reduce axial load requirements foraxisymmetric or near-axisymmetric forgingoperations. This process is not new and has beenused for small- or medium-batch production ofvarious round parts. The principle of orbitalforming can be seen in Fig. 23.20 and is alsodiscussed in Chapter 12, “Special Machines forForging,” in this book. The main advantage ofthis process is the reduction of the forging load,since deformation takes place incrementally.Furthermore, a forging process that may require

330 / Cold and Hot Forging: Fundamentals and Applications
Fig. 23.16 Sectional view of the drive mechanism of the Aida Digital Servo Former. Courtesy of Aida Engineering Co. [AidaEngineering]
Fig. 23.15 Multiaction forming press with the dies and the forged gear [Nakano, 1997]
multiple-station operations can be done on onemachine, although the cycle time is longer thanin upset forging.
Recently, orbital forming has been used byvarious bearing and axle manufacturers for theassembly of spindle drives (NSK Bearings, Ja-pan). At the ERC/NSM at Ohio State University,orbital forging simulations using DEFORM-3D(Scientific Forming Technologies Corp.) were
conducted to study and develop a robust assem-bly process of an automotive spindle and anouter ring. Figure 23.21 shows the simulationprogression, which considers elastic and plasticdeformation, residual stresses, and quality of as-sembly. This application illustrates the currentcapabilities of FEM in simulating complex andincremental cold forging operations to optimizeprocess conditions and product design.

Near-Net Shape Forging and New Developments / 331
Fig. 23.17 Some example settings of forming motions and speeds. Courtesy of Aida Engineering Co. [Aida Engineering]
Fig. 23.18 Microforming of surgical blades. Blank thickness� 0.004 in. (0.1 mm); final blade thickness �
0.0004 in. (0.01 mm) [Palaniswamy et al., 2001]
Machines for hot forging large wheels orrings, using the incremental forming principle oforbital forging, have been developed by severalmachine tool builders. In these designs, thepunch or tool does not move orbitally but rotatesaround a fixed inclined axis, as shown in Fig.23.22 [Husmann, 1999]. The part, located in adie, is rotated and pushed vertically upwardwhile the inclined punch rotates. Thus, the ma-chine is similar to a ring rolling mill that has alower die cavity that is hydraulically pushed up-ward (Fig. 23.23).
Such machines are used to forge railroad carwheels or forgings for large gears and near-netshape formed spiral bevel ring gears for truckdifferentials (Fig. 23.24).
23.6 Future of Forging Technology inthe Global Marketplace
Automotive companies, which account for avery large portion of forged parts, are rapidlyexpanding global operations in an effort to pro-duce cost-effective vehicles. This has vast im-plications for local automotive suppliers. Aglobal economy allows, in many instances, anysupplier that can satisfy part design requirementsto bid and obtain a contract, irrespective of thegeographic boundaries. This implies that thecurrent automotive suppliers will have to changetheir production strategies to remain competitivein the global marketplace.
Due to globalization, forging technologies arediffusing across firms and across boundaries atincreasing rates, through channels such as over-seas patenting, licensing, exchange of technol-ogy-intensive goods, international investments,and alliances. As a result of inexpensive labor,production costs for simple parts are much lessexpensive in developing nations. Therefore,conventional cold forging operations will grad-
ually shift to developing nations for productionof low-tech components.
In order to succeed in the global marketplace,forging suppliers from developed nations mustfocus on production of high-value-added forg-ings, finished parts, and subassemblies with theaid of new developments such as advances inthe use of computer modeling in forging processdevelopment, advances in press design, use ofinnovative tool design for complex forgingoperations, appropriate training in advancedcold forging technologies, and information man-agement in forge shops. While the process tooland equipment design have been the subject ofextensive research and development, the ad-vances in information management and person-nel training cannot be ignored. These two as-pects are just as crucial to ensuring a defect-freepart with the desired functionality as the tech-nical developments.
23.6.1 Information Management in theForge Shop
Management of complex engineering infor-mation in the forging environment plays a bigrole in ensuring that the desired production out-puts are met. A forging company should havethe ability to organize engineering knowledgeand properly disseminate useful information tothe respective departments for implementation.It is necessary to store an abundance of data, tobe retrieved when and where desired. A numberof forging companies have gone global, with

332 / Cold and Hot Forging: Fundamentals and Applications
Fig. 23.20 Schematic representation of the orbital forgingprocess [Oudot et al., 2001]
Fig. 23.19 Double-cup extrusion test for determination of friction conditions in microforming [Tiesler et al., 1999]
branches in various locations. Thus, informationflow becomes complex and difficult to manageefficiently.
To date, companies such as Plexus Systemshave developed computerized systems that canassist the management of information flow atvarious departmental levels, e.g., inventorytracking, shipping, receiving, engineering, pur-chasing, etc. [Beatty, 1997]. At the engineeringdepartmental level, information managementsystems can be helpful for storing and retrievingdata pertaining to tool designs, changing toolmaterials, product specification, process instruc-tions, just-in-time jobs/rush jobs, process controlplan, tool life tracking, machine specificationsand drawings, press stress analysis, engineeringdrawing management, and dimensional controlplans.
More sophisticated computerized informationmanagement systems will continue to emerge,and the forging companies will be compelled toadopt these systems. Failure to do so mighthinder their chances of competing on the globalmarketplace. The steady growth and develop-ment of the worldwide web has prompted manyforging firms to reassess and redesign the waythey share critical business information [Beattyet al., 2001]. The web can provide cold forgingcompanies with both operational and adminis-trative benefits that can improve the firm’s over-all competitive position.
23.6.2 Training of Personnel
Due to global competition, the training ofmetal forming engineers, who are expected to
plan and supervise the design and production ofparts and dies, becomes increasingly important.Continuous improvements in forging technol-ogy and application of recently generated re-search and development results require thatengineers be continuously updated in new meth-ods, machines, and process technology. Profes-sional education in forging and metal forming isnecessary not only to upgrade the knowledgelevel of practicing forging engineers but alsothat of industrial, mechanical, and metallurgicalengineers who may be assuming new responsi-
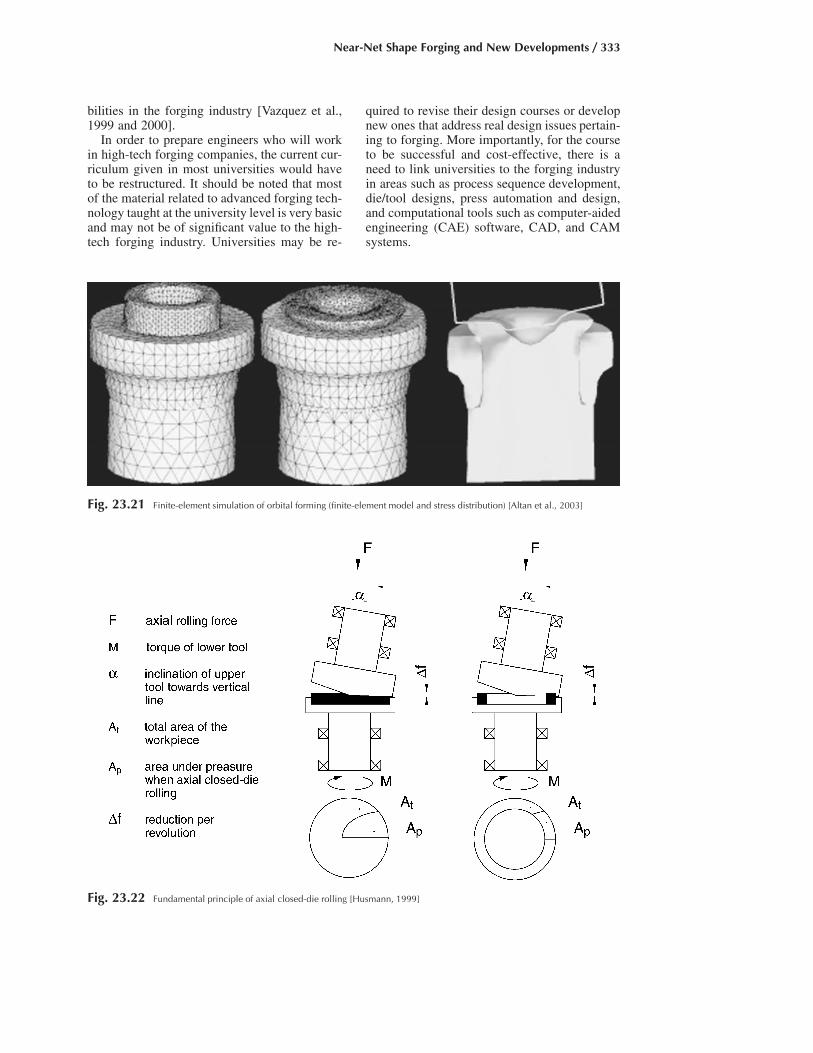
Near-Net Shape Forging and New Developments / 333
Fig. 23.22 Fundamental principle of axial closed-die rolling [Husmann, 1999]
Fig. 23.21 Finite-element simulation of orbital forming (finite-element model and stress distribution) [Altan et al., 2003]
bilities in the forging industry [Vazquez et al.,1999 and 2000].
In order to prepare engineers who will workin high-tech forging companies, the current cur-riculum given in most universities would haveto be restructured. It should be noted that mostof the material related to advanced forging tech-nology taught at the university level is very basicand may not be of significant value to the high-tech forging industry. Universities may be re-
quired to revise their design courses or developnew ones that address real design issues pertain-ing to forging. More importantly, for the courseto be successful and cost-effective, there is aneed to link universities to the forging industryin areas such as process sequence development,die/tool designs, press automation and design,and computational tools such as computer-aidedengineering (CAE) software, CAD, and CAMsystems.
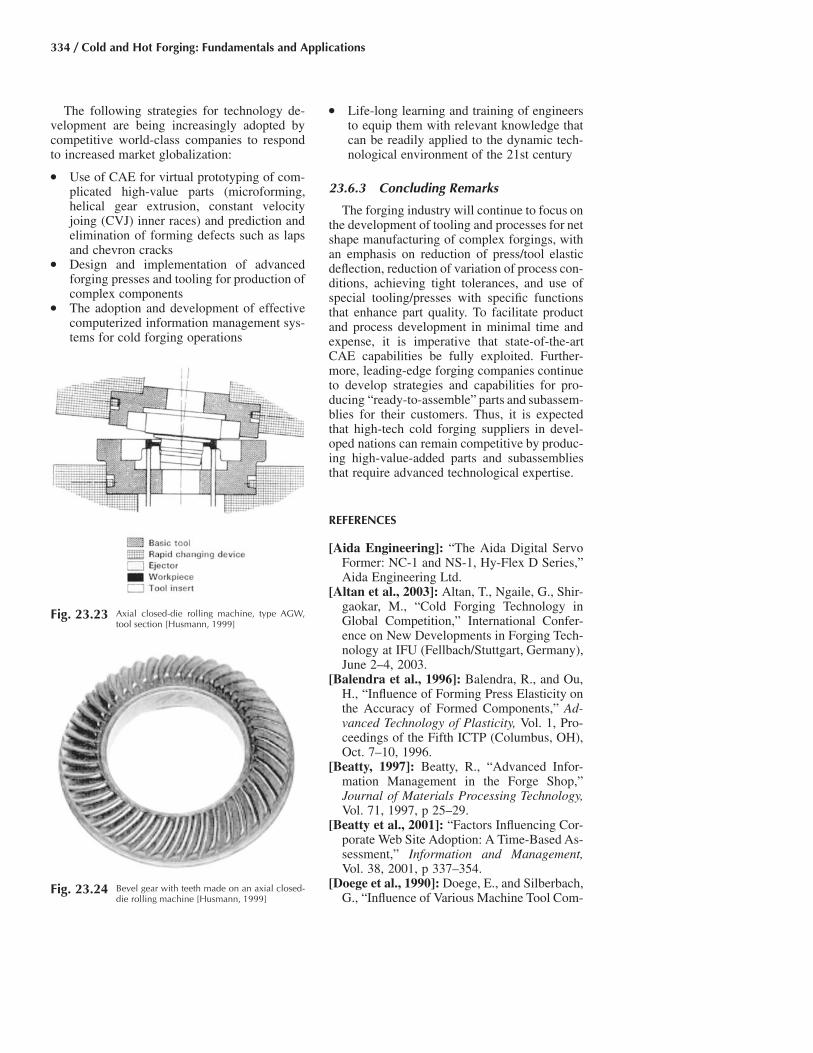
334 / Cold and Hot Forging: Fundamentals and Applications
Fig. 23.24 Bevel gear with teeth made on an axial closed-die rolling machine [Husmann, 1999]
Fig. 23.23 Axial closed-die rolling machine, type AGW,tool section [Husmann, 1999]
The following strategies for technology de-velopment are being increasingly adopted bycompetitive world-class companies to respondto increased market globalization:
● Use of CAE for virtual prototyping of com-plicated high-value parts (microforming,helical gear extrusion, constant velocityjoing (CVJ) inner races) and prediction andelimination of forming defects such as lapsand chevron cracks
● Design and implementation of advancedforging presses and tooling for production ofcomplex components
● The adoption and development of effectivecomputerized information management sys-tems for cold forging operations
● Life-long learning and training of engineersto equip them with relevant knowledge thatcan be readily applied to the dynamic tech-nological environment of the 21st century
23.6.3 Concluding Remarks
The forging industry will continue to focus onthe development of tooling and processes for netshape manufacturing of complex forgings, withan emphasis on reduction of press/tool elasticdeflection, reduction of variation of process con-ditions, achieving tight tolerances, and use ofspecial tooling/presses with specific functionsthat enhance part quality. To facilitate productand process development in minimal time andexpense, it is imperative that state-of-the-artCAE capabilities be fully exploited. Further-more, leading-edge forging companies continueto develop strategies and capabilities for pro-ducing “ready-to-assemble” parts and subassem-blies for their customers. Thus, it is expectedthat high-tech cold forging suppliers in devel-oped nations can remain competitive by produc-ing high-value-added parts and subassembliesthat require advanced technological expertise.
REFERENCES
[Aida Engineering]: “The Aida Digital ServoFormer: NC-1 and NS-1, Hy-Flex D Series,”Aida Engineering Ltd.
[Altan et al., 2003]: Altan, T., Ngaile, G., Shir-gaokar, M., “Cold Forging Technology inGlobal Competition,” International Confer-ence on New Developments in Forging Tech-nology at IFU (Fellbach/Stuttgart, Germany),June 2–4, 2003.
[Balendra et al., 1996]: Balendra, R., and Ou,H., “Influence of Forming Press Elasticity onthe Accuracy of Formed Components,” Ad-vanced Technology of Plasticity, Vol. 1, Pro-ceedings of the Fifth ICTP (Columbus, OH),Oct. 7–10, 1996.
[Beatty, 1997]: Beatty, R., “Advanced Infor-mation Management in the Forge Shop,”Journal of Materials Processing Technology,Vol. 71, 1997, p 25–29.
[Beatty et al., 2001]: “Factors Influencing Cor-porate Web Site Adoption: A Time-Based As-sessment,” Information and Management,Vol. 38, 2001, p 337–354.
[Doege et al., 1990]: Doege, E., and Silberbach,G., “Influence of Various Machine Tool Com-

Near-Net Shape Forging and New Developments / 335
ponents on Workpiece Quality,” Annals ofCIRP, Vol. 39 (No. 1), 1990.
[Groenbaek et al., 1997]: Groenbaek, J., andNielsen, E.B., “Stripwound Containers forCombined Radial and Axial Prestressing,”Journal of Materials Processing Technology,Vol. 71, 1997, p 30–35.
[Groenbaek et al., 2000]: Groenbaek, J., andBirker, T., “Innovations in Cold Forging DieDesign,” Journal of Materials ProcessingTechnology, Vol. 98, 2000, p 155–161.
[Husmann, 1999]: Husmann, J., “High SpeedRing Rolling and Closed-Die Rolling,” pre-sented at the FIA Conference (Reno, NV),May 1999.
[Ishinaga, 1996]: Ishinaga, N., “An AdvancedPress Design for Cold Forging,” Third Inter-national Cold and Warm Forging TechnologyConference, SME and ERC/NSM (Columbus,OH), Oct. 7–9, 1996.
[Kocanda et al., 1996]: Kocanda, A., Cacko,R., Czyzewski, P., “Some Aspects of Die De-formation in Net-Shape Cold Forging,” Ad-vanced Technology of Plasticity, Vol. 1, Pro-ceedings of the Fifth ICTP (Columbus, OH),Oct. 7–10, 1996.
[Kondo, 1999]: Kondo, K., “Improvement ofProduct Accuracy in Cold Die Forging,” Ad-vanced Technology of Plasticity, Vol. 1, Pro-ceedings of the Sixth ICTP, Sept. 19–24,1999.
[Kondo, 2002]: Kondo, K., “Some Reminis-cences of the Development of Precision Forg-ing Processes,” Advanced Technology of Plas-ticity, Vol. 1, Proceedings of the SeventhICTP (Yokohama, Japan), Oct. 28–31, 2002.
[Meidert et al., 2000]: Meidert, M., and Hansel,M., “Net-Shape Cold Forging to Close Tol-erances under QS 9000 Aspects,” Journal ofMaterials Processing Technology, Vol. 98,2000, p 150–154.
[Nakano, 1997]: Nakano, T., “Presses for ColdForging,” Aida Engineering Ltd., JSTP Inter-national Seminar of Precision Forging(Osaka, Japan), The Japanese Society forTechnology of Plasticity, March 31 to April1, 1997.
[Osakada, 1999]: Osakada, K., “New Methodsfor Precision Forging,” Advanced Technologyof Plasticity, Vol. 2, Proceedings of the SixthICTP (Nuremberg, Germany), Sept. 19–24,1999.
[Oudot et al., 2001]: Oudot, H., and Faure, H.,“Improvement of Precision in Cold Forged
Parts,” La Forge, No. 4, April 2001, p 27 (inFrench).
[Palaniswamy et al., 2001]: Palaniswamy, H.,Ngaile, G., and Altan, T., “Coining of Surgi-cal Slit Knife,” F/ERC/NSM-01-R-26, Engi-neering Research Center for Net Shape Manu-facturing, 2001.
[Siegert et al., 2003]: Siegert, K., and Baur, J.,“Cold Lateral Extrusion of Automotive Com-ponents,” Proceedings of the InternationalCold Forging Group Conference (Columbus,OH), ERC/NSM, Sept. 2–4, 2003.
[Tiesler et al., 1999]: Tiesler, N., Engel, U.,Geiger, M., “Forming of Microparts—Effectsof Miniaturization on Friction,” AdvancedTechnology of Plasticity, Vol. 2, Proceedingsof the Sixth ICTP (Nuremberg, Germany),Sept. 19–24, 1999.
[Vazquez et al., 1999]: Vazquez, V., and Altan,T., “State of the Art Technology for TrainingEngineers for the Forging Industry,” pre-sented at the 1999 FIA/FIERF Conference,1999.
[Vazquez et al., 2000]: Vazquez, V., and Altan,T., “State of the Art Technology for TrainingEngineers for the Forging Industry,” Proceed-ings of Umformtechnik 2000 plus, M. Geiger,Ed., Meisenbach Verlag, 1999, p 53.
[Yamanaka et al., 2002]: Yamanaka, M., andSunami, F., “Tool Design for Precision Forg-ing,” Cold and Warm Precision ForgingWorkshop (Canton, MI), Schuler, Inc., Ya-manaka Engineering, Scientific FormingTechnologies Corp., ERC/NSM, Nov 14,2002.
[Yoshimura et al., 1997]: Yoshimura, H., andWang, C.C., “Manufacturing of Dies for Pre-cision Forging,” Nichidai Corporation, JSTPInternational Seminar of Precision Forging(Osaka, Japan), March 31 to April 1, 1997.
[Yoshimura et al., 2000]: Yoshimura, H.,Wang, X., Kubota, K., Hamaya, S., “ProcessDesign and Die Manufacturing for PrecisionForging,” Nichidai Corporation, Second JSTPInternational Seminar of Precision Forging(Osaka, Japan), May 15–16, 2000.
SELECTED REFERENCE
● [Yoshimura et al., 1983]: Yoshimura, H.,and Shimasaki, S., “A Study of Enclosed DieForging,” Journal of the JSTP, 1983, p 24–30.

Index
A
Accuracyin forging 112of mechanical presses 126–128(F, T)of screw presses 133
Aircraft/aerospace applicationsisothermal and hot-die forging 257–275(F, T)process modeling for 199(F), 201–202, 203(F), 204(F),
205–206(F)Aluminum and aluminum alloys
aircraft component, process modeling for 203(F),205–206
cold forging of 213–215(F, T)flow stress-strain 30(F), 40(T), 44(T)hot forging temperatures 163(T)load-displacement curve 29(F)lubrication 71(F), 73(T), 75(T), 214–215(F)preform dies 174, 175(F, T)ring testing 65(T), 87–89(F, T)
Analysis. See also Finite difference analysis; Finiteelement analysis/modeling; Inverse analysis; Slabanalysis
for flow stress and friction 83–89(F, T)for forging operations 91–105(F, T)
Automated mesh generation 196Automotive applications
and globalization 331–334process modeling for 200(F), 201(F), 202–205(F),
239(F), 240(F), 241, 242(F)
B
Barreling, and flow stress errors 33–35, 36(F), 37(F),38(F), 238
Bending, load vs. displacement 109(F)Biaxial stress 19–20(F)Billets
and die failure 297–299lubrication 214–215(T)as process variable 8(F)separation and shearing 151–157(F), 299
Blanking, load vs. displacement 109(F)Blocking. See Dies, preform
C
Carbon steelshot forging temperatures 163(T), 214(T)lubrication 71–73(F, T), 74(T)preform dies 174(T), 175(F)
Casting, of dies 292Cemented carbides, for tooling 286–287, 288(T)Ceramic dies 285Closed-die forging. See also Impression-die forging
load vs. displacement 109(F), 110(F)overview 10(F), 11(F)
Coiningload vs. displacement 109(F)overview 14(F)
Cold forgingadvantages 212–213billet preparation 214(T)dies 228–229, 230(F), 286–289(T)finite-element modeling 307–311(F, T)lubricants for 70–73(F, T), 214–215(F, T)materials for 213–214(T)overview 211–212(F)process design 229–230, 231(F), 232(F)process modeling 237–246(F)system variables 213(F)tooling 225–228(F), 230–233(F), 286–289(T)
Compression testing. See also Ring testingerrors 33–35, 36(F), 37(F), 38(F)and flow stress 26(F), 27(F), 28(F), 29–35(F, T), 36(F),
37(F), 38(F)for microstructure model development 247–248press slide parallelism 32–33, 34(F), 35(T)specimen preparation 28(F), 31–32tooling 27(F)
Computer-aided design (CAD) system, and FEMsimulation 244–245(F)
Connecting rodload prediction 177–182(F, T)process modeling for 206–207(F)
Copper and copper alloysflow stress-strain 40(T), 45(T)hot forging temperatures 163(T)lubrication 73(T), 75(T)
© 2005 ASM International. All Rights Reserved.Cold and Hot Forging: Fundamentals and Applications (#05104G)
www.asminternational.org

338 / Cold and Hot Forging: Fundamentals and Applications
Crank presses. See Mechanical pressesCross rolling. See Transverse rolling
D
Deformation. See Homogeneous deformation; Plasticdeformation; Superplastic deformation
Deformation energy 57Deformation zone, as process variable 8(F), 9Dies. See also Closed-die forging; Enclosed-die forging;
Impression-die forging; Open-die forgingadvances in 325(F)casting of 292ceramic 285cold forging 228–229, 230(F), 286–289(T)extrusion 228–229, 230(F)failure of 231–232, 295–317(F, T)finisher design of, 165–167finite-element modeling 307–316(F, T)and friction/lubrication 70, 304for isothermal and hot-die forging 264–267, 270(F)lubrication 74(T)machining of 291(F), 292, 320–321(F)manufacture of 289–292(F, T), 303, 320–321(F)materials for 277–289(F, T), 301–303precision 320–321(F)preform 171–177(F, T)as process variable 8, 9surface finish 303–304surface treatments 292(T), 303
Double cup backward extrusion testing, for lubricity77(F), 78–80(F, T), 243(F)
E
Eccentric presses. See Mechanical pressesEfficiency factor 111Electro-upsetting 10, 11(F), 142–143, 145(F)Electrochemical machining, of dies 292Electrodischarge machining, of dies 291(F), 320–321(F)Enclosed-die forging 323–325(F)Energy requirements 108–109, 111, 123–124,
131–133(F)Engineering strain 23(F)Environmental factors 4, 8(F)Equipment. See also Dies; Forging machines; Hammers;
Presses; Shearingand die failure 299–301as process variable 8(F), 161–162selection, process modeling for 199(F), 201
Exhaust valves, FEM analysis of 314–315(F, T)Extrusion
backward 11, 12(F), 109(F), 218–225(F, T), 308–309(F)dies 228–229, 230(F)double cup backward extrusion testing 77(F), 78–80(F,
T), 243(F)forward 10–11, 12(F), 109(F), 218–225(F, T), 239(F),
240(F), 307–308(F, T)friction and flow stress 221–222load and energy 218–220(F), 222–225(T)
lubrication 219open-die 221(F)tooling 225–228(F), 230–233(F)trapped-die 220–221(F)
F
Failure, of dies 231–232, 295–317(F, T)Fatigue, and die failure 301–303(F, T)Finite difference analysis 92(T)Finite element analysis/modeling 75(F), 83–89(F, T),
92–93(T), 98–104(F), 185, 189–190, 193–209(F),237–246(F), 307–316(F, T)
Flash 10(F), 159–160, 161(F), 167–169(F)Flow rules, and plastic deformation 55–56, 96Flow stress
average values 48(T)data representation 36–48(F, T)estimation 178–181(T), 190(T), 191, 221–222and forgeability 25–49(F, T), 161, 163(F)inverse analysis 83–89(F, T), 238(F)of nickel-base superalloys 266(F)of titanium alloys 264(F), 265(F)
Forgeability, and flow stress 25–49(F, T), 161, 163(F)Forging machines. See also Hammers; Presses
advances in 326–328(F)principles of 107–113(F, T)special 141–150(F)
Forging processes. See also Cold forging; Hot forging;Metal forming; Near-net shape forging; specificforging processes
analysis methods for 91–105(F, T)future developments 331–334innovations 328–331(F)load and energy requirements 108–109(F), 110(F), 111system variables 7–9(F), 91, 160–161, 162(F), 322(F),
323temperature and heat transfer in 59–66(F, T)types of 9–14(F)
Fracture mechanisms, in die failure 296Friction
estimation of 181, 221–222, 238in forging 67–81(F, T)inverse analysis 83–89(F, T)laws 69as process variable 9, 162, 196
G
Gatorizing 258Gears
cold forging of 211(F)process modeling for 200(F), 201(F), 202–203,
207–208(F)punch failure 310–311(F)
Geometryand manufacturing process 2and process modeling 194–195, 237as process variable 8, 9, 159, 160(F), 164–165, 166(F)simplified model 187(F), 190–191
© 2005 ASM International. All Rights Reserved.Cold and Hot Forging: Fundamentals and Applications (#05104G)
www.asminternational.org

Index / 339
Glass, as lubricant 74(T), 268–269, 271(F)Globalization 331–334Golf ball mold cavities, modeling of 239–241(F)Grain growth 251–252, 253(F)Graphite, as lubricant 74(T), 214
H
Hammers/hammer forging 110, 111(T), 135–139(F),198–200(F), 300
Heading 13–14(F)Heat checking, of die steels 283(T), 284(T)Heat transfer, in metal forming 59–66(F, T), 162–163,
196Heat treatment. See also Postforging heat treatment
of die steels 285process modeling for 207–208(F)
HERF machines 111(T)Hobbing
of dies 291–292of golf ball mold cavities 239–241(F)overview 11, 12(F)
Homogeneous deformation 21–23(F), 56(F)Horizontal forging machines 144–145, 147(F)Hot-die forging 257–275(F, T)Hot forging
advantages 212–213, 233die and tool materials for 277–285(F, T)finite-element modeling 311–316(F, T)lubricants for 73–74(F, T), 75(T)overview 211, 233–234process and machine variables 108(F)temperatures 163(T)
Hydraulic presses 110, 111(T), 115–120(F), 263–264,267(F)
I
Impression-die forging. See also Closed-die forgingload estimation, simplified method 185–192(F, T)process design 159–183(F, T)process modeling using FEA 193–209(F)systems approach 8(F)
Information management 331–332Inverse analysis, for flow stress and friction
determination 83–89(F, T)Ironing 14(F)IsoCon process 258Isothermal forging 11–12, 13(F), 257–275(F, T)
J
Jet engine disks, process modeling for 199(F), 201–202
K
Knockout pin, finite-element modeling of 309–310(F)Knuckle-joint presses. See Mechanical presses
L
Lead and lead alloys, flow stress-strain 47(T)Load
in extrusion 218–220(F), 222–225(T)in impression-die forging 167–171(F), 181–182(T),
185–192(F, T)prediction, for connecting rod 177–182(F, T)requirements 108–109(F), 110(F), 111, 123–124(F),
131–133(F)Lot size, and die design 164Low-alloy steels
for hot forging 278(T)hot forging temperatures 163(T)lubrication 214(T)preform dies 174(T), 175(F)
Lubricationand die failure 304evaluation methods 74–80(F, T)in extrusion 219in forging 67–81(F, T)in isothermal and hot-die forging 268–269, 271(F)mechanisms 68–69(F)as process variable 8, 9, 162
M
Machining, of dies 289–291Magnesium and magnesium alloys
flow stress-strain 47(T)hot forging temperatures 163(T)lubrication 75(T)
Manufacturing processescharacteristics of 2–4classification of 1–2metal forming 1–5
Maraging steelsfor dies 283–284(T)hot forging temperatures 163(T)
Material characterization 8–9, 196, 237–238Mechanical presses 111(T), 120–131(F). See also
Horizontal forging machinesMesh generation, automated. See Automated mesh
generationMetal forming
analysis methods 83–85(F), 91–105(F, T)and flow stress 25–49(F, T)friction and lubrication 67–81(F, T)and heat transfer 59–66(F, T)in manufacturing 1–5plastic deformation 17–23(F), 51–57(F)
Microforming 329, 331(F), 332(F)Microstructure modeling, in superalloy forging 199(F),
200, 201–202, 247–255(F, T)Modeling. See Microstructure modeling; Process modelingMohr circles 53(F), 54(F)Molybdenite, as lubricant 74(T), 214Molybdenum and molybdenum alloys, hot forging
temperatures 163(T)
© 2005 ASM International. All Rights Reserved.Cold and Hot Forging: Fundamentals and Applications (#05104G)
www.asminternational.org

340 / Cold and Hot Forging: Fundamentals and Applications
Multiaction press 328, 330(F)Multislide press 326, 328, 329(F)
N
Near-net shape forging 319–331(F)Necking 26(F)Nickel aluminides, for dies 285Nickel and nickel alloys. See also Superalloys
hot forging temperatures 163(T)lubrication 75(T)
Niobium and niobium alloys, hot forging temperatures163(T)
Nosing 14(F)
O
Open-die forging 12, 13(F)Orbital forging 12–13(F), 145, 148(F), 245(F),
329–331(F)
P
Personnel training 332–334Petroforge 111(T)Pinions, automotive, FEM simulation 241, 242(F)Plane stress 19–20(F)Plastic deformation
of die steels 280–281(F)flow rules 55–56power and energy 56–57(F)strain and strain rate 17–23(F), 57stress state 51–52(F)yield criteria 52–55(F), 56(F)
Plastic strain. See True strainPostforging heat treatment, in isothermal and hot-die
forging 269–271Powder metal (P/M) forging 13(F)Precision forging. See Near-net shape forgingPresses. See Hydraulic presses; Mechanical presses;
Multiaction press; Multislide press; Screw presses;Servomotor press
Pressure, in impression-die forging 169–170(F), 171(F)Process modeling
applications/examples 239–245(F)in cold forging 237–246(F)for equipment selection 199(F), 201finite-element analysis for 193–209(F), 237–246(F)
Product geometry and variables 8(F)Production rate, and manufacturing process 3–4
R
Race, cross-groove inner, FEM analysis of 243–244(F)Radial forging 11, 12(F), 145–149(F)Recrystallization
dynamic 248–249(F), 250(F)meta-dynamic 249–251(F), 252(F), 253(F)
Reducer rolling 141–142(F), 143(F), 144(F)Ring rolling 143–144, 146(F), 147(F)Ring testing
of Al 6061-T6 87–89(F, T)and flow stress 35, 38(F)for lubricity 75(F), 76–77(F, T), 78(T)
Rocking die forging. See Orbital forgingRoll forging 141–142(F), 143(F), 144(F)Rotary forging. See Orbital forging
S
Scale, and friction/lubrication 70Screw presses 110, 111(T), 131–135(F)Servomotor press 328, 330(F), 331(F)Shape complexity. See GeometryShearing, of billets 151–157(F)Simulation code 196–197Slab analysis 91, 92(T), 93–97(F), 170–171(F), 177–182,
185–192(F, T), 216–217, 218(F)Slip-line field analysis 91–92(T)Stainless steels
cold forging of 213flow stress-strain curves 32(F)hot forging temperatures 163(T)lubrication 73, 74(T)
Steels. See also Carbon steels; Low-alloy steels; Maragingsteels; Stainless steels; Tool steels
cold forging of 213–215(T)for dies 277–289(F, T)flow stress-strain relation 39(T), 41–43(F)lubrication 72(T), 74(T)
Strain. See also Engineering strain; True straineffective 57overview 20–21(F)
Strain rate, effective 57Stress tensor
overview 17–18(F)and plastic deformation 51–52(F)properties of 18–19(F)
Stribeck curve 68(F)Superalloys
for dies 284–285flow stress-strain curves 33(F)hot forging temperatures 163(T)isothermal and hot-die forging of 257–275(F, T)microstructure modeling 199(F), 200, 201–202,
247–255(F, T)yield strengths 268(F), 269(F)
Superplastic deformation 259, 261(F)Surface finish
for dies 303–304and manufacturing process 4(F)
Surgical blades, microforming of 241–243(F), 331(F)Swing forging. See Orbital forging
T
Tantalum and tantalum alloys, hot forgingtemperatures 163(T)
© 2005 ASM International. All Rights Reserved.Cold and Hot Forging: Fundamentals and Applications (#05104G)
www.asminternational.org

Index / 341
Temperature, and metal forming 59–66(F, T),162–163(T)
Tensile testing, and flow stress 25(F), 26(F), 27–29Titanium and titanium alloys
aircraft component, process modeling for 203(F),205–206
alpha and beta stabilizers for 262(T)beta transus and forging temperatures for 262(T)flow stress-strain 46(T)hot forging temperatures 163(T)isothermal and hot-die forging of 259–262(F, T),
263(F), 264(F), 265(F)lubrication 73(T), 75(T)preform dies 174, 175(T)ring compression testing 65(T)
Tolerancesand die design 164and manufacturing process 2–3(F), 4(F)in precision forging 319–323(F)
Tool steelsAISI classification and composition 278(T)for cold forging 286(T), 287(T)
Toolingadvances in 323–326(F)automotive, failure investigation using FEM 202(F),
203–205for cold forging 225–228(F), 230–233(F), 286–289(T)and friction/lubrication 69–70for isothermal and hot-die forging 263–264materials for 277–289(F, T)as process variable 8(F), 9, 196, 237–238
Torsion testing, and flow stress 36Toughness, of die steels 281–283(F)Training 332–334Transverse rolling 142, 144(F), 145(F)Trapped-die forging. See Enclosed-die forgingTresca yield criterion 52–53(F), 54–55(F)True strain 23(F)Tungsten and tungsten alloys
hot forging temperatures 163(T)lubrication 75(T)
Tungsten carbide, for tooling 287, 288(T)
U
Upper-bound analysis 92(T), 97–98Upset forging. See also Electro-upsetting
closed-die 216–217(F)cold 215–217(F, T)and finite element analysis 101–102, 103(F), 312–314(F,
T)and friction 67(F)and horizontal machines 144–145, 147(F)load vs. displacement 109(F)overview 13–14(F)and slab analysis 93–97(F), 216–217, 218(F)and upper-bound analysis 97–98
Uranium and uranium alloys, flow stress-strain 47(T)
V
Velocity fieldand local deformation 20and slab analysis 93–94(F), 95–96and strain rate 21
Visioplasticity analysis 92Von Mises yield criterion 53–55(F), 56(F)
W
Warm forging. See Hot forgingWear mechanisms, in die failure 296–297(F), 298(F, T)Wear resistance, of die steels 279–280(F)
Y
Yield criteria, and plastic deformation 52–55(F), 56(F)
Z
Zinc phosphate, for lubrication 71–73(F, T), 214(T)Zirconium and zirconium alloys, flow stress-strain
47(T)
© 2005 ASM International. All Rights Reserved.Cold and Hot Forging: Fundamentals and Applications (#05104G)
www.asminternational.org

ASM International is the society for materials engineers and scientists,
a worldwide network dedicated to advancing industry, technology, and
applications of metals and materials.
ASM International, Materials Park, Ohio, USA
www.asminternational.org
This publication is copyright © ASM International®
. All rights reserved.
Publication title Product code
Cold and Hot Forging: Fundamentals and
Applications
05104G
To order products from ASM International:
Online Visit www.asminternational.org/bookstore
Telephone 1-800-336-5152 (US) or 1-440-338-5151 (Outside US)
Fax 1-440-338-4634
MailCustomer Service, ASM International
9639 Kinsman Rd, Materials Park, Ohio 44073, USA
Email [email protected]
In Europe
American Technical Publishers Ltd.
27-29 Knowl Piece, Wilbury Way, Hitchin Hertfordshire SG4 0SX, United
Kingdom
Telephone: 01462 437933 (account holders), 01462 431525 (credit card)
www.ameritech.co.uk
In Japan
Neutrino Inc.
Takahashi Bldg., 44-3 Fuda 1-chome, Chofu-Shi, Tokyo 182 Japan
Telephone: 81 (0) 424 84 5550
Terms of Use. This publication is being made available in PDF format as a benefit to members and customers of ASM
International. You may download and print a copy of this publication for your personal use only. Other use and distribution is
prohibited without the express written permission of ASM International.
No warranties, express or implied, including, without limitation, warranties of merchantability or fitness for a particular purpose,
are given in connection with this publication. Although this information is believed to be accurate by ASM, ASM cannot
guarantee that favorable results will be obtained from the use of this publication alone. This publication is intended for use by
persons having technical skill, at their sole discretion and risk. Since the conditions of product or material use are outside of
ASM's control, ASM assumes no liability or obligation in connection with any use of this information. As with any material,
evaluation of the material under end-use conditions prior to specification is essential. Therefore, specific testing under actual
conditions is recommended.
Nothing contained in this publication shall be construed as a grant of any right of manufacture, sale, use, or reproduction, in
connection with any method, process, apparatus, product, composition, or system, whether or not covered by letters patent,
copyright, or trademark, and nothing contained in this publication shall be construed as a defense against any alleged
infringement of letters patent, copyright, or trademark, or as a defense against liability for such infringement.