Embed Size (px)
Citation preview

Cognitive and metacognitive activity in mathematicalproblem solving: prefrontal and parietal patterns
John R. Anderson & Shawn Betts & Jennifer L. Ferris &
Jon M. Fincham
Published online: 20 November 2010# Psychonomic Society, Inc. 2010
Abstract Students were taught an algorithm for solving anew class of mathematical problems. Occasionally in thesequence of problems, they encountered exception prob-lems that required that they extend the algorithm. Regularand exception problems were associated with differentpatterns of brain activation. Some regions showed aCognitive pattern of being active only until the problemwas solved and no difference between regular or exceptionproblems. Other regions showed a Metacognitive pattern ofgreater activity for exception problems and activity thatextended into the post-solution period, particularly when anerror was made. The Cognitive regions included some ofparietal and prefrontal regions associated with the triple-code theory of (Dehaene, S., Piazza, M., Pinel, P., &Cohen, L. (2003). Three parietal circuits for numberprocessing. Cognitive Neuropsychology, 20, 487–506) andassociated with algebra equation solving in the ACT-Rtheory (Anderson, J. R. (2005). Human symbol manipu-lation within an 911 integrated cognitive architecture.Cognitive science, 29, 313–342. Metacognitive regionsincluded the superior prefrontal gyrus, the angular gyrusof the triple-code theory, and frontopolar regions.
Keywords Metacognition . Problem solving . Prefrontalcortex . Numerical cognition . Parietal cortex
This research is concerned with identifying brain regions thatare engaged when students have to deploy their mathematicalknowledge in non-routine versus routine ways. Our goal is toacquire information that will guide development of a model ofmetacognitive activity in mathematical problem solving. We
will both examine predefined brain regions (see Fig. 1) thatpast theory has related to routine mathematical tasks andidentify additional regions that are engaged by the non-routine tasks in this research.
Considerable research has studied the neural basis of whatmight be characterized as routine use of mathematicalknowledge. The greatest amount of research has gone intounderstanding the role of various parietal regions in arithmetictasks (e.g., Castelli, Glaser, & Butterworth, 2006; Eger,Sterzer, Russ, Giraud, & Kleinschmidt, 2003; Isaacs,Edmonds, Lucas, & Gadian, 2001; Molko et al., 2003;Naccache & Dehaene, 2001; Piazza, Izard, Pinel, Le Bihan,& Dehaene, 2004; Pinel, Piazza, Le Bihan, & Dehaene,2004). The triple-code theory (e.g., Dehaene & Cohen, 1997)proposes that basic numerical knowledge is distributed overthree brain regions that code for different aspects of numberknowledge: the horizontal intraparietal sulcus (HIPS) thatprocesses numerical quantities, a left perisylvian languagenetwork that is involved in the verbal processing of numbers,and a ventral occipital-parietal region that processes visualrepresentations of digits. In related work, Dehaene et al.(2003) identified three parietal regions that will be of interestto us. In addition to HIPS, there is the angular gyrus (ANG)that is part of the perisylvian language network, and theposterior superior parietal lobule (PSPL, not part of theoriginal triple-code theory) that supports attentional orienta-tion on the mental number line and other spatial processing.
The prefrontal cortex is also involved in mathematicalperformance. Broca’s area is part of the perisylvianlanguage network identified in the triple-code theory. Thereis a region of the lateral inferior prefrontal cortex (LIPFC)that is particularly involved in more advanced tasksinvolving topics like algebra, geometry, or calculus (e.g.,Krueger et al., 2008; Qin, Anderson, Silk, Stenger, &Carter, 2004; Ravizza, Anderson, & Carter, 2008; Sohn,Goode, Koedinger, Stenger, Carter, & Anderson, 2004). Italso appears to play a key role in retrieval of arithmetic
J. R. Anderson (*) : S. Betts : J. L. Ferris : J. M. FinchamDepartment of Psychology, Carnegie Mellon University,Pittsburgh, PA 15213, USAe-mail: [email protected]
Cogn Affect Behav Neurosci (2011) 11:52–67DOI 10.3758/s13415-010-0011-0
facts and semantic facts (Danker & Anderson, 2007;Menon, Rivera, White, Glover, & Reiss, 2000).
We have developed ACT-R theory (Anderson, Bothell,Byrne, Douglass, Lebiere, & Qin, 2004; Anderson, 2007)of equation solving (Anderson, 2005; Ravizza et al., 2008)and mental multiplication (Rosenberg-Lee, Lovett, &Anderson, 2009). These models particularly emphasize thecontribution of the LIPFC and a region of the posteriorparietal cortex (PPC), which is about 2 cm away from eachof the three parietal regions (HIPS, PSPL, and ANG)identified by Dehaene et al. (2003). This region is activatedwhen mental representations are being manipulated (e.g.,Carpenter, Just, Keller, Eddy, & Thulborn, 1999; Zacks,Ollinger, Sheridan, & Tversky, 2002). In a variety ofexperiments studying tasks like algebra equation solvingand geometry proof generation (see Anderson, 2007, for areview), activity in the PPC proves to be the best correlateof problem complexity, while activity in the LIPFC provesto be the best correlate of student proficiency. According tothe ACT-R theory, the connection between complexity andPPC holds because its activity reflects how much themental representation of the problem is manipulated in
solving it1. The connection between proficiency and LIPFCholds because its activity reflects amount of declarativeretrieval, which decreases as students develop a proceduralmastery of a new algorithm and drop out the need forretrieval of tasks instructions.
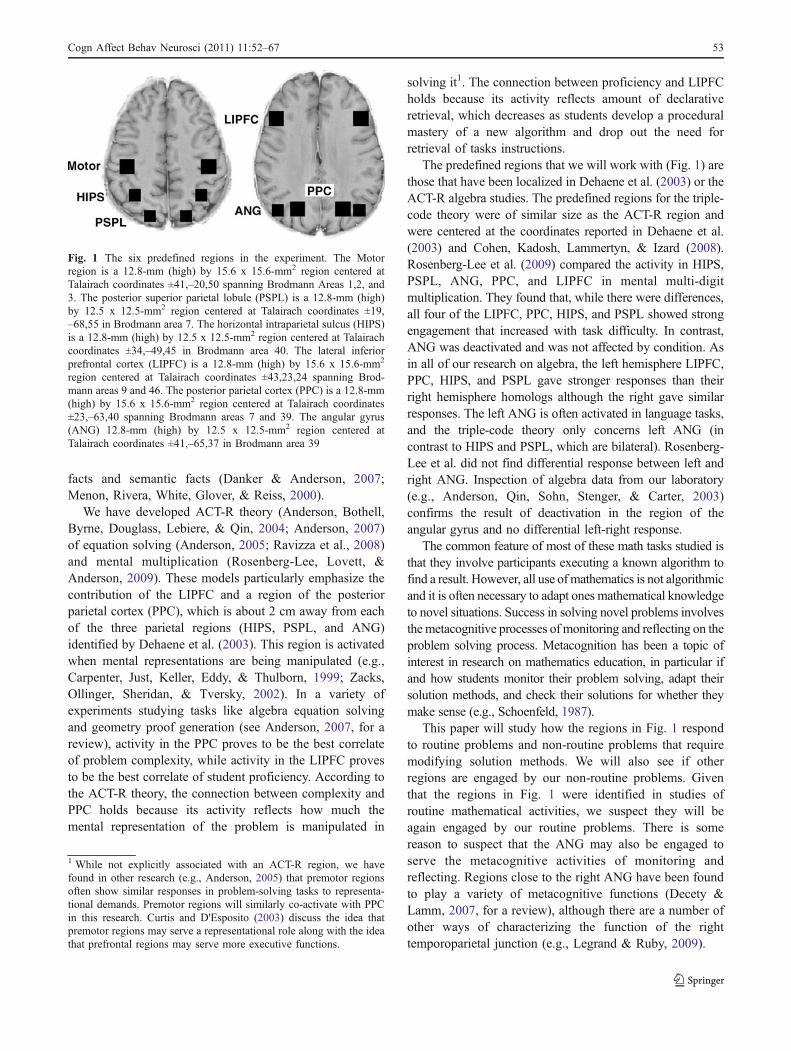
The predefined regions that we will work with (Fig. 1) arethose that have been localized in Dehaene et al. (2003) or theACT-R algebra studies. The predefined regions for the triple-code theory were of similar size as the ACT-R region andwere centered at the coordinates reported in Dehaene et al.(2003) and Cohen, Kadosh, Lammertyn, & Izard (2008).Rosenberg-Lee et al. (2009) compared the activity in HIPS,PSPL, ANG, PPC, and LIPFC in mental multi-digitmultiplication. They found that, while there were differences,all four of the LIPFC, PPC, HIPS, and PSPL showed strongengagement that increased with task difficulty. In contrast,ANG was deactivated and was not affected by condition. Asin all of our research on algebra, the left hemisphere LIPFC,PPC, HIPS, and PSPL gave stronger responses than theirright hemisphere homologs although the right gave similarresponses. The left ANG is often activated in language tasks,and the triple-code theory only concerns left ANG (incontrast to HIPS and PSPL, which are bilateral). Rosenberg-Lee et al. did not find differential response between left andright ANG. Inspection of algebra data from our laboratory(e.g., Anderson, Qin, Sohn, Stenger, & Carter, 2003)confirms the result of deactivation in the region of theangular gyrus and no differential left-right response.
The common feature of most of these math tasks studied isthat they involve participants executing a known algorithm tofind a result. However, all use ofmathematics is not algorithmicand it is often necessary to adapt ones mathematical knowledgeto novel situations. Success in solving novel problems involvesthe metacognitive processes of monitoring and reflecting on theproblem solving process. Metacognition has been a topic ofinterest in research on mathematics education, in particular ifand how students monitor their problem solving, adapt theirsolution methods, and check their solutions for whether theymake sense (e.g., Schoenfeld, 1987).
This paper will study how the regions in Fig. 1 respondto routine problems and non-routine problems that requiremodifying solution methods. We will also see if otherregions are engaged by our non-routine problems. Giventhat the regions in Fig. 1 were identified in studies ofroutine mathematical activities, we suspect they will beagain engaged by our routine problems. There is somereason to suspect that the ANG may also be engaged toserve the metacognitive activities of monitoring andreflecting. Regions close to the right ANG have been foundto play a variety of metacognitive functions (Decety &Lamm, 2007, for a review), although there are a number ofother ways of characterizing the function of the righttemporoparietal junction (e.g., Legrand & Ruby, 2009).
1 While not explicitly associated with an ACT-R region, we havefound in other research (e.g., Anderson, 2005) that premotor regionsoften show similar responses in problem-solving tasks to representa-tional demands. Premotor regions will similarly co-activate with PPCin this research. Curtis and D'Esposito (2003) discuss the idea thatpremotor regions may serve a representational role along with the ideathat prefrontal regions may serve more executive functions.
Fig. 1 The six predefined regions in the experiment. The Motorregion is a 12.8-mm (high) by 15.6 x 15.6-mm2 region centered atTalairach coordinates ±41,–20,50 spanning Brodmann Areas 1,2, and3. The posterior superior parietal lobule (PSPL) is a 12.8-mm (high)by 12.5 x 12.5-mm2 region centered at Talairach coordinates ±19,–68,55 in Brodmann area 7. The horizontal intraparietal sulcus (HIPS)is a 12.8-mm (high) by 12.5 x 12.5-mm2 region centered at Talairachcoordinates ±34,–49,45 in Brodmann area 40. The lateral inferiorprefrontal cortex (LIPFC) is a 12.8-mm (high) by 15.6 x 15.6-mm2
region centered at Talairach coordinates ±43,23,24 spanning Brod-mann areas 9 and 46. The posterior parietal cortex (PPC) is a 12.8-mm(high) by 15.6 x 15.6-mm2 region centered at Talairach coordinates±23,–63,40 spanning Brodmann areas 7 and 39. The angular gyrus(ANG) 12.8-mm (high) by 12.5 x 12.5-mm2 region centered atTalairach coordinates ±41,–65,37 in Brodmann area 39
Cogn Affect Behav Neurosci (2011) 11:52–67 53

Another region that is potentially involved in metacog-nitive function is Brodmann Area 10 or frontopolar cortex(FPC), particularly its lateral portion (Christoff & Gabrieli,2000: Fletcher & Henson, 2001). A number of converginglines of research suggest that this region of the brain may becritical in the ability to extend knowledge. Ramnani andOwen (2004) stress that this region is unique in beingexclusively connected only with supramodal regions of thecortex. They suggest that this region is involved in theintegration of information from multiple regions. There arenumerous other theories of the role of this region, all ofwhich have elements of metacognition, such as monitoringof memory retrieval (e.g., Buckner, 2003; Rugg, Henson, &Robb, 2003), branching (Koechlin & Hyafil, 2007), shiftingbetween external and internal processes (Burgess, Gilbert,Okuda, & Simons, 2006), relational integration (Christoff etal., 2001), and after-task processing in memory experiments(e.g., Johnson, Raye, Mitchell, Greene, Cunningham, &Sanislow, 2005; Raye, Johnson, Mitchell, Greene, &Johnson, 2007; Reynolds, McDermott, & Braver, 2006).
In an effort to contrast cognitive and metacognitiveprocesses in mathematics, we developed pyramid problems.Table 1 reproduces the instruction provided to participantsfor solving these problems. These problems require onlymiddle-school mathematics to solve. As students work withpyramid problems they quickly master the algorithm forsolving these problems. Nonetheless, students can still beplaced in situations that require they extend this knowledgeand most students can do so with at least some success.
Anderson (2007) reported an initial behavioral studywith these problems. Students had little difficulty solvingregular versions of these problems in the three forms:
8$4 x (solve-for-value)7$x 18 (solve-for-height)x$4 22 (solve-for-base)
Students initially solve both solve-for-value and solve-for-height problems by performing repeated addition. In thesolve-for-value case, students keep adding until the numberof additions equals the height while in the solve-for-heightcase they keep adding until the sum equals the value. Thesolve-for-base problems cannot be dealt with so simplybecause there is no base to start the addition. Most studentsstart by using a guess-and-check strategy, guessing a base,checking that, and guessing again if necessary. Their initialguesses are close (for instance, 6 for x$4 = 22) and theysensibly adjust wrong guesses (e.g., since 6 produces toosmall an answer for x$4 = 22, they try 7, which they oftendo not even test but just assume will be correct).
The experiment to be reported here contrasts studentssolving regular problems like the above with exceptionproblems. Regular problems are characterized by involvingonly small positive integer values for base and height with asingle unknown. Exception problems involve going outsidethese constraints. There are a substantial variety ofexception problems and each requires the student to thinkabout how to extend their understanding of pyramidproblems. We use four types of exception problems:problems involving fractions for bases, problems involvingnegative numbers for bases or heights, problems involvinglarge numbers for bases or heights, and problemsinvolving a repetition of the variable as in x$x = 15.
We collected verbal protocols from pilot students solvingthese problems. The following verbal protocol of one studentsolving 6$5 illustrates the solution of a regular problem:
“Six plus four plus three plus two – four, fifteen,three, eighteen plus two is 20”
That is, the student basically gives a partial record of hiscalculations. The student said nothing further upon receiv-ing confirmatory feedback and just went on to the nextproblem. In contrast, consider the protocol of the samestudent as he successfully solved –9$4:
“So wait it's one less so it's minus ten…minus nineplus minus ten plus minus eleven is three and thennegative… minus 42”
In this case, in addition to the record of calculationsthere is an initial recognition of difficulty. Also aftersolving the problem the student continues to think about iteven though he got it right:
“You need to explain the rule”
Consider another student on the X$4 = X which hesolved incorrectly entering –2 rather than 2:
“different… Oh, that’s interesting…x, 3x +6” andafter the feedback:
“no, oh 2, 2, 2! Shit!”
Table 1 Instructions given to participants on pyramid problems
There is a notation for writing repeated addition where each termadded is one less than the previous:
For instance is written as 4 + 3 + 2 = 4$3
Since 4 + 3 + 2 = 9 we would evaluate 4$3 as 9 and write 4$3 = 9.The parts of 4 $ 3 are given names:
4 is the base and reflects the number you start with
3 is the height and reflects the total number of items you add,including the base
4 $ 3 is called a pyramid
You will see a variety of problems in which you will need to solve forthe variable. Here are three examples:
4$3 = x you are to type "9" the answer
x$3 = 9 you are to type "4" the base
4$x = 9 you are to type "3" the height
54 Cogn Affect Behav Neurosci (2011) 11:52–67
Two metacognitive features show up in the protocols forexception problems, both of which are intuitively reason-able—an early recognition that this was a different kind ofproblem and various assessment remarks after the solution.We expected that these exception problems would engagebrain regions in addition to those engaged for regularproblems and that this engagement would extend after theproblem was solved. This research will contrast regionsengaged during execution of a routine procedure withregions engaged when the problem involved rethinking theexisting procedure. We will call these Cognitive andMetacognitive regions. The Cognitive regions might besomewhat more active in solving exception problems thanroutine problems because exception problems tend toinvolve somewhat more complex computations, but theiractivity should drop after solving the problem. In contrast,Metacognitive regions should show much greater activationfor exception problems and maintain that activation intoafter-task reflection. Less than 15% of all problems wereexceptions and they were quite varied so that they wouldcontinue to engage metacognitive activities throughout theexperiment.
Our research will contrast regions that reflect a Cogni-tive or a Metacognitive pattern of activity. As Fig. 2illustrates, participants are given feedback after theirresponse and time to consider this feedback. Letting“Before” denote activity before the answer is generatedand “After” the activity after the answer is generated (so,for instance, Before-Regular denotes activity for regularproblems before the answer is generated) we expect one ofthe following two orderings of the conditions:
Cognitive pattern Before-Regular > After-Exception –Cognitive regions should cease engagement upon solu-tion of a problem and, even if Exception problemsinvolve somewhat more computation, there should berelatively little activation after the solution of theproblem.
Metacognitive pattern After-Exception > Before-Regular –Exception problems should evoke reflection after as well asduring the solution of the problem. In contrast, regularproblems should involve little reflection at any point.
Thus, the contrast between After-Exception and Before-Regular offers a simple diagnostic of whether a region isCognitive or Metacognitive. We will restrict this contrast tocorrectly solved problems to avoid any complications thaterror processing might add to the analysis, but we will alsolook at activity on error trials.
Methods
Participants Twenty right-handed participants (eight fe-male and 12 male, 18–31 years of age, mean = 23.8) wererecruited from subject population at Carnegie MellonUniversity. Each participant took part in one fMRI scanthat lasted approximately 90 min.
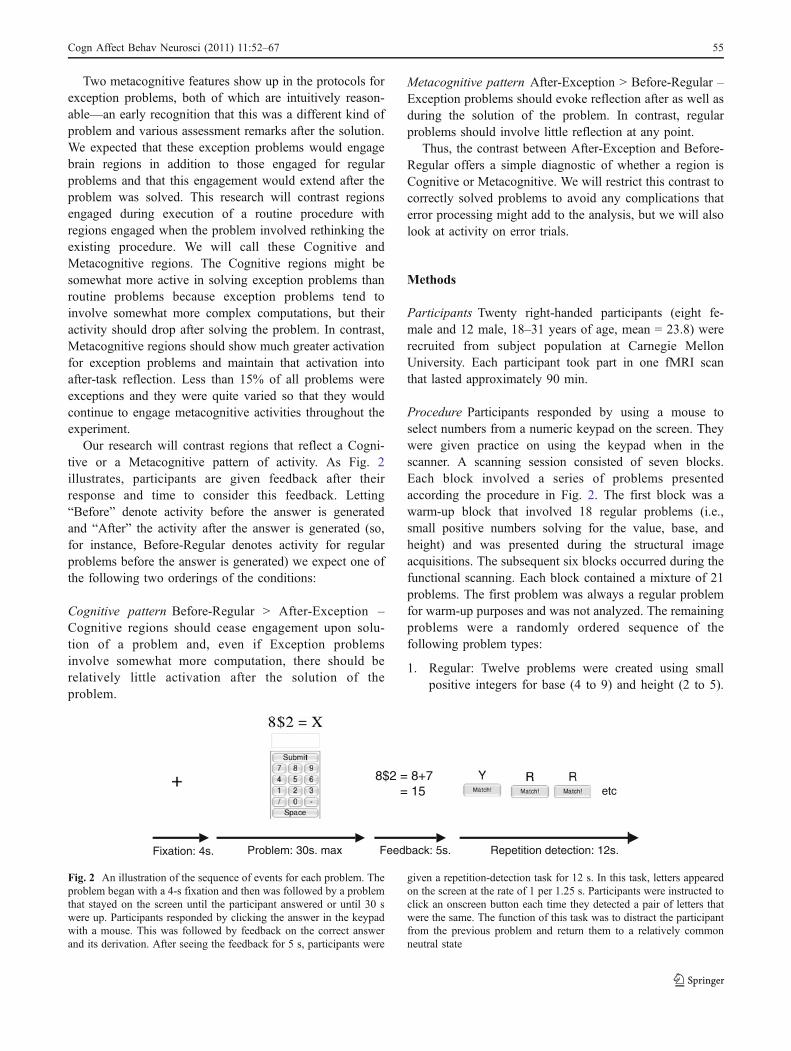
Procedure Participants responded by using a mouse toselect numbers from a numeric keypad on the screen. Theywere given practice on using the keypad when in thescanner. A scanning session consisted of seven blocks.Each block involved a series of problems presentedaccording the procedure in Fig. 2. The first block was awarm-up block that involved 18 regular problems (i.e.,small positive numbers solving for the value, base, andheight) and was presented during the structural imageacquisitions. The subsequent six blocks occurred during thefunctional scanning. Each block contained a mixture of 21problems. The first problem was always a regular problemfor warm-up purposes and was not analyzed. The remainingproblems were a randomly ordered sequence of thefollowing problem types:
1. Regular: Twelve problems were created using smallpositive integers for base (4 to 9) and height (2 to 5).
etc
Fixation: 4s. Problem: 30s. max Feedback: 5s. Repetition detection: 12s.
8$2 = 8+7 = 15
Fig. 2 An illustration of the sequence of events for each problem. Theproblem began with a 4-s fixation and then was followed by a problemthat stayed on the screen until the participant answered or until 30 swere up. Participants responded by clicking the answer in the keypadwith a mouse. This was followed by feedback on the correct answerand its derivation. After seeing the feedback for 5 s, participants were
given a repetition-detection task for 12 s. In this task, letters appearedon the screen at the rate of 1 per 1.25 s. Participants were instructed toclick an onscreen button each time they detected a pair of letters thatwere the same. The function of this task was to distract the participantfrom the previous problem and return them to a relatively commonneutral state
Cogn Affect Behav Neurosci (2011) 11:52–67 55

These consisted of four problems each that requiredsolving for base, solving for height, and solving forvalue.
2. Exception: Four problems consisted of one each of thefollowing:
(a) A problem with a large base (in the hundreds) orlarge exponent (in the teens or twenties) (e.g., 151$2 = X or 8$21 = X),
(b) A problem with a fractional base (e.g., 5½$4 = X),(c) A problem with a negative bases or height (e.g., –9
$3 = X, 9$–3 = X),(d) A problem with a repetition of X in two positions
(e.g., X$4 = X, X$X = 21).(e) Over the course of the six blocks, two problems in
categories (a) – (c) would involve solving for base,solving for height, and solving for value. Forcategory (d), the variable appeared twice each pairof positions. These subcategories within the fourexception categories were randomly ordered overthe blocks.
3. Font: To have regular problems that would besurprising like exception problems but not pose acognitive challenge we created four very odd fontsand presented regular problems in these fonts and withdifferent colors other than the normal black. Over thecourse of the experiment, each font-color choicewould be tested twice solving for base, height, andvalue. These problems proved indistinguishable fromregular problems in their behavioral and imagingprofiles in the predefined regions (Fig. 1) and werecollapsed with regular problems in all reportedanalyses.
fMRI analysis Images were acquired using gradient echo-echo planar image (EPI) acquisition on a Siemens 3 TAllegra Scanner using a standard RF head coil (quadraturebirdcage), with 2-s repetition time (TR), 30-ms echo time(TE), 70° flip angle, and 20-cm field of view (FOV). Theexperiment acquired 34 axial slices on each TR using a 3.2-mm-thick, 64 × 64 matrix. This produces voxels 3.2 mmhigh and 3.125 × 3.125 mm2. The anterior commissure-posterior commissure (AC-PC) line was on the 11th slicefrom the bottom scan slice. Acquired images were analyzedusing the NIS system. Functional images were motion-corrected using six-parameter 3D registration (AIR; Woods,Grafton, Holmes, Cherry, & Mazziotta, 1998). All imageswere then co-registered to a common reference structuralMRI by means of a 12-parameter 3D registration andsmoothed with a 6-mm full-width-half-maximum 3DGaussian filter to accommodate individual differences inanatomy.
All of our analysis will be on percent change in theBOLD response from the first scan of the 4-s fixationperiod. To test the predictions outlined in the introduction,we extracted an estimate of the engagement of these regionsbefore and after the response. To separate these twoestimates from any activity that occurred during the actualresponse generation, we used three regressors—one for thevariable period up to 2 s before response completion, onefor the 2 s up to response completion, and one for the 8 safter response completion. These regressors were created bytaking boxcar functions for the three periods and convolv-ing them with a hemodynamic response function. We usedthe standard hemodynamic function in the ACT-R model(Anderson, Carter, Fincham, Ravizza, & Rosenberg-Lee,2008), a gamma function with an index parameter of sixand a scale parameter of 0.75 s2. Three such regressorswere entered into a design matrix (Friston, 2006) for eachof five conditions (regular versus exception crossed withcorrect versus error, plus a fifth condition to deal with caseswhere participants times out and never generated aresponse). Finally, a set of regressors for a quadraticfunction was added for each block to extract any generaltrends. Ignoring the time outs and block trends, this yielded12 beta weights for each participant—the four conditionscrossed with the three intervals. Analyses (random-effectsmodel at the group level of analysis) will focus on the betaweights for the variable period before the response and the8-s period after the response. We refer to these beta weightsas estimates of engagement for that region.
We performed three analyses on the imaging data:
1. Predefined Regions: The first analysis focused on the sixregions in Fig. 1: HIPS, PSPL, and ANG from the triple-code theory and a Motor region controlling the hands,LIPFC, and PPC from the ACT-R theory. The ACT-Rregions have been used many times (for a review seeAnderson, 2007). The locations of triple-code regionsare from Dehaene et al. (2003) and were first used in ourresearch in Rosenberg-Lee et al. (2009). However, weupdated the coordinates of the HIPS region to reflect thelarger meta analysis in on Cohen et al. (2008)
2. 408 Regions Exploratory: This analysis used 408regions that we have used in a multivariate patternrecognition study (e.g., Anderson, Betts, Ferris, &Fincham, 2010). These regions were created by evenlydistributing 4 x 4 x 4 voxel cubes (a voxel is 3.2 mmhigh by 3.125 mm long and wide) over the 34 slices ofthe 64 x 64 acquisition matrix. Between region spacingwas 1 voxel in the x- and y- directions in the axial
2 This produces a hemodynamic function that peaks at 4.5 s. Itcorrelates .971 with the standard SPM hemodynamic function(Friston, Fletcher, Josephs, Holmes, Rugg, Turner, 1998) but lacksthe small undershoot of that function.
56 Cogn Affect Behav Neurosci (2011) 11:52–67
plane, and one slice in the z-direction. We applied amask of the structural reference brain and excludedregions where less than 70% of the region’s original 64voxels survived.
3. Voxel-Level Exploratory: The other exploratoryanalyses will be at the individual voxel level. Theyinclude a contrast of Before-Exception and beforeBefore-Regular. This exploratory analysis looked forregions of at least 15 contiguous voxels that showeda voxel-wise significance of 0.00001 for the differ-ence between Before-Exception and Before-Regular.Using these values results in a brain-wide signifi-cance estimated to be less than 0.00001 by simula-tion (Cox, 1996; Cox & Hyde, 1997).
Results
Behavioral results Participants were correct on 90.3% ofthe regular problems but only 42.9% of the exceptionproblems, a highly significant difference (t(19) = 12.55, p <.0001). The error rate on exception problems rangedrelatively uniformly across participants from 17 to 79%.We excluded from further analysis the 4.9% of problemsthat resulted in errors due to timing out. Of the remainingproblems, correct regular averaged 9.77 s., correct excep-tions average 16.02 s., incorrect regulars average 12.75 s.,and incorrect exceptions averaged 19.02 s. These timesdisplay a main effect of problem type (F(1, 19) = 113.36,p < .0001) and correctness (F(1, 19) = 48.21, p < .0001)and no significant interaction F(1, 19) = .01).
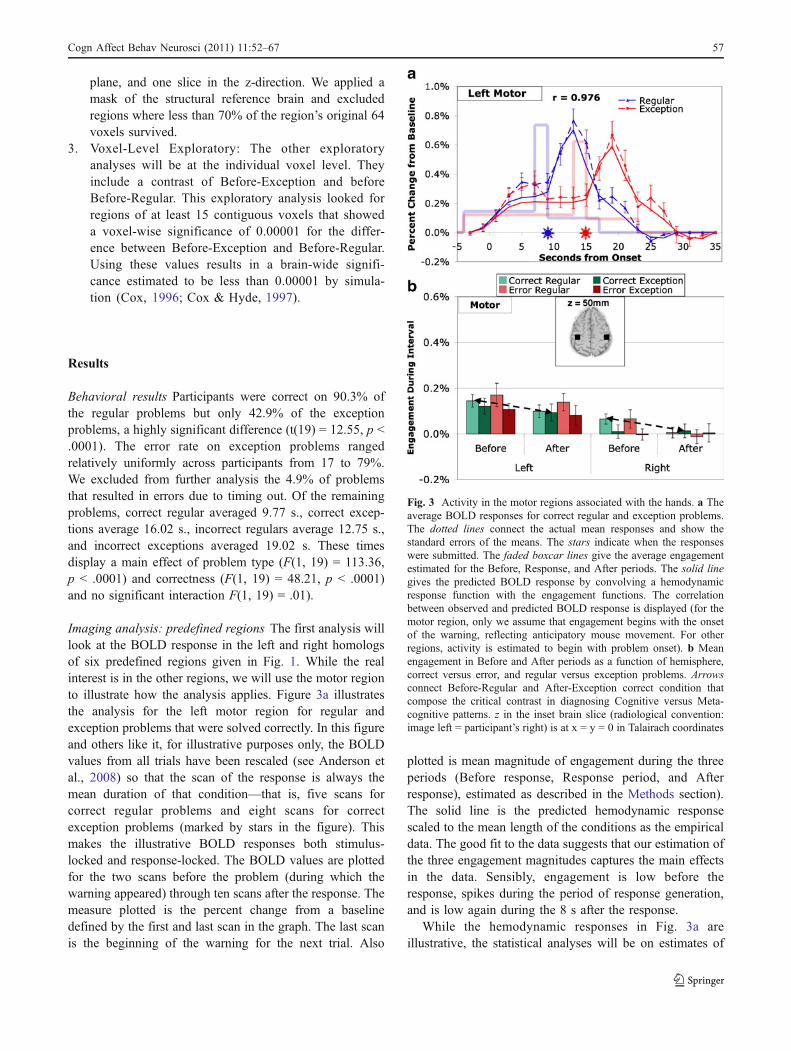
Imaging analysis: predefined regions The first analysis willlook at the BOLD response in the left and right homologsof six predefined regions given in Fig. 1. While the realinterest is in the other regions, we will use the motor regionto illustrate how the analysis applies. Figure 3a illustratesthe analysis for the left motor region for regular andexception problems that were solved correctly. In this figureand others like it, for illustrative purposes only, the BOLDvalues from all trials have been rescaled (see Anderson etal., 2008) so that the scan of the response is always themean duration of that condition—that is, five scans forcorrect regular problems and eight scans for correctexception problems (marked by stars in the figure). Thismakes the illustrative BOLD responses both stimulus-locked and response-locked. The BOLD values are plottedfor the two scans before the problem (during which thewarning appeared) through ten scans after the response. Themeasure plotted is the percent change from a baselinedefined by the first and last scan in the graph. The last scanis the beginning of the warning for the next trial. Also
plotted is mean magnitude of engagement during the threeperiods (Before response, Response period, and Afterresponse), estimated as described in the Methods section).The solid line is the predicted hemodynamic responsescaled to the mean length of the conditions as the empiricaldata. The good fit to the data suggests that our estimation ofthe three engagement magnitudes captures the main effectsin the data. Sensibly, engagement is low before theresponse, spikes during the period of response generation,and is low again during the 8 s after the response.
While the hemodynamic responses in Fig. 3a areillustrative, the statistical analyses will be on estimates of
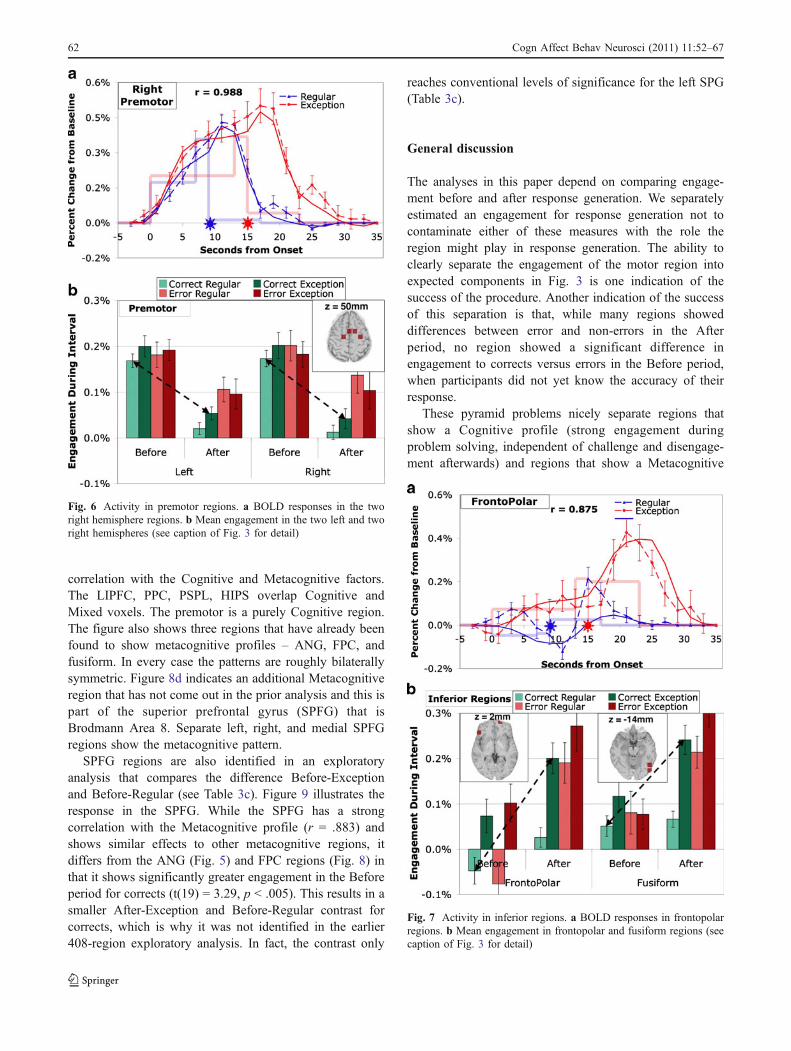
Fig. 3 Activity in the motor regions associated with the hands. a Theaverage BOLD responses for correct regular and exception problems.The dotted lines connect the actual mean responses and show thestandard errors of the means. The stars indicate when the responseswere submitted. The faded boxcar lines give the average engagementestimated for the Before, Response, and After periods. The solid linegives the predicted BOLD response by convolving a hemodynamicresponse function with the engagement functions. The correlationbetween observed and predicted BOLD response is displayed (for themotor region, only we assume that engagement begins with the onsetof the warning, reflecting anticipatory mouse movement. For otherregions, activity is estimated to begin with problem onset). b Meanengagement in Before and After periods as a function of hemisphere,correct versus error, and regular versus exception problems. Arrowsconnect Before-Regular and After-Exception correct condition thatcompose the critical contrast in diagnosing Cognitive versus Meta-cognitive patterns. z in the inset brain slice (radiological convention:image left = participant’s right) is at x = y = 0 in Talairach coordinates
Cogn Affect Behav Neurosci (2011) 11:52–67 57

engagement during the Before and After intervals (ignoringthe Response engagement for the 2 s before the responsewas completed). Figure 3b illustrates the mean engage-ments, averaged over participants, both for left and rightmotor regions and for both correct and incorrect answers.For this and subsequent regions we performed a 2 x 2 x 2 x2 analysis of variance (see Table 2) where the factors wereHemisphere (left versus right), Accuracy (correct versuserror), Type (regular versus exception), and Period(Before versus After). The analysis in the case of themotor region produced only one strongly significanteffect – that of hemisphere (F(1,19) = 22.10, p <.0005). Not surprisingly, since the responding hand is theright, the right motor region shows little activity. While theBefore and After engagement in the left hemisphere issignificantly greater than in the right, it is small relative tothe left’s engagement during the Response period (seeFig. 3a).
The results in Fig. 3 can be viewed as a sanity check onthe analysis, as there is no reason to expect any effects offactors other than hemisphere for the motor region and astrong reason to expect a larger effect in the left hemispherethat would spike during the response interval. The relativelysmall Before engagement probably reflects mouse move-ments, perhaps in anticipation of response generation. Also,the relatively small After engagement probably reflectsmouse movements, perhaps in anticipation of the repetitiondetection task.
The results of complete statistical analyses for the sixpredefined regions are in Table 2a. The results for the otherregions are quite different from the motor region. Noneshows significant effects of hemisphere. In contrast, theyshow significant or near significant effects of correctness(errors greater than corrects), type (exception greater thanregular), and (except for ANG) of period (Before greaterthan After). They all show a significant period-by-correctness interaction such that the greater response toerrors only occurs after the response has been made.Table 2a also reports the results of a two-tailed t-test ofthe difference between After-Exception and Before-Regular, which is the critical test identified in theintroduction for distinguishing Cognitive and Metacogni-tive regions. The PPC, the LIPFC, the PSPL, and the HIPSshow significant effects) in the Cognitive direction ofBefore-Regular being greater than After-Exception. Incontrast, ANG shows a strong effect in the oppositedirection (p < .005).
The PPC, LIPFC, PSPL, and HIPS all show the samedirection of effects and are strongly intercorrelated (meancorrelation of the eight Before and After engagement values(averaging over left and right) is .933, with a range from.841 to .981) while they are much more weakly correlatedwith ANG (mean .423, range from .185 to .591). Figure 4
illustrates the BOLD values for the left LIPFC, which isquite representative of the intercorrelated four regions, andFig. 5 illustrates the pattern in right ANG, which isdifferent. The LIPFC (Fig. 4) shows strong engagementduring the problem solving and low engagement after-wards. The mean .04% engagement after successfulsolution of regular problems is only marginally differentfrom 0 (t(19) = 2.01, p < .1). While there is a differencebetween exception and regular problems, it is relativelysmall.
The results for ANG (Fig. 5) are quite different from theLIPFC. For corrects (Fig. 5a) the Before engagement is notsignificantly different than the After engagement. Thedifference between exceptions and regulars is quite largeand results in a highly significant difference betweenBefore-Regular and After-Exception, but in the oppositedirection of the other regions. The magnitude of the leftengagement is marginally larger (p < .1) than in right buthemisphere is involved in no interactions3. The left ANG isoften distinguished from the right in many theoriesincluding the triple code, but the pattern of ANG effectsin this experiment is basically the same in the twohemispheres.
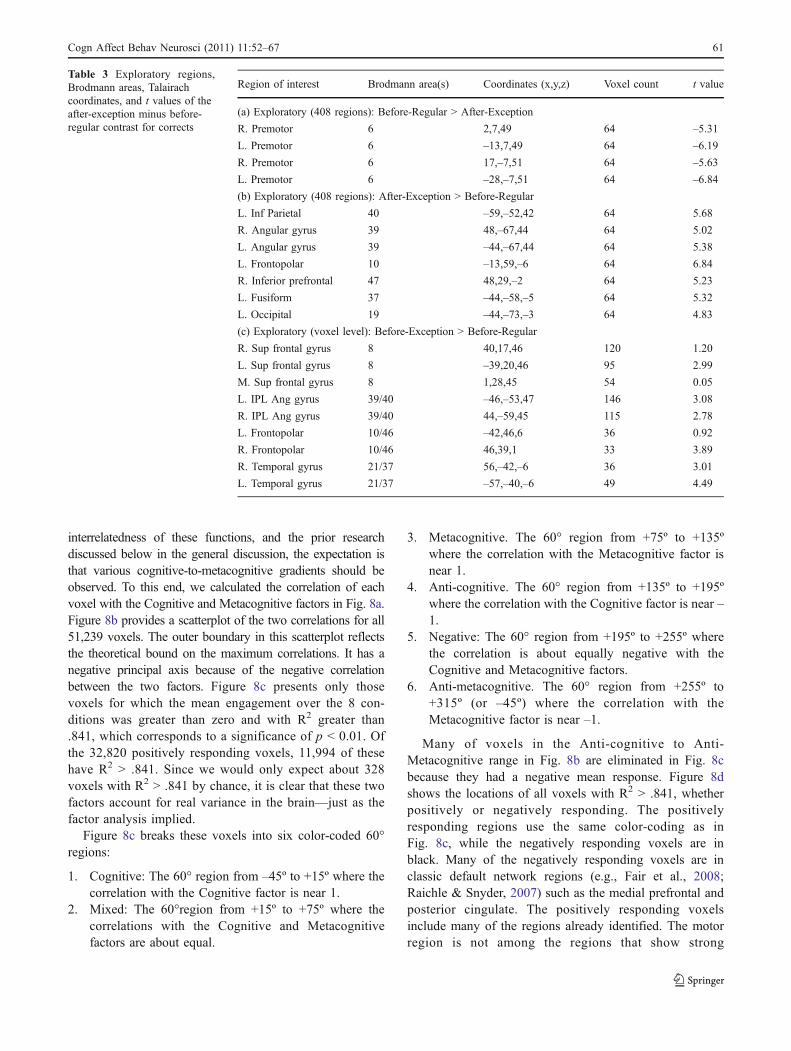
Imaging analysis: exploratory analysis with 408 regions TheANG is the only predefined region to display theMetacognitive Pattern defined in the introduction. To findfurther Metacognitive (or Cognitive) regions we performedan exploratory analysis using 408 regions that cover theentire brain as described in the Methods section. For eachof the 408 regions we calculated the difference between thecritical conditions of Before-Regular and After-Exceptionfor the correct data. Using the Bonferroni correction formultiple comparisons, a t of ±4.81 is required forsignificance. Eleven regions exceeded this threshold (seeTable 3). Four of these regions were located in the bilateralpremotor areas and showed significantly greater activationfor the Before period for regular problems than the Afterperiod for exception problems and they all give very similarpatterns of engagement. Three parietal regions, the last twoof which overlap with the predefined left and right ANG,show patterns of engagement similar to Fig. 5. Two regionsin the frontopolar cortex (FPC) and two visual regions alsoshow greater engagement for After-Exceptions than Before-Regulars. One of the visual regions is the left fusiform andthe other is an occipital region just posterior to the fusiform.These visual areas overlap substantially with the region inthe triple-code theory of Dehaene and Cohen that processesvisual representations of digits. Having already examinedthe ANG, we will report the effects for the premotor
3 Given that the triple-code model predicts this difference, one mightuse a 1-tailed test in which case the difference would be significant.
58 Cogn Affect Behav Neurosci (2011) 11:52–67
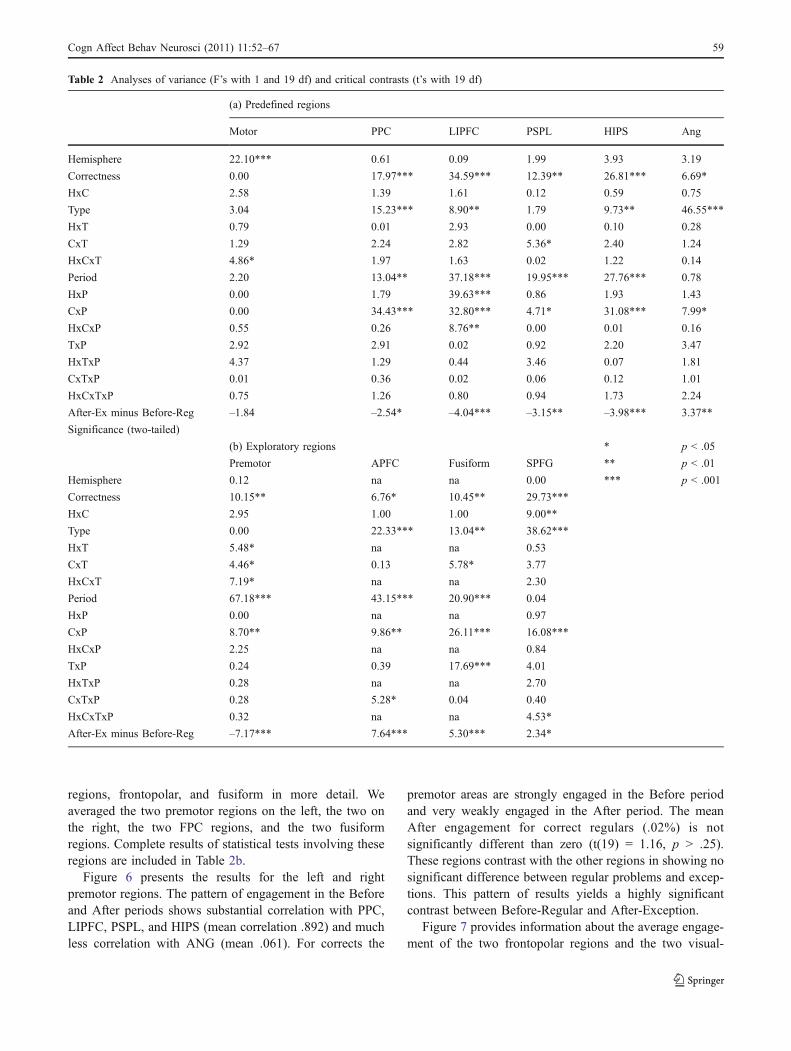
regions, frontopolar, and fusiform in more detail. Weaveraged the two premotor regions on the left, the two onthe right, the two FPC regions, and the two fusiformregions. Complete results of statistical tests involving theseregions are included in Table 2b.
Figure 6 presents the results for the left and rightpremotor regions. The pattern of engagement in the Beforeand After periods shows substantial correlation with PPC,LIPFC, PSPL, and HIPS (mean correlation .892) and muchless correlation with ANG (mean .061). For corrects the
premotor areas are strongly engaged in the Before periodand very weakly engaged in the After period. The meanAfter engagement for correct regulars (.02%) is notsignificantly different than zero (t(19) = 1.16, p > .25).These regions contrast with the other regions in showing nosignificant difference between regular problems and excep-tions. This pattern of results yields a highly significantcontrast between Before-Regular and After-Exception.
Figure 7 provides information about the average engage-ment of the two frontopolar regions and the two visual-
Table 2 Analyses of variance (F’s with 1 and 19 df) and critical contrasts (t’s with 19 df)
(a) Predefined regions
Motor PPC LIPFC PSPL HIPS Ang
Hemisphere 22.10*** 0.61 0.09 1.99 3.93 3.19
Correctness 0.00 17.97*** 34.59*** 12.39** 26.81*** 6.69*
HxC 2.58 1.39 1.61 0.12 0.59 0.75
Type 3.04 15.23*** 8.90** 1.79 9.73** 46.55***
HxT 0.79 0.01 2.93 0.00 0.10 0.28
CxT 1.29 2.24 2.82 5.36* 2.40 1.24
HxCxT 4.86* 1.97 1.63 0.02 1.22 0.14
Period 2.20 13.04** 37.18*** 19.95*** 27.76*** 0.78
HxP 0.00 1.79 39.63*** 0.86 1.93 1.43
CxP 0.00 34.43*** 32.80*** 4.71* 31.08*** 7.99*
HxCxP 0.55 0.26 8.76** 0.00 0.01 0.16
TxP 2.92 2.91 0.02 0.92 2.20 3.47
HxTxP 4.37 1.29 0.44 3.46 0.07 1.81
CxTxP 0.01 0.36 0.02 0.06 0.12 1.01
HxCxTxP 0.75 1.26 0.80 0.94 1.73 2.24
After-Ex minus Before-Reg –1.84 –2.54* –4.04*** –3.15** –3.98*** 3.37**
Significance (two-tailed)
(b) Exploratory regions * p < .05
Premotor APFC Fusiform SPFG ** p < .01
Hemisphere 0.12 na na 0.00 *** p < .001
Correctness 10.15** 6.76* 10.45** 29.73***
HxC 2.95 1.00 1.00 9.00**
Type 0.00 22.33*** 13.04** 38.62***
HxT 5.48* na na 0.53
CxT 4.46* 0.13 5.78* 3.77
HxCxT 7.19* na na 2.30
Period 67.18*** 43.15*** 20.90*** 0.04
HxP 0.00 na na 0.97
CxP 8.70** 9.86** 26.11*** 16.08***
HxCxP 2.25 na na 0.84
TxP 0.24 0.39 17.69*** 4.01
HxTxP 0.28 na na 2.70
CxTxP 0.28 5.28* 0.04 0.40
HxCxTxP 0.32 na na 4.53*
After-Ex minus Before-Reg –7.17*** 7.64*** 5.30*** 2.34*
Cogn Affect Behav Neurosci (2011) 11:52–67 59

fusiform regions, which give somewhat similar effects. Themean engagement in the fusiform correlates .907 with thefrontopolar engagement. Their mean correlation with ANGis .742 while their mean correlation with the other non-motor predefined regions is just –.101. Both are moreengaged by errors, by exceptions, and in the After period,and show a strong interaction between correctness andperiod. Figure 7a illustrates the mean response of FPC forcorrects. This region actually shows a negative engagementin the Before period for regular problems which ismarginally significant (t(19) = –1.93, p < .10).
The exploratory regions in Figs. 6 and 7 provide a strikingcontrast. While there are small effects of errors in Fig. 6, themajority of variance among conditions is due to the greateractivity before than after the response. On the other hand, theregions in Fig. 7 show strong effects of error and problemtype and show more activation after the response. Todetermine how typical these regions might be of generalactivity in the 408 regions we performed a factor analysis ofthe 8 magnitudes of engagement (excluding the magnitude forthe response scan between the Before and After periods) foreach of the 408 regions. Figure 8a shows, after a rotation toproduce the best illustration, the scores for the first two factors
(Factor 1 and Factor 2) that account for 72% of the variance.Factor 1 is much like the pattern in Fig. 6 for the premotorregions. The figure also shows a hypothetical CognitiveFactor that is simply +1 before the response and -1 after. Thecorrelation between Factor 1 and the Cognitive Factor is .974.Factor 2 shows a pattern somewhat like Fig. 7 for thefrontopolar and fusiform regions. Figure 8a also illustrates aMetacognitive Factor that is engaged by exceptions and byerrors in the After period. The Metacognitive factor adds theexception engagement to the error engagement for the lastcondition (After response to exception errors) in Fig. 8a. Thecorrelation between the Metacognitive factor and Factor 2 is.913. Unlike Factors 1 and 2, the Cognitive and Metacogni-tive factors are not perfectly orthogonal but show a negativecorrelation of –.378. Factor 2 may be the Metacognitive factordistorted under the constraint of extracting orthogonal factorsin the factor analysis.
Individual voxel analysis of the cognitive and metacognitivefactors While this final analysis is at the voxel level, the intentis to shed more light on the global organization of the brain inservice of both cognition and metacognition. Given the
Fig. 5 Activity in the angular gyrus whose left hemisphere isassociated with verbal processing of numbers in the triple-codetheory. a BOLD responses in right hemisphere. b Mean engagementin left and right hemispheres (see caption of Fig. 3 for detail)
Fig. 4 Activity in the lateral inferior prefrontal regions associatedwith controlled retrieval in the ACT-R theory. a BOLD responses inleft hemisphere. b Mean engagement in left and right hemispheres(see caption of Fig. 3 for detail)
60 Cogn Affect Behav Neurosci (2011) 11:52–67
interrelatedness of these functions, and the prior researchdiscussed below in the general discussion, the expectation isthat various cognitive-to-metacognitive gradients should beobserved. To this end, we calculated the correlation of eachvoxel with the Cognitive and Metacognitive factors in Fig. 8a.Figure 8b provides a scatterplot of the two correlations for all51,239 voxels. The outer boundary in this scatterplot reflectsthe theoretical bound on the maximum correlations. It has anegative principal axis because of the negative correlationbetween the two factors. Figure 8c presents only thosevoxels for which the mean engagement over the 8 con-ditions was greater than zero and with R2 greater than.841, which corresponds to a significance of p < 0.01. Ofthe 32,820 positively responding voxels, 11,994 of thesehave R2 > .841. Since we would only expect about 328voxels with R2 > .841 by chance, it is clear that these twofactors account for real variance in the brain—just as thefactor analysis implied.
Figure 8c breaks these voxels into six color-coded 60°regions:
1. Cognitive: The 60° region from –45º to +15º where thecorrelation with the Cognitive factor is near 1.
2. Mixed: The 60°region from +15º to +75º where thecorrelations with the Cognitive and Metacognitivefactors are about equal.
3. Metacognitive. The 60° region from +75º to +135ºwhere the correlation with the Metacognitive factor isnear 1.
4. Anti-cognitive. The 60° region from +135º to +195ºwhere the correlation with the Cognitive factor is near –1.
5. Negative: The 60° region from +195º to +255º wherethe correlation is about equally negative with theCognitive and Metacognitive factors.
6. Anti-metacognitive. The 60° region from +255º to+315º (or –45º) where the correlation with theMetacognitive factor is near –1.
Many of voxels in the Anti-cognitive to Anti-Metacognitive range in Fig. 8b are eliminated in Fig. 8cbecause they had a negative mean response. Figure 8dshows the locations of all voxels with R2 > .841, whetherpositively or negatively responding. The positivelyresponding regions use the same color-coding as inFig. 8c, while the negatively responding voxels are inblack. Many of the negatively responding voxels are inclassic default network regions (e.g., Fair et al., 2008;Raichle & Snyder, 2007) such as the medial prefrontal andposterior cingulate. The positively responding voxelsinclude many of the regions already identified. The motorregion is not among the regions that show strong
Region of interest Brodmann area(s) Coordinates (x,y,z) Voxel count t value
(a) Exploratory (408 regions): Before-Regular > After-Exception
R. Premotor 6 2,7,49 64 –5.31
L. Premotor 6 –13,7,49 64 –6.19
R. Premotor 6 17,–7,51 64 –5.63
L. Premotor 6 –28,–7,51 64 –6.84
(b) Exploratory (408 regions): After-Exception > Before-Regular
L. Inf Parietal 40 –59,–52,42 64 5.68
R. Angular gyrus 39 48,–67,44 64 5.02
L. Angular gyrus 39 –44,–67,44 64 5.38
L. Frontopolar 10 –13,59,–6 64 6.84
R. Inferior prefrontal 47 48,29,–2 64 5.23
L. Fusiform 37 –44,–58,–5 64 5.32
L. Occipital 19 –44,–73,–3 64 4.83
(c) Exploratory (voxel level): Before-Exception > Before-Regular
R. Sup frontal gyrus 8 40,17,46 120 1.20
L. Sup frontal gyrus 8 –39,20,46 95 2.99
M. Sup frontal gyrus 8 1,28,45 54 0.05
L. IPL Ang gyrus 39/40 –46,–53,47 146 3.08
R. IPL Ang gyrus 39/40 44,–59,45 115 2.78
L. Frontopolar 10/46 –42,46,6 36 0.92
R. Frontopolar 10/46 46,39,1 33 3.89
R. Temporal gyrus 21/37 56,–42,–6 36 3.01
L. Temporal gyrus 21/37 –57,–40,–6 49 4.49
Table 3 Exploratory regions,Brodmann areas, Talairachcoordinates, and t values of theafter-exception minus before-regular contrast for corrects
Cogn Affect Behav Neurosci (2011) 11:52–67 61
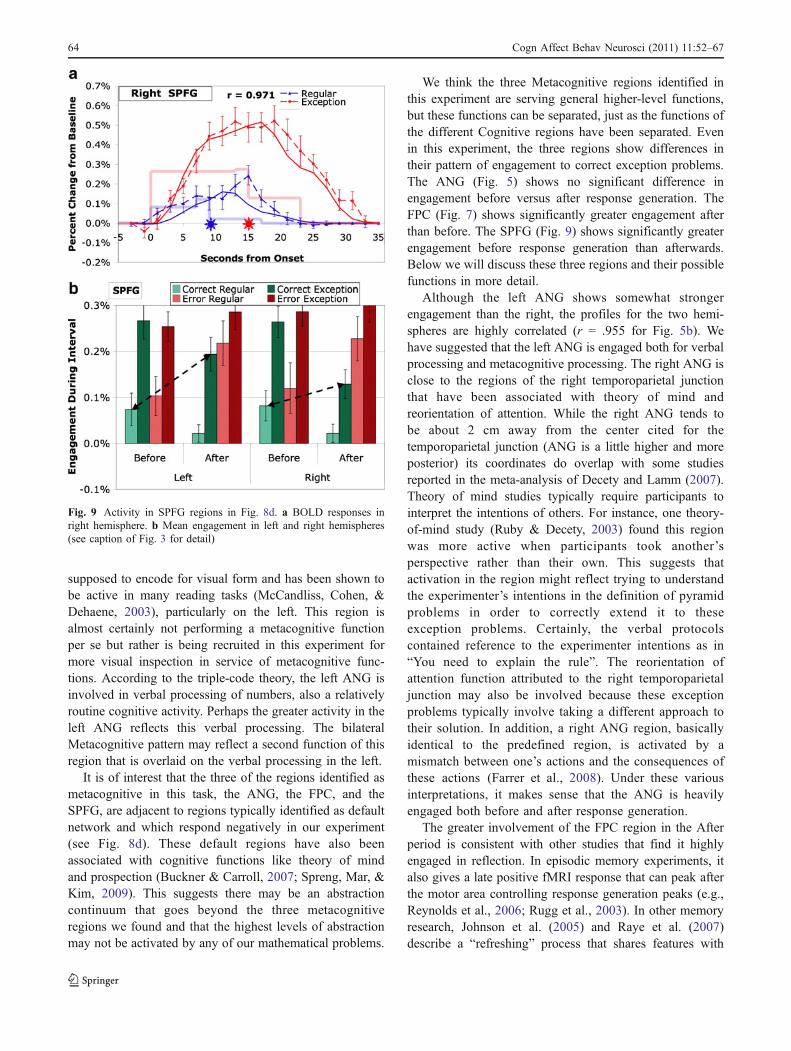
correlation with the Cognitive and Metacognitive factors.The LIPFC, PPC, PSPL, HIPS overlap Cognitive andMixed voxels. The premotor is a purely Cognitive region.The figure also shows three regions that have already beenfound to show metacognitive profiles – ANG, FPC, andfusiform. In every case the patterns are roughly bilaterallysymmetric. Figure 8d indicates an additional Metacognitiveregion that has not come out in the prior analysis and this ispart of the superior prefrontal gyrus (SPFG) that isBrodmann Area 8. Separate left, right, and medial SPFGregions show the metacognitive pattern.
SPFG regions are also identified in an exploratoryanalysis that compares the difference Before-Exceptionand Before-Regular (see Table 3c). Figure 9 illustrates theresponse in the SPFG. While the SPFG has a strongcorrelation with the Metacognitive profile (r = .883) andshows similar effects to other metacognitive regions, itdiffers from the ANG (Fig. 5) and FPC regions (Fig. 8) inthat it shows significantly greater engagement in the Beforeperiod for corrects (t(19) = 3.29, p < .005). This results in asmaller After-Exception and Before-Regular contrast forcorrects, which is why it was not identified in the earlier408-region exploratory analysis. In fact, the contrast only
reaches conventional levels of significance for the left SPG(Table 3c).
General discussion
The analyses in this paper depend on comparing engage-ment before and after response generation. We separatelyestimated an engagement for response generation not tocontaminate either of these measures with the role theregion might play in response generation. The ability toclearly separate the engagement of the motor region intoexpected components in Fig. 3 is one indication of thesuccess of the procedure. Another indication of the successof this separation is that, while many regions showeddifferences between error and non-errors in the Afterperiod, no region showed a significant difference inengagement to corrects versus errors in the Before period,when participants did not yet know the accuracy of theirresponse.
These pyramid problems nicely separate regions thatshow a Cognitive profile (strong engagement duringproblem solving, independent of challenge and disengage-ment afterwards) and regions that show a Metacognitive
Fig. 7 Activity in inferior regions. a BOLD responses in frontopolarregions. b Mean engagement in frontopolar and fusiform regions (seecaption of Fig. 3 for detail)
Fig. 6 Activity in premotor regions. a BOLD responses in the tworight hemisphere regions. b Mean engagement in the two left and tworight hemispheres (see caption of Fig. 3 for detail)
62 Cogn Affect Behav Neurosci (2011) 11:52–67

profile (strong engagement during challenging parts ofproblem solving and continued reflection afterwards).Figure 8d reveals a cognitive-to-metacognitive gradient inthe frontal cortex moving posterior to anterior. Others havenoted a similar concrete-to-abstract organization of theprefrontal cortex (e.g., Badre, 2008; Buckner, 2003;Christoff & Gabrieli, 2000; Petrides, 2005). Figure 8dwould also appear to reveal another cognitive-to-metacognitive gradient in the parietal cortex going medialto lateral. There are some reports of a similar organizationin other tasks (e.g., Asari, Konishi, Jimura, & Miyashita,2005). There are projections between many prefrontalregions and parietal regions (e.g., Petrides & Pandya,
1984; Selemon & Goldman-Rakic, 1988) including con-nections between premotor and superior parietal (Wise,Boussaoud, Johnson, & Caminiti, 1997), but apparently nodirect parietal connections from frontopolar to the parietal(Petrides & Pandya, 1984).
It would be wrong to conclude that all of the Cognitiveand Metacognitive regions are equivalent. On the Cognitiveside, the ACT-R theory implies different roles forCognitive regions like the LIPFC and PPC and the triple-code theory implies distinct functions for the HIPS andPSPL. On the Metacognitive side, it is interesting that twoof the regions identified are part of the triple-code theory—ANG and the fusiform gyrus. The fusiform gyrus is
Fig. 8 a Factors 1 and 2 show the rotated scores for the first twofactors identified in the factor analysis of the 408 exploratory regions.The Cognitive and Metacognitive Factors are idealized scores thatstrongly correlated with Factors 1 and 2. b Distribution of 51,239voxels in terms of their correlation with the Cognitive andMetacognitive factors color-coded as to total variance explained. c
Color coding of categories for 11,994 positively responding voxelswith variance explained greater than .841. d Brain distribution ofvoxels in b with R2 > .841. Negatively responding voxels are in blackand positively responding voxels use the color coding in c. The valueof z at each brain slice (shown in radiological convention: image left =participant’s right) is at x = y = 0 in Talairach coordinates
Cogn Affect Behav Neurosci (2011) 11:52–67 63
supposed to encode for visual form and has been shown tobe active in many reading tasks (McCandliss, Cohen, &Dehaene, 2003), particularly on the left. This region isalmost certainly not performing a metacognitive functionper se but rather is being recruited in this experiment formore visual inspection in service of metacognitive func-tions. According to the triple-code theory, the left ANG isinvolved in verbal processing of numbers, also a relativelyroutine cognitive activity. Perhaps the greater activity in theleft ANG reflects this verbal processing. The bilateralMetacognitive pattern may reflect a second function of thisregion that is overlaid on the verbal processing in the left.
It is of interest that the three of the regions identified asmetacognitive in this task, the ANG, the FPC, and theSPFG, are adjacent to regions typically identified as defaultnetwork and which respond negatively in our experiment(see Fig. 8d). These default regions have also beenassociated with cognitive functions like theory of mindand prospection (Buckner & Carroll, 2007; Spreng, Mar, &Kim, 2009). This suggests there may be an abstractioncontinuum that goes beyond the three metacognitiveregions we found and that the highest levels of abstractionmay not be activated by any of our mathematical problems.
We think the three Metacognitive regions identified inthis experiment are serving general higher-level functions,but these functions can be separated, just as the functions ofthe different Cognitive regions have been separated. Evenin this experiment, the three regions show differences intheir pattern of engagement to correct exception problems.The ANG (Fig. 5) shows no significant difference inengagement before versus after response generation. TheFPC (Fig. 7) shows significantly greater engagement afterthan before. The SPFG (Fig. 9) shows significantly greaterengagement before response generation than afterwards.Below we will discuss these three regions and their possiblefunctions in more detail.
Although the left ANG shows somewhat strongerengagement than the right, the profiles for the two hemi-spheres are highly correlated (r = .955 for Fig. 5b). Wehave suggested that the left ANG is engaged both for verbalprocessing and metacognitive processing. The right ANG isclose to the regions of the right temporoparietal junctionthat have been associated with theory of mind andreorientation of attention. While the right ANG tends tobe about 2 cm away from the center cited for thetemporoparietal junction (ANG is a little higher and moreposterior) its coordinates do overlap with some studiesreported in the meta-analysis of Decety and Lamm (2007).Theory of mind studies typically require participants tointerpret the intentions of others. For instance, one theory-of-mind study (Ruby & Decety, 2003) found this regionwas more active when participants took another’sperspective rather than their own. This suggests thatactivation in the region might reflect trying to understandthe experimenter’s intentions in the definition of pyramidproblems in order to correctly extend it to theseexception problems. Certainly, the verbal protocolscontained reference to the experimenter intentions as in“You need to explain the rule”. The reorientation ofattention function attributed to the right temporoparietaljunction may also be involved because these exceptionproblems typically involve taking a different approach totheir solution. In addition, a right ANG region, basicallyidentical to the predefined region, is activated by amismatch between one’s actions and the consequences ofthese actions (Farrer et al., 2008). Under these variousinterpretations, it makes sense that the ANG is heavilyengaged both before and after response generation.
The greater involvement of the FPC region in the Afterperiod is consistent with other studies that find it highlyengaged in reflection. In episodic memory experiments, italso gives a late positive fMRI response that can peak afterthe motor area controlling response generation peaks (e.g.,Reynolds et al., 2006; Rugg et al., 2003). In other memoryresearch, Johnson et al. (2005) and Raye et al. (2007)describe a “refreshing” process that shares features with
Fig. 9 Activity in SPFG regions in Fig. 8d. a BOLD responses inright hemisphere. b Mean engagement in left and right hemispheres(see caption of Fig. 3 for detail)
64 Cogn Affect Behav Neurosci (2011) 11:52–67

reflection on problem solving. Their paradigm involvespresenting participants with a sequence of items, usually anew word to study, but sometimes a cue to refresh theprevious word. If the FPC region principally serves areflection function, then it is reasonable that it should bemuch more engaged after response generation. However, itis not just a region that is engaged after any response, sinceit does not show significant engagement after a correctresponse to a regular problem.
The SPFG region has been shown to play a role inspatial working memory tasks (e.g., Casey et al., 1998;Courtney, Ungerleider, Keil, & Haxby, 1996; Postle,Berger, Taich, & D’Esposito, 2000; Rowe, Toni, Josephs,Frackowiak, & Passingham, 2000) and reasoning tasks(e.g., Goel & Dolan, 2004; Parsons & Osherson, 2001),particularly inductive reasoning. Neither of these processesare what one would consider classic metacognitive func-tions. One might speculate the SPFG is activated by theneed to reason about how to extend regular solutions toexception cases by analogy to the solution for regularproblems. Alternatively, this region might be engaged inspatial reasoning about the pyramid metaphor for thesemathematical problems. Psychometric studies tend to findsubstantial correlations among spatial ability, reasoning,and mathematical ability (Lohman, 1988). Both of thereasoning and the spatial interpretations would imply thatthe SPFG would be engaged more by the immediatechallenge of solving a pyramid problem and so we mightexpect it to be more active before the response isdetermined.
Our suggested interpretations for the ANG, FPC, andSPFG are consistent with other interpretations in theliterature and these interpretations generally see theseregions as having a role in higher-level cognitive process-ing. The postulated functions for each region can beinterpreted as general-purpose computation that is notspecific to metacognitive processing. In this experiment,the critical metacognitive demands involve reflecting onones processing, both concurrently to adapt the solutionmethod for an exception problem and after the fact to tuneone’s methods given the feedback. These regions are likethe fusiform in that they perform general-purpose functionsthat are called upon to meet the metacognitive demands ofsolving these pyramid problems.
The results of this experiment have important implica-tions for how to model metacognitive processing inmathematics. Just as processing of regular problems provedto require the postulation of multiple modules in either thetriple-code theory or ACT-R, these results suggest that toone needs to incorporate multiple separate modules thatperform different functions when confronted with asituation that evokes metacognition. We might conjecturethat the exception problems in this experiment evoke a
“theory of mind” module (ANG) to interpret the intentionsof the experimenter in defining pyramid problems, a“reasoning” module (SPFG) to determine the implicationsof the definition of a pyramid problem, and a “reflection”module (APFC) to modify one’s understanding given thefeedback. Figure 8d suggests that these pyramid problemsevoke a wide pattern of activity with many different brainregions performing the distinct functions required to solvethese problems.
Acknowledgements This work was supported by the NationalInstitute of Mental Health grant MH068243 to J. R. A. We wouldlike to thank Julie Fiez for her comments on this research and HeeSeung Lee and Andrea Stocco for their comments on the paper.
References
Anderson, J. R. (2005). Human symbol manipulation within anintegrated cognitive architecture. Cognitive science, 29, 313–342.
Anderson, J. R. (2007). How can the human mind occur in thephysical universe? New York: Oxford University Press.
Anderson, J. R., Qin, Y., Sohn, M.-H., Stenger, V. A., & Carter, C. S.(2003). An information-processing model of the BOLD responsein symbol manipulation tasks. Psychonomic Bulletin & Review,10, 241–261.
Anderson, J. R., Betts, S., Ferris, J. L., & Fincham, J. M. (2010).Neural imaging to track mental states while using an intelligenttutoring system. Proceedings of the National Academy ofSciences of the United States of America, 107, 7018–7023.
Anderson, J. R., Bothell, D., Byrne, M. D., Douglass, S., Lebiere, C.,& Qin, Y. (2004). An integrated theory of mind. PsychologicalReview, 111, 1036–1060.
Anderson, J. R., Carter, C. S., Fincham, J. M., Ravizza, S. M., &Rosenberg-Lee, M. (2008). Using fMRI to test models ofcomplex cognition. Cognitive science, 32, 1323–1348.
Asari, T., Konishi, S., Jimura, K., & Miyashita, Y. (2005). Multiplecomponents of lateral posterior parietal activation associated withcognitive set shifting. Neuroimage, 26, 694–702.
Badre, D. (2008). Cognitive control, hierarchy, and the rostro-caudalaxis of the prefrontal cortex. Trends in Cognitive Sciences, 12,193–200.
Buckner, R. L. (2003). Functional-anatomic correlates of controlprocesses in memory. The Journal of Neuroscience, 23, 3999–4004.
Buckner, R. L., & Carroll, D. C. (2007). Self-projection and the brain.Trends in Cognitive Sciences, 11, 49–57.
Burgess, P. W., Gilbert, S. J., Okuda, J., & Simons, J. S. (2006).Rostral prefrontal brain regions (area 10): A gateway betweeninner thought and the external world? In W. Prinz & N. Sebanz(Eds.), Disorders of volition (pp. 373–396). Cambridge: MITPress.
Carpenter, P. A., Just, M. A., Keller, T. A., Eddy, W., & Thulborn, K.(1999). Graded function activation in the visuospatial system withthe amount of task demand. Journal of Cognitive Neuroscience,11, 9–24.
Casey, B. J., Cohen, J. D., O’Craven, K., Davidson, R. J., Irwin, W.,Nelson, C. A., et al. (1998). Reproducibility of fMRI resultsacross four institutions using a spatial working memory task.Neuroimage, 8, 249–261.
Castelli, F., Glaser, D. E., & Butterworth, B. (2006). Discrete andanalogue quantity processing in the parietal lobe: A functional
Cogn Affect Behav Neurosci (2011) 11:52–67 65
MRI study. Proceedings of the National Academy of Sciences ofthe United States of America, 103, 4693–4698.
Christoff, K., & Gabrieli, J. D. E. (2000). The frontopolar cortex andhuman cognition: Evidence for a rostrocaudal hierarchicalorganization within the human prefrontal cortex. Psychobiology,28, 168–186.
Christoff, K., Prabhakaran, V., Dorfman, J., Zhao, Z., Kroger, J. K.,Holyoak, K. J., et al. (2001). Rostrolateral prefrontal cortexinvolvement in relational integration during reasoning. Neuro-image, 14(5), 1136–1149.
Cohen, L., Kadosh, R., Lammertyn, J., & Izard, V. (2008). Arenumbers special? An overview of chronometric, neuroimaging,developmental, and comparative studies of magnitude represen-tation. Progress in Neurobiology, 84, 132–147.
Courtney, S. M., Ungerleider, L. G., Keil, K., & Haxby, J. V. (1996).Object and spatial visual working memory activate separateneural systems in human cortex. Cerebral Cortex, 6, 39–49.
Cox, R. (1996). AFNI: Software for analysis and visualization offunctional magnetic resonance neuroimages. Computers andBiomedical Research, 29, 162–173.
Cox, R., & Hyde, J. S. (1997). Software tools for analysis andvisualization of fMRI data. NMR in Biomedicine, 10, 171–178.
Curtis, C. E., & D'Esposito, M. (2003). Persistent activity in theprefrontal cortex during working memory". Trends in CognitiveSciences, 7, 415–423.
Danker, J., & Anderson, J. (2007). The roles of prefrontal andposterior parietal cortex in algebra problem solving: A case ofusing cognitive modeling to inform neuroimaging data. Neuro-image, 35, 1365–1377.
Decety, J., & Lamm, C. (2007). The role of the right temporoparietaljunction in social interaction: How low-level computationalprocesses contribute to metacognition. The Neuroscientist, 13,580–593.
Dehaene, S., & Cohen, L. (1997). Cerebral pathways for calculation:Double dissociation between rote verbal and quantitative knowl-edge of arithmetic. Cortex, 33, 219–250.
Dehaene, S., Piazza, M., Pinel, P., & Cohen, L. (2003). Three parietalcircuits for number processing. Cognitive Neuropsychology, 20,487–506.
Eger, E., Sterzer, P., Russ, M. O., Giraud, A. L., & Kleinschmidt, A.(2003). A supramodal number representation in human intra-parietal cortex. Neuron, 37, 719–725.
Fair, D. A., Cohen, A. L., Dosenbach, N. U., Church, J. A.,Miezin, F. M., Barch, D. M., et al. (2008). The maturingarchitecture of the brain's default network. Proceedings of theNational Academy of Sciences of the United States of America,105, 4028–4032.
Farrer, C., Frey, S. H., Van Horn, J. D., Tunik, E., Turk, D., Inati, S.,et al. (2008). The angular gyrus computes action awarenessrepresentations. Cerebral Cortex, 18, 254–261.
Fletcher, P. C., & Henson, R. N. A. (2001). Frontal lobes and humanmemory: Insights from functional neuroimaging. Brain, 124,849–881.
Friston, K. J. (2006). Statistical parametric mapping: The analysis offunctional brain. London: Academic.
Friston, K. J., Fletcher, P., Josephs, O., Holmes, A. P., Rugg, M. D., &Turner, R. (1998). Event-related fMRI: Characterising differentialresponses. Neuroimage, 7, 30–40.
Goel, V., &Dolan, R. J. (2004). Differential involvement of left prefrontalcortex in inductive and deductive reasoning. Cognition, 93, B109–B121.
Isaacs, E. B., Edmonds, C. J., Lucas, A., & Gadian, D. G. (2001).Calculation difficulties in children of very low birth weight: Aneural correlate. Brain, 124, 1701–1707.
Johnson, M. K., Raye, C. L., Mitchell, K. J., Greene, E. J.,Cunningham, W. A., & Sanislow, C. A. (2005). Using fMRI to
investigate a component process of reflection: Prefrontal corre-lates of refreshing a just-activated representation. Cognitive,Affective & Behavioral Neuroscience, 5, 339–361.
Koechlin, E., & Hyafil, A. (2007). Anterior prefrontal function and thelimits of human decision-making. Science, 318, 594–598.
Krueger, F., Spampinato, M. V., Pardini, M., Pajevic, S., Wood, J. N.,Weiss, G. H., et al. (2008). Integral calculus problem solving: AnfMRI investigation. NeuroReport, 19, 1095–1099.
Legrand, D., & Ruby, P. (2009). What is self-specific? Theoreticalinvestigations and critical review of neuroimaging results.Psychological Review, 116, 252–282.
Lohman, D. F. (1988). Spatial abilities as traits, processes, andknowledge. In R. J. Sternberg (Ed.), Advances in the psychologyof human intelligence (pp. 181–248). Hillsdale: Erlbaum.
McCandliss, B. D., Cohen, L., & Dehaene, S. (2003). The visual wordform area: Expertise for reading in the fusiform gyrus. Trends inCognitive Sciences, 7, 293–299.
Menon, V., Rivera, S. M., White, C. D., Glover, G. H., & Reiss, A. L.(2000). Dissociating prefrontal and parietal cortex activationduring arithmetic processing. Neuroimage, 12, 357–365.
Molko, N., Cachia, A., Riviere, D., Mangin, J. F., Bruandet, M., LeBihan, D., et al. (2003). Functional and structural alterations ofthe intraparietal sulcus in a developmental dyscalculia of geneticorigin. Neuron, 40, 847–858.
Naccache, L., & Dehaene, S. (2001). The priming method: Imagingunconscious repetition priming reveals an abstract representa-tion of number in the parietal lobes. Cerebral Cortex, 11, 966–974.
Parsons, L. M., & Osherson, D. (2001). New evidence for distinctright and left brain systems for deductive versus probabilisticreasoning. Cerebral Cortex, 11, 954–965.
Petrides, M. (2005). Lateral prefrontal cortex: Architectonic andfunctional organization. Philosophical Transactions of the RoyalSociety of London. Series B: Biological Sciences, 360, 781–795.
Petrides, M., & Pandya, D. N. (1984). Projections to the frontal cortexfrom the posterior parietal region in the rhesus monkey. TheJournal of Comparative Neurology, 228, 105–116.
Piazza, M., Izard, V., Pinel, P., Le Bihan, D., & Dehaene, S. (2004).Tuning curves for approximate numerosity in the human intra-parietal sulcus. Neuron, 44, 547–555.
Pinel, P., Piazza, M., Le Bihan, D., & Dehaene, S. (2004).Distributed and overlapping cerebral representations of num-ber, size, and luminance during comparative judgments.Neuron, 41, 983–993.
Postle, B. R., Berger, J. S., Taich, A. M., & D’Esposito, M. (2000).Activity in human frontal cortex associated with spatial workingmemory and saccadic behavior. Journal of Cognitive Neuroscience,12, 2–14.
Qin, Y., Anderson, J. R., Silk, E., Stenger, V. A., & Carter, C. S.(2004). The change of the brain activation patterns along with thechildren's practice in algebra equation solving. Proceedings of theNational Academy of Sciences of the United States of America,101, 5686–5691.
Raichle, M. E., & Snyder, A. Z. (2007). A default mode of brainfunction: A brief history of an evolving idea. Neuroimage, 37,1083–1090.
Ramnani, N., & Owen, A. M. (2004). Anterior prefrontal cortex:Insights into function from anatomy and neuroimaging. NatureReviews. Neuroscience, 5, 184–194.
Ravizza, S. M., Anderson, J. R., & Carter, C. S. (2008). Errors ofmathematical processing: The relationship of accuracy to neuralregions associated with retrieval or representation of the problemstate. Brain Research, 1238, 118–126.
Raye, C. L., Johnson, M. K., Mitchell, K. J., Greene, E. J., & Johnson,M. R. (2007). Refreshing: A minimal executive function. Cortex,43, 135–145.
66 Cogn Affect Behav Neurosci (2011) 11:52–67
Reynolds, J. R., McDermott, K. B., & Braver, T. S. (2006). A directcomparison of anterior prefrontal cortex involvement in episodicretrieval and integration. Cerebral Cortex, 16, 519–528.
Rosenberg-Lee, M., Lovett, M., & Anderson, J. R. (2009). Neuralcorrelates of arithmetic calculation strategies. Cognitive, Affective& Behavioral Neuroscience, 9, 270–285.
Rowe, J. B., Toni, I., Josephs, O., Frackowiak, R. S. J., &Passingham, R. E. (2000). The prefrontal cortex: Responseselection or maintenance within working memory? Science,288, 1656–1660.
Ruby, P., & Decety, J. (2003). What you believe versus what you thinkthey believe? A neuroimaging study of conceptual perspectivetaking. European Journal of Neuroscience, 17, 2475–2480.
Rugg, M. D., Henson, R. N., & Robb, W. G. (2003). Neural correlatesof retrieval processing in the prefrontal cortex during recognitionand exclusion tasks. Neuropsychologia, 41, 40–52.
Schoenfeld, A. H. (1987). What's all the fuss about metacogni-tion? In A. H. Schoenfeld (Ed.), Cognitive science andmathematics education (pp. 189–215). Hillsdale: LawrenceErlbaum Associates.
Selemon, L. D., & Goldman-Rakic, P. S. (1988). Common corticaland subcortical target areas of the dorsolateral prefrontal and
posterior parietal cortices in the rhesus monkey: Evidence for adistributed neural network subserving spatially guided behavior.The Journal of Neuroscience, 8, 4049–4068.
Sohn, M.-H., Goode, A., Koedinger, K. R., Stenger, V. A., Carter, C.S., & Anderson, J. R. (2004). Behavioral equivalence does notnecessarily imply neural equivalence: Evidence in mathematicalproblem solving. Nature Neuroscience, 7, 1193–1194.
Spreng, R. N., Mar, R. A., & Kim, A. S. (2009). The common neuralbasis of autobiographical memory, prospection, navigation,theory of mind and the default mode: A quantitative meta-analysis. Journal of Cognitive Neuroscience, 21, 489–510.
Wise, S. P., Boussaoud, D., Johnson, P. B., & Caminiti, R. (1997).Premotor and parietal cortex: Corticocortical connectivity andcombinatorial computations. Annual Review of Neuroscience, 20,25–42.
Woods, R. P., Grafton, S. T., Holmes, C. J., Cherry, S. R., &Mazziotta, J. C. (1998). Automated image registration: I. Generalmethods and intrastudent intramodality validation. Journal ofComputer Assisted Tomography, 22, 139–152.
Zacks, J. M., Ollinger, J. M., Sheridan, M. A., & Tversky, B. (2002).A parametric study of mental spatial transformation of bodies.Neuroimage, 16, 857–872.
Cogn Affect Behav Neurosci (2011) 11:52–67 67


![Mathematics Teachers’ Cognitive-metacognitive … · Mathematics Teachers’ Cognitive-metacognitive ... the 3rd and 4th ... periodical or repetitive process [73]](https://img.dokumen.tips/doc/110x75/5b28e2867f8b9a69328b47c5/mathematics-teachers-cognitive-metacognitive-mathematics-teachers-cognitive-metacognitive.jpg)