Embed Size (px)
Citation preview
Cloze Tests: A Tool for Proficiency Assessment inResearch on L2 French
1
Annie Tremblay and Meryl D. GarrisonUniversity of Illinois at Urbana-Champaign
1. Introduction
As the field of second/foreign language (L2) acquisition continues to intersect with psycholinguistics, cognitive science, and education, the methods employed in L2 research should become increasingly rigorous. This includes a need for researchers to both document and control for the factors that affect L2 learners’ performance on experiments. One such factor is proficiency in the target language. Beyond the initial state of L2 acquisition, defined in this study as the first year of explicit language instruction, L2 learners in a given classroom level (third-semester French, fifth-semester French, etc.) are typically not homogeneous in their proficiency. This variability, which is well attested by language instructors, is often due to factors external to the classroom, such as the L2 learners’ age of first exposure to the target language, their percent daily use of the target language, and their length of immersion in an environment where the target language is spoken. Cross-sectional research that groups the so-called “intermediate” and “advanced” L2 learners on the basis of classroom level may thus miss important developmental effects. Furthermore, the inadequate documentation of L2 learners’ proficiency can make comparisons between studies somewhat difficult. The main objective of the present study is to demonstrate the validity, reliability, discriminability, and practicality of a cloze test that we created for assessing the proficiency of adult L2 learners of French in research at the University of Illinois. By showing how we created this test and evaluated it, and by sharing the test with scholars who are working with a similar population of L2 learners of French, we hope to provide a methodological contribution to the field of L2 acquisition and help increase experimental rigor and comparability in L2 research. The paper is organized as follows: Section 2 presents a survey we conducted of the proficiency assessment methods employed in the recent L2 acquisition literature; Section 3 justifies the use of cloze tests as an efficient tool for assessing L2 proficiency; Section 4 describes the method used in this study, including the L2 learners who took part in it and the cloze test they completed. Section 5 presents the results; finally, Section 6 provides a discussion of the findings in light of testing and L2 research standards, and it makes a few methodological recommendations on the implementation of cloze tests in experimental work.
1 This research was supported by the Department of French at the University of Illinois at Urbana-Champaign. We would like to thank Soondo Baek, Zsuzsanna Fagyal, Michael Foster, Scott Fraundorf, Peter Golato, Angela Isaac, Yasuko Ito, Scott Jackson, Doug Kibbee, Dennis Koyama, Tuan Lam, Eun-Kyung Lee, Laurence Mall, Nathan Owens, Lisa Pierce, Bonnie D. Schwartz, Duane Watson, and the audience of the 2008 Second Language Forum for discussion. We are particularly grateful for the valuable feedback we received from an anonymous reviewer. Many thanks should also go to: Nathan Owens for help with the data analysis; Christophe Chaguinian, Nathan Owens, Sarah Simeziane, and Alain Fresco, for letting us administer the test in their class; and the undergraduate and graduate French students and the French faculty who participated in this research.
© 2010 Annie Tremblay and Meryl D. Garrison. Selected Proceedings of the 2008 Second Language ResearchForum, ed. Matthew T. Prior et al., 73-88. Somerville, MA: Cascadilla Proceedings Project.
2. Proficiency assessment methods in recent L2 research
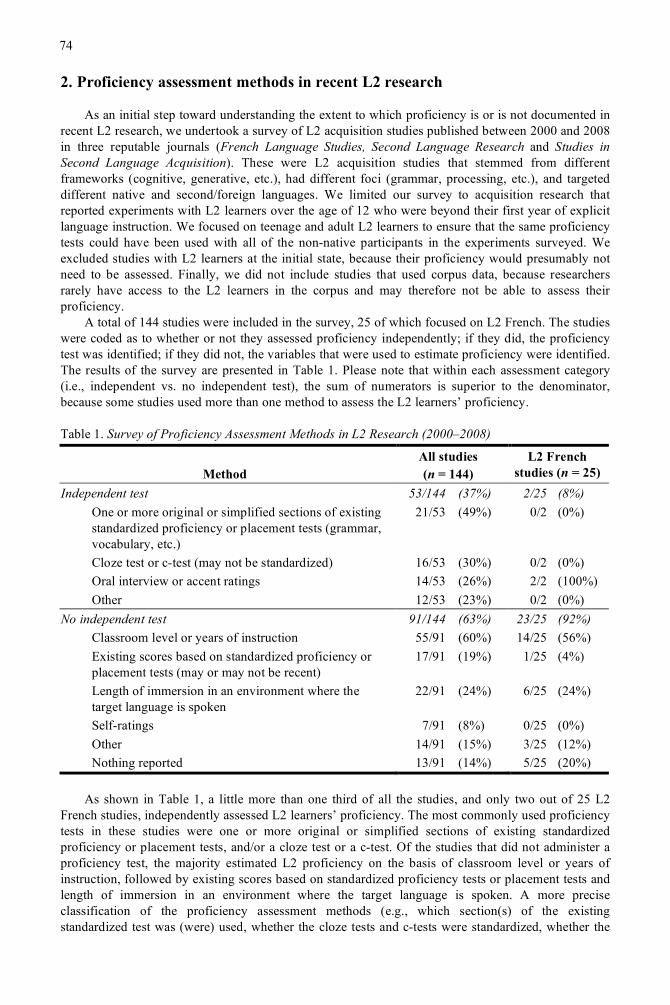
As an initial step toward understanding the extent to which proficiency is or is not documented in recent L2 research, we undertook a survey of L2 acquisition studies published between 2000 and 2008 in three reputable journals (French Language Studies, Second Language Research and Studies in Second Language Acquisition). These were L2 acquisition studies that stemmed from different frameworks (cognitive, generative, etc.), had different foci (grammar, processing, etc.), and targeted different native and second/foreign languages. We limited our survey to acquisition research that reported experiments with L2 learners over the age of 12 who were beyond their first year of explicit language instruction. We focused on teenage and adult L2 learners to ensure that the same proficiency tests could have been used with all of the non-native participants in the experiments surveyed. We excluded studies with L2 learners at the initial state, because their proficiency would presumably not need to be assessed. Finally, we did not include studies that used corpus data, because researchers rarely have access to the L2 learners in the corpus and may therefore not be able to assess their proficiency. A total of 144 studies were included in the survey, 25 of which focused on L2 French. The studies were coded as to whether or not they assessed proficiency independently; if they did, the proficiency test was identified; if they did not, the variables that were used to estimate proficiency were identified. The results of the survey are presented in Table 1. Please note that within each assessment category (i.e., independent vs. no independent test), the sum of numerators is superior to the denominator, because some studies used more than one method to assess the L2 learners’ proficiency. Table 1. Survey of Proficiency Assessment Methods in L2 Research (2000–2008)
Method All studies (n = 144)
L2 French studies (n = 25)
Independent test 53/144 (37%) 2/25 (8%) One or more original or simplified sections of existing standardized proficiency or placement tests (grammar, vocabulary, etc.)
21/53 (49%) 0/2 (0%)
Cloze test or c-test (may not be standardized) 16/53 (30%) 0/2 (0%) Oral interview or accent ratings 14/53 (26%) 2/2 (100%) Other 12/53 (23%) 0/2 (0%) No independent test 91/144 (63%) 23/25 (92%) Classroom level or years of instruction 55/91 (60%) 14/25 (56%) Existing scores based on standardized proficiency or placement tests (may or may not be recent)
17/91 (19%) 1/25 (4%)
Length of immersion in an environment where the target language is spoken
22/91 (24%) 6/25 (24%)
Self-ratings 7/91 (8%) 0/25 (0%) Other 14/91 (15%) 3/25 (12%) Nothing reported 13/91 (14%) 5/25 (20%) As shown in Table 1, a little more than one third of all the studies, and only two out of 25 L2 French studies, independently assessed L2 learners’ proficiency. The most commonly used proficiency tests in these studies were one or more original or simplified sections of existing standardized proficiency or placement tests, and/or a cloze test or a c-test. Of the studies that did not administer a proficiency test, the majority estimated L2 proficiency on the basis of classroom level or years of instruction, followed by existing scores based on standardized proficiency tests or placement tests and length of immersion in an environment where the target language is spoken. A more precise classification of the proficiency assessment methods (e.g., which section(s) of the existing standardized test was (were) used, whether the cloze tests and c-tests were standardized, whether the
74
existing scores based on proficiency or placement tests were recent) could not be performed, because many studies did not provide sufficient details about the proficiency tool or estimate they relied on.
The results of this survey underline the need for more studies to independently assess L2 learners’ proficiency. Although language background factors (e.g., length of immersion in an environment where the target language is spoken) often correlate with L2 proficiency, they do not always do so (as will be shown in this study), and when they do, it is not always clear how the factors should be weighted for L2 proficiency to be estimated accurately. Independently assessing L2 learners’ proficiency solves this problem while allowing for an examination of the extent to which language background factors correlate with proficiency scores. The survey results also highlight a lack of uniformity between researchers in their choice of proficiency assessment methods and in their characterization of proficiency tools or estimates. Comparisons between studies, at least those that investigate the same target language, are at best tenuous in the presence of such inconsistency (for discussion, see also Norris & Ortega, 2000). Hence, it is evident that L2 research would benefit from establishing firm proficiency assessment standards.
3. Cloze tests: A tool for assessing L2 proficiency
Researchers working with populations of adult “intermediate” and “advanced” L2 learners do not always have access to standardized proficiency scores (such as the TOEFL for L2 English) that have been collected shortly (e.g., less than three months) before the study. Since these standardized tests are designed for specific decision-making purposes, they may also not be appropriate for a given study. To avoid the pitfalls of not adequately documenting L2 proficiency, researchers should find and administer a proficiency test that is sufficiently integrative (e.g., assessing not only morphosyntactic competence, but also lexical and discourse competence), meets validity and reliability standards of testing research while discriminating between L2 learners (for discussion, see Brown, 1996), and can be completed within the time constraints of an experimental paradigm. Depending on the target language, it may even be necessary to create such a test. Given the ability of cloze tests to meet these criteria, their flexibility, and their ease of creation and relative ease of scoring, we believe that they are an excellent tool for assessing L2 proficiency in experimental research. The use of cloze tests as a measure of L2 proficiency is certainly not new. These tests have been the object of much testing research since the seventies (e.g., Jonz, 1976; Oller, 1972, 1973). Although there is some controversy as to exactly what aspects of linguistic competence cloze tests measure, one important finding of testing research is that cloze test scores tend to correlate highly with standardized proficiency scores (e.g., Bachman, 1985; Fotos, 1991; Hanania & Shikhani, 1986). Assuming that the latter indeed tap L2 proficiency (an assumption which, admittedly, can be questioned for oral skills), this correlation then suggests that cloze tests also provide a valid proficiency measure. Testing research has further shown that cloze tests are internally consistent and their internal consistency does not vary substantially across different cloze test formats (e.g., Bachman, 1985; Brown, 1980, 1983; Chapelle & Abraham, 1990). While a single cloze test can discriminate between L2 learners in a wide range of proficiency levels (e.g., Fotos, 1991), by manipulating the difficulty level of the test, it is also possible to tailor the test for L2 learners at a particular proficiency level (e.g., Brown, Yamashiro, & Ogane, 2001). In fact, the ability of a cloze test to discriminate between L2 learners very much depends on its difficulty level and on the population it is intended for, with the test discriminating well between L2 learners who score in the middle range of possible scores, but not so much between L2 learners who score very high or very low on the test; note that discriminability and reliability also tend to go hand in hand, with the cloze test being more reliable as the distribution of L2 learners’ scores approaches normality (for discussion, see Brown, 2002). Cloze tests are not only a good L2 proficiency assessment measure by testing standards, as illustrated above, they are also a practical tool for research purposes: they can take a relatively short amount of time to complete (e.g., 15-35 minutes, depending on the difficulty level of the test); their flexible format (choice of text, length of text, word-deletion ratio, scoring method, etc.) makes it possible to target a particular range of proficiency levels; and they are easy to create and can be easy to score if clear scoring criteria are established. It should therefore be possible for researchers who work on a target language for which no reliable proficiency assessment tool is available to create such a test,
75
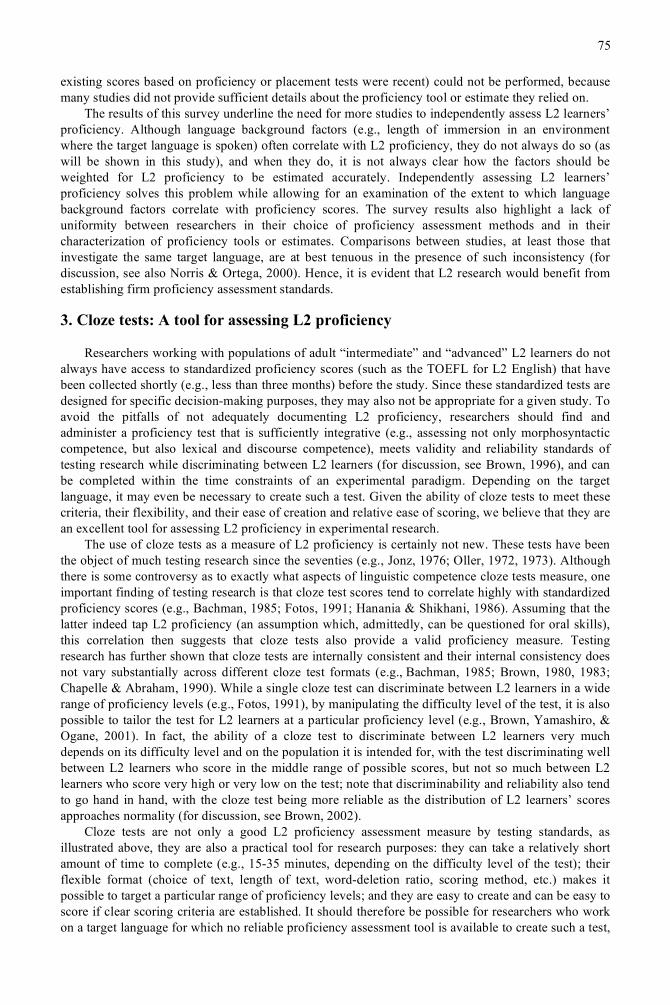
evaluate its validity, reliability, and discriminability with the targeted population of L2 learners, and share the final version of the test with scholars working with similar populations of L2 learners. This is precisely what the present study sets out to do for experimental research with adult L2 learners of French. We do not wish to advocate the use of cloze tests as the only good proficiency assessment method for L2 research, as cloze tests are unlikely to be adequate for some populations of L2 learners (e.g., child L2 learners, L2 learners with poor literacy skills) and they may not be sufficient in L2 research investigating aural/oral skills (see Section 6 for a discussion of this point). Instead, we would like to argue for the necessity of independently assessing L2 proficiency, and demonstrate one way to do so reliably and efficiently with college-level L2 learners. 4. Method 4.1. Participants The participants in this study are 84 L2 learners of French (mean age = 22.1; range = 18–61) from four undergraduate-level courses (17 from French 103, “Intermediate French I”; 20 from French 207, “Grammar and Composition”; 17 from French 414, “Advanced Grammar and Style”; 12 from French 421, “Techniques in Translation II”) and 18 graduate students and faculty at the University of Illinois. The above courses were selected, because each of them is a prerequisite for the one that follows, thus allowing for a wide range of proficiency levels to be observed. Graduate students and faculty were recruited to ensure that the higher end of the proficiency spectrum would also be targeted. The L2 learners completed a language background questionnaire in which they provided information such as their age of first exposure to French, the number of years of instruction they had received in/on French, the number of years they had spent immersed in a French-speaking environment, and their percent daily use of French. We collected this information in order to examine the relationship between these factors and the proficiency of our L2 learners as independently measured by the cloze test. The language background information of the participants in each classroom level is presented in Table 2.
Table 2. Mean (Standard Error) Age of First Instruction, Years of Instruction, Years of Immersion, and Percent Daily use of French by Classroom Level
Age of first exposure to
French
Years of instruction in/on
French
Years in French
immersion
Percent daily use of
French French 103 (n = 17) 14.4 (0.8) 3.1 (0.3) 0.005 (0.003) 1.0 (0.6) French 207 (n = 20) 12.8 (0.8) 5.7 (0.6) 0.3 (0.3) 2.7 (0.8) French 414 (n = 17) 12.6 (0.4) 7.0 (0.3) 0.2 (0.1) 9.8 (3.1) French 421 (n = 12) 12.1 (0.9) 9.1 (0.8) 1.8 (1.0) 13.8 (2.5) Graduate students / faculty (n = 18)
12.2 (0.8) 12.3 (0.9) 1.8 (0.5) 29.0 (3.4)
Analyses of variance (ANOVAs) with classroom level as between-subject variable were conducted on the above factors to determine whether the groups differed from one another on each of the factors.2 These ANOVAs were significant for years of instruction in/on French (F(4,79) = 28.339, p < .001), years of immersion in a French-speaking environment (F(4,76) = 3.634, p < .009), and percent daily use of French (F(4,72) = 23.317, p < .001), with the vertical bars in Table 2 linking the groups between which no significant difference was found in post-hoc Tukey tests. These results indicate that years of instruction in/on French is (as one would predict) the factor that best differentiates between the classroom levels, followed by percent daily use of French.
2 In these analyses, the degrees of freedom are smaller than they should be, because not all the participants answered all the questions on the language background questionnaire, resulting in a few empty cells.
76
4.2. Materials
The cloze test that we developed was modeled after Brown’s (1980) cloze test. The latter had originally been created for the Guangzhou English Language Center in China, and was subsequently used at the University of Hawai‘i as part of their English Language Institute placement test (J. D. Brown, personal communication, April 28, 2007). Since it has been the object of considerable research, Brown’s cloze test is considered to be a valid and reliable measure of L2 proficiency in English, and has been used in a number of L2 acquisition studies (e.g., Hwang, 2007; Tremblay, 2007, 2008, 2009). Our cloze test, provided in the Appendix A, was created for a target population of adult L2 learners of French ranging from high beginner to near-native levels of proficiency. For the base text, we chose a non-academic article about global warming selected from Le Monde (2007). The text, which contains 314 words, was judged to be accessible in content to a population of college-level students. We originally deleted 50 words from the text and pilot tested it with five native speakers of French (two from Québec, three from France). The cloze test was revised once after the native speakers from Québec completed it and once after each native speaker from France completed it. The final version had forty-five words (approximately 1/7 words) deleted, of which 23 were content (i.e., open-class) words (nouns, adjectives, verbs, etc.) and 22 were function (i.e., closed-class) words (determiners, prepositions, pronouns, etc.). We opted for the rational deletion method, because it made it possible to elicit a balanced proportion of content and function words from L2 learners. The open-ended answers helped increase the difficulty level of the test, which was necessary to discriminate between L2 learners in higher proficiency levels. We created a bank of acceptable answers on the basis of the participants’ responses, which we used for scoring the test. Despite the occasional difficulty involved in determining what is and is not an acceptable answer, we believe that scoring cloze tests on the basis of acceptable answers has more face validity, as it is rarely the case that only one word is licit in any given lexical, morphosyntactic, and discourse context. Responses were considered acceptable if they were judged by a native speaker of French (the first author) as possible in the context of the text. For unclear cases, word usages and collocations were consulted in dictionaries, books, and websites. We adopted a descriptive approach to acceptability and did not reject words that might have been considered “improper” on the basis of prescriptive rules. For example, some L2 learners provided the word globale in économie globale ‘global economy’ rather than the target word mondiale. Although this borrowing from English could be considered “improper” French, économie globale was found on several non-translated French websites, and was therefore accepted. Similarly, because it is not uncommon for native speakers to make spelling and “silent” agreement errors (i.e., agreement errors that do not affect the pronunciation of a word) in writing, such errors did not affect the acceptability of the word so long as they did not alter its pronunciation (e.g., plural –s, feminine –e after a vowel, etc.). The bank of exact and lexically acceptable answers is provided in Appendix B (note that many more acceptable answers exist once spelling and “silent” agreement errors are included). 4.3. Procedure The undergraduate L2 learners completed the cloze test in their respective classrooms during normal instruction time, and the graduate and faculty L2 learners completed the test in the investigator’s office. The participants were instructed to read the entire text before writing their answers. They were told they should write only one word in each blank. While no time limit was imposed, the participants usually required between 15 and 35 minutes to complete the test. They were not allowed to use dictionaries or to ask the meaning of any word appearing in the text.
4.4. Data analysis
One point was given for each acceptable response, and no points were given for unacceptable responses. The scores (i.e., the number of acceptable responses out of 45 deleted words) were then
77
converted into percent accuracy rates to facilitate the interpretation of the results. All the statistical analyses were performed with the software SPSS. We will first present descriptive statistics for the distribution of cloze test scores that we obtained from all the participants. We will then assess the difficulty level of the test items, their internal consistency, and their ability to discriminate between L2 learners. Next, we will present the cloze test scores by classroom level, overall and on content versus function words, to show the extent of variability in L2 proficiency that characterizes such levels, and we will repeat the item analysis by classroom level to determine if the test can also be used with L2 learners in smaller ranges of L2 proficiency (third-semester French, fifth- semester French, etc.). Finally, using a k-means cluster analysis, we will regroup the L2 learners by proficiency level and reanalyze their results as such. We will validate these proficiency groups by reanalyzing the language background information reported in Table 2 and by conducting a stepwise linear multiple-regression analysis on the proficiency scores with the language background factors as predictors. 5. Results Figure 1 shows the frequencies of the cloze test scores (percent accuracy) obtained from all the participants.
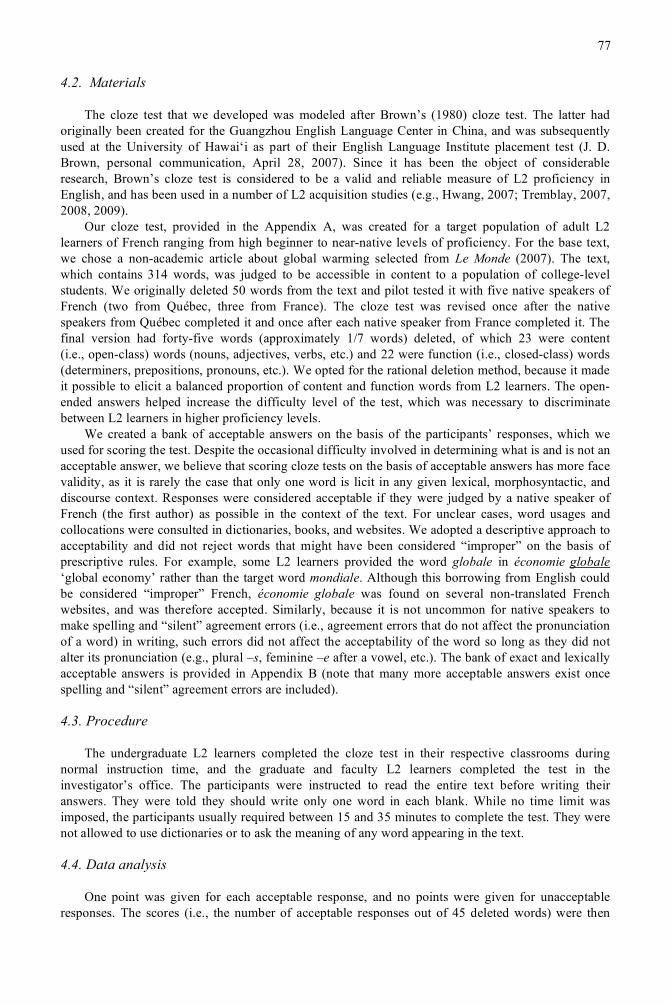
Figure 1. Distribution of the cloze test scores.
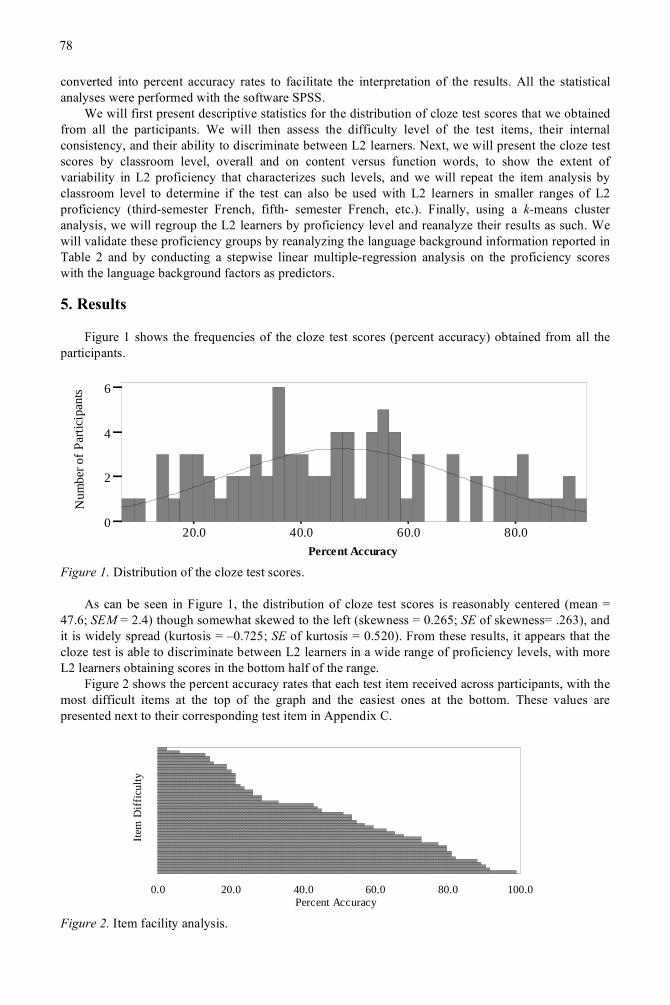
As can be seen in Figure 1, the distribution of cloze test scores is reasonably centered (mean = 47.6; SEM = 2.4) though somewhat skewed to the left (skewness = 0.265; SE of skewness= .263), and it is widely spread (kurtosis = –0.725; SE of kurtosis = 0.520). From these results, it appears that the cloze test is able to discriminate between L2 learners in a wide range of proficiency levels, with more L2 learners obtaining scores in the bottom half of the range. Figure 2 shows the percent accuracy rates that each test item received across participants, with the most difficult items at the top of the graph and the easiest ones at the bottom. These values are presented next to their corresponding test item in Appendix C.
Figure 2. Item facility analysis.
78
20.0 40.0 60.0 80.0Percent Accuracy
0
2
4
6
Num
ber o
f Par
ticip
ants
0.0 20.0 40.0 60.0 80.0 100.0
Item
Diff
icul
ty
Percent Accuracy
As illustrated in Figure 2, the test items display a wide range of difficulty levels, which contributes to explaining why the cloze test is able to discriminate between L2 learners in a wide range of proficiency levels. We evaluated the internal consistency of the test by conducting a Kuder Richardson formula 20 (K-R20) reliability analysis on all the individual test items. The overall analysis (45 items, 84 participants) revealed a K-R20 of .94, which is very high given the relatively small number of participants (by testing standards) who completed the cloze test. This indicates that the test is internally consistent. To further examine the ability of the 45 test items to discriminate between L2 learners, item discriminability indices were computed as follows: for each test item, the mean percent accuracy obtained by the lowest scoring third of all L2 learners (n = 28) was subtracted from the mean percent accuracy obtained by the highest scoring third of all L2 learners (n = 28) (for details, see Brown, 2003). The mean, standard error, and range of the percent accuracy rates and of the discrimination indices are summarized in Table 3 and listed for each test item in Appendix D. Table 3. Item Discrimination Analysis (45 Items)
Mean SEM Range Percent Accuracy, Top Third of L2 Learners (n = 28) 72.8 3.9 7.1–100.0 Percent Accuracy, Bottom Third of L2 Learners (n = 28) 23.8 4.2 0.0–96.4 Discrimination Indices 49.1 3.1 3.6–89.3 Although the discrimination indices vary considerably, as shown by the high ranges in Table 3, all of the individual values provided in Appendix D are positive. Hence, it is not the case that more L2 learners in the bottom third range than L2 learners in the top third range provided a correct answer on any of the cloze test items. A close inspection of the individual test items in Appendix D indicates that only five of the cloze test items have discriminability indices below 20%. This means that most of the test items can discriminate well between lower- and higher-level L2 learners. Turning now to the results by classroom level, Table 4 presents the mean, standard error, and range of percent accuracy rates, as well as the skewness and kurtosis and their standard errors, for each classroom level. Table 4. Cloze Test Scores by Classroom Level
Mean SEM Range Skewness
SE of skewness Kurtosis
SE of kurtosis
French 103 (n = 17) 20.4 2.3 6.7–44.4 1.032 .550 1.463 1.063 French 207 (n = 20) 37.0 2.2 17.8–53.3 0.074 .512 -0.488 0.992 French 414 (n = 17) 47.9 2.3 33.3–62.2 0.032 .550 -1.173 1.063 French 421 (n = 12) 55.7 2.7 37.8–73.3 0.118 .637 0.783 1.232 Graduate students/ faculty (n = 18)
79.4 2.4 57.8–93.3 -0.689 .536 -0.058 1.038
The percent accuracy results in Table 4 show considerable variability within each classroom level and substantial overlap between classroom levels. The skewness analyses indicate that the L2 learners in the lowest classroom level generally score in the bottom half of their distribution, whereas those in the highest classroom level tend to score in the top half of their distribution. By contrast, the middle three classroom levels have fairly centered distributions. The kurtosis analyses show that the L2 learners in French 103, and to some extend those in French 421, have narrower distributions of scores, whereas those in French 414 have a widespread distribution of scores. On the other hand, the L2 learners in French 207 and graduate students/faculty have distributions of scores that approach normality. An ANOVA performed on the scores with group as between-subject variable revealed a main effect of group (F(4,79) = 92.231, p < .001), with the vertical bar in Table 4 linking the two groups between which no significant difference was found in a post-hoc Tukey test. Despite the
79
significant overall effect of classroom level, it is evident that grouping L2 learners by classroom level results in much within-group variability in the mean scores and some between-group variability in the way in which these scores are distributed. We further analyzed the L2 learners’ accuracy rates on content versus function words to determine whether they were equally difficult across the different classroom levels. Table 5 presents the mean, standard error, and range of percent accuracy rates that each classroom level obtained on the two word types. Table 5. Percent Accuracy Rates on Content Vs. Function Words by Classroom Level
Content words (k = 23) Function words (k = 22) Mean (%) SEM Range Mean (%) SEM Range
French 103 (n = 17) 13.6 1.6 4.3–26.1 27.5 3.3 9.1–63.6 French 207 (n = 20) 24.8 2.3 13.0–52.2 49.8 3.1 22.7–77.3 French 414 (n = 17) 34.8 2.4 21.7–52.2 61.5 3.1 36.4–81.8 French 421 (n = 12) 43.8 2.5 30.4–60.9 68.2 3.1 45.5–86.4 Graduate students / faculty (n = 18) 72.5 3.2 43.5–91.3 85.6 1.7 72.7–95.5 As shown in Table 5, content words are more difficult than function words for all the groups, with the asymmetry between the two word types increasing and then decreasing as classroom level increases. A two-way mixed ANOVA with word type as within-subject variable and group as between-subject variable revealed a significant effect of word type (F(1,79) = 264.845, p < .001), a significant effect of level (F(4,79) = 91.744, p < .001), and a significant type × level interaction (F(4,79) =5.592, p < .001), confirming the above observations. Again, the vertical bars in Table 5 link the groups between which no significant difference was found in post-hoc Tukey tests. We performed a second item analysis, this time with L2 learners grouped by classroom level, to determine whether the internal consistency and discriminability of the cloze test is sufficiently high for researchers to use the test with L2 learners in a singe classroom level (third-semester French, fifth- semester French, etc.). For each classroom level, we conducted a K-R20 reliability analysis on the individual test items and we established the item discrimination indices by subtracting the mean percent accuracy of the lowest scoring third of L2 learners from the mean percent accuracy of the highest scoring third of L2 learners.3 The K-R20 coefficients and the mean and standard error values of the remaining results are provided in Table 6. Table 6. Reliability and Item Discrimination Analysis by Classroom Level (45 items)
Mean % accuracy top third
Mean % accuracy bottom third
Discrimination index
Classroom Level K-R20 Mean SEM Mean SEM Mean SEM French 103 (n = 17) .76 32.0 4.9 11.1 3.6 20.9 3.4 French 207 (n = 20) .71 48.9 5.6 26.3 4.7 22.6 4.2 French 414 (n = 17) .69 58.7 5.6 36.9 5.7 21.8 3.5 French 421 (n = 12) .72 65.0 5.9 46.7 6.0 18.3 3.9 Graduate students /faculty (n = 18) .74 89.3 2.9 70.0 4.3 19.3 3.8
3 For each classroom, it was not always possible to compute the item discrimination indices based on exactly one third of the L2 learners, because some sample sizes were not multiples of 3. In those cases, the top and bottom ranges included one fewer L2 learner than the closest larger multiple of 3 would have allowed. Given that each group had a small number of participants and did not always yield a normal distribution of scores, caution is warranted in the interpretation of these results.
80
As these results show, the internal consistency of the cloze test is lower when classroom levels are considered separately. This is partly due to the smaller range of variability that each classroom level shows. Considering the small number of participants in each group, the reliability estimates are nonetheless high, and they are the highest for the top and bottom classroom levels. Likewise, the mean discrimination index is much smaller for each classroom level than for the entire sample, hovering around 20%. A closer examination of the individual results indicate that fewer than four test items have a negative value in each level (French 103: 0; French 207: 3; French 414: 1; French 421: 4; graduate students / faculty: 2).4 This indicates that the cloze test may not discriminate as well between the L2 learners in each of the levels. It is clear from the above results, in particular from the large within-group variability, that if these L2 learners completed one or more experiments for a given study, they would benefit from being grouped by proficiency level (as measured by the cloze test scores) rather than by classroom level, even if L2 learners in only one or two classroom levels were tested. One way to do so objectively and systematically is to use a k-means cluster analysis, a procedure which has been employed by other L2 acquisition researchers (e.g., Ionin, Zubizarreta, & Maldonado, 2008). The k-means cluster analysis identifies the natural sub-groups within the larger distribution of data. The task of the researcher is to find the ideal number (k) of clusters in the data, one that maximizes between-group variance and minimizes within-group variance. The analysis can be run in conjunction with an ANOVA in which cluster is the between-subject variable: two clusters are specified in the initial analysis, and one cluster is added to each subsequent analysis, until the proportion of variance accounted for by the ANOVA begins decreasing (e.g., Calinski & Harabasz, 1974). It may be difficult to identify the number of clusters when the data do not contain well-defined sub-groups. In the present study, due to the relatively small number of participants, we adopted a conservative approach, assuming that the selected number of clusters should depart the least possible from the null hypothesis (i.e., that the data do not contain any sub-groups). Table 7 presents the degree of freedom and quasi F values obtained for each number of clusters specified in the analyses of the cloze test scores, as well as the gain in F value obtained with each additional cluster. Table 7. k-Means Cluster Analysis on Cloze Test Scores
k (number of clusters) df F Gain 2 1,82 174.094 -- 3 2,81 261.552 87.458 4 3,80 355.983 94.431 5 4,79 386.213 30.230
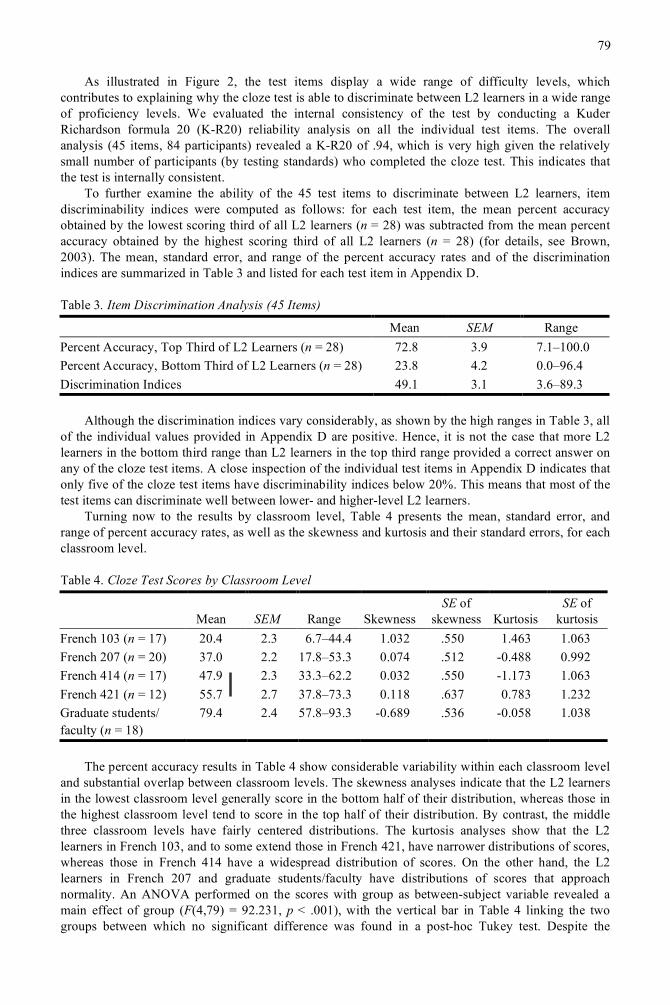
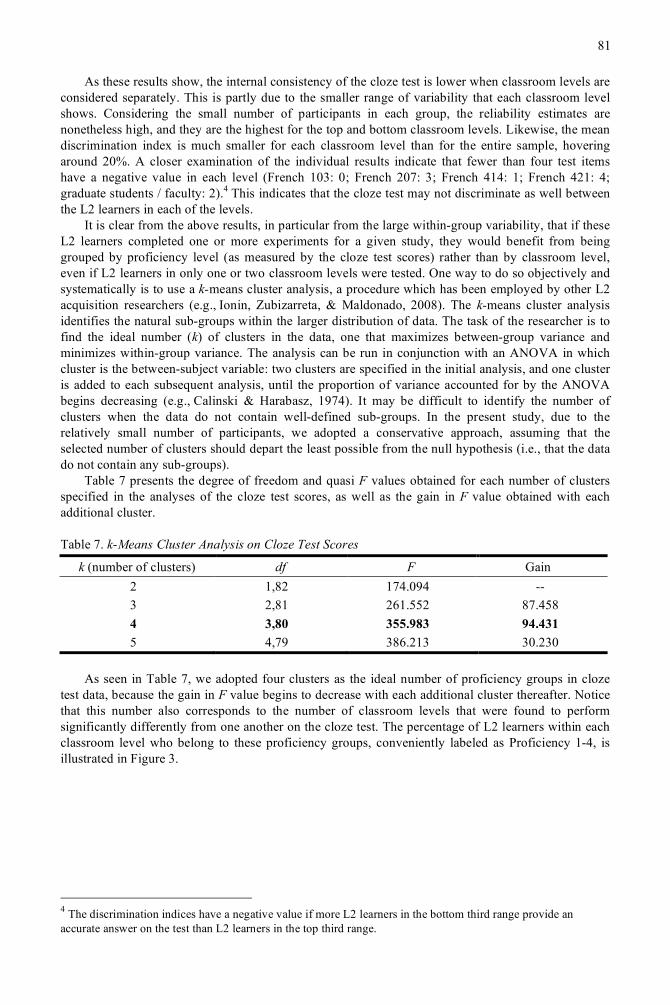
As seen in Table 7, we adopted four clusters as the ideal number of proficiency groups in cloze test data, because the gain in F value begins to decrease with each additional cluster thereafter. Notice that this number also corresponds to the number of classroom levels that were found to perform significantly differently from one another on the cloze test. The percentage of L2 learners within each classroom level who belong to these proficiency groups, conveniently labeled as Proficiency 1-4, is illustrated in Figure 3.
4 The discrimination indices have a negative value if more L2 learners in the bottom third range provide an accurate answer on the test than L2 learners in the top third range.
81
0%
20%
40%
60%
80%
100%
French 103(n = 17)
French 207(n = 20)
French 414(n = 17)
French 421(n = 12)
Grad / Fac(n = 18)
Proficiency 4 (n = 15)Proficiency 3 (n = 21)Proficiency 2 (n = 29)Proficiency 1 (n = 19)
Perc
enta
ge o
f par
ticip
ants
Figure 3. Proficiency group assignments within classroom levels. The results in Figure 3 show that each classroom level contains L2 learners in at least two (and sometimes three) proficiency levels, indicating again that while L2 proficiency increases with classroom level, it also varies within such levels. We thus regrouped the L2 learners by proficiency level. The consequent mean, standard error, and range of percent accuracy rates, as well as the skewness and kurtosis and their standard errors, are presented in Table 8. Table 8. Cloze Test Scores by Proficiency Level
Mean (%) SEM Range Skewness
SE of skewness Kurtosis
SE of kurtosis
Proficiency 1 (n = 19) 19.2 1.5 6.7–28.9 -0.195 0.524 -0.563 1.014 Proficiency 2 (n = 29) 40.1 1.1 31.1–48.9 0.125 0.434 -1.319 0.845 Proficiency 3 (n = 21) 58.4 1.2 51.1–68.9 0.925 0.501 -0.010 0.972 Proficiency 4 (n = 15) 82.9 1.6 73.3–93.3 0.110 0.580 -0.874 1.121 The values in Table 8 indicate that the newly formed groups are, evidently, more homogeneous. The adopted cluster analysis gave rise to four ranges of scores, with the middle two ranges having more L2 learners than the top and bottom two. With the exception of L2 learners in Proficiency 3, who tend to score in the lower half of their distribution, the identified proficiency levels have fairly centered distributions, and they tend to be widespread, particularly so for L2 learners in Proficiency 2. It is clear from these results that grouping L2 learners by proficiency level results in less within-group variability in the mean scores and less between-group variability in the way in which these scores are distributed. A breakdown of the accuracy rates by content and function words (mean, standard error, and range) is provided for each proficiency level in Table 9. Table 9. Percent Accuracy Rates on Content Vs. Function Words by Proficiency Level
Content Words (k = 23) Function Words (k = 22) Mean (%) SEM Range Mean (%) SEM Range
Proficiency 1 (n = 19) 12.8 1.2 4.3–21.7 25.8 2.2 9.1–40.9 Proficiency 2 (n = 29) 27.7 1.5 13.0–52.2 52.9 1.7 36.4–68.2 Proficiency 3 (n = 21) 45.6 2.0 30.4–65.2 72.3 1.5 59.1–81.8 Proficiency 4 (n = 15) 76.2 2.7 60.9–91.3 88.2 1.2 77.3–95.5 The results presented in Table 9 are similar to those reported in Table 4, in that L2 learners perform more poorly on content words than on function words, and the size of this asymmetry increases and then decreases as proficiency increases. Even though analyzing these two types of words separately result in larger standard error values (due to the smaller sample sizes), these values are nonetheless lower than those reported in the analysis by classroom level in Table 4.
82
To validate the number of clusters that we identified in the data, we reanalyzed the participants’ language background information by proficiency level rather than by classroom level. Table 10 presents the L2 learners’ age of first exposure to French, the number of years they studied French, the number of years they spent immersed in a French environment, and their percent daily use of French for each proficiency group. Table 10. Mean (Standard Error) Age of First Exposure, Years of Instruction, Years of Immersion, and Percent Daily use of French by Proficiency Level
Age of first exposure to
French
Years of instruction in/on
French
Years of French
immersion
Percent daily use of
French Proficiency 1 (n = 19) 14.6 (0.8) 3.2 (0.3) 0.02 (0.01) 0.8 (0.5) Proficiency 2 (n = 29) 12.3 (0.5) 6.5 (0.5) 0.3 (0.2) 9.0 (2.3) Proficiency 3 (n = 21) 12.8 (0.5) 8.6 (0.7) 1.5 (0.6) 12.4 (3.2) Proficiency 4 (n = 15) 11.8 (1.0) 12.6 (1.0) 1.7 (0.6) 27.4 (3.0) As can be seen in Table 10, the proficiency groups vary from one another in the expected direction on the language background factors. ANOVAs with proficiency level as between-subject variable were performed on each of the factors to determine whether the groups differ from one another on each of the factors.5 These ANOVAs were statistically significant for age of first exposure to French (F(3,78) = 2.866, p < .042), years of instruction in/on French (F(3,80) = 34.572, p < .001), years of immersion in a French-speaking environment (F(3,77) = 3.872, p < .012), and percent daily use of French (F(3,73) = 15.507, p < .001), with the vertical barks in Table 10 linking the groups between which no statistical significant difference was found on post-hoc Tukey tests. These indicate that years of instruction in/on French and percent daily use of French are better at distinguishing between the different proficiency groups than age of first exposure to French and years of French immersion. To examine the ability of the above language background factors to predict individual cloze test scores (rather than proficiency groups), a stepwise linear multiple-regression analysis was performed on the scores, with each of the factors as a possible predictor of L2 proficiency. Table 11 presents the results of this analysis. Table 11. Stepwise Linear Multiple-Regression Analysis on the Cloze Test Scores
B SE of B β Model 1 Constant 17.866 3.353 Years of Instruction in/on French 4.202 .392 .788*** Model 2 Constant -22.104 Years of Instruction in/on French 5.111 .421 .958*** Age of First Exposure to French 2.560 .635 .318***
R2 (Model 1) = .621; R2 (Model 2) = .693; ***p < .001 It is evident from the regression analysis that years of instructions in/on French is the best predictor of performance on the cloze test, followed by age of first exposure to French, both accounting for nearly 70% of all the variance. Years of immersion in a French-speaking environment and percent daily use of French were not significant predictors of L2 learners’ cloze test scores, even though this last variable did play a role in distinguishing between the different proficiency groups.
5 Again, the degrees of freedom are smaller than they should be, because not all the participants answered all the questions on the language background questionnaire, resulting in a few empty cells.
83
We believe that the regression results are in part due to the specific population of L2 learners we targeted: college-level students who learned French as a foreign language in the United States and who began to do so in middle school, high school, or university. These L2 learners vary in both their age of first exposure to French and the number of years they have been instructed in/on the language. In a context where the target language is learned as a second language and from early on (e.g., French and English in Canada, which are taught in elementary schools), years of instruction in/on the target language and age of first exposure to the target language are unlikely to be good predictors of individual L2 proficiency, because L2 learners do not vary substantially on these factors; instead, years of immersion in an environment where the target language is spoken and percent daily use of the target language are (for such results with L2 English in Canada, see Tremblay, 2007). In the present study, although percent daily use of French did distinguish between some of the proficiency groups, it was not found to be a good predictor of individual proficiency, and nor was years of immersion in a French-speaking environment, probably because the L2 learners did not show sufficient variability on these factors (with fewer of them being at the higher end of the proficiency spectrum). This exemplifies the difficulty involved in predicting L2 proficiency solely on the basis of language background factors.
6. Discussion and conclusion
The above results indicate that the cloze test we have developed for assessing the proficiency of adult L2 learners of French meets both testing and L2 research standards. First, the cloze test appears to be valid, in that the participants’ scores increase with years of instruction in/on French (the opposite would be problematic) and the proficiency groups are significantly different from one another on one or more language background factors. Admittedly, a comparison of the cloze test scores to standardized proficiency scores would have strengthened the validity of the cloze test, but such scores were not available for the population of L2 learners targeted in this study. Second, the cloze test is reliable: its overall internal consistency is very high, and it remains considerably high even when classroom levels are considered separately, suggesting that the cloze test could also be used to assess the proficiency of L2 learners in a single classroom level. Third, the cloze test has the ability to discriminate between L2 learners in a wide range of proficiency levels, yielding a wide distribution of scores both by participant and by item. Since this ability decreases for L2 learners in a single classroom level, the cloze test will work best for discriminating between L2 learners in a wider range of proficiency levels. Finally, the cloze test is practical, requiring L2 learners less than 35 minutes to complete it. It can therefore easily be incorporated into an existing experimental paradigm. All in all, the present cloze test appears to be an excellent tool for assessing the proficiency of college-level adult L2 learners of French. Using such a test can help reduce the within-group variability that would otherwise be observed if the L2 learners were grouped by classroom level, and it can circumvent the difficulty involved in grouping L2 learners on the basis of language background factors. As in any rigorous experimental research, however, cloze test scores should not be used in the presence of conflicting evidence from other types of data, including language background factors, native speaker judgments (e.g., oral proficiency assessments), overall response times on experiments (higher-level L2 learners should be faster than lower-level L2 learners), and so forth. In the present study, we validated the cloze test scores by comparing the proficiency groups against the language background information that the participants provided. We did not always find a relationship between the two, but when we did, it was in the expected direction. Not finding a relationship between cloze test scores and other experimental data may not be a serious issue, but finding a conflicting relationship between them may signal problems with the one or the other (or both). A potential concern with the use of cloze tests as a proficiency assessment tool in L2 research is that they do not measure aural or oral skills. For studies that investigate such skills, this can be an important limitation. One solution to this problem is using a cloze test alongside an aural/oral task, such as a listening comprehension task, a perception task, or a read-aloud task in which L2 learners’ foreign accents are judged by native speakers. For example, Tremblay (2007, 2008, 2009), who investigated the acquisition, perception, and processing of word stress in L2 English, estimated the L2 learners’ proficiency on the basis of cloze test scores and native speakers’ judgments of the L2
84
learners’ foreign accents in an audiorecorded read-aloud task (for a similar judgment task, see Colantoni & Steele, 2007). The accent ratings correlated with the cloze test scores (r = .43, p < .001), but using the two measures conjointly allowed for a more global characterization of L2 proficiency. The advantage of using these two tasks over an oral proficiency interview is that the former are easier to administer, they do not requite special training on the part of the native speakers, and thus they provide more reliable results. As the field of L2 acquisition continues to evolve, documenting and controlling for L2 proficiency in research should no be longer an option. Providing adequate proficiency estimates, ones that meet both testing and research standards, can not only enhance the interpretation of experimental results, but also decrease the disparity between the proficiency assessment methods used in L2 research, and facilitate comparisons between studies. We believe that such standards are within our reach. Appendixes Appendix A. Cloze test
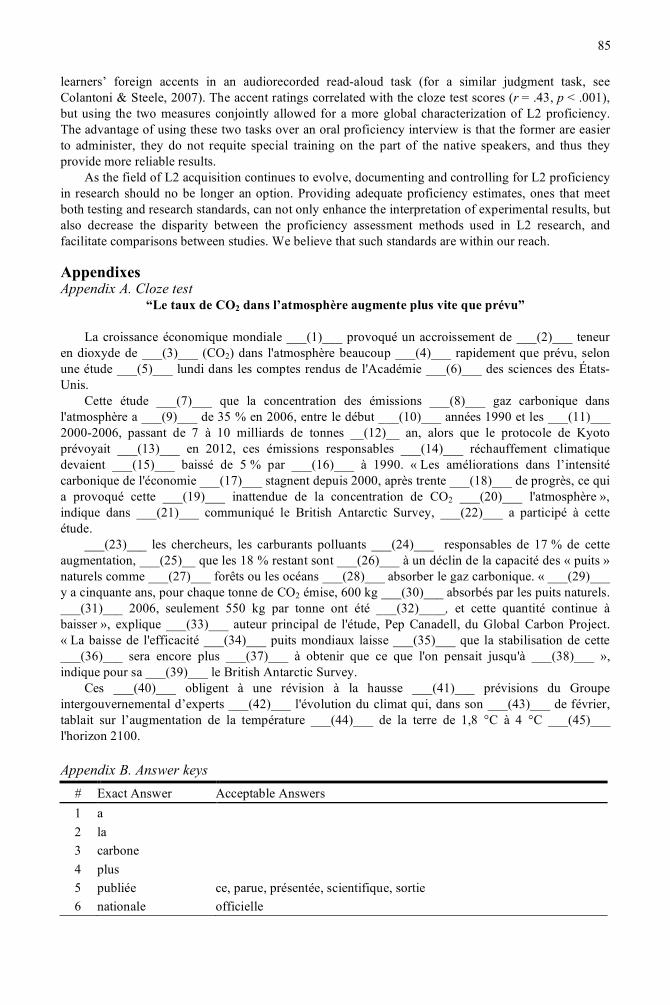
“Le taux de CO2 dans l’atmosphère augmente plus vite que prévu”
La croissance économique mondiale ___(1)___ provoqué un accroissement de ___(2)___ teneur en dioxyde de ___(3)___ (CO2) dans l'atmosphère beaucoup ___(4)___ rapidement que prévu, selon une étude ___(5)___ lundi dans les comptes rendus de l'Académie ___(6)___ des sciences des États-Unis. Cette étude ___(7)___ que la concentration des émissions ___(8)___ gaz carbonique dans l'atmosphère a ___(9)___ de 35 % en 2006, entre le début ___(10)___ années 1990 et les ___(11)___ 2000-2006, passant de 7 à 10 milliards de tonnes __(12)__ an, alors que le protocole de Kyoto prévoyait ___(13)___ en 2012, ces émissions responsables ___(14)___ réchauffement climatique devaient ___(15)___ baissé de 5 % par ___(16)___ à 1990. « Les améliorations dans l’intensité carbonique de l'économie ___(17)___ stagnent depuis 2000, après trente ___(18)___ de progrès, ce qui a provoqué cette ___(19)___ inattendue de la concentration de CO2 ___(20)___ l'atmosphère », indique dans ___(21)___ communiqué le British Antarctic Survey, ___(22)___ a participé à cette étude. ___(23)___ les chercheurs, les carburants polluants ___(24)___ responsables de 17 % de cette augmentation, ___(25)__ que les 18 % restant sont ___(26)___ à un déclin de la capacité des « puits » naturels comme ___(27)___ forêts ou les océans ___(28)___ absorber le gaz carbonique. « ___(29)___ y a cinquante ans, pour chaque tonne de CO2 émise, 600 kg ___(30)___ absorbés par les puits naturels. ___(31)___ 2006, seulement 550 kg par tonne ont été ___(32)____, et cette quantité continue à baisser », explique ___(33)___ auteur principal de l'étude, Pep Canadell, du Global Carbon Project. « La baisse de l'efficacité ___(34)___ puits mondiaux laisse ___(35)___ que la stabilisation de cette ___(36)___ sera encore plus ___(37)___ à obtenir que ce que l'on pensait jusqu'à ___(38)___ », indique pour sa ___(39)___ le British Antarctic Survey. Ces ___(40)___ obligent à une révision à la hausse ___(41)___ prévisions du Groupe intergouvernemental d’experts ___(42)___ l'évolution du climat qui, dans son ___(43)___ de février, tablait sur l’augmentation de la température ___(44)___ de la terre de 1,8 °C à 4 °C ___(45)___ l'horizon 2100. Appendix B. Answer keys
# Exact Answer Acceptable Answers 1 a 2 la 3 carbone 4 plus 5 publiée ce, parue, présentée, scientifique, sortie 6 nationale officielle
85
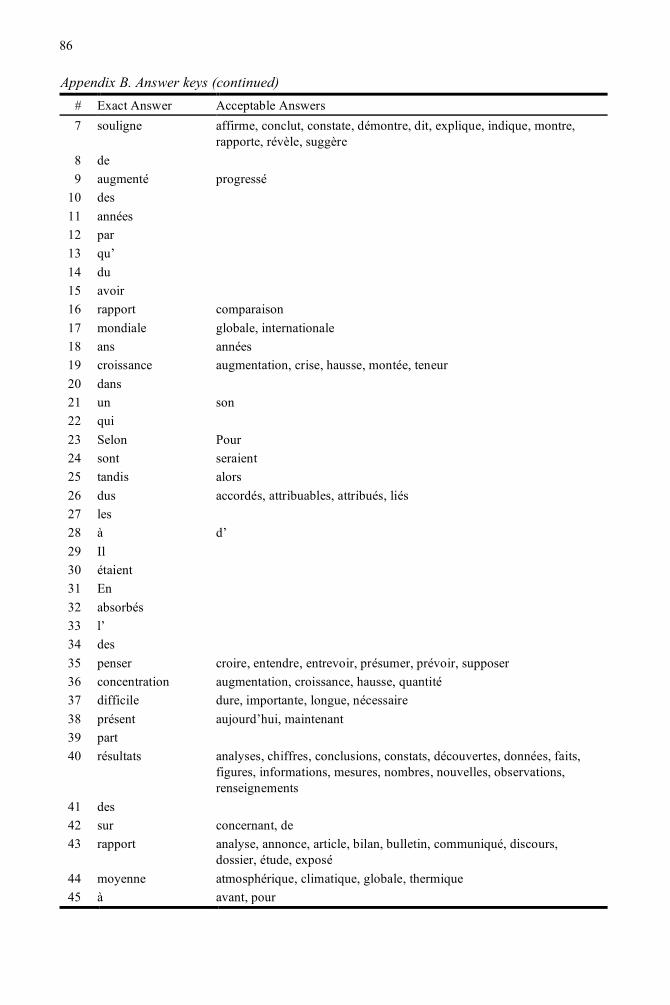
Appendix B. Answer keys (continued) # Exact Answer Acceptable Answers 7 souligne affirme, conclut, constate, démontre, dit, explique, indique, montre,
rapporte, révèle, suggère 8 de 9 augmenté progressé
10 des 11 années 12 par 13 qu’ 14 du 15 avoir 16 rapport comparaison 17 mondiale globale, internationale 18 ans années 19 croissance augmentation, crise, hausse, montée, teneur 20 dans 21 un son 22 qui 23 Selon Pour 24 sont seraient 25 tandis alors 26 dus accordés, attribuables, attribués, liés 27 les 28 à d’ 29 Il 30 étaient 31 En 32 absorbés 33 l’ 34 des 35 penser croire, entendre, entrevoir, présumer, prévoir, supposer 36 concentration augmentation, croissance, hausse, quantité 37 difficile dure, importante, longue, nécessaire 38 présent aujourd’hui, maintenant 39 part 40 résultats analyses, chiffres, conclusions, constats, découvertes, données, faits,
figures, informations, mesures, nombres, nouvelles, observations, renseignements
41 des 42 sur concernant, de 43 rapport analyse, annonce, article, bilan, bulletin, communiqué, discours,
dossier, étude, exposé 44 moyenne atmosphérique, climatique, globale, thermique 45 à avant, pour
86
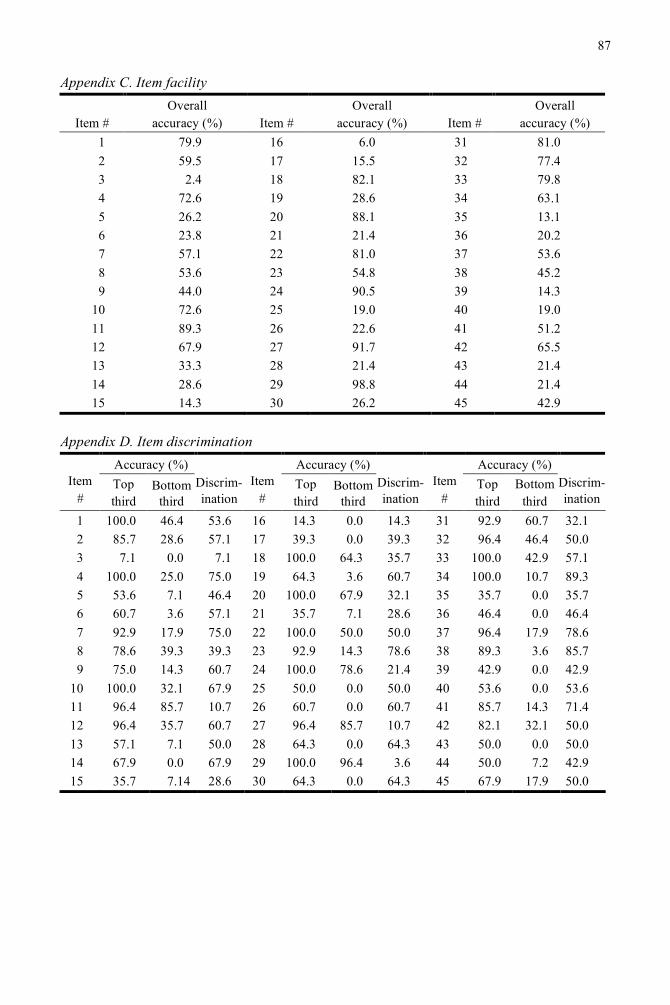
Appendix C. Item facility
Item # Overall
accuracy (%) Item # Overall
accuracy (%) Item # Overall
accuracy (%) 1 79.9 16 6.0 31 81.0 2 59.5 17 15.5 32 77.4 3 2.4 18 82.1 33 79.8 4 72.6 19 28.6 34 63.1 5 26.2 20 88.1 35 13.1 6 23.8 21 21.4 36 20.2 7 57.1 22 81.0 37 53.6 8 53.6 23 54.8 38 45.2 9 44.0 24 90.5 39 14.3
10 72.6 25 19.0 40 19.0 11 89.3 26 22.6 41 51.2 12 67.9 27 91.7 42 65.5 13 33.3 28 21.4 43 21.4 14 28.6 29 98.8 44 21.4 15 14.3 30 26.2 45 42.9
Appendix D. Item discrimination
Accuracy (%) Accuracy (%) Accuracy (%) Item
# Top third
Bottom third
Discrim-ination
Item #
Top third
Bottom third
Discrim-ination
Item #
Top third
Bottom third
Discrim-ination
1 100.0 46.4 53.6 16 14.3 0.0 14.3 31 92.9 60.7 32.1 2 85.7 28.6 57.1 17 39.3 0.0 39.3 32 96.4 46.4 50.0 3 7.1 0.0 7.1 18 100.0 64.3 35.7 33 100.0 42.9 57.1 4 100.0 25.0 75.0 19 64.3 3.6 60.7 34 100.0 10.7 89.3 5 53.6 7.1 46.4 20 100.0 67.9 32.1 35 35.7 0.0 35.7 6 60.7 3.6 57.1 21 35.7 7.1 28.6 36 46.4 0.0 46.4 7 92.9 17.9 75.0 22 100.0 50.0 50.0 37 96.4 17.9 78.6 8 78.6 39.3 39.3 23 92.9 14.3 78.6 38 89.3 3.6 85.7 9 75.0 14.3 60.7 24 100.0 78.6 21.4 39 42.9 0.0 42.9
10 100.0 32.1 67.9 25 50.0 0.0 50.0 40 53.6 0.0 53.6 11 96.4 85.7 10.7 26 60.7 0.0 60.7 41 85.7 14.3 71.4 12 96.4 35.7 60.7 27 96.4 85.7 10.7 42 82.1 32.1 50.0 13 57.1 7.1 50.0 28 64.3 0.0 64.3 43 50.0 0.0 50.0 14 67.9 0.0 67.9 29 100.0 96.4 3.6 44 50.0 7.2 42.9 15 35.7 7.14 28.6 30 64.3 0.0 64.3 45 67.9 17.9 50.0
87
References Bachman, Lyle F. (1985). Performance on cloze tests with fixed-ratio and rational deletions. TESOL Quarterly,
16, 61–70. Brown, James Dean (1980). Relative merits of four methods for scoring cloze tests. The Modern Language
Journal, 64, 311–317. Brown, James Dean (1983). A closer look at cloze: Validity and reliability. In John W. Oller, Jr. (Ed.), Issues in
language testing research (pp. 237–250). Rowley, MA: Newbury House. Brown, James Dean (1996). Testing in language programs. Upper Saddle River, NJ: Prentice Hall. Brown, James Dean (2002). Do cloze tests work? Or, is it just an illusion? Second Language Studies, 21, 79–125. Brown, James Dean (2003). Norm-referenced item analysis (item facilitation and item discrimination). Shiken:
The JALT Testing and Evaluation SIG Newsletter, 7, 16–19. Brown, James Dean, Yamashiro, Amy D., & Ogane, Ethel (2001). The Emperor’s new cloze: Strategies for
revising cloze tests. In Thom Hudson & James Dean Brown (Eds.), A focus on language test development (pp. 143–161). Honolulu, HI: University of Hawai‘i Press.
Calinski, Tadeusz & Harabasz, Jerzy (1974). A dendrite method for cluster analysis. Communications in Statistics, 3, 1–27.
Chapelle, Carol A. & Abraham, Roberta G. (1990). Cloze method: What differences does it make? Language Testing, 7, 121–146.
Colantoni, Laura & Steele, Jeffrey (2007). Acquiring /ʁ/ in context. Studies in Second Language Acquisition, 29, 381–406.
Fotos, Sandra (1991). The cloze test as an integrative measure of EFL proficiency: A substitute for essays on college entrance examinations? Language Learning, 41, 313–336.
Hanania, Edith & Shikhani, May (1986). Interrelationships among three tests of language proficiency: Standardized ESL, cloze and writing. TESOL Quarterly, 20, 97–110.
Hwang, Hyekyung (2007). Prosodic phrasing in sentence comprehension: Evidence from native English speakers and native Korean-speaking second language learners of English. Unpublished doctoral dissertation, University of Hawai‘i.
Ionin, Tania, Zubizarreta, María, Luisa, & Maldonado, Salvador, Bautista (2008). Sources of linguistic knowledge in the second language acquisition of English articles. Lingua, 118, 554–576.
Jonz, Jon (1976). Improving on the basic egg; The multiple-choice cloze. Language Learning, 26, 255–265. Norris, John M. & Ortega, Lourdes (2000). Effectiveness of L2 instruction: A research synthesis and quantitative
meta-analysis. Language Learning, 50, 417–528. Oller, John W. Jr. (1972). Scoring methods and difficulty levels for cloze tests of proficiency in English as a
second language. The Modern Language Journal, 56, 151–157. Oller, John W. Jr. (1973). Cloze tests of second language proficiency and what they measure. Language Learning,
23, 105–118. Tremblay, Annie (2007). Bridging the gap between theoretical linguistics and psycholinguistics in L2 phonology:
Acquisition and processing of word stress by French Canadian L2 learners of English (Unpublished doctoral dissertation). University of Hawai‘i, Honolulu, HI.
Tremblay, Annie (2008). Is second language lexical access prosodically constrained? Processing of word stress by French Canadian second language learners of English. Applied Psycholinguistics, 29, 553–584.
Tremblay, Annie (2009). Phonetic variability and the variable perception of L2 word stress by French Canadian listeners. International Journal of Bilingualism, 13, 35–62.
88
Selected Proceedings of the2008 Second Language Research Forum:Exploring SLA Perspectives, Positions,and Practices
edited by Matthew T. Prior,Yukiko Watanabe, and Sang-Ki LeeCascadilla Proceedings Project Somerville, MA 2010
Copyright information
Selected Proceedings of the 2008 Second Language Research Forum:Exploring SLA Perspectives, Positions, and Practices© 2010 Cascadilla Proceedings Project, Somerville, MA. All rights reserved
ISBN 978-1-57473-439-3 library binding
A copyright notice for each paper is located at the bottom of the first page of the paper.Reprints for course packs can be authorized by Cascadilla Proceedings Project.
Ordering information
Orders for the library binding edition are handled by Cascadilla Press.To place an order, go to www.lingref.com or contact:
Cascadilla Press, P.O. Box 440355, Somerville, MA 02144, USAphone: 1-617-776-2370, fax: 1-617-776-2271, e-mail: [email protected]
Web access and citation information
This entire proceedings can also be viewed on the web at www.lingref.com. Each paper has a unique document #which can be added to citations to facilitate access. The document # should not replace the full citation.
This paper can be cited as:
Tremblay, Annie and Meryl D. Garrison. 2010. Cloze Tests: A Tool for Proficiency Assessment in Research onL2 French. In Selected Proceedings of the 2008 Second Language Research Forum, ed. Matthew T. Prior et al.,73-88. Somerville, MA: Cascadilla Proceedings Project. www.lingref.com, document #2386.

![CLOZE TEST Go with Frequently Used Words …prepadda.com/.../English-Cloze-Test[].pdf · MOCKTIME.COM ONLINE TEST SERIES CORRESPONDENCE COURSE CLOZE TEST INTRODUCTION A Cloze reading](https://img.dokumen.tips/doc/110x75/5aa8d9367f8b9a90188c1254/cloze-test-go-with-frequently-used-words-pdfmocktimecom-online-test-series.jpg)