Embed Size (px)
Citation preview
Atmos. Chem. Phys., 11, 8003–8015, 2011www.atmos-chem-phys.net/11/8003/2011/doi:10.5194/acp-11-8003-2011© Author(s) 2011. CC Attribution 3.0 License.
AtmosphericChemistry
and Physics
Cloud condensation nuclei as a modulator of ice processes in Arcticmixed-phase clouds
S. Lance1,2, M. D. Shupe2,3, G. Feingold1, C. A. Brock1, J. Cozic1,2, J. S. Holloway1,2, R. H. Moore4, A. Nenes4,5,J. P. Schwarz1,2, J. R. Spackman1,2, K. D. Froyd1,2, D. M. Murphy 1, J. Brioude1,2, O. R. Cooper1,2, A. Stohl6, andJ. F. Burkhart 6,7
1Chemical Sciences Division, Earth System Research Laboratory, National Oceanic and Atmospheric Administration,Boulder, CO, USA2Cooperative Institute for Research in Environmental Sciences, University of Colorado, Boulder, CO, USA3Physical Sciences Division, Earth System Research Laboratory, National Oceanic and Atmospheric Administration,Boulder, CO, USA4School of Chemical & Biomolecular Engineering, Georgia Institute of Technology, Atlanta, GA, USA5School of Earth and Atmospheric Sciences, Georgia Institute of Technology, Atlanta, GA, USA6Norwegian Institute for Air Research, Kjeller, Norway7Sierra Nevada Research Institute, University of California, Merced, CA, USA
Received: 25 January 2011 – Published in Atmos. Chem. Phys. Discuss.: 25 February 2011Revised: 26 July 2011 – Accepted: 27 July 2011 – Published: 5 August 2011
Abstract. We propose that cloud condensation nuclei (CCN)concentrations are important for modulating ice formationof Arctic mixed-phase clouds, through modification of thedroplet size distribution. Aircraft observations from theAerosol, Radiation, and Cloud Processes affecting ArcticClimate (ARCPAC) study in northern Alaska in April 2008allow for identification and characterization of both aerosoland trace gas pollutants, which are then compared with cloudmicrophysical properties. Consistent with previous studies,we find that the concentration of precipitating ice particles (>
400 µm) is correlated with the concentration of large droplets(> 30 µm). We are further able to link the observed micro-physical conditions to aerosol pollution, originating mainlyfrom long range transport of biomass burning emissions. Thecase studies demonstrate that polluted mixed-phase cloudshave narrower droplet size distributions and contain 1–2 or-ders of magnitude fewer precipitating ice particles than cleanclouds at the same temperature. This suggests an aerosol in-direct effect leading to greater cloud lifetime, greater cloudemissivity, and reduced precipitation. This result is oppositeto the glaciation indirect effect, whereby polluted clouds areexpected to precipitate more readily due to an increase in theconcentration of particles acting as ice nuclei.
Correspondence to:S. Lance([email protected])
1 Introduction
Understanding the effect of aerosol on mixed-phase cloudradiative forcing may be critical for understanding climatechange in the Arctic. Aerosols can indirectly cool the Earth’ssurface by increasing the shortwave scattering of incident so-lar radiation through an increase in cloud reflectivity, cover-age or lifetime (Twomey, 1974; Albrecht, 1989). Aerosolscan also increase cloud longwave emissivity when liquid wa-ter path is low, which can warm the Earth’s surface (Garrett etal., 2002; Lubin and Vogelmann, 2006). The Arctic is poten-tially sensitive to this longwave aerosol effect, since low al-titude clouds are often warmer than the underlying snow andice covered surfaces (Garrett et al., 2002) and since cloudswith liquid water path< 100 g m−2 are common in the Arc-tic.
Low-level boundary layer clouds are persistent in the Arc-tic for all seasons (Curry et al., 1996; Shupe et al., 2011).An important characteristic of these clouds during winter andspring is that they are frequently mixed-phase, with super-cooled liquid water droplets and ice particles often coexist-ing for several hours to many days (Shupe et al., 2006, 2011),with a lifetime that is thought to depend on the cooling rate,concentration and type of ice nuclei (IN) present (e.g. Pinto,1998; Intrieri et al., 2002; Korolev and Isaac, 2003; Morrisonet al., 2005). Cloud-resolving model studies have shown thatby increasing IN number concentration by 2–3 times, a liquid
Published by Copernicus Publications on behalf of the European Geosciences Union.
8004 S. Lance et al.: Cloud condensation nuclei as a modulator
stratus deck can be transformed into a broken, optically-thinice cloud system (Harrington et al., 1999; Jiang et al., 2000;Harrington and Olsson, 2001) due to the Wegener–Bergeron-Findeisen process (Wegener, 1911; Bergeron, 1935; Find-eisen, 1938). The resulting ice cloud has a much lower parti-cle number density; these sparse, relatively large ice crystalsreduce the cloud optical depth (thereby reducing the cloud’sradiative effects), and settle relatively rapidly (thereby reduc-ing the cloud lifetime).
During the springtime, pollution is often transported fromlower latitudes to the Arctic, leading to what is known as“Arctic haze” (Shaw, 1975; Rahn et al., 1977; Lubin andVogelmann, 2006; Quinn et al., 2007; Garrett et al., 2010).The persistent temperature inversions that develop duringthis time period in the lower Arctic troposphere inhibit verti-cal mixing, which can give rise to multiple layers of concen-trated pollution plumes originating from long range transportof fossil fuel and biomass burning emissions (Radke et al.,1984; Warneke et al., 2010), which are superimposed on theseasonal background haze (Brock et al., 2010). Arctic hazehas been correlated with an increase in the number concen-tration of supercooled liquid cloud droplets (resulting froman increase in CCN) and a decrease in cloud droplet effec-tive radii, which can together increase the cloud longwaveemissivity (Lubin and Vogelmann, 2006). However, Arctichaze and concentrated pollution plumes can also be asso-ciated with elevated IN concentrations, which may increasethe rate of cloud glaciation thereby reducing cloud longwaveemissivity as well as cloud lifetime. Thus, the net effect ofaerosol pollution on Arctic clouds remains unclear.
Previous studies have proposed different mechanisms forthe influence of aerosols on cloud phase partitioning. Pro-posed mechanisms include: (1) the “glaciation indirect ef-fect” (Lohmann, 2002), in which black carbon (soot) pollu-tion provides more IN (acting predominantly in the contactnucleation mode), leading to a greater number of ice particlesformed and enhancements in ice precipitation, (2) the “rim-ing indirect effect”, also known as “inhibition of snowfall bypollution aerosol” (Borys et al., 2003), in which pollutionprovides more CCN, leading to smaller droplets that rimeless effectively, thereby decreasing the mass of ice precip-itation, (3) the “thermodynamic indirect effect” (Lohmannand Feichter, 2005), in which pollution provides more CCN,leading to smaller droplets that freeze less readily. This lasteffect has been invoked to explain observed correlation be-tween large droplet and ice crystal concentrations in slightlyto moderately supercooled clouds (Hobbs and Rangno, 1985;Korolev et al., 2003), although the dominant freezing mech-anism(s) taking place are not universally agreed upon.
In this paper we present observations of polluted and cleanclouds from the ARCPAC study (http://www.esrl.noaa.gov/csd/arcpac/) in northern Alaska April 2008. These obser-vations provide evidence that CCN concentrations ratherthan IN concentrations are the primary limiting factor forice formation in these slightly to moderately supercooled
mixed-phase clouds (−4 to −20◦C, as defined by Rangnoand Hobbs, 2001), as a result of modifications to the dropletsize distribution.
2 Methods
2.1 Instrumentation
The instrument payload during ARCPAC is unique forcloud microphysical studies. The NOAA WP-3D air-craft was extensively outfitted for trace gas measurementsin addition to aerosol and cloud microphysical measure-ments, which allowed for identification and characteriza-tion of intercepted pollution plumes. Data from the AR-CPAC campaign is available athttp://www.esrl.noaa.gov/csd/tropchem/2008ARCPAC/P3/DataDownload/. Measure-ments of biomass burning (BB) aerosol tracers, carbonmonoxide (CO), acetonitrile (CH3CN) and other volatileorganic compounds, coupled with transport model simula-tions, provide for clear identification of plumes originat-ing from biomass burning emissions in southern Russia andsoutheastern Siberia (Warneke et al., 2009). Trace gas andaerosol composition measurement techniques are outlined byWarneke et al. (2009) and Brock et al. (2010). Dry aerosolsize distributions (4 nm< dp < 8.3 µm) were obtained fromthree separate instruments: a five-channel condensation par-ticle counter, an ultra high sensitivity aerosol spectrometerand a white light optical counter (Brock et al., 2010). Singleparticle composition measurements (for dry particle diame-ters, dp > 150 nm) were obtained using the particle analysisby laser mass spectrometery (PALMS) instrument (Murphyet al., 2006). CCN measurements were obtained using a con-tinuous flow streamwise thermal gradient chamber (Robertsand Nenes, 2005) built by Droplet Measurement Technolo-gies (DMT) (Lance et al., 2006). A DMT single particle sootphotometer (Schwarz et al., 2006) measured the refractoryblack carbon (BC) mass of single particles. A DMT clouddroplet probe (CDP), cloud imaging probe (CIP) and pre-cipitation imaging probe (PIP) were used to measure cloudparticle diameters spanning the range 3–6000 µm. Lance etal. (2010) describe in detail the performance of the CDP (3–50 µm) during ARCPAC. A King probe was used to mea-sure liquid water content (LWC), and is corrected using theprocedure outlined by King et al. (1978). LWC calculatedbased on the measured droplet size distribution is referred toas CDP-LWC, whereas measurements from the King probeare referred to as King-LWC or simply LWC.
2.2 Phase determination and definition of a cloud
Cloud particle concentrations are highly sensitive to the waya “cloud” is defined (Gultepe and Isaac, 1999). For ev-ery 1 s sampling interval during the ARCPAC flights, thefollowing criteria are used to identify a cloud:> 10 cm−3
droplets (with diameter 3–50 µm, as measured by the CDP),
Atmos. Chem. Phys., 11, 8003–8015, 2011 www.atmos-chem-phys.net/11/8003/2011/
S. Lance et al.: Cloud condensation nuclei as a modulator 8005
Or > 0.01−0.02 L−1 ice particles (with diameter> 400 µm,as measured by the PIP)
The first criterion is essentially the same as that used byHobbs and Rangno (1998) for mixed-phase clouds, whereasthe second criterion is modified to reflect new informationthat has been discovered about ice shattering artifacts; Ko-rolev et al. (2011) showed that measured concentrations forice particles with diameter>∼ 400 µm are much less sus-ceptible to shattering artifacts than concentrations measuredin the range 100–400 µm, which were included in the crite-rion used by Hobbs and Rangno (1998). Phase identifica-tion based on CIP and PIP images is also much more reli-able when the particle diameter is> 400 µm. However, iceconcentrations at 400 µm are typically∼2 orders of magni-tude lower than concentrations at 100 µm. We therefore usea threshold concentration for the second criterion that is ap-proximately two orders of magnitude lower than that usedby Hobbs and Rangno (1998). Because this lower concen-tration cutoff approaches the counting limits of the PIP, oursecond criterion is chosen to limit concentration uncertaintydue to counting statistics to< 50 % for particles> 400 µm.The range of concentrations for this second criterion is a re-sult of the fact that the sample area for PIP measurements,and therefore the concentration uncertainty, is dependent onthe particle size. The second criterion will not be appropri-ate for all cloud types (e.g., colder free tropospheric cloudswhere ice crystals do not grow to diameters> 400 µm).
Ice water content (IWC) is estimated from the measuredsize distribution using the parameterization by Mitchell etal. (1990),
IWC = C∑
niD2i . (1)
where C = 0.022 mg mm−2 and ni is the ice number con-centration for particles with maximum linear dimensionDi .Lawson and Baker (2006) show that this parameterizationmay underestimate IWC by more than a factor of two forthe Arctic stratus that they analyzed. However, even giventhe possibility of such a large underestimate of IWC, it isclear that the mixed-phase clouds sampled during ARCPACwere dominated by liquid water. In mixed-phase clouds,IWC estimated using the Mitchell et al. (1990) parameter-ization was almost always< 0.01 g m−3 and almost never> 0.1 g m−3, whereas LWC often exceeded 0.1 g m−3. WhenIWC > 0.01 g m−3, King-LWC measurements were biasedby up to 0.08 g m−3, which is greater than expected fromprevious studies (e.g., Cober et al. 2001). The apparentlygreater sensitivity of the King-LWC measurement to icingduring ARCPAC may be due to an underestimate in IWC forthe dendrite aggregates that were sampled at the highest IWCobserved.
2.3 Case studies
For this paper, we have focused on the 19 April 2008 flight(lasting until 20 April when all measurements discussed in
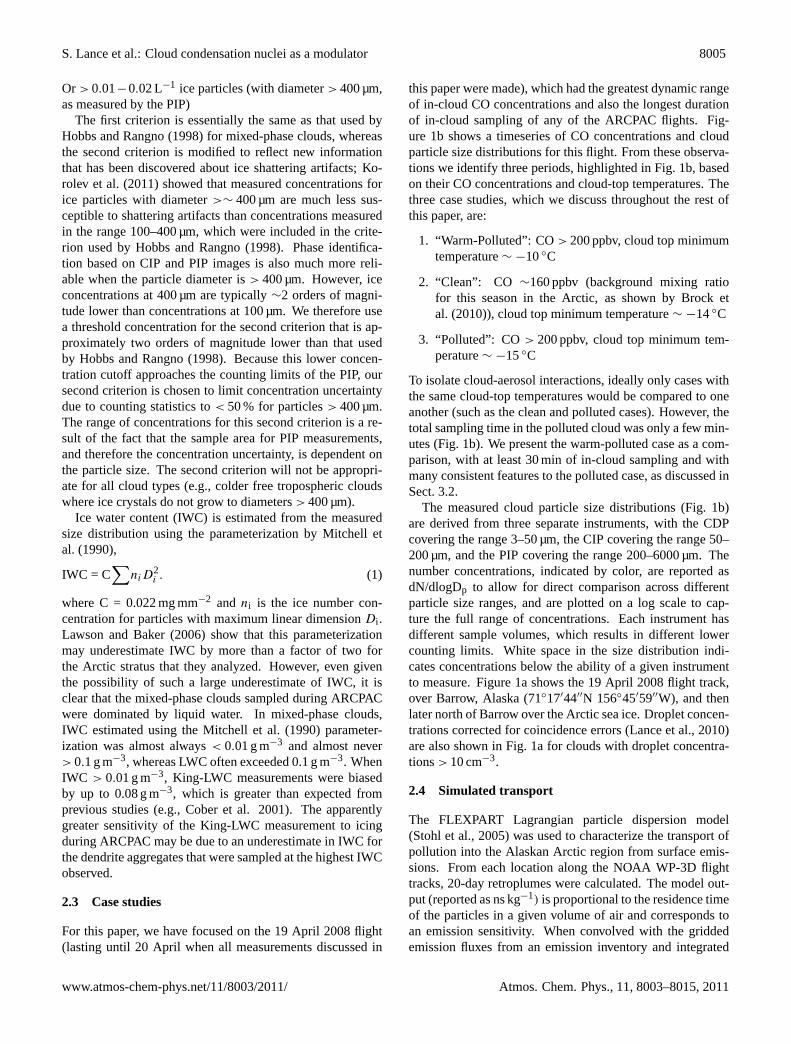
this paper were made), which had the greatest dynamic rangeof in-cloud CO concentrations and also the longest durationof in-cloud sampling of any of the ARCPAC flights. Fig-ure 1b shows a timeseries of CO concentrations and cloudparticle size distributions for this flight. From these observa-tions we identify three periods, highlighted in Fig. 1b, basedon their CO concentrations and cloud-top temperatures. Thethree case studies, which we discuss throughout the rest ofthis paper, are:
1. “Warm-Polluted”: CO> 200 ppbv, cloud top minimumtemperature∼ −10◦C
2. “Clean”: CO ∼160 ppbv (background mixing ratiofor this season in the Arctic, as shown by Brock etal. (2010)), cloud top minimum temperature∼ −14◦C
3. “Polluted”: CO > 200 ppbv, cloud top minimum tem-perature∼ −15◦C
To isolate cloud-aerosol interactions, ideally only cases withthe same cloud-top temperatures would be compared to oneanother (such as the clean and polluted cases). However, thetotal sampling time in the polluted cloud was only a few min-utes (Fig. 1b). We present the warm-polluted case as a com-parison, with at least 30 min of in-cloud sampling and withmany consistent features to the polluted case, as discussed inSect. 3.2.
The measured cloud particle size distributions (Fig. 1b)are derived from three separate instruments, with the CDPcovering the range 3–50 µm, the CIP covering the range 50–200 µm, and the PIP covering the range 200–6000 µm. Thenumber concentrations, indicated by color, are reported asdN/dlogDp to allow for direct comparison across differentparticle size ranges, and are plotted on a log scale to cap-ture the full range of concentrations. Each instrument hasdifferent sample volumes, which results in different lowercounting limits. White space in the size distribution indi-cates concentrations below the ability of a given instrumentto measure. Figure 1a shows the 19 April 2008 flight track,over Barrow, Alaska (71◦17′44′′N 156◦45′59′′W), and thenlater north of Barrow over the Arctic sea ice. Droplet concen-trations corrected for coincidence errors (Lance et al., 2010)are also shown in Fig. 1a for clouds with droplet concentra-tions> 10 cm−3.
2.4 Simulated transport
The FLEXPART Lagrangian particle dispersion model(Stohl et al., 2005) was used to characterize the transport ofpollution into the Alaskan Arctic region from surface emis-sions. From each location along the NOAA WP-3D flighttracks, 20-day retroplumes were calculated. The model out-put (reported as ns kg−1) is proportional to the residence timeof the particles in a given volume of air and corresponds toan emission sensitivity. When convolved with the griddedemission fluxes from an emission inventory and integrated
www.atmos-chem-phys.net/11/8003/2011/ Atmos. Chem. Phys., 11, 8003–8015, 2011
8006 S. Lance et al.: Cloud condensation nuclei as a modulator
500
400
300
200
100
0
Droplet C
oncentrations [cm-3]
00:00
02:00
04:00
Flight T
ime [U
TC
]
Polluted
Clean
Warm-Polluted
Barrow
100 km
a)
3.0
2.0
1.0
0.0
Altitude [km
]
00:3020 Apr 2008
01:00 01:30 02:00 02:30 03:00
Flight Time [UTC]
350
300
250
200
150
CO
[ppb
v]
160
120
80
40
4
3
2
125020015010050
300
280
260
240
220
-16
-12
-8
-4
10
100
1000
Dia
met
er [µ
m]
-4
-2
0
2
log (dN/dlogD
p )
Warm-Polluted(CO ~215 ppbv)
Clean(CO ~ 160 ppbv)
Polluted(CO ~ 220 ppbv)
b)
Fig. 1. (a)Flight track on 19 April 2008 colored by time, with clouddroplet concentrations marked in greyscale.(b) Timeseries of car-bon monoxide concentrations (top) and cloud particle size distri-butions (bottom) on the 19 April 2008 ARCPAC flight. The threecases as described in Sect. 2.3 are highlighed: warm-polluted clouds(red), clean clouds (blue), and polluted clouds (green).
over the volume of the atmosphere, a model-calculated mix-ing ratio of the emitted species at the location of the aircraft isobtained. EDGAR fast track 2000 (Olivier and Berdowski,2001) was used as the anthropogenic emissions inventory,and for biomass burning the inventory was based on fire lo-cations detected by the moderate resolution imaging spectro-radiometer (MODIS, NASA/University of Maryland, 2002)onboard the Terra and Aqua satellites and a land cover clas-sification (Stohl et al., 2007). The model was run with bothGFS (0.5◦ × 0.5◦ horizontal resolution, 26 vertical levels)and ECMWF (1◦ × 1◦ horizontal resolution, 90 vertical lev-els) global meteorological fields.
The modeled transport pathways of the clean and pollutedair masses were verified against satellite imagery and in situmeasurements. Retroplumes calculated from both GFS andECMWF wind fields were used. Both wind fields produced asimilar transport pathway for the warm-polluted case, but dif-fered for the clean and polluted cases, with differences likelyresulting from the different vertical resolutions of the mod-els. Comparison of modeled and measured CO mixing ratios
showed that the GFS winds produced a transport pathwayconsistent with the clean air mass while the ECMWF windfields produced a transport pathway consistent with the pol-luted air mass. This blend of model output is used in thefollowing description of the transport processes (see Supple-ment, Fig. S1–S3).
The retroplumes indicate that the warm-polluted and pol-luted air masses accumulated smoke from biomass burningin Asia, first from agricultural burning in Kazakhstan andsouthern Russia, and then from boreal forest fires betweenLake Baikal and the coast of southeastern Siberia (Warnekeet al., 2009). These emissions mainly occurred during 10–15April, with a greater contribution from the fires in southeast-ern Siberia. The smoke was subsequently advected off thecoast of southeastern Siberia, across northern Japan and be-came entrained into the post cold front airstream of a mid-latitude cyclone forming just east of Japan. Over the next 3days the air masses descended and then ascended slightly asthey traveled northwards coming close to the center of thecyclone where low-level stratus clouds formed by the earlyhours of 18 April. The FLEXPART trajectories and the satel-lite images suggest that the warm-polluted and polluted airmasses were probably influenced by clouds during the 48 hprior to the time they were sampled by the NOAA WP-3D.
Although the FLEXPART retroplumes indicate an Asianorigin for the clean air mass, it did not receive strong emis-sions from biomass burning or anthropogenic sources onthose days. The clean air mass took a different path to theArctic traveling at low altitude under the warm conveyor beltof the cyclone and wrapping around the center of the lowjust prior to the time it was sampled by the WP-3D. Becausethe high level clouds of the warm conveyor belt obscure theview of the lower troposphere we cannot estimate the lengthof time that the air mass was influenced by clouds.
3 Results
3.1 Aerosol characterization
A fundamental challenge for cloud-aerosol interaction stud-ies is characterizing the aerosol that has initiated cloud for-mation. In-cloud measurements of aerosol are difficult to in-terpret, especially in mixed-phase conditions. To address thisproblem, we utilize trace gas observations, such as carbonmonoxide (CO) and acetonitrile, for which the measurementtechnique and the ambient gas are unaffected by clouds.
3.1.1 Cloud condensation nuclei
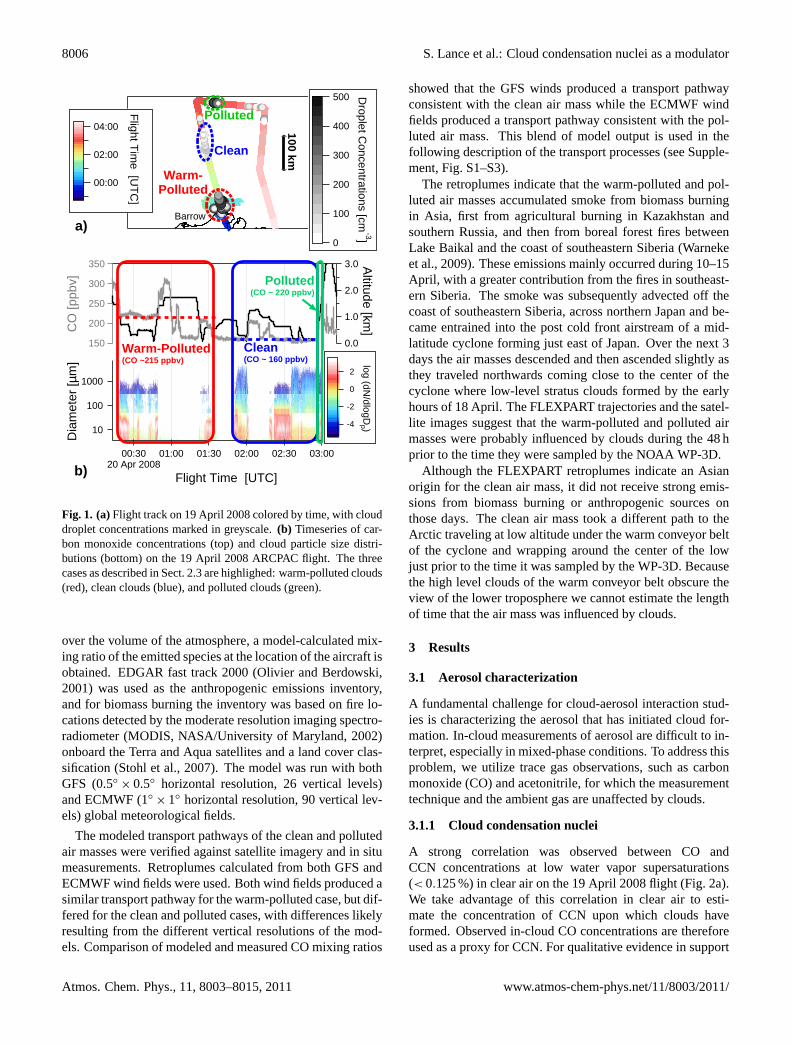
A strong correlation was observed between CO andCCN concentrations at low water vapor supersaturations(< 0.125 %) in clear air on the 19 April 2008 flight (Fig. 2a).We take advantage of this correlation in clear air to esti-mate the concentration of CCN upon which clouds haveformed. Observed in-cloud CO concentrations are thereforeused as a proxy for CCN. For qualitative evidence in support
Atmos. Chem. Phys., 11, 8003–8015, 2011 www.atmos-chem-phys.net/11/8003/2011/
S. Lance et al.: Cloud condensation nuclei as a modulator 8007
60
50
40
30
20
10
0
Lar
ge A
eros
ol (
> 0
.5µm
) [c
m-3
]
350300250200150
CO Mixing Ratio [ppbv]
Intercept = -28.82 ± 1.19Slope = 0.1932 ± 0.00615
R2 = 0.695
c)
1000
800
600
400
200
0 BC
Mix
ing
Rat
io [n
g m
-3]
350300250200150
CO Mixing Ratio [ppbv]
Intercept = -704.6 ± 11.1Slope = 4.702 ± 0.0587
R2 = 0.861
b)
1500
1000
500
0
CC
N a
t < 0
.125
% S
S [c
m-3
]
350300250200150
CO Mixing Ratio [ppbv]
Intercept = -904.31 ± 9.95Slope = 6.741 ± 0.0488
R2 = 0.785
a)
4
3
2
1
0Min
eral
Dus
t (>
0.5
µm)
[cm
-3]
220210200190180170160150
CO Mixing Ratio [ppbv]
Intercept = -6.67 ± 1.52Slope = 0.0420 ± 0.0084
R2 = 0.56
d)
Fig. 2. (a)Cloud Condensation Nuclei (CCN),(b) black carbon (BC),(c)) large aerosol, and(d) mineral dust concentrations as a function ofcarbon monoxide (CO) mixing ratios in clear air during the 19 April 2008 flight. Average (circles) and maximum (squares) measured clouddroplet concentrations for the 3 cases introduced in Fig. 1 are also plotted in Fig. 2a. In polluted conditions (i.e. higher CO), both more CCNand more IN are expected.
of this assumption, regions of higher droplet concentrations(Fig. 1a) correspond to polluted airmasses, as identified byhigher CO concentrations (Fig. 1b). In Fig. 2a, average andmaximum droplet concentrations are directly compared toCCN concentrations for the three different case studies. Themaximum droplet concentrations are consistent with the av-erage CCN concentrations observed in clear air at a givenCO concentration. However, since water vapor supersatu-rations are not known for these mixed-phase clouds, directcomparison between CCN and droplet concentrations is notfully constrained. Supersaturations (relative to liquid water)in these weakly convective Arctic mixed-phase stratus are ex-pected to be quite close to saturation (Korolev and Mazin,2003), therefore we use CCN concentrations measured at thelowest instrument supersaturation (< 0.125 %) in our analy-sis. The relationship between CO and CCN concentrationsat higher supersaturations exhibits more variability, likelydue to greater variability in aerosol particle concentrationsat smaller sizes, but nevertheless exhibits a similar trend (notshown). The difference between the average droplet concen-trations and average CCN concentrations could be a result ofcloud supersaturations< 0.125 % or due to cloud processessuch as collision coalescence, evaporation, dilution or rim-ing, which act to lower droplet concentrations.
3.1.2 Ice nuclei
Measurements of IN were not obtained on board the NOAAWP-3D during the ARCPAC study. However, several differ-ent measurements of aerosol composition and particle sizewere obtained, which are relevant for the ice nucleation effi-ciency of aerosols.
Many studies have shown that ice nucleation efficiency ishighly sensitive to aerosol particle size (e.g., Pruppacher andKlett, 2000). By accounting for both particle size and tem-perature, ice nuclei can sometimes be predicted to within atleast an order of magnitude, which is an improvement of ap-proximately two orders of magnitude over using temperaturealone (DeMott et al., 2010). On the 19 April 2008 ARC-PAC flight, the concentration of large aerosol particles (withdiameter> 0.5 µm) was strongly correlated with CO concen-trations (Fig. 2c). Thus, we expect based on the size distribu-tion of the particles alone that the polluted conditions containmore IN.
However, aerosol compositional differences may lead tosignificant differences in the ice forming potential of theaerosols. For instance, the glaciation indirect effect wasspecifically formulated on the assumption that soot particlesact as contact IN. This model assumption was based on lab-oratory studies showing that oxidized soot from incomplete
www.atmos-chem-phys.net/11/8003/2011/ Atmos. Chem. Phys., 11, 8003–8015, 2011
8008 S. Lance et al.: Cloud condensation nuclei as a modulator
5%
89%
5% 1%
BiomassBurning
41%
10% Sulfate-Organic
0%EC
SeaSalt38%
Mineral Dust4%
Unclassified 7%
9% 9%
55%
27% 3% 1%
82%
7% 7%
70%
21%
1% 4% 3% 1%
83%
4% 10%
1% 2%
Fine aerosol <700 nm
Coarse aerosol >700 nm
Clean Warm-Polluted Polluted
n=839 n=763 n=156
n=168 n=151 n=11
113 cm-3
0.16 cm-3
632 cm-3
1.7 cm-3
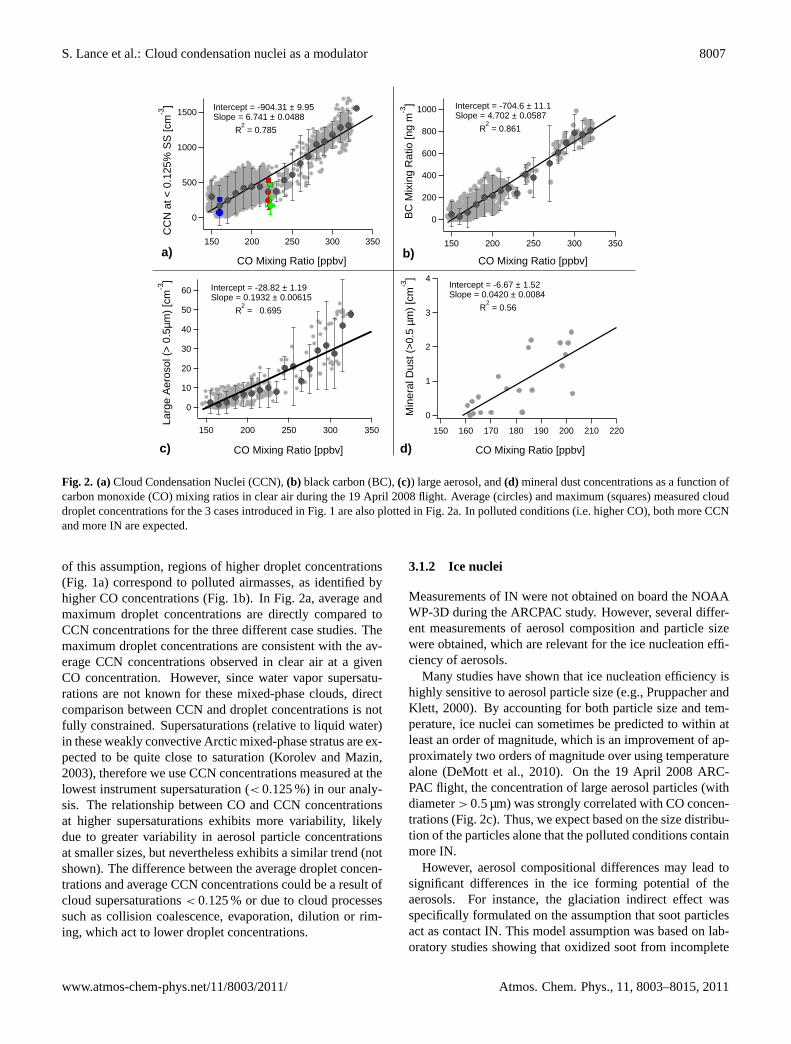
Fig. 3. Fraction of fine and coarse aerosol particle types identifiedby single particle mass spectrometry. Number concentrations in-ferred from the coarse aerosol size distributions are listed in whitetext. Also reported are the number of particles detected by thePALMS for each case (n).
combustion initiates freezing upon contact with droplets evenat fairly warm temperatures (−5 to −20◦C) (Gorbunov etal., 2001). Observations at the high mountain research labo-ratory at Jungfraujoch in Switzerland also showed that blackcarbon (BC) mass is enhanced in ice crystals relative to liquiddroplets, suggesting that some BC-containing particles maypreferentially act as ice nuclei (Cozic et al., 2008). Massconcentrations of BC and CO mixing ratios in clear air werehighly correlated on the 19 April 2008 flight (Fig. 2b). Thus,again we expect that the polluted conditions contain more IN.
Laboratory studies have shown that aerosol particles pro-duced from biomass burning of certain plants (includingsome grasses, hardwood trees and softwood trees) can beefficient immersion IN at relatively cold temperatures of−30◦C (Petters et al., 2009). Biomass burning (BB) emis-sion may include the relatively large ash particles producedas a result of the noncombustible mineral content of plants,as well as biological particles such as pollen and plant debris,bacteria or fungi, the most efficient natural IN known (vonBlohn et al., 2005), which may be thermally lofted alongwith the biomass burning smoke (Reid et al., 1998). Sin-gle particle mass spectrometer observations made with thePALMS instrument show that fine mode (150–700 nm) BBparticles are highly correlated with CO mixing-ratios (notshown). Both the fraction and number concentration of BBparticles are higher in the polluted cases than in the cleancase (Fig. 3).
Mineral dust is one of the most important IN due to a highice nucleation efficiency and global abundance (Cantrell andHeymsfield, 2005; Phillips et al., 2008). Concentrations ofmineral dust particles> 500 nm identified by PALMS anddry aerosol size distribution measurements were correlated
with CO mixing ratios averaged over 5 minute intervals onthe 19 April 2008 Flight (Fig. 2d). Coarse mode mineraldust concentrations were roughly 10 L−1 and 90 L−1 in theclean and polluted environments, respectively (Fig. 3). Thus,again we expect that IN concentrations are greater in the pol-luted cases than in the clean case. However, soluble organicor sulfate coatings can inhibit the ice nucleation efficiencyof mineral dust particles (Mohler et al., 2008; Cziczo et al.,2009). The PALMS measurements indicate that in both theclean and polluted cases, the mineral dust particles are coatedwith organics. The mass of organic coating on the mineraldust particles increases as a function of CO mixing ratio (notshown), suggesting that a smaller fraction of the greater num-ber of mineral dust particles might be acting as IN in the pol-luted cases, at least in the deposition freezing mode. Sincethese mineral dust particles are coated, they may act as INfrom within droplets, as by immersion freezing or contactnucleation from inside-out (Durant and Shaw, 2005).
3.2 Cloud microphysical properties
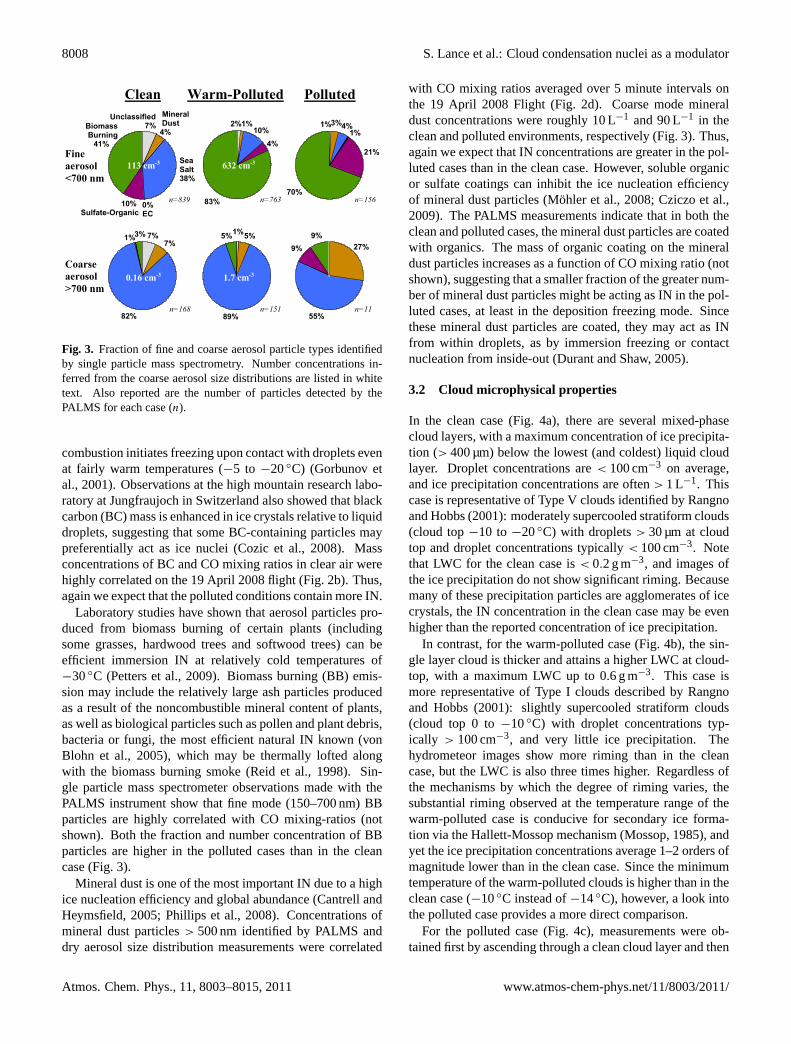
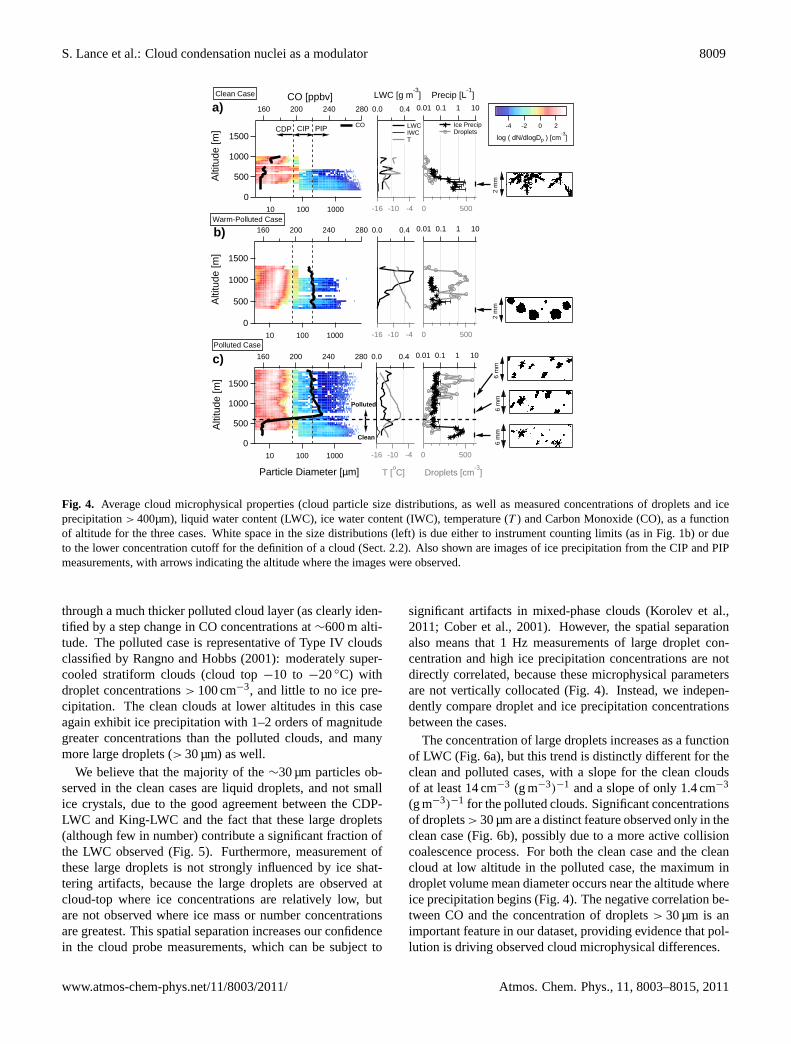
In the clean case (Fig. 4a), there are several mixed-phasecloud layers, with a maximum concentration of ice precipita-tion (> 400 µm) below the lowest (and coldest) liquid cloudlayer. Droplet concentrations are< 100 cm−3 on average,and ice precipitation concentrations are often> 1 L−1. Thiscase is representative of Type V clouds identified by Rangnoand Hobbs (2001): moderately supercooled stratiform clouds(cloud top−10 to −20◦C) with droplets> 30 µm at cloudtop and droplet concentrations typically< 100 cm−3. Notethat LWC for the clean case is< 0.2 g m−3, and images ofthe ice precipitation do not show significant riming. Becausemany of these precipitation particles are agglomerates of icecrystals, the IN concentration in the clean case may be evenhigher than the reported concentration of ice precipitation.
In contrast, for the warm-polluted case (Fig. 4b), the sin-gle layer cloud is thicker and attains a higher LWC at cloud-top, with a maximum LWC up to 0.6 g m−3. This case ismore representative of Type I clouds described by Rangnoand Hobbs (2001): slightly supercooled stratiform clouds(cloud top 0 to−10◦C) with droplet concentrations typ-ically > 100 cm−3, and very little ice precipitation. Thehydrometeor images show more riming than in the cleancase, but the LWC is also three times higher. Regardless ofthe mechanisms by which the degree of riming varies, thesubstantial riming observed at the temperature range of thewarm-polluted case is conducive for secondary ice forma-tion via the Hallett-Mossop mechanism (Mossop, 1985), andyet the ice precipitation concentrations average 1–2 orders ofmagnitude lower than in the clean case. Since the minimumtemperature of the warm-polluted clouds is higher than in theclean case (−10◦C instead of−14◦C), however, a look intothe polluted case provides a more direct comparison.
For the polluted case (Fig. 4c), measurements were ob-tained first by ascending through a clean cloud layer and then
Atmos. Chem. Phys., 11, 8003–8015, 2011 www.atmos-chem-phys.net/11/8003/2011/
S. Lance et al.: Cloud condensation nuclei as a modulator 8009
1500
1000
500
0
Alti
tude
[m]
5000
280240200160
CO [ppbv]0.40.0
LWC [g m-3
]
10 100 1000 -16 -10 -4
0.01 0.1 1 10
Precip [L-1
]
a)
CDP CIP PIP
Clean Case
LWC IWC T
Ice Precip Droplets
CO
1500
1000
500
0
Alti
tude
[m]
5000
0.01 0.1 1 10280240200160 0.40.0
10 100 1000 -16 -10 -4
b)Warm-Polluted Case
1500
1000
500
0
Alti
tude
[m]
5000
Droplets [cm-3
]
0.40.0280240200160 0.01 0.1 1 10
10 100 1000
Particle Diameter [µm]
-16 -10 -4
T [oC]
Polluted
Clean
c)Polluted Case
6 m
m 6
mm
2 m
m 2
mm
6 m
m
10000
280200 0.01 0.40.0
10 2500-10-2
-4 -2 0 2
log ( dN/dlogDp ) [cm-3
]
Fig. 4. Average cloud microphysical properties (cloud particle size distributions, as well as measured concentrations of droplets and iceprecipitation> 400µm), liquid water content (LWC), ice water content (IWC), temperature (T ) and Carbon Monoxide (CO), as a functionof altitude for the three cases. White space in the size distributions (left) is due either to instrument counting limits (as in Fig. 1b) or dueto the lower concentration cutoff for the definition of a cloud (Sect. 2.2). Also shown are images of ice precipitation from the CIP and PIPmeasurements, with arrows indicating the altitude where the images were observed.
through a much thicker polluted cloud layer (as clearly iden-tified by a step change in CO concentrations at∼600 m alti-tude. The polluted case is representative of Type IV cloudsclassified by Rangno and Hobbs (2001): moderately super-cooled stratiform clouds (cloud top−10 to −20◦C) withdroplet concentrations> 100 cm−3, and little to no ice pre-cipitation. The clean clouds at lower altitudes in this caseagain exhibit ice precipitation with 1–2 orders of magnitudegreater concentrations than the polluted clouds, and manymore large droplets (> 30 µm) as well.
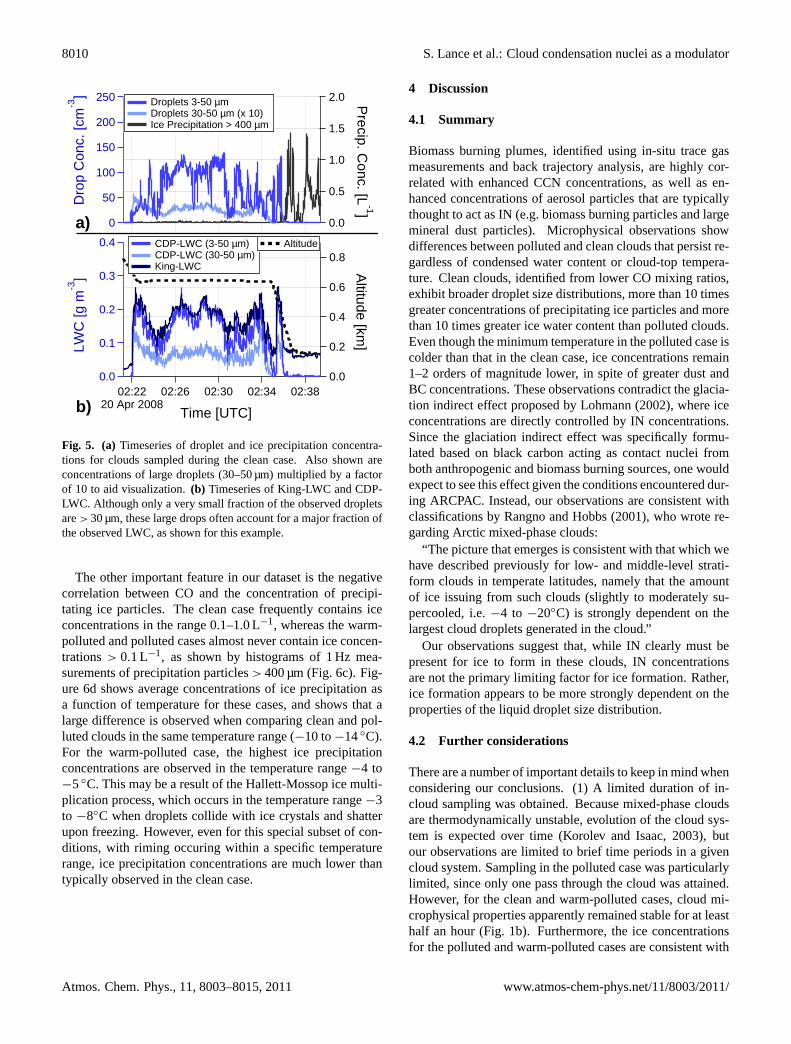
We believe that the majority of the∼30 µm particles ob-served in the clean cases are liquid droplets, and not smallice crystals, due to the good agreement between the CDP-LWC and King-LWC and the fact that these large droplets(although few in number) contribute a significant fraction ofthe LWC observed (Fig. 5). Furthermore, measurement ofthese large droplets is not strongly influenced by ice shat-tering artifacts, because the large droplets are observed atcloud-top where ice concentrations are relatively low, butare not observed where ice mass or number concentrationsare greatest. This spatial separation increases our confidencein the cloud probe measurements, which can be subject to
significant artifacts in mixed-phase clouds (Korolev et al.,2011; Cober et al., 2001). However, the spatial separationalso means that 1 Hz measurements of large droplet con-centration and high ice precipitation concentrations are notdirectly correlated, because these microphysical parametersare not vertically collocated (Fig. 4). Instead, we indepen-dently compare droplet and ice precipitation concentrationsbetween the cases.
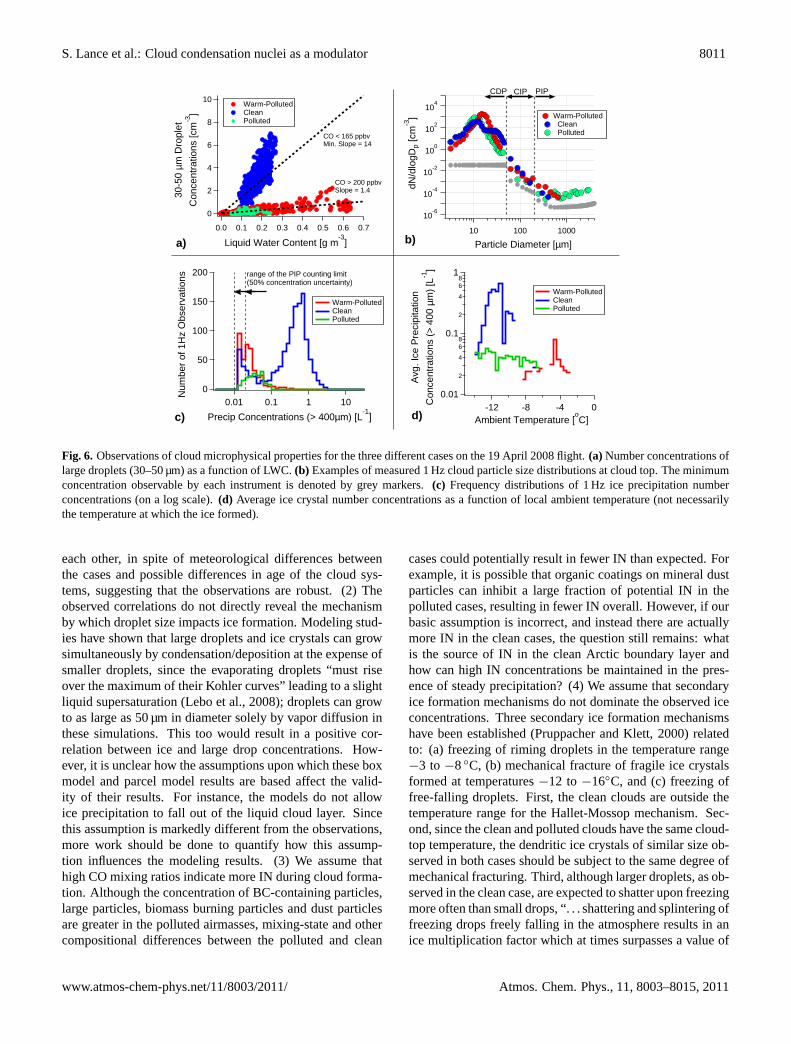
The concentration of large droplets increases as a functionof LWC (Fig. 6a), but this trend is distinctly different for theclean and polluted cases, with a slope for the clean cloudsof at least 14 cm−3 (g m−3)−1 and a slope of only 1.4 cm−3
(g m−3)−1 for the polluted clouds. Significant concentrationsof droplets> 30 µm are a distinct feature observed only in theclean case (Fig. 6b), possibly due to a more active collisioncoalescence process. For both the clean case and the cleancloud at low altitude in the polluted case, the maximum indroplet volume mean diameter occurs near the altitude whereice precipitation begins (Fig. 4). The negative correlation be-tween CO and the concentration of droplets> 30 µm is animportant feature in our dataset, providing evidence that pol-lution is driving observed cloud microphysical differences.
www.atmos-chem-phys.net/11/8003/2011/ Atmos. Chem. Phys., 11, 8003–8015, 2011
8010 S. Lance et al.: Cloud condensation nuclei as a modulator
02:2220 Apr 2008
02:26 02:30 02:34 02:38
Time [UTC]
2.0
1.5
1.0
0.5
0.0
Precip. C
onc. [L-1]
0.4
0.3
0.2
0.1
0.0
LW
C [g
m-3
]250
200
150
100
50
0
Dro
p C
onc.
[cm
-3]
0.8
0.6
0.4
0.2
0.0
Altitude [km
]
CDP-LWC (3-50 µm) CDP-LWC (30-50 µm) King-LWC
Droplets 3-50 µm Droplets 30-50 µm (x 10) Ice Precipitation > 400 µm
Altitude
a)
b)
Fig. 5. (a) Timeseries of droplet and ice precipitation concentra-tions for clouds sampled during the clean case. Also shown areconcentrations of large droplets (30–50 µm) multiplied by a factorof 10 to aid visualization.(b) Timeseries of King-LWC and CDP-LWC. Although only a very small fraction of the observed dropletsare> 30 µm, these large drops often account for a major fraction ofthe observed LWC, as shown for this example.
The other important feature in our dataset is the negativecorrelation between CO and the concentration of precipi-tating ice particles. The clean case frequently contains iceconcentrations in the range 0.1–1.0 L−1, whereas the warm-polluted and polluted cases almost never contain ice concen-trations> 0.1 L−1, as shown by histograms of 1 Hz mea-surements of precipitation particles> 400 µm (Fig. 6c). Fig-ure 6d shows average concentrations of ice precipitation asa function of temperature for these cases, and shows that alarge difference is observed when comparing clean and pol-luted clouds in the same temperature range (−10 to−14◦C).For the warm-polluted case, the highest ice precipitationconcentrations are observed in the temperature range−4 to−5◦C. This may be a result of the Hallett-Mossop ice multi-plication process, which occurs in the temperature range−3to −8◦C when droplets collide with ice crystals and shatterupon freezing. However, even for this special subset of con-ditions, with riming occuring within a specific temperaturerange, ice precipitation concentrations are much lower thantypically observed in the clean case.
4 Discussion
4.1 Summary
Biomass burning plumes, identified using in-situ trace gasmeasurements and back trajectory analysis, are highly cor-related with enhanced CCN concentrations, as well as en-hanced concentrations of aerosol particles that are typicallythought to act as IN (e.g. biomass burning particles and largemineral dust particles). Microphysical observations showdifferences between polluted and clean clouds that persist re-gardless of condensed water content or cloud-top tempera-ture. Clean clouds, identified from lower CO mixing ratios,exhibit broader droplet size distributions, more than 10 timesgreater concentrations of precipitating ice particles and morethan 10 times greater ice water content than polluted clouds.Even though the minimum temperature in the polluted case iscolder than that in the clean case, ice concentrations remain1–2 orders of magnitude lower, in spite of greater dust andBC concentrations. These observations contradict the glacia-tion indirect effect proposed by Lohmann (2002), where iceconcentrations are directly controlled by IN concentrations.Since the glaciation indirect effect was specifically formu-lated based on black carbon acting as contact nuclei fromboth anthropogenic and biomass burning sources, one wouldexpect to see this effect given the conditions encountered dur-ing ARCPAC. Instead, our observations are consistent withclassifications by Rangno and Hobbs (2001), who wrote re-garding Arctic mixed-phase clouds:
“The picture that emerges is consistent with that which wehave described previously for low- and middle-level strati-form clouds in temperate latitudes, namely that the amountof ice issuing from such clouds (slightly to moderately su-percooled, i.e.−4 to −20◦C) is strongly dependent on thelargest cloud droplets generated in the cloud.”
Our observations suggest that, while IN clearly must bepresent for ice to form in these clouds, IN concentrationsare not the primary limiting factor for ice formation. Rather,ice formation appears to be more strongly dependent on theproperties of the liquid droplet size distribution.
4.2 Further considerations
There are a number of important details to keep in mind whenconsidering our conclusions. (1) A limited duration of in-cloud sampling was obtained. Because mixed-phase cloudsare thermodynamically unstable, evolution of the cloud sys-tem is expected over time (Korolev and Isaac, 2003), butour observations are limited to brief time periods in a givencloud system. Sampling in the polluted case was particularlylimited, since only one pass through the cloud was attained.However, for the clean and warm-polluted cases, cloud mi-crophysical properties apparently remained stable for at leasthalf an hour (Fig. 1b). Furthermore, the ice concentrationsfor the polluted and warm-polluted cases are consistent with
Atmos. Chem. Phys., 11, 8003–8015, 2011 www.atmos-chem-phys.net/11/8003/2011/
S. Lance et al.: Cloud condensation nuclei as a modulator 8011
10
8
6
4
2
0
30-
50 µ
m D
ropl
et
Con
cent
ratio
ns [c
m-3
]
0.70.60.50.40.30.20.10.0
Liquid Water Content [g m-3
]
CO < 165 ppbvMin. Slope = 14
CO > 200 ppbvSlope = 1.4
Warm-Polluted Clean Polluted
a)
200
150
100
50
0
Num
ber
of 1
Hz
Obs
erva
tions
0.01 0.1 1 10
Precip Concentrations (> 400µm) [L-1
]
Warm-Polluted Clean Polluted
range of the PIP counting limit(50% concentration uncertainty)
c)
0.01
2
4
68
0.1
2
4
68
1
Avg
. Ice
Pre
cipi
tatio
n
Con
cent
ratio
ns (
> 4
00 µ
m)
[L-1
]
-12 -8 -4 0 Ambient Temperature [
oC]
Warm-Polluted Clean Polluted
d)
10-6
10-4
10-2
100
102
104
dN
/dlo
gDp
[cm
-3]
10 100 1000
Particle Diameter [µm]
CDP CIP PIP
Warm-Polluted Clean Polluted
b)
Fig. 6. Observations of cloud microphysical properties for the three different cases on the 19 April 2008 flight.(a) Number concentrations oflarge droplets (30–50 µm) as a function of LWC.(b) Examples of measured 1 Hz cloud particle size distributions at cloud top. The minimumconcentration observable by each instrument is denoted by grey markers.(c) Frequency distributions of 1 Hz ice precipitation numberconcentrations (on a log scale).(d) Average ice crystal number concentrations as a function of local ambient temperature (not necessarilythe temperature at which the ice formed).
each other, in spite of meteorological differences betweenthe cases and possible differences in age of the cloud sys-tems, suggesting that the observations are robust. (2) Theobserved correlations do not directly reveal the mechanismby which droplet size impacts ice formation. Modeling stud-ies have shown that large droplets and ice crystals can growsimultaneously by condensation/deposition at the expense ofsmaller droplets, since the evaporating droplets “must riseover the maximum of their Kohler curves” leading to a slightliquid supersaturation (Lebo et al., 2008); droplets can growto as large as 50 µm in diameter solely by vapor diffusion inthese simulations. This too would result in a positive cor-relation between ice and large drop concentrations. How-ever, it is unclear how the assumptions upon which these boxmodel and parcel model results are based affect the valid-ity of their results. For instance, the models do not allowice precipitation to fall out of the liquid cloud layer. Sincethis assumption is markedly different from the observations,more work should be done to quantify how this assump-tion influences the modeling results. (3) We assume thathigh CO mixing ratios indicate more IN during cloud forma-tion. Although the concentration of BC-containing particles,large particles, biomass burning particles and dust particlesare greater in the polluted airmasses, mixing-state and othercompositional differences between the polluted and clean
cases could potentially result in fewer IN than expected. Forexample, it is possible that organic coatings on mineral dustparticles can inhibit a large fraction of potential IN in thepolluted cases, resulting in fewer IN overall. However, if ourbasic assumption is incorrect, and instead there are actuallymore IN in the clean cases, the question still remains: whatis the source of IN in the clean Arctic boundary layer andhow can high IN concentrations be maintained in the pres-ence of steady precipitation? (4) We assume that secondaryice formation mechanisms do not dominate the observed iceconcentrations. Three secondary ice formation mechanismshave been established (Pruppacher and Klett, 2000) relatedto: (a) freezing of riming droplets in the temperature range−3 to −8◦C, (b) mechanical fracture of fragile ice crystalsformed at temperatures−12 to −16◦C, and (c) freezing offree-falling droplets. First, the clean clouds are outside thetemperature range for the Hallet-Mossop mechanism. Sec-ond, since the clean and polluted clouds have the same cloud-top temperature, the dendritic ice crystals of similar size ob-served in both cases should be subject to the same degree ofmechanical fracturing. Third, although larger droplets, as ob-served in the clean case, are expected to shatter upon freezingmore often than small drops, “. . . shattering and splintering offreezing drops freely falling in the atmosphere results in anice multiplication factor which at times surpasses a value of
www.atmos-chem-phys.net/11/8003/2011/ Atmos. Chem. Phys., 11, 8003–8015, 2011
8012 S. Lance et al.: Cloud condensation nuclei as a modulator
2 but rarely, if ever, exceeds a value of 10” (Pruppacher andKlett, 2000). Known ice multiplication mechanisms, there-fore, are apparently insufficient to explain the observed dif-ference in ice concentrations, which is often greater than afactor of 10.
4.3 Ice nucleation mechanisms
While it appears that large droplets support ice formation, itis not entirely clear what ice nucleation mechanisms couldbe responsible for this correlation.
In the case of immersion freezing, smaller droplets mayfreeze less effectively since increased solute concentrationslower the freezing point temperature (de Boer et al., 2010).However, when droplets are greater than∼10 µm in diame-ter, a condition that is very often met at cloud-top in Arcticmixed-phase stratus (Rangno and Hobbs, 2001; Lawson etal., 2001; Korolev et al., 2003; McFarquhar et al., 2007), so-lute concentrations are typically too low (< 10−3 mol L−1)
(Diehl et al., 2006) to significantly inhibit immersion freez-ing (Pruppacher and Klett, 2000). If there is a surface en-hanced nucleation rate (Djikaev et al., 2002; Shaw et al.,2005; Durant and Shaw, 2005), large droplets may be morelikely to freeze if internal circulations that develop within thedrop (Pruppacher and Beard, 1970) promote contact betweenimmersed IN and the drop surface. It may be possible thatthe collision coalescence process also promotes this type offreezing mechanism.
Since contact nucleation has been shown in the labora-tory to occur at warmer temperatures than does immersionfreezing (Young, 1974; Cooper, 1974), contact freezing mayplay an important role in these slightly to moderately super-cooled clouds. Diehl et al. (2006) showed that the collisionefficiency between submicron aerosol particles and droplets(including Brownian motions but not phoretic effects) in-creases with droplet size, which could enhance ice forma-tion via contact freezing where large droplets are present.Unfortunately, contact nucleation is the least understood ofany freezing mechanism. For instance, it is unclear to whatdegree particles must be dry to act as contact nuclei (Prup-pacher and Klett, 2000) and how such particles could remaindry within the same environment as supercooled droplets. Ifthe contact nuclei must be dry, it is also unclear then whycontact nucleation from the inside appears to act in a simi-lar fashion, with freezing temperatures 3–5◦C greater thanthat for which the same particle is immersed in the droplet(Durant and Shaw, 2005; Shaw et al., 2005). Furthermore,diffusio-, thermo- and electro-phoretic effects resulting fromgrowing or evaporating droplets can substantially alter thedroplet size dependent collision efficiency in complex ways(Young, 1974), which also need to be considered.
There is no reason we know of to expect ice nucleationby the deposition or condensation freezing mechanisms tobe correlated with droplet size. In agreement with de Boer
et al. (2011), our observations suggest that liquid-dependentice nucleation modes are dominant.
5 Conclusions
This study provides compelling evidence that CCN are im-portant for modulating ice processes in mixed-phase clouds,through impacts on the droplet size distribution. We haveshown that measurements of gas phase tracers like CO thatpersist in cloudy environments are useful for identifying pol-luted clouds. However, more observations are needed to fur-ther constrain the specific mechanisms responsible for ob-served differences in cloud microphysical properties. Furtherwork must be done to characterize ambient IN and to distin-guish between ice nucleation modes. Reliable cloud micro-physical measurements in the 50–400 µm size range, and theability to distinguish between liquid droplets and ice parti-cles in this size range, are needed for accurately capturingthe initiation of ambient ice formation. Specifically, ice shat-tering artifacts need to be prevented. Better constraints onthe evolving cloud dynamics (e.g. updraft velocity and cloudradiative properties), humidity and ice crystal growth ratesare also needed for accurately modeling the highly sensitiveprocesses taking place in Arctic mixed-phase clouds.
Supplementary material related to thisarticle is available online at:http://www.atmos-chem-phys.net/11/8003/2011/acp-11-8003-2011-supplement.pdf.
Acknowledgements.All authors acknowledge support from theNOAA climate and air quality programs. We thank Jorge Delgadoand the NOAA Aircraft Operations Center for allowing use of theirequipment and for technical support in the field. S. Lance thanksthe US National Research Council for a research associateshipsprogram postdoctoral fellowship. A. Nenes acknowledges supportfrom a US NSF CAREER grant. R. Moore acknowledges supportfrom a US DOE global change education program graduateresearch fellowship. M. Shupe acknowledges support by US DOEgrant DE-FG01-05ER63965. J. F. Burhart and A. Stohl weresupported by the Norwegian Research Council in the framework ofPOLARCAT-Norway. MODIS hotspot data provided courtesy ofNASA and the University of Maryland.
Edited by: P. Monks
Disclaimer
US government work not protected by US copyright laws. The useof trade, firm, or corporation names in this publication is for theinformation and convenience of the reader. Such use does not implyan official endorsement or approval by the University of Colorado,the United States Department of Commerce or the National Oceanicand Atmospheric Administration of any product or service to theexclusion of others that may be suitable.
Atmos. Chem. Phys., 11, 8003–8015, 2011 www.atmos-chem-phys.net/11/8003/2011/
S. Lance et al.: Cloud condensation nuclei as a modulator 8013
References
Albrecht, B. A.: Aerosols, cloud microphysics, and fractionalcloudiness, Science, 245(4923), 1227—1230, 1989.
Bergeron, T.: On the physics of clouds and precipitation, Proc. VeAssemblee Generale de l’Union Geodesique et Geophysique In-ternationale, Lisbon, Portugal, International Union of Geodesyand Geophysics, 156–180, 1935.
Borys, R. D., Lowenthal, D. H., Cohn, S. A., and Brown, W. O. J.:Mountaintop and radar measurements of anthropogenic aerosoleffects on snow growth and snowfall rate, Geophys. Res. Lett.,30(10), 1538,doi:10.1029/2002GL016855, 2003.
Brock, C. A., Cozic, J., Bahreini, R., Froyd, K. D., Middlebrook,A. M., McComiskey, A., Brioude, J., Cooper, O. R., Stohl, A.,Aikin, K. C., de Gouw, J. A., Fahey, D. W., Ferrare, R. A., Gao,R.-S., Gore, W., Holloway, J. S., Hubler, G., Jefferson, A., Lack,D. A., Lance, S., Moore, R. H., Murphy, D. M., Nenes, A.,Novelli, P. C., Nowak, J. B., Ogren, J. A., Peischl, J., Pierce,R. B., Pilewskie, P., Quinn, P. K., Ryerson, T. B., Schmidt,K. S., Schwarz, J. P., Sodemann, H., Spackman, J. R., Stark,H., Thomson, D. S., Thornberry, T., Veres, P., Watts, L. A.,Warneke, C., and Wollny, A. G.: Characteristics, sources, andtransport of aerosols measured in spring 2008 during the aerosol,radiation, and cloud processes affecting Arctic climate (ARC-PAC) project, Atmos. Chem. Phys. Discuss., 10, 27361–27434,doi:10.5194/acpd-10-27361-2010, 2010.
Cantrell, W. and Heymsfield, A.: Production of ice in troposphericclouds, A Review, Bull. Amer. Meteor. Soc., 795–807, 2005.
Cober, S. G., Isaac, G. A., Korolev, A. V., and Strapp, J. W.: As-sessing cloud-phase conditions, J. Appl. Met., 40, 1967–1983,2001.
Cooper, W. A.: A possible mechanism for contact nucleation, J.Atmos. Sci., 31, 1832–1837, 1974.
Cozic, J., Mertes, S., Verheggen, B., Cziczo, D. J., Gallavardin,S. J., Walter, S., Baltensperger, U., and Weingartner, E.: Blackcarbon enrichment in atmospheric ice particle residuals observedin lower tropospheric mixed phase clouds, J. Geophys. Res., 113,D15209,doi:10.1029/2007JD009266, 2008.
Curry, J. A., Rossow, W. B., Randall, D., and Schramm, J. L.:Overview of Arctic cloud and radiation characteristics, J. Clim.,9, 1731–1764, 1996.
Cziczo, D. J., Froyd, K. D., Gallavardin, S. J., Mohler, O., Benz, S.,Saathoff, H., and Murphy, D. M.: Deactivation of ice nuclei dueto atmospherically relevant surface coatings, Environ. Res. Lett.,4, 044013,doi:10.1088/1748-9326/4/4/044013, 2009.
de Boer, G., Hashino, T., and Tripoli, G. J.: Ice nucleation throughimmersion freezing in mixed-phase stratiform clouds: Theoryand numerical simulations, Atmos. Res., 96, 315–324, 2010.
de Boer, G., Morrison, H., Shupe, M. D., and Hildner, R.: Evi-dence of liquid dependent ice nucleation in high-latitude strati-form clouds from surface remote sensors, Geophys. Res. Lett.,38, L01803,doi:10.1029/2010GL046016, 2011.
DeMott, P. J., Prenni, A. J., Liu, X., Kreidenweis, S. M., Petters, M.D., Twohy, C. H., Richardson, M. S., Eidhammer, T., and Rogers,D. C.: Predicting global atmospheric ice nuclei distributions andtheir impacts on climate, Proc. Nat. Acad. Sci., 107(25), 11217–11222, 2010.
Diehl, K., Simmel, M., and Wurzler, S.: Numerical sensitivity stud-ies on the impact of aerosol properties and drop freezing modeson the glaciation, microphysics, and dynamics of clouds, J. Geo-
phys. Res., 111, D07202,doi:10.1029/2005JD005884, 2006.Djikaev, Y. S., Tabazadeh, A., Hamill, P., and Reiss, H.: Thermody-
namic conditions for the surface-stimulated crystallization of at-mospheric droplets, J. Phys. Chem. A, 106, 10247–10253, 2002.
Durant, A. J. and Shaw, R. A.: Evaporation freezing by con-tact nucleation inside-out, Geophys. Res. Lett., 32, L20814,doi:10.1029/2005GL024175, 2005.
Findeisen, W.: Kolloid-meteorologische vorgange beineiderschlags-bildung, Meteorologiche Zeitschrift, 55, 121–133,1938.
Garrett, T. J., Radke, L. F., and Hobbs, P. V.: Aerosol effects oncloud emissivity and surface longwave heating in the Arctic, J.Atmos. Sci., 59, 769–778, 2002.
Garrett, T. J., Zhao, C., and Novelli, P. C.: Assessing the relativecontributions of transport efficiency and scavenging to seasonalvariability in Arctic aerosol, Tellus, 62B, 190–196, 2010.
Gorbunov, B., Baklanov, A., Kakutkina, N., Windsor, H. L., andToumi, R.: Ice nucleation on soot particles, J. Aeros. Sci. 32,199–215, 2001.
Gultepe, I. and Isaac, G. A.: Scale effects on averaging of clouddroplet and aerosol number concentrations: Observations andmodels, J. Climate, 12, 1268–1279, 1999.
Harrington, J. Y. and Olsson, P. Q.: A method for the parameteri-zation of cloud optical properties in bulk and bin microphysicalmodels, Implications for Arctic cloudy boundary layers, Atmos.Res., 57(1), 51–80, 2001.
Harrington, J. Y., Reisin, T., Cotton, W. R., and Kreidenweis, S.M.: Cloud resolving simulations of Arctic stratus – Part II:Transition-season clouds, Atmos. Res., 51(1), 45–75, 1999.
Hobbs, P. V. and Rangno, A. L.: Ice Particle Concentrations inClouds, J. Atmos. Sci., 42(23), 2523–2549, 1985.
Hobbs, P. V. and Rangno, A. L.: Microstructures of low and middle-level clouds over the Beaufort sea, Q. J. R. Meterol. Soc., 124,2035–2071, 1998.
Intrieri, J. M., Shupe, M. D., Uttal, T., and McCarty, B. J.:An annual cycle of Arctic cloud characteristics observed byradar and lidar at SHEBA, J. Geophys. Res., 107, 8030,doi:10.1029/2000JC000423, 2002.
Jiang, H. L., Cotton, W. R., Pinto, J. O., Curry, J. A., and Weiss-bluth, M. J.: Cloud resolving simulations of mixed-phase Arcticstratus observed during BASE: Sensitivity to concentration of icecrystals and large-scale heat and moisture advection, J. Atmos.Sci., 57(13), 2105–2117, 2000.
King, W. D., Parkin, D. A., and Handsworth, R. J.: A hot-wire liq-uid water device having fully calculable response characteristics,J. Appl. Meteor., 1809–1813, 1978.
Korolev, A. V. and Isaac, G. A.: Phase transformation of mixed-phase clouds, Q. J. R. Meteorol. Soc., 129, 19–38, 2003.
Korolev, A. V. and Mazin, I. P.: Supersaturation of water vapor inclouds, J. Atmos. Sci., 60, 2957–2974, 2003.
Korolev, A. V., Isaac, G. A., Cober, S. G., Strapp, W., and Hallett,J.: Microphysical characterization of mixed-phase clouds, Q. J.R. Meteorol. Soc., 129, 39–65, 2003.
Korolev, A. V., Emery, E. F., Strapp, J. W., Cober, S. G., Isaac,G. A., and Wasey, M.: Small ice particle observations intropospheric clouds: fact or artifact? Airborne icing instru-mentation evaluation experiment, Bull. Amer. Meteor. Soc.,doi:10.1175/2010BAMS3141.1, in press, 2011.
www.atmos-chem-phys.net/11/8003/2011/ Atmos. Chem. Phys., 11, 8003–8015, 2011
8014 S. Lance et al.: Cloud condensation nuclei as a modulator
Lance, S., Medina, J., Smith, J. N., and Nenes, A.: Mapping theoperation of the DMT continuous flow CCN counter, AerosolSci. Technol., 40(4), 242–254, 2006.
Lance, S., Brock, C. A., Rogers, D., and Gordon, J. A.: Waterdroplet calibration of a cloud droplet probe and in-flight perfor-mance in liquid, ice and mixed-phase clouds during ARCPAC,Atmos. Meas. Tech. Discuss., 3, 3133–3177,doi:10.5194/amtd-3-3133-2010, 2010.
Lawson, R. P. and Baker, B. A.: Improvement in determination ofice water content from two-dimensional particle imagery, Pt. II:Applications to collected data, J. Appl. Meteor. Climat., 45,1291–1303, 2006.
Lawson, R. P, Baker, B. A., Schmitt, C. G., and Jensen, T. L.:An overview of microphysical properties of Arctic clouds ob-served in May and July 1998 during FIRE ACE, J. Geophys.Res., 106(D14), 14989–15014, 2001.
Lebo, Z. J., Johnson, N. C., and Harrington, J. Y.: Ra-diative influences on ice crystal and droplet growth withinmixed-phase stratus clouds, J. Geophys. Res., 113, D09203,doi:10.1029/2007JD009262, 2008.
Lohmann, U.: A glaciation indirect aerosol effect causedby soot aerosols, Geophys. Res. Lett., 29(4), 1052,doi:10.1029/2001GL014357, 2002.
Lohmann, U. and Feichter, J.: Global indirect aerosol effects: a re-view, Atmos. Chem. Phys., 5, 715–737,doi:10.5194/acp-5-715-2005, 2005.
Lubin, D. and Vogelmann, A. M.: A climatologically significantaerosol longwave indirect effect in the Arctic, Nature Letters,439(26), 453–456, 2006.
McFarquhar, G. M., Zhang, G., Poellot, M. R., Kok, G. L., Mc-Coy, R., Tooman, T., Fridlind, A., and Heymsfield, A. J.: Iceproperties of single-layer stratocumulus during the mixed-phasearctic cloud experiment: 1. Observations, J. Geophys. Res., 112,D24201,doi:10.1029/2007JD008633, 2007.
Mitchell, D. L., Zhang, R., and Pitter, R. L.: Mass-dimensional rela-tionships for ice particles and the influence of riming on snowfallrates, J. Appl. Met., 29, 153–163, 1990.
Mohler, O., Benz, S., Saathoff, H., Schnaiter, M., Wagner, R.,Schneider, J., Walter, S., Ebert, V., and Wagner, S.: The ef-fect of organic coating on the heterogeneous ice nucleation ef-ficiency of mineral dust aerosols, Environ. Res. Lett., 3, 025007,doi:10.1088/1748-9326/3/2/025007, 2008.
Morrison, H., Shupe, M. D., Pinto, J. O., and Curry, J. A.: Possi-ble roles of ice nucleation mode and ice nuclei depletion in theextended lifetime of Arctic mixed-phase clouds, Geophys. Res.Lett., 32, L18801,doi:10.1029/2005GL023614, 2005.
Mossop, S. C.: Secondary ice particle production during rimegrowth: The effect of drop size distribution and rimer velocity,Q. J. R. Meteorol. Soc., 111, 1113–1124, 1985.
Murphy, D. M., Cziczo, D. J., Froyd, K. D., Hudson, P. K., Matthew,B. M., Middlebrook, A. M., Peltier, R. E., Sullivan, A., Thomson,D. S., and Weber, R. J.: Single-particle mass spectrometry oftropospheric aerosol particles, J. Geophys. Res., 111, D23S32,doi:10.1029/2006JD007340, 2006.
NASA/University of Maryland. MODIS Hotspot/Active Fire Detec-tions. Data set. MODIS Rapid Response Project, NASA/GSFC(producer), University of Maryland, Fire information for re-source management system (distributors), available on-line athttp://maps.geog.umd.edu/firms/, 2002.
Olivier, J. G. J. and Berdowski, J. J. M.: Global emission sourcesand sinks, A. A. Balkema, Brookfield, Vt., 2001.
Petters, M. D., Parsons, M. T., Prenni, A. J., DeMott, P. J., Kreiden-weis, S. M., Carrico, C. M., Sullivan, A. P., McMeeking, G. R.,Levin, E., Wold, C. E., Collett Jr., J. L., and Moosmuller, H.: Icenuclei emissions from biomass burning, J. Geophys. Res., 114,D07209,doi:10.1029/2008JD011532, 2009.
Phillips, V. T. J., DeMott, P.J., and Andronache, C.: An empiri-cal parameterization of heterogeneous ice nucleation for multi-ple chemical species of aerosol, J. Atmos. Sci., 65, 2757–2783,2008.
Pinto, J. O.: Autumnal mixed-phase cloudy boundary layers in theArctic. J. Atmos. Sci., 55, 2016–2038, 1998.
Pruppacher, H. R. and Beard. K. V.: A wind tunnel investigation ofthe internal circulation and shape of water drops falling at termi-nal velocity in air, Quart. J. R. Met. Soc., 96, 247–256, 1970.
Pruppacher, H. R. and Klett, J. D.: Microphysics of clouds and pre-cipitation, 2nd Ed., Kluwer Academic Publishers, the Nether-lands, 2000.
Quinn, P. K., Shaw, G., Andrews, E., Dutton, E. G., Ruoho-Airola,T., and Gong, S.: Arctic haze: Current trends and knowledgegaps, Tellus, 59B, 99–114, 2007.
Radke, L. F. and Hobbs, P. V.: Airborne observations of Arcticaerosols. III: Origins and effects of airmasses, Geophys. Res.Lett., 11(5), 401–404, 1984.
Rahn, K. A, Borys, R. D., and Shaw, G. E.: The Asian source ofArctic haze bands, Nature, 268, 713–715, 1977.
Rangno, A. L. and Hobbs, P. V.: Ice particles in stratiform cloudsin the Arctic and possible mechanisms for the production of highice concentrations, J. Geophys. Res., 106(D14), 15065–15075,2001.
Reid, J. S., Hobbs, P. V., Ferek, R. J., Blake, D. R., Mar-tins, J. V., Dunlap, M. R., and Liousse, C.: Physical, chem-ical and optical properties of regional hazes dominated bysmoke in Brazil, J. Geophys. Res., 103(D24), 23059–32080,doi:10.1029/98JD00458, 1998.
Roberts, G. and Nenes, A.: A continuous-flow longitudinal thermal-gradient CCN chamber for atmospheric measurements, Aeros.Sci. Tech., 39, 206–221,doi:10.1080/027868290913988, 2005.
Schwarz, J. P., Gao, R.-S., Fahey, D. W., Thomson, D. S., Watts,L. A., Wilson, J. C., Reeves, J. M., Darbehesti, M., Baum-gardner, D. G., Kok, G. L., Chung, S. H., Schulz, M., Hen-dricks, J., Lauer, A., Karcher, B., Slowik, J. G., Rosenlof,K. H., Thompson, R. L., Langford, A. O., Loewenstein, M.,and Aikin, K. C.: Single-particle measurements of midlatitudeblack carbon and light-scattering aerosols from the boundarylayer to the lower stratosphere, J. Geophys. Res., 111, D16207,doi:10.1029/2006JD007076, 2006.
Shaw, G. E.: Vertical distribution of tropospheric aerosols at Bar-row, Alaska, Tellus, 27(1), 39–50, 1975.
Shaw, R. A., Durant, A. J., and Mi, Y.: Heterogeneous surface crys-tallization observed in undercooled water, J. Phys. Chem. Lett.,109, 9865–9868, 2005.
Shupe, M. D.: Clouds at Arctic atmospheric observatories, PartII: Thermodynamic phase characteristics, J. Appl Meteor. Clim.,50(3), 645–661, doi:10.1175/2010JAMC2467.1, 2011.
Shupe, M. D, Matrosov, S. Y., and Uttal, T.: Arctic mixed-phasecloud properties derived from surface-based sensors at SHEBA,J. Atmos. Sci., 63, 2, 697–711, 2006.
Atmos. Chem. Phys., 11, 8003–8015, 2011 www.atmos-chem-phys.net/11/8003/2011/
S. Lance et al.: Cloud condensation nuclei as a modulator 8015
Shupe, M. D., Walden, V. P., Eloranta, E., Uttal, T., Campbell,J. R., Starkweather, S. M., and Shiobara, M.: Clouds at Arc-tic atmospheric observatories, Part I: Occurrence and macro-physical properties, J. Appl. Meteor. Clim., 50(3), 626–644,doi:10.1175/2010JAMC2467.1, 2011.
Stohl, A., Forster, C., Frank, A., Seibert, P., and Wotawa,G.: Technical note: The Lagrangian particle dispersion modelFLEXPART version 6.2, Atmos. Chem. Phys., 5, 2461–2474,doi:10.5194/acp-5-2461-2005, 2005.
Stohl, A., Berg, T., Burkhart, J. F., Fjæraa, A. M., Forster, C., Her-ber, A., Hov, Ø., Lunder, C., McMillan, W. W., Oltmans, S.,Shiobara, M., Simpson, D., Solberg, S., Stebel, K., Strom, J.,Tørseth, K., Treffeisen, R., Virkkunen, K., and Yttri, K. E.: Arc-tic smoke record high air pollution levels in the European Arcticdue to agricultural fires in Eastern Europe in spring 2006, Atmos.Chem. Phys., 7, 511–534,doi:10.5194/acp-7-511-2007, 2007.
Twomey, S.: Pollution and the planetary albedo, Atmos. Environ.,8, 1251–1256, 1974.
von Blohn, N., Mitra, S. K., Diehl, K., and Borrmann, S.: The icenucleating ability of pollen Part III: New laboratory studies in im-mersion and contact freezing modes including more pollen types,Atmos. Res., 78, 182–189, 2005.
Warneke, C., Bahreini, R., Brioude, J., Brock, C. A., de Gouw, J.A., Fahey, D. W., Froyd, K. D., Holloway, J. S., Middlebrook,A., Miller, L., Montzka, S., Murphy, D. M., Peischl, J., Ryerson,T. B., Schwarz. J. P., Spackman, J. R., and Veres, P.: Biomassburning in Siberia and Kazakhstan as an important source forhaze over the Alaskan Arctic in April 2008, Geophys. Res. Lett.,36, L02813,doi:10.1029/2008GL036194, 2009.
Warneke, C., Froyd, K. D., Brioude, J., Bahreini, R., Brock, C.A., Cozic, J., de Gouw, J. A., Fahey, D. W., Ferrare, R., Hol-loway, J. S., Middlebrook, A. M., Miller, L., Montzka, S.,Schwarz, J. P., Sodemann, H., Spackman, J. R., and Stohl, A.:An important contribution to springtime Arctic aerosol frombiomass burning in Russia, Geophys. Res. Lett., 37, L01801,doi:10.1029/2009GL041816, 2010.
Wegener, A.: Thermodynamik der atmosphare (in German),Leipzig, Poland, 1911.
Young, K. C.: The role of contact nucleation in ice phase initiation,J. Atmos. Sci., 31, 768–776, 1974.
www.atmos-chem-phys.net/11/8003/2011/ Atmos. Chem. Phys., 11, 8003–8015, 2011