Embed Size (px)
Citation preview

CLINICAL SYNOPSIS

1TEN Clinical Synopsis — 013019
C L I N I C A L S Y N O P S I S
PRODUCTION OF MITOCHONDRIA AND INCREASING HEALTHY MITOCHONDRIA FUNCTION. In-Vitro and Human Clinical Study Synopsis 1ST and 2ND Pilot Project
EXECUTIVE SUMMARYThe goal for the work reported here was to perform pilot clinical testing on the effects of a Bod•ē Pro, Inc. novel nutraceutical formula on human mitochondria at the cellular level, to help plan a clinical proof-of-concept trial. The nutraceutical formula, TEN, contains a number of ingredients, known to support mitochondrial functions. Mitochondria are intracellular organelles, responsible for producing cellular energy. They consist of membranous bodies that can either appear as oval bodies or as an interconnected web of tubes. Therefore, when evaluating the amount of mitochondria in a cell, this is discussed as mitochondrial mass per cell, rather than the number of mitochondria per cell.
The mitochondrial mass was significantly increased after 2 hours in cells treated with an aqueous fraction of the TEN nutraceutical formula. The timing (2 hours) is promising for the use of the test for mitochondrial mass in planned future human clinical studies.*
Pilot testing was also performed pertaining to TEN’s total antioxidant capacity (TAC), to document
the levels of antioxidants present in an aqueous preparation of the TEN formula. This is relevant to the antioxidants that are expected to be accessible following human consumption in future clinical studies.
RESULTS2 MAJOR STUDY ENDPOINTS:
1. Mitochondrial Mass Per Cell (MMPC): Defined as, the ability of a compound to induce an increase in number of Mitochondrial organelles within human leukocytes (white blood cells).
2. Total Antioxidant Capacity (TAC): Defined as, the protective ability of a compound against free radical damage to human leukocytes.
ENDPOINTS:
1. Mitochondrial Mass Per Cell:
• Increases in MMPC were detected at 2 hours following treatment of cells with the TEN formula (see graphs below).
• The 0.125 g/L dose of the TEN formula led to an 80-140% increase in MMPC in 3 different white blood cell populations. This shows relative potency of the TEN formula, that is promising for future clinical studies where mitochondrial mass per cell will be tested in blood samples from human subjects before and after consuming the TEN formula.
*This statement has not been evaluated by the Food & Drug Administration. This product is not intended to diagnose, treat cure or prevent any disease.

2TEN Clinical Synopsis — 013019

3TEN Clinical Synopsis — 013019
HUMAN CLINICAL STUDY DESIGNA placebo-controlled cross-over study design was used for the testing of acute effects, following the design of previous human testing of cellular effects of natural products.
This project involved 12 people, where each person’s acute response was tested on the active product compared to a placebo. This was followed by a 4-week open-label phase.
The volunteers were tested on separate clinic days with 7 days’ wash-out period between test days. The sequence for testing of acute effects of the TEN formula and placebo, as presented below, is an example only, since the order in which products were fed to study participants for acute effects was randomized:
2. Total Antioxidant Capacity:
• The TEN formula showed robust antioxidant capacity. This is important since it is expected that many of the water-soluble compounds present in the TEN formula will be readily available following human consumption.
• Graph below shown in gallic acid equivalents.

4TEN Clinical Synopsis — 013019
SUBJECTS:
12 volunteers were recruited for this study.
INCLUSION CRITERIA:
• Healthy adult volunteers of either gender.
• Age 45-70 years.
• BMI between 25-40.
• Veins easy to see in both arms.
PRESCREENING:
The pre-screening involved an interview to document gender, age, BMI, medical/surgical history, diet/lifestyle, current health issues, medication, and supplement use.
STUDY VISITS:
On each test day, our previously established protocol for acute effects of the TEN formula was applied. This involved careful management of the human subjects as well as the study environment, and a full hour of quiet resting before the baseline blood draw:
Upon arrival on the morning of each clinic day, participants rested in a seated position quietly for 1 hour prior to baseline blood draw. This resting period is crucial to gain representative baseline data. During this time, questionnaires were completed to monitor previous meals, snacks, exercise, stressors, and recent sickness. The baseline blood draw was followed immediately by feeding a product to the volunteer, who continued to rest quietly. One more blood draw was taken at 2 hours after consumption of the TEN formula. Blood pressure and responses to a brief questionnaire on mental state were recorded prior to each blood draw.
Blood samples were tested on clinic days for mitochondrial mass and activity. Blood samples were also sent for testing for Complete Metabolic Panel (CMP) and Complete Blood Count (CBC) at the baseline and 4 week visits, and high-sensitivity C- reactive protein (hsCRP) testing was done on both blood draws from each acute clinic day as well as the 4 week visit.
Serum was collected on all blood draws both for testing of a panel of inflammatory cytokines (this report) and for banking for future testing.
Questionnaires were administered at each visit. This included a questionnaire on general health and wellbeing (29 questions) and a questionnaire pertaining to fatigue (14 questions).
DEMOGRAPHICS OF THE STUDY POPULATION:
COMPLIANCE:
Compliance was evaluated by capsule count for product returned at the end of the 4-week open-label part of the study. The average compliance during the study was 96% (range 84- 100%).
SOURCE OF TEST PRODUCTS:
The active product was provided by the study sponsor. The TEN formula is a blend of vitamins and nutritional ingredients designed to enhance mitochondrial mass and function. Study participants were given 4 weeks supply of the test product. This product was also used for the placebo-controlled cross-over part of the study.
Placebo (used for the acute phase of the study) consisted of rice flour encapsulated in veggie capsules.
BLINDING OF PRODUCT AND PLACEBO FOR TESTING OF ACUTE EFFECTS:
Volunteers were randomized so that on each of the clinic visits where acute effects were measured, half of the volunteers received placebo and the other half received active product. On their subsequent clinic visit to measure acute effects, volunteers received the remaining product (placebo or product), which they had not previously received.
Prior to the acute study days, TEN product and placebo were blinded and randomly assigned to
Table 1. Demographics of study participants.
Females: 7
Age average* 59.1 ± 5.0
Age range 53.7 - 66.9
BMI average 27.5 ± 4.9
BMI range 22.9 - 33.0
Males: 5
Age average* 57.7 ± 9.6
Age range 47.1 - 65.8
BMI average 30.2 ± 2.3
BMI range 27.3 - 33.0
*The average ± standard deviation is shown

5TEN Clinical Synopsis — 013019
each volunteer’s first or second acute study day. Two people, neither of whom was directly involved in administering product to study participants, witnessed this. Clinic personnel and study participants were not aware of the identity of the product being administered on a particular study day.
LABELING OF CONSUMABLE FOR LONG-TERM USE:
The product received from the sponsor consisted of unlabeled bottles. The lab printed labels so that each bottle had a label on the outside of the bottle with directions on how to consume the product. Phone number, and study number were also on the label.
At the end of the second acute effects clinic day, volunteers received active product to take home and consume for 28 days.
METHODS AND DATA ANALYSISThe testing described herein was performed on white blood cells (leukocytes) isolated from peripheral blood drawn from study participants taken before consumption, 2 hours post consumption and after 4 weeks of consumption. 3 different cell lines were used in the study.
Blood cell populations:
• Lymphocytes are a type of white blood cell that are round in shape with a round nucleus that occupies the majority of the cell. Three types of cells belong to the lymphocyte class. These are natural killer cells, T lymphocytes and B lymphocytes.
• Monocytes are the largest type of white blood cell. They are present in the blood circulation, and after leaving the blood and migrating into tissue they become macrophages and serve a crucial link between the innate and adaptive immune responses.
• Neutrophils are also known as polymorphonuclear (PMN) cells because they contain a nucleus whose shape (morph) is irregular and contains many (poly) lobes. They are the most abundant type of white blood cell and are the first line of defense for bacterial infection. Neutrophils engulf and kill bacteria by releasing enzymes stored in intracellular granules. Neutrophils are also involved in inflammation, including migrating to sites of tissue injury in response to chemical signals.
Group averages and standard error of the means (SEM) for each data set were calculated using Microsoft Excel. Statistical significance of changes from baseline to later assessments was evaluated by between-treatment analysis using ‘within-subject’ analysis using the two-tailed, paired t-test.
The probability (p) values indicate the strength of the evidence that the study-specific ‘treatment’, i.e. the nutraceutical formula consumption, had an effect that can be considered statistically significant. On the tables and data graphs, the levels of statistical significance are displayed with asterisks following the format below. Levels of significance:
• When a change in the study reached a high level of statistical significance, as defined as p<0.01 (1% risk of error; 99% confidence interval), this is indicated with “**”.
• When a change in the study reached statistical significance as defined as p<0.05 (5% risk of error; 95% confidence interval), this is indicated with “*”.
• When a change in the study revealed only a marginal effect, this is indicated as a statistical trend. A trend is defined as p<0.10 (10% risk of error; 90% confidence interval), and indicated with “(*)”.
RESULTS4 MAJOR STUDY ENDPOINTS:
3. Mitochondrial Biogenesis/Mass: defined as, the ability of a compound to induce natural synthesis or an increase in volume of Mitochondrial organelles in the human body.
4. Mitochondrial Energetics/Function: defined as, the ability of a compound to induce ATP or energy synthesis in Mitochondrial organelles in the human body.
5. Study Participant Energy Questionnaire: defined as, a standardized testing method used to evaluate participant’s physical energy, mental focus and mental function after ingesting a compound versus placebo.
6. Safety Parameters and Inflammatory Markers: defined as, a Complete Blood Count (CBC), Complete Metabolic Profile (CMP) and endogenous inflammatory cytokines. Used to evaluate the relative safety of a compound when ingested by humans over short and long term use.

6TEN Clinical Synopsis — 013019
END POINTS:
1. MITOCHONDRIAL BIOGENESIS/MASS:
• Acute/Short-Term Results (2 hours):
o Summary:
- Over the two hours of inactive rest on the acute study days, increases in mitochondrial mass per cell were seen in all blood cell populations following consumption of the TEN formula. The increase associated with the TEN formula consumption reached a statistical trend (p<0.10) in the lymphocyte population, when compared to baseline levels.
o A rapid 20% increase (average) in the volume of mitochondria from baseline and a statistically significant 5% increase greater than placebo.
• Long-Term Results (4 weeks):
o Summary:
- Increases in mitochondrial mass per cell were seen in all blood cell populations following 4 weeks’ consumption of the TEN formula. This increase was statistically
significant (p<0.05) for the lymphocyte population and reached a statistical trend (p<0.10) in the monocyte and PMN cell populations (only Monocyte graphs shown above).
o Approximate 32% increase (average) in the number of mitochondria after 4 weeks of consumption (shown in graph above).
o 10 of 12 participants showed an overall increase in the number of mitochondria after 4 weeks of consumption (shown in graph below).
V01-V12 Mitochondrial Mass (Monocytes)
Per
cent
Cha
nge
Baseline 4 weeks
10
30
50
70

7TEN Clinical Synopsis — 013019
2. MITOCHONDRIAL ENERGETICS/FUNCTION:
• Acute/Short-Term Results:
o Summary:
- In the case of the PMN cell population, an increase in mitochondria energetics was seen post TEN formula consumption. This suggests that the consumption of the TEN formula triggered an increase in metabolic activity in contrast to a reduction seen in activity following placebo consumption.
o A 14% increase in the functional capacity/energetics of the mitochondria was seen with 2 hours of consumption (shown in table below). There was no difference between placebo and active test product. The reduction may relate to people sitting still for two hours.
3. STUDY PARTICIPANT ENERGY QUESTIONNAIRE:
• The Energy questionnaire evaluated effects on current mental state and used a visual analog scale (VAS) with a sliding scale from 0-100. This questionnaire was administered prior to all blood draws.
• Acute/Short-Term Results:
o Summary:
• An improvement in physical energy levels and mental focus and mental functioning was seen 2 hours after consuming the nutraceutical formula. A similar increase was not seen after consuming placebo, where a slight decrease was seen for these scores. When comparing an individuals’ response to the TEN formula versus placebo, statistical significance (p<0.05) was obtained for the increase in mental focus and mental functioning following the TEN formula consumption (see table below).
Table 3. Acute effects on mitochondrial function in PMN cells (MTT assay)
Table 13. Energy Questionnaire — Acute effects
Placebo
Baselinea 2 hoursa % change P-value
0.83 ± 0.10 0.72 ± 0.08 -14.05% 0.2757
a average ± SEM
Questions Baselinea 2 hoursa P-valueb Baselinea 2 hoursa P-valueb P-valueb
What is your current energy level? 68.25 ± 7.96 65.00 ± 8.34 0.7460 65.75 ± 8.38 74.42 ± 8.03 0.0479* 0.1242
How focused do you feel? 82.17 ± 6.06 72.00 ± 8.53 0.2064 81.33 ± 5.56 85.00 ± 5.14 0.4870 0.0213*
What is your current level of mental functioning? 80.00 ± 6.28 71.08 ± 7.61 0.2097 79.42 ± 6.08 82.58 ± 5.92 0.5926 0.0247*
What is your current stress level? 8.08 ± 2.61 1.67 ± 0.74 0.0253* 1.50 ± 0.62 1.58 ± 0.56 0.7774 0.8864
What is your current level of relaxation? 81.42 ± 4.98 78.25 ± 10.61 0.7769 81.58 ± 8.20 86.50 ± 7.90 0.6682 0.3514
a average ± SEMbp<0.05 is indicated with “*”.cComparison between placebo and MEF-2 at 2 hours
Active Test Product
Baselinea 2 hoursa % change P-value P-value (placebo/MEF-2)
0.67 ± 0.07 0.76 ± 0.07 13.62% 0.2757 0.1234
Placebo/MEF-2 Placebo MEF-2 Comparisonc
8TEN Clinical Synopsis — 013019
• Long Term Results:
o Summary:
• A slight improvement in energy levels and mental focus/functioning was seen following 4 weeks’ consumption of the TEN formula (see table below).
Table 14. Energy Questionnaire — Long-term effects
Questions Baseline 1a Baseline 2a P-value 4 weeksa P-valueb,c P-valued
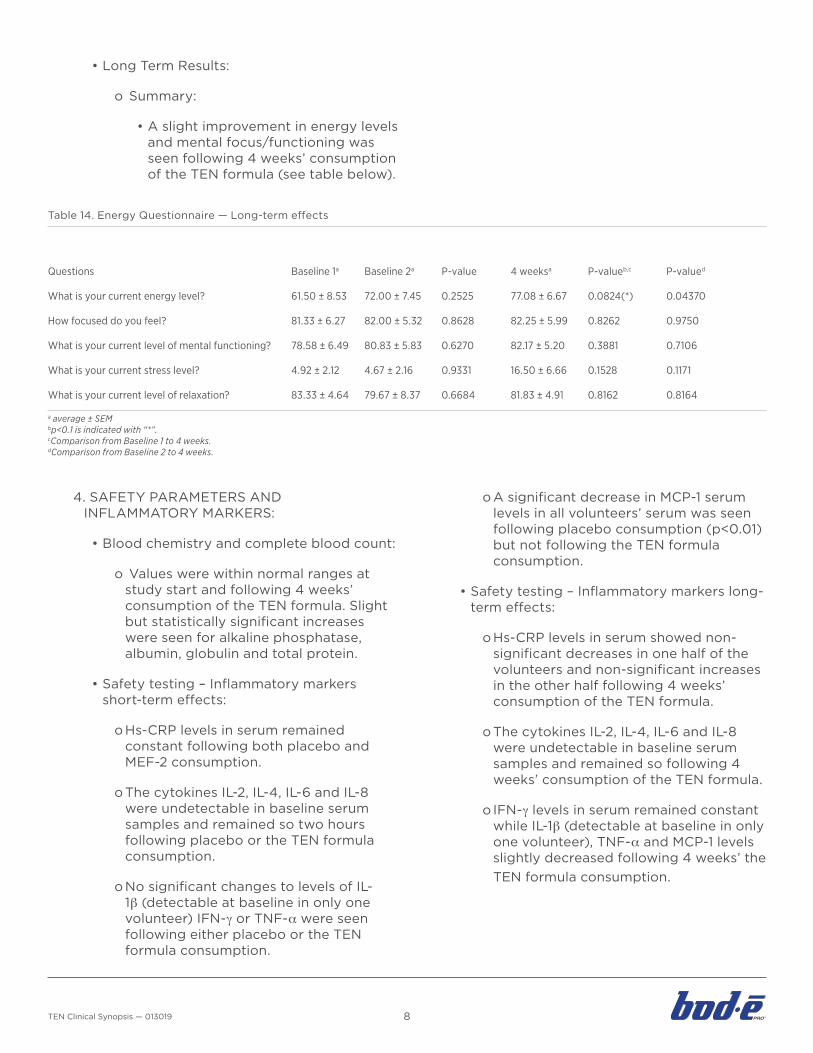
What is your current energy level? 61.50 ± 8.53 72.00 ± 7.45 0.2525 77.08 ± 6.67 0.0824(*) 0.04370
How focused do you feel? 81.33 ± 6.27 82.00 ± 5.32 0.8628 82.25 ± 5.99 0.8262 0.9750
What is your current level of mental functioning? 78.58 ± 6.49 80.83 ± 5.83 0.6270 82.17 ± 5.20 0.3881 0.7106
What is your current stress level? 4.92 ± 2.12 4.67 ± 2.16 0.9331 16.50 ± 6.66 0.1528 0.1171
What is your current level of relaxation? 83.33 ± 4.64 79.67 ± 8.37 0.6684 81.83 ± 4.91 0.8162 0.8164
a average ± SEMbp<0.1 is indicated with “*”.cComparison from Baseline 1 to 4 weeks.dComparison from Baseline 2 to 4 weeks.
4. SAFETY PARAMETERS AND INFLAMMATORY MARKERS:
• Blood chemistry and complete blood count:
o Values were within normal ranges at study start and following 4 weeks’ consumption of the TEN formula. Slight but statistically significant increases were seen for alkaline phosphatase, albumin, globulin and total protein.
• Safety testing – Inflammatory markers short-term effects:
o Hs-CRP levels in serum remained constant following both placebo and MEF-2 consumption.
o The cytokines IL-2, IL-4, IL-6 and IL-8 were undetectable in baseline serum samples and remained so two hours following placebo or the TEN formula consumption.
o No significant changes to levels of IL-1β (detectable at baseline in only one volunteer) IFN-γ or TNF-α were seen following either placebo or the TEN formula consumption.
o A significant decrease in MCP-1 serum levels in all volunteers’ serum was seen following placebo consumption (p<0.01) but not following the TEN formula consumption.
• Safety testing – Inflammatory markers long-term effects:
o Hs-CRP levels in serum showed non-significant decreases in one half of the volunteers and non-significant increases in the other half following 4 weeks’ consumption of the TEN formula.
o The cytokines IL-2, IL-4, IL-6 and IL-8 were undetectable in baseline serum samples and remained so following 4 weeks’ consumption of the TEN formula.
o IFN-γ levels in serum remained constant while IL-1β (detectable at baseline in only one volunteer), TNF-α and MCP-1 levels slightly decreased following 4 weeks’ the TEN formula consumption.

9TEN Clinical Synopsis — 013019
C L I N I C A L S Y N O P S I S
PROTECTION OF MITOCHONDRIAL FUNCTION FROM OXIDATIVE STRESS AND INFLAMMATION SUMMARY. In-Vitro Clinical Study Synopsis 3RD Pilot Project Report 147-001.
EXECUTIVE SUMMARYBod•ē Pro distributes ultra premium nutritional supplements for wellness and cellular nutrition. Bod•ē Pro’s latest offering, TEN, which is focused on supporting cellular energy through support of mitochondrial function. This pilot project has generated results to support the effects of TEN at the cellular level, particularly under stressed culture conditions.
TEN provided cellular antioxidant protection, showing that it contains antioxidants capable of penetrating into cells and protecting them from the inside-out, when the cells were exposed to free radical stress.*
When cells are stressed by free radicals and by inflammatory conditions, the mitochondria suffer. Testing applied several types of stressors to cells to test the protection offered by TEN. TEN showed multiple levels of support of mitochondrial in bioassays:
• TEN supported mitochondrial metabolic activity under normal, oxidative stress, and inflamed culture conditions.*
• TEN supported healthy mitochondrial mass per cell under inflamed conditions in the presence of the TEN formula.*
The data are also immediately useful for planning of the fourth clinical trial protocol on Bod•ē Pro TEN. The data reported here points to inflammation as the most useful stressor for testing protective effect of TEN.
PURPOSEThe purpose of this pilot project was to test the protective effects of TEN on mitochondrial function under various experimental conditions of oxidative stress, inflammation, and reduced oxygen delivery, using cellular bioassays.
The results from the comparison of various culture conditions, to cause stress on mitochondrial function, will help plan which test conditions to use in the subsequent clinical trial, which needs to be initiated as soon as possible.
BACKGROUNDA novel nutraceutical formula, TEN has been developed for the support of mitochondrial function, with ingredients backed by research.
A key ingredient is pyrroloquinoline quinone (PQQ), which has shown rapid effects on inflammation and mitochondrial-related metabolism in human subjects, with peak serum levels at 2 hours.i Therefore, the planned clinical study aims at documenting effects within 1-2 hours after consuming a single dose of product, compared to placebo.
Another key ingredient is Coenzyme Q10, also well-known to support mitochondrial function under stressful conditions.ii iii
The effect of the patent pending blend of mitochondria-targeted ingredients needs to be documented, both under normal conditions, and under conditions of specific types of stress, reflecting situations simulating exercise-induced stress, as well as inflammation.
*These statements have not been evaluated by the Food & Drug Administration. These products are not intended to diagnose, treat cure or prevent any disease.

10TEN Clinical Synopsis — 013019
WORK PERFORMED
TESTS PERFORMED
This pilot project compared several tests that evolve around:
- Total antioxidant capacity.
- Cellular antioxidant protection due to uptake of antioxidant compounds.
- Mitochondrial volume per cell:
• Under normal culture conditions (unstressed).
• Under oxidative stress.
• Under inflamed conditions.
- Mitochondrial metabolic activity:
• Under normal culture conditions (unstressed).
• Under oxidative stress.
• Under inflamed conditions.
PRODUCT HANDLING
The formula TEN contains a blend of water-soluble and water-insoluble/poorly soluble compounds. Therefore, this pilot testing compared the cellular effects of three different methods of handling the product for introduction into the liquid nutrient-rich medium in which the cells are grown in cell culture.
Table 1. Description of product handling.
RESULTS
TOTAL ANTIOXIDANT CAPACITY
The three extracts shown in Table 1 were tested in the Folin-Ciocalteu assay (also known as the total phenolics assay). This assay makes use of the Folin-Ciocalteu reagent to measure antioxidants. The assay is performed by adding the Folin-Ciocalteu’s phenol reagent to serial dilutions of each extract, thoroughly mixing, and incubating for 5 minutes. Sodium carbonate is then added,
starting a chemical reaction producing a color. The reaction is allowed to continue for 30 minutes at 37°C. Optical absorbance is measured at 765nm in a colorimetric plate reader. Gallic acid is used as a reference standard, and the data reported in Gallic Acid Equivalents per gram product. Data from this assay helps interpret the subsequent Cellular Antioxidant Protection assay, as well as the assays for mitochondrial function. The results confirmed that TEN contains antioxidants. The antioxidant capacity was greater in the water-soluble fraction than in the ethanol fraction.
Extraction/handling Solvent for making stock Serial dilutions Proportion
TEN Aqueous handling Physiological saline Physiological saline
TEN Ethanol handling Ethanol 95% (blend) Physiological saline
TEN Aqueous/ethanol blend (blend) Physiological saline 50:50 blend

11TEN Clinical Synopsis — 013019
CELL-BASED ANTIOXIDANT PROTECTION (CAP-E) ASSAY.
The rationaleiv behind the method that we use is important: It allows assessment of anti- oxidant potential in a method that is comparable to the ORAC antioxidant test, but only allows measurement of antioxidants that are able to cross the lipid bilayer cell membrane, enter the cells, and provide biologically meaningful antioxidant protection under conditions of oxidative stress.
We developed the CAP-e bioassay specifically to work with natural products and ingredients.v The method has been used on multiple types of natural products and ingredients, published in the peer-reviewed scientific literature.vi vii viii ix x xi
As a model cell type, we use the red blood cell (RBC). This is an inert cell type, in contrast to other cell types. We developed this assay particularly to be able to assess antioxidants from complex natural products in a cell-based system.
Freshly purified human RBC are washed repeatedly in physiological saline, and then exposed to the test products. During the incubation with a test product, any antioxidant compounds able to cross the cell membrane can enter the interior of the RBC. Then the RBC are washed to remove compounds that were not absorbed by the cells, and loaded with the DCF-DA dye, which turns fluorescent upon exposure to reactive oxygen species. Oxidation is triggered by addition of the peroxyl free radical generator AAPH. The fluorescence intensity is evaluated. The low fluorescence intensity of untreated control cells serve as a baseline, and RBC treated with AAPH alone serve as a positive control for maximum oxidative damage.
When we observe a reduced fluorescence intensity of RBC exposed to a test product and subsequently exposed to AAPH, this indicates that the test product contains antioxidants available to penetrate into the cells and protect these from oxidative damage.
The results showed that water-soluble antioxidants in TEN were capable of entering into and protecting the cells from oxidative stress-induced intracellular damage.
TEST PRODUCT
OXIDATIVECHALLENGE
DYE
REDBLOODCELLS

12TEN Clinical Synopsis — 013019
MITOCHONDRIAL METABOLIC ACTIVITY WHEN EXPOSED TO VARIOUS STRESSORS
The testing described below was performed on freshly isolated peripheral blood mononuclear cells from a healthy human blood donor. Serial dilutions of the test product (using all 3 handling methods in parallel) were added to cell cultures, where the cultures were tested for mitochondrial metabolic activity, using the MTT assay. Freshly purified cells were cultured for 24 hours in the presence of TEN, after which MTT reagents were added to allow a color formation to take place in proportion to mitochondrial function. In the MTT bioassay, chemical reactions trigger a specific color development based on cellular functions:
• When a reduction in color is measured, this is linked to a reduced cellular viability, either as a result of direct killing, or inhibition of mitochondrial function.
• When an increase in color is measured, this has multiple possible explanations: 1) increased cell numbers (growth); 2) increased mitochondrial mass, and 3) increased mitochondrial function (energy production).
Under the test conditions used for this project, no cellular growth was expected, therefore the changes are proportional to the combination of increased mitochondrial mass, and increased mitochondrial metabolic activity.
Culture conditions: One set of cell cultures was allowed to incubate under normal cell culture conditions (“Normal culture”), without any added stressors. The following four sets of cell cultures were made in parallel:
• Normal culture.
• Oxidative stress (induced by adding H2O2).
• Inflammation (induced by LPS (a highly inflammatory bacterial endotoxin)).
The results showed that TEN was effective at very low doses. TEN provided mitochondrial support under normal healthy culture conditions, as well as under conditions of oxidative stress and inflammation.
On the following pages there are two sets of graphs for each culture condition. The first graph shows the TEN-induced change for all three test fractions for all four doses tested, as well as the ethanol control. The second graph focuses on the three lower doses, with a modified scale to better compare the results of the water-soluble and water-insoluble (ethanol) fractions.
Figure 2. Cellular antioxidant protection by TEN. The Cellular Antioxidant Protection (CAP-e) graph displays the % inhibition of oxidative damage for each handling method. The % inhibition of cellular oxidative damage for each dose of extract is shown as the average ± standard deviation of the Gallic acid equivalents (GAE), where each dose was tested in duplicate.
TEN Water-soluble fraction
TEN Ethanol fraction
TEN Blend water-soluble fraction and ethanol fraction
Cellular Antioxidant Protection
13TEN Clinical Synopsis — 013019
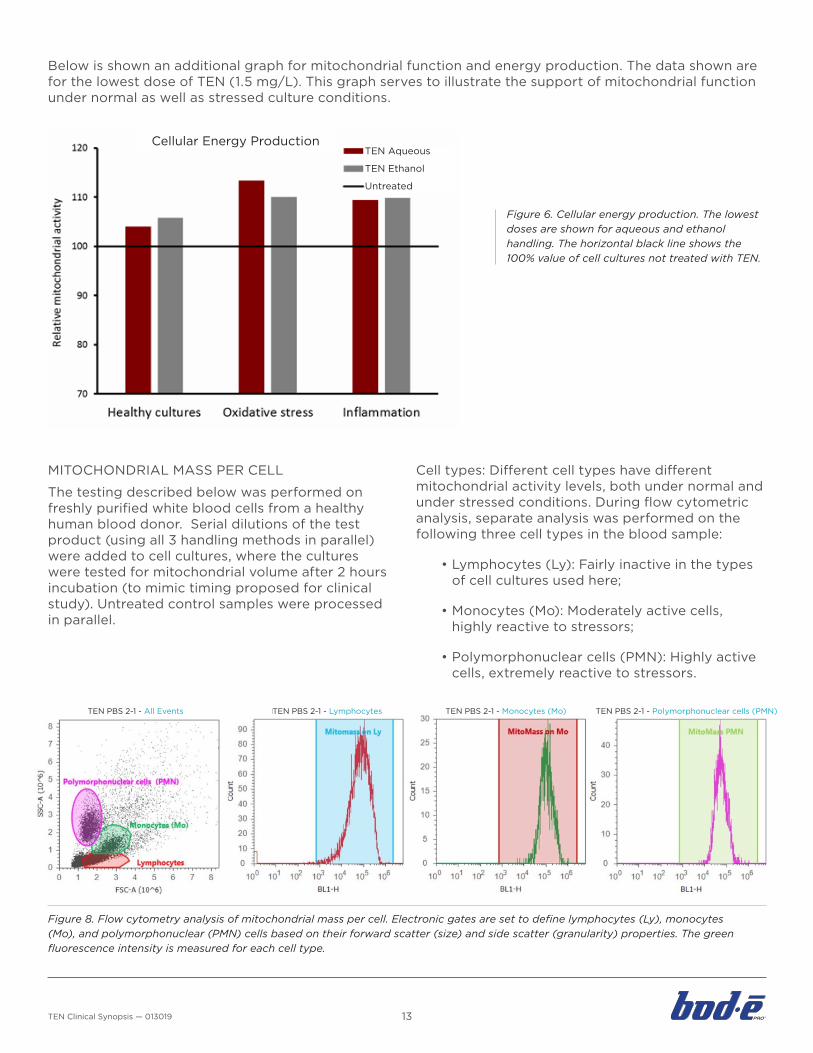
Below is shown an additional graph for mitochondrial function and energy production. The data shown are for the lowest dose of TEN (1.5 mg/L). This graph serves to illustrate the support of mitochondrial function under normal as well as stressed culture conditions.
MITOCHONDRIAL MASS PER CELL
The testing described below was performed on freshly purified white blood cells from a healthy human blood donor. Serial dilutions of the test product (using all 3 handling methods in parallel) were added to cell cultures, where the cultures were tested for mitochondrial volume after 2 hours incubation (to mimic timing proposed for clinical study). Untreated control samples were processed in parallel.
Cell types: Different cell types have different mitochondrial activity levels, both under normal and under stressed conditions. During flow cytometric analysis, separate analysis was performed on the following three cell types in the blood sample:
• Lymphocytes (Ly): Fairly inactive in the types of cell cultures used here;
• Monocytes (Mo): Moderately active cells, highly reactive to stressors;
• Polymorphonuclear cells (PMN): Highly active cells, extremely reactive to stressors.
Figure 6. Cellular energy production. The lowest doses are shown for aqueous and ethanol handling. The horizontal black line shows the 100% value of cell cultures not treated with TEN.
Figure 8. Flow cytometry analysis of mitochondrial mass per cell. Electronic gates are set to define lymphocytes (Ly), monocytes (Mo), and polymorphonuclear (PMN) cells based on their forward scatter (size) and side scatter (granularity) properties. The green fluorescence intensity is measured for each cell type.
Cellular Energy ProductionTEN Aqueous
TEN Ethanol
Untreated
TEN PBS 2-1 - All EventsTEN PBS 2-1 - All Events TEN PBS 2-1 - Lymphocytes TEN PBS 2-1 - Monocytes (Mo) TEN PBS 2-1 - Polymorphonuclear cells (PMN)

14TEN Clinical Synopsis — 013019
Culture conditions: One set of cell cultures was allowed to incubate under normal cell culture conditions (“Normal culture”), without any added stressors. The following four sets of cell cultures were made in parallel:
• Normal culture: Moderate increases in mitochondrial mass per cell when cells were treated with the aqueous as well as the ethanol-extract of TEN.
• Oxidative stress (induced by adding H2O2): Mild increases in mitochondrial mass per cell when Mo and PMN cells were treated with the ethanol-extract of TEN.
• Inflammation (induced by LPS (a highly inflammatory bacterial endotoxin)): TEN offered strong protection of mitochondrial mass per cell for all three cell types.
After incubation, cells were stained with a fluorescent probe that stains mitochondria in proportion to mitochondrial volume per cell. The overall sum of fluorescent output per cell is a measure of mitochondrial volume per cell. The Attune® acoustic aligning flow cytometer tracks cell numbers per volume unit, and provides fluorescence intensity measurements per cell.
On the following pages are two sets of graphs for each culture condition and cell type. The first graph shows the TEN-induced change for all three test fractions for all three doses tested.
The second graph serves to illustrate the effects of TEN when compared to untreated versus stressed cells.
Figure 9. Mitochondrial mass per lymphocyte (Ly) is shown as green fluorescence intensity. The top graph shows the average ± standard deviation of triplicate cultures. The bottom graph shows the same data plotted against the untreated cells (green dotted line).
Mitochondrial Mass Per Cell (Ly), Normal Cultures
Mitochondrial Mass Per Cell (Ly), Normal Cultures
Flu
ore
scen
ce in
tens
ity
Flu
ore
scen
ce in
tens
ity
180
160
140
120
100
80
60
40
20
0
160
140
120
100
80
60
40
TEN Aqueous
TEN Ethanol
0.03 0.25 2 mg/mL
TEN Blend
Healthy cells
Health
y ce
lls
TEN Aq 0
.03
mg/m
L
TEN Aq 0
.25 m
g/mL
TEN Aq 2
.0 m
g/mL
TEN Eth
anol A
q 0.0
3 m
g/mL
TEN Eth
anol A
q 0.25
mg/m
L
TEN Eth
anol A
q 2.0
mg/m
L
TEN Blen
d Aq 0
.03
mg/m
L
TEN Blen
d Aq 0
.25 m
g/mL
TEN Blen
d Aq 2
.0 m
g/mL

15TEN Clinical Synopsis — 013019
Figure 10. Mitochondrial mass per monocyte (Mo) is shown as green fluorescence intensity. The top graph shows the average ± standard deviation of triplicate cultures for TEN-treated cells. The bottom graph shows the same data plotted against the untreated cells (green dotted line).
Mitochondrial Mass Per Cell (Mo), Normal Cultures
Flu
ore
scen
ce in
tens
ity
400
350
300
250
200
150
100
50
0
Health
y ce
lls
TEN Aq 0
.03
mg/m
L
TEN Aq 0
.25 m
g/mL
TEN Aq 2
.0 m
g/mL
TEN Eth
anol A
q 0.0
3 m
g/mL
TEN Eth
anol A
q 0.25
mg/m
L
TEN Eth
anol A
q 2.0
mg/m
L
TEN Blen
d Aq 0
.03
mg/m
L
TEN Blen
d Aq 0
.25 m
g/mL
TEN Blen
d Aq 2
.0 m
g/mL
Mitochondrial Mass Per Cell (Mo), Normal Cultures
Flu
ore
scen
ce in
tens
ity
0.03 0.25 2 mg/mL
TEN Aqueous
TEN Ethanol
TEN Blend
Healthy cells
390
340
290
240
190
140
90
40
16TEN Clinical Synopsis — 013019
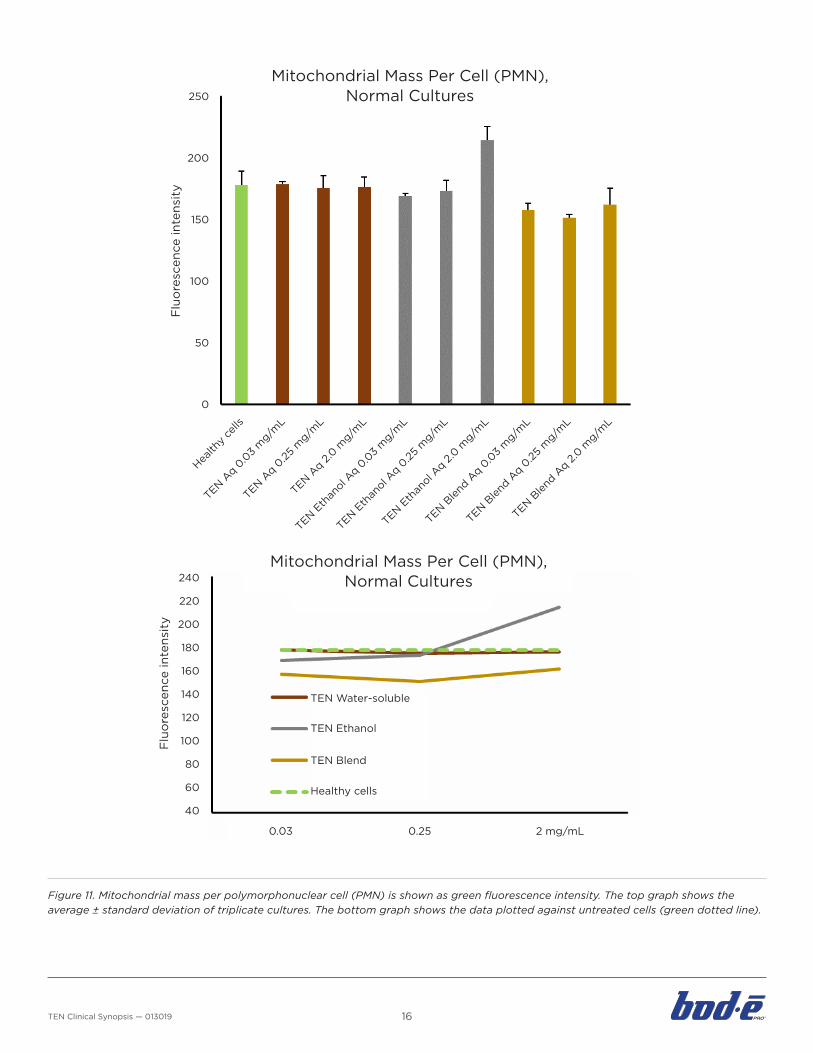
Figure 11. Mitochondrial mass per polymorphonuclear cell (PMN) is shown as green fluorescence intensity. The top graph shows the average ± standard deviation of triplicate cultures. The bottom graph shows the data plotted against untreated cells (green dotted line).
Mitochondrial Mass Per Cell (PMN), Normal Cultures
Flu
ore
scen
ce in
tens
ity
250
200
150
100
50
0
Health
y ce
lls
TEN Aq 0
.03
mg/m
L
TEN Aq 0
.25 m
g/mL
TEN Aq 2
.0 m
g/mL
TEN Eth
anol A
q 0.0
3 m
g/mL
TEN Eth
anol A
q 0.25
mg/m
L
TEN Eth
anol A
q 2.0
mg/m
L
TEN Blen
d Aq 0
.03
mg/m
L
TEN Blen
d Aq 0
.25 m
g/mL
TEN Blen
d Aq 2
.0 m
g/mL
Mitochondrial Mass Per Cell (PMN), Normal Cultures
Flu
ore
scen
ce in
tens
ity
0.03 0.25 2 mg/mL
TEN Water-soluble
TEN Ethanol
TEN Blend
Healthy cells
240
220
200
180
160
140
120
100
80
60
40

17TEN Clinical Synopsis — 013019
Figure 15. Mitochondrial mass per lymphocyte (Ly) is shown as green fluorescence intensity. The top graph shows the average ± standard deviation of triplicate cultures. The bottom graph shows the data plotted against untreated (green dotted line) and stressed cells (red dotted line).
Mitochondrial Mass Per Cell (Ly), Oxidative stress
Flu
ore
scen
ce in
tens
ity
200
180
160
140
120
100
80
60
40
20
0
Health
y ce
lls
Stre
ssed
cells
TEN Aq 0
.03
mg/m
L
TEN Aq 0
.25 m
g/mL
TEN Aq 2
.0 m
g/mL
TEN Eth
anol A
q 0.0
3 m
g/mL
TEN Eth
anol A
q 0.25
mg/m
L
TEN Eth
anol A
q 2.0
mg/m
L
TEN Blen
d Aq 0
.03
mg/m
L
TEN Blen
d Aq 0
.25 m
g/mL
TEN Blen
d Aq 2
.0 m
g/mL
Mitochondrial Mass Per Cell (Ly), Oxidative stress
Flu
ore
scen
ce in
tens
ity
0.03 0.25 2 mg/mL
TEN Aqueous
TEN Ethanol
TEN Blend
Stressed cells
Healthy cells
160
140
120
100
80
60
40

18TEN Clinical Synopsis — 013019
Figure 16. Mitochondrial mass per monocyte (Mo) is shown as green fluorescence intensity. The top graph shows the average ± standard deviation of triplicate cultures. The bottom graph shows the data plotted against untreated (green dotted line) and stressed cells (red dotted line).
Mitochondrial Mass Per Cell (Mo), Oxidative stress
Flu
ore
scen
ce in
tens
ity
400
350
300
250
200
150
100
50
0
Health
y ce
lls
Stre
ssed
cells
TEN Aq 0
.03
mg/m
L
TEN Aq 0
.25 m
g/mL
TEN Aq 2
.0 m
g/mL
TEN Eth
anol A
q 0.0
3 m
g/mL
TEN Eth
anol A
q 0.25
mg/m
L
TEN Eth
anol A
q 2.0
mg/m
L
TEN Blen
d Aq 0
.03
mg/m
L
TEN Blen
d Aq 0
.25 m
g/mL
TEN Blen
d Aq 2
.0 m
g/mL
Mitochondrial Mass Per Cell (Mo), Oxidative stress
Flu
ore
scen
ce in
tens
ity
0.03 0.25 2 mg/mL
TEN Aqueous
TEN Ethanol
TEN Blend
Stressed cells
Healthy cells
340
290
240
190
140
90
40

19TEN Clinical Synopsis — 013019
Figure 17. Mitochondrial mass per polymorphonuclear cell (PMN) is shown as green fluorescence intensity. The top graph shows the average ± standard deviation of triplicate cultures. The bottom graph shows the data plotted against untreated (green dotted line) and stressed cells (red dotted line).
Mitochondrial Mass Per Cell (PMN), Oxidative stress
Mitochondrial Mass Per Cell (PMN), Oxidative stress
Flu
ore
scen
ce in
tens
ity
Flu
ore
scen
ce in
tens
ity
250
200
150
100
50
0
Health
y ce
lls
Stre
ssed
cells
TEN Aq 0
.03
mg/m
L
TEN Aq 0
.25 m
g/mL
TEN Aq 2
.0 m
g/mL
TEN Eth
anol A
q 0.0
3 m
g/mL
TEN Eth
anol A
q 0.25
mg/m
L
TEN Eth
anol A
q 2.0
mg/m
L
TEN Blen
d Aq 0
.03
mg/m
L
TEN Blen
d Aq 0
.25 m
g/mL
TEN Blen
d Aq 2
.0 m
g/mL
0.03 0.25 2 mg/mL
TEN Aqueous
TEN Ethanol
TEN Blend
Stressed cells
Healthy cells
240
220
200
180
160
140
120
100
80
60
40

20TEN Clinical Synopsis — 013019
Figure 18. Mitochondrial mass per lymphocyte (Ly) is shown as green fluorescence intensity. The top graph shows the average ± standard deviation of triplicate cultures. The bottom graph shows the data plotted against untreated (green dotted line) and inflamed cells (red dotted line).
Mitochondrial Mass Per Cell (Ly), Inflammation
Mitochondrial Mass Per Cell (Ly), Inflammation
TEN Aqueous
0.03
65
60
55
50
45
40
0.25 2 mg/mL
TEN Ethanol
Flu
ore
scen
ce in
tens
ity
TEN Blend
No TEN
Healthy cells
Flu
ore
scen
ce in
tens
ity
70
60
50
40
30
20
10
0
Health
y ce
lls
Infla
med
cells
TEN Aq 0
.03
mg/m
L
TEN Aq 0
.25 m
g/mL
TEN Aq 2
.0 m
g/mL
TEN Eth
anol A
q 0.0
3 m
g/mL
TEN Eth
anol A
q 0.25
mg/m
L
TEN Eth
anol A
q 2.0
mg/m
L
TEN Blen
d Aq 0
.03
mg/m
L
TEN Blen
d Aq 0
.25 m
g/mL
TEN Blen
d Aq 2
.0 m
g/mL
21TEN Clinical Synopsis — 013019
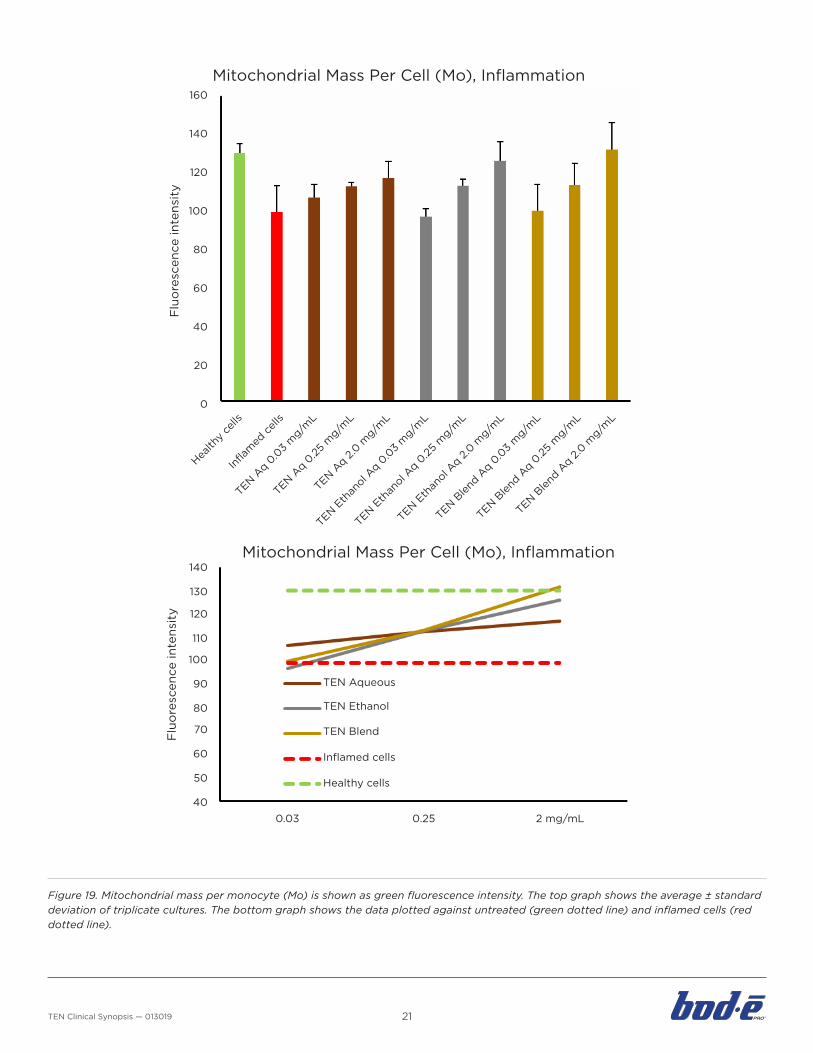
Figure 19. Mitochondrial mass per monocyte (Mo) is shown as green fluorescence intensity. The top graph shows the average ± standard deviation of triplicate cultures. The bottom graph shows the data plotted against untreated (green dotted line) and inflamed cells (red dotted line).
Mitochondrial Mass Per Cell (Mo), Inflammation
Mitochondrial Mass Per Cell (Mo), Inflammation
Flu
ore
scen
ce in
tens
ity
Flu
ore
scen
ce in
tens
ity
160
140
120
100
80
60
40
20
0
140
130
120
110
100
90
80
70
60
50
40
Health
y ce
lls
Infla
med
cells
TEN Aq 0
.03
mg/m
L
TEN Aq 0
.25 m
g/mL
TEN Aq 2
.0 m
g/mL
TEN Eth
anol A
q 0.0
3 m
g/mL
TEN Eth
anol A
q 0.25
mg/m
L
TEN Eth
anol A
q 2.0
mg/m
L
TEN Blen
d Aq 0
.03
mg/m
L
TEN Blen
d Aq 0
.25 m
g/mL
TEN Blen
d Aq 2
.0 m
g/mL
TEN Aqueous
0.03 0.25 2 mg/mL
TEN Ethanol
TEN Blend
Inflamed cells
Healthy cells

22TEN Clinical Synopsis — 013019
Figure 20. Mitochondrial mass per polymorphonuclear cell (PMN) is shown as green fluorescence intensity. The top graph shows the average ± standard deviation of triplicate cultures. The bottom graph shows the data plotted against untreated (green dotted line) and inflamed cells (red dotted line).
Mitochondrial Mass Per Cell (PMN),Inflammation
TEN Aqueous
0.03
100
90
80
70
60
50
400.25 2 mg/mL
TEN Ethanol
Flu
ore
scen
ce in
tens
ity
TEN Blend
Inflamed cells
Healthy cells
Mitochondrial Mass Per Cell (PMN),Inflammation120
100
80
60
40
20
0
Flu
ore
scen
ce in
tens
ity
Health
y ce
lls
Infla
med
cells
TEN Aq 0
.03
mg/m
L
TEN Aq 0
.25 m
g/mL
TEN Aq 2
.0 m
g/mL
TEN Eth
anol A
q 0.0
3 m
g/mL
TEN Eth
anol A
q 0.25
mg/m
L
TEN Eth
anol A
q 2.0
mg/m
L
TEN Blen
d Aq 0
.03
mg/m
L
TEN Blen
d Aq 0
.25 m
g/mL
TEN Blen
d Aq 2
.0 m
g/mL

23TEN Clinical Synopsis — 013019
CONCLUSIONS
These three pilot projects have generated results to support the effects of TEN at the cellular level, particularly under stressed human culture conditions.
The TEN formula possess the ability to induce a significant increase in the number of mitochondrial organelles within human leukocytes (white blood cells) after 2 hours (a rapid 20% increase) and a greater increase (32%) after the 4 week period.*
TEN created a significant increase (14%) in the functional capacity/energetics of the mitochondria within 2 hours of consumption.*
TEN formula showed robust antioxidant capacity and contains antioxidants capable of penetrating into cells and protecting them from the inside-out, when the cells were exposed to free radical stress.*
TEN supported mitochondrial metabolic activity under normal, oxidative stress and inflamed human culture conditions.*
TEN supported healthy mitochondrial mass per cell under specific culture conditions: Mitochondrial mass per cell was mildly supported by TEN under normal conditions and strongly supported under inflamed conditions. The human cultures under oxidative stress showed some support by TEN for the more active cells (monocytes and PMN cells).
Although these three studies were small in scale and no conclusive findings can be inferred from them, their results are extremely promising. Bod•ē Pro is planning to use the data gathered from these initial studies to conduct a larger human clinical study to further confirm these preliminary findings.
*These statements have not been evaluated by the Food & Drug Administration. These products are not intended to diagnose, treat cure or prevent any disease.