Embed Size (px)
Citation preview

Hindawi Publishing CorporationBioMed Research InternationalVolume 2013, Article ID 341269, 7 pageshttp://dx.doi.org/10.1155/2013/341269
Clinical StudyChanges in Frequency-Doubling Perimetry in Patients withType I Diabetes prior to Retinopathy
Isabel Pinilla,1 Antonio Ferreras,2 Miriam Idoipe,2 Ana I. Sanchez-Cano,3
Diana Perez-Garcia,1 Laura X. Herrera,1 Maria J. Pinilla,4 and Emilio Abecia2
1 Department of Ophthalmology, Hospital Clinico Universitario Lozano Blesa, Aragon Health Sciences Institute,50009 Zaragoza, Spain
2Miguel Servet University Hospital, Aragon Health Sciences Institute, 50009 Zaragoza, Spain3 Department of Applied Physics, Zaragoza University, 50009 Zaragoza, Spain4Department of Cardiology, Hospital Clinico Universitario Lozano Blesa, Aragon Health Sciences Institute, 50009 Zaragoza, Spain
Correspondence should be addressed to Antonio Ferreras; [email protected]
Received 21 July 2013; Revised 23 September 2013; Accepted 25 September 2013
Academic Editor: Atsushi Mizota
Copyright © 2013 Isabel Pinilla et al. This is an open access article distributed under the Creative Commons Attribution License,which permits unrestricted use, distribution, and reproduction in any medium, provided the original work is properly cited.
Purpose. To evaluate the ability of frequency-doubling technology (FDT) perimetry in detecting visual field defects in youngadults with type I diabetes prior to retinopathy or with minor retinovascular changes. Methods. This comparative cross-sectionalstudy included 30 healthy subjects and 73 age-matched patients with type I diabetes mellitus. All subjects underwent a full ocularexamination including an FDTwith the threshold C-20-5 strategy. Only one eye per subject was randomly included in the statisticalanalysis. FDT results and time to perform the test were compared between the groups. Results. The mean age was 27.1 years inthe control group and 26.6 years in the diabetic group (𝑃 = 0.875). The mean period from the onset of diabetes was 12.6 ± 6.7years, while minimal retinovascular changes were observed in 18 eyes. Mean deviation of FDT did not differ between the groups.Although global indices of FDT were within normal limits, pattern standard deviation of FDT was higher in the diabetic group(𝑃 = 0.035). The area under the receiver operating characteristic curve was 0.647 for pattern standard deviation of FDT (standarderror = 0.052; 𝑃 = 0.017). Conclusion. FDT can detect retinal dysfunctions in diabetic patients prior to the onset of significantvascular complications.
1. Introduction
Diabetic retinopathy is the major cause of visual loss in thediabetic population, although it is not the only aspect ofvisual dysfunction in these patients. There is accumulatingevidence indicating that the impairment of retinal functionprecedes the earliest signs of vascular complications. Also,functional defects have been reported in animal models ofdiabetic retinopathy prior to the occurrence of any clinicallyvisible changes [1, 2]. Such defects are attributed to a decreasein nerve function and consist of alterations in oscillatorypotentials, pattern electroretinogram (ERG),multifocal ERG,S-cone ERG, and paired-flash ERG [3–10]. Other changesinclude reductions in dark adaptation, visually evokedresponses, contrast sensitivity, and optic nerve conductionvelocity [11–13]. Additionally, abnormal colour sensation [14],
prolongations in visually evoked response latencies [15–22],and defects in the retinal nerve fiber layer [23] have beendetected at stages preceding detectable retinopathy.
Some years ago, frequency-doubling technology (FDT)perimetry was introduced, a method for assessing contrastthreshold based on the spatial frequency-doubling illusionthat occurs when a low spatial frequency sine wave gratingis counterphased at a high temporal rate, resulting in thegrating’s appearing to have twice its original spatial frequency[24–28]. Frequency-doubling illusion does not depend oncontrast reversal and any rapid temporal variation will doeither translation or pattern onset.Thus, localized visual fielddefects are tested as malfunctions of the temporal contrastbehaviour andmay contribute to the results obtainedwith theFDT perimeter.

2 BioMed Research International
White et al. [29] suggested that a cortical loss of temporalphase discrimination is the principal cause of the illusionand proposed that the mechanisms underlying the illusionresemble those underlying the detection of full-field flicker,which appears to be accomplished through themagnocellularpathway.Therefore, FDT can be abnormal not only in patientswith visual field defects, such as those found in glaucoma,but also in patients with impaired contrast sensitivity. Thethreshold contrast, at which a pattern of stripes is just visible,is a measure of a different visual function that can pick updeficits in diverse pathologies including retinal diseases [11,30–32].The reduction in contrast sensitivity found in diabeticpatients can be a source of abnormal FDT [33].
To our knowledge this is the first study aimed to evaluatethe efficacy of FDT in detecting functional impairment ofvision in patients with type I diabetes without retinopathy orwith minor retinovascular changes.
2. Materials and Methods
Thecomparative cross-sectional study protocol was approvedby the ethics committee of theMiguel Servet University Hos-pital and written consent was obtained from all participants.
Thirty consecutive eyes of 30 healthy young adults and 73consecutive eyes of 73 patients with type I diabetes mellitusthat met the inclusion criteria were prospectively enrolled inthe study. Control eyes were selected from patients referredfor refraction and routine exploration without abnormalocular findings, hospital staff, and relatives of patients of ourhospital. Diabetic patients were recruited from those referredfor annual diabetic retinopathy screening.
The following criteria were met in both groups: agebetween 15 and 45 years, no cardiac diseases or uncontrolledarterial hypertension (over 130/80mmHg), best-correctedvisual acuity of 20/30 or better (Snellen), Goldmann appla-nation tonometry lower than 20mmHg, refractive errorsless than 5 spherical diopters and 2 cylinder diopters, andtransparent ocularmedia (nuclear color/opalescence, corticalor posterior subcapsular lens opacity<1) according to the lensopacities classification system (LOCS) III [34]. Subjects withprevious intraocular surgery, history of ocular or neurologicdisease, or current use of a medication that could affectvisual field sensitivity were excluded. One eye per patient wasrandomly selected for the study.
Control eyes presented normal ocular findings. The fun-duscopic examination of diabetic patient required, as aselection criterion for this study, the absence of retinopathyor minimal changes. The presence of five or more microa-neurysms in each eyewas an exclusion criteria; no patient hadreceived previous laser treatment. The level of retinopathywas estimated according to the early treatment diabeticretinopathy study (ETDRS) guidelines [35].
All of them had a full ophthalmologic examination:clinical history, visual acuity, biomicroscopy of the anteriorsegment using a slit lamp, intraocular pressure, indirect oph-thalmoscopy (evaluation of peripheral retina), and stereo-scopic ophthalmoscopy of the posterior segment. Addition-ally, diabetic patients underwent a blood extraction within
3 months from the subject’s date of enrolment into the studyto measure the HbA1c level.
At least 2 digital color fundus photographs with a 45-degree field of view were acquired through dilated pupils (1%tropicamide eye drops; Alcon Laboratories Inc., Fort Worth,TX). One of the fundus images was centered on the fovea,while the other was centered on the optic nerve head. Theimages were evaluated by two independent observers (IsabelPinilla and Emilio Abecia) who were masked about thepatients’ identity and the status of disease. Any disagreementwas resolved by consensus.
FDT was performed under low ambient light using theoriginal frequency-doubling perimeter (Carl Zeiss Meditec,Dublin, CA). The full-threshold C-20 strategy was used andperimetric data were analyzed withWindows ViewFinder 1.0software. Trial lenses and patches were not applied, but sub-jects wore their own corrective lenses. Conditions for reliabletest were nomore than 1/6 fixation losses (16%), nomore than1/6 false positive (16%), and no more than 1/3 false negativeresponses (33%); otherwise, visual field tests were repeated.The criterion of abnormal points for FDT was defined by thepresence of at least 5 points lower than𝑃 < 5%, 2 points lowerthan 𝑃 < 2%, or 1 point lower than 𝑃 < 1% on pattern devia-tion plot. The abnormal locations could be anywhere withinthe FDT field [36]. Mean deviation (MD) and pattern stan-dard deviation (PSD) results and time of performance of thetest were also included in the statistical analysis. Every subjectcompleted the FDTs prior to any other exploration, and if theperimetry had to be repeated, it was completed in a differentday to avoid a fatigue effect.
All statistical analyses were performed using the IBMSPSS (version 21.0; IBMCorporation, Somers, NY) andMed-Calc (version 12.7; MedCalc software, Mariakerke, Belgium)statistical software. The Kolmogorov Smirnov test was usedto check for a normal distribution of the data. Differencesbetween both groups were tested using Student’s 𝑡-test whendata followed normal distributions. The probability level atwhich the null hypothesis was rejected was set at 𝑃 <0.05.The receiver operating characteristic (ROC) curves wereplotted for the MD and PSD of FDT (bootstrap replications:1000). The cut-off points were calculated by the MedCalcsoftware as the points with the best sensitivity-specificitybalance.
3. Results
3.1. Results Are Expressed as Mean ± Standard Deviation3.1.1. Patient Data. The control group comprised 12 womenand 18 men. Their mean age was 27.1 ± 9.1 years (range: 15to 44 years; Table 1). The diabetic group included 30 womenand 43 men; their mean age was 26.6 ± 8.3 years (range: 15to 40 years). Figure 1 shows the funduscopic appearance of adiabetic patient with no retinal findings and its FDT results.The mean period from the onset of diabetes was 12.62 ± 6.7years and the mean HbA1c was 7.78mg/dL (Table 2). In 32of them (43.8%), the mean HbA1c value was under 7.5mg/dLand 56.1% (41 patients) had it over this level. Better HbA1ccontrol was achieved in patients with higher number of

BioMed Research International 3
Right eye
Test duration: 4:16
Left eye
Test duration: 4:15
32 32 32
32
3333
33333637
3629
34 3432
32
33
31 32 28
28
2829
28293229
3228
32 2833
32
31
30∘
30∘
30∘
30∘
Threshold (dB)
Total deviation
Pattern deviation
Fixation errors: 0/6False positive errors: 0/6
MD: +2.18 dBPSD: +3.01dB
Fixation errors: 0/6False positive errors: 0/6
MD: +1.95 dBPSD: +3.31dB
False negative errors: 0/3False negative errors: 0/3
P ≥ 5%5%P <
P < 2%P < 1%P < 0.5%
Figure 1: Fundus photographs (one centered on the fovea and the other in the optic disc) and FDT outcome of the same patient with type Idiabetes and minor retinovascular changes.
Table 1: Demographic data and results of FDT in both study groups. 𝑃 < 0.05 was considered statistically significant (in bold print).
Control Diabetics𝑃 value∗
Mean SD Mean SDAge (yrs) 27.1 9.14 26.6 8.3 0.875BCVA (Snellen) 0.93 0.1 0.94 0.1 0.645IOP (mmHg) 14.93 2.2 14.72 2.4 0.680FDT MD (dB) 0.25 1.52 −0.04 2.05 0.130FDT PSD 3.43 0.39 3.78 0.95 0.035Test time (min) 4.33 0.27 4.37 0.44 0.692𝑛 30 73∗Student’s 𝑡-test.BCVA: best-corrected visual acuity; IOP: intraocular pressure; FDT: frequency-doubling perimetry; MD: mean deviation; PSD: pattern standard deviation;SD: standard deviation.
4 BioMed Research International
Table 2: Clinical data of diabetic patients.
Mean SD Minimal value Maximal valueHbA1c last 3months 7.78 1.33 5.5 11.6
HbA1c last year 7.76 1.35 4.5 10.8Number of insulininjections per day 3.10 0.63 1 5
Number of insulins 2 0.55 1 4SD: standard deviation.
insulin injections per day. According to ETDRS severitycriteria applied to our fundus photographs [35], 55 patientshad no retinopathy (level 10, 75.3%) and 18 patients (24.7%)had microaneurysm formation only (level 20). No additionalchanges were detected. Clinical data of diabetic patients arepresented in Table 2. Patients with less than 15 years of historyof diabetes were 43 (58.9%) and 30 had more than 15 yearssince the diabetic onset. The age of the diabetic patients notaffected by ocular changes was lower (𝑃 < 0.001) than the ageof the patients with lesions (25.35±7.4 years versus 32.3±8.3years, resp.). There were also differences (𝑃 < 0.001) in theage of onset of the diabetes between patients without fundus-copic lesions and those with minor retinovascular changes:the mean diabetes duration was 11.06 ± 5.8 years in subjectswithout retinal damage and 20.2 ± 4.2 years in patients withminor lesions.
No significant difference was found for the factors affect-ing retinal blood flow such as level of blood pressure, cigarettesmoking, and rheologic factors, as aspirin use, between thegroups.
3.1.2. Visual Field Data: Altered Points, MD, and PSD. MDof FDT was not different (𝑃 = 0.13) between the controland diabetic group (0.25 ± 1.5 dB and −0.04 ± 2.1 dB, resp.).However, PSD of FDT differed between the groups (3.43±0.4versus 3.78 ± 0.9 in diabetic group; 𝑃 = 0.035).
Two subjects (6.7%) of the control group and 15 (20.5%)of the diabetic patients showed abnormal FDTs based onthe criteria of altered points. No significant differences wereobserved between both groups (𝑃 = 0.09). In the diabeticgroup, 12 (21.8%) of the abnormal FDT were from patientswith no retinopathy and 3 (16.7%) with minimal vascularchanges. No significant differences were observed betweenthe two diabetic groups (𝑃 = 0.82). Abnormal perimetriesdepending on the criterion of altered points showed asignificant higher PSD value (𝑃 = 0.004) than normal tests(4.37 ± 0.5 and 3.62 ± 1.0, resp.).
We examined whether the age of diabetes onset wasrelated to the FDT findings. Patients with less than 15 yearsof the disease had a PSD of 3.72±0.63, while those with morethan 15 years of the disease had a PSD of 3.84 ± 1.16 (𝑃 =0.56).There was no relationship between the HbA1c level andthe mean PSD values (3.69 ± 0.7 and 3.85 ± 1.1 in patientswith HbA1c levels lower and higher than 7.5, resp.). Neitherthe number of insulin injections per day was related to thePSD value.
100
80
60
40
20
0
100806040200
Sens
itivi
ty
100 − specificity
MDPSD
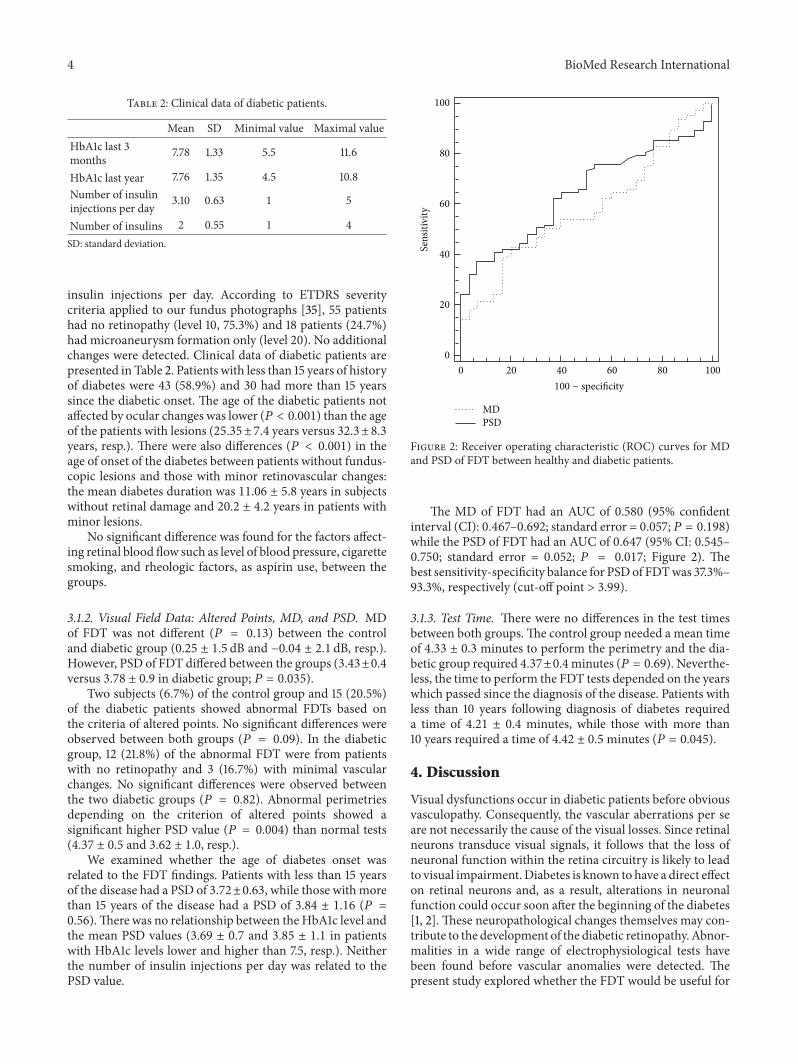
Figure 2: Receiver operating characteristic (ROC) curves for MDand PSD of FDT between healthy and diabetic patients.
The MD of FDT had an AUC of 0.580 (95% confidentinterval (CI): 0.467–0.692; standard error = 0.057; 𝑃 = 0.198)while the PSD of FDT had an AUC of 0.647 (95% CI: 0.545–0.750; standard error = 0.052; 𝑃 = 0.017; Figure 2). Thebest sensitivity-specificity balance for PSDof FDTwas 37.3%–93.3%, respectively (cut-off point > 3.99).
3.1.3. Test Time. There were no differences in the test timesbetween both groups.The control group needed a mean timeof 4.33 ± 0.3 minutes to perform the perimetry and the dia-betic group required 4.37±0.4minutes (𝑃 = 0.69). Neverthe-less, the time to perform the FDT tests depended on the yearswhich passed since the diagnosis of the disease. Patients withless than 10 years following diagnosis of diabetes requireda time of 4.21 ± 0.4 minutes, while those with more than10 years required a time of 4.42 ± 0.5minutes (𝑃 = 0.045).
4. Discussion
Visual dysfunctions occur in diabetic patients before obviousvasculopathy. Consequently, the vascular aberrations per seare not necessarily the cause of the visual losses. Since retinalneurons transduce visual signals, it follows that the loss ofneuronal function within the retina circuitry is likely to leadto visual impairment.Diabetes is known to have a direct effecton retinal neurons and, as a result, alterations in neuronalfunction could occur soon after the beginning of the diabetes[1, 2]. These neuropathological changes themselves may con-tribute to the development of the diabetic retinopathy.Abnor-malities in a wide range of electrophysiological tests havebeen found before vascular anomalies were detected. Thepresent study explored whether the FDT would be useful for

BioMed Research International 5
the individual patient in detecting such changes in neuronalfunction.
FDT is a quick and efficient way of screening visualfield with a very good sensitivity and specificity [28]. Thisperimetry is most likely a probe of contrast sensitivity of themagnocellular pathway [29]. Contrast sensitivity is known tobe affected in diabetic patients and, therefore, FDT can be apromising psychophysical test candidate for the detection ofnot only glaucoma [37] but also other diseases such as dia-betic retinopathy.
TheC-20-5 strategy tests the central 20∘ (10∘×10∘ targets),4 per quadrantwithin the central 20∘, with one smaller centraltarget (5∘ diameter circle) projected on themacular region. Inour study, we used 45∘ fundus photographs centered on thefovea and the optic disc. Consequently, they should cover thearea of the retina assessed by FDT. We did not find changesin the number of altered FDT tests. This suggests that thediabetic patient might not already have detectable visual fielddefects.Thus, it is important to consider that the abnormalitycriterion for FDT was based on glaucoma patients [36].Hence, there will be a need for a new definition for patientswith diabetes, who are likely to have different visual fielddefects than patients with glaucoma.
Although MD was similar between diabetic and normalgroups, there was a statistically significant difference in PSDvalues. This suggests that localized diminutions of retinalsensitivity occur in diabetic patients, prior to the appearanceof retinal lesions. It is relevant to note that the median ageof the diabetic group was 26 years; at this age no other opticnerve pathologies are expected to be found. No differenceswere observed between patients with normal orminimal fun-dus changes. These can be explained for two reasons: (1) thelow number of patients affected with background retinopathyand (2) the minimal changes they were showing. To know ifthese changes can predict the appearance of retinal vascularabnormalities in the future, a prolonged follow-up should beperformed. It is likely that those patients whose contrast sen-sitivity was impaired later would show background retinopa-thy. Alternatively, the test results may suggest the possibilityof an ischemic involvement; this could be controlled by tak-ing into account angiographic findings. However, screeningnormal patients with angiographies should be avoided ifpossible. Parikh et al. [38] reported the possibility of usingthe FDT as a way of detecting sight-threatening diabeticretinopathy. One key difference from the present study isthat Parikh et al. included patients with advanced retinopathystates in their study. Although their findings remain in com-pliance with the ability of FDT in detecting ischemic states,a crucial use of the FDT should be the ability of detectingpotential funduscopic lesions prior to their occurrence, there-fore allowing preventive measures to be taken.
Realini et al., using the C-20-5 screening algorithm of theFDT perimeter, have found that diabetes can affect glaucomascreening using FDT testing and recommended the exclusionof patients with cataract and/or diabetes from this screening,suggesting that the specificity of the screeningwould improve[33]. They used a suprathreshold strategy derived from thefifth percentile of normal values, but nowadays this algorithmis not available in the software for the commercial version of
this device. Our study has shown results based on a thres-hold strategy that can be performed in the original commer-cialized FDT perimeter.
Other authors reported that Matrix and scanning laserpolarimetry with variable corneal compensation (GDx VCC)could be useful to identify early retinal impairment inpatients with type I diabetes mellitus and without signs ofretinal vasculopathy [39]. The Humphrey Matrix perime-ter (Carl Zeiss Meditec) allows FDT algorithms similar tothose of conventional perimetry. In spite of this innovation,the original FDT perimeter cannot be considered outdatedbecause each of these instruments has a different purpose.
Bell et al. [40] used themultifocal pupillographic perime-try to evaluate changes in patients with early type 2 diabetes.They used transient stimuli containing low spatial frequen-cies (less than 2 cycles/degree) and found that some retinaldamage was present in the near absence of visible diabeticretinopathy, especially in those patients with more than 10years of diabetes.
FDT is a fast examination, ideal as a screening approach,with an analysis time shorter than other strategies used instandard automated perimetry. FDT testing is commonlyachieved in less than 1 minute for the suprathreshold algo-rithm and less than 5 minutes for the threshold detectingmode. This fact makes FDT a good option for testing visualfield in all kind of subjects, even children. Patel et al. [41]found that subjects with normal visual fields completed thescreening C-20-1 FDT examination within 90 seconds, andtimes of performance longer than 90 seconds can be consid-ered as abnormal FDT. In our study, no significant differenceswere observed for the test time between normal subjects andthe diabetic group. However, for the C-20 threshold algo-rithm the time of the perimetry cannot be applied as amarkerof disease, because obviously the way of testing the visualfield points is different for a threshold than for a suprathresh-old mode.
A major problem of some psychophysical tests usedfor glaucoma screening such as FDT or short-wavelengthautomated perimetry is the high false positive rate that wouldreduce the specificity [42]. It is important to take into con-sideration that patients with ocular pathology like cataractsand systemic diseases such as diabetes, with orwithout retinalmanifestations, can interfere in some glaucoma screeningtests including FDT. Cataract is known to alter the contrastsensitivity perception, and it has been demonstrated thatpatients who underwent cataract extraction indeed improvedtheir retinal sensitivity [43].
5. Conclusions
Diabetic patients without retinopathy or with minor retino-vascular changes have alterations in FDT threshold test witha diminution of the sensitivity. The findings suggest theoccurrence of retinal dysfunctions prior to the onset of dia-betic retinopathy. The test could be considered as a fast wayto determine whether there is a diminution in retinal sensi-tivity in these patients.
6 BioMed Research International
Conflict of Interests
The authors declare that there is no conflict of interestsregarding the publication of this paper.
Acknowledgments
The authors would like to thank Dr. Lynda Wright forcritically reading the paper. This work is supported in partby DGA group B99 Investigacion en Retina and the Institutode Salud Carlos III Grants PI080976 and 13 PI1101239.
References
[1] Q. Li, E. Zemel, B. Miller, and I. Perlman, “Early retinaldamage in experimental diabetes: electroretinographical andmorphological observations,” Experimental Eye Research, vol.74, no. 5, pp. 615–625, 2002.
[2] Y. Aizu, K. Oyanagi, J. Hu, and H. Nakagawa, “Degeneration ofretinal neuronal processes and pigment epithelium in the earlystage of the streptozotocin-diabetic rats,” Neuropathology, vol.22, no. 3, pp. 161–170, 2002.
[3] K. Frost Larsen, J. Sandahl Christiansen, and H. H. Parving,“The effect of strict short-termmetabolic control on retinal ner-vous system abnormalities in newly diagnosed type 1 (insulin-dependent) diabetic patients,” Diabetologia, vol. 24, no. 3, pp.207–209, 1983.
[4] J. V. Lovasik and M. M. Spafford, “An electrophysiologicalinvestigation of visual function in juvenile insulin-dependentdiabetes mellitus,” American Journal of Optometry and Physio-logical Optics, vol. 65, no. 4, pp. 236–253, 1988.
[5] M. A. S. Di Leo, B. Falsini, G. Ghirlanda, V. Porciatti, and A.V. Greco, “Spatial frequency-selective losses with pattern elec-troretinogram in Type 1 (insulin-dependent) diabetic patientswithout retinopathy,” Diabetologia, vol. 33, no. 12, pp. 726–730,1990.
[6] A. V. Greco, M. A. S. Di Leo, S. Caputo et al., “Early selectiveneuroretinal disorder in prepubertal type 1 (insulin-dependent)diabetic children without microvascular abnormalities,” ActaDiabetologica, vol. 31, no. 2, pp. 98–102, 1994.
[7] A. Kurtenbach, H. Langrova, and E. Zrenner, “Multifocaloscillatory potentials in Type 1 diabetes without retinopathy,”Investigative Ophthalmology and Visual Science, vol. 41, no. 10,pp. 3234–3241, 2000.
[8] M. A. Bearse Jr., Y. Han, M. E. Schneck, and A. J. Adams, “Reti-nal function in normal and diabetic eyes mapped with the slowflash multifocal electroretinogram,” Investigative Ophthalmol-ogy and Visual Science, vol. 45, no. 1, pp. 296–304, 2004.
[9] J. A. Phipps, E. L. Fletcher, and A. J. Vingrys, “Paired-flash iden-tification of rod and cone dysfunction in the diabetic rat,” Inves-tigative Ophthalmology and Visual Science, vol. 45, no. 12, pp.4592–4600, 2004.
[10] K. E. Mortlock, Z. Chiti, N. Drasdo, D. R. Owens, and R. V.North, “Silent substitution S-cone electroretinogram in subjectswith diabetes mellitus,” Ophthalmic and Physiological Optics,vol. 25, no. 5, pp. 392–399, 2005.
[11] S. Della Sala, G. Bertoni, and L. Somazzi, “Impaired contrastsensitivity in diabetic patients with and without retinopathy:a new technique for rapid assessment,” British Journal ofOphthalmology, vol. 69, no. 2, pp. 136–142, 1985.
[12] S. Sokol, A. Moskowitz, and B. Skarf, “Contrast sensitivity indiabetics with and without background retinopathy,” Archivesof Ophthalmology, vol. 103, no. 1, pp. 51–54, 1985.
[13] G. M. Ismail and D. Whitaker, “Early detection of changes invisual function in diabetes mellitus,”Ophthalmic and Physiolog-ical Optics, vol. 18, no. 1, pp. 3–12, 1998.
[14] P. R. Kinnear, P. A. Aspinall, and R. Lakowski, “The diabetic eyeand colour vision,” Transactions of the Ophthalmological Soci-eties of the United Kingdom, vol. 92, pp. 69–78, 1972.
[15] K. Puvanendran, G. Devathasan, and P. K. Wong, “Visualevoked responses in diabetes,” Journal of Neurology Neuro-surgery and Psychiatry, vol. 46, no. 7, pp. 643–647, 1983.
[16] M. Anastasi, M. Lauricella, C. Giordano, and A. Galluzo,“Visual evoked potentials in insulin-dependent diabetics,” ActaDiabetologica Latina, vol. 22, no. 4, pp. 343–349, 1985.
[17] G. Pozzessere, P. A. Rizzo, E. Valle et al., “Early detection ofneurological involvement in IDDM and NIDDM. Multimodalevoked potentials versus metabolic control,” Diabetes Care, vol.11, no. 6, pp. 473–480, 1988.
[18] K. Yaltkaya, S. Balkan, and A. I. Baysal, “Visual evoked poten-tials in diabetes mellitus,” Acta Neurologica Scandinavica, vol.77, no. 3, pp. 239–241, 1988.
[19] E. Mariani, G. Moreo, and G. B. Colucci, “Study of visualevoked potentials in diabetics without retinopathy: correlationswith clinical findings and polyneuropathy,” Acta NeurologicaScandinavica, vol. 81, no. 4, pp. 337–340, 1990.
[20] V. Martinelli, I. M. Filippi, F. Meschi, G. Pozza, N. Canal, andG. C. Comi, “Electrophysiological study of optic pathways ininsulin dependent diabetes mellitus,” Clinical Vision Sciences,vol. 6, no. 6, pp. 437–443, 1991.
[21] G. Pozzessere, E. Valle, S. De Crignis et al., “Abnormalities ofcognitive functions in IDDM revealed by P300 event-relatedpotential analysis: comparison with short-latency evokedpotentials and psychometric tests,” Diabetes, vol. 40, no. 8, pp.952–958, 1991.
[22] L. Uccioli, V. Parisi, G. Monticone et al., “Electrophysiologi-cal assessment of visual function in newly diagnosed IDDMpatients,” Diabetologia, vol. 38, no. 7, pp. 804–808, 1995.
[23] E. Chihara, T.Matsuoka, Y. Ogura, andM.Matsumura, “Retinalnerve fiber layer defect as an early manifestation of diabeticretinopathy,” Ophthalmology, vol. 100, no. 8, pp. 1147–1151, 1993.
[24] D. H. Kelly, “Frequency doubling in visual responses,” Journalof the Optical Society of America, vol. 56, no. 11, pp. 1628–1633,1966.
[25] D. H. Kelly, “Nonlinear visual responses to flickering sinusoidalgratings,” Journal of the Optical Society of America, vol. 71, no. 9,pp. 1051–1055, 1981.
[26] T.Maddess, I. Goldberg, J. Dobinson, S.Wine, A. H.Welsh, andA. C. James, “Testing for glaucoma with the spatial frequencydoubling illusion,” Vision Research, vol. 39, no. 25, pp. 4258–4273, 1999.
[27] P. G. D. Spry, C. A. Johnson, A. M. McKendrick, and A. Turpin,“Variability components of standard automated perimetry andfrequency-doubling technology perimetry,” Investigative Oph-thalmology and Visual Science, vol. 42, no. 6, pp. 1404–1410,2001.
[28] P. Fogagnolo, L. Rossetti, S. Ranno, A. Ferreras, and N. Orza-lesi, “Short-wavelength automated perimetry and frequency-doubling technology perimetry in glaucoma,” Progress in BrainResearch, vol. 173, pp. 101–124, 2008.

BioMed Research International 7
[29] A. J. R. White, H. Sun, W. H. Swanson, and B. B. Lee, “Anexamination of physiological mechanisms underlying the freq-uency-doubling illusion,” Investigative Ophthalmology andVisual Science, vol. 43, no. 11, pp. 3590–3599, 2002.
[30] M. Wolkstein, A. Atkin, and I. Bodis-Wollner, “Contrast sensi-tivity in retinal disease,”Ophthalmology, vol. 87, no. 11, pp. 1140–1149, 1980.
[31] I.M. Ghafour,W. S. Foulds, D. Allan, and E.McClure, “Contrastsensitivity in diabetic subjects with and without retinopathy,”British Journal of Ophthalmology, vol. 66, no. 8, pp. 492–495,1982.
[32] L. Hyvarinen, P. Laurinen, and J. Rovamo, “Contrast sensitivityin evaluation of visual impairment due to diabetes,” ActaOphthalmologica, vol. 61, no. 1, pp. 94–101, 1983.
[33] T. Realini, M. Q. Lai, and L. Barber, “Impact of diabetes onglaucoma screening using frequency-doubling perimetry,”Ophthalmology, vol. 111, no. 11, pp. 2133–2136, 2004.
[34] L. T. Chylack Jr., J. K. Wolfe, D. M. Singer et al., “The lensopacities classification system III,” Archives of Ophthalmology,vol. 111, no. 6, pp. 831–836, 1993.
[35] Treatment Diabetic Retinopathy Study Research Group: Pho-tocoagulation for diabetic macular edema, “Early treatmentdiabetic retinopathy study report number 1,” Archives of Oph-thalmology, vol. 103, no. 12, pp. 1796–1806, 1985.
[36] A. Ferreras, J. M. Larrosa, V. Polo, A. B. Pajarın, F. Mayoral, andF.M.Honrubia, “Frequency-doubling technology: searching forthe optimum diagnostic criteria for glaucoma,” Acta Ophthal-mologica Scandinavica, vol. 85, no. 1, pp. 73–79, 2007.
[37] A. Ferreras, V. Polo, J. M. Larrosa et al., “Can frequency-doubling technology and short-wavelength automated perime-tries detect visual field defects before standard automatedperimetry in patients with preperimetric glaucoma?” Journal ofGlaucoma, vol. 16, no. 4, pp. 372–383, 2007.
[38] R. Parikh, M. Naik, A. Mathai, T. Kuriakose, J. Muliyil, and R.Thomas, “Role of frequency doubling technology perimetry inscreening of diabetic retinopathy,” Indian Journal of Ophthal-mology, vol. 54, no. 1, pp. 17–22, 2006.
[39] M. Parravano, F. Oddone, D. Mineo et al., “The role ofHumphrey Matrix testing in the early diagnosis of retinopathyin type 1 diabetes,” British Journal of Ophthalmology, vol. 92, no.12, pp. 1656–1660, 2008.
[40] A. Bell, A. C. James, M. Kolic, R. W. Essex, and T. Maddess,“Dichoptic multifocal pupillography reveals afferent visual fielddefects in early type 2 diabetes,” Investigative Ophthalmologyand Visual Science, vol. 51, no. 1, pp. 602–608, 2010.
[41] S. C. Patel, D. S. Friedman, P. Varadkar, and A. L. Robin,“Algorithm for interpreting the results of frequency doublingperimetry,” American Journal of Ophthalmology, vol. 129, no. 3,pp. 323–327, 2000.
[42] A.U. Bayer andC. Erb, “Short wavelength automated perimetry,frequency doubling technology perimetry, and pattern elec-troretinography for prediction of progressive glaucomatousstandard visual field defects,”Ophthalmology, vol. 109, no. 5, pp.1009–1017, 2002.
[43] A. P. Tanna, C. Abraham, J. Lai, and J. Shen, “Impact of cataracton the results of frequency-doubling technology perimetry,”Ophthalmology, vol. 111, no. 8, pp. 1504–1507, 2004.

Submit your manuscripts athttp://www.hindawi.com
Stem CellsInternational
Hindawi Publishing Corporationhttp://www.hindawi.com Volume 2014
Hindawi Publishing Corporationhttp://www.hindawi.com Volume 2014
MEDIATORSINFLAMMATION
of
Hindawi Publishing Corporationhttp://www.hindawi.com Volume 2014
Behavioural Neurology
EndocrinologyInternational Journal of
Hindawi Publishing Corporationhttp://www.hindawi.com Volume 2014
Hindawi Publishing Corporationhttp://www.hindawi.com Volume 2014
Disease Markers
Hindawi Publishing Corporationhttp://www.hindawi.com Volume 2014
BioMed Research International
OncologyJournal of
Hindawi Publishing Corporationhttp://www.hindawi.com Volume 2014
Hindawi Publishing Corporationhttp://www.hindawi.com Volume 2014
Oxidative Medicine and Cellular Longevity
Hindawi Publishing Corporationhttp://www.hindawi.com Volume 2014
PPAR Research
The Scientific World JournalHindawi Publishing Corporation http://www.hindawi.com Volume 2014
Immunology ResearchHindawi Publishing Corporationhttp://www.hindawi.com Volume 2014
Journal of
ObesityJournal of
Hindawi Publishing Corporationhttp://www.hindawi.com Volume 2014
Hindawi Publishing Corporationhttp://www.hindawi.com Volume 2014
Computational and Mathematical Methods in Medicine
OphthalmologyJournal of
Hindawi Publishing Corporationhttp://www.hindawi.com Volume 2014
Diabetes ResearchJournal of
Hindawi Publishing Corporationhttp://www.hindawi.com Volume 2014
Hindawi Publishing Corporationhttp://www.hindawi.com Volume 2014
Research and TreatmentAIDS
Hindawi Publishing Corporationhttp://www.hindawi.com Volume 2014
Gastroenterology Research and Practice
Hindawi Publishing Corporationhttp://www.hindawi.com Volume 2014
Parkinson’s Disease
Evidence-Based Complementary and Alternative Medicine
Volume 2014Hindawi Publishing Corporationhttp://www.hindawi.com