Embed Size (px)
Citation preview
BLA761024 Page 1 of 55
CLINICAL PHARMACOLOGY REVIEW
BLA 761024
Submission Date: 11/25/2015
Proposed Brand Name:
Nonproprietary Name: ABP 501 (adalimumab-xxxx)1
Clinical Pharmacology Reviewer: Jianmeng Chen, M.D., Ph.D.
Clinical Pharmacology Team Leader :
Anshu Marathe, Ph.D.
OCP Division: Division of Clinical Pharmacology II
OND Division: Division of Pulmonary, Allergy, and Rheumatology Products
Sponsor: Amgen
Submission Type; Code: 351(k); standard review
Formulation; Strength(s) Single-use prefilled syringe 40 mg/0.8 mL and 20 mg/0.4 mL; Autoinjector (SureClick): 40 mg/0.8 mL
Proposed Indications: Rheumatoid arthritis (RA), polyarticular juvenile idiopathic arthritis (PJIA) in patients 4 years and older, ankylosing spondylitis (AS), psoriatic arthritis (PsA), plaque psoriasis (PsO), adult Crohn’s disease (CD), adult Ulcerative colitis (UC)
Proposed Dosage Regimens: Same as Humira
1. Executive Summary ............................................................................................ 2 1.1 Recommendations .............................................................................................. 3 1.2 Phase IV Commitments ..................................................................................... 3 1.3 Summary of Clinical Pharmacology and Biopharmaceutics Findings ........... 3
2. Question Based Review ................................................................................................. 4 2.1 General Attributes .................................................................................................. 4
2.1.1 What pertinent regulatory background or history contributes to the current assessment of the clinical pharmacology of this drug? .................................. 5
2.1.2 What are the highlights of the chemistry and physical-chemical properties
1 In this document, FDA generally refers to Amgen’s proposed product by the Amgen descriptor “ABP 501.” FDA has not yet designated a nonproprietary name for Amgen’s proposed biosimilar product that includes a distinguishing suffix (see Draft Guidance on Nonproprietary Naming of Biological Products).
Reference ID: 3974069
(b) (4)
BLA761024 Page 2 of 55
of the drug substance and the formulation of the drug product? .................. 5 2.1.3 What are the proposed mechanism of action and therapeutic indication(s)?
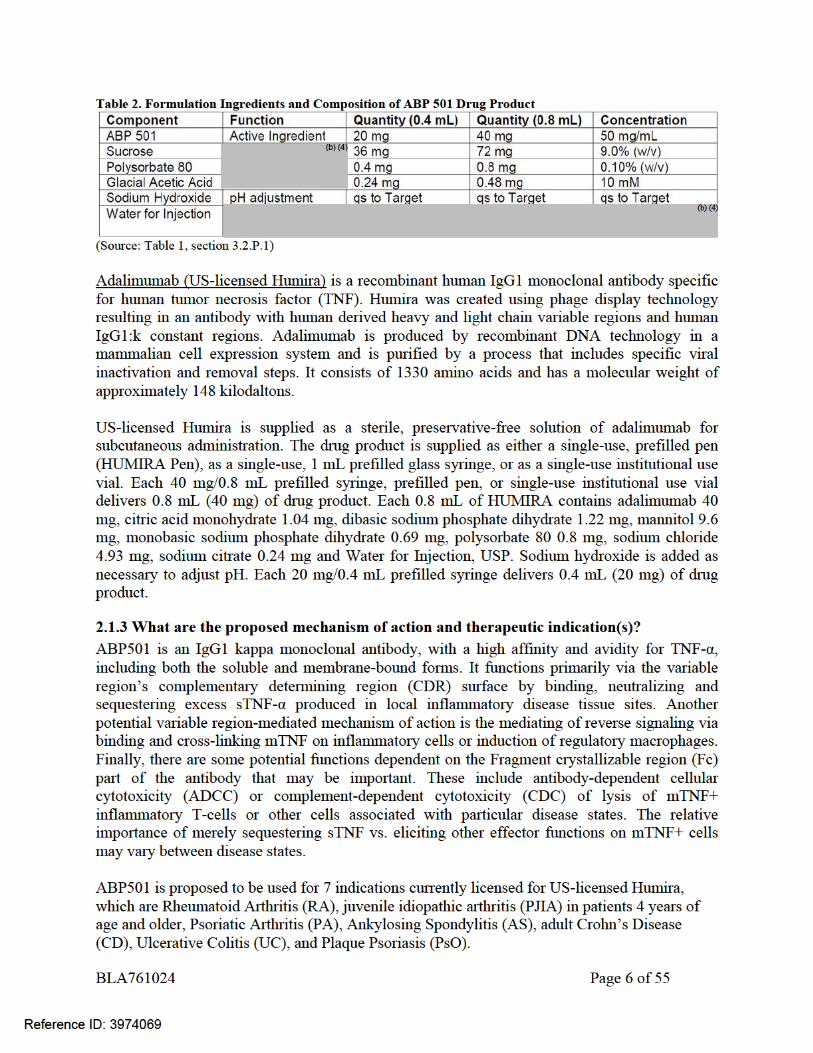
........................................................................................................................... 6 2.1.4 What are the proposed dosages and routes of administration? .............. 7
2.2 General Clinical Pharmacology ............................................................................ 7 2.2.1 What are the design features of the clinical pharmacology and
biopharmaceutics studies and the clinical studies used to support dosing or claims? .............................................................................................................. 7
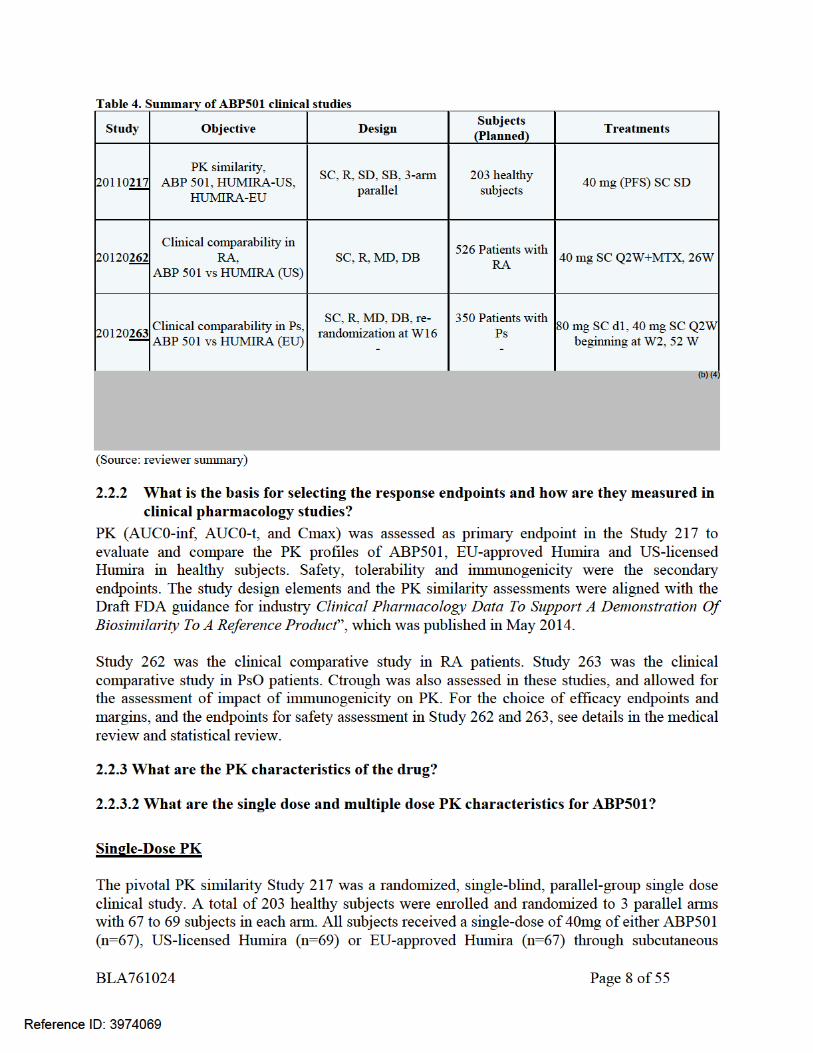
2.2.2 What is the basis for selecting the response endpoints and how are they measured in clinical pharmacology studies? .................................................. 8
2.2.3 What are the PK characteristics of the drug? ............................................ 8 2.3 Intrinsic Factors ................................................................................................... 14
2.3.1 Immunogenicity ......................................................................................... 14 2.4 General Biopharmaceutics .................................................................................. 20
2.4.1 What is the in vivo relationship of the proposed to-be-marketed formulation to the pivotal clinical trial formulation in terms of comparative exposure? 20
2.5 Analytical Section ................................................................................................ 21 2.5.1 What are the analytical methods used to measure ABP501 or Humira in
serum? ............................................................................................................ 21 2.5.2 What bioanalytical methods are used to assess concentrations of the
measured moieties? ........................................................................................ 25 2.5.3 What is the range of the standard curve? How does it relate to the
requirements for clinical studies? What curve fitting techniques were used?25 2.5.4 What is the sample stability under conditions used in the study? ........... 25 2.5.5 What bioanalytical methods are used to assess the immunogenicity? .... 25
3. Detailed Labeling Recommendations .......................................................................... 26 4.1 Appendix – Individual Study Review ................................................................... 29
Study 20110217 (3-way PK Bridge/Similarity Study in Healthy Subjects) ...... 29 Study 262 (Clinical Comparative Study in RA) ................................................. 37 Study 263 (Clinical comparative Study in PsO) ................................................ 42
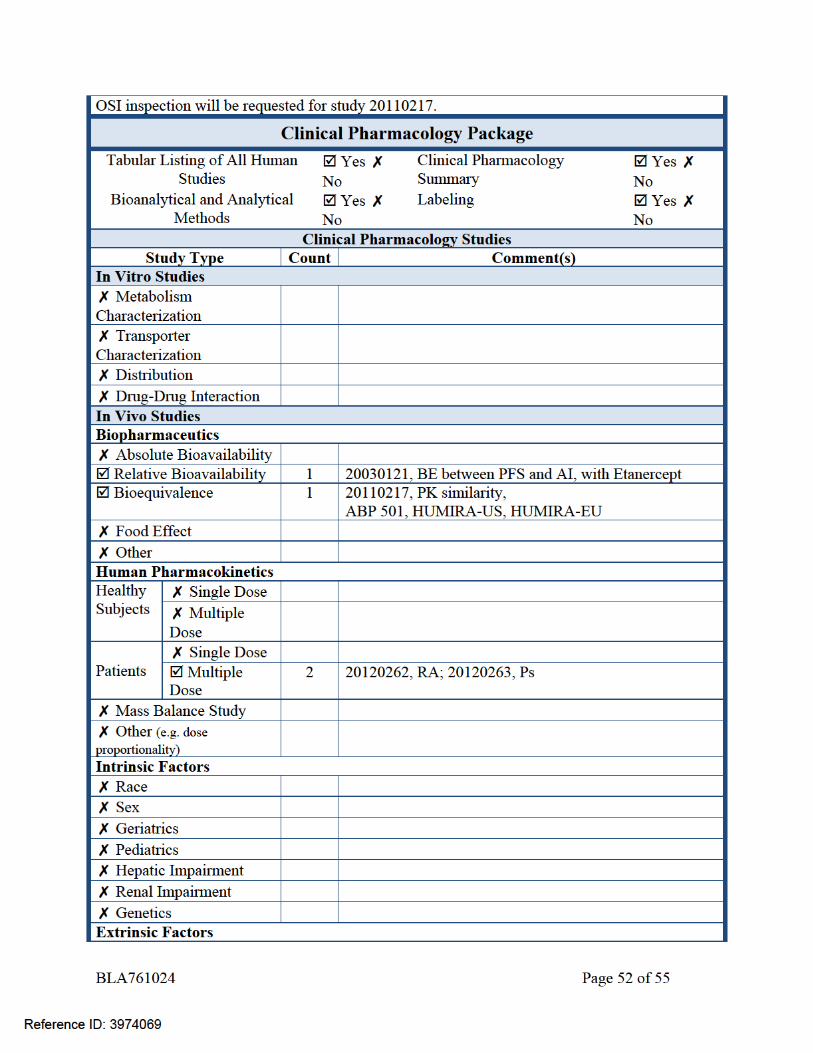
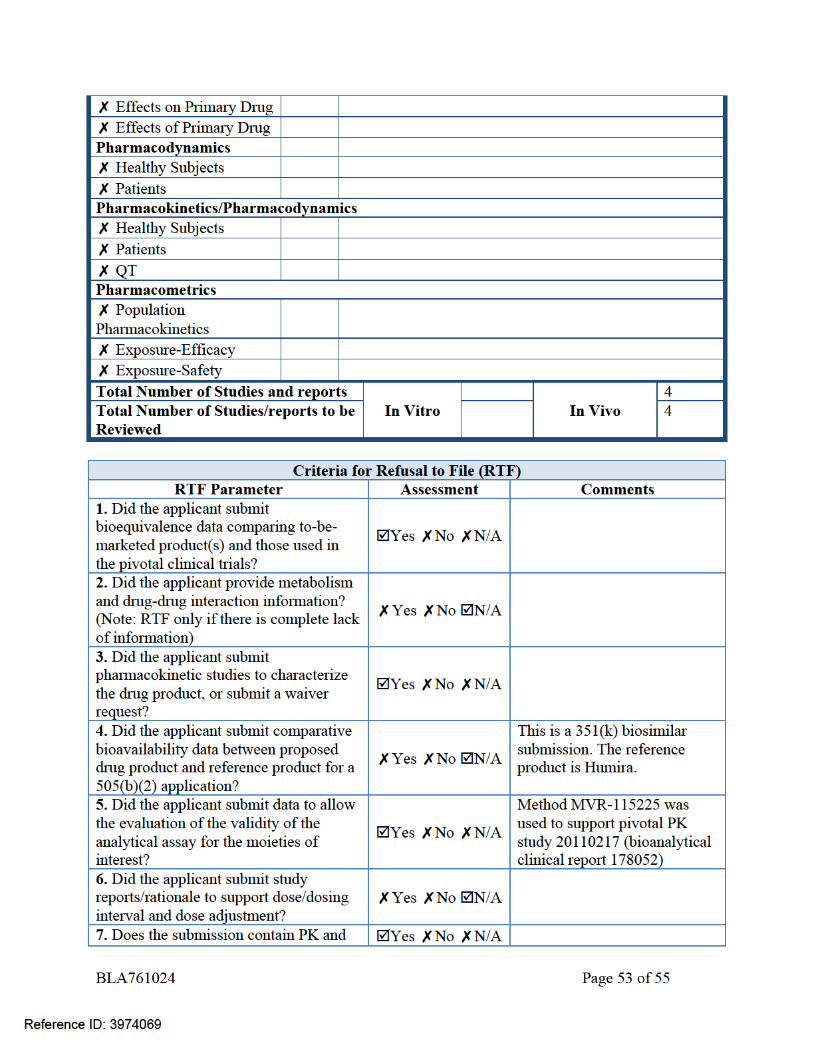
4.2 Appendix – Office of Clinical Pharmacology Filing Memo .............................. 51
1. Executive Summary Amgen submitted a Biologic License Application (BLA) for ABP501, a recombinant human immunoglobulin G1(IgG1) monoclonal antibody that binds to human tumor necrosis factor alpha (TNFα), under Section 351(k) of the Public Health Service Act (42 U.S.C. 262(k)). The applicant is seeking approval for ABP501 as a biosimilar to US-licensed Humira (BLA 125057) and licensure for seven indications currently approved for US-licensed Humira, which are Rheumatoid Arthritis (RA), juvenile idiopathic arthritis (PJIA) in patients 4 years of age and older, Psoriatic Arthritis (PA), Ankylosing Spondylitis (AS), adult Crohn’s Disease (CD), Ulcerative Colitis (UC), and Plaque Psoriasis (PsO). ABP501 drug product is supplied as a single-use pre-filled syringe (40 mg/0.8 mL, 20 mg/0.4mL) or a single use autoinjector (40 mg/0.8 mL) for subcutaneous injection. The clinical development for ABP501 relevant to US submission included three clinical studies.
Reference ID: 3974069
BLA761024 Page 3 of 55
Pharmacokinetic (PK) similarity of ABP501 to US-licensed Humira was evaluated with the pivotal three-way PK similarity study to compare the PK, safety, tolerability, and immunogenicity of ABP501, EU-approved Humira and US-licensed Humira in healthy subjects (Study 217). PK and immunogenicity were also assessed in study 262 to compare ABP 501 and US-licensed Humira in RA patients (with concomitant use of methotrexate), and study 263 in psoriasis patients to compare ABP501 and EU-approved Humira (administered as monotherapy). PK similarity was demonstrated between ABP501, EU-approved Humira, and US-licensed Humira in healthy subjects (study 217). In this study, the pairwise comparisons of ABP501, US-licensed Humira and EU-approved Humira met the pre-specified acceptance criteria for PK similarity (90% CIs for the ratios of geometric mean of AUCinf, AUClast, and Cmax, within the interval of 80% to 125%), thus establishing the PK similarity and providing the PK bridging data in addition to the analytical bridging data, to justify the relevance of the comparative data generated using EU-approved Humira. In addition, similar trough concentrations were demonstrated for ABP501 and US-licensed Humira in patients with RA (with concomitant use of methotrexate, Study 262), and for ABP501 and EU-approved Humira in patients with PsO (administered as monotherapy, Study 263). The incidence of binding anti-drug antibody (ADA) formation on Day 63 in healthy subjects was 43%, 51%, and 50% for ABP501, EU-approved Humira, and US-licensed Humira, respectively. While the development of ADAs appears to increase clearance of the products, the impact of ADAs on PK was similar between these three treatment groups. After multiple doses, the ADA incidence increased over time in all arms in Study 262 and 263, and was comparable between ABP501 and US-licensed Humira in patients with RA (Study 262), and ABP501 and EU-approved Humira in patients with PsO (Study 263). Overall, the PK similarity has been demonstrated between ABP501 and the US-licensed Humira. PK data also support the scientific bridge between the US-licensed Humira and EU-approved Humira to justify the relevance of comparative data generated using EU-approved Humira. The PK results add to the totality of evidence to support a demonstration of biosimilarity of ABP501 and US-licensed Humira.
1.1 Recommendations The Office of Clinical Pharmacology has determined that PK similarity has been demonstrated between ABP501 and US-licensed Humira, and the PK results support a demonstration of no clinically meaningful differences between ABP501 and US-licensed Humira. Labeling Recommendations Please refer to Section 3 – Detailed Labeling Recommendations.
1.2 Phase IV Commitments None.
1.3 Summary of Clinical Pharmacology and Biopharmaceutics Findings
Reference ID: 3974069
BLA761024 Page 4 of 55
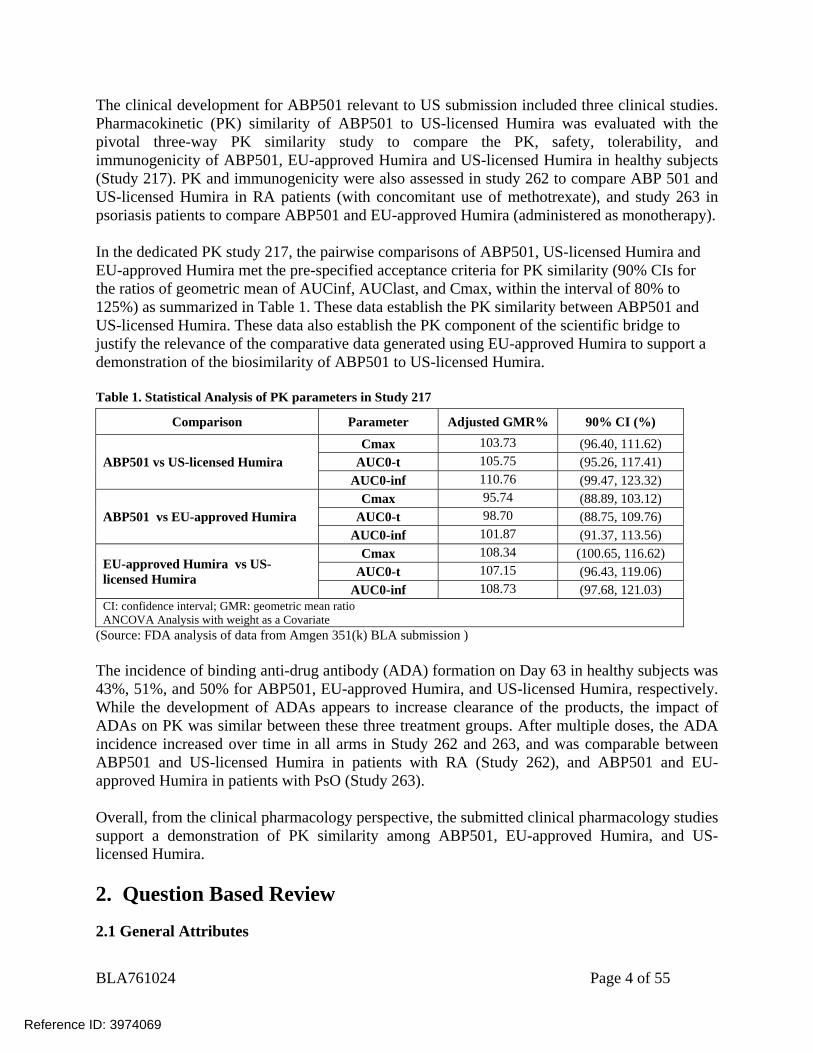
The clinical development for ABP501 relevant to US submission included three clinical studies. Pharmacokinetic (PK) similarity of ABP501 to US-licensed Humira was evaluated with the pivotal three-way PK similarity study to compare the PK, safety, tolerability, and immunogenicity of ABP501, EU-approved Humira and US-licensed Humira in healthy subjects (Study 217). PK and immunogenicity were also assessed in study 262 to compare ABP 501 and US-licensed Humira in RA patients (with concomitant use of methotrexate), and study 263 in psoriasis patients to compare ABP501 and EU-approved Humira (administered as monotherapy). In the dedicated PK study 217, the pairwise comparisons of ABP501, US-licensed Humira and EU-approved Humira met the pre-specified acceptance criteria for PK similarity (90% CIs for the ratios of geometric mean of AUCinf, AUClast, and Cmax, within the interval of 80% to 125%) as summarized in Table 1. These data establish the PK similarity between ABP501 and US-licensed Humira. These data also establish the PK component of the scientific bridge to justify the relevance of the comparative data generated using EU-approved Humira to support a demonstration of the biosimilarity of ABP501 to US-licensed Humira. Table 1. Statistical Analysis of PK parameters in Study 217
Comparison Parameter Adjusted GMR% 90% CI (%)
ABP501 vs US-licensed Humira Cmax 103.73 (96.40, 111.62)
AUC0-t 105.75 (95.26, 117.41) AUC0-inf 110.76 (99.47, 123.32)
ABP501 vs EU-approved Humira Cmax 95.74 (88.89, 103.12)
AUC0-t 98.70 (88.75, 109.76) AUC0-inf 101.87 (91.37, 113.56)
EU-approved Humira vs US-licensed Humira
Cmax 108.34 (100.65, 116.62) AUC0-t 107.15 (96.43, 119.06)
AUC0-inf 108.73 (97.68, 121.03) CI: confidence interval; GMR: geometric mean ratio ANCOVA Analysis with weight as a Covariate
(Source: FDA analysis of data from Amgen 351(k) BLA submission ) The incidence of binding anti-drug antibody (ADA) formation on Day 63 in healthy subjects was 43%, 51%, and 50% for ABP501, EU-approved Humira, and US-licensed Humira, respectively. While the development of ADAs appears to increase clearance of the products, the impact of ADAs on PK was similar between these three treatment groups. After multiple doses, the ADA incidence increased over time in all arms in Study 262 and 263, and was comparable between ABP501 and US-licensed Humira in patients with RA (Study 262), and ABP501 and EU-approved Humira in patients with PsO (Study 263). Overall, from the clinical pharmacology perspective, the submitted clinical pharmacology studies support a demonstration of PK similarity among ABP501, EU-approved Humira, and US-licensed Humira. 2. Question Based Review
2.1 General Attributes
Reference ID: 3974069
BLA761024 Page 5 of 55
2.1.1 What pertinent regulatory background or history contributes to the current assessment of the clinical pharmacology of this drug?
Amgen is developing ABP501 as a proposed biosimilar to Humira® (adalimumab). Humira®
was approved in the United States (US) in 2002 under BLA125057. During the clinical development of ABP501, several key regulatory interactions with Amgen occurred: The first interaction with the FDA on the ABP 501 development program occurred at a Biosimilar Biological Product Development (BPD) meeting held on August 24, 2011 with several follow up interactions that included a BPD Type 4 meeting held on June 10, 2015. Additional interactions occurred to discuss the initial Pediatric Study Plan (iPSP). During the pre-submission interactions, FDA provided product quality, nonclinical, and clinical comments, including the recommendations to the applicant regarding demonstration of PK similarity between ABP 501, US-licensed Humira and EU-approved Humira. OSI inspection was requested for study 20110217 (Study 217), for ICON Clinical Pharmacology (clinical site) and (analytical lab). The Division of New Drug Bioequivalence Evaluation (DNDBE) and Office of Study Integrity and Surveillance (OSIS) recommended that the data were acceptable following evaluation of the inspection findings. See reviews by Dr. Mohsen Rajabi and Dr. Xiaohan Cai dated 7/27/2016. An advisory committee meeting was held on 7/12/2016 and the committee voted (26yes: 0no: 0abstain) for approval of ABP501. The voting question is:
• Does the totality of the evidence support licensure of ABP501 as a biosimilar product to US-licensed Humira for the following indications for which US-licensed Humira is currently licensed and for which Amgen is seeking licensure (RA, JIA in patients 4 years of age and older, PsA, AS, adult CD, adult UC, and PsO)? The vote result is: 26Y: 0N: 0Abstain
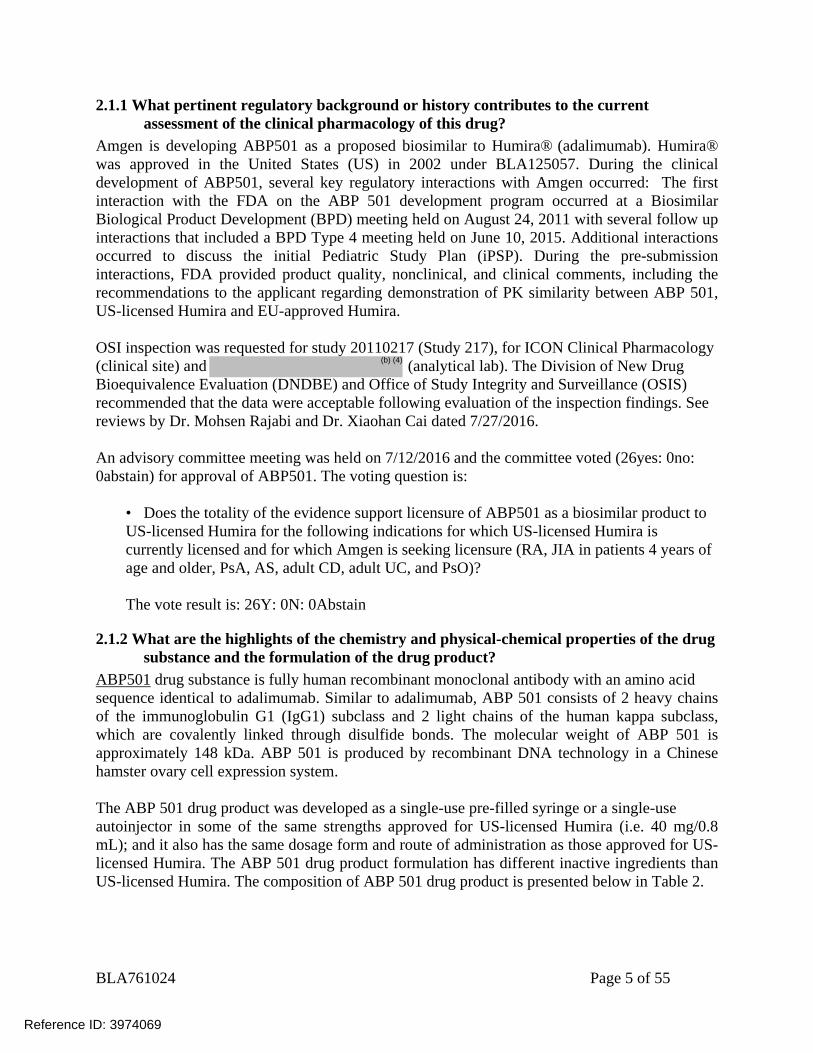
2.1.2 What are the highlights of the chemistry and physical-chemical properties of the drug substance and the formulation of the drug product?
ABP501 drug substance is fully human recombinant monoclonal antibody with an amino acid sequence identical to adalimumab. Similar to adalimumab, ABP 501 consists of 2 heavy chains of the immunoglobulin G1 (IgG1) subclass and 2 light chains of the human kappa subclass, which are covalently linked through disulfide bonds. The molecular weight of ABP 501 is approximately 148 kDa. ABP 501 is produced by recombinant DNA technology in a Chinese hamster ovary cell expression system. The ABP 501 drug product was developed as a single-use pre-filled syringe or a single-use autoinjector in some of the same strengths approved for US-licensed Humira (i.e. 40 mg/0.8 mL); and it also has the same dosage form and route of administration as those approved for US-licensed Humira. The ABP 501 drug product formulation has different inactive ingredients than US-licensed Humira. The composition of ABP 501 drug product is presented below in Table 2.
Reference ID: 3974069
(b) (4)
BLA761024 Page 9 of 55
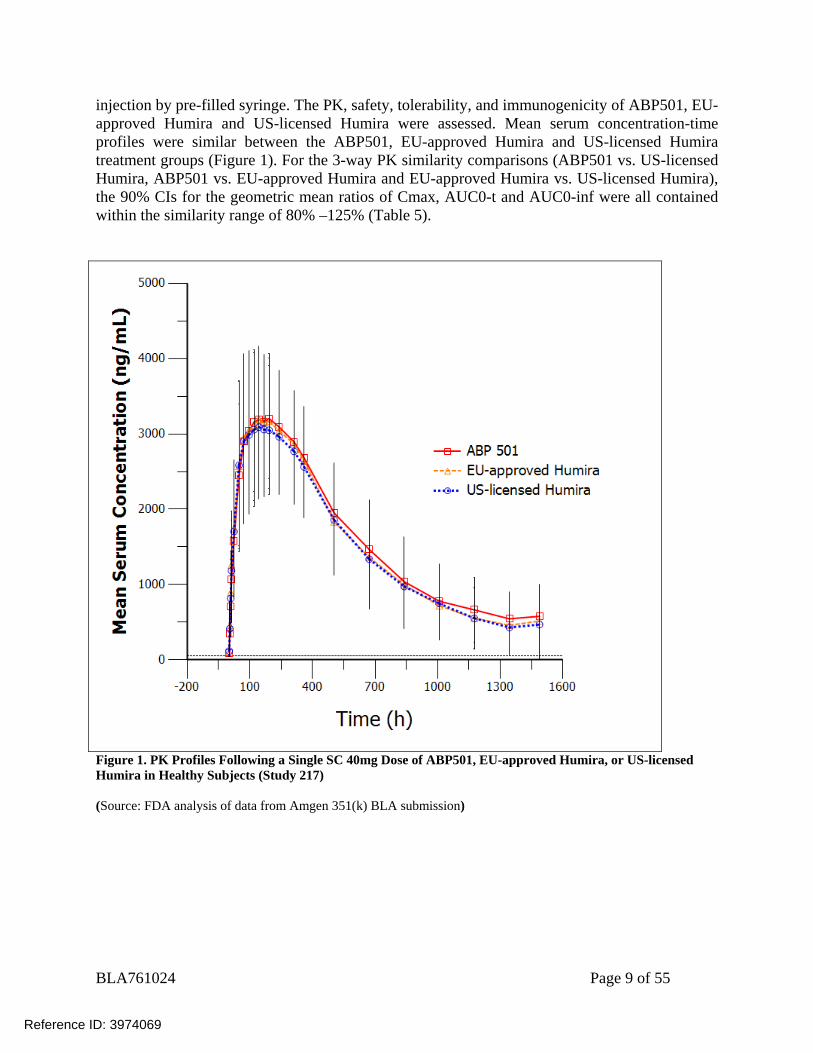
injection by pre-filled syringe. The PK, safety, tolerability, and immunogenicity of ABP501, EU-approved Humira and US-licensed Humira were assessed. Mean serum concentration-time profiles were similar between the ABP501, EU-approved Humira and US-licensed Humira treatment groups (Figure 1). For the 3-way PK similarity comparisons (ABP501 vs. US-licensed Humira, ABP501 vs. EU-approved Humira and EU-approved Humira vs. US-licensed Humira), the 90% CIs for the geometric mean ratios of Cmax, AUC0-t and AUC0-inf were all contained within the similarity range of 80% –125% (Table 5).
Figure 1. PK Profiles Following a Single SC 40mg Dose of ABP501, EU-approved Humira, or US-licensed Humira in Healthy Subjects (Study 217) (Source: FDA analysis of data from Amgen 351(k) BLA submission)
Reference ID: 3974069
BLA761024 Page 10 of 55
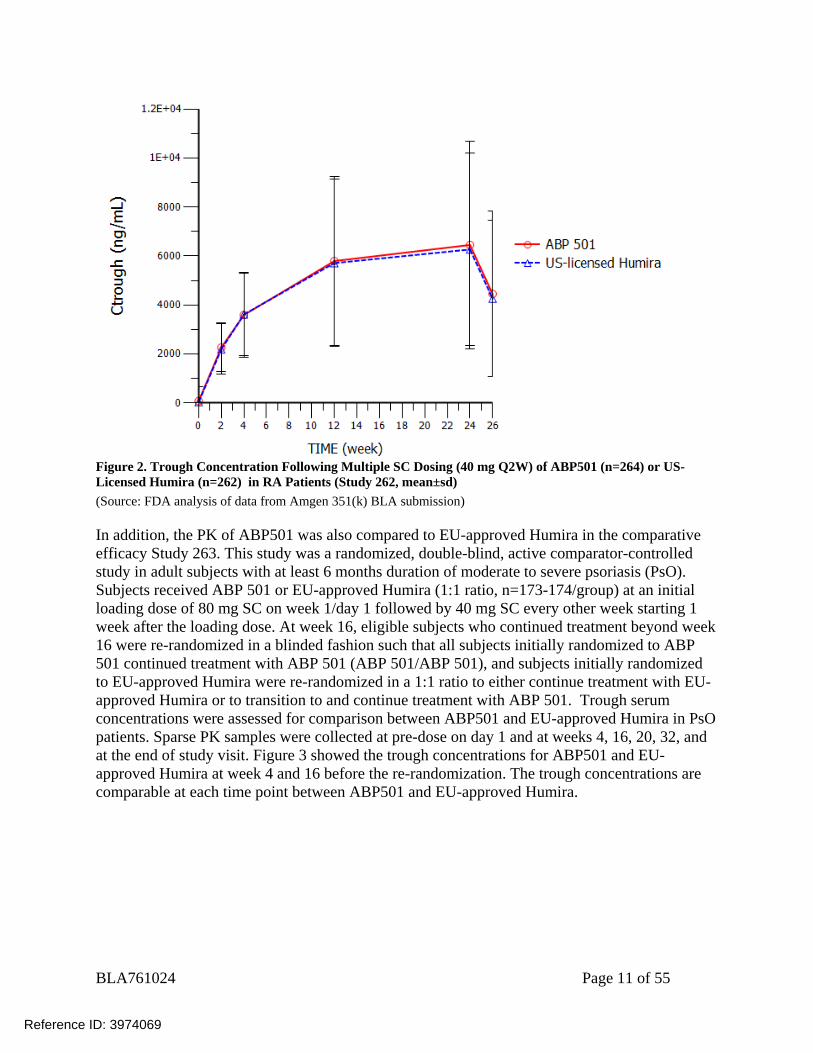
Table 5. Statistical Analysis of PK parameters in Study 217 Comparison Parameter Adjusted GMR% 90% CI (%)
ABP501 vs US-licensed Humira Cmax 103.73 (96.40, 111.62)
AUC0-t 105.75 (95.26, 117.41) AUC0-inf 110.76 (99.47, 123.32)
ABP501 vs EU-approved Humira Cmax 95.74 (88.89, 103.12)
AUC0-t 98.70 (88.75, 109.76) AUC0-inf 101.87 (91.37, 113.56)
EU-approved Humira vs US-licensed Humira
Cmax 108.34 (100.65, 116.62) AUC0-t 107.15 (96.43, 119.06)
AUC0-inf 108.73 (97.68, 121.03) CI: confidence interval; GMR: geometric mean ratio ANCOVA Analysis with weight as a Covariate
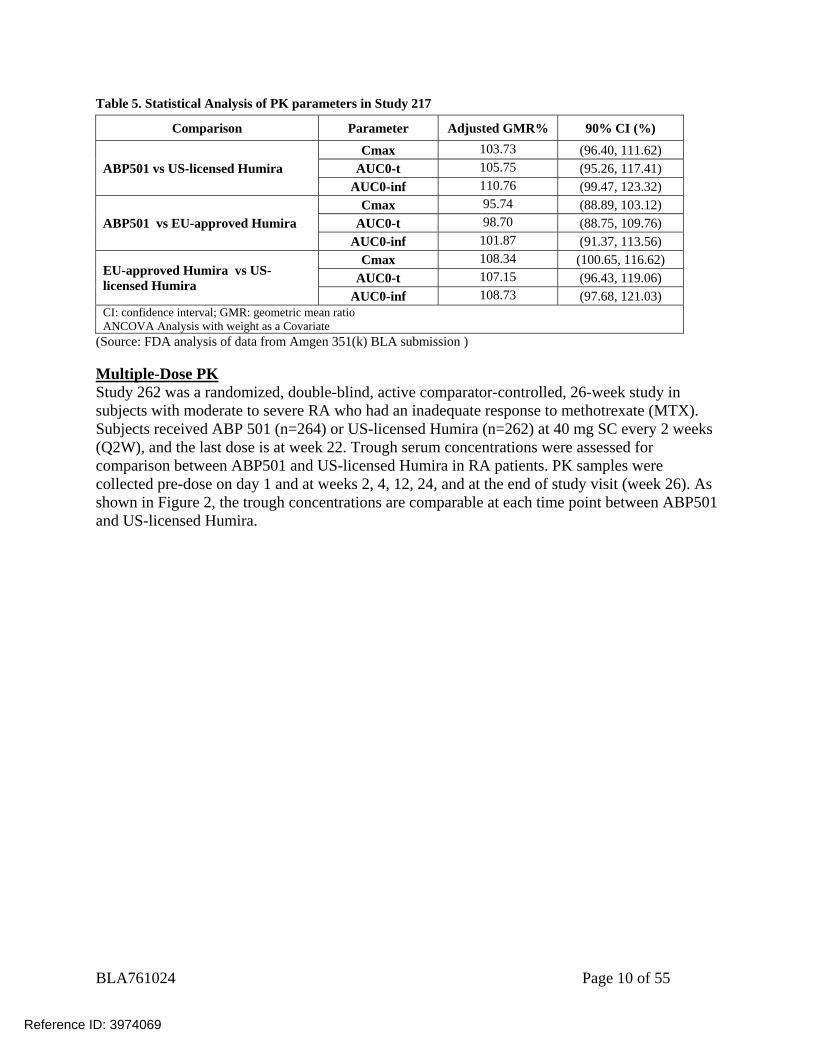
(Source: FDA analysis of data from Amgen 351(k) BLA submission ) Multiple-Dose PK Study 262 was a randomized, double-blind, active comparator-controlled, 26-week study in subjects with moderate to severe RA who had an inadequate response to methotrexate (MTX). Subjects received ABP 501 (n=264) or US-licensed Humira (n=262) at 40 mg SC every 2 weeks (Q2W), and the last dose is at week 22. Trough serum concentrations were assessed for comparison between ABP501 and US-licensed Humira in RA patients. PK samples were collected pre-dose on day 1 and at weeks 2, 4, 12, 24, and at the end of study visit (week 26). As shown in Figure 2, the trough concentrations are comparable at each time point between ABP501 and US-licensed Humira.
Reference ID: 3974069
BLA761024 Page 11 of 55
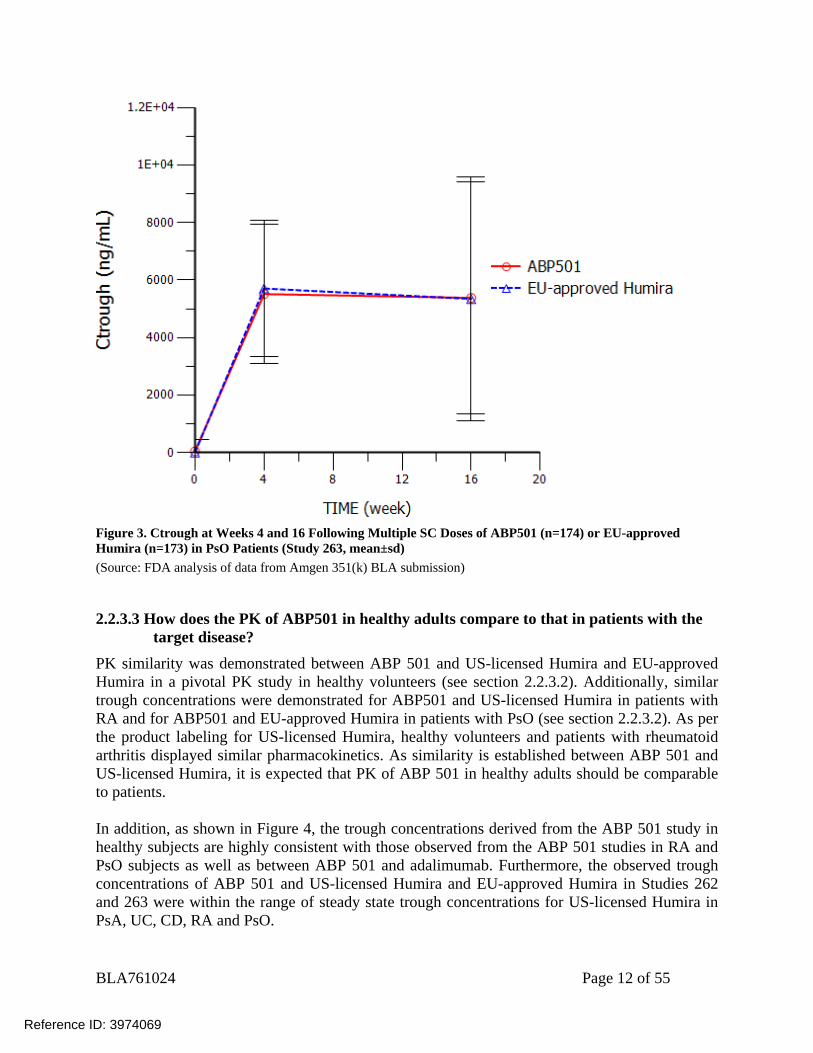
Figure 2. Trough Concentration Following Multiple SC Dosing (40 mg Q2W) of ABP501 (n=264) or US-Licensed Humira (n=262) in RA Patients (Study 262, mean±sd) (Source: FDA analysis of data from Amgen 351(k) BLA submission) In addition, the PK of ABP501 was also compared to EU-approved Humira in the comparative efficacy Study 263. This study was a randomized, double-blind, active comparator-controlled study in adult subjects with at least 6 months duration of moderate to severe psoriasis (PsO). Subjects received ABP 501 or EU-approved Humira (1:1 ratio, n=173-174/group) at an initial loading dose of 80 mg SC on week 1/day 1 followed by 40 mg SC every other week starting 1 week after the loading dose. At week 16, eligible subjects who continued treatment beyond week 16 were re-randomized in a blinded fashion such that all subjects initially randomized to ABP 501 continued treatment with ABP 501 (ABP 501/ABP 501), and subjects initially randomized to EU-approved Humira were re-randomized in a 1:1 ratio to either continue treatment with EU-approved Humira or to transition to and continue treatment with ABP 501. Trough serum concentrations were assessed for comparison between ABP501 and EU-approved Humira in PsO patients. Sparse PK samples were collected at pre-dose on day 1 and at weeks 4, 16, 20, 32, and at the end of study visit. Figure 3 showed the trough concentrations for ABP501 and EU-approved Humira at week 4 and 16 before the re-randomization. The trough concentrations are comparable at each time point between ABP501 and EU-approved Humira.
Reference ID: 3974069
BLA761024 Page 12 of 55
Figure 3. Ctrough at Weeks 4 and 16 Following Multiple SC Doses of ABP501 (n=174) or EU-approved Humira (n=173) in PsO Patients (Study 263, mean±sd) (Source: FDA analysis of data from Amgen 351(k) BLA submission)
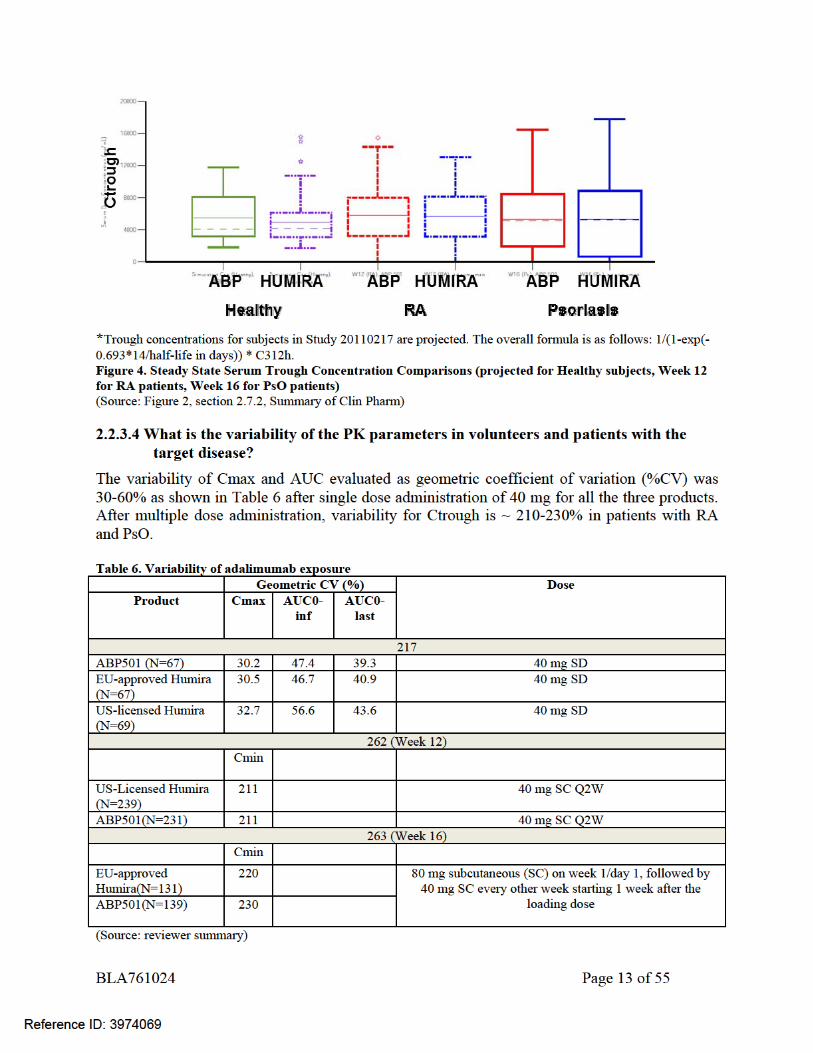
2.2.3.3 How does the PK of ABP501 in healthy adults compare to that in patients with the target disease?
PK similarity was demonstrated between ABP 501 and US-licensed Humira and EU-approved Humira in a pivotal PK study in healthy volunteers (see section 2.2.3.2). Additionally, similar trough concentrations were demonstrated for ABP501 and US-licensed Humira in patients with RA and for ABP501 and EU-approved Humira in patients with PsO (see section 2.2.3.2). As per the product labeling for US-licensed Humira, healthy volunteers and patients with rheumatoid arthritis displayed similar pharmacokinetics. As similarity is established between ABP 501 and US-licensed Humira, it is expected that PK of ABP 501 in healthy adults should be comparable to patients. In addition, as shown in Figure 4, the trough concentrations derived from the ABP 501 study in healthy subjects are highly consistent with those observed from the ABP 501 studies in RA and PsO subjects as well as between ABP 501 and adalimumab. Furthermore, the observed trough concentrations of ABP 501 and US-licensed Humira and EU-approved Humira in Studies 262 and 263 were within the range of steady state trough concentrations for US-licensed Humira in PsA, UC, CD, RA and PsO.
Reference ID: 3974069
BLA761024 Page 14 of 55
2.3 Intrinsic Factors
2.3.1 Immunogenicity
2.3.1.1 How was the immunogenicity assessed and what was the incidence of the formation of the anti-drug antibody (ADA)?
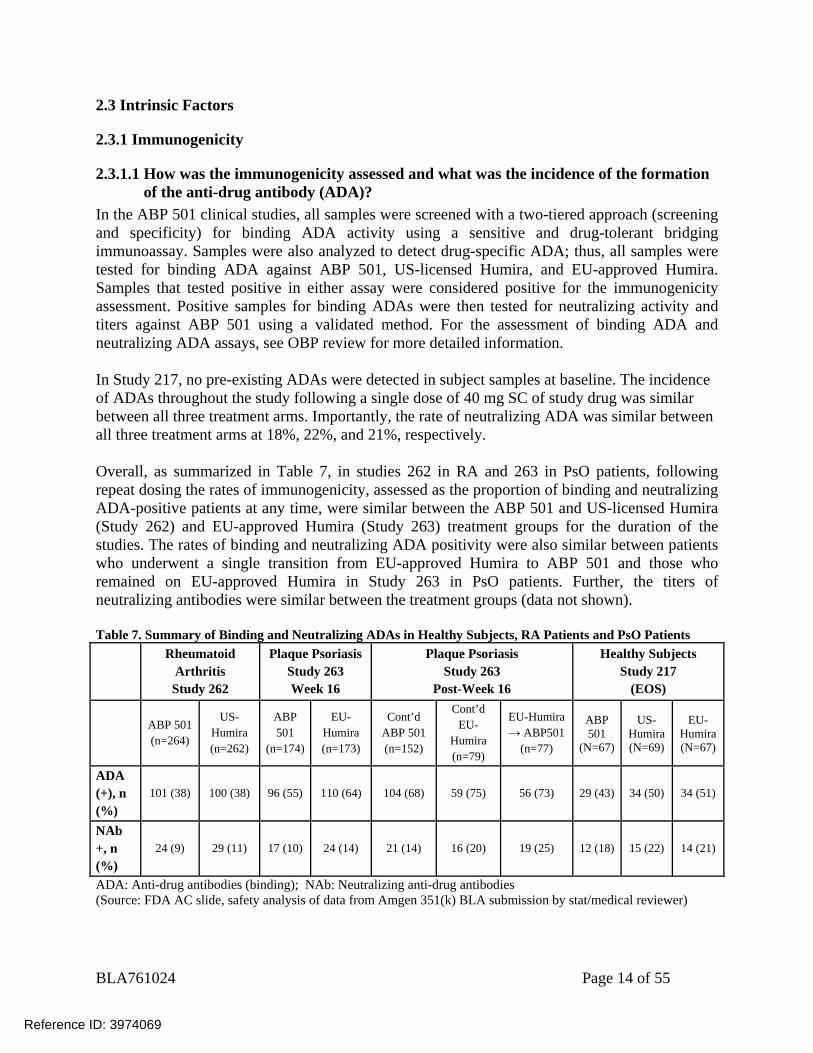
In the ABP 501 clinical studies, all samples were screened with a two-tiered approach (screening and specificity) for binding ADA activity using a sensitive and drug-tolerant bridging immunoassay. Samples were also analyzed to detect drug-specific ADA; thus, all samples were tested for binding ADA against ABP 501, US-licensed Humira, and EU-approved Humira. Samples that tested positive in either assay were considered positive for the immunogenicity assessment. Positive samples for binding ADAs were then tested for neutralizing activity and titers against ABP 501 using a validated method. For the assessment of binding ADA and neutralizing ADA assays, see OBP review for more detailed information. In Study 217, no pre-existing ADAs were detected in subject samples at baseline. The incidence of ADAs throughout the study following a single dose of 40 mg SC of study drug was similar between all three treatment arms. Importantly, the rate of neutralizing ADA was similar between all three treatment arms at 18%, 22%, and 21%, respectively. Overall, as summarized in Table 7, in studies 262 in RA and 263 in PsO patients, following repeat dosing the rates of immunogenicity, assessed as the proportion of binding and neutralizing ADA-positive patients at any time, were similar between the ABP 501 and US-licensed Humira (Study 262) and EU-approved Humira (Study 263) treatment groups for the duration of the studies. The rates of binding and neutralizing ADA positivity were also similar between patients who underwent a single transition from EU-approved Humira to ABP 501 and those who remained on EU-approved Humira in Study 263 in PsO patients. Further, the titers of neutralizing antibodies were similar between the treatment groups (data not shown). Table 7. Summary of Binding and Neutralizing ADAs in Healthy Subjects, RA Patients and PsO Patients
Rheumatoid Arthritis Study 262
Plaque Psoriasis Study 263 Week 16
Plaque Psoriasis Study 263
Post-Week 16
Healthy Subjects Study 217
(EOS)
ABP 501 (n=264)
US-Humira (n=262)
ABP 501
(n=174)
EU-Humira (n=173)
Cont’d ABP 501 (n=152)
Cont’d EU-
Humira (n=79)
EU-Humira → ABP501
(n=77)
ABP 501
(N=67)
US-Humira (N=69)
EU-Humira (N=67)
ADA (+), n (%)
101 (38) 100 (38) 96 (55) 110 (64) 104 (68) 59 (75) 56 (73) 29 (43) 34 (50) 34 (51)
NAb +, n (%)
24 (9) 29 (11) 17 (10) 24 (14) 21 (14) 16 (20) 19 (25) 12 (18) 15 (22) 14 (21)
ADA: Anti-drug antibodies (binding); NAb: Neutralizing anti-drug antibodies (Source: FDA AC slide, safety analysis of data from Amgen 351(k) BLA submission by stat/medical reviewer)
Reference ID: 3974069
BLA761024 Page 15 of 55
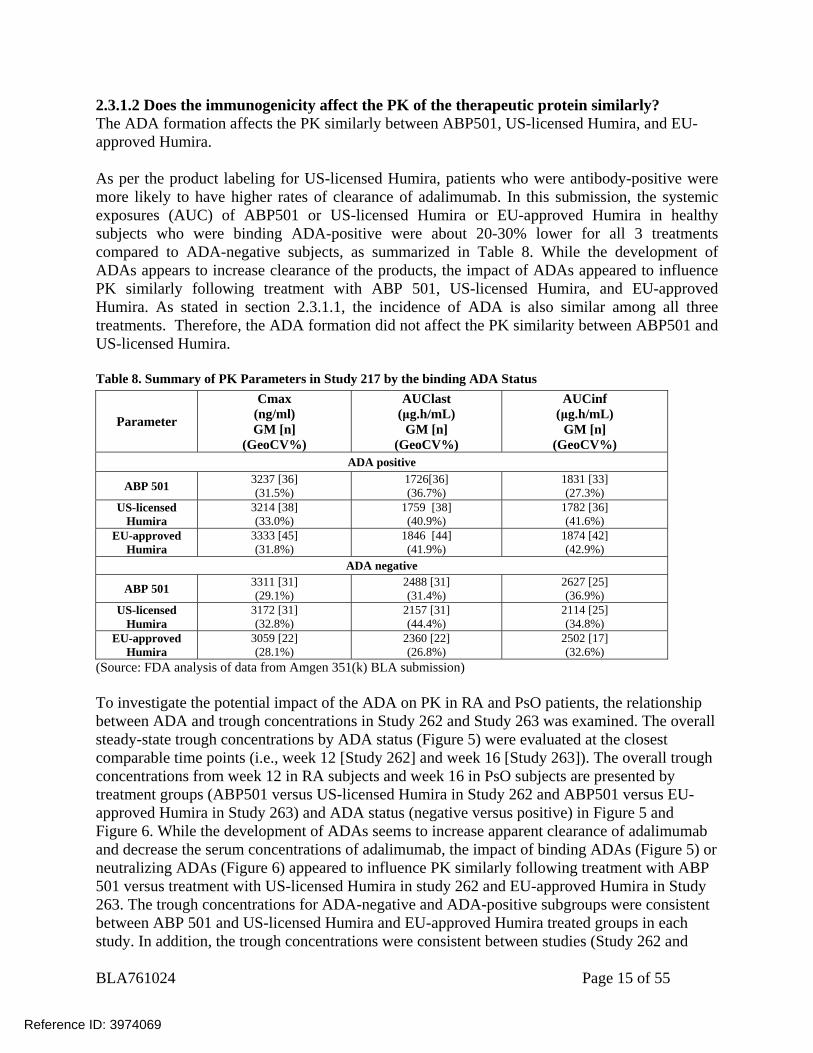
2.3.1.2 Does the immunogenicity affect the PK of the therapeutic protein similarly? The ADA formation affects the PK similarly between ABP501, US-licensed Humira, and EU-approved Humira. As per the product labeling for US-licensed Humira, patients who were antibody-positive were more likely to have higher rates of clearance of adalimumab. In this submission, the systemic exposures (AUC) of ABP501 or US-licensed Humira or EU-approved Humira in healthy subjects who were binding ADA-positive were about 20-30% lower for all 3 treatments compared to ADA-negative subjects, as summarized in Table 8. While the development of ADAs appears to increase clearance of the products, the impact of ADAs appeared to influence PK similarly following treatment with ABP 501, US-licensed Humira, and EU-approved Humira. As stated in section 2.3.1.1, the incidence of ADA is also similar among all three treatments. Therefore, the ADA formation did not affect the PK similarity between ABP501 and US-licensed Humira. Table 8. Summary of PK Parameters in Study 217 by the binding ADA Status
Parameter
Cmax (ng/ml) GM [n]
(GeoCV%)
AUClast (μg.h/mL)
GM [n] (GeoCV%)
AUCinf (μg.h/mL)
GM [n] (GeoCV%)
ADA positive
ABP 501 3237 [36] (31.5%)
1726[36] (36.7%)
1831 [33] (27.3%)
US-licensed Humira
3214 [38] (33.0%)
1759 [38] (40.9%)
1782 [36] (41.6%)
EU-approved Humira
3333 [45] (31.8%)
1846 [44] (41.9%)
1874 [42] (42.9%)
ADA negative
ABP 501 3311 [31] (29.1%)
2488 [31] (31.4%)
2627 [25] (36.9%)
US-licensed Humira
3172 [31] (32.8%)
2157 [31] (44.4%)
2114 [25] (34.8%)
EU-approved Humira
3059 [22] (28.1%)
2360 [22] (26.8%)
2502 [17] (32.6%)
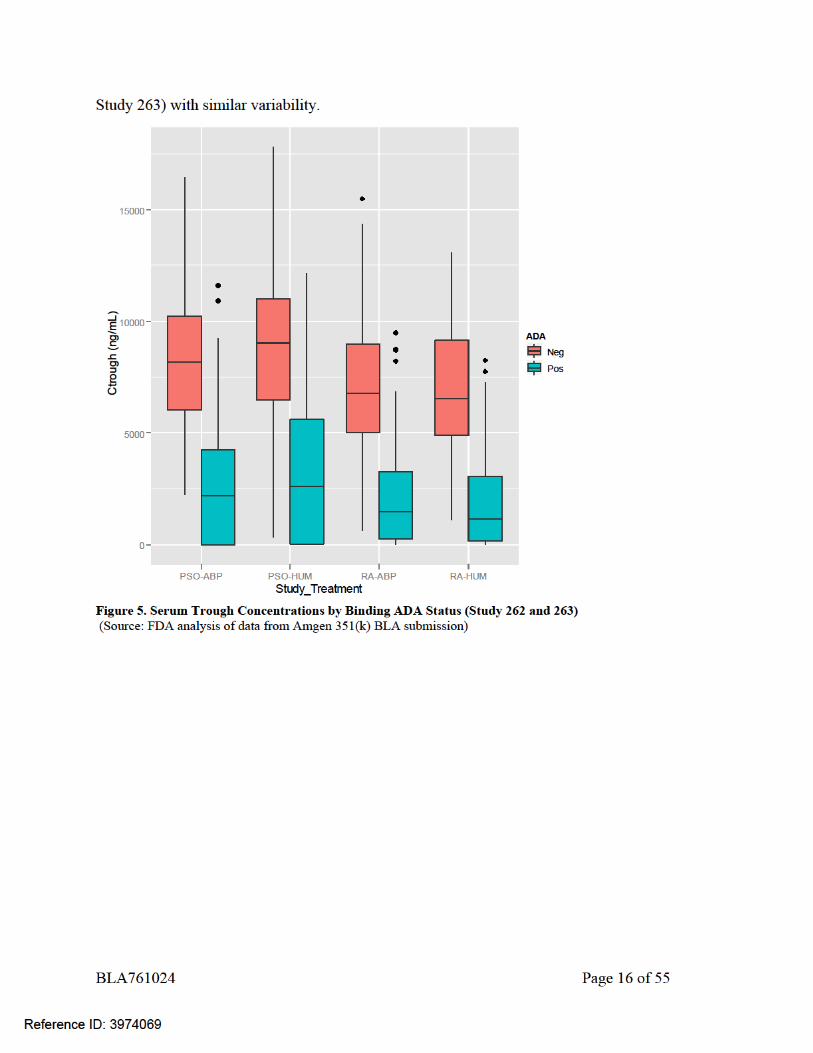
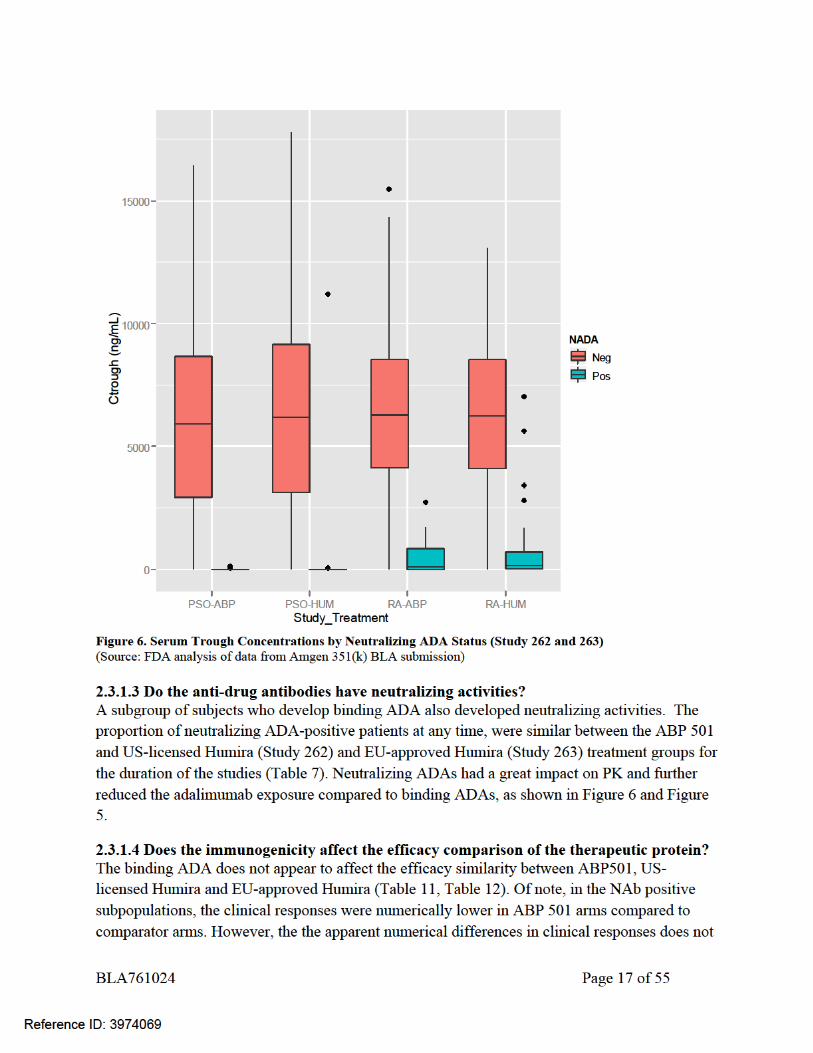
(Source: FDA analysis of data from Amgen 351(k) BLA submission) To investigate the potential impact of the ADA on PK in RA and PsO patients, the relationship between ADA and trough concentrations in Study 262 and Study 263 was examined. The overall steady-state trough concentrations by ADA status (Figure 5) were evaluated at the closest comparable time points (i.e., week 12 [Study 262] and week 16 [Study 263]). The overall trough concentrations from week 12 in RA subjects and week 16 in PsO subjects are presented by treatment groups (ABP501 versus US-licensed Humira in Study 262 and ABP501 versus EU-approved Humira in Study 263) and ADA status (negative versus positive) in Figure 5 and Figure 6. While the development of ADAs seems to increase apparent clearance of adalimumab and decrease the serum concentrations of adalimumab, the impact of binding ADAs (Figure 5) or neutralizing ADAs (Figure 6) appeared to influence PK similarly following treatment with ABP 501 versus treatment with US-licensed Humira in study 262 and EU-approved Humira in Study 263. The trough concentrations for ADA-negative and ADA-positive subgroups were consistent between ABP 501 and US-licensed Humira and EU-approved Humira treated groups in each study. In addition, the trough concentrations were consistent between studies (Study 262 and
Reference ID: 3974069
BLA761024 Page 18 of 55
preclude a finding of no clinically meaningful differences between ABP 501 and US-licensed Humira.
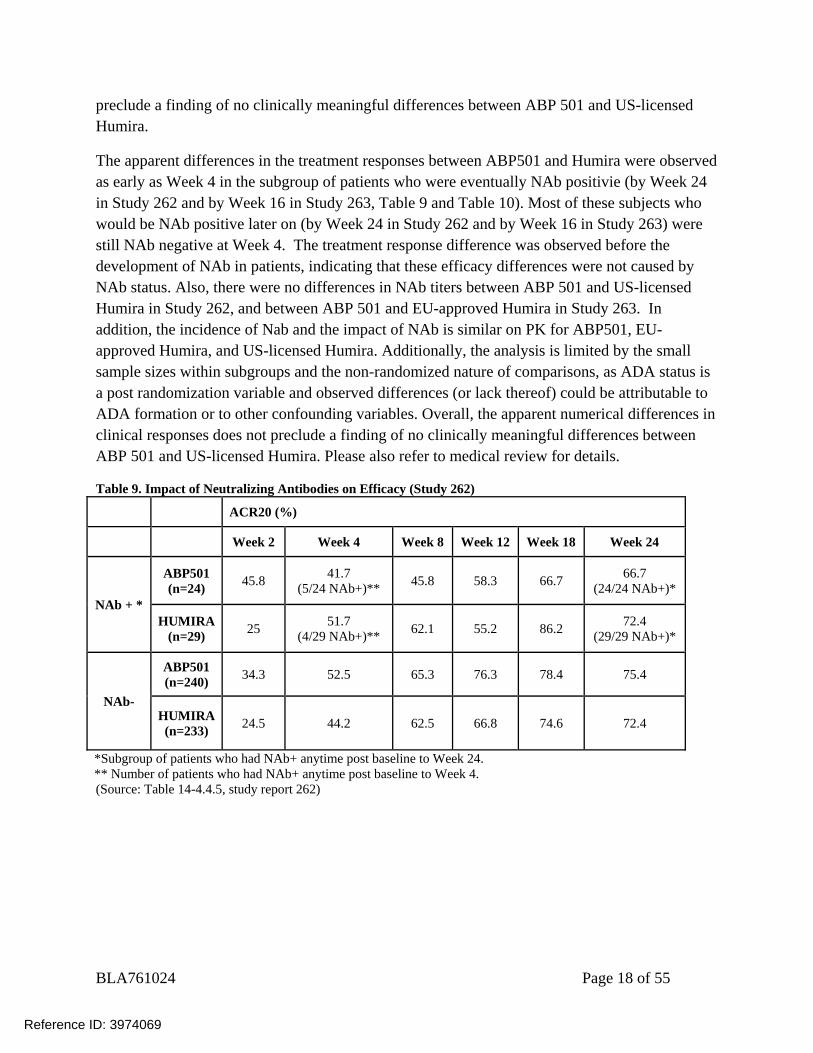
The apparent differences in the treatment responses between ABP501 and Humira were observed as early as Week 4 in the subgroup of patients who were eventually NAb positivie (by Week 24 in Study 262 and by Week 16 in Study 263, Table 9 and Table 10). Most of these subjects who would be NAb positive later on (by Week 24 in Study 262 and by Week 16 in Study 263) were still NAb negative at Week 4. The treatment response difference was observed before the development of NAb in patients, indicating that these efficacy differences were not caused by NAb status. Also, there were no differences in NAb titers between ABP 501 and US-licensed Humira in Study 262, and between ABP 501 and EU-approved Humira in Study 263. In addition, the incidence of Nab and the impact of NAb is similar on PK for ABP501, EU-approved Humira, and US-licensed Humira. Additionally, the analysis is limited by the small sample sizes within subgroups and the non-randomized nature of comparisons, as ADA status is a post randomization variable and observed differences (or lack thereof) could be attributable to ADA formation or to other confounding variables. Overall, the apparent numerical differences in clinical responses does not preclude a finding of no clinically meaningful differences between ABP 501 and US-licensed Humira. Please also refer to medical review for details.
Table 9. Impact of Neutralizing Antibodies on Efficacy (Study 262)
ACR20 (%)
Week 2 Week 4 Week 8 Week 12 Week 18 Week 24
NAb + *
ABP501 (n=24) 45.8 41.7
(5/24 NAb+)** 45.8 58.3 66.7 66.7 (24/24 NAb+)*
HUMIRA (n=29) 25 51.7
(4/29 NAb+)** 62.1 55.2 86.2 72.4 (29/29 NAb+)*
NAb-
ABP501 (n=240) 34.3 52.5 65.3 76.3 78.4 75.4
HUMIRA (n=233) 24.5 44.2 62.5 66.8 74.6 72.4
*Subgroup of patients who had NAb+ anytime post baseline to Week 24. ** Number of patients who had NAb+ anytime post baseline to Week 4. (Source: Table 14-4.4.5, study report 262)
Reference ID: 3974069
BLA761024 Page 19 of 55
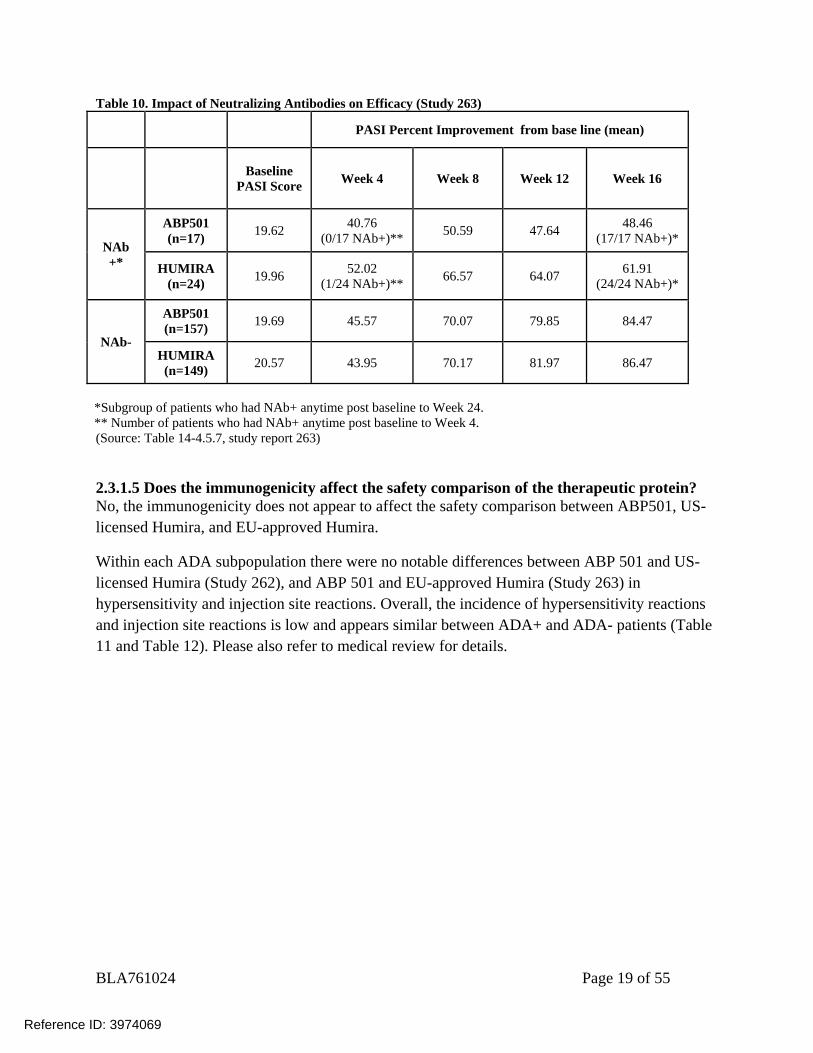
Table 10. Impact of Neutralizing Antibodies on Efficacy (Study 263)
PASI Percent Improvement from base line (mean)
Baseline
PASI Score Week 4 Week 8 Week 12 Week 16
NAb +*
ABP501 (n=17) 19.62 40.76
(0/17 NAb+)** 50.59 47.64 48.46 (17/17 NAb+)*
HUMIRA (n=24) 19.96 52.02
(1/24 NAb+)** 66.57 64.07 61.91 (24/24 NAb+)*
NAb-
ABP501 (n=157) 19.69 45.57 70.07 79.85 84.47
HUMIRA (n=149) 20.57 43.95 70.17 81.97 86.47
*Subgroup of patients who had NAb+ anytime post baseline to Week 24. ** Number of patients who had NAb+ anytime post baseline to Week 4. (Source: Table 14-4.5.7, study report 263)
2.3.1.5 Does the immunogenicity affect the safety comparison of the therapeutic protein? No, the immunogenicity does not appear to affect the safety comparison between ABP501, US-licensed Humira, and EU-approved Humira.
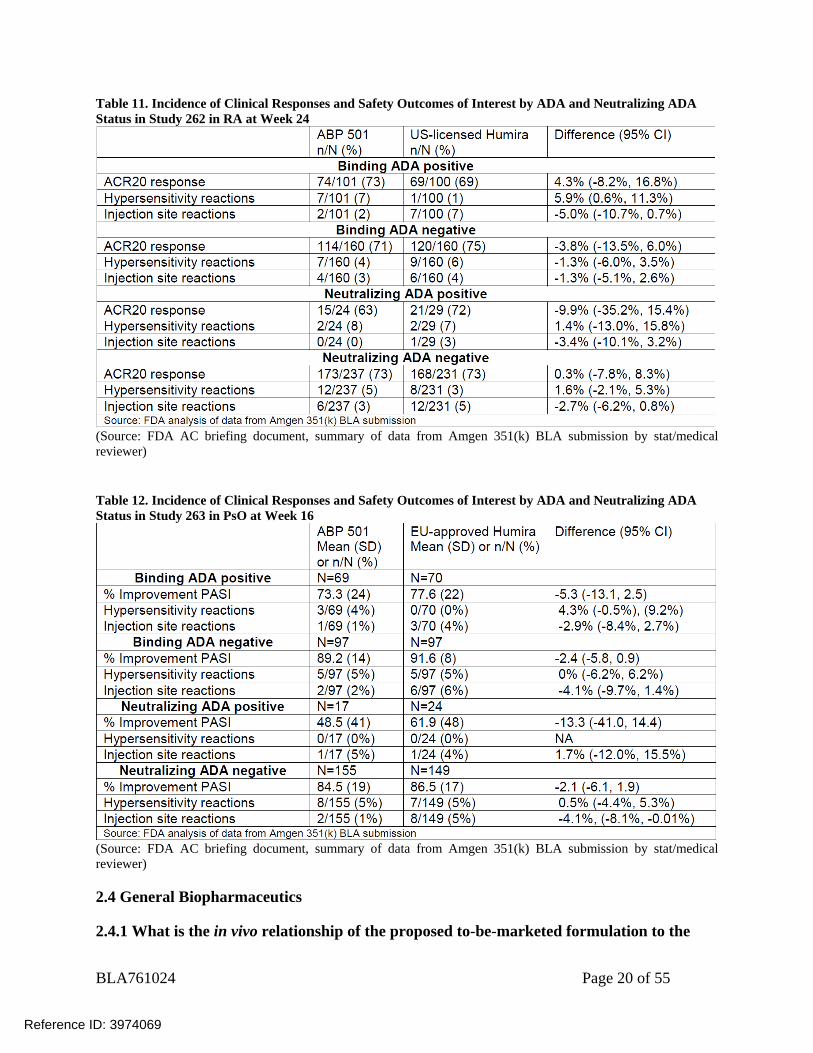
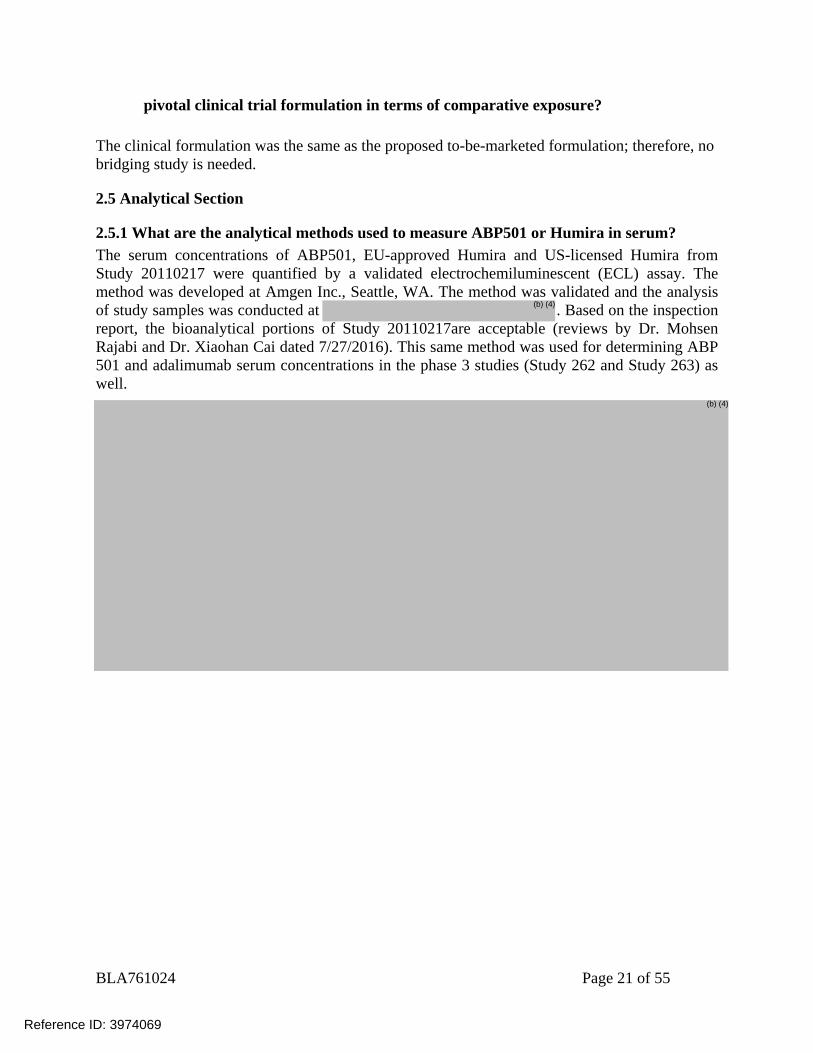
Within each ADA subpopulation there were no notable differences between ABP 501 and US-licensed Humira (Study 262), and ABP 501 and EU-approved Humira (Study 263) in hypersensitivity and injection site reactions. Overall, the incidence of hypersensitivity reactions and injection site reactions is low and appears similar between ADA+ and ADA- patients (Table 11 and Table 12). Please also refer to medical review for details.
Reference ID: 3974069
BLA761024 Page 20 of 55
Table 11. Incidence of Clinical Responses and Safety Outcomes of Interest by ADA and Neutralizing ADA Status in Study 262 in RA at Week 24
(Source: FDA AC briefing document, summary of data from Amgen 351(k) BLA submission by stat/medical reviewer) Table 12. Incidence of Clinical Responses and Safety Outcomes of Interest by ADA and Neutralizing ADA Status in Study 263 in PsO at Week 16
(Source: FDA AC briefing document, summary of data from Amgen 351(k) BLA submission by stat/medical reviewer)
2.4 General Biopharmaceutics
2.4.1 What is the in vivo relationship of the proposed to-be-marketed formulation to the
Reference ID: 3974069
BLA761024 Page 21 of 55
pivotal clinical trial formulation in terms of comparative exposure?
The clinical formulation was the same as the proposed to-be-marketed formulation; therefore, no bridging study is needed.
2.5 Analytical Section
2.5.1 What are the analytical methods used to measure ABP501 or Humira in serum? The serum concentrations of ABP501, EU-approved Humira and US-licensed Humira from Study 20110217 were quantified by a validated electrochemiluminescent (ECL) assay. The method was developed at Amgen Inc., Seattle, WA. The method was validated and the analysis of study samples was conducted at . Based on the inspection report, the bioanalytical portions of Study 20110217are acceptable (reviews by Dr. Mohsen Rajabi and Dr. Xiaohan Cai dated 7/27/2016). This same method was used for determining ABP 501 and adalimumab serum concentrations in the phase 3 studies (Study 262 and Study 263) as well.
Reference ID: 3974069
(b) (4)
(b) (4)
BLA761024 Page 23 of 55
Table 14: Accuracy and Precision of ABP501 standards
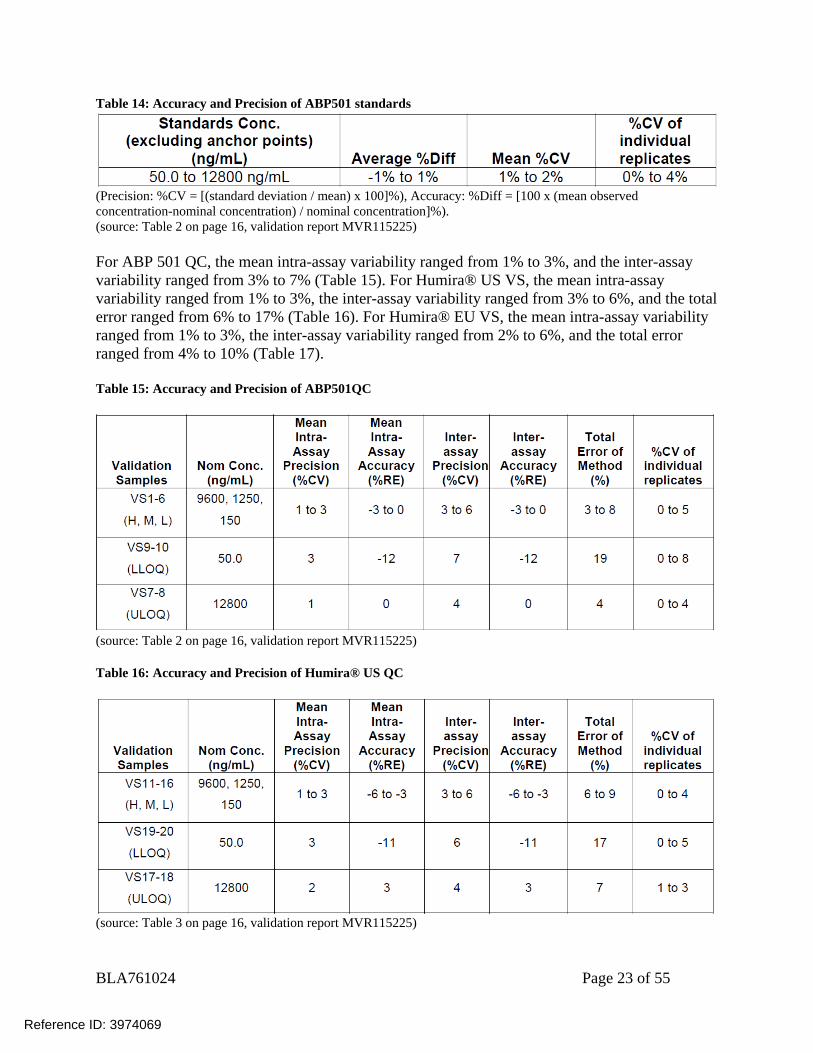
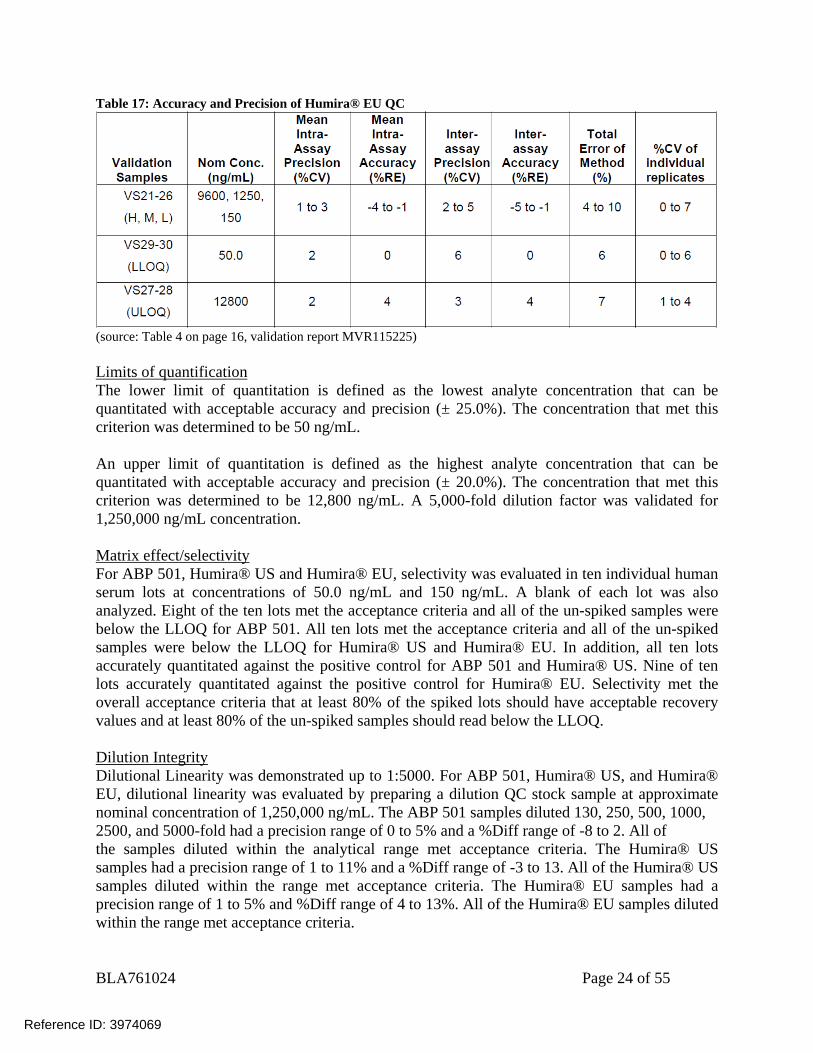
(Precision: %CV = [(standard deviation / mean) x 100]%), Accuracy: %Diff = [100 x (mean observed concentration-nominal concentration) / nominal concentration]%). (source: Table 2 on page 16, validation report MVR115225) For ABP 501 QC, the mean intra-assay variability ranged from 1% to 3%, and the inter-assay variability ranged from 3% to 7% (Table 15). For Humira® US VS, the mean intra-assay variability ranged from 1% to 3%, the inter-assay variability ranged from 3% to 6%, and the total error ranged from 6% to 17% (Table 16). For Humira® EU VS, the mean intra-assay variability ranged from 1% to 3%, the inter-assay variability ranged from 2% to 6%, and the total error ranged from 4% to 10% (Table 17). Table 15: Accuracy and Precision of ABP501QC
(source: Table 2 on page 16, validation report MVR115225) Table 16: Accuracy and Precision of Humira® US QC
(source: Table 3 on page 16, validation report MVR115225)
Reference ID: 3974069
BLA761024 Page 24 of 55
Table 17: Accuracy and Precision of Humira® EU QC
(source: Table 4 on page 16, validation report MVR115225) Limits of quantification The lower limit of quantitation is defined as the lowest analyte concentration that can be quantitated with acceptable accuracy and precision (± 25.0%). The concentration that met this criterion was determined to be 50 ng/mL. An upper limit of quantitation is defined as the highest analyte concentration that can be quantitated with acceptable accuracy and precision (± 20.0%). The concentration that met this criterion was determined to be 12,800 ng/mL. A 5,000-fold dilution factor was validated for 1,250,000 ng/mL concentration. Matrix effect/selectivity For ABP 501, Humira® US and Humira® EU, selectivity was evaluated in ten individual human serum lots at concentrations of 50.0 ng/mL and 150 ng/mL. A blank of each lot was also analyzed. Eight of the ten lots met the acceptance criteria and all of the un-spiked samples were below the LLOQ for ABP 501. All ten lots met the acceptance criteria and all of the un-spiked samples were below the LLOQ for Humira® US and Humira® EU. In addition, all ten lots accurately quantitated against the positive control for ABP 501 and Humira® US. Nine of ten lots accurately quantitated against the positive control for Humira® EU. Selectivity met the overall acceptance criteria that at least 80% of the spiked lots should have acceptable recovery values and at least 80% of the un-spiked samples should read below the LLOQ. Dilution Integrity Dilutional Linearity was demonstrated up to 1:5000. For ABP 501, Humira® US, and Humira® EU, dilutional linearity was evaluated by preparing a dilution QC stock sample at approximate nominal concentration of 1,250,000 ng/mL. The ABP 501 samples diluted 130, 250, 500, 1000, 2500, and 5000-fold had a precision range of 0 to 5% and a %Diff range of -8 to 2. All of the samples diluted within the analytical range met acceptance criteria. The Humira® US samples had a precision range of 1 to 11% and a %Diff range of -3 to 13. All of the Humira® US samples diluted within the range met acceptance criteria. The Humira® EU samples had a precision range of 1 to 5% and %Diff range of 4 to 13%. All of the Humira® EU samples diluted within the range met acceptance criteria.
Reference ID: 3974069
BLA761024 Page 25 of 55
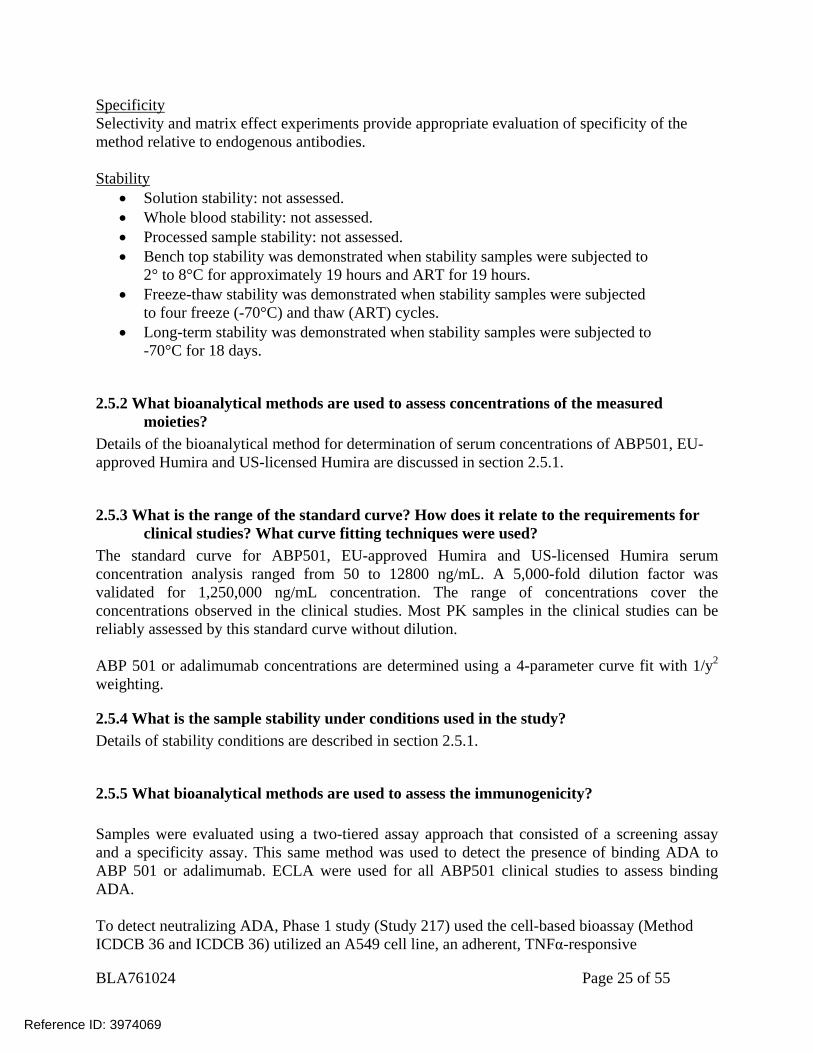
Specificity Selectivity and matrix effect experiments provide appropriate evaluation of specificity of the method relative to endogenous antibodies. Stability
Solution stability: not assessed. Whole blood stability: not assessed. Processed sample stability: not assessed. Bench top stability was demonstrated when stability samples were subjected to
2° to 8°C for approximately 19 hours and ART for 19 hours. Freeze-thaw stability was demonstrated when stability samples were subjected
to four freeze (-70°C) and thaw (ART) cycles. Long-term stability was demonstrated when stability samples were subjected to
-70°C for 18 days.
2.5.2 What bioanalytical methods are used to assess concentrations of the measured moieties?
Details of the bioanalytical method for determination of serum concentrations of ABP501, EU-approved Humira and US-licensed Humira are discussed in section 2.5.1.
2.5.3 What is the range of the standard curve? How does it relate to the requirements for clinical studies? What curve fitting techniques were used?
The standard curve for ABP501, EU-approved Humira and US-licensed Humira serum concentration analysis ranged from 50 to 12800 ng/mL. A 5,000-fold dilution factor was validated for 1,250,000 ng/mL concentration. The range of concentrations cover the concentrations observed in the clinical studies. Most PK samples in the clinical studies can be reliably assessed by this standard curve without dilution. ABP 501 or adalimumab concentrations are determined using a 4-parameter curve fit with 1/y2 weighting.
2.5.4 What is the sample stability under conditions used in the study? Details of stability conditions are described in section 2.5.1.
2.5.5 What bioanalytical methods are used to assess the immunogenicity? Samples were evaluated using a two-tiered assay approach that consisted of a screening assay and a specificity assay. This same method was used to detect the presence of binding ADA to ABP 501 or adalimumab. ECLA were used for all ABP501 clinical studies to assess binding ADA. To detect neutralizing ADA, Phase 1 study (Study 217) used the cell-based bioassay (Method ICDCB 36 and ICDCB 36) utilized an A549 cell line, an adherent, TNFα-responsive
Reference ID: 3974069
BLA761024 Page 27 of 55
following a single 40 mg subcutaneous administration of adalimumab to healthy adult subjects. The average absolute bioavailability of adalimumab estimated from three studies following a single 40 mg subcutaneous dose was 64%. The pharmacokinetics of adalimumab were linear over the dose range of 0.5 to 10.0 mg/kg following a single intravenous dose. The single dose pharmacokinetics of adalimumab in RA patients were determined in several studies with intravenous doses ranging from 0.25 to 10 mg/kg. The distribution volume (Vss) ranged from 4.7 to 6.0 L. The systemic clearance of adalimumab is approximately 12 mL/hr. The mean terminal half-life was approximately 2 weeks, ranging from 10 to 20 days across studies. Adalimumab concentrations in the synovial fluid from five rheumatoid arthritis patients ranged from 31 to 96% of those in serum. In RA patients receiving 40 mg adalimumab every other week, adalimumab mean steady-state trough concentrations of approximately 5 µg/mL and 8 to 9 µg/mL, were observed without and with methotrexate (MTX), respectively. MTX reduced adalimumab apparent clearance after single and multiple dosing by 29% and 44% respectively, in patients with RA. Mean serum adalimumab trough levels at steady state increased approximately proportionally with dose following 20, 40, and 80 mg every other week and every week subcutaneous dosing. In long- term studies with dosing more than two years, there was no evidence of changes in clearance over time. Adalimumab mean steady-state trough concentrations were slightly higher in psoriatic arthritis patients treated with 40 mg adalimumab every other week (6 to 10 µg/mL and 8.5 to 12 µg/mL, without and with MTX, respectively) compared to the concentrations in RA patients treated with the same dose. The pharmacokinetics of adalimumab in patients with AS were similar to those in patients with RA. In patients with CD, the loading dose of 160 mg adalimumab on Week 0 followed by 80 mg adalimumab on Week 2 achieves mean serum adalimumab trough levels of approximately 12µg/mL at Week 2 and Week 4. Mean steady-state trough levels of approximately 7 µg/mL were observed at Week 24 and Week 56 in CD patients after receiving a maintenance dose of 40 mg adalimumab every other week. In patients with UC, the loading dose of 160 mg adalimumab on Week 0 followed by 80 mg adalimumab on Week 2 achieves mean serum adalimumab trough levels of approximately 12µg/mL at Week 2 and Week 4. Mean steady-state trough level of approximately 8 µg/mL was observed at Week 52 in UC patients after receiving a dose of 40 mg adalimumab every other week, and approximately 15 µg/mL at Week 52 in UC patients who increased to a dose of 40 mg adalimumab every week. In patients with Ps, the mean steady-state trough concentration was approximately 5 to 6 µg/mL during adalimumab 40 mg every other week monotherapy treatment.
Reference ID: 3974069
(b) (4)
BLA761024 Page 28 of 55
Population pharmacokinetic analyses in patients with RA revealed that there was a trend toward higher apparent clearance of adalimumab in the presence of anti-adalimumab antibodies, and lower clearance with increasing age in patients aged 40 to > 75 years. Minor increases in apparent clearance were also predicted in RA patients receiving doses lower than the recommended dose and in RA patients with high rheumatoid factor or CRP concentrations. These increases are not likely to be clinically important. No gender-related pharmacokinetic differences were observed after correction for a patient’s body weight. Healthy volunteers and patients with rheumatoid arthritis displayed similar adalimumab pharmacokinetics. No pharmacokinetic data are available in patients with hepatic or renal impairment. In Study JIA-I for patients with polyarticular JIA who were 4 to 17 years of age, the mean steady-state trough serum adalimumab concentrations for patients weighing < 30 kg receiving 20 mg adalimumab subcutaneously every other week as monotherapy or with concomitant MTX were 6.8 µg/mL and 10.9 µg/mL, respectively. The mean steady-state trough serum adalimumab concentrations for patients weighing ≥ 30 kg receiving 40 mg adalimumab subcutaneously every other week as monotherapy or with concomitant MTX were 6.6 µg/mL and 8.1 µg/mL, respectively.
Reference ID: 3974069
(b) (4)
BLA761024 Page 29 of 55
4. Appendix
4.1 Appendix – Individual Study Review
INDIVIDUAL STUDY REVIEW
4. Appendix ...................................................................................................................... 29 4.1 Appendix – Individual Study Review ................................................................ 29
Study 20110217 (3-way PK Bridge/Similarity Study in Healthy Subjects) . 29 Study 262 (Clinical Comparative Study in RA) ............................................. 37 Study 263 (Clinical comparative Study in PsO) ............................................. 42
Study 20110217 (3-way PK Bridge/Similarity Study in Healthy Subjects) Report # 20110217 Study Type: PK similarity study in healthy subjects Study Dates: 03/Jul/2012– 26/Oct/2012 Drug Product:
ABP 501 supplied as 40 mg/0.8 mL prefilled syringe.
US-licensed Humira supplied as 40 mg/0.8 mL prefilled syringe. EU-approved Humira supplied as 40 mg/0.8 mL prefilled syringe.
Title: A Randomized, Single-Blind, Single-Dose, 3-Arm, Parallel-Group Study to Determine the Pharmacokinetic Equivalence of ABP 501 and Adalimumab (Humira®) in Healthy Adult Subjects Objectives Primary: To demonstrate bioequivalence (as assessed principally by area under the serum concentration-time curve [AUC] from time 0 extrapolated to infinity [AUCinf] and the maximum observed serum concentration [Cmax]) of ABP 501 following a 40-mg subcutaneous (SC) injection relative to that from a 40-mg SC injection of US-licensed Humira and EU-approved Humira. Secondary: To determine the safety, tolerability, and immunogenicity of ABP 501 in healthy adult subjects compared with US-licensed Humira and EU-approved Humira. Primary endpoints: Cmax, AUC0-t, AUC0-inf Study Population Healthy male and female subjects, aged 18-45 years, with BMI 18-30kg/m2
Reference ID: 3974069
BLA761024 Page 30 of 55
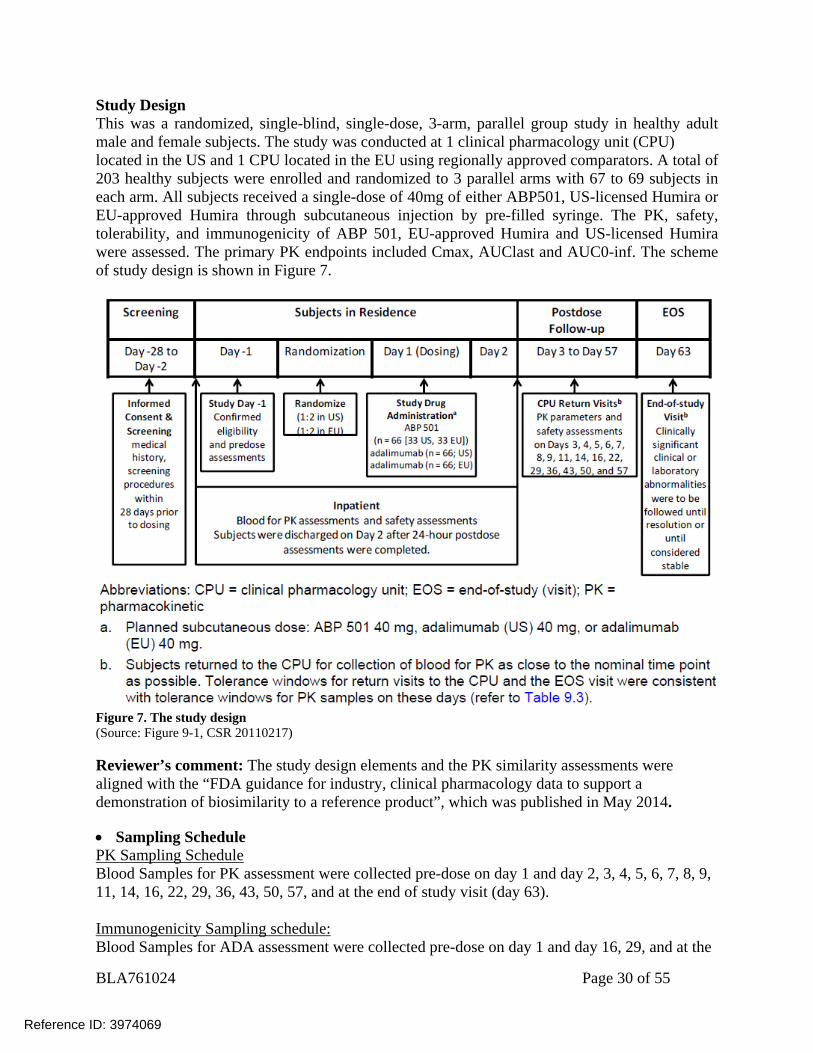
Study Design This was a randomized, single-blind, single-dose, 3-arm, parallel group study in healthy adult male and female subjects. The study was conducted at 1 clinical pharmacology unit (CPU) located in the US and 1 CPU located in the EU using regionally approved comparators. A total of 203 healthy subjects were enrolled and randomized to 3 parallel arms with 67 to 69 subjects in each arm. All subjects received a single-dose of 40mg of either ABP501, US-licensed Humira or EU-approved Humira through subcutaneous injection by pre-filled syringe. The PK, safety, tolerability, and immunogenicity of ABP 501, EU-approved Humira and US-licensed Humira were assessed. The primary PK endpoints included Cmax, AUClast and AUC0-inf. The scheme of study design is shown in Figure 7.
Figure 7. The study design (Source: Figure 9-1, CSR 20110217)
Reviewer’s comment: The study design elements and the PK similarity assessments were aligned with the “FDA guidance for industry, clinical pharmacology data to support a demonstration of biosimilarity to a reference product”, which was published in May 2014. Sampling Schedule PK Sampling Schedule Blood Samples for PK assessment were collected pre-dose on day 1 and day 2, 3, 4, 5, 6, 7, 8, 9, 11, 14, 16, 22, 29, 36, 43, 50, 57, and at the end of study visit (day 63).
Immunogenicity Sampling schedule: Blood Samples for ADA assessment were collected pre-dose on day 1 and day 16, 29, and at the
Reference ID: 3974069
BLA761024 Page 31 of 55
end of study visit (day 63). Results PK Results and BE assessment Independent analysis by FDA reviewer:
Method:
Data sets used are summarized in
Reference ID: 3974069
BLA761024 Page 32 of 55
Table 18 Table 18. The data were assembled in R (Version 2.13.1) for PK analysis. Pharmacokinetic parameters were calculated from the serum concentration-time data using noncompartmental techniques (Phoenix 64/WinNonlin 6.4, Pharsight Corp, St. Louis, MO). Pharmacokinetic parameters were listed by subject and summarized descriptively by treatment for the PK Parameters.
Point estimates and 90% confidence intervals (CIs) for ratios of the geometric means (GMs) for AUClast, AUCinf, and Cmax were estimated using an analysis of covariance (ANCOVA) model for comparisons of ABP 501 and US-licensed Humira, ABP 501 and EU-approved Humira, and US-licensed Humira and EU-approved Humira adjusted for region and weight. The model was in the form: Loge (parameter) = region + treatment + weight The adjusted point estimate and 90% CI were assessed by Phoenix. To establish PK similarity, the 90% CIs for the GM test-to-reference ratios for AUClast, AUCinf, and Cmax were to fall within the protocol-specified similarity criteria of 0.80 and 1.25. The following subgroup/sensitivity statistical analyses were conducted: Antidrug Antibody: A subgroup analysis of subjects who tested negative or positive for
binding ADA. Region:
As “Region” is highly correlated with “Treatment” in the ANCOVA model, with the US site and EU site using regionally approved comparators (US-licensed Humira in US site and EU-approved Humira in EU site), this reviewer considered that region is not an appropriate covariate for the PK similarity assessment. A sensitivity analysis was performed using only Body weight as covariate : Loge (parameter) = treatment + weight
Reference ID: 3974069
BLA761024 Page 33 of 55
Table 18: Analysis Data Sets Study Number Name Link to EDR Study 20110217 adpc.xpt
(Concentration, Region) adpp.xpt (Body weight) adsl.xpt (ADA)
\\cdsesub1\evsprod\bla761024\0001\m5\datasets\20110217\analysis\adam\datasets\adpc.xpt \\cdsesub1\evsprod\bla761024\0001\m5\datasets\20110217\analysis\adam\datasets\adpp.xpt \\cdsesub1\evsprod\bla761024/0001\m5\datasets\20110217\analysis/adam\datasets\adsl.xpt
(Source: reviewer summary) Result:
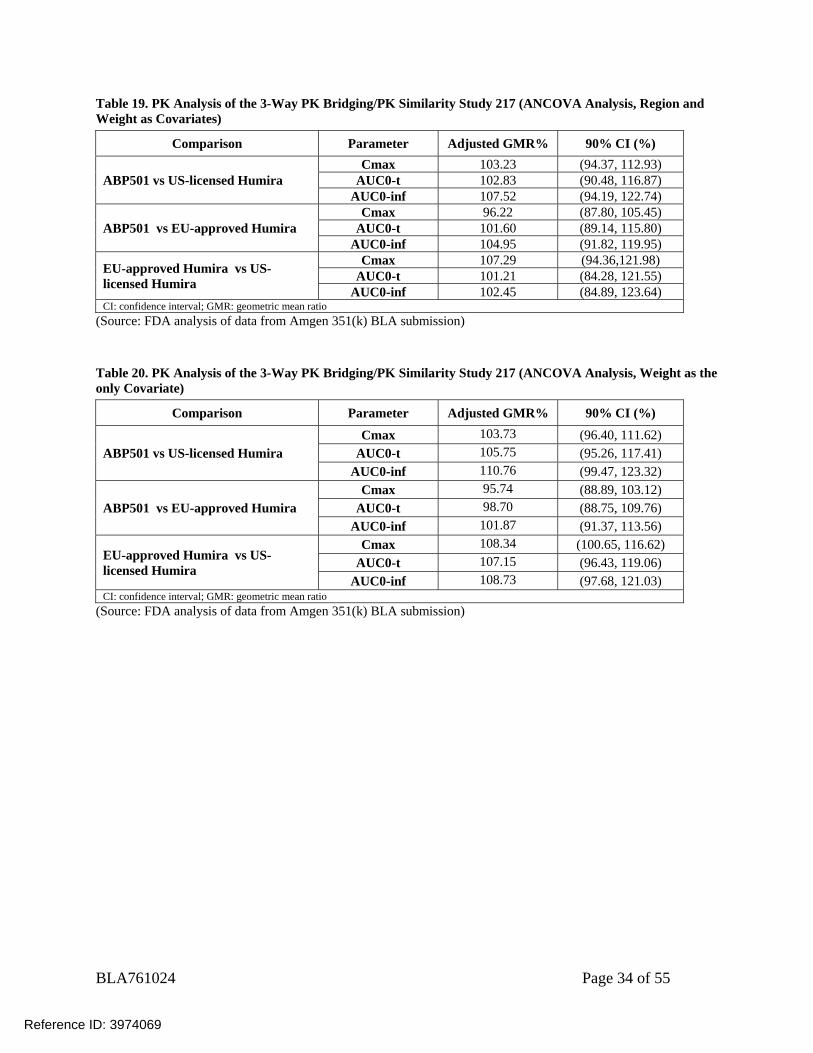
The adalimumab serum concentration vs time profiles are shown in Figure 8. Both peak and overall exposure were similar across the 3 treatments, as was the Tmax. The terminal t½ was estimated to be 9 to 10 days on average. For the majority of subjects in each treatment arm, AUClast accounted for at least 80% of the total AUC, confirming the adequacy of the duration of PK sampling across the 3 treatments.
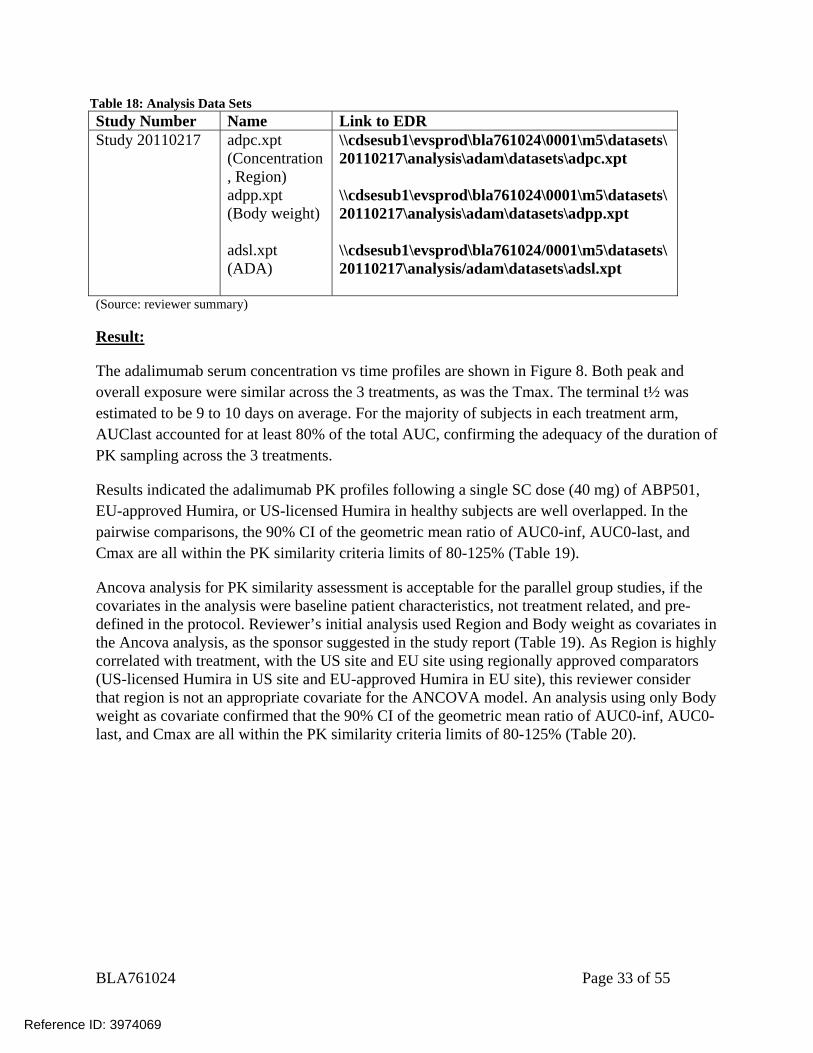
Results indicated the adalimumab PK profiles following a single SC dose (40 mg) of ABP501, EU-approved Humira, or US-licensed Humira in healthy subjects are well overlapped. In the pairwise comparisons, the 90% CI of the geometric mean ratio of AUC0-inf, AUC0-last, and Cmax are all within the PK similarity criteria limits of 80-125% (Table 19).
Ancova analysis for PK similarity assessment is acceptable for the parallel group studies, if the covariates in the analysis were baseline patient characteristics, not treatment related, and pre-defined in the protocol. Reviewer’s initial analysis used Region and Body weight as covariates in the Ancova analysis, as the sponsor suggested in the study report (Table 19). As Region is highly correlated with treatment, with the US site and EU site using regionally approved comparators (US-licensed Humira in US site and EU-approved Humira in EU site), this reviewer consider that region is not an appropriate covariate for the ANCOVA model. An analysis using only Body weight as covariate confirmed that the 90% CI of the geometric mean ratio of AUC0-inf, AUC0-last, and Cmax are all within the PK similarity criteria limits of 80-125% (Table 20).
Reference ID: 3974069
BLA761024 Page 34 of 55
Table 19. PK Analysis of the 3-Way PK Bridging/PK Similarity Study 217 (ANCOVA Analysis, Region and Weight as Covariates)
Comparison Parameter Adjusted GMR% 90% CI (%)
ABP501 vs US-licensed Humira Cmax 103.23 (94.37, 112.93)
AUC0-t 102.83 (90.48, 116.87) AUC0-inf 107.52 (94.19, 122.74)
ABP501 vs EU-approved Humira Cmax 96.22 (87.80, 105.45)
AUC0-t 101.60 (89.14, 115.80) AUC0-inf 104.95 (91.82, 119.95)
EU-approved Humira vs US-licensed Humira
Cmax 107.29 (94.36,121.98) AUC0-t 101.21 (84.28, 121.55)
AUC0-inf 102.45 (84.89, 123.64) CI: confidence interval; GMR: geometric mean ratio
(Source: FDA analysis of data from Amgen 351(k) BLA submission) Table 20. PK Analysis of the 3-Way PK Bridging/PK Similarity Study 217 (ANCOVA Analysis, Weight as the only Covariate)
Comparison Parameter Adjusted GMR% 90% CI (%)
ABP501 vs US-licensed Humira Cmax 103.73 (96.40, 111.62)
AUC0-t 105.75 (95.26, 117.41) AUC0-inf 110.76 (99.47, 123.32)
ABP501 vs EU-approved Humira Cmax 95.74 (88.89, 103.12)
AUC0-t 98.70 (88.75, 109.76) AUC0-inf 101.87 (91.37, 113.56)
EU-approved Humira vs US-licensed Humira
Cmax 108.34 (100.65, 116.62) AUC0-t 107.15 (96.43, 119.06)
AUC0-inf 108.73 (97.68, 121.03) CI: confidence interval; GMR: geometric mean ratio
(Source: FDA analysis of data from Amgen 351(k) BLA submission)
Reference ID: 3974069
BLA761024 Page 35 of 55
Figure 8. PK Profiles Following a Single SC 40mg Dose of ABP501, EU-approved Humira, or US-licensed Humira in Healthy Subjects (Study 217)
(Source: FDA analysis of data from Amgen 351(k) BLA submission)
The agency did not agree with this approach,
Overall, the 90% CI of the geometric mean ratio of AUC0-inf, AUC0-last, and Cmax are all within the PK similarity criteria limits of 80-125%. These data establish the PK similarity between ABP501 and US-licensed Humira. These data also establish the PK component of the scientific bridge to justify the relevance of the comparative data generated using EU-approved Humira to support a demonstration of the biosimilarity of ABP501 to US-licensed Humira. Immunogenicity Results
No pre-existing ADAs were detected in subject samples at baseline. Table 21 shows the incidence of ADAs throughout the study following a single dose of 40 mg SC of study drug. Importantly, the rate of neutralizing ADA was similar between all three treatments arms at 18%, 22%, and 21%, respectively.
LLOQ
Reference ID: 3974069
(b) (4)
(b) (4)
BLA761024 Page 36 of 55
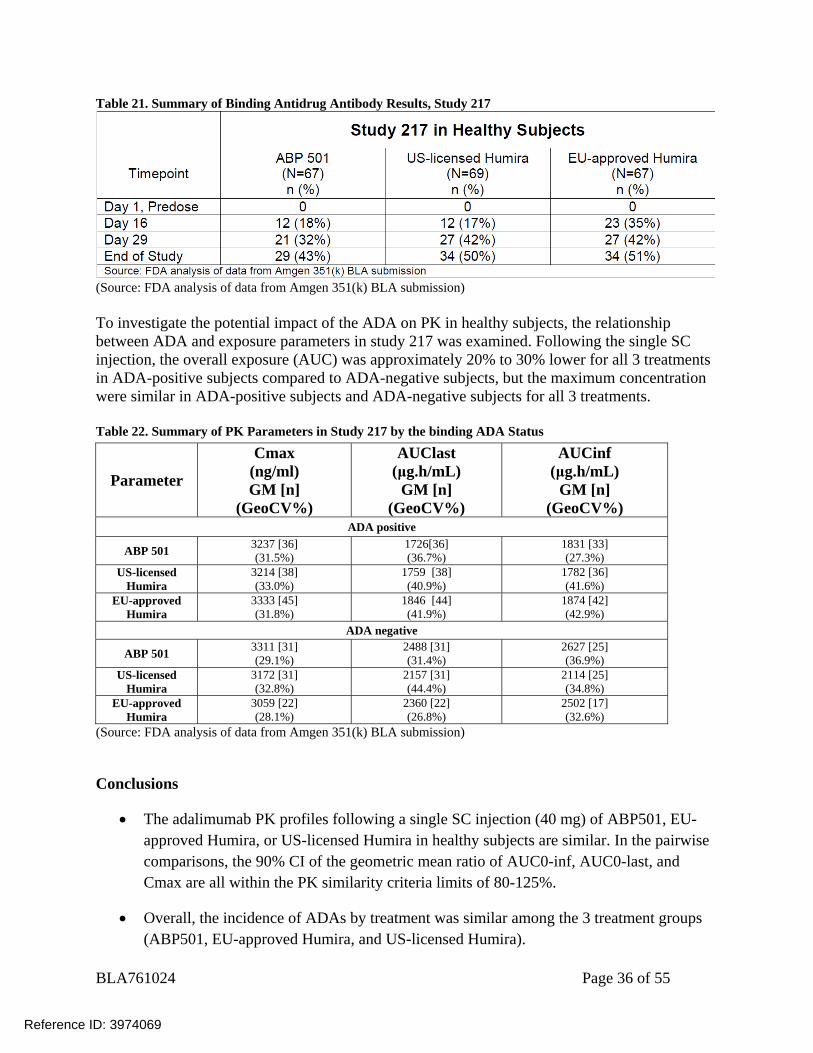
Table 21. Summary of Binding Antidrug Antibody Results, Study 217
(Source: FDA analysis of data from Amgen 351(k) BLA submission) To investigate the potential impact of the ADA on PK in healthy subjects, the relationship between ADA and exposure parameters in study 217 was examined. Following the single SC injection, the overall exposure (AUC) was approximately 20% to 30% lower for all 3 treatments in ADA-positive subjects compared to ADA-negative subjects, but the maximum concentration were similar in ADA-positive subjects and ADA-negative subjects for all 3 treatments. Table 22. Summary of PK Parameters in Study 217 by the binding ADA Status
Parameter
Cmax (ng/ml) GM [n]
(GeoCV%)
AUClast (μg.h/mL)
GM [n] (GeoCV%)
AUCinf (μg.h/mL)
GM [n] (GeoCV%)
ADA positive
ABP 501 3237 [36] (31.5%)
1726[36] (36.7%)
1831 [33] (27.3%)
US-licensed Humira
3214 [38] (33.0%)
1759 [38] (40.9%)
1782 [36] (41.6%)
EU-approved Humira
3333 [45] (31.8%)
1846 [44] (41.9%)
1874 [42] (42.9%)
ADA negative
ABP 501 3311 [31] (29.1%)
2488 [31] (31.4%)
2627 [25] (36.9%)
US-licensed Humira
3172 [31] (32.8%)
2157 [31] (44.4%)
2114 [25] (34.8%)
EU-approved Humira
3059 [22] (28.1%)
2360 [22] (26.8%)
2502 [17] (32.6%)
(Source: FDA analysis of data from Amgen 351(k) BLA submission)
Conclusions
The adalimumab PK profiles following a single SC injection (40 mg) of ABP501, EU-approved Humira, or US-licensed Humira in healthy subjects are similar. In the pairwise comparisons, the 90% CI of the geometric mean ratio of AUC0-inf, AUC0-last, and Cmax are all within the PK similarity criteria limits of 80-125%.
Overall, the incidence of ADAs by treatment was similar among the 3 treatment groups (ABP501, EU-approved Humira, and US-licensed Humira).
Reference ID: 3974069
BLA761024 Page 37 of 55
Study 262 (Clinical Comparative Study in RA) Report # 20120262 Study Type: Clinical comparative study in RA Study Dates: 24/Oct/2013– 19/Nov/2014 Drug Product: ABP 501 supplied as 40 mg/0.8 mL prefilled syringe.
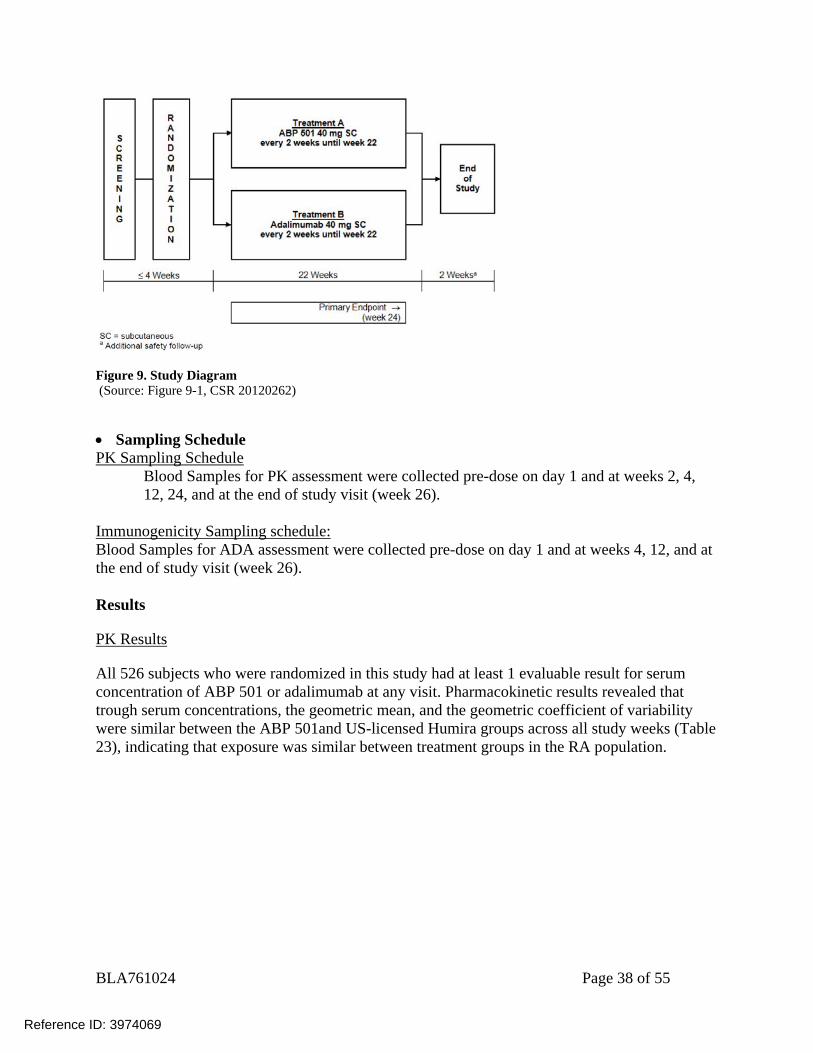
US-licensed Humira supplied as 40 mg/0.8 mL prefilled syringe. Title: A Randomized, Double-blind, Phase 3 Study of ABP 501 Efficacy and Safety Compared to Adalimumab in Subjects with Moderate to Severe Rheumatoid Arthritis Objectives Primary Objective: The primary objective for this study was to assess the efficacy of ABP 501 compared with US-licensed Humira. Secondary Objectives: The secondary objectives were to assess the safety and immunogenicity of ABP 501 compared with US-licensed Humira. Exploratory Objectives: The exploratory objectives were to assess the injection site pain perception based on subject’s rankings for ABP 501 compared with US-licensed Humira and to assess the trough serum concentration of ABP 501 compared with US-licensed Humira. Only results related to PK and immunogenicity are reviewed here. For efficacy and safety results, please refer to clinical review by Dr. Keith Hull. Study Population Male or female patients aged 18 to 80 years old, inclusive, with moderate to severe RA Study Design This was a randomized, double-blind, active comparator-controlled study of adalimumab-naïve adult subjects with moderate to severe RA who had an inadequate response to methotrexate (MTX). Approximately 500 subjects (250 per treatment group) were to be enrolled. Subjects were randomized 1:1 to receive either ABP 501 or US-licensed Humira at 40 mg subcutaneously (SC) every 2 weeks for 22 weeks. The assessment of the primary endpoint was at week 24, with a safety follow-up period through week 26 (end of study).
Reference ID: 3974069
BLA761024 Page 38 of 55
Figure 9. Study Diagram (Source: Figure 9-1, CSR 20120262)
Sampling Schedule PK Sampling Schedule
Blood Samples for PK assessment were collected pre-dose on day 1 and at weeks 2, 4, 12, 24, and at the end of study visit (week 26).
Immunogenicity Sampling schedule: Blood Samples for ADA assessment were collected pre-dose on day 1 and at weeks 4, 12, and at the end of study visit (week 26). Results
PK Results
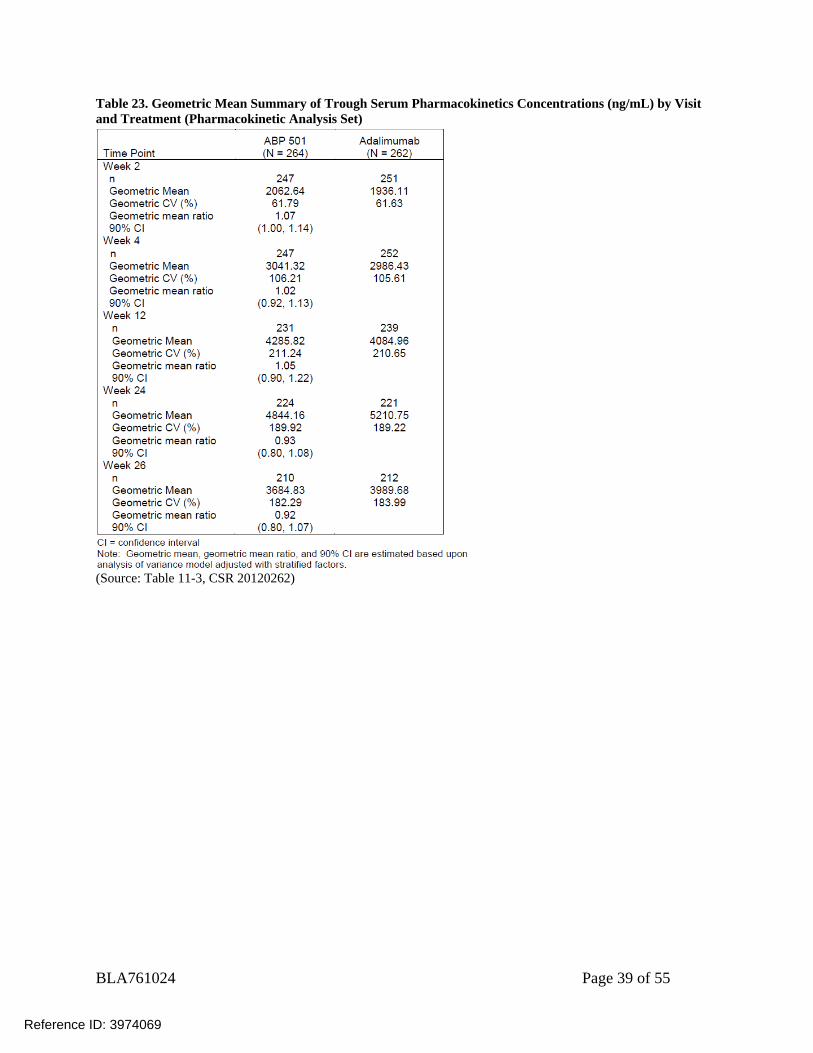
All 526 subjects who were randomized in this study had at least 1 evaluable result for serum concentration of ABP 501 or adalimumab at any visit. Pharmacokinetic results revealed that trough serum concentrations, the geometric mean, and the geometric coefficient of variability were similar between the ABP 501and US-licensed Humira groups across all study weeks (Table 23), indicating that exposure was similar between treatment groups in the RA population.
Reference ID: 3974069
BLA761024 Page 39 of 55
Table 23. Geometric Mean Summary of Trough Serum Pharmacokinetics Concentrations (ng/mL) by Visit and Treatment (Pharmacokinetic Analysis Set)
(Source: Table 11-3, CSR 20120262)
Reference ID: 3974069
BLA761024 Page 40 of 55
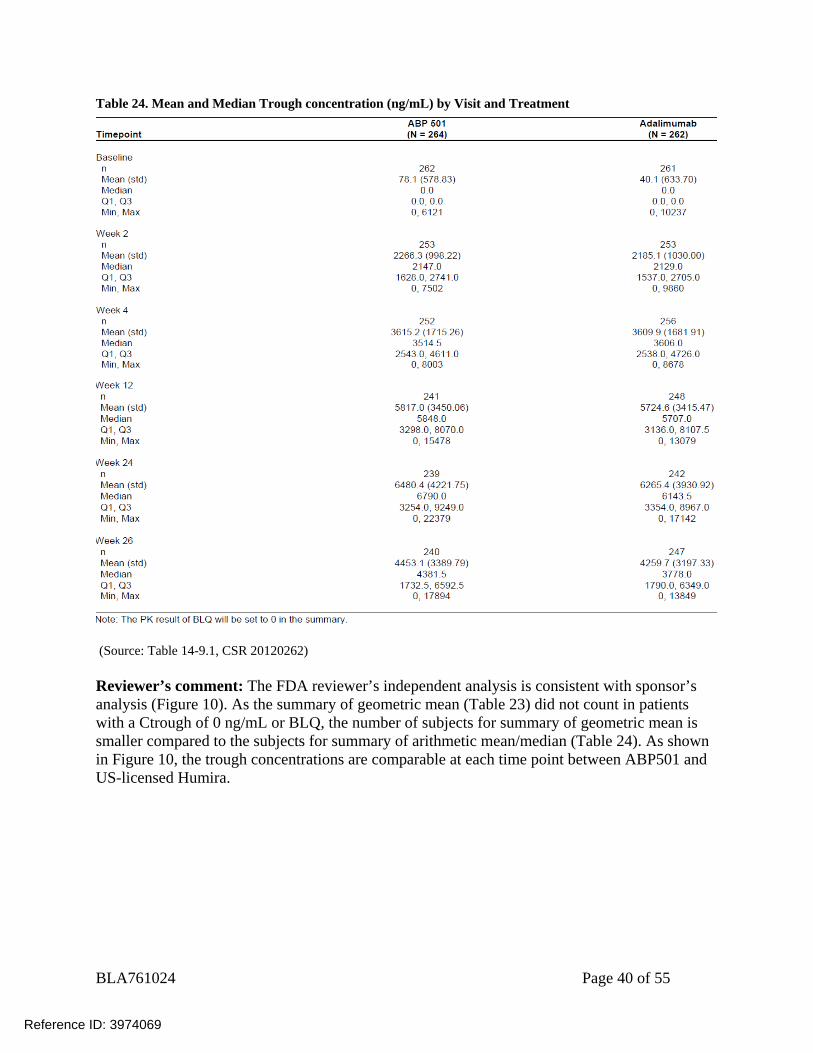
Table 24. Mean and Median Trough concentration (ng/mL) by Visit and Treatment
(Source: Table 14-9.1, CSR 20120262) Reviewer’s comment: The FDA reviewer’s independent analysis is consistent with sponsor’s analysis (Figure 10). As the summary of geometric mean (Table 23) did not count in patients with a Ctrough of 0 ng/mL or BLQ, the number of subjects for summary of geometric mean is smaller compared to the subjects for summary of arithmetic mean/median (Table 24). As shown in Figure 10, the trough concentrations are comparable at each time point between ABP501 and US-licensed Humira.
Reference ID: 3974069
BLA761024 Page 41 of 55
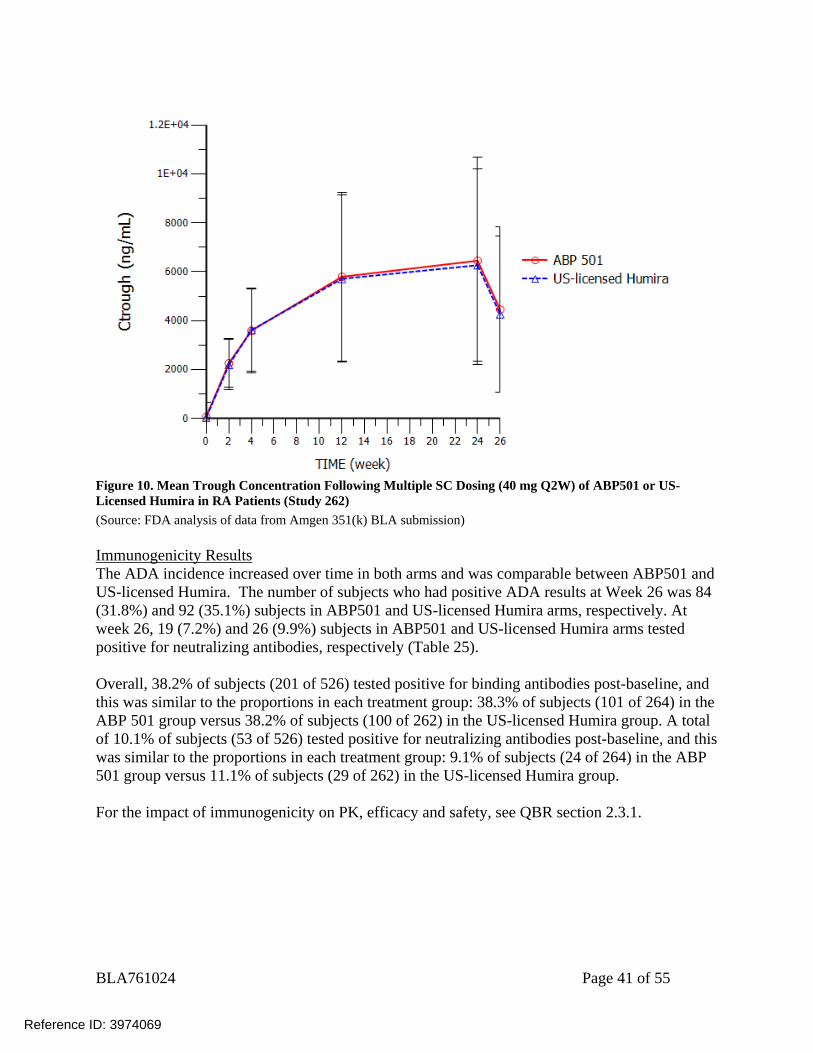
Figure 10. Mean Trough Concentration Following Multiple SC Dosing (40 mg Q2W) of ABP501 or US-Licensed Humira in RA Patients (Study 262) (Source: FDA analysis of data from Amgen 351(k) BLA submission) Immunogenicity Results The ADA incidence increased over time in both arms and was comparable between ABP501 and US-licensed Humira. The number of subjects who had positive ADA results at Week 26 was 84 (31.8%) and 92 (35.1%) subjects in ABP501 and US-licensed Humira arms, respectively. At week 26, 19 (7.2%) and 26 (9.9%) subjects in ABP501 and US-licensed Humira arms tested positive for neutralizing antibodies, respectively (Table 25). Overall, 38.2% of subjects (201 of 526) tested positive for binding antibodies post-baseline, and this was similar to the proportions in each treatment group: 38.3% of subjects (101 of 264) in the ABP 501 group versus 38.2% of subjects (100 of 262) in the US-licensed Humira group. A total of 10.1% of subjects (53 of 526) tested positive for neutralizing antibodies post-baseline, and this was similar to the proportions in each treatment group: 9.1% of subjects (24 of 264) in the ABP 501 group versus 11.1% of subjects (29 of 262) in the US-licensed Humira group. For the impact of immunogenicity on PK, efficacy and safety, see QBR section 2.3.1.
Reference ID: 3974069
BLA761024 Page 42 of 55
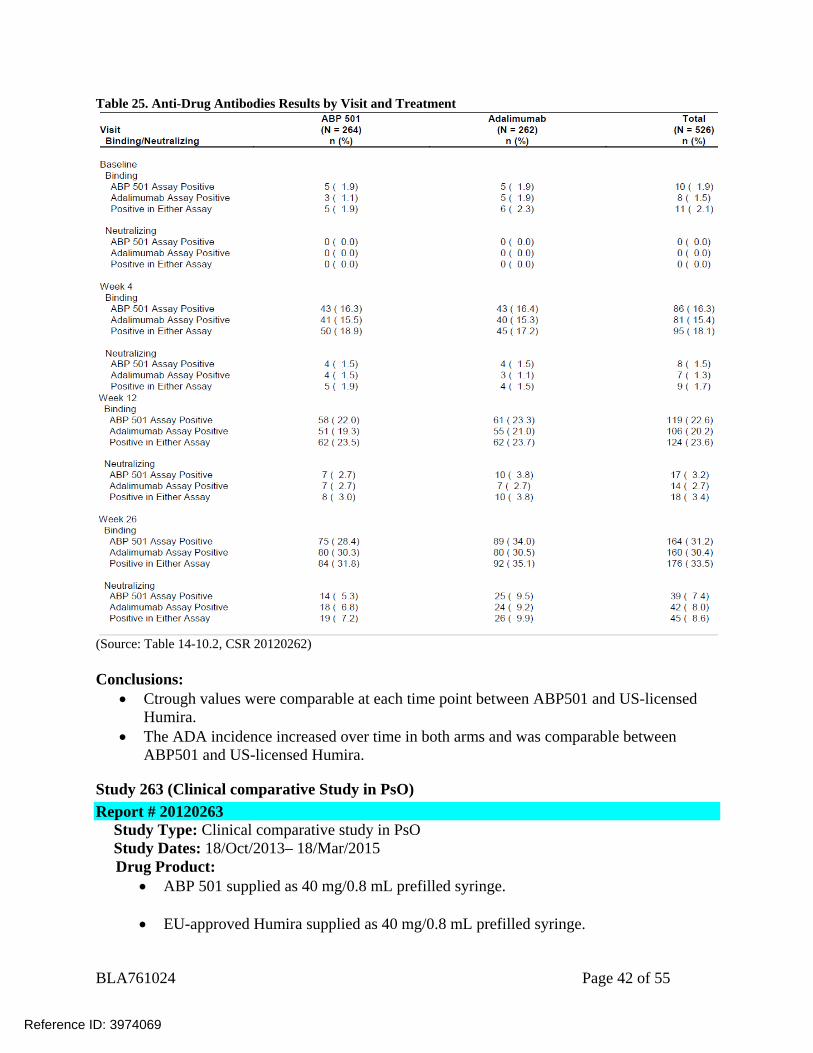
Table 25. Anti-Drug Antibodies Results by Visit and Treatment
(Source: Table 14-10.2, CSR 20120262) Conclusions:
Ctrough values were comparable at each time point between ABP501 and US-licensed Humira.
The ADA incidence increased over time in both arms and was comparable between ABP501 and US-licensed Humira.
Study 263 (Clinical comparative Study in PsO) Report # 20120263
Study Type: Clinical comparative study in PsO Study Dates: 18/Oct/2013– 18/Mar/2015 Drug Product:
ABP 501 supplied as 40 mg/0.8 mL prefilled syringe.
EU-approved Humira supplied as 40 mg/0.8 mL prefilled syringe.
Reference ID: 3974069
BLA761024 Page 43 of 55
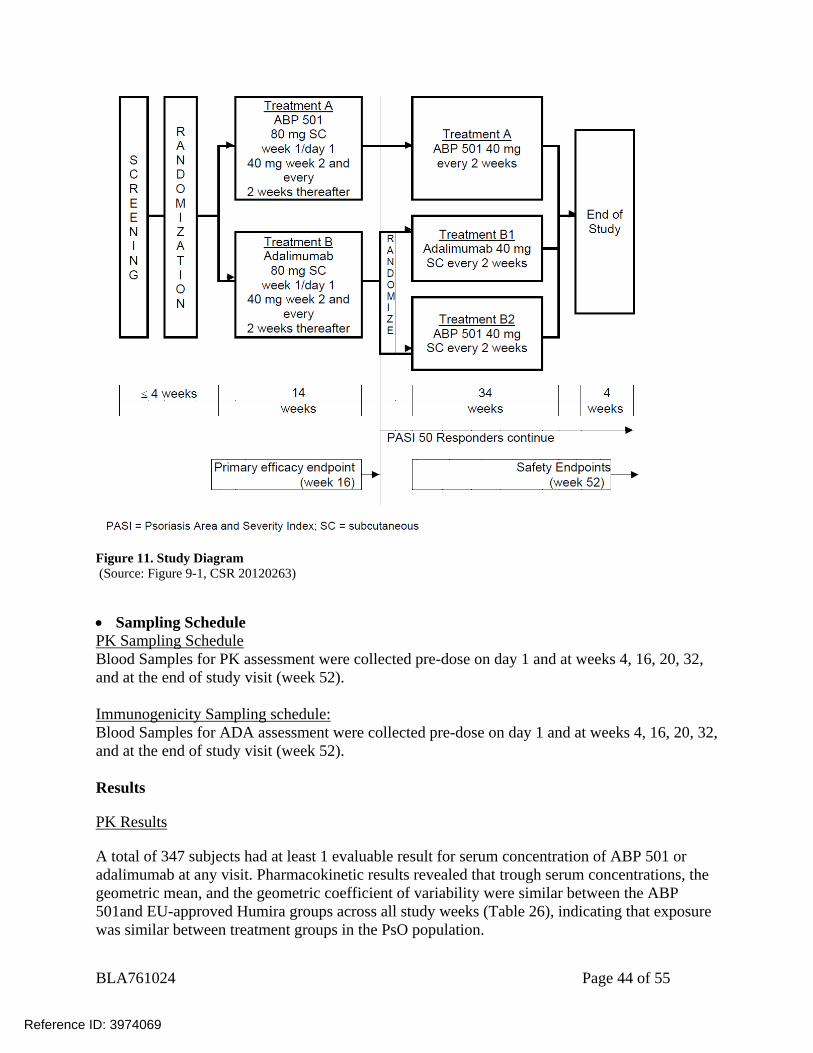
Title: A Phase 3, Multicenter, Randomized, Double-blind Study Evaluating the Efficacy and Safety of ABP 501 Compared with Adalimumab in Subjects with Moderate to Severe Plaque Psoriasis Objectives Primary Objective: The primary objective for this study was to evaluate the efficacy of ABP 501 in subjects with moderate to severe plaque psoriasis, as measured by the Psoriasis Area and Severity Index (PASI) percent improvement from baseline, compared with EU-approved Humira. Secondary Objectives: The secondary objectives of this study were to assess the safety and immunogenicity of ABP 501 compared with EU-approved Humira and to assess efficacy in terms of PASI 75 response (75% or greater improvement from baseline in PASI score), static Physician’s Global Assessment (sPGA), and percent body surface area (BSA) affected. Exploratory Objectives: The exploratory objective was to assess the perception of injection site pain based on subjects’ rankings for ABP 501 compared with EU-approved Humira injections. Only results related to PK and immunogenicity are reviewed here. For efficacy and safety results, please refer to clinical review. Study Population Male or female patients aged 18 to 75 years old, inclusive, with moderate to severe plaque psoriasis. Study Design This was a randomized, double-blind, active comparator-controlled study in adult subjects with moderate to severe plaque psoriasis. Approximately 340 subjects (170 subjects per treatment group) were to be enrolled. After a 4-week screening period, subjects were randomized (1:1) to Treatment Group A (ABP 501) or Treatment Group B (EU-approved Humira). Randomization was stratified based on prior biologic use for psoriasis and geographic region. Subjects received ABP 501 or EU-approved Humira at an initial loading dose of 80 mg subcutaneous (SC) on week 1/day 1, followed by 40 mg SC every other week starting 1 week after the loading dose (i.e., week 2) and every 2 weeks thereafter. At week 16, subjects with a PASI 50 response (50% or better improvement) continued on study for up to 52 weeks. Subjects who continued treatment beyond week 16 were re-randomized in a blinded fashion such that all subjects initially randomized to Treatment Group A (ABP 501) continued treatment with ABP 501 and subjects initially randomized to Treatment Group B (EU-approved Humira) were re-randomized (1:1) to either continue treatment with adalimumab (Treatment Group B1 [EU-approved Humira / EU-approved Humira]) or were transitioned to ABP 501 (Treatment Group B2 [EU-approved Humira /ABP 501]). All subjects continued with their assigned treatment until week 48, when the last dose of assigned investigational product was administered. The final efficacy assessments were conducted at week 50 and the end of study visit was at week 52.
Reference ID: 3974069
BLA761024 Page 44 of 55
Figure 11. Study Diagram (Source: Figure 9-1, CSR 20120263)
Sampling Schedule PK Sampling Schedule Blood Samples for PK assessment were collected pre-dose on day 1 and at weeks 4, 16, 20, 32, and at the end of study visit (week 52).
Immunogenicity Sampling schedule: Blood Samples for ADA assessment were collected pre-dose on day 1 and at weeks 4, 16, 20, 32, and at the end of study visit (week 52). Results
PK Results
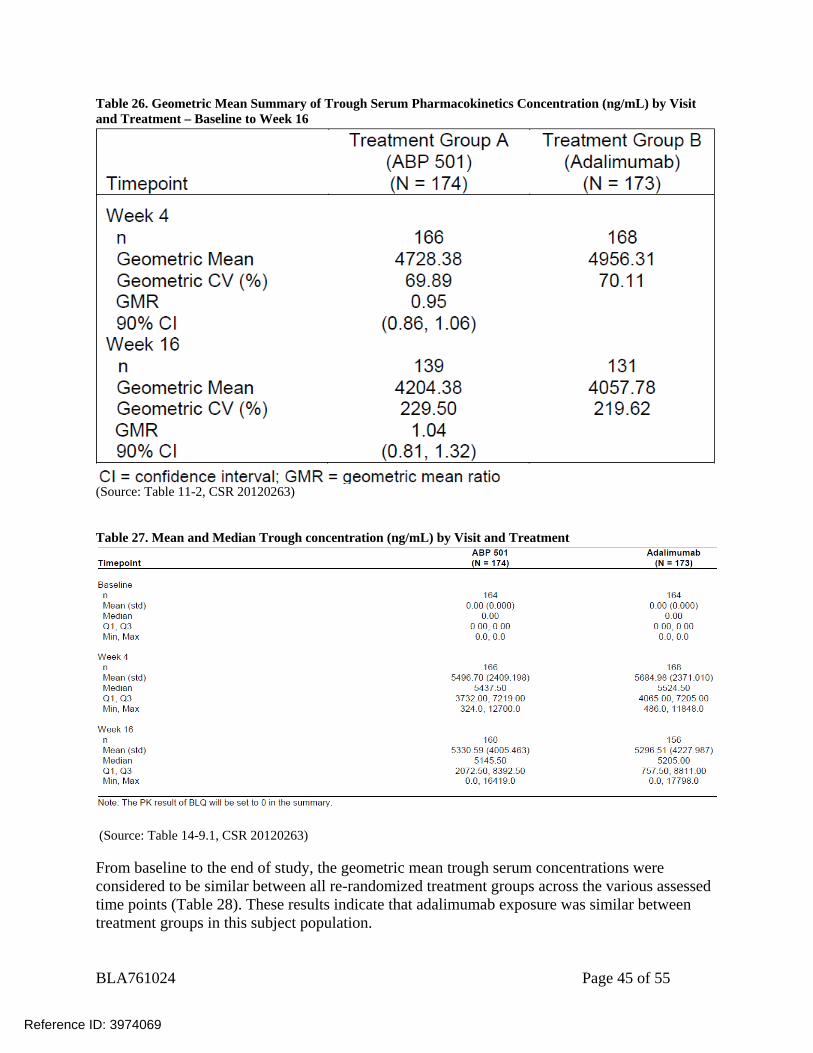
A total of 347 subjects had at least 1 evaluable result for serum concentration of ABP 501 or adalimumab at any visit. Pharmacokinetic results revealed that trough serum concentrations, the geometric mean, and the geometric coefficient of variability were similar between the ABP 501and EU-approved Humira groups across all study weeks (Table 26), indicating that exposure was similar between treatment groups in the PsO population.
Reference ID: 3974069
BLA761024 Page 45 of 55
Table 26. Geometric Mean Summary of Trough Serum Pharmacokinetics Concentration (ng/mL) by Visit and Treatment – Baseline to Week 16
(Source: Table 11-2, CSR 20120263) Table 27. Mean and Median Trough concentration (ng/mL) by Visit and Treatment
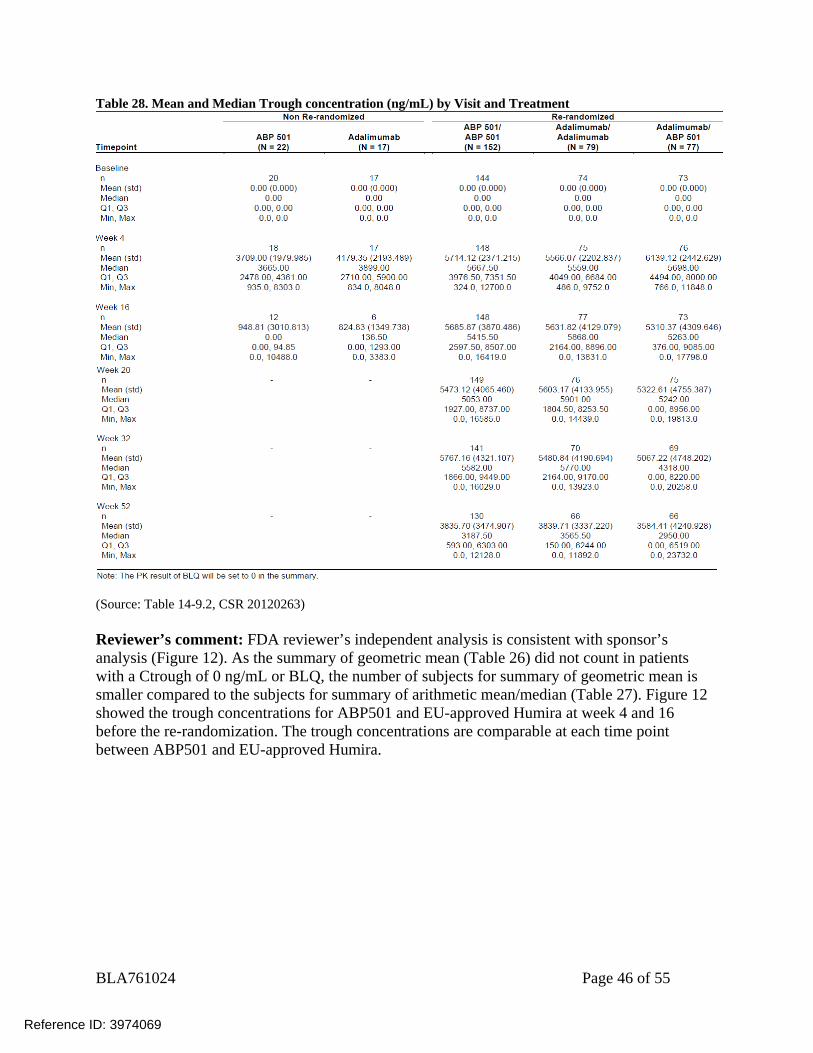
(Source: Table 14-9.1, CSR 20120263) From baseline to the end of study, the geometric mean trough serum concentrations were considered to be similar between all re-randomized treatment groups across the various assessed time points (Table 28). These results indicate that adalimumab exposure was similar between treatment groups in this subject population.
Reference ID: 3974069
BLA761024 Page 46 of 55
Table 28. Mean and Median Trough concentration (ng/mL) by Visit and Treatment
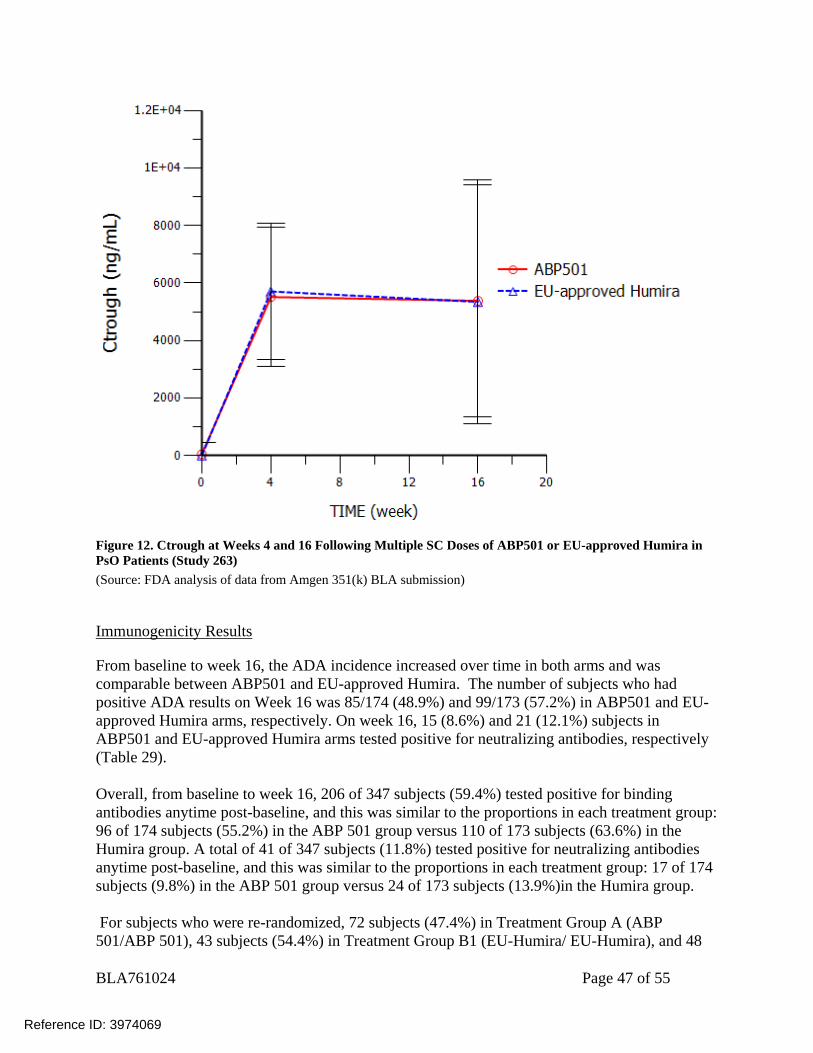
(Source: Table 14-9.2, CSR 20120263) Reviewer’s comment: FDA reviewer’s independent analysis is consistent with sponsor’s analysis (Figure 12). As the summary of geometric mean (Table 26) did not count in patients with a Ctrough of 0 ng/mL or BLQ, the number of subjects for summary of geometric mean is smaller compared to the subjects for summary of arithmetic mean/median (Table 27). Figure 12 showed the trough concentrations for ABP501 and EU-approved Humira at week 4 and 16 before the re-randomization. The trough concentrations are comparable at each time point between ABP501 and EU-approved Humira.
Reference ID: 3974069
BLA761024 Page 47 of 55
Figure 12. Ctrough at Weeks 4 and 16 Following Multiple SC Doses of ABP501 or EU-approved Humira in PsO Patients (Study 263) (Source: FDA analysis of data from Amgen 351(k) BLA submission)
Immunogenicity Results
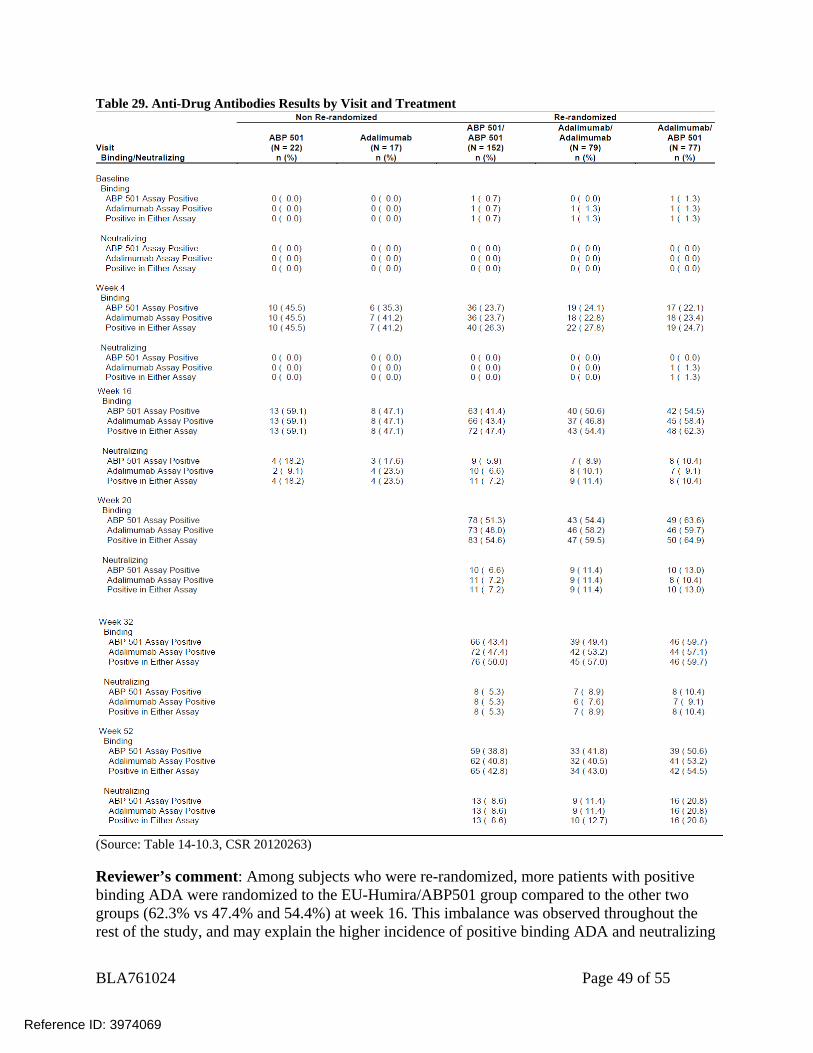
From baseline to week 16, the ADA incidence increased over time in both arms and was comparable between ABP501 and EU-approved Humira. The number of subjects who had positive ADA results on Week 16 was 85/174 (48.9%) and 99/173 (57.2%) in ABP501 and EU-approved Humira arms, respectively. On week 16, 15 (8.6%) and 21 (12.1%) subjects in ABP501 and EU-approved Humira arms tested positive for neutralizing antibodies, respectively (Table 29). Overall, from baseline to week 16, 206 of 347 subjects (59.4%) tested positive for binding antibodies anytime post-baseline, and this was similar to the proportions in each treatment group: 96 of 174 subjects (55.2%) in the ABP 501 group versus 110 of 173 subjects (63.6%) in the Humira group. A total of 41 of 347 subjects (11.8%) tested positive for neutralizing antibodies anytime post-baseline, and this was similar to the proportions in each treatment group: 17 of 174 subjects (9.8%) in the ABP 501 group versus 24 of 173 subjects (13.9%)in the Humira group. For subjects who were re-randomized, 72 subjects (47.4%) in Treatment Group A (ABP 501/ABP 501), 43 subjects (54.4%) in Treatment Group B1 (EU-Humira/ EU-Humira), and 48
Reference ID: 3974069
BLA761024 Page 48 of 55
subjects (62.3%) in Treatment Group B2 (EU-Humira /ABP 501 arms) tested positive for binding antibodies at the time of re-randomization (week 16, Table 29). The number of subjects who had positive binding ADA results on Week 52 was 65 (42.8%), 34 (43%), and 42 (54.5%) subjects in ABP 501/ABP 501, EU-Humira/ EU-Humira and EU-Humira /ABP 501 arms, respectively (Table 29). For subjects who were re-randomized, the neutralizing ADA incidence increased over time in all arms. 11 subjects (7.2%) in Treatment Group A (ABP 501/ABP 501), 9 subjects (11.4%) in Treatment Group B1 (EU-Humira / EU-Humira), and 8 subjects (10.4%) in Treatment Group B2 (EU-Humira /ABP 501) tested positive for neutralizing antibodies at the time of re-randomization (week 16, Table 29). On week 52, 13 (8.6%), 10 (12.7%) and 16 (20.8%) subjects in ABP 501/ABP 501, EU-Humira/ EU-Humira and EU-Humira /ABP 501 arms tested positive for neutralizing antibodies, respectively (Table 29). Overall, from baseline to the end of study, among subjects who were re-randomized, 104 of 152 subjects (68.4%) in Treatment Group A (ABP 501/ABP 501), 59 of 79 subjects (74.7%) in Treatment Group B1 (EU-Humira / EU-Humira), and 56 of 77 subjects (72.7%) in Treatment Group B2 (EU-Humira /ABP 501) tested positive for binding antibodies anytime post-baseline. From baseline to the end of study, among subjects who were re-randomized, 21 of 152 subjects (13.8%) in Treatment Group A (ABP 501/ABP 501), 16 of 79 subjects (20.3%) in Treatment Group B1 (EU-Humira / EU-Humira), and 19 of 77 subjects (24.7%) in Treatment Group B2 (EU-Humira /ABP 501) tested positive for neutralizing antibodies anytime post-baseline. For the impact of immunogenicity on PK, efficacy and safety, see QBR section 2.3.1.
Reference ID: 3974069
BLA761024 Page 49 of 55
Table 29. Anti-Drug Antibodies Results by Visit and Treatment
(Source: Table 14-10.3, CSR 20120263) Reviewer’s comment: Among subjects who were re-randomized, more patients with positive binding ADA were randomized to the EU-Humira/ABP501 group compared to the other two groups (62.3% vs 47.4% and 54.4%) at week 16. This imbalance was observed throughout the rest of the study, and may explain the higher incidence of positive binding ADA and neutralizing
Reference ID: 3974069
BLA761024 Page 50 of 55
ADA observed in the EU-Humira/ABP501 group later at week 52, as subjects with binding antibodies are predisposed to form neutralizing antibodies.
Conclusions:
Ctrough values were comparable at each time point between ABP501 and EU-approved Humira in PsO patients.
The ADA incidence increased over time in both arms and was comparable between ABP501 and EU-approved Humira before week 16 and re-randomization. More patients with positive binding ADA were randomized to the EU-Humira/ABP501 group at week 16, and higher incidence of positive binding ADA and neutralizing ADA were observed in the EU-Humira/ABP group at week 52.
Reference ID: 3974069
BLA761024 Page 55 of 55
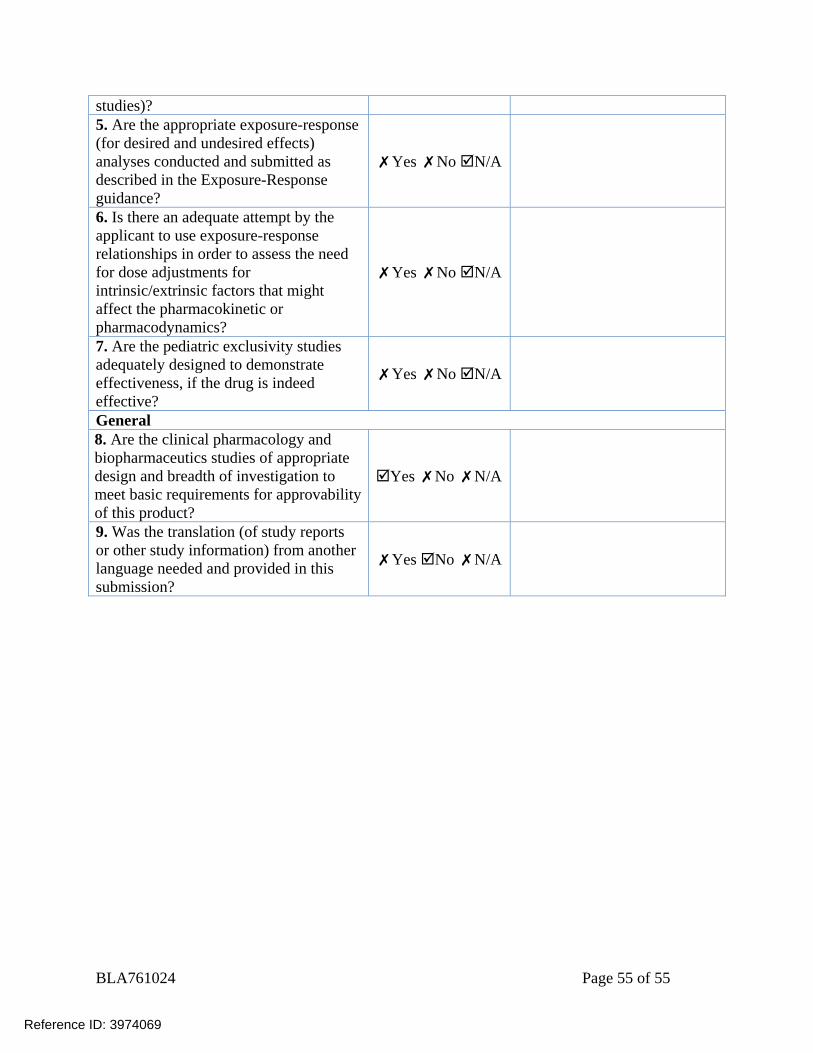
studies)? 5. Are the appropriate exposure-response (for desired and undesired effects) analyses conducted and submitted as described in the Exposure-Response guidance?
✗Yes ✗No N/A
6. Is there an adequate attempt by the applicant to use exposure-response relationships in order to assess the need for dose adjustments for intrinsic/extrinsic factors that might affect the pharmacokinetic or pharmacodynamics?
✗Yes ✗No N/A
7. Are the pediatric exclusivity studies adequately designed to demonstrate effectiveness, if the drug is indeed effective?
✗Yes ✗No N/A
General 8. Are the clinical pharmacology and biopharmaceutics studies of appropriate design and breadth of investigation to meet basic requirements for approvability of this product?
Yes ✗No ✗N/A
9. Was the translation (of study reports or other study information) from another language needed and provided in this submission?
✗Yes No ✗N/A
Reference ID: 3974069
---------------------------------------------------------------------------------------------------------This is a representation of an electronic record that was signedelectronically and this page is the manifestation of the electronicsignature.---------------------------------------------------------------------------------------------------------/s/----------------------------------------------------
JIANMENG CHEN08/18/2016
ANSHU MARATHE08/18/2016
Reference ID: 3974069