Embed Size (px)
Citation preview

McGILL UNIVERSITY Department of Geography
CLIMATOLOGICAL ·
BULLETIN
NO. 3
JANUARY 1968
McGILL UNIVERSITY, MONTREAL
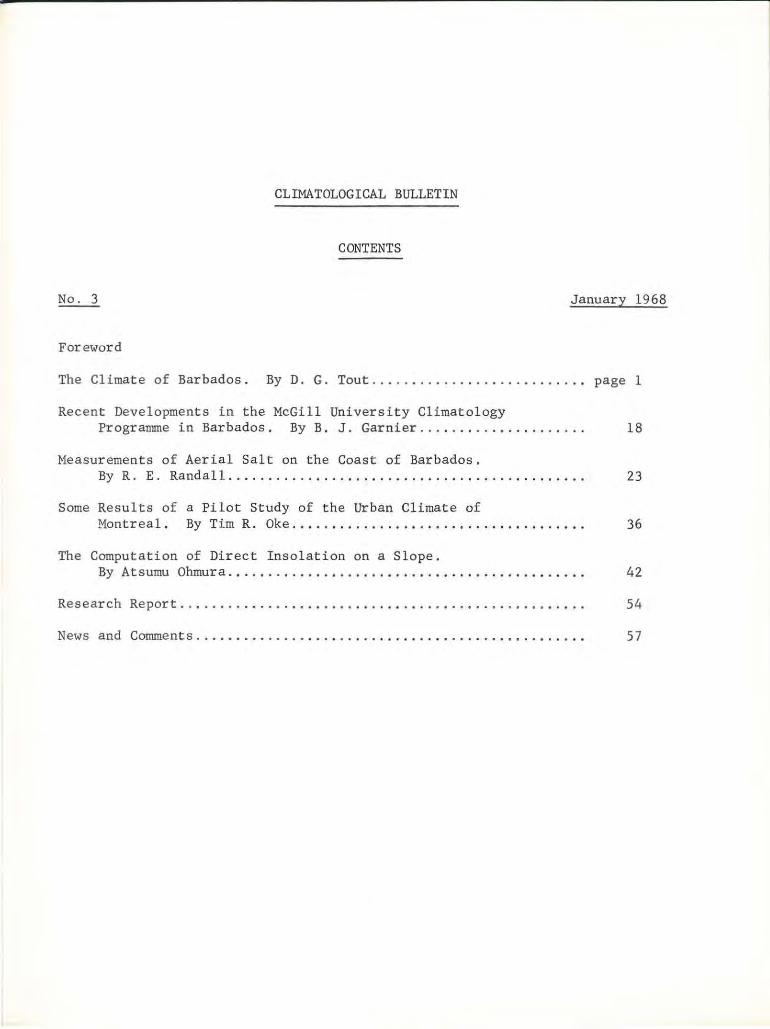
CLIMATOLOGICAL BULLETIN
CONTENTS
No.3 January 1968
Foreword
The Climate of Barbados. By D. G. Tout ............. .. ............ page 1
Recent Developments in the McGil l University Climatology Programme in Barbados. By B. J. Garnier.. .. . .. .. . ........... 18
Measurements of Aerial Salt on the Coast of Barbados. By R. E. Randall................ . ............................ 23
Some Results of a Pilot Study of the Urban Climate of Montreal. By Tim R. Oke.. ... ........... ... .................. 36
The Computation of Direct Insolation on a Slope. By Atsumu Ohmura............................................. 42
Research Report. .. . . . . . . . . . . . . . . . . . . . . . . . . . . . . . . . . . . . . . . . . . . . . . . . . S4
News and Comments... . .. . .... ......... ........... .... . .. . .... ... . .. S 7

CLIMATOLOGICAL BULLETIN is published in January and July each year. It exists to report on the work associated with the programme of Graduate Training and Research in Climatology and Microclimatology in the Department of Geography at McGill University which is supported by grants in aid from the National Research Council of Canada, the Department of Transport (Meteorological Branch) and the research funds of McGill University. Any additional special support is acknowledged in the relevant article. The Department also publishes a CLIMATOLOGICAL RESEARCH SERIES, information on which will be found at the end of this Bulletin.
The Subscription to CLIMATOLOGICAL BULLETIN is Three Dollar s a year.
All enquiries concerning the BULLETIN and RESEARCH SERIES, and the Climatology Programme in general, should be addressed to
Department of Geography (Climatology), McGill University, Montreal 2, P.Q . , Canada.
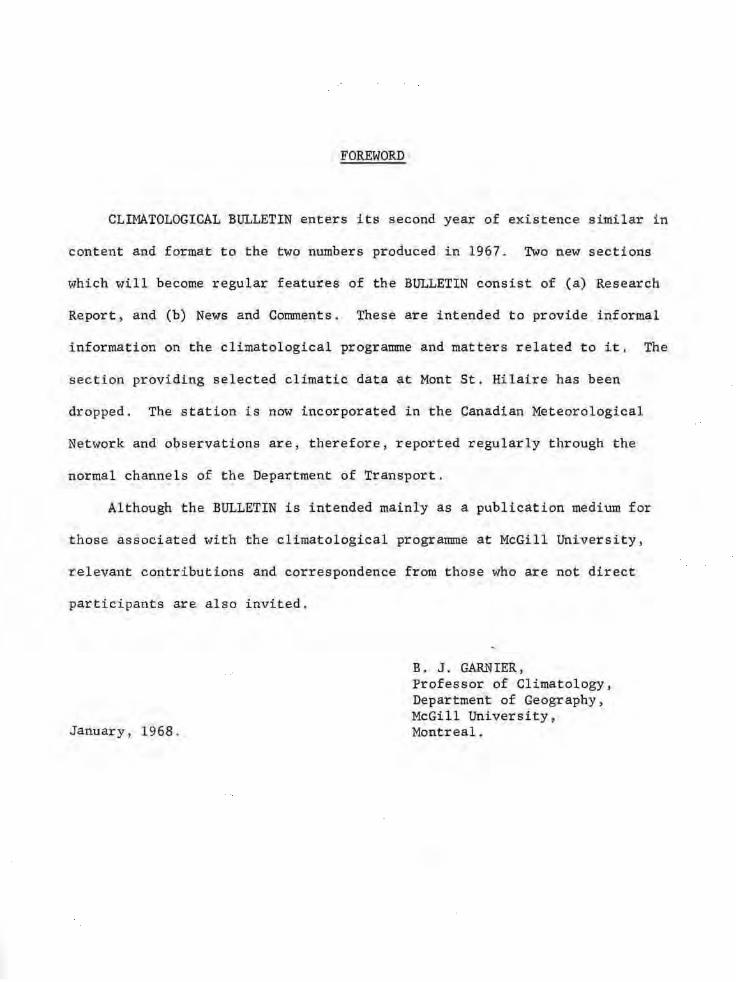
FOREWORD
CLIMATOLOGICAL BULLETIN enters its second year of existence similar in
content Bnd format to the two numbers produced in 1967. Two new sections
which will become regular features of the BULLETIN consist of (a) Research
Report, and (b) News snd Comments. These are intended to provide informal
i nformation on the climatological programme Bnd matters rela ted to it. The
section providing selected climatic data at Mont St. Hilaire has been
dropped. The s tat ion is now incorporated in the Canadian Meteorological
Ne twork and observations are, therefore, reported regularly through the
normal channels of th e Department of Transport.
Although the BULLETIN is intended mainly as a publicati on medium for
those associated with the climatological programme at McGill University,
relevant contr ibutions and correspondence from those who are not direct
participants are also invited.
January, 1968 .
B. J . GARNIER, Professor of Climatology. Department of Geography, McGill University, MonCreal.
- 1 -
THE CLIMATE OF BARBADOS
by
D. G. TOUT*
Introduction
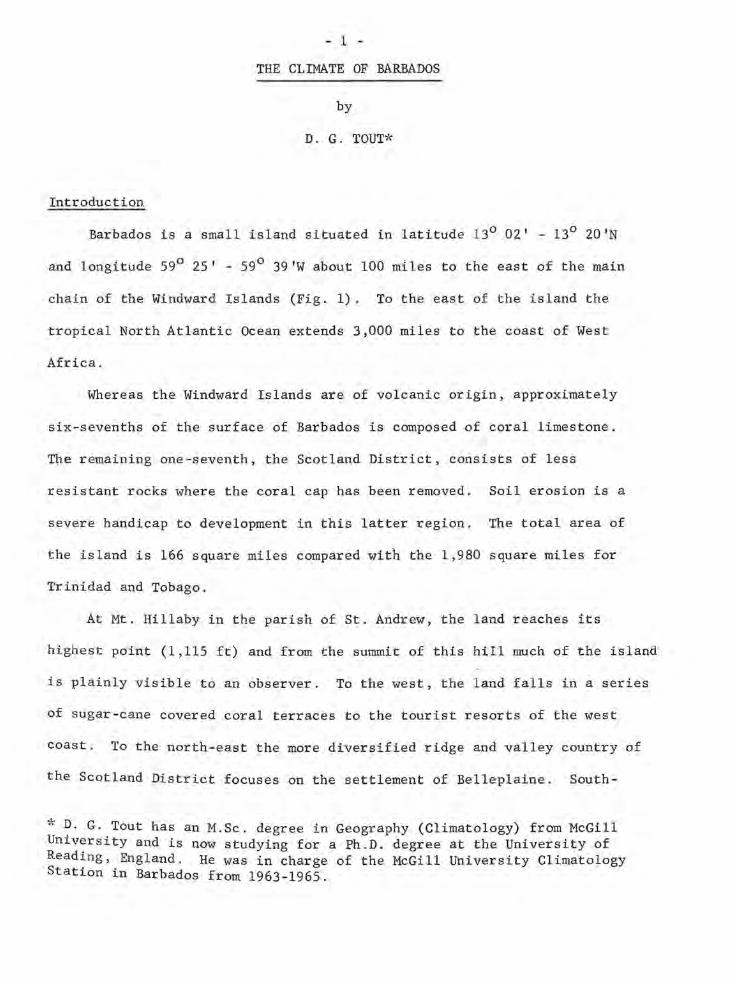
Barbados is a small island situated in latitude 130 02' - 130 20'N
and longitude 590 25' - 59 0 39'W about 100 miles to the east of the main
chain of the Windward Islands (Fig. 1). To the east of the island the
tropical North Atlantic Ocean extends 3,000 miles to the coast of West
Africa.
Whereas the Windward Islands are of volcanic origin, approximately
six-sevenths of the surface of Barbados is composed of coral limestone.
The remaining one-seventh, the Scotland District, consists of less
resistant rocks where the coral cap has been removed. Soil erosion is a
severe handicap to development in this latter region. The total area of
the island is 166 square miles compared with the 1,980 square miles for
Trinidad and Tobago.
At Mt. Hillaby in the parish of St. Andrew, the land reaches its
highest point (1,115 ft) and from the summit of this hill much of the island
is plainly visible to an observer. To the west, the land falls in a series
of sugar-cane covered coral terraces to the tourist resorts of the west
coast. To the north-east the more diversified ridge and valley country of
the Scotland District focuses on the settlement of Belleplaine. South-
* D. G. Tout has an M.Sc. degree in Geography (Climatology) from McGill University and is now studying for a Ph.D. degree at the University of Reading, England. He was in charge of the McGill University Climatology Station in Barbados from 1963-1965.
SCALE
t:=::~tO~::1 I::!:21~i~!::f;.·4 MI. : :2? ! 1 e f KM.
SI GEORGE'S
I /
; , ...... , . \ , . "
r N
VAJ-LEY '\~ ."" '''\
.'" ',~ \'%
BARBADOS
LOCATION MAP
FIG .•
'\.\ .~~ \
". , '\
• d#."';'\ SEAWELL i<-~ AIRPORT

- 2 -
wards the land falls gradually to the east-west through a valley known as
the St. George's Valley. South of this valley the land rises to 400 feet
in the Christ Church Ridge and then descends evenly to the south-west
coast. Apart from the built-up area of Bridgetown and its suburbs and
the semi-arid areas in the south-eastern parts of the parishes of Christ
Church and St. Philip, most of the southern part of the island is devoted
exclusively to growing sugar cane.
General Factors Controlling the Island's Climate
Barbados is surrounded by a tropical sea which has a temperature
varying little from 80 0 F in any month of the year. The nearest land area
is 100 miles to the west. Daily solar radiation at the top of the atmos
phere for latitude 130 20'N varies from 719 langleys (lys) to 932 lys over
a twelve month period (Tout, 1967). During the months with low radiation
values at tre top of the atmosphere cloud amounts are low and radiation
is strongly absorbed at the surface of the earth. In June, July and
August when radiation values at the top of the atmosphere are high the
cloud amount is also high, as this is the rainy season, and a lower percentage
of radiation reaches the surface. As a result of these conditions monthly
values of total solar radiation on a horizontal surface do not show great
differences from one month to another. The months of March, April and May
are exceptions to this statement, however, since high radiation values
combine with low cloud amounts at the end of the dry season to give high
values of total solar radiation at the surface. The fact that monthly
values of radiation on a horizontal surface are always high and the surrounding

- 3 -
seas are always at a temperature of about 800 F, means that monthly
temperatures on the island will vary little and will always be near the
mean ocean temperature. As in any maritime situation, diurnal ranges of
temperature will be small. In fact , we find that temperatures rarely rise
above 900 F or fall below 600 F. The more elevated parrn of the island,
however, experience temperatures slighly lower than these .
For the greater part of the year Barbados lies in the broad stream
of the North Atlantic Trade Winds which generally blow from directions
between east north-east and east south-east in these latitudes. These
winds have an uninterrupted sea-passage from their source region in the
vast anticyclonic area normally situated near the islands of the Azores
in latitudes 35 0 - 40~. On travelling south-westwards these winds pick
up warmth and moisture from the underlying tropical ocean and the associated
maritime tropical air mass, with high levels of relative humidity, will
produce instability rain showers when forced ascent takes place, provided
that the trade-wind inversion level is sufficiently high.
During the rainy season months, June through November, the island
occasionally comes under the influence of the Inter-tropical Convergence
Zone (ITCZ) which is usually found at its most northerly position, about
lOoN latitude, during the months of July and August. Its influence at this
season may, at times, extend to IsoN latitude accompanied by increased
convectional activity and wind from a more southerly point. During the
rainy season Barbados is also visi~dby tropical disturbances which are
found to the north of the ITCZ and range from easterly waves, through
tropical depressions, to full hurricanes. It is these synoptic scale

- 4 -
features and the influence of the ITCZ which account for most of the rain
fall of the rainy season.
Seasons
The four seasons of the temperate lands have no meaning in tropical
latitudes. Rainfall must here be the criterion for dividing the year into
seasons. In Barbados, the dry season is generally considered to last from
December through May and the rainy season from June through November. The
intensity and duration of the two seasons varies with respect to situation.
For example, a station such as Lion Castle in the higher part of the island
will have a longer and more intense rainy season than a station such as
River Plantation in the lowlands of the south-east. Another point to bear
in mind is that it is quite possible to experience a week of dry season
weather in the "wet seasonll month of July and several consecutive wet days
in the "dry season" month of April.
Available Climatic Records
Rainfall has always been of prime importance to the plantation owners
of the island because on this mainly depends the quality and quantity of
their sugar crop. It is not surprising, therefore, to find thE rainfall
data are available for approximately eighty stations, mainly plantation
sites, some of which possess records dating back to the middle of the
nineteenth century. But, whereas rainfall has been more than adequately
covered by the network of amateur stations, other climatic parameters have
received scant attention and the only station for which long-term averages
of temperature, humidity, rainfall and sunshine are available is Codrington
- 5 -
Agricultural Station in St. Michael parish. A second full climatological
station, Seawell International Airport, Christ Church, dates from the period
of increased aviation activity at the c10,se of the Second World War.
The Waterford Climatological Station
Such was the climatological coverage in 1958 when the Geography
Department of McGill University undertood the task of establishing a
climatological station at Waterford, St. Michael, a short distance beyond
the north-eastern suburbs of Bridgetown. The aims of the station were to
make meteorological and climatological measurements, especially on a micro
scale, at a tropiqa1 station within the trade-wind zone, to undertake
research on problems of agricultural meteorology on an island with an
economy virtually dependent on the production of sugar cane, and to
establish a centre from which research into more general aspects of
Caribbean geography and climatology could be undertaken.
The station, which was established on five acres of leased land, came
into being through co-operation between the Barbados Ministry of Agriculture,
Lands and Fisheries,and McGill University. Although enjoying the benefit
of having the Codrington Agricultural Station data as a long-term comparison ,
it seems, nevertheless, a little unfortunate that the station should have
been located in an area covered by an existing climatological station when
so little is known of conditioni in other parts of the island. Dr. Ivan
Smith, a native Barbadian,was Director of the station until his departure
for Ghana in 1962. By this time the Waterford enterprise had become a
section of the Be11airs Research Institute, St. James, under the director-

TABLE ONE
.. , Means'of 1959-1966 Data for Waterford, St. Michael
Jan. Feb. Mar. Apr. May June Ju1. Aug. Sep. Oct. Nov. Dec. Year
Mean Temperature (oF) 76.4 76.2 77 .4 78.5 79.9 80.7 80.1 80.2 79.5 79.1 78.5 77 .3 78.6
Mean Daily Max. 83.8 84.2 85.5 86.4 87.2 86.9 86.1 86.9 86.8 85.9 85.7 83.9
Mean Daily Min. 68.9 68.1 69.3 70.5 72.6 74.3 74.4 73.5 72.3 72.2 71.3 69.5
Mean Extreme Max. 85.7 86.3 87.3 88.1 88.9 88.9 87.9 88.8 88.9 88.1 87.5 86.3 89.6
Mean Extreme Min. 62.7 61.8 63.1 66.0 68.0 70.0 70.0 69.1 68.1 68.4 67.0 63.2 60.6
Mean Extreme Grass Min. 56.6 55.6 57.1 59.0 61.2 63.3 64.4 63.0 62.7 62.7 61.4 57.3 54.7 0'\
Total Rainfall (Ins) 2.12 1.58 1.19 2.03 1.51 3.83 6.82 3.78 5.84 6.37 3.19 3.70 42.70
Most Rain in 24 hours 0.56 0.53 0.25 0.77 0.54 0.98 2.03 0.99 1.62 1.91 0.96 1.23 2.96
Number of Rain Days 19 17 14 15 13 19 24 22 20 21 17 17 218
* 6-8 year means.

- 1 -
ship of Dr. John Lewis. From July 1963 to June 1965 the author was in o
charge at Waterford, during which time the work at Waterford was continued
and fourteen other micro-climatological stations were set up at various
sites on the island, at eight of which daily total solar radiation on a
horizontal surface was recorded and at all fourteen weekly evaporation
measurements were obtained. Since January 1966 Professor B. J. Garnier
has been in charge of the research programme on Barbados and a complete
re-organization of the Waterford Station was started'in the summer of 1966.
The chief results of the work conducted at Waterford from 1958-66
have been the series of means given in Table One, and two studies based
on the evaporation and evapotranspiration measurements made at the station
(Rouse and Watts, 1966). In the following section these means and the
general results of the radiation study will be incorporated into a
description of the main features of the climate of Barbados.
The Elements of Climate
(a) Temperature
Temperatures do not vary to any appreciable extent over the island
either from month to month or from site to site. Mean temperatures at
Waterford range from 16.20 in February to 80.10 F in June, the highest
temperatures being recorded just before the onset of the rainy season.
The mean annual temperature is 18.60 F and this has only varied between
18.4°F and 18.10 F in six years of record. The diurnal range of temperature
in each month is much greater than the annual range. Mean daily maxima
vary between 83.8°F in January and 87.2°F in May. Mean daily minima range

- 8 -
SCALE 0 I 2 3 h41. 0 2 3 4 ~ 6 KM.
LEGEND N
INCHES
I OVER 70
60 70
50 60 ~ UNDER 50 . .
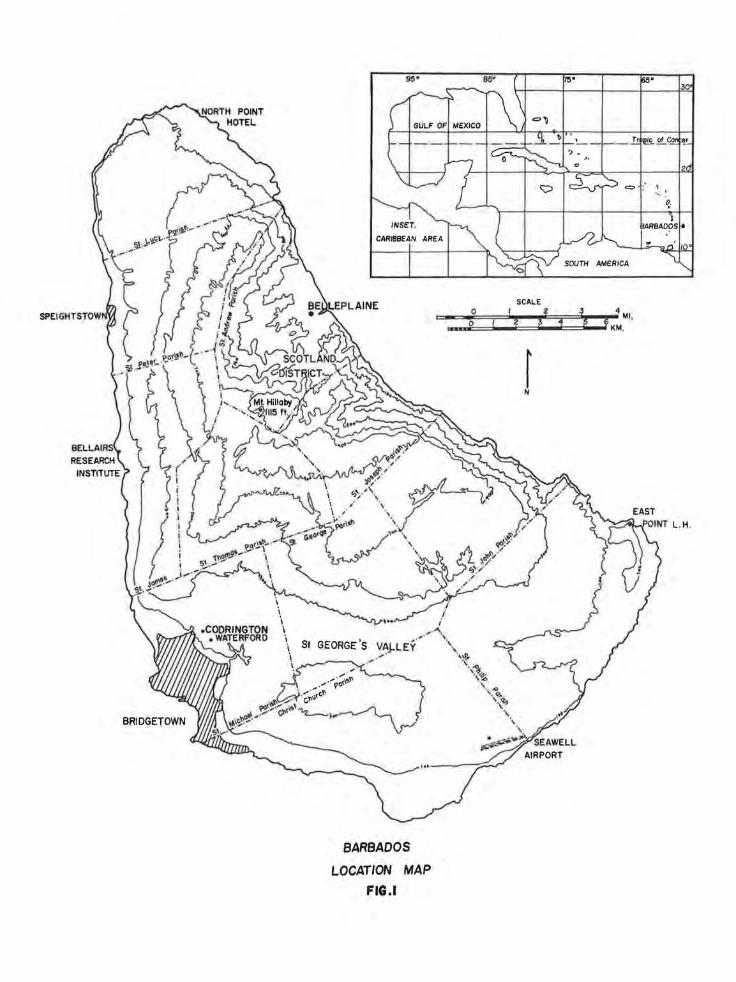
Fig. 2. The Mean Annual Rainfall of Barbados (adapted from a map by Wayne Rouse) .
- 9 -
from 68.loF in February to 74.4oF in July. The extreme maximum temperature
during the period of record is 90.50 F and the extreme minimum 59 . 0oF. Grass
minima may fall to the mid or even low 50's during the early months of the
year, there having been a record low of 52.8oF in December, 1964. prolonged
"cool ll spells with temperatures noticeably below average, such as was
experienced during December 1964, are, however, a very rare feature of
the climate. Depressions over the North Atlantic taking a more southerly
course than usual and giving spells of persistant northerly or north-easterly
winds to the southern Caribbean account for these rare weather episodes.
During the period mentioned above a relict cold front which was, in fact,
traceable at least to the north coast of Guyana, was observed to pass south
wards over Barbados bringing northerly winds to the area.
(b) Rainfall
Unlike temperature, rainfall varies considerably in different parts
of the island. The south-east, north-east -and south-west are the driest
areas, while the central and northern upland areas receive the most
precipitation (Fig. 2 ) . Annual totals vary from over 80 inches in the
wetter areas to under 50 inches in the drier parts. A~ Waterford, with a
mean annual total of 42 . 70 inches, monthly rainfall 1S usually less than
2.25 inches from January through May and above that figure during the
remaining months of the year. Monthly and annual totals vary considerably
from year to year , especially in the drier area. In July, 1963, 12.98
inches of rainfall were recorded at Waterford while July, 1959, produced
only 2.71 inches. Similarly, December rainfall has varied from 8.84 inches
to 1 . 30 inches. The very high totals are usually the result of one or two

- 10 -
exceptionally heavy storms. In July 1963, a total of 6.89 inches was
recorded in one twenty-four hour period, representing over 50% of the month's
rainfall. This heavy fall is especially remarkable since it was not
associated with a hurricane. Annual totals of rainfall at Waterford have
ranged from 36.18 inches (1960) to 52.05 inches (1963). Although rainfall
totals vary considerably the number of rainy days remains remarkably
constant, ranging between 207 and 227 in a six year period. Even in the
dry season one day in two is a rainy day.
Thunderstorms occur only rarely and mostly during periods of disturbed
rainy season weather. The occurrence of hail on the island was reported
for the first time in 1964.
(c) Cloudiness and Sunshine
Cloudless skies are extremely rare in Barbados. Usually the sky is
two to six-eighths covered with cloud, the higher values being in the rainy
season. Conditions of complete overcast, however, are infrequently
experienced. Convection type clouds predominate over all other types
at all times of the year. These clouds range from the small cumulus humilis
to the giant cumulo-nimbus characteristic of more disturbed types of
weather. The early morning tends to be fairly clear- but the cumulus clouds
soon build up over the higher areas and spread to the lowlands. The nights
are less cloudy, but convection clouds are nevertheless still visible in
the sky at this time. Cumulus clouds have a tendency to line up in "streets"
parallel to the prevailing wind with clear areas representing the down-
draughts between. Bad weather stratus and nimbostratus clouds are
infrequent and occur only during periods of synoptic disturbances.

- 11 -
Exact data on hours of bright sunshine are difficult to obtain because
the tropical sun strongly burns the sensitized sunshine card and the burn
often continues into subsequent periods of no sunshine when cumulus clouds
cross the sun. A record of one hour's sunshine may thus really represent
only fifty minutes of actual bright sunshine. Figures for Codrington
Agricultural Station and Seawell Airport give annual totals slightly in
excess of 3 ,000 hours , with little variation from year to year. In a
normal year January has the highest percentage of possible sunshine and
September the lowest. McIntosh (1934) thought sunshine totals in the
upland area would be similar to those of the lowlands, but the radiation
results presented below show that this is most unlikely.
(d) Wind
Wind direction over the whole island is predominantly from an easterly
point. Only during the rainy season will the wind veer more to the south.
Northerly winds may blow for short periods during an unusual spell of
weather, as in December 1964. When centres of low pressure are i n the
area the wind may blow from any point of the compass depending on the
position of the storm in relation to the island. Thus~ a hurricane passing
to the north of Barbados will give westerly winds to the island.
Wind speed is strongest , except for occasional hurricanes, during the
dry season when the Trades are firmly established and lightest during the
rainy season when Barbados occasionally comes under the influence of the
doldrum belt (ITCZ) of light winds. At the latter time of year sea-breezes
may become established on the west coast during the late morning.
- 12 -
-300- CONTOURS IN FEET
STATIONS
SCALE.
pO, 'i ,s' ¥ \ ,::1.
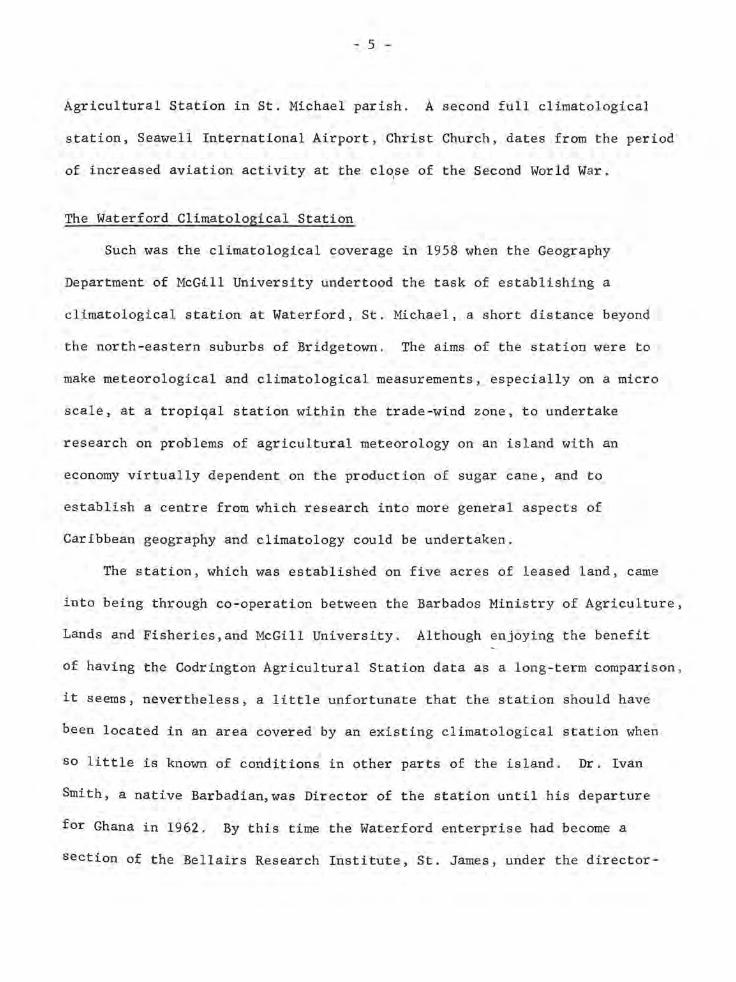
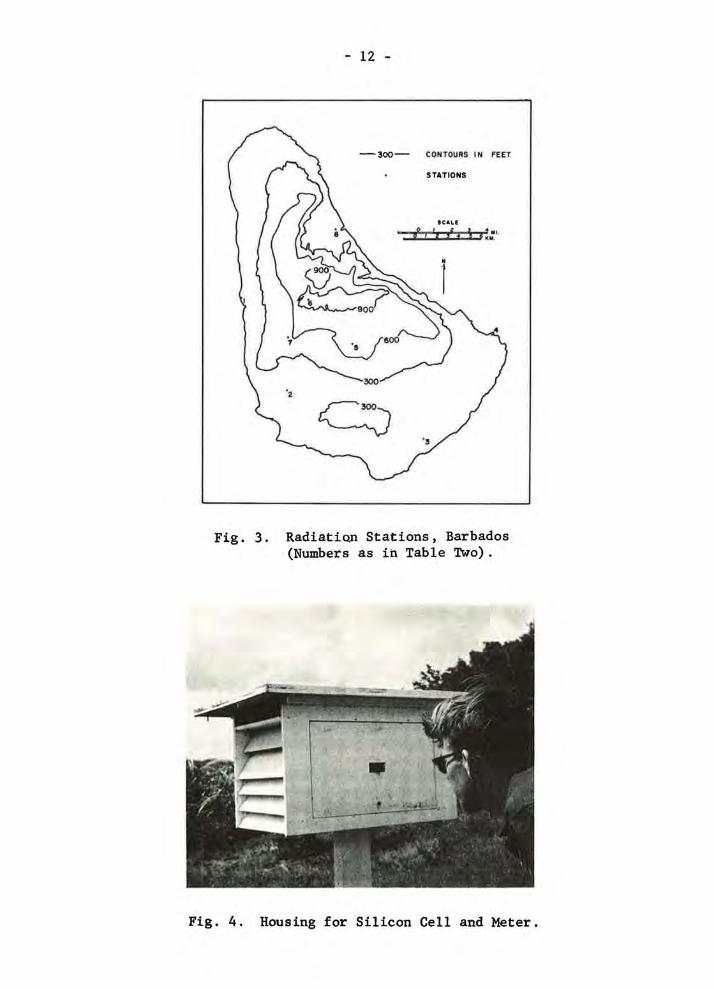
Fig. 3. Radiation Stations, Barbados (Numbers as in Table Two).
Fig. 4. Housing for Silicon Cell and Meter.

- 13 -
(e) Solar Radiation
Prior to the author's own studies , radiation records of a broken nature
were available for only two stations on the island: (a) the Brace Experiment
Station where records were kept only during periods of experimentation with
solar cooking devices; and (b) the Waterford Climatological Station where
the pyranometer was situated on the roof of the nearby Combermere School
and suffered from an almost total disregard of the frequent re-calibration
needed for such an instrument.
Table Two gives details of the eight solar radiation stations which
were in operation for varying periods between August 1st , 1964 and May 31st,
1965.
The positions of the various stations are shown on Fig. 3. The
sites were chosen in an attempt to cover all sections of the island,
from the cloudy, rainy airea largely above 900 feet (represented by Mt.
Misery, 1070 feet) which has a mean annual rainfall of 72-78 inches through
the intermediate areas (Groves Agricultural Station, 790 feet , 65-71 inches
mean annual rainfall), to the less cloudy, drier areas of the south-east
(Seawell Aiport, 170 feet, 40-50 inches mean annual ra~nfall). Brace
Experiment Station represented a west coast location and Ragged Point Light
house fulfilled a similar role on the east coast.
Instrumentation consisted of silicon-cell ampere-hour meter combinations
housed in a specially-built box (Fig. 4). The instruments were calibrated
at the Brace Experiment Station before being taken out into the field.
Early calibration results and a description of the instrument are to be
found in Whillier and Tout (1965). Problems of organization were many in

- 14 -
a study of this nature, which attempted to obtain daily values of total
solar radiation on a horizontal surface from eight reporting stations,
but nevertheless a considerable volume of reliable data was obtained.
As expected, the areas with highest values of mean daily radiation
were found to lie in the south-eastern parts of the island. Little
difference was noted in radiation received at Ragged Point, directly on
the east coast, and at Seawell Airport, a little way inland from the south
east coast. In October, 1964, for example, Ragged Point had a mean value
of 442 langleys daily whereas Seawell recorded 458 langleys, while in April
1965, the mean daily figure at Ragged Pt. was 590 langleys and at Seawell
584 langleys. A consideration of the areal cloud patterns ~ill throw light
on the reasons why radiation values vary widely over the island. In the
region of Rugged Point clouds tend to form over the upland areas to the
west and the coast itself remains comparatively clear. Similarly at Seawell
Airport clouds are frequently seen over the uplands to the north while the
lowlands of the south-east are much more free of cloud. By contrast the
radiation record at Walkers, commenced on March 4, 1965, indicates that
radiation values were lower than those in the south-east. In April, 1965,
for example, the mean daily value at Walkers was 528 langleys, as opposed
to the figures already given for Seawell and Ragged Point. Cloud building
up over the Scotland District to the west would probably account for these
lower values. An indication of the radiation range on the island is given
by the figures in Table Three.

TABLE TWO
Details of Solar Radiation Station Network
Altitude Rainfall Solar in Area* Radiation Beginning of
Parish Feet (in ins.) Operated by: Station No. Record**
Brace Experiment Station St. James Coast 51-57 D. G. Tout 51 Aug. 1, 1964
Waterford St. Michael 130 40-50 V. Gibbs ) 52 Sept. 9, 1964 D. G. Tout)
Seawell Airport Christ Church 170 40-50 Met. Office Staff 53 Aug. 28, 1964 f--' V1
Ragged Pt. Lighthouse St. Philip 120 40-50 Mr. Wilson 54 Sept. 3, 1964
Groves Agric. Station St. George 790 6,5 -71 Mr. Walker 55 Aug. 29, 1964
Mt. Misery St: Thomas 1,070 72-78 Mr. Francis 56 Dec. 12, 1964
Edge Hill St. Thomas 480 58-64 Mr . Hudson 57 Feb. 20, 1965
Walkers St. Andrew 240 40-50 Mr. Grant 58 Mar. 4, 1965
* Taken from the map of mean annual rainfall in Rouse (1962) but with amended lowest category.
** Records closed on May 31, 1965, except for Seawell Airport whose record terminated on May 13.

- 16 -
TABLE THREE
Mean Total Solar Radiation in Langleys, May - June, 1965
May, 1965 June, 1965
Ragged Pt. 578 578
Groves 430 450
Mt. Misery 474 473
Other Features of the Climate
(a) Hurricanes
In most years Barbados lies to the south of the main hurricane tracks
but, on average, about once in 50 years a hurricane will pass over the
island. The last one, "Janet", in September, 1955 , was the first recorded
during the twentieth century. Any hurricane in the vicinity, however, will
affect the weather on Barbados, giving increased cloudiness and rainfall.
This was well seen at the end of September, 1963, when hurricane "Edith"
moving to the north and hurricane "Flora" passing to the south brought
inclement weather to the island within the space of a jew days.
(b) Sea Surges
During the northern winter heavy seas are occasionally experienced on
the shores of Barbados. These are the result of storms in the North Atlantic
taking a southerly course and the northerly winds in the rear portion of . the
storm creating a sea surge which sweeps into the eastern Caribbean. The
local weather remains fine during these surges.

- 17 -
Sununary
The most meaningful division of the climatic year in Barbados is in
terms of a rainy season and a dry season, the intensity and duration of
which depends on location within the island. Temperature differences are
small from month to month and from region to region although diurnal ranges
may reach 20 po on oCcasion. Radiation, cloudiness and sunshine, however,
vary with location. The upland areas stand out as relatively more cloudy
and rainy thap the lowlands. But everywhere, even in the rainy season,
tbe accent is on quiet~ s~nny, weather occasionally disturbed by a brief,
but intense, rainshower. The passage of a disturbance approaching
hurricane strength is very much the exception rather than the rule.
Acknowledgements
Sincere thanks are extended to Professors Lloyd, Garnier and Hills
who made it possible for the author to experience the climate of Barbados
at first hand, and to thQse named in Table Two who willingly helped maintain
the network of radiation stations.
References
McIntosh, A. 1934:: "Sugar cane growth measurements in Barbados", Barbados Agricultural Journal, Vol. 3, pp. 9-19.
Rouse, W. 1962: · "The moisture balance of Barbados and its influence on sugar · cane yield", M.Sc. Thesis, Department of Geography, McGill University, Montreal. (Published in "Two Studies in Barbadi<;ln Climat9logy" - see below).
Rouse, W. and Watts, D. 1966: "Two studies in Barbadian climatology", Climatological Research Series, No.1, July, Department of Geography, McGill University, Montreal.
Tout, D. G. 1967: "An analysis of the 1964 solar radiation record at the Brace Experiment Station, St. James, Barbados", Climatological Bulletin No.2, July, Department of Geography, McGill University, Montreal.

- 18 -
RECENT DEVELOPMENTS IN THE McGILL UNIVERSITY CLIMATOLOGY PROGRAMME IN BARBADOS
by
B. J. Garnier-""
The re-organisation of the observing site at Waterford, Barbados (fig. 1)
referred to in the preceding article of this Bulletin, has been made primarily
in order to integrate the work in Barbados more closely with the overall
programme in climatology within the Department of Geography at McGill
University itself. The latter programme is currently concentrating on
microclimatology (Garnier, 1967). One of its principal aims is to use the
field stations at (a) Knob Lake, Schefferville, (b) Mont Ste. Hilaire,
Quebec, and (c) Waterford, Barbados, as laboratories for examining the role
of the surface in the total energy and moisture budgets under differing
atmospheric states in different climatic regions. This involves measuring
the inter-connection between such physical parameters as slope, aspect,
soil properties, and vegetation on the one hand, ~nd energy fluxes and
prevailing atmospheric circumstances on the other, with a view to establishing
models whereby the two may be linked.
A first step in such a programme is to measure the radiation and
energy balances at selected locations and to map their topographic variations
* B. J. Garnier is Professor of Climatology at McGill University.

- 19 -
Fig. 1. Re-organising the site at Waterford, Barbados.
N
r SCA ....
0 ! 3 • 1 Wl.. 0 J • • • .....
. COTTAO! PLA~TATION
Fig. 2. Location of Observing Stations for Energy Budget Measurements.

- 20 -
by reference to the character of the surface geometry.* It is on work of
this nature that the programme in Barbados will concentrate in the immediate
future.
With this aim in view, the instrumentation at Waterford has been
improved to enable the necessary energy parameters to be measured and three
new stations are being added to the observation network to be used during
a period of intensive observations planned to start in July 1968, and to
last about eighteen months. The three new stations are at Seawell Inter-
national Airport (in co-operation with the Barbados Meteorological Service),
at Greenlands and on Cottage Plantation (Fig. 2). Observations from these
sites, in conjunction with those from Waterford, will make it possible to
sample the contrasts between the regions of windward (east) and leeward
(west) exposure, and between the coast and the interior. Since each site
will consist of generally similar grassed plots they will permit direct
comparison of energy budget variations between sites differing only in
location, aspect, and elevation.
Standard methods will be used to measure the various parameters of the
energy budget. Net radiation, for example .. will be ~easured by battery-
operated net radiometers.
A battery-operated recording system will also be used to measure heat
fluxes in the ground at Waterford, and a similar instrument will be used
* A brief reference to the formulae and procedures involved in this will be found elsewhere in this Bulletin (Ohmura, 1968). More substantive accounts are currently being prepared for publication elsewhere.

- 21 -
in succession at the other three sites. At the latter there will also be
soilheat flow plates read at hourly intervals during periods of especially
detailed observations and twice-daily at other times. Continuous records
of ground temperature will be made by mercury in steel recording thermometers
inserted one centimetre below the ground surface, while temperature and
humidity profiles above ground will be measured by shielded wet and dry
thermocouples using battery-operated recorders.
The general organisation of the programme will be such as to provide
short periods of intensive study against a background of continuing routine
observations. Thus, each station will also be equipped with the standard
instruments for measuring wet and dry bulb temperatures, wind speed,
evaporation, and rainfall. At each station there will also be a bi-metallic
recording actinograph. This arrangement will not only enable the different
climatic seasons to be sampled in detail, but will also provide a means
for examining the efficacy of using the records from standard instruments
read once, or at most twice, daily for estimating the heat budget in the
context of a tropical island in a humid, trade-wind environment.
The value of a programme of this nature will be greatly increased by
the fact that it will coincide with a period of detailed surface/air energy
studies being organized by Professor Garstang of Florida Station University
during the summer of 1968 and 1969.* The particular programme described
in this short article, therefore, will contribute towards the concerted
* An account of this programme, together with more information on the MCGill contribution, is expected to appear shortly in the Bulletin of the American Meteorological Society.

- 22 -
efforts which will soon be made in Barbados to understand the interface
characteristics of a small island of varied slopes, surfaces, and aspects
within the moist trade wind air stream. By approaching the matter
geographically in terms of the varying inter-connections between the land
and the air under different atmospheric states, it is hoped that current
developments in the McGill University programme of climatology in Barbados
will help to achieve a better understanding of the response of different
parts of the island to the large-scale, steady-state attack of trade wind
conditions, or to the influx of meso-scale synoptic disturbances, or to
contrasting solar energy situations. Such knowledge may then be put to
work to evaluate conditions not only in other parts of the Caribbean, but
also elsewhere. It may thus be possible to estimate the microclimatology
of other tropical islands by a knowledge of surface character and prevailing
atmospheric conditions. Such an achievement will be valuable both
scientifically and as a contribution towards a better understand of
environmental characteristics important to the economic development of
many parts of the underdeveloped world.
References
Garnier, B. J. 1967: iiClimatology at McGill University", Climat.Bull., No.1 (McGill University), pp. 1-8.
Ohmura, Atsumu, 1968: liThe Computation of Direct Insolation on a Slope", Climat. Bull., No. 3(McGill University), pp. 42-53.
- 23 -
MEASUREMENTS OF AERIAL SALT ON THE COAST OF BARBADOS
by
R. E. Randall *
During the period May to September, 1967, and again in December, 1967,
a study was made of the coastal environments and vegetation of Barbados.
Part of the environmental research included the measurement of aerial
salt particles since these were thought to be a major factor in the dis-
tribution of vegetation. The importance of salt and the response to it
by plants are described by Boyce (1954),
Apparatus
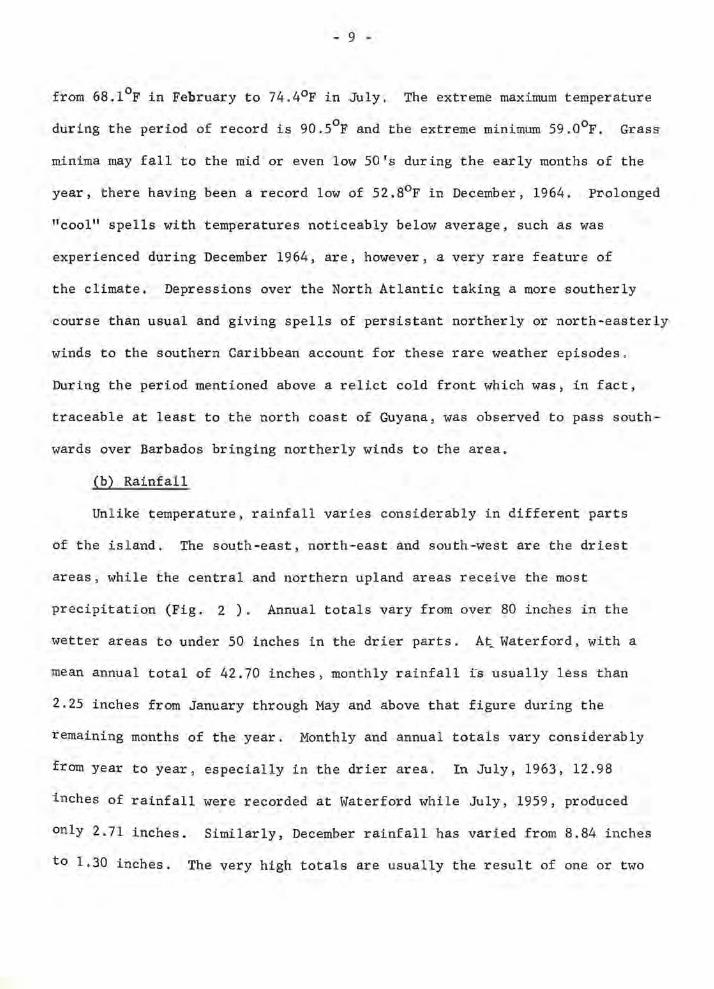
In order to measure the aerial salt ten instruments, modified from
the design of Hudson (1963), were constructed. Each was composed of a
stand (which was, in fact , an evaporimeter box), from which projected a
square piece of 'G1ass1ite' measuring 2 ft by 2 ft, and held firm against
the wind at its outer edge by a cord joined to a weight on the ground
(Fig. l(a)). This acted as a protection from rain but was not large
enough to cause serious wind interference. Under the 'G1ass1ite', and
also connected to the stand, was a wooden supporting strip into which
two hooks were screwed. A piece of washed towelling, one foot square,
* R. E. Randall is a graduate of Cambridge University currently carrying out research at McGill University prior to returning to Cambridge for doctoral studies in October, 1968.

(a)
(b)
- 24 -
TIlI,"_
l'U:Ast: 110:1' IIrl"
Fig. 1 . Aerial Salt Measurement Techniques (a) Type of Instrument; (b) Line-up of Instruments.

--- 25 -
with tabs at each corner, was suspended from these hooks and weighted at
the bottom by a piece of wood also containing two hooks.
The amount of salt present on exposed towels was discovered by
p1aciqg them separately in jars containing 300 ccs of distilled water
and pummelling thoroughly to force out the salt particles. The solution
was then measured on a Lock Conductivity Bridge and t he result recorded
. . h"~ . ~n m~crom os per cent~metre.
Method
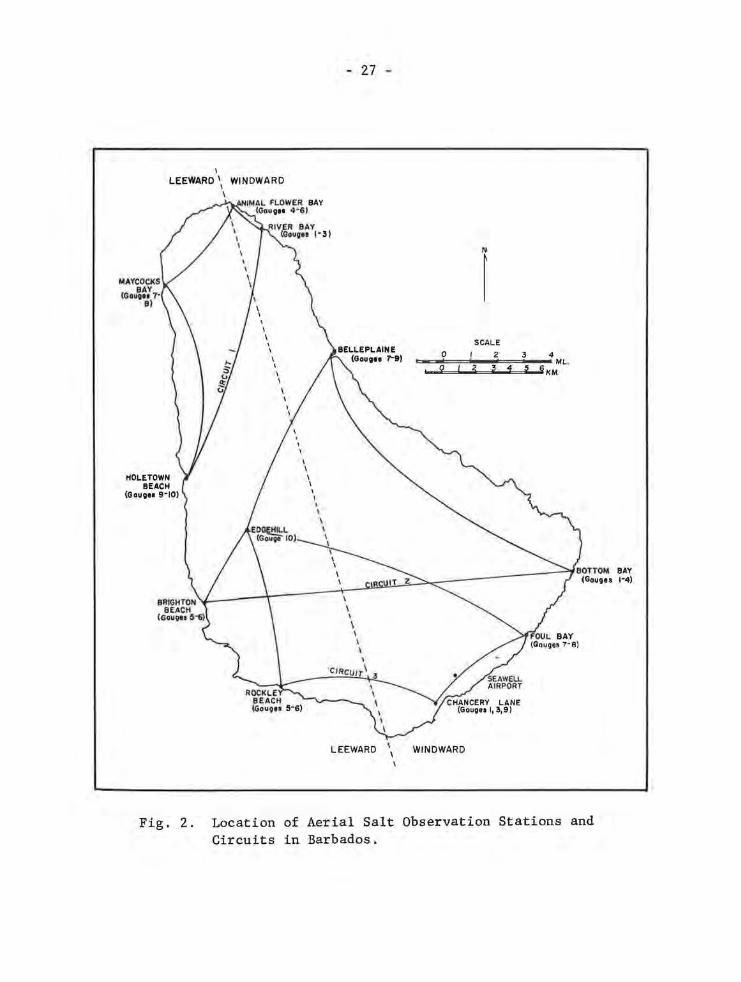
The instruments were used by devising three circuits, each covering
approximately one-third of the island's coasts, and each including
selected windward and leeward points. At each point two or more instruments
were set up (,rab1e l) with the towelling positioned to face squarely into
the prevailing trade wind . The instruments were placed in line as shown
in fig. l(b). They were located at a known distance from the coast in
order to measure the change in salt content with distance from the sea.
The first circuit covered the northern part of the island, the second
included the central part both east and west while the third was along
-the south coast (Fig. 2). Circ.uits two and three included a central
station inland at Edgehill. Towels were replaced every 24 or 48 hours.
The replacement was made at the same time for each stat.ion and took place
between 4.30 p.m. and 5.30 p.m . when the wind speed tends to be lower
than during the day. On each circuit readings were taken for more than
one week and a variety of weather conditions were included. During the
~'\: One micromho is the conductance of a body having a resistance of one micro-ohm.
- 26 -
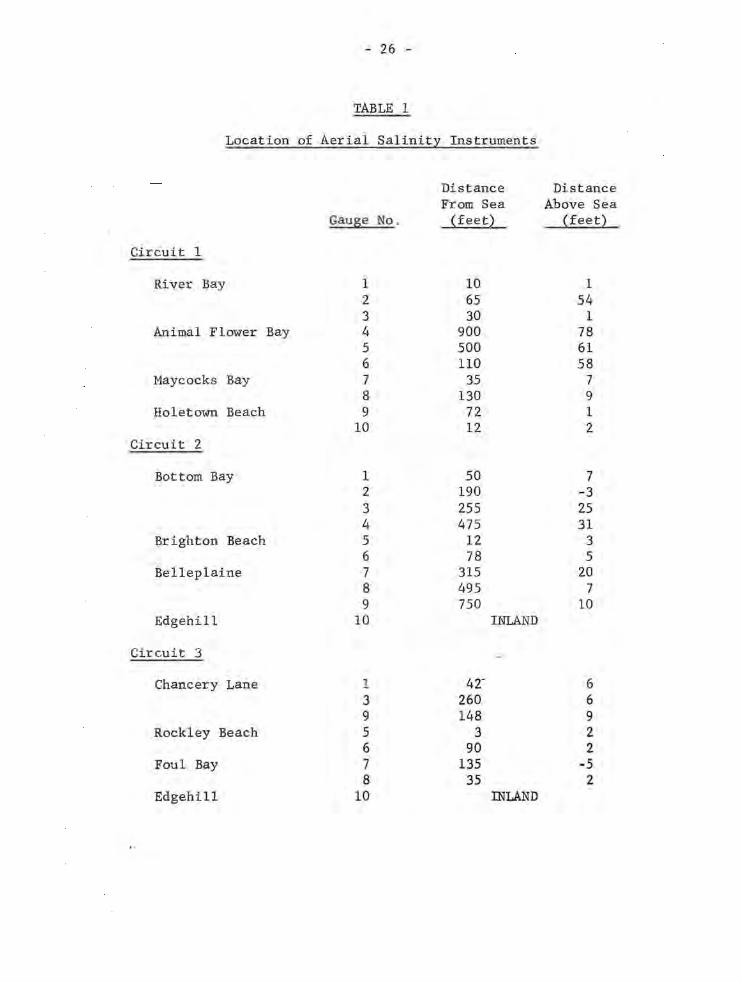
TABLE 1
Location of Aerial Salinity Instruments
Distance Distance Fr om Sea Above Sea
Gauge No . (feet) (feet)
Circuit 1
River Bay 1 10 1 2 65 54 3 30 1
Animal Flower Bay 4 900 78 5 500 61 6 110 58
Maycocks Bay 7 35 7 8 130 9
Ho1etown Beach 9 72 1 10 12 2
Circuit 2
Bottom Bay 1 50 7 2 190 -3 3 255 25 4 475 31
Brighton Beach 5 12 3 6 78 5
Be11ep1aine 7 315 20 8 495 7 9 750 10
Edgehi11 10 INLAND
Circ.uit 3
Chancery Lane 1 42- 6 3 260 6 9 148 9
Rockley Beach 5 3 2 6 90 2
Foul Bay 7 135 -5 8 35 2
Edgehill 10 INLAND
\
LEEWARD \ WINDWARD \
MAYCOCl(S BAY
(00.0" 7· 8)
HOLETOWN BEACH
(GoUO" 9-10)
\
- 27 -
\ \
\ \ \ \ \
·CIRCUIT \ 3
LEEWARD \
1 SCALE
t=-"""~?=;=,,!! !",,"~2=:=,3~~4 ML. o 2 3 4 5 6 KM
WINDWARD
Fig. 2. Location of Aerial Salt Observation Stations and Circuits in Barbados.

- 28 -
time when records were being taken, windspeeds from the anemometer at
Seawell Airport were calculated for the same 24 and 48 hour periods.
This anemometer is situated at 10 meters above ground level and is thus
free from ground interference. Also, each day during the experiment the
amplitude of the ocean waves in relation to the wind speed was noted.
Results
The results of this work are given in Tables Two to Seven, which appear
at the end of this article. In most cases there is a decrease in salinity
with increase in distance from the sea, suggesting that the ground surface
acts as a roughness parameter causing a decrease in windspeed and a con
sequent loss of airborne salt particles. This relationship does not hold
true for Bottom Bay, Circuit TWo, however, where excessively low readings
are recorded for gauge No.2. This is because the gauge is situated in
a protected pocket at the foot of a cliff behind a dune. It will be
seen that on the leeward coast, as illustrated by the values for Brighton,
Ho1etown, Maycocks and Rockley, the salt levels are considerably lower
than to windward, and the fall-off rate is much less. This shows that
the major source of salt particles is from the trad~ winds which blow
from the windward side of the island, and not from the adjacent waves.
This point is further emphasized by the small difference in salt levels
between Edgehi11 in the centre of the island and the gauges on the leeward
coast. However, at all stations on the leeward coast locally derived
salt is just enough to give a higher reading at the seaward gauge. At
certain times, particularly during winds associated with hurricane
- 29 -
disturbances such as Beulah in September, 1967, and also during storm
swells such as in late November and early December, 1967, the leeward
coast may receive large amounts of locally derived salt particles which
have considerable effect upon the vegetation and mask the importance
of the trade winds.
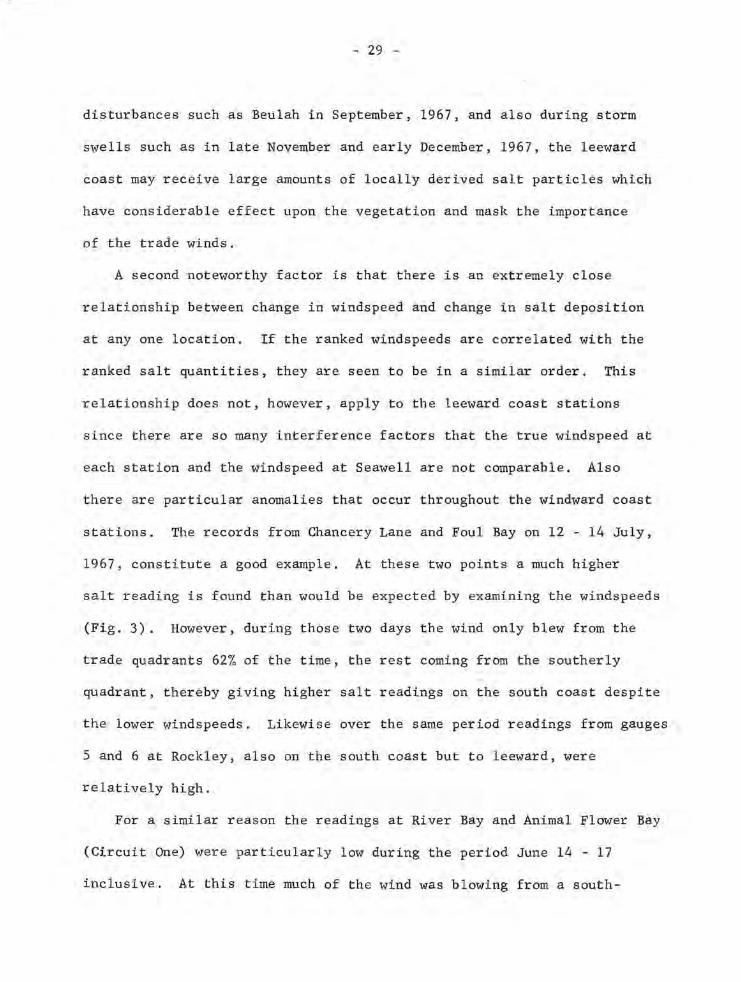
A second noteworthy factor is that there is an extremely close
relationship between change in windspeed and change in salt deposition
at anyone location. If the ranked windspeeds are correlated with the
ranked salt quantities, they are seen to be in a similar order. This
relationship does not, however, apply to the leeward coast stations
since there are so many interference factors that the true windspeed at
each station and the windspeed at Seawell are not comparable. Also
there are particular anomalies that occur throughout the windward coast
stations. The records from Chancery Lane and Foul Bay on 12 - 14 July,
1967, constitute a good example. At these two points a much higher
salt reading is found than would be expected by examining the windspeeds
(Fig. 3). However, during those two days the wind only blew from the
trade quadrants 62% of the time, the rest coming from the southerly
quadrant, thereby giving higher salt readings on the south coast despite
the lower windspeeds. Likewise over the same period readings from gauges
5 and 6 at Rockley, also on the south coast but to leeward, were
relatively high.
For a similar reason the readings at River Bay and Animal Flower Bay
(Circuit One) were particularly low during the period June 14 - 17
inclusive. At this time much of the wind was blowing from a south-

- 30 -
easterly direction. The masking effect of wave amplitude is illustrated
over the period June 11 - 13 (Circuit One), when seas began to rise as
the wind died down. This resulted in much higher salt figures on June 13
than June 9 when the sea was low despite the higher windspeed on the
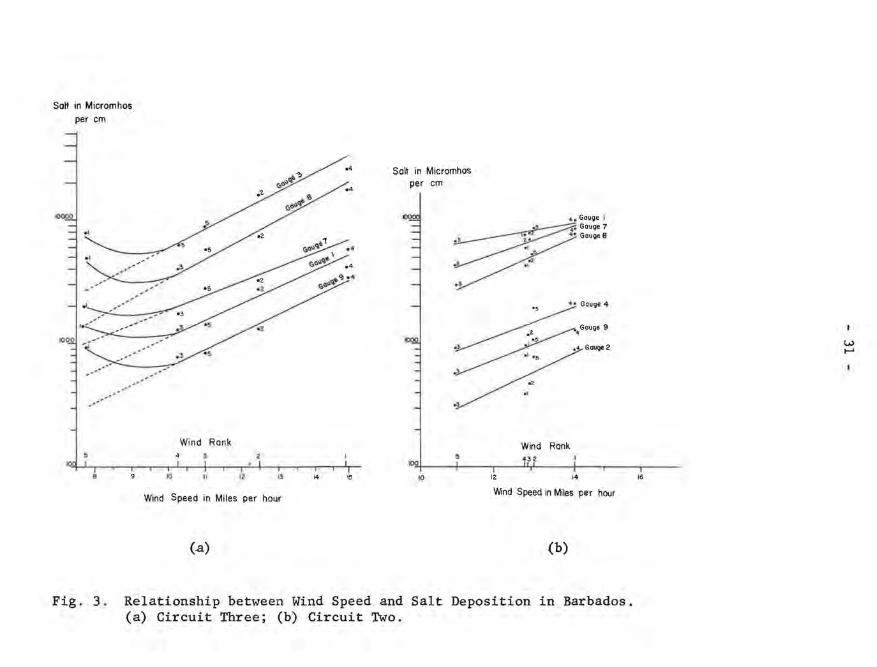
latter date. It will be seen from a graph of windspeeds and windward
coast salt measurements for Circuit two (Fig. 3), th~t when the wind
is always from the same direction and when the wave amplitude is not at
variance with the winds peed there is a log relationship between windspeed
and salt deposition. The general reliability of these figures is also
shown in Fig. 3. Collection period 5 at each gauge g~ves results
higher than expected. This coincides with high seas on July 3 - 5.
Conversely, all figures from collection period 1 are lower than expected
and coincide with low seas on June 21 - 23.
It is suggested that in further experiments of this type it might
be more useful to devise an instrument in which the towel is exposed
in all directions. This could be achieved by wrapping the towel around
a tin through which a pole could be passed. This pole would then be
fixed in the ground and have a protective screen fixed horizontally to
the top. Changes of the towelling could be easily effected by removing
the screen and lifting off the tin. In this way readings closer to
reality would be obtained whatever the wind direction.
Acknowledgements
I would like to thank Colin Hudson, the staff of Seawell Airport
Meteorological Office, and the Sugar Producers Agronomy Research Unit
Salt in Mieromhos
per em
.' .' .. -
Wind Rank
Salt in Mieromhos per em
~~~~~:~ ~GaUge8
~ .'
.2
Wind Rank
OO~ ____ ~ ____ ~ __ -U~ ____ -r __ -' ____ -' ____ __ 8
Fig. 3 .
10 01 14 15 10 12 14
Wind Speed in Miles per hour Wind Speed in Miles per hour
(a) (b)
Relationship between Wind Speed and Salt Deposition in Barbados. (a) Circuit Three; (b) Circuit Two.
16
- 32 -
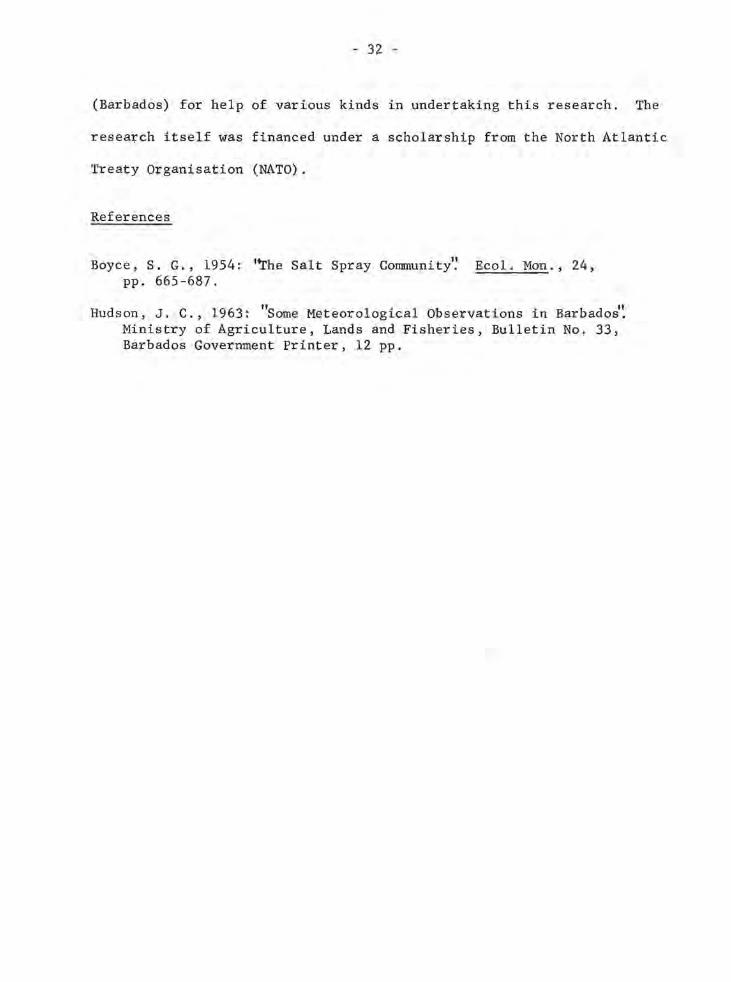
(Barbados) for help of various kinds in undertaking this research. The
research itself was financed under a scholarship from the North Atlantic
Treaty Organisation (NATO).
References
Boyce, S. G., 1954: "rhe Salt Spray Community': Ecol. Mon., 24, pp. 665-687.
Hudson, J. C., 1963: "Some Meteorological Observations in Barbados'~ Ministry of Agriculture, Lands and Fisheries, Bulletin No. 33, Barbados Government Printer, 12 pp.
- 33 -
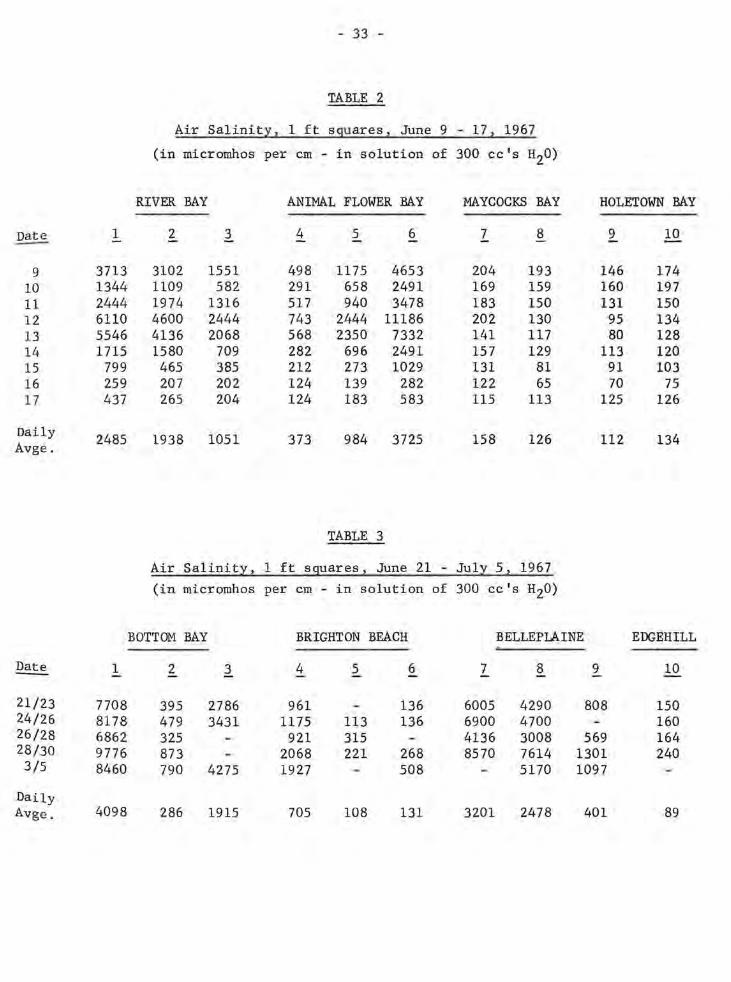
TABLE 2
Air Sa1init~z 1 ft sguares z June 9 - 17 z 1967
(in mieromhos per em - in solution of 300 ee's H2O)
RIVER BAY ANIMAL FLOWER BAY MAYCOCKS BAY HOLETOWN BAY
~ 1 2 3 4 5 6 7 8 9 10
9 3713 3102 1551 498 1175 4653 204 193 146 174 10 1344 1109 582 291 658 2491 169 159 160 197 11 2444 1974 1316 517 940 3478 183 150 131 150 12 6110 4600 2444 743 2444 11186 202 130 95 134 13 5546 4136 2068 568 2350 7332 141 117 80 128 14 1715 1580 709 282 696 2491 157 129 113 120 15 799 465 385 212 273 1029 131 81 91 103 16 259 207 202 124 139 282 122 65 70 75 17 437 265 204 124 183 583 115 113 125 126
Daily 2485 1938 1051 373 984 3725 158 126 112 134 Avge.
TABLE 3
Air Salinit~z 1 ft sguares z June 21 - July 5 z 1967
(in mieromhos per em - in solution of 300 ee's H2O)
BOTTOM BAY BRIGHTON BEACH BELLEPLAINE EDGEHILL
~ 1 2 3 4 5 6 7 8 9 10
21/23 7708 395 2786 961 136 6005 4290 808 150 24/26 8178 479 3431 1175 113 136 6900 4700 160 26/28 6862 325 921 315 4136 3008 569 164 28/30 9776 873 2068 221 268 8570 7614 1301 240 3/5 8460 790 4275 1927 508 5170 1097
Daily Avge. 4098 286 1915 705 108 131 3201 2478 401 89

- 34 -
TABLE 4
Air Sa1init~z 1 ft sguares! Ju1~ 12 - 30 z 1967
(in micromhos per cm - in solution of 300 ccls H2O)
CHANCERY LANE ROCKLEY FOUL BAY EDGEHILL BEACH
Date 1 3 9 5 6 7 8
12/14 1363 7614 912 508 249 1974 4888 14/16 2773 15745 1326 306 228 3431 7332 16/18 1287 6486 761 202 124 1786 3901 18/20 4089 26380 3290 348 263 5557 17426 28/30 1410 8554 846 508 268 2773 5625
Daily 1092 6378 714 187 113 1552 3917 Avge.
TABLE 5
Winds at Seawell Airport during Salinity Measurements Circuit 1, June 8 - 17, 1967
Percent from Wave Amplitude Wind Trade in relation to
Date Speed Rank Quadrants Wind Speed
8/9 12.92 2 100 L 9/10 9.08 5 100 M
10/11 8.92 6 92 H 11/12 14.50 1 100 L 12/13 12.63 3 100 M 13/14 9.21 4 100 H 14/15 7.42 7 83 M 15/16 4.71 9 50 M 16/17 6.04 8 92 H
10
249 308
235 114
113

- 35 -
TABLE 6
Winds at Seawell Airport during Salinity Measurements Circuit 2, June 21 - July 5, 1967
Percent from Wave Ampli tude Wind Trade in relation to
Date Speed Rank Quadrants Wind Speed
21/23 12.85 4 100 L 24/26 12 . 93 3 100 M 26/28 10.95 5 100 M 28/30 14.20 1 100 H 3/5 13.08 2 100 M
TABLE 7
Winds at Seawell Airport during Salinity Measurements Circuit 3, July 12 - 30, 1967
Percent from Wave Amplitude Wind Trade in relation to
Date Speed Rank Quadrants Wind Speed
12/14 7.72 5 62 L 14/16 12.45 2 100 M 16/18 10.27 4 100 M 18/20 14.91 1 100 L 28/30 11.00 3 100 M
- 36 -
SOME RESULTS OF A PILOT STUDY OF THE URBAN CLIMATE IN MONTREAL
by
Tim R. Oke*
In comparison with other surfaces, the city has received very little
attention in climatology. Previous studies have been concerned with the
effects of the city and its environment upon individual climatic elements.
The influence of the city in attenuating solar radiation and increasing
air temperature has attracted the most interest.
The changes in these climatic elements brought about by the city's
surface character, are really a reflection of changes in the radiation and
energy balances associated with an urban environment. The relative magni-
tude of the components comprising these balances has not yet been explored
(Munn, 1965). Similarly the vertical extent of the city's influence remains
an area for research.
The programme of studies in urban climate now developing in the
Department of Geography at McGill University, may be conveniently divided
into two long-term projects:
1. energy balance studies - concerned with evaluating the relative
magnitude of the component fluxes in the radiation and energy
balances associated with urban surfaces; and
2. a study of Montreal's urban heat island - an attempt to combine
* T. R. Oke is Assistant Professor of Climatology in the Department of Geography at McGill University.

- 37 -
both horizontal and vertical temperature measurements in a
three-dimensional model of the heat island under different
cloud, wind, and stability conditions.
The observational programme will include both helicopter soundings and
automobile traverses. The former, which will be made in co-operation with
Professor Conrad East of the University of Montreal, will make it possible
to obtain temperatures at nine locations at a number of levels over Montreal.
Automobile traverses are at present being undertaken as pilot investigations
to discover some of the more important features of the Montreal heat island.
This work will be used to help select the location of stations for later
research.
The pilot investigations by means of automobile traverses are being
carried out by a group of graduate and undergraduate honours students in
geography as a class exercise in climatology.* The area of the city under
study is broken down into sectors, each of which may be conveniently covered
by an automobile in a two-hour period. All teams meet at a central location
and then disperse and take readings throughout their assigned sectors. All
teams re-assemble at the starting point at the end of -the period. This
-procedure makes it possible to correct the results by a simple "error of
closure technique" to offset the synoptic temperature change during the
observation period. In this manner six teams can obtain in excess of 125
* Misses S. Boucher and K. Ott, Messrs. B.Banks, B.Basnayake, B. Fanta, P. Grevatt, A. Kirschen, F. Kousaie, S. Munro, M. Polansky, and D. Smith.

LEGEND
__ -2'C __ ISOTHERMS
BUILT UP AREA
ROADS
Scale in Miles
'-'-
/ '-/ '-
DORVAL
AIRPORT
Fig. 1.
)
WATER TEMPERATURE
1°C
The Distribution of Air Temperatures in Montreal on December 5, 1967, at 2100 hours E.S.T.
N
r
w 00

- 39 -
readings in ~ two-hour period.
Fig. 1 is an example of the results of one of these traverses. The
isotherm map illustrates the spatial variation of temperature taken by
means of Assmann psychrometers at a height of one metre above the surface
in central and west Montreal at 2100 hours on December 5, 1967. The
isotherms, which indicate an SCO (14Fo) rural/urban temperature difference,
were drawn by interpolation from 143 point readings. The day of the
observation period was cold and clear with weak ventilation. The ground
was covered with old snow and slush. During the observation period skies
remained clear; winds were from the north-east at about 1.5 m sec-I.
According to the micrometeorological tower at the Botanical Gardens, the
o -1 lowest 60 m was characterised by a weak inversion (+0.006C m ), and ,
therefore, weak stability (Ri = +0.02).
Four points of general interest emerge from Fig. 1.
(a) The urban/rural boundary. The correspondence between the isotherms and
the limits of the built-up area in the west are very apparent (e.g. the -6Co
isotherm almost traces the urban outline). This leeward boundary of the
heat island is almost cliff-like in gradient, similar ~o an effect noted
by Chandler (1965). There is a 6Co change in temperature in lsOOm (lIFo in
one mile) in the Cote Saint Luc area. This is a sharper gradient than is
found at most major fronts and thus one could postulate the existence of
thermally induced winds, similar in nature to sea breezes, blowing across
the tliffs' of the urban heat island. Dorval Airport appears to produce a
slight warming influence of about 2Co . A similar observation was noted by
Summers (1964), who felt it may be due to the runways releasing heat absorbed

- 40 -
during the previous day.
(b) Saint Lawrence River. The surface of the river remained unfrozen
during the observation period, at a temperature of about loC (St. Lambert
Dock). This relatively warm influence is brought out by the way the
isotherms parallel the shoreline.
(c) Heat Island Core. The core area of the heat island was not as well
defined on this occasion as it has been on some other surveys undertaken
in the current series. Usually the core is centred on the downtown high
rise building complex, marked as X on Fig. 1. With the north-east wind on
December 5, 1967, however, the core has become discontinuous and displaced
south-westwards into Verdun, although an examination of the soiling index
(COH) values at this time did not indicate that the pollution cover had also
shifted into the same area. Further studies will be made in Verdun to see
if the industrial development there gives rise to a secondary heat core.
(d) Mount Royal Park. Fig. 1 shows that adjacent to the core area there
is a 'cold spot' associated with Mount Royal. This has been a marked
feature of all the traverses to date. There are two reasons for this
cooling. Firstly, the area is open and vegetated, and secondly, the park
rises to 150m above the surrounding city. The use ot potential temperature
could eliminate this altitude effect.
Surveys of this type are continuing under different weather conditions.
It is hoped that the area of observation will be extended with the develop
ment of automatic recorders for one or two automobiles.

- 41 -
Acknowledgements
Thanks are due to the Montreal Health Department and the Department of
Transport, Meteorological Branch, for supplying the COH and micrometeorologica1
tower data.
References
Chandler, T. J., 1965: "The Climate of London", Hutchinson.
Munn, R. E., 1966: "Descriptive Micrometeoro1ogy", Academic Press.
Sunnners, P. W., 1964: "An urban ventilation model applied to Montreal", ph.D. Thesis, McGill University.

- 42 -
THE COMPUTATION OF DIRECT INSOLATION ON A SLOPE
by
Atsumu Ohmura*
1. Introduction
The contribution of direct insolation is of great importance to the
microclimatological study of the heat budget at the surface of the ground, \
mainly for two reasons. Firstly, among the terms of the heat budget equation ,
heat exchange by radiation yields a large value and direct insolation is of
primary importance among the five terms which comprise the radiation term.
Secondly , direct insolation is more liable to be influenced by the topographic
features of the ground than the other terms. Therefore, in order to study
the heat budget on the actual surface of the ground, the evaluation of
direct insolation must be the first element to be considered.
Several studies of this kind have already been attempted, of which the
works of Kondrat'yev (1965) and Lee (1963) are typical. The equation used
by Kondrat'yev is only useful for the calculation of instantaneous values.
To make the equation effective , consideration of variations in the relation
between the direction of a slope and that of the sun must be added , and this
is usually an enormous calculation. Lee (1963) used an equation devised by
* Atsumu Ohmura is a graduate of Tokyo University . He is at present Research Assistant in Climatology at McGill University (Department of Geography).

- 43 -
Okanoue to integrate direct insolation for a certain time period. However,
the equation, unfortunately, does not take into account the existence of
the atmosphere. Neither of these equations is, therefore, suitable for this
study because the value wanted is the total for certain time periods under
different atmospheric states. For this purpose an equation has been developed
in which the transmissivity of the atmosphere is taken into account.
2. The Elements of the Equation
The instantaneous value of direct insolation on a slope can be expressed
by
where Is is the instantaneous value of direct insolation on the slope,
~ A denotes a unit vector normal to the slope,
-:; S is a unit vector expressing the direction of the sun,
A is a symbol denoting the angle between the two vectors,
10 is the solar constant = 2.00 1y min-1 (Johnson, 1954),
p is the transmissivity of the atmosphere,
m is the optical airmass.
( 1)
To make the equation practical for computation, it is necessary to
express equation (1) as a function of time. The co-ordinate system which
-) will best express A is the one which is located at the site in question with
the three axes directed to zenith, south and east. A system suitable for
~ the expression of S has the origin in the centre of the earth with three
axes consisting of (a) the polar axis, (b) the axis of the direct line
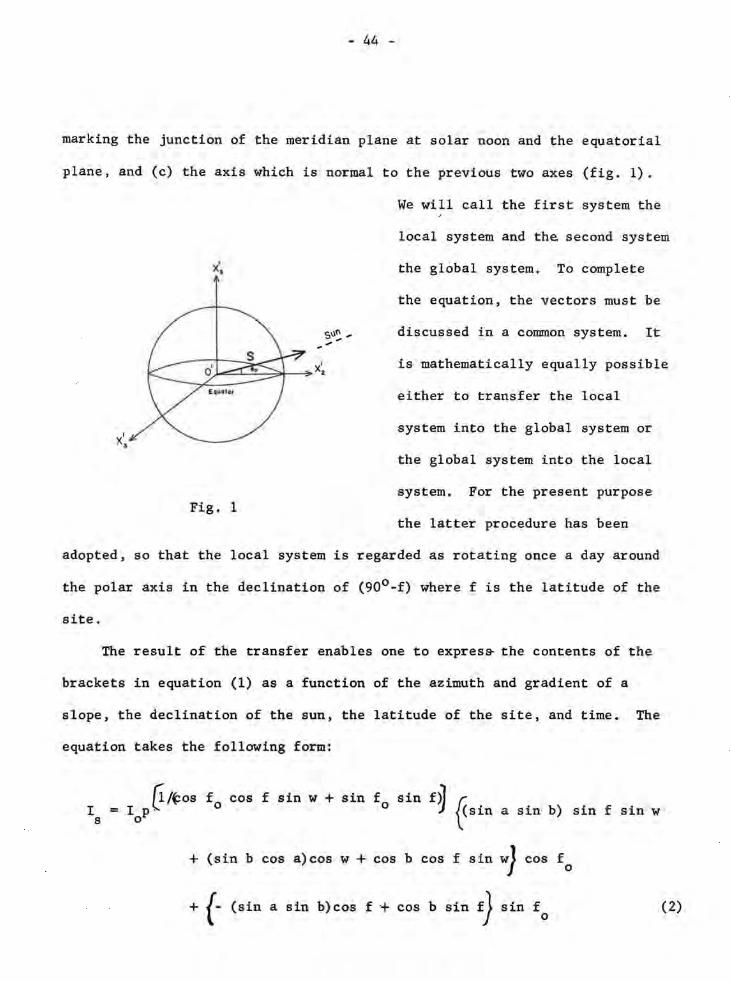
- 44 -
marking the junction of the meridian plane at solar noon and the equatorial
plane, and (c) the axis which is normal to the previous two axes (fig. 1).
We will call the first system the
local system and the second system
X' • the global system. To complete
the equation, the vectors must be
Sll~ ... discussed in a connnon system. It .......
x' ..J-:=-2----:*-~ 2
is mathematically equally possible
I
X.
Fig. 1
either to transfer the local
system into the global system or
the global system into the local
system. For the present purpose
the latter procedure has been
adopted, so that the local system is regarded as rotating once a day around
the polar axis in the declination of (900 -f) where f is the latitude of the
site.
The result of the transfer enables one to expres& the contents of the
brackets in equation (1) as a function of the azimuth and gradient of a
slope, the declination of the sun, the latitude of the site, and time. The
equation takes the following form:
fi./t:os fo cos f sin w + sin fo sin I = I plJ.
S 0 f~ ~Sin a sin b) sin f sin w
+ (sin b cos a)cos w + cos b cos f sin w) cos fo
+ {- (sin a sin b)cos f + cos b sin f) sin fo (2)

- 45 -
where fo is the declination of the sun,
f is the latitude of the site,
w is the hour angle measured in solar time from 6 o'clock,
a is the azimuth of the slope measured from east or west, negatively to north and positively to south,
b is the gradient of the slope measured in relation to the horizontal.
If Id is the daily total direct insolation, then
where wI and w2
are the times of sunrise and sunset respectively.
(3)
Although the mathematical integration of the righ~ hand side of this
equation is not possible, the total of the instantaneous values will give
the same result as the integrated values if a sufficiently short time
period is chosen. Thus,
(4)
where Aw is a sufficiently short time period to obtain the daily total.
3. The Computer Programming
For practical purposes when computing the value for a certain time period
such as a day, it is essential to know what is the maximum interval which
will give the same value correct to the first decimal as is obtained when
using a time interval of one minute. The desired time interval was found
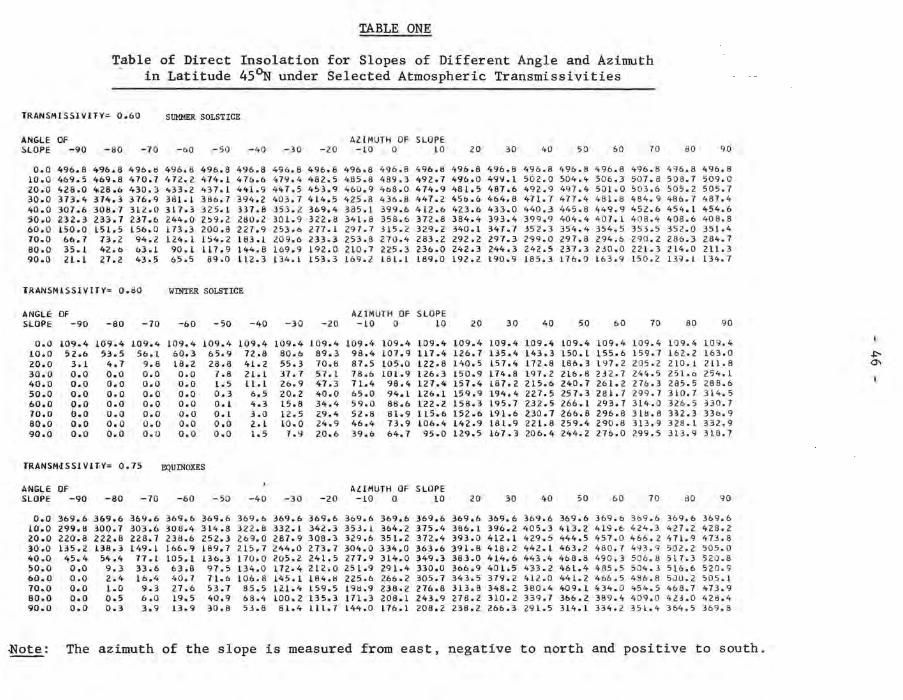
TABLE ONE
Table of Direct Insolation for Slopes of Different Angle and Azimuth in Latitude 4S~ under Selected Atmospheric Transmissivities
TRANSMISSIVITY= 0.60 SUMMER SOLSTICE
ANGLE OF AZIMUTH OF SLOPE SLOPE -90 -80 -70 -60 -50 -40 -30 -20 -LO 0 10 20 30 40 50 60 70 80 90
0.0 496.8 496.8 496.tl 496.8 496.8 496.8 496.8 496.8 496.8 496.8 496.8 496.8 496.8 496.8 496.8 "96.8 "96.8 "90.8 "96.8 10.0 469.5 469.8 470.7 "72.2 "H.l "71>.6 "79.4 482.5 485.8 489.3 492.7 496.0 49~.1 502.0 504.4 506.3 507.8 508.7 509.0 20.0 428.0 4.28.6 430.3 <'33.2 <'37.1 441.9 4 .. 7.5 453.9 460.9 "b8.0 474.9 481.5 487.6 492.9 497 ... 501.0 503.6 505.2 505.7 30.0 373 ... 314.3 376.9 3S1.1 386.7 394.2 403.7 414.5 425.8 ,,36.8 "47.2 450.6 464.8 471.7 477." 481.8 484.9 486.7 487.4 40.0 301.6 308.7 3L2.0 3L 7.3 325.1 337.8 353.2 369.4 385.1 399.6 412.6 423.6 433.0 440.3 445.8 449.9 452.6 454.1 .. 54.6 50.0 232.3 233.7 237.6 2"".0 259.2 280.2 301.9 322.8 341.8 358.6 372.8 384.4 393.4 399.9 404.4 407.1 408.4 408.6 408.8 60.0 150.0 151.5 156.0 L73 .3 200.8 227.9 253.6 277 .1 297.7 3L5.2 329.2 340.1 341.7 352.3 354.4 354.5 353.5 352.0 351.4 10.0 66.7 73.2 94.2 124.1 154.2 183.1 209.6 233.3 253.8 270.4 283.2 292 .2 297.3 299.0 297.8 294.6 290.2 286.3 284.7 80.0 35.L 42.b 63.L 90.1 117.9 1"4.8 169.9 192.0 210.7 225.3 236.0 242.3 244.3 242.5 237.3 230.0 221.3 214.0 211.3 90.0 2L.l 27.2 43.5 65.5 89.0 ll2.3 134.1 153.3 169.2 181.1 189.0 192.2 L90.9 185.3 176.0 163.9 150.2 139.1 134.7
TRANSM ISS1 lillY: 0.80 WINTER SOLSTICE
ANGLE OF AZIMUTH OF SLOPE SLOPE -90 -80 -70 -60 -50 - .. 0 -30 -20 -10 0 10 20 30 40 50 60 70 80 90
0.0 109.4 109.4 L09.4 L09.4 109.4 L09.4 L09.4 L09.4 109.4 L09.4 109.4 L09.4 109.4 109.4 109.4 109.4 109.4 109.4 109.4 10.0 52.6 53.5 56.1 60.3 65.9 12.8 80.6 89.3 98.4 L07.9 117.4 126.7 135.4 L43.3 150.1 155.6 159.7 162.2 163.0 .po. 20.0 3.1 4.7 9.8 18.2 28.8 41.2 55.3 -,o.8 87.5 105.0 122.8 140.5 157.4 172.8 L86.3 197.2 205.2 210.1 2L1. 8 0\
30.0 0.0 0.0 0.0 0.0 7.8 21.L J7.7 57.1 78.0 LOL.9 126.3 150.9 114.8 197.2 216.8 232.7 2"".5 251.6 254. L 40.0 0.0 0.0 0.0 0.0 1.5 1l.1 26.9 47.3 71.4 98.4 127.4 157." 187.2 215.6 240.7 261.2 276.3 285.5 288.6 50.0 0.0 0.0 0.0 0.0 0.3 6.5 20.2 40.0 65.0 94.1 126.1 159.9 194.4 227.5 257.3 281.7 299.7 310.7 314.5 bO.O 0.0 0.0 0.0 0.0 O.L 4.3 15.8 34.4 59.0 8B.6 122.2 158.3 195.7 232.5 266.1 293.7 314.0 326.5 330.7 10.0 0.0 0.0 0.0 0.0 0.1 3.0 12.5 29." 52.8 81.9 ll5.6 152.6 19 L.6 230.7 266.8 296.8 318.8 332.3 33b.9 80.0 0.0 0.0 0.0 0.0 0.0 2.1 10.0 24.9 "6.4 73.9 106.4 142.9 181.9 221.8 259.4 290.6 313.9 328.1 332.9 90.0 0.0 0.0 0.0 0.0 0.0 1.5 7.9 20.b 39.6 64.7 95.0 129.5 107.3 206.4 244.2 276.0 299.5 313.9 318.7
TRANSM.I SS1 II ny= 0.75 EQUINOXES
ANGLE OF AZIMUTH OF SLOPE SLOPE -90 -80 -70 -60 -50 -40 -30 -20 -LO 0 10 20 30 "0 50 60 70 dO 90
0.0 369.6 369.6 369.b 369.6 369.6 369.0 369.6 369.6 369.6 369.6 369.6 369.6 369.6 369.6 3b9.6 369.;' 3;'9.6 3b9.6 3b9.6 10.0 299.8 300.1 303.6 308." 31".8 322.8 332.1 342.3 353.1 364.2 315.4 386.1 396.2 405.3 413.2 419.6 42".3 "27.2 428.2 20.0 220'.8 222.8 228.7 238.6 252.3 269.0 287.9 308.3 329.6 351.2 372.4 393.0 412.1 429.5 "44.5 457.0 466.2 471.9 473.8 30.0 135.2 138.3 149.1 166.9 189.7 215.7 244.0 273.7 304.0 33".0 363.6 391. B 418.2 442.1 463.2 4BO.7 493.9 502.2 505.0 40.0 45.4 54.4 17 .1 105.1 136.3 170.0 205.2 241.5 277.9 314.0 349.3 363.0 414.6 443.4 468.8 "90.3 506.8 517.3 52Cl.8 50.0 0.0 9.3 33.6 63.8 97.5 134.0 172.4 2L2.0 25 L.9 291.4 330.0 366.9 401.5 433.2 461.4 485.5 504.3 516.6 520.9 60.0 0.0 2.4 16.4 40.7 7L.b 106.8 L45.1 184.8 225.6 266.2 305.7 343.5 379.2 412.0 441.2 "66.5 486.8 5JO.2 505.1 70.0 0.0 1.0 9.3 27.6 53.7 85.5 121." 159.5 198.9 238.2 276.8 313.8 348.2 360.4 "09.1 434.0 454.5 468.7 473.9 80.0 0.0 0.5 6.0 19.5 40.9 68.4 100.2 135.3 171.3 208.1 243.9 278.2 310.2 339.1 366.2 389.4 "09.0 423.0 428.4 90.0 0.0 0.3 3.9 13.9 30.6 53.6 81.4 111.7 L44.0 176.1 208.2 236.2 266.3 291.5 314.1 334.2 351.4 364.5 369.8
Note: The azimuth of the slope is measured from east, negative to north and positive to south.

- 47 -
to be twenty minutes. Using this interval, tables of the daily total direct
insolation at latitude 45 0 N for the equinoxes and solstices were prepared
in steps of ten degrees for all slopes of all aspects and gradients, with
the values for the transmissivity of the atmosphere ranging from 0.50 to
0.85 in steps of 0.05 (Table 1). The computation for the transmissivity at
a lower value than 0.50 was not made because under such low transmissiyities,
the contribution of the diffused insolation becomes too large for the
estimation of direct solar radiation to be worthwhile.
4. The Application of the Equation
To illustrate the application of the formula maps have been prepared
to show how the distribution of direct insolation at Mont St. Hilaire,
Quebec, is influenced by topographic irregularities (Figs. 3 - 5). These
maps were constructed by using the values from Table 1 to plot radiation
totals for each corner of a grid system in which each grid square is
equivalent to 150 yards. The topographic map of the area (Fig. 2) was
used as a base for the grid from which to obtain the appropriate slope
angle and azimuth at each intersection.
5. The Features of the Distribution of the Direct Insolation on Slopes
(i) The map for June 20, 1967, which approximates the summer solstice,
shows the most uniform distribution over the rugged ground surface of Mont
St. Hilaire. This is because firstly, the orbit of the sun in summer is
fairly uniform for south and north slopes, and secondly, the relatively low
intensities of a gently tilted north slope are compensated for by a longer

_"', ...... _,I~),'lS-O ... II • ....... , ... ~ ..... , .. .-'11111
Fig. 2.
48
GAULT DONATION
MONT ST. HILAIRE, P.O.
-Orchard boundary - ........ ..
Paved rood
Unpaved rood
Trail flnk'roil Blue lroil Yellow Ireil Red lrail Greoo Irail - - , --
=
ContOVl' interval- 50 feel
Contour Map of Mont St. Hilaire, Quebec.

- 49 -
potential sunshine duration than that which exists on a south slope. This
fact makes the difference in azimuth less important than the difference
caused by gradient, the range of which is relatively narrow in nature.
(ii) The topographic variation is effectively reflected in the map
for September 19, 1967, representing the equinoxes. The enormous difference
between north and south slopes is explained by the combined effect of longer
sunshine duration and consistently larger instantaneous values on the south
slope as compared with the north. Maximum values are found on a relatively
steep south slope (40 0 - 500), while in summer the highest values appeared
on a more gentle slope (100 - 15 0). For the east and west facing slopes,
the azimuth of the slope is more effective than the gradient in causing
radiation differences.
(iii) At the winter solstice represented by the map for December 27,
1966, the difference between south and north slopes is as sharp as at the
equinoxes if we take the ratio between the slopes, but since the maximum
value of insolation is so small, the difference in the absolute values
between north and south slopes does not appear as large as that found at the
equinoxes. The gradient of the slope loses its significance for the east
and west slopes and only the aspect of the slopes determines the major value
of the daily total.
6. The Future Project
To evaluate the contribution of insolation to the elements of the heat
budget, it is not satisfactory to deal only with direct insolation. Both
diffuse radiation and surface albedo need to be considered. To approach this
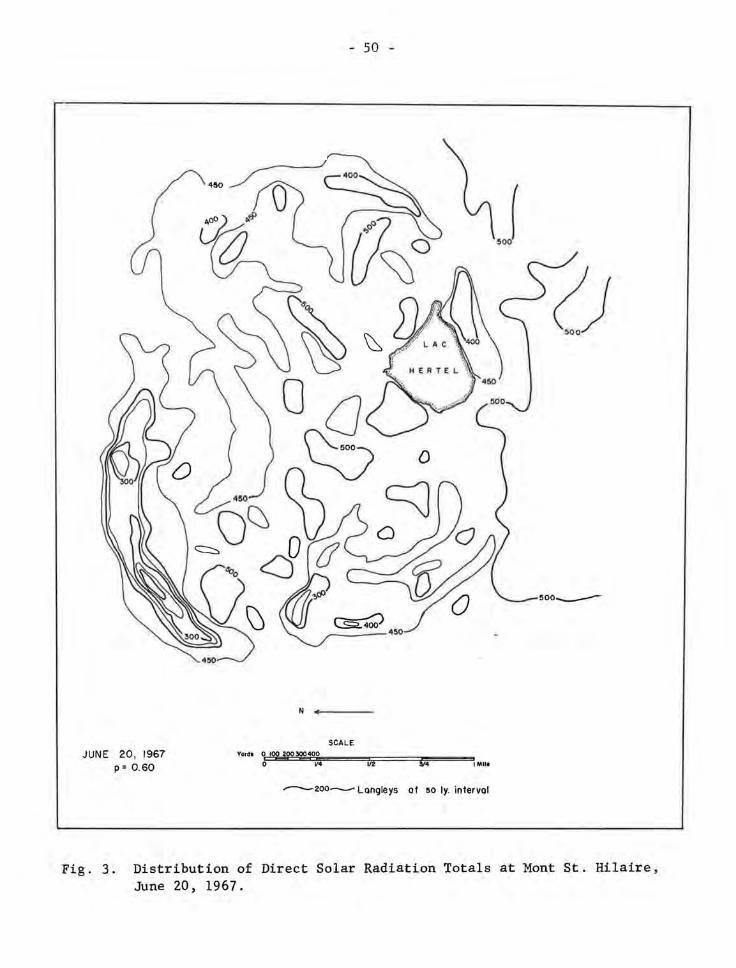
JUNE 20, 1967 P = 0.60
- 50 -
N +-c---
SCALE Ya,d. 0 IUO~400
o V4 V2 1 Mill
----200 __ Longleys at 50 Iy. interval
()
500 __
Fig. 3. Distribution of Direct Solar Radiation Totals at Mont St. Hilaire, June 20, 1967.
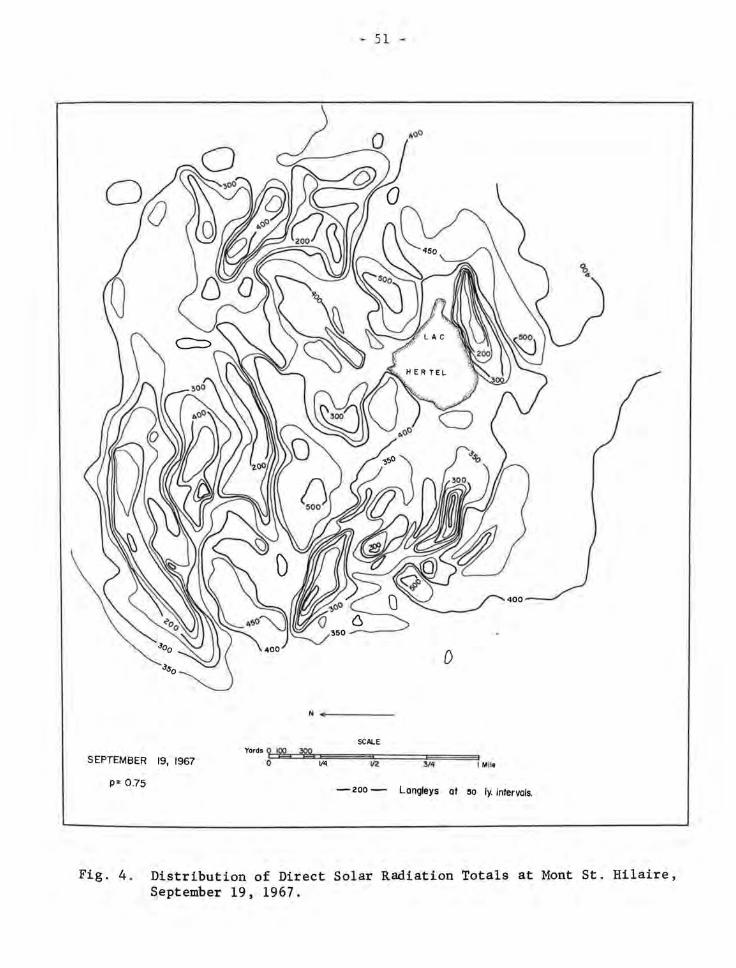
SEPTEMBER 19, 1967
p= 0.75
- 51 -
N •• ___ _
SCALE Yards 9 '$a Xjg.
o Vq V2 31q I Mil.
- 200 - Longleys ot lIO Iy. intervals.
Fig. 4. Distribution of Direct Solar Radiation Totals at Mont St. Hilaire, September 19, 1967.

o
'"
DECEMBER 27, 1966
P = 0.80
- 52 -
N .... c-__
Yard. 0 tOO '200 :500400 b F+i Ed V4
SCALE
V2
____ ISO
314 I Mill
- 200 - Longleys a1 50 Iy. interval
Fig. 5 . Distribution of Direct Solar Radiation Totals at Mont St. Hilaire. December 27, 1966.
- 53 -
aim, a larger programme is now being prepared in which Kondrat'yev's equation
for sky-diffuse radiation will be adopted to compute the contribution from
direct and diffuse radiation separately, so that mapping for overcast con-
ditions is possible. In addition, the albedo for each point on the map will
be put in to subtract the reflected part. Since the distribution of long-
wave radiation can be expected to be fairly homogeneous, a net short-wave
radiation map of this type will help to estimate both the evaporation and
the sensible heat flux at the surface of the ground.
References
Johnson, F. S., 1954: "The Solar Constant", Journ. Meteor., Vo1. ,11, pp. 431-439.
Kondrat'yev, K. Y., 1965: "Radiative Heat Exchange in the Atmosphere", (Trans. from the Russian), Pergamon Press.
Lee, R., 1963: "Evaluation of Solar Beam Irradiation as a Climatic Parameter on Mountain Watersheds", Hydrology Papers, Colorado State University.

- 54 -
RESEARCH REPORT
The first number of CLIMATOLOGICAL BULLETIN contained an article outlining the development and current plans for the climatological programme at McGill University (Garnier, 1967). It was there stated that " .... the existence of a separate Department of Meteorology [since 1959-6~ enables the Department of Geography to concentrate more completely on microclimatological studies, both pure and applied, with emphasis upon their comparative ~eographica] aspects and their relation~hip to prevailing weather characteristics. This is the direction which the climatological programme [!n geograph~ is now taking".
During the twelve months which have elapsed since that statement was written, the lines of development have become more precise. The fundamental philosophy underlying the programme is that microclimatological characteristics within any territory represent the response of local surfaces to the prevailing atmospheric conditions and energy inputs. The result is often a complex pattern, the nature of which is difficult to monitor if studies are concentrated solely or mainly on measuring detailed effects. A more meaningful approach is to recognise these effects as responses to the inter-connections between physical parameters like slope, aspect, soil properties and vegetation characteristics on the one hand, and energy fluxes and prevailing atmospheric circumstances, such as cloud, wind, and humidity on the other. By measuring these fundamental conditions and carefully sampling the consequences of their inter-connections in selected localities and under different synoptic situations, it is possible to achieve not only an understanding of the pattern of microclimatological conditions themselves, but also an appreciation of the role of the surface in the total energy and moisture balances under different atmospheric states. Moreover, such an approach to microclimatological investigations suggests a way whereby much of the detailed and highly varied microclimatic pattern can be estimated from terrain and weather chart analysis without the need for a dense net-work of observing points.
Among the factors involved in such a study, the topographic variation of solar radiation is fundamentally important. Accordingly a major effort towards evaluating this is being made. The article by Atsumu Ohmura elsewhere in this BULLETIN (see pp. 42-53) briefly describes a formula he has developed for this purpose and programmed for use with an IBM 360 computer. The article also illustrates how the formula has been used to map direct short-wave radiation for three specific days at Mont St. Hilare. A more substantive paper describing the formula has been prepared by Ohmura and B. J. Garnier for publication elsewhere.
Immediate developments in relation to this formula and its use consist in making a programme for the computer mapping of direct short-wave radiation, preparing tables for use at different times of year, and investigating the

- 55 -
importance and methods to be used for sky-line correction when mapping the radiation distribution. This work is being undertaken at the moment in respect of latitude 45 0 N and latitude l3~. The former latitude is that of Mont St. Hilaire and the latter that of Barbados. Thus, the pilot studies based on the former research base are being extended to a tropical location for comparative purposes. In the latter area, a special study into the radiation intensities during the early hours of the day and their importance for the subsequent development of convection is being planned as a doctoral research project by B. K. Basanayake, who will also assist B. J. Garnier in the more general radiation studies of the island .
Since the radiation work outlined above is an essential background to the whole surface energy budget and its estimation, energy budget investigations at both Mont St. Hilaire and Barbados are being planned. Some discussion of the recent developments in the latter area will be found on pp. 18- 22 of this BULLETIN. A similar energy budget investigation at Mont St. Hilaire is to be undertaken by Atsumu Ohmura during the coming summer. In this work he will have the benefit of being able to draw on Richard G. Wilson's detailed study of the microclimate of part of the forest at Mont St. Hilaire, now being written-up as an M.Sc . Thesis, and Wayne Rouse's earlier work (Rouse, 1965, 1967) .
Although the radiation and energy budget studies at Mont St . Hi l air e and in Barbados account for a substant i a l part of the resear ch activity within the climatological programme at present , f urther dimensions are being added by Tim R. Oke who is developing work in urban climato logy and in the aerodynamic approach to energy budget investigations.
These studies in urban climatology are expected to take about five years to complete. Initial studies are investigating the structure of the "heat island" associated with a large metropolitan area, such as Montreal. A brief look at a pilot investigation in this field is given in the article on pp. 36 - 41 of this BULLETIN. The primary aim of this work is an understanding of the three-dimensional structure of the heat island.
The major emphasis in the programme as a whol~, however, lies in a study of the component fluxes in the energy balance of a city. This Summer a start will be made in measur ing the radiation balance f luxes by replicating the Mont St. Hilaire equipmen t at a c ity location . This study will be concerned with both the spatial and tempor a l variations of sol ar and infra-red radiation with special reference t o the effects of po llution . Later studies will attempt an estimation of the contributions to the energy balance of city surfaces that are made by other factors. These components include the heat stored in building materials and produced by combustion processes, and the very important partition of energy between the sensible and latent heat fluxes.
During the coming summer, T. R. Oke and a graduate student will be involved in a co-operative micro-climatic project at Simcoe, Ontario, in

- 56 - .
conjunction with Drs. Davies and Rouse of McMaster University. By joining together at a single research site in this way, it is possible to gather enough instrumentation to attack problems that a single institution could not encompass. Such a problem is that of advection of air from one surface to another, and the resulting · progressive changes in the microclimatic properties of the air. An understanding of advective effects is a necessary prerequisite if geographers are to progress from point studies towards the spatial variation of microclimates. In the work at Simcoe, an attempt will be made to formulate a universal relationship for the growth of the internal boundary layer following a change in surface characteristics.
The research described above constitutes the chief research activity currently under way within the programme of comparative microclimatology in the Department of Geography at McGill University. It is hoped, as soon as possible, to add to it a systematic study of the radiation and energy balances of lake surfaces beginning with a pilot study of Lac Hertel, Mont St. Hilaire, and possibly other water surfaces nearby, and extending it to the lakes in the vicinity of the McGill University Sub-Arctic Laboratory at Schefferville. This extension of work is necessary for two main reasons: to include inland water surfaces and their responses as an integral part of the fundamental investigations described at the start of this report as basic to the research programme's outlook; and to extend the comparative aspects of the programme to include the Sub-Arctic, and ultimately the Arctic, as well as the tropics.
References
Bo J. GARNIER Professor of Climatology,
McGill University.
Garnier, B. J., 1967: "Climatology at McGill University", Climat. Bull., No.1, pp. 1-8.
Rouse, W. R., 1965: "Aspects of a Forest Microclimate", Ph.D. Thesis, McGill University.
Rouse, W. R., 1967: "A Preliminary Report on Topoclimatic Research at Mont St. Hilaire", Climat. Bull., No.1, pp. 15 -16.

r ! I
- 57 -
NEWS AND COMMENTS
Tim R. Oke joined the staff of the Department of Geography in September, 1967, as Assistant Professor of Climatology. Professor Oke graduated in geography at Bristol University, England, before coming to Canada to study at McMaster University. He completed his M.A. at McMaster in 1964 and obtained a Ph.D. from the same University in November, 1967. His dissertation was entitled "Super Surface Minimum Temperatures at Night" and represented a development on his work for his Master's thesis in "Temperature Variations in a Fine Sandy Loam. Professor Oke's present research is concerned particularly with Urban Climatology and the aerodynamic aspects of energy budget measurements (see pp. 36-41 and 54-56 of this Bulletin).
" Since the beginning of September, 1967, J. Noel Pelletier has been the Chief Observer at the Mont St. Hilaire observation site. Mr. Pelletier joins the staff of the McGill Climate Programme after three years' experience ' as an observer, first with ARDA during 1965 where he was Assistant Meteorologist in the Bureau d'Amenagement de l'Est Quebec at Mont Jolie, and then, from December 1965 to August 1967, at the McGill University Sub-Arctic Laboratory at Schefferville.
At the end of October, 1967, Dr. W. C. Swinbank of the Meteorological Physics Division of CSIRO, Australia, gave a seminar on his recent work in the aerodynamic approach to energy budget measurements. Dr. Swinbank also discussed his work informally with graduate students and advised on the research programme, particularly in respect of work in progress at Mont St. Hilaire.
Another recent visitor was Professor Melvin E. Marcus of the University of Michigan, Ann Arbor. Professor Marcus gave a seminar on the interdisciplinary approach in research work based on his experience in glacier investigations in Alaska.
Two University Lecturers from overseas universities are currently studying in the doctoral programme in climatology at McGill. They are B. K. Basanayake, Lecturer in the University of Ceylon, and Richard F. Fuggle, Lecturer in the University of South Africa, Pretoria, from 1966 to 1967. Mr. Basanayake's field of interest lies in radiation studies in the tropics and he plans to research in Barbados on the contribution of solar radiation during the morning to the development of convection through the day. Mr. Fuggle will be working in the field of urban climatology.

- 58 -
Topics under investigation by candidates for the Master's degree include: (a) Topographic Influences on a Forest Microclimate (R. G. Wilson); (b) Precipitation Characteristics in Central Labrador (P. R. Grevatt); (c) An Analysis of Weather Conditions in the Rupununi District of Guyana (C . Kagenda-Atwoki); (d) Methods of Calculating and Mapping the Insolation on a Slope (A . Ohmura); (e) Temperature Variations in Relation to Typical Weather Situations in Central Labrador (D. Leung); (f) Moisture Conditions in the Savanna Region of West Africa (K. Swami).
McGill University has for long carried an international reputation for studies in many fields. The University's international flavour is wellrepresented in climatology. The nationalities of the eight people working for doctoral or master's degrees in climatological subjects are distributed as follows : Canadian (1), American (1), Japanese (1), Chinese (1), South African (1), Ugandan (1), Indian (1), Singhalese (1).
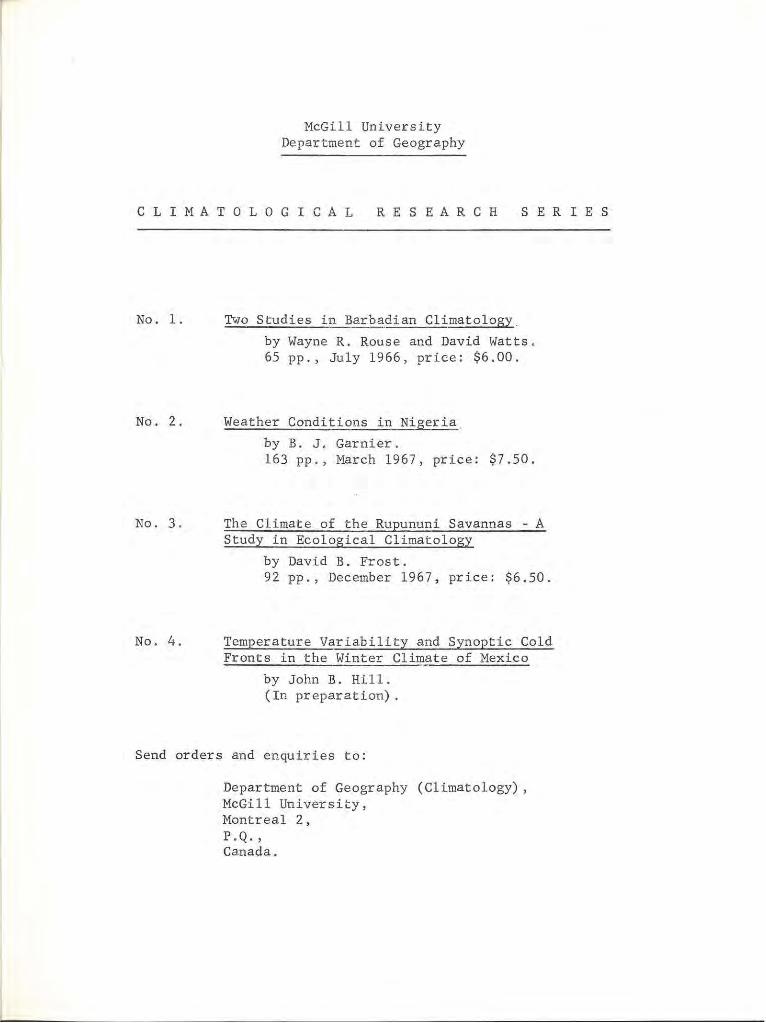
McGill University Department of Geography
C LIM A T 0 LOG I CAL RESEARCH SERIES
No.1.
No.2.
No.3 .
No.4 .
Two Studies in Barbadian Climatology .
by Wayne R. Rouse and David Watts . 65 pp., July 1966, price : $6.00.
Weather Conditions in Nigeria
by B. J . Garnier . 163 pp . , March 1967, price: $7.50.
The Climate of the Rupununi Savannas - A Study in Ecological Climatology
by David B. Frost. 92 pp . , December 1967, price : $6 . 50.
Temperature Variability and Synoptic Cold Fronts in the Winter Climate of Mexico
by John B. Hill . (In preparation) .
Send orders and enquiries to:
Department of Geography (Climatology), McGill University, Montreal 2, P .Q. , Canada.

![pc a2...86.9% 13.1% 32.1% 11.1% (86.9%) 15.4% 15.0% 13.3% ( n , (Medication Possession Ratio : : 8.6% [95%Cl : 1.6-15.6] ) Blonde L, et al.: 2003 Thayer S, et al.: 2010*](https://img.dokumen.tips/doc/110x75/5e61b63c520e862cc00aea15/pc-a2-869-131-321-111-869-154-150-133-n-medication-possession.jpg)