Embed Size (px)
Citation preview

Climatic Regions of the Canadian Arctic IslandsAuthor(s): J. B. MaxwellSource: Arctic, Vol. 34, No. 3 (Sep., 1981), pp. 225-240Published by: Arctic Institute of North AmericaStable URL: http://www.jstor.org/stable/40509150 .
Accessed: 12/06/2014 12:37
Your use of the JSTOR archive indicates your acceptance of the Terms & Conditions of Use, available at .http://www.jstor.org/page/info/about/policies/terms.jsp
.JSTOR is a not-for-profit service that helps scholars, researchers, and students discover, use, and build upon a wide range ofcontent in a trusted digital archive. We use information technology and tools to increase productivity and facilitate new formsof scholarship. For more information about JSTOR, please contact [email protected].
.
Arctic Institute of North America is collaborating with JSTOR to digitize, preserve and extend access to Arctic.
http://www.jstor.org
This content downloaded from 188.72.126.55 on Thu, 12 Jun 2014 12:37:52 PMAll use subject to JSTOR Terms and Conditions
ARCTIC VOL. 34, NO. 3 (SEPTEMBER 1981), P. 225-240
Climatic Regions of the Canadian Arctic Islands J.B. MAXWELL1
ABSTRACT. As a result of a comprehensive assessment of the climate of the Canadian Arctic Islands and adjacent waters , five climatic regions were identified. The regional boundaries were delineated by an analysis of the influence of the major climatic controls while further regional subdivisions were arrived at through consideration of the fields of the standard observed meteorological elements. Short discussions of the climatic characteristics of each sub-region are given and tables outlining values of selected climatic elements are presented. A brief discussion of climatic change across the entire area is included.
Key words: Canadian Arctic Islands, climate, climatic change, meteorology
RÉSUMÉ: Suite à une évaluation détailée du climat des îles Arctiques canadiennes et des eaux adjacentes, cinq régions climatiques ont été identifiées. Les bornes régionale ont été tracés au moyen de l'analyse de l'influence des principaux contrôles climatiques, et les subdivisions régionales ont été déterminées par l'étude des champs des éléments météorologiques standards ayant été observés. De courtes discussions des caractéristiques climatiques de chaque sous-réion sont présentées, ainsi que des tableaux signalant les valeurs de certains des éléments climatiques. Une courte discussion du changement climatique dans toute la région paraît aussi.
Traduit par Maurice Guibord, Le Centre Français, The University of Calgary.
INTRODUCTION
The vast area of land and water that makes up the Canadian Arctic has long been popularly regarded as a region of fairly uniform climatic conditions - a "polar desert" with little diversity and strikingly harsh weather throughout the year. This perception has been particularly true for the Canadian Arctic Islands and adjacent waters. General climatologies of the Canadian Arctic completed during the past 10 to 15 years (Thompson, 1965; Dept. of Transport, 1970) have recognized the areal and seasonal variations that exist, but have not attempted a systematic climatic subdivision of the region. Recently, however, detailed analyses of meteorological data for a climatology of the Canadian Arctic Islands and adjacent waters (Max- well, 1980) suggested that such an approach was now both possible and desirable, in view of the high degree of in- terest of both developmental and environmental groups in the arctic areas.
DATA BASE
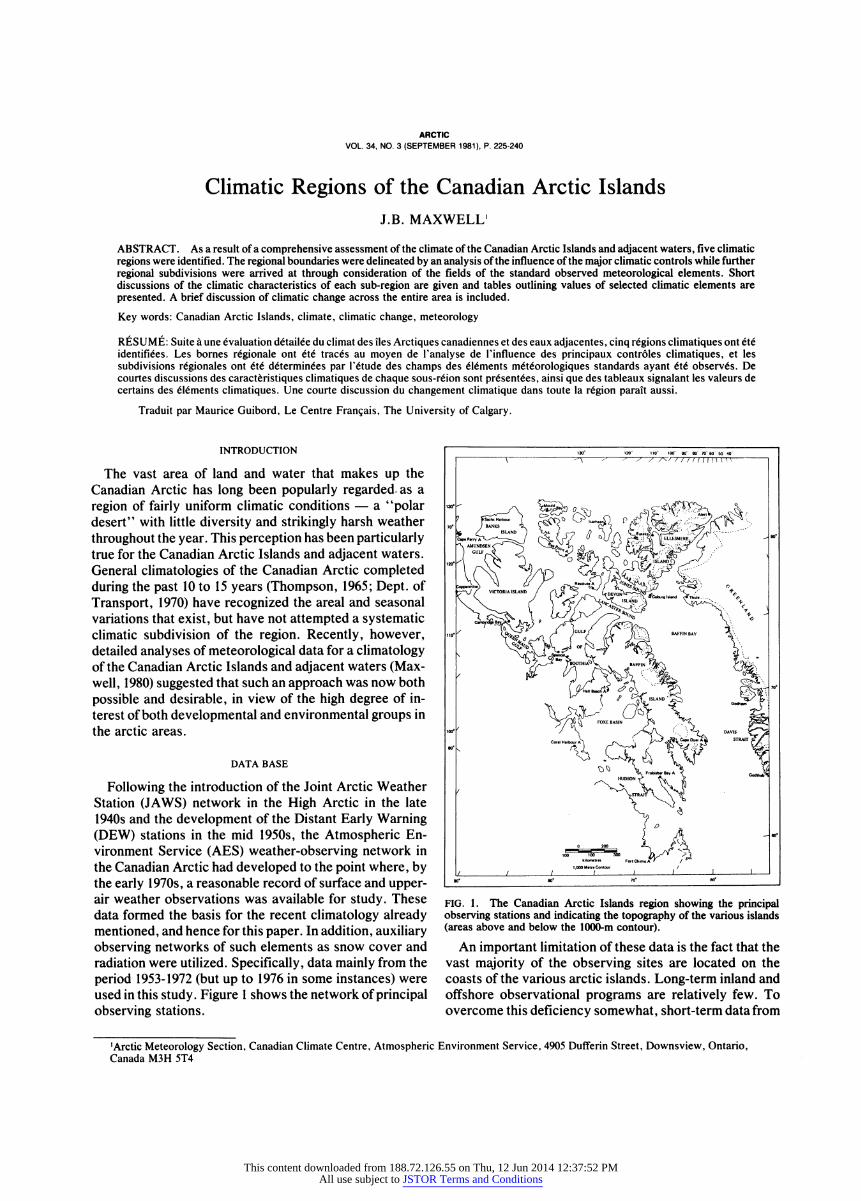
Following the introduction of the Joint Arctic Weather Station (JAWS) network in the High Arctic in the late 1940s and the development of the Distant Early Warning (DEW) stations in the mid 1950s, the Atmospheric En- vironment Service (AES) weather-observing network in the Canadian Arctic had developed to the point where, by the early 1970s, a reasonable record of surface and upper- air weather observations was available for study. These data formed the basis for the recent climatology already mentioned, and hence for this paper. In addition, auxiliary observing networks of such elements as snow cover and radiation were utilized. Specifically, data mainly from the period 1953-1972 (but up to 1976 in some instances) were used in this study. Figure 1 shows the network of principal observing stations.
130° 120 110' 100 90 80 70 60 SO 40
I ' ^' ^ ^ / / /v/ / t I 1 )'''''''
1
r~'jY VICTORIA ISLAND / S' cl D '
L DFwÍ¡¡V^tai4j <^T''' ** ' X S I y*'
D /^'Ltt ISLAND^ *&*u'»'«tand ^Thuli.-.., >
t <? qv
island 2^> G«ti«r r
y/M, FOXEBAS.N k ^l SÉ* 1cor' ' /^C' '"- ]c*<' DAVIS ^r")^
HUDSON ̂ íy» ' Go*»m6
L / / 1000M""'/C°nto>" , ¿ , i 1 90*
80°
70°
60°
FIG. 1. The Canadian Arctic Islands region showing the principal observing stations and indicating the topography of the various islands (areas above and below the 1000-m contour).
An important limitation of these data is the fact that the vast majority of the observing sites are located on the coasts of the various arctic islands. Long-term inland and offshore observational programs are relatively few. To overcome this deficiency somewhat, short-term data from
'Arctic Meteorology Section, Canadian Climate Centre, Atmospheric Environment Service, 4905 Dufferin Street, Downsview, Ontario, Canada M3H 5T4
This content downloaded from 188.72.126.55 on Thu, 12 Jun 2014 12:37:52 PMAll use subject to JSTOR Terms and Conditions

226 J. B. MAXWELL
AES inland observing sites and those collected by scien- tific parties or resource exploration groups located on the islands' interiors were utilized wherever possible. For the offshore areas, ship observations (archived for North American waters by the United States) were obtained and collectively analyzed for each waterway in the Arctic Islands area. These marine observations, however, were available only for the months July through October and were relatively few in number in comparison with the coastal stations. As a typical example, there were fewer than 2000 observations available from the whole of Lan- caster Sound for the entire 20-year period 1953-1972; this may be compared with the hourly observing program of a standard AES surface station which would accumulate almost 9000 observations in only one year.
Due to this imbalance of data coverage, weather condi- tions over the inland and offshore areas often had to be either empirically or subjectively assessed in relation to conditions at the coastal stations in order to produce areal maps of many of the standard meteorological elements. Temperature and precipitation, which are important in developing a regional breakdown of climate, are good examples of fields so treated.
Important to this particular study was the sizable volume of literature dealing with the Arctic. This compris- ed a wide range of approaches including regional, island, and site-specific climatologies; single climatic element studies; analyses of single storms and the development of synoptic climatologies; and assessments of climatic varia- tion and change. A broad, but by no means complete, selection of the literature available and used as back- ground to the regional analysis presented in this paper is shown in Table 1 . Many of the studies cited are based on AES data.
METHOD OF CLIMATIC SUBDIVISION
The usefulness of the major climatic classification sys- tems (for example: Koppen and Geiger, 1930-40; Thorn- thwaite, 1948; Flohn, 1969) is rather limited in the arctic
areas, for such schemes generally divide the entire Arctic into only one or two regions. This is not sufficiently de- tailed to recognize the many important climatic differ- ences that impact on human activities there.
In this study, the approach chosen was one which in- volved first subdividing the Canadian Arctic Islands into regions on the basis of a subjective assessment of the relative effects (outlined below) of the major climatic con- trols and then further sectioning the resulting regions on the basis of major local variations. It was felt that this was the only realistic way to approach the problem considering the serious lack of uniformity in the data coverage.
For the detailed examination of the various weather element analyses that served as the basis for this climatic subdivision, the reader should refer to Maxwell (1980); however, a brief outline is given here. For the initial regional breakdown, the major climatic controls used were cyclonic activity, the sea ice- water regime, broad- scale physiographic features, and net radiation.
(1) Cyclonic activity (Figs. 2 and 3). The percentage fre- quencies of occurrence of low pressure centres within 400 000-km2 areas along with the primary cyclonic trajectories are shown for both January and July. These figures represent amalgamations of the results of Berry et al. (1953), Klein (1957), Prostjkova (1968), and McKay et al. (1969). The ever-present trajectory extending north through Davis Strait and Baffin Bay is to be noted. This is an offshoot from the major trajectory which skirts south- ern Greenland on its route from the eastern seaboard towards the Iceland area.
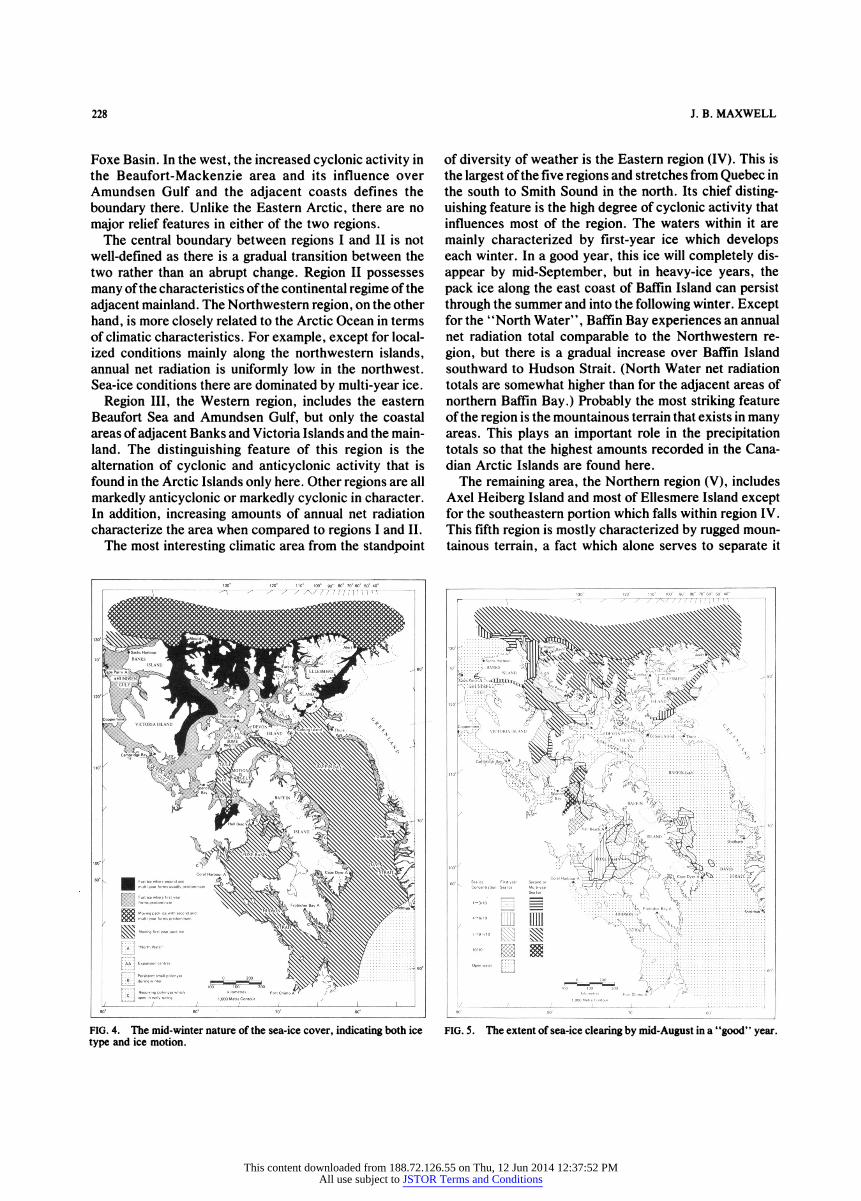
(2) Sea ice-water regime (Figs. 4 and 5). For mid- winter, the typical nature of the sea-ice cover is shown, indicating both ice type and ice motion. Ice coverage on this map is virtually complete except for eastern Davis Strait. This may be contrasted with the extent of the clearing that can occur by mid- August in a "good" year (one of above- average degree of clearing).
(3) Broad-scale physiographic features. An appreciation of this climatic control can be gained from the topographic contours included on Figure 1 . The dominance of higher
TABLE 1 . Selected references dealing with Canadian Arctic climate Arctic Climatology, Regional, Island, & Specific Analysis of Specific Climatic Synoptic Studies, Synoptic Sea Ice, Oceanography Climatic Variation, Change in Environment - General Site Climatologies Elements Climatology the Arctic
Barry & Hare (1974) Alt (1975) Berry & Lawford (1977) Alt (1978) Arctic Institute North Bradley (1973a, b) Brown (1972) Barry (1964) Bilello (1966, 1973) Barry (1974) America (1968) Bradley & England (1978) Dept. Energy, Mines, Barry & Fogarasi (1968) Catchpole & Moodie (1971) Barry, Bradley & Jacobs Bushell (1959) Crane (1978)
Resources (1970) Berry et al. (1975) Dept. Environment (1976) (1975) Collin & Dunbar (1964) Dunbar (1976) Dept. Transport (1944, 1970) Burns (1973, 1974) Fraser (1959) Berry et al. (1953) Dept. Environment (1970) Jacobs & Newell (1979) Dunbar & Greenaway (1956) Duck et al. (1977) Fraser (1964) Cogley & McCann (1976) Dept. Transport (1964-69) Kellogg (1975) Hare (1968, 1969) Hare & Montgomery (1944) Hagglund & Thompson (1964) Fogarasi (1972) Fletcher et al. (1973) Lamb (1980) Hare & Hay (1971) Henry (1947) Henderson ( 1967) Jacobs et al. (1974) Gade et al. (1974) Thomas (1975) Hastings (1971) Holmgren (1971) Huschke (1969) Keegan (1958) Hibler et al. (1974) Vowinckel & Orvig (1967) Orvig(1970) Jackson (1959, 1960) Jackson (1961) Klein (1957) Leahey(l%7) Walsh & Johnson (1979) Rae (1951) Lotz and Sagar (1960) Longley (1960, 1972) LeDrew (1976) Markham (1975, 1977) Thompson ( 1 965) Maxwell et al. ( 1980) MacKay & Arnold (1965) Prostjkova (1968) Morgan ( 1 970) Vowinckel & Orvig (1963) Müller & Roskin-Sharlin Thomas (1960) Reed & Kunkel (1960) United States Navy (1958) Weiler & Bowling (1975) (1967) Thomas & Thompson (1962) Scholefield (1978) Walker (1975, 1977) Wilson (1967, 1969) Müller et al. ( 1976) Thomas & Titus (1958) Wilson (1973) Savdie & Berry (1976) Thompson (1963)
Treshnikov & Voskresenkiy Vowinckel (1962) (1977)
Abstracted from Maxwell (1980)
This content downloaded from 188.72.126.55 on Thu, 12 Jun 2014 12:37:52 PMAll use subject to JSTOR Terms and Conditions

CLIMATIC REGIONS OF THE ARCTIC ISLANDS 227
terrain in the Eastern Arctic in contrast with the mainly low-lying islands in the Western Arctic is particularly to be noted.
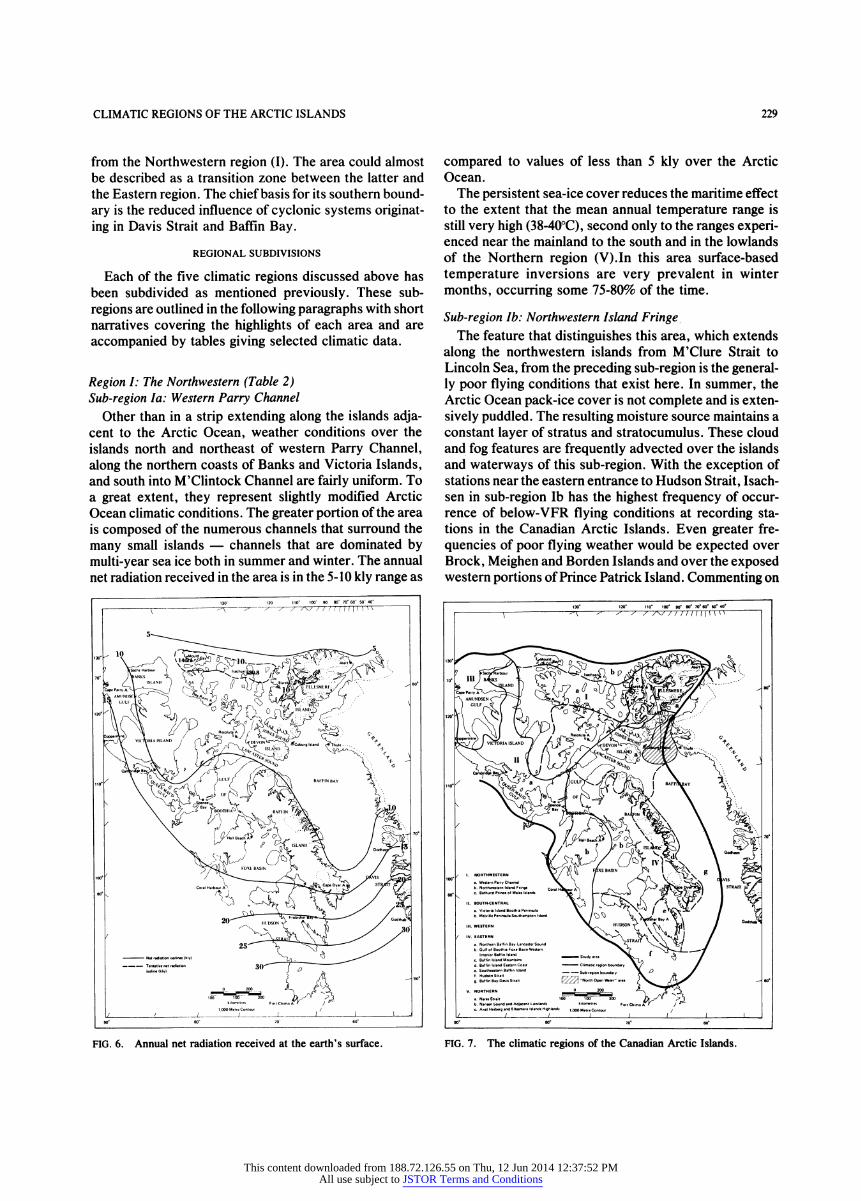
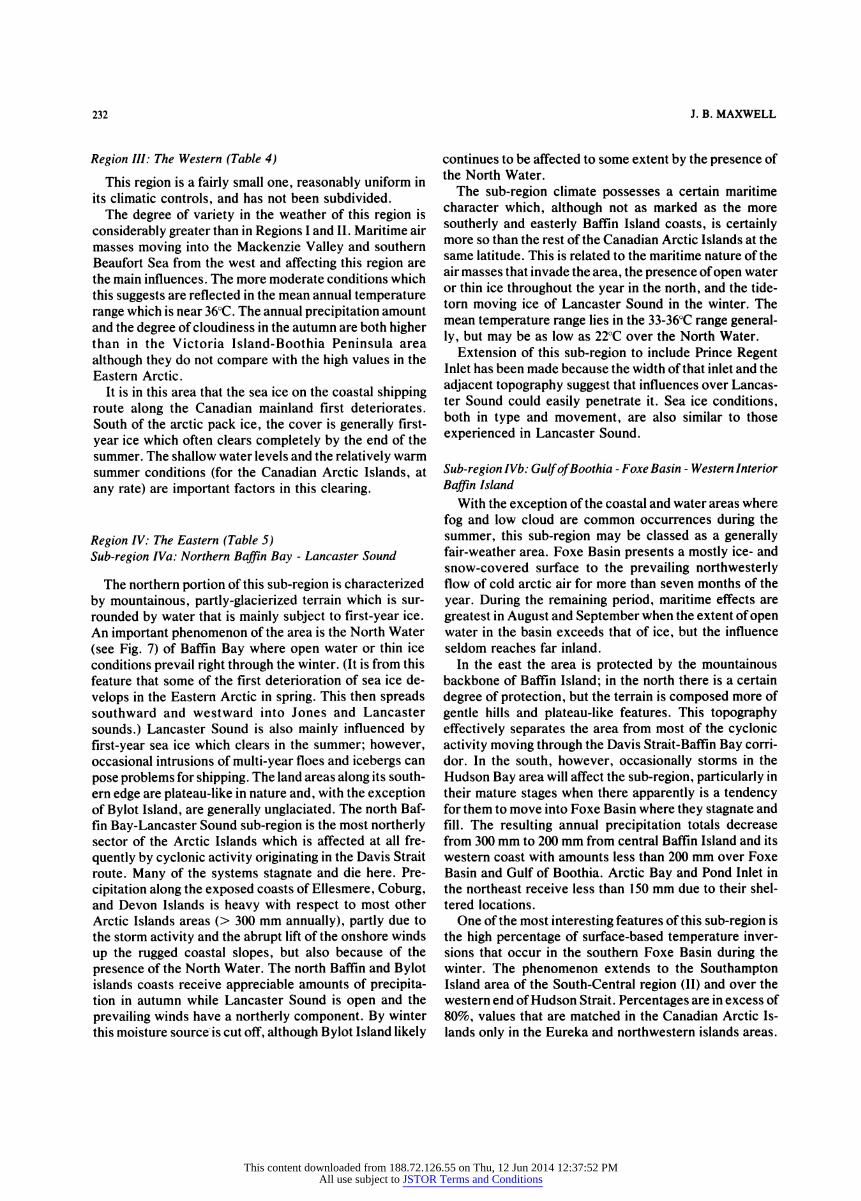
(4) Net radiation (Fig. 6). The field of annual net radiation received across the Canadian Arctic Islands has been provisionally analyzed using data collected during the period 1970-1976. The interesting feature of this map is the high values that have been recorded at the three stations on the northwestern islands. Although this may be due to disturbed instrument sites, a tentative contour (dashed) has been analyzed in this area due to similar anomalies in other climatic elements that also exist (e.g. high frequen- cies of fog, and low ceilings and visibility). There are undoubtedly other localized occurrences of relatively high annual net radiation in the Arctic Islands area. Courtin and Labine (1977), for example, reporting on a continuing program to study the microclimate of Truelove Lowland on the northern coast of Devon Island, indicated a mea- sured value for annual net radiation of 17.8 kly, similar in magnitude to those values indicated in the northwestern islands.
The secondary subdivision of the resulting regions con- sidered such major local variations as local topography, aviation weather, maritime influences, temperature, pre- cipitation, snow cover and wind.
130° 120° 110° 100° 90° 80° 70° 80° 50° 40°
-5
¡~~J X VICTORIA ISLAM* / Oj? ^
vO'AS^l*^fc¿^ *<***"' '*«• <*Thú.. . . . .^ ' ^
5 ö^^jSf** VioOTHIA^V^^^
BAFFIN ÍJk' ' /JO .
1.000 Metre Contour / '¿ / / I I i | I J 90° 80° 70° 60°
FIG. 2. The percentage frequency of occurrence of low pressure cen- tres within 400 000-km2 areas and the primary cyclonic trajectory during January.
MAJOR REGIONS IDENTIFIED
The application of the major climatic controls listed above resulted in five climatic regions being identified within the Canadian Arctic Islands. These are shown in Figure 7. Delineation of the boundaries of these regions was, of necessity, somewhat arbitrary and is therefore subject to future alteration. It must be realized that the climatic boundaries arrived at represent average positions which may show some year-to-year variations. The asser- tions regarding climatic conditions that occur in the fol- lowing discussions of each of the regions (and the sub- regions later) are based on data analyses found in Maxwell (1980) unless otherwise indicated.
The first two regions - the Northwestern (I) and the South-Central (II) - are of a kind in terms of cyclonic activity and relief. Anticyclonic activity is a maximum over these areas as far as the Canadian Arctic Islands are concerned. The eastern boundary of the two areas has been selected on the basis that it represents the furthest westward extent of the major cyclonic activity that feeds into the Davis Strait-Baffin Bay-Baffin Island area from the south and southwest. Generally, this boundary runs north-south from western Axel Heiberg Island through Somerset Island to the Gulf of Boothia, then east through Fury and Hecla Strait, and finally south through western
130° 120° HO" 100° 90° 80° 70° 60° 50° 40°
i '
-y
^r^ ^ 7 - y y /'/ ////// 1 1 ' ' ' ' I
/ ' NI 7.5- '' '^ ^Vn^__^^10
'
'l / / 100° M""/Con'our ; 20 ; ' | | J 90° 80' 70° 60°
FIG. 3. The percentage frequency of occurrence of low pressure cen- tres within 400 000-km2 areas and the primary cyclonic trajectories during July.
This content downloaded from 188.72.126.55 on Thu, 12 Jun 2014 12:37:52 PMAll use subject to JSTOR Terms and Conditions
228 J. B. MAXWELL
Foxe Basin. In the west, the increased cyclonic activity in the Beaufort-Mackenzie area and its influence over Amundsen Gulf and the adjacent coasts defines the boundary there. Unlike the Eastern Arctic, there are no major relief features in either of the two regions.
The central boundary between regions I and II is not well-defined as there is a gradual transition between the two rather than an abrupt change. Region II possesses many of the characteristics of the continental regime of the adjacent mainland. The Northwestern region, on the other hand, is more closely related to the Arctic Ocean in terms of climatic characteristics. For example, except for local- ized conditions mainly along the northwestern islands, annual net radiation is uniformly low in the northwest. Sea-ice conditions there are dominated by multi-year ice.
Region III, the Western region, includes the eastern Beaufort Sea and Amundsen Gulf, but only the coastal areas of adjacent Banks and Victoria Islands and the main- land. The distinguishing feature of this region is the alternation of cyclonic and anticyclonic activity that is found in the Arctic Islands only here. Other regions are all markedly anticyclonic or markedly cyclonic in character. In addition, increasing amounts of annual net radiation characterize the area when compared to regions I and II.
The most interesting climatic area from the standpoint
of diversity of weather is the Eastern region (IV). This is the largest of the five regions and stretches from Quebec in the south to Smith Sound in the north. Its chief disting- uishing feature is the high degree of cyclonic activity that influences most of the region. The waters within it are mainly characterized by first-year ice which develops each winter. In a good year, this ice will completely dis- appear by mid-September, but in heavy-ice years, the pack ice along the east coast of Baffin Island can persist through the summer and into the following winter. Except for the ' 'North Water", Baffin Bay experiences an annual net radiation total comparable to the Northwestern re- gion, but there is a gradual increase over Baffin Island southward to Hudson Strait. (North Water net radiation totals are somewhat higher than for the adjacent areas of northern Baffin Bay.) Probably the most striking feature of the region is the mountainous terrain that exists in many areas. This plays an important role in the precipitation totals so that the highest amounts recorded in the Cana- dian Arctic Islands are found here.
The remaining area, the Northern region (V), includes Axel Heiberg Island and most of Ellesmere Island except for the southeastern portion which falls within region IV. This fifth region is mostly characterized by rugged moun- tainous terrain, a fact which alone serves to separate it
FIG. 4. The mid- winter nature of the sea-ice cover, indicating both ice type and ice motion.
FIG. 5 . The extent of sea-ice clearing by mid- August in a * 'good" year.
This content downloaded from 188.72.126.55 on Thu, 12 Jun 2014 12:37:52 PMAll use subject to JSTOR Terms and Conditions
CLIMATIC REGIONS OF THE ARCTIC ISLANDS 229
from the Northwestern region (I). The area could almost be described as a transition zone between the latter and the Eastern region. The chief basis for its southern bound- ary is the reduced influence of cyclonic systems originat- ing in Davis Strait and Baffin Bay.
REGIONAL SUBDIVISIONS
Each of the five climatic regions discussed above has been subdivided as mentioned previously. These sub- regions are outlined in the following paragraphs with short narratives covering the highlights of each area and are accompanied by tables giving selected climatic data.
Region I: The Northwestern (Table 2) Sub-region la: Western Parry Channel
Other than in a strip extending along the islands adja- cent to the Arctic Ocean, weather conditions over the islands north and northeast of western Parry Channel, along the northern coasts of Banks and Victoria Islands, and south into M'Clintock Channel are fairly uniform. To a great extent, they represent slightly modified Arctic Ocean climatic conditions. The greater portion of the area is composed of the numerous channels that surround the many small islands - channels that are dominated by multi-year sea ice both in summer and winter. The annual net radiation received in the area is in the 5-10 kly range as
compared to values of less than 5 kly over the Arctic Ocean.
The persistent sea-ice cover reduces the maritime effect to the extent that the mean annual temperature range is still very high (38-40°C), second only to the ranges experi- enced near the mainland to the south and in the lowlands of the Northern region (V).In this area surface-based temperature inversions are very prevalent in winter months, occurring some 75-80% of the time.
Sub-region Ib: Northwestern Island Fringe The feature that distinguishes this area, which extends
along the northwestern islands from M'Clure Strait to Lincoln Sea, from the preceding sub-region is the general- ly poor flying conditions that exist here. In summer, the Arctic Ocean pack-ice cover is not complete and is exten- sively puddled. The resulting moisture source maintains a constant layer of stratus and stratocumulus. These cloud and fog features are frequently advected over the islands and waterways of this sub-region. With the exception of stations near the eastern entrance to Hudson Strait, Isach- sen in sub-region Ib has the highest frequency of occur- rence of below- VFR flying conditions at recording sta- tions in the Canadian Arctic Islands. Even greater fre- quencies of poor flying weather would be expected over Brock, Meighen and Borden Islands and over the exposed western portions of Prince Patrick Island. Commenting on
130- 120 110" 100' 90 80° 70° 60- 50° 40°
pr-VyV' VK TORI A ISLAND /
f^V^/^'Y 4^V0N^^>1? ¿"coburo Island ^Thule- -.. >
■ '^&& ifr
L L / ^"""/c-- , ¿ L , | 90° 80° 70 60°
130° 120° 110° 100° 90° 80° 70° 60° S0° 40° i r
^ ^ - 7 - y / /'/ ////// 1 1 m u I
. , I. NORTHWESTERN '/ '^ I /-4L A V'
" VL'
^ A £^~^
c. Ax.l Heiterg and EILvnete Islands HighLndi 1 000 M«,. Contour / [¿ L L / / |_ | I J
90° 80° 70° 60°
FIG. 6. Annual net radiation received at the earth's surface. FIG. 7. The climatic regions of the Canadian Arctic Islands.
This content downloaded from 188.72.126.55 on Thu, 12 Jun 2014 12:37:52 PMAll use subject to JSTOR Terms and Conditions

230 J. B. MAXWELL
weather conditions at the latter two, Stefansson (in Rae, 1951) noted that in summer, winds from open water to the west bring almost continuous fog over western portions of the islands. MacKay and Arnold (1965) documented much more severe ceiling and visibility conditions at Meighen Island, where the ice cap station was located at 240 m elevation, than at Isachsen. In winter, variable open leads along the Polar Continental Shelf (where moving Arctic Basin ice impinges on land-fast ice) are important influ- ences for steam and ice fog occurrences throughout the area.
Sub-region Ic: Bathurst - Prince of Wales Islands This area includes the stations of Rea Point and Reso-
lute and the islands adjacent to central Parry Channel in the vicinity of 105°W longitude. Sea-ice conditions here are a mixture of multi-year and first-year types with the degree of summer clearing variable from year to year. As a result, shipping conditions are generally less harsh than in the other areas of the Northwestern region.
In many respects, climatic conditions are similar to the Western Parry Channel sub-region, but modification of mean temperature values is evident in both summer and winter. As in the two other sub-regions, blizzard condi- tions can be common. Percentage frequencies of occur- rences in January are in the 10-15% range, depending on the location.
Region II: The South-Central (Table 3) Sub-region Ha: Victoria Island - Boothia Peninsula
As the name suggests, this sub-region is mainly com- posed of those two areas of land; however, it contains also the adjacent waters of Coronation and Queen Maud gulfs and other land areas including King William and northern Banks islands. The climatic characteristics of this sub- region are very similar to those of the nearby mainland. Two factors are important in producing this result: one is the fairly massive size of the land areas and their proximi- ty; the other is the fact that the inter-island waterways are generally narrow and shallow.
Rivers flowing northward into Coronation and Queen Maud gulfs cause some clearing of the solid winter ice cover along the mainland coast in July, but often heavy concentrations of ice still persist in northern Coronation Gulf in late August. Ice cover is even more persistent in eastern and northern areas of Queen Maud Gulf. Freeze- up begins again in late September and is complete by November.
These ice patterns lead to one distinction that should be made in this sub-region and that is the summer climate. Queen Maud and Coronation gulfs have a reputation for high frequencies of low cloud and fog during July and August when sea ice is still present. This regime is re- flected in the July mean daily temperature at the small island stations in the area such as Jenny Lind and Hat
TABLE 2. Region I: The Northwestern Temperature
Sub-Region Mean Mean Daily Winter Surface-Based Percentage January Annual Percentage Percentage Annual Temperature (°C) Temperature Frequency of Percentage Precipitation Frequency of Frequency of Range Inversion Occurrence of Frequency of Occurrence of Occurrence of
Frequency Winds > 40 km/h Blizzard Fog or Ice Fog IFR Conditions Occurrence
a: Western Parry 38 to 40°C January: -35 to -33 Begin: Aug. Dec- Feb.: January: 15-20 5-10 100-125 mm from Dec.- Feb.: 10 Dec.- Feb.: 20 Channel from north to south 20-25 from 80% west to east
west to east
July: 5 to 3 from End: June 10-15 June- Aug.: July: 5-10 35-40% falls as July- Aug.: 15-20 June- Aug.: 25-30 south to north from south to 20-40% from liquid
north northwest to precipitation southwest b: Northwestern 38to40°C January: -35 to -33 Begin: Aug. 20 Dec. - Feb.: January: Isachsen- 12, Less than 100 mm Dec. - Feb.: Dec. - Feb.:
Island Fringe from north 80% Isachsen- 17 Mould Bay-5 Isachsen- 14, Isachsen-25, to south Mould Bay-10 Mould Bay- 13 Mould Bay- 17
July: 3 End: June 10 June- Aug.: July: Isachsen-6 30-35% falls as June- Aug.: June- Aug.: to June 25 near 20% Mould Bay-4 liquid Isachsen-24, Isachsen-33, from south precipitation Mould Bay- 16 Mould Bay-25 to north
c: Bathurst-Prince 37 to 39°C January: near -33 Begin: Aug. 25 Dec- Feb.: January: Rea Point Rea Point- 15, 125-150 mm from Dec- Feb.: Dec- Feb.: of Wales or slightly below 80% (short-term station) Resolute-6 west to east Rea Point-6, ReaPoint-21, Islands -16, Resolute- 18 Resolute- 10 Resolute-19
July: 5 to 3 from End: June 15 June- Aug.: July: Rea Point- 3, 35-40% falls as June- Aug.: June- Aug.: south to north 30-40% from Resolute- 10 liquid Rea Point- 13, Rea Point-28,
north to south precipitation Resolute- 17 Resolute-28
Notes for Tables 2-6: 1. Winter is defined here as that period of the year during which the mean daily temperature remains below 0°C. 2. Surface-based air temperature inversion frequency is here based on 1100 (nominally 1200) GMT data. 3. In the strong wind and succeeding columns, either station or areal values are given for the times of year specified. 4. A blizzard condition is said to exist if the following four weather elements occur simultaneously: snow or blowing snow, winds 40 knvh or greater,
visibility 0.8 km or less, and temperature below -12°C. 5. For fog or ice fog, a visibility of 10 km or less is the defined criterion. 6. Instrument flight rules (IFR) are in force with ceiling below 300 m or visibility less than 4.8 km.
This content downloaded from 188.72.126.55 on Thu, 12 Jun 2014 12:37:52 PMAll use subject to JSTOR Terms and Conditions

CLIMATIC REGIONS OF THE ARCTIC ISLANDS 23 1
islands. The summer temperatures of 6°C and 5°C at these locations respectively are some 3-4°C cooler than the in- land areas of the sub-region.
The degree of continentality of the sub-region may be judged from the mean annual temperature range whose values lie in the 42-45°C range. Only in the Eureka area of Ellesmere Island are such large ranges encountered in the rest of the Canadian Arctic Islands. Indeed, the largest mean annual temperature at a long-term recording station is found in this sub-region at Shepherd Bay (44.7°C), which is located just south of Boothia Peninsula.
The dominance of anticyclonic conditions is indicated by the very low precipitation amounts in the southern Victoria Island-King William Island area. Mean annual totals are less than 100 mm at some locations there and thus are second only to the Eureka lowland area in that regard.
Sub-region lib: Melville Peninsula - Southampton Island
Although there are many similarities between this sub- region and the preceding, it is basically a transition zone between continental and maritime conditions. When one considers the area's proximity to such large water bodies as Foxe Basin, Hudson Strait and Hudson Bay, it may even be surprising that the differences from the sub-region to the west are not greater.
Fairly high concentrations of multi-year ice persist in the Committee Bay area during most summers. This, together with a prevailing onshore air flow from the bay onto the rugged, coastal terrain of western Melville Penin- sula, is reflected in the high July frequencies of low cloud, fog and IFR conditions at Mackar Inlet (elevation 430 m). Sea ice persists near the centre of Foxe Basin during the summer, but with large open areas near shore, it does not affect the weather along the eastern side of Melville Penin- sula as greatly.
With prevailing winds from the northwest quadrant dur- ing most of the year resulting in a subsiding flow from the continental land mass upstream, the climate of South- ampton Island is typically continental, except for a short period in July and August when maritime influences are evident along the eastern coastlines.
This sub-region is an area which cyclonic activity begins to be increasingly significant in the local climate. One example involves lows which stagnate and fill in the vici- nity of Foxe Basin. This is particularly reflected in the higher percentage of autumn cloudiness that occurs in the sub-region compared to the area to the west.
As would be expected, the mean annual temperature range is somewhat lower than to the west, lying in the 36-39°C range. Precipitation is generally higher with mean annual totals increasing from 200 to 300 mm from north to south.
TABLE 3. Region II: The South-Central temperature
Sub-Region Mean Mean Daily Winter Surface-Based Percentage January Annual Percentage Percentage Annual Temperature (°C) Temperature Frequency of Percentage Precipitation Frequency of Frequency of Range Inversion Occurrence of Frequency of Occurrence of Occurrence of
Frequency Winds s* 40 km/h Blizzard Fog or Ice Fog IFR Conditions
Occurrence a: Victoria 42to45°C January: -33 to -35 Begin: Aug. 25 Dec. - Feb.: January: Cambridge 150 mm in west to Dec. - Feb.: Dec. - Feb.:
Island-Boothia from west to east in west to 70-80% from Cambridge Bay- 10, Bay-7, Gladman 100 mm in centre to Cambridge Bay- 16, Cambridge Bay-21, Peninsula September 15 east to west Gladman Point-7, Point-5, Pelly 200 mm in east Gladman Point- 10 Gladman Point- 18,
in east Pelly Bay-20 Bay-6 Pelly Bay-26 July: +8 to + 10 End: June 5-15 June- Aug.: July: Cambridge 50-60% falls as June- Aug.: June- Aug.: over land, from west 40-50% from Bay-5, Gladman liquid Cambridge Bay-7, Cambridge Bay- 15, + 8 to +5 to east west to east Point- 3, precipitation Gladman Point- 12 Gladman Point-18, over water Pelly Bay-2 except lesser Pelly Bay-24
over northern
Banks Is. b: Melville 36to39°C January: -33 to -30 Begin: Sept. Dec.- Feb.: January: Coral Coral 200 to 300 mm Dec.- Feb.: Coral Dec- Feb.: Coral
Peninsula- from west to east 5-20 from 80% Harbour-9, Hall Harbour-5, from north Harbour-5, Hall Harbour- 16, Hall Southampton north to Beach-9, Mackar Hall Beach-5, to south Beach- 14, Mackar Beach-23, Mackar Island south Inlet-6 Mackar Inlet-2 Inlet- 17 Inlet- 13
July: +5 to +8 End: June June- Aug.: July: Coral 40-50% falls as June- Aug.: Coral June- -Aug.: Coral from north 10-15 from 30-50% from Harbour-5, Hall liquid Harbour-7, Hall Harbour-12, Hall to south south to south to north Beach-2, Mackar precipitation Bcach-11, Mackar Beach- 15, Mackar
north Inlet-2 Inlet-27 Inlet-26
TABLE 4. Region III. The Western Temperature
Sub-Region Mean Mean Daily Winter Surface-Based Percentage January Annual Percentage Percentage Annual Temperature (°C) Temperature Frequency of Percentage Precipitation Frequency of Frequency of Range Inversion Occurrence of Frequency of Occurrence of Occurrence of
Frequency Winds > 40 km/h Blizzard Fog or Ice Fog IFR Conditions
Occurrence _____ No sub- 36°C January: -28 to -30 Begin: Aug. 30 Dec. - Feb.: January: Cape Cape Parry-4, 125 to 175 mm Dec. - Feb.: Cape Dec. - Feb.: Cape regions from west to east to Sept. 5 75% Parry-8, Clinton Clinton Point-9, from northwest Parry-8, Clinton Parry-16, Clinton
from north Point-18, Sachs Sachs to southeast Point-3, Sachs Point- 15, Sachs to south Harbour-5 Harbour-3 Harbour-4 Harbour- 11
July: +5 to +8 End: May 25 June- Aug.: July: Cape Parry-2, 45-55% falls as liquid June- Aug.: Cape June- Aug.: Cape from north 40-50% from Clinton Point-6, precipitation Parry-20, Clinton Parry-28, Clinton to south north to south Sachs Harbour-3 Point-15, Sachs Point- 16, Sachs
Harbour-17 Harbour-26
This content downloaded from 188.72.126.55 on Thu, 12 Jun 2014 12:37:52 PMAll use subject to JSTOR Terms and Conditions
232 J. B. MAXWELL
Region III: The Western (Table 4)
This region is a fairly small one, reasonably uniform in its climatic controls, and has not been subdivided.
The degree of variety in the weather of this region is considerably greater than in Regions I and II. Maritime air masses moving into the Mackenzie Valley and southern Beaufort Sea from the west and affecting this region are the main influences. The more moderate conditions which this suggests are reflected in the mean annual temperature range which is near 36°C. The annual precipitation amount and the degree of cloudiness in the autumn are both higher than in the Victoria Island-Boothia Peninsula area although they do not compare with the high values in the Eastern Arctic.
It is in this area that the sea ice on the coastal shipping route along the Canadian mainland first deteriorates. South of the arctic pack ice, the cover is generally first- year ice which often clears completely by the end of the summer. The shallow water levels and the relatively warm summer conditions (for the Canadian Arctic Islands, at any rate) are important factors in this clearing.
Region IV: The Eastern (Table 5) Sub-region IV a: Northern Baffin Bay - Lancaster Sound
The northern portion of this sub-region is characterized by mountainous, partly-glacierized terrain which is sur- rounded by water that is mainly subject to first-year ice. An important phenomenon of the area is the North Water (see Fig. 7) of Baffin Bay where open water or thin ice conditions prevail right through the winter. (It is from this feature that some of the first deterioration of sea ice de- velops in the Eastern Arctic in spring. This then spreads southward and westward into Jones and Lancaster sounds.) Lancaster Sound is also mainly influenced by first-year sea ice which clears in the summer; however, occasional intrusions of multi-year floes and icebergs can pose problems for shipping. The land areas along its south- ern edge are plateau-like in nature and, with the exception of By lot Island, are generally unglaciated. The north Baf- fin Bay-Lancaster Sound sub-region is the most northerly sector of the Arctic Islands which is affected at all fre- quently by cyclonic activity originating in the Davis Strait route. Many of the systems stagnate and die here. Pre- cipitation along the exposed coasts of Ellesmere, Coburg, and Devon Islands is heavy with respect to most other Arctic Islands areas (> 300 mm annually), partly due to the storm activity and the abrupt lift of the onshore winds up the rugged coastal slopes, but also because of the presence of the North Water. The north Baffin and Bylot islands coasts receive appreciable amounts of precipita- tion in autumn while Lancaster Sound is open and the prevailing winds have a northerly component. By winter this moisture source is cut off, although Bylot Island likely
continues to be affected to some extent by the presence of the North Water.
The sub-region climate possesses a certain maritime character which, although not as marked as the more southerly and easterly Baffin Island coasts, is certainly more so than the rest of the Canadian Arctic Islands at the same latitude. This is related to the maritime nature of the air masses that invade the area, the presence of open water or thin ice throughout the year in the north, and the tide- torn moving ice of Lancaster Sound in the winter. The mean temperature range lies in the 33-36°C range general- ly, but may be as low as 22°C over the North Water.
Extension of this sub-region to include Prince Regent Inlet has been made because the width ofthat inlet and the adjacent topography suggest that influences over Lancas- ter Sound could easily penetrate it. Sea ice conditions, both in type and movement, are also similar to those experienced in Lancaster Sound.
Sub-region IVb: Gulf of Boothia - Foxe Basin - Western Interior Baffin Island
With the exception of the coastal and water areas where fog and low cloud are common occurrences during the summer, this sub-region may be classed as a generally fair-weather area. Foxe Basin presents a mostly ice- and snow-covered surface to the prevailing northwesterly flow of cold arctic air for more than seven months of the year. During the remaining period, maritime effects are greatest in August and September when the extent of open water in the basin exceeds that of ice, but the influence seldom reaches far inland.
In the east the area is protected by the mountainous backbone of Baffin Island; in the north there is a certain degree of protection, but the terrain is composed more of gentle hills and plateau-like features. This topography effectively separates the area from most of the cyclonic activity moving through the Davis Strait-Baffin Bay corri- dor. In the south, however, occasionally storms in the Hudson Bay area will affect the sub-region, particularly in their mature stages when there apparently is a tendency for them to move into Foxe Basin where they stagnate and fill. The resulting annual precipitation totals decrease from 300 mm to 200 mm from central Baffin Island and its western coast with amounts less than 200 mm over Foxe Basin and Gulf of Boothia. Arctic Bay and Pond Inlet in the northeast receive less than 150 mm due to their shel- tered locations.
One of the most interesting features of this sub-region is the high percentage of surface-based temperature inver- sions that occur in the southern Foxe Basin during the winter. The phenomenon extends to the Southampton Island area of the South-Central region (II) and over the western end of Hudson Strait. Percentages are in excess of 80%, values that are matched in the Canadian Arctic Is- lands only in the Eureka and northwestern islands areas.
This content downloaded from 188.72.126.55 on Thu, 12 Jun 2014 12:37:52 PMAll use subject to JSTOR Terms and Conditions
CLIMATIC REGIONS OF THE ARCTIC ISLANDS 233
Sub-region IVc: Baffin Island Mountains The area of mountainous terrain on Baffin Island ex-
tending from near Pond Inlet in the north to the Cumber- land Peninsula in the south is generally 1000-1600 m ASL with some areas in excess of 2300 m. In the south and east, the edge of the mountains is well-defined, but in the west it becomes plateau-like and hilly.
An interesting aspect of the climate here is the fact that the elevation of the land enables it to escape some of the extreme low temperatures that occur in lowland areas due to the intense surface-based inversions. The result is an area with mean annual temperature range (<33°C) less than the Foxe Basin interior area (35-37°C), but not as low as on the eastern Baffin coast (29-30°C) where the marine influence is very strong. This is also partially due to the fact that in summer the higher altitudes result in cooler temperatures than the surrounding lower areas.
One of the characteristics of this sub-region (and in fact all similar mountainous areas) is the variety of local condi- tions than can occur due to such factors as ponding of cold air and air drainage and local wind effects resulting in air mixing or foehn influences. Locally mild conditions may be due to the latter whereas large-scale warming is related to synoptic-scale influences. In this sub-region, the active cyclonic track to the east is an important influence in that regard.
This cyclonic activity combined with the proximity of a source of moist air, the temperature regime, and the local relief provide the prerequisites for glacial development and a number of glacierized areas are found in the sub- region, chief among them being the Barnes and Penny ice caps. Precipitation throughout the sub-region is generally above 300 mm annually with higher totals on the exposed eastern slopes.
Sub-region IVd: Baffin Island Eastern Coast The thin eastern strip of Baffin Island which forms this
sub-region features a complex series of fiords, each with its own peculiarities. Along southeastern coasts, fiord walls rise abruptly to more than 1000 m. In the north, the fiords penetrate up to 100 km into the mountains, but coastal slopes are not as sheer.
Other than along Hudson Strait, this is the coastal area in the Canadian Arctic Islands where marine influences are greatest. This is reflected in the mean annual tempera- ture range which varies from 30°C in the north to 26°C in the south. In winter, mean temperatures are not nearly as low as in regions at similar latitudes to the west due to the presence of milder air associated with cyclonic systems, the numerous water inlets along the coast, and the occa- sional warming due to milder air moving down the moun- tains. In summer, the southward-moving Baffin cold cur- rent and the heavy concentrations of sea ice which persist until late in the summer season have a marked chilling effect along the coast. In this regard, it is interesting to
note that the final sea ice to melt along the Baffin Island east coast is usually in the vicinity of Home Bay to the north of Broughton Island.
Cloudiness amounts, particularly in southern sections, are high, maintained in winter by vigorous cyclonic activ- ity combined with the abrupt lift provided to an onshore airflow by the coastal cliffs. In summer, the latter, together with the persistent maritime influence of cold seas, results in a high incidence of fog and low clouds. In this regime, annual precipitation averages 400 mm, in- creasing to 600 mm or more on exposed southern coastal slopes. With somewhat less cyclonic activity in northern sections of the sub-region, annual precipitation averages about 200 mm there.
Winds in the sub-region are usually quite strong at un- sheltered locations as low-pressure areas move up the Davis Strait in winter. The high speeds are often main- tained over periods exceeding one or two days.
Sub-region IVe: Southeastern Baffin Island This sub-region has posed some problems as to whether
it should really be a separate area. It does not, however, appear to fit into any of the adjacent sub-regions. In com- parison with the Interior Baffin Island sub-region (IVb), it experiences a significantly higher degree of cyclonic activ- ity, particularly in terms of active systems. Its mean annual temperature range is 5 to 6°C higher than along the Baffin east and south coasts and the terrain is not as rugged or high as the mountainous area of northern and central Baffin Island. Finally, the climate of the sub-region is also significantly different from that of the Hudson Strait area, where ice and moderating maritime influences are so strong.
The area is composed of Cumberland Sound and Fro- bisher Bay and most of the adjacent lands. From both of these large water bodies, valleys trend northwestward through hilly terrain to lowlands on the western side of the island. Prevailing winds down the valleys give somewhat better aviation weather conditions to Frobisher Bay and Pangnirtung, the two stations in the sub-region for which observations are available, than one would expect else- where in the area. As both are located near the heads of large inlets, the marine influence is evident in the summer and autumn. Residual summer sea ice is not usually pres- ent, with clearing of the inlets being complete by mid-July on the average. This is in contrast to the coastal areas directly to the north where sea ice can linger throughout the summer, resulting in relatively cooler temperatures.
Precipitation amounts range from 300-400 mm annually in lowland areas to in excess of 500 mm at the higher elevations. Winter conditions are not as mild as in the Hudson Strait area or the coastal sub-region to the east, but temperatures rise relatively early and rapidly in the spring. In summer, interior temperatures are influenced by cooler air from over the surrounding water, but not as
This content downloaded from 188.72.126.55 on Thu, 12 Jun 2014 12:37:52 PMAll use subject to JSTOR Terms and Conditions

234 J. B. MAXWELL
markedly as on the coasts to the west and south of the sub-region.
Sub-region IVf: Hudson Strait The Hudson Strait area lies at the most southerly lati-
tude of any portion of the Canadian Arctic Islands and the
extreme deficit of solar radiation in winter is not quite so significant here as it is further north. In the western and central parts of the strait, there are ice and moderating marine influences imposed both in summer and winter to about the same extent as along the Baffin Island east coast. The typical characteristics of increased fog and
TABLE 5. Region IV: The Eastern
Sub-Region Mean Mean Daily Winter Surface-Based Percentage January Annual Percentage Percentage Annual Temperature (°C) Temperature Frequency of Percentage Precipitation Frequency of Frequency of Range Inversion Occurrence of Frequency of Occurrence of Occurrence of
Frequency Winds > 40 km/h Blizzard Fog or Ice Fog 1FR Conditions Occurrence
a: Northern 33 to 36°C January: -20 to -33 Begin: Aug. 30 Dec- Feb.: January: Coburg Coburg 150-200 mm Dec- Feb.: Dec- Feb.: Baffin Bay- generally; from northeast to Sept. 5 75% except Island (short-term lsland-5 over water Coburg Island -4, Coburg Island- 18, Lancaster Sound as low as to southwest much lower record) -8 surfaces, up to marine areas 5-20 marine areas 20-25
23°C over over 300 mm on "North "North Open exposed slopes Open Water" of Ellesmcre Water" and Devon Islands
July: +3 to +5 End: June 15 June- Aug.: July: Coburg 40-50% falls as June- Aug.: Coburg June- Aug.: Coburg 30% Island-7, liquid precipitation Island- 13, marine Island-24, marine
"North Open 20% at elevation areas 15-30 areas 25-30
Water"-10 above 400m b. Gulf of 35to37°C January: -32 to -28 Begin: Dec- Feb.: January: De war Dewar Lakes-7, 175-250 mm Dec- Feb.: Arctic Dec- Feb.: Arctic
Boothia-Foxe from northwest to Sept. 5-15 80% Lakes- 13, Longstaff from northwest Bay- 16, Dewar Bay-6, Dewar Basin- southeast from northwest Longstaff Bluff- 3 to southeast Lakes-9, Longstaff Lakes- 15, Longstaff Western to southeast Bluff- 3 Bluff-9 Bluff- 14 Interior Baffin Island
July: +5 to +8 End: June June- Aug.: July: Dewar 40-50% falls as June- Aug.: Arctic June- Aug.: Arctic from northwest 10-15 from 50-40% from Lakes-9, liquid Bay-4, Dewar Bay-3, Dewar to southeast southeast to northwest to Longstaff precipitation Lakes- 16, Longstaff Lakes- 17, Longstaff
northwest southeast Bluff-3 Bluff- 17 Bluff- 18 c: Baffin Island 33°C January: -28 to -23 Begin: Sept. 5 Dec- Feb.: Jan.: 15-20 5-10 Generally more Dec- Feb.: 20-25 Dec- Feb.: 20-25
Mountains from northwest to 70% than 300 mm; southeast 500-600 mm
locally on Cumberland Peninsula
July: +5 to End: June June- Aug.: July: 10 20-25% falls as June- Aug.: 25-30 June- Aug.: 20-25 slightly below 15-20 40-20% from liquid precipitation
north to south ^_____ d: Baffin Island 30to26°C Jan.: -25 to -20 Begin: Sept. Dec. - Feb.: Jan.: Brevoort Brevoort 200 mm in north Dec. - Feb.: Dec - Feb.:
Eastern Coast from north from north 10-25 from 60% lsland-23, lsland-8, to 600 mm Brevoort Brevoort to south to south north to Broughton Broughton locally in Island-20, lsland-29,
south lsland-6, lsland-3, Cape Cape Dyer area Gape Dyer- 12, Cape Dyer- 19, CapeDyer-14, Dyer-4, Clydc-3 to 400 mm Clyde-4 Clyde-12 Clyde-3 in south
July: +5 End: June 15 June- Aug.: July: Brevoort 15-25% in June- Aug.: June- Aug.: 30-20% from lsland-9, north and Brevoort Brevoort north to south Broughton 35-45% in Island-42, lsland-42,
Island- 1, south (except Cape Dyer-32, Cape Dyer- 18, Cape Dyer-3, lesser at high Clyde-12 Clyde- 16 Clyde- 1 elevations)
falls as liquid precipitation
e: Southeastern 33 to 34°C January: -25 Begin: Sept. Dec- Feb.: Jan.: Frobisher Frobisher Generally 400 mm Dec- Feb.: Dec- Feb.: Baffin Island 20-25 70% Bay- 10 Bay-2 except 500 mm at Frobisher Bay-5 Frobisher Bay- 14,
higher elevations Pangnirtung-13 north and south of Frobisher Bay
July: +5 in north End: June 10 June- Aug.: July: 40-45% falls June- Aug.: June- Aug.: to +8 in centre over lowland, 20% Frobisher Bay-3 as liquid Frobisher Bay- 10 Frobisher Bay- 10, to +5 in south June 15 over precipitation, 20% Pangnirtung-10
highland at elevations above 400 m f: Hudson Strait 30°C in Jan.: -25 to -20 Begin: Sept. 30 Dec- Feb.: Jan.: Nottingham Nottingham 275-300 mm Dec- Feb.: Dec- Feb.:
west to from west 80-50% from lsland-8. Resolution lsland-3, Cape from west to east Nottingham Nottingham 22°Cin to east west to east Island - Cape Warwick-7 Island-2, Island- 15, east at Warwick-48 Cape Warwick-38 Cape Warwick-37 Resolution Island
July: +5 to +8 in End: June 5 June- Aug.: July: Nottingham 45-55% falls as June - Aug.: June - Aug.: west, less than 30-10% from Island-2, Cape liquid Nottingham Nottingham + 5 in east west to east Warwick-26 precipitation lsland-9, Island- 14,
on coasts Cape Warwick-45 Cape Warwick-43
g: Baffin Bay- 25 to 30°C January: -20 to -28 Begin: Dec- Feb.: Jan.: 15-20 5 Less than 200 mm Dec- Feb.: 5-10 Dec- Feb.: 20-25 Davis Strait from south Sept. 10-30 60% in north to
to north from north between 300 and to south 400 mm in south
July: between End: June 5-10 June- Aug.: July: 10-15 June- Aug.: 15-20 June- Aug.: 30-35
+3 and -I- 5 20%
This content downloaded from 188.72.126.55 on Thu, 12 Jun 2014 12:37:52 PMAll use subject to JSTOR Terms and Conditions

CLIMATIC REGIONS OF THE ARCTIC ISLANDS 235
cloud occurrence and more moderate temperature condi- tions are present. At the eastern end, however, the proxi- mity to open water in both summer and winter results in the most pronounced marine influence of any area of the Canadian Arctic Islands. Resolution Island, located there, has a mean annual temperature range of only 22°C. In winter, Resolution Island's coldest months are the warm- est of any of the regions while the July mean temperature is almost the lowest of anywhere in the Arctic Islands, even though it is for the southernmost point. The presence of ice in the Hudson Strait waters being flushed from the west and the cold water current down the eastern Baffin Island coast are important factors in this regard. The com- bination of these factors and the presence of warm moist air due to cyclonic activity results in fog formation reaching its maximum occurrence here.
Sub-region IVg: Baffin Bay - Davis Strait This is the only climatic sub-region in the Canadian
Arctic Islands that is entirely a marine area. It includes all the Canadian waters off the east coast of Baffin Island from the North Water in the north to east of Frobisher Bay in the south. The area is composed of water of both Atlan- tic and Arctic influence and is characterized by first-year ice for most of the year. During the summer season, the sea ice cover gradually shrinks from both the north and south so that the Home Bay area experiences sea ice the longest, usually well into August. The cold southward- flowing Baffinland current is the dominant surface water motion of the sub-region. Many icebergs calved from the glaciers of Greenland and Ellesmere Island are carried along in this flow and the water to the east of Clyde is an important staging area for them.
The sub-region is the closest one to the mean cyclone trajectory over the eastern half of Davis Strait, and as a result storm activity in the area is frequent. Injections of relatively milder air because of this and the presence of the water itself keep winter mean temperatures in the -20 to -25°C range, similar to those experienced over Hudson Strait and thus warmer than all other areas of the Arctic Islands. In summer, the cold water and floating ice floes keep mean temperatures below 5°C. The resulting mean annual temperature is around 25 to 30°C, fairly similar to sub-region IVd.
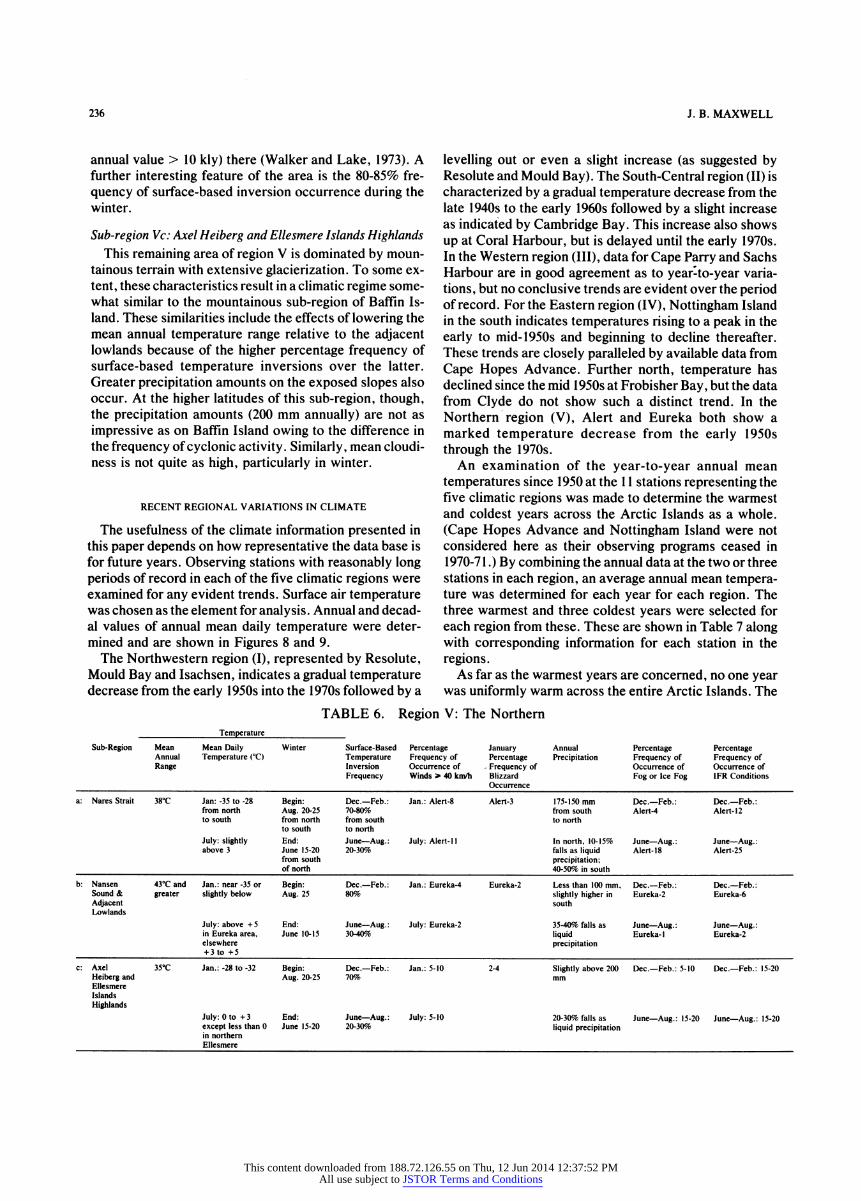
Region V: The Northern (Table 6) Sub-region Va: Nares Strait
This sub-region includes Kane and Hall basins, their connecting channels and the adjacent Ellesmere Island coastal lands. The latter are marked by fiords, but not to the same extent as Baffin Island. The waterways are dominated by a mixture of first- and multi-year sea ice and summer clearing is inhibited by the ice plug that forms in narrow Smith Sound to the south.
Although most of the storm systems in the Eastern Arctic stagnate in northern Baffin Bay, the few that con-
tinue northward between Ellesmere Island and Greenland are enough to make this area different from the rest of region V. This activity is mainly responsible for the sea ice in Nares Strait consolidating later than most of the other narrow Arctic Islands channels, usually not until Febru- ary or March (Dunbar, 1971).
The mean annual temperature range is near 38°C, fairly high, but still significantly lower than the 43°C at Eureka in the interior. Precipitation is less than 200 mm annually, but again this differs from both the higher elevations of Axel Heiberg and Ellesmere islands whose exposed slopes receive in excess of 200 mm, and the interior low- lands which experience less than 100 mm in places.
Along relatively narrow, steep-sided Nares Strait, it appears that downslope winds off either the Greenland or Ellesmere highlands may be frequent and turbulent in winter and often accompanied by low visibilities in blow- ing snow. In the summer and fall, the influences of varying coverages of sea ice-open water lead to high frequencies of fog and low cloud over the channels and along the coast- lines. The same influences probably result in localized fog and low cloud patches during the early winter sea ice consolidation period.
Sub-region Vb: Nansen Sound and Adjacent Lowlands Nansen Sound and the adjacent interior lowlands, prin-
cipally of Ellesmere Island, are almost completely sur- rounded by mountains and the resulting rainshadow effect is indicated by the area's receiving the least mean annual precipitation in Canada. Protected from cyclonic activity along the Baffin Bay storm track by the mountainous barrier of Ellesmere Island and from the occasional cyclo- nic centre moving northward from the western Parry Channel by similarly mountainous Axel Heiberg Island, this essentially continental area has few outside synoptic influences.
The sub-region experiences the greatest mean annual temperature range in the Arctic Islands, 43°C at Eureka. Although not so indicated on Figure 7 due to scale limita- tions, Lake Hazen and vicinity belong in this sub-region. During 1957-58 when temperatures were recorded con- tinuously for one year at Lake Hazen, the mean annual range was 50°C compared to Eureka' s 49°C for the same period. The implication here that some of the interior lowland locations are more continental than Eureka seems reasonable when one considers that in summer the effect of nearby Eureka Sound probably keeps Eureka' s temper- ature down somewhat.
Insofar as aviation weather is concerned conditions are generally favourable. For example, IFR conditions at Eureka occur only 6% and 2% of the time during Decem- ber-to-February and June-to- August respectively.
In comparison with Resolute, some 500 km further south in region I, spring breakup of streams near Eureka is several days earlier. This has been attributed to the lesser cloud cover at Eureka and the higher net radiation (mean
This content downloaded from 188.72.126.55 on Thu, 12 Jun 2014 12:37:52 PMAll use subject to JSTOR Terms and Conditions
236 J. B. MAXWELL
annual value > 10 kly) there (Walker and Lake, 1973). A further interesting feature of the area is the 80-85% fre- quency of surface-based inversion occurrence during the winter.
Sub-region Vc: Axel Heiberg and Ellesmere Islands Highlands This remaining area of region V is dominated by moun-
tainous terrain with extensive glacierization. To some ex- tent, these characteristics result in a climatic regime some- what similar to the mountainous sub-region of Baffin Is- land. These similarities include the effects of lowering the mean annual temperature range relative to the adjacent lowlands because of the higher percentage frequency of surface-based temperature inversions over the latter. Greater precipitation amounts on the exposed slopes also occur. At the higher latitudes of this sub-region, though, the precipitation amounts (200 mm annually) are not as impressive as on Baffin Island owing to the difference in the frequency of cyclonic activity. Similarly, mean cloudi- ness is not quite as high, particularly in winter.
RECENT REGIONAL VARIATIONS IN CLIMATE
The usefulness of the climate information presented in this paper depends on how representative the data base is forniture years. Observing stations with reasonably long periods of record in each of the five climatic regions were examined for any evident trends. Surface air temperature was chosen as the element for analysis. Annual and decad- al values of annual mean daily temperature were deter- mined and are shown in Figures 8 and 9.
The Northwestern region (I), represented by Resolute, Mould Bay and Isachsen, indicates a gradual temperature decrease from the early 1950s into the 1970s followed by a
levelling out or even a slight increase (as suggested by Resolute and Mould Bay). The South-Central region (II) is characterized by a gradual temperature decrease from the late 1940s to the early 1960s followed by a slight increase as indicated by Cambridge Bay. This increase also shows up at Coral Harbour, but is delayed until the early 1970s. In the Western region (III), data for Cape Parry and Sachs Harbour are in good agreement as to year-to-year varia- tions, but no conclusive trends are evident over the period of record. For the Eastern region (IV), Nottingham Island in the south indicates temperatures rising to a peak in the early to mid-1950s and beginning to decline thereafter. These trends are closely paralleled by available data from Cape Hopes Advance. Further north, temperature has declined since the mid 1950s at Frobisher Bay, but the data from Clyde do not show such a distinct trend. In the Northern region (V), Alert and Eureka both show a marked temperature decrease from the early 1950s through the 1970s.
An examination of the year-to-year annual mean temperatures since 1950 at the 1 1 stations representing the five climatic regions was made to determine the warmest and coldest years across the Arctic Islands as a whole. (Cape Hopes Advance and Nottingham Island were not considered here as their observing programs ceased in 1970-71 .) By combining the annual data at the two or three stations in each region, an average annual mean tempera- ture was determined for each year for each region. The three warmest and three coldest years were selected for each region from these. These are shown in Table 7 along with corresponding information for each station in the regions.
As far as the warmest years are concerned, no one year was uniformly warm across the entire Arctic Islands. The
TABLE 6. Region V: The Northern l emperature
Sub-Region Mean Mean Daily Winter Surface-Based Percentage January Annual Percentage Percentage Annual Temperature (°C) Temperature Frequency of Percentage Precipitation Frequency of Frequency of Range Inversion Occurrence of . Frequency of Occurrence of Occurrence of
Frequency Winds > 40 km/h Blizzard Fog or Ice Fog 1FR Conditions Occurrence
a: Nares Strait 38°C Jan: -35 to -28 Begin: Dec- Feb.: Jan.: Alert-8 Alert-3 175-150 mm Dec- Feb.: Dec- Feb.: from north Aug. 20-25 70-80% from south Alert-4 Alert- 1 2 to south from north from south to north
to south to north July: slightly End: June - Aug.: July: Alert-ll In north, 10-15% June - Aug.: June - Aug.: above 3 June 15-20 20-30% falls as liquid Alert- 18 Alert-25
from south precipitation; of north 40-50% in south b: Nansen 43°C and Jan.: near -35 or Begin: Dec - Feb.: Jan.: Eureka-4 Eureka-2 Less than 100 mm, Dec - Feb.: Dec- Feb.:
Sound & greater slightly below Aug. 25 80% slightly higher in Eureka-2 Eureka-6 Adjacent south Lowlands
July: above +5 End: June - Aug.: July: Eureka-2 35-40% falls as June - Aug.: June- Aug.: in Eureka area, June 10-15 30-40% liquid Eureka- 1 Eureka-2 elsewhere precipitation
-1-3 to +5 c: Axel 35°C Jan.: -28 to -32 Begin: Dec- Feb.: Jan.: 5-10 2-4 Slightly above 200 Dec- Feb.: 5-10 Dec- Feb.: 15-20
Heiberg and Aug. 20-25 70% mm Ellesmere Islands Highlands
July: Oto +3 End: June- Aug.: July: 5-10 20-30% falls as June- Aug.: 15-20 June- Aug.: 15-20 except less than 0 June 15-20 20-30% liquid precipitation in northern Ellesmere
This content downloaded from 188.72.126.55 on Thu, 12 Jun 2014 12:37:52 PMAll use subject to JSTOR Terms and Conditions

CLIMATIC REGIONS OF THE ARCTIC ISLANDS 237
.15| Annual mean daily temperature / '
f' A l' ReïOlute A A
16 Decadal running-mean temperature / ^L-.y/ V ' /' A A /I I l'
" 13 Coral Harbour I I I /
18
Cape Parry l' M / 1 / '
16 Sachs Harbour ' 1/
Year
7 Annual mean daily temperature ' I "" - "~ "" - Decadal running-mean temperature I / 1
10 h FrobisherBay 'j 1/ l/W I /"
_ / / 1 Cape Hopes Adv8nce " 6 / / I r-^' A S Region IV A / I / ' / K
I ' /?<., +"* Nottingham Island 'J I
•22 • , . ■
Year
FIG . 8 . Annual mean daily temperature variation in regions I , II and III . FIG. 9. Annual mean daily temperature variation in regions IV and V.
TABLE 7. Warmest and coldest years in the climatic regions on the basis of annual mean daily temperature
Region Station Warmest Years Warmest Years on Coldest Years Coldest Years on at Stations Regional Basis at Stations Regional Basis
1st 2nd 3rd 1st 2nd 3rd [st 2nd 3rd 1st 2nd 3rd I Isachsen 1962 1958 1952 hQ62i 1972 1974 1964
Mould Bay 1973 1969 1962 l ¿?^ J ' 1969 1964 1974 1972 1972 1974 1964
Resolute 1952 1977 1969 l J 1972 1974 1967
II Cambridge Bay 1973 1969 1975 1972 1961 1974 Coral Harbour 1977 1969 1955 Iy// iyW 19/3 1972 1978 1967 197Z 197* 1967
III Cape Parry 1969 1977 1973 1974 1964 1961 Sachs Harbour 1977 1973 1969 1977 1973 1969 1974 1964 1956 1974 1964 1%1
IV Clyde 1969 1960 1955 193:> I877 196° 1972 1961 1978 1Qr> 1972 1Q7R 1978 FrobisherBay 1955 1977 1966 193:> I877 196° 1972 1978 1976 1972 1Qr> 1Q7R 1978 1%1
V Alert 1953 1958 1962 195* 1962 1960 1979 1977 1975 1979 1Q7Q 1Q7, 1972 1Q74 1974 Eureka 1958 1960 1962 195* 1962 1960 1972 1979 1974 1979 1Q7Q 1Q7, 1972 1Q74 1974
year 1977 was warm from east to west south of the Parry Channel, but not to the north, and 1962 showed the oppo- site pattern. For the coldest years, 1972 was almost uni- formly cold across the entire Arctic Islands. The excep- tion was in region III, adjacent to the Beaufort Sea. 1974 was cold north of the Parry Channel and in the west also, but not sufficiently so in the Eastern and South-Central regions to be ranked in the three coldest years of those regions.
It is interesting to note that, of the eight different region- al warmest years, five were before 1963. Of the seven
different regional coldest years, only one was before 1963. This fits with the work of Bradley (1973) and Bradley and England (1978) which pointed out marked summer temperature decreases after about 1963/1964 in the East- ern and Northern Arctic. A comparison of mean max- imum July temperatures (a common index of glacial abla- tion season conditions) for 1948-1963 and 1964-1976 for the 1 1 representative stations of the five climatic regions (Table 8) showed decreases up to 1 .6, 1 .9 and 1 .4°C for the period after 1963 in regions I, IV and V (Northwestern, Eastern, and Northern) respectively and increases under
This content downloaded from 188.72.126.55 on Thu, 12 Jun 2014 12:37:52 PMAll use subject to JSTOR Terms and Conditions

238 J. B. MAXWELL
TABLE 8 . Comparison of July mean maximum temper- ature at 11 stations between 1948-1963 and 1964-1976
Region Station July Mean Maximum Temperature (°C)
1948-1963 1964-1976 Change I Isachsen 6.1 4.7 -1.4
Mould Bay 6.4 6.2 -0.2 Resolute 7.5 5.9 -1.6
H Cambridge Bay lIÕ YL' +0J Coral Harbour 13.3 13.5 +0.2
III Cape Parry (1957)* 8.6 9.1 +0.5 Sachs Harbour (1956) 9J 9J 0.0
IV Clyde 9.2 7.3 -1.9 Frobisher Bay 12.1 11.2 -0.9
V Alert (1950) 7.3 5.9 -1.4 Eureka $3 7.8 -1.1
* Indicates a station where data collection did not begin until after 1948.
0.6°C in regions II and III (South-Central and Western). It would appear from the various above results that a
measurable cooling in the climate has been in progress in the Northern and Eastern Arctic since at least the early 1960s. This cooling is not generally reflected in the Central and Western Arctic south of Parry Channel.
SUMMARY
The pattern of regional climate in the Canadian Arctic Islands outlined here is an attempt to come to grips with the diversity of climatic conditions that characterizes the area. As pointed out, the bias in the network of observa- tions towards coastal locations is a major problem for such a regional delineation. It is felt, however, that the results arrived at provide a useful background for those involved in weather-sensitive activities in the Arctic Islands.
The regional boundaries should, however, be treated cautiously in view of the subjectivity involved in their choice. Obviously, a denser observing network with sites representative of inland and marine areas as well as coast- al ones would provide an improved data base over a long period of time to define the regional boundaries more accurately. In the meantime, much can still be gained through the study of many existing short-term observa- tional data collection programs which support environ- mental and industrial activities in the north. It is hoped that the climatic regions suggested in this study will serve as a basis for discussion in the scientific community and provide greater recognition of the distinct regional clima- tic variation within the Canadian Arctic.
Acknowledgements
I am particularly grateful to Messrs. Angus Headley and John Emmett, who were responsible for much of the initial assembly and abstracting of the climatic data. I would also like to aknow- ledge the helpful comments and critisim of Messrs. Harland Thompson and Malcolm Berry, both former superintendents of the Arctic Meteorology section.
REFERENCES
ALT, B.T. 1975. The Energy Balance Climate of Meighen Ice Cap, N.W.T. 2 Vol. Polar Continental Shelf Project. Ottawa: Dept. Ener- gy, Mines and Resources. 67, 101 p.
. 1978. Synoptic climate controls of mass-balance variation on Devon Island Ice Cap. Arctic and Alpine Research 10(l):61-80.
Arctic Institute of North America. 1968. Arctic Drifting Stations. Pro- ceedings of the Conference, Warrenton, VA. 475 p.
BARRY, R.G. 1964. Weather Conditions at Tanquary Fiord, Summer 1963. Report D. Phys. R. (G) Hazen 23, Canada Defence Research Board. 36 p.
. 1974. A Pressure Pattern Classification for Baffin Island. Tech- nical Bulletin No. 65, Water Resources Branch, Inland Waters Directorate, Ottawa. 31-38.
and FOGARASI, S. 1968. Climatological Studies of Baffin Is- land. Technical Bulletin No. 13, Inland Waters Branch, Ottawa. 106 p.
BARRY, R.G., and HARE, F.K. 1974. Arctic climate. In: Ives, J. and Barry, R. (eds.). Arctic and Alpine Environments. London: Methuen. 17-54.
BARRY, R.G., BRADLEY, R.S. and JACOBS, J.D. 1975. Synoptic climatological studies of the Baffin Island area. In: Weller, G. and Bowling, S.A. (eds.). Climate of the Arctic. Fairbanks: Geophysical Institute, University of Alaska. 82-90.
BERRY, F.A., OWENS, G.V. and WILSON, H.P. 1953. Arctic Weath- er Maps. Project TED-UNL-MA-501, Naval Air Station, U.S. Navy Bureau of Aeronautics, Norfolk. 100 p.
BERRY, M.O., DUTCHAK, P.M., LALONDE, M.E., McCULLOCH, J.A.W. and SAVDIE, I. 1975. Technical Report 21, Beaufort Sea Project, Victoria. 143 p.
and LAWFORD, R.G. 1977. Low-Temperature Fog in the North- west Territories. Technical Memorandum 850, Atmospheric En- vironment Service. 27 p.
BILELLO, M.A. 1966. Survey of Arctic and Subarctic Temperature Inversions. Technical Report 161, Cold Regions Research and En- gineering Lab., Hanover, N.H. 35 p.
. 1973. Prevailing Wind Directions in the Arctic Ocean. Research Report 306, Cold Regions Research and Engineering Lab., Hanover, N.H. 53 p.
BRADLEY, R.S. 1973a. Seasonal climatic fluctuations on Baffin Island during the period of instrumental records. Arctic 26(3): 230-243.
. 1973b. Recent freezing level changes and climatic deterioration in the Canadian Arctic Archipelago. Nature 243:398-400.
and ENGLAND, J. 1978. Recent climatic fluctuations of the Canadian High Arctic and their significance for glaciology. Arctic and Alpine Research 10(4):7 15-731.
BROWN, R.J.E. 1972. Permafrost in the Canadian Arctic Archipelago. Zeitschrift fuer Geomorphologie, N.F. Supplemenband 13:102-130.
BURNS, B.M. 1973, 1974. The Climate of the Mackenzie Valley - Beaufort Sea. 2 Vol. Climatological Studies 24, Atmospheric En- vironment Service, Toronto. 227, 239 p.
BUSHELL, V. (ed.). 1959. Scientific Studies at Fletcher's Ice Island, T-3. 3 Vol. Geophysical Research Papers No. 63, Cambridge Re- search Lab., U.S. Air Force, Bedford, Ma. 219, 117, 114 p.
CATCHPOLE, A.J.W, and MOODIE, D.W. 1971 . Multiple reflection in arctic regions. Weather 26(4): 157-163.
COGLEY, J.G. and McCANN, S.B. 1976. An exceptional storm and its effects in the Canadian High Arctic. Arctic and Alpine Research 8(l):105-110.
COLLIN, A.E. and DUNBAR, M.J. 1964. Physical oceanography in arctic Canada. Oceanography and Marine Biology Annual Review 2:45-75.
COURTIN, G.M. and LABINE, C.L. 1977. Microclimatological studies onTruelove Lowland. In: Bliss, L.C. (ed.). 1977. Truelove Lowland, Devon Island, Canada: A High Arctic Ecosystem. Edmonton: Uni- versity of Alberta Press. 73-106.
CRANE, R.G. 1978. Seasonal variations of sea ice extent in the Davis Strait-Labrador Sea area and relationships with synoptic scale atmos- pheric circulation. Arctic 31(4):434-447.
This content downloaded from 188.72.126.55 on Thu, 12 Jun 2014 12:37:52 PMAll use subject to JSTOR Terms and Conditions

CLIMATIC REGIONS OF THE ARCTIC ISLANDS 239
Dept. Energy, Mines and Resources. 1970. Pilot of Arctic Canada. Vol. 1, 2nd Edition. Ottawa, Canada. 247 p.
Dept. Environment. 1970. Ice Summary and Analysis, Canadian Arctic Waters. Information Canada Catalogue No. En 57-8/1970-4. Ottawa. 74 n
. 1976. Airport Handbook - Arctic. Industrial Meteorology Sec- tion, Atmospheric Environment Service, Toronto. 360 p.
Dept. Transport. 1944. Meteorology of the Canadian Arctic. Meteorolo- gical Division, Toronto. 85 p.
. 1964-1969. Ice Summary and Analysis, Canadian Arctic Waters. Queen's Printer Catalogue No. T57-8/1964-4 to T57-8/1968-4 and Information Canada Catalogue No. En 57-8/1969-4. Ottawa. 79, 82, 80, 82, 82, 82 p.
. 1970. Climate of the Canadian Arctic. Marine Sciences Branch, Hydrographie Service, Dept. Energy, Mines and Resources, Ottawa. 71 p.
DUCK, P.J., BERRY, M.O. and PHILLIPS, D.W. 1977. A Preliminary Analysis of Weather and Weather-Related Factors in Lancaster Sound. Unpubl. Project Report No. 32, Meteorology Applications Branch, Atmospheric Environment Service, Toronto. 29 p.
DUNBAR, M. 1971. Winter Ice Reconnaissance in Nares Strait, 1970- 71. Technical Note 71-34, Defence Research Establishment, Ottawa. 45 p.
and GREENAWAY, K.R. 1956. Arctic Canada from the Air. Defence Research Board, Ottawa. 541 p.
DUNBAR, M.J. 1976. Climatic change and northern development. Arc- tic 29(4): 183-193.
FLETCHER, J.O., MINTZ, Y., ARAKAWA, A. and FOX, T. 1973. Numerical Simulation of the Influence of Arctic Sea Ice on Climate. Technical Note 129, World Meteorological Organization. 181-218.
FLOHN, H. 1969. Climate and Weather. World University Library. New York: McGraw-Hill Book Co. 253 p.
FOGARASI, S. 1972. Weather Systems and Precipitation Characteris- tics over the Arctic Archipelago in the Summer of 1968. Scientific Series No. 16, Water Resources Branch, Inland Waters Directorate, Ottawa. 116 p.
FRASER, D.B. 1959. Unstable Character of Northeasterly Winds at Resolute, N.W.T. Technical Circular 300, Meteorological Branch, Dept. of Transport, Toronto. 14 p.
FRASER, W.C. 1964. A Study of Winds and Blowing Snow in the Canadian Arctic. Technical Circular 548, Meteorological Branch, Dept. of Transport, Toronto. 47 p.
GADE, H.G., LAKE, R.A., LEWIS, E.L. and WALKER, E.R. 1974. Oceanography of an arctic bay. Deep-Sea Research 21:547-571.
HAGGLUND, M.G. and THOMPSON, H.A. 1964. A Study of Sub- Zero Canadian Temperatures. Meteorology Memorandum No. 16, Meteorological Branch, Dept. of Transport, Toronto. 77 p.
HARE, F.K. 1968. The Arctic. Quarterly Journal Royal Meteorological Society 94:439-459.
. 1969. The atmospheric circulation and arctic meteorology. Arc- tic 22(3): 185-193.
and HAY, J.E. 1971. Anomalies in the large-scale annual water balance over northern North America. Canadian Geographer XV(2):70-93.
HARE, F.K. and MONTGOMERY, M.R. 1949. Ice, open water, and winter climate in the Eastern Arctic of North America. Arctic 2:78- 89, 149-164.
HASTINGS, A.D. Jr. 1971. Surface Climate of the Arctic Basin. Report ETL-TR-71-5, U.S. Army Engineer. Topographic Lab., Fort Bel- voir, VA. 96 p.
HENDERSON, P.M. 1967. Cloud Conditions over the Beaufort Sea. Publications in Meteorology No. 83, Arctic Meteorology Research Group, McGill University, Montreal. 48 p.
HENRY, T.J.G. 1947. Meteorological Observations at Winter Harbour, Melville Island. Technical Circular 16, Meteorological Division, Dept. of Transport, Toronto. 23 p.
HIBLER, W.D. Ill, MOCK, S.J., and TUCKER, W.B. III. 1974. Classi- fication and variation of sea-ice ridging in the Arctic Basin. Journal of Geophysical Research 79(1 8): 2735-2743.
HOLMGREN, B. 1971 . Climate and energy exchange on a sub-polar ice cap in summer. 6 Parts. Meddelande Nr. 107-112. Meteorological Institute, Uppsala University. 83, 43, 43, 29, 111, 59 p.
HUSCHKE, R.E. 1969. Arctic Cloud Statistics from " Air-Calibrated" Surface Weather Observations. Research Memo RM-6173-PR, Rand Corp. 79 p.
JACKSON, C.I. 1959. The Meteorology of Lake Hazen, N.W.T. Part I. Publications in Meteorology No. 15, Arctic Meteorology Research Group, McGill University, Montreal. 194 p.
. 1960. The Meteorology of Lake Hazen, N.W.T. Parts II, III, and IV. Publications in Meteorology No. 16, Arctic Meteorology Re- search Group, McGill University, Montreal. 295 p.
. 1961. Summer Precipitation in the Queen Elizabeth Islands. Symposium SD2, Physical Geography of Greenland, Folia Geo- graphica Dánica, TOM IX, Kobenhavn. 140-153.
JACOBS, J.D. and NEWELL, J.P. 1979. Recent year-to-year variations in seasonal temperatures and sea ice conditions in the Eastern Cana- dian Arctic. Arctic 32(4):345-354.
JACOBS, J.D., BARRY, R.G., BRADLEY, R.S. and WEAVER, R.L. 1974. Studies of Climate and Ice Conditions in Eastern Baffin Island, 1971-1973. Occasional Paper No. 9, Institute of Arctic and Alpine Research, University of Colorado, Boulder. 78 p.
KEEGAN, T.J. 1958. Arctic synoptic activity in winter. Journal of Meteorology 15:513-521.
KELLOGG, W.W. 1975. Climatic feedback mechanisms involving the polar regions. In: Weller, G. and Bowling, S.A. (eds.). 1975. Climate of the Arctic. Fairbanks: Geophysical Institute, University of Alas- ka. 111-116.
KLEIN, W.H. 1957. Principal Tracks and Mean Frequencies of Cyc- lones and Anticyclones in the Northern Hemisphere. Research Paper No. 40. Weather Bureau, U.S. Dept. of Commerce, Washington. 60 p.
KOPPEN, W. and GEIGER, R. 1930-1940. Handbuck der Klimatologie. 5 Volumes (incomplete). Berlin.
LAMB, H.H. 1980. The Climatic Environment of the Arctic Ocean. Paper presented to the Arctic Committee Conference on The Arctic Ocean: The Hydrographie Environment and the Fate of Pollutants, London, England, 11-12 March 1980. 36 p.
LEAHEY, D.M. 1967. Sea Ice Growth in Arctic Canada. Technical Circular 637, Meteorological Branch, Dept. of Transport, Toronto. 21 p.
LeDREW, E.F. 1976. Physical Mechanisms Responsible for the Major Synoptic Systems in the Eastern Canadian Arctic in the Winter and Summer of 1973. Occasional Paper No. 22. Institute of Arctic and Alpine Research, University of Colorado, Boulder. 205 p.
LONGLEY, R.W. 1960. Snow depth and snow density at Resolute, Northwest Territories. Journal of Glaciology 3(28):733-738.
. 1972. A Note on Arctic Relative Humidities. Paper presented to the 6th Annual CMS Congress, Edmonton, Alberta, 31 May-2 June, 1972. 12 p.
LOTZ, J. and SAGAR, R.B. 1960. Meteorological work in northern Ellesmere Island, 1957-1960. Weather 15(1 2): 397-406.
MACKAY, D.K. and ARNOLD, K.C. 1965. Access to Meighen Island, N.W.T. Arctic 18(3): 193-198.
MARKHAM, W.E. 1975. Ice Climatology of the Beaufort Sea. Techni- cal Report No. 26, Beaufort Sea Project, Victoria. 87 p.
- . 1977. Ice Climatology of Lancaster Sound. Unpubl. Internal Report Ice Central, Atmospheric Environment Service, Ottawa. 17 p.
MAXWELL, J.B. 1980. The Climate of the Canadian Arctic Islands and Adjacent Waters. Vol. 1. Climatological Studies 30. Atmospheric Environment Service, Toronto. 531 p. (Vol. 2 in press).
, DUCK, P.J., THOMSON, R.B. and VICKERS, G.G. 1980. The Climate of Northwestern Baffin Bay. Unpubl. Report No. 80-2, Canadian Climate Centre, Atmospheric Environment Service, Toronto. 105 p.
McKAY, G.A., FINDLAY, B.F. and THOMPSON, H.A. 1969. A Climatic Perspective of Tundra Areas. Proceedings of the Confer- ence on Products and Conservation in Northern Circumpolar Lands, Edmonton. 10-33.
This content downloaded from 188.72.126.55 on Thu, 12 Jun 2014 12:37:52 PMAll use subject to JSTOR Terms and Conditions

240 J. B. MAXWELL
MORGAN, C.W. 1970. Icebergs of West Greenland. Sea Frontiers 16:328-336.
MÜLLER, F. and ROSKIN-SHARLIN, N. 1967. A High Arctic Climate Study on Axel Heiberg Island. Meteorology No. 3, Axel Heiberg Island Research Reports, McGill University, Montreal. 82 p.
MÜLLER, F., BACHMANN, W., BERGER, P., BLATTER, H., BRAITHWAITE, R., CRAWFORD, J., DUTTER, C, ITO, H., ITO, S., KAPPENBERGER, G., MÜLLER, H., OHMURA, A., SCHRIBER, G., SCHROFF, K., SIEGENTHALER, H.V., ZUST, A. and WEISS, J. 1976. Report on North Water Project Activities, I October 1975 to 30 September 1976. Unpublished report. Swiss Federal Institute of Technology, Zurich and McGill University, Mon- treal. 128 p.
ORVIG, S. (ed.). 1970. Climates of the Polar Regions. World Survey of Climatology. Vol. 14. Amsterdam: Elsevier. 370 p.
PROSTJKOVA, S.M. (ed.). 1968. Atlas of Synoptic Characteristics of the Northern Hemisphere: Part II. Scientific Research Institute of Aeroclimatology, Hydrometeorological Press, Moscow. 214 p.
RAE, R.W. 195 1 . Climate of the Canadian Arctic Archipelago. Meteoro- logical Division, Dept. of Transport, Toronto. 90 p.
REED, R.J. and KUNKEL, B.A. 1960. The arctic circulation in sum- mer. Journal of Meteorology 17:489-506.
SAVDIE, I. and BERRY, M.O. 1976. A Comparison of Weather on the Ice Pack to that of Coastal Stations in the Arctic Islands. Unpubl. Project Report No. 23, Meteorology Applications Branch, Atmos- pheric Environment Service, Toronto. 33 p.
SCHOLEFIELD, P.R. 1978. An Early September Snowstorm which likely Contributed to Crashes of Muskox and Caribou Populations During the 1973-74 Winter on the Parry Islands. Unpubl. Internal Report, Atmospheric Environment Service, Toronto. 18 p.
THOMAS, M.K. 1960. Canadian Arctic Temperatures. Circular 3334, Climate 24, Meteorological Branch, Dept. of Transport, Toronto. 36 p.
. 1975. Recent Climatic Fluctuations in Canada. Climatological Studies 28, Atmospheric Environment Service, Toronto. 92 p.
and THOMPSON, H.A. 1962. Heavy rainfall in the Canadian Arctic during August 1960. Weatherwise 15(4): 153-157, 167.
THOMAS, M.K. and TITUS, R.L. 1958. Abnormally mild temperatures in the Canadian Arctic during January 1958. Monthly Weather Re- view 86:19-22.
THOMPSON, H.A. 1963. Freezing and Thawing Indices in Northern Canada. Technical Memorandum No. 76, National Research Coun- cil, Ottawa. 118-136.
. 1965. The Climate of the Canadian Arctic. Prepared for Canada Year Book 1967, Dominion Bureau of Statistics, Ottawa. 32 p.
THORNTHWAITE, C.W. 1948. An approach towards a rational classi- fication of climate. Geographical Review 38:55-94.
TRESHNIKOV, A.F. and VOSKRESENSKIY, A.V. 1977. Climate of the drift-ice zone. Polar Geography l(l):41-49.
United States Navy. 1958. Océanographie Atlas of the Polar Seas. Part II: Arctic. Publication No. 705, Hydrographie Office, Washington. 149 p.
VOWINCKEL, E. 1962. Cloud Amount and Type over the Arctic. Publications in Meteorology No. 51. Arctic Meteorology Research Group, McGill University, Montreal. 63 p.
and ORVIG, S. 1963. Long- Wave Radiation and Total Radiation Balance at the Surface in the Arctic. Publications in Meteorology No. 62. Arctic Meteorology Research Group, McGill University, Mon- treal. 53 p.
. 1967. Climate change over the polar ocean. Archiv fuer Meter- ologie, Geophysik und Bioklimatologie, serie B. 15:1-23.
WALKER, E.R. 1975. Oil, Ice, and Climate in the Beaufort Sea. Tech- nical Report No. 35, Beaufort Sea Project, Victoria. 39 p.
. 1977. Aspects of Oceanography in the Archipelago. Unpubl. Manuscript, IOS Note-3, Institute of Ocean Sciences, Sidney, B.C. 186 p.
and LAKE, R. A. 1973. Runoff in the Canadian Arctic Archipela- go. In: Weiler, G. and Bowling, S.A. (eds.). 1975. Climate of the Arctic. Fairbanks: Geophysical Institute, University of Alaska. 374- 378.
WALSH, J.E. and JOHNSON, CM. 1979. Interannual atmospheric variability and associated fluctuations in arctic sea ice extent. Journal of Geophysical Research 84(C11): 69 15-6928.
WELLER, G. and BOWLING, S.A. (eds.). 1975. Climate of the Arctic. Fairbanks: Geophysical Institute, University of Alaska. 436 p.
WILSON, C.V. 1967. Introduction. Northern Hemisphere 1. Mono- graph I-A3a, Cold Regions Research and Engineering Lab., Hanov- er, N.H. 141 p.
. 1969. Climatology of the Cold Regions. Northern Hemisphere II. Monograph I-A3b, Cold Regions Research and Engineering Lab., Hanover, N.H. 163 p.
WILSON, H.P. 1973. Arctic Operational Meteorology. Edmonton, Alta.: Queen's Printer. 373 p.
This content downloaded from 188.72.126.55 on Thu, 12 Jun 2014 12:37:52 PMAll use subject to JSTOR Terms and Conditions