Embed Size (px)
Citation preview
CLIMATE CHANGE MITIGATION STRATEGY TO 2050 MELBOURNE TOGETHER FOR 1.5°C
A CITY THAT CARESFOR THE ENVIRONMENT
melbourne.vic.gov.au
Environmental sustainability is the basis of all Future Melbourne goals. It requires current generations to choose how they meet their needs without compromising the ability of future generations to be able to do the same.
Acknowledgement of Traditional Owners
The City of Melbourne respectfully acknowledges the Traditional Owners of the land, the Boon Wurrung and Woiwurrung (Wurundjeri) people of the Kulin Nation and pays respect to their Elders, past and present.
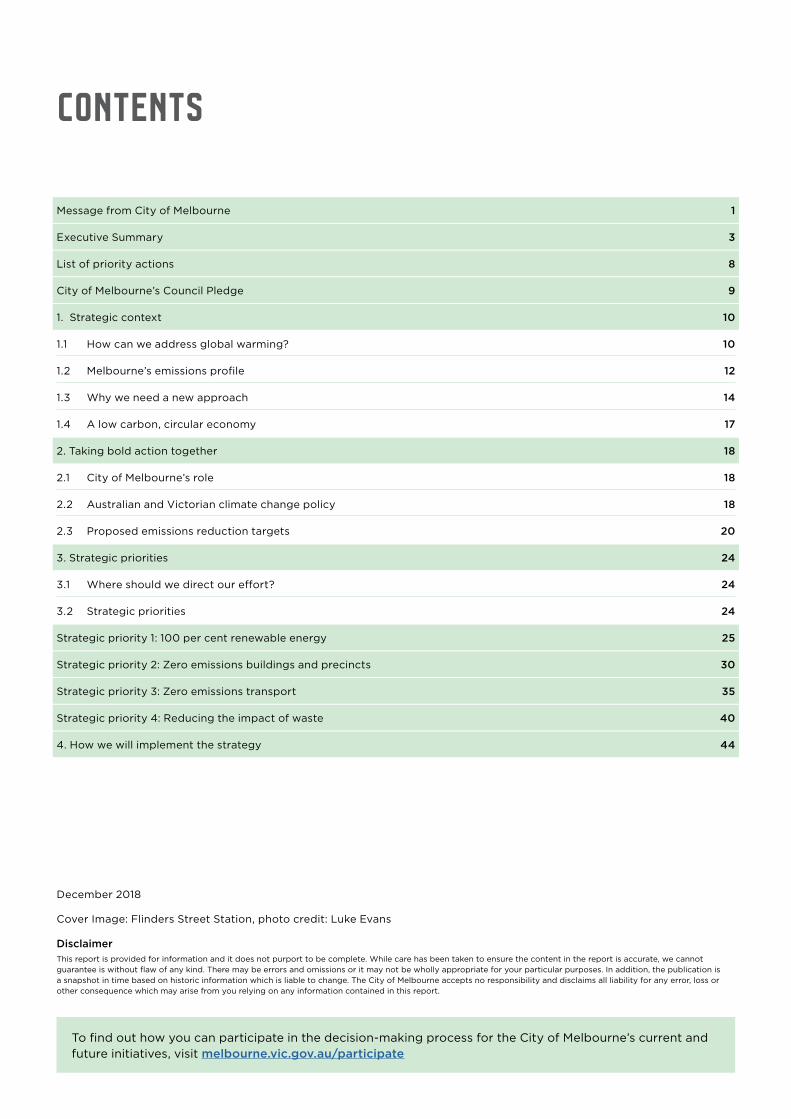
CONTENTS
Message from City of Melbourne 1
Executive Summary 3
List of priority actions 8
City of Melbourne’s Council Pledge 9
1. Strategic context 10
1.1 How can we address global warming? 10
1.2 Melbourne’s emissions profile 12
1.3 Why we need a new approach 14
1.4 A low carbon, circular economy 17
2. Taking bold action together 18
2.1 City of Melbourne’s role 18
2.2 Australian and Victorian climate change policy 18
2.3 Proposed emissions reduction targets 20
3. Strategic priorities 24
3.1 Where should we direct our effort? 24
3.2 Strategic priorities 24
Strategic priority 1: 100 per cent renewable energy 25
Strategic priority 2: Zero emissions buildings and precincts 30
Strategic priority 3: Zero emissions transport 35
Strategic priority 4: Reducing the impact of waste 40
4. How we will implement the strategy 44
To find out how you can participate in the decision-making process for the City of Melbourne’s current and future initiatives, visit melbourne.vic.gov.au/participate
December 2018
Cover Image: Flinders Street Station, photo credit: Luke Evans
DisclaimerThis report is provided for information and it does not purport to be complete. While care has been taken to ensure the content in the report is accurate, we cannot guarantee is without flaw of any kind. There may be errors and omissions or it may not be wholly appropriate for your particular purposes. In addition, the publication is a snapshot in time based on historic information which is liable to change. The City of Melbourne accepts no responsibility and disclaims all liability for any error, loss or other consequence which may arise from you relying on any information contained in this report.
melbourne.vic.gov.auiv
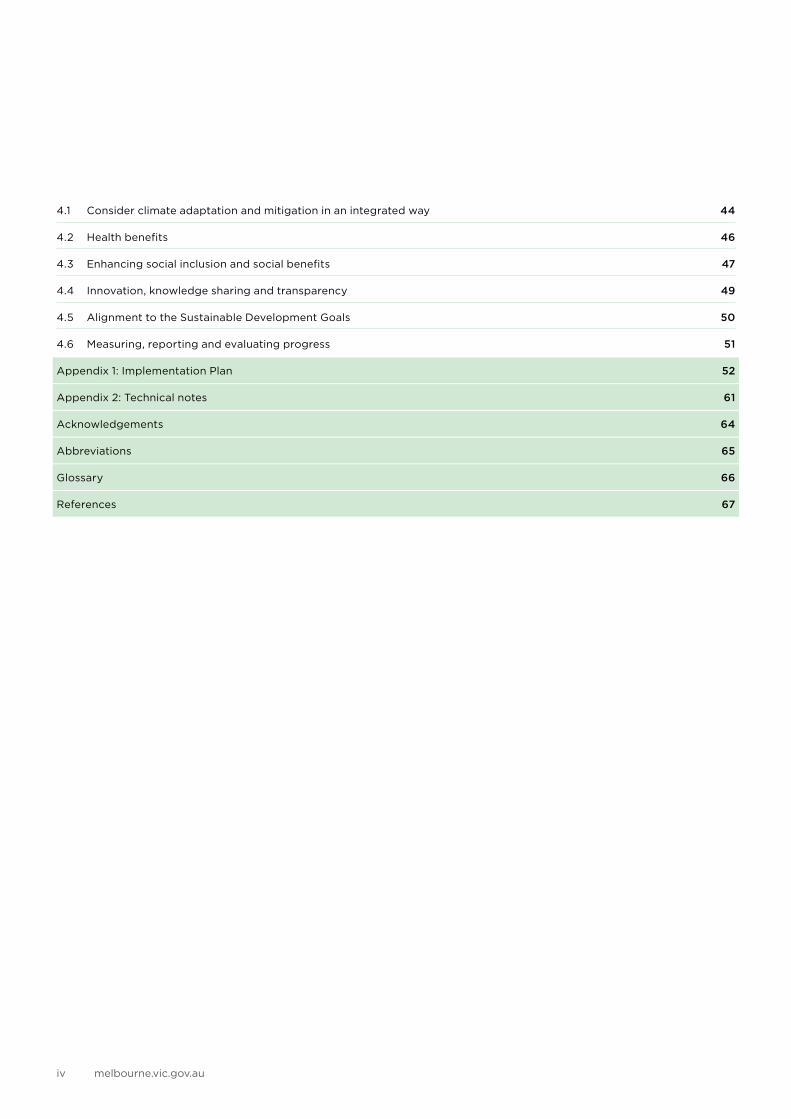
4.1 Consider climate adaptation and mitigation in an integrated way 44
4.2 Health benefits 46
4.3 Enhancing social inclusion and social benefits 47
4.4 Innovation, knowledge sharing and transparency 49
4.5 Alignment to the Sustainable Development Goals 50
4.6 Measuring, reporting and evaluating progress 51
Appendix 1: Implementation Plan 52
Appendix 2: Technical notes 61
Acknowledgements 64
Abbreviations 65
Glossary 66
References 67
Climate Change Mitigation Strategy to 2050 v
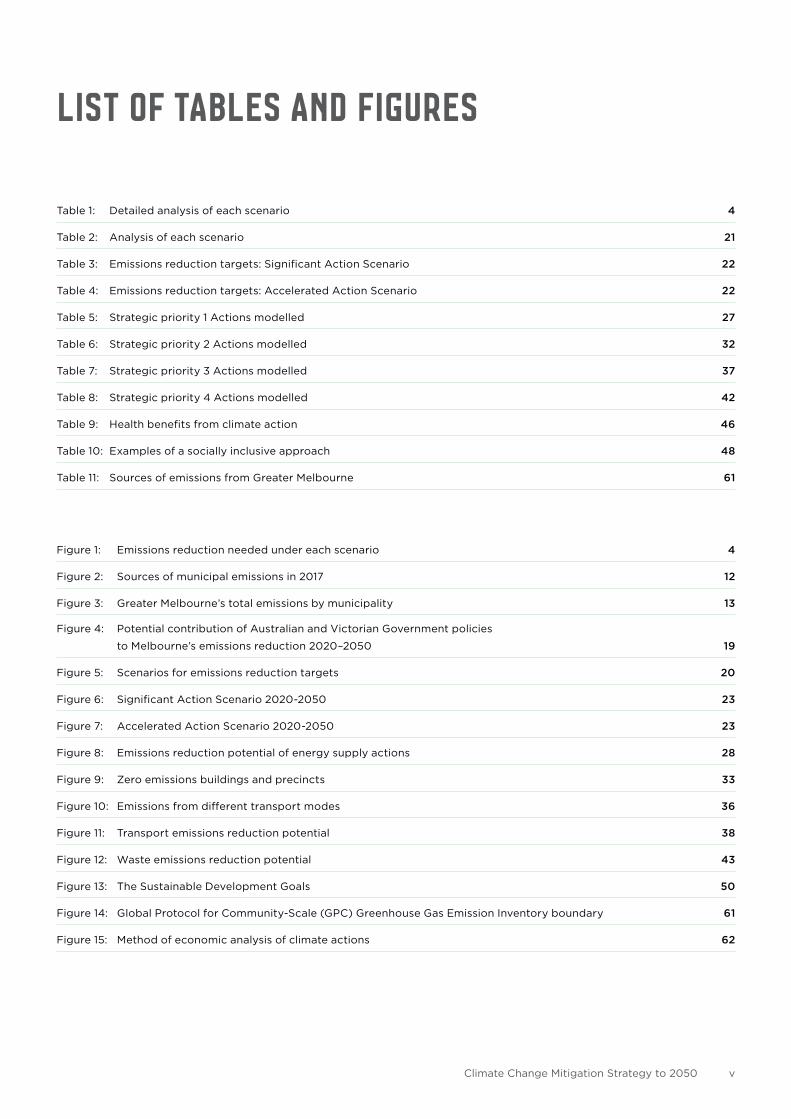
LIST OF TABLES AND FIGURES
Table 1: Detailed analysis of each scenario 4
Table 2: Analysis of each scenario 21
Table 3: Emissions reduction targets: Significant Action Scenario 22
Table 4: Emissions reduction targets: Accelerated Action Scenario 22
Table 5: Strategic priority 1 Actions modelled 27
Table 6: Strategic priority 2 Actions modelled 32
Table 7: Strategic priority 3 Actions modelled 37
Table 8: Strategic priority 4 Actions modelled 42
Table 9: Health benefits from climate action 46
Table 10: Examples of a socially inclusive approach 48
Table 11: Sources of emissions from Greater Melbourne 61
Figure 1: Emissions reduction needed under each scenario 4
Figure 2: Sources of municipal emissions in 2017 12
Figure 3: Greater Melbourne’s total emissions by municipality 13
Figure 4: Potential contribution of Australian and Victorian Government policies
to Melbourne’s emissions reduction 2020–2050 19
Figure 5: Scenarios for emissions reduction targets 20
Figure 6: Significant Action Scenario 2020-2050 23
Figure 7: Accelerated Action Scenario 2020-2050 23
Figure 8: Emissions reduction potential of energy supply actions 28
Figure 9: Zero emissions buildings and precincts 33
Figure 10: Emissions from different transport modes 36
Figure 11: Transport emissions reduction potential 38
Figure 12: Waste emissions reduction potential 43
Figure 13: The Sustainable Development Goals 50
Figure 14: Global Protocol for Community-Scale (GPC) Greenhouse Gas Emission Inventory boundary 61
Figure 15: Method of economic analysis of climate actions 62
vi melbourne.vic.gov.au
Climate Change Mitigation Strategy to 2050 1
MESSAGE FROM CITY OF MELBOURNE
This Climate Change Mitigation Strategy is a major commitment to action.
The City of Melbourne is proud to be part of a local and international movement of cities that will act to reduce emissions and to address climate change impacts.
Through this strategy we will continue to lead and inspire ambitious and rapid climate change action among our residents, community organisations, businesses, investors and all levels of government in Australia and around the world.
The City of Melbourne is already investing in renewable energy, urban forests, green buildings, waste innovation and in better pedestrian and cycling infrastructure. Through such creative initiatives, we can deliver better health for our community together with economic, social and environmental benefits. A more resilient city will be better prepared for heatwaves, storms and drought.
This strategy guides our next steps in reducing the largest sources of emissions in our municipality – to achieve our science-based targets and to align our actions with the Paris Agreement on climate change.
We need to take urgent action, together with the Victorian and Australian governments, to strengthen an international effort to limit global warming to 1.5°C. We invite you to join us in our commitment to transformational action, with clear benefits for all who live and work in our city.
Sally Capp Lord Mayor City of Melbourne
Cr Cathy Oke Portfolio Chair, Environment

melbourne.vic.gov.au2
Climate Change Mitigation Strategy to 2050 3
EXECUTIVE SUMMARY
Local action, global leadership
The City of Melbourne is leading by example, demonstrating the possible and sharing the solutions to climate change.
In 2003, we set an ambitious target of zero net emissions for the municipality of Melbourne by 2020. We were one of the first cities to set such an ambitious target and many other cities followed our lead. We are now part of a movement of cities around the world taking bold action for the benefit of our communities and for future generations.
The global role of cities in stepping up to act on climate change was recognised in the 2015 Paris Climate Agreement. Since that time, national and state governments, cities, investors, businesses and communities alike have begun to take action to reduce greenhouse gas emissions to help avoid a global average temperature rise of 1.5°C.
The Intergovernmental Panel on Climate Change has conveyed a clear message to leaders around the world that climate change is already impacting communities and that urgent action is needed. The Australian Government has ratified the Paris Climate Agreement and the Victorian Government has introduced the Climate Change Act 2017. This provides a fresh opportunity for the City of Melbourne to pursue our long-standing commitment to act on the emissions that cause climate change.
To align with the 2015 Paris Climate Agreement, we now need to reset ambitious emissions reduction targets for 2030,1 achieve net zero emissions before 2050 and align our strategy to the C40 Climate Action Plan Framework.2
This Climate Change Mitigation Strategy identifies the actions that we can take to leverage systemic change. We want to pilot a virtual power plant powered by renewables in the city. We will expand the ground-breaking Melbourne Renewable Energy Project (MREP) to facilitate power purchase agreements for businesses across the city. This will generate investment in new renewable energy.
We will also advocate for Victorian and Australian Government action to deliver 100 per cent renewable energy to our city and to increase the ambition of Australia’s climate policy.
Taking bold action together
In 2016, the City of Melbourne hosted a deliberative democracy process, the Future Melbourne Refresh, to develop a community vision and set priorities for Melbourne. Reducing greenhouse gas emissions from the municipality was identified as a top priority and this is reflected in our Council Plan 2017–2021. This view is shared across Victoria: 80 per cent of people are willing to act on climate change and 87 per cent think local government should be taking action.3
Our Council Pledge to reduce emissions is the first of its kind under the Victorian Climate Change Act 2017. The strategy has been developed as part of the C40 Climate Action Planning Pilot Program, sharing our approach with other cities including: Boston, Durban, Los Angeles, London, Mexico City, New York and Paris. We've developed it as an example for others to use and improve as part of our commitment to local government leadership.
The City of Melbourne will partner with industry and the Victorian and Australian Governments to demonstrate zero emissions for the Fishermans Bend and Arden precincts and remove barriers to zero emissions buildings. We will advocate for effective building standards to reduce emissions.
We will invest in better walking and cycling infrastructure and advocate for Melbourne’s public transport to be efficient and powered by 100 per cent renewable energy. We will apply a circular economy approach to reduce emissions from buildings and precincts.
And we will collaborate with community organisations, businesses, cities, and government agencies to reduce climate risk and fulfil our legislative responsibilities. This strategy is supported by a rolling five-year Implementation Plan (see Appendix 1), fulfilling our first Council Pledge under the Climate Change Act 2017.
1 The calculation for 2030 needs to follow the C40 Deadline 2020 approach with contraction and convergence of emissions by 2030. 2 The C40 Cities Climate Action Planning Framework supports cities in developing climate action plans. It sets out the essential components
of a climate action plan that is deemed to be compatible with the objectives of the Paris Agreement.3 Sustainability Victoria Social Research on Climate Change 2016.
melbourne.vic.gov.au4
Raising our ambition
Aligning to the science-based targets in the Paris Climate Agreement requires a mix of delivery mechanisms: engaging, facilitating, collaborating and partnering. We will lead the delivery of actions within our powers and advocate for policy change and action from others.
To inform the development of the strategy we analysed four scenarios:
1. Business as Usual (BAU)
2. Significant Action to reduce emissions
3. Accelerated Action to reduce emissions
4. Purchasing Offsets from 2020.
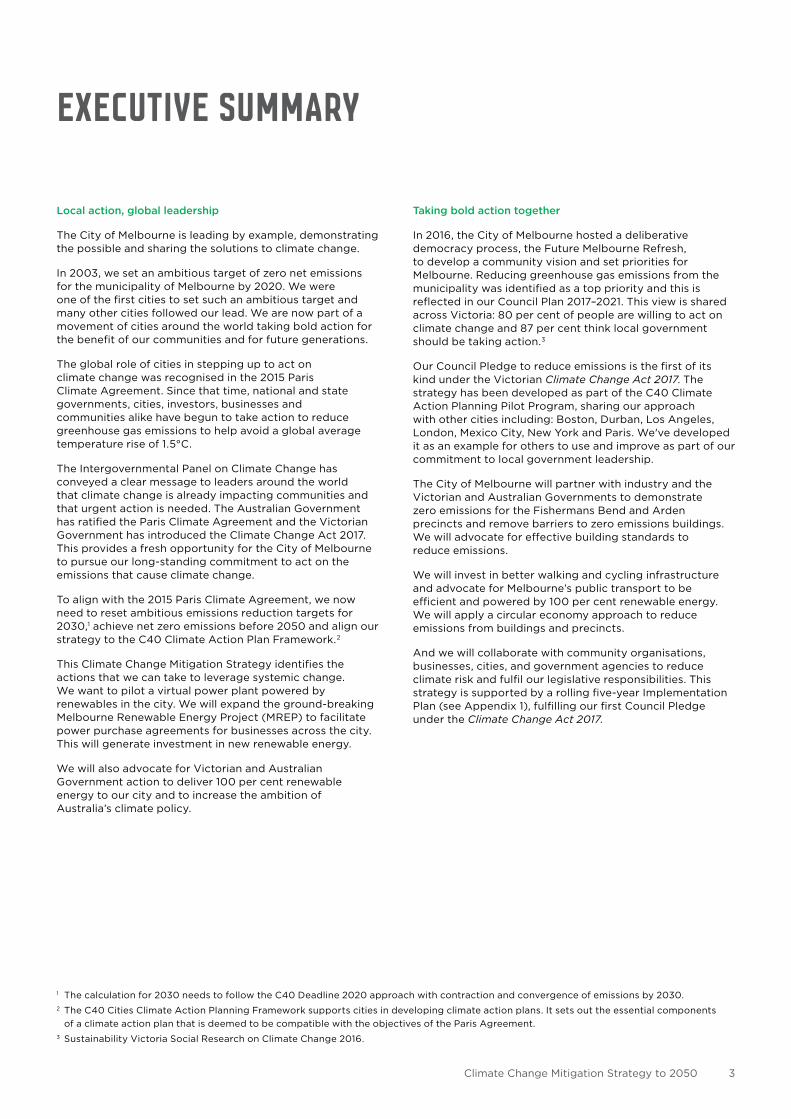
Both the Significant and Accelerated Action scenarios require investors, businesses and the Victorian and Australian Governments to take action.
The chart below summarises the four scenarios. It illustrates the reduction in emissions needed as part of the international effort to stay below a 1.5°C rise in global average temperatures.
Figure 1: Emissions reduction needed under each scenario
Table 1: Detailed analysis of each scenario
Table 1 below summarises the characteristics of each scenario and emissions reduction by 2025 and 2030.4
SCENARIOEMISSIONS REDUCED BY 2025*
EMISSIONS REDUCED BY 2030*
TARGET PER PERSON IN 2030
NET ZERO EMISSIONS
ALIGNED TO 1.5°C PARIS CLIMATE AGREEMENT
1. Business as Usual
-3%** -6%** 22.1tCO2-e never no
2. Significant Action
-10% -29% 14.3tCO2-e 2050 yes
3. Accelerated Action
-21% -50% 10.7tCO2-e 2043 yes
4. Purchasing Offsets
-100% -100% 22.1tCO2-e 2020 no
* Compared to 2015 baseline emissions. ** Assumes Victorian Renewable Energy Target to 2025.
4 Ernst & Young (2018). Economic Analysis. Prepared for C40 and City of Melbourne.
Climate Change Mitigation Strategy to 2050 5
5 Ernst & Young (2018). Synthesis Report. Prepared for C40 and City of Melbourne. Estimated cost of offsets in 2020 converted to Australian dollars.
6 Ernst & Young (2018). Synthesis Report. Prepared for C40 and City of Melbourne. Estimated cost of offsets in 2020 converted to Australian dollars.
Our preferred approach: Significant Action Scenario
The City of Melbourne’s preferred approach is to deliver the actions needed to achieve the Significant Action Scenario and pursue actions for the Accelerated Action Scenario where there is the opportunity to go further. This will require us to take bold action within our powers, collaborate and advocate for policy change from the Victorian and Australian Governments. Our approach aligns with the Paris Climate Agreement while acknowledging our limited powers and financial resources.
Under the Business as Usual Scenario, the impacts of climate change and missed economic opportunities of transitioning to a low carbon economy will cost AU$12.6 billion to the municipality’s economy by 2050.5
The Significant Action and Accelerated Action Scenarios not only reduce the future economic burden of climate change, but also provide economic stimulus, generating over 30,000 jobs and over AU$5 billion in economic value by 2050.
Realising these benefits will require collaborative action across all three levels of government. Without effective policy changes in state and national jurisdictions, the City of Melbourne will not achieve alignment to the Paris Climate Agreement targets.
The estimated cost to the City of Melbourne of the Purchasing Offsets Scenario would be AU$240—480 million per year and would not address the underlying causes of emissions in the municipality.6 For these reasons the Business as Usual and Purchasing Offsets Scenarios are not in the best interests of the municipality.
Strategic priorities
The City of Melbourne has identified four priorities for action in achieving our emissions reduction targets:
1. 100 per cent renewable energy
2. zero emissions buildings and precincts
3. zero emissions transport
4. reducing the impact of waste.
To implement the strategy we will:
• integrate climate adaptation and mitigation
• deliver environmental, social and economic benefits to the community
• support innovation, knowledge sharing and transparency
We will focus on reducing the largest sources of emissions in the municipality to achieve our science-based targets and align this strategy to the Paris Climate Change Agreement and C40 Climate Action Plan Framework. The strategy demonstrates our support for social inclusion and contributes to achieving the Sustainable Development Goals.
melbourne.vic.gov.au6
Long-term thinking, short-term action
The decisions made today about energy, infrastructure, buildings and transport planning will lock in the pathway to achieving rapid decarbonisation of the municipality. This strategy is part of a suite of strategies delivering step-change for our community as part of our Council Plan 2017–2021. These include our Climate Change Adaptation, Nature in the City, Urban Forest Strategy, Transport, and Waste and Resource Recovery strategies.
The timeframe for this strategy is 1 January 2019 to 31 December 2050 with an interim target for 31 December 2030. This aligns to the timing of the Paris Climate Agreement. A rolling five-year Implementation Plan, aligned to the Council Pledge requirements of the Climate Change Act 2017, accompanies this strategy (see Appendix 1).
We will measure and report our progress to the community annually and evaluate the implementation plan by 2025.
“The principle of inter-generational equity recognises that decisions made today will determine the future climate that children and future generations will experience. Climate change will impact everyone who lives, works and plays in the city.”

7Climate Change Mitigation Strategy to 2050
melbourne.vic.gov.au8
These priority actions will inform the City of Melbourne’s planning and resourcing considerations and will be subject to Annual Plan and Budget processes.
Reduce emissions from Council operations
1.0 Continue to lead by example by reducing emissions from our operations, supply chain and business practices.
Priority 1: 100 per cent renewable energy
1.1 Advocate for a more ambitious renewable energy target and changes to the National Electricity Rules.
1.2 Accelerate corporate Power Purchase Agreements.
1.3 Facilitate residential purchasing of renewable energy products.
1.4 Facilitate a virtual power plant or solar garden for residents or small businesses.
1.5 Collaborate with other cities, investors and superannuation companies to accelerate divestment from fossil-fuel energy supply.
1.6 Partner with businesses, universities, healthcare services and other organisations to promote innovative renewable energy technology and research.
Priority 2: Zero emissions buildings and precincts
2.1 Demonstrate innovative carbon positive design and operation of council-owned buildings and precincts.
2.2 Partner with industry and Victorian and Australian Government agencies to reduce barriers and deliver zero emissions buildings and urban renewal precincts.
2.3 Accelerate existing commercial buildings and tenants’ energy efficiency programs through CitySwitch and other partnerships.
2.4 Advocate for energy performance disclosure for a greater range of commercial and residential buildings.
2.5 Facilitate the take up of the National Built Environment Rating Scheme for apartments across the municipality.
2.6 Renew and implement planning policies to support the development of zero emissions buildings and precincts.
2.7 Partner with industry to advocate for higher energy performance standards in the National Construction Code, Building Act 1993 and regulations.
2.8 Advocate and facilitate to transition from gas to electricity in buildings and precincts.
2.9 Adopt circular economy principles to reduce the environmental impact and embodied emissions from products, materials and buildings across the city through procurement, urban design and planning.
Priority 3: Zero emissions transport
3.1 Continue to reallocate road space to create more space for walking, cycling and green infrastructure.
3.2 Prioritise active and public transport through dedicated lanes, traffic light priorities, parking controls and road user pricing.
3.3 Advocate for energy efficiency public transport powered by renewable energy.
3.4 Advocate for the Victorian Government to extend train, tram and bus services.
3.5 Advocate for lower carbon intensity of motor vehicles and support transition to electric vehicles.
Priority 4: Reducing the impact of waste
4.1 Continue to promote and facilitate waste avoidance, recycling, recovery and diversion of waste from landfill by implementing a Waste and Resource Recovery Strategy.
Enabling actions to implement the strategy effectively
5.1 Promote the actions needed to achieve emission reductions to the community, businesses and government decision-makers.
5.2 Identify and address synergies, trade-offs and feedback loops between the implementation of the Climate Change Mitigation Strategy to 2050, Climate Change Adaptation, Nature in the City Strategy and other relevant strategies including transport and waste.
5.3 Take an innovative, evidence-based approach to prioritising actions and open data on our emissions profile for urban researchers to develop new solutions.
5.4 Participate in city networks to share knowledge and continue to co-lead the C40 Low Carbon Districts and Climate Positive forum to learn from innovative international projects.
5.5 Report progress in reducing emissions annually and update the rolling five-year Implementation Plan based on progress.
5.6 Evaluate the implementation of the strategy by 2025 to meet the Council Pledge requirements under the Climate Change Act 2017.
LIST OF PRIORITY ACTIONS
Climate Change Mitigation Strategy to 2050 9
Greenhouse Gas Emissions Reduction Statement In accordance with the Climate Change Act 2017
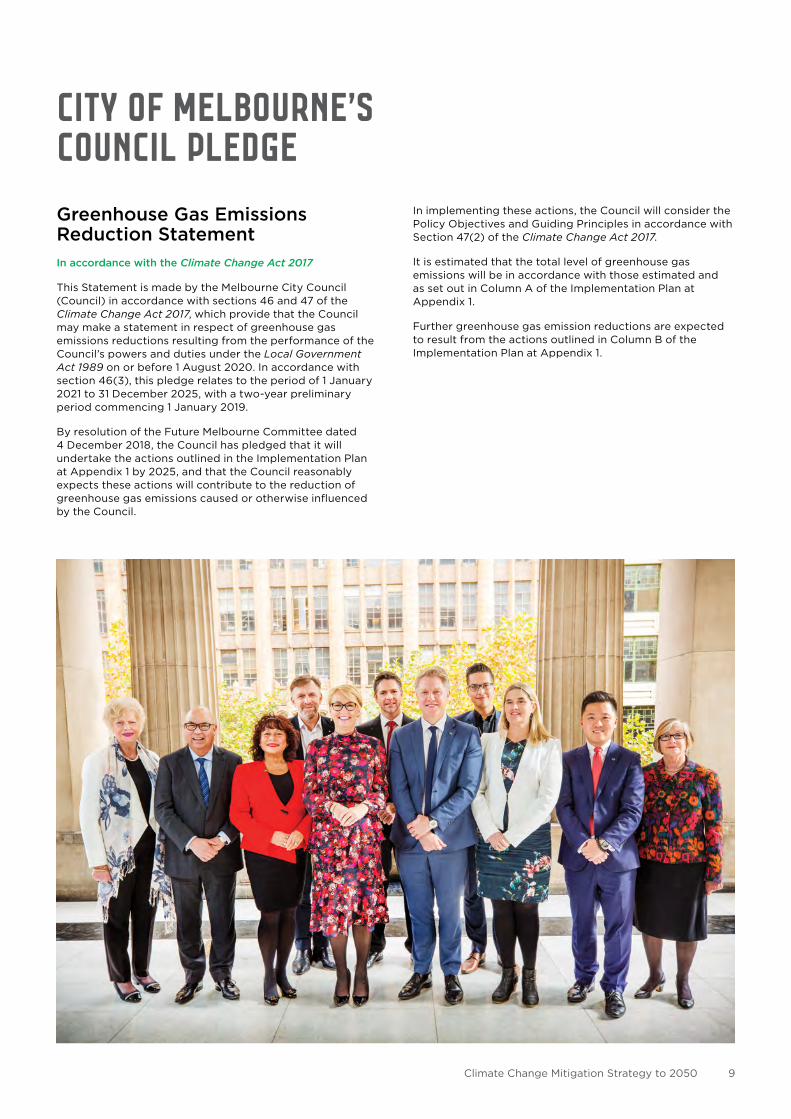
This Statement is made by the Melbourne City Council (Council) in accordance with sections 46 and 47 of the Climate Change Act 2017, which provide that the Council may make a statement in respect of greenhouse gas emissions reductions resulting from the performance of the Council’s powers and duties under the Local Government Act 1989 on or before 1 August 2020. In accordance with section 46(3), this pledge relates to the period of 1 January 2021 to 31 December 2025, with a two-year preliminary period commencing 1 January 2019.
By resolution of the Future Melbourne Committee dated 4 December 2018, the Council has pledged that it will undertake the actions outlined in the Implementation Plan at Appendix 1 by 2025, and that the Council reasonably expects these actions will contribute to the reduction of greenhouse gas emissions caused or otherwise influenced by the Council.
In implementing these actions, the Council will consider the Policy Objectives and Guiding Principles in accordance with Section 47(2) of the Climate Change Act 2017.
It is estimated that the total level of greenhouse gas emissions will be in accordance with those estimated and as set out in Column A of the Implementation Plan at Appendix 1.
Further greenhouse gas emission reductions are expected to result from the actions outlined in Column B of the Implementation Plan at Appendix 1.
CITY OF MELBOURNE’S COUNCIL PLEDGE
melbourne.vic.gov.au10
6 Intergovernmental Panel on Climate Change (2018). Special Report on Global Warming of 1.5°C.
1.STRATEGIC CONTEXT
"According to climate scientists, global average temperatures have already risen by 1°C and this is contributing to increasingly severe heatwaves, droughts, and storms."
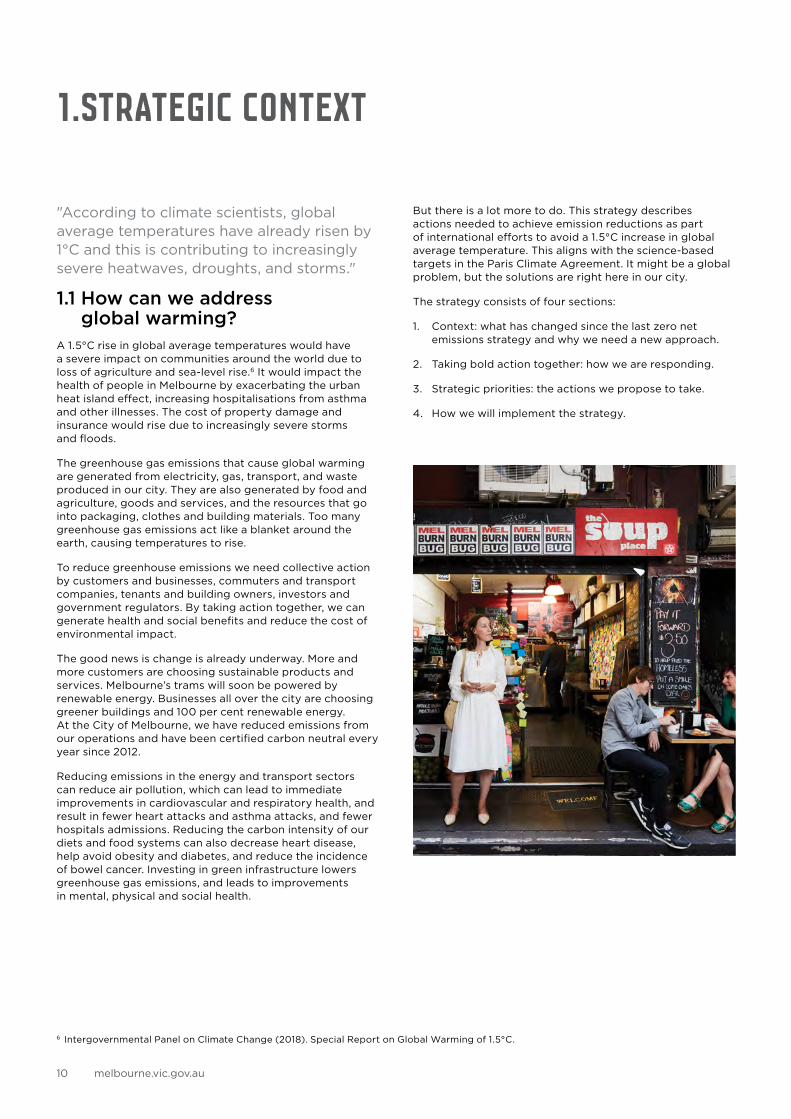
1.1 How can we address global warming?
A 1.5°C rise in global average temperatures would have a severe impact on communities around the world due to loss of agriculture and sea-level rise.6 It would impact the health of people in Melbourne by exacerbating the urban heat island effect, increasing hospitalisations from asthma and other illnesses. The cost of property damage and insurance would rise due to increasingly severe storms and floods.
The greenhouse gas emissions that cause global warming are generated from electricity, gas, transport, and waste produced in our city. They are also generated by food and agriculture, goods and services, and the resources that go into packaging, clothes and building materials. Too many greenhouse gas emissions act like a blanket around the earth, causing temperatures to rise.
To reduce greenhouse emissions we need collective action by customers and businesses, commuters and transport companies, tenants and building owners, investors and government regulators. By taking action together, we can generate health and social benefits and reduce the cost of environmental impact.
The good news is change is already underway. More and more customers are choosing sustainable products and services. Melbourne’s trams will soon be powered by renewable energy. Businesses all over the city are choosing greener buildings and 100 per cent renewable energy. At the City of Melbourne, we have reduced emissions from our operations and have been certified carbon neutral every year since 2012.
Reducing emissions in the energy and transport sectors can reduce air pollution, which can lead to immediate improvements in cardiovascular and respiratory health, and result in fewer heart attacks and asthma attacks, and fewer hospitals admissions. Reducing the carbon intensity of our diets and food systems can also decrease heart disease, help avoid obesity and diabetes, and reduce the incidence of bowel cancer. Investing in green infrastructure lowers greenhouse gas emissions, and leads to improvements in mental, physical and social health.
But there is a lot more to do. This strategy describes actions needed to achieve emission reductions as part of international efforts to avoid a 1.5°C increase in global average temperature. This aligns with the science-based targets in the Paris Climate Agreement. It might be a global problem, but the solutions are right here in our city.
The strategy consists of four sections:
1. Context: what has changed since the last zero net emissions strategy and why we need a new approach.
2. Taking bold action together: how we are responding.
3. Strategic priorities: the actions we propose to take.
4. How we will implement the strategy.
Climate Change Mitigation Strategy to 2050 11
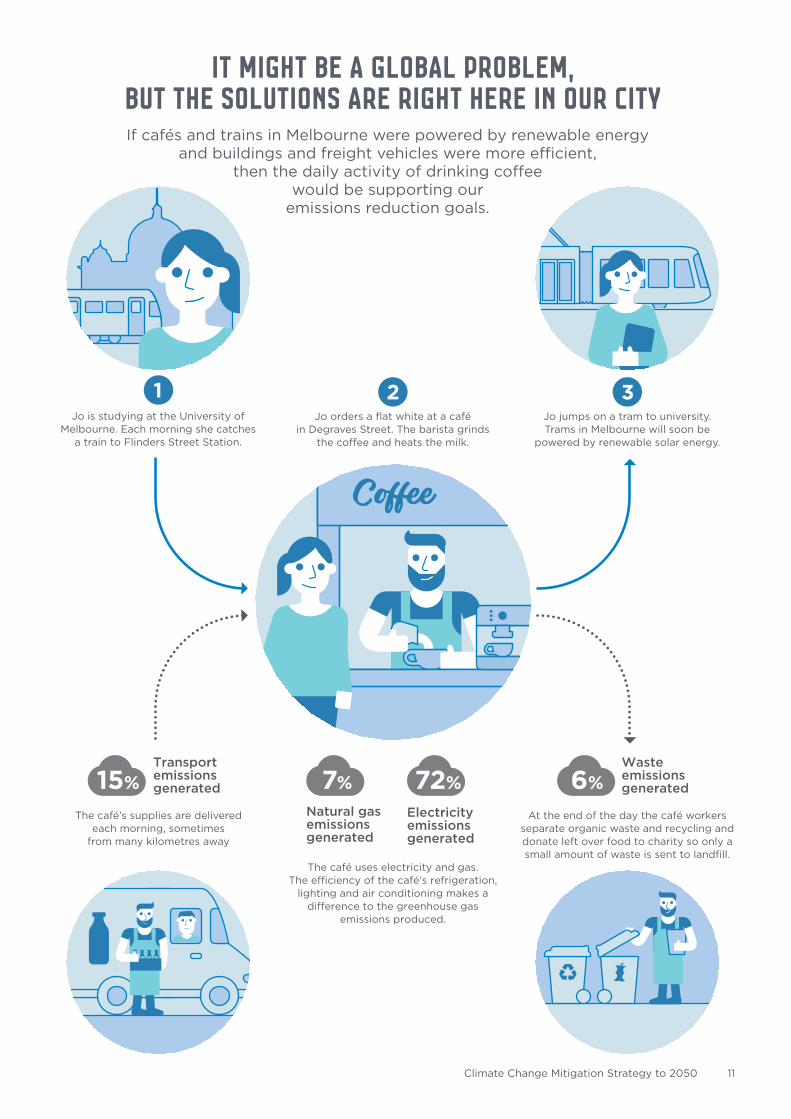
IT MIGHT BE A GLOBAL PROBLEM,BUT THE solutionS ARE RIGHT HERE IN OUR CITY
Jo is studying at the University of Melbourne. Each morning she catches
a train to Flinders Street Station.
Jo orders a flat white at a café in Degraves Street. The barista grinds
the co�ee and heats the milk.
Jo jumps on a tram to university. Trams in Melbourne will soon be
powered by renewable solar energy.
The café uses electricity and gas. The efficiency of the café’s refrigeration,
lighting and air conditioning makes a difference to the greenhouse gas
emissions produced.
The café’s supplies are deliveredeach morning, sometimes
from many kilometres away
At the end of the day the café workers separate organic waste and recycling and donate left over food to charity so only a small amount of waste is sent to landfill.
Transportemissionsgenerated15%
1 2 3
Electricityemissionsgenerated
72%Natural gasemissionsgenerated
7%Wasteemissionsgenerated6%
If cafés and trains in Melbourne were powered by renewable energy and buildings and freight vehicles were more e�cient,
then the daily activity of drinking co�eewould be supporting our
emissions reduction goals.
melbourne.vic.gov.au12
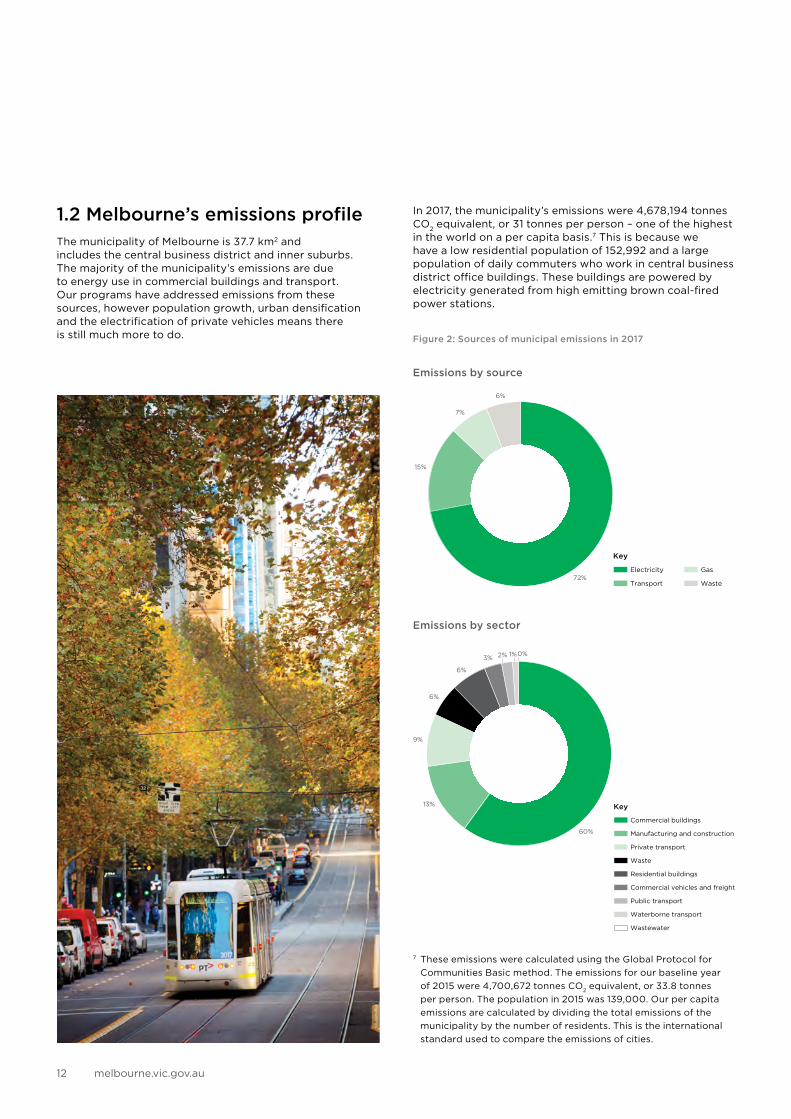
1.2 Melbourne’s emissions profileThe municipality of Melbourne is 37.7 km2 and includes the central business district and inner suburbs. The majority of the municipality’s emissions are due to energy use in commercial buildings and transport. Our programs have addressed emissions from these sources, however population growth, urban densification and the electrification of private vehicles means there is still much more to do.
In 2017, the municipality’s emissions were 4,678,194 tonnes CO2 equivalent, or 31 tonnes per person – one of the highest in the world on a per capita basis.7 This is because we have a low residential population of 152,992 and a large population of daily commuters who work in central business district office buildings. These buildings are powered by electricity generated from high emitting brown coal-fired power stations.
Figure 2: Sources of municipal emissions in 2017
Emissions by source
Emissions by sector
7 These emissions were calculated using the Global Protocol for Communities Basic method. The emissions for our baseline year of 2015 were 4,700,672 tonnes CO2 equivalent, or 33.8 tonnes per person. The population in 2015 was 139,000. Our per capita emissions are calculated by dividing the total emissions of the municipality by the number of residents. This is the international standard used to compare the emissions of cities.
2% 1%0%3%
6%
6%
9%
13%
60%72%
15%
7%
6%
Emissions by source Emissions by sector
Commercial buildings
Manufacturing and construction
Private transport
Waste
Residential buildings
Commercial vehicles and freight
Public transport
Waterborne transport
Wastewater
Key
Electricity
Transport
Key
Gas
Waste
Figure 22% 1%0%
3%
6%
6%
9%
13%
60%72%
15%
7%
6%
Emissions by source Emissions by sector
Commercial buildings
Manufacturing and construction
Private transport
Waste
Residential buildings
Commercial vehicles and freight
Public transport
Waterborne transport
Wastewater
Key
Electricity
Transport
Key
Gas
Waste
Figure 2
Climate Change Mitigation Strategy to 2050 13
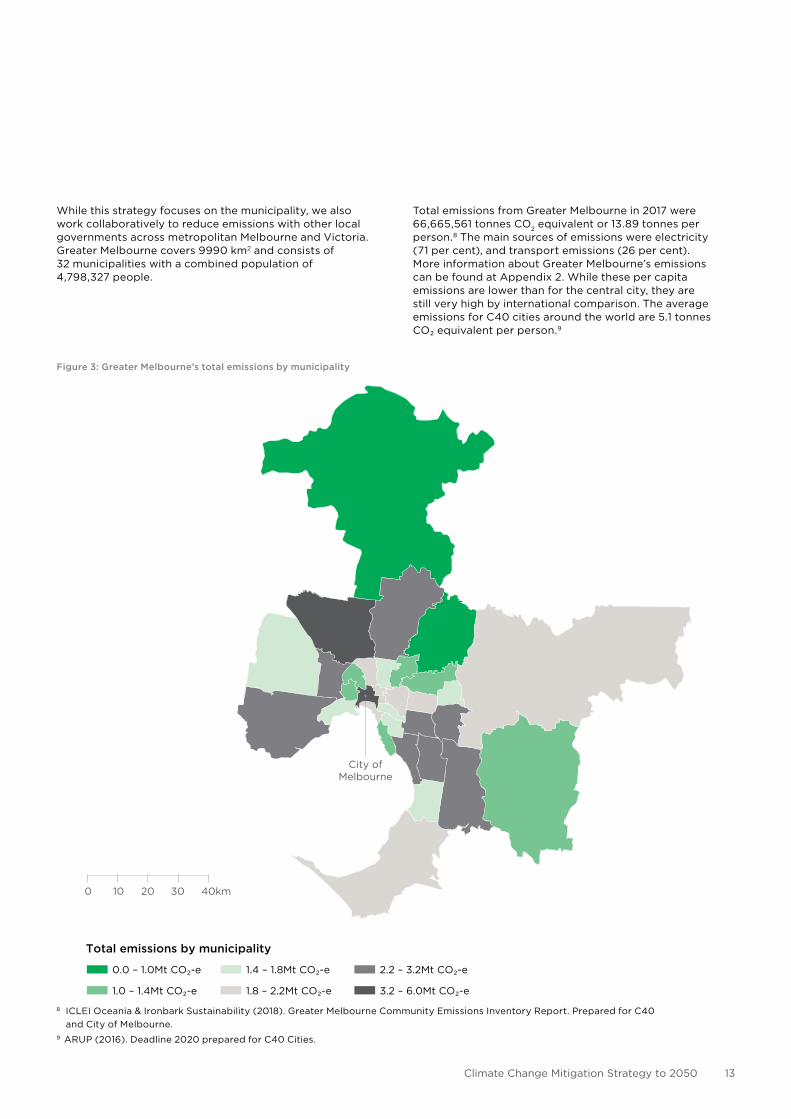
While this strategy focuses on the municipality, we also work collaboratively to reduce emissions with other local governments across metropolitan Melbourne and Victoria. Greater Melbourne covers 9990 km2 and consists of 32 municipalities with a combined population of 4,798,327 people.
Total emissions from Greater Melbourne in 2017 were 66,665,561 tonnes CO2 equivalent or 13.89 tonnes per person.8 The main sources of emissions were electricity (71 per cent), and transport emissions (26 per cent). More information about Greater Melbourne’s emissions can be found at Appendix 2. While these per capita emissions are lower than for the central city, they are still very high by international comparison. The average emissions for C40 cities around the world are 5.1 tonnes CO₂ equivalent per person.9
Figure 3: Greater Melbourne’s total emissions by municipality
8 ICLEI Oceania & Ironbark Sustainability (2018). Greater Melbourne Community Emissions Inventory Report. Prepared for C40 and City of Melbourne.
9 ARUP (2016). Deadline 2020 prepared for C40 Cities.
melbourne.vic.gov.au14
10 Sustainability Victoria Social Research on Climate Change 2016. 11 www.c40.org
1.3 Why we need a new approachZero net emissions by 2020
In 2003, the City of Melbourne set an ambitious target of zero net emissions from the municipality by 2020, prior to Australia ratifying the Kyoto Protocol. We were one of the first cities to set such an ambitious target, and many other cities followed our lead. The most recent update of the Zero Net Emissions by 2020 Strategy was completed in 2014, prior to the Paris Climate Agreement.
In 2016, the City of Melbourne hosted a deliberative democracy process to develop a community vision for the Future Melbourne Refresh, setting the priorities for the city. Reducing greenhouse gas emissions from the municipality was identified as a top priority and this is reflected in our Council Plan 2017–2021. This view is shared across Victoria: 80 per cent of people are willing to act on climate change and 87 per cent think local government should be taking action.10
Now that the Australian Government has ratified the Paris Climate Agreement and the Victorian Government has introduced the Climate Change Act 2017 there is a fresh opportunity to pursue our long-standing commitment to action on the emissions that cause climate change. Our city will continue to grow and the decisions we make today will lock in the future emissions profile of our energy, buildings, transport and waste management.
We completed our Climate Change Adaptation Strategy Refresh in 2017. This complementary Climate Change Mitigation Strategy focuses on reducing greenhouse emissions. It responds to the new science-based targets and frameworks introduced since the Paris Climate Agreement was ratified in 2016.
C40 Climate Action Planning Framework
C40 is a network of the world’s megacities committed to addressing climate change.11 To ensure our approach demonstrates global leadership, the City of Melbourne joined seven cities in a C40 Climate Action Planning Pilot Program: Boston, Durban, Los Angeles, London, Mexico City, New York, and Paris. This peer-review exchange has contributed greatly to our strategy.
Through this program, the City of Melbourne contributed to the development of the C40 Climate Action Planning Framework. Cities can use this framework to meet their commitments to the Paris Climate Agreement.
The key features of the C40 Climate Action Planning Framework are:
1. Develop a pathway to deliver an emissions neutral city by 2050 at the latest and set an ambitious interim target and/or carbon budget.
2. Demonstrate how the city will adapt and improve its resilience to the climate hazards that may impact the city now and in future climate change scenarios.
3. Outline the social, environmental and economic benefits expected from implementing the plan, and improve the equitable distribution of these benefits to the city’s population.
4. Detail the city’s governance, powers and partners who need to be engaged in order to accelerate the delivery of the city’s mitigation targets and resilience goals.
Cities need to do this by:
• Considering adaptation and mitigation in an integrated way, identifying interdependencies to maximise efficiencies and minimize investment risk.
• Setting an evidence-based, inclusive and deliverable plan for achieving transformational mitigation and adaptation, centred on the city’s powers and wider context.
• Establishing a transparent process to monitor delivery, communicate progress and update climate action planning in line with governance and reporting systems.
We have started a capacity building program for local governments in metropolitan Melbourne and will continue to share the lessons we learnt during the pilot program with cities around the world.

15Climate Change Mitigation Strategy to 2050

16 melbourne.vic.gov.au
Climate Change Mitigation Strategy to 2050 17
1.4 A low carbon, circular economy Melbourne is Australia’s second largest city and an important centre for finance, professional services and the knowledge economy in the Asia-Pacific region. Tourists and visitors to the city are attracted by small businesses in Melbourne’s restaurant, retail and entertainment precincts. The city's environmental sustainability is central to its reputation as an attractive place to work and do business.
Cities consume 75 per cent of natural resources globally, and many cities are now taking climate change more seriously as an investment issue as well as an operational issue. The financial ratings agency Moody’s recently advised US cities to start addressing climate change or face ratings downgrades.
In 2015, the City of Melbourne decided not to invest in fossil fuels or fossil fuel aligned companies and to call upon our default superannuation fund to create a fossil fuel free investment option. We also decided to consider fossil fuel exposure when awarding our transactional banking contract.12
The Investor Group on Climate Change, representing $2 trillion assets under management, is encouraging companies to manage climate risks. More businesses and investors are positioning to take advantage of the opportunities of a low carbon economy. They are setting science-based emissions reduction targets, purchasing renewable energy and divesting from fossil-fuels. Further, company directors are increasingly considering climate change in their decision-making.
These investors and businesses will contribute to our transition to a low carbon economy and increase our economic resilience to the risks of climate change. A low carbon economy supports business activities by generating the highest value for the least emissions. Melbourne’s knowledge economy is well positioned: its strengths in professional, technical, scientific and financial services will benefit from the transition to 100 per cent renewable energy and zero emissions buildings.
A circular economy
The concept of a circular economy recognises that the way we currently design many products, buildings, transport systems and cities contributes to wasted resources. Many products generate a lot of waste in their manufacture or transport, are only used once or require excessive packaging. Wasted energy and material resources also go into buildings and car parks that sit vacant. Making urban systems more efficient reduces emissions from the wasted energy used to manufacture and operate inefficient products, buildings and transport.
The principles of a circular economy are to design out waste, keep products and materials in use at their highest value, and preserve and regenerate natural capital. Because of the emissions generated by the manufacture or transport of materials (called “embodied emissions”) there is a relationship between our transition to a low carbon economy, and a more
efficient circular economy. Examples include the emissions produced by growing, producing and transporting food, the manufacture of clothing or building products, and the mining and industrial processing of raw materials for buildings and roads.
When we consider all of these “consumption-based” emissions across the city it highlights the action we can take to reduce emissions by choosing sustainable products and reducing emissions through our supply chains.
We need to reduce waste of all kinds and decouple emissions intensity from economic value. Through urban design and planning, cities can support an increase in energy efficient buildings and transport systems and a reduction in both structural and material waste.
12 Council resolution October 2015 www.melbourne.vic.gov.au/about-council/committees-meetings/meeting-archive/meetingagendaitemattachments/706/12791/oct15%20ccl%20agenda%20item%207.4.pdf
melbourne.vic.gov.au18
13 City of Melbourne Emission Reduction Plan for our operations www.melbourne.vic.gov.au/SiteCollectionDocuments/ emissions-reduction-plan.pdf
14 Australian Government Carbon Neutral Program www.environment.gov.au/climate-change/government/carbon-neutral/ certified-businesses
2. TAKING BOLD ACTION TOGETHER
"We've developed our Council Pledge as an example for others to use and improve as part of our commitment to local government leadership on climate change."
2.1 City of Melbourne’s roleThe City of Melbourne is leading by example, demonstrating the possible and sharing the solutions to climate change.
We have taken strong action to reduce emissions from our own operations and to power our buildings with 100 percent renewable energy. In 2016, we introduced a 1.5°C science-based target for our operations in our Emission Reduction Plan 2016–2021.13 All remaining emissions are offset to enable the City of Melbourne to be a certified Carbon Neutral organisation.14 However, our operations generate less than one per cent of emissions in the municipality.
We also run many influential programs that aim to reduce emissions from the broader municipality such as CitySwitch and the Melbourne Renewable Energy Project (MREP).
There are many activities in the municipality that we have not traditionally had direct responsibility for such as transport, energy supply, and energy use in privately owned buildings. Using international standards, the emissions from these sources are still measured in the municipality’s greenhouse gas accounts.
To address them, we need to work collaboratively with the community, other governments and businesses to investigate new delivery models for renewable energy powered buildings and transport for the municipality. This collaborative approach will achieve the best outcomes for current and future generations.
2.2 Australian and Victorian climate change policy
The City of Melbourne cannot mitigate climate risk for the municipality effectively without supporting action from the Victorian and Australian Governments to reduce greenhouse gas emissions. Unlike some cities in other countries, we do not have the power to regulate building energy performance standards, and we do not currently operate public transport or energy utilities. There are also some limitations to the City of Melbourne’s urban planning controls.
This strategy identifies opportunities within City of Melbourne’s control, together with opportunities outside our control, where our role is to advocate and influence.
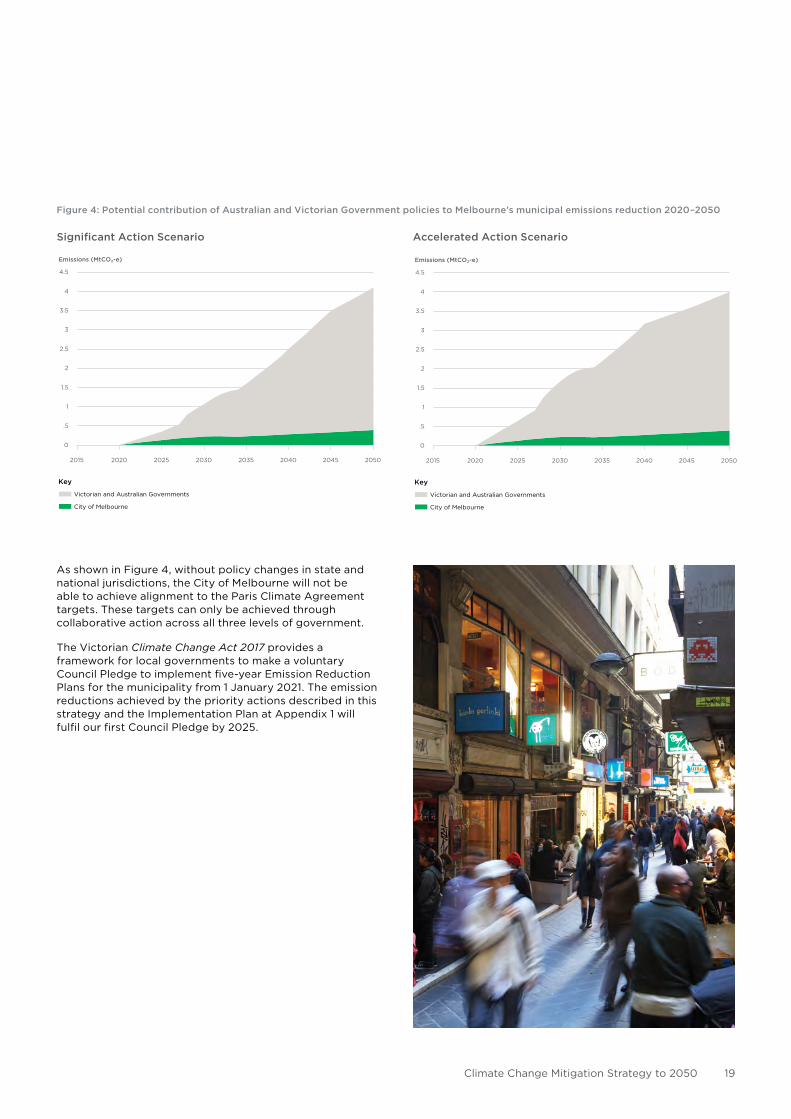
Figure 4 illustrates the impact that different levels of government can have on Melbourne’s emission reductions through their policies.
The graphs show the reductions that can be delivered if an ambitious renewable energy target is set for 2030 and an effective national climate and energy policy implemented.
Climate Change Mitigation Strategy to 2050 19
Figure 4: Potential contribution of Australian and Victorian Government policies to Melbourne’s municipal emissions reduction 2020–2050
Accelerated Action ScenarioSignificant Action Scenario
As shown in Figure 4, without policy changes in state and national jurisdictions, the City of Melbourne will not be able to achieve alignment to the Paris Climate Agreement targets. These targets can only be achieved through collaborative action across all three levels of government.
The Victorian Climate Change Act 2017 provides a framework for local governments to make a voluntary Council Pledge to implement five-year Emission Reduction Plans for the municipality from 1 January 2021. The emission reductions achieved by the priority actions described in this strategy and the Implementation Plan at Appendix 1 will fulfil our first Council Pledge by 2025.
2015 2020 2025 2030 2035 2040 2045 2050
Significant Action Scenario
0
.5
1
1.5
2
2.5
3
3.5
4
4.5
Emissions (MtCO2-e)
Victorian and Australian Governments
City of Melbourne
Key
Accelerated Action Scenario
Emissions (MtCO2-e)
2015 2020 2025 2030 2035 2040 2045 2050
0
.5
1
1.5
2
2.5
3
3.5
4
4.5
Victorian and Australian Governments
City of Melbourne
Key
Figure 4
2015 2020 2025 2030 2035 2040 2045 2050
Significant Action Scenario
0
.5
1
1.5
2
2.5
3
3.5
4
4.5
Emissions (MtCO2-e)
Victorian and Australian Governments
City of Melbourne
Key
Accelerated Action Scenario
Emissions (MtCO2-e)
2015 2020 2025 2030 2035 2040 2045 2050
0
.5
1
1.5
2
2.5
3
3.5
4
4.5
Victorian and Australian Governments
City of Melbourne
Key
Figure 4
melbourne.vic.gov.au20
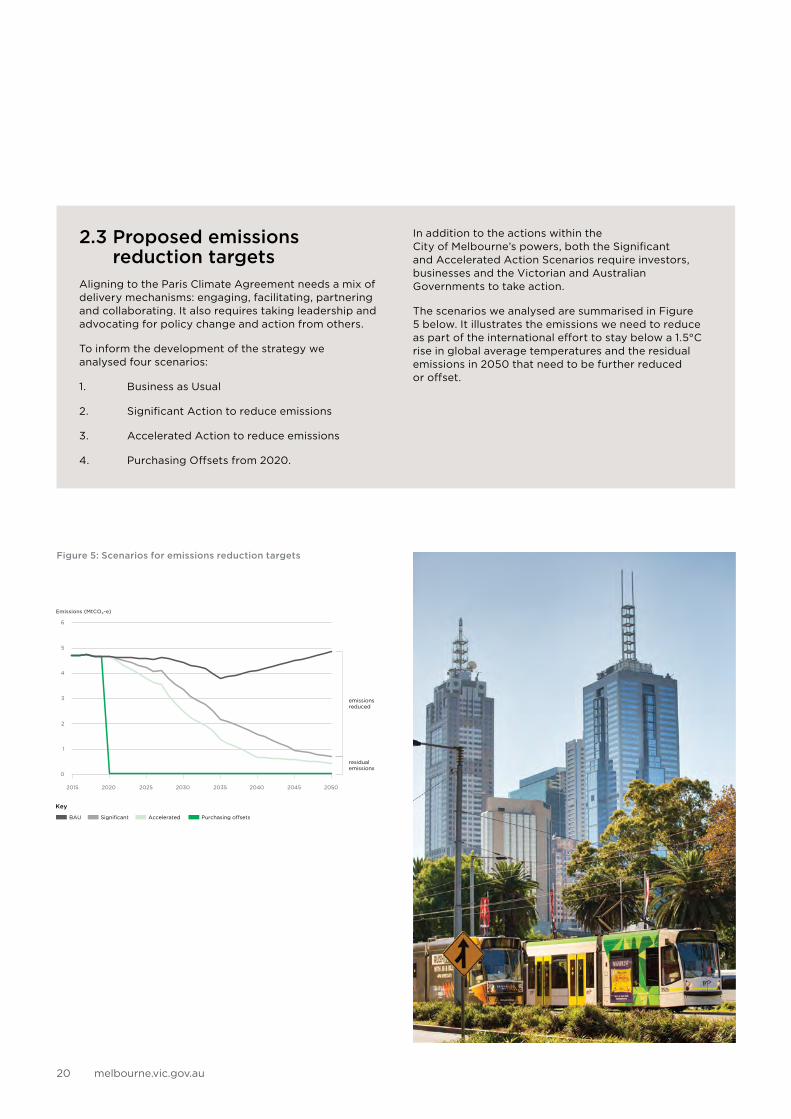
Figure 5: Scenarios for emissions reduction targets
2.3 Proposed emissions reduction targets
Aligning to the Paris Climate Agreement needs a mix of delivery mechanisms: engaging, facilitating, partnering and collaborating. It also requires taking leadership and advocating for policy change and action from others.
To inform the development of the strategy we analysed four scenarios:
1. Business as Usual
2. Significant Action to reduce emissions
3. Accelerated Action to reduce emissions
4. Purchasing Offsets from 2020.
In addition to the actions within the City of Melbourne’s powers, both the Significant and Accelerated Action Scenarios require investors, businesses and the Victorian and Australian Governments to take action.
The scenarios we analysed are summarised in Figure 5 below. It illustrates the emissions we need to reduce as part of the international effort to stay below a 1.5°C rise in global average temperatures and the residual emissions in 2050 that need to be further reduced or offset.
Climate Change Mitigation Strategy to 2050 21
SCENARIOTARGET PER PERSON IN 2030
NET ZERO EMISSIONSALIGNED TO PARIS CLIMATE AGREEMENT
1. Business as Usual 22.1 tCO2-e never no
2. Significant Action 14.3tCO2-e 2050 yes
3. Accelerated Action 10.7 tCO2-e 2043 yes
4. Purchasing Offsets 22.1 tCO2-e 2020 no
The following table summarises the characteristics of each scenario.15
The City of Melbourne’s preferred approach is to deliver the actions needed to achieve the Significant Action Scenario and pursue actions for the Accelerated Action Scenario where there is the opportunity to go further.
This will require us to take bold action within our powers, collaborate with others and advocate for policy change from the Victorian and Australian Governments. Our approach aligns with the Paris Climate Agreement while acknowledging our limited powers and financial resources.
Under the Business as Usual Scenario, the impacts of climate change and missed economic opportunities of transitioning to a low carbon economy will cost AU$12.6 billion to the municipality’s economy by 2050.
By reducing emissions across the municipality, we can reduce the future costs of climate change impacts to the city, while also generating new jobs and business opportunities.
The Significant and Accelerated Action Scenarios provide economic stimulus, generating over 30,000 jobs and over AU$5 billion in value by 2050. Further explanation of the method used to calculate costs and benefits can be found at Appendix 2.
The estimated cost to the City of Melbourne of the Purchasing Offsets Scenario would be AU$240 million to AU$480 million per year.16 The Business as Usual and Purchasing Offsets Scenarios do not address the underlying causes of greenhouse gas emissions in the municipality and do not appear to be in the best interests of the community.
Table 2: Analysis of each scenario
15 Ernst & Young (2018). Economic Analysis. Prepared for C40 and City of Melbourne.16 Ernst & Young (2018). City of Melbourne Climate Action Planning Technical Assistance Synthesis Report p.3.
The estimated cost of offsets in 2020 was converted to Australian dollars.
melbourne.vic.gov.au22
Residual emissions and the role of offsets
The calculations for the Significant and Accelerated Action Scenarios do not reduce emissions to zero by 2050 because a small amount of residual emissions will still be generated. For example, not all emissions from waste management facilities are likely to be reduced to zero. Our scenario modelling is based on current technology and focussed on the largest system-wide changes needed for Melbourne. It is likely that new solutions and technology will emerge over the next decade to reduce emissions even further in all sectors. Beyond that, any remaining emissions will need to be offset to achieve net zero emissions.
Offsets also provide important environmental, social and economic benefits for reducing emissions in remote and regional Australia, and in many other countries. However, achieving emission reductions through purchasing offsets alone will not address the systemic causes of greenhouse gas emissions or achieve the full extent of benefits for Melbourne residents and businesses.
According to the World Bank, carbon offsets are expected to increase in cost exponentially beyond the year 2020 because the many countries signed up to the Paris Agreement will suddenly increase international demand for offsets.
It is anticipated that by 2025 there will be less uncertainty about the role of offsets and better estimates of potential costs as the international carbon market develops. Therefore, we will continue to monitor and review the role of offsets for residual emissions as part of our Implementation Plan.
The emissions reduction targets that the Significant and Accelerated Action Scenarios could achieve in 2025, 2030 and 2050 are presented in the tables below. Both scenarios align to the Paris Climate Agreement.
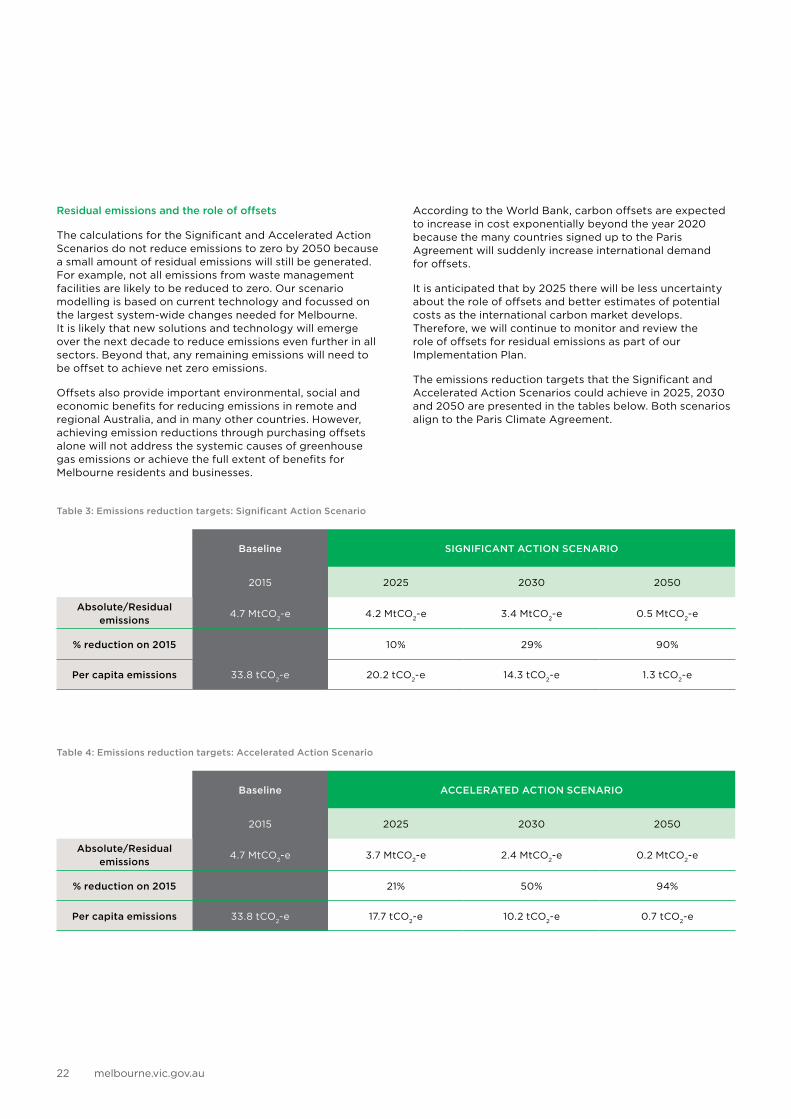
Table 3: Emissions reduction targets: Significant Action Scenario
Table 4: Emissions reduction targets: Accelerated Action Scenario
Baseline SIGNIFICANT ACTION SCENARIO
2015 2025 2030 2050
Absolute/Residual emissions
4.7 MtCO2-e 4.2 MtCO2-e 3.4 MtCO2-e 0.5 MtCO2-e
% reduction on 2015 10% 29% 90%
Per capita emissions 33.8 tCO2-e 20.2 tCO2-e 14.3 tCO2-e 1.3 tCO2-e
Baseline ACCELERATED ACTION SCENARIO
2015 2025 2030 2050
Absolute/Residual emissions
4.7 MtCO2-e 3.7 MtCO2-e 2.4 MtCO2-e 0.2 MtCO2-e
% reduction on 2015 21% 50% 94%
Per capita emissions 33.8 tCO2-e 17.7 tCO2-e 10.2 tCO2-e 0.7 tCO2-e
Emissions (MtCO2-e)
5
4
3
2
1
0
6
2015 2020 2025 2030 2035 2040 2045 2050
Key
Waste Transport Buildings Energy Supply
5
4
3
2
1
0
6
2015 2020 2025 2030 2035 2040 2045 2050
Emissions (MtCO2-e)
Key
Waste Transport Buildings Energy Supply
Figure 6
Figure 7
Climate Change Mitigation Strategy to 2050 23
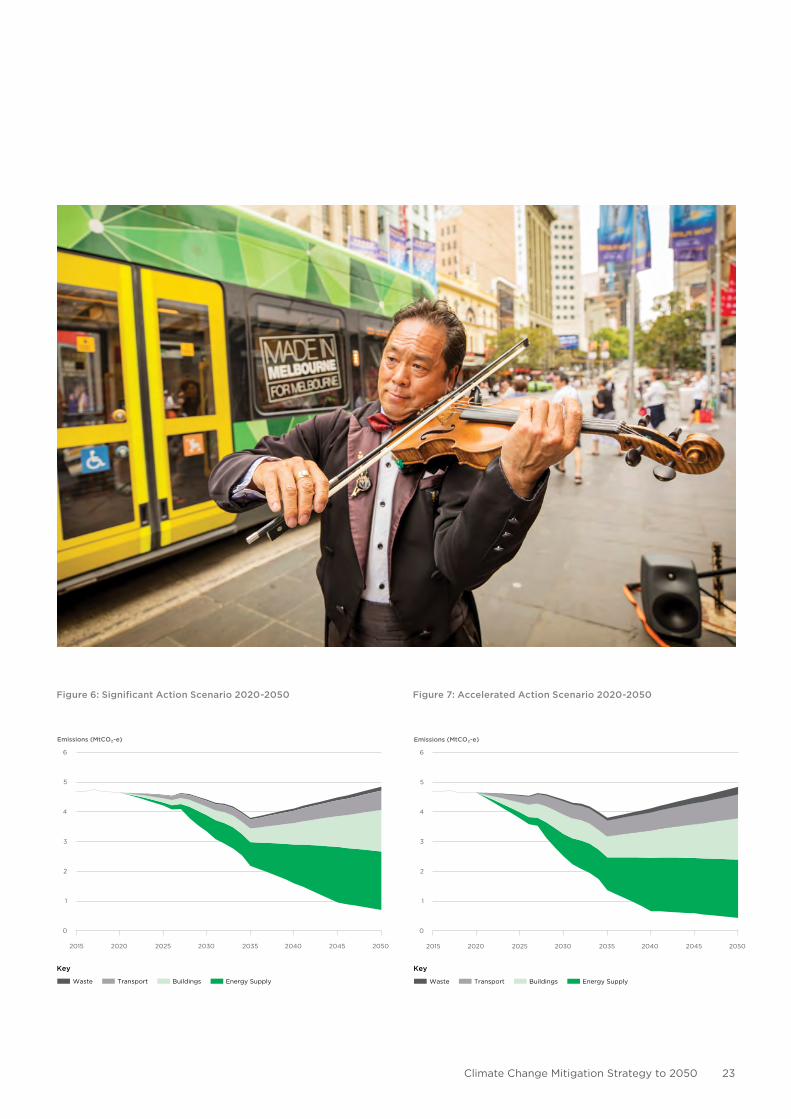
Figure 6: Significant Action Scenario 2020-2050 Figure 7: Accelerated Action Scenario 2020-2050
Emissions (MtCO2-e)
5
4
3
2
1
0
6
2015 2020 2025 2030 2035 2040 2045 2050
Key
Waste Transport Buildings Energy Supply
5
4
3
2
1
0
6
2015 2020 2025 2030 2035 2040 2045 2050
Emissions (MtCO2-e)
Key
Waste Transport Buildings Energy Supply
Figure 6
Figure 7
Emissions (MtCO2-e)
5
4
3
2
1
0
6
2015 2020 2025 2030 2035 2040 2045 2050
Key
Waste Transport Buildings Energy Supply
5
4
3
2
1
0
6
2015 2020 2025 2030 2035 2040 2045 2050
Emissions (MtCO2-e)
Key
Waste Transport Buildings Energy Supply
Figure 6
Figure 7
melbourne.vic.gov.au24
3. STRATEGIC PRIORITIES
"To ensure emissions are reduced as rapidly as possible, we need to put the most effort into reducing the largest sources of emissions that we can control or influence."
3.1 Where should we direct our effort?
We analysed opportunities for transformational actions relating to the major sources of emissions in the city: energy supply, buildings, transport and waste. We calculated the potential to reduce emissions from each potential action by 2025, 2030 and 2050.
To identify new ideas we investigated:
• priorities identified in the Future Melbourne community process
• actions taken by other cities around the world
• policy settings of the Victorian and Australian Governments
• climate impacts
• changes in technology
• demographics and urban densification trends
• business and economic trends
• potential to contribute to the Sustainable Development Goals.
3.2 Strategic priorities Our actions align with four strategic priorities:
1. 100 per cent renewable energy
2. zero emissions buildings and precincts
3. zero emissions transport
4. reduce the impact of waste.
We aim to reduce the largest sources of emissions in the municipality. This will align with the requirements of the C40 Climate Action Planning Framework and achieve our science-based targets. We have included actions we can implement directly as well as those we need to collaborate on and advocate for. The strategy demonstrates our support for social inclusion and contributes to achieving the Sustainable Development Goals.
In implementing the strategy we will:
• consider climate adaptation and mitigation in an integrated way, identifying interdependencies to maximise efficiencies and minimise investment risk
• deliver environmental, social and economic benefits to the community
• take an innovative, transparent and evidence-based approach to evaluate and report our progress.
Climate Change Mitigation Strategy to 2050 25
"Local governments have demonstrated leadership for many years by bargaining with energy companies to facilitate lower cost renewable energy for the community in the form of solar panels and GreenPower."
The story so farThe Melbourne Renewable Energy Project (MREP) was a game-changing initiative led by the City of Melbourne. Bringing together some of Melbourne’s leading businesses, universities, local governments and public institutions, the City of Melbourne developed an Australian first group Power Purchase Agreement. This commitment to purchase our power from a new renewable energy development enabled the construction of a 39 turbine windfarm at Crowlands, about two hours from Melbourne in regional Victoria. This project alone will increase renewable energy in the city by 3 per cent in addition to the 18 per cent currently adopted.17
Local governments have demonstrated leadership for many years by bargaining with energy companies to facilitate lower cost renewable energy for the community in the form of solar panels and GreenPower. Property owners and businesses have also benefitted from policies such as feed-in tariffs, solar rebates, and renewable energy targets implemented by Victorian and Australian Governments. These programs have contributed greatly to the uptake in renewable energy and the rapid reduction in market cost.
In the past, the higher cost of renewable energy meant purchasing solar panels and GreenPower was more expensive than standard electricity. However the costs of renewable energy have now reduced significantly, while the cost of ordinary electricity and gas has increased. This particularly affects some of our more vulnerable residents.
ChallengesWhile a proportion of property owners enjoy the benefits of solar power on their rooftops, access can be limited for people who are renting or living in apartments. The upfront cost of purchasing solar panels and storage systems can be a barrier, and for renters, permission is needed from their landlords. There is also some uncertainty about the reliability of new technology such as storage. An alternative to installing renewable energy directly is to purchase renewable energy or carbon neutral certified electricity from an energy retailer. One of the challenges with this approach is consumer confidence that the environmental claims are genuinely reducing emissions.
In previous years, we trialled programs to support the installation of solar panels on commercial buildings. It was challenging to find suitable commercial sites for installation due to overshadowing from surrounding buildings, and regulations that made connection to the electricity grid and distribution to neighbouring properties difficult. One of the drivers for increasing electricity bills has been the fixed network and distribution charges that cannot be reduced by saving energy at home.
Investment in new renewable energy is being driven by the commitments of state governments, including the 2016 Victorian Government commitment to 40 per cent renewable energy by 2025. Without a commitment to a further renewable energy target for 2030 or science-based emission reduction targets in a national climate and energy policy, the investment needed in renewable energy is likely to stall. This would result in investor uncertainty and higher electricity prices.
STRATEGIC PRIORITY 1: 100 PER CENT RENEWABLE ENERGY
17 www.tai.org.au/sites/default/files/National%20Energy%20Emissions%20Audit%20-%20Electricity%20Update%20July%202018.pdf
26 melbourne.vic.gov.au
Climate Change Mitigation Strategy to 2050 27
Strategic opportunitiesTo achieve our emissions reduction goals, the city’s buildings, precincts and transport need to be electrified and powered by 100 per cent renewable energy. This requires a transition away from gas, petrol, diesel and coal. It will generate investment opportunities in clean energy infrastructure. New and exciting technologies are being developed and present important opportunities for the City of Melbourne to harness and promote.
The influence of the Melbourne Renewable Energy Project has greatly accelerated the uptake of renewable energy in recent years. New analysis shows that nationally, a third of the contribution to the Australian Renewable Energy Target scheme is from corporate power purchase agreements.18 We can continue to amplify the impact of the Melbourne Renewable Energy Project to contribute to future Victorian and Australian Government renewable energy targets.
The development of a virtual renewable energy power plant or facilitation of renewable energy purchases for residents could help share the benefits of the renewable energy transition with people who live in apartments as well as stand-alone houses. We can also provide residents with information on how to access Victorian Government programs to increase the uptake of renewable energy, reduce barriers to install solar panels and batteries and assist renters.
Another type of virtual power plant or solar garden is a larger scale installation of solar panels and storage on a public building or a vacant rooftop with benefits flowing to nearby residents. Some communities have also developed community energy projects where residents or businesses purchase a share in, or energy from, a large scale renewable energy development outside the municipality. The energy generated is then directly counted against residents' energy use. We could also drive innovation by engaging university researchers in trialling new technology or holding design competitions.
The decreasing cost of renewable energy and the increasing cost of gas and coal-fired electricity has also generated community support for renewable energy and employment opportunities for regional Victorians. There is a growing consensus from investors, energy companies, and businesses that renewable energy is needed to replace coal-fired power stations. The City of Melbourne could amplify this by advocating for ambitious renewable energy targets in Victorian and Australian Government policy.
The environmental, social and economic benefits of taking actionThe benefits of taking action on energy include:
• increased energy security
• increased local employment
• reduced health impacts from air pollution
• reduced ecosystem impacts from air pollution
• reduced ecosystem impacts from coal mining.
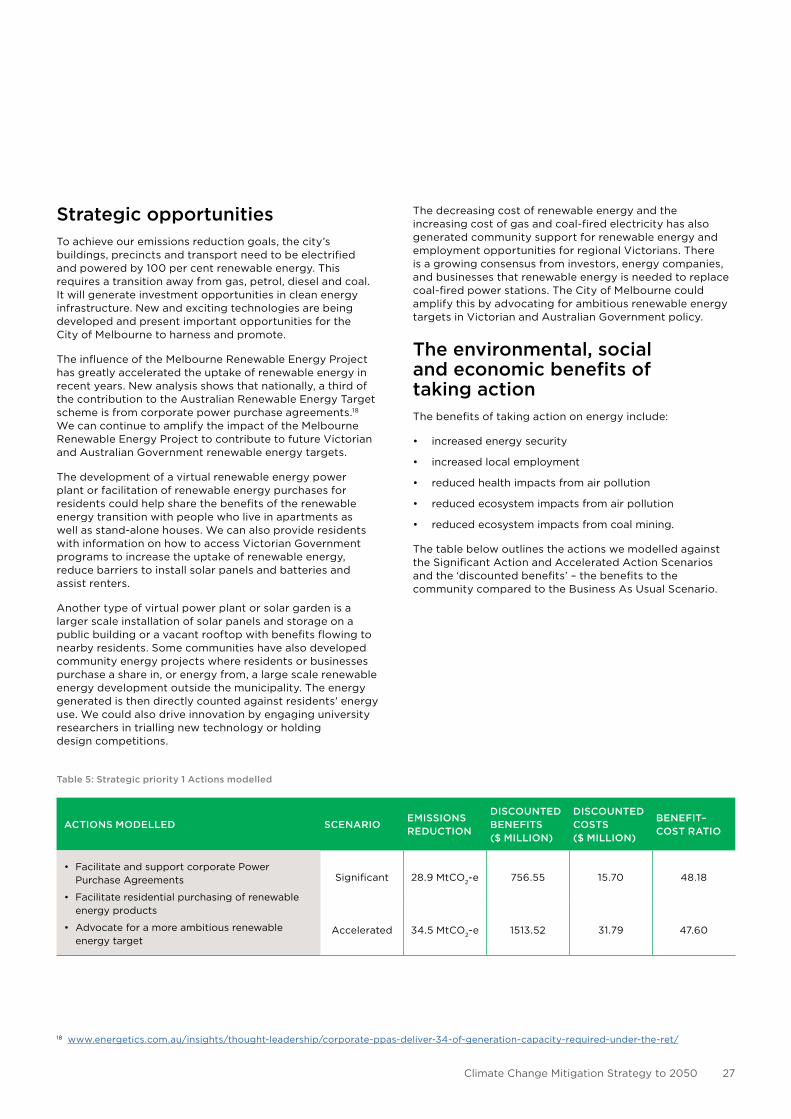
The table below outlines the actions we modelled against the Significant Action and Accelerated Action Scenarios and the ‘discounted benefits’ – the benefits to the community compared to the Business As Usual Scenario.
18 www.energetics.com.au/insights/thought-leadership/corporate-ppas-deliver-34-of-generation-capacity-required-under-the-ret/
Table 5: Strategic priority 1 Actions modelled
ACTIONS MODELLED SCENARIOEMISSIONS REDUCTION
DISCOUNTED BENEFITS ($ MILLION)
DISCOUNTED COSTS ($ MILLION)
BENEFIT–COST RATIO
• Facilitate and support corporate Power Purchase Agreements
• Facilitate residential purchasing of renewable energy products
• Advocate for a more ambitious renewable energy target
Significant 28.9 MtCO2-e 756.55 15.70 48.18
Accelerated 34.5 MtCO2-e 1513.52 31.79 47.60
melbourne.vic.gov.au28
Figure 8: Emissions reduction potential of energy supply actions
Accelerated Action ScenarioSignificant Action Scenario
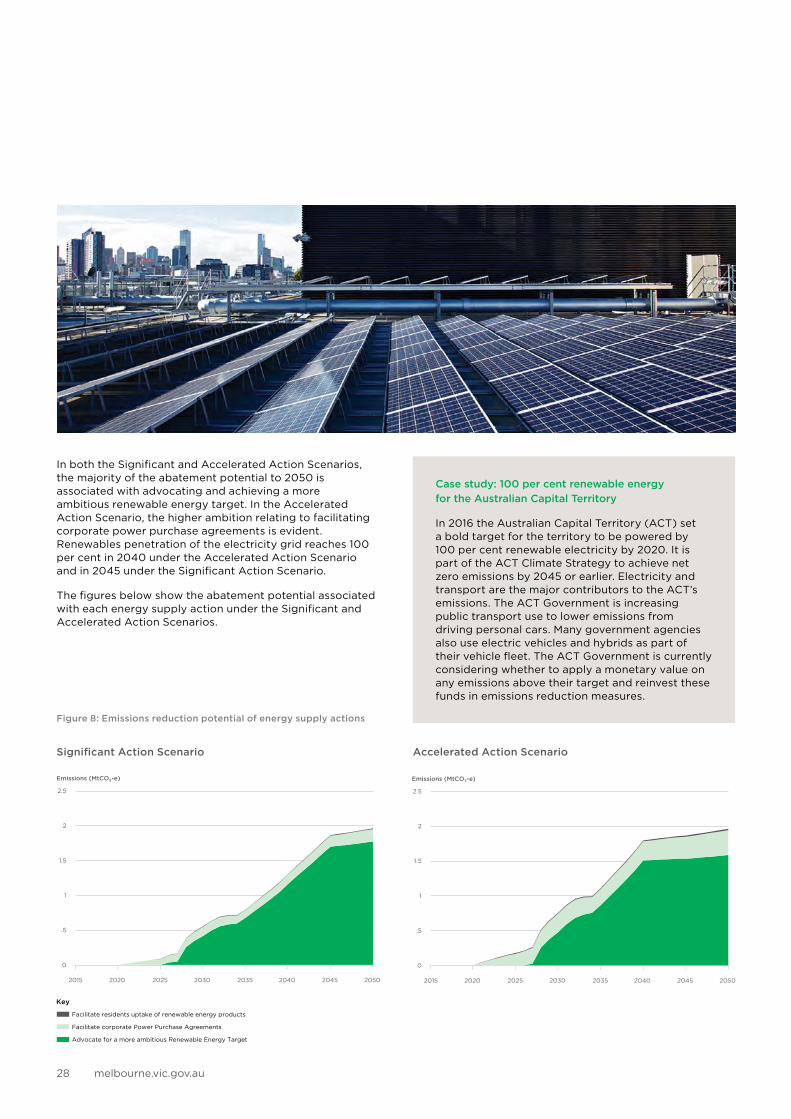
In both the Significant and Accelerated Action Scenarios, the majority of the abatement potential to 2050 is associated with advocating and achieving a more ambitious renewable energy target. In the Accelerated Action Scenario, the higher ambition relating to facilitating corporate power purchase agreements is evident. Renewables penetration of the electricity grid reaches 100 per cent in 2040 under the Accelerated Action Scenario and in 2045 under the Significant Action Scenario.
The figures below show the abatement potential associated with each energy supply action under the Significant and Accelerated Action Scenarios.
Case study: 100 per cent renewable energy for the Australian Capital Territory
In 2016 the Australian Capital Territory (ACT) set a bold target for the territory to be powered by 100 per cent renewable electricity by 2020. It is part of the ACT Climate Strategy to achieve net zero emissions by 2045 or earlier. Electricity and transport are the major contributors to the ACT’s emissions. The ACT Government is increasing public transport use to lower emissions from driving personal cars. Many government agencies also use electric vehicles and hybrids as part of their vehicle fleet. The ACT Government is currently considering whether to apply a monetary value on any emissions above their target and reinvest these funds in emissions reduction measures.
Significant Action Scenario
Emissions (MtCO2-e)
2
1.5
1
.5
0
2.5
2015 2020 2025 2030 2035 2040 2045 2050
Facilitate residents uptake of renewable energy products
Facilitate corporate Power Purchase Agreements
Advocate for a more ambitious Renewable Energy Target
Key
Accelerated Action Scenario
Emissions (MtCO2-e)
2
1.5
1
.5
0
2.5
2015 2020 2025 2030 2035 2040 2045 2050
Facilitate residents uptake of renewable energy products
Facilitate corporate Power Purchase Agreements
Advocate for a more ambitious Renewable Energy Target
Key
Figure 8
Climate Change Mitigation Strategy to 2050 29
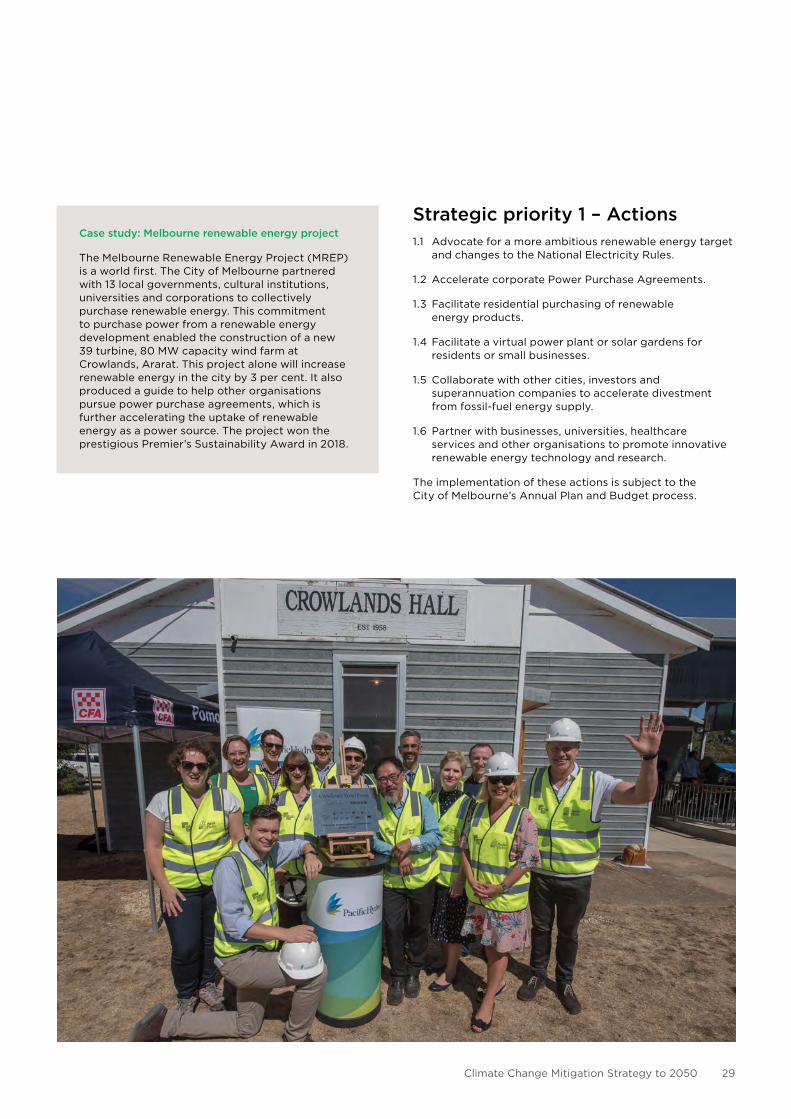
Strategic priority 1 – Actions1.1 Advocate for a more ambitious renewable energy target
and changes to the National Electricity Rules.
1.2 Accelerate corporate Power Purchase Agreements.
1.3 Facilitate residential purchasing of renewable energy products.
1.4 Facilitate a virtual power plant or solar gardens for residents or small businesses.
1.5 Collaborate with other cities, investors and superannuation companies to accelerate divestment from fossil-fuel energy supply.
1.6 Partner with businesses, universities, healthcare services and other organisations to promote innovative renewable energy technology and research.
The implementation of these actions is subject to the City of Melbourne’s Annual Plan and Budget process.
Case study: Melbourne renewable energy project
The Melbourne Renewable Energy Project (MREP) is a world first. The City of Melbourne partnered with 13 local governments, cultural institutions, universities and corporations to collectively purchase renewable energy. This commitment to purchase power from a renewable energy development enabled the construction of a new 39 turbine, 80 MW capacity wind farm at Crowlands, Ararat. This project alone will increase renewable energy in the city by 3 per cent. It also produced a guide to help other organisations pursue power purchase agreements, which is further accelerating the uptake of renewable energy as a power source. The project won the prestigious Premier’s Sustainability Award in 2018.
melbourne.vic.gov.au30
"In the last five years, we have achieved a 24 per cent reduction in emissions across our building portfolio."
The story so farThe City of Melbourne developed Australia’s first new 6-star Green Star rated office building in 2006 called Council House 2. This building trialled new energy saving technology, sustainable materials and a green roof garden. From January 2019, it will be powered by 100 per cent renewable energy as a result of the Melbourne Renewable Energy Project. Over the last decade, we have integrated the lessons learnt across our portfolio of public and community buildings including the Library at the Dock and the Queen Victoria Market precinct renewal.
In the last five years, we have achieved a 24 per cent reduction in emissions across our building portfolio. We have undertaken energy saving upgrades and retrofits in existing buildings, including a number of heritage listed buildings such as the Melbourne Town Hall.
We have also collaborated with apartment owners and tenants, and the commercial property sector to drive improved environmental performance. The 1200 Buildings Program helped to inform building owners how to drive energy efficiency and retrofit activity in existing buildings. CitySwitch is a national program delivered in partnership with the Cities of Sydney, North Sydney, Adelaide, Perth and the New South Wales Office of Environment and Heritage. It achieved an emissions reduction of 667,000 tonnes of CO2-e in 2017 and has won an international C40 award.
The City of Melbourne and the City of Stockholm co-lead the C40 Cities Low Carbon Districts and Climate Positive network. This international network of cities collaborates on precinct-scale solutions. In 2013, we expanded our local planning policy for sustainable office buildings to include all types of property development.
We are working with Victorian Government partners to introduce net zero emissions targets for urban renewal precincts such as Fishermans Bend and Arden-Macaulay, and to incorporate these into planning and implementation.
ChallengesBuildings generate 66 per cent of emissions in the municipality, mainly because the majority use energy from coal-fired power in the Latrobe Valley. Gas is another source of building emissions. Until the transition is made away from gas, having a 100 per cent renewable electricity system will still result in buildings generating emissions.
Long-term trends in population growth and urban densification mean that Melbourne is in the greatest property development boom since the 1850s gold rush. Apartment buildings are already the most common type of residence and they are growing at a rapid rate. The buildings developed today will still be part of our city in 2050.
Melbourne’s buildings are not as efficient as they could be and benchmarks for measuring the performance of the city’s building portfolio are not fully developed, especially for apartments. This means residents do not have information about the building’s energy performance before moving in, which can lead to unexpected high energy bills. For people living in apartments, it can be a challenge negotiating changes with the body corporate. For renters this is especially challenging, because they cannot retrofit their homes to improve energy performance, and their landlords are not incentivised to ensure homes are energy efficient. A similar challenge exists with commercial office buildings because landlords can pass on the costs of higher energy bills to corporate tenants.
Because buildings retain heat they also contribute to the urban heat island effect. This can make poorly designed buildings uninhabitable if there is a power cut during a heat wave. Heat waves are occurring more frequently due to climate change as summer temperatures become more extreme.
The social impacts of building thermal performance during heatwaves and extreme weather need to be considered because some members of our community, young families, older people and those vulnerable due to health problems are more at risk. Low income households and renters have less ability to retrofit their homes to save energy and stay cool. Energy security and heatwaves also affect workers and business operations.
STRATEGIC PRIORITY 2: ZERO EMISSIONS BUILDINGS AND PRECINCTS

31Climate Change Mitigation Strategy to 2050
melbourne.vic.gov.au32
Strategic opportunitiesBy collaborating with industry, the City of Melbourne can accelerate emission reductions from buildings across the city. The Green Building Council of Australia’s Carbon Positive Roadmap aligns the future energy performance of buildings to the Paris Climate Agreement. It has set an objective for new commercial buildings to achieve carbon neutrality by 2030, and existing commercial buildings to achieve carbon neutrality (or zero emissions) by 2050.
The industry-led Australian Sustainable Built Environment Council is advocating for the National Construction Code to be urgently updated so that new buildings are fit for a zero carbon future. The construction sector can improve the energy efficiency and thermal performance of buildings and integrate renewable energy into building fabric. This will reduce emissions and help the community adapt to climate change.
Shifting our focus from individual buildings to sector-wide engagement and precinct-scale development will help deliver emission reductions through long-term infrastructure, urban renewal and planning policy. Over time, existing buildings will need to be upgraded. Ensuring new buildings are built to a higher standard will lock in future energy savings.
Applying the principles of the circular economy means buildings should be designed to provide multiple functions over their life-span, the emissions generated by building materials need to reduced and used building materials need to be upcycled.
The environmental, social and economic benefits of taking actionThe benefits of taking action on buildings include:
• energy security
• increased asset values of buildings
• urban biodiversity from green roofs
• reduced health impacts from air pollution
• increased productivity
• increased thermal comfort
• increased disaster resilience
• reduced water consumption/sewage production
• reduced urban heat island effect.
Built to Perform, a report by Climate Works Australia and the Australian Sustainable Built Environment Council, shows that setting stronger energy standards for new buildings in the National Construction Code could reduce energy bills by up to AU$27 billion. It could cut energy network costs by up to AU$7 billion and deliver at least 78 million tonnes of cumulative emissions savings between now and 2050.19
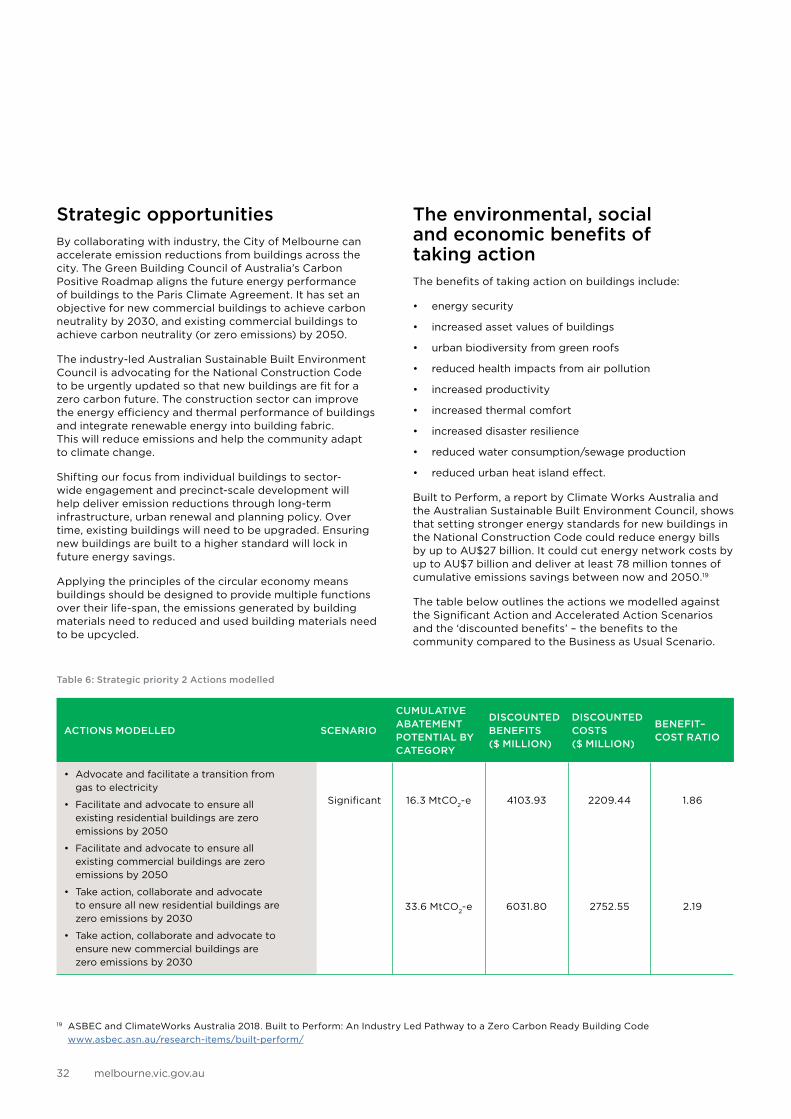
The table below outlines the actions we modelled against the Significant Action and Accelerated Action Scenarios and the ‘discounted benefits’ – the benefits to the community compared to the Business as Usual Scenario.
19 ASBEC and ClimateWorks Australia 2018. Built to Perform: An Industry Led Pathway to a Zero Carbon Ready Building Code www.asbec.asn.au/research-items/built-perform/
Table 6: Strategic priority 2 Actions modelled
ACTIONS MODELLED SCENARIO
CUMULATIVE ABATEMENT POTENTIAL BY CATEGORY
DISCOUNTED BENEFITS ($ MILLION)
DISCOUNTED COSTS ($ MILLION)
BENEFIT–COST RATIO
• Advocate and facilitate a transition from gas to electricity
• Facilitate and advocate to ensure all existing residential buildings are zero emissions by 2050
• Facilitate and advocate to ensure all existing commercial buildings are zero emissions by 2050
• Take action, collaborate and advocate to ensure all new residential buildings are zero emissions by 2030
• Take action, collaborate and advocate to ensure new commercial buildings are zero emissions by 2030
Significant 16.3 MtCO2-e 4103.93 2209.44 1.86
33.6 MtCO2-e 6031.80 2752.55 2.19
Climate Change Mitigation Strategy to 2050 33
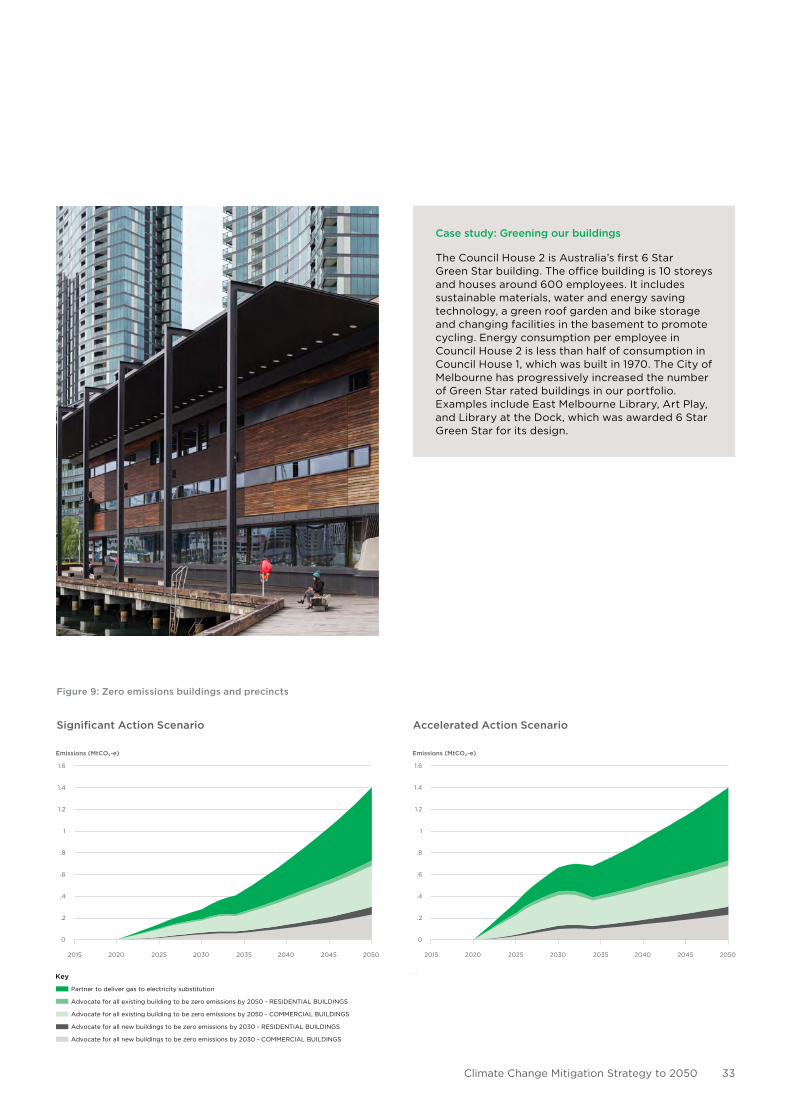
Figure 9: Zero emissions buildings and precincts
Significant Action Scenario Accelerated Action Scenario
Case study: Greening our buildings
The Council House 2 is Australia’s first 6 Star Green Star building. The office building is 10 storeys and houses around 600 employees. It includes sustainable materials, water and energy saving technology, a green roof garden and bike storage and changing facilities in the basement to promote cycling. Energy consumption per employee in Council House 2 is less than half of consumption in Council House 1, which was built in 1970. The City of Melbourne has progressively increased the number of Green Star rated buildings in our portfolio. Examples include East Melbourne Library, Art Play, and Library at the Dock, which was awarded 6 Star Green Star for its design.
Significant Action Scenario
Emissions (MtCO2-e)
1.4
1.2
1
.8
.6
.4
.2
0
1.6
2015 2020 2025 2030 2035 2040 2045 2050
Partner to deliver gas to electricity substitution
Advocate for all existing building to be zero emissions by 2050 - RESIDENTIAL BUILDINGS
Advocate for all existing building to be zero emissions by 2050 - COMMERCIAL BUILDINGS
Advocate for all new buildings to be zero emissions by 2030 - RESIDENTIAL BUILDINGS
Advocate for all new buildings to be zero emissions by 2030 - COMMERCIAL BUILDINGS
Key
1.2
1
.8
.6
.4
.2
0
2015 2020 2025 2030 2035 2040 2045 2050
Accelerated Action Scenario
Emissions (MtCO2-e)
1.4
1.6
Partner to deliver gas to electricity substitution
Advocate for all existing building to be zero emissions by 2050 - RESIDENTIAL BUILDINGS
Advocate for all existing building to be zero emissions by 2050 - COMMERCIAL BUILDINGS
Advocate for all new buildings to be zero emissions by 2030 - RESIDENTIAL BUILDINGS
Advocate for all new buildings to be zero emissions by 2030 - COMMERCIAL BUILDINGS
Key
Figure 9
melbourne.vic.gov.au34
Our long-term aim is that new and existing commercial and residential buildings become carbon neutral by 2050 at the latest. This ambition is aligned to the Green Building Council of Australia’s Carbon Positive Road Map.
Strategic priority 2 – Actions2.1 Demonstrate innovative carbon positive design and
operation of City of Melbourne-owned buildings and precincts.
2.2 Partner with industry, Victorian and Australian Government agencies to reduce barriers and deliver zero emissions buildings and urban renewal precincts.
2.3 Accelerate existing energy efficiency programs for commercial buildings and tenants through CitySwitch and other partnerships.
2.4 Advocate for energy performance disclosure for a greater range of commercial and residential buildings.
2.5 Facilitate the take up of the National Built Environment Rating Scheme for apartments across the municipality.
2.6 Renew and implement planning policies to support the development of zero emissions buildings and precincts.
2.7 Partner with industry to advocate for higher energy performance standards in the National Construction Code, the Building Act 1993 and regulations.
2.8 Advocate and facilitate to transition from gas to electricity in buildings and precincts.
2.9 Adopt circular economy principles to reduce the environmental impact and embodied emissions from products, materials and buildings across the city through procurement, urban design and planning.
The implementation of these actions is subject to the City of Melbourne’s Annual Plan and Budget process.
Climate Change Mitigation Strategy to 2050 35
"Transport accounts for 15 per cent of the city’s emissions, the majority from private cars and freight that drive across the city."
The story so farPublic transport into the city also contributes to Melbourne’s emissions profile. The city’s trams will soon be powered by solar energy, yet trains still source their power from coal-fired power.
Melbourne has a large week day population of around 900,000 people, including workers, tourists and residents, who cycle, use public transport, and drive to the city from the surrounding suburbs.
Our city also has an extensive network of pedestrian laneways that contribute to Melbourne’s retail and café culture. Swanston and Bourke Streets are partially closed to traffic and they support major retail precincts in the city. Many people enjoy walking and recreation in public parks and gardens. However, cycling levels remain static, and cycle routes across the city are patchy.
The Victorian Government has invested in major new rail infrastructure for Melbourne. The City of Melbourne is actively involved in planning the public space and infrastructure needed to support pedestrian access to the new train stations.
Challenges Melbourne already experiences significant overcrowding at various locations due to substantial growth in the number of people walking, and limited pedestrian space. Footpaths need to be widened in the municipality to cater for the number of pedestrians. Currently, at the street level, more public space is allocated to driving and parking cars than walking and cycling, even though the number of people walking and cycling is far greater.
One of the biggest barriers to increasing the proportion of people riding bicycles is safety. Current routes with dedicated cycle lanes are poorly connected. Having only a few physically protected lanes contributes to an unnecessarily stressful experience for people riding bicycles in Melbourne.
While public transport services within the city are popular, particularly the free trams in the central city, there are some barriers to more people using public transport. Barriers include overcrowding which makes journeys uncomfortable, and long waiting times for buses and trains travelling into the city from Greater Melbourne and regional areas. Many people drive to reduce their travelling time. Accessibility of public transport is also an important consideration for people with a disability and those with young families.
As climate change becomes more severe, the city needs to prepare for the impact of increased temperatures, flood and drought on people walking, cycling and using public transport. Increasing green infrastructure can cool the city, reduce the impact of floods and provide shade and respite for people while they are travelling around the city. Particular attention can be given to intersections exposed to direct sun, which become hotspots during heatwaves. Priority could be given to people walking, riding bicycles and using public transport at these intersections, reducing waiting times and exposure to the weather.
The majority of transport emissions are still from private cars and freight vehicles that drive across the city. In the short term, the electrification of vehicles will increase emissions until there is adequate supply of renewable energy in the electricity grid. In the long term, cars, buses and commercial vehicles will need to be powered by 100 per cent renewable energy to reduce emissions in line with the Paris Climate Agreement. This will also improve air quality.
STRATEGIC PRIORITY 3: ZERO EMISSIONS TRANSPORT
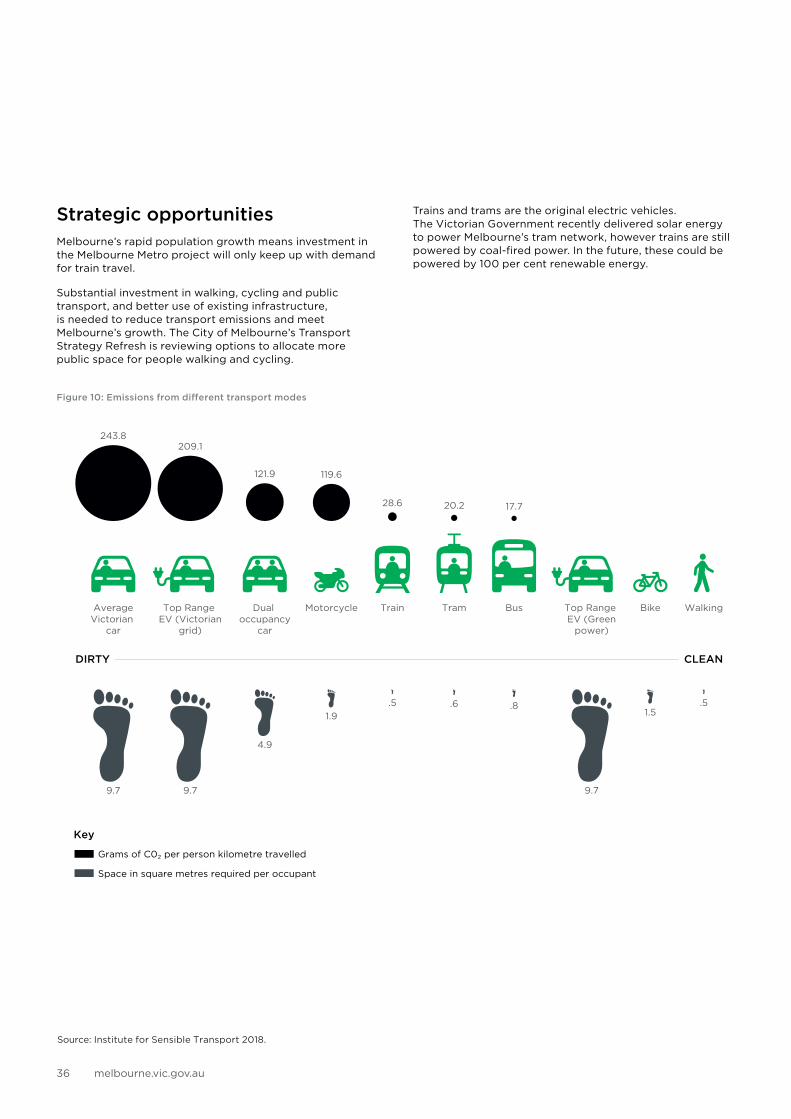
melbourne.vic.gov.au36
Figure 10: Emissions from different transport modes
Strategic opportunitiesMelbourne’s rapid population growth means investment in the Melbourne Metro project will only keep up with demand for train travel.
Substantial investment in walking, cycling and public transport, and better use of existing infrastructure, is needed to reduce transport emissions and meet Melbourne’s growth. The City of Melbourne’s Transport Strategy Refresh is reviewing options to allocate more public space for people walking and cycling.
Trains and trams are the original electric vehicles. The Victorian Government recently delivered solar energy to power Melbourne’s tram network, however trains are still powered by coal-fired power. In the future, these could be powered by 100 per cent renewable energy.
DIRTY CLEAN
Key
243.8209.1
9.7 9.7 9.7
4.9
1.9 1.5.5 .5.6 .8
121.9 119.6
28.6 20.2 17.7
AverageVictorian
car
Top Range EV (Victorian
grid)
Dual occupancy
car
Motorcycle Train Tram Bus Top Range EV (Green
power)
Bike Walking
Grams of C02 per person kilometre travelled
Space in square metres required per occupant
Figure 10
Source: Institute for Sensible Transport 2018.
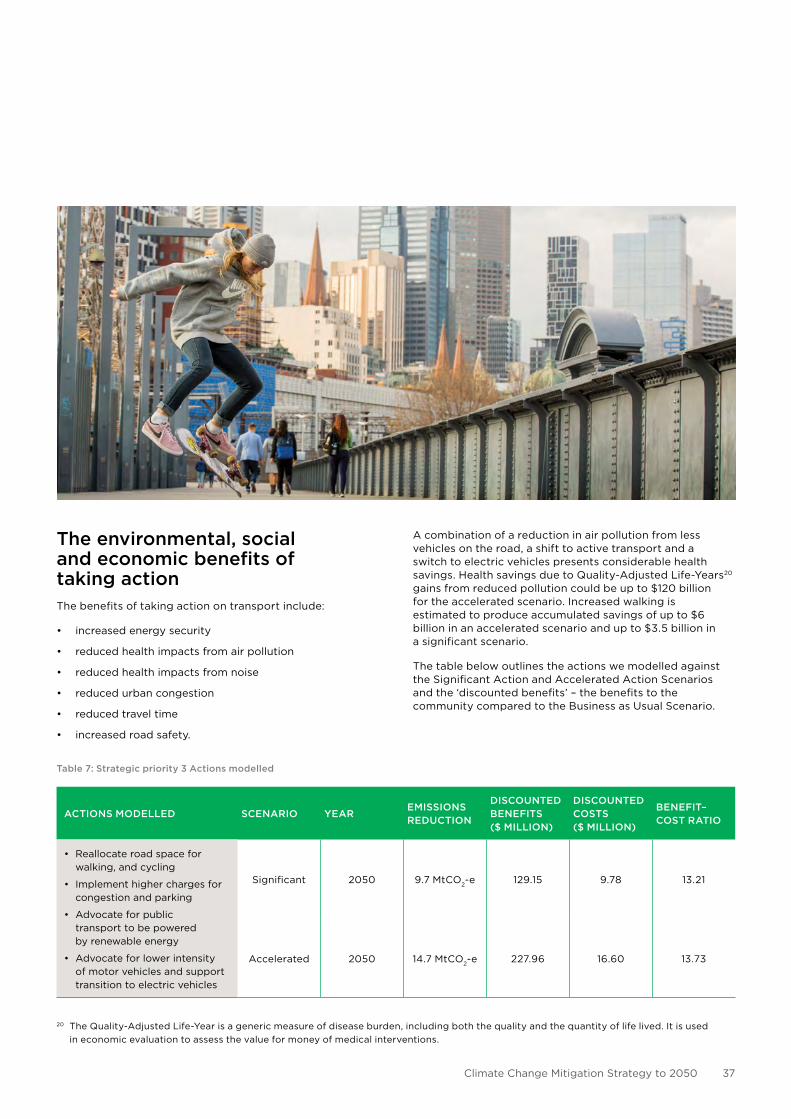
Climate Change Mitigation Strategy to 2050 37
The environmental, social and economic benefits of taking actionThe benefits of taking action on transport include:
• increased energy security
• reduced health impacts from air pollution
• reduced health impacts from noise
• reduced urban congestion
• reduced travel time
• increased road safety.
A combination of a reduction in air pollution from less vehicles on the road, a shift to active transport and a switch to electric vehicles presents considerable health savings. Health savings due to Quality-Adjusted Life-Years20 gains from reduced pollution could be up to $120 billion for the accelerated scenario. Increased walking is estimated to produce accumulated savings of up to $6 billion in an accelerated scenario and up to $3.5 billion in a significant scenario.
The table below outlines the actions we modelled against the Significant Action and Accelerated Action Scenarios and the ‘discounted benefits’ – the benefits to the community compared to the Business as Usual Scenario.
Table 7: Strategic priority 3 Actions modelled
ACTIONS MODELLED SCENARIO YEAREMISSIONS REDUCTION
DISCOUNTED BENEFITS ($ MILLION)
DISCOUNTED COSTS ($ MILLION)
BENEFIT–COST RATIO
• Reallocate road space forwalking, and cycling
• Implement higher charges forcongestion and parking
• Advocate for publictransport to be poweredby renewable energy
• Advocate for lower intensityof motor vehicles and supporttransition to electric vehicles
Significant 2050 9.7 MtCO2-e 129.15 9.78 13.21
Accelerated 2050 14.7 MtCO2-e 227.96 16.60 13.73
20 The Quality-Adjusted Life-Year is a generic measure of disease burden, including both the quality and the quantity of life lived. It is used in economic evaluation to assess the value for money of medical interventions.
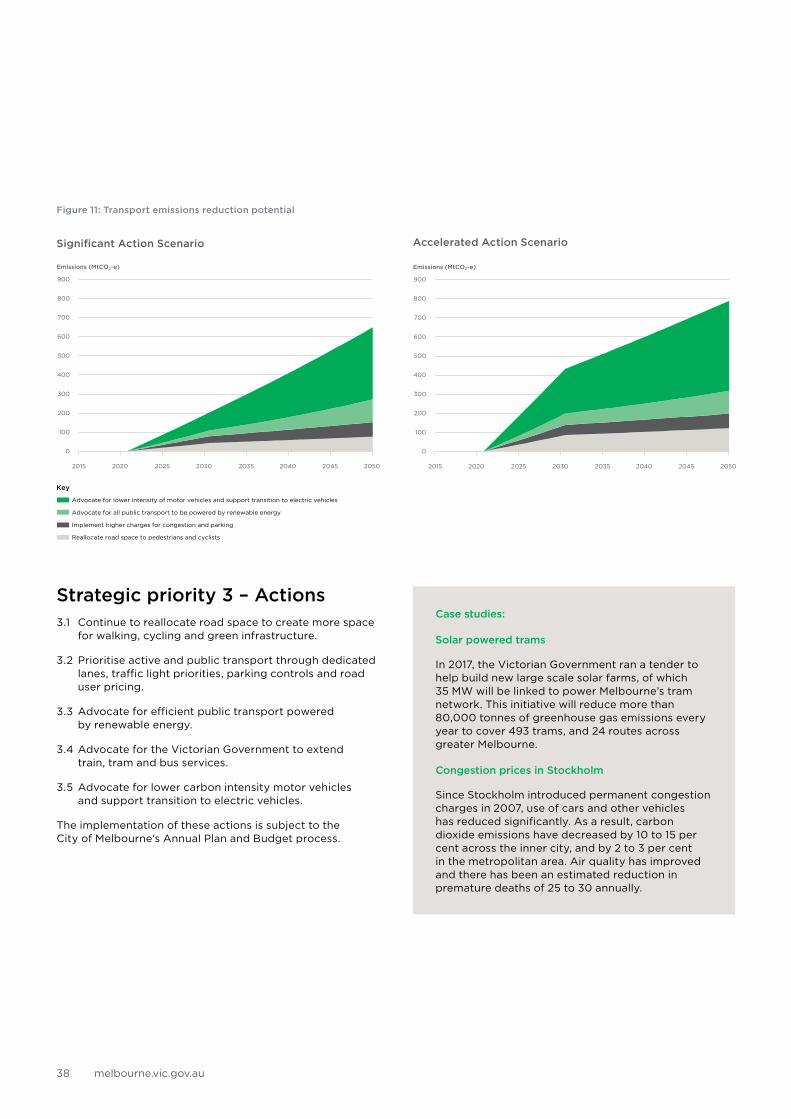
melbourne.vic.gov.au38
Figure 11: Transport emissions reduction potential
Significant Action Scenario Accelerated Action Scenario
Strategic priority 3 – Actions3.1 Continue to reallocate road space to create more space
for walking, cycling and green infrastructure.
3.2 Prioritise active and public transport through dedicated lanes, traffic light priorities, parking controls and road user pricing.
3.3 Advocate for efficient public transport powered by renewable energy.
3.4 Advocate for the Victorian Government to extend train, tram and bus services.
3.5 Advocate for lower carbon intensity motor vehicles and support transition to electric vehicles.
The implementation of these actions is subject to the City of Melbourne’s Annual Plan and Budget process.
Case studies:
Solar powered trams
In 2017, the Victorian Government ran a tender to help build new large scale solar farms, of which 35 MW will be linked to power Melbourne’s tram network. This initiative will reduce more than 80,000 tonnes of greenhouse gas emissions every year to cover 493 trams, and 24 routes across greater Melbourne.
Congestion prices in Stockholm
Since Stockholm introduced permanent congestion charges in 2007, use of cars and other vehicles has reduced significantly. As a result, carbon dioxide emissions have decreased by 10 to 15 per cent across the inner city, and by 2 to 3 per cent in the metropolitan area. Air quality has improved and there has been an estimated reduction in premature deaths of 25 to 30 annually.
500
600
700
400
300
200
100
0
2015 2020 2025 2030 2035 2040 2045 2050
Advocate for lower intensity of motor vehicles and support transition to electric vehicles
Advocate for all public transport to be powered by renewable energy
Implement higher charges for congestion and parking
Reallocate road space to pedestrians and cyclists
Key
Significant Action Scenario
Emissions (MtCO2-e)
900
800
Accelerated Action Scenario
Emissions (MtCO2-e)
900
800
0
2015 2020 2025 2030 2035 2040 2045 2050
Advocate for lower intensity of motor vehicles and support transition to electric vehicles
Advocate for all public transport to be powered by renewable energy
Implement higher charges for congestion and parking
Reallocate road space to pedestrians and cyclists
Key
500
600
700
400
300
200
100
Figure 11
500
600
700
400
300
200
100
0
2015 2020 2025 2030 2035 2040 2045 2050
Advocate for lower intensity of motor vehicles and support transition to electric vehicles
Advocate for all public transport to be powered by renewable energy
Implement higher charges for congestion and parking
Reallocate road space to pedestrians and cyclists
Key
Significant Action Scenario
Emissions (MtCO2-e)
900
800
Accelerated Action Scenario
Emissions (MtCO2-e)
900
800
0
2015 2020 2025 2030 2035 2040 2045 2050
Advocate for lower intensity of motor vehicles and support transition to electric vehicles
Advocate for all public transport to be powered by renewable energy
Implement higher charges for congestion and parking
Reallocate road space to pedestrians and cyclists
Key
500
600
700
400
300
200
100
Figure 11

39Climate Change Mitigation Strategy to 2050
melbourne.vic.gov.au40
"The vast majority of waste is generated by business activities, and is collected by private operators. These waste streams have relatively high rates of recycling."
The story so farMore than 800,000 tonnes of waste (including garbage and recycling) is estimated to be generated in the municipality each year. The total waste produced generated 6 per cent of the greenhouse emissions from our municipality in 2015. Emissions from waste are included in our greenhouse inventory even though waste treatment facilities are currently located outside our municipal boundary.
The vast majority of waste is generated by business activities, and is collected by private operators. These waste streams have relatively high rates of recycling. The recycling rate is around 61 per cent for commercial and industrial waste, and 87 per cent for construction and demolition waste.
Only 6 per cent of all waste is collected by the City of Melbourne. The recycling rates are lower for the much smaller volume of waste collected from households (25 per cent) and public places (22 per cent).
The City of Melbourne’s Waste and Resource Recovery Strategy aims to develop and introduce cost effective, environmentally responsible waste and resource recovery systems. The strategy is underpinned by waste hierarchy and circular economy thinking. A circular economy approach designs out waste wherever possible and keeps materials in use as long as possible through repair and reuse. It then returns materials to the economy through efficient recycling processes.
The Victorian Government sets policy for metropolitan waste and resource recovery including landfill levies, and funds waste and resource recovery programs through Sustainability Victoria.
ChallengesWaste generated in the municipality is expected to grow as Melbourne’s population increases over coming decades. The City of Melbourne is responsible for collection and recycling or disposal of waste from our operations, households and public places such as streets and parks. We do not have the responsibility for waste collection from restaurants, offices or businesses with commercial waste contracts.
State and local governments across Australia have been impacted by the changes in global recycling markets since early 2018. Councils are facing increased costs as a result of the Chinese Government’s decision to tighten standards for the import of recycled materials.
Strategic opportunitiesIn 2017 the Australian Government released a National Food Waste Strategy with a goal to halve the nation’s food waste by 2030. Organic waste is a priority because it generates greenhouse emissions twenty-five times more intense in their global warming potential than carbon dioxide. By promoting the health benefits of smaller portion sizes and supporting social enterprises to make use of leftover food, we can help to reduce food waste and cut emissions.
There is growing community support for reducing waste as a measure to address climate change. The Victorian Government recently committed to implement a ban on single use plastic bags, which has already been introduced in other states. The South Australian Government has introduced container deposit legislation to encourage the recycling of bottles and cans. The Australian Government has the power to regulate packaging standards that could significantly reduce waste.
A large proportion of materials that are sent to landfill can be reduced through better design and less packaging. Developing new products from recycled materials including building materials can also contribute to reduced emissions and a circular economy. This would also build local capability for recycling rather than relying on overseas recycling markets.
STRATEGIC PRIORITY 4: REDUCING THE IMPACT OF WASTE
41Climate Change Mitigation Strategy to 2050
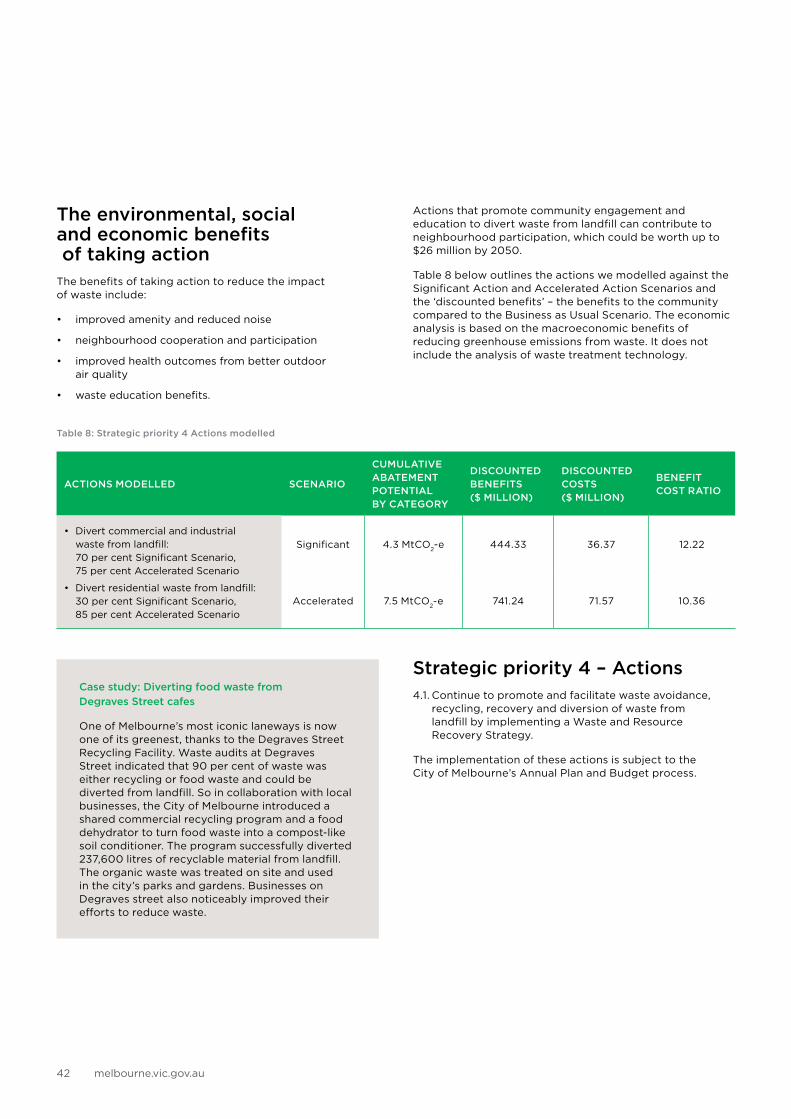
melbourne.vic.gov.au42
Table 8: Strategic priority 4 Actions modelled
The environmental, social and economic benefits of taking action The benefits of taking action to reduce the impact of waste include:
• improved amenity and reduced noise
• neighbourhood cooperation and participation
• improved health outcomes from better outdoor air quality
• waste education benefits.
Actions that promote community engagement and education to divert waste from landfill can contribute to neighbourhood participation, which could be worth up to $26 million by 2050.
Table 8 below outlines the actions we modelled against the Significant Action and Accelerated Action Scenarios and the ‘discounted benefits’ – the benefits to the community compared to the Business as Usual Scenario. The economic analysis is based on the macroeconomic benefits of reducing greenhouse emissions from waste. It does not include the analysis of waste treatment technology.
Strategic priority 4 – Actions4.1. Continue to promote and facilitate waste avoidance,
recycling, recovery and diversion of waste from landfill by implementing a Waste and Resource Recovery Strategy.
The implementation of these actions is subject to the City of Melbourne’s Annual Plan and Budget process.
Case study: Diverting food waste from Degraves Street cafes
One of Melbourne’s most iconic laneways is now one of its greenest, thanks to the Degraves Street Recycling Facility. Waste audits at Degraves Street indicated that 90 per cent of waste was either recycling or food waste and could be diverted from landfill. So in collaboration with local businesses, the City of Melbourne introduced a shared commercial recycling program and a food dehydrator to turn food waste into a compost-like soil conditioner. The program successfully diverted 237,600 litres of recyclable material from landfill. The organic waste was treated on site and used in the city’s parks and gardens. Businesses on Degraves street also noticeably improved their efforts to reduce waste.
ACTIONS MODELLED SCENARIO
CUMULATIVE ABATEMENT POTENTIAL BY CATEGORY
DISCOUNTED BENEFITS ($ MILLION)
DISCOUNTED COSTS ($ MILLION)
BENEFIT COST RATIO
• Divert commercial and industrial waste from landfill: 70 per cent Significant Scenario, 75 per cent Accelerated Scenario
• Divert residential waste from landfill: 30 per cent Significant Scenario, 85 per cent Accelerated Scenario
Significant 4.3 MtCO2-e 444.33 36.37 12.22
Accelerated 7.5 MtCO2-e 741.24 71.57 10.36
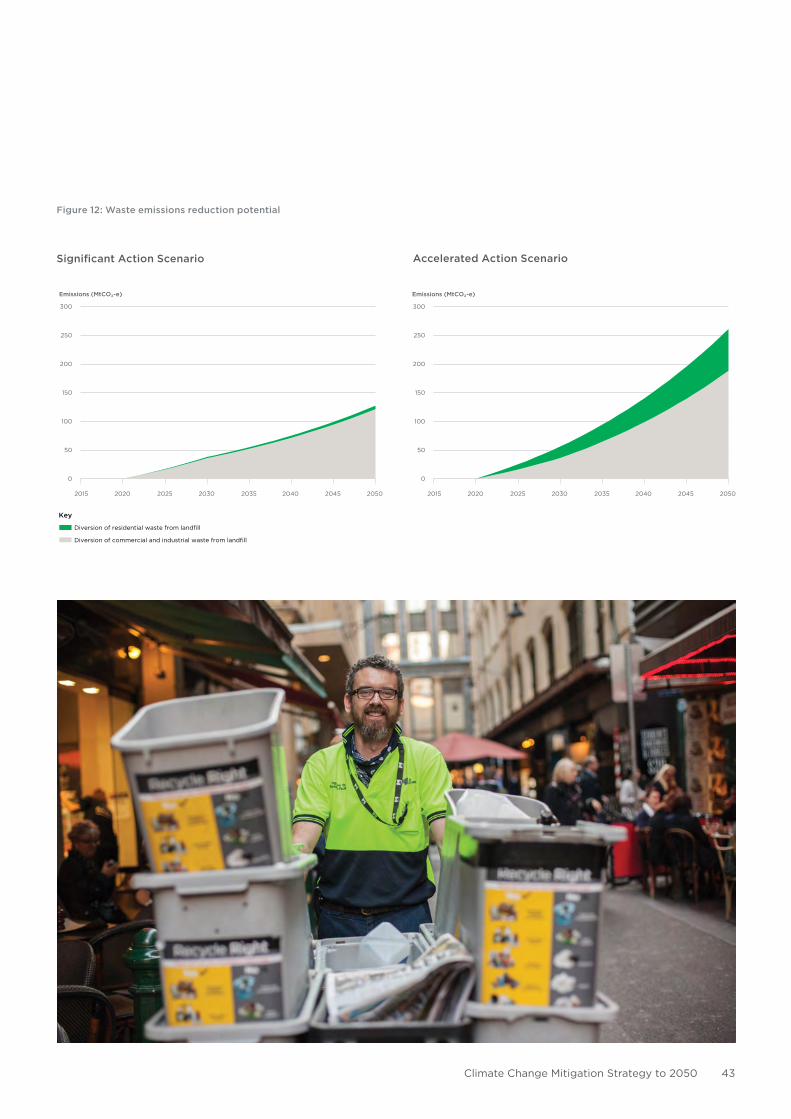
Climate Change Mitigation Strategy to 2050 43
Significant Action Scenario
Figure 12: Waste emissions reduction potential
Accelerated Action Scenario
300
250
100
150
200
50
Emissions (MtCO2-e)
0
2015 2020 2025 2030 2035 2040 2045 2050
Diversion of residential waste from landfill
Diversion of commercial and industrial waste from landfill
Key
Emissions (MtCO2-e)
300
250
0
2015 2020 2025 2030 2035 2040 2045 2050
100
150
200
50
Diversion of residential waste from landfill
Diversion of commercial and industrial waste from landfill
Key
Figure 12
300
250
100
150
200
50
Emissions (MtCO2-e)
0
2015 2020 2025 2030 2035 2040 2045 2050
Diversion of residential waste from landfill
Diversion of commercial and industrial waste from landfill
Key
Emissions (MtCO2-e)
300
250
0
2015 2020 2025 2030 2035 2040 2045 2050
100
150
200
50
Diversion of residential waste from landfill
Diversion of commercial and industrial waste from landfill
Key
Figure 12
melbourne.vic.gov.au44
"We have developed a rolling five-year Implementation Plan to meet the requirements of a voluntary Council Pledge under the Victorian Climate Change Act 2017."
Our actions to reduce emissions will be evidence-based and we will report our progress publicly. The actions within our powers are bold and ambitious. We have also outlined policy changes and actions needed by the Victorian and Australian Governments. The strategy demonstrates our support for social inclusion and contributes to achieving the Sustainable Development Goals.
We have developed a rolling five-year Implementation Plan to meet the requirements of a voluntary Council Pledge under the Victorian Climate Change Act 2017. The Implementation Plan at Appendix 1 sets interim targets to be met by 2025. It will enable us to adjust our approach as Victorian and Australian Government policy settings change or if the shift to renewable energy technology occurs more quickly than expected.
In implementing the strategy we will:
• consider climate adaptation and mitigation in an integrated way, identifying interdependencies to maximise efficiencies and minimise investment risk
• deliver environmental, social and economic benefits to the community
• take an innovative, transparent and evidence-based approach to evaluate and report our progress.
4.1 Consider climate adaptation and mitigation in an integrated way
Climate change affects our health, particularly the health of young and older people and vulnerable members of our community. It will impact future generations of Melburnians and the long-term environmental, social and economic interests of the municipality.
Managing climate risk requires public institutions, investors and businesses to reduce emissions as part of their social license to operate. It also requires managing the impacts of climate change on people, assets and infrastructure and business operations. Heatwaves causing power outages in buildings and public transport is an example of how climate change adaptation and energy supply issues can cause negative consequences for the community.
Melbourne is already experiencing the impacts of climate change. Drought, flooding and extreme heatwaves have been occurring more frequently and the impacts have become more severe. Experts warn that these impacts will continue to worsen in the next few decades. We updated our Climate Change Adaptation Strategy in 2017 to respond to these challenges. It identifies climate risks and sets actions and priorities to ensure we adapt well to the impacts of climate change.
The Climate Change Mitigation Strategy to 2050 will complement and mutually reinforce the priorities of our Climate Change Adaptation Strategy.
The Climate Change Adaptation Strategy includes five goals:
1. Enhance natural environment and green spaces in our municipality.
2. Shape our built form and urban renewal areas to withstand future climate change impacts.
3. Strengthen the resilience of our inclusive, family friendly and culturally diverse community.
4. Protect and enhance our diverse economy.
5. Continue to build Melbourne’s adaptation capabilities and expertise.
It is supported by the Total Watermark Strategy, which integrates water management across the municipality in response to increased drought and flooding; and the Urban Forest Strategy, which addresses the impact of drought and the rising temperatures associated with the urban heat island effect. The Nature in the City Strategy aims to improve the health of animal and plant populations including their resilience to climate change impacts. These strategies use nature-based solutions to help cool our city on hot days, which improves liveability, resilience and community health. It also helps to reduce the heat load on buildings during summer, reducing the energy needed for air conditioning and peak demand on the electricity grid.
As part of our Implementation Plan for this strategy, we will consider the potential for positive or negative synergies, trade-offs and feedback loops between our climate change adaptation and emission reduction goals. This will ensure that we can increase community benefits and avoid unintended negative consequences.
Integrating climate adaptation and mitigation actions
Examples of synergies, trade-offs and feedback loops include:
Positive synergy: energy efficient buildings that reduce emissions and also stay cooler during heat waves without the use of air conditioning.
Trade-off: competition for roof space between green infrastructure and solar panels.
Positive feedback loop: enhance the urban forest and use green infrastructure to reduce the urban heat island effect, which will reduce both flood risk and the impact of heat on buildings.
Negative feedback loop: irrigating green infrastructure increases demand for water and can also increase greenhouse emissions through pumping and treatment of water supply.
4. HOW WE WILL IMPLEMENT THE STRATEGY
45Climate Change Mitigation Strategy to 2050
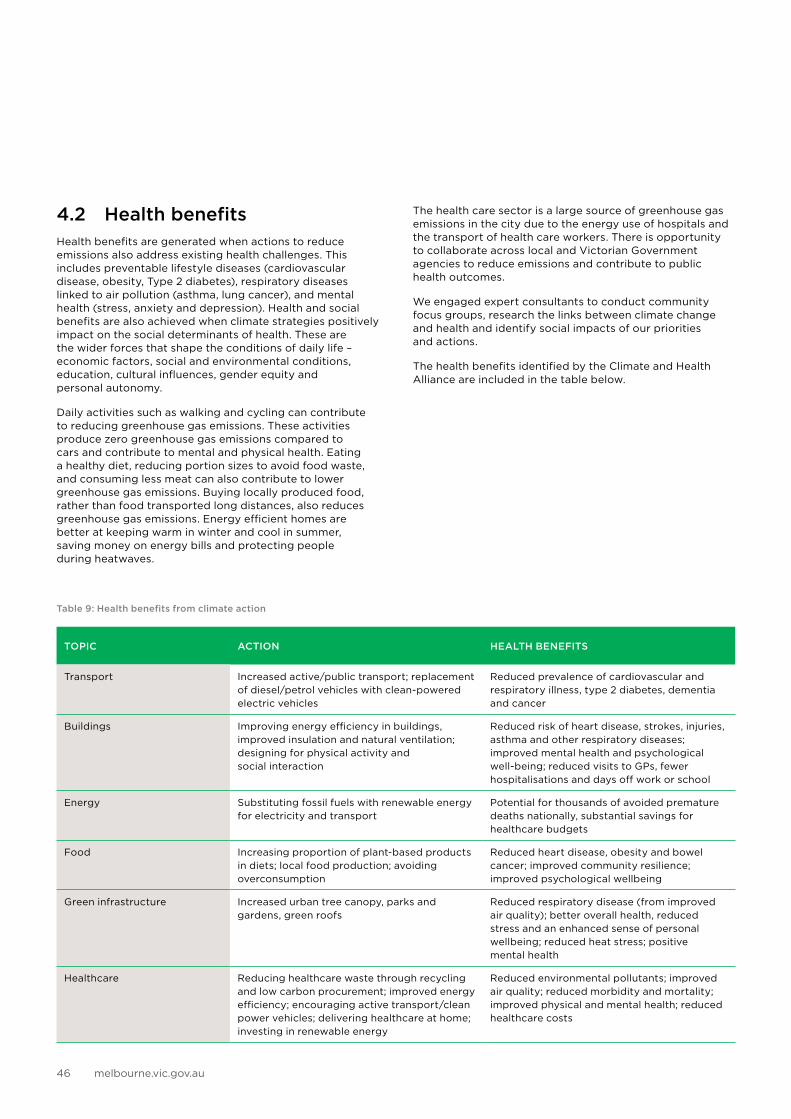
melbourne.vic.gov.au46
4.2 Health benefitsHealth benefits are generated when actions to reduce emissions also address existing health challenges. This includes preventable lifestyle diseases (cardiovascular disease, obesity, Type 2 diabetes), respiratory diseases linked to air pollution (asthma, lung cancer), and mental health (stress, anxiety and depression). Health and social benefits are also achieved when climate strategies positively impact on the social determinants of health. These are the wider forces that shape the conditions of daily life – economic factors, social and environmental conditions, education, cultural influences, gender equity and personal autonomy.
Daily activities such as walking and cycling can contribute to reducing greenhouse gas emissions. These activities produce zero greenhouse gas emissions compared to cars and contribute to mental and physical health. Eating a healthy diet, reducing portion sizes to avoid food waste, and consuming less meat can also contribute to lower greenhouse gas emissions. Buying locally produced food, rather than food transported long distances, also reduces greenhouse gas emissions. Energy efficient homes are better at keeping warm in winter and cool in summer, saving money on energy bills and protecting people during heatwaves.
The health care sector is a large source of greenhouse gas emissions in the city due to the energy use of hospitals and the transport of health care workers. There is opportunity to collaborate across local and Victorian Government agencies to reduce emissions and contribute to public health outcomes.
We engaged expert consultants to conduct community focus groups, research the links between climate change and health and identify social impacts of our priorities and actions.
The health benefits identified by the Climate and Health Alliance are included in the table below.
Table 9: Health benefits from climate action
TOPIC ACTION HEALTH BENEFITS
Transport Increased active/public transport; replacement of diesel/petrol vehicles with clean-powered electric vehicles
Reduced prevalence of cardiovascular and respiratory illness, type 2 diabetes, dementia and cancer
Buildings Improving energy efficiency in buildings, improved insulation and natural ventilation; designing for physical activity and social interaction
Reduced risk of heart disease, strokes, injuries, asthma and other respiratory diseases; improved mental health and psychological well-being; reduced visits to GPs, fewer hospitalisations and days off work or school
Energy Substituting fossil fuels with renewable energy for electricity and transport
Potential for thousands of avoided premature deaths nationally, substantial savings for healthcare budgets
Food Increasing proportion of plant-based products in diets; local food production; avoiding overconsumption
Reduced heart disease, obesity and bowel cancer; improved community resilience; improved psychological wellbeing
Green infrastructure Increased urban tree canopy, parks and gardens, green roofs
Reduced respiratory disease (from improved air quality); better overall health, reduced stress and an enhanced sense of personal wellbeing; reduced heat stress; positive mental health
Healthcare Reducing healthcare waste through recycling and low carbon procurement; improved energy efficiency; encouraging active transport/clean power vehicles; delivering healthcare at home; investing in renewable energy
Reduced environmental pollutants; improved air quality; reduced morbidity and mortality; improved physical and mental health; reduced healthcare costs
Climate Change Mitigation Strategy to 2050 47
4.3 Enhancing social inclusion and social benefits
Our aim is for a socially inclusive strategy, in keeping with the values of fairness and equity that people expressed during community consultation and the Future Melbourne deliberative democracy process in 2016.
These community priorities are reflected in the description of the goals included in the Council Plan 2017–2021:
A City for People (Goal 2) A city for people welcomes all. It is accessible, affordable, inclusive, safe and engaging. It promotes health and wellbeing, participation and social justice. It respects, celebrates and embraces human diversity. People of all ages and abilities feel secure and empowered. City planning puts people, families and community at the forefront.
A City with an Aboriginal Focus (Goal 9)Aboriginal culture, knowledge and heritage will enrich the city’s growth and development. The City of Melbourne can improve economic outcomes for Aboriginal people by creating economic development opportunities for Aboriginal people and their communities.
Social impacts
The principle of intergenerational equity recognises that decisions made today will determine the future climate that children and future generations will experience. Climate change will impact everyone who lives, works and plays in the city. However, some members of our community are more vulnerable to heatwaves, energy prices and reliability, rising food prices and the accessibility and affordability of buildings and transport infrastructure. This is because factors such as low income, age, gender, disability and background can contribute to inequities in social status and wellbeing. Together, these are the social and ecological determinants of health.21 Considering these social factors will enhance the fair distribution of benefits from the implementation of this strategy.
Social inclusion
Melbourne is a culturally diverse city and this is one of our city’s greatest strengths. Nearly half of the population was born in a non-English speaking country, and 38 per cent speak a language other than English at home (Australian Bureau of Statistics, 2011). The municipality also has a number of large universities attracting nearly 40,000 international students who contribute to the youthful and multicultural fabric of the community.22 Language and educational background can greatly influence an individual’s understanding and access to climate change solutions. Some disciplines, such as science, technology, engineering and maths also have a gender gap that industry leaders are trying to address. New technology can also be a barrier to older people or people with a disability or low income.
We will continue to engage with community stakeholders to identify barriers, social impacts and opportunities to enhance social inclusion. This will enhance the fair distribution of benefits from the implementation of this strategy.
21 The Climate and Health Alliance. (2018). Prepared for the City of Melbourne.22 City of Melbourne, Tertiary Student and Education Profile, 2016.
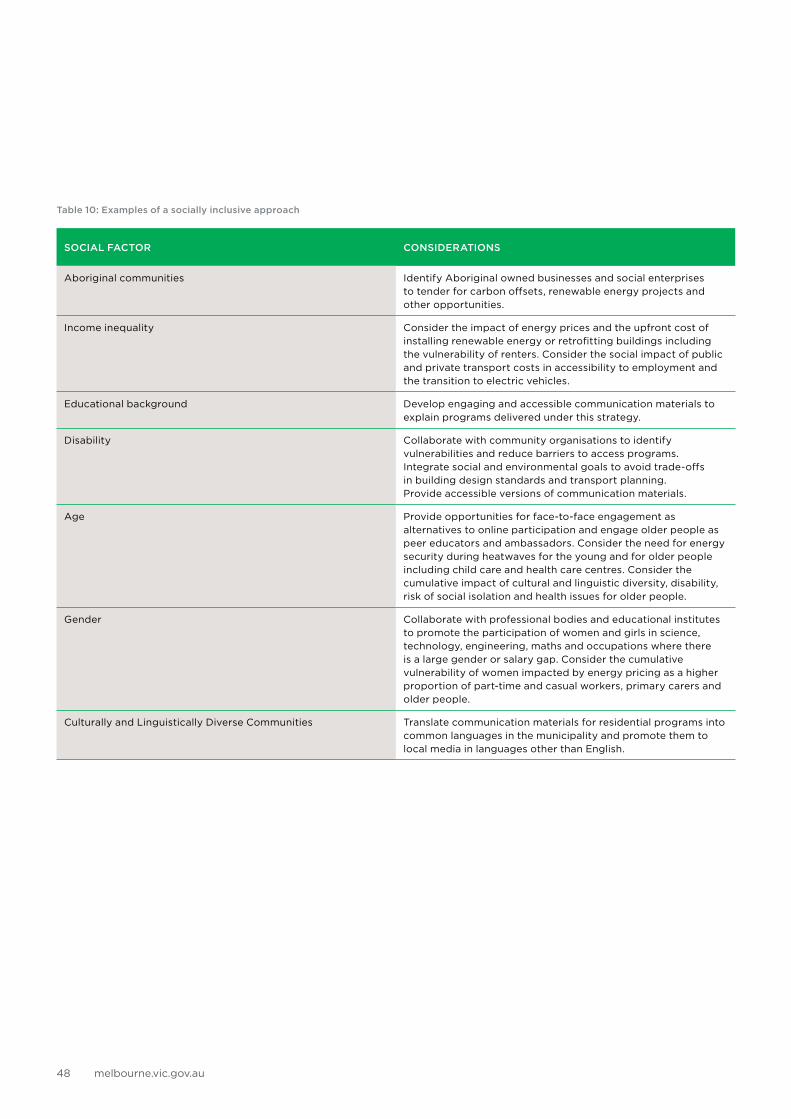
melbourne.vic.gov.au48
Table 10: Examples of a socially inclusive approach
SOCIAL FACTOR CONSIDERATIONS
Aboriginal communities Identify Aboriginal owned businesses and social enterprises to tender for carbon offsets, renewable energy projects and other opportunities.
Income inequality Consider the impact of energy prices and the upfront cost of installing renewable energy or retrofitting buildings including the vulnerability of renters. Consider the social impact of public and private transport costs in accessibility to employment and the transition to electric vehicles.
Educational background Develop engaging and accessible communication materials to explain programs delivered under this strategy.
Disability Collaborate with community organisations to identify vulnerabilities and reduce barriers to access programs. Integrate social and environmental goals to avoid trade-offs in building design standards and transport planning. Provide accessible versions of communication materials.
Age Provide opportunities for face-to-face engagement as alternatives to online participation and engage older people as peer educators and ambassadors. Consider the need for energy security during heatwaves for the young and for older people including child care and health care centres. Consider the cumulative impact of cultural and linguistic diversity, disability, risk of social isolation and health issues for older people.
Gender Collaborate with professional bodies and educational institutes to promote the participation of women and girls in science, technology, engineering, maths and occupations where there is a large gender or salary gap. Consider the cumulative vulnerability of women impacted by energy pricing as a higher proportion of part-time and casual workers, primary carers and older people.
Culturally and Linguistically Diverse Communities Translate communication materials for residential programs into common languages in the municipality and promote them to local media in languages other than English.
Climate Change Mitigation Strategy to 2050 49
4.4 Innovation, knowledge sharing and transparency
Developing and sharing new solutions
Advances in building intelligence systems provide the foundation for using technology to enable a smarter city. The City of Melbourne has demonstrated new energy saving technologies including one of the first large solar arrays on the sheds of the Queen Victoria Market, and we trialled micro-turbines on the rooftop of Council House 2.
The installation of smart meters in buildings across the city, and technological advances in building intelligence systems provide the foundation for using technology to enable a smarter city. We collaborated with the University of Melbourne and Royal Melbourne Institute of Technology, launching an innovation precinct to test smart city technology.
We work with governments, international and local city networks and university researchers on demonstration projects, pilot programs, and testing new solutions. We also sponsor competitions and hack-a-thon events for university students to develop the skills needed for the low carbon economy of the future.
The City of Melbourne also participates in several international and local city networks that support knowledge sharing between cities on climate change solutions. The development of this strategy was part of an international pilot program run by C40 for cities to share solutions. We contribute to the international efforts of cities to address climate change through the ICLEI- Local Governments for Sustainability, the Carbon Neutral Cities Alliance and 100 Resilient Cities. We collaborate with other Australian capital cities and metropolitan Melbourne local governments in the delivery of programs.
We will support innovation by using the city as a lab to test and refine solutions. Real-time, publicly accessible data about the city’s energy performance and emissions profile would enable people to develop new digital, transport and energy solutions. Multiple research gaps and information barriers must be addressed before real-time, city-wide data could be made available. Some basic data, including the average energy performance of apartments, is not currently available.
More research is needed to identify the best methods to avoid waste and achieve carbon positive buildings and precincts, zero emissions transport and renewable energy. By collaborating with other cities and urban researchers, we will be better able to identify gaps and commission urgent research to help us track our progress.
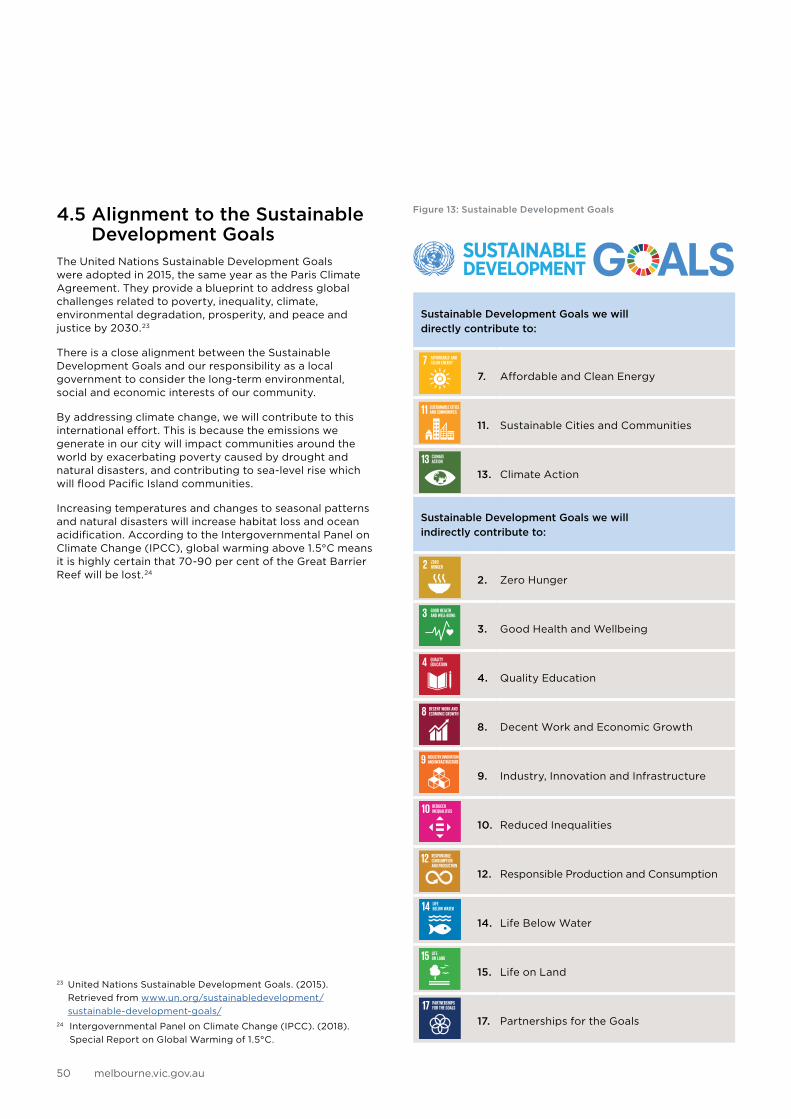
melbourne.vic.gov.au50
4.5 Alignment to the Sustainable Development Goals
The United Nations Sustainable Development Goals were adopted in 2015, the same year as the Paris Climate Agreement. They provide a blueprint to address global challenges related to poverty, inequality, climate, environmental degradation, prosperity, and peace and justice by 2030.23
There is a close alignment between the Sustainable Development Goals and our responsibility as a local government to consider the long-term environmental, social and economic interests of our community.
By addressing climate change, we will contribute to this international effort. This is because the emissions we generate in our city will impact communities around the world by exacerbating poverty caused by drought and natural disasters, and contributing to sea-level rise which will flood Pacific Island communities.
Increasing temperatures and changes to seasonal patterns and natural disasters will increase habitat loss and ocean acidification. According to the Intergovernmental Panel on Climate Change (IPCC), global warming above 1.5°C means it is highly certain that 70-90 per cent of the Great Barrier Reef will be lost.24
Figure 13: Sustainable Development Goals
Sustainable Development Goals we will directly contribute to:
7. Affordable and Clean Energy
11. Sustainable Cities and Communities
13. Climate Action
Sustainable Development Goals we will indirectly contribute to:
2. Zero Hunger
3. Good Health and Wellbeing
4. Quality Education
8. Decent Work and Economic Growth
9. Industry, Innovation and Infrastructure
10. Reduced Inequalities
12. Responsible Production and Consumption
14. Life Below Water
15. Life on Land
17. Partnerships for the Goals
23 United Nations Sustainable Development Goals. (2015). Retrieved from www.un.org/sustainabledevelopment/sustainable-development-goals/
24 Intergovernmental Panel on Climate Change (IPCC). (2018). Special Report on Global Warming of 1.5°C.
Figure 13
Sustainable Development Goals we will directly contribute to:
Sustainable Development Goals we will indirectly contribute to:
Figure 13
Sustainable Development Goals we will directly contribute to:
Sustainable Development Goals we will indirectly contribute to:
Figure 13
Sustainable Development Goals we will directly contribute to:
Sustainable Development Goals we will indirectly contribute to:
Figure 13
Sustainable Development Goals we will directly contribute to:
Sustainable Development Goals we will indirectly contribute to:
Figure 13
Sustainable Development Goals we will directly contribute to:
Sustainable Development Goals we will indirectly contribute to:
Figure 13
Sustainable Development Goals we will directly contribute to:
Sustainable Development Goals we will indirectly contribute to:
Figure 13
Sustainable Development Goals we will directly contribute to:
Sustainable Development Goals we will indirectly contribute to:
Figure 13
Sustainable Development Goals we will directly contribute to:
Sustainable Development Goals we will indirectly contribute to:
Figure 13
Sustainable Development Goals we will directly contribute to:
Sustainable Development Goals we will indirectly contribute to:
Figure 13
Sustainable Development Goals we will directly contribute to:
Sustainable Development Goals we will indirectly contribute to:
Figure 13
Sustainable Development Goals we will directly contribute to:
Sustainable Development Goals we will indirectly contribute to:
Figure 13
Sustainable Development Goals we will directly contribute to:
Sustainable Development Goals we will indirectly contribute to:
Figure 13
Sustainable Development Goals we will directly contribute to:
Sustainable Development Goals we will indirectly contribute to:
Climate Change Mitigation Strategy to 2050 51
Figure 13: Sustainable Development Goals
4.6 Measuring, reporting and evaluating progress
We have developed a comprehensive measurement and evaluation plan to accompany this strategy. Progress will be reviewed each year to adjust the five-year rolling Implementation Plan. We will also fulfil the requirements of the Council Pledge made under the Climate Change Act 2017, to evaluate and report on the implementation of emission reductions by 2025. We will review progress each year and conduct a comprehensive evaluation after five years of implementation in 2023.
We will report our progress annually as part of our commitment to the Global Covenant of Mayors, supporting the transparency priorities of the Future Melbourne 2026
Plan and the Local Government Act 1989. We will report our municipal greenhouse gas emissions according to the Global Protocol for Community-Scale Greenhouse Gas Emission Inventories, and report our residual emissions.
Our reports will also be publicly accessible on the Carbon Disclosure Project Cities platform. The Carbon Disclosure Project provides a holistic reporting framework to report the emissions profile of the municipality, emission reduction actions, greening, and climate adaptation. This will allow our performance to be tracked, evaluated, and benchmarked against other cities.
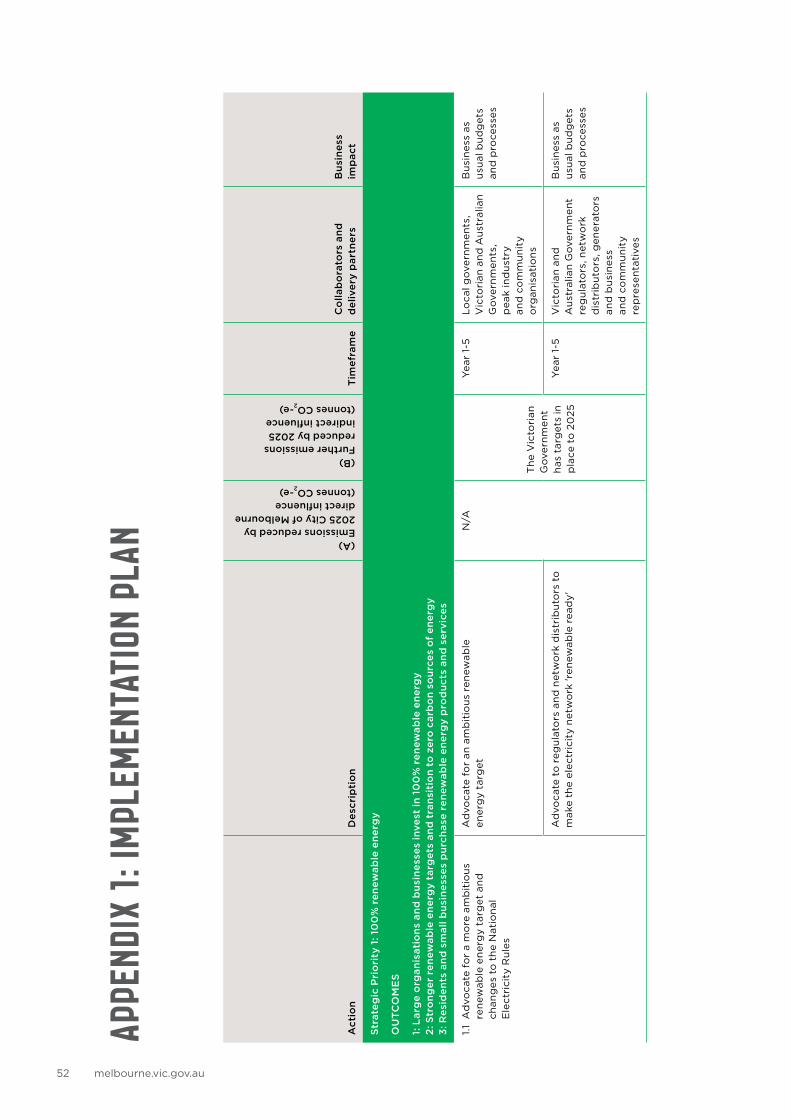
melbourne.vic.gov.au52
Act
ion
Des
crip
tio
n
(A) Emissions reduced by 2025 City of Melbourne direct influence (tonnes CO2-e)
(B) Further emissions reduced by 2025 indirect influence (tonnes CO2-e)
Tim
efra
me
Co
llab
ora
tors
and
d
eliv
ery
par
tner
sB
usin
ess
imp
act
Str
ateg
ic P
rio
rity
1: 1
00
% r
enew
able
ene
rgy
OU
TCO
ME
S
1: L
arg
e o
rgan
isat
ions
and
bus
ines
ses
inve
st in
10
0%
ren
ewab
le e
nerg
y 2:
Str
ong
er r
enew
able
ene
rgy
targ
ets
and
tra
nsit
ion
to z
ero
car
bo
n so
urce
s o
f en
erg
y 3:
Res
iden
ts a
nd s
mal
l bus
ines
ses
pur
chas
e re
new
able
ene
rgy
pro
duc
ts a
nd s
ervi
ces
1.1
Ad
voca
te f
or
a m
ore
am
bit
iou
s re
new
able
en
erg
y ta
rget
an
d
chan
ges
to
th
e N
atio
nal
E
lect
rici
ty R
ule
s
Ad
voca
te f
or
an a
mb
itio
us
ren
ewab
le
ener
gy
targ
et
N/A
Th
e V
icto
rian
G
ove
rnm
ent
has
tar
get
s in
p
lace
to
20
25
Yea
r 1-
5L
oca
l go
vern
men
ts,
Vic
tori
an a
nd
Au
stra
lian
Go
vern
men
ts,
pea
k in
du
stry
an
d c
om
mu
nit
y o
rgan
isat
ion
s
Bu
sin
ess
as
usu
al b
ud
get
s an
d p
roce
sses
Ad
voca
te t
o r
egu
lato
rs a
nd
net
wo
rk d
istr
ibu
tors
to
m
ake
the
elec
tric
ity
net
wo
rk 'r
enew
able
rea
dy
'Y
ear
1-5
Vic
tori
an a
nd
A
ust
ralia
n G
ove
rnm
ent
reg
ula
tors
, net
wo
rk
dis
trib
uto
rs, g
ener
ato
rs
and
bu
sin
ess
and
co
mm
un
ity
rep
rese
nta
tive
s
Bu
sin
ess
as
usu
al b
ud
get
s an
d p
roce
sses
APPE
NDIX
1: I
MPL
EMEN
TATI
ON P
LAN
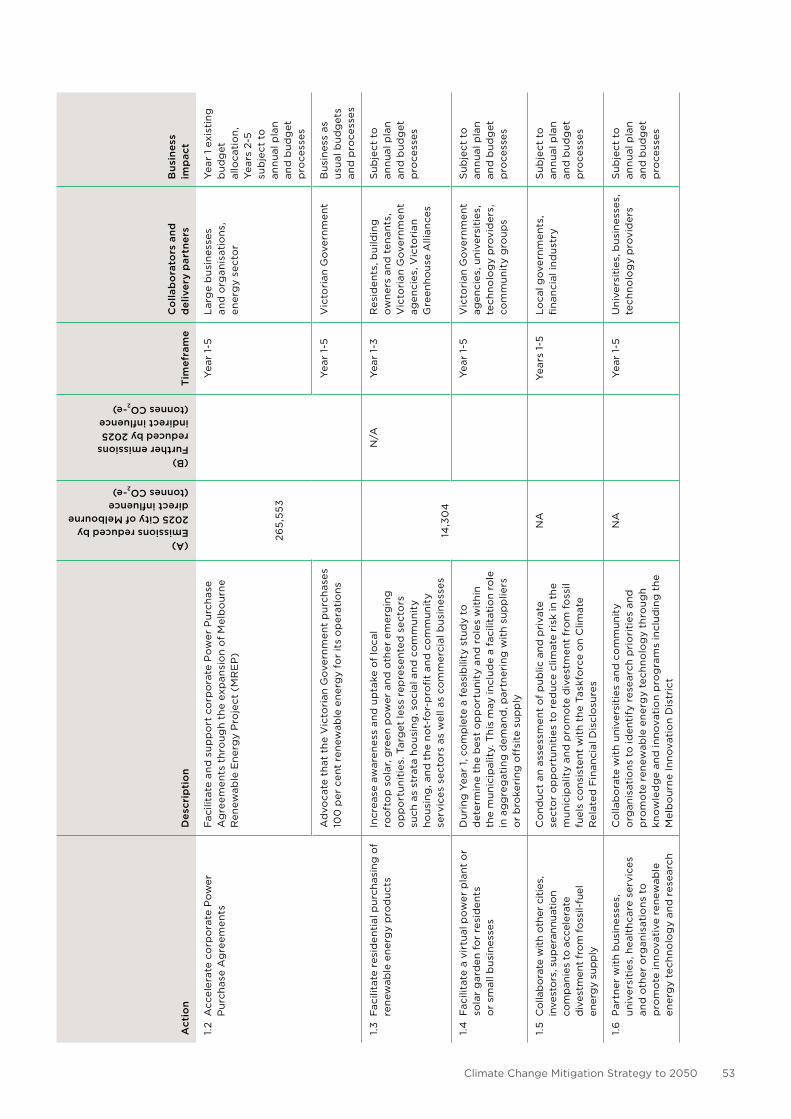
Climate Change Mitigation Strategy to 2050 53
Act
ion
Des
crip
tio
n
(A) Emissions reduced by 2025 City of Melbourne direct influence (tonnes CO2-e)
(B) Further emissions reduced by 2025 indirect influence (tonnes CO2-e)
Tim
efra
me
Co
llab
ora
tors
and
d
eliv
ery
par
tner
sB
usin
ess
imp
act
1.2
Acc
eler
ate
corp
ora
te P
ow
er
Pu
rch
ase
Ag
reem
ents
Fac
ilita
te a
nd
su
pp
ort
co
rpo
rate
Po
wer
Pu
rch
ase
Ag
reem
ents
th
rou
gh
the
exp
ansi
on
of
Mel
bo
urn
e R
enew
able
En
erg
y P
roje
ct (
MR
EP
)
265
,55
3
Y
ear
1-5
Lar
ge
bu
sin
esse
s
and
org
anis
atio
ns,
en
erg
y se
cto
r
Yea
r 1
exis
tin
g
bu
dg
et
allo
cati
on
, Y
ears
2-5
su
bje
ct t
o
ann
ual
pla
n an
d b
ud
get
p
roce
sses
Ad
voca
te t
hat
th
e V
icto
rian
Go
vern
men
t p
urc
has
es
100
per
cen
t re
new
able
en
erg
y fo
r it
s o
per
atio
ns
Yea
r 1-
5V
icto
rian
Go
vern
men
tB
usi
nes
s as
u
sual
bu
dg
ets
and
pro
cess
es
1.3
Fac
ilita
te r
esid
enti
al p
urc
has
ing
of
ren
ewab
le e
ner
gy
pro
du
cts
Incr
ease
aw
aren
ess
and
up
take
of
loca
l ro
oft
op
so
lar,
gre
en p
ow
er a
nd
oth
er e
mer
gin
g
op
po
rtu
nit
ies.
Tar
get
less
rep
rese
nte
d s
ecto
rs
such
as
stra
ta h
ou
sin
g, s
oci
al a
nd
co
mm
un
ity
ho
usi
ng
, an
d t
he
no
t-fo
r-p
rofi
t an
d c
om
mu
nit
y se
rvic
es s
ecto
rs a
s w
ell a
s co
mm
erci
al b
usi
nes
ses
14,3
04
N/A
Yea
r 1-
3R
esid
ents
, bu
ildin
g
ow
ner
s an
d t
enan
ts,
Vic
tori
an G
ove
rnm
ent
agen
cies
, Vic
tori
an
Gre
enh
ou
se A
llian
ces
Su
bje
ct t
o
ann
ual
pla
n an
d b
ud
get
p
roce
sses
1.4
Fac
ilita
te a
vir
tual
po
wer
pla
nt
or
sola
r g
ard
en f
or
resi
den
ts
or
smal
l bu
sin
esse
s
Du
rin
g Y
ear
1, c
om
ple
te a
fea
sib
ility
stu
dy
to
det
erm
ine
the
bes
t o
pp
ort
un
ity
and
ro
les
wit
hin
th
e m
un
icip
alit
y. T
his
may
incl
ud
e a
faci
litat
ion
role
in
ag
gre
gat
ing
dem
and
, par
tner
ing
wit
h su
pp
liers
o
r b
roke
rin
g o
ffsi
te s
up
ply
Y
ear
1-5
Vic
tori
an G
ove
rnm
ent
agen
cies
, un
iver
siti
es,
tech
no
log
y p
rovi
der
s,
com
mu
nit
y g
rou
ps
Su
bje
ct t
o
ann
ual
pla
n an
d b
ud
get
p
roce
sses
1.5
Co
llab
ora
te w
ith
oth
er c
itie
s,
inve
sto
rs, s
uper
annu
atio
n co
mp
anie
s to
acc
eler
ate
div
estm
ent
fro
m f
oss
il-fu
el
ener
gy
sup
ply
Co
nd
uct
an
asse
ssm
ent
of
pu
blic
an
d p
riva
te
sect
or
op
po
rtu
nit
ies
to r
edu
ce c
limat
e ri
sk in
th
e m
un
icip
alit
y an
d p
rom
ote
div
estm
ent
fro
m f
oss
il fu
els
con
sist
ent
wit
h th
e Ta
skfo
rce
on
Clim
ate
Rel
ated
Fin
anci
al D
iscl
osu
res
NA
Y
ears
1-5
Lo
cal g
ove
rnm
ents
, fi
nan
cial
ind
ust
ryS
ub
ject
to
an
nu
al p
lan
and
bu
dg
et
pro
cess
es
1.6
Par
tner
wit
h b
usi
nes
ses,
u
niv
ersi
ties
, hea
lth
care
ser
vice
s an
d o
ther
org
anis
atio
ns
to
pro
mo
te in
no
vati
ve r
enew
able
en
erg
y te
chn
olo
gy
and
res
earc
h
Co
llab
ora
te w
ith
un
iver
siti
es a
nd
co
mm
un
ity
org
anis
atio
ns
to id
enti
fy r
esea
rch
pri
ori
ties
an
d
pro
mo
te r
enew
able
en
erg
y te
chn
olo
gy
thro
ug
h kn
ow
led
ge
and
inn
ova
tio
n p
rog
ram
s in
clu
din
g t
he
Mel
bo
urn
e In
no
vati
on
Dis
tric
t
NA
Y
ear
1-5
Un
iver
siti
es, b
usi
nes
ses,
te
chn
olo
gy
pro
vid
ers
Su
bje
ct t
o
ann
ual
pla
n an
d b
ud
get
p
roce
sses
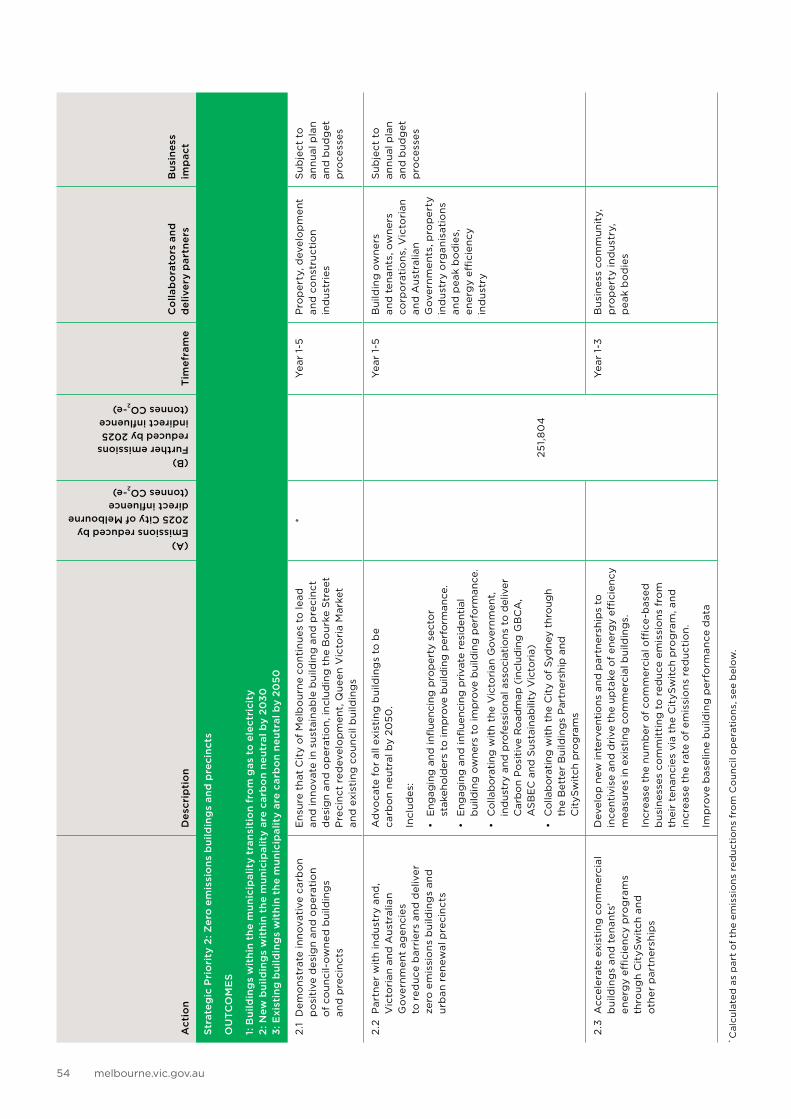
melbourne.vic.gov.au54
Act
ion
Des
crip
tio
n
(A) Emissions reduced by 2025 City of Melbourne direct influence (tonnes CO2-e)
(B) Further emissions reduced by 2025 indirect influence (tonnes CO2-e)
Tim
efra
me
Co
llab
ora
tors
and
d
eliv
ery
par
tner
sB
usin
ess
imp
act
Str
ateg
ic P
rio
rity
2: Z
ero
em
issi
ons
bui
ldin
gs
and
pre
cinc
ts
OU
TCO
ME
S
1: B
uild
ing
s w
ithi
n th
e m
unic
ipal
ity
tran
siti
on
fro
m g
as t
o e
lect
rici
ty
2: N
ew b
uild
ing
s w
ithi
n th
e m
unic
ipal
ity
are
carb
on
neut
ral b
y 20
30
3: E
xist
ing
bui
ldin
gs
wit
hin
the
mun
icip
alit
y ar
e ca
rbo
n ne
utra
l by
2050
2.1
Dem
on
stra
te in
no
vati
ve c
arb
on
po
siti
ve d
esig
n an
d o
per
atio
n
of
cou
nci
l-o
wn
ed b
uild
ing
s
and
pre
cin
cts
En
sure
th
at C
ity
of
Mel
bo
urn
e co
nti
nu
es t
o le
ad
and
inn
ova
te in
su
stai
nab
le b
uild
ing
an
d p
reci
nct
d
esig
n an
d o
per
atio
n, i
ncl
ud
ing
th
e B
ou
rke
Str
eet
Pre
cin
ct r
edev
elo
pm
ent,
Qu
een
Vic
tori
a M
arke
t an
d e
xist
ing
co
un
cil b
uild
ing
s
*
Yea
r 1-
5P
rop
erty
, dev
elo
pm
ent
and
co
nst
ruct
ion
ind
ust
ries
Su
bje
ct t
o
ann
ual
pla
n an
d b
ud
get
p
roce
sses
2.2
Par
tner
wit
h in
du
stry
an
d,
Vic
tori
an a
nd
Au
stra
lian
Go
vern
men
t ag
enci
es
to r
edu
ce b
arri
ers
and
del
iver
ze
ro e
mis
sio
ns
bu
ildin
gs
and
u
rban
ren
ewal
pre
cin
cts
Ad
voca
te f
or
all e
xist
ing
bu
ildin
gs
to b
e
carb
on
neu
tral
by
205
0.
Incl
ud
es:
• E
ngag
ing
and
infl
uenc
ing
pro
per
ty s
ecto
r st
akeh
old
ers
to im
pro
ve b
uild
ing
per
form
ance
.
• E
ngag
ing
and
infl
uenc
ing
pri
vate
res
iden
tial
b
uild
ing
ow
ners
to
imp
rove
bui
ldin
g p
erfo
rman
ce.
• C
olla
bo
rati
ng w
ith
the
Vic
tori
an G
over
nmen
t,
ind
ustr
y an
d p
rofe
ssio
nal a
sso
ciat
ions
to
del
iver
C
arb
on
Po
siti
ve R
oad
map
(in
clud
ing
GB
CA
, A
SB
EC
and
Sus
tain
abili
ty V
icto
ria)
• C
olla
bo
rati
ng w
ith
the
Cit
y o
f S
ydne
y th
roug
h
the
Bet
ter
Bui
ldin
gs
Par
tner
ship
and
C
ityS
wit
ch p
rog
ram
s
25
1,8
04
Yea
r 1-
5B
uild
ing
ow
ner
s an
d t
enan
ts, o
wn
ers
corp
ora
tio
ns,
Vic
tori
an
and
Au
stra
lian
Go
vern
men
ts, p
rop
erty
in
du
stry
org
anis
atio
ns
and
pea
k b
od
ies,
en
erg
y effi
cien
cy
ind
ust
ry
Su
bje
ct t
o
ann
ual
pla
n an
d b
ud
get
p
roce
sses
2.3
Acc
eler
ate
exis
tin
g c
om
mer
cial
b
uild
ing
s an
d t
enan
ts’
ener
gy
effici
ency
pro
gra
ms
thro
ug
h C
ityS
wit
ch a
nd
o
ther
par
tner
ship
s
Dev
elo
p n
ew in
terv
enti
on
s an
d p
artn
ersh
ips
to
ince
ntiv
ise
and
dri
ve t
he
up
take
of
ener
gy
effici
ency
m
easu
res
in e
xist
ing
co
mm
erci
al b
uild
ing
s.
Incr
ease
th
e n
um
ber
of
com
mer
cial
offi
ce-b
ased
b
usi
nes
ses
com
mit
tin
g t
o r
edu
ce e
mis
sio
ns
fro
m
thei
r te
nan
cies
via
th
e C
ityS
wit
ch p
rog
ram
, an
d
incr
ease
th
e ra
te o
f em
issi
on
s re
du
ctio
n.
Imp
rove
bas
elin
e b
uild
ing
per
form
ance
dat
a
Yea
r 1-
3B
usi
nes
s co
mm
un
ity,
p
rop
erty
ind
ust
ry,
pea
k b
od
ies
* C
alcu
late
d a
s p
art
of
the
emis
sio
ns
red
uct
ion
s fr
om
Co
un
cil o
per
atio
ns,
see
bel
ow
.
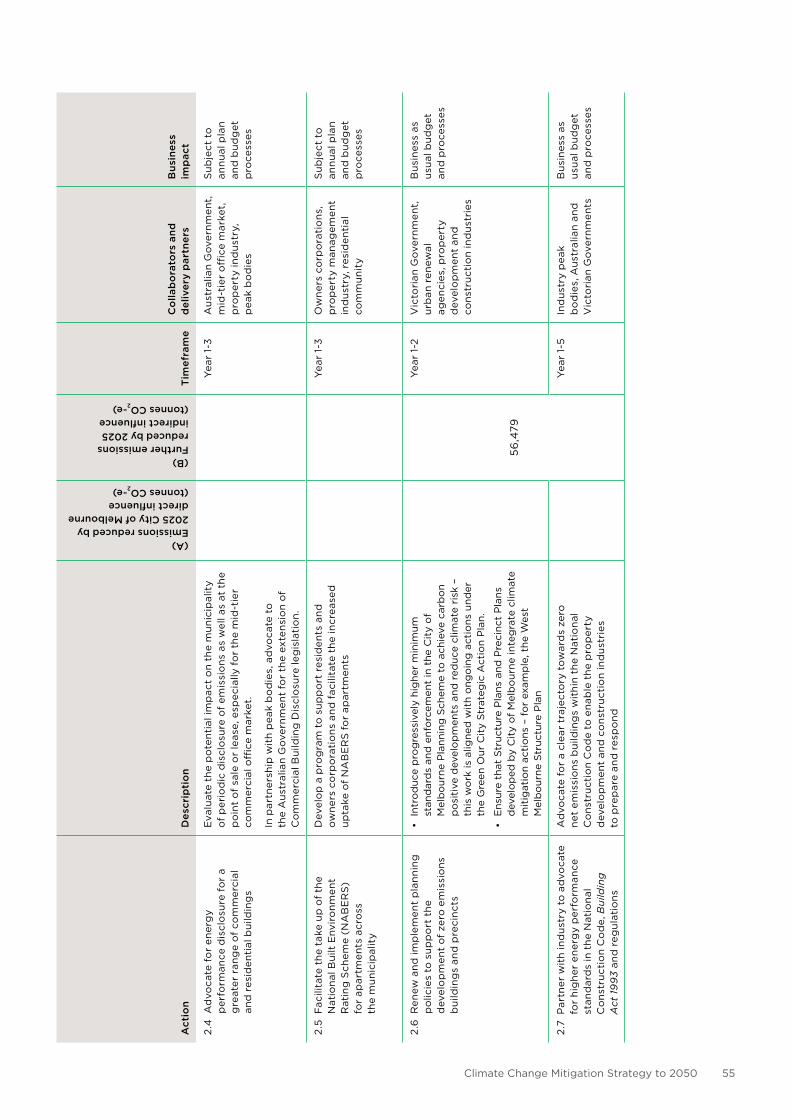
Climate Change Mitigation Strategy to 2050 55
Act
ion
Des
crip
tio
n
(A) Emissions reduced by 2025 City of Melbourne direct influence (tonnes CO2-e)
(B) Further emissions reduced by 2025 indirect influence (tonnes CO2-e)
Tim
efra
me
Co
llab
ora
tors
and
d
eliv
ery
par
tner
sB
usin
ess
imp
act
2.4
Ad
voca
te f
or
ener
gy
per
form
ance
dis
clo
sure
fo
r a
gre
ater
ran
ge
of
com
mer
cial
an
d r
esid
enti
al b
uild
ing
s
Eva
luat
e th
e p
ote
nti
al im
pac
t o
n th
e m
un
icip
alit
y o
f p
erio
dic
dis
clo
sure
of
emis
sio
ns
as w
ell a
s at
th
e p
oin
t o
f sa
le o
r le
ase,
esp
ecia
lly f
or
the
mid
-tie
r co
mm
erci
al o
ffice
mar
ket.
In p
artn
ersh
ip w
ith
pea
k b
od
ies,
ad
voca
te t
o
the
Au
stra
lian
Go
vern
men
t fo
r th
e ex
ten
sio
n o
f C
om
mer
cial
Bu
ildin
g D
iscl
osu
re le
gis
lati
on
.
Yea
r 1-
3A
ust
ralia
n G
ove
rnm
ent,
m
id-t
ier
offi
ce m
arke
t,
pro
per
ty in
du
stry
, p
eak
bo
die
s
Su
bje
ct t
o
ann
ual
pla
n an
d b
ud
get
p
roce
sses
2.5
Fac
ilita
te t
he
take
up
of
the
Nat
ion
al B
uilt
Env
iro
nm
ent
R
atin
g S
chem
e (N
AB
ER
S)
fo
r ap
artm
ents
acr
oss
th
e m
un
icip
alit
y
Dev
elo
p a
pro
gra
m t
o s
up
po
rt r
esid
ents
an
d
ow
ner
s co
rpo
rati
on
s an
d f
acili
tate
th
e in
crea
sed
u
pta
ke o
f N
AB
ER
S f
or
apar
tmen
ts
Yea
r 1-
3O
wn
ers
corp
ora
tio
ns,
p
rop
erty
man
agem
ent
ind
ust
ry, r
esid
enti
al
com
mu
nit
y
Su
bje
ct t
o
ann
ual
pla
n an
d b
ud
get
p
roce
sses
2.6
Ren
ew a
nd
imp
lem
ent
pla
nn
ing
p
olic
ies
to s
up
po
rt t
he
dev
elo
pm
ent
of
zero
em
issi
on
s b
uild
ing
s an
d p
reci
nct
s
• In
tro
duc
e p
rog
ress
ivel
y hi
ghe
r m
inim
um
stan
dar
ds
and
enf
orc
emen
t in
the
Cit
y o
f M
elb
our
ne P
lann
ing
Sch
eme
to a
chie
ve c
arb
on
po
siti
ve d
evel
op
men
ts a
nd r
educ
e cl
imat
e ri
sk –
th
is w
ork
is a
ligne
d w
ith
ong
oin
g a
ctio
ns u
nder
th
e G
reen
Our
Cit
y S
trat
egic
Act
ion
Pla
n.
• E
nsur
e th
at S
truc
ture
Pla
ns a
nd P
reci
nct
Pla
ns
dev
elo
ped
by
Cit
y o
f M
elb
our
ne in
teg
rate
clim
ate
mit
igat
ion
acti
ons
– f
or
exam
ple
, the
Wes
t M
elb
our
ne S
truc
ture
Pla
n
56
,479
Yea
r 1-
2V
icto
rian
Go
vern
men
t,
urb
an r
enew
al
agen
cies
, pro
per
ty
dev
elo
pm
ent
and
co
nst
ruct
ion
ind
ust
ries
Bu
sin
ess
as
usu
al b
ud
get
an
d p
roce
sses
2.7
Par
tner
wit
h in
du
stry
to
ad
voca
te
for
hig
her
en
erg
y p
erfo
rman
ce
stan
dar
ds
in t
he
Nat
ion
al
Co
nst
ruct
ion
Co
de,
Bu
ildin
g
Act
19
93
and
reg
ula
tio
ns
Ad
voca
te f
or
a cl
ear
traj
ecto
ry t
ow
ard
s ze
ro
net
em
issi
on
s b
uild
ing
s w
ith
in t
he
Nat
ion
al
Co
nst
ruct
ion
Co
de
to e
nab
le t
he
pro
per
ty
dev
elo
pm
ent
and
co
nst
ruct
ion
ind
ust
ries
to
pre
par
e an
d r
esp
on
d
Yea
r 1-
5In
du
stry
pea
k
bo
die
s, A
ust
ralia
n an
d
Vic
tori
an G
ove
rnm
ents
Bu
sin
ess
as
usu
al b
ud
get
an
d p
roce
sses
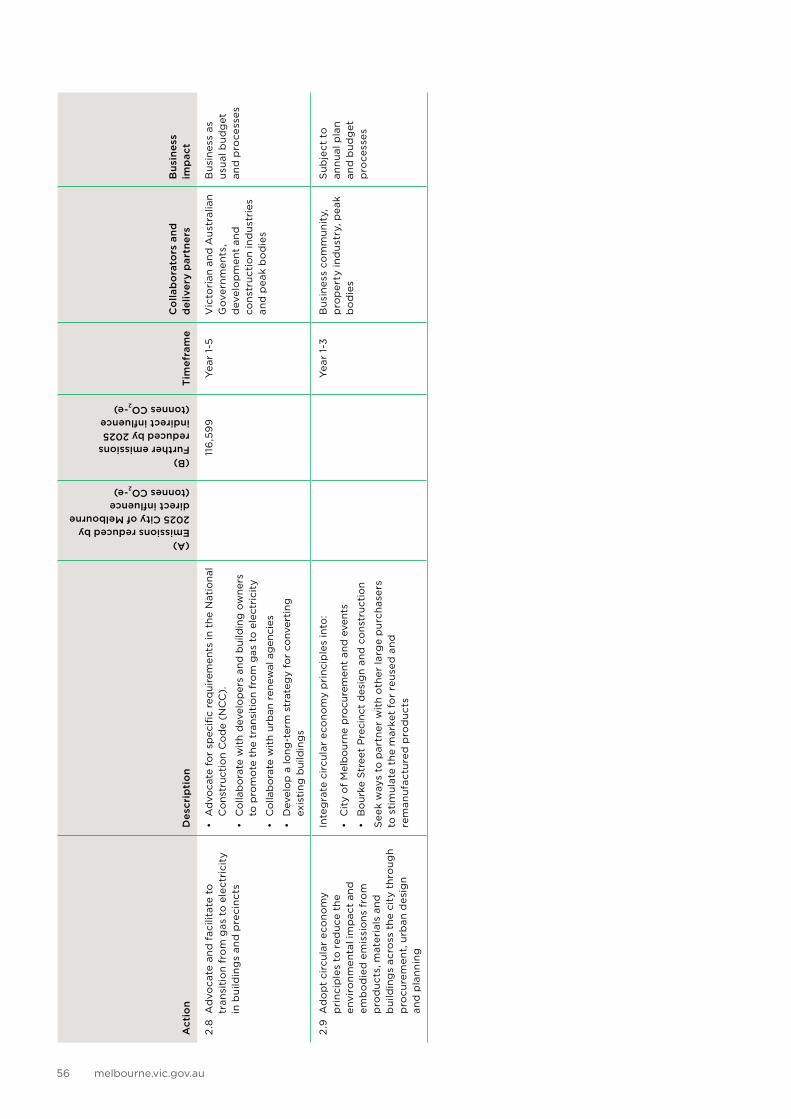
melbourne.vic.gov.au56
Act
ion
Des
crip
tio
n
(A) Emissions reduced by 2025 City of Melbourne direct influence (tonnes CO2-e)
(B) Further emissions reduced by 2025 indirect influence (tonnes CO2-e)
Tim
efra
me
Co
llab
ora
tors
and
d
eliv
ery
par
tner
sB
usin
ess
imp
act
2.8
Ad
voca
te a
nd
fac
ilita
te t
o
tran
siti
on
fro
m g
as t
o e
lect
rici
ty
in b
uild
ing
s an
d p
reci
nct
s
• A
dvo
cate
fo
r sp
ecifi
c re
qui
rem
ents
in t
he N
atio
nal
Co
nstr
ucti
on
Co
de
(NC
C).
• C
olla
bo
rate
wit
h d
evel
op
ers
and
bui
ldin
g o
wne
rs
to p
rom
ote
the
tra
nsit
ion
fro
m g
as t
o e
lect
rici
ty
• C
olla
bo
rate
wit
h ur
ban
ren
ewal
ag
enci
es
• D
evel
op
a lo
ng-t
erm
str
ateg
y fo
r co
nver
ting
ex
isti
ng b
uild
ing
s
116
,59
9Y
ear
1-5
Vic
tori
an a
nd
Au
stra
lian
Go
vern
men
ts,
dev
elo
pm
ent
and
co
nst
ruct
ion
ind
ust
ries
an
d p
eak
bo
die
s
Bu
sin
ess
as
usu
al b
ud
get
an
d p
roce
sses
2.9
Ad
op
t ci
rcu
lar
eco
no
my
pri
nci
ple
s to
red
uce
th
e en
viro
nm
enta
l im
pac
t an
d
emb
od
ied
em
issi
on
s fr
om
p
rod
uct
s, m
ater
ials
an
d
bu
ildin
gs
acro
ss t
he
city
th
rou
gh
pro
cure
men
t, u
rban
des
ign
an
d p
lan
nin
g
Inte
gra
te c
ircu
lar
eco
no
my
pri
nci
ple
s in
to:
• C
ity
of
Mel
bo
urne
pro
cure
men
t an
d e
vent
s
• B
our
ke S
tree
t P
reci
nct
des
ign
and
co
nstr
ucti
on
See
k w
ays
to p
artn
er w
ith
oth
er la
rge
pu
rch
aser
s to
sti
mu
late
th
e m
arke
t fo
r re
use
d a
nd
re
man
ufa
ctu
red
pro
du
cts
Yea
r 1-
3B
usi
nes
s co
mm
un
ity,
p
rop
erty
ind
ust
ry, p
eak
bo
die
s
Su
bje
ct t
o
ann
ual
pla
n an
d b
ud
get
p
roce
sses
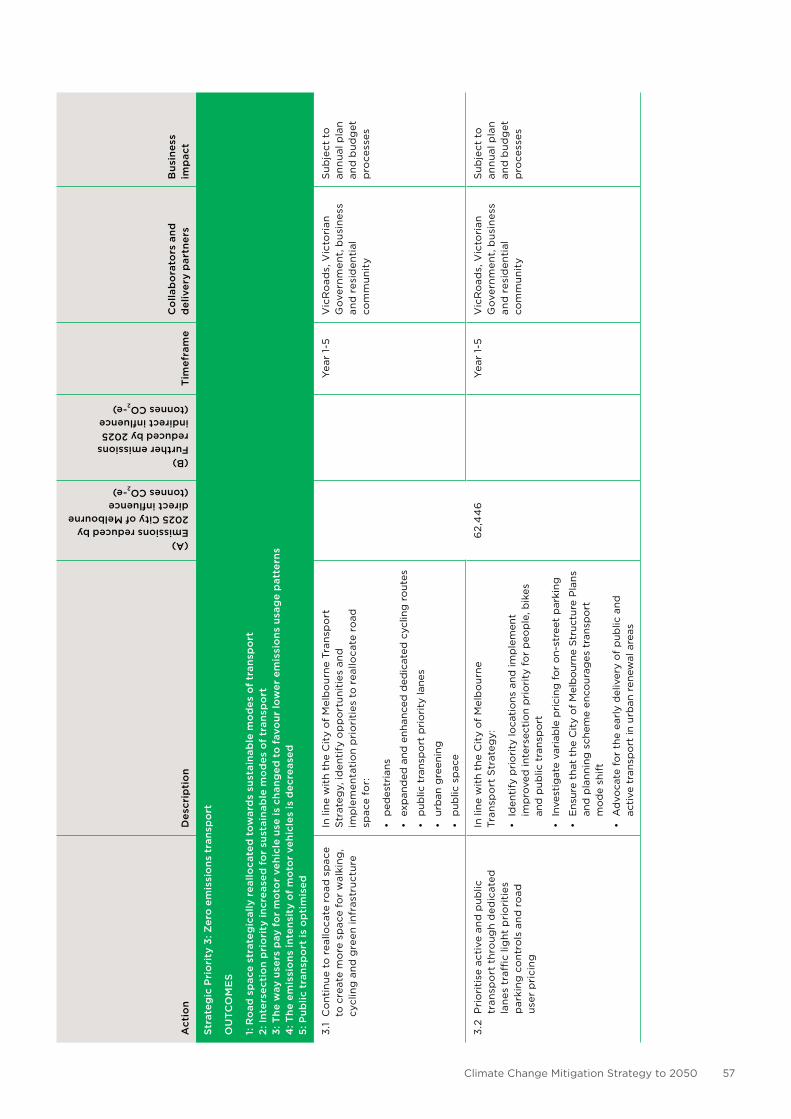
Climate Change Mitigation Strategy to 2050 57
Act
ion
Des
crip
tio
n
(A) Emissions reduced by 2025 City of Melbourne direct influence (tonnes CO2-e)
(B) Further emissions reduced by 2025 indirect influence (tonnes CO2-e)
Tim
efra
me
Co
llab
ora
tors
and
d
eliv
ery
par
tner
sB
usin
ess
imp
act
Str
ateg
ic P
rio
rity
3: Z
ero
em
issi
ons
tra
nsp
ort
OU
TCO
ME
S
1: R
oad
sp
ace
stra
teg
ical
ly r
eallo
cate
d t
ow
ard
s su
stai
nab
le m
od
es o
f tr
ansp
ort
2:
Inte
rsec
tio
n p
rio
rity
incr
ease
d f
or
sust
aina
ble
mo
des
of
tran
spo
rt
3: T
he w
ay u
sers
pay
fo
r m
oto
r ve
hicl
e us
e is
cha
nged
to
fav
our
low
er e
mis
sio
ns u
sag
e p
atte
rns
4: T
he e
mis
sio
ns in
tens
ity
of
mo
tor
vehi
cles
is d
ecre
ased
5:
Pub
lic t
rans
po
rt is
op
tim
ised
3.1
Co
nti
nu
e to
rea
lloca
te r
oad
sp
ace
to c
reat
e m
ore
sp
ace
for
wal
kin
g,
cycl
ing
an
d g
reen
infr
astr
uct
ure
In li
ne
wit
h th
e C
ity
of
Mel
bo
urn
e Tr
ansp
ort
S
trat
egy,
iden
tify
op
po
rtu
nit
ies
and
im
ple
men
tati
on
pri
ori
ties
to
rea
lloca
te r
oad
sp
ace
for:
• p
edes
tria
ns
• ex
pan
ded
and
enh
ance
d d
edic
ated
cyc
ling
ro
utes
• p
ublic
tra
nsp
ort
pri
ori
ty la
nes
• ur
ban
gre
enin
g
• p
ublic
sp
ace
62,
44
6
Yea
r 1-
5V
icR
oad
s, V
icto
rian
G
ove
rnm
ent,
bu
sin
ess
and
res
iden
tial
co
mm
un
ity
Su
bje
ct t
o
ann
ual
pla
n an
d b
ud
get
p
roce
sses
3.2
Pri
ori
tise
act
ive
and
pu
blic
tr
ansp
ort
th
rou
gh
ded
icat
ed
lan
es t
raffi
c lig
ht
pri
ori
ties
p
arki
ng
co
ntr
ols
an
d r
oad
u
ser
pri
cin
g
In li
ne
wit
h th
e C
ity
of
Mel
bo
urn
e
Tran
spo
rt S
trat
egy:
• Id
enti
fy p
rio
rity
loca
tio
ns a
nd im
ple
men
t im
pro
ved
inte
rsec
tio
n p
rio
rity
fo
r p
eop
le, b
ikes
an
d p
ublic
tra
nsp
ort
• In
vest
igat
e va
riab
le p
rici
ng f
or
on-
stre
et p
arki
ng
• E
nsur
e th
at t
he C
ity
of
Mel
bo
urne
Str
uctu
re P
lans
an
d p
lann
ing
sch
eme
enco
urag
es t
rans
po
rt
mo
de
shif
t
• A
dvo
cate
fo
r th
e ea
rly
del
iver
y o
f p
ublic
and
ac
tive
tra
nsp
ort
in u
rban
ren
ewal
are
as
Yea
r 1-
5V
icR
oad
s, V
icto
rian
G
ove
rnm
ent,
bu
sin
ess
and
res
iden
tial
co
mm
un
ity
Su
bje
ct t
o
ann
ual
pla
n an
d b
ud
get
p
roce
sses
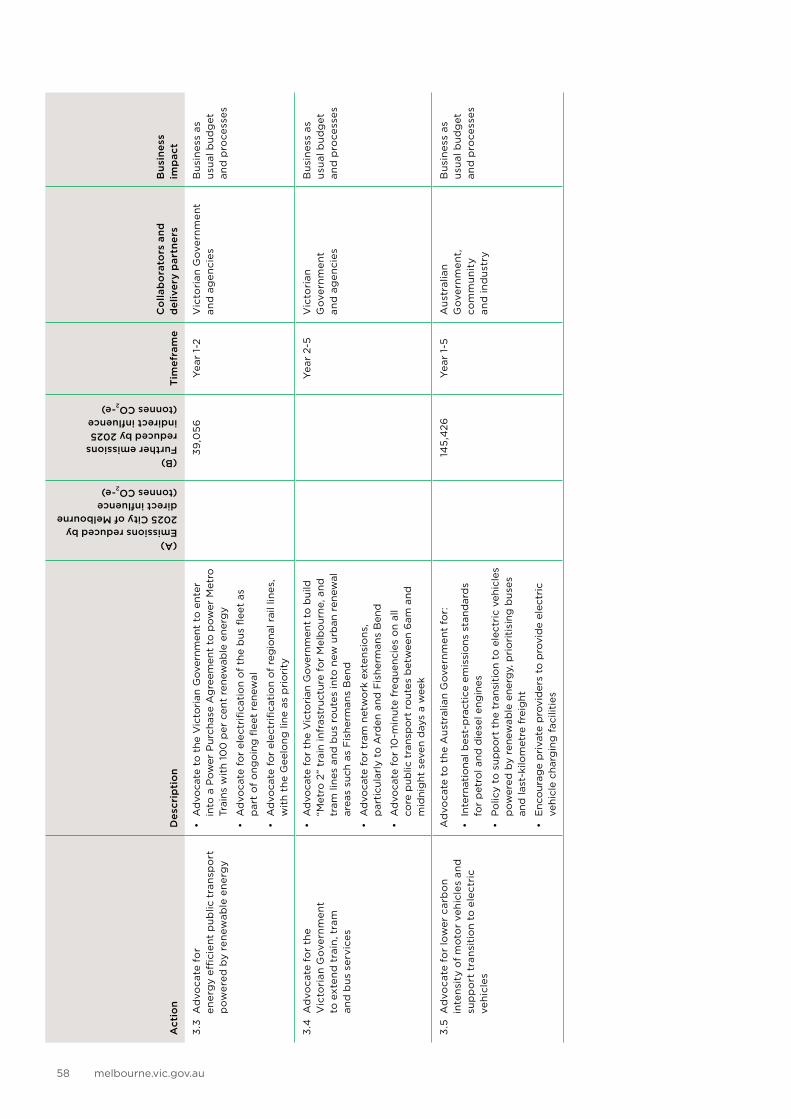
melbourne.vic.gov.au58
Act
ion
Des
crip
tio
n
(A) Emissions reduced by 2025 City of Melbourne direct influence (tonnes CO2-e)
(B) Further emissions reduced by 2025 indirect influence (tonnes CO2-e)
Tim
efra
me
Co
llab
ora
tors
and
d
eliv
ery
par
tner
sB
usin
ess
imp
act
3.3
Ad
voca
te f
or
en
erg
y effi
cien
t p
ub
lic t
ran
spo
rt
po
wer
ed b
y re
new
able
en
erg
y
• A
dvo
cate
to
the
Vic
tori
an G
over
nmen
t to
ent
er
into
a P
ow
er P
urch
ase
Ag
reem
ent
to p
ow
er M
etro
Tr
ains
wit
h 10
0 p
er c
ent
rene
wab
le e
nerg
y
• A
dvo
cate
fo
r el
ectr
ifica
tio
n o
f th
e b
us fl
eet
as
par
t o
f o
ngo
ing
flee
t re
new
al
• A
dvo
cate
fo
r el
ectr
ifica
tio
n o
f re
gio
nal r
ail l
ines
, w
ith
the
Gee
long
line
as
pri
ori
ty
39
,05
6Y
ear
1-2
Vic
tori
an G
ove
rnm
ent
an
d a
gen
cies
Bu
sin
ess
as
usu
al b
ud
get
an
d p
roce
sses
3.4
Ad
voca
te f
or
the
V
icto
rian
Go
vern
men
t
to e
xten
d t
rain
, tra
m
and
bu
s se
rvic
es
• A
dvo
cate
fo
r th
e V
icto
rian
Gov
ernm
ent
to b
uild
“M
etro
2”
trai
n in
fras
truc
ture
fo
r M
elb
our
ne, a
nd
tram
line
s an
d b
us r
out
es in
to n
ew u
rban
ren
ewal
ar
eas
such
as
Fis
herm
ans
Ben
d
• A
dvo
cate
fo
r tr
am n
etw
ork
ext
ensi
ons
, p
arti
cula
rly
to A
rden
and
Fis
herm
ans
Ben
d
• A
dvo
cate
fo
r 10
-min
ute
freq
uenc
ies
on
all
core
pub
lic t
rans
po
rt r
out
es b
etw
een
6am
and
m
idni
ght
sev
en d
ays
a w
eek
Yea
r 2-
5V
icto
rian
G
ove
rnm
ent
and
ag
enci
es
Bu
sin
ess
as
usu
al b
ud
get
an
d p
roce
sses
3.5
Ad
voca
te f
or
low
er c
arb
on
inte
nsi
ty o
f m
oto
r ve
hic
les
and
su
pp
ort
tra
nsi
tio
n to
ele
ctri
c ve
hic
les
Ad
voca
te t
o t
he
Au
stra
lian
Go
vern
men
t fo
r:
• In
tern
atio
nal b
est-
pra
ctic
e em
issi
ons
sta
ndar
ds
for
pet
rol a
nd d
iese
l eng
ines
• P
olic
y to
sup
po
rt t
he t
rans
itio
n to
ele
ctri
c ve
hicl
es
po
wer
ed b
y re
new
able
ene
rgy,
pri
ori
tisi
ng b
uses
an
d la
st-k
ilom
etre
fre
ight
• E
nco
urag
e p
riva
te p
rovi
der
s to
pro
vid
e el
ectr
ic
vehi
cle
char
gin
g f
acili
ties
145
,426
Yea
r 1-
5A
ust
ralia
n
Go
vern
men
t,
com
mu
nit
y
and
ind
ust
ry
Bu
sin
ess
as
usu
al b
ud
get
an
d p
roce
sses
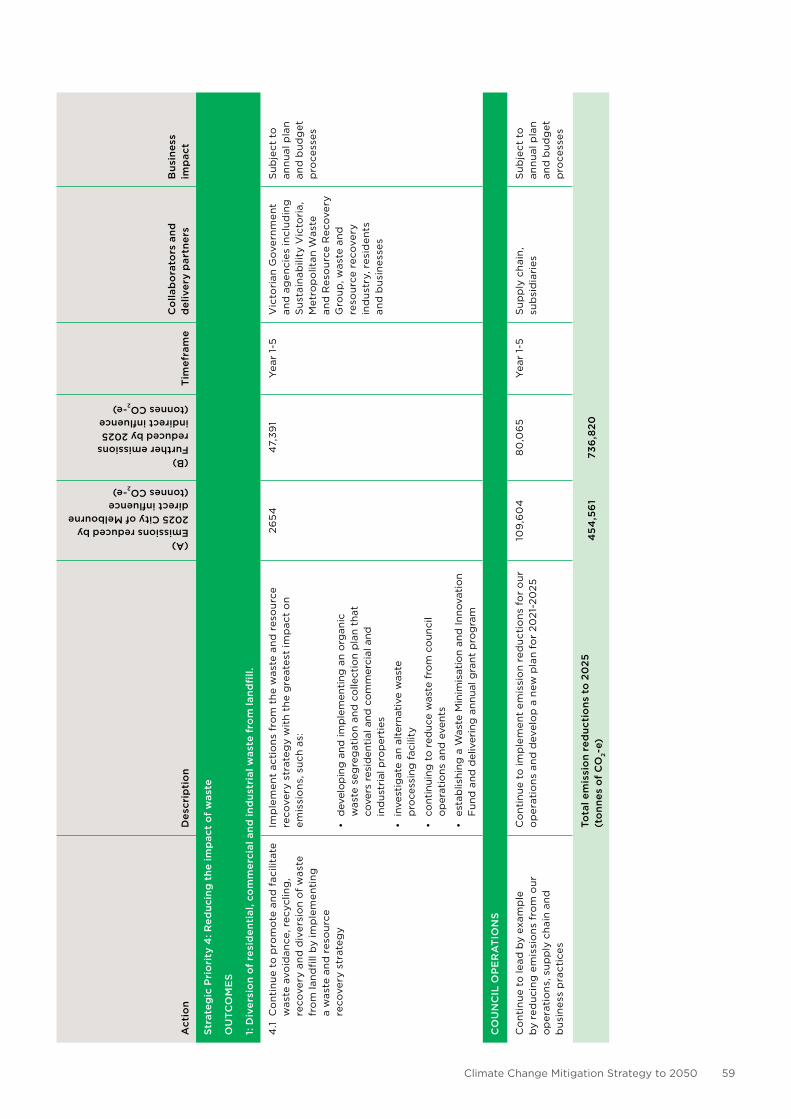
Climate Change Mitigation Strategy to 2050 59
Act
ion
Des
crip
tio
n
(A) Emissions reduced by 2025 City of Melbourne direct influence (tonnes CO2-e)
(B) Further emissions reduced by 2025 indirect influence (tonnes CO2-e)
Tim
efra
me
Co
llab
ora
tors
and
d
eliv
ery
par
tner
sB
usin
ess
imp
act
Str
ateg
ic P
rio
rity
4: R
educ
ing
the
imp
act
of
was
te
OU
TCO
ME
S
1: D
iver
sio
n o
f re
sid
enti
al, c
om
mer
cial
and
ind
ustr
ial w
aste
fro
m la
ndfi
ll.
4.1
Co
nti
nu
e to
pro
mo
te a
nd
fac
ilita
te
was
te a
void
ance
, rec
yclin
g,
reco
very
an
d d
iver
sio
n o
f w
aste
fr
om
lan
dfi
ll b
y im
ple
men
tin
g
a w
aste
an
d r
eso
urc
e
reco
very
str
ateg
y
Imp
lem
ent
acti
on
s fr
om
th
e w
aste
an
d r
eso
urc
e re
cove
ry s
trat
egy
wit
h th
e g
reat
est
imp
act
on
emis
sio
ns,
su
ch a
s:
• d
evel
op
ing
and
imp
lem
enti
ng a
n o
rgan
ic
was
te s
egre
gat
ion
and
co
llect
ion
pla
n th
at
cove
rs r
esid
enti
al a
nd c
om
mer
cial
and
in
dus
tria
l pro
per
ties
• in
vest
igat
e an
alt
erna
tive
was
te
pro
cess
ing
fac
ility
• co
ntin
uing
to
red
uce
was
te f
rom
co
unci
l o
per
atio
ns a
nd e
vent
s
• es
tab
lishi
ng a
Was
te M
inim
isat
ion
and
Inno
vati
on
Fun
d a
nd d
eliv
erin
g a
nnua
l gra
nt p
rog
ram
265
44
7,3
91
Yea
r 1-
5V
icto
rian
Go
vern
men
t an
d a
gen
cies
incl
ud
ing
S
ust
ain
abili
ty V
icto
ria,
M
etro
po
litan
Was
te
and
Res
ou
rce
Rec
ove
ry
Gro
up
, was
te a
nd
re
sou
rce
reco
very
in
du
stry
, res
iden
ts
and
bu
sin
esse
s
Su
bje
ct t
o
ann
ual
pla
n an
d b
ud
get
p
roce
sses
CO
UN
CIL
OP
ER
AT
ION
S
Co
nti
nu
e to
lead
by
exam
ple
b
y re
du
cin
g e
mis
sio
ns
fro
m o
ur
op
erat
ion
s, s
up
ply
ch
ain
and
b
usi
nes
s p
ract
ices
Co
nti
nu
e to
imp
lem
ent
emis
sio
n re
du
ctio
ns
for
ou
r o
per
atio
ns
and
dev
elo
p a
new
pla
n fo
r 20
21-
202
510
9,6
04
80
,06
5Y
ear
1-5
Su
pp
ly c
hai
n,
sub
sid
iari
esS
ub
ject
to
an
nu
al p
lan
and
bu
dg
et
pro
cess
es
Tota
l em
issi
on
red
ucti
ons
to
20
25
(to
nnes
of
CO
2-e)
45
4,5
61
736
,820
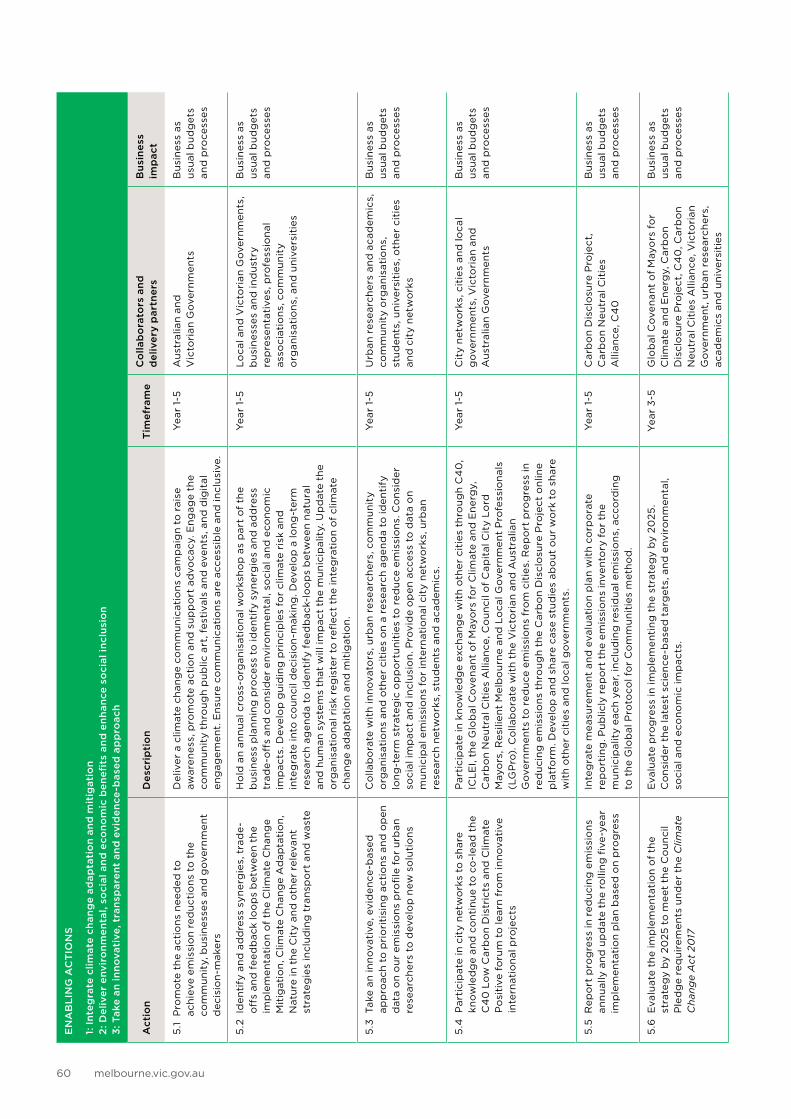
melbourne.vic.gov.au60
EN
AB
LIN
G A
CT
ION
S
1: In
teg
rate
clim
ate
chan
ge
adap
tati
on
and
mit
igat
ion
2: D
eliv
er e
nvir
onm
enta
l, so
cial
and
eco
nom
ic b
enefi
ts a
nd e
nhan
ce s
oci
al in
clus
ion
3: T
ake
an in
nova
tive
, tra
nsp
aren
t an
d e
vid
ence
-bas
ed a
pp
roac
h
Act
ion
Des
crip
tio
nT
imef
ram
eC
olla
bo
rato
rs a
nd
del
iver
y p
artn
ers
Bus
ines
s im
pac
t
5.1
Pro
mo
te t
he
acti
on
s n
eed
ed t
o
ach
ieve
em
issi
on
red
uct
ion
s to
th
e co
mm
un
ity,
bu
sin
esse
s an
d g
ove
rnm
ent
d
ecis
ion
-mak
ers
Del
iver
a c
limat
e ch
ang
e co
mm
un
icat
ion
s ca
mp
aig
n to
rai
se
awar
enes
s, p
rom
ote
act
ion
and
su
pp
ort
ad
voca
cy. E
ng
age
the
com
mu
nit
y th
rou
gh
pu
blic
art
, fes
tiva
ls a
nd
eve
nts
, an
d d
igit
al
eng
agem
ent.
En
sure
co
mm
un
icat
ion
s ar
e ac
cess
ible
an
d in
clu
sive
.
Yea
r 1-
5A
ust
ralia
n an
d
Vic
tori
an G
ove
rnm
ents
Bu
sin
ess
as
usu
al b
ud
get
s an
d p
roce
sses
5.2
Id
enti
fy a
nd
ad
dre
ss s
yner
gie
s, t
rad
e-
off
s an
d f
eed
bac
k lo
op
s b
etw
een
the
imp
lem
enta
tio
n o
f th
e C
limat
e C
han
ge
Mit
igat
ion
, Clim
ate
Ch
ang
e A
dap
tati
on
, N
atu
re in
th
e C
ity
and
oth
er r
elev
ant
stra
teg
ies
incl
ud
ing
tra
nsp
ort
an
d w
aste
Ho
ld a
n an
nu
al c
ross
-org
anis
atio
nal
wo
rksh
op
as
par
t o
f th
e b
usi
nes
s p
lan
nin
g p
roce
ss t
o id
enti
fy s
yner
gie
s an
d a
dd
ress
tr
ade
-off
s an
d c
on
sid
er e
nvir
on
men
tal,
soci
al a
nd
eco
no
mic
im
pac
ts. D
evel
op
gu
idin
g p
rin
cip
les
for
clim
ate
risk
an
d
inte
gra
te in
to c
ou
nci
l dec
isio
n-m
akin
g. D
evel
op
a lo
ng
-ter
m
rese
arch
ag
end
a to
iden
tify
fee
db
ack-
loo
ps
bet
wee
n n
atu
ral
and
hu
man
sys
tem
s th
at w
ill im
pac
t th
e m
un
icip
alit
y. U
pd
ate
the
org
anis
atio
nal
ris
k re
gis
ter
to r
eflec
t th
e in
teg
rati
on
of
clim
ate
chan
ge
adap
tati
on
and
mit
igat
ion
.
Yea
r 1-
5L
oca
l an
d V
icto
rian
Go
vern
men
ts,
bu
sin
esse
s an
d in
du
stry
re
pre
sen
tati
ves,
pro
fess
ion
al
asso
ciat
ion
s, c
om
mu
nit
y o
rgan
isat
ion
s, a
nd
un
iver
siti
es
Bu
sin
ess
as
usu
al b
ud
get
s an
d p
roce
sses
5.3
Tak
e an
inn
ova
tive
, evi
den
ce-b
ased
ap
pro
ach
to p
rio
riti
sin
g a
ctio
ns
and
op
en
dat
a o
n o
ur
emis
sio
ns
pro
file
fo
r u
rban
re
sear
cher
s to
dev
elo
p n
ew s
olu
tio
ns
Co
llab
ora
te w
ith
inn
ova
tors
, urb
an r
esea
rch
ers,
co
mm
un
ity
org
anis
atio
ns
and
oth
er c
itie
s o
n a
rese
arch
ag
end
a to
iden
tify
lo
ng
-ter
m s
trat
egic
op
po
rtu
nit
ies
to r
edu
ce e
mis
sio
ns.
Co
nsi
der
so
cial
imp
act
and
incl
usi
on
. Pro
vid
e o
pen
acc
ess
to d
ata
on
mu
nic
ipal
em
issi
on
s fo
r in
tern
atio
nal
cit
y n
etw
ork
s, u
rban
re
sear
ch n
etw
ork
s, s
tud
ents
an
d a
cad
emic
s.
Yea
r 1-
5U
rban
res
earc
her
s an
d a
cad
emic
s,
com
mu
nit
y o
rgan
isat
ion
s,
stu
den
ts, u
niv
ersi
ties
, oth
er c
itie
s an
d c
ity
net
wo
rks
Bu
sin
ess
as
usu
al b
ud
get
s an
d p
roce
sses
5.4
Par
tici
pat
e in
cit
y n
etw
ork
s to
sh
are
kno
wle
dg
e an
d c
on
tin
ue
to c
o-l
ead
th
e C
40
Lo
w C
arb
on
Dis
tric
ts a
nd
Clim
ate
Po
siti
ve f
oru
m t
o le
arn
fro
m in
no
vati
ve
inte
rnat
ion
al p
roje
cts
Par
tici
pat
e in
kn
ow
led
ge
exch
ang
e w
ith
oth
er c
itie
s th
rou
gh
C4
0,
ICL
EI,
the
Glo
bal
Co
ven
ant
of
May
ors
fo
r C
limat
e an
d E
ner
gy,
C
arb
on
Neu
tral
Cit
ies
Alli
ance
, Co
un
cil o
f C
apit
al C
ity
Lo
rd
May
ors
, Res
ilien
t M
elb
ou
rne
and
Lo
cal G
ove
rnm
ent
Pro
fess
ion
als
(LG
Pro
). C
olla
bo
rate
wit
h th
e V
icto
rian
an
d A
ust
ralia
n G
ove
rnm
ents
to
red
uce
em
issi
on
s fr
om
cit
ies.
Rep
ort
pro
gre
ss in
re
du
cin
g e
mis
sio
ns
thro
ug
h th
e C
arb
on
Dis
clo
sure
Pro
ject
on
line
pla
tfo
rm. D
evel
op
an
d s
har
e ca
se s
tud
ies
abo
ut
ou
r w
ork
to
sh
are
wit
h o
ther
cit
ies
and
loca
l go
vern
men
ts.
Yea
r 1-
5C
ity
net
wo
rks,
cit
ies
and
loca
l g
ove
rnm
ents
, Vic
tori
an a
nd
A
ust
ralia
n G
ove
rnm
ents
Bu
sin
ess
as
usu
al b
ud
get
s an
d p
roce
sses
5.5
Rep
ort
pro
gre
ss in
red
uci
ng
em
issi
on
s an
nu
ally
an
d u
pd
ate
the
rolli
ng
five
-yea
r im
ple
men
tati
on
pla
n b
ased
on
pro
gre
ss
Inte
gra
te m
easu
rem
ent
and
eva
luat
ion
pla
n w
ith
corp
ora
te
rep
ort
ing
. Pu
blic
ly r
epo
rt t
he
emis
sio
ns
inve
nto
ry f
or
the
mu
nic
ipal
ity
each
yea
r, in
clu
din
g r
esid
ual
em
issi
on
s, a
cco
rdin
g
to t
he
Glo
bal
Pro
toco
l fo
r C
om
mu
nit
ies
met
ho
d.
Yea
r 1-
5C
arb
on
Dis
clo
sure
Pro
ject
, C
arb
on
Neu
tral
Cit
ies
A
llian
ce, C
40
Bu
sin
ess
as
usu
al b
ud
get
s an
d p
roce
sses
5.6
Eva
luat
e th
e im
ple
men
tati
on
of
the
stra
teg
y b
y 20
25
to m
eet
the
Co
un
cil
Ple
dg
e re
qu
irem
ents
un
der
th
e C
limat
e C
han
ge
Act
20
17
Eva
luat
e p
rog
ress
in im
ple
men
tin
g t
he
stra
teg
y b
y 20
25
. C
on
sid
er t
he
late
st s
cien
ce-b
ased
tar
get
s, a
nd
env
iro
nm
enta
l, so
cial
an
d e
con
om
ic im
pac
ts.
Yea
r 3
-5G
lob
al C
ove
nan
t o
f M
ayo
rs f
or
Clim
ate
and
En
erg
y, C
arb
on
Dis
clo
sure
Pro
ject
, C4
0, C
arb
on
Neu
tral
Cit
ies
Alli
ance
, Vic
tori
an
Go
vern
men
t, u
rban
res
earc
her
s,
acad
emic
s an
d u
niv
ersi
ties
Bu
sin
ess
as
usu
al b
ud
get
s an
d p
roce
sses
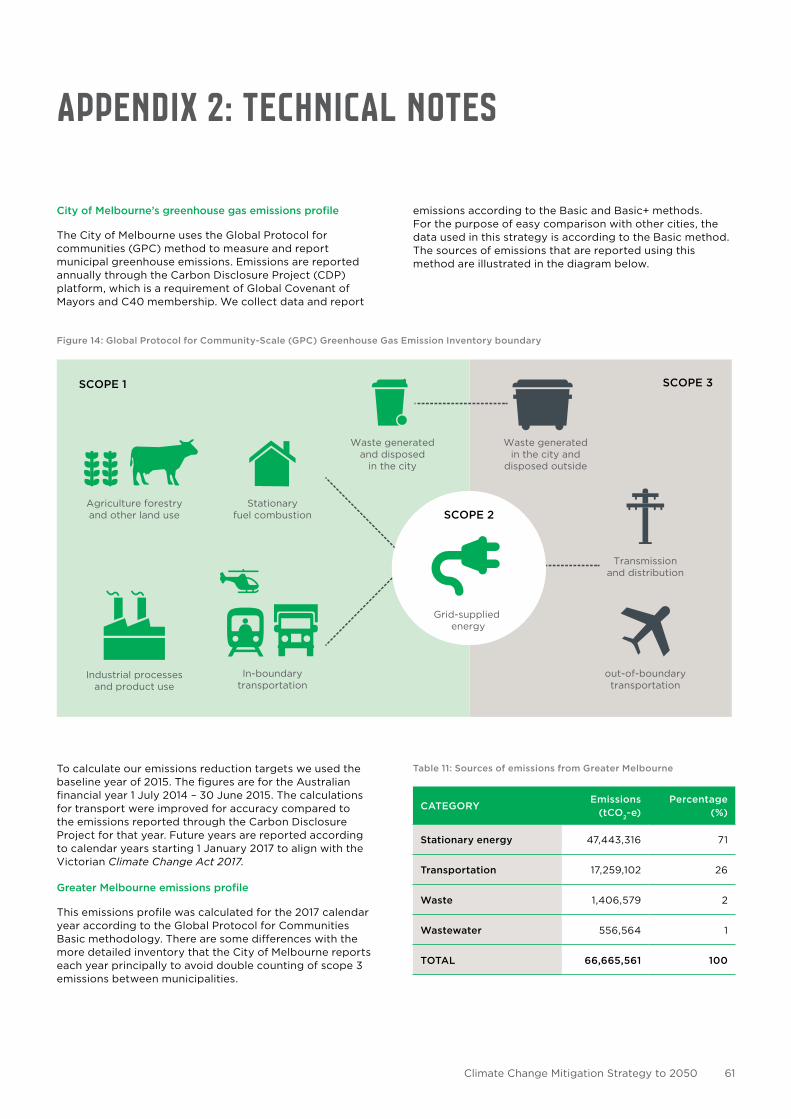
Climate Change Mitigation Strategy to 2050 61
To calculate our emissions reduction targets we used the baseline year of 2015. The figures are for the Australian financial year 1 July 2014 – 30 June 2015. The calculations for transport were improved for accuracy compared to the emissions reported through the Carbon Disclosure Project for that year. Future years are reported according to calendar years starting 1 January 2017 to align with the Victorian Climate Change Act 2017.
Greater Melbourne emissions profile
This emissions profile was calculated for the 2017 calendar year according to the Global Protocol for Communities Basic methodology. There are some differences with the more detailed inventory that the City of Melbourne reports each year principally to avoid double counting of scope 3 emissions between municipalities.
APPENDIX 2: TECHNICAL NOTES
City of Melbourne’s greenhouse gas emissions profile
The City of Melbourne uses the Global Protocol for communities (GPC) method to measure and report municipal greenhouse emissions. Emissions are reported annually through the Carbon Disclosure Project (CDP) platform, which is a requirement of Global Covenant of Mayors and C40 membership. We collect data and report
emissions according to the Basic and Basic+ methods. For the purpose of easy comparison with other cities, the data used in this strategy is according to the Basic method. The sources of emissions that are reported using this method are illustrated in the diagram below.
Figure 14: Global Protocol for Community-Scale (GPC) Greenhouse Gas Emission Inventory boundary
Table 11: Sources of emissions from Greater Melbourne
CATEGORYEmissions
(tCO2-e)Percentage
(%)
Stationary energy 47,443,316 71
Transportation 17,259,102 26
Waste 1,406,579 2
Wastewater 556,564 1
TOTAL 66,665,561 100
Figure 14
SCOPE 1 SCOPE 3
Agriculture forestryand other land use
Industrial processesand product use
In-boundarytransportation
Stationaryfuel combustion
Waste generatedand disposed
in the city
Waste generatedin the city and
disposed outside
Transmissionand distribution
out-of-boundarytransportation
SCOPE 2
Grid-supplied energy
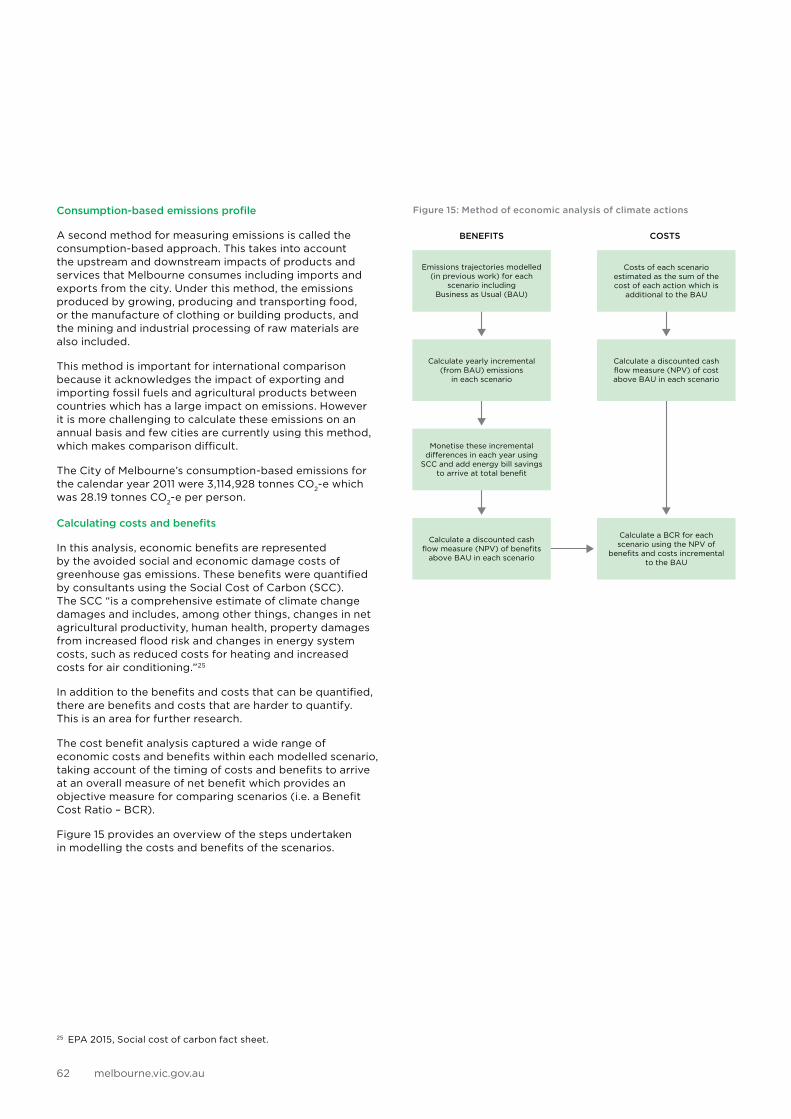
melbourne.vic.gov.au62
Consumption-based emissions profile
A second method for measuring emissions is called the consumption-based approach. This takes into account the upstream and downstream impacts of products and services that Melbourne consumes including imports and exports from the city. Under this method, the emissions produced by growing, producing and transporting food, or the manufacture of clothing or building products, and the mining and industrial processing of raw materials are also included.
This method is important for international comparison because it acknowledges the impact of exporting and importing fossil fuels and agricultural products between countries which has a large impact on emissions. However it is more challenging to calculate these emissions on an annual basis and few cities are currently using this method, which makes comparison difficult.
The City of Melbourne’s consumption-based emissions for the calendar year 2011 were 3,114,928 tonnes CO2-e which was 28.19 tonnes CO2-e per person.
Calculating costs and benefits
In this analysis, economic benefits are represented by the avoided social and economic damage costs of greenhouse gas emissions. These benefits were quantified by consultants using the Social Cost of Carbon (SCC). The SCC “is a comprehensive estimate of climate change damages and includes, among other things, changes in net agricultural productivity, human health, property damages from increased flood risk and changes in energy system costs, such as reduced costs for heating and increased costs for air conditioning.”25
In addition to the benefits and costs that can be quantified, there are benefits and costs that are harder to quantify. This is an area for further research.
The cost benefit analysis captured a wide range of economic costs and benefits within each modelled scenario, taking account of the timing of costs and benefits to arrive at an overall measure of net benefit which provides an objective measure for comparing scenarios (i.e. a Benefit Cost Ratio – BCR).
Figure 15 provides an overview of the steps undertaken in modelling the costs and benefits of the scenarios.
Figure 15: Method of economic analysis of climate actions
25 EPA 2015, Social cost of carbon fact sheet.
Figure 15
BENEFITS COSTS
Emissions trajectories modelled (in previous work) for each
scenario including Business as Usual (BAU)
Calculate yearly incremental (from BAU) emissions
in each scenario
Monetise these incremental di�erences in each year using
SCC and add energy bill savings to arrive at total benefit
Costs of each scenario estimated as the sum of the cost of each action which is
additional to the BAU
Calculate a discounted cash flow measure (NPV) of cost above BAU in each scenario
Calculate a BCR for each scenario using the NPV of
benefits and costs incremental to the BAU
Calculate a discounted cash flow measure (NPV) of benefits
above BAU in each scenario
Climate Change Mitigation Strategy to 2050 63
Quantified benefits
The SCC was developed by the US Environment Protection Authority (EPA) to assess the cost of actions with marginal impacts on cumulative global emissions. It estimates the dollar figure of damages over the next 100 years (or more) from one extra tonne of greenhouse gas emissions.
This marginal cost is calculated using three integrated assessment models translating emissions into changes in atmospheric greenhouse concentrations, atmospheric concentrations into changes in temperature and changes in temperature into economic damages. A range of plausible socio-economic and emissions trajectories are used. Marginal cost is increasing in time as future emissions are expected to produce larger incremental damages as physical and economic systems become more stressed in response to greater levels of climate change. SCC values are therefore ‘year specific’.
The EPA’s model looks at the future impacts (out to 2300) of emitting one tCO2-e today. It quantifies the damage costs caused by global temperature increases due to an additional tonne and discounts this back to today’s value.
Quantified costs
Each modelled scenario is comprised of a number of climate actions which need to be undertaken to meet the emissions trajectory of the scenario. The consultant’s modelling estimated the cost of actions incremental to directly related costs which would arise in the absence of the action. For each action, the overall quantum of the activity is compared to the amount expected under the Business as Usual Scenario, and the incremental expense of the proposed action in the scenario is used to calculate a total cost of the action.
Analysis of economic contribution
This analysis aims to measure the economic contribution of actions under the modelled scenarios. Only actions with market based expenditure are modelled using this technique and as such, only a subset of actions within each scenario is assumed to provide an economic contribution.
The direct and indirect economic contribution has been calculated by estimating the direct contribution of capital expenditure associated with each scenario relative to the Business as Usual scenario. The economic contribution was then calculated over a 31-year period (between 2020 and 2050) in order to demonstrate the value of the ongoing spending, and hence contribution, of each scenario. Tailored input-output multipliers were developed that reflect the specific characteristics of the Melbourne local government area (LGA), the rest of Greater Melbourne and the rest of Victoria. The consultants applied the input-output modelling approach to quantify the contribution. Note that this model accounts for ‘leakage’ of direct expenditure from the economy in its multipliers. This feature also allows for an analysis of the effects in the different geographies as a result of domestic ‘imports’ and ‘exports’ between the Melbourne LGA, the rest of Greater Melbourne and the rest of Victoria.
Economic contribution is a measure comprising all market-related expenditure generated by a specified industry or an activity. Economic contribution studies do not consider the substitution effects to other industries (i.e. what might happen to expenditures if the specific industry or activity were lost). As such economic contribution is a gross measure rather than a net measure.
Three common indicators of an industry or economic size or value are:
• Gross output – Market value of goods and services produced, often measured by turnover/revenue. Gross output is also referred to as ‘gross economic contribution’
• Value added – Market value of goods and services produced, after deducting the cost of goods and services used
• Jobs – Number of jobs generated by an industry or attraction.
This study focuses on value add and peak employment as key measures of the economic contribution to the Melbourne LGA, the rest of Greater Melbourne and the rest of Victoria.
In comparing an industry’s size against others, it is generally accepted to discuss this in terms of its industry value add. Industry value add measures economic activities net of the costs of production (that is, inputs sourced from other sectors), from the industry’s outputs. This avoids the inclusion of revenues to other industries and any associated double counting.
In practice, industry value add largely comprises wages, salaries and the operating surplus of an industry (i.e. the industry’s income). Attention should be placed on industry value add measures when making comparisons to other industries. The value add measure is commonly put forward as the most appropriate measure of an industry’s contribution to the national economy.
25 Ernst & Young (2018). Economic Analysis. Prepared for C40 and City of Melbourne. p.29.
melbourne.vic.gov.au64
ACKNOWLEDGEMENTS
The City of Melbourne would like to acknowledge the generous funding from Bloomberg Philanthropies, the support of the C40 Cities Climate Action Planning Pilot Program and the cities that participated in the program.
Many people contributed their time and expertise to the development of this strategy. Thank you to the members of the external reference group, community, government and business representatives, expert consultants, City of Melbourne councillors and staff. The City of Melbourne would also like to thank the representatives from the many local and international cities who have peer-reviewed our progress to date and who continue to collaborate on solutions.
This strategy is one of a suite adopted in conjunction with the Council Plan and should be read as consistent with the overall vision and outcomes of the Council Plan. Note that any specific actions or initiatives outlined in this strategy are not binding upon the City of Melbourne but will inform its planning and resourcing considerations and may be endorsed as part of its Annual Plan and Budget.
CitationCity of Melbourne. (2018). Climate Change Mitigation Strategy to 2050: Melbourne Together for 1.5°C.
Climate Change Mitigation Strategy to 2050 65
ABBREVIATIONS
C40: C40 Cities is a network of the world’s megacities committed to addressing climate change. C40 supports cities to collaborate effectively, share knowledge and drive meaningful, measurable and sustainable action on climate change.
GBCA: Green Building Council of Australia
ICLEI: Local Governments for Sustainability
IPCC: Intergovernmental Panel on Climate Change
NABERS: National Australian Built Environment Rating System
UNFCCC: United Nations Framework Convention on Climate Change
ZNE: Zero Net Emissions
melbourne.vic.gov.au66
GLOSSARY
Aboriginal: The term ‘Aboriginal’ is used to refer to both Aboriginal and Torres Strait Islander people. Use of the terms ‘Koori’, ‘Koorie’ and ‘Indigenous’ are retained in the names of programs, initiatives and publication titles, and unless noted otherwise, are inclusive of both Aboriginal and Torres Strait Islander people.
Carbon offsets: Carbon offsets are tradeable units that represent abatement of greenhouse gas emissions. Offsets represent the rights to a greenhouse gas reduction. The carbon offsets purchased are retired through a registered third party so they cannot be counted twice.
Carbon neutral: Being carbon neutral means that the net greenhouse gas emissions associated with an organisation’s or city’s activities are equal to zero. It is achieved through a combination of measuring and reducing greenhouse gas emissions and purchasing carbon offsets. The terms zero net emissions, zero emissions and carbon neutral can be used interchangeably.
Emissions: This term is used interchangeably with greenhouse gas emissions, unless specifically stated that it relates to air quality pollutants.
Greenhouse gas emissions: The greenhouse gas emissions from human activities that cause climate change: carbon dioxide (CO2), methane (CH4), nitrous oxide (N2O), ozone (O3), and synthetic gases such as chlorofluorocarbons (CFCs) and hydrofluorocarbons (HFCs).
Paris Climate Agreement: The Paris Climate Agreement entered into force on 4 November 2016. The Paris Agreement is made under the United Nations Framework Convention on Climate Change (Climate Change Convention, also referred to as the UNFCCC). Australia announced its ratification of the Paris Agreement on 10 November 2016. Its stated goal is to limit the increase in the global average temperature to ‘well below 2°C’ above pre-industrial levels, that we should ‘pursue efforts’ to limit the temperature increase to 1.5°C (Article 2). In addition, parties are aiming to peak global greenhouse gas emissions ‘as soon as possible’ (Article 4). According to the Intergovernmental Panel on Climate Change (IPCC), global warming of more than 2°C would have serious consequences, such as an increase in the number of extreme weather events.
Science-based targets: The amount of emissions that need to be reduced to avoid the 1.5°C increase in global average temperatures as recommended by the IPCC and referred to in the Paris Climate Agreement.
Zero emissions or Zero net emissions: The net greenhouse gas emissions associated with an organisation’s or city’s activities are equal to zero.
Climate Change Mitigation Strategy to 2050 67
REFERENCES
ARUP (2016). Deadline 2020 prepared for C40 Cities.
Australian Sustainable Built Environment Council and Climate Works Australia. (2018). Built to Perform: An Industry Led Pathway to a Zero Carbon Ready Building Code. Retrieved from www.asbec.asn.au/wordpress/wp-content/uploads/2018/10/180703-ASBEC-CWA-Built-to-Perform-Zero-Carbon-Ready-Building-Code-web.pdf
City of Melbourne Council resolution October 2015 Retrieved from www.melbourne.vic.gov.au/about-council/committees-meetings/meeting-archive/meetingagendaitemattachments/706/12791/oct15%20ccl%20agenda%20item%207.4.pdf
Climate and Health Alliance (2018). Climate Change and Health Literature Review. Prepared for the City of Melbourne.
Climate Change Act 2017
Commonwealth of Australia. Department of the Environment and Energy. (2018). Carbon Neutral Network. Retrieved from www.environment.gov.au/climate-change/government/carbon-neutral/certified-businesses
C40 Cities Climate Leadership Group. (2018). About C40. Retrieved from www.c40.org/about
C40 Cities Climate Leadership Group. (2018). Climate Action Planning Framework
Ernst & Young (2018). Synthesis Report. Prepared for C40 and City of Melbourne.
Ernst & Young. (2018). Climate Action Analysis Report. Prepared for C40 and City of Melbourne.
Ernst & Young. (2018). Economic Analysis. Prepared for C40 and City of Melbourne.
Green Building Council of Australia. (2018). Carbon Positive Roadmap.
Institute for Sensible Transport (2018). Transport, Greenhouse Gas Emissions and Air Quality. Prepared for the City of Melbourne.
Intergovernmental Panel on Climate Change. (2018). Global Warming of 1.5°C, an IPCC special report on the impacts of global warming of 1.5°C above pre-industrial levels and related global greenhouse gas emission pathways, in the context of strengthening the global response to the threat of climate change, sustainable development, and efforts to eradicate poverty: Summary for Policy Makers. Retrieved from www.ipcc.ch/report/sr15/summary-for-policymakers/
ICLEI Oceania & Ironbark Sustainability. (2018). Greater Melbourne Community Emissions Inventory Report. Prepared for C40 and City of Melbourne
Lifecycles & Arup (2018). Climate Change and the Circular Economy Research Report. Prepared for the City of Melbourne.
Local Government Act 1989.
Saddler, H. (2018). National Energy Emissions Audit: Electricity Update. Retrieved from www.tai.org.au/content/audit-july-electricity-update
Stadler, A. (2018) Corporate PPAs already deliver 34% of generation capacity required under the Renewable Energy Target. Retrieved from www.energetics.com.au/insights/thought-leadership/corporate-ppas-deliver-34-of-generation-capacity-required-under-the-ret/
State of Victoria. Sustainability Victoria. (2016). Victorian’s Perceptions of Climate Change. Retrieved from www.sustainability.vic.gov.au/About-Us/Research/Victorians-perceptions-of-climate-change
United Nations Sustainable Development Goals. (2015). Retrieved from www.un.org/sustainabledevelopment/sustainable-development-goals/
United States Environmental Protection Agency. (2016). Social Cost of Carbon. Retrieved from www.epa.gov/sites/production/files/2016-12/documents/social_cost_of_carbon_fact_sheet.pdf
melbourne.vic.gov.au68