Embed Size (px)
DESCRIPTION
CLIMATE CHANGE IMPACTS AND ADAPTATION: ROLE OF EXTREME EVENTS. Stewart J. Cohen 1) Adaptation & Impacts Research Group, Environment Canada [[email protected], http://www.msc-scm.ec.gc.ca/airg] 2) Institute for Resources Environment & Sustainability University of British Columbia, Vancouver - PowerPoint PPT Presentation
Citation preview
CLIMATE CHANGE IMPACTS AND ADAPTATION: ROLE OF EXTREME
EVENTS
Stewart J. Cohen1) Adaptation & Impacts Research Group, Environment Canada[[email protected], http://www.msc-scm.ec.gc.ca/airg]
2) Institute for Resources Environment & SustainabilityUniversity of British Columbia, Vancouver[http://www.sdri.ubc.ca]
Presentation at the Environment Canada Scenarios Workshop, Victoria, October 16-17, 2003.
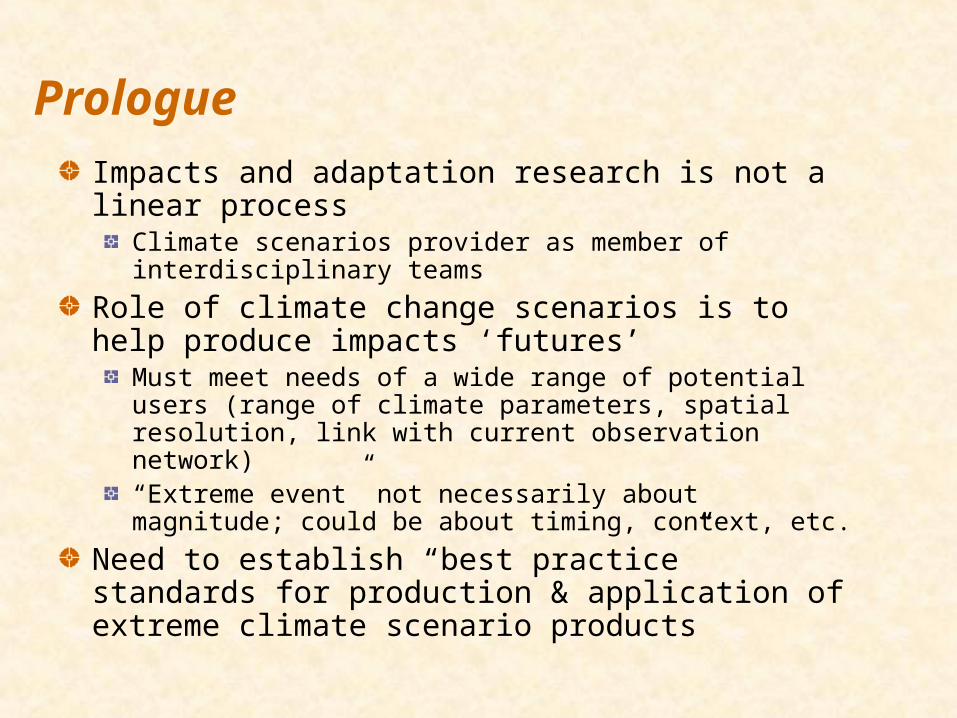
PrologueImpacts and adaptation research is not a linear process
Climate scenarios provider as member of interdisciplinary teams
Role of climate change scenarios is to help produce impacts ‘futures’
Must meet needs of a wide range of potential users (range of climate parameters, spatial resolution, link with current observation network)“Extreme event” not necessarily about magnitude; could be about timing, context, etc.
Need to establish “best practice” standards for production & application of extreme climate scenario products
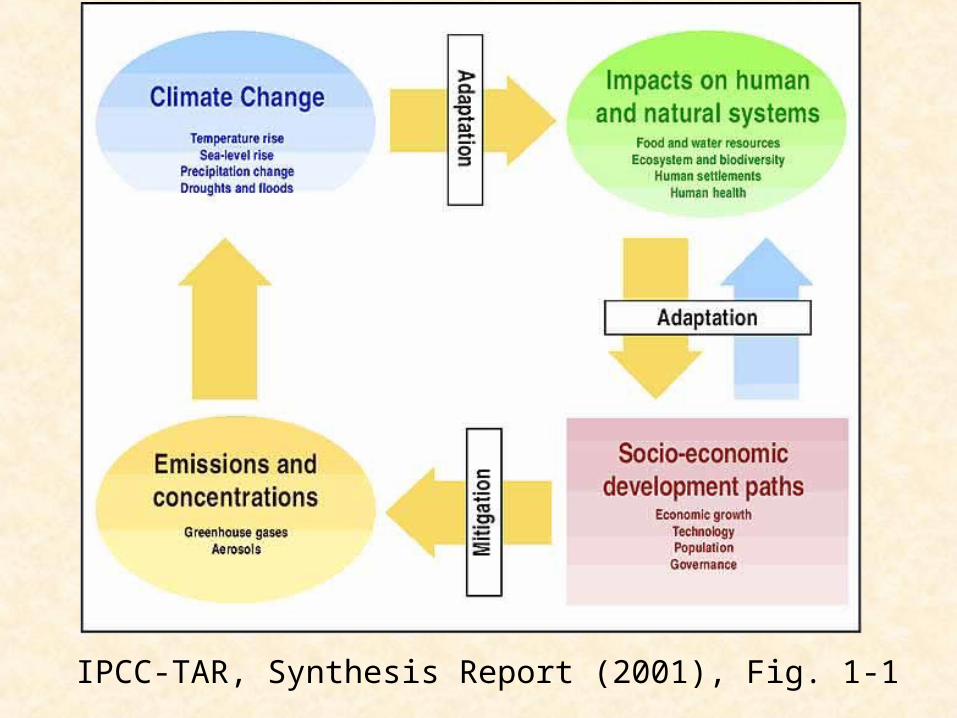
IPCC-TAR, Synthesis Report (2001), Fig. 1-1
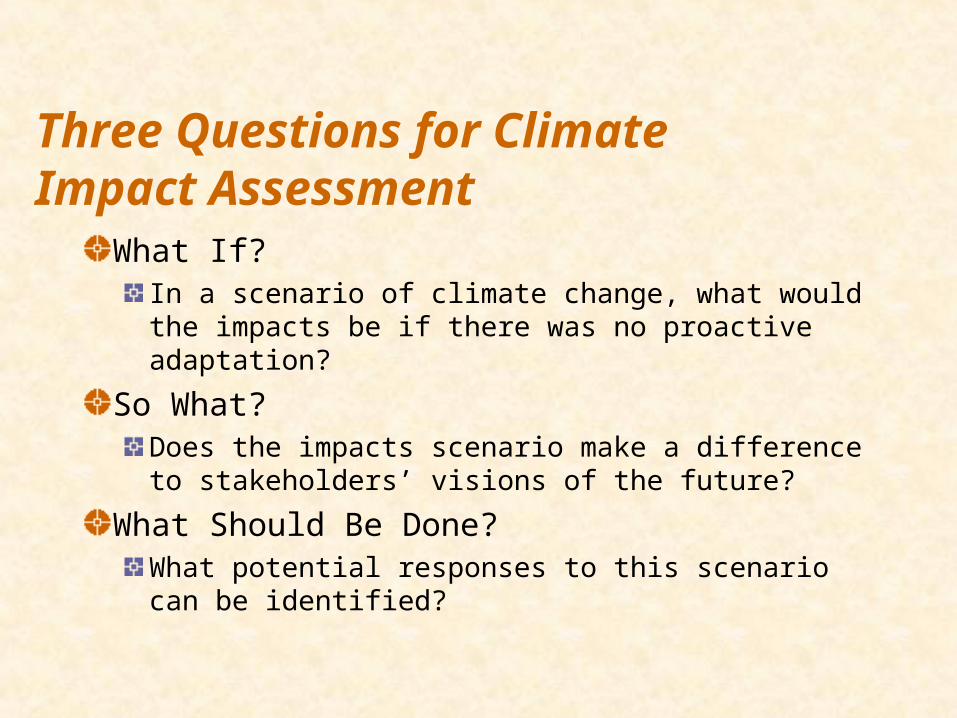
Three Questions for Climate Impact Assessment
What If?In a scenario of climate change, what would the impacts be if there was no proactive adaptation?
So What?Does the impacts scenario make a difference to stakeholders’ visions of the future?
What Should Be Done?What potential responses to this scenario can be identified?

IPCC-TAR, WG2 (2001), Fig. 18.2
Adaptation Questions
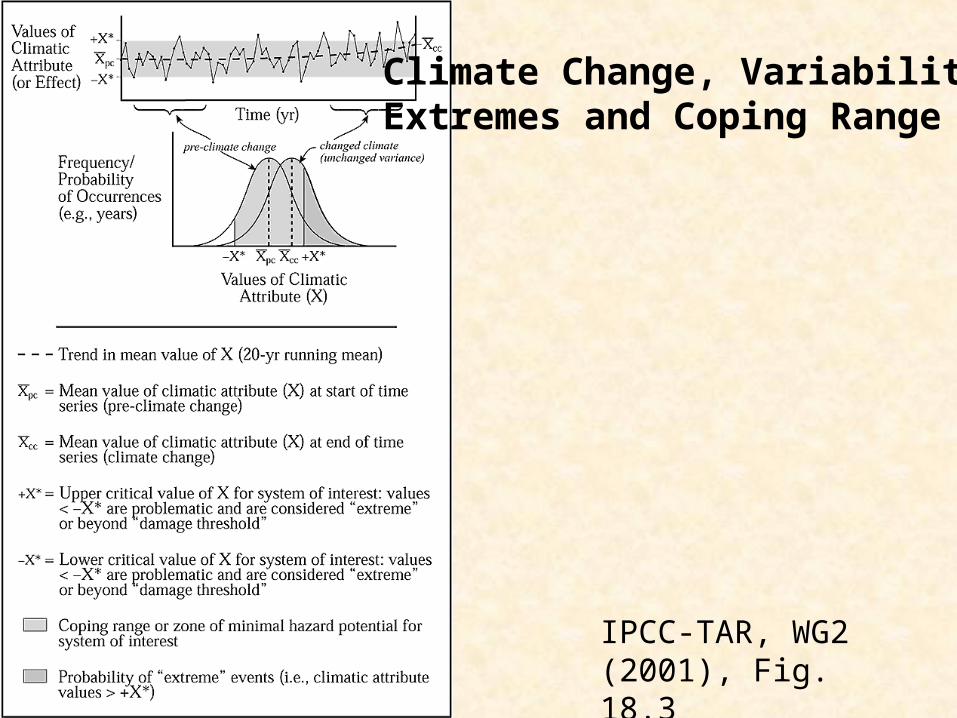
IPCC-TAR, WG2 (2001), Fig. 18.3
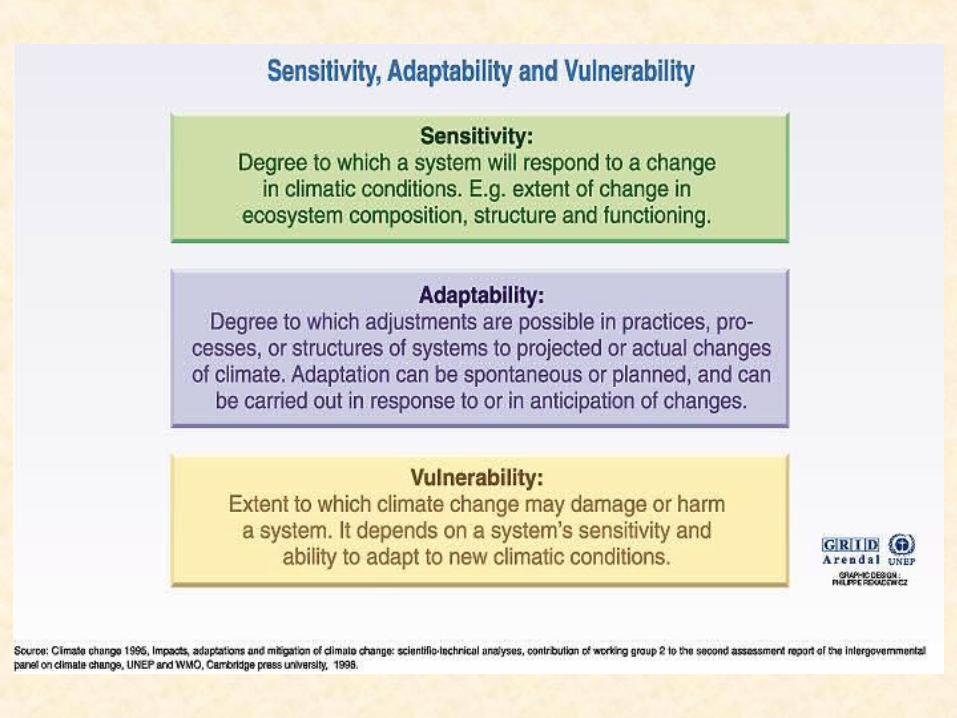
Climate Change, Variability, Extremes and Coping Range
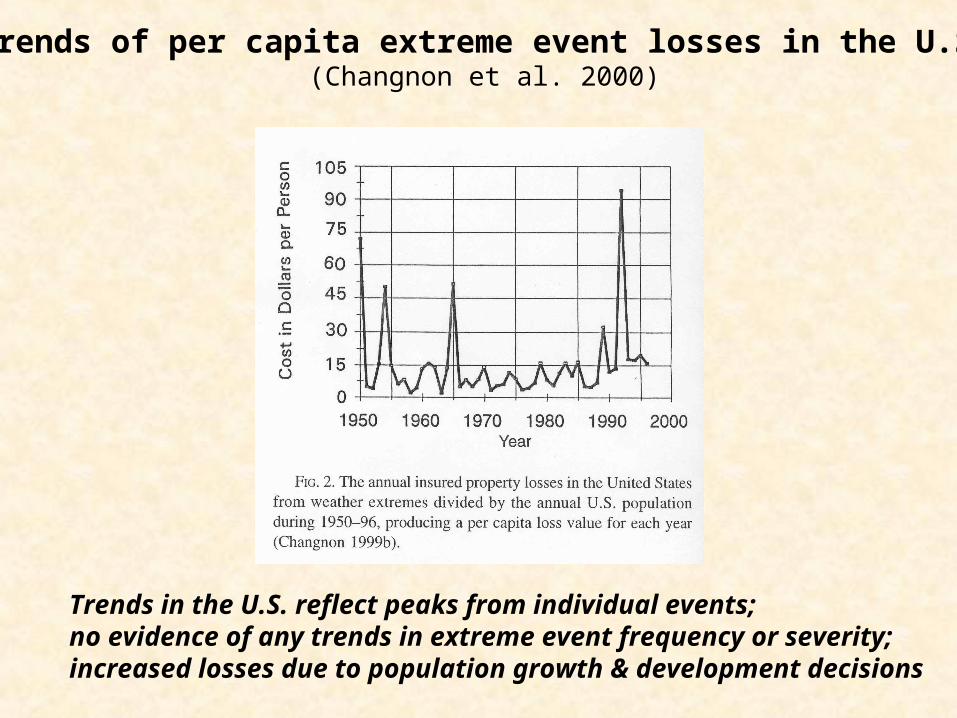
Trends in the U.S. reflect peaks from individual events; no evidence of any trends in extreme event frequency or severity; increased losses due to population growth & development decisions
Trends of per capita extreme event losses in the U.S.(Changnon et al. 2000)
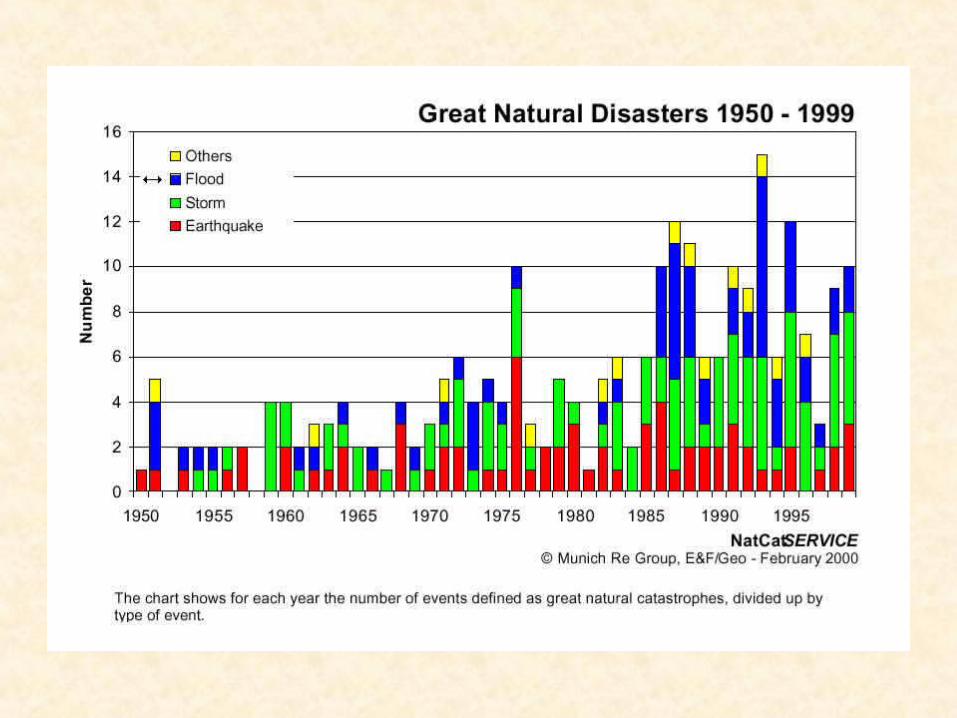
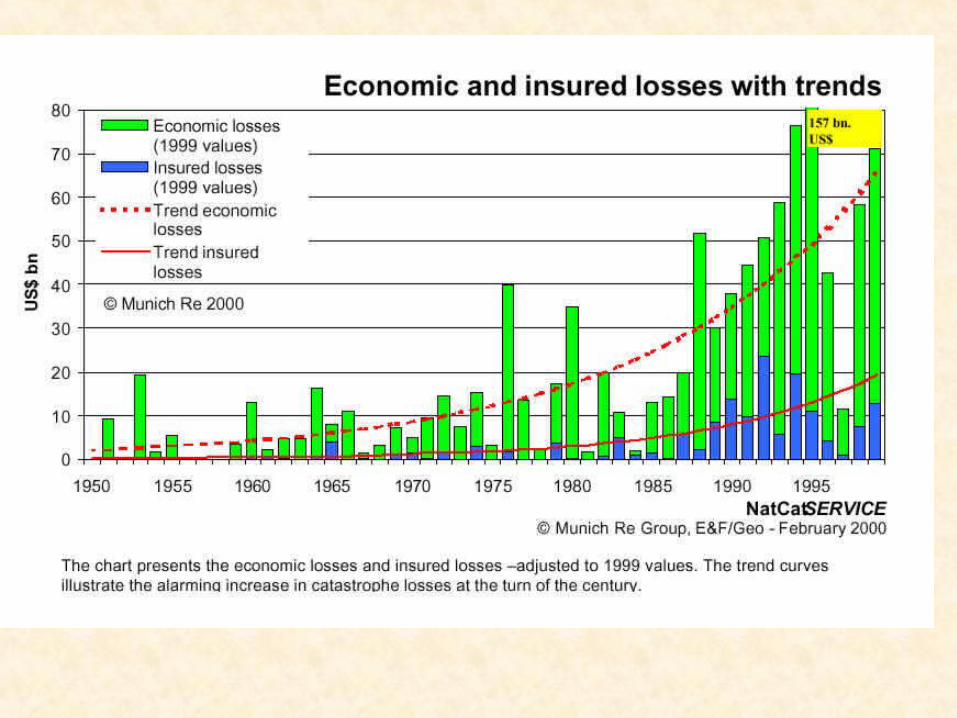
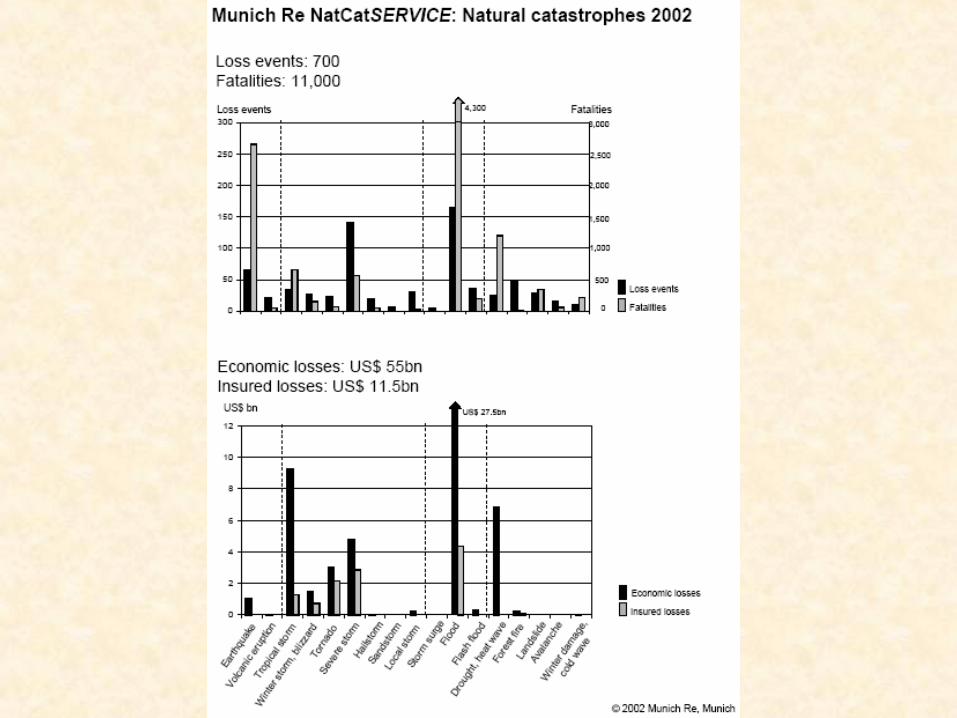
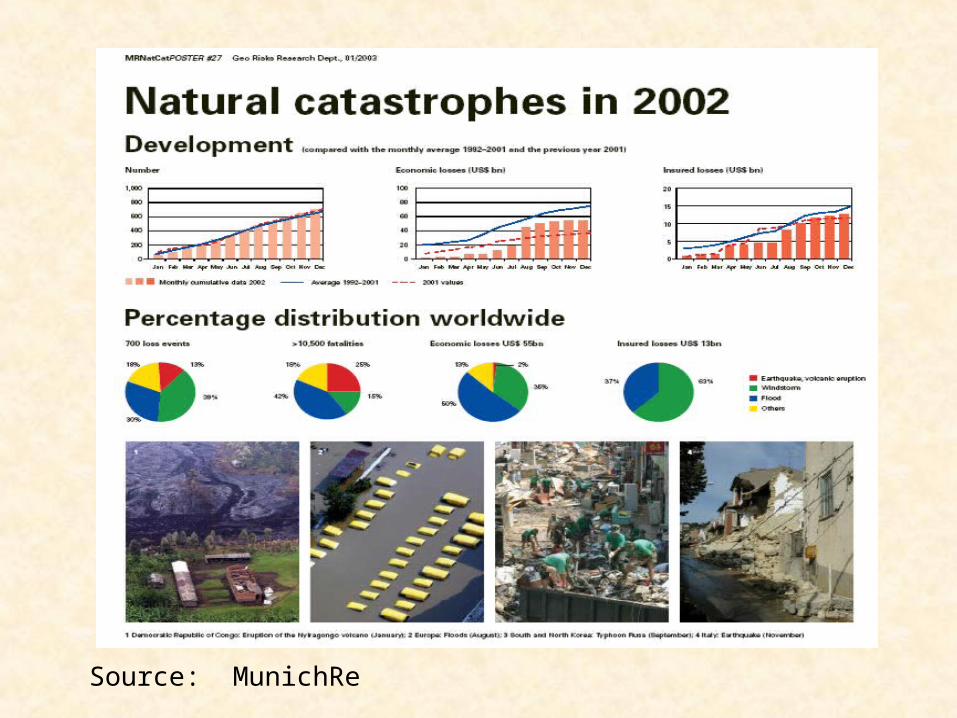
Source: MunichRe
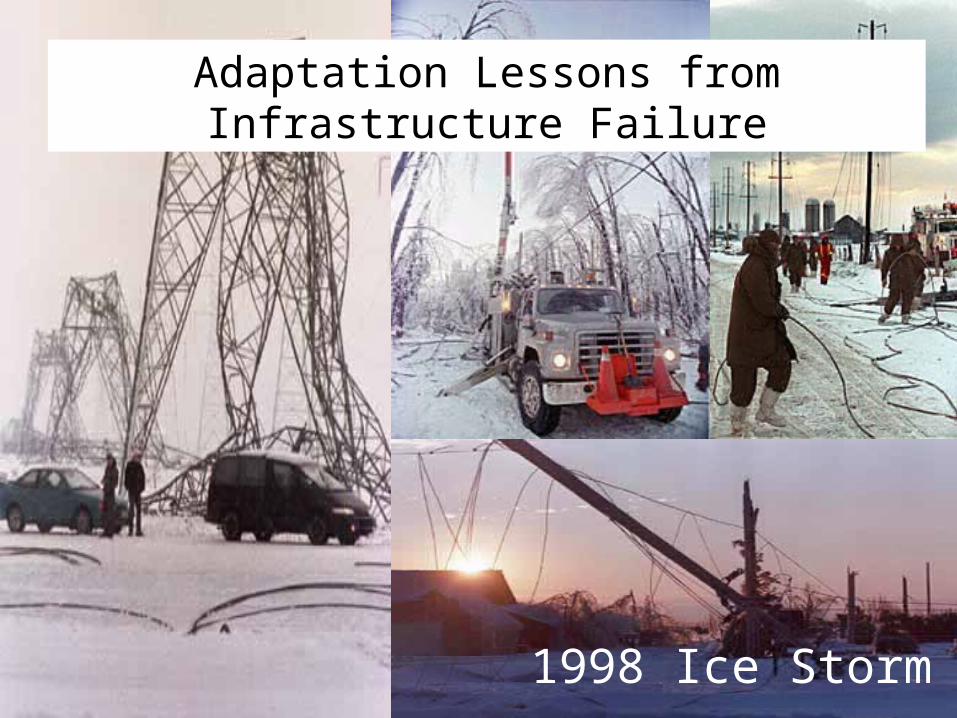
Adaptation Lessons from Infrastructure Failure
1998 Ice Storm
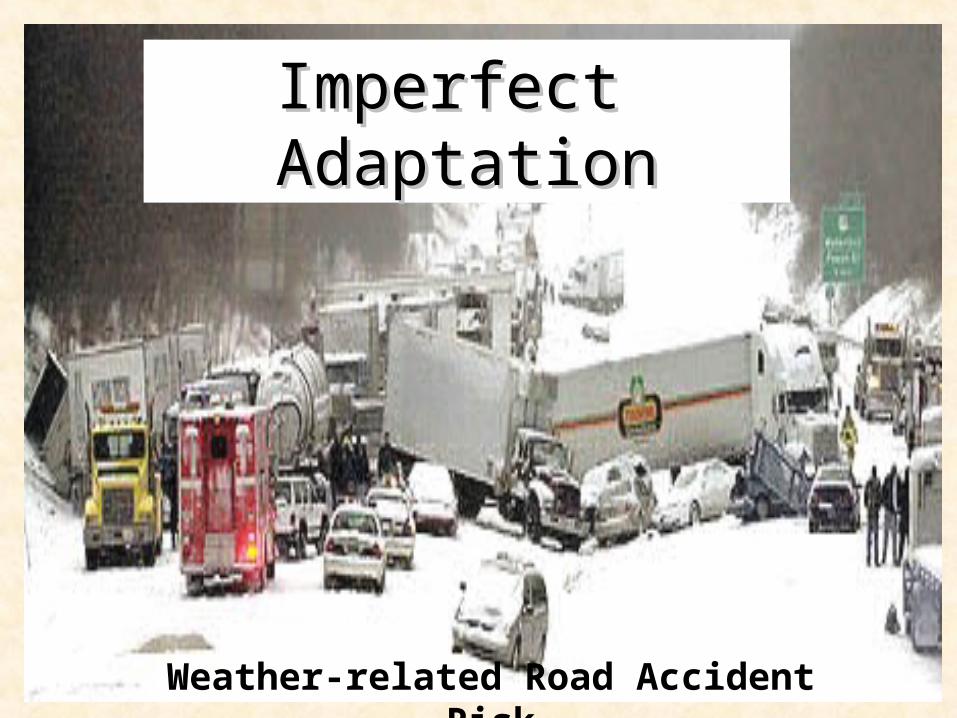
Imperfect Imperfect AdaptationAdaptation
Weather-related Road Accident Risk
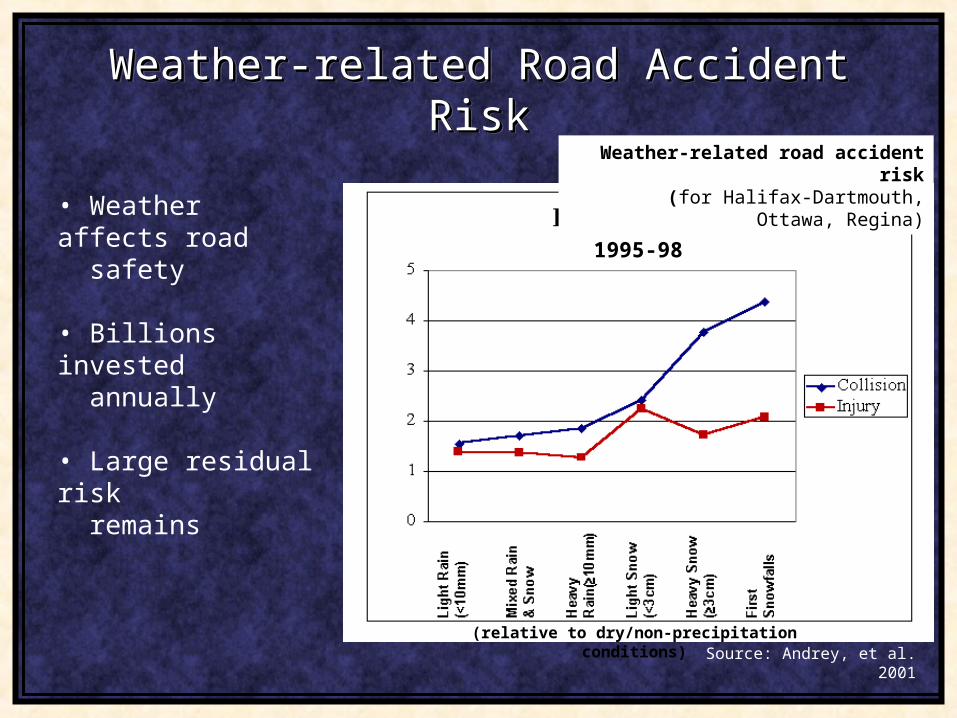
• Weather affects road safety
• Billions invested annually
• Large residual risk remains
Weather-related road accident risk (for Halifax-Dartmouth, Ottawa, Regina)
1995-98
(relative to dry/non-precipitation conditions)Source: Andrey, et al. 2001
Weather-related Road Accident Weather-related Road Accident RiskRisk
Weather-related Road Accident Weather-related Road Accident RiskRisk
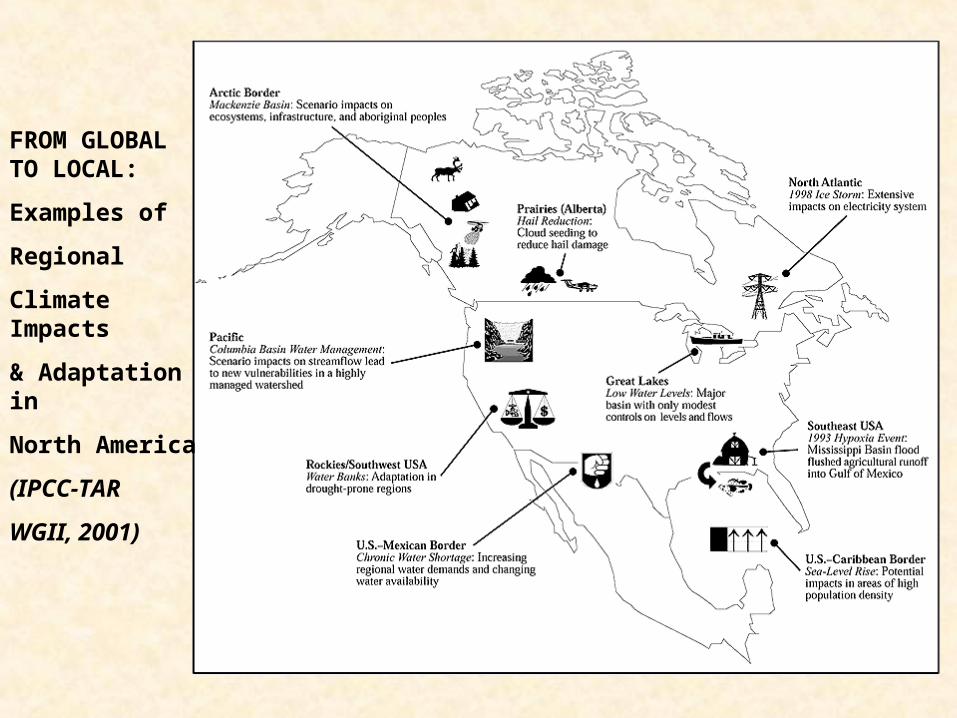
FROM GLOBAL TO LOCAL:
Examples of
Regional
Climate Impacts
& Adaptation in
North America
(IPCC-TAR
WGII, 2001)
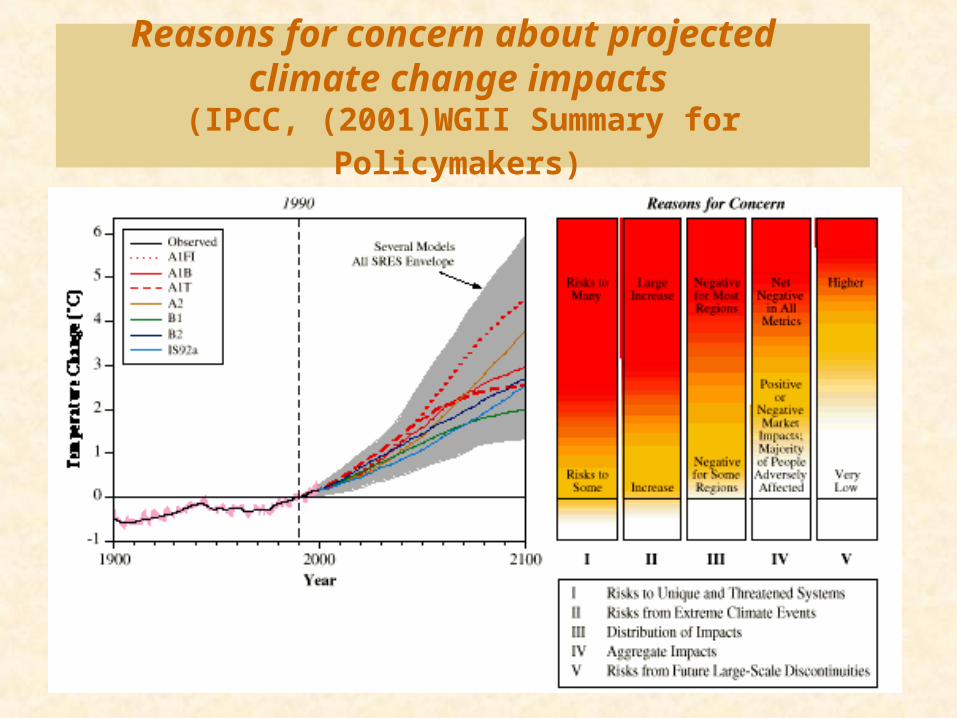
Reasons for concern about projected climate change impacts
(IPCC, (2001)WGII Summary for Policymakers)
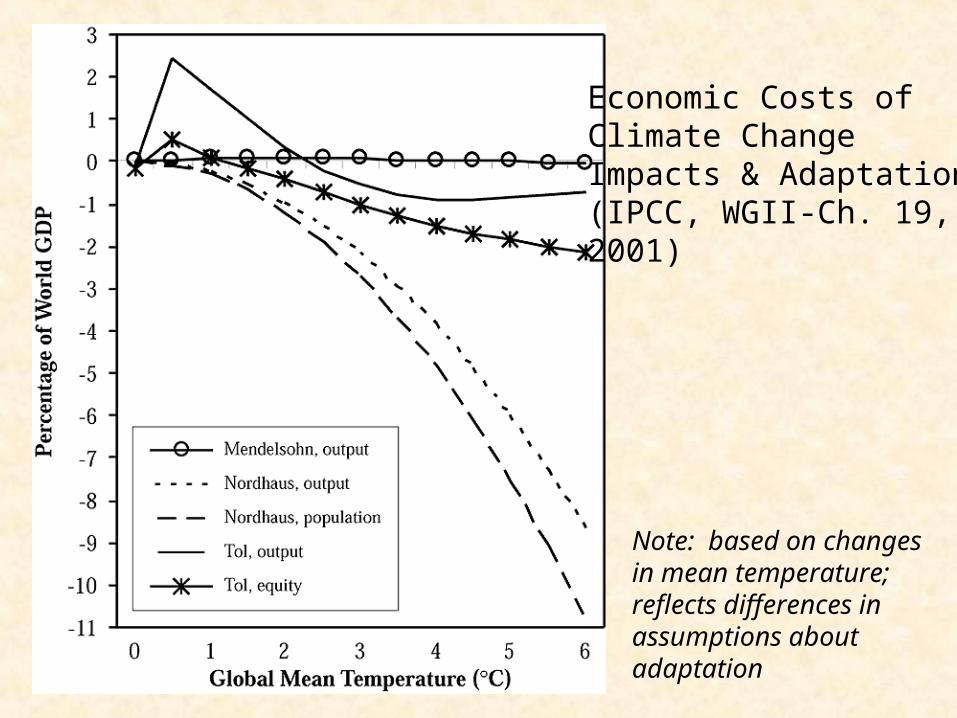
Economic Costs of Climate ChangeImpacts & Adaptation; (IPCC, WGII-Ch. 19,2001)
Note: based on changes in mean temperature; reflects differences in assumptions about adaptation
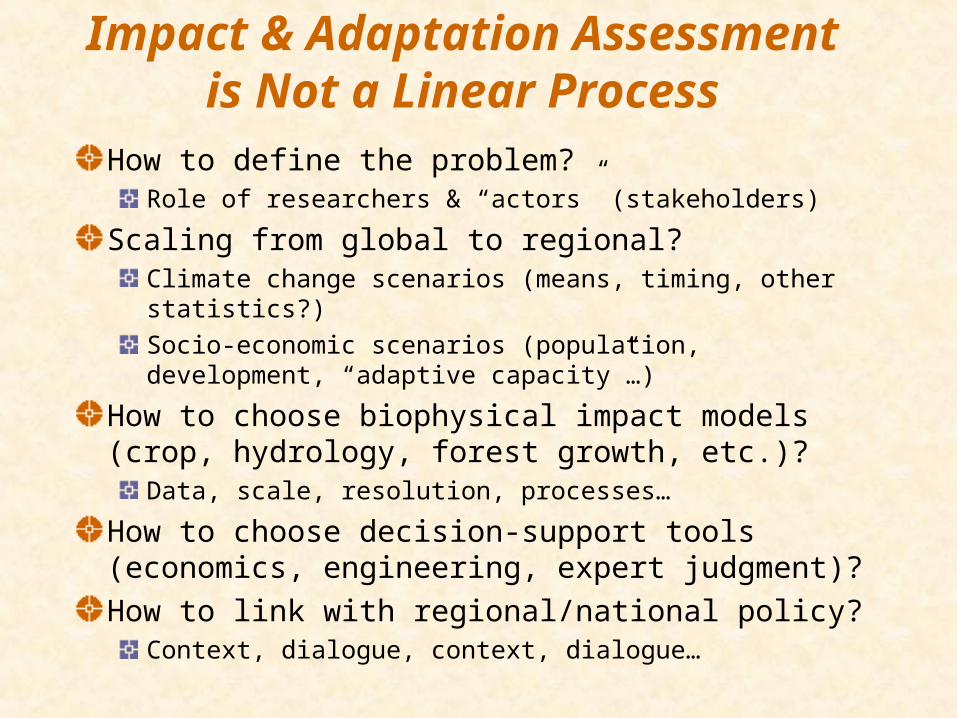
Impact & Adaptation Assessment is Not a Linear Process
How to define the problem?Role of researchers & “actors” (stakeholders)
Scaling from global to regional?Climate change scenarios (means, timing, other statistics?)Socio-economic scenarios (population, development, “adaptive capacity”…)
How to choose biophysical impact models (crop, hydrology, forest growth, etc.)?
Data, scale, resolution, processes…
How to choose decision-support tools (economics, engineering, expert judgment)?How to link with regional/national policy?
Context, dialogue, context, dialogue…
Examples from Studies of Observed and Scenario Events
Drought of 2003; fires
Mackenzie Basin Impact Study (MBIS); fires, storm surges
Mountain pine beetle in British Columbia; warm winters and future potential
Okanagan water resources; will drought conditions become more common?
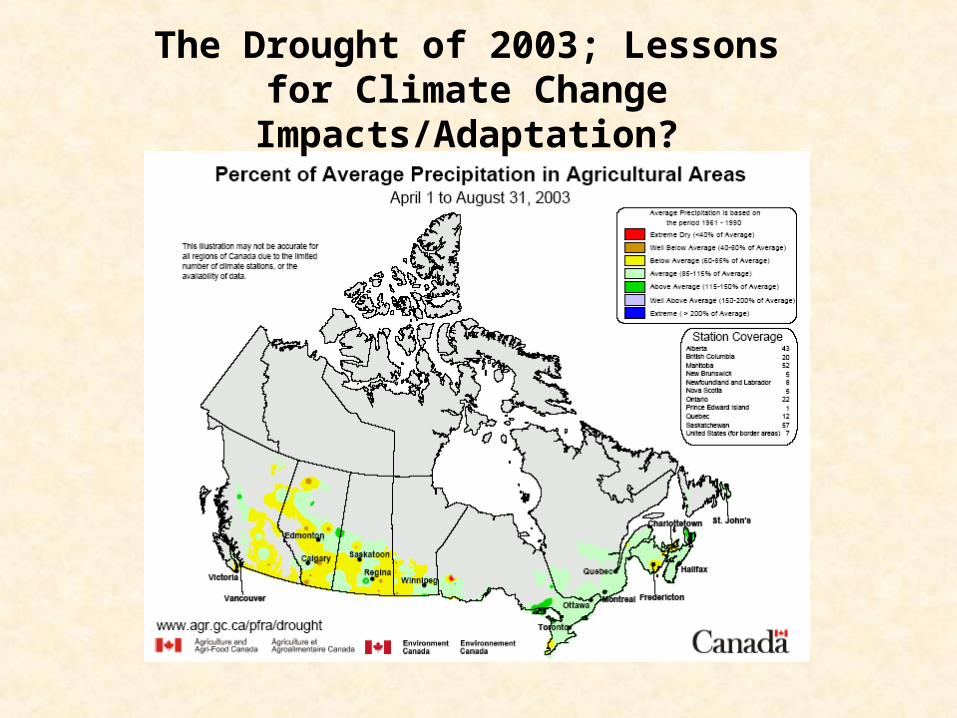
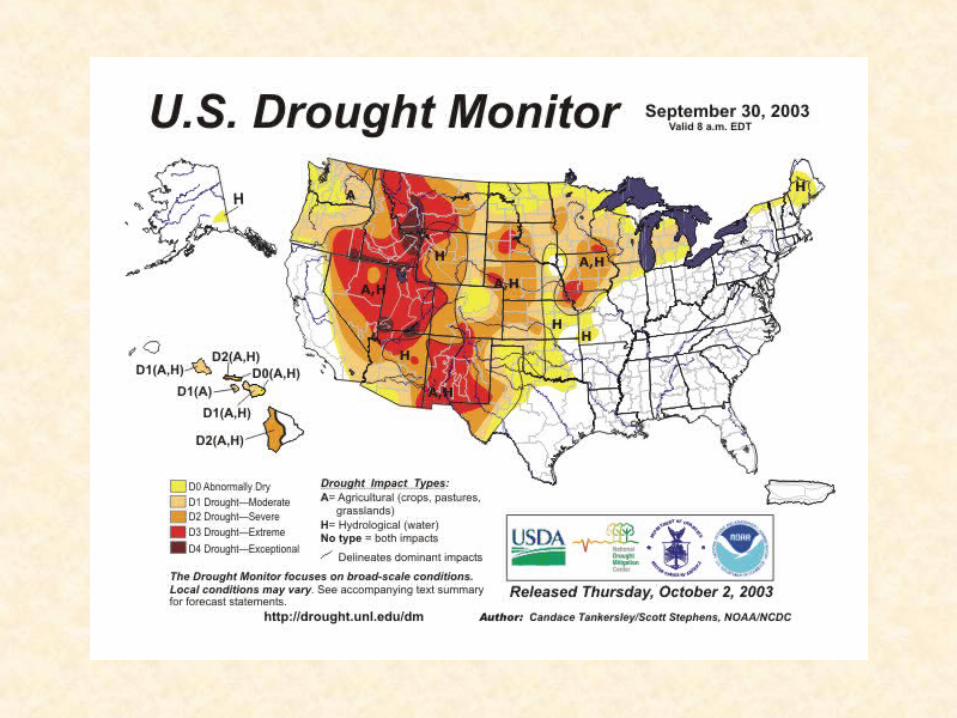
The Drought of 2003; Lessons for Climate Change Impacts/Adaptation?
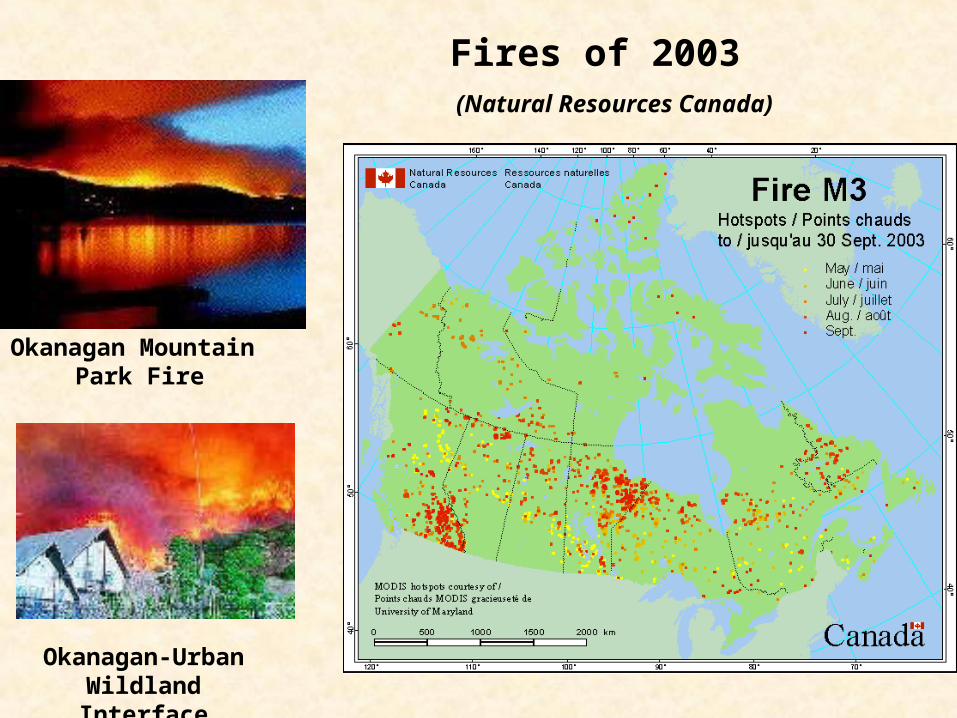
Okanagan Mountain Park Fire
Okanagan-Urban Wildland Interface
Fires of 2003
(Natural Resources Canada)
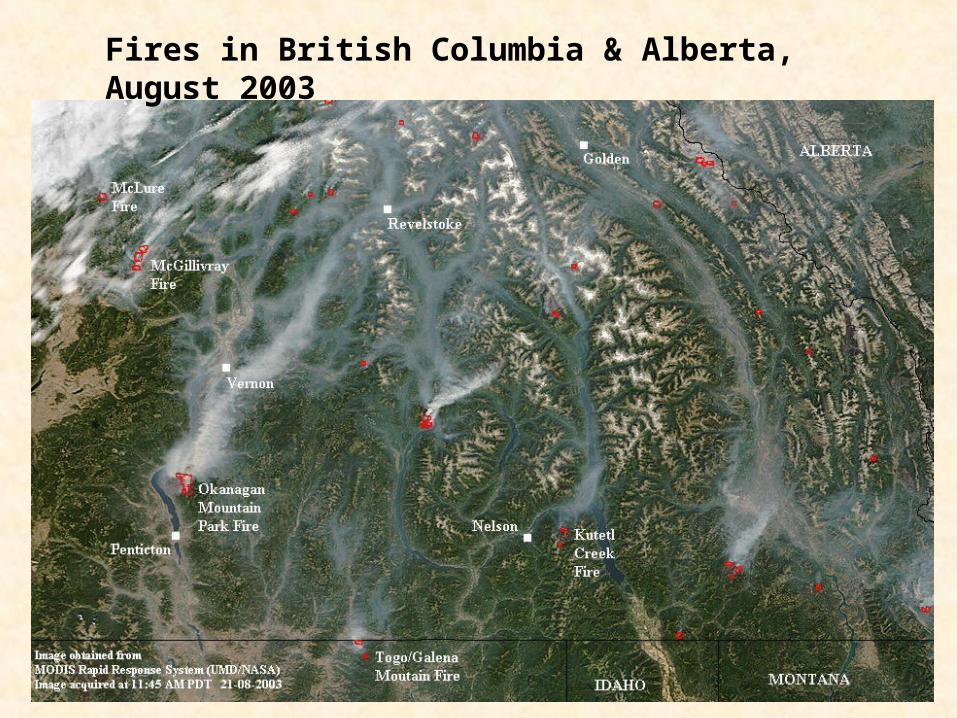
Fires in British Columbia & Alberta, August 2003
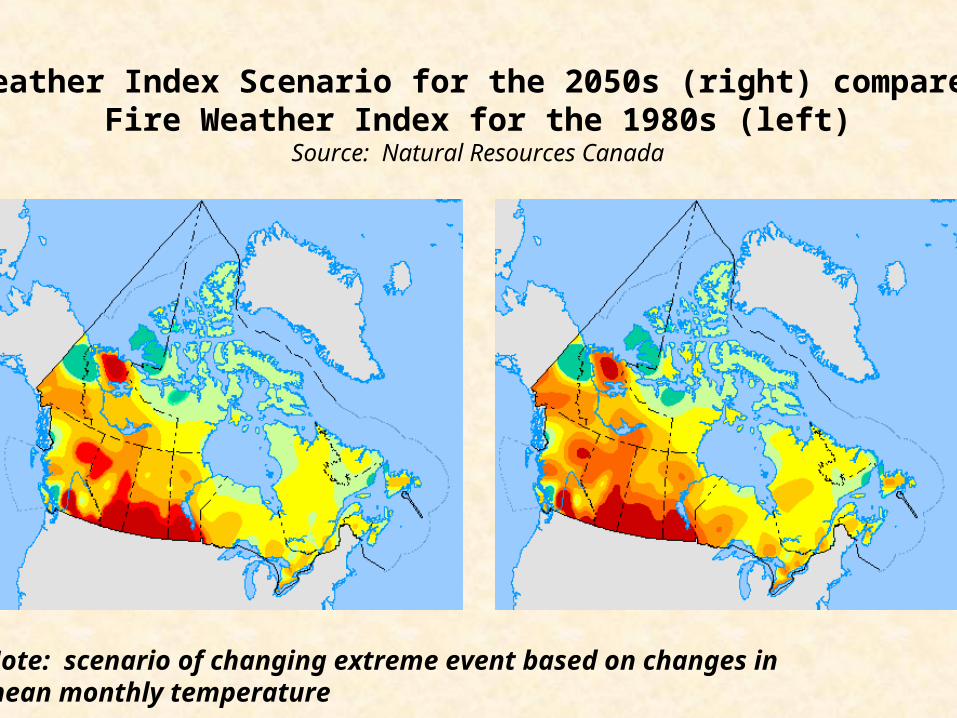
Fire Weather Index Scenario for the 2050s (right) compared withFire Weather Index for the 1980s (left)
Source: Natural Resources Canada
Note: scenario of changing extreme event based on changes in mean monthly temperature
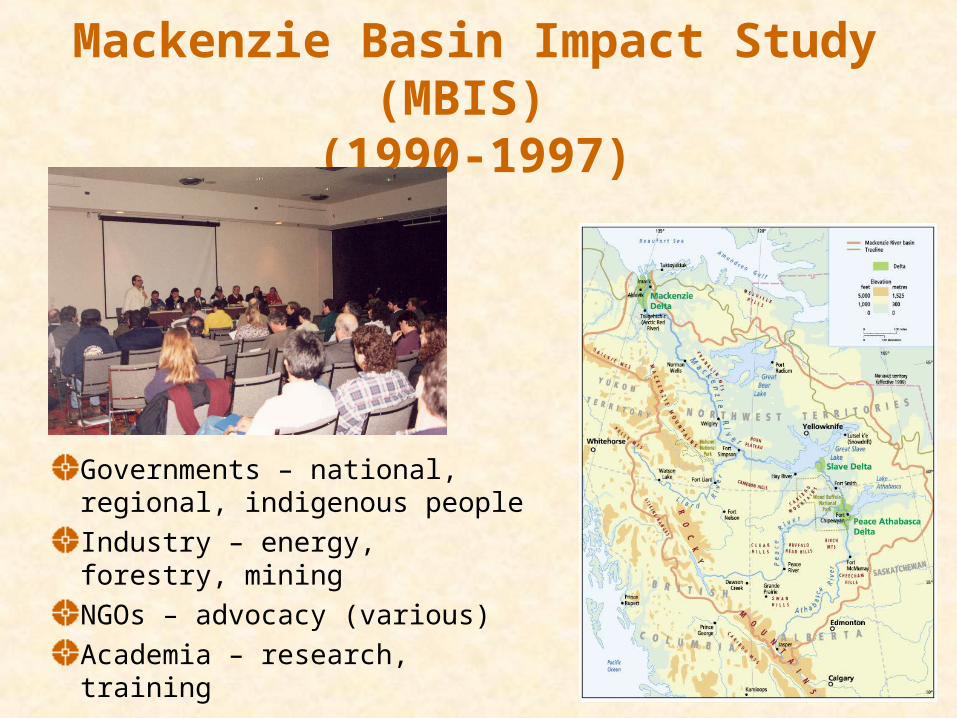
Mackenzie Basin Impact Study (MBIS) (1990-1997)
Governments – national, regional, indigenous peopleIndustry – energy, forestry, miningNGOs – advocacy (various)Academia – research, training
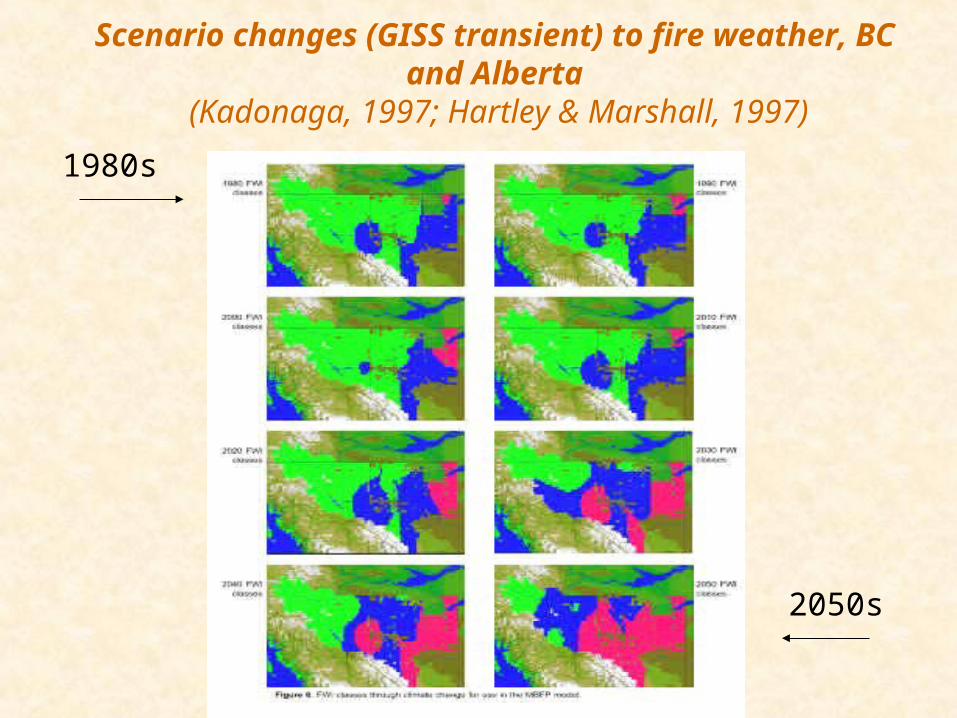
Scenario changes (GISS transient) to fire weather, BC and Alberta
(Kadonaga, 1997; Hartley & Marshall, 1997)
1980s
2050s
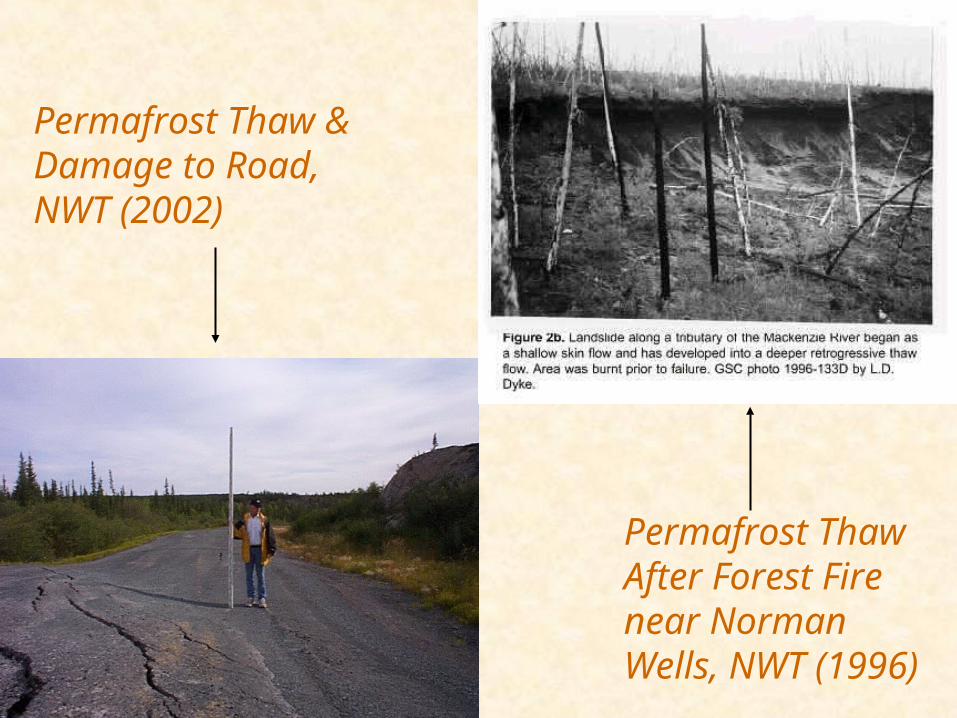
Permafrost Thaw & Damage to Road, NWT (2002)
Permafrost Thaw After Forest Fire near Norman Wells, NWT (1996)
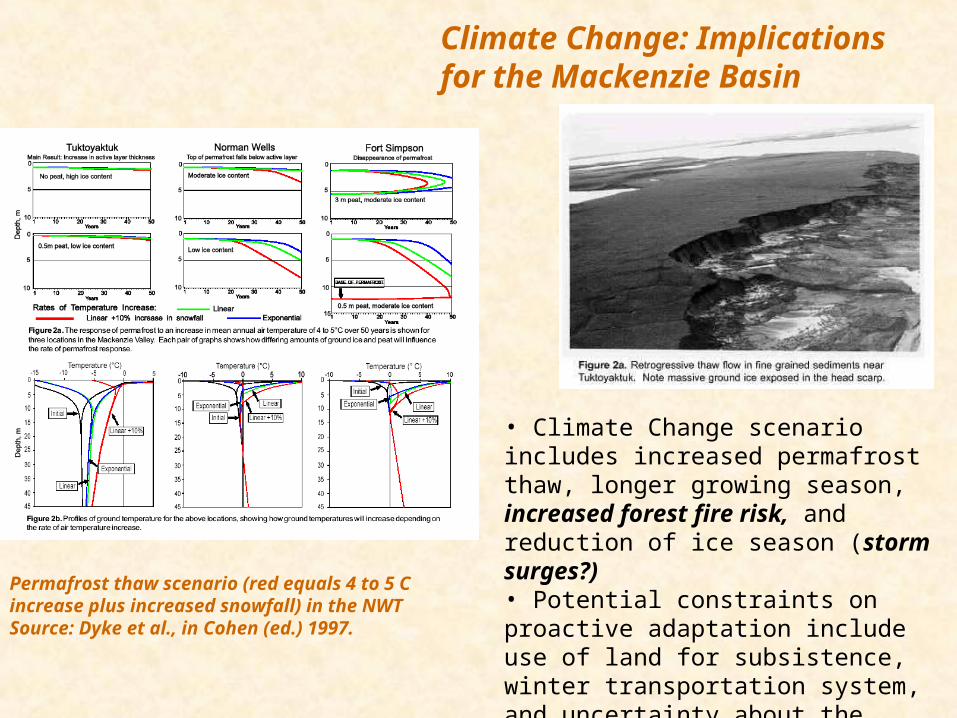
Climate Change: Implications for the Mackenzie Basin
• Climate Change scenario includes increased permafrost thaw, longer growing season, increased forest fire risk, and reduction of ice season (storm surges?) • Potential constraints on proactive adaptation include use of land for subsistence, winter transportation system, and uncertainty about the futurehttp://www.msc-scm.ec.gc.ca/airg/publications
Permafrost thaw scenario (red equals 4 to 5 C increase plus increased snowfall) in the NWT Source: Dyke et al., in Cohen (ed.) 1997.
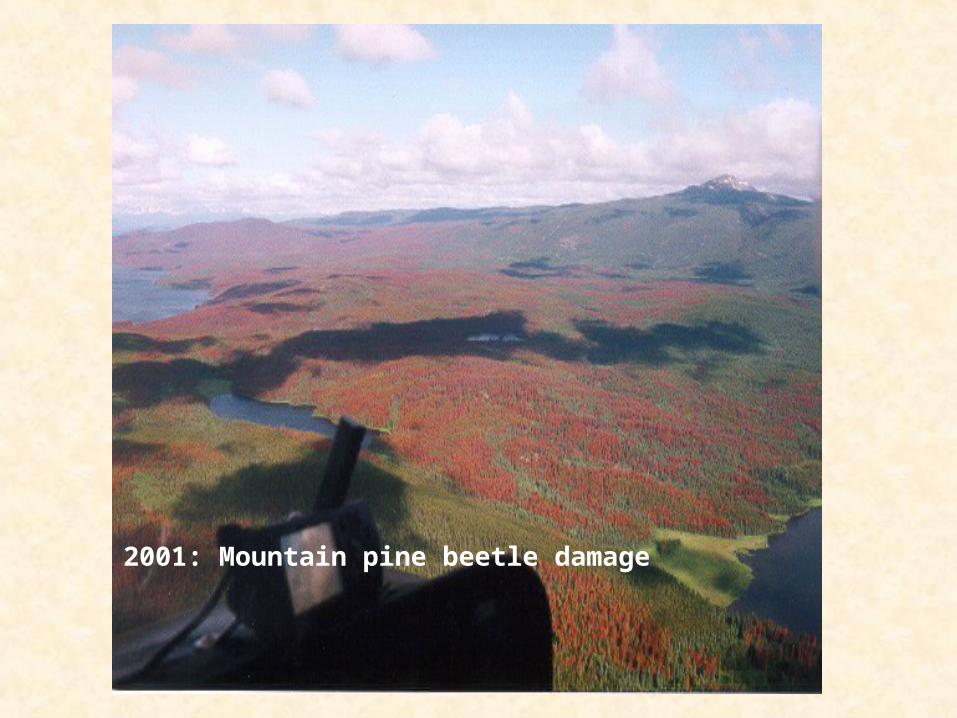
2001: Mountain pine beetle damage
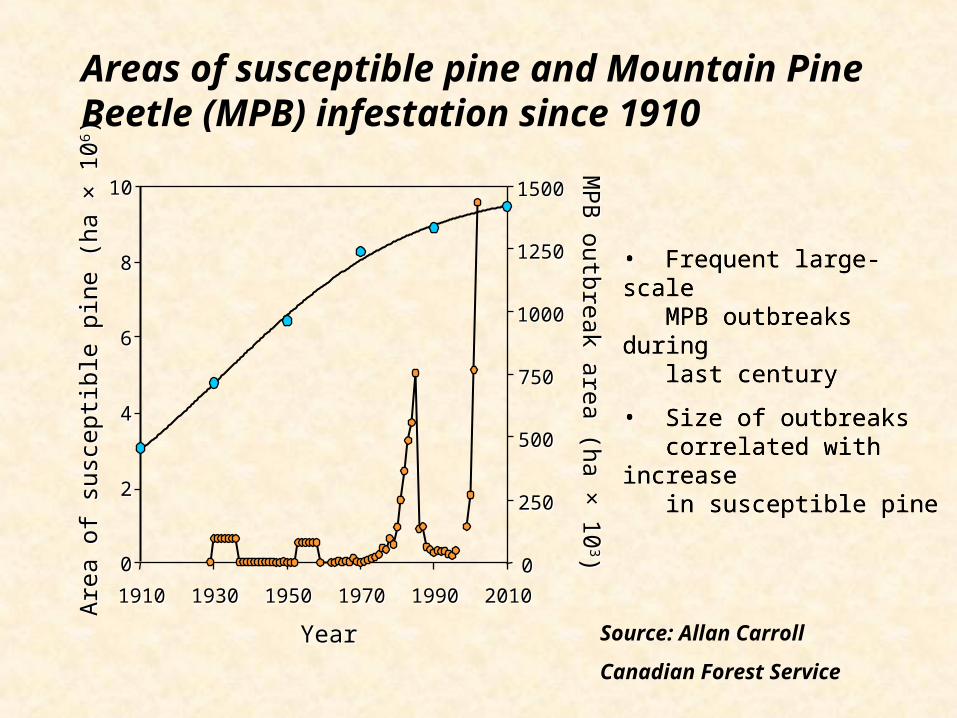
Areas of susceptible pine and Mountain Pine Beetle (MPB) infestation since 1910
Are
a of
sus
cept
ible
pin
e (h
a ×
106 )
Are
a of
sus
cept
ible
pin
e (h
a ×
106 )
MP
B outbreak area (ha ×
103)
MP
B outbreak area (ha ×
103)
19101910 19301930 19501950 19701970 19901990 20102010
00
22
44
66
88
1010
00
250250
500500
750750
10001000
12501250
15001500
YearYear
• Frequent large-scale MPB outbreaks during last century
• Size of outbreaks correlated with increase in susceptible pine
• Frequent large-scale MPB outbreaks during last century
• Size of outbreaks correlated with increase in susceptible pine
Source: Allan Carroll
Canadian Forest Service
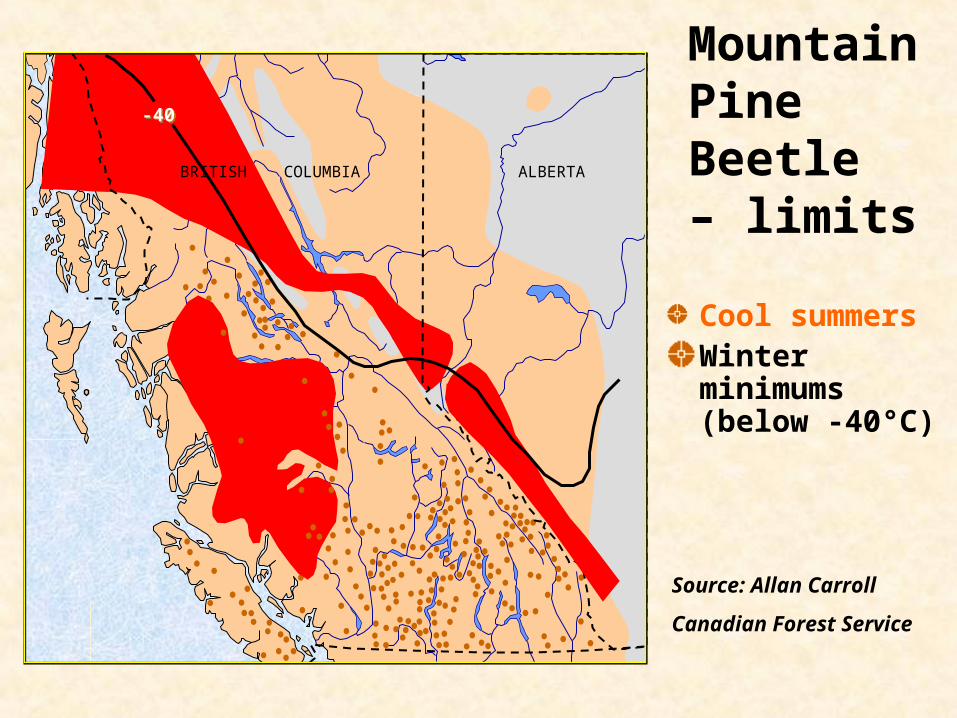
Mountain Pine Beetle – limits
Cool summers Winter minimums (below -40°C)
ALBERTACOLUMBIABRITISH
-40-40
Source: Allan Carroll
Canadian Forest Service
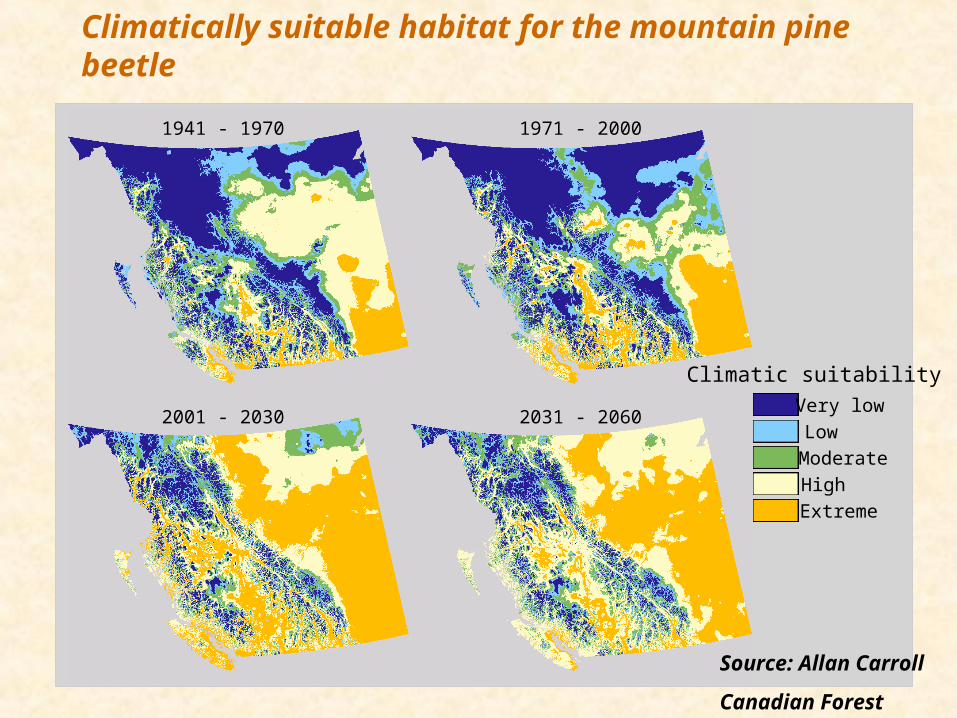
Very low
Low
Extreme
Moderate
High
Climatic suitability
1941 - 1970 1971 - 2000
2001 - 2030 2031 - 2060
Climatically suitable habitat for the mountain pine beetle
Source: Allan Carroll
Canadian Forest Service
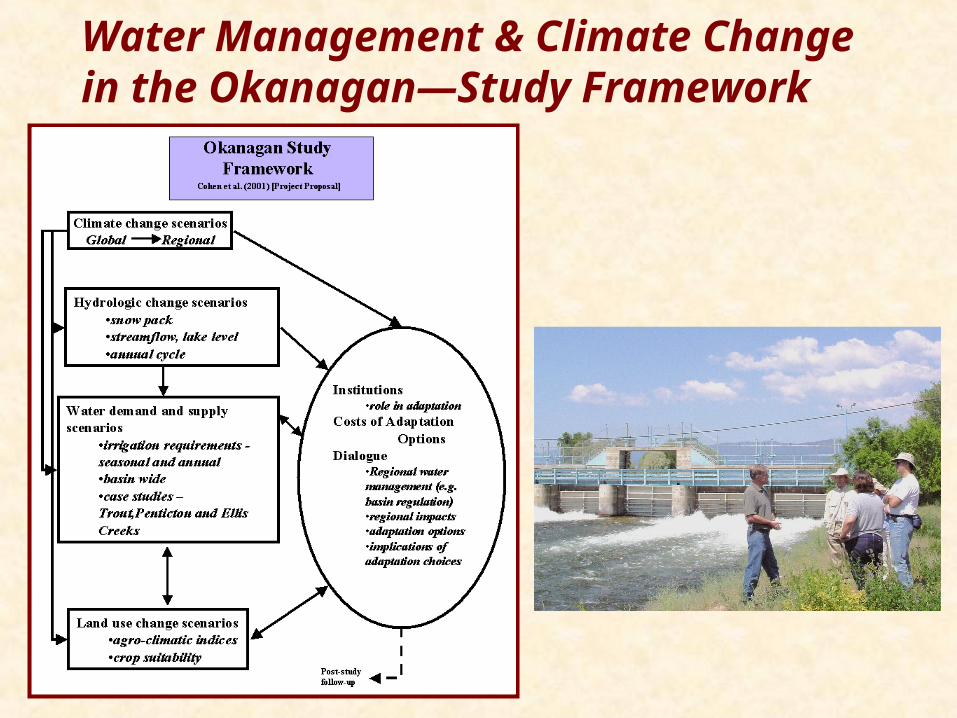
Water Management & Climate Change in the Okanagan—Study Framework

Winter Season (DJF) 2050, Lat=50o Lon=120o
0
5
10
15
20
25
0 1 2 3 4 5
Mean Temperature Change (oC)
Pre
cipi
tatio
n C
hang
e (%
)
Summer Season (JJA) 2050, Lat=50o Lon=120o
-40
-30
-20
-10
0
10
0 1 2 3 4 5
Mean Temperature Change (oC)
Pre
cipi
tatio
n C
hang
e (%
)
Climate Change Scenarios for 50 °N,
120°W(Taylor & Barton, 2003)
CGCM2 A21
CGCM2 B21
CSIROMk2 A21
CSIROMk2 B21
HadCM3 A22
HadCM3 B22
Legend

CSIRO
0
1
2
3
4
5
Base2020's [A2]2050's [A2]2080's [A2]2020's [B2]2050's [B2]2080's [B2]
Flo
w V
olu
me (
10^
6 m
3)
January to March April to June July to August October to December
CGCM2
0
1
2
3
4
5
Base2020's [A2]2050's [A2]2080's [A2]2020's [B2]2050's [B2]2080's [B2]
Flo
w V
olu
me(1
0^
6 m
3)
January to March April to June July to August October to December
Hadley
0
1
2
3
4
5
Base2020's [A2]2050's [A2]2080's [A2]2020's [B2]2050's [B2]2080's [B2]
Flo
w V
olu
me
(10
^6
m3
)
January to March April to June July to August October to December
Base & scenariomean seasonalflow volumes atEllis Reservoir(Merritt & Alila,2003)
0
5
10
15
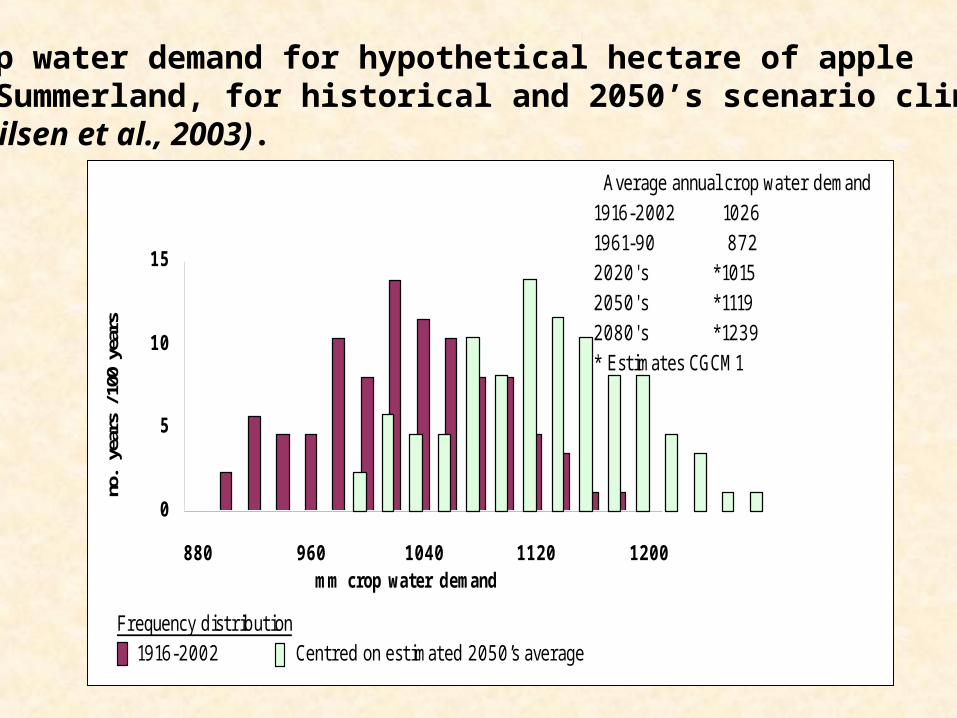
880 960 1040 1120 1200mm crop water demand
no. y
ears
/100
yea
rs
Average annual crop water demand 1916-2002 1026 1961-90 872 2020's *1015 2050's *1119 2080's *1239 * Estimates CGCM1
Frequency distribution 1916-2002 Centred on estimated 2050’s average
Crop water demand for hypothetical hectare of apple at Summerland, for historical and 2050’s scenario climate (Neilsen et al., 2003).
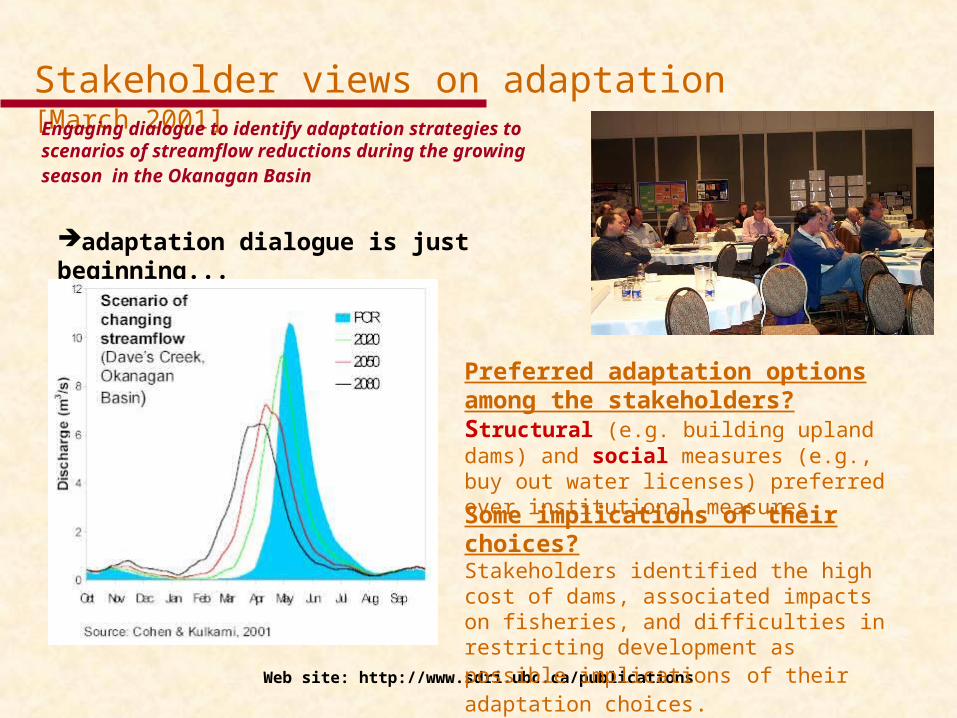
Stakeholder views on adaptation [March 2001]Engaging dialogue to identify adaptation strategies to scenarios of streamflow reductions during the growing season in the Okanagan Basin
Web site: http://www.sdri.ubc.ca/publications
Preferred adaptation options among the stakeholders?Structural (e.g. building upland dams) and social measures (e.g., buy out water licenses) preferred over institutional measures
Some implications of their choices?Stakeholders identified the high cost of dams, associated impacts on fisheries, and difficulties in restricting development as possible implications of their adaptation choices.
adaptation dialogue is just beginning...
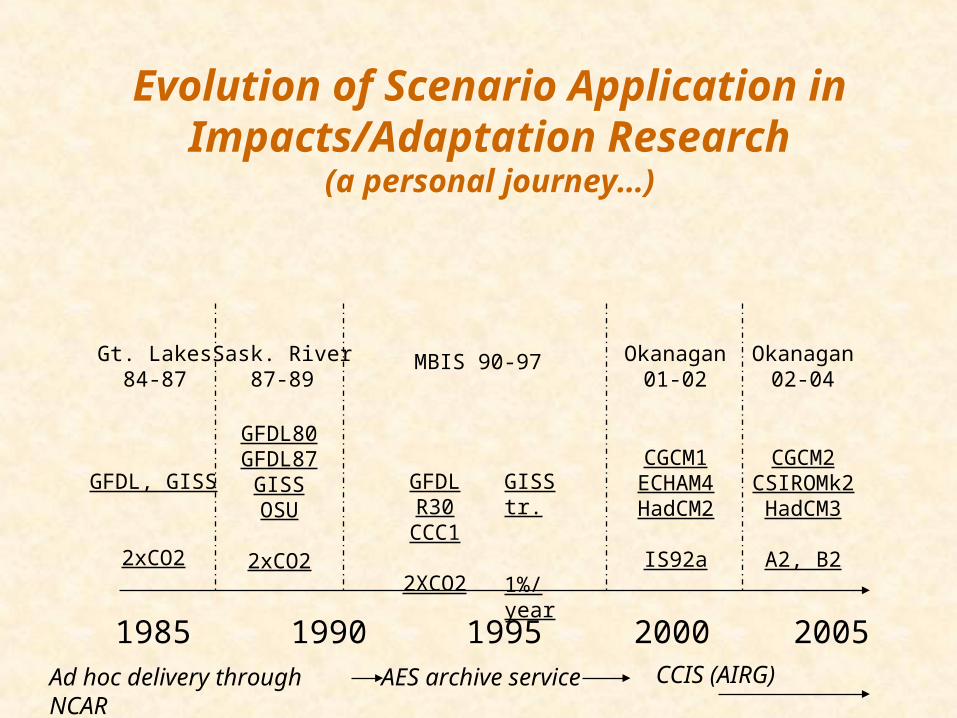
Evolution of Scenario Application in Impacts/Adaptation Research
(a personal journey…)
1985 1990 1995 2000 2005
Okanagan02-04
Okanagan01-02
MBIS 90-97Sask. River87-89
Gt. Lakes84-87
GFDL, GISS
2xCO2
GFDL80GFDL87
GISSOSU
2xCO2
GFDL R30CCC1
2XCO2
GISS tr.
1%/year
CGCM2CSIROMk2
HadCM3
A2, B2
CGCM1ECHAM4HadCM2
IS92a
Ad hoc delivery through NCAR AES archive service CCIS (AIRG)
Key Messages
Impacts/adaptation research requires an interdisciplinary approach to fully address the range of potential issues that may arise due to climate change; scenario applications must fit into that context.
Current applications of ‘mean’ climate scenario products already include derivation of extreme event indicators (e.g. fire weather); future application of extreme climate scenario products could attract new users, BUT beware of simplistic definitions of ‘extremes’ (e.g. drought).
There are institutional & social components to vulnerability & adaptation, and this will continue to influence the framing of impacts/adaptation research questions, including the role of climate scenarios.