Embed Size (px)
Citation preview
CLIMATE CHANGE: Connections and SolutionsMiddle School
Copyright © 2007 Facing the Future
Commercial reproduction of Facing the Future materials is prohibited without prior written permission. Materials may be reproduced and used for nonprofit educational purposes, providing the user contacts
Facing the Future prior to reproduction, and appropriately acknowledges Facing the Future as the writer and developer of said materials.
Facing the Future is a nonprofit, nonpartisan organization providing resources and community action opportunities on global issues and sustainability for teachers, students, and the public. For more information
and to order copies of this guide, visit our website or contact us at:
FACING THE FUTURE811 First Avenue, Suite 454
Seattle, WA 98104(206) 264-1503
www.facingthefuture.org
Two-Week Unit for Middle School (Grades 6-8)
Climate Change: Connections and Solutions
This unit was developed with generous funding from the Hewlett-Packard Company
Acknowledgements
Curriculum Development
Laura Skelton, M.S.Cecilia Lund, M.A.
Copy EditingSandra Pederson
Design and LayoutMike F Leonen
Research and EditingKim Rakow Bernier, M.P.A.
David Wilton, M.Ed.
Field TestingThank you to the following teachers and their students for field testing the curriculum:
Thomas R. Allison, Science Facilitator, Marion County Marine InstituteAntony Blaikie, Science Teacher
Angela Brener-Suarez, Social Studies Teacher, Cesar Chavez School for Social ChangeNancy Butler, Science Teacher, Harbour View High School
Alexandra Chauran, Science Teacher, Kent Phoenix AcademyBrenda Cloyed, Counselor/Teacher, Moravia Community School
Elise Cooksley, Science Teacher, Two Rivers SchoolMargy Dieter, Anthropology Teacher, Marshall High School
Bill DeMartini, Language Arts and Social Studies Teacher, Tyee Middle SchoolTeresa Eastburn, UCAR/NCAR Public Visitor and School Programs Coordinator, National Center for
Atmospheric ResearchMary Margaret Elmayan, Science Teacher and AMGEN-NSTA Teaching Fellow, Zebulon Gifted and
Talented Magnet Middle SchoolEmily Flaherty, Science Teacher, Kennebunk High School
Jan Hertel, Geography Teacher and Department Chair, Hastings Middle SchoolMike Johnston, Global Issues and Environmental Education Teacher, American School of Doha
Emily LeLacheur, Science Teacher, Marymount International SchoolChristine Loeffler, Science Teacher, Laguna-Acoma High School
Steven Marks, Social Science Teacher, Marion County Marine InstituteIrene Martine, Science Teacher, Spacecoast Jr/Sr High
Bray McDonald, Educator, Tennessee AquariumKate Perry, Science Teacher, DCMO Board of Cooperative Educational Services
Suzy Schulz, Pathfinder Educator, Lancaster County Youth Services CenterKathryn Kurtz Smith, Science Teacher, Polaris K-12
Debra Smrchek, Science Chairperson, Academy of the Holy Cross
Additional ContributionsThank you to the following individuals for reviewing, editing, and contributing to the curriculum:
Char Alkire, Science Teacher Supervisor, University of WashingtonDave Aplin, Bering Sea Program Officer, World Wildlife Fund
Miriam Bertram, Program Manager, Program on Climate Change, University of WashingtonPierre Delforge, Energy and Climate Program Manager, Hewlett-Packard Corporate
Environmental StrategiesAva Erickson, Science and Math Teacher, Seattle Girls School
Charles C. Eriksen, Professor, School of Oceanography, University of WashingtonKate Graves, Southeast Climate Program Officer, World Wildlife Fund
Scott Jamieson, Teacher, Lakeside SchoolTheressa L. Lenear, Director of Diversity and Inclusion, Child Care Resources
Hanna Poffenbarger, Student Teacher, University of MarylandLuAnne Thompson, Associate Professor, School of Oceanography, University of Washington
Deanna Ward, Corporate Philanthropy, Hewlett-Packard Company
Facing the Future Advisory Council
Char Alkire, Science Teacher Supervisor, University of WashingtonJim Bennett, Vice President, Cinematch, Netflix Inc.John de Graaf, PBS Producer and Author, Affluenza
Dee Dickinson, Founder and CEO, New Horizons for LearningWendy Ewbank, Teacher, Seattle Girls School
Scott Jamieson, Teacher, Lakeside SchoolMarie Marrs, Teacher, Eagle Harbor High School
Kate McPherson, Director, Project Service LeadershipRobin Pasquarella, Former Director, Alliance for Education
Abby Ruskey, Executive Director, Environmental Education Association of WashingtonDr. Debra Sullivan, Dean, Praxis Institute for Early Childhood Education
Dr. Anand Yang, Director, Jackson School of International Studies, University of Washington
Climate Change: Connections and Solutions
Climate change is a complex and interconnected global issue that cuts across many disciplines. This curriculum is aligned with national science and social studies standards and may be used in other classes as well. Appropriate disciplines are suggested for each lesson.
The 2-week unit begins with an introduction to climate change. During the first week, the foundation is laid for understanding some of the forces behind climate change. Students learn basic scientific phenomena related to climate change, beginning with the carbon cycle and the greenhouse effect and concluding with an analysis of different fuel types.
The second week widens and deepens students’ understanding of climate change with an exploration of its connections to various social, economic, and environmental factors. By the end of this 2-week unit, students will under-stand and be able to communicate complex and interconnected issues related to climate change.
Each week of the curriculum is a stand-alone unit and can be taught inde-pendently of the other week.
CLIMATE CHANGE
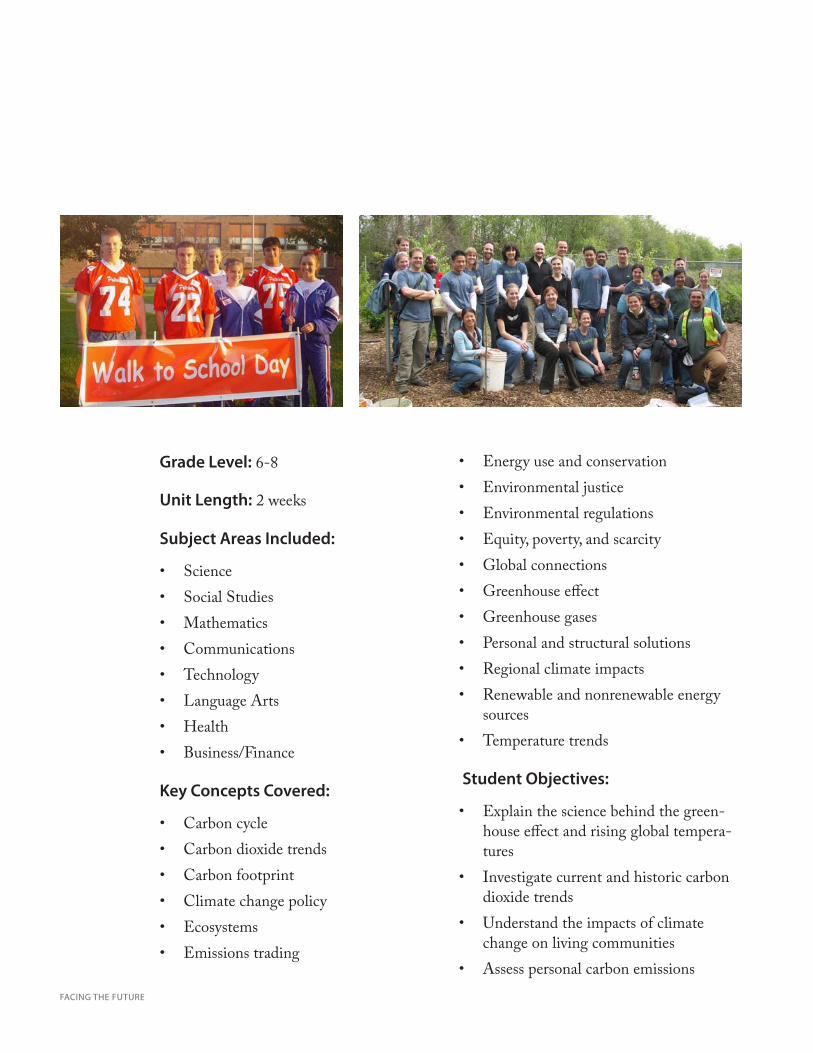
Grade Level: 6-8
Unit Length: 2 weeks
Subject Areas Included:
Science•Social Studies•Mathematics•Communications•Technology•Language Arts•Health•Business/Finance•
Key Concepts Covered:
Carbon cycle•Carbon dioxide trends•Carbon footprint•Climate change policy•Ecosystems•Emissions trading•
Energy use and conservation•Environmental justice•Environmental regulations•Equity, poverty, and scarcity•Global connections•Greenhouse effect•Greenhouse gases•Personal and structural solutions•Regional climate impacts•Renewable and nonrenewable energy •sourcesTemperature trends•
Student Objectives:
Explain the science behind the green-•house effect and rising global tempera-turesInvestigate current and historic carbon •dioxide trendsUnderstand the impacts of climate •change on living communitiesAssess personal carbon emissions•
FACING THE FUTURE
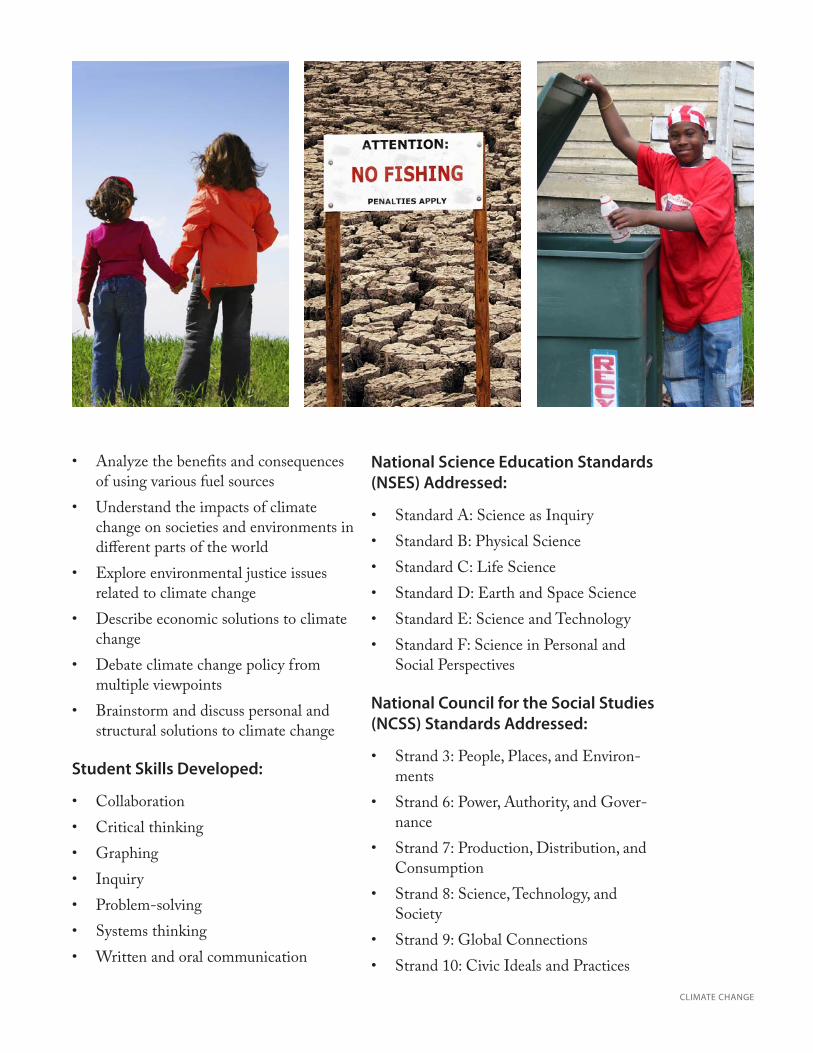
Analyze the benefits and consequences •of using various fuel sourcesUnderstand the impacts of climate •change on societies and environments in different parts of the world Explore environmental justice issues •related to climate changeDescribe economic solutions to climate •changeDebate climate change policy from •multiple viewpointsBrainstorm and discuss personal and •structural solutions to climate change
Student Skills Developed:
Collaboration•Critical thinking•Graphing•Inquiry•Problem-solving•Systems thinking •Written and oral communication•
National Science Education Standards (NSES) Addressed:
Standard A: Science as Inquiry•Standard B: Physical Science•Standard C: Life Science•Standard D: Earth and Space Science•Standard E: Science and Technology•Standard F: Science in Personal and •Social Perspectives
National Council for the Social Studies (NCSS) Standards Addressed:
Strand 3: People, Places, and Environ-•mentsStrand 6: Power, Authority, and Gover-•nanceStrand 7: Production, Distribution, and •ConsumptionStrand 8: Science, Technology, and •SocietyStrand 9: Global Connections•Strand 10: Civic Ideals and Practices•
CLIMATE CHANGE
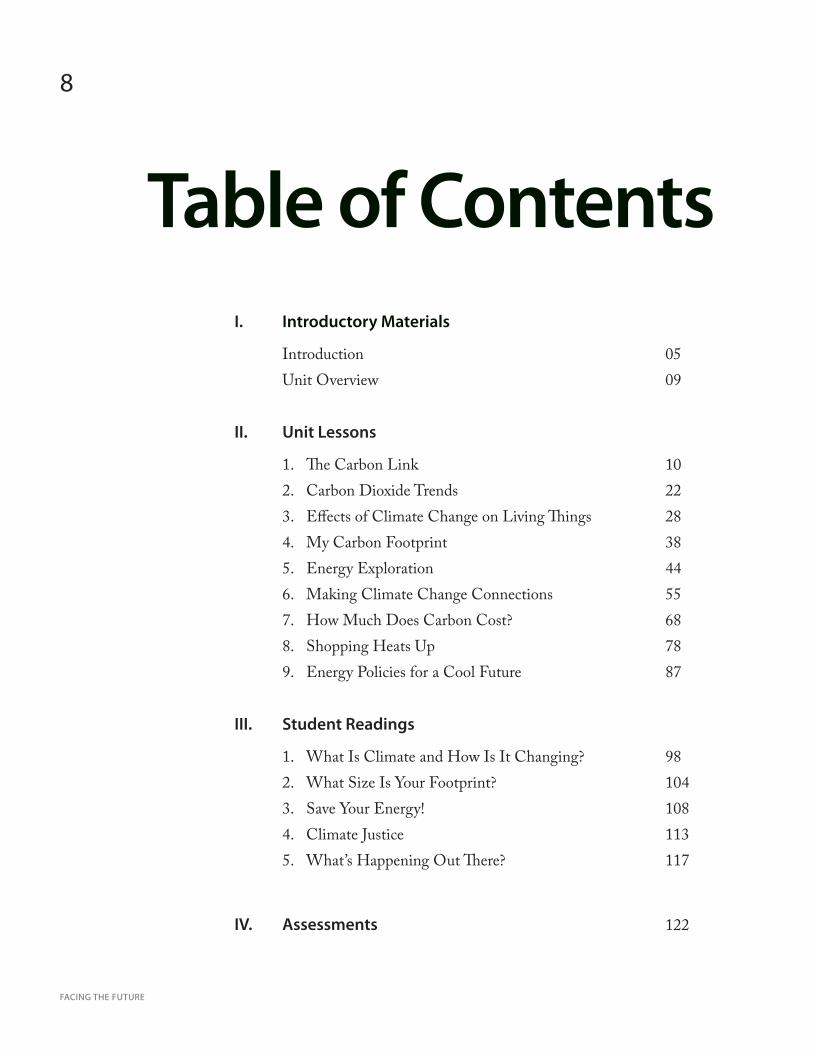
I. Introductory Materials
Introduction 05 Unit Overview 09
II. Unit Lessons
The Carbon Link 101. Carbon Dioxide Trends 222. Effects of Climate Change on Living Things 283. My Carbon Footprint 384. Energy Exploration 445. Making Climate Change Connections 556. How Much Does Carbon Cost? 687. Shopping Heats Up 788. Energy Policies for a Cool Future 879.
III. Student Readings
What Is Climate and How Is It Changing? 981. What Size Is Your Footprint? 1042. Save Your Energy! 1083. Climate Justice 1134. What’s Happening Out There? 1175.
IV. Assessments 122
Table of Contents
FACING THE FUTURE
8
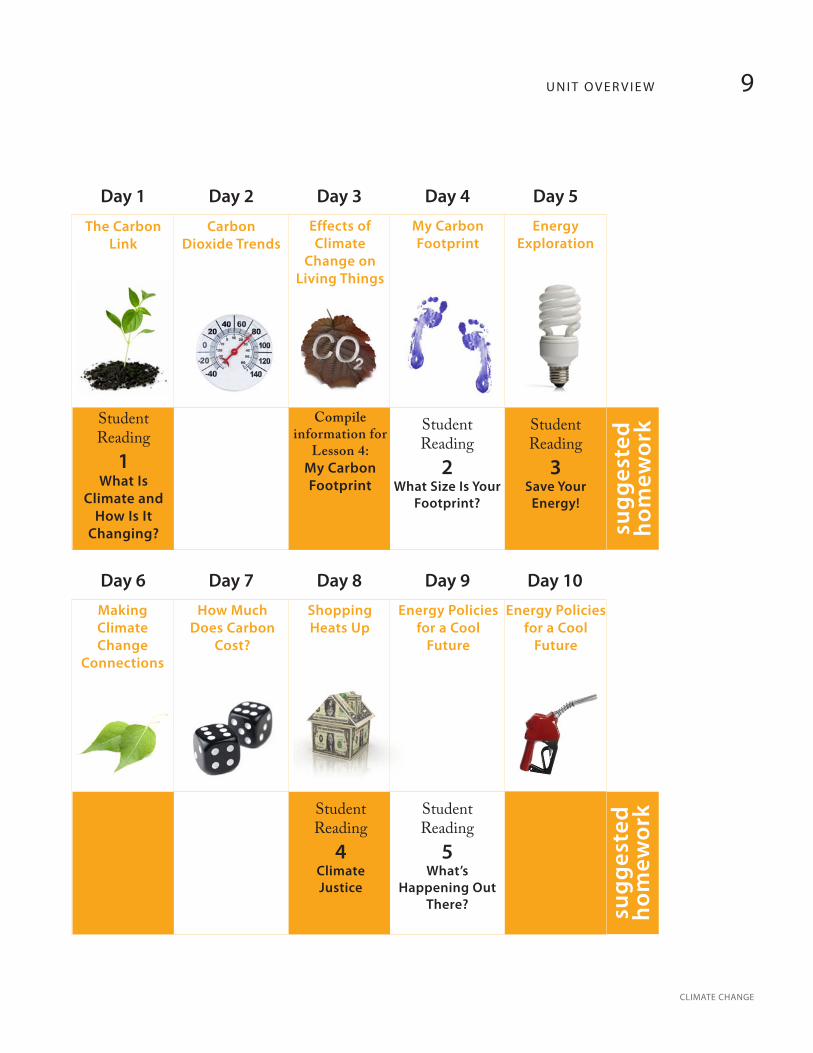
Student Reading
1What Is
Climate and How Is It
Changing?
Student Reading
3Save Your
Energy!
Compile information for
Lesson 4: My Carbon Footprint
Student Reading
4Climate Justice
Student Reading
2What Size Is Your
Footprint?
Student Reading
5What’s
Happening Out There?
The Carbon Link
Carbon Dioxide Trends
Energy Exploration
Effects of Climate
Change on Living Things
My Carbon Footprint
How Much Does Carbon
Cost?
Energy Policies for a Cool
Future
Shopping Heats Up
Making Climate Change
Connections
Energy Policies for a Cool
Future
Day 1 Day 2 Day 3 Day 4 Day 5
sugg
este
d ho
mew
ork
Day 6 Day 7 Day 8 Day 9
sugg
este
d ho
mew
ork
Day 10
CLIMATE CHANGE
9U N I T O V E R V I E W
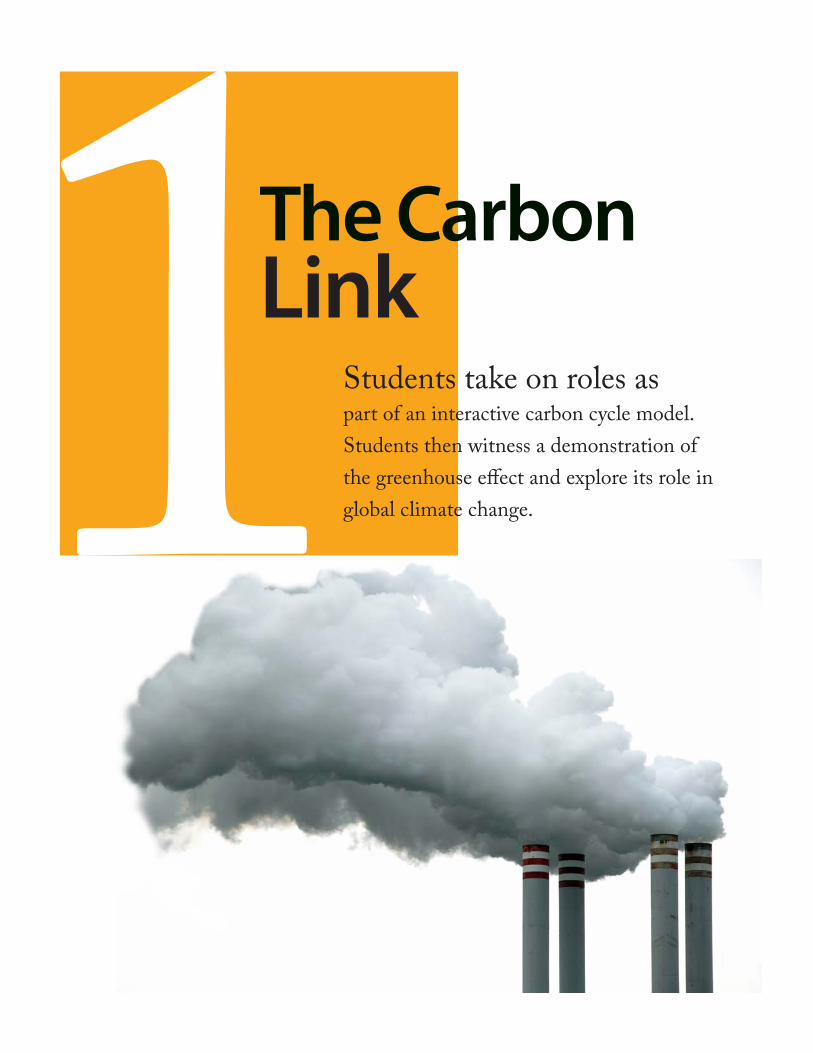
1Students take on roles as part of an interactive carbon cycle model. Students then witness a demonstration of the greenhouse effect and explore its role in global climate change.
The Carbon Link
11clim
ate chan
ge
Inquiry/Critical Thinking Questions
How does carbon move within an eco-•system?What are some activities that may alter •the balance of carbon in the cycle?What is the greenhouse effect, and how •do carbon emissions influence it?
Objectives
Students will:Identify component parts of a terrestrial •carbon cycleReview, draw, and act out the carbon •cycleLink carbon cycle dynamics to the •greenhouse effectUnderstand the greenhouse effect and •its relation to climate change
Time Required
50 minutes (Extra time will be required for reviewing carbon background information, including respiration and photosynthesis.)
Key Concepts
Carbon cycle•Greenhouse effect•Greenhouse gases•
Subject Areas
Science (Life, Earth, Physical, Environ-•mental)
National Standards Alignment
National Science Education Standards (NSES)
Standard B: Physical Science •Standard C: Life Science •Standard D: Earth and Space Science •Standard F: Science in Personal and Social •Perspectives
Vocabulary
carbon• —a chemical substance found in all living things; carbon atoms make up cellscarbon dioxide• —a gas made of 1 carbon atom and 2 oxygen atoms; found in our atmosphere fossil fuels• —energy sources created over millions of years from the decay of living organisms
12
faci
ng
th
e fu
ture
T H E C A R B O N L I N K
greenhouse effect• —process by which certain gases in Earth’s atmosphere trap energy from the sun (as infrared radia-tion, or heat) that has been reflected off Earth’s surface; this process warms the earth’s surfacegreenhouse gas• —any gas in the atmo-sphere capable of absorbing infrared ra-diation (heat) reflected from the earth’s surface
Materials/Preparation
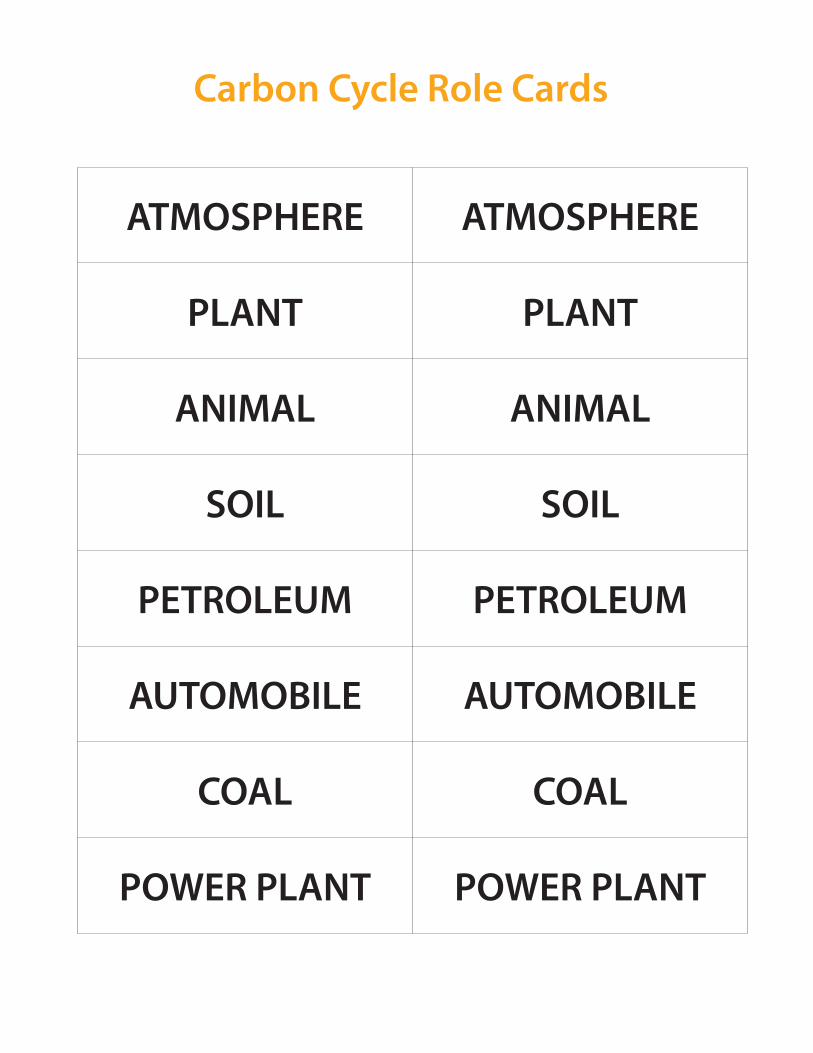
Lightweight ball (such as a beach ball or •foam ball) or other soft object to repre-sent a carbon moleculeCarbon Cycle Role Cards (use tape •to stick to shirts or affix yarn to a sign to hang around students’ necks), 1 per studentOverhead: Land-Based Carbon Cycle•(optional) Overhead: Carbon FAQ•2 thermometers•1 glass container (e.g., jar or Erlenmeyer •flask)
Activity Part 1 —Carbon CycleIntroduction
Ask students what they have heard 1. about climate change. What is it? What causes it? Tell students that they are about to begin a study of climate change. First, students will learn more about 2. carbon, which is integral to the study of climate change. Ask for volunteers to explain what 3. carbon is. Carbon is an element found in all living things. It is also a component of carbon dioxide, an important gas in Earth’s atmosphere. Carbon in our atmosphere occurs as carbon dioxide. Carbon dioxide (CO2) is one of the main gases linked to climate change; it remains in the atmosphere a long time, causing temperatures on Earth to rise.Use the overhead Carbon FAQ if 4. students need a review of basic carbon facts. Discuss the questions 1 at a time. Challenge students to call out answers to each question before revealing the given answer.
Note: This introductory activity could take the form of a KWL chart. (What I Know. What I Want to Know. What I Learned.)
If students are not familiar with 5. respiration and photosynthesis, you may want to review these concepts.
T H E C A R B O N L I N K13
climate ch
ang
eDuring respiration, energy stored in a. glucose is used to perform cellular activities.sugar + oxygen g CO2 + water + energy (to do work)
During photosynthesis, energy from b. the sun converts carbon dioxide and water into glucose, an energy source. Oxygen is a byproduct of this process.
water + CO2 + solar energy g sugar + oxygen
Steps
Use the Land-Based Carbon Cycle 1. overhead to review the terrestrial carbon cycle. Remind students that this diagram only shows part of the carbon
cycle (there are other components not shown, such as oceans and rock weathering). Begin anywhere on the overhead and walk through the cycle with students once.After you’ve walked through the carbon 2. cycle together, ask 1 student to draw 1 component of the cycle on the board. You may remove the Land-Based Carbon Cycle overhead for an extra challenge, or leave it up if students need a guide.Then ask another student to draw 3. a second component of the carbon cycle on the board, linked to the first component with an arrow.Continue this process until a fairly 4. complete land-based carbon cycle model has been drawn. If students are not
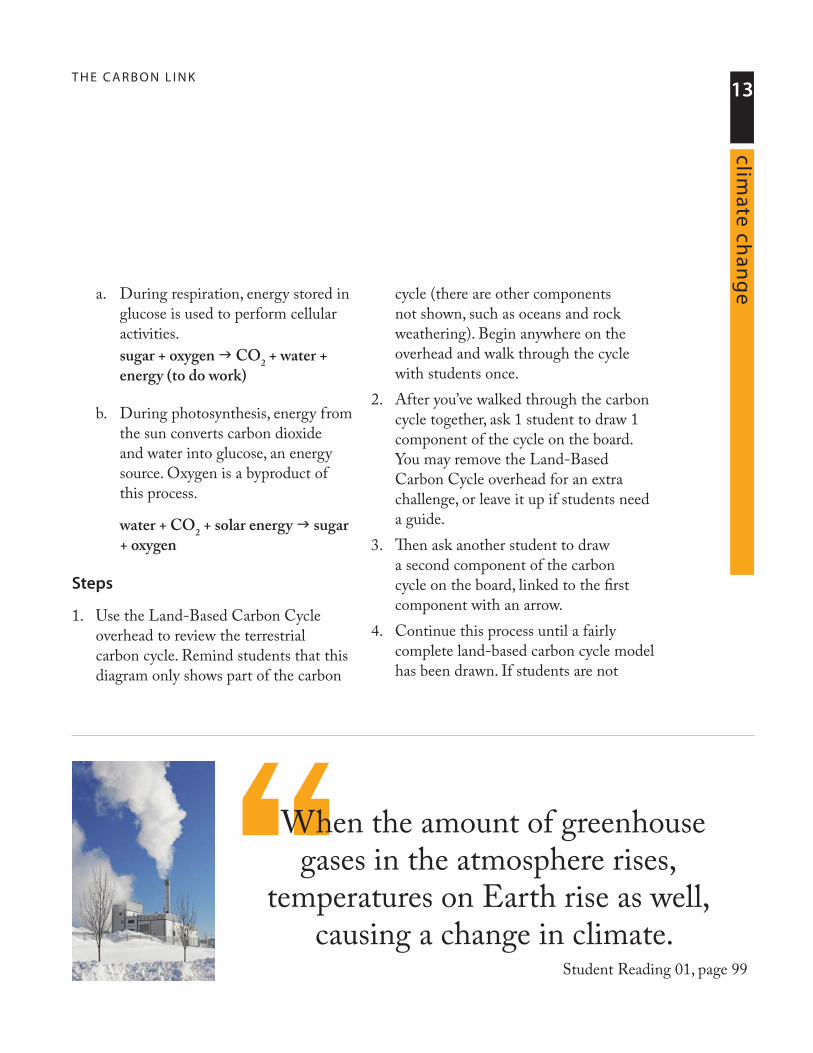
“When the amount of greenhouse gases in the atmosphere rises,
temperatures on Earth rise as well, causing a change in climate.
Student Reading 01, page 99
14
faci
ng
th
e fu
ture
T H E C A R B O N L I N K
already familiar with the carbon cycle, leave the Land-Based Carbon Cycle overhead up to guide students through the rest of the activity.Now pass out the Carbon Cycle Role 5. Cards and have students affix them to their shirts. Tell students that they are going to act out the parts of the carbon cycle that they just drew. You may want to complete this 6. activity in a large open space, such as a gymnasium or an outdoor area. Arrange students in a large circle so that all students can read each other’s role cards. Give the ball to a person with an 7. ATMOSPHERE role card. Ask that student where carbon might travel from the atmosphere (answer: plant). Have the first student send the carbon atom (pass or toss the ball) to the next student in the cycle.
Lesson Variation: Have students toss a ball of yarn in order to visual-ize the path of carbon in the carbon cycle. Each student should hold onto his/her piece of the yarn before passing the ball of yarn on to the next person.
Ask the student who has just caught 8. the ball where it might go next. (Carbon could be released back to the
atmosphere during respiration, or it may be eaten by an animal, or it may become a fossil fuel after being buried for millions of years.) Have the student toss the ball to an appropriate person to keep the cycle going.Tell students that no one can get the 9. ball twice before everyone has received it once. Continue play until the carbon has cycled through each student at least once. (Optional) To examine the effects of 10. deforestation, ask half of the students with PLANT cards to step out of the circle. Have the remaining students go through the carbon cycle again, noting the changes caused by loss of plants. Alternately, to examine the effects of reduced automobile use, ask half of the students with AUTOMOBILE cards to step out of the circle. Have the remaining students go through the carbon cycle again to examine how a reduction in automobiles affects the carbon cycle. Answer and discuss the following 11. reflection questions.
Reflection
How do you think the carbon cycle is 1. affected by deforestation?
T H E C A R B O N L I N K15
climate ch
ang
eHow will the carbon cycle be affected 2. by reduced automobile and/or fossil fuel use?What do you think will happen to the 3. carbon stored in fossil fuels as the world population increases? In your opinion, why would increased population create this change in the carbon cycle?As we burn more fossil fuels, the carbon 4. cycle gets out of balance; more and more carbon is added to our atmosphere as carbon dioxide. What are some things that you could do to keep the carbon cycle more balanced, so that less carbon dioxide is added to our atmosphere?
Activity Part 2— Greenhouse EffectIntroduction
Tell students that they will now 1. explore the greenhouse effect, which is heavily influenced by changes to carbon emissions in the atmosphere. An important greenhouse gas is carbon dioxide; it causes Earth’s surface temperatures to rise and it remains in the atmosphere for a long time (up to 200 years).Ask students to recall how it feels to 2. get into a car that has been sitting in the sun all day. This is very similar
to Earth’s greenhouse effect, which keeps temperatures warm enough to support life on Earth. (This is a good time to point out that the greenhouse effect itself is beneficial. Without the greenhouse effect, our planet would be too cold for many organisms to survive. However, the enhancement of the greenhouse effect through activities that add greenhouse gases to the atmosphere is a concern for all living things.)
Steps
Place 2 thermometers next to each 1. other in a sunny spot, such as a window sill or outside on a sidewalk (or under a heat lamp in the classroom). Cover 1 thermometer with a glass container by either turning the container upside-down or covering the top with plastic wrap so there is no exchange between the air in the container and the air outside the container. All variables other than the glass container should be controlled (i.e., thermometers subjected to identical conditions).Ask 2 students to read the temperatures 2. shown on the thermometers at the beginning of the demonstration.Wait 5 minutes for the heat to warm the 3. thermometer. While you are waiting, ask students to predict what will happen to the temperature inside and outside
16
faci
ng
th
e fu
ture
T H E C A R B O N L I N K
of the glass container. Ask students to articulate why they think this will happen.Ask students to name the atoms found 4. in carbon dioxide (answer: 1 carbon atom and 2 oxygen atoms). Can anyone name a component of the carbon cycle that includes carbon dioxide?Ask if anyone has heard of a 5. “greenhouse gas.” One major greenhouse gas is carbon dioxide. (Others include water vapor, nitrous oxide, and methane). Can anyone recall how the amount of carbon, in the form of carbon dioxide, can increase in Earth’s atmosphere?Have 2 different students read 6. the temperatures shown on the thermometers after 5 or more minutes. What has happened? If they are not the same temperature, which one is higher and why? Explain to students that what happened 7. in the glass container is similar to Earth’s greenhouse effect. Greenhouse gases like carbon dioxide (along with methane, nitrous oxide, and water vapor) trap heat from the sun near Earth’s surface, similar to the way the glass trapped the heated air.
Note: The process demonstrated in the glass container is not identi-cal to the greenhouse effect. While
greenhouse gases absorb and reemit heat radiating from Earth’s surface, the glass keeps the heated air from escaping.)
Reflection
How does increasing the amount of 1. carbon dioxide in Earth’s atmosphere affect temperatures on Earth?If temperatures on Earth rise due to 2. increased greenhouse gases, how might human health be affected? (For example, how would the spread of diseases change with warmer temperatures?)In what ways could increased 3. temperatures on Earth be harmful for living organisms? Give specific examples of species you think will be negatively affected by warmer temperatures.Could increased temperatures on Earth 4. be beneficial for some organisms, including humans? Give examples of ways that higher temperatures could improve living conditions for certain organisms.
Writing Extension
Write a paragraph in first person describ-ing the carbon cycle from the point-of-view of a carbon atom. List the places you travel and how you move from one place to the next until you return to where you started.
T H E C A R B O N L I N K17
climate ch
ang
e
Additional ResourcesVideo
Climate Connections, a partnership •between National Public Radio (NPR) and National Geographic, features Robert Krulwich’s 5-part cartoon series, Global Warming: It’s All About Carbon. These 5 short films explain in simple yet humorous ways the role of carbon in climate change. http://www.npr.org/news/specials/climate/video/
Websites
http://www.climateclassroom.org• —National Wildlife Federation has put together an online Climate Classroom. Here, you can download their excel-lent slideshow, “What’s Up with Global Warming?” http://www.windows.ucar.edu/tour/•link=/earth/Water/co2_cycle.html—The Windows to the Universe site is a project of the University Corpora-tion for Atmospheric Research. Here you will find elementary, intermediate, and advanced readings (in English and Spanish) about the carbon cycle and a link to The Carbon Cycle Game, an interactive activity where students can travel throughout the carbon cycle as a carbon atom.
http://epa.gov/climatechange/kids/ •—U.S. Environmental Protection Agency’s (EPA) Climate Change Kids Site includes interactive climate anima-tions, an explanation of the difference between weather and climate, and ideas for reducing our climate impacts.www.whrc.org/carbon/index.htm• —Woods Hole Research Center pro-vides an explanation of the global carbon cycle, including annual global carbon flows per year.
Carbon Cycle Role Cards
ATMOSPHERE ATMOSPHERE
PLANT PLANT
ANIMAL ANIMAL
SOIL SOIL
PETROLEUM PETROLEUM
AUTOMOBILE AUTOMOBILE
COAL COAL
POWER PLANT POWER PLANT
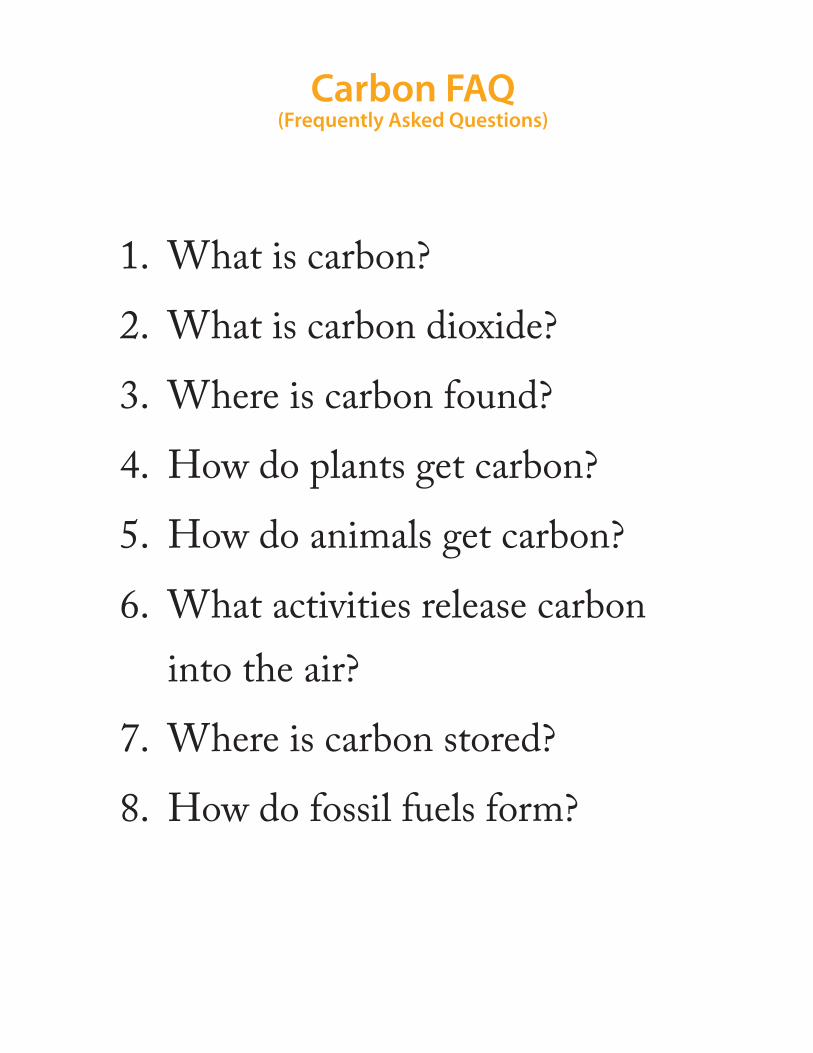
What is carbon?1.
What is carbon dioxide?2.
Where is carbon found?3.
How do plants get carbon?4.
How do animals get carbon?5.
What activities release carbon 6. into the air?
Where is carbon stored?7.
How do fossil fuels form?8.
Carbon FAQ (Frequently Asked Questions)
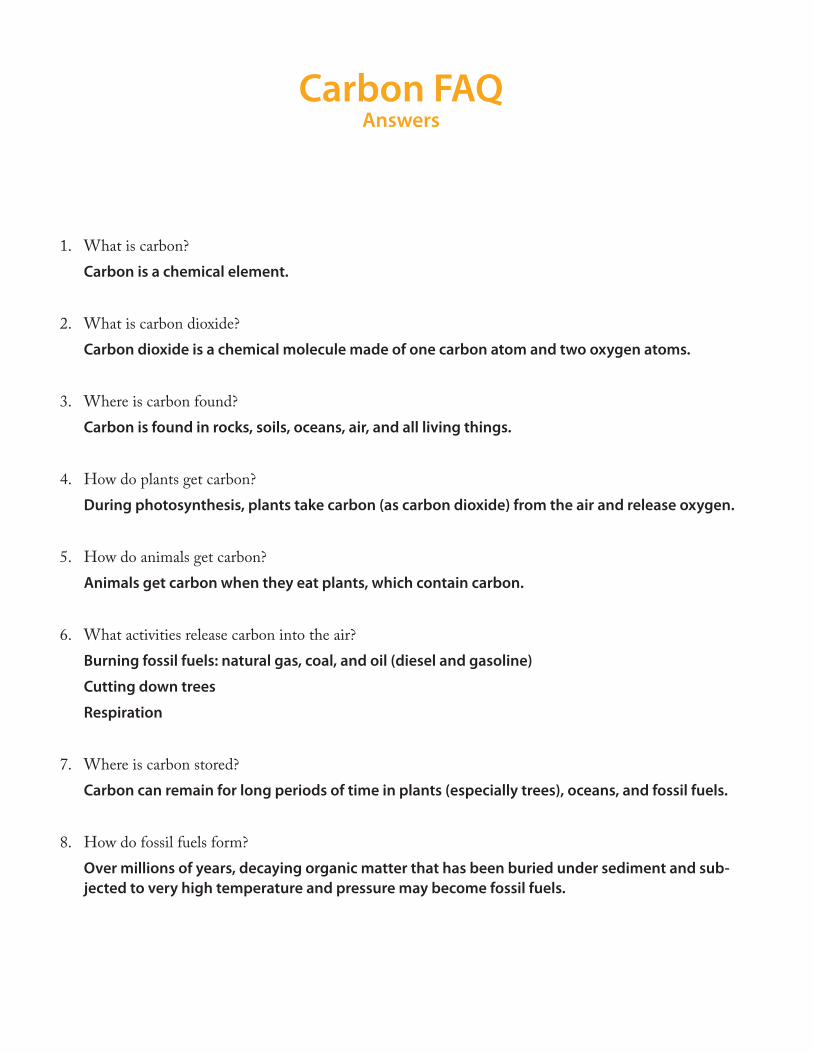
Carbon FAQ Answers
What is carbon?1. Carbon is a chemical element.
What is carbon dioxide?2. Carbon dioxide is a chemical molecule made of one carbon atom and two oxygen atoms.
Where is carbon found?3. Carbon is found in rocks, soils, oceans, air, and all living things.
How do plants get carbon?4. During photosynthesis, plants take carbon (as carbon dioxide) from the air and release oxygen.
How do animals get carbon?5. Animals get carbon when they eat plants, which contain carbon.
What activities release carbon into the air?6. Burning fossil fuels: natural gas, coal, and oil (diesel and gasoline)
Cutting down trees
Respiration
Where is carbon stored?7. Carbon can remain for long periods of time in plants (especially trees), oceans, and fossil fuels.
How do fossil fuels form?8. Over millions of years, decaying organic matter that has been buried under sediment and sub-jected to very high temperature and pressure may become fossil fuels.
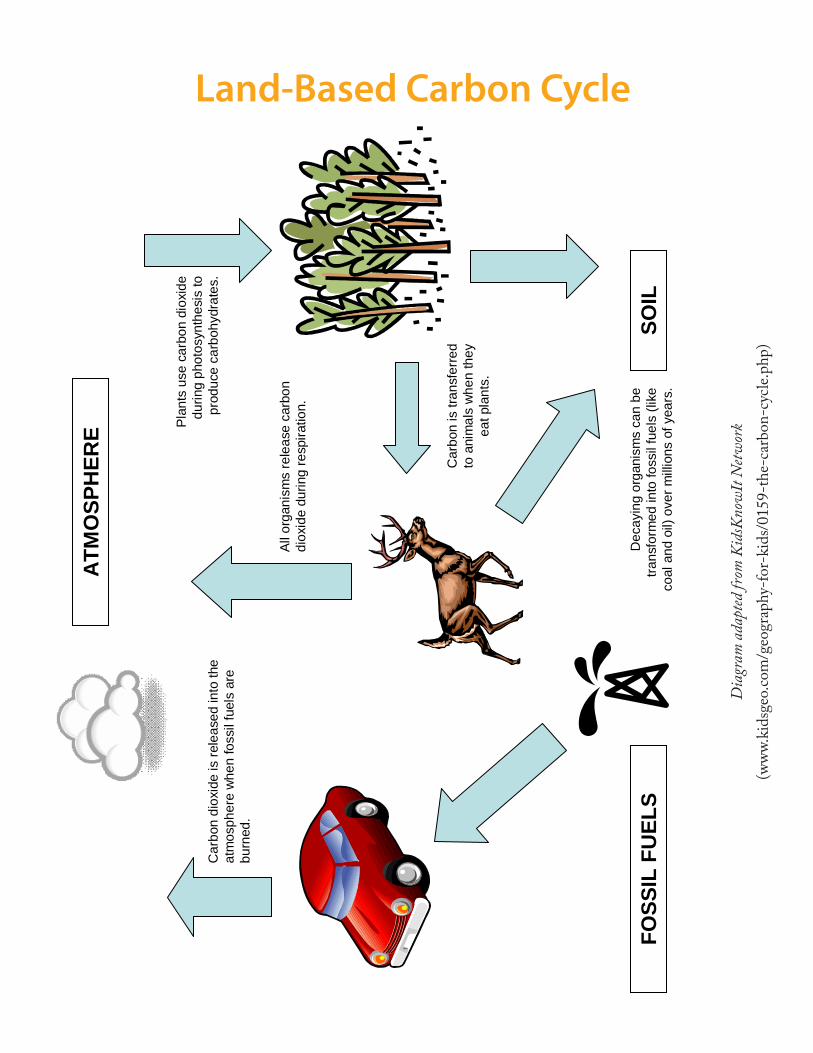
Land-Based Carbon Cycle
Dia
gram
ada
pted
from
Kid
sKno
wIt
Netw
ork
(www
.kid
sgeo
.com
/geo
grap
hy-f
or-k
ids/
0159
-the
-car
bon-
cycle
.php
)
Car
bon
diox
ide
is re
leas
ed in
to th
e at
mos
pher
e w
hen
foss
il fu
els
are
burn
ed.
Plan
ts u
se c
arbo
n di
oxid
e du
ring
phot
osyn
thes
is to
pr
oduc
e ca
rboh
ydra
tes.
All o
rgan
ism
s re
leas
e ca
rbon
di
oxid
e du
ring
resp
iratio
n.
Dec
ayin
g or
gani
sms
can
be
trans
form
ed in
to fo
ssil
fuel
s (li
ke
coal
and
oil)
ove
r mill
ions
of y
ears
.
Car
bon
is tr
ansf
erre
d to
ani
mal
s w
hen
they
ea
t pla
nts.
ATM
OSP
HER
E
SOIL
FOSS
IL F
UEL
S
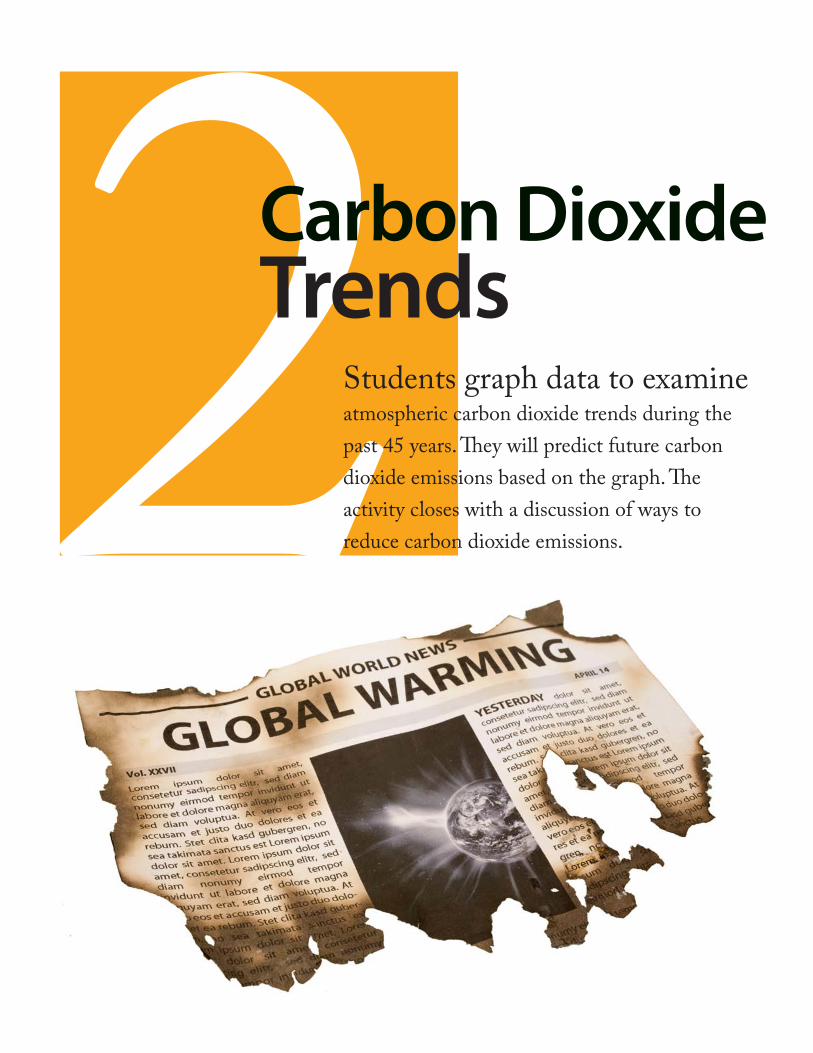
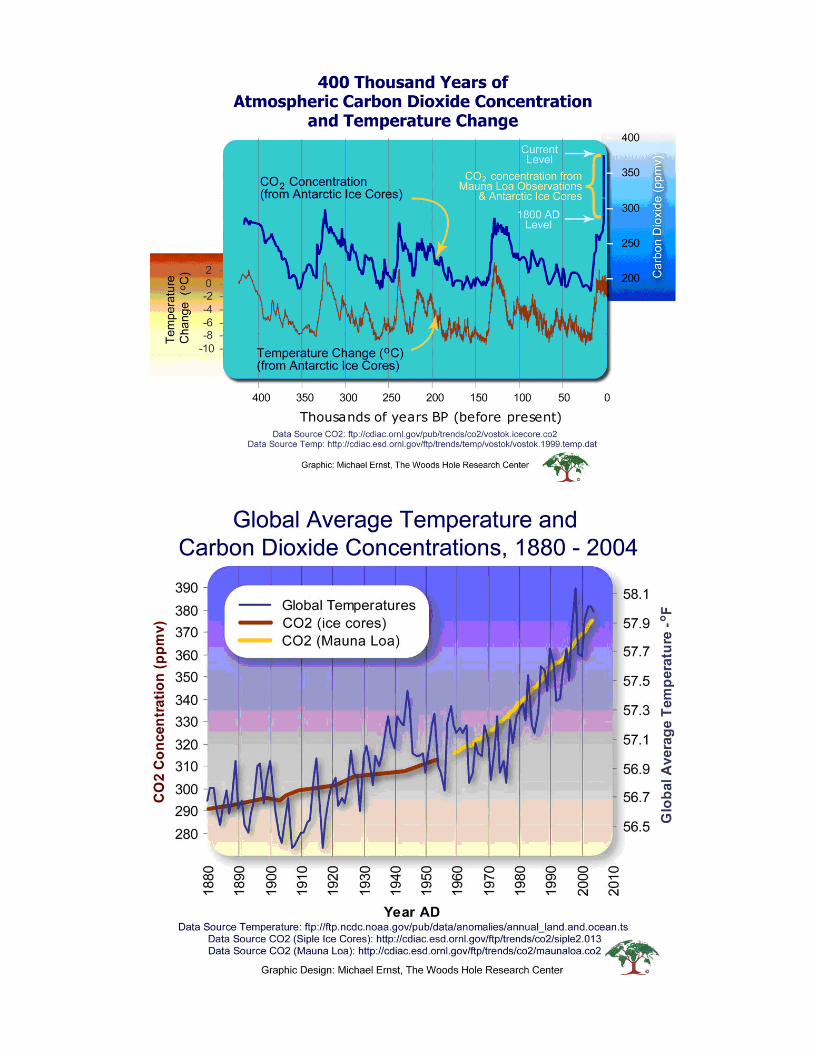
2Students graph data to examine atmospheric carbon dioxide trends during the past 45 years. They will predict future carbon dioxide emissions based on the graph. The activity closes with a discussion of ways to reduce carbon dioxide emissions.
Carbon Dioxide Trends
23clim
ate chan
ge
Inquiry/Critical Thinking Questions
What are some activities that emit car-•bon dioxide into Earth’s atmosphere?What have been the trends in atmo-•spheric carbon dioxide levels in the past 45 years?How is carbon dioxide related to tem-•peratures on Earth?How can we reduce future carbon diox-•ide emissions?
Objectives
Students will:Identify processes that contribute to •carbon dioxide emissionsGraph annual carbon dioxide emissions•Predict future carbon dioxide trends•Brainstorm ways to reduce carbon diox-•ide emissions
Time Required
50 minutes
Key Concepts
Carbon dioxide emissions•Historic temperature and carbon diox-•ide trends
Subject Areas
Science (Life, Environmental, Physical, •Earth)Mathematics•
National Standards Alignment
National Science Education Standards (NSES)
Standard A: Science as Inquiry •Standard C: Life Science•Standard D: Earth and Space Science •Standard F: Science in Personal and •Social Perspectives
Materials/Preparation
Graph paper, 1 sheet per student pair•Handout: CO• 2 Dataset, 1 per student pair(Optional) Overhead: Long-term Car-•bon Dioxide and Temperature Trends
C A R B O N D I OX I D E T R E N D S
24
faci
ng
th
e fu
ture
ActivityIntroduction
Ask students if they can name which 1. gases are involved in the greenhouse effect (water vapor, carbon dioxide, methane, and nitrous oxide, along with some man-made gases). Tell students that today they will be exploring trends in carbon dioxide emissions. Carbon dioxide (CO2) is an important greenhouse gas that occurs naturally but can be enhanced by human activities.Ask students if they can name some 2. activities, human or otherwise, that might add carbon dioxide to our atmosphere. (Burning fossil fuels, cutting trees, burning wood, and cellular respiration all release CO2.)
Steps
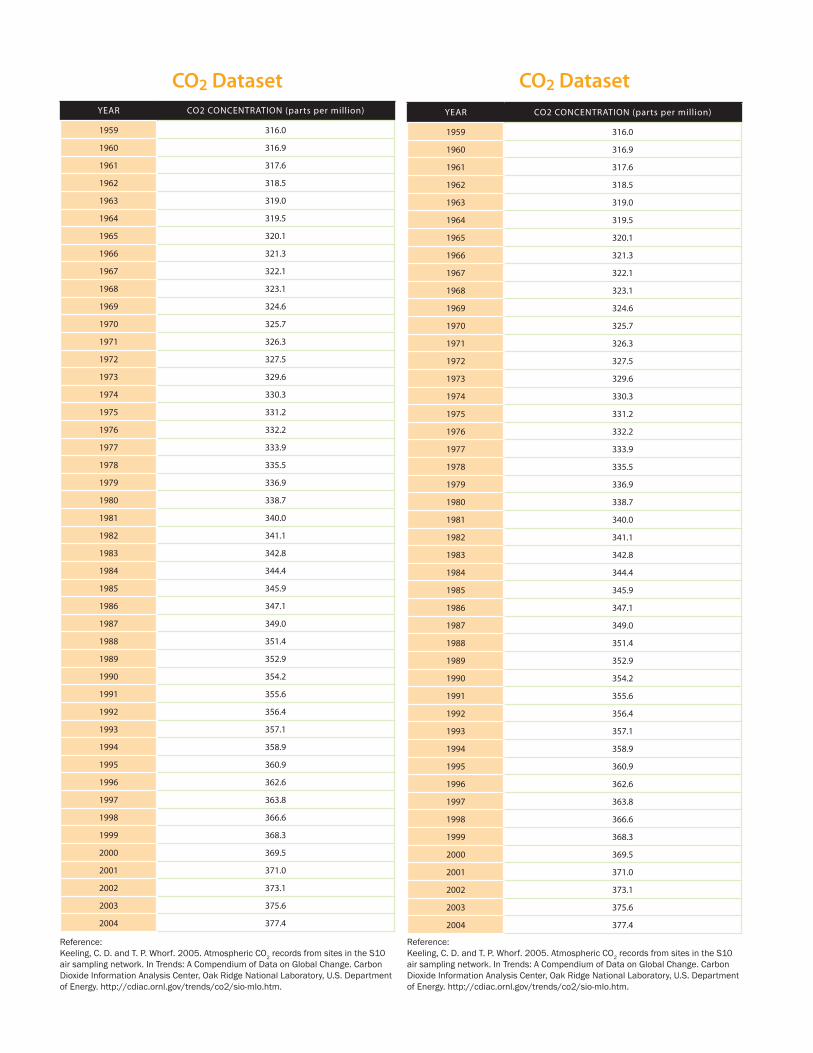
Divide the class into pairs. 1. Give each pair 1 sheet of graph paper 2. and 1 CO2 dataset.
Note: This dataset from the Mauna Loa Observatory is the most complete and accurate CO2 dataset in the world. CO2 is measured in parts per million; 316 parts per million means that for every 1 million particles in the atmosphere, 316 of those are carbon dioxide molecules.)
Have students make a line graph from 3. the data. (Year should be on the x-axis, CO2 emissions on the y-axis. The scale should be appropriate for the data.)
Students can use a computer graphing program as an alternative to graphing by hand.
Lesson Variation: To shorten the graph-ing activity, have students only graph odd- or even-numbered years.
After graphing the data, ask students to 4. predict the carbon dioxide concentration for the year 2020 and draw a star to represent that number on their graph.(Optional) Once students have finished 5. graphing, display and discuss 1 or both graphs of long-term CO2 and temperature trends. (Both graphs incorporate the data from Mauna Loa that the students just graphed.) Ask students to describe the relationship between CO2 and temperature.Bring the class together for a discussion 6. using the following reflection questions.
Reflection
Based on the data shown on your 1. graph, what do you think the CO2 concentration will be in the year 2020? Why do you think CO2. 2 levels have continued to rise during the past 45 years?What types of activities might raise 3. CO2 levels even faster?
C A R B O N D I OX I D E T R E N D S25
climate ch
ang
eHow do you think increasing CO4. 2 will affect Earth’s climate? Predict how your life will be different if this change occurs.What types of actions can we take to 5. lower our CO2 emissions?
History Extension
For the years 1880-2000, assign stu-dents a particular 10-20 year period (e.g., 1900-1910). Have students, either individu-ally or in small groups, research trends in industry, technology, and politics during their assigned time period to examine what specific activities might have contributed to climate change during that period.
Additional ResourcesVideo
“The One Degree Factor,” Episode 2 of the Strange Days on Planet Earth series, Na-tional Geographic, 2005, http://www.pbs.org/strangedays. This 60-minute episode narrated by Edward Norton explores the impact that climate change has on our lives and what we can do to slow rising tempera-tures.
Websites
http://www.climatehotmap.org• —Global Warming: Early Warning Signs is a world map showing regional effects of climate change. Information was compiled by the Union of Concerned Scientists. Impacts shown are based on the latest scientific findings. http://www.whrc.org/resources/ •online_publications/warming_earth/index.htm—The Warming of the Earth: A Beginner’s Guide to Understand-ing the Issue of Global Warming is an online publication by the Woods Hole Research Center explaining the green-house effect, scientific evidence, causes, and potential outcomes.
YEAR CO2 CONCENTRATION (parts per million)
1959 316.0
1960 316.9
1961 317.6
1962 318.5
1963 319.0
1964 319.5
1965 320.1
1966 321.3
1967 322.1
1968 323.1
1969 324.6
1970 325.7
1971 326.3
1972 327.5
1973 329.6
1974 330.3
1975 331.2
1976 332.2
1977 333.9
1978 335.5
1979 336.9
1980 338.7
1981 340.0
1982 341.1
1983 342.8
1984 344.4
1985 345.9
1986 347.1
1987 349.0
1988 351.4
1989 352.9
1990 354.2
1991 355.6
1992 356.4
1993 357.1
1994 358.9
1995 360.9
1996 362.6
1997 363.8
1998 366.6
1999 368.3
2000 369.5
2001 371.0
2002 373.1
2003 375.6
2004 377.4
CO2 Dataset CO2 DatasetYEAR CO2 CONCENTRATION (parts per million)
1959 316.0
1960 316.9
1961 317.6
1962 318.5
1963 319.0
1964 319.5
1965 320.1
1966 321.3
1967 322.1
1968 323.1
1969 324.6
1970 325.7
1971 326.3
1972 327.5
1973 329.6
1974 330.3
1975 331.2
1976 332.2
1977 333.9
1978 335.5
1979 336.9
1980 338.7
1981 340.0
1982 341.1
1983 342.8
1984 344.4
1985 345.9
1986 347.1
1987 349.0
1988 351.4
1989 352.9
1990 354.2
1991 355.6
1992 356.4
1993 357.1
1994 358.9
1995 360.9
1996 362.6
1997 363.8
1998 366.6
1999 368.3
2000 369.5
2001 371.0
2002 373.1
2003 375.6
2004 377.4
Reference:Keeling, C. D. and T. P. Whorf. 2005. Atmospheric CO2 records from sites in the S10 air sampling network. In Trends: A Compendium of Data on Global Change. Carbon Dioxide Information Analysis Center, Oak Ridge National Laboratory, U.S. Department of Energy. http://cdiac.ornl.gov/trends/co2/sio-mlo.htm.
Reference:Keeling, C. D. and T. P. Whorf. 2005. Atmospheric CO2 records from sites in the S10 air sampling network. In Trends: A Compendium of Data on Global Change. Carbon Dioxide Information Analysis Center, Oak Ridge National Laboratory, U.S. Department of Energy. http://cdiac.ornl.gov/trends/co2/sio-mlo.htm.
3In small groups, students learn about potential impacts of climate change on living things in a variety of ecosystems. Students communicate these impacts to the class through skits.
Effects of Climate Change on Living Things
Adapted from “Communities of Living Things” by Elizabeth K. Andre, Will Steger Foundation
29clim
ate chan
ge
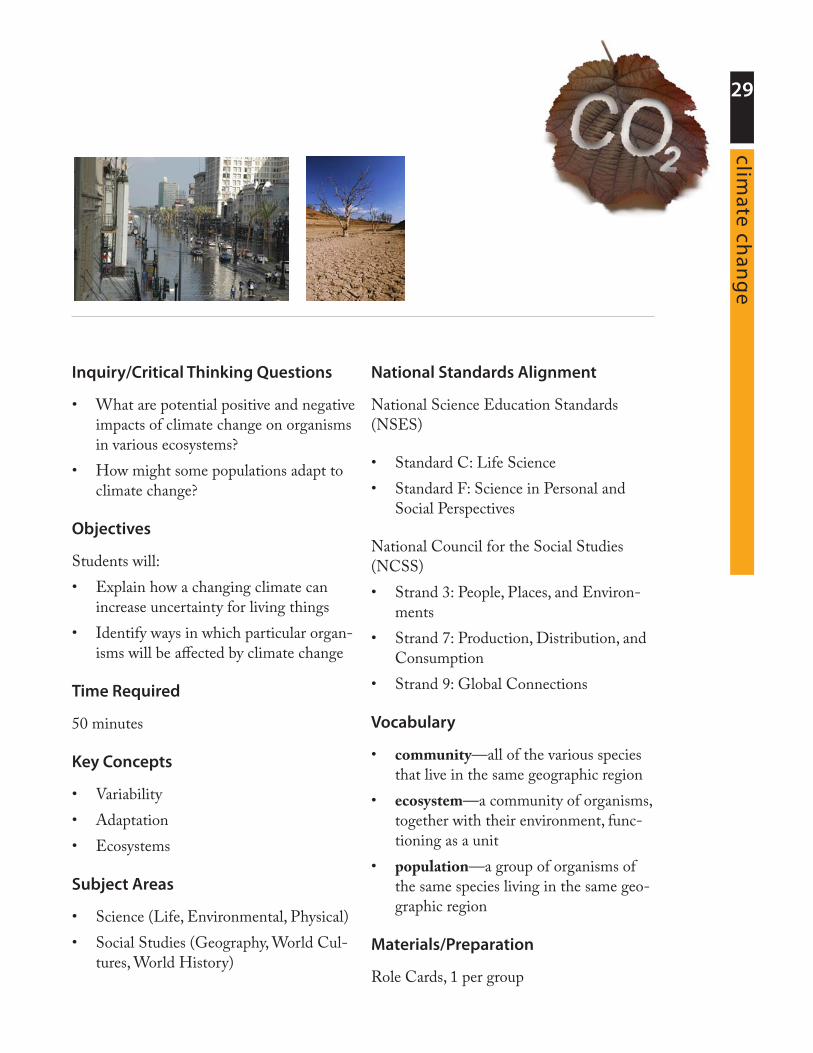
Inquiry/Critical Thinking Questions
What are potential positive and negative •impacts of climate change on organisms in various ecosystems?How might some populations adapt to •climate change?
Objectives
Students will: Explain how a changing climate can •increase uncertainty for living thingsIdentify ways in which particular organ-•isms will be affected by climate change
Time Required
50 minutes
Key Concepts
Variability•Adaptation•Ecosystems•
Subject Areas
Science (Life, Environmental, Physical)•Social Studies (Geography, World Cul-•tures, World History)
National Standards Alignment
National Science Education Standards (NSES)
Standard C: Life Science •Standard F: Science in Personal and •Social Perspectives
National Council for the Social Studies (NCSS)
Strand 3: People, Places, and Environ-•mentsStrand 7: Production, Distribution, and •ConsumptionStrand 9: Global Connections•
Vocabulary
community• —all of the various species that live in the same geographic regionecosystem• —a community of organisms, together with their environment, func-tioning as a unitpopulation• —a group of organisms of the same species living in the same geo-graphic region
Materials/Preparation
Role Cards, 1 per group
E F F E C T S O F C L I M AT E C H A N G E O N L I V I N G T H I N G S
30
faci
ng
th
e fu
ture
ActivityIntroduction
Ask students to define an ecosystem. 1. An ecosystem includes all of the populations of different species that live together in the same area (a community), as well as the nonliving components of their environment.Ask for examples of ecosystems that 2. students have seen or heard about (e.g., coral reefs, hardwood forests, Arctic tundra). Tell them that they will be exploring how climate change can affect living things in ecosystems around the world. They will be creating and performing skits to educate other classmates about ways in which particular organisms are sensitive to climate change.
Steps
Divide students into 6 groups. Give 1. each group a Role Card. If students do not know the geographic 2. location of their ecosystem, help them to find it on a world map.Have students take turns reading aloud 3. sections of their passage to the rest of their group. Have each group discuss the impacts 4. described in their passages and then plan a skit to illustrate these impacts. Skits should be a maximum of 3 minutes long. Give students about 5 minutes to plan their skits. Let them
know in advance that skits do not need to be “polished.” They should be impromptu, quick-moving, and fun. Remind students that skits should respect other members of the class, as well as the living beings portrayed in the skits.Reconvene the entire class. Allow 5. groups to present their skits one at a time. After each group’s skit, ask audience members what they learned from the skit. If students did not understand the skit, ask 1 member of the group to explain the impacts they were portraying, including specific examples from their Role Card.
Reflection
What areas of Earth do you think are 1. most vulnerable to climate change? Why are these areas more sensitive to climate change than other regions?In what ways might some people benefit 2. from climate change?Which effects of climate change that 3. you learned about today will have the greatest effect on Earth’s ecosystems? Give reasoning to support your answer. What are some other living organisms 4. that may be affected by changes in the ecosystem that your group studied? In what ways might they be affected?
E F F E C T S O F C L I M AT E C H A N G E O N L I V I N G T H I N G S31
climate ch
ang
eHow might the ecosystem you live in 5. change if global temperatures rise? How would your ecosystem be affected by rising sea levels?
Art Extension
Have each group create a poster that il-lustrates the impacts from their Ecosystem Role Card. Put posters in visible locations around the school to share this information with other students and teachers.
Action Project
Have students write their own ecosystem impact cards. They can research particular populations or communities in the ecosys-tem where they live, or ecosystems else-where in the world. Students can publish their information about impacts of climate change on various ecosystems as a school newspaper article, a podcast, or an online news article.
Additional ResourcesFilm
Silent Sentinels, directed by Richard Smith, produced by the Australian Broadcasting Corporation, 1999, 57 minutes, http://www.bullfrogfilms.com/catalog/sil.html. This documentary film takes a broad look at coral reefs and how the coral organism has coped with climate change over time.
Websites
http://www.ipcc-wg2.org/• —The Work-ing Group II Report from the Intergov-ernmental Panel on Climate Change provides an in-depth assessment of specific impacts of climate change on populations around the world. http://amap.no/acia/• —The scientific report, Impacts of a Warming Arctic, can be downloaded from the Arctic Cli-mate Impact Assessment website. This report details the impacts of a warming climate on Arctic ecosystems.
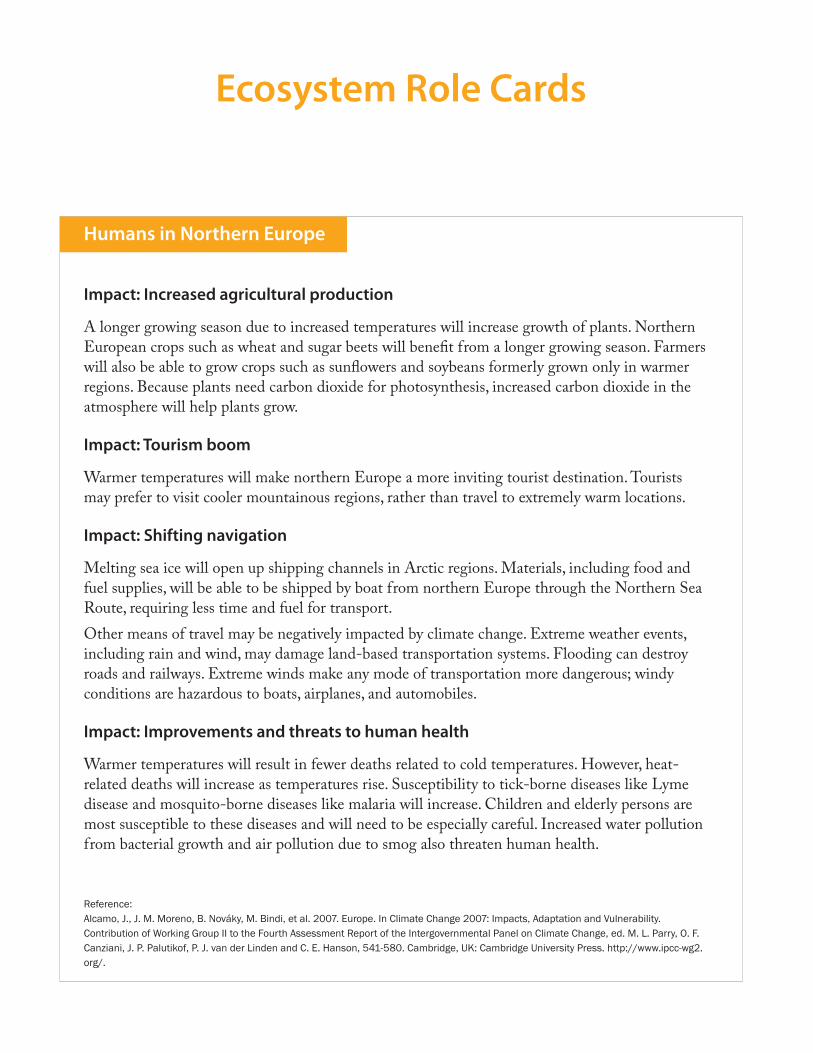
Impact: Increased agricultural production
A longer growing season due to increased temperatures will increase growth of plants. Northern European crops such as wheat and sugar beets will benefit from a longer growing season. Farmers will also be able to grow crops such as sunflowers and soybeans formerly grown only in warmer regions. Because plants need carbon dioxide for photosynthesis, increased carbon dioxide in the atmosphere will help plants grow.
Impact: Tourism boom
Warmer temperatures will make northern Europe a more inviting tourist destination. Tourists may prefer to visit cooler mountainous regions, rather than travel to extremely warm locations.
Impact: Shifting navigation
Melting sea ice will open up shipping channels in Arctic regions. Materials, including food and fuel supplies, will be able to be shipped by boat from northern Europe through the Northern Sea Route, requiring less time and fuel for transport.Other means of travel may be negatively impacted by climate change. Extreme weather events, including rain and wind, may damage land-based transportation systems. Flooding can destroy roads and railways. Extreme winds make any mode of transportation more dangerous; windy conditions are hazardous to boats, airplanes, and automobiles.
Impact: Improvements and threats to human health
Warmer temperatures will result in fewer deaths related to cold temperatures. However, heat-related deaths will increase as temperatures rise. Susceptibility to tick-borne diseases like Lyme disease and mosquito-borne diseases like malaria will increase. Children and elderly persons are most susceptible to these diseases and will need to be especially careful. Increased water pollution from bacterial growth and air pollution due to smog also threaten human health.
Reference:Alcamo, J., J. M. Moreno, B. Nováky, M. Bindi, et al. 2007. Europe. In Climate Change 2007: Impacts, Adaptation and Vulnerability. Contribution of Working Group II to the Fourth Assessment Report of the Intergovernmental Panel on Climate Change, ed. M. L. Parry, O. F. Canziani, J. P. Palutikof, P. J. van der Linden and C. E. Hanson, 541-580. Cambridge, UK: Cambridge University Press. http://www.ipcc-wg2.org/.
Humans in Northern Europe
Ecosystem Role Cards
Polar Bears
Ecosystem Role Cards
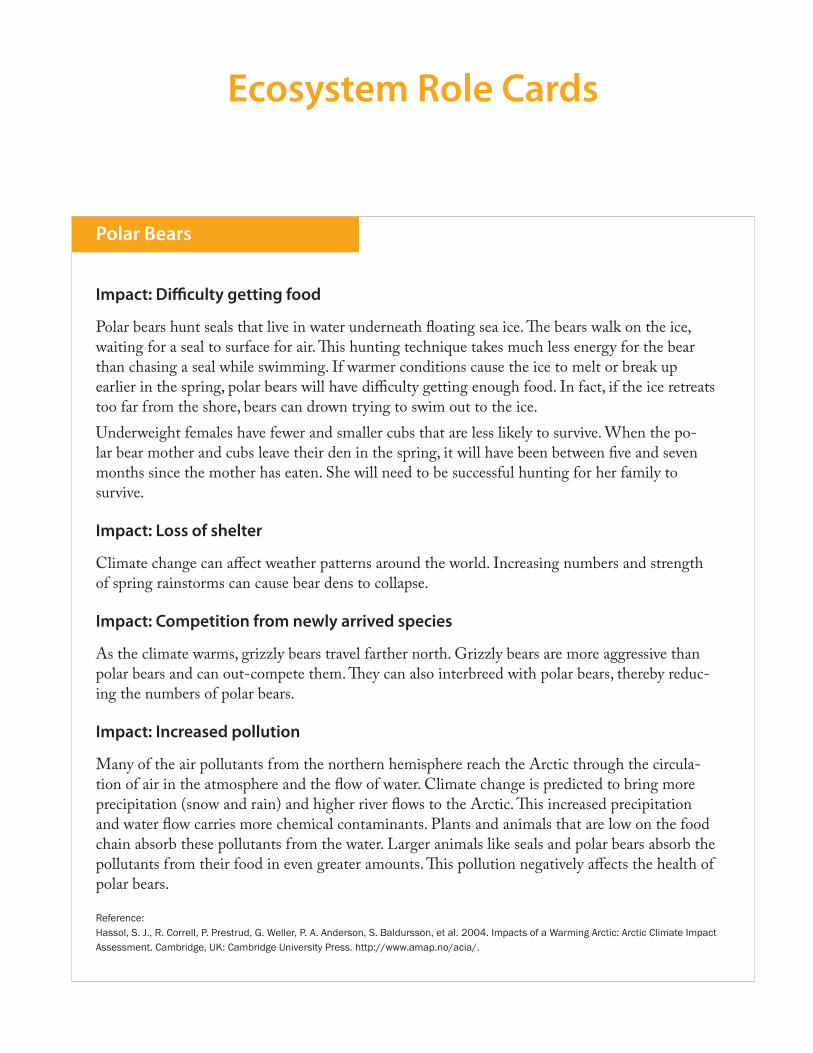
Impact: Difficulty getting food
Polar bears hunt seals that live in water underneath floating sea ice. The bears walk on the ice, waiting for a seal to surface for air. This hunting technique takes much less energy for the bear than chasing a seal while swimming. If warmer conditions cause the ice to melt or break up earlier in the spring, polar bears will have difficulty getting enough food. In fact, if the ice retreats too far from the shore, bears can drown trying to swim out to the ice.Underweight females have fewer and smaller cubs that are less likely to survive. When the po-lar bear mother and cubs leave their den in the spring, it will have been between five and seven months since the mother has eaten. She will need to be successful hunting for her family to survive.
Impact: Loss of shelter
Climate change can affect weather patterns around the world. Increasing numbers and strength of spring rainstorms can cause bear dens to collapse.
Impact: Competition from newly arrived species
As the climate warms, grizzly bears travel farther north. Grizzly bears are more aggressive than polar bears and can out-compete them. They can also interbreed with polar bears, thereby reduc-ing the numbers of polar bears.
Impact: Increased pollution
Many of the air pollutants from the northern hemisphere reach the Arctic through the circula-tion of air in the atmosphere and the flow of water. Climate change is predicted to bring more precipitation (snow and rain) and higher river flows to the Arctic. This increased precipitation and water flow carries more chemical contaminants. Plants and animals that are low on the food chain absorb these pollutants from the water. Larger animals like seals and polar bears absorb the pollutants from their food in even greater amounts. This pollution negatively affects the health of polar bears.
Reference: Hassol, S. J., R. Correll, P. Prestrud, G. Weller, P. A. Anderson, S. Baldursson, et al. 2004. Impacts of a Warming Arctic: Arctic Climate Impact Assessment. Cambridge, UK: Cambridge University Press. http://www.amap.no/acia/.
Australian Sea Turtles
Ecosystem Role Cards
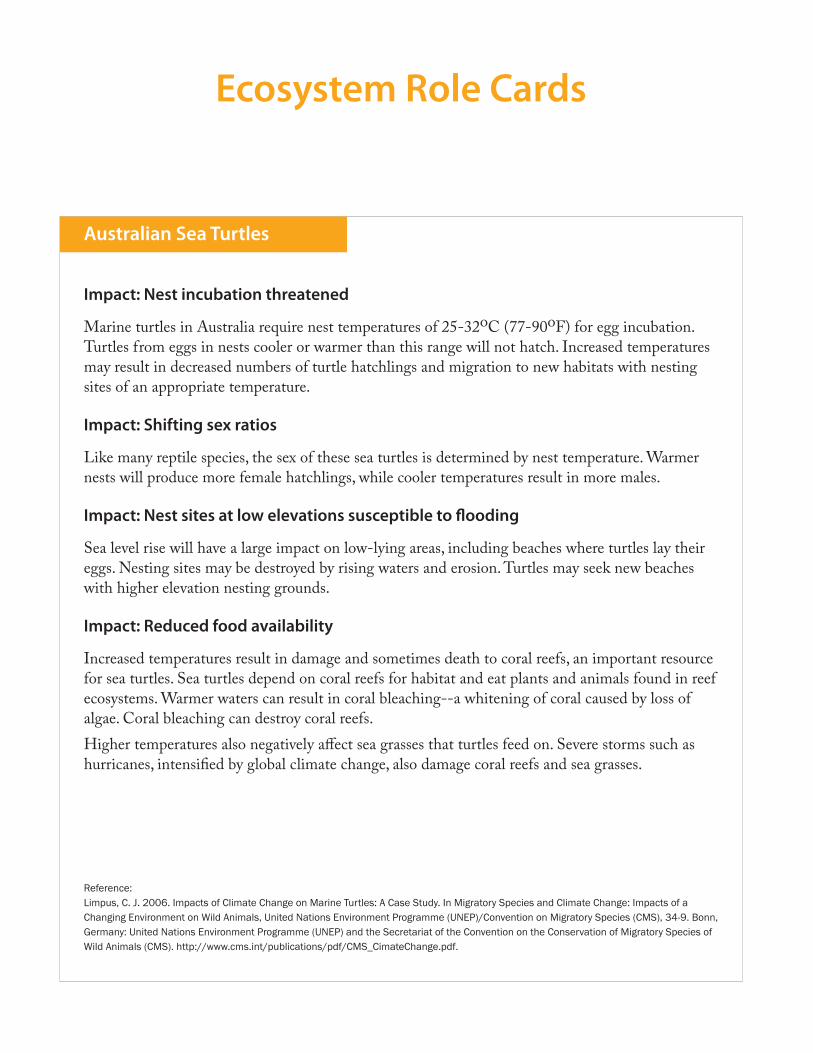
Impact: Nest incubation threatened
Marine turtles in Australia require nest temperatures of 25-32oC (77-90oF) for egg incubation. Turtles from eggs in nests cooler or warmer than this range will not hatch. Increased temperatures may result in decreased numbers of turtle hatchlings and migration to new habitats with nesting sites of an appropriate temperature.
Impact: Shifting sex ratios
Like many reptile species, the sex of these sea turtles is determined by nest temperature. Warmer nests will produce more female hatchlings, while cooler temperatures result in more males.
Impact: Nest sites at low elevations susceptible to flooding
Sea level rise will have a large impact on low-lying areas, including beaches where turtles lay their eggs. Nesting sites may be destroyed by rising waters and erosion. Turtles may seek new beaches with higher elevation nesting grounds.
Impact: Reduced food availability
Increased temperatures result in damage and sometimes death to coral reefs, an important resource for sea turtles. Sea turtles depend on coral reefs for habitat and eat plants and animals found in reef ecosystems. Warmer waters can result in coral bleaching--a whitening of coral caused by loss of algae. Coral bleaching can destroy coral reefs. Higher temperatures also negatively affect sea grasses that turtles feed on. Severe storms such as hurricanes, intensified by global climate change, also damage coral reefs and sea grasses.
Reference:Limpus, C. J. 2006. Impacts of Climate Change on Marine Turtles: A Case Study. In Migratory Species and Climate Change: Impacts of a Changing Environment on Wild Animals, United Nations Environment Programme (UNEP)/Convention on Migratory Species (CMS), 34-9. Bonn, Germany: United Nations Environment Programme (UNEP) and the Secretariat of the Convention on the Conservation of Migratory Species of Wild Animals (CMS). http://www.cms.int/publications/pdf/CMS_CimateChange.pdf.
Humans in the Arctic
Ecosystem Role Cards
Impact: Diminishing food supplies and cultural resources
The Inuit people (Native people of the Arctic, formerly known as Eskimos) hunt caribou (deer relatives), which provide them with an affordable food source and help them survive the cold seasons. Caribou numbers have decreased, perhaps due to an inability to travel over melting snow and ice to reach food.In addition to using caribou for food, Inuit people also value caribou as an important part of their cultural identity.
Impact: Difficulty traveling
Many Inuit villages are accessible only by dogsled, snowmobile, or sometimes on roads over per-mafrost (permanently frozen ground). As snow- and ice-free periods get longer, travel by dogsled or snowmobile becomes difficult or even impossible. The permafrost is melting earlier in the spring, turning the roads into mud pits.
Impact: Erosion of coastal lands
Warmer ocean water and air can melt the permafrost that stabilizes coastal land and shorelines. This melting, combined with rising sea levels and shrinking shore ice and sea ice that once buff-ered the shore from stormy wave action, can make coastal buildings, pipelines, and roads fall into the ocean and flood low-lying areas, contaminating them with salt from the ocean.
Impact: Increased accessibility to ships
As the sea ice melts and breaks up, ocean that was previously locked in ice, and therefore impas-sible to most ships, will now be open to ships. For example, a cruise ship recently arrived and unloaded its passengers in Pangnirtung, a remote Inuit village in the Canadian Arctic that before was accessible only by air or dogsled.
Reference: Hassol, S. J., R. Correll, P. Prestrud, G. Weller, P. A. Anderson, S. Baldursson, et al. 2004. Impacts of a Warming Arctic: Arctic Climate Impact Assessment. Cambridge, UK: Cambridge University Press. http://www.amap.no/acia/.
Arctic Plants
Ecosystem Role Cards
Impact: Thawing permafrost and soil instability
Permafrost (permanently frozen ground) helps maintain soil stability. Permafrost supports the weight of buildings and roads. When it melts, trees can begin to fall over or sinkholes develop which can then fill with water and drown the trees standing there.
Impact: Possible desert-like conditions
Even though the total amount of precipitation (rain and snow) is projected to increase in the Arc-tic, precipitation may come at times of the year when plants do not need it, or it may come in ex-treme storms where most of it runs off to the rivers quickly. Also, as temperatures get warmer, more water will evaporate and plants will lose more water. This sends water back into the atmosphere. It is therefore possible that certain areas could dry out and become polar deserts.
Impact: Thriving pests
When winters are long and very cold and when summers are short, as they traditionally have been in the Arctic, numbers of pests like the spruce bark beetle do not grow out of control. However, warmer winters mean that more bark beetles will survive each year, and these beetles can kill spruce trees.Healthy spruce trees have natural defenses against bark beetle attacks. When a beetle tries to bore into the tree to lay her eggs, the tree can push sap out against the beetle to keep her from moving far enough into the tree to lay her eggs. When trees are stressed from dry conditions and warmer than normal temperatures, however, they do not have enough sap to fight the beetles.
Impact: Competition from foreign species
As temperatures warm, plant species begin to migrate and survive farther north, invading areas previously inhabited by Arctic species only. Many of the adaptations that allow Arctic species to survive in such cold conditions also limit their ability to compete with species that invade from other areas. For example, when the temperature gets above about 60ºF (16ºC), black spruce trees and white spruce trees are not able to grow as well. If temperatures get too hot, black and white spruce will not grow at all.
Reference: Hassol, S. J., R. Correll, P. Prestrud, G. Weller, P. A. Anderson, S. Baldursson, et al. 2004. Impacts of a Warming Arctic: Arctic Climate Impact Assessment. Cambridge, UK: Cambridge University Press. http://www.amap.no/acia/.
Humans on Small Pacific Islands
Ecosystem Role Cards
Impact: Coastal erosion
Many of these small islands are less than 4 meters (about 13 feet) above sea level. Sea levels have risen continually in the past century. Higher sea levels invade coastal habitat, which affects not only human settlements but also natural coastal ecosystems. Increased sea levels and saltwater intrusion onto these islands reduce mangrove tree populations. Mangrove roots protect coastlines from erosion, but as sea levels rise over time, mangroves mi-grate toward the land. If they eventually reach a sea wall or other barrier, they may be reduced to a narrow strip of trees or may disappear altogether.Impact: Reduced tourism
Algae living on coral reefs are sensitive to warmer water temperatures. If the water is too warm, they die, causing coral to appear white (this is called “coral bleaching”). Tourism from scuba div-ing will be reduced if coral reefs are damaged.
Impact: Reduced freshwater quality
Low-lying islands depend on rainfall and natural filters such as mangroves to maintain a clean supply of freshwater. Rising sea levels cause salt water to move farther inland, often contaminat-ing drinking water sources. Mangroves act as natural filters, preventing sediment and toxins from reaching island water sources. Reduction of mangrove habitat from rising sea levels would allow more sediments and pollutants to move inland, polluting fresh water sources.
Impact: Lack of food resources
Loss of mangrove and coral reef habitats means reduced food resources for islanders. Mangroves provide habitat for many types of seafood, including crabs, clams, and fish. Coral reefs likewise provide habitat for many fish.References:Gilman, E., H. Van Lavieren, J. Ellison, V. Jungblut, et al. 2006. Pacific Island Mangroves in a Changing Climate and Rising Sea: UNEP Regional Seas Reports and Studies No. 179. Nairobi, Kenya: United Nations Environment Programme (UNEP). http://www.unep.org/PDF/mangrove-report.pdf.Mimura, N., L. Nurse, R. F. McLean, J. Agard, et al. 2007. Small Islands. In Climate Change 2007: Impacts, Adaptation and Vulnerability. Contribution of Working Group II to the Fourth Assessment Report of the Intergovernmental Panel on Climate Change, ed. M. L. Parry, O. F. Canziani, J. P. Palutikof, P. J. van der Linden and C. E. Hanson, 687-716. Cambridge, UK: Cambridge University Press. http://www.ipcc-wg2.org/.
Solomon Islands, Papua New Guinea, American Samoa
4Students collect information about their daily lives to calculate their carbon footprint using an online carbon calculator. They compare their results to average carbon footprints around the world. Students also discover ways to decrease their carbon emissions.
My Carbon Footprint
39clim
ate chan
ge
Inquiry/Critical Thinking Questions
How do our lifestyles affect climate •change?What is a carbon footprint, and how is •it measured?What changes in our daily lives would •result in lower carbon emissions?
Objectives
Students will:Collect information about their daily •habits and lifestyleUse an online carbon calculator to •examine impacts of daily choices on carbon emissionsExplore ways to reduce their carbon •footprint
Time Required
50 minutes (plus prior data collection)
Key Concepts
Carbon footprint•Personal solutions•
Subject Areas
Science (Environmental, Life, Physical)•Social Studies (World History, U.S. •History, Global Studies)Mathematics•Technology•
National Standards Alignment
National Science Education Standards (NSES)
Standard A: Science as Inquiry•Standard C: Life Science•Standard D: Earth and Space Science•Standard F: Science in Personal and •Social Perspectives
National Council for the Social Studies (NCSS)
Strand 3: People, Places, and Environ-•mentsStrand 7: Production, Distribution, and •ConsumptionStrand 9: Global Connections•
M Y C A R B O N F O OT P R I N T
40
faci
ng
th
e fu
ture
Materials/Preparation
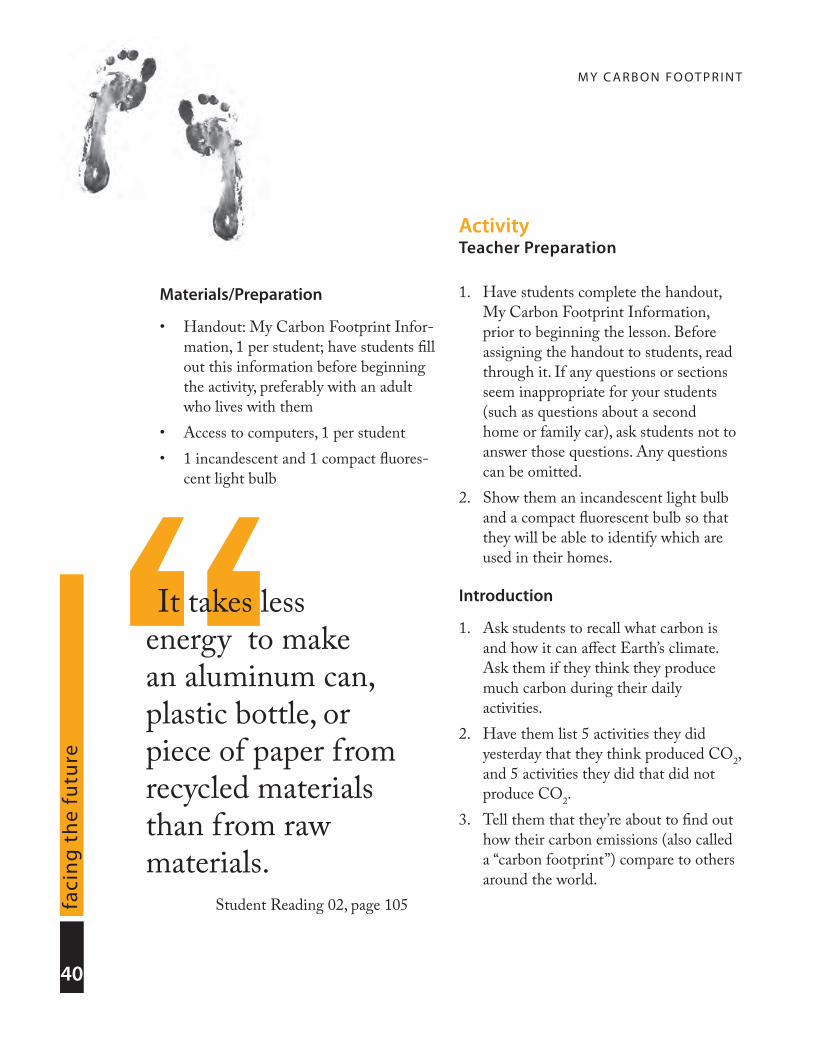
Handout: My Carbon Footprint Infor-•mation, 1 per student; have students fill out this information before beginning the activity, preferably with an adult who lives with themAccess to computers, 1 per student•1 incandescent and 1 compact fluores-•cent light bulb
ActivityTeacher Preparation
Have students complete the handout, 1. My Carbon Footprint Information, prior to beginning the lesson. Before assigning the handout to students, read through it. If any questions or sections seem inappropriate for your students (such as questions about a second home or family car), ask students not to answer those questions. Any questions can be omitted.Show them an incandescent light bulb 2. and a compact fluorescent bulb so that they will be able to identify which are used in their homes.
Introduction
Ask students to recall what carbon is 1. and how it can affect Earth’s climate. Ask them if they think they produce much carbon during their daily activities. Have them list 5 activities they did 2. yesterday that they think produced CO2, and 5 activities they did that did not produce CO2.Tell them that they’re about to find out 3. how their carbon emissions (also called a “carbon footprint”) compare to others around the world.
“It takes less energy to make an aluminum can, plastic bottle, or piece of paper from recycled materials than from raw materials.
Student Reading 02, page 105
M Y C A R B O N F O OT P R I N T41
climate ch
ang
eSteps
Have students enter their answers from 1. My Carbon Footprint Information on the carbon calculator at http://www.zerofootprintkids.com. This site will calculate students’ personal impact on the earth. Results are given in 4 units of measurement: carbon, land, water, and total footprint. Their results can be compared to average results for 11 countries. Students can also find out the approximate number of Earths we would need if everyone had their lifestyle.
Lesson Variation: For a more advanced calculator, use the U.S. EPA’s Personal Emissions Calculator: http://www.epa.gov/climatechange/wycd/calculator/ind_calculator.html.
Once students have completed step 1, 2. have them change their answers in the calculator, one at a time, to see how these changes will affect their carbon footprint. After everyone has had a chance to 3. make a few changes and see the results, conclude with the following reflection questions.
Reflection
How did your level of carbon emissions 1. compare to the average carbon emissions of people in other countries? Why do some people call our total 2. carbon emissions a “carbon footprint”?Which category (transportation, home 3. and school, what you eat, what you use, or what you throw away) do you think has the greatest effect on your carbon footprint? Why do you think it has the largest impact?What are some ways you can reduce 4. your carbon footprint? Which change is the easiest one to make? Will you try one of the things you learned from the carbon calculator? How can you help others in your 5. community to make similar changes to their carbon footprints?Many people think that shrinking our 6. footprint will improve our quality of life. How might we reduce our carbon emissions while improving our quality of life?
Communications Extension
Have students create a carbon footprint awareness campaign. They could make post-ers or write articles explaining how specific actions and lifestyle choices affect our car-bon footprint. They should also explain the
M Y C A R B O N F O OT P R I N T
42
faci
ng
th
e fu
ture
link between carbon and climate change. Knowing the size of our carbon footprint gives us an idea of how much we can im-pact Earth’s climate, and how much we can reduce this impact.
Mathematics Extension
Find out the average carbon footprint for your class. Have all students report on their total carbon footprint, as calculated by the Zerofootprint KidsCalculator. Use this data to find the mean, median, and mode for student carbon emissions (in tons of CO2/year).
Action Project
Using questions from the Zerofootprint KidsCalculator or another online carbon calculator, have students interview an adult who does not live in their house (e.g., a grandparent, a neighbor, a teacher). After the adult has answered the questions, the student can enter that information into an online calculator to find the adult’s carbon footprint. Next, have students develop spe-cific ideas for ways to reduce their inter-viewee’s carbon footprint. Lastly, students should present their footprint results and ideas for reducing that footprint to their interviewee.
Additional ResourcesWebsites
http://www.climateclassroom.org• —National Wildlife Federation’s Climate Classroom provides a “Family Action Plan for Global Warming,” including an action checklist with both small and large steps to help reduce your house-hold’s carbon footprint.http://www.nature.org/initiatives/•climatechange/calculator—The Nature Conservancy has a carbon calculator that starts with an average carbon foot-print and subtracts CO2 emissions for actions that reduce emissions.
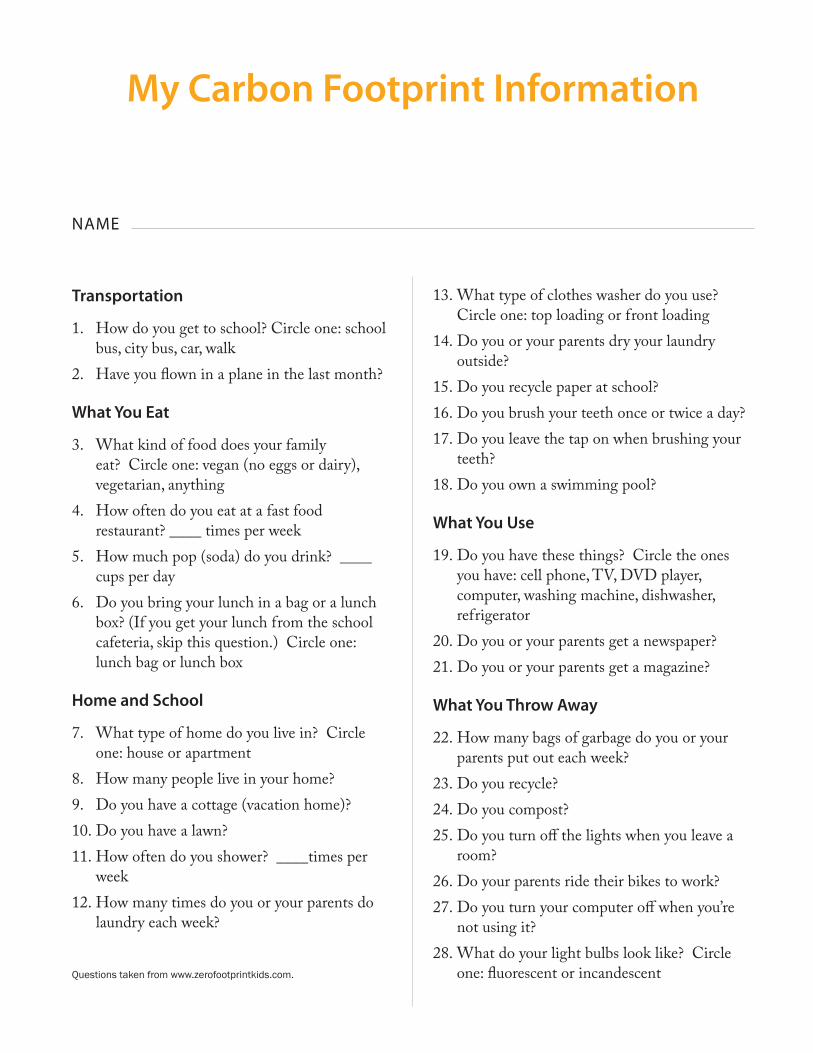
My Carbon Footprint Information
Transportation
How do you get to school? Circle one: school 1. bus, city bus, car, walkHave you flown in a plane in the last month? 2.
What You Eat
What kind of food does your family 3. eat? Circle one: vegan (no eggs or dairy), vegetarian, anythingHow often do you eat at a fast food 4. restaurant? ____ times per week How much pop (soda) do you drink? ____5. cups per dayDo you bring your lunch in a bag or a lunch 6. box? (If you get your lunch from the school cafeteria, skip this question.) Circle one: lunch bag or lunch box
Home and School
What type of home do you live in? Circle 7. one: house or apartmentHow many people live in your home?8. Do you have a cottage (vacation home)?9. Do you have a lawn?10. How often do you shower? ____times per 11. weekHow many times do you or your parents do 12. laundry each week?
What type of clothes washer do you use? 13. Circle one: top loading or front loadingDo you or your parents dry your laundry 14. outside?Do you recycle paper at school?15. Do you brush your teeth once or twice a day?16. Do you leave the tap on when brushing your 17. teeth?Do you own a swimming pool?18.
What You Use
Do you have these things? Circle the ones 19. you have: cell phone, TV, DVD player, computer, washing machine, dishwasher, refrigeratorDo you or your parents get a newspaper?20. Do you or your parents get a magazine?21.
What You Throw Away
How many bags of garbage do you or your 22. parents put out each week?Do you recycle?23. Do you compost?24. Do you turn off the lights when you leave a 25. room?Do your parents ride their bikes to work?26. Do you turn your computer off when you’re 27. not using it?What do your light bulbs look like? Circle 28. one: fluorescent or incandescent
NAME
Questions taken from www.zerofootprintkids.com.
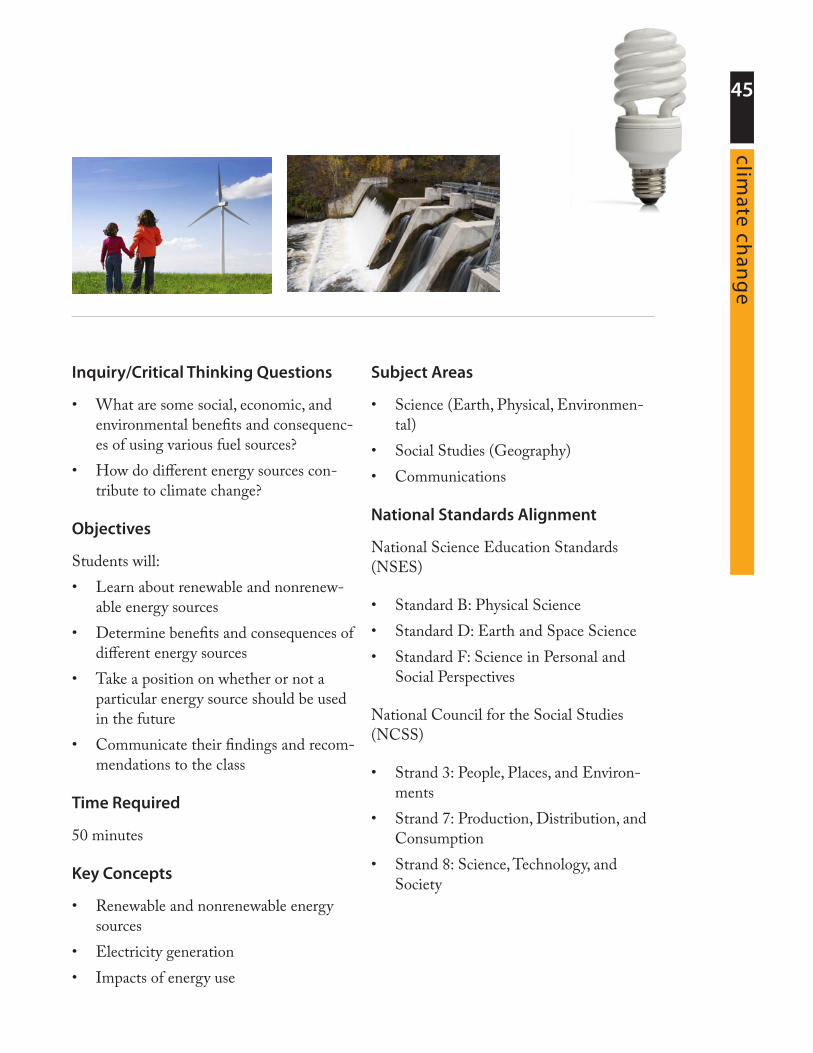
5In small groups, students read about various sources of energy used for electricity production. Students identify the pros and cons of these energy sources and take a position, either encouraging or discouraging the class to use particular energy sources.
Energy Exploration
45clim
ate chan
ge
Inquiry/Critical Thinking Questions
What are some social, economic, and •environmental benefits and consequenc-es of using various fuel sources?How do different energy sources con-•tribute to climate change?
Objectives
Students will:Learn about renewable and nonrenew-•able energy sourcesDetermine benefits and consequences of •different energy sourcesTake a position on whether or not a •particular energy source should be used in the futureCommunicate their findings and recom-•mendations to the class
Time Required
50 minutes
Key Concepts
Renewable and nonrenewable energy •sourcesElectricity generation•Impacts of energy use•
Subject Areas
Science (Earth, Physical, Environmen-•tal)Social Studies (Geography)•Communications•
National Standards Alignment
National Science Education Standards (NSES)
Standard B: Physical Science•Standard D: Earth and Space Science•Standard F: Science in Personal and •Social Perspectives
National Council for the Social Studies (NCSS)
Strand 3: People, Places, and Environ-•mentsStrand 7: Production, Distribution, and •ConsumptionStrand 8: Science, Technology, and •Society
E N E R G Y E X P LO R AT I O N
46
faci
ng
th
e fu
ture
Vocabulary
renewable energy• —a source of usable power that can be replaced as it is con-sumed; examples: wind, water, sunlight, firewoodnonrenewable energy• —a source of usable power that cannot be replaced within a human lifetime; examples: coal, natural gas, petroleumfossil fuel• —a source of energy produced by the decomposition of prehistoric plants and animals
Materials/Preparation
Handout: Energy Source worksheets, 1 •per group
ActivityIntroduction
Ask students to recall some things that 1. we do or use everyday that contribute to greenhouse gas emissions. If no one identifies energy (for transportation, home electricity, etc.), remind them that the largest source of our emissions is from energy use.Tell them that they will be researching 2. different sources of energy and reporting back to the class, with a recommendation on which sources are best to use.
Steps
Split the class into 7 groups. Give 1. each group a different Energy Source worksheet.For each group, assign 1 person to be 2. the group writer, who will write the group’s answers to the questions on the worksheet. Assign a second student to present the group’s findings and position to the class. The remaining students will take turns reading the given information aloud to the group.Give groups 15 minutes to read through 3. and complete the worksheet.Allow each group 3-5 minutes to 4. present information about their assigned energy source to the class. Ask each group to share their position on whether the energy source should be used, in light of economic, social, and
“Conservation not only saves energy and reduces human impacts on the climate, but it also saves money!
Student Reading 03, page 111
E N E R G Y E X P LO R AT I O N47
climate ch
ang
e
environmental concerns. Tell students to take notes as each group is speaking about the pros and cons of each energy source.Encourage other groups to ask questions 5. after each group presents. Students should be allowed to respectfully challenge conclusions reached by each group. Encourage an atmosphere of friendly debate, while monitoring the debate to ensure that all student voices are heard and respected.After all groups have presented, 6. begin a discussion of overall findings and conclusions using the following reflection questions.
Reflection
Which energy source appears to be the 1. best choice, when taking into account social, environmental, and economic factors? What types of resources does that energy source use? Are they renewable? Does the use of that energy source benefit some people at the expense of others?Which energy sources would you 2. recommend to limit climate change?Why do you think energy sources that 3. are strongly linked to climate change are used all over the world? If we know about technology and 4. conservation techniques that can limit greenhouse gas emissions, why don’t we use them in all instances?
Do you think that all people know 5. which energy source is used to generate the electricity they use?Are there places where certain 6. technologies couldn’t be used? Why couldn’t all technologies be used in all places?
Mathematics Extension
For an out-of-class assignment, have stu-dents investigate what percentage of their community’s electricity is generated by various energy sources. Using a graphing program like Microsoft Excel, have students create a pie chart to illustrate the percent-age of energy use provided by each type of energy source in their community.
Additional ResourcesWebsites
http://www.princeton.edu/~cmi/•resources/stabwedge.htm—In the Stabilization Wedge Game, a resource developed by the Carbon Mitigation Initiative, students work to stabilize car-bon dioxide emissions at current levels by using existing technologies, increas-ing energy efficiency, and conserving natural resources. http://www.ases.org/climatechange/•climate_change.pdf—The American Solar Energy report, “Tackling Climate Change in the U.S.,” explains how en-ergy efficiency and use of various renew-able energy sources can greatly reduce carbon emissions.
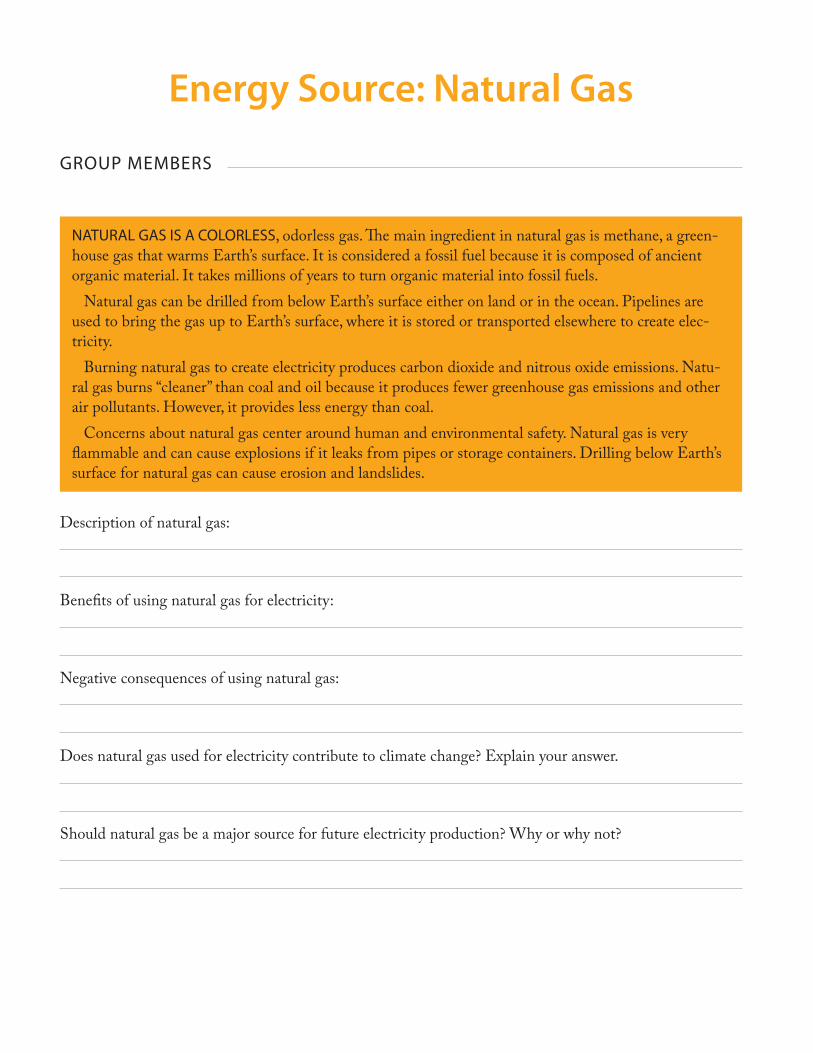
Description of natural gas:
Benefits of using natural gas for electricity:
Negative consequences of using natural gas:
Does natural gas used for electricity contribute to climate change? Explain your answer.
Should natural gas be a major source for future electricity production? Why or why not?
Energy Source: Natural Gas
NATURAL GAS IS A COLORLESS, odorless gas. The main ingredient in natural gas is methane, a green-house gas that warms Earth’s surface. It is considered a fossil fuel because it is composed of ancient organic material. It takes millions of years to turn organic material into fossil fuels.
Natural gas can be drilled from below Earth’s surface either on land or in the ocean. Pipelines are used to bring the gas up to Earth’s surface, where it is stored or transported elsewhere to create elec-tricity.
Burning natural gas to create electricity produces carbon dioxide and nitrous oxide emissions. Natu-ral gas burns “cleaner” than coal and oil because it produces fewer greenhouse gas emissions and other air pollutants. However, it provides less energy than coal.
Concerns about natural gas center around human and environmental safety. Natural gas is very flammable and can cause explosions if it leaks from pipes or storage containers. Drilling below Earth’s surface for natural gas can cause erosion and landslides.
GROUP MEMBERS
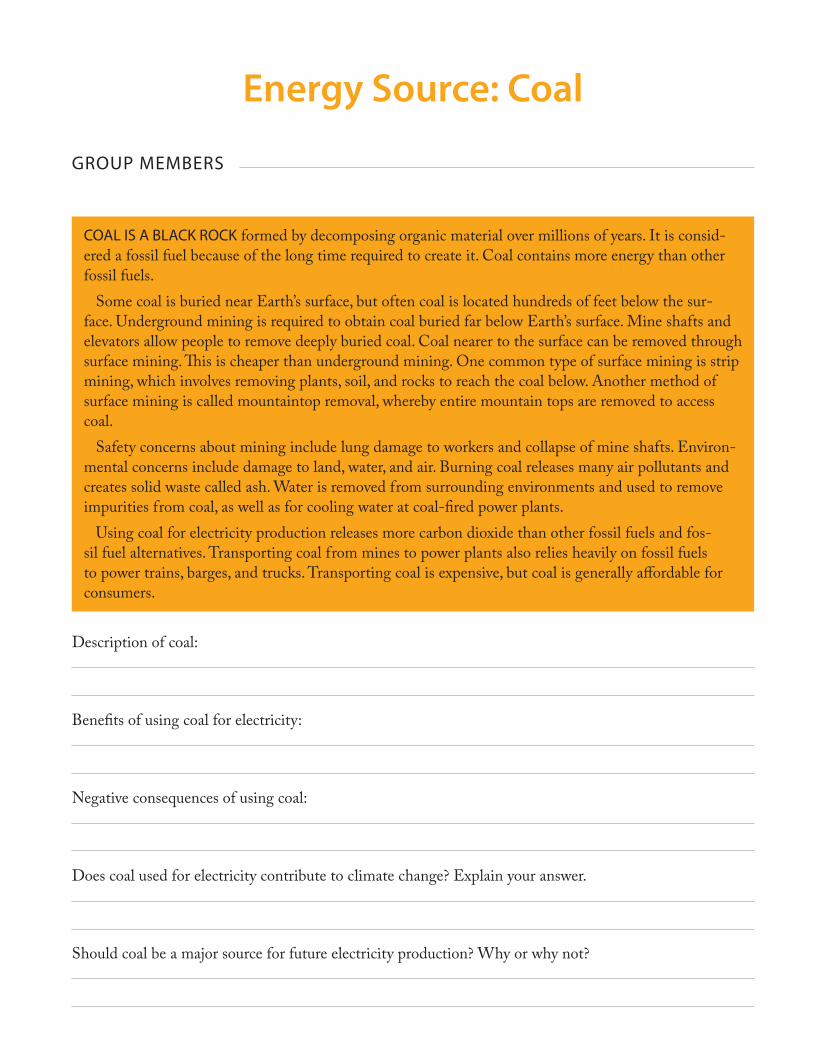
Energy Source: Coal
COAL IS A BLACK ROCK formed by decomposing organic material over millions of years. It is consid-ered a fossil fuel because of the long time required to create it. Coal contains more energy than other fossil fuels.
Some coal is buried near Earth’s surface, but often coal is located hundreds of feet below the sur-face. Underground mining is required to obtain coal buried far below Earth’s surface. Mine shafts and elevators allow people to remove deeply buried coal. Coal nearer to the surface can be removed through surface mining. This is cheaper than underground mining. One common type of surface mining is strip mining, which involves removing plants, soil, and rocks to reach the coal below. Another method of surface mining is called mountaintop removal, whereby entire mountain tops are removed to access coal.
Safety concerns about mining include lung damage to workers and collapse of mine shafts. Environ-mental concerns include damage to land, water, and air. Burning coal releases many air pollutants and creates solid waste called ash. Water is removed from surrounding environments and used to remove impurities from coal, as well as for cooling water at coal-fired power plants.
Using coal for electricity production releases more carbon dioxide than other fossil fuels and fos-sil fuel alternatives. Transporting coal from mines to power plants also relies heavily on fossil fuels to power trains, barges, and trucks. Transporting coal is expensive, but coal is generally affordable for consumers.
GROUP MEMBERS
Description of coal:
Benefits of using coal for electricity:
Negative consequences of using coal:
Does coal used for electricity contribute to climate change? Explain your answer.
Should coal be a major source for future electricity production? Why or why not?
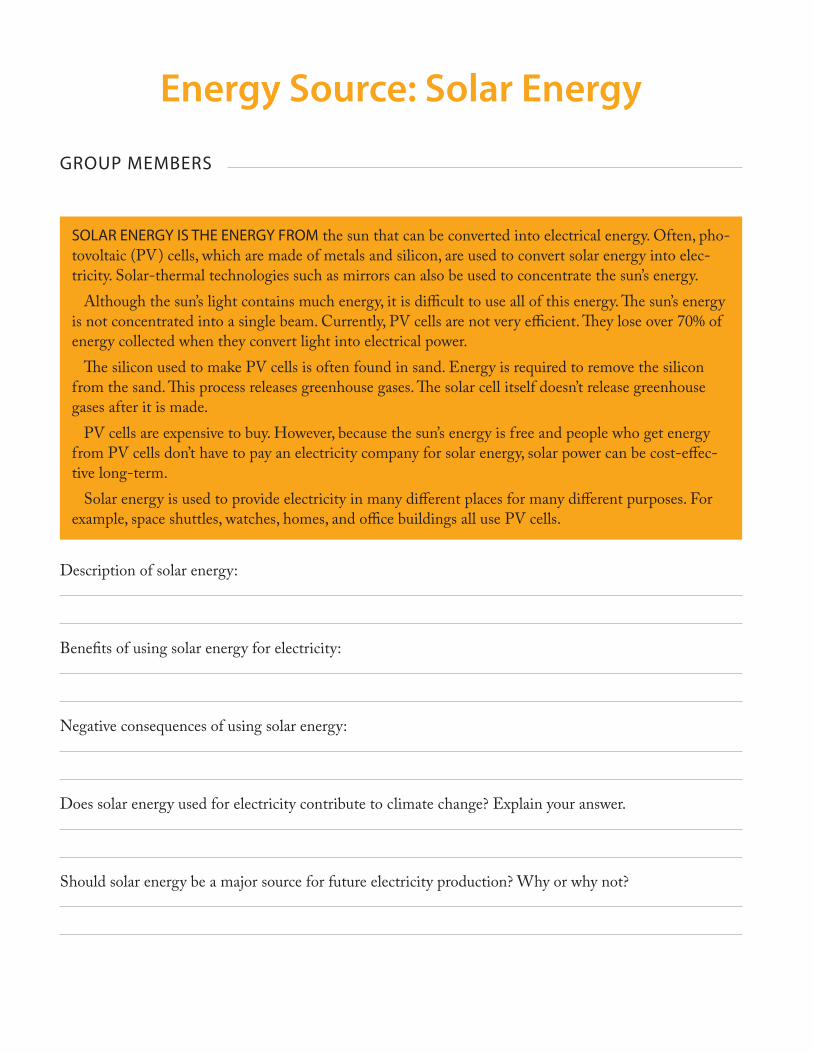
Energy Source: Solar Energy
GROUP MEMBERS
SOLAR ENERGY IS THE ENERGY FROM the sun that can be converted into electrical energy. Often, pho-tovoltaic (PV) cells, which are made of metals and silicon, are used to convert solar energy into elec-tricity. Solar-thermal technologies such as mirrors can also be used to concentrate the sun’s energy.
Although the sun’s light contains much energy, it is difficult to use all of this energy. The sun’s energy is not concentrated into a single beam. Currently, PV cells are not very efficient. They lose over 70% of energy collected when they convert light into electrical power.
The silicon used to make PV cells is often found in sand. Energy is required to remove the silicon from the sand. This process releases greenhouse gases. The solar cell itself doesn’t release greenhouse gases after it is made.
PV cells are expensive to buy. However, because the sun’s energy is free and people who get energy from PV cells don’t have to pay an electricity company for solar energy, solar power can be cost-effec-tive long-term.
Solar energy is used to provide electricity in many different places for many different purposes. For example, space shuttles, watches, homes, and office buildings all use PV cells.
Description of solar energy:
Benefits of using solar energy for electricity:
Negative consequences of using solar energy:
Does solar energy used for electricity contribute to climate change? Explain your answer.
Should solar energy be a major source for future electricity production? Why or why not?
Energy Source: Hydropower
GROUP MEMBERS
HYDROPOWER IS THE ENERGY GENERATED by moving water. Fast-flowing water and water that falls a great distance contain much energy. Often a dam is built to control flowing water and create electricity as needed.
Hydropower is a renewable energy source. Water is renewed naturally through Earth’s water cycle. Hydropower is considered a clean energy source because it does not result in any carbon dioxide emis-sions, air pollution, or water pollution.
Water is a cheap energy source. The cost of hydropower lies in building and maintaining dams and channels. Dams have big impacts on environments. Sediments (soil, sand, leaves) can build up in reservoirs—the bodies of water held by dams. That sediment reduces water quality for organisms that live in the water and can choke out the sun’s light. Migrating fish may have trouble swimming around dams. Changing the path of a stream affects any organisms dependent on that stream. It may also cause erosion along riverbanks.
Building dams can also affect human communities. Often people must be relocated from their homes if they live in an area where a dam and reservoir are to be constructed. People displaced by dams are often poor. One benefit of creating reservoirs is the opportunity for recreation, such as swimming and fishing.
Description of hydropower:
Benefits of using hydropower for electricity:
Negative consequences of using hydropower:
Does hydropower used for electricity contribute to climate change? Explain your answer.
Should hydropower be a major source for future electricity production? Why or why not?
Energy Source: Wind Energy
GROUP MEMBERS
WIND ENERGY IS ACTUALLY A form of solar energy. The sun heats different parts of the Earth at dif-ferent rates. Also, different surfaces absorb or reflect sunlight in different amounts. This causes the atmosphere to warm unevenly, creating wind. Average annual wind speeds of at least 9-13 miles per hour are required to have successful electrical production from wind.
Wind-generated electricity requires wind turbines (sometimes called windmills). These are mostly made of steel. Steel is made of iron and other metals. Mining and processing these metals produces greenhouse gases. However, once the turbine is made, using wind energy to create electricity produces no land, water, or air pollution.
Costs of wind power have decreased steadily. Building and maintaining wind turbines are the major costs. Some farmers and ranchers have installed wind turbines on their land to make extra money.
Some people don’t like wind turbines because they can harm birds and bats that might get caught in the blades. Others don’t like the way they look or the noise that large wind farms can create.
Description of wind energy:
Benefits of using wind energy for electricity:
Negative consequences of using wind energy:
Does wind used for electricity contribute to climate change? Explain your answer.
Should wind energy be a major source for future electricity production? Why or why not?
Energy Source: Nuclear Energy
GROUP MEMBERS
NUCLEAR ENERGY IS ENERGY OBTAINED from splitting apart atoms in a process called fission. Ura-nium, a metal found in rocks, is used as fuel for nuclear fission. Neutrons hit uranium atoms, causing the uranium atoms to split apart. Energy is released when atoms break apart.
Nuclear energy doesn’t result in any greenhouse gas emissions, other than those due to mining and transporting uranium to nuclear plants. Water is required for various steps in electricity production from nuclear energy.
Uranium is radioactive. It can harm living organisms if it is released into the environment. Radio-activity can cause illness such as cancers and even death. Radioactive wastes are dangerous for a very long time. Currently there is no known way to dispose of nuclear waste safely; it must be contained in special storage areas.
There are other safety concerns associated with nuclear energy. Uranium used for nuclear fuel can also be used to create nuclear weapons. Also, the extreme heat created by fission makes reactors suscep-tible to fires or explosions if safety measures malfunction.
Description of nuclear energy:
Benefits of using nuclear energy for electricity:
Negative consequences of using nuclear energy:
Does nuclear energy used for electricity contribute to climate change? Explain your answer.
Should nuclear energy be a major source for future electricity production? Why or why not?
Energy Source: Geothermal Energy
GROUP MEMBERS
GEOTHERMAL ENERGY IS HEAT THAT comes from within the earth. Extremely high temperatures are continuously produced inside the earth. The heat from below Earth's surface can be used to create electricity.
Reservoirs of hot water, steam, and hot dry rocks can be used to generate electricity. Pipes are often drilled 1 to 2 miles below Earth's surface to reach these reservoirs of thermal (or heat) energy. Geo-thermal reservoirs are difficult to reach in places where they are far below Earth’s surface.
Geothermal energy is not as renewable as solar or wind energy because a specific location can cool over time. However, geothermal energy is unaffected by weather, unlike solar and wind energy.
Construction of geothermal power plants can affect land stability in the surrounding region. How-ever, after a power plant has been constructed, geothermal energy is inexpensive and clean. Geothermal power plants release less than 5% of the CO2 emissions of a fossil fuel power plant.
The shallow ground of the earth provides another form of geothermal energy that can be used almost anywhere to heat or cool buildings. For most areas in the world, temperatures in the upper 10 feet of Earth’s crust are warmer than the air in the winter and cooler than the air in the summer, kind of like a cave. Geothermal heat pumps transfer heat from the ground into buildings in the winter and reverse the process in the summer, transferring heat from the air into the cooler ground.
Description of geothermal energy:
Benefits of using geothermal energy for electricity:
Negative consequences of using geothermal energy:
Does geothermal energy used for electricity contribute to climate change? Explain your answer.
Should geothermal energy be a major source for future electricity production? Why or why not?
6In pairs, students read about the impacts of climate change experienced by people living in different environments around the world. As a class, students discuss how these climate change impacts are connected.
Making Climate Change Connections
M A K I N G C L I M AT E C H A N G E CO N N E C T I O N S
56
faci
ng
th
e fu
ture
Inquiry/Critical Thinking Questions
How is climate change impacting •people in different environments around the world?How are the impacts of climate change •in different environments around the world connected?What are some ways that we can lessen •the impacts of climate change on differ-ent environments?
Objectives
Students will:Examine environments in different •regions of the worldConsider the impacts of climate change •on different environmentsExplore the connections between the •impacts of climate change on different environmentsThink about ways they can contribute •to preventing or reducing the impacts of climate change on different environ-ments
Time Required
50 minutes
Key Concepts
Geography•Climate change impacts•Interconnections•
Subject Areas
Social Studies (Geography, Global •Studies, World History, Contemporary World Problems)Science (Earth, Environmental, Life, •Physical)
National Standards Alignment
National Science Education Standards (NSES)
Standard B: Physical Science•Standard C: Life Science•Standard D: Earth and Space Science•Standard F: Science in Personal and •Social Perspectives
National Council for the Social Studies (NCSS)
Strand 3: People, Places, and Environ-•mentsStrand 7: Production, Distribution, and •ConsumptionStrand 9: Global Connections•Strand 10: Civic Ideals and Practices•
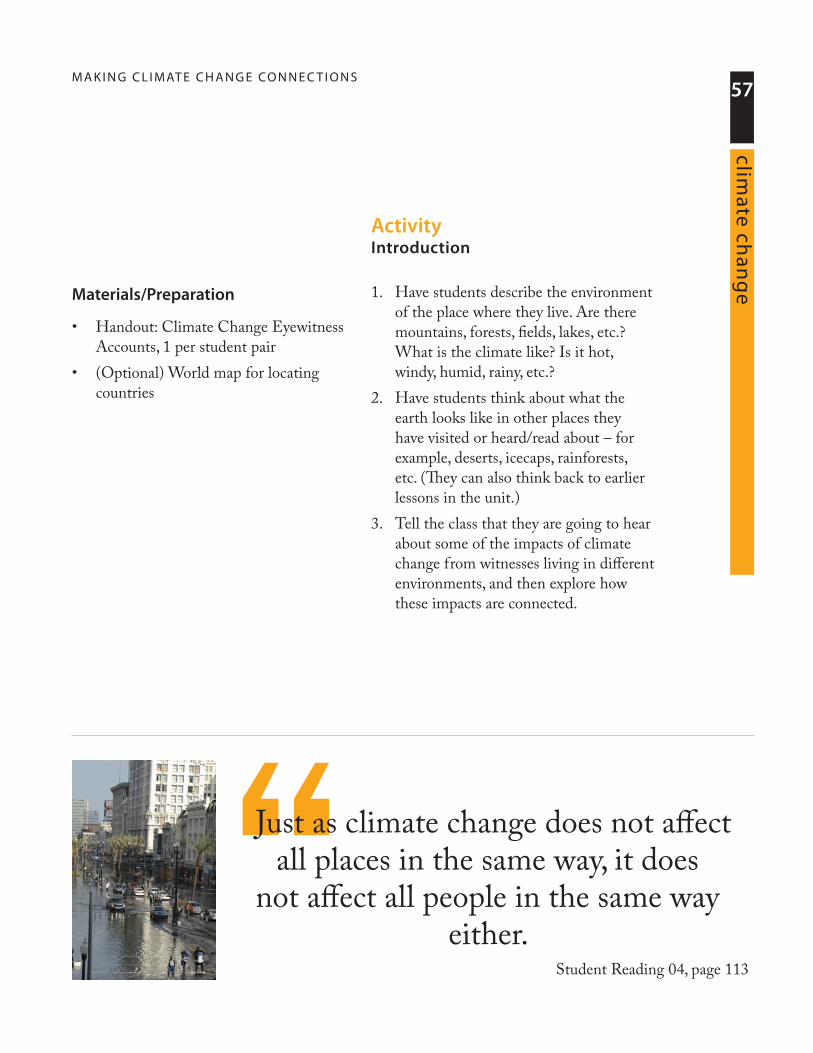
M A K I N G C L I M AT E C H A N G E CO N N E C T I O N S57
climate ch
ang
e
“
Materials/Preparation
Handout: Climate Change Eyewitness •Accounts, 1 per student pair (Optional) World map for locating •countries
ActivityIntroduction
Have students describe the environment 1. of the place where they live. Are there mountains, forests, fields, lakes, etc.? What is the climate like? Is it hot, windy, humid, rainy, etc.?Have students think about what the 2. earth looks like in other places they have visited or heard/read about – for example, deserts, icecaps, rainforests, etc. (They can also think back to earlier lessons in the unit.)Tell the class that they are going to hear 3. about some of the impacts of climate change from witnesses living in different environments, and then explore how these impacts are connected.
Student Reading 04, page 113
Just as climate change does not affect all places in the same way, it does
not affect all people in the same way either.
M A K I N G C L I M AT E C H A N G E CO N N E C T I O N S
58
faci
ng
th
e fu
ture
Steps
Divide the class into pairs. Give each 1. pair a Climate Change Eyewitness Account. Ask if any pairs do not know the place 2. their scenario describes. If so, have a world map available for students to find their location.Give the pairs a few minutes to read 3. their scenarios, using the reading questions to guide them. Tell students to be ready to share their climate change impacts with the rest of the class. (Optional) Write the following reading 4. questions on the board for students to answer:
Where is the story located? How •would you describe the environment there? What species (animals or plants) are •mentioned? How have these been affected by climate change?How are humans using the •environment in your story? How have these activities been affected by climate change?Is the eyewitness doing anything to •try to reduce the impacts of climate change?
While students are working in 5. pairs, make a circular list of all the environments from the scenarios on a large blackboard or whiteboard. (Write the names of all the environments from the scenarios so that they form a large open circle.) Bring the class back together to 6. complete the activity. Starting with the pair that has Pohnpei, ask them to share the impacts of climate change on the people and the environment in their scenario. (Give each pair about 1-2 minutes.)Now ask the rest of the pairs if they 7. think people living in the environment in their scenario will be impacted by the changes in Pohnpei. Encourage students to consider possible effects and connections beyond those specifically mentioned in their scenario. You can also ask students to note similarities and differences in how climate change is impacting their environments.As students point out connections 8. between environments, draw a line between those connected environments on the board.
M A K I N G C L I M AT E C H A N G E CO N N E C T I O N S59
climate ch
ang
eLesson Variation: Have pairs join 2 other pairs so that now each group has 6 students with 3 scenarios. Ask each group to make a 3-ring Venn diagram showing which impacts are shared and not shared among their environments.
Ask another pair to share their impacts. 9. Again, have the pairs that would be affected by these impacts raise their hands and explain how they will be affected. Then draw a line between affected environments on the board.Continue until each pair has had a 10. turn, and conclude with the following reflection questions.
Reflection
What does the diagram on the board 1. show about climate change?Are the impacts on any one 2. environment isolated from other environments (that is, do any impacts affect only one environment)?Are some environments impacted more 3. than others? If so, which ones? Why do you think these environments are more sensitive to climate change?Can you think of any examples of 4. climate change having a positive impact for environments or humans? What are some possible benefits for certain environments?
Could some of the impacts described 5. by your eyewitness have been caused by something other than climate change? What could some other causes be? How might these other causes relate to climate change? What, if anything, are people in the 6. various scenarios doing to respond to climate change? Which actions mentioned do you think are more effective? Which are less effective?How can we, as individuals living in our 7. environment, contribute to reducing the impacts of climate change on other environments?
Writing and/or Drama Extension
Have students, either in pairs or individu-ally, imagine a conversation between them-selves and the person in their scenario. Have them think about what they would want to ask this person, and what they would want to tell them. Ask students to suggest how they might cooperate with the person in their scenario to have a positive impact on the world with regard to climate change. Have students write up their dialogue as either a story or a script.
M A K I N G C L I M AT E C H A N G E CO N N E C T I O N S
60
faci
ng
th
e fu
ture
Action Project
Interview a climate witness. Collect oral histories from older relatives or community members. Ask them to explain how climate (temperatures, rainfall, long-term weather patterns) has changed during their lifetime. Document climate change in your com-munity by combining these oral histories in a book to share with other community members. For more information, includ-ing a sample interview form, see the World Wildlife Fund’s Climate Witness proj-ect, available at http://www.panda.org/ climatewitness.
Additional ResourcesFilm
Rising Waters: Global Warming and the Fate of the Pacific Islands, directed by Andrea Torrice, 2000, 57 minutes, http://www.bullfrogfilms.com/catalog/rw.html. Through personal stories of Pacific Islanders in Kiri-bati, the Samoas, the atolls of Micronesia and Hawaii, as well as researchers in the continental United States, this documentary film puts a human face on the international climate change debate.
Websites
http://www.panda.org/climatewitness• —Climate Witness is the World Wildlife Fund’s initiative to document the direct experiences of people who are witness-ing the impacts of climate change on their local environment. WWF works with scientists around the world who provide scientific background informa-tion to the climate witness testimonies. http://www.npr.org/news/specials/•climate/interactive—On the Climate Connections: A Global Journey web-site, students can click on an interactive world map to read and hear stories from National Public Radio (NPR) related to climate change around the world.
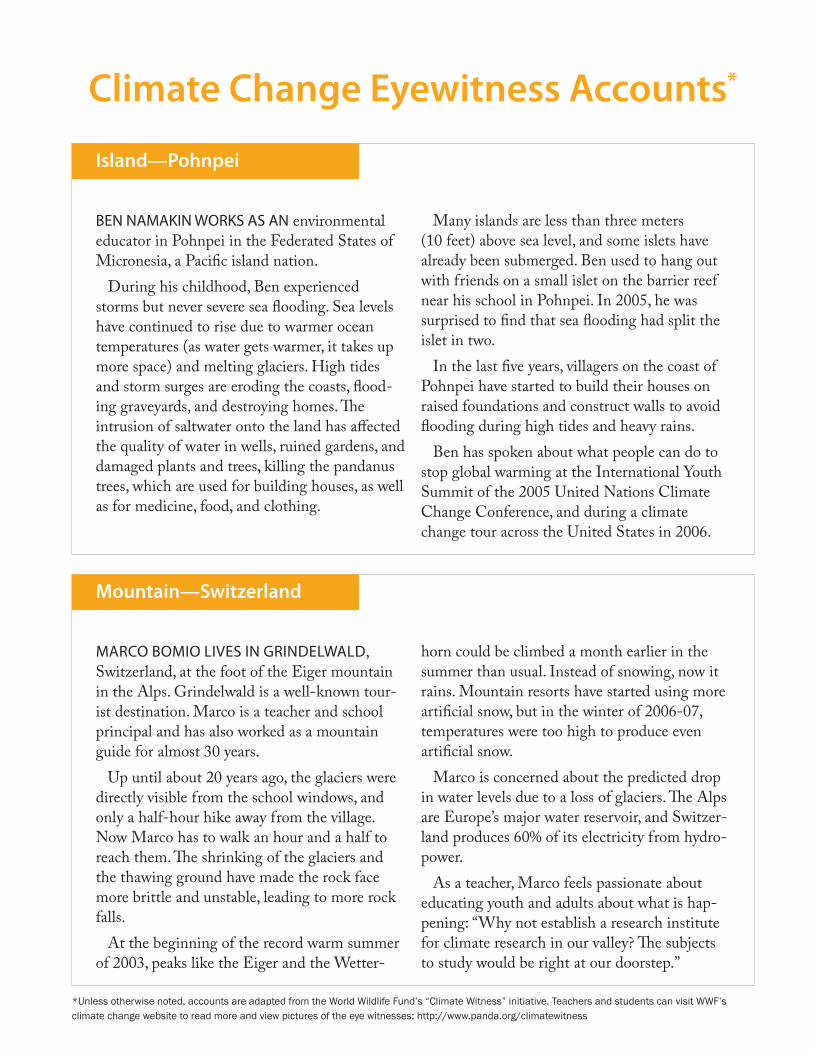
Climate Change Eyewitness Accounts*
Island—Pohnpei
BEN NAMAKIN WORKS AS AN environmental educator in Pohnpei in the Federated States of Micronesia, a Pacific island nation.
During his childhood, Ben experienced storms but never severe sea flooding. Sea levels have continued to rise due to warmer ocean temperatures (as water gets warmer, it takes up more space) and melting glaciers. High tides and storm surges are eroding the coasts, flood-ing graveyards, and destroying homes. The intrusion of saltwater onto the land has affected the quality of water in wells, ruined gardens, and damaged plants and trees, killing the pandanus trees, which are used for building houses, as well as for medicine, food, and clothing.
Many islands are less than three meters (10 feet) above sea level, and some islets have already been submerged. Ben used to hang out with friends on a small islet on the barrier reef near his school in Pohnpei. In 2005, he was surprised to find that sea flooding had split the islet in two.
In the last five years, villagers on the coast of Pohnpei have started to build their houses on raised foundations and construct walls to avoid flooding during high tides and heavy rains.
Ben has spoken about what people can do to stop global warming at the International Youth Summit of the 2005 United Nations Climate Change Conference, and during a climate change tour across the United States in 2006.
Mountain—Switzerland
MARCO BOMIO LIvES IN GRINdELWALd, Switzerland, at the foot of the Eiger mountain in the Alps. Grindelwald is a well-known tour-ist destination. Marco is a teacher and school principal and has also worked as a mountain guide for almost 30 years.
Up until about 20 years ago, the glaciers were directly visible from the school windows, and only a half-hour hike away from the village. Now Marco has to walk an hour and a half to reach them. The shrinking of the glaciers and the thawing ground have made the rock face more brittle and unstable, leading to more rock falls.
At the beginning of the record warm summer of 2003, peaks like the Eiger and the Wetter-
horn could be climbed a month earlier in the summer than usual. Instead of snowing, now it rains. Mountain resorts have started using more artificial snow, but in the winter of 2006-07, temperatures were too high to produce even artificial snow.
Marco is concerned about the predicted drop in water levels due to a loss of glaciers. The Alps are Europe’s major water reservoir, and Switzer-land produces 60% of its electricity from hydro-power.
As a teacher, Marco feels passionate about educating youth and adults about what is hap-pening: “Why not establish a research institute for climate research in our valley? The subjects to study would be right at our doorstep.”
*Unless otherwise noted, accounts are adapted from the World Wildlife Fund’s “Climate Witness” initiative. Teachers and students can visit WWF’s climate change website to read more and view pictures of the eye witnesses: http://www.panda.org/climatewitness
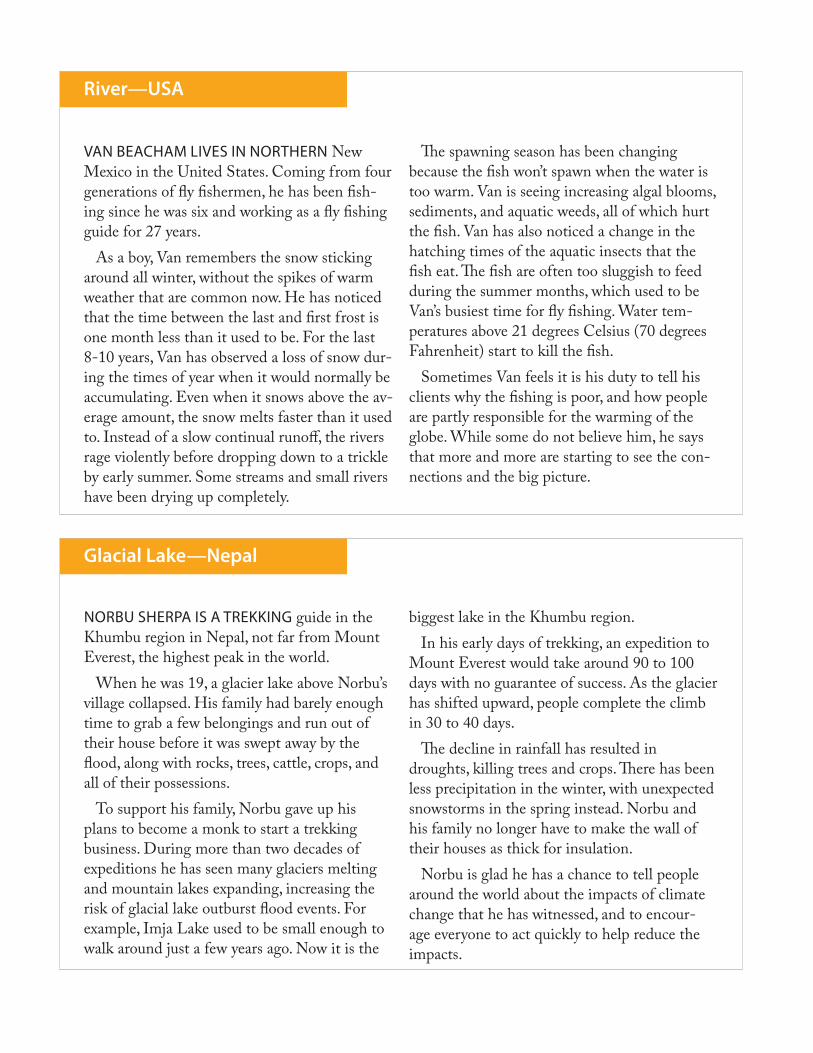
River—USA
vAN BEACHAM LIvES IN NORTHERN New Mexico in the United States. Coming from four generations of fly fishermen, he has been fish-ing since he was six and working as a fly fishing guide for 27 years.
As a boy, Van remembers the snow sticking around all winter, without the spikes of warm weather that are common now. He has noticed that the time between the last and first frost is one month less than it used to be. For the last 8-10 years, Van has observed a loss of snow dur-ing the times of year when it would normally be accumulating. Even when it snows above the av-erage amount, the snow melts faster than it used to. Instead of a slow continual runoff, the rivers rage violently before dropping down to a trickle by early summer. Some streams and small rivers have been drying up completely.
The spawning season has been changing because the fish won’t spawn when the water is too warm. Van is seeing increasing algal blooms, sediments, and aquatic weeds, all of which hurt the fish. Van has also noticed a change in the hatching times of the aquatic insects that the fish eat. The fish are often too sluggish to feed during the summer months, which used to be Van’s busiest time for fly fishing. Water tem-peratures above 21 degrees Celsius (70 degrees Fahrenheit) start to kill the fish.
Sometimes Van feels it is his duty to tell his clients why the fishing is poor, and how people are partly responsible for the warming of the globe. While some do not believe him, he says that more and more are starting to see the con-nections and the big picture.
Glacial Lake—Nepal
NORBu SHERpA IS A TREKKING guide in the Khumbu region in Nepal, not far from Mount Everest, the highest peak in the world.
When he was 19, a glacier lake above Norbu’s village collapsed. His family had barely enough time to grab a few belongings and run out of their house before it was swept away by the flood, along with rocks, trees, cattle, crops, and all of their possessions.
To support his family, Norbu gave up his plans to become a monk to start a trekking business. During more than two decades of expeditions he has seen many glaciers melting and mountain lakes expanding, increasing the risk of glacial lake outburst flood events. For example, Imja Lake used to be small enough to walk around just a few years ago. Now it is the
biggest lake in the Khumbu region.In his early days of trekking, an expedition to
Mount Everest would take around 90 to 100 days with no guarantee of success. As the glacier has shifted upward, people complete the climb in 30 to 40 days.
The decline in rainfall has resulted in droughts, killing trees and crops. There has been less precipitation in the winter, with unexpected snowstorms in the spring instead. Norbu and his family no longer have to make the wall of their houses as thick for insulation.
Norbu is glad he has a chance to tell people around the world about the impacts of climate change that he has witnessed, and to encour-age everyone to act quickly to help reduce the impacts.
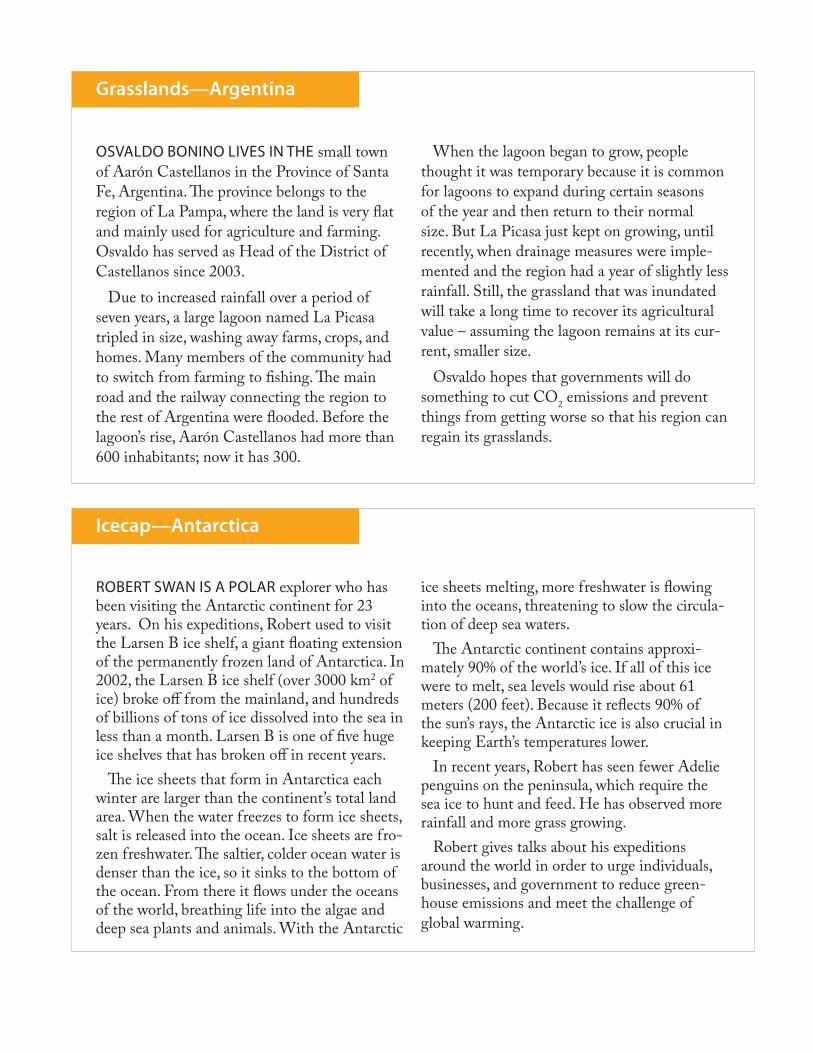
Grasslands—Argentina
OSvALdO BONINO LIvES IN THE small town of Aarón Castellanos in the Province of Santa Fe, Argentina. The province belongs to the region of La Pampa, where the land is very flat and mainly used for agriculture and farming. Osvaldo has served as Head of the District of Castellanos since 2003.
Due to increased rainfall over a period of seven years, a large lagoon named La Picasa tripled in size, washing away farms, crops, and homes. Many members of the community had to switch from farming to fishing. The main road and the railway connecting the region to the rest of Argentina were flooded. Before the lagoon’s rise, Aarón Castellanos had more than 600 inhabitants; now it has 300.
When the lagoon began to grow, people thought it was temporary because it is common for lagoons to expand during certain seasons of the year and then return to their normal size. But La Picasa just kept on growing, until recently, when drainage measures were imple-mented and the region had a year of slightly less rainfall. Still, the grassland that was inundated will take a long time to recover its agricultural value – assuming the lagoon remains at its cur-rent, smaller size.
Osvaldo hopes that governments will do something to cut CO2 emissions and prevent things from getting worse so that his region can regain its grasslands.
Icecap—Antarctica
ROBERT SWAN IS A pOLAR explorer who has been visiting the Antarctic continent for 23 years. On his expeditions, Robert used to visit the Larsen B ice shelf, a giant floating extension of the permanently frozen land of Antarctica. In 2002, the Larsen B ice shelf (over 3000 km2 of ice) broke off from the mainland, and hundreds of billions of tons of ice dissolved into the sea in less than a month. Larsen B is one of five huge ice shelves that has broken off in recent years.
The ice sheets that form in Antarctica each winter are larger than the continent’s total land area. When the water freezes to form ice sheets, salt is released into the ocean. Ice sheets are fro-zen freshwater. The saltier, colder ocean water is denser than the ice, so it sinks to the bottom of the ocean. From there it flows under the oceans of the world, breathing life into the algae and deep sea plants and animals. With the Antarctic
ice sheets melting, more freshwater is flowing into the oceans, threatening to slow the circula-tion of deep sea waters.
The Antarctic continent contains approxi-mately 90% of the world’s ice. If all of this ice were to melt, sea levels would rise about 61 meters (200 feet). Because it reflects 90% of the sun’s rays, the Antarctic ice is also crucial in keeping Earth’s temperatures lower.
In recent years, Robert has seen fewer Adelie penguins on the peninsula, which require the sea ice to hunt and feed. He has observed more rainfall and more grass growing.
Robert gives talks about his expeditions around the world in order to urge individuals, businesses, and government to reduce green-house emissions and meet the challenge of global warming.
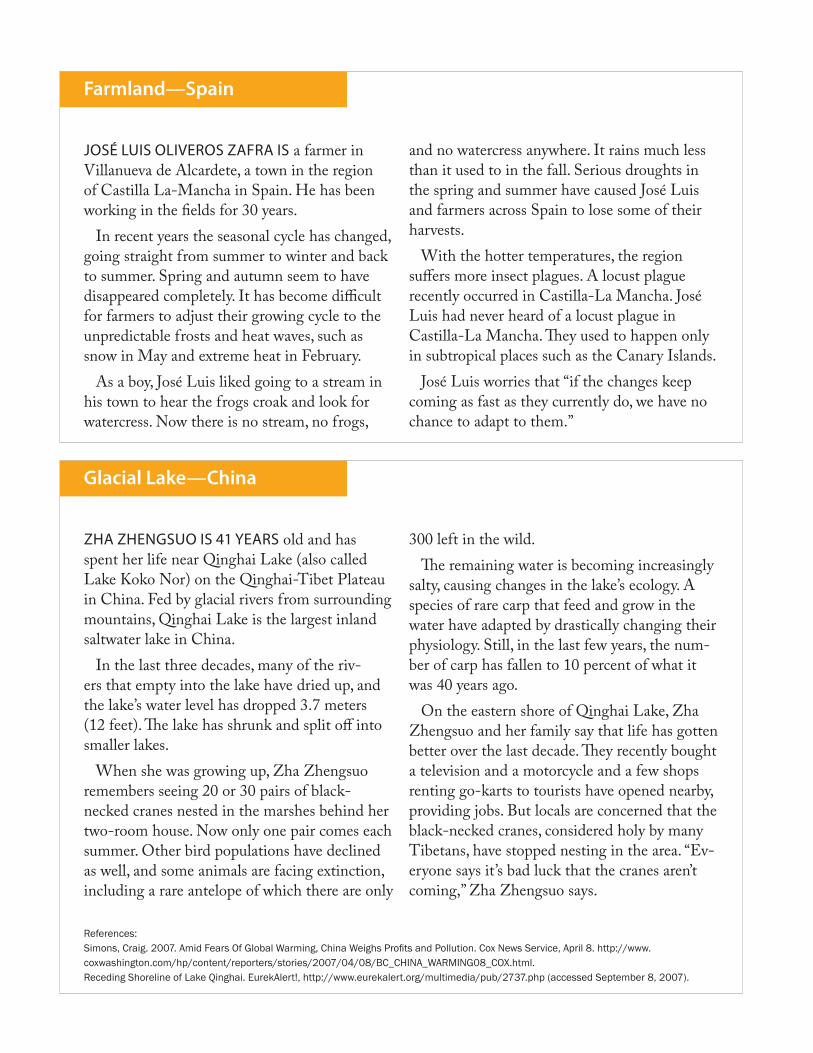
Farmland—Spain
JOSé LuIS OLIvEROS ZAfRA IS a farmer in Villanueva de Alcardete, a town in the region of Castilla La-Mancha in Spain. He has been working in the fields for 30 years.
In recent years the seasonal cycle has changed, going straight from summer to winter and back to summer. Spring and autumn seem to have disappeared completely. It has become difficult for farmers to adjust their growing cycle to the unpredictable frosts and heat waves, such as snow in May and extreme heat in February.
As a boy, José Luis liked going to a stream in his town to hear the frogs croak and look for watercress. Now there is no stream, no frogs,
and no watercress anywhere. It rains much less than it used to in the fall. Serious droughts in the spring and summer have caused José Luis and farmers across Spain to lose some of their harvests.
With the hotter temperatures, the region suffers more insect plagues. A locust plague recently occurred in Castilla-La Mancha. José Luis had never heard of a locust plague in Castilla-La Mancha. They used to happen only in subtropical places such as the Canary Islands.
José Luis worries that “if the changes keep coming as fast as they currently do, we have no chance to adapt to them.”
Glacial Lake—China
ZHA ZHENGSuO IS 41 yEARS old and has spent her life near Qinghai Lake (also called Lake Koko Nor) on the Qinghai-Tibet Plateau in China. Fed by glacial rivers from surrounding mountains, Qinghai Lake is the largest inland saltwater lake in China.
In the last three decades, many of the riv-ers that empty into the lake have dried up, and the lake’s water level has dropped 3.7 meters (12 feet). The lake has shrunk and split off into smaller lakes.
When she was growing up, Zha Zhengsuo remembers seeing 20 or 30 pairs of black-necked cranes nested in the marshes behind her two-room house. Now only one pair comes each summer. Other bird populations have declined as well, and some animals are facing extinction, including a rare antelope of which there are only
300 left in the wild.The remaining water is becoming increasingly
salty, causing changes in the lake’s ecology. A species of rare carp that feed and grow in the water have adapted by drastically changing their physiology. Still, in the last few years, the num-ber of carp has fallen to 10 percent of what it was 40 years ago.
On the eastern shore of Qinghai Lake, Zha Zhengsuo and her family say that life has gotten better over the last decade. They recently bought a television and a motorcycle and a few shops renting go-karts to tourists have opened nearby, providing jobs. But locals are concerned that the black-necked cranes, considered holy by many Tibetans, have stopped nesting in the area. “Ev-eryone says it’s bad luck that the cranes aren’t coming,” Zha Zhengsuo says.
References: Simons, Craig. 2007. Amid Fears Of Global Warming, China Weighs Profits and Pollution. Cox News Service, April 8. http://www.coxwashington.com/hp/content/reporters/stories/2007/04/08/BC_CHINA_WARMING08_COX.html. Receding Shoreline of Lake Qinghai. EurekAlert!, http://www.eurekalert.org/multimedia/pub/2737.php (accessed September 8, 2007).
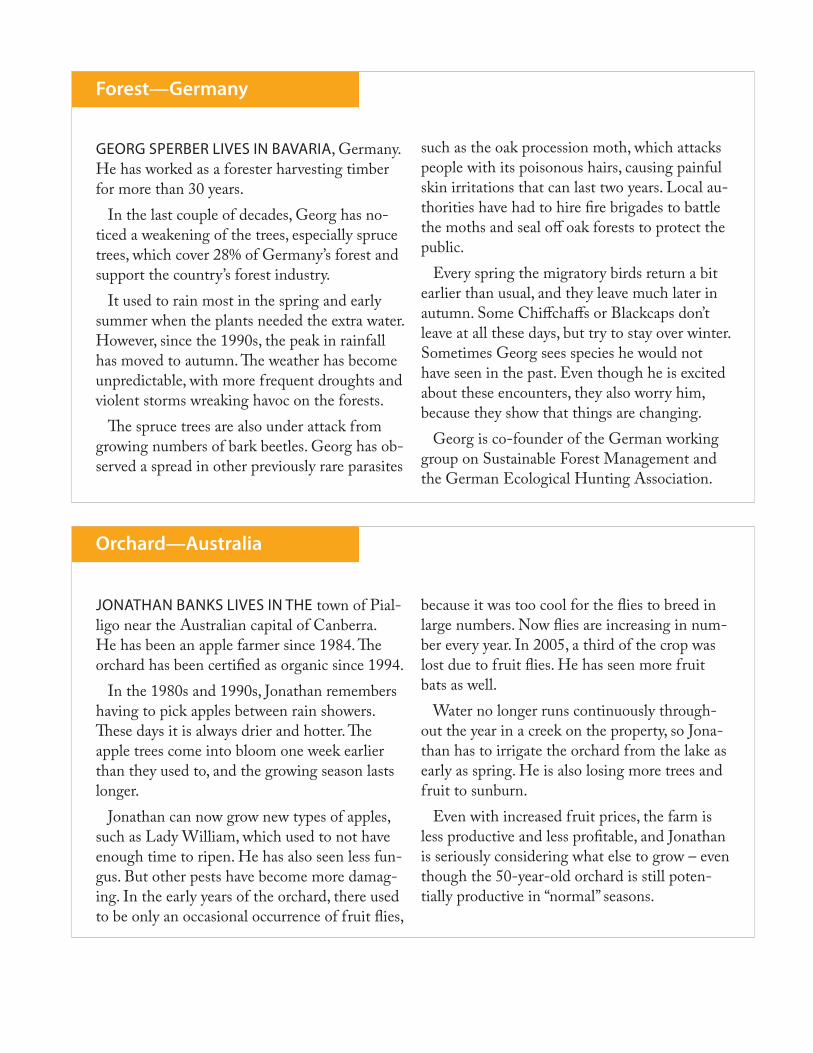
Forest—Germany
GEORG SpERBER LIvES IN BAvARIA, Germany. He has worked as a forester harvesting timber for more than 30 years.
In the last couple of decades, Georg has no-ticed a weakening of the trees, especially spruce trees, which cover 28% of Germany’s forest and support the country’s forest industry.
It used to rain most in the spring and early summer when the plants needed the extra water. However, since the 1990s, the peak in rainfall has moved to autumn. The weather has become unpredictable, with more frequent droughts and violent storms wreaking havoc on the forests.
The spruce trees are also under attack from growing numbers of bark beetles. Georg has ob-served a spread in other previously rare parasites
such as the oak procession moth, which attacks people with its poisonous hairs, causing painful skin irritations that can last two years. Local au-thorities have had to hire fire brigades to battle the moths and seal off oak forests to protect the public.
Every spring the migratory birds return a bit earlier than usual, and they leave much later in autumn. Some Chiffchaffs or Blackcaps don’t leave at all these days, but try to stay over winter. Sometimes Georg sees species he would not have seen in the past. Even though he is excited about these encounters, they also worry him, because they show that things are changing.
Georg is co-founder of the German working group on Sustainable Forest Management and the German Ecological Hunting Association.
Orchard—Australia
JONATHAN BANKS LIvES IN THE town of Pial-ligo near the Australian capital of Canberra. He has been an apple farmer since 1984. The orchard has been certified as organic since 1994.
In the 1980s and 1990s, Jonathan remembers having to pick apples between rain showers. These days it is always drier and hotter. The apple trees come into bloom one week earlier than they used to, and the growing season lasts longer.
Jonathan can now grow new types of apples, such as Lady William, which used to not have enough time to ripen. He has also seen less fun-gus. But other pests have become more damag-ing. In the early years of the orchard, there used to be only an occasional occurrence of fruit flies,
because it was too cool for the flies to breed in large numbers. Now flies are increasing in num-ber every year. In 2005, a third of the crop was lost due to fruit flies. He has seen more fruit bats as well.
Water no longer runs continuously through-out the year in a creek on the property, so Jona-than has to irrigate the orchard from the lake as early as spring. He is also losing more trees and fruit to sunburn.
Even with increased fruit prices, the farm is less productive and less profitable, and Jonathan is seriously considering what else to grow – even though the 50-year-old orchard is still poten-tially productive in “normal” seasons.
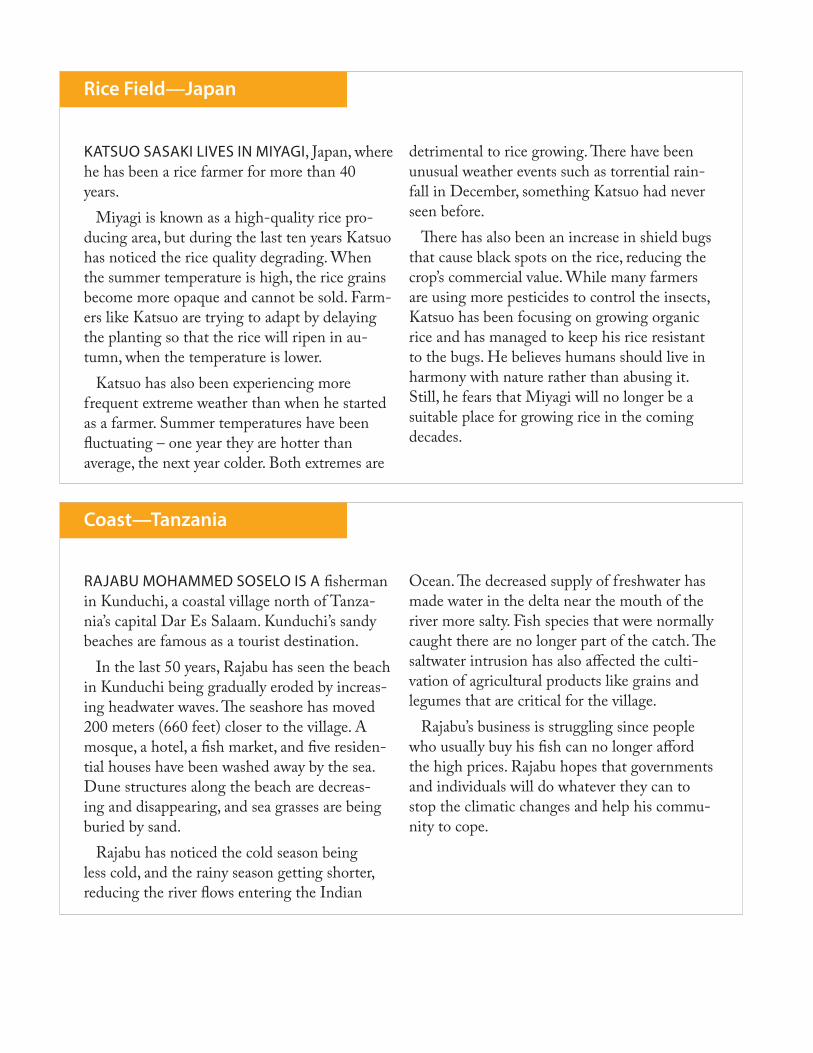
Rice Field—Japan
KATSuO SASAKI LIvES IN MIyAGI, Japan, where he has been a rice farmer for more than 40 years.
Miyagi is known as a high-quality rice pro-ducing area, but during the last ten years Katsuo has noticed the rice quality degrading. When the summer temperature is high, the rice grains become more opaque and cannot be sold. Farm-ers like Katsuo are trying to adapt by delaying the planting so that the rice will ripen in au-tumn, when the temperature is lower.
Katsuo has also been experiencing more frequent extreme weather than when he started as a farmer. Summer temperatures have been fluctuating – one year they are hotter than average, the next year colder. Both extremes are
detrimental to rice growing. There have been unusual weather events such as torrential rain-fall in December, something Katsuo had never seen before.
There has also been an increase in shield bugs that cause black spots on the rice, reducing the crop’s commercial value. While many farmers are using more pesticides to control the insects, Katsuo has been focusing on growing organic rice and has managed to keep his rice resistant to the bugs. He believes humans should live in harmony with nature rather than abusing it. Still, he fears that Miyagi will no longer be a suitable place for growing rice in the coming decades.
Coast—Tanzania
RAJABu MOHAMMEd SOSELO IS A fisherman in Kunduchi, a coastal village north of Tanza-nia’s capital Dar Es Salaam. Kunduchi’s sandy beaches are famous as a tourist destination.
In the last 50 years, Rajabu has seen the beach in Kunduchi being gradually eroded by increas-ing headwater waves. The seashore has moved 200 meters (660 feet) closer to the village. A mosque, a hotel, a fish market, and five residen-tial houses have been washed away by the sea. Dune structures along the beach are decreas-ing and disappearing, and sea grasses are being buried by sand.
Rajabu has noticed the cold season being less cold, and the rainy season getting shorter, reducing the river flows entering the Indian
Ocean. The decreased supply of freshwater has made water in the delta near the mouth of the river more salty. Fish species that were normally caught there are no longer part of the catch. The saltwater intrusion has also affected the culti-vation of agricultural products like grains and legumes that are critical for the village.
Rajabu’s business is struggling since people who usually buy his fish can no longer afford the high prices. Rajabu hopes that governments and individuals will do whatever they can to stop the climatic changes and help his commu-nity to cope.
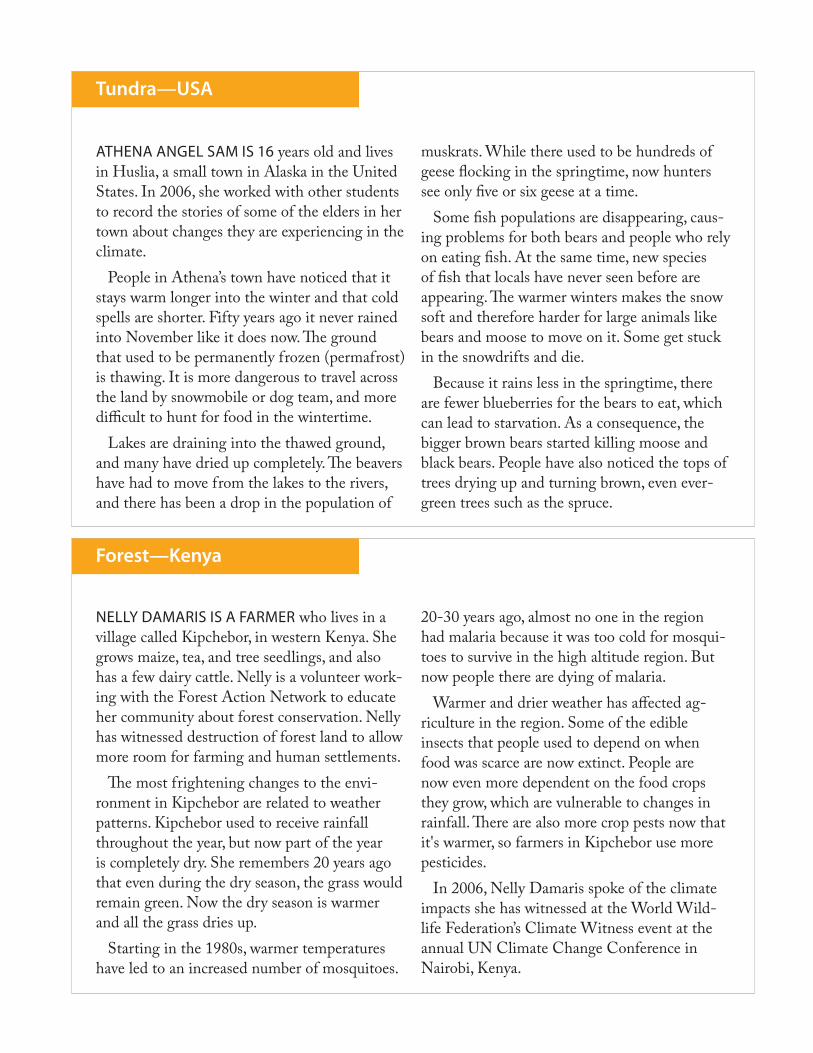
Tundra—USA
ATHENA ANGEL SAM IS 16 years old and lives in Huslia, a small town in Alaska in the United States. In 2006, she worked with other students to record the stories of some of the elders in her town about changes they are experiencing in the climate.
People in Athena’s town have noticed that it stays warm longer into the winter and that cold spells are shorter. Fifty years ago it never rained into November like it does now. The ground that used to be permanently frozen (permafrost) is thawing. It is more dangerous to travel across the land by snowmobile or dog team, and more difficult to hunt for food in the wintertime.
Lakes are draining into the thawed ground, and many have dried up completely. The beavers have had to move from the lakes to the rivers, and there has been a drop in the population of
muskrats. While there used to be hundreds of geese flocking in the springtime, now hunters see only five or six geese at a time.
Some fish populations are disappearing, caus-ing problems for both bears and people who rely on eating fish. At the same time, new species of fish that locals have never seen before are appearing. The warmer winters makes the snow soft and therefore harder for large animals like bears and moose to move on it. Some get stuck in the snowdrifts and die.
Because it rains less in the springtime, there are fewer blueberries for the bears to eat, which can lead to starvation. As a consequence, the bigger brown bears started killing moose and black bears. People have also noticed the tops of trees drying up and turning brown, even ever-green trees such as the spruce.
Forest—Kenya
NELLy dAMARIS IS A fARMER who lives in a village called Kipchebor, in western Kenya. She grows maize, tea, and tree seedlings, and also has a few dairy cattle. Nelly is a volunteer work-ing with the Forest Action Network to educate her community about forest conservation. Nelly has witnessed destruction of forest land to allow more room for farming and human settlements.
The most frightening changes to the envi-ronment in Kipchebor are related to weather patterns. Kipchebor used to receive rainfall throughout the year, but now part of the year is completely dry. She remembers 20 years ago that even during the dry season, the grass would remain green. Now the dry season is warmer and all the grass dries up.
Starting in the 1980s, warmer temperatures have led to an increased number of mosquitoes.
20-30 years ago, almost no one in the region had malaria because it was too cold for mosqui-toes to survive in the high altitude region. But now people there are dying of malaria.
Warmer and drier weather has affected ag-riculture in the region. Some of the edible insects that people used to depend on when food was scarce are now extinct. People are now even more dependent on the food crops they grow, which are vulnerable to changes in rainfall. There are also more crop pests now that it's warmer, so farmers in Kipchebor use more pesticides.
In 2006, Nelly Damaris spoke of the climate impacts she has witnessed at the World Wild-life Federation’s Climate Witness event at the annual UN Climate Change Conference in Nairobi, Kenya.
7Students begin with a simulation to understand the limits imposed by environmental regulations. They compare 2 structural solutions to regulate carbon emissions, then play a cap and trade game to find ways to reduce emissions in the most cost-effective manner.
Adapted from “The Cap and Trade Game” by Ava Erickson, Seattle Girls School
How Much Does Carbon Cost?
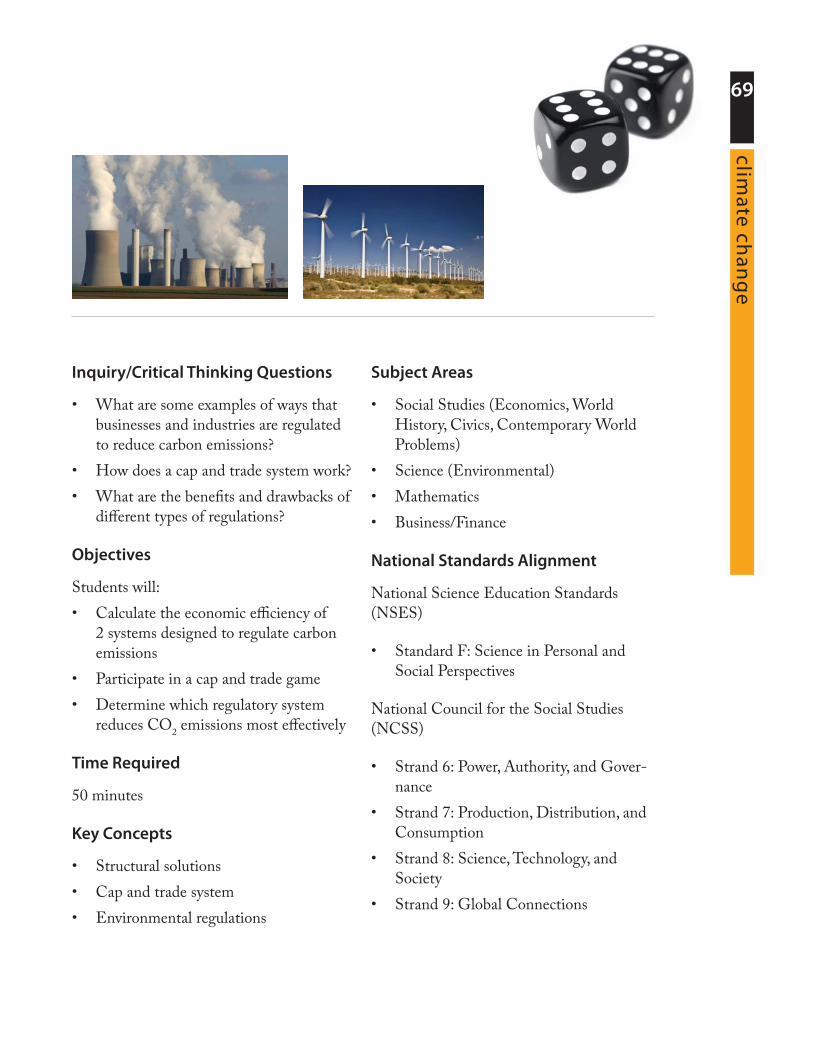
69clim
ate chan
ge
Inquiry/Critical Thinking Questions
What are some examples of ways that •businesses and industries are regulated to reduce carbon emissions?How does a cap and trade system work?•What are the benefits and drawbacks of •different types of regulations?
Objectives
Students will:Calculate the economic efficiency of •2 systems designed to regulate carbon emissionsParticipate in a cap and trade game•Determine which regulatory system •reduces CO2 emissions most effectively
Time Required
50 minutes
Key Concepts
Structural solutions•Cap and trade system•Environmental regulations•
Subject Areas
Social Studies (Economics, World •History, Civics, Contemporary World Problems)Science (Environmental)•Mathematics•Business/Finance•
National Standards Alignment
National Science Education Standards (NSES)
Standard F: Science in Personal and •Social Perspectives
National Council for the Social Studies (NCSS)
Strand 6: Power, Authority, and Gover-•nanceStrand 7: Production, Distribution, and •ConsumptionStrand 8: Science, Technology, and •SocietyStrand 9: Global Connections•
H O W M U C H D O E S C A R B O N CO S T ?
70
faci
ng
th
e fu
ture
Vocabulary
cap and trade• —rather than placing a cap (maximum allowable amount) on each individual CO2 emitter (power plant, factory, or other business), this system places a cap on industry overall; each emitter is given a certain number of CO2 allowances per year, and can trade with other emitters to acquire more allowances or sell off excess allow-ances
environmental regulation• —a law passed that is intended to protect or enhance the environment; often people or businesses are required to follow cer-tain rules to limit their environmental impactstructural solution• —a way in which a component of a system can be changed to alleviate a problem (vs. a personal solution, which is a way in which an individual can act to alleviate a problem)
Materials/Preparation
Handout: Costs of Environmental •Regulations, 1 per student(Optional) Teacher Master: Costs of •Environmental RegulationsHandout: Cap and Trade Balance Sheet, •1 per group of 3-4 studentsDice, 1 per group of 3-4 students•(Optional) Play money, $1000 per stu-•dent group“There are numerous
other ways that individuals can join governments and businesses to positively impact the climate.
Student Reading 05, page 121
H O W M U C H D O E S C A R B O N CO S T ?71
climate ch
ang
e
ActivityIntroduction
Begin this activity by telling students 1. that they will receive 1 bathroom pass per week. Tell them that they may sell this pass to classmates if they don’t use it, or they may buy passes from classmates if they need more than one. Ask students to share their feelings about this new limit placed on their bathroom privileges. Now explain that one way to fight 2. climate change is also to set limits. A government or other entity may limit, or regulate, emissions produced by companies. Students will soon play a game to explore 1 climate change regulatory mechanism.In order to prepare for the game, first 3. work through the handout, Costs of Environmental Regulations. You may want to do each problem together as a class, or you may find it best to let students work on their own first and then discuss their results.After you’ve finished the worksheet, ask 4. students which option (Individual Limit or Cap and Trade) seems to be best for each company. If you were AllStuff and you knew the government was going to impose regulations, would you prefer Individual Limit or Cap and Trade? Why?
Steps
Divide the class into groups of 3-4. Give 1. each group a Cap and Trade Balance Sheet and a die.(Optional) Give each group $1000 in 2. play money so that they can actually gain or lose dollars during each transaction.First, students will create their company. 3. What does the company do? What is it called?Instruct all groups to roll their die twice 4. and add up the numbers, then multiply by 10. This is their CO2 emissions in tons per year. Have them write that number on their balance sheet.Now have them roll the die once and 5. multiply by 10. This is the cost to their company to reduce emissions by 1 ton of CO2. Have them write that number on their balance sheet.Depending on their total emissions, 6. students may have extra allowances, or they may need to reduce their emissions. To reduce emissions, companies may pay to reduce emissions themselves (through conservation, improved efficiency, or new technology). They may also buy allowances from companies with extra allowances; this may be cheaper and faster.
H O W M U C H D O E S C A R B O N CO S T ?
72
faci
ng
th
e fu
ture
Tell students to circulate in the class to meet other companies. If a company has extra allowances, it will want to sell them for the most money it can get. If a company needs to reduce its emissions, it needs to do so for the least amount of money. Each company will have to decide if it is cheaper to make the reductions themselves or buy allowances from another company.Have students record each transaction, making sure not to exceed the total amount of money they started with. Continue the game for 10-15 minutes, or until everyone has had a chance to make at least 2 transactions. For an extra challenge, introduce a second year of trading with fewer allowances.At the end of the game, poll the class to see who was able to sell extra allowances for the most money. Also, who purchased allowances for the least amount of money? Conclude with the following reflection questions.
Reflection
Did anyone reduce emissions on their own rather than buy allowances? If so, why?How do you think businesses whose emissions exceed the maximum number of allowances would feel about a cap and trade system? Why?How do you think businesses whose emissions are below the maximum
7.
8.
9.
1.
2.
3.
number of allowances would feel about a cap and trade system? Why?Do you think a cap and trade system is a good way to reduce overall CO2 emissions? Is this a good climate change solution? Are there other solutions that you think would work better to reduce the impact businesses have on climate change? How might businesses be persuaded to reduce CO2 emissions without regulations? How could businesses benefit by saving energy?How do you think the impact of these types of structural solutions (environmental regulations) compares with personal solutions (e.g., reducing energy use, using “cleaner” technology)?
Additional ResourcesWebsites
http://www.worldwatch.org/node/3949—In this question and an-swer site maintained by the Worldwatch Institute, ideas are offered for how businesses and governments can work toward climate change solutions.http://www.theclimategroup.org—The Climate Group is a nonprofit organiza-tion dedicated to advancing business and government leadership on climate change. Click on “Low Carbon Solu-tions” to learn about ways that busi-nesses and governments can lower their CO2 emissions.
4.
5.
6.
•
•
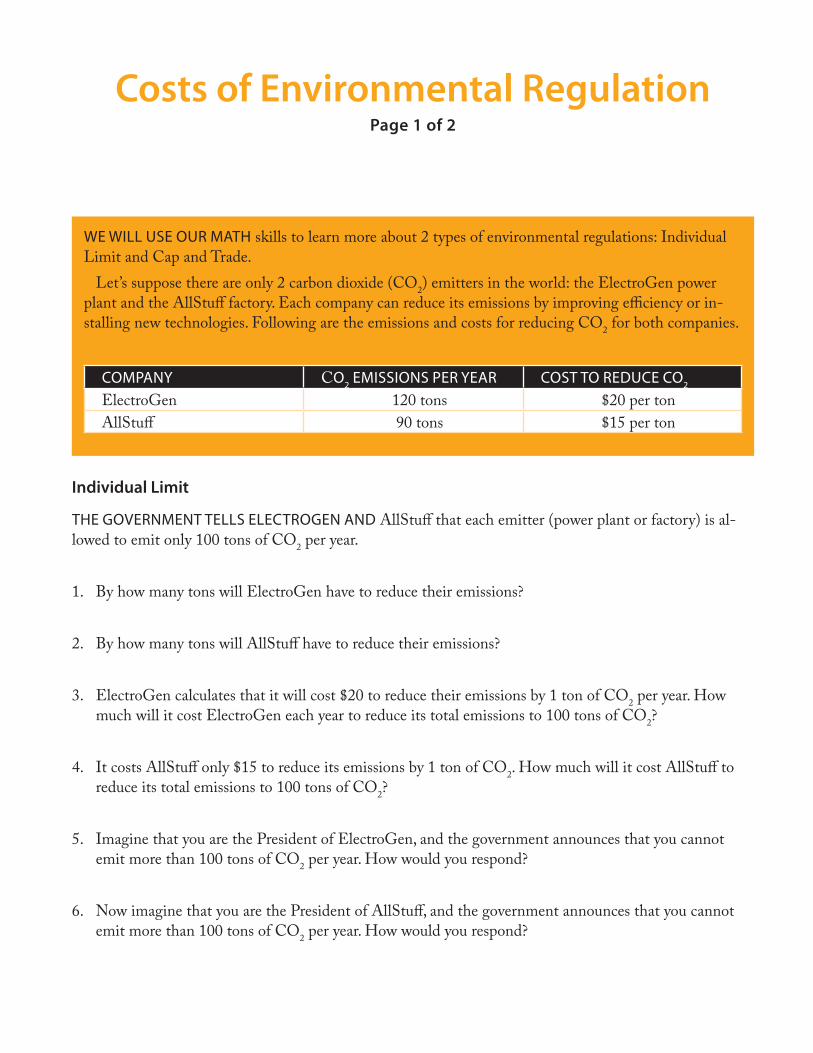
Costs of Environmental RegulationPage 1 of 2
WE Will USE OUR MATH skills to learn more about 2 types of environmental regulations: Individual Limit and Cap and Trade.
Let’s suppose there are only 2 carbon dioxide (CO2) emitters in the world: the ElectroGen power plant and the AllStuff factory. Each company can reduce its emissions by improving efficiency or in-stalling new technologies. Following are the emissions and costs for reducing CO2 for both companies.
COMpANy CO2 EMiSSiONS pER yEAR COST TO REDUCE CO2
ElectroGen 120 tons $20 per tonAllStuff 90 tons $15 per ton
Individual Limit
THE gOvERNMENT TEllS ElECTROgEN AND AllStuff that each emitter (power plant or factory) is al-lowed to emit only 100 tons of CO2 per year.
By how many tons will ElectroGen have to reduce their emissions?1.
By how many tons will AllStuff have to reduce their emissions?2.
ElectroGen calculates that it will cost $20 to reduce their emissions by 1 ton of CO3. 2 per year. How much will it cost ElectroGen each year to reduce its total emissions to 100 tons of CO2?
It costs AllStuff only $15 to reduce its emissions by 1 ton of CO4. 2. How much will it cost AllStuff to reduce its total emissions to 100 tons of CO2?
Imagine that you are the President of ElectroGen, and the government announces that you cannot 5. emit more than 100 tons of CO2 per year. How would you respond?
Now imagine that you are the President of AllStuff, and the government announces that you cannot 6. emit more than 100 tons of CO2 per year. How would you respond?
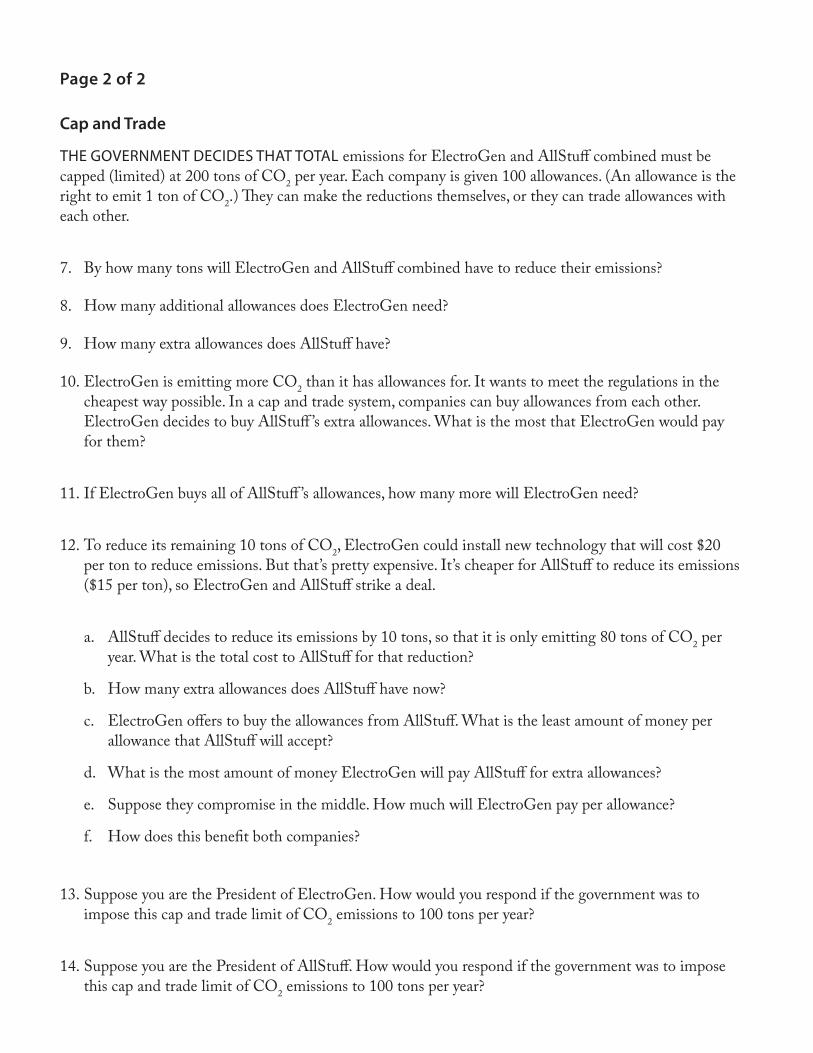
Page 2 of 2
Cap and Trade
THE gOvERNMENT DECiDES THAT TOTAl emissions for ElectroGen and AllStuff combined must be capped (limited) at 200 tons of CO2 per year. Each company is given 100 allowances. (An allowance is the right to emit 1 ton of CO2.) They can make the reductions themselves, or they can trade allowances with each other.
By how many tons will ElectroGen and AllStuff combined have to reduce their emissions?7.
How many additional allowances does ElectroGen need?8.
How many extra allowances does AllStuff have?9.
ElectroGen is emitting more CO10. 2 than it has allowances for. It wants to meet the regulations in the cheapest way possible. In a cap and trade system, companies can buy allowances from each other. ElectroGen decides to buy AllStuff ’s extra allowances. What is the most that ElectroGen would pay for them?
If ElectroGen buys all of AllStuff ’s allowances, how many more will ElectroGen need?11.
To reduce its remaining 10 tons of CO12. 2, ElectroGen could install new technology that will cost $20 per ton to reduce emissions. But that’s pretty expensive. It’s cheaper for AllStuff to reduce its emissions ($15 per ton), so ElectroGen and AllStuff strike a deal.
AllStuff decides to reduce its emissions by 10 tons, so that it is only emitting 80 tons of COa. 2 per year. What is the total cost to AllStuff for that reduction?
How many extra allowances does AllStuff have now?b.
ElectroGen offers to buy the allowances from AllStuff. What is the least amount of money per c. allowance that AllStuff will accept?
What is the most amount of money ElectroGen will pay AllStuff for extra allowances?d.
Suppose they compromise in the middle. How much will ElectroGen pay per allowance?e.
How does this benefit both companies?f.
Suppose you are the President of ElectroGen. How would you respond if the government was to 13. impose this cap and trade limit of CO2 emissions to 100 tons per year?
Suppose you are the President of AllStuff. How would you respond if the government was to impose 14. this cap and trade limit of CO2 emissions to 100 tons per year?
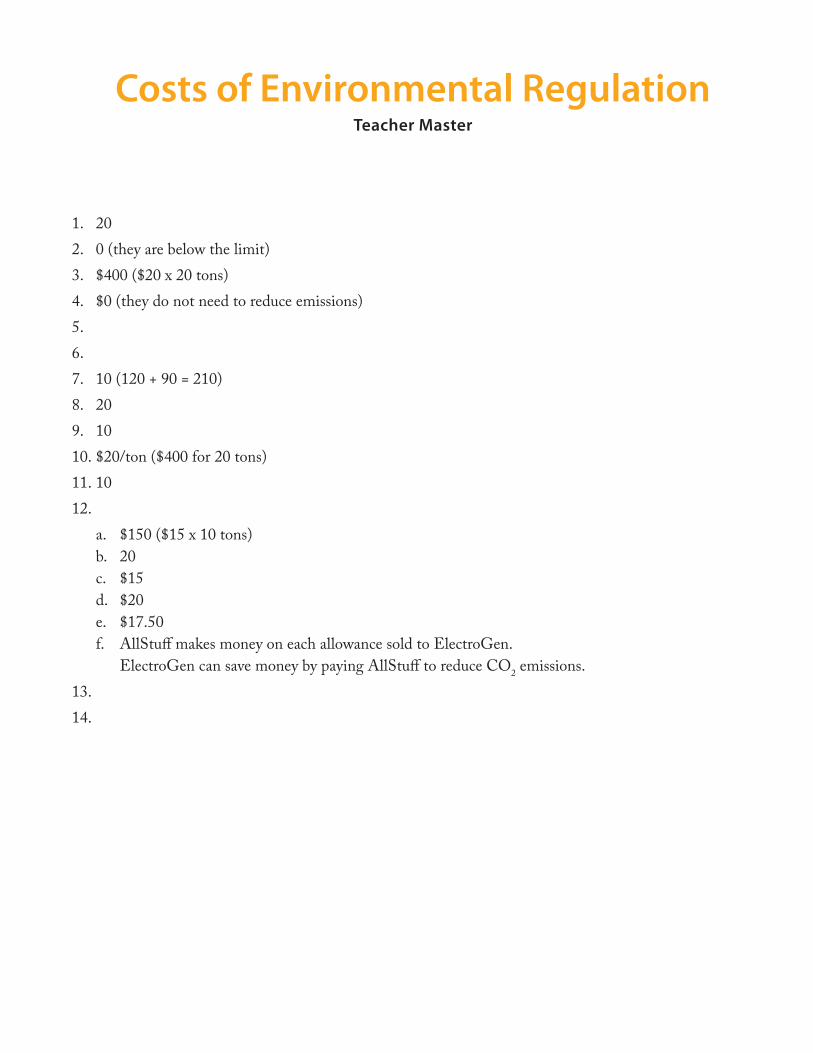
201. 0 (they are below the limit)2. $400 ($20 x 20 tons)3. $0 (they do not need to reduce emissions)4. 5.
6. 10 (120 + 90 = 210)7. 208. 109. $20/ton ($400 for 20 tons)10. 1011.
12. $150 ($15 x 10 tons)a. 20b. $15c. $20d. $17.50e. AllStuff makes money on each allowance sold to ElectroGen. f.
ElectroGen can save money by paying AllStuff to reduce CO2 emissions.13. 14.
Costs of Environmental RegulationTeacher Master
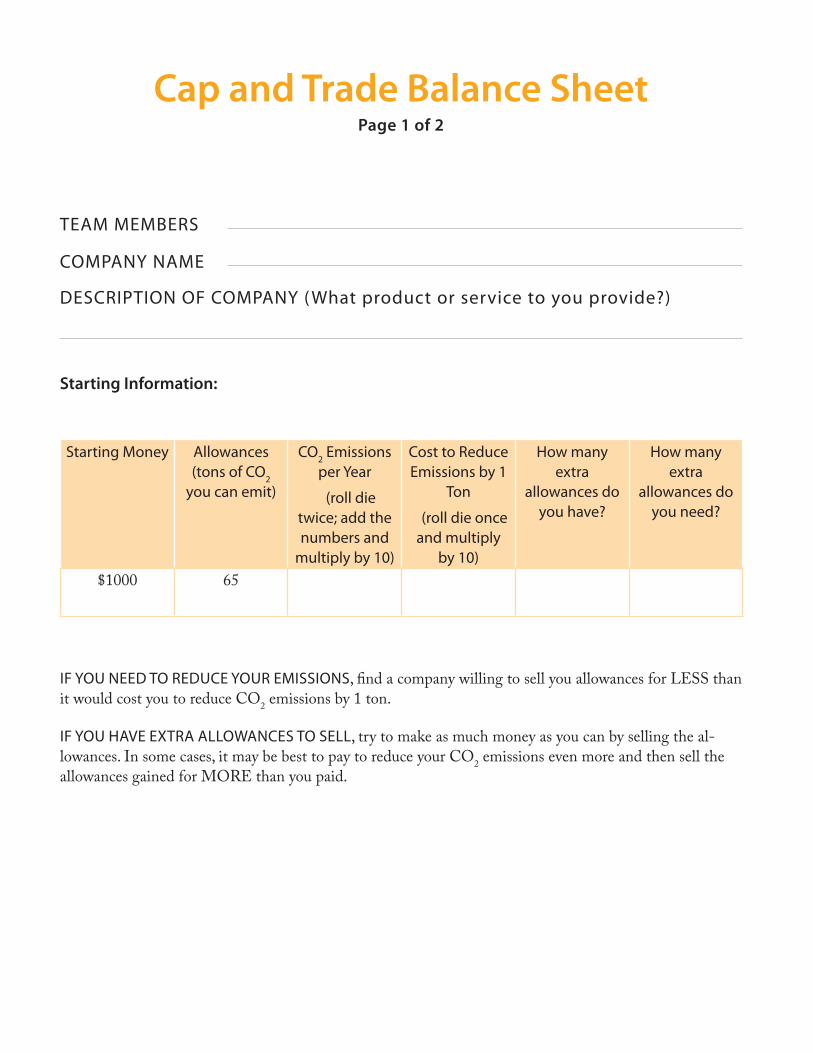
Cap and Trade Balance SheetPage 1 of 2
TEAM MEMBERS
COMpANy NAME
DESCRipTiON OF COMpANy ( What product or service to you provide?)
Starting Information:
Starting Money Allowances (tons of CO2
you can emit)
CO2 Emissions per year
(roll die twice; add the numbers and
multiply by 10)
Cost to Reduce Emissions by 1
Ton
(roll die once and multiply
by 10)
How many extra
allowances do you have?
How many extra
allowances do you need?
$1000 65
iF yOU NEED TO REDUCE yOUR EMiSSiONS, find a company willing to sell you allowances for LESS than it would cost you to reduce CO2 emissions by 1 ton.
iF yOU HAvE ExTRA AllOWANCES TO SEll, try to make as much money as you can by selling the al-lowances. In some cases, it may be best to pay to reduce your CO2 emissions even more and then sell the allowances gained for MORE than you paid.
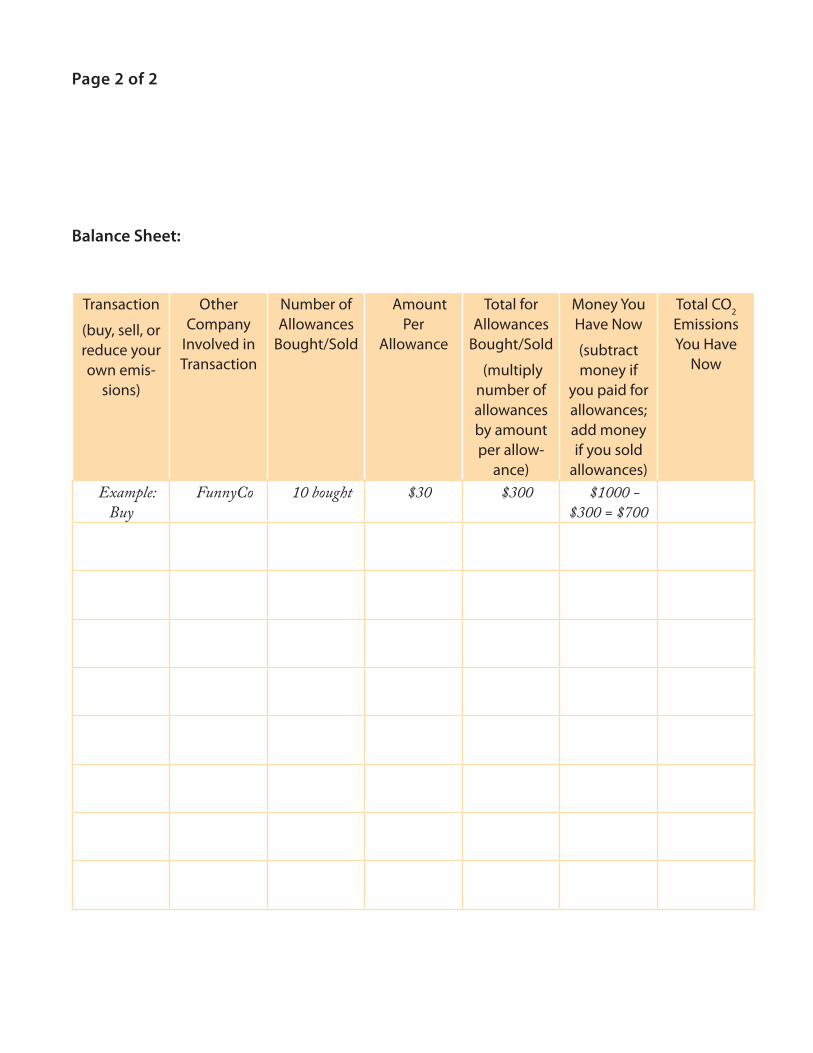
Balance Sheet:
Transaction
(buy, sell, or reduce your own emis-
sions)
Other Company
involved in Transaction
Number of Allowances
Bought/Sold
Amount per
Allowance
Total for Allowances
Bought/Sold
(multiply number of allowances by amount per allow-
ance)
Money you Have Now
(subtract money if
you paid for allowances; add money if you sold
allowances)
Total CO2 Emissions you Have
Now
Example: Buy
FunnyCo 10 bought $30 $300 $1000 - $300 = $700
Page 2 of 2
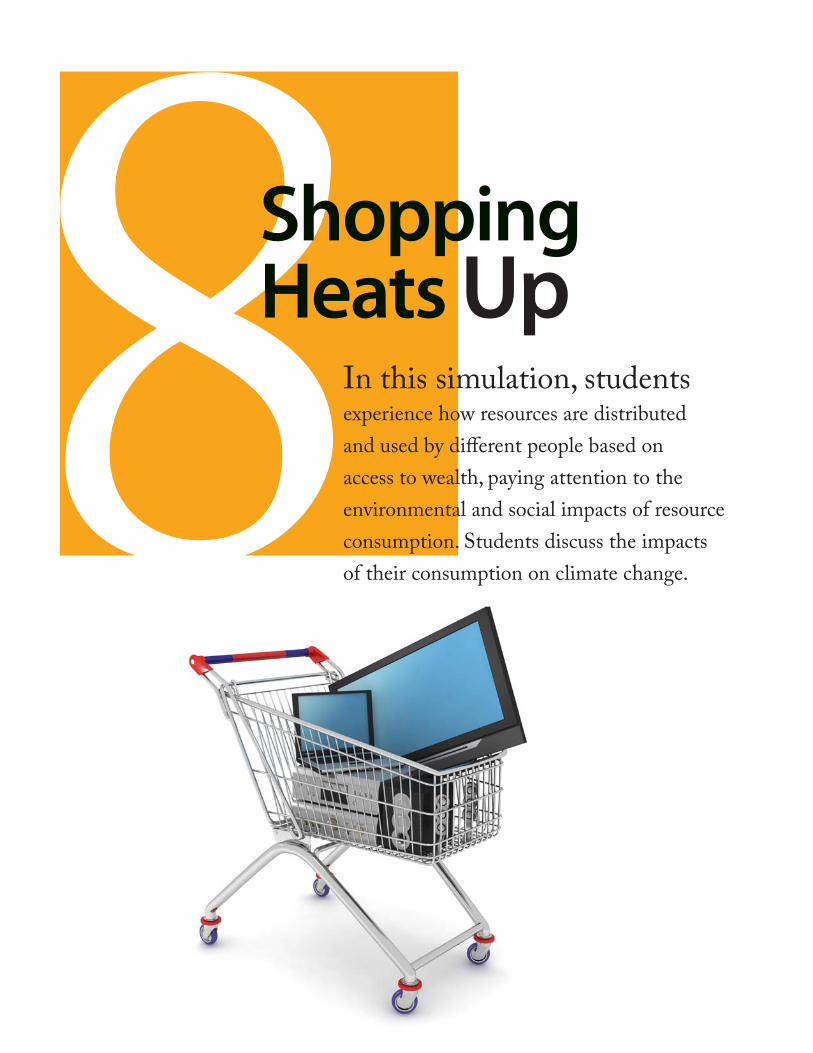
8In this simulation, students experience how resources are distributed and used by different people based on access to wealth, paying attention to the environmental and social impacts of resource consumption. Students discuss the impacts of their consumption on climate change.
ShoppingHeats Up
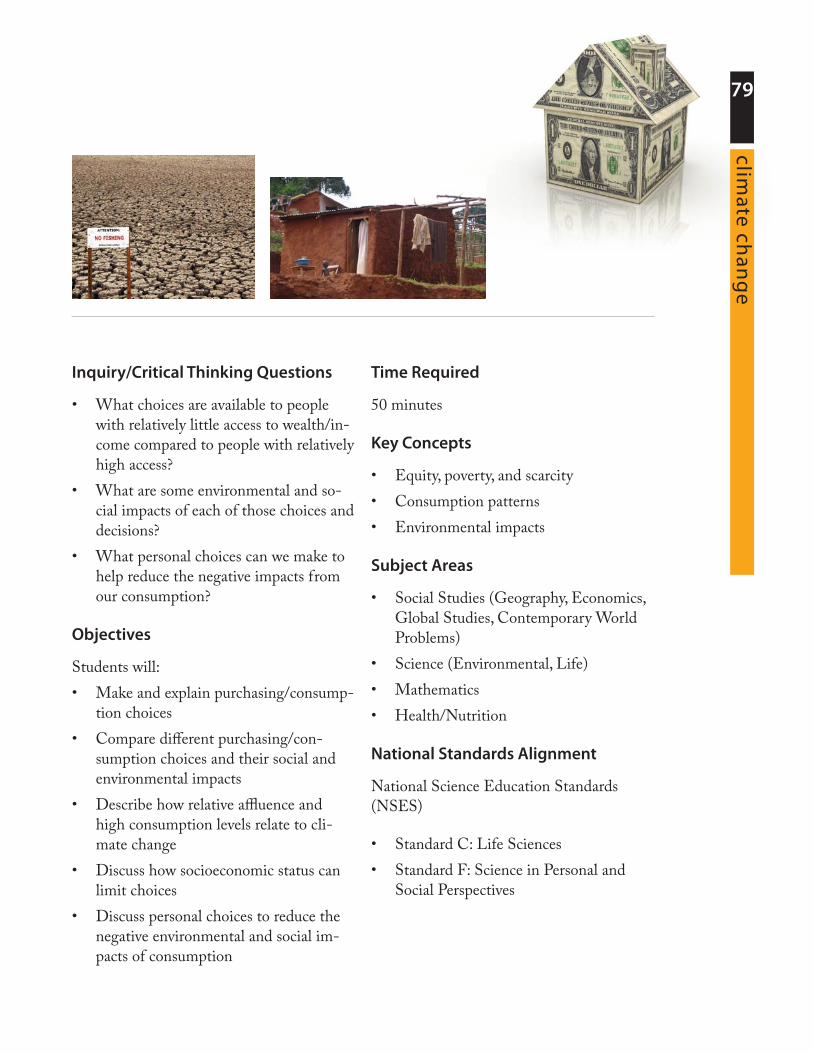
79clim
ate chan
ge
Inquiry/Critical Thinking Questions
What choices are available to people •with relatively little access to wealth/in-come compared to people with relatively high access?What are some environmental and so-•cial impacts of each of those choices and decisions?What personal choices can we make to •help reduce the negative impacts from our consumption?
Objectives
Students will: Make and explain purchasing/consump-•tion choicesCompare different purchasing/con-•sumption choices and their social and environmental impactsDescribe how relative affluence and •high consumption levels relate to cli-mate changeDiscuss how socioeconomic status can •limit choicesDiscuss personal choices to reduce the •negative environmental and social im-pacts of consumption
Time Required
50 minutes
Key Concepts
Equity, poverty, and scarcity•Consumption patterns•Environmental impacts•
Subject Areas
Social Studies (Geography, Economics, •Global Studies, Contemporary World Problems) Science (Environmental, Life) •Mathematics•Health/Nutrition•
National Standards Alignment
National Science Education Standards (NSES)
Standard C: Life Sciences •Standard F: Science in Personal and •Social Perspectives
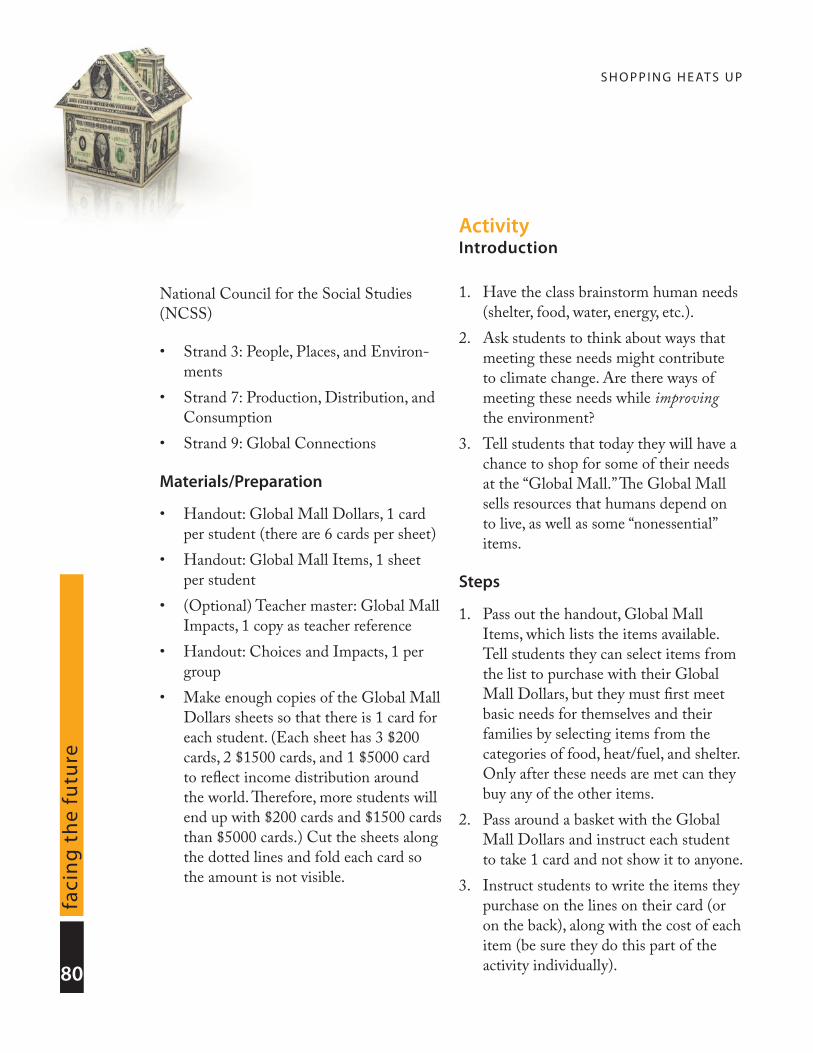
S H O P P I N G H E AT S U P
80
faci
ng
th
e fu
ture
National Council for the Social Studies (NCSS)
Strand 3: People, Places, and Environ-•mentsStrand 7: Production, Distribution, and •ConsumptionStrand 9: Global Connections•
Materials/Preparation
Handout: Global Mall Dollars, 1 card •per student (there are 6 cards per sheet)Handout: Global Mall Items, 1 sheet •per student(Optional) Teacher master: Global Mall •Impacts, 1 copy as teacher referenceHandout: Choices and Impacts, 1 per •groupMake enough copies of the Global Mall •Dollars sheets so that there is 1 card for each student. (Each sheet has 3 $200 cards, 2 $1500 cards, and 1 $5000 card to reflect income distribution around the world. Therefore, more students will end up with $200 cards and $1500 cards than $5000 cards.) Cut the sheets along the dotted lines and fold each card so the amount is not visible.
ActivityIntroduction
Have the class brainstorm human needs 1. (shelter, food, water, energy, etc.).Ask students to think about ways that 2. meeting these needs might contribute to climate change. Are there ways of meeting these needs while improving the environment?Tell students that today they will have a 3. chance to shop for some of their needs at the “Global Mall.” The Global Mall sells resources that humans depend on to live, as well as some “nonessential” items.
Steps
Pass out the handout, Global Mall 1. Items, which lists the items available. Tell students they can select items from the list to purchase with their Global Mall Dollars, but they must first meet basic needs for themselves and their families by selecting items from the categories of food, heat/fuel, and shelter. Only after these needs are met can they buy any of the other items.Pass around a basket with the Global 2. Mall Dollars and instruct each student to take 1 card and not show it to anyone.Instruct students to write the items they 3. purchase on the lines on their card (or on the back), along with the cost of each item (be sure they do this part of the activity individually).
S H O P P I N G H E AT S U P81
climate ch
ang
eWhile students are making their 4. purchasing choices, keep the pressure on to instill a sense of urgency. Ask, “Who’s done shopping?” Say, “The mall is closing soon!” Students with $200 Global Mall Dollars will likely finish much sooner than those with $1500 and $5000.When students finish their shopping, 5. have them break into 3 groups, putting students with the same dollar amounts ($200, $1500, $5000) together. (There will be more students with $200; if necessary, subdivide groups so you have 3-5 students per group.)In their groups, have students complete 6. the handout, Choices and Impacts. Ask them to discuss anything they could not afford to purchase and how not having those items might affect their lives.Circulate among the groups and suggest 7. impacts they might not have considered. Use the handout, Global Resource Mall Impacts as a teacher reference.Have each group report to the class on 8. the decisions they made and the impact these decisions would have on their lives and on the environment. Answers to the questions on the 9. Choices and Impacts handout are good starting points for more in-depth discussion. This lesson is also a good introduction for a discussion of who contributes most to climate change
(often wealthier nations) and who is most greatly affected by climate change (often poorer people living on marginalized land), as well as a discussion of how poor people can meet their basic needs and improve quality of life in a sustainable manner.
Lesson Extension
Assign each group a family from the book, Material World, by Peter Menzel. Have the students analyze what that family owns and brainstorm the relative impact those items might have on climate change. Have them examine and compare the carbon dioxide emissions from each family’s country.
Math Connection
Have students research cost-effective ways of reducing greenhouse gas emissions (e.g., compact fluorescent light bulbs, sealing cracks around windows and doors, unplug-ging appliances when not in use). Some high-tech solutions are too costly for many people to use; finding cost-effective mea-sures is essential to involve more people in climate change solutions. Give students a “budget” of $50 and challenge them to find the most effective ways to reduce CO2 emissions within that budget. How many pounds of CO2 can their $50 prevent from entering Earth’s atmosphere? Encourage them to share their findings with parents and teachers.
S H O P P I N G H E AT S U P
82
faci
ng
th
e fu
ture
Additional ResourcesBooks
Plan B: Rescuing a Planet Under Stress •and a Civilization in Trouble, Lester R. Brown, W.W. Norton & Company, New York, 2003. Brown calls for a worldwide mobilization to stabilize population and climate before they spiral out of control. It provides a plan for sustaining eco-nomic progress worldwide.You Can Prevent Global Warming (and •Save Money!), Jeffrey Langholz and Kelly Turner, Andrews McMeel Pub-lishing, Kansas City, 2003. 51 tips are provided for reducing greenhouse gas emissions at home while saving money. Potential impacts are reported in dollars saved and pounds of carbon dioxide not emitted.
Websites
http://www.undp.org• —The United Nations Development Programme (UNDP) is the UN’s global develop-ment network − an organization ad-vocating for change and connecting countries to knowledge, experience, and resources to help people build a better life.
http://ibuydifferent.org• —The Center for a New American Dream encourages people to consume responsibly in order to protect the environment, enhance quality of life, and promote social justice. Their “I Buy Different” website provides ideas on how to have a positive impact on the world through consump-tion choices.

Global Mall Dollars
$200
ITEM COST
$200
ITEM COST
$200
ITEM COST
$1,500
ITEM COST
$1,500
ITEM COST
$5,000
ITEM COST
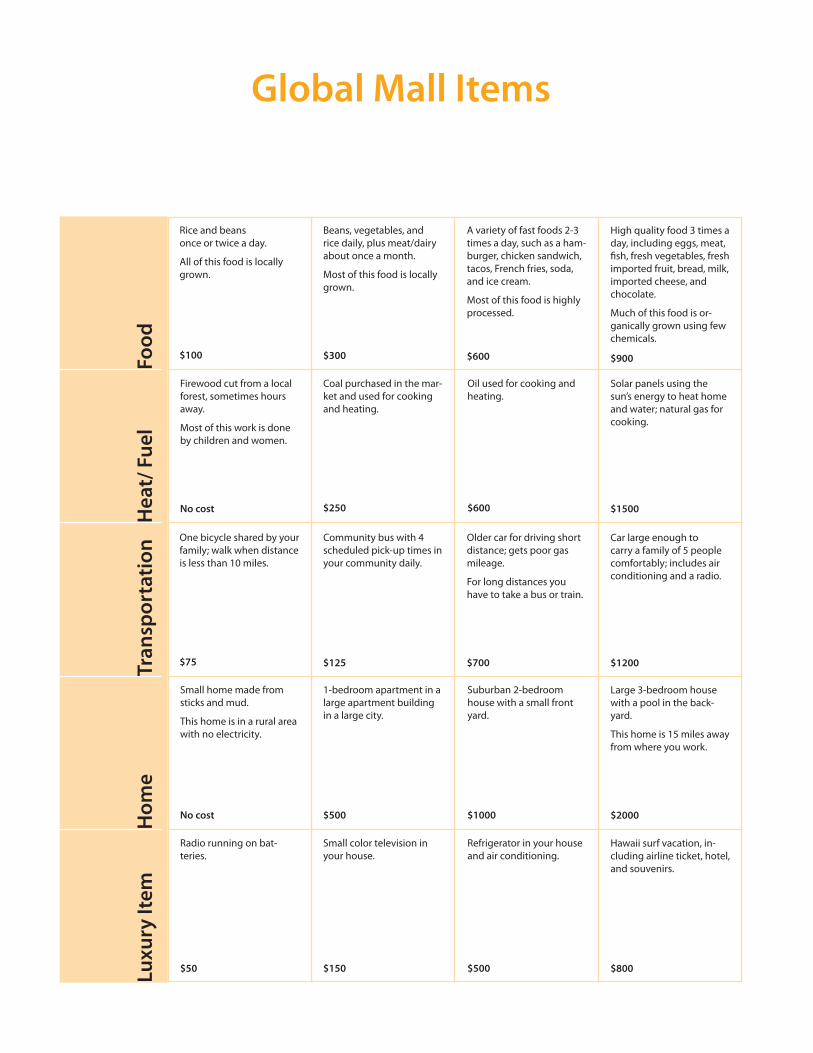
High quality food 3 times a day, including eggs, meat, fish, fresh vegetables, fresh imported fruit, bread, milk, imported cheese, and chocolate.
Much of this food is or-ganically grown using few chemicals.
$900
Rice and beansonce or twice a day.
All of this food is locally grown.
$100
Beans, vegetables, and rice daily, plus meat/dairy about once a month.
Most of this food is locally grown.
$300
A variety of fast foods 2-3 times a day, such as a ham-burger, chicken sandwich, tacos, French fries, soda, and ice cream.
Most of this food is highly processed.
$600
Solar panels using the sun’s energy to heat home and water; natural gas for cooking.
$1500
Firewood cut from a local forest, sometimes hours away.
Most of this work is done by children and women.
No cost
Coal purchased in the mar-ket and used for cooking and heating.
$250
Oil used for cooking and heating.
$600
Car large enough to carry a family of 5 people comfortably; includes air conditioning and a radio.
$1200
One bicycle shared by your family; walk when distance is less than 10 miles.
$75
Community bus with 4 scheduled pick-up times in your community daily.
$125
Older car for driving short distance; gets poor gas mileage.
For long distances you have to take a bus or train.
$700
Large 3-bedroom house with a pool in the back-yard.
This home is 15 miles away from where you work.
$2000
Small home made from sticks and mud.
This home is in a rural area with no electricity.
No cost
1-bedroom apartment in a large apartment building in a large city.
$500
Suburban 2-bedroom house with a small front yard.
$1000
Hawaii surf vacation, in-cluding airline ticket, hotel, and souvenirs.
$800
Radio running on bat-teries.
$50
Small color television in your house.
$150
Refrigerator in your house and air conditioning.
$500
Food
Hea
t/ F
uel
Tran
spor
tatio
nH
ome
Luxu
ry It
em
Global Mall Items
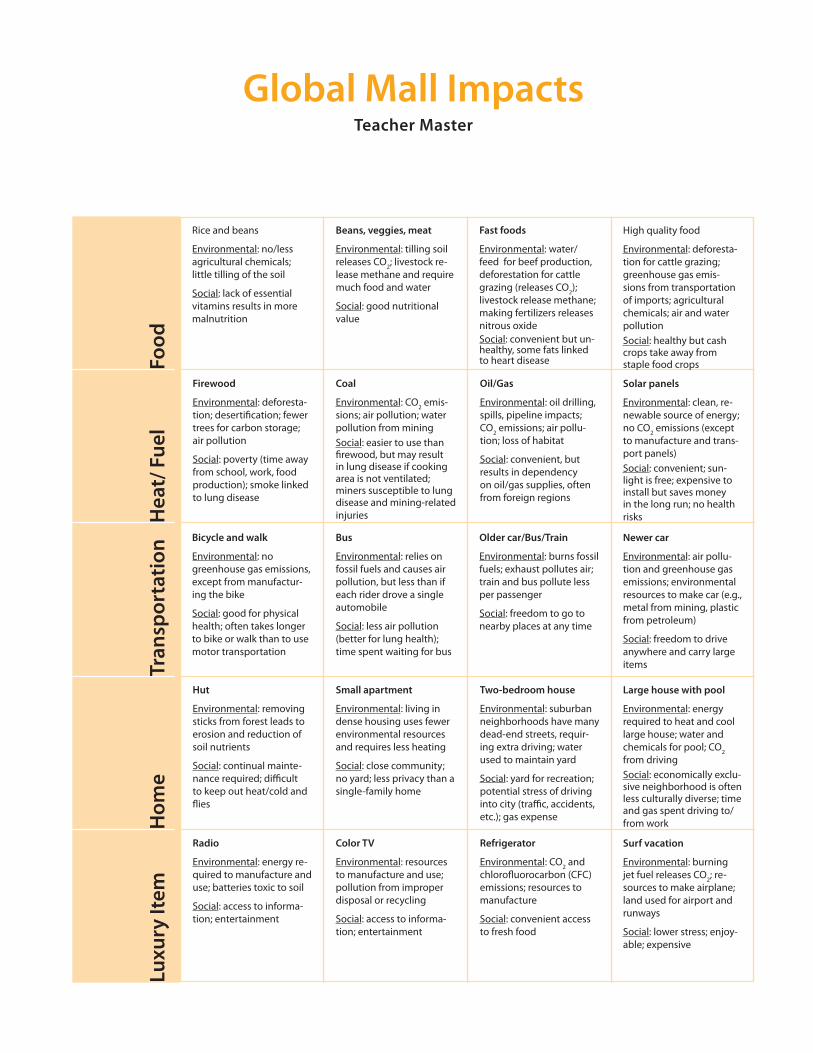
High quality food
Environmental: deforesta-tion for cattle grazing; greenhouse gas emis-sions from transportation of imports; agricultural chemicals; air and water pollutionSocial: healthy but cash crops take away from staple food crops
Rice and beans
Environmental: no/less agricultural chemicals; little tilling of the soil
Social: lack of essential vitamins results in more malnutrition
Beans, veggies, meat
Environmental: tilling soil releases CO2; livestock re-lease methane and require much food and water
Social: good nutritional value
Fast foods
Environmental: water/feed for beef production, deforestation for cattle grazing (releases CO2); livestock release methane; making fertilizers releases nitrous oxideSocial: convenient but un-healthy, some fats linked to heart disease
Solar panels
Environmental: clean, re-newable source of energy; no CO2 emissions (except to manufacture and trans-port panels)Social: convenient; sun-light is free; expensive to install but saves money in the long run; no health risks
Firewood
Environmental: deforesta-tion; desertification; fewer trees for carbon storage; air pollution
Social: poverty (time away from school, work, food production); smoke linked to lung disease
Coal
Environmental: CO2 emis-sions; air pollution; water pollution from miningSocial: easier to use than firewood, but may result in lung disease if cooking area is not ventilated; miners susceptible to lung disease and mining-related injuries
Oil/Gas
Environmental: oil drilling, spills, pipeline impacts; CO2 emissions; air pollu-tion; loss of habitat
Social: convenient, but results in dependency on oil/gas supplies, often from foreign regions
Newer car
Environmental: air pollu-tion and greenhouse gas emissions; environmental resources to make car (e.g., metal from mining, plastic from petroleum)
Social: freedom to drive anywhere and carry large items
Bicycle and walk
Environmental: no greenhouse gas emissions, except from manufactur-ing the bike
Social: good for physical health; often takes longer to bike or walk than to use motor transportation
Bus
Environmental: relies on fossil fuels and causes air pollution, but less than if each rider drove a single automobile
Social: less air pollution (better for lung health); time spent waiting for bus
Older car/Bus/Train
Environmental: burns fossil fuels; exhaust pollutes air; train and bus pollute less per passenger
Social: freedom to go to nearby places at any time
Large house with pool
Environmental: energy required to heat and cool large house; water and chemicals for pool; CO2 from driving Social: economically exclu-sive neighborhood is often less culturally diverse; time and gas spent driving to/from work
Hut
Environmental: removing sticks from forest leads to erosion and reduction of soil nutrients
Social: continual mainte-nance required; difficult to keep out heat/cold and flies
Small apartment
Environmental: living in dense housing uses fewer environmental resources and requires less heating
Social: close community; no yard; less privacy than a single-family home
Two-bedroom house
Environmental: suburban neighborhoods have many dead-end streets, requir-ing extra driving; water used to maintain yard
Social: yard for recreation; potential stress of driving into city (traffic, accidents, etc.); gas expense
Surf vacation
Environmental: burning jet fuel releases CO2; re-sources to make airplane; land used for airport and runways
Social: lower stress; enjoy-able; expensive
Radio
Environmental: energy re-quired to manufacture and use; batteries toxic to soil
Social: access to informa-tion; entertainment
Color TV
Environmental: resources to manufacture and use; pollution from improper disposal or recycling
Social: access to informa-tion; entertainment
Refrigerator
Environmental: CO2 and chlorofluorocarbon (CFC) emissions; resources to manufacture
Social: convenient access to fresh food
Food
Hea
t/ F
uel
Tran
spor
tatio
nH
ome
Luxu
ry It
em
Global Mall ImpactsTeacher Master
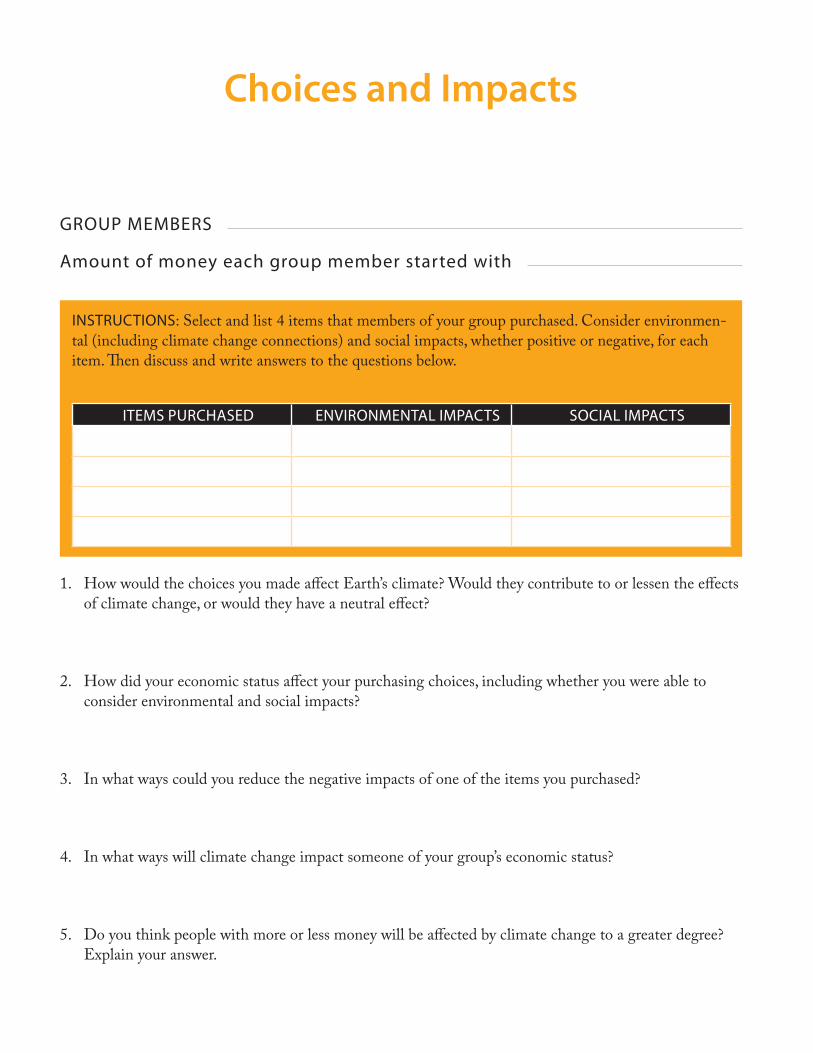
INSTRUCTIONS: Select and list 4 items that members of your group purchased. Consider environmen-tal (including climate change connections) and social impacts, whether positive or negative, for each item. Then discuss and write answers to the questions below.
ITEMS PURCHASEd ENvIRONMENTAL IMPACTS SOCIAL IMPACTS
How would the choices you made affect Earth’s climate? Would they contribute to or lessen the effects 1. of climate change, or would they have a neutral effect?
How did your economic status affect your purchasing choices, including whether you were able to 2. consider environmental and social impacts?
In what ways could you reduce the negative impacts of one of the items you purchased? 3.
In what ways will climate change impact someone of your group’s economic status? 4.
Do you think people with more or less money will be affected by climate change to a greater degree? 5. Explain your answer.
Choices and Impacts
GROUP MEMBERS
Amount of money each group member started with
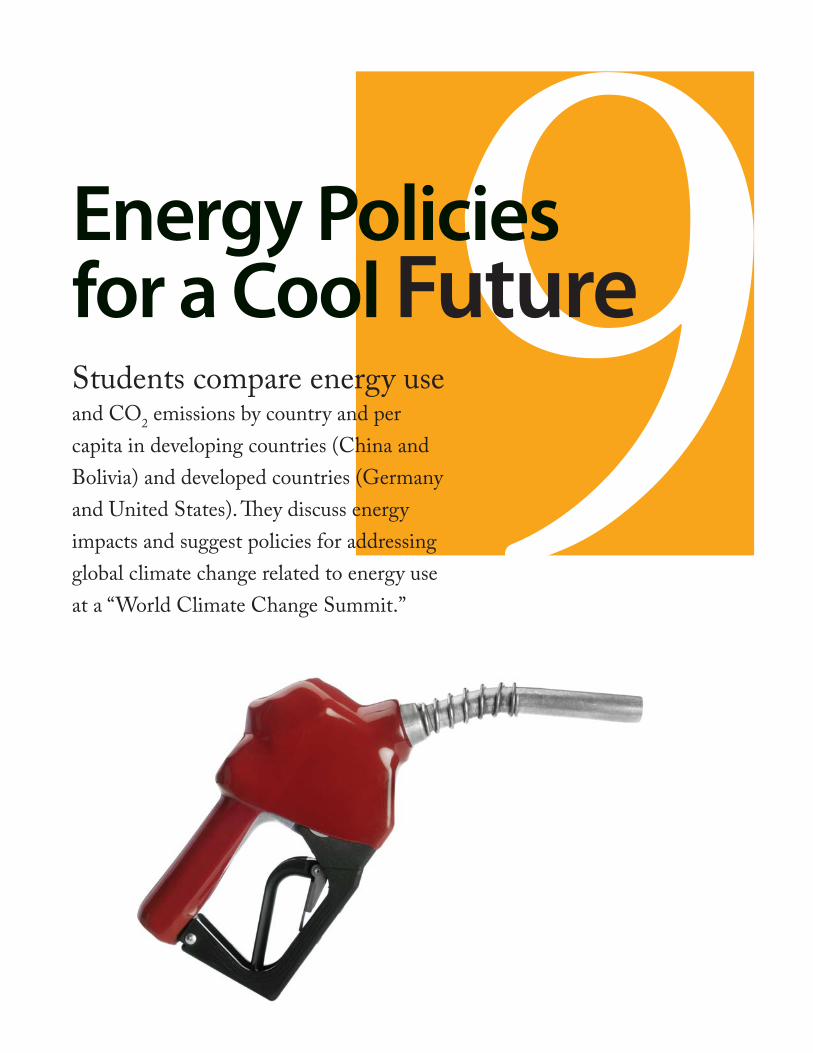
9Energy Policies for a Cool FutureStudents compare energy use and CO2 emissions by country and per capita in developing countries (China and Bolivia) and developed countries (Germany and United States). They discuss energy impacts and suggest policies for addressing global climate change related to energy use at a “World Climate Change Summit.”
E N E R G Y P O L I C I E S F O R A CO O L F U T U R E
88
faci
ng
th
e fu
ture
Inquiry/Critical Thinking Questions
How does total energy use compare •among different countries in the world, and among different sectors within those countries?How does per capita energy use com-•pare between different countries?How is energy use connected to climate •change?What can be done to conserve energy •resources and reduce CO2 emissions?
Objectives
Students will:Calculate and compare the percentage •of energy use and emissions by country to world average energy use and emis-sionsBrainstorm impacts of energy use and •sustainable energy solutionsDevelop a policy addressing global cli-•mate changePresent their policy at a mock “World •Climate Change Summit”
Time Required
Two 50-minute class periods
Key Concepts
Energy use•Climate change•Energy conservation•
Subject Areas
Social Studies (World History, Geogra-•phy, Civics/Government, Global Stud-ies, Contemporary World Problems)Science (Earth, Environmental, Physi-•cal)Mathematics•Language Arts •
National Standards Alignment
National Science Education Standards (NSES)
Standard D: Earth and Space Science•Standard E: Science and Technology•Standard F: Science in Personal and •Social Perspectives
National Council for the Social Studies (NCSS)
Strand 3: People, Places, and Environ-•mentsStrand 6: Power, Authority, and Gover-•nance
E N E R G Y P O L I C I E S F O R A CO O L F U T U R E89
climate ch
ang
eStrand 7: Production, Distribution, and •ConsumptionStrand 8: Science, Technology, and •SocietyStrand 9: Global Connections•Strand 10: Civic Ideals and Practices•
Vocabulary
developed country• —a nation with high average per capita (or per-person) in-come; includes countries such as Japan, Canada, the U.S., Australia, New Zea-land, and countries in western Europe developing country• —a nation with low average per capita income; includes all countries except developed countries and those in the former Soviet Union and Eastern Europe
policy• —a plan of action for tackling issues; often initiated by a political party in governmentsustainability• —meeting current needs without limiting the ability of future generations to meet their needs
Materials/Preparation
A few items to show during the intro-•duction segment of the activity (e.g., food, clothing, a book, computer)Handout: Total Energy Use and CO• 2 Emissions by Countries, 1 per group of 2-3 studentsHandout: Assessing Energy Possibili-•ties, 1 per student groupCalculators, 1 per student group •
“Learn more about the issues and contact government representatives with your concerns and ideas.
Student Reading 05, page 121
E N E R G Y P O L I C I E S F O R A CO O L F U T U R E
90
faci
ng
th
e fu
ture
Activity—Day 1 Introduction
Show students some items (e.g., food, 1. clothing, a book, computer) 1 at a time. Ask them how energy is related to all of the items shown. (It was required to manufacture them.)Tell the class they are going to do an 2. activity that examines and compares the type and amount of energy use and emissions in different countries.
Steps
Write on the board or overhead these 1. 3 energy sectors: transportation, residential, and industrial/commercial.Ask students which energy sector some 2. of the following activities and items would belong to: cars, home heating and cooling, lights, food production. List each one below the appropriate sector(s). Note that some items or activities may fall under more than one category. For example, driving a car would be “transportation,” but manufacturing the car would be “industrial.” Have students brainstorm more activities or items for each sector and add these to the list.Tell students they are going to be 3. looking at actual numbers for energy use and carbon emissions for these sectors in different countries.Divide the class into 12 groups of 2-3 4. students. Assign groups to a sector and
a country; each group represents 1 of the 3 energy use sectors (transportation, residential, and industrial/commercial) for each of the 4 countries. For example, 1 group will be the transportation sector for India.Give each group a copy of Total Energy 5. Use and CO2 Emissions by Countries.Give groups about 10-15 minutes to 6. complete the table for their country. Each group will need a calculator to figure out the percentages. Ask for a volunteer from each country 7. to report the percentages for that country in the first table. Have students fill in their tables based on the reported data from the other groups. Make sure that groups representing different sectors from the same country have the same results as those reported to the class.Give groups 15 minutes to answer the 8. questions on the handout, Assessing Energy Possibilities.Bring the class back together for the 9. following reflection questions. After the discussion, collect the worksheets and pass them out again on Day 2 of the activity.
Reflection
How are energy use and CO1. 2 emissions related?
E N E R G Y P O L I C I E S F O R A CO O L F U T U R E91
climate ch
ang
eWhich sector uses the most energy? 2. Which country uses the most energy? 3. Do you think this is primarily due to per-capita energy use, population, or other factors?Which country has the highest per 4. capita energy use? What does per capita energy use tell you about how an “average” person lives in each country?Why should we care about energy use 5. and emissions? What impacts does it have on people and our planet? How does energy use relate to climate change?Have students share and discuss possible 6. sustainable energy solutions. (Tell them that the next day they will get to explore their ideas for reducing energy in more depth at a “World Climate Change Summit.”)
Activity – Day 2 Introduction
Welcome the class to the “World 1. Climate Change Summit.” Tell students they will work together in sector groups to develop a policy addressing energy consumption, conservation, and emission reductions for their sector in all countries. Review the term “policy” with students. 2. A policy is a plan of action for tackling
issues, often initiated by a political party in government. For example, the Kyoto Protocol is an international policy for addressing climate change.
Steps
Hand out the worksheets from Day 1. 1 and arrange the class so that each sector joins the same sector from the other countries. There should be 3 large groups: a transportation sector, a residential sector, and an industrial/commercial sector.Assign students in each sector group 2. to act as facilitator, timekeeper, note taker, and reporter. If necessary, explain what each responsibility involves (you can also rotate responsibilities between rounds).Tell students that there will be several 3. rounds of discussions at the summit. After each round, the group reporter will share the group’s ideas with the rest of the attendees (i.e., the rest of the class).Students should take on the roles of 4. their countries during this activity.For round 1, give the groups 4 minutes 5. to have country members introduce themselves and share their ideas for reducing energy use and CO2 emissions in the sector, referring to their worksheets from the first day.
E N E R G Y P O L I C I E S F O R A CO O L F U T U R E
92
faci
ng
th
e fu
ture
The timekeeper should make sure each country has 1 minute to speak.For round 2, give the groups 3-4 6. minutes to answer the following questions:
In your sector, which countries •should be required to reduce their energy use and/or CO2 emissions? Do all 4 countries share equal responsibility for reducing emissions?How much should each country •reduce their energy use and/or CO2 emissions?
Have the reporter from each group 7. present the group’s answers, and comment on whether it was easy or difficult for group members to come to an agreement.For round 3, give the groups 8-10 8. minutes to agree on 2 or 3 specific policy recommendations for reversing and/or preventing climate change. At least 1 recommendation should focus on reducing energy use (i.e., conserving energy) and 1 on reducing CO2 emissions for the group’s sector worldwide. For example, a policy recommendation for the transportation sector might be: “All countries should prohibit any motor vehicles that run at less than 30 per miles per gallon.” Encourage groups to consider how this
policy would affect their country, and whether different strategies might be needed for different countries. (Students may also want to consider how the policy could be enforced.)Have the reporter from each 9. group present the group’s policy recommendations. List each proposed policy on the board. Tell students that the final round is a 10. joint session in which all groups will discuss the pros and cons of each policy recommendation, before voting for 1 policy for each sector.Facilitate a discussion in which 11. students can ask questions and give arguments in favor of or against each recommendation. Spend no more than 4 minutes on the recommendations for each sector.Have students vote for 1 solution from 12. each sector that they think will be most effective in reducing energy use and CO2 emissions. When voting, students should keep in mind the particular situation of their assigned country and sector.Conclude with the following reflection 13. questions.
E N E R G Y P O L I C I E S F O R A CO O L F U T U R E93
climate ch
ang
eReflection
What are some of the difficulties 1. involved in creating an international agreement? Were all countries within your sector in agreement? If not, what were the sources of conflict?Why are all solutions not appropriate 2. for people in all places?Often, some countries are categorized 3. as “developed” while others are “developing,” depending on the average income per person in the country. Based on the energy use per person, would you consider the country you represented in this activity to be developed or developing? How does energy use relate to income?Do you think that people in both 4. developed and developing countries share equal responsibility in tackling climate change? If not, which type of countries should bear greater responsibility for implementing climate change solutions? Why? Sustainability means meeting current 5. needs without compromising the ability of future generations to meet their needs. How can developing countries meet their growing energy needs and develop in a sustainable manner? Why might developed countries be interested in helping developing countries to grow in a sustainable manner?
Writing Extension
Have students write a letter to a local or national government official, urging him or her to adopt their favorite recommendation from the World Climate Change Summit. Students can work individually or compose the letter in groups, or they can compile their ideas into 1 letter from the class.
Art Extension
Have students invent an “energy-saver technology” that will help people, busi-nesses, and/or countries to reduce their CO2 emissions. Have students make drawings or models of their ideas. Encourage students to use their imaginations to think of creative solutions, whether they are solar-powered cell phone chargers, or a gadget that turns lights off automatically. You can have stu-dents consider how the technology could be applied in a developing or a developed country. Have students present their inven-tions to the class and/or display them in the school.
Action Projects
Have students write an essay explaining •what they would do if they were unable to use any oil- or gasoline-powered ve-hicles once a week. Then have them plan and implement “fossil-fuel free” activity days for their family and neighborhood.
E N E R G Y P O L I C I E S F O R A CO O L F U T U R E
94
faci
ng
th
e fu
ture
Create a more energy-efficient learning •environment. Many local energy com-panies or city utility agencies are team-ing up with students to save schools and districts energy and money, and to beautify learning environments. By providing energy audits, technical as-sistance with retrofit plans, information about financing methods, staff training, and educational programs, these com-panies and agencies can help schools identify many ways to save energy and money. Have students investigate local energy and utility companies to identify the resources and opportunities available to address energy consumption in their school or district. Your students can play a critical role in educating their peers and community on the many benefits of creating a more energy-efficient learning environment.
Additional ResourcesBooks
Stormy Weather: 101 Solutions to Global •Climate Change, Guy Dauncey with Patrick Mazza, New Society Publishers, 2001. This book provides a compre-hensive overview of energy issues and practical solutions. Material World: A Global Family Portrait• , Peter Menzel, Sierra Club Books, 1994. Families are pictured around the world in front of their homes with all of their material possessions. Information on energy use and emissions is included in the back for each country.
Websites
http://www.earthtrends.wri.org• —World Resources Institute’s “Earth Trends” is a comprehensive on-line database that focuses on environmental, economic, and social trends. “Country Profiles” present environmental infor-mation about key variables for several topic areas. View charts and graphs to find statistics for over 220 countries. http://cait.wri.org• —The Climate Analysis Indicators Tool (CAIT) is an information and analysis tool on global climate change developed by the World Resources Institute. The website features a multitude of charts and graphs on global climate change and energy use by sector and country.http://unfccc.int• —The United Nations Framework Convention on Climate Change provides information about measures taken by countries in response to climate change. Links to the Kyoto Protocol and background information are provided.http://www.princeton.edu/~cmi/•resources/stabwedge.htm—The Car-bon Mitigation Initiative at Princeton University provides information on stabilization wedges. Information on how current technologies can stabilize carbon emissions is provided, as well as a stabilization wedge game for advanced students.
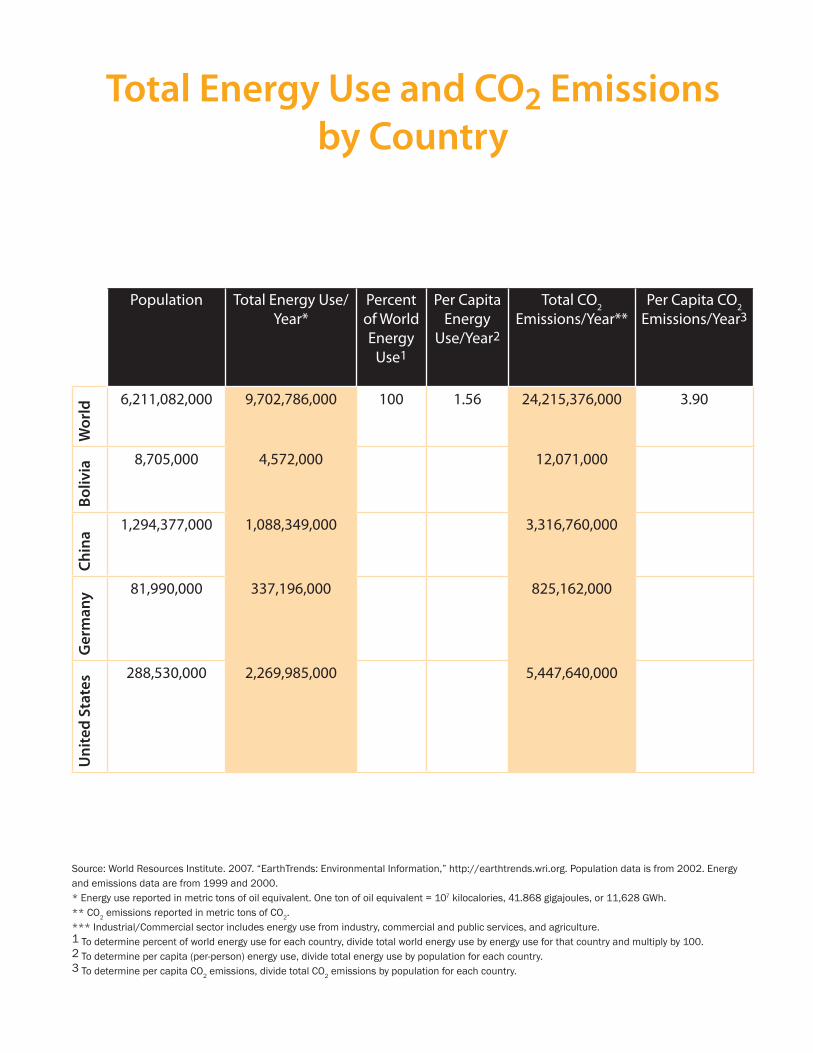
Population Total Energy Use/Year*
Percent of World Energy
Use1
Per Capita Energy
Use/Year2
Total CO2 Emissions/Year**
Per Capita CO2 Emissions/Year3
Wor
ld 6,211,082,000 9,702,786,000 100 1.56 24,215,376,000 3.90
Boliv
ia 8,705,000 4,572,000 12,071,000
Chin
a
1,294,377,000 1,088,349,000 3,316,760,000
Ger
man
y 81,990,000 337,196,000 825,162,000
Uni
ted
Stat
es
288,530,000 2,269,985,000 5,447,640,000
Total Energy Use and CO2 Emissions by Country
Source: World Resources Institute. 2007. “EarthTrends: Environmental Information,” http://earthtrends.wri.org. Population data is from 2002. Energy and emissions data are from 1999 and 2000.* Energy use reported in metric tons of oil equivalent. One ton of oil equivalent = 107 kilocalories, 41.868 gigajoules, or 11,628 GWh.** CO2 emissions reported in metric tons of CO2.*** Industrial/Commercial sector includes energy use from industry, commercial and public services, and agriculture.1 To determine percent of world energy use for each country, divide total world energy use by energy use for that country and multiply by 100.2 To determine per capita (per-person) energy use, divide total energy use by population for each country.3 To determine per capita CO2 emissions, divide total CO2 emissions by population for each country.
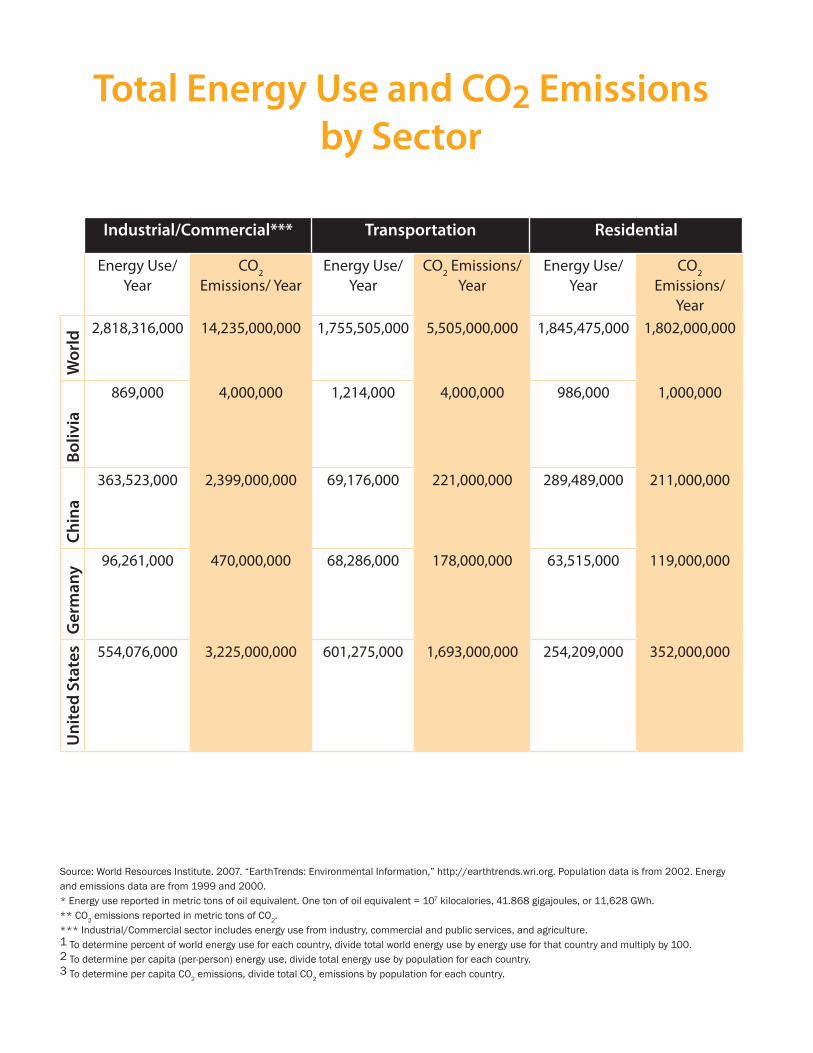
Industrial/Commercial*** Transportation Residential
Energy Use/Year
CO2 Emissions/ Year
Energy Use/Year
CO2 Emissions/ Year
Energy Use/Year
CO2 Emissions/
Year
Wor
ld
2,818,316,000 14,235,000,000 1,755,505,000 5,505,000,000 1,845,475,000 1,802,000,000
Boliv
ia
869,000 4,000,000 1,214,000 4,000,000 986,000 1,000,000
Chin
a
363,523,000 2,399,000,000 69,176,000 221,000,000 289,489,000 211,000,000
Ger
man
y 96,261,000 470,000,000 68,286,000 178,000,000 63,515,000 119,000,000
Uni
ted
Stat
es 554,076,000 3,225,000,000 601,275,000 1,693,000,000 254,209,000 352,000,000
Total Energy Use and CO2 Emissions by Sector
Source: World Resources Institute. 2007. “EarthTrends: Environmental Information,” http://earthtrends.wri.org. Population data is from 2002. Energy and emissions data are from 1999 and 2000.* Energy use reported in metric tons of oil equivalent. One ton of oil equivalent = 107 kilocalories, 41.868 gigajoules, or 11,628 GWh.** CO2 emissions reported in metric tons of CO2.*** Industrial/Commercial sector includes energy use from industry, commercial and public services, and agriculture.1 To determine percent of world energy use for each country, divide total world energy use by energy use for that country and multiply by 100.2 To determine per capita (per-person) energy use, divide total energy use by population for each country.3 To determine per capita CO2 emissions, divide total CO2 emissions by population for each country.
Look at the number for per capita energy use in your country. Does this number mean that every 1. person in your country uses this amount of energy?
What types of activities or items use energy in your sector?2.
Do you think people in your sector can have an important impact on reducing energy use in your 3. country? Why or why not?
What are some ideas for reducing the amount of 4. energy used in this sector in your country?
What are some ideas for reducing the level of 5. CO2 emissions for your sector and country? Are there ways to use energy that would produce lower CO2 emissions?
What might be some obstacles to making these changes in your sector and country, and what are some 6. ideas for overcoming these obstacles?
Your sector’s energy use per year CO2 emissions per year
GROUP MEMBERS
COUNTRY ENERGY SECTOR
Assessing Energy Possibilities
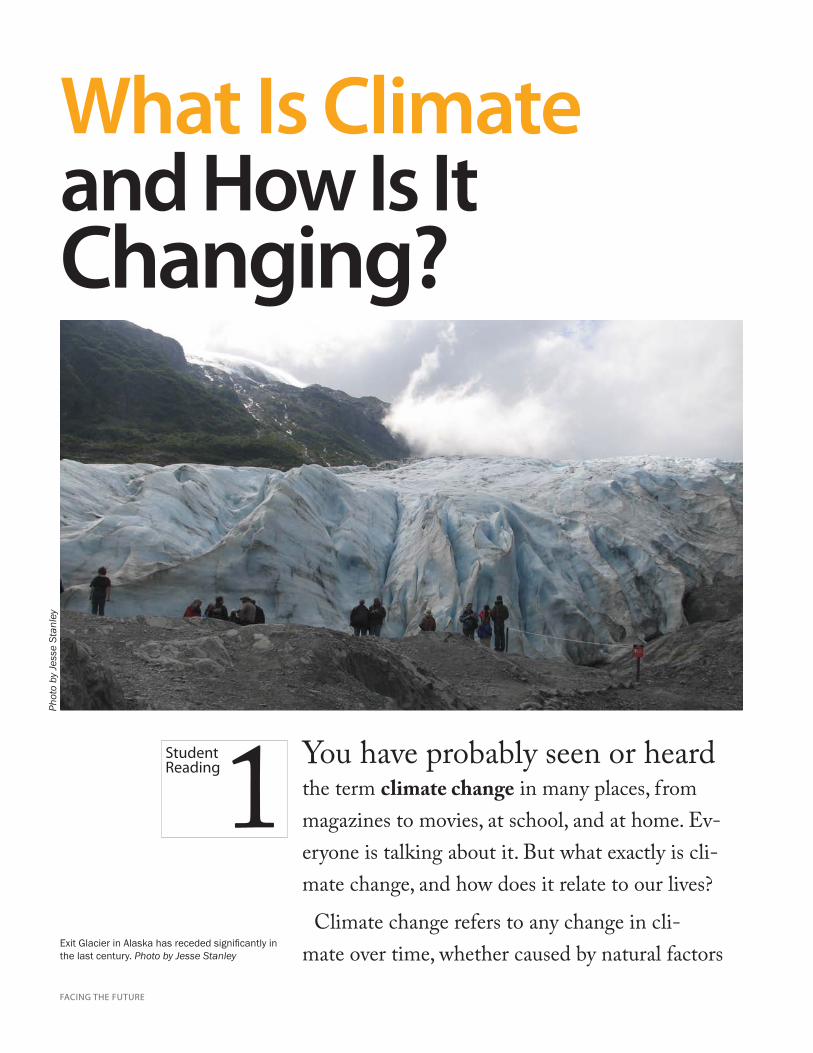
FACING THE FUTURE
What Is Climate and How Is It Changing?
1Student Reading You have probably seen or heard
the term climate change in many places, from magazines to movies, at school, and at home. Ev-eryone is talking about it. But what exactly is cli-mate change, and how does it relate to our lives?
Climate change refers to any change in cli-mate over time, whether caused by natural factors
Phot
o by
Jess
e St
anle
y
Exit Glacier in Alaska has receded significantly in the last century. Photo by Jesse Stanley
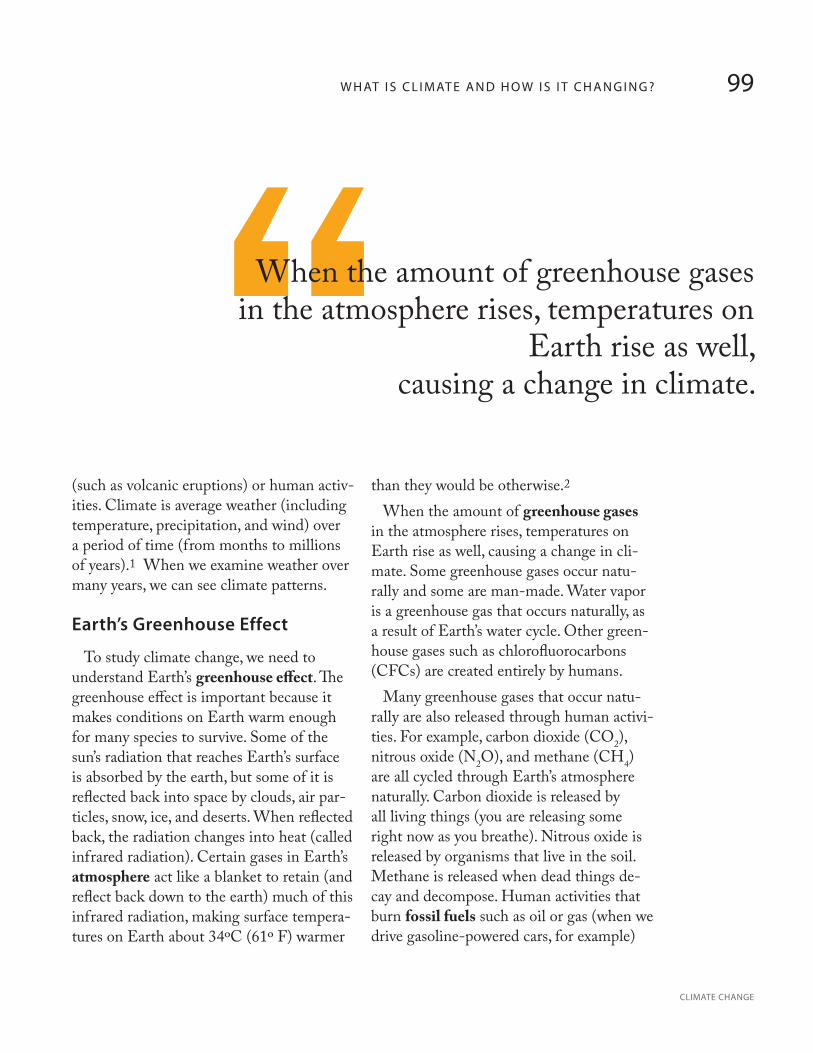
99W H AT I S C L I M AT E A N D H O W I S I T C H A N G I N G ?
CLIMATE CHANGE
“When the amount of greenhouse gases in the atmosphere rises, temperatures on
Earth rise as well, causing a change in climate.
(such as volcanic eruptions) or human activ-ities. Climate is average weather (including temperature, precipitation, and wind) over a period of time (from months to millions of years).1 When we examine weather over many years, we can see climate patterns.
Earth’s Greenhouse Effect
To study climate change, we need to understand Earth’s greenhouse effect. The greenhouse effect is important because it makes conditions on Earth warm enough for many species to survive. Some of the sun’s radiation that reaches Earth’s surface is absorbed by the earth, but some of it is reflected back into space by clouds, air par-ticles, snow, ice, and deserts. When reflected back, the radiation changes into heat (called infrared radiation). Certain gases in Earth’s atmosphere act like a blanket to retain (and reflect back down to the earth) much of this infrared radiation, making surface tempera-tures on Earth about 34ºC (61º F) warmer
than they would be otherwise.2 When the amount of greenhouse gases
in the atmosphere rises, temperatures on Earth rise as well, causing a change in cli-mate. Some greenhouse gases occur natu-rally and some are man-made. Water vapor is a greenhouse gas that occurs naturally, as a result of Earth’s water cycle. Other green-house gases such as chlorofluorocarbons (CFCs) are created entirely by humans.
Many greenhouse gases that occur natu-rally are also released through human activi-ties. For example, carbon dioxide (CO2), nitrous oxide (N2O), and methane (CH4) are all cycled through Earth’s atmosphere naturally. Carbon dioxide is released by all living things (you are releasing some right now as you breathe). Nitrous oxide is released by organisms that live in the soil. Methane is released when dead things de-cay and decompose. Human activities that burn fossil fuels such as oil or gas (when we drive gasoline-powered cars, for example)
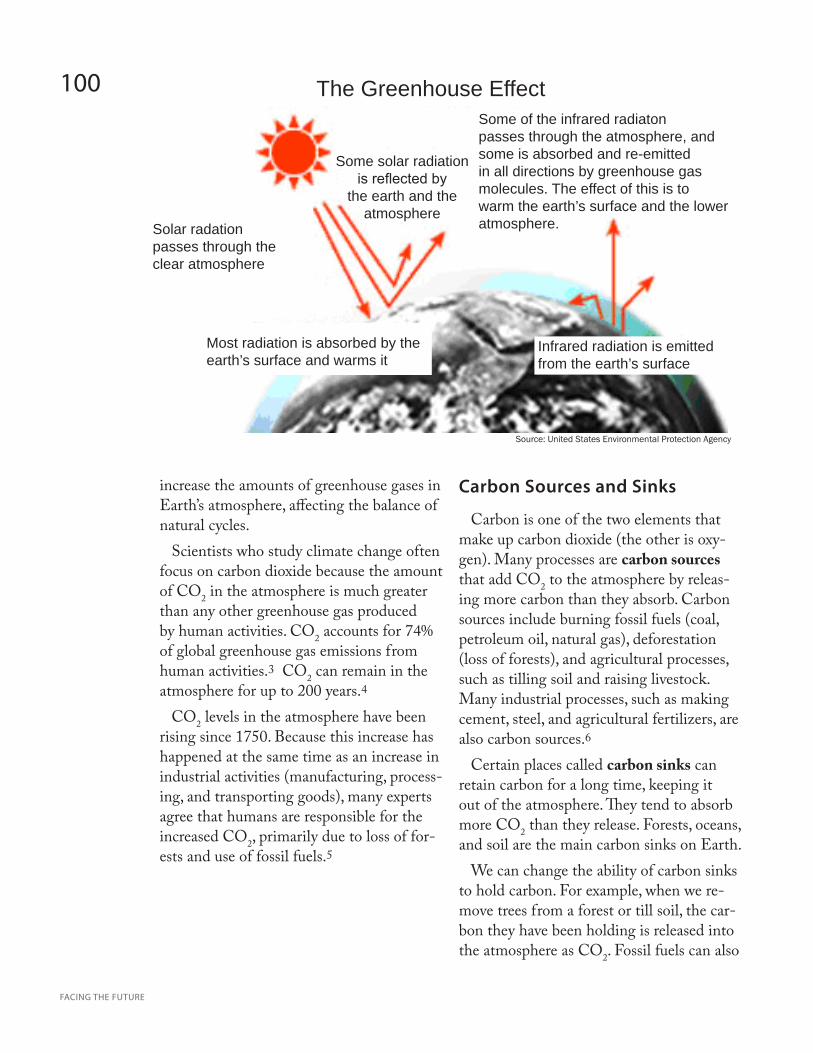
100
FACING THE FUTURE
increase the amounts of greenhouse gases in Earth’s atmosphere, affecting the balance of natural cycles.
Scientists who study climate change often focus on carbon dioxide because the amount of CO2 in the atmosphere is much greater than any other greenhouse gas produced by human activities. CO2 accounts for 74% of global greenhouse gas emissions from human activities.3 CO2 can remain in the atmosphere for up to 200 years.4
CO2 levels in the atmosphere have been rising since 1750. Because this increase has happened at the same time as an increase in industrial activities (manufacturing, process-ing, and transporting goods), many experts agree that humans are responsible for the increased CO2, primarily due to loss of for-ests and use of fossil fuels.5
Carbon Sources and Sinks
Carbon is one of the two elements that make up carbon dioxide (the other is oxy-gen). Many processes are carbon sources that add CO2 to the atmosphere by releas-ing more carbon than they absorb. Carbon sources include burning fossil fuels (coal, petroleum oil, natural gas), deforestation (loss of forests), and agricultural processes, such as tilling soil and raising livestock. Many industrial processes, such as making cement, steel, and agricultural fertilizers, are also carbon sources.6
Certain places called carbon sinks can retain carbon for a long time, keeping it out of the atmosphere. They tend to absorb more CO2 than they release. Forests, oceans, and soil are the main carbon sinks on Earth.
We can change the ability of carbon sinks to hold carbon. For example, when we re-move trees from a forest or till soil, the car-bon they have been holding is released into the atmosphere as CO2. Fossil fuels can also
Source: United States Environmental Protection Agency
The Greenhouse EffectSome of the infrared radiaton passes through the atmosphere, and some is absorbed and re-emitted in all directions by greenhouse gas molecules. The effect of this is to warm the earth’s surface and the lower atmosphere.
Some solar radiation is reflected by
the earth and the atmosphere
Solar radation passes through the clear atmosphere
Most radiation is absorbed by the earth’s surface and warms it
Infrared radiation is emitted from the earth’s surface
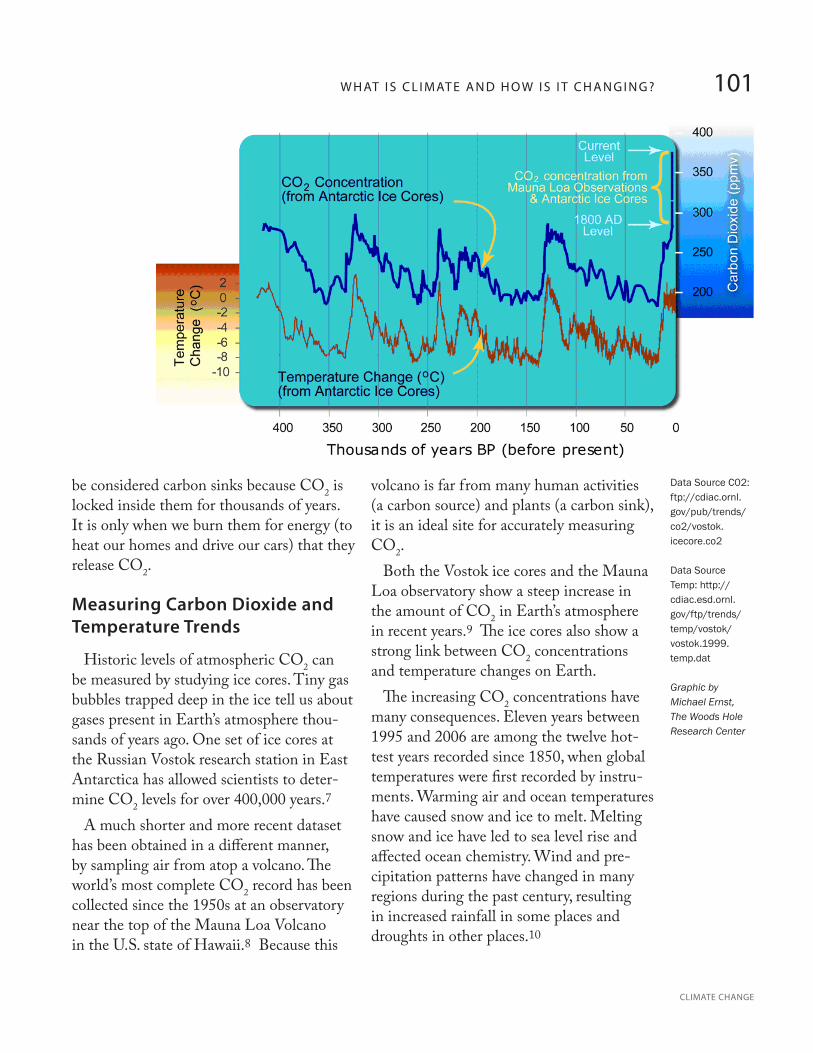
101W H AT I S C L I M AT E A N D H O W I S I T C H A N G I N G ?
CLIMATE CHANGE
be considered carbon sinks because CO2 is locked inside them for thousands of years. It is only when we burn them for energy (to heat our homes and drive our cars) that they release CO2.
Measuring Carbon Dioxide and Temperature Trends
Historic levels of atmospheric CO2 can be measured by studying ice cores. Tiny gas bubbles trapped deep in the ice tell us about gases present in Earth’s atmosphere thou-sands of years ago. One set of ice cores at the Russian Vostok research station in East Antarctica has allowed scientists to deter-mine CO2 levels for over 400,000 years.7
A much shorter and more recent dataset has been obtained in a different manner, by sampling air from atop a volcano. The world’s most complete CO2 record has been collected since the 1950s at an observatory near the top of the Mauna Loa Volcano in the U.S. state of Hawaii.8 Because this
volcano is far from many human activities (a carbon source) and plants (a carbon sink), it is an ideal site for accurately measuring CO2.
Both the Vostok ice cores and the Mauna Loa observatory show a steep increase in the amount of CO2 in Earth’s atmosphere in recent years.9 The ice cores also show a strong link between CO2 concentrations and temperature changes on Earth.
The increasing CO2 concentrations have many consequences. Eleven years between 1995 and 2006 are among the twelve hot-test years recorded since 1850, when global temperatures were first recorded by instru-ments. Warming air and ocean temperatures have caused snow and ice to melt. Melting snow and ice have led to sea level rise and affected ocean chemistry. Wind and pre-cipitation patterns have changed in many regions during the past century, resulting in increased rainfall in some places and droughts in other places.10
Data Source C02: ftp://cdiac.ornl.gov/pub/trends/co2/vostok.icecore.co2
Data Source Temp: http://cdiac.esd.ornl.gov/ftp/trends/temp/vostok/vostok.1999.temp.dat
Graphic by Michael Ernst, The Woods Hole Research Center
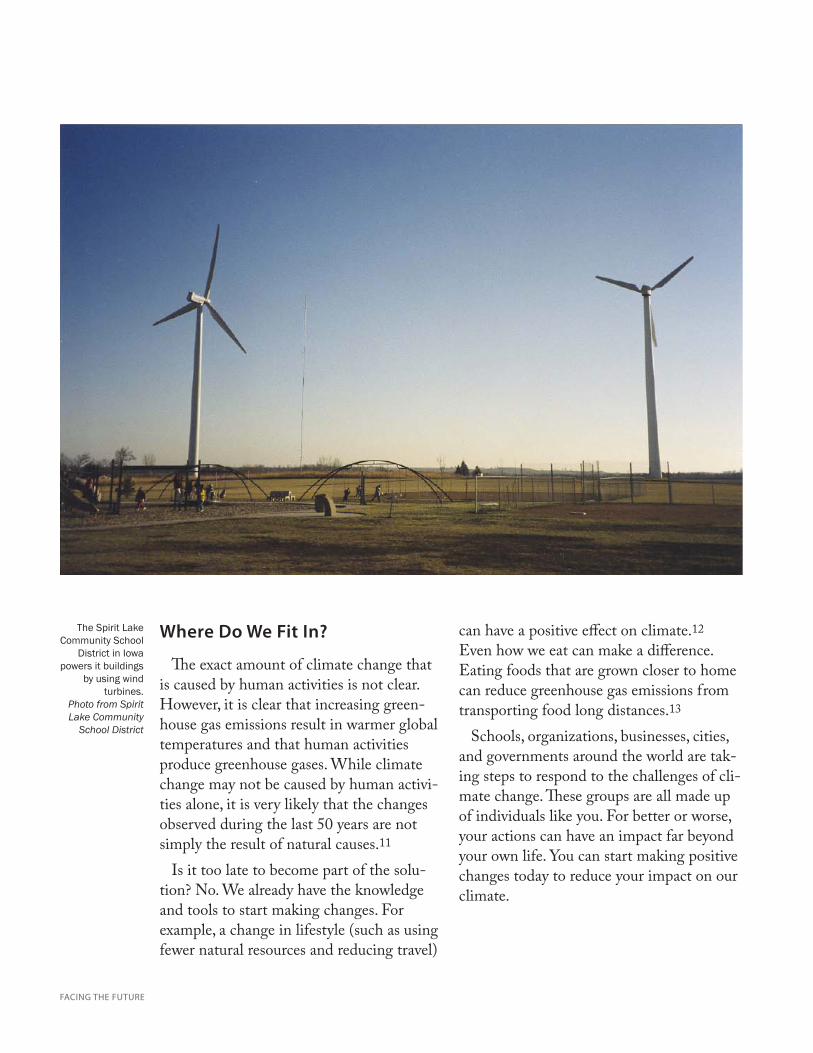
FACING THE FUTURE
Where Do We Fit In?
The exact amount of climate change that is caused by human activities is not clear. However, it is clear that increasing green-house gas emissions result in warmer global temperatures and that human activities produce greenhouse gases. While climate change may not be caused by human activi-ties alone, it is very likely that the changes observed during the last 50 years are not simply the result of natural causes.11
Is it too late to become part of the solu-tion? No. We already have the knowledge and tools to start making changes. For example, a change in lifestyle (such as using fewer natural resources and reducing travel)
can have a positive effect on climate.12 Even how we eat can make a difference. Eating foods that are grown closer to home can reduce greenhouse gas emissions from transporting food long distances.13
Schools, organizations, businesses, cities, and governments around the world are tak-ing steps to respond to the challenges of cli-mate change. These groups are all made up of individuals like you. For better or worse, your actions can have an impact far beyond your own life. You can start making positive changes today to reduce your impact on our climate.
The Spirit Lake Community School
District in Iowa powers it buildings
by using wind turbines.
Photo from Spirit Lake Community
School District
103W H AT I S C L I M AT E A N D H O W I S I T C H A N G I N G ?
CLIMATE CHANGE
Vocabulary
atmosphere—a layer of gases, such as nitrogen, oxygen, and carbon dioxide, surrounding the Earth carbon sink—a place (ecosystem) or organism that can store carbon for long periods of time; examples include oceans, plants, and other organisms that use carbon dioxide from the atmosphere during pho-tosynthesis carbon source—anything that adds carbon to the atmosphere by releasing more carbon than it absorbsclimate change – any variation in global or regional long-term weather patternsfossil fuels—energy sources, such as petroleum, coal, and natural gas, that are produced by the decom-position (or decay) of ancient plants and animalsgreenhouse effect—process by which gases in Earth’s atmosphere retain infrared radiation (heat) from the sun, warming Earth’s surfacegreenhouse gas—any gas in the atmosphere capable of absorbing infrared radiation (or heat) reflected from the earth’s surface
Checking for Understanding
What does the greenhouse effect have to do with climate change?1.
List three activities that you did today (or things that you used) that released greenhouse gases.2.
List three specific ways that you can personally reduce greenhouse gas emissions.3.
Imagine yourself 50 years from now. What do you want the earth to look like in 50 years? 4.
What are some steps you can take now to work toward your vision of the future?5.
1H. Le Treut, et al., “Historical Overview of Climate Change Science,” in Climate Change 2007: The Physical Science Basis. Contribution of Working Group I to the Fourth Assessment Report of the Intergovernmental Panel on Climate Change, ed. S. Solomon, D. Qin, M. Manning, Z. Chen, M. Marquis, K. B. Averyt, M. Tignor, and H. L. Miller (Cambridge, UK: Cambridge University Press, 2007), 93-128. http://ipcc-wg1.ucar.edu/wg1/wg1-report.html. 2Ibid. 3U.S. Environmental Protection Agency. 2007. “Global Greenhouse Gas Data,” http://www.epa.gov/climatechange/emissions/globalghg.html. 4IPCC, “Technical Summary,” in Climate Change 2001: The Scientific Basis. Contribution of Working Group I to the Third Assessment Report of the Intergovernmental Panel on Climate Change, ed. J. T. Houghton, Y. Ding, D. J. Griggs, M. Noguer, P. J. van der Linden and D. Xiaosu (Cambridge, UK: Cambridge University Press, 2001), 21-83. http://www.ipcc.ch/pub/wg1TARtechsum.pdf. 5H. Le Treut, et al. 6U.S. Environmental Protection Agency. 2007. “Human-Related Sources and Sinks of Carbon Dioxide,” http://www.epa.gov/climatechange/emissions/co2_human.html. 7See Vostok Ice Core Data on the National Oceanic and Atmospheric Administration’s website: http://www.ncdc.noaa.gov/paleo/icecore/antarctica/vostok/vostok.html. 8See Mauna Loa Observatory data on the National Oceanic and Atmospheric Administration’s website: http://www.mlo.noaa.gov/home.html. 9Woods Hole Research Center, The Warming of the Earth, http://www.whrc.org/resources/online_publications/warming_earth/index.htm (accessed September 23, 2007). 10IPCC, “Summary for Policymakers,” in Climate Change 2007: The Physical Science Basis. Contribution of Working Group I to the Fourth Assessment Report of the Intergovernmental Panel on Climate Change, ed. S. Solomon, D. Qin, M. Manning, Z. Chen, M. Marquis, K. B. Averyt, M. Tignor and H. L. Miller (Cambridge, UK: Cambridge University Press, 2007), 1-18. http://ipcc-wg1.ucar.edu/wg1/Report/AR4WG1_Print_SPM.pdf. 11Ibid. 12IPCC, “Summary for Policymakers,” in Climate Change 2007: Mitigation. Contribution of Working Group III to the Fourth Assessment Report of the Intergovernmental Panel on Climate Change, ed. B. Metz, O. R. Davidson, P. R. Bosch, R. Dave, and L. A. Meyer (Cambridge, UK: Cambridge University Press, 2007), 1-23. http://www.mnp.nl/ipcc/pages_media/FAR4docs/final_pdfs_ar4/SPM.pdf. 13Paul Rauber, “Decoder: Miles to Go Before You Eat,” Sierra Magazine, May 31, 2006. www.sierraclub.org/sierra/200605/decoder.asp
FACING THE FUTURE
What Size Is Your Footprint?
A carbon footprint is one way to measure your impact on the climate because it gives you an idea of the amount of greenhouse gases your activities produce. It is often measured in pounds of carbon dioxide (CO2) emissions. We call it a footprint because it’s like the mark you leave on the earth as you go about your daily activities.
2Student Reading
Organizing a walk to school day is a fun way to reduce your carbon footprint and get others involved. Photo from the National Center for Safe Routes to School, the coordinating agency for Walk to School events in the USA
105W H AT S I Z E I S YO U R F O OT P R I N T ?
CLIMATE CHANGE
“It takes less energy to make an aluminum can, plastic bottle, or
piece of paper from recycled materials than
from raw materials.
When you walk on a sandy beach, you leave behind a footprint. When you participate in an activity or use an item that produces greenhouse gases, you leave behind a car-bon footprint.
Parts of a Footprint
Two major components of your footprint are electricity and transportation. We need energy for all of our daily activities, but electricity and transportation require the largest amounts of energy.
Think about all the things you do in the morning before you even leave your home. You may turn off your alarm clock, turn on the light, take a hot shower, get orange juice from the refrigerator, heat up a frozen sau-sage biscuit in the microwave, or make toast. All of those things require electricity.
In many places, our electricity comes from burning fossil fuels such as coal, natural gas, propane, or heating oil. When they are burned to produce energy, fossil fuels emit
greenhouse gases. Greenhouse gases like carbon dioxide (hear that carbon word in there?) warm the planet and are released ev-ery time we use electricity that was created by burning fossil fuels.
How about the juice, sausage, and toast you might have eaten for breakfast? Most of us don’t have orange trees, cattle ranches, or wheat fields in our yards. Our food is pro-duced somewhere else. Modern food pro-duction usually requires fertilizers. Creating nitrogen fertilizers produces nitrous oxide (N2O), another greenhouse gas. Tilling soil to plant crops like wheat also releases N2O. (Thankfully, many crops can be planted without much tillage or fertilizers.) The meat for the sausage requires livestock such as pigs or cows. Raising livestock gives off large amounts of methane (CH4), another greenhouse gas, from livestock waste and gas.
Whenever our food is produced else-where, it has to be transported to us. Car-
Recycling uses less energy than creating new items from raw materials. Photo by Gilda Wheeler
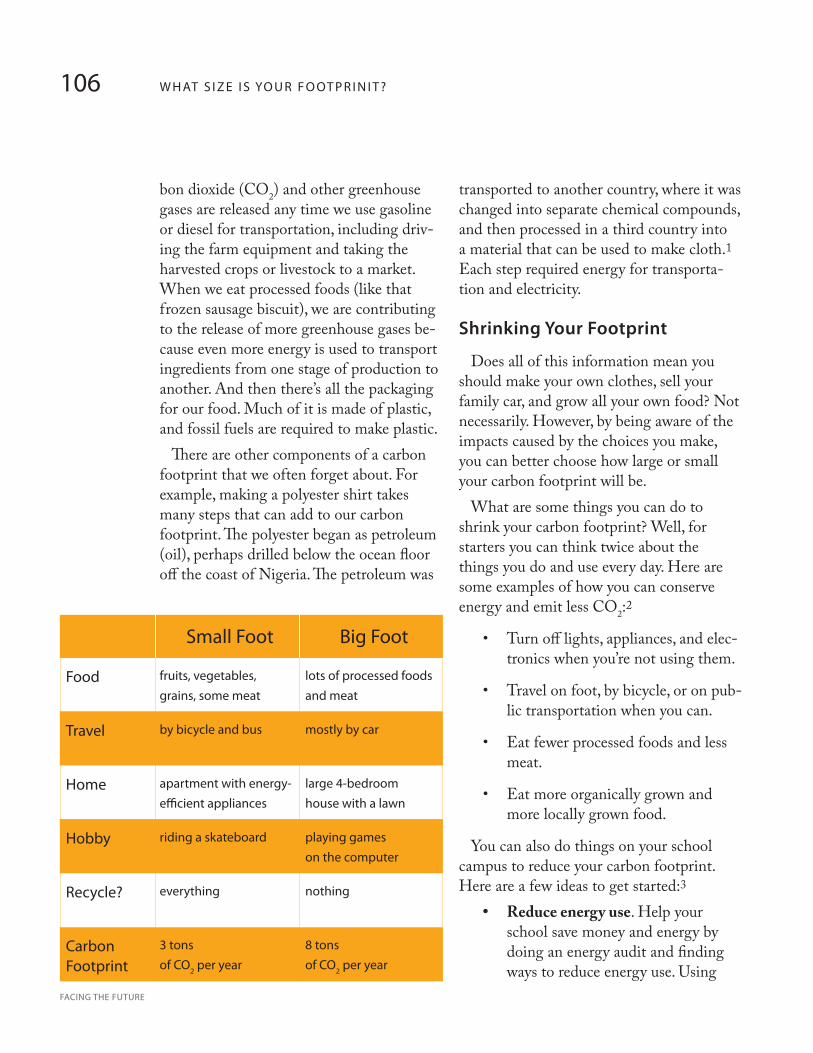
106 W H AT S I Z E I S YO U R F O OT P R I N I T ?
FACING THE FUTURE
bon dioxide (CO2) and other greenhouse gases are released any time we use gasoline or diesel for transportation, including driv-ing the farm equipment and taking the harvested crops or livestock to a market. When we eat processed foods (like that frozen sausage biscuit), we are contributing to the release of more greenhouse gases be-cause even more energy is used to transport ingredients from one stage of production to another. And then there’s all the packaging for our food. Much of it is made of plastic, and fossil fuels are required to make plastic.
There are other components of a carbon footprint that we often forget about. For example, making a polyester shirt takes many steps that can add to our carbon footprint. The polyester began as petroleum (oil), perhaps drilled below the ocean floor off the coast of Nigeria. The petroleum was
transported to another country, where it was changed into separate chemical compounds, and then processed in a third country into a material that can be used to make cloth.1 Each step required energy for transporta-tion and electricity.
Shrinking Your Footprint
Does all of this information mean you should make your own clothes, sell your family car, and grow all your own food? Not necessarily. However, by being aware of the impacts caused by the choices you make, you can better choose how large or small your carbon footprint will be.
What are some things you can do to shrink your carbon footprint? Well, for starters you can think twice about the things you do and use every day. Here are some examples of how you can conserve energy and emit less CO2:2
Turn off lights, appliances, and elec-•tronics when you’re not using them.
Travel on foot, by bicycle, or on pub-•lic transportation when you can.
Eat fewer processed foods and less •meat.
Eat more organically grown and •more locally grown food.
You can also do things on your school campus to reduce your carbon footprint. Here are a few ideas to get started:3
Reduce energy use• . Help your school save money and energy by doing an energy audit and finding ways to reduce energy use. Using
fruits, vegetables, grains, some meat
by bicycle and bus
apartment with energy-efficient appliances
riding a skateboard
everything
3 tons of CO2 per year
lots of processed foods and meat
mostly by car
large 4-bedroom house with a lawn
playing games on the computer
nothing
8 tons of CO2 per year
Food
Travel
Home
Hobby
Recycle?
Carbon Footprint
Small Foot Big Foot
107W H AT S I Z E I S YO U R F O OT P R I N T ?
CLIMATE CHANGE
natural daylight saves energy and improves the learning environment.
Recycle• . It takes less energy to make an aluminum can, plastic bottle, or piece of paper from recycled materi-als than from raw materials.
Reuse• . Buy used instead of new. It will save you money and it cuts down on the energy that would have gone into making another book, CD, shirt, or gizmo.
Walk to school• . Organize a walk to school day,4 or create a walking school bus.5
Out with gray. In with green!• Re-place concrete and asphalt at school with plants and trees that absorb CO2.
Shrinking your carbon footprint doesn’t need to be painful. When you shrink your carbon footprint, you’re not just giving things up. You’re getting a lot, too. By help-ing to stop climate change, you are working to improve your own quality of life. Quality of life is all about making choices that you feel good about.
It’s your quality of life. It’s your carbon footprint. But the carbon affects us all.
Vocabulary
carbon footprint—a measure of human impacts on Earth’s climate through activities that release car-bon dioxide (a greenhouse gas); usually reported as weight of carbon dioxide releasedgreenhouse gas—any gas in the atmosphere capable of absorbing infrared radiation (or heat) reflected from the earth’s surface, making temperatures on earth warmerquality of life—the level of well-being and physical conditions in which people live
Checking for Understanding
Name three benefits to you and your family created by reducing your carbon footprint.1.
What is one way you can reduce your footprint today, with little or no effort? 2.
What, if anything, is stopping you from making this footprint reduction? How can you overcome 3. this obstacle?
1Ryan, John C. and Alan Thein Durning, Stuff: The Secret Lives of Everyday Things (Seattle: Northwest Environment Watch, 1997)
2Guy Dauncey and Patrick Mazza, Stormy Weather: 101 Solutions to Global Climate Change (Gabriola Island, BC: New Society Publishers, 2001).
3Ibid. 4Learn more about International Walk to School at: http://www.iwalktoschool.org.
5Learn more at: http://www.walkingschoolbus.org.
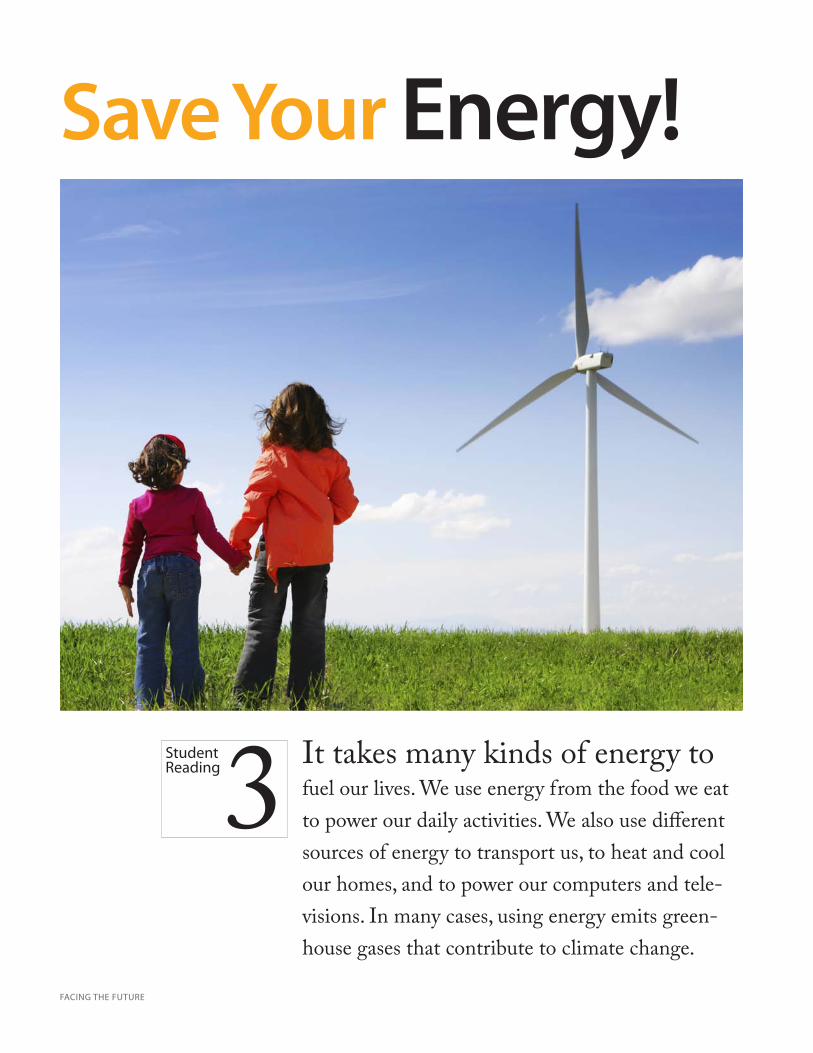
FACING THE FUTURE
Save Your Energy!
It takes many kinds of energy to fuel our lives. We use energy from the food we eat to power our daily activities. We also use different sources of energy to transport us, to heat and cool our homes, and to power our computers and tele-visions. In many cases, using energy emits green-house gases that contribute to climate change.
3Student Reading
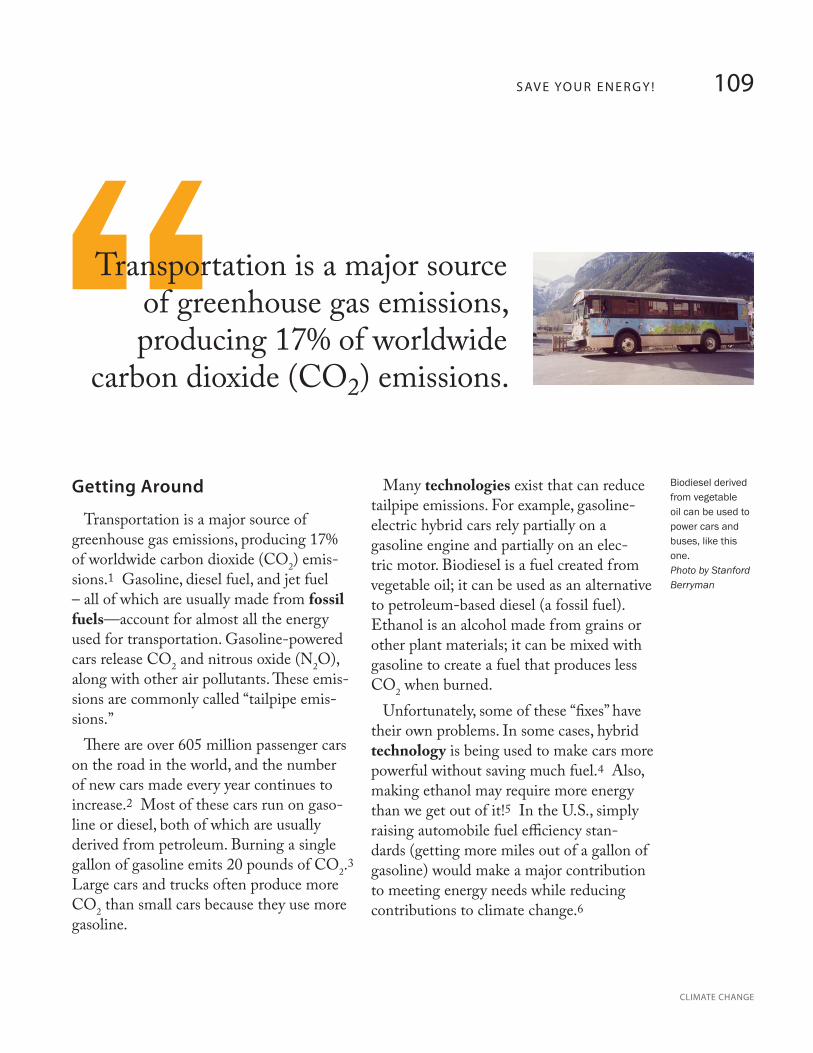
109S AV E YO U R E N E R G Y !
CLIMATE CHANGE
“Transportation is a major source of greenhouse gas emissions, producing 17% of worldwide
carbon dioxide (CO2) emissions.
Getting Around
Transportation is a major source of greenhouse gas emissions, producing 17% of worldwide carbon dioxide (CO2) emis-sions.1 Gasoline, diesel fuel, and jet fuel – all of which are usually made from fossil fuels—account for almost all the energy used for transportation. Gasoline-powered cars release CO2 and nitrous oxide (N2O), along with other air pollutants. These emis-sions are commonly called “tailpipe emis-sions.”
There are over 605 million passenger cars on the road in the world, and the number of new cars made every year continues to increase.2 Most of these cars run on gaso-line or diesel, both of which are usually derived from petroleum. Burning a single gallon of gasoline emits 20 pounds of CO2.3 Large cars and trucks often produce more CO2 than small cars because they use more gasoline.
Many technologies exist that can reduce tailpipe emissions. For example, gasoline-electric hybrid cars rely partially on a gasoline engine and partially on an elec-tric motor. Biodiesel is a fuel created from vegetable oil; it can be used as an alternative to petroleum-based diesel (a fossil fuel). Ethanol is an alcohol made from grains or other plant materials; it can be mixed with gasoline to create a fuel that produces less CO2 when burned.
Unfortunately, some of these “fixes” have their own problems. In some cases, hybrid technology is being used to make cars more powerful without saving much fuel.4 Also, making ethanol may require more energy than we get out of it!5 In the U.S., simply raising automobile fuel efficiency stan-dards (getting more miles out of a gallon of gasoline) would make a major contribution to meeting energy needs while reducing contributions to climate change.6
Biodiesel derived from vegetable oil can be used to power cars and buses, like this one. Photo by Stanford Berryman
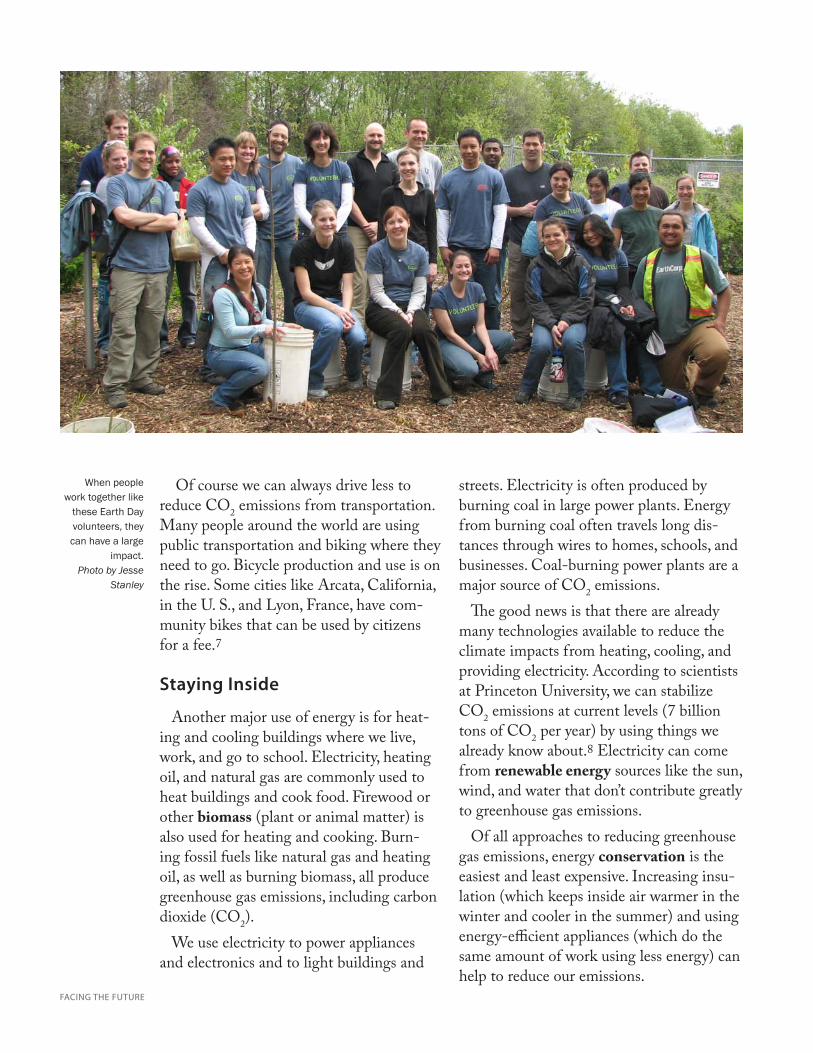
110 S AV E YO U R E N E R G Y !
FACING THE FUTURE
Of course we can always drive less to reduce CO2 emissions from transportation. Many people around the world are using public transportation and biking where they need to go. Bicycle production and use is on the rise. Some cities like Arcata, California, in the U. S., and Lyon, France, have com-munity bikes that can be used by citizens for a fee.7
Staying Inside
Another major use of energy is for heat-ing and cooling buildings where we live, work, and go to school. Electricity, heating oil, and natural gas are commonly used to heat buildings and cook food. Firewood or other biomass (plant or animal matter) is also used for heating and cooking. Burn-ing fossil fuels like natural gas and heating oil, as well as burning biomass, all produce greenhouse gas emissions, including carbon dioxide (CO2).
We use electricity to power appliances and electronics and to light buildings and
streets. Electricity is often produced by burning coal in large power plants. Energy from burning coal often travels long dis-tances through wires to homes, schools, and businesses. Coal-burning power plants are a major source of CO2 emissions.
The good news is that there are already many technologies available to reduce the climate impacts from heating, cooling, and providing electricity. According to scientists at Princeton University, we can stabilize CO2 emissions at current levels (7 billion tons of CO2 per year) by using things we already know about.8 Electricity can come from renewable energy sources like the sun, wind, and water that don’t contribute greatly to greenhouse gas emissions.
Of all approaches to reducing greenhouse gas emissions, energy conservation is the easiest and least expensive. Increasing insu-lation (which keeps inside air warmer in the winter and cooler in the summer) and using energy-efficient appliances (which do the same amount of work using less energy) can help to reduce our emissions.
When people work together like
these Earth Day volunteers, they can have a large
impact. Photo by Jesse
Stanley
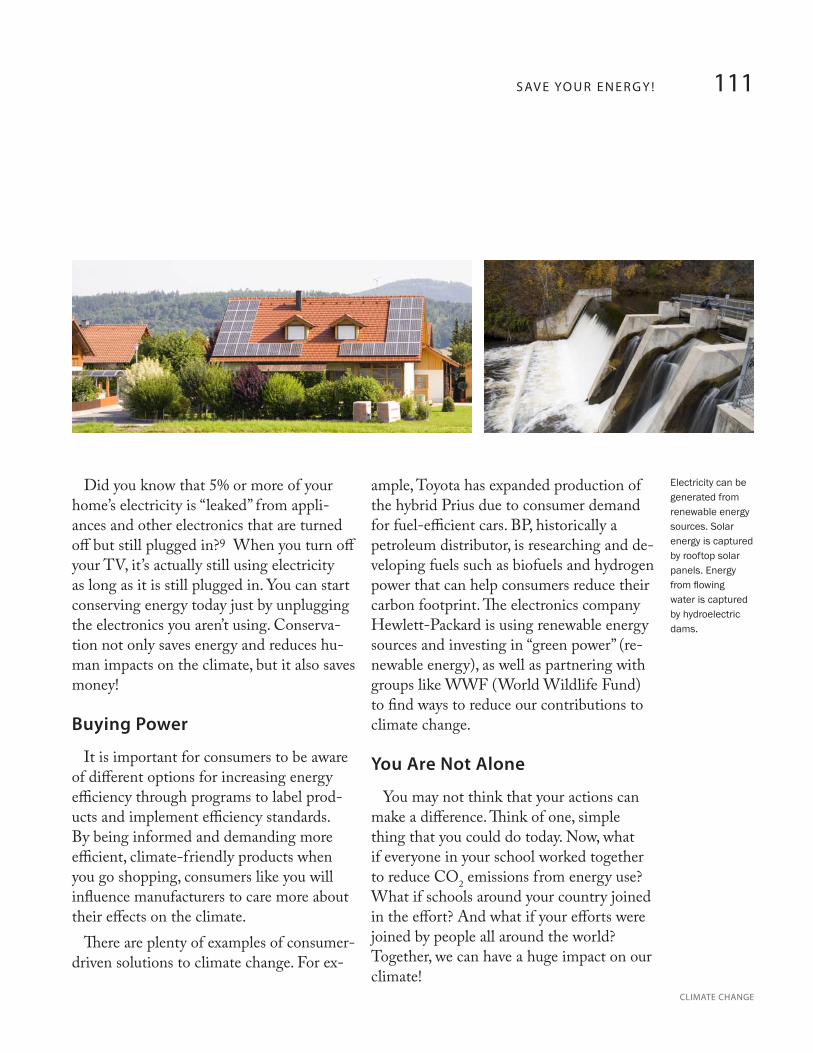
111S AV E YO U R E N E R G Y !
CLIMATE CHANGE
Did you know that 5% or more of your home’s electricity is “leaked” from appli-ances and other electronics that are turned off but still plugged in?9 When you turn off your TV, it’s actually still using electricity as long as it is still plugged in. You can start conserving energy today just by unplugging the electronics you aren’t using. Conserva-tion not only saves energy and reduces hu-man impacts on the climate, but it also saves money!
Buying Power
It is important for consumers to be aware of different options for increasing energy efficiency through programs to label prod-ucts and implement efficiency standards. By being informed and demanding more efficient, climate-friendly products when you go shopping, consumers like you will influence manufacturers to care more about their effects on the climate.
There are plenty of examples of consumer-driven solutions to climate change. For ex-
ample, Toyota has expanded production of the hybrid Prius due to consumer demand for fuel-efficient cars. BP, historically a petroleum distributor, is researching and de-veloping fuels such as biofuels and hydrogen power that can help consumers reduce their carbon footprint. The electronics company Hewlett-Packard is using renewable energy sources and investing in “green power” (re-newable energy), as well as partnering with groups like WWF (World Wildlife Fund) to find ways to reduce our contributions to climate change.
You Are Not Alone
You may not think that your actions can make a difference. Think of one, simple thing that you could do today. Now, what if everyone in your school worked together to reduce CO2 emissions from energy use? What if schools around your country joined in the effort? And what if your efforts were joined by people all around the world? Together, we can have a huge impact on our climate!
Electricity can be generated from renewable energy sources. Solar energy is captured by rooftop solar panels. Energy from flowing water is captured by hydroelectric dams.
112 S AV E YO U R E N E R G Y !
FACING THE FUTURE
Vocabulary
biomass—living and recently dead material or biodegradable waste that can be used as fuel; examples include wood, grains, and grasses conservation—protection, preservation, management, or enhancement of wildlife and natural resourcesfossil fuels—energy sources, such as petroleum, coal, and natural gas, that are produced by the decom-position (or decay) of ancient plants and animalsrenewable energy—energy from sources that are naturally replaced as they are used, such as sunlight, wind, water, and geothermal heattechnology—the use of scientific knowledge to create tools; often used to solve problems
Checking for Understanding
What are some ideas for reducing greenhouse gas emissions from transportation?1.
What are some ways to reduce greenhouse gas emissions in our homes and schools?2.
Which of these ideas do you think could contribute the most to reducing climate change? Why do 3. you think it would have the largest impact? Will it be easy or difficult to implement, and why?
Why might it be difficult for everyone to buy energy-efficient appliances or hybrid cars? 4.
What actions can 5. everyone take to reduce greenhouse gas emissions?
1Samantha Putt del Pino, Ryan Levinson, and John Larsen, Hot Climate, Cool Commerce: A Service Sector Guide to Greenhouse Gas Management (Washington, D.C.: World Resources Institute, 2006), 5. http://pdf.wri.org/hotclimatecoolcommerce.pdf.
2Michael Renner, “Vehicle Production Continues to Rise,” in Vital Signs 2006-2007, Worldwatch Institute (New York: W. W. Norton & Company, 2006), 64-5.
3U.S. Energy Information Administration, “Voluntary Reporting of Greenhouse Gases Program: Fuel and Energy Source Codes and Emission Coefficients,” http://www.eia.doe.gov/oiaf/1605/coefficients.html (accessed September 24, 2007).
4Matthew Wald, “Hybrid Cars Burn Gas in the Drive for Power,” New York Times, July 17, 2005. 5Susan Lang, “Cornell Ecologist’s Study Finds that Producing Ethanol and Biodiesel from Corn and Other Crops is Not Worth the Energy,” Cornell
University News Service, July 5, 2005. 6World Resources Institute, “Climate Change and Energy Security Impacts and Tradeoffs in 2025,” May 11, 2007. http://www.wri.org/climate/topic_
content.cfm?cid=4368 7Gary Gardner, “Bicycle Production Up,” in Vital Signs 2006-2007, Worldwatch Institute (New York: W. W. Norton & Company, 2006), 66-7.
8Robert Socolow and Stephen Pacala, “A Plan to Keep Carbon in Check,” Scientific American, September 2006, 50-7. 9Michael Woods, “Pulling the Plug on Electricity Leaks,” Pittsburg Post-Gazette, May 8, 2005.
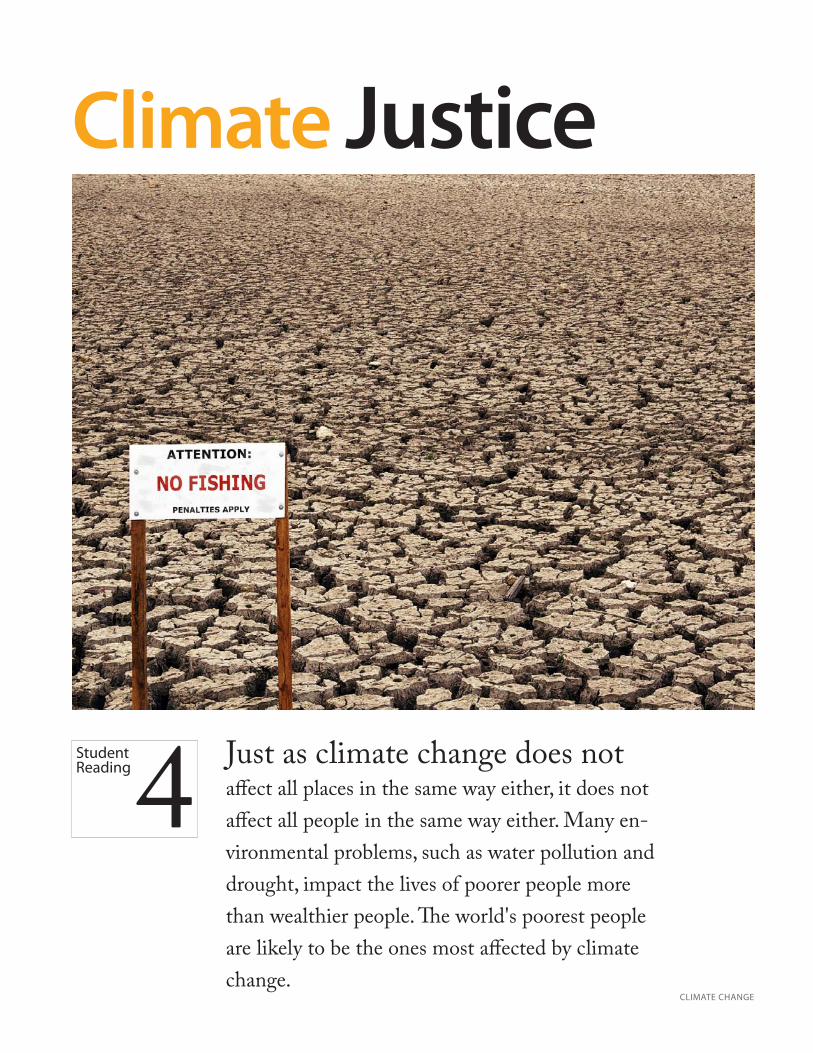
CLIMATE CHANGE
Climate Justice
4Student Reading Just as climate change does not
affect all places in the same way either, it does not affect all people in the same way either. Many en-vironmental problems, such as water pollution and drought, impact the lives of poorer people more than wealthier people. The world's poorest people are likely to be the ones most affected by climate change.
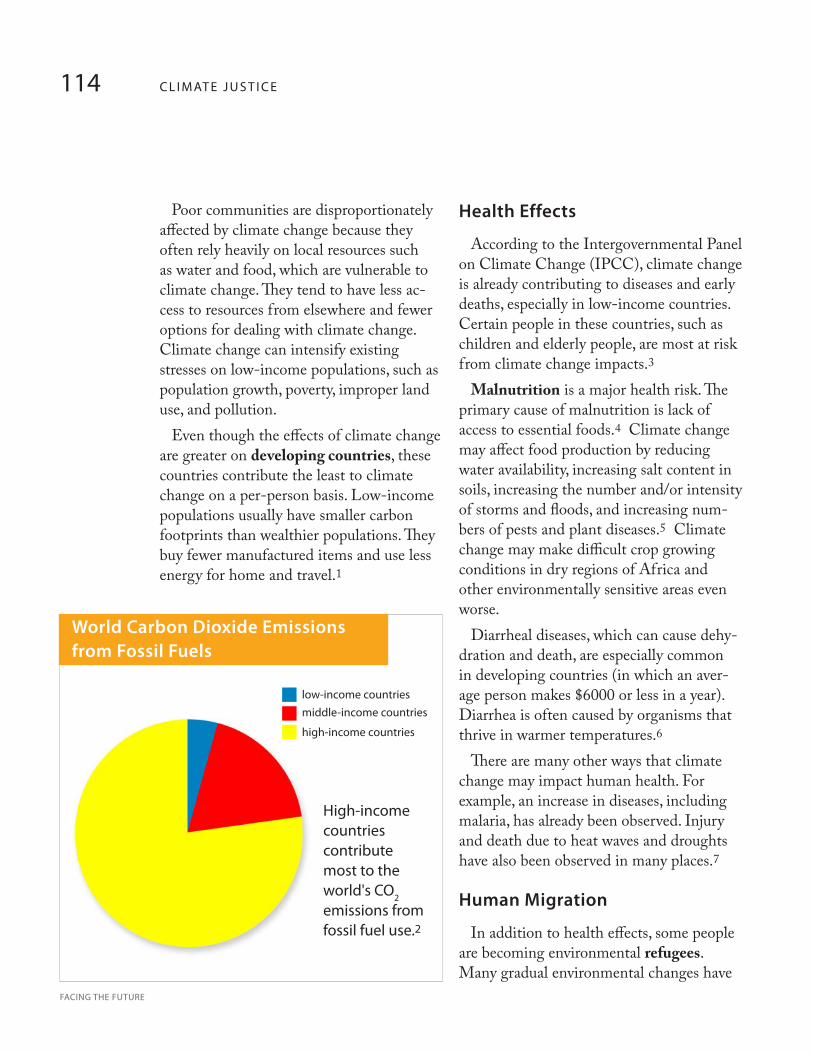
114 C L I M AT E J U S T I C E
FACING THE FUTURE
Poor communities are disproportionately affected by climate change because they often rely heavily on local resources such as water and food, which are vulnerable to climate change. They tend to have less ac-cess to resources from elsewhere and fewer options for dealing with climate change. Climate change can intensify existing stresses on low-income populations, such as population growth, poverty, improper land use, and pollution.
Even though the effects of climate change are greater on developing countries, these countries contribute the least to climate change on a per-person basis. Low-income populations usually have smaller carbon footprints than wealthier populations. They buy fewer manufactured items and use less energy for home and travel.1
Health Effects
According to the Intergovernmental Panel on Climate Change (IPCC), climate change is already contributing to diseases and early deaths, especially in low-income countries. Certain people in these countries, such as children and elderly people, are most at risk from climate change impacts.3
Malnutrition is a major health risk. The primary cause of malnutrition is lack of access to essential foods.4 Climate change may affect food production by reducing water availability, increasing salt content in soils, increasing the number and/or intensity of storms and floods, and increasing num-bers of pests and plant diseases.5 Climate change may make difficult crop growing conditions in dry regions of Africa and other environmentally sensitive areas even worse.
Diarrheal diseases, which can cause dehy-dration and death, are especially common in developing countries (in which an aver-age person makes $6000 or less in a year). Diarrhea is often caused by organisms that thrive in warmer temperatures.6
There are many other ways that climate change may impact human health. For example, an increase in diseases, including malaria, has already been observed. Injury and death due to heat waves and droughts have also been observed in many places.7
Human Migration
In addition to health effects, some people are becoming environmental refugees. Many gradual environmental changes have
World Carbon Dioxide Emissions from Fossil Fuels
low-income countriesmiddle-income countries
high-income countries
High-income countries contribute most to the world's CO2 emissions from fossil fuel use.2
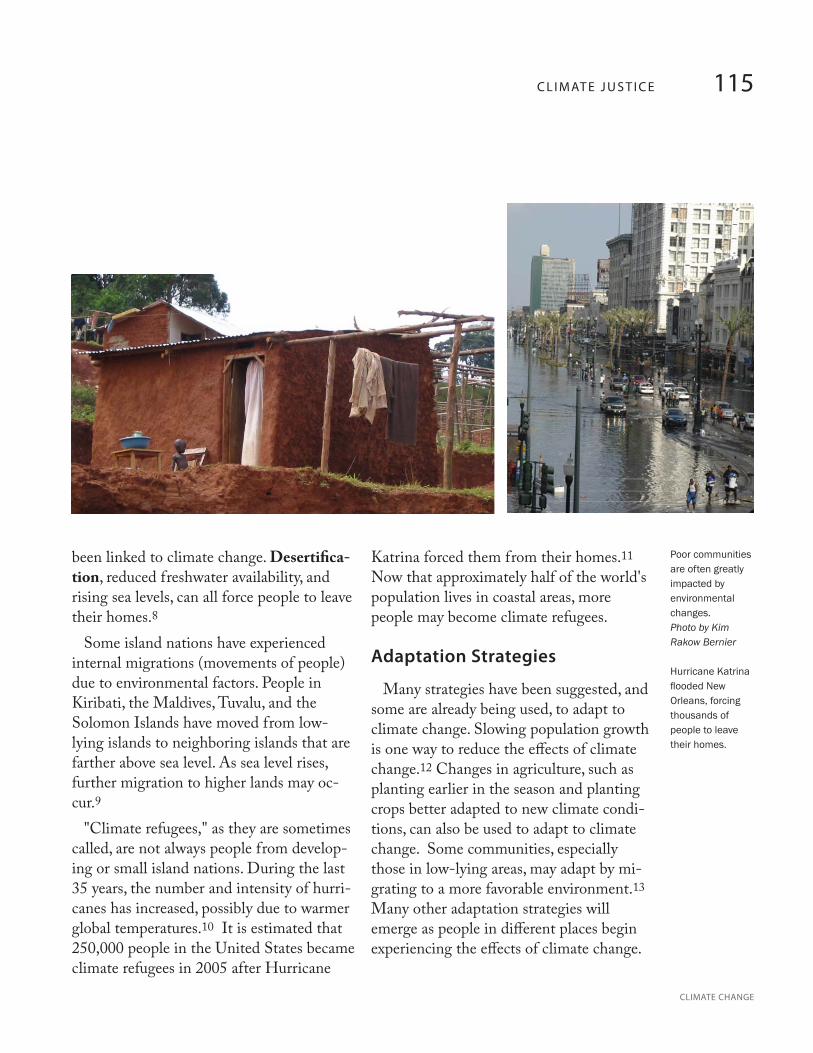
115C L I M AT E J U S T I C E
CLIMATE CHANGE
been linked to climate change. Desertifica-tion, reduced freshwater availability, and rising sea levels, can all force people to leave their homes.8
Some island nations have experienced internal migrations (movements of people) due to environmental factors. People in Kiribati, the Maldives, Tuvalu, and the Solomon Islands have moved from low-lying islands to neighboring islands that are farther above sea level. As sea level rises, further migration to higher lands may oc-cur.9
"Climate refugees," as they are sometimes called, are not always people from develop-ing or small island nations. During the last 35 years, the number and intensity of hurri-canes has increased, possibly due to warmer global temperatures.10 It is estimated that 250,000 people in the United States became climate refugees in 2005 after Hurricane
Katrina forced them from their homes.11 Now that approximately half of the world's population lives in coastal areas, more people may become climate refugees.
Adaptation Strategies
Many strategies have been suggested, and some are already being used, to adapt to climate change. Slowing population growth is one way to reduce the effects of climate change.12 Changes in agriculture, such as planting earlier in the season and planting crops better adapted to new climate condi-tions, can also be used to adapt to climate change. Some communities, especially those in low-lying areas, may adapt by mi-grating to a more favorable environment.13 Many other adaptation strategies will emerge as people in different places begin experiencing the effects of climate change.
Poor communities are often greatly impacted by environmental changes. Photo by Kim Rakow Bernier
Hurricane Katrina flooded New Orleans, forcing thousands of people to leave their homes.
116 C L I M AT E J U S T I C E
FACING THE FUTURE
Vocabulary
desertification—the onset of desert-like conditions, including reduced groundwater availability and fewer plantsdeveloping countries—countries with a low per-person incomejustice—the fair and moral treatment of all personsmalnutrition—the condition of lacking proper nutrients for normal body functioningrefugee—a person who leaves his/her country to find a safer place
Checking for Understanding
Why are poorer people more vulnerable to climate change than wealthier people?1.
Why do you think malnutrition is considered by the World Health Organization to be the most 2. important factor affecting human health?
How can poorer people and wealthier people work together to reduce the impacts of climate 3. change?
While many communities are finding ways to adapt to climate change, we can all be proactive in 4. preventing future climate change. In what ways can populations that are especially vulnerable to climate change prepare for changing temperatures, rising sea levels, and other effects of climate change?
1Randy Poplock, “The poor are hit hardest by climate change, but contribute the least to it,” Seattle Post-Intelligencer, August 19, 2007. 2WWF, Living Planet Report 2006, http://www.panda.org/livingplanet.
3U. Confalonieri, et al., 2007, “Human Health,” in Climate Change 2007: Impacts, Adaptation and Vulnerability. Contribution of Working Group II to the Fourth Assessment Report of the Intergovernmental Panel on Climate Change, ed. M. L. Parry, O. F. Canziani, J. P. Palutikof, P. J. van der Linden and C. E.
Hanson (Cambridge, UK: Cambridge University Press, 2007), 391-431. http://www.ipcc-wg2.org/. 4D. H. Campbell-Lendrum, C. F. Corvalan and A. Pruss-Ustun, “How much disease could climate change cause?” in Climate Change and Human Health:
Risks and Responses (Geneva: World Health Organization, 2003), 133-158. 5U. Confalonieri, et al.
6D. H. Campbell-Lendrum, et al. 7U. Confalonieri, et al.
8Stefan Lovgren, “Climate Change Creating Millions of ‘Eco Refugees,’ UN Warns,” National Geographic News, November 18, 2005. http://news.nationalgeographic.com/news/2005/11/1118_051118_disaster_refugee.html.
9N. Mimura, et al., “Small Islands,” in Climate Change 2007: Impacts, Adaptation and Vulnerability. Contribution of Working Group II to the Fourth Assessment Report of the Intergovernmental Panel on Climate Change, ed. M. L. Parry, O. F. Canziani, J. P. Palutikof, P. J. van der Linden and C. E.
Hanson (Cambridge, UK: Cambridge University Press, 2007), 688-716. 10P. J. Webster, G. J. Holland, J. A. Curry and H. R. Chang, “Changes in Tropical Cyclone Number, Duration, and Intensity in a Warming Environment,”
Science, September 16, 2005, 1844-1846. 11Lester R. Brown, “Global Warming Forcing U.S. Coastal Population To Move Inland: An Estimated 250,000 Katrina Evacuees Are Now Climate
Refugees,” Earth Policy Institute, August 16, 2006. http://www.earth-policy.org/Updates/2006/Update57.htm. 12Roger Kasperson and Jeanne Kasperson, Climate Change, Vulnerability and Social Justice (Stockholm: Stockholm Environment Institute, 2001),
http://www.sei.se/dload/2001/sei-risk.pdf. 13N. Mimura, et al.
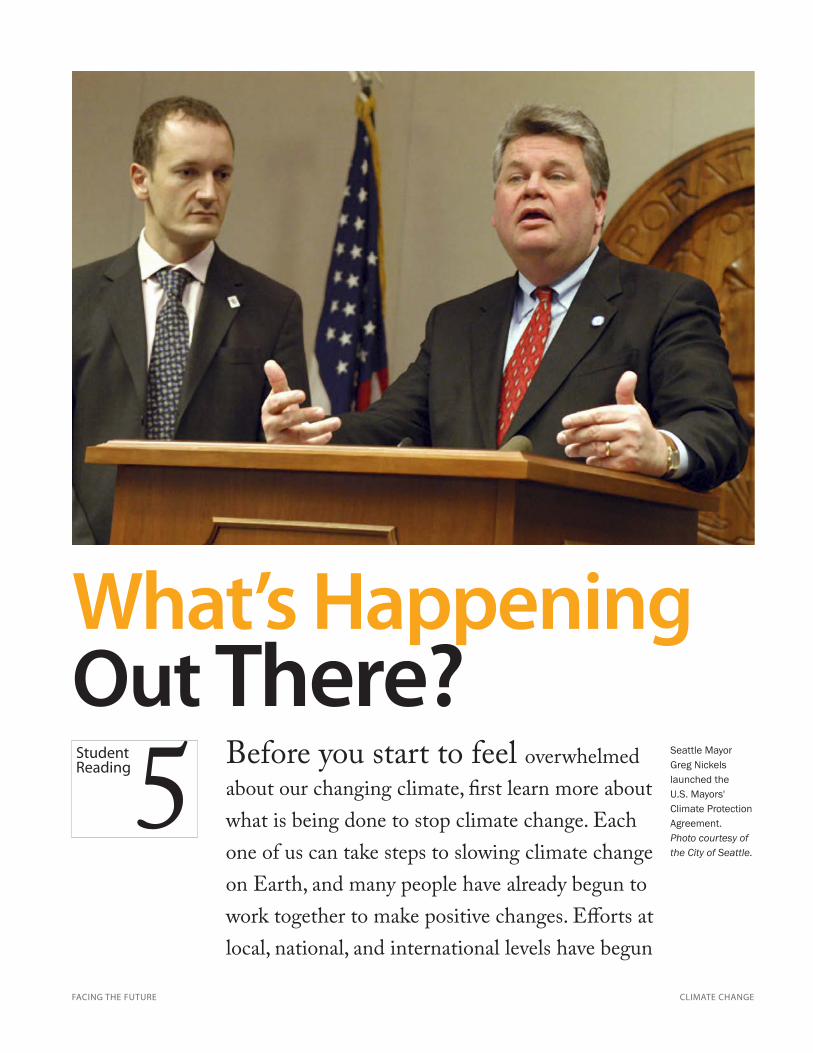
CLIMATE CHANGEFACING THE FUTURE
What’s Happening Out There?
Before you start to feel overwhelmed about our changing climate, first learn more about what is being done to stop climate change. Each one of us can take steps to slowing climate change on Earth, and many people have already begun to work together to make positive changes. Efforts at local, national, and international levels have begun
5Student Reading
Seattle Mayor Greg Nickels launched the U.S. Mayors' Climate Protection Agreement.Photo courtesy of the City of Seattle.
118 W H AT ’ S H A P P E N I N G O U T T H E R E ?
FACING THE FUTURE
“A good way to get involved in local, national, and even international efforts to address climate change
is to learn more about the issues and to contact government representatives
with your concerns and ideas
to stabilize our climate and reduce the impacts of climate change on citizens. By collaborating with people all over the globe, we can have a much greater impact than one person can alone.
As you read these examples of groups tak-ing action on climate change, don’t forget that you can join their efforts to be part of the solution!
International Collaboration
The most famous international effort to address global climate change is the Kyoto Protocol.1 The Protocol was officially ad-opted December 11, 1997, in Kyoto, Japan. 175 nations have ratified the document, pledging to meet its goals for reducing greenhouse gas emissions. The Protocol calls for a reduction in greenhouse gas emissions to at least 5% below 1990 levels, to be com-pleted during the period 2008-2012.
The Kyoto Protocol lists numerous ways to cut greenhouse gas emissions. Some of
these ways include: Increasing energy efficiency—getting •more energy from less fuel
Protecting carbon sinks (for example, •oceans and forests)
Promoting sustainable forestry—har-•vesting trees in such a way that forests continue to thrive
Promoting sustainable agriculture—•reducing soil tillage and water use
Developing renewable energy sources •(for example, solar, wind, and geother-mal power)
Making it more expensive to pollute by •reducing economic subsidies (financial support) for greenhouse gas-emitting activities
Reducing greenhouse gas emissions •from cars, airplanes, and other means of transportation
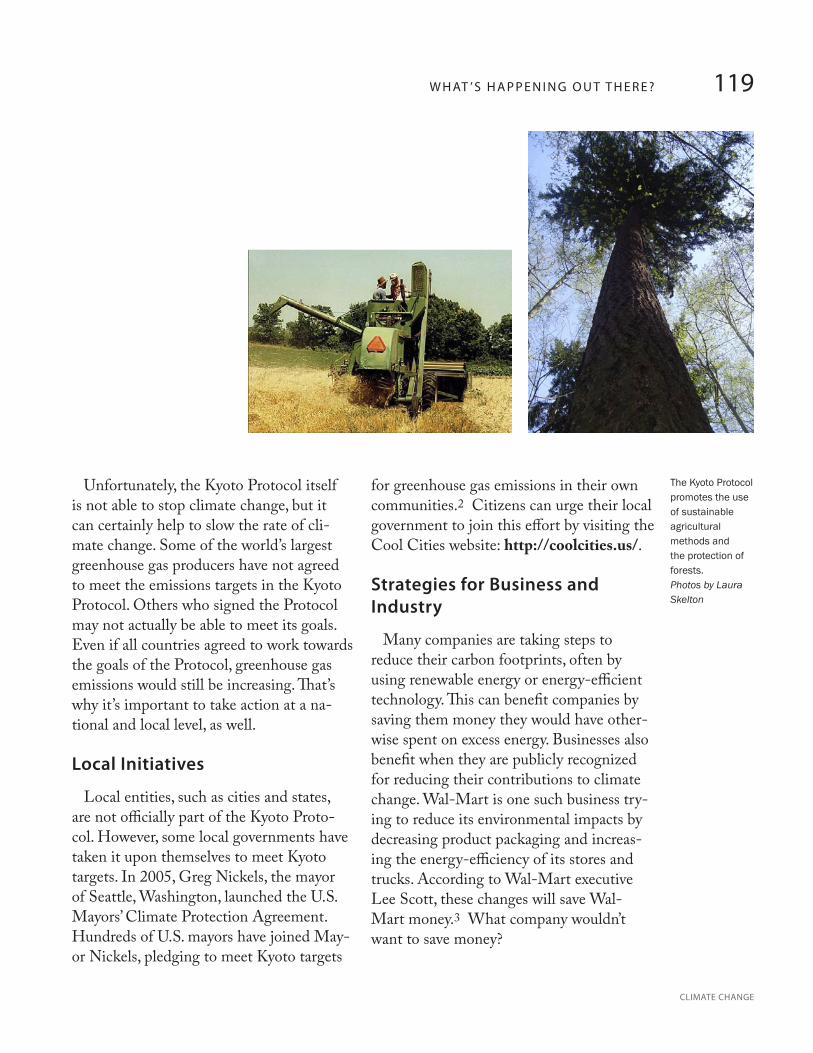
119W H AT ’ S H A P P E N I N G O U T T H E R E ?
CLIMATE CHANGE
Unfortunately, the Kyoto Protocol itself is not able to stop climate change, but it can certainly help to slow the rate of cli-mate change. Some of the world’s largest greenhouse gas producers have not agreed to meet the emissions targets in the Kyoto Protocol. Others who signed the Protocol may not actually be able to meet its goals. Even if all countries agreed to work towards the goals of the Protocol, greenhouse gas emissions would still be increasing. That’s why it’s important to take action at a na-tional and local level, as well.
Local Initiatives
Local entities, such as cities and states, are not officially part of the Kyoto Proto-col. However, some local governments have taken it upon themselves to meet Kyoto targets. In 2005, Greg Nickels, the mayor of Seattle, Washington, launched the U.S. Mayors’ Climate Protection Agreement. Hundreds of U.S. mayors have joined May-or Nickels, pledging to meet Kyoto targets
for greenhouse gas emissions in their own communities.2 Citizens can urge their local government to join this effort by visiting the Cool Cities website: http://coolcities.us/.
Strategies for Business and Industry
Many companies are taking steps to reduce their carbon footprints, often by using renewable energy or energy-efficient technology. This can benefit companies by saving them money they would have other-wise spent on excess energy. Businesses also benefit when they are publicly recognized for reducing their contributions to climate change. Wal-Mart is one such business try-ing to reduce its environmental impacts by decreasing product packaging and increas-ing the energy-efficiency of its stores and trucks. According to Wal-Mart executive Lee Scott, these changes will save Wal-Mart money.3 What company wouldn’t want to save money?
The Kyoto Protocol promotes the use of sustainable agricultural methods and the protection of forests. Photos by Laura Skelton
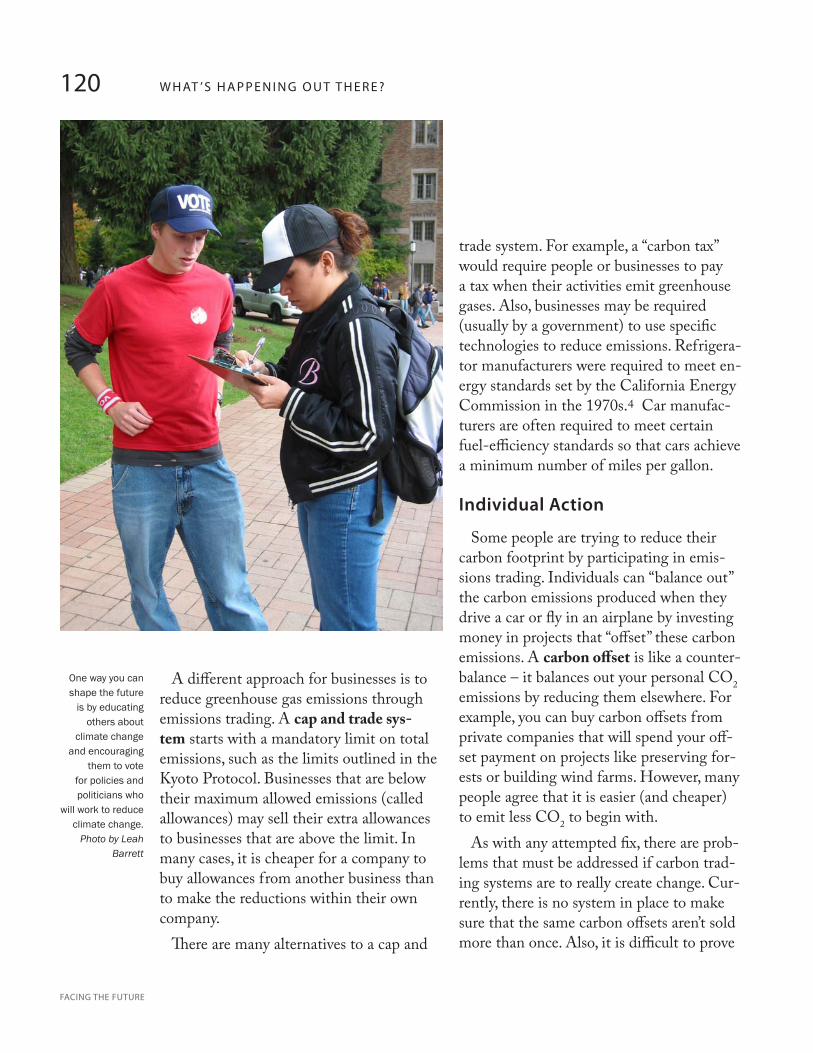
120 W H AT ’ S H A P P E N I N G O U T T H E R E ?
FACING THE FUTURE
A different approach for businesses is to reduce greenhouse gas emissions through emissions trading. A cap and trade sys-tem starts with a mandatory limit on total emissions, such as the limits outlined in the Kyoto Protocol. Businesses that are below their maximum allowed emissions (called allowances) may sell their extra allowances to businesses that are above the limit. In many cases, it is cheaper for a company to buy allowances from another business than to make the reductions within their own company.
There are many alternatives to a cap and
trade system. For example, a “carbon tax” would require people or businesses to pay a tax when their activities emit greenhouse gases. Also, businesses may be required (usually by a government) to use specific technologies to reduce emissions. Refrigera-tor manufacturers were required to meet en-ergy standards set by the California Energy Commission in the 1970s.4 Car manufac-turers are often required to meet certain fuel-efficiency standards so that cars achieve a minimum number of miles per gallon.
Individual Action
Some people are trying to reduce their carbon footprint by participating in emis-sions trading. Individuals can “balance out” the carbon emissions produced when they drive a car or fly in an airplane by investing money in projects that “offset” these carbon emissions. A carbon offset is like a counter-balance – it balances out your personal CO2 emissions by reducing them elsewhere. For example, you can buy carbon offsets from private companies that will spend your off-set payment on projects like preserving for-ests or building wind farms. However, many people agree that it is easier (and cheaper) to emit less CO2 to begin with.
As with any attempted fix, there are prob-lems that must be addressed if carbon trad-ing systems are to really create change. Cur-rently, there is no system in place to make sure that the same carbon offsets aren’t sold more than once. Also, it is difficult to prove
One way you can shape the future
is by educating others about
climate change and encouraging
them to vote for policies and politicians who
will work to reduce climate change.
Photo by Leah Barrett
121W H AT ’ S H A P P E N I N G O U T T H E R E ?
CLIMATE CHANGE
Checking for Understanding
Do you think that local climate change efforts are as important as ones happening at an interna-1. tional level? Why or why not?
Why do you think many businesses prefer a cap and trade system to other means of reducing 2. greenhouse gas emissions?
Why might some people have difficulty purchasing carbon offsets?3.
What ideas do you have for working to reduce climate change impacts within your own commu-4. nity? What groups in your community could you work with?
Vocabulary
cap and trade system—a system where a regulatory entity (usually a government) sets a cap, or limit, on total greenhouse gas emissions allowed by industry; those who emit more than their allowable limit can buy emission allowances from others who are below their limitcarbon offset—a voluntary payment by an individual or company to compensate for its greenhouse gas emissions; the money is usually spent in a way that balances the emissions (for example, by protecting forests, which are carbon sinks)
1United Nations. 1998. Kyoto Protocol to the United Nations Framework Convention on Climate Change. http://unfccc.int/kyoto_protocol/items/2830.php.
2US Mayors Climate Protection Agreement, www.seattle.gov/mayor/climate/ (accessed October 2, 2007). 3Daren Fonda, “The Greening of Wal-Mart,” Time, April 3, 2006.
4David Goldstein, Saving Energy, Growing Jobs (Berkeley: Bay Tree Publishing, 2007), 260. 5Ibid.
that all of the projects advertised to offset emissions are actually happening and that they really are reducing carbon emissions.5
There are numerous other ways that indi-viduals can join governments and businesses to positively impact the climate. A good way to get involved in local, national, and
even international efforts to address climate change is to learn more about the issues and to contact government representatives with your concerns and ideas for solutions. Elected officials rely on your input to make decisions that affect us all.
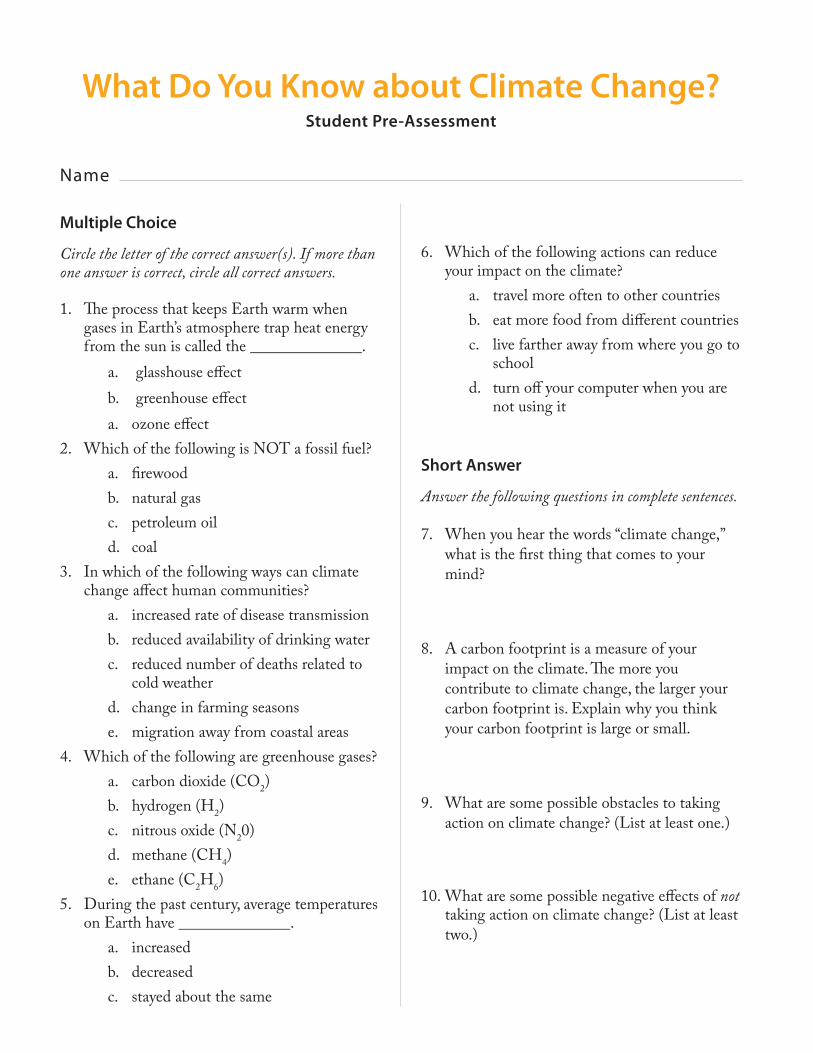
What Do You Know about Climate Change?Student Pre-Assessment
Name
Multiple Choice
Circle the letter of the correct answer(s). If more than one answer is correct, circle all correct answers.
The process that keeps Earth warm when 1. gases in Earth’s atmosphere trap heat energy from the sun is called the ______________.
glasshouse effecta. greenhouse effectb. ozone effecta.
Which of the following is NOT a fossil fuel?2. firewood a. natural gas b. petroleum oil c. coal d.
In which of the following ways can climate 3. change affect human communities?
increased rate of disease transmissiona. reduced availability of drinking waterb. reduced number of deaths related to c. cold weatherchange in farming seasonsd. migration away from coastal arease.
Which of the following are greenhouse gases?4. carbon dioxide (COa. 2) hydrogen (Hb. 2)nitrous oxide (Nc. 20)methane (CHd. 4)ethane (Ce. 2H6)
During the past century, average temperatures 5. on Earth have ______________.
increased a. decreased b. stayed about the samec.
Which of the following actions can reduce 6. your impact on the climate?
travel more often to other countriesa. eat more food from different countriesb. live farther away from where you go to c. schoolturn off your computer when you are d. not using it
Short Answer
Answer the following questions in complete sentences.
When you hear the words “climate change,” 7. what is the first thing that comes to your mind?
A carbon footprint is a measure of your 8. impact on the climate. The more you contribute to climate change, the larger your carbon footprint is. Explain why you think your carbon footprint is large or small.
What are some possible obstacles to taking 9. action on climate change? (List at least one.)
What are some possible negative effects of 10. not taking action on climate change? (List at least two.)
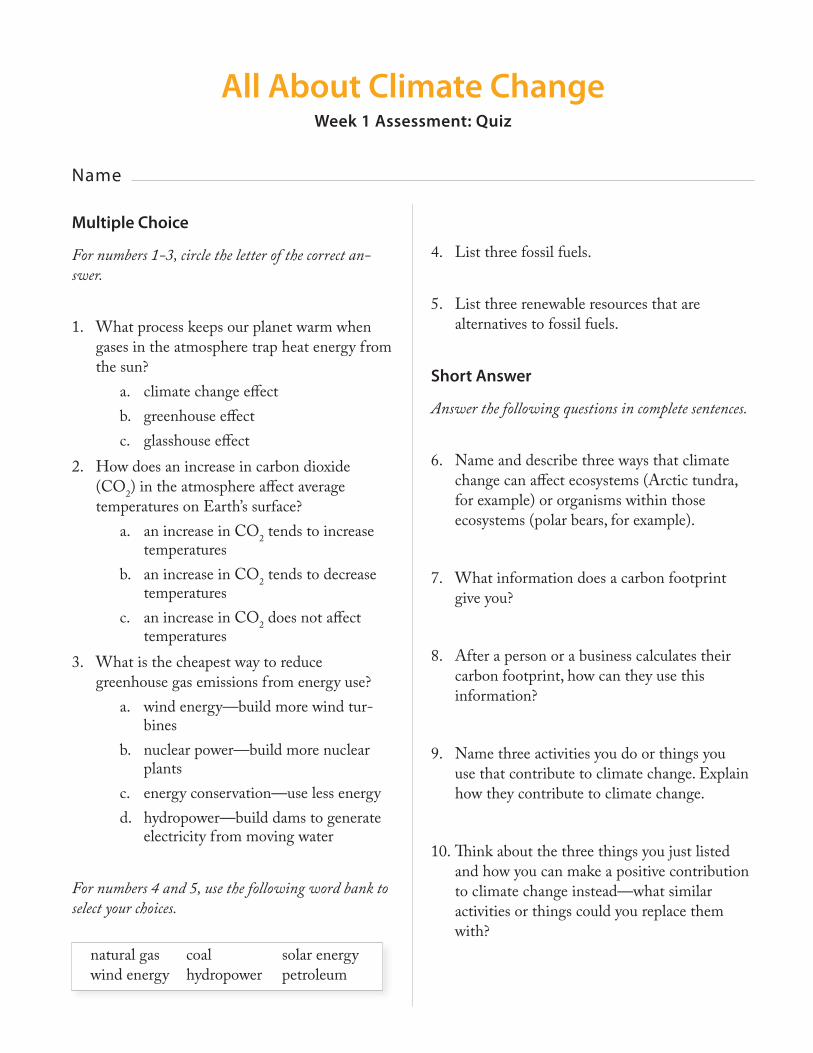
All About Climate ChangeWeek 1 Assessment: Quiz
Name
Multiple Choice
For numbers 1-3, circle the letter of the correct an-swer.
What process keeps our planet warm when 1. gases in the atmosphere trap heat energy from the sun?
climate change effect a. greenhouse effect b. glasshouse effectc.
How does an increase in carbon dioxide 2. (CO2) in the atmosphere affect average temperatures on Earth’s surface?
an increase in COa. 2 tends to increase temperatures an increase in COb. 2 tends to decrease temperatures an increase in COc. 2 does not affect temperatures
What is the cheapest way to reduce 3. greenhouse gas emissions from energy use?
wind energy—build more wind tur-a. binesnuclear power—build more nuclear b. plantsenergy conservation—use less energyc. hydropower—build dams to generate d. electricity from moving water
For numbers 4 and 5, use the following word bank to select your choices.
List three fossil fuels.4.
List three renewable resources that are 5. alternatives to fossil fuels.
Short Answer
Answer the following questions in complete sentences.
Name and describe three ways that climate 6. change can affect ecosystems (Arctic tundra, for example) or organisms within those ecosystems (polar bears, for example).
What information does a carbon footprint 7. give you?
After a person or a business calculates their 8. carbon footprint, how can they use this information?
Name three activities you do or things you 9. use that contribute to climate change. Explain how they contribute to climate change.
Think about the three things you just listed 10. and how you can make a positive contribution to climate change instead—what similar activities or things could you replace them with?
natural gas coal solar energywind energy hydropower petroleum
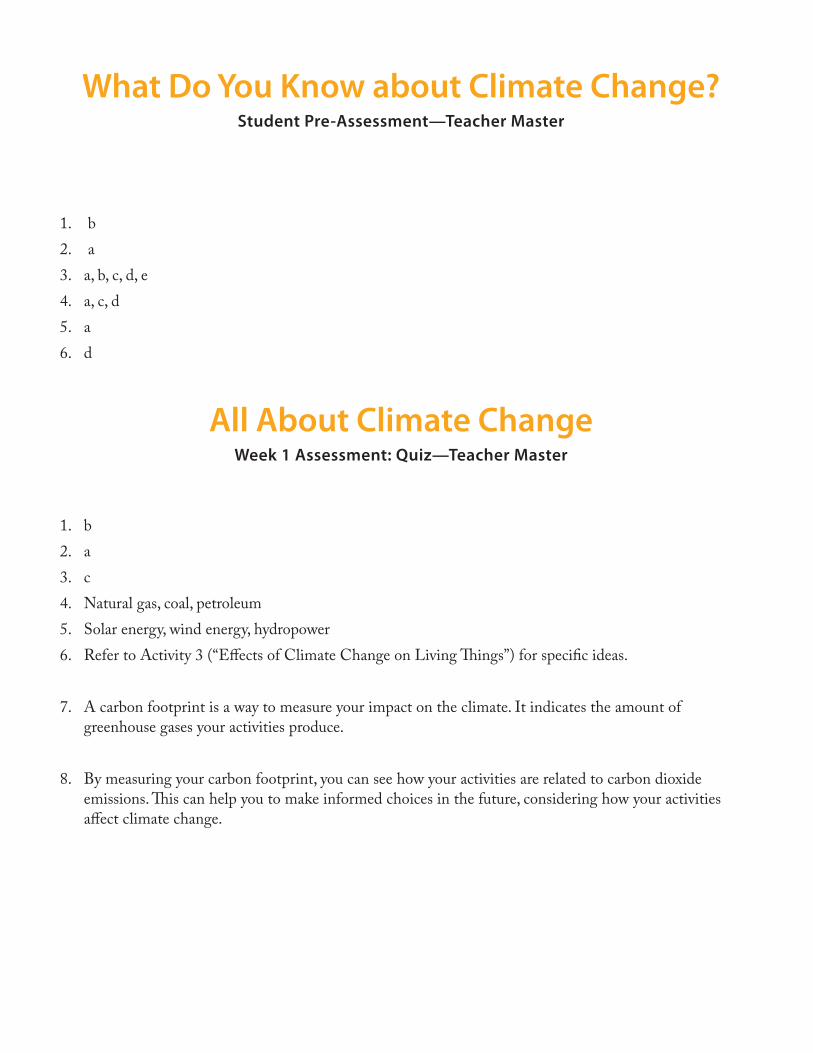
What Do You Know about Climate Change?Student Pre-Assessment—Teacher Master
b1. a2. a, b, c, d, e3. a, c, d4. a5. d6.
All About Climate ChangeWeek 1 Assessment: Quiz—Teacher Master
b1. a2. c3. Natural gas, coal, petroleum4. Solar energy, wind energy, hydropower5. Refer to Activity 3 (“Effects of Climate Change on Living Things”) for specific ideas.6.
A carbon footprint is a way to measure your impact on the climate. It indicates the amount of 7. greenhouse gases your activities produce.
By measuring your carbon footprint, you can see how your activities are related to carbon dioxide 8. emissions. This can help you to make informed choices in the future, considering how your activities affect climate change.
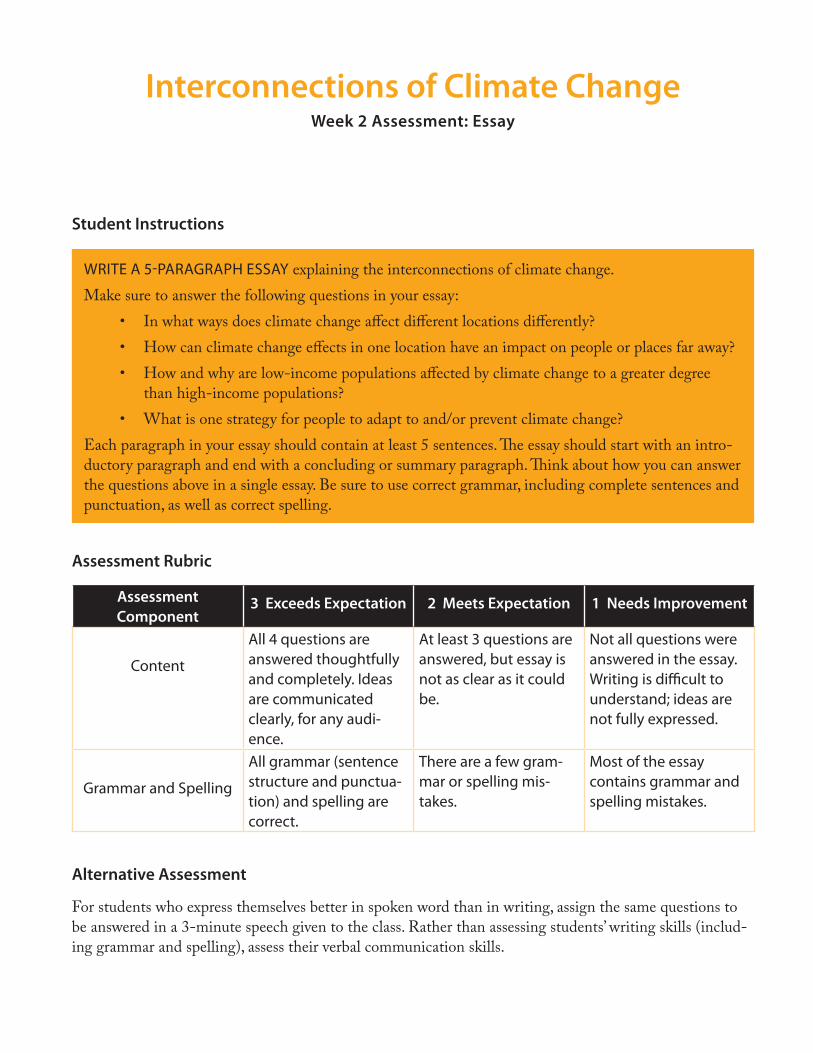
Interconnections of Climate ChangeWeek 2 Assessment: Essay
Write a 5-paragraph essay explaining the interconnections of climate change. Make sure to answer the following questions in your essay:
In what ways does climate change affect different locations differently?•How can climate change effects in one location have an impact on people or places far away?•How and why are low-income populations affected by climate change to a greater degree •than high-income populations?What is one strategy for people to adapt to and/or prevent climate change?•
Each paragraph in your essay should contain at least 5 sentences. The essay should start with an intro-ductory paragraph and end with a concluding or summary paragraph. Think about how you can answer the questions above in a single essay. Be sure to use correct grammar, including complete sentences and punctuation, as well as correct spelling.
Assessment Rubric
Assessment Component
3 Exceeds Expectation 2 Meets Expectation 1 Needs Improvement
Content
all 4 questions are answered thoughtfully and completely. ideas are communicated clearly, for any audi-ence.
at least 3 questions are answered, but essay is not as clear as it could be.
Not all questions were answered in the essay. Writing is difficult to understand; ideas are not fully expressed.
grammar and spelling
all grammar (sentence structure and punctua-tion) and spelling are correct.
there are a few gram-mar or spelling mis-takes.
Most of the essay contains grammar and spelling mistakes.
Alternative Assessment
For students who express themselves better in spoken word than in writing, assign the same questions to be answered in a 3-minute speech given to the class. Rather than assessing students’ writing skills (includ-ing grammar and spelling), assess their verbal communication skills.
Student Instructions
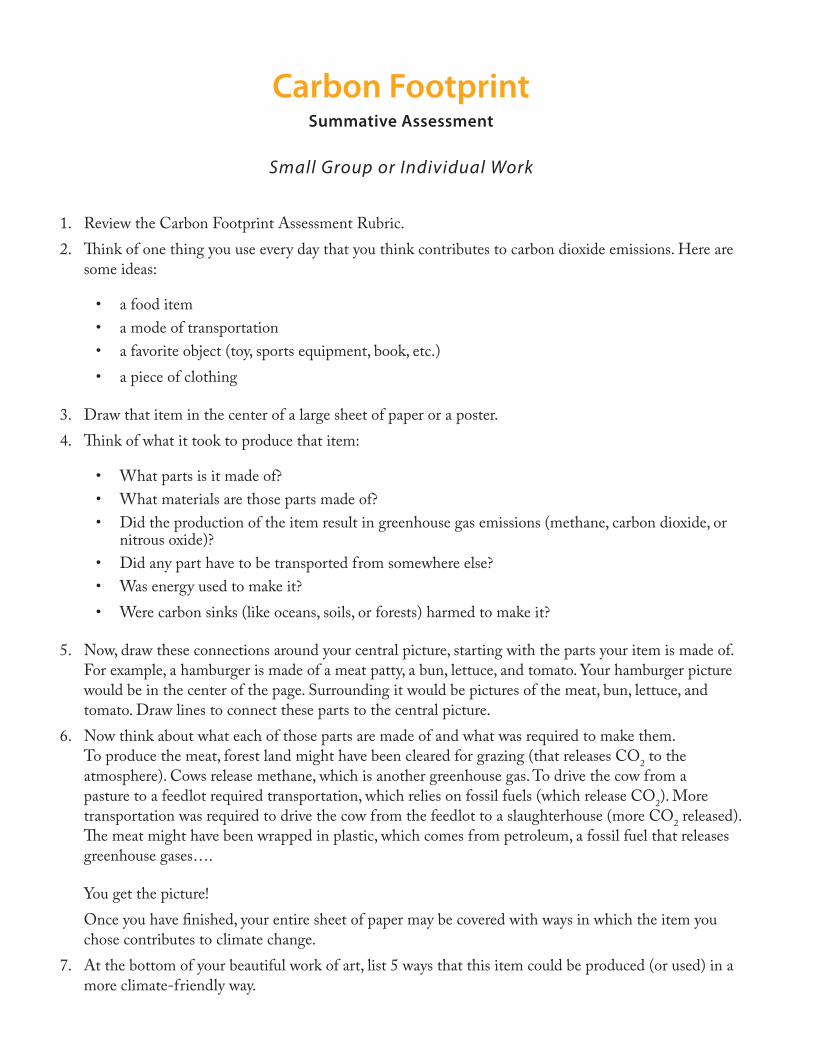
Carbon FootprintSummative Assessment
Small Group or Individual Work
Review the Carbon Footprint Assessment Rubric.1. Think of one thing you use every day that you think contributes to carbon dioxide emissions. Here are 2. some ideas:
a food item•a mode of transportation•a favorite object (toy, sports equipment, book, etc.)•a piece of clothing•
Draw that item in the center of a large sheet of paper or a poster. 3. Think of what it took to produce that item:4.
What parts is it made of?•What materials are those parts made of?•Did the production of the item result in greenhouse gas emissions (methane, carbon dioxide, or •nitrous oxide)?Did any part have to be transported from somewhere else?•Was energy used to make it?•Were carbon sinks (like oceans, soils, or forests) harmed to make it?•
Now, draw these connections around your central picture, starting with the parts your item is made of. 5. For example, a hamburger is made of a meat patty, a bun, lettuce, and tomato. Your hamburger picture would be in the center of the page. Surrounding it would be pictures of the meat, bun, lettuce, and tomato. Draw lines to connect these parts to the central picture. Now think about what each of those parts are made of and what was required to make them. 6. To produce the meat, forest land might have been cleared for grazing (that releases CO2 to the atmosphere). Cows release methane, which is another greenhouse gas. To drive the cow from a pasture to a feedlot required transportation, which relies on fossil fuels (which release CO2). More transportation was required to drive the cow from the feedlot to a slaughterhouse (more CO2 released). The meat might have been wrapped in plastic, which comes from petroleum, a fossil fuel that releases greenhouse gases….
You get the picture!Once you have finished, your entire sheet of paper may be covered with ways in which the item you chose contributes to climate change.At the bottom of your beautiful work of art, list 5 ways that this item could be produced (or used) in a 7. more climate-friendly way.
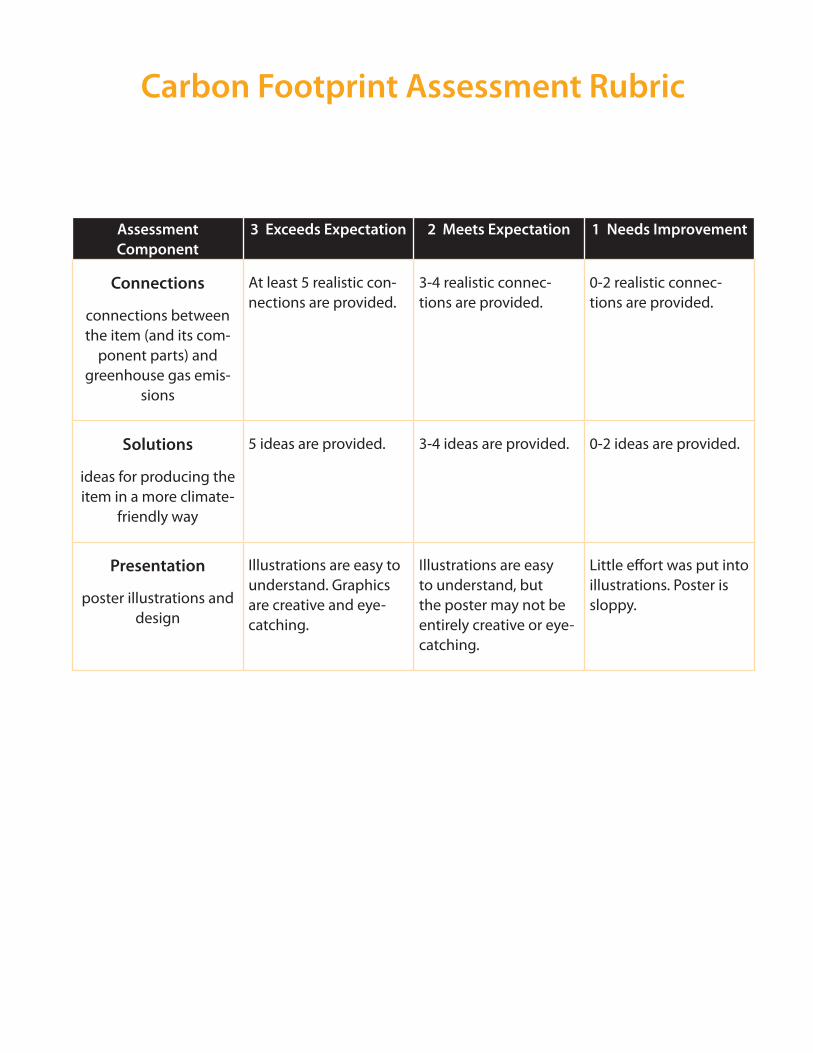
Carbon Footprint Assessment Rubric
Assessment Component
3 Exceeds Expectation 2 Meets Expectation 1 Needs Improvement
Connections
connections between the item (and its com-
ponent parts) and greenhouse gas emis-
sions
at least 5 realistic con-nections are provided.
3-4 realistic connec-tions are provided.
0-2 realistic connec-tions are provided.
Solutions
ideas for producing the item in a more climate-
friendly way
5 ideas are provided. 3-4 ideas are provided. 0-2 ideas are provided.
Presentation
poster illustrations and design
illustrations are easy to understand. graphics are creative and eye-catching.
illustrations are easy to understand, but the poster may not be entirely creative or eye-catching.
Little effort was put into illustrations. poster is sloppy.