Embed Size (px)
Citation preview

Water Quality Status and Trends in the Water Quality Status and Trends in the Clark ForkClark Fork--Pend Oreille Watershed Pend Oreille Watershed
19841984--2002 2002
Bruce Anderson, John Babcock, and Gary IngmanBruce Anderson, John Babcock, and Gary IngmanLand & Water Consulting, Inc.Land & Water Consulting, Inc.
Missoula and Helena, MTMissoula and Helena, MT

The Clark ForkThe Clark Fork--Pend Oreille WatershedPend Oreille Watershed
•• 26,000 mi.26,000 mi.2 2 drainage areadrainage area
• includes Clark Fork of the Columbia River, • includes Clark Fork of the Columbia River, Pend Oreille Lake, Pend Oreille RiverPend Oreille Lake, Pend Oreille River
• includes 2 EPA Regions, 3 states, 14 • includes 2 EPA Regions, 3 states, 14 counties, several Indian reservationscounties, several Indian reservations


TriTri--State Water Quality CouncilState Water Quality CouncilHistory & MissionHistory & Mission
•• Formed in 1993 to address interstate water quality Formed in 1993 to address interstate water quality issues in the threeissues in the three--state watershedstate watershed
• • Primary interstate issue is nutrients & eutrophicationPrimary interstate issue is nutrients & eutrophication
• • Secondary issue is heavy metals toxicitySecondary issue is heavy metals toxicity
• Mission: …”Citizens, business, industry, government • Mission: …”Citizens, business, industry, government and environmental groups are united”…”to improve and environmental groups are united”…”to improve water quality”… ”through mutual respect, water quality”… ”through mutual respect, collaboration, science and education.”collaboration, science and education.”

TriTri--State Water Quality CouncilState Water Quality CouncilManagement GoalsManagement Goals
•• Control nuisance algae in the Clark Fork by Control nuisance algae in the Clark Fork by reducing nutrient concentrationsreducing nutrient concentrations
• Protect Pend Oreille Lake by maintaining or • Protect Pend Oreille Lake by maintaining or reducing nutrient loading from the Clark Fork R.reducing nutrient loading from the Clark Fork R.
• Reduce near• Reduce near--shore eutrophication in Pend Oreille shore eutrophication in Pend Oreille Lake by reducing nonLake by reducing non--point nutrient loadingpoint nutrient loading
• Improve Pend Oreille River water quality through • Improve Pend Oreille River water quality through aquatic weed management and tributary nonaquatic weed management and tributary non--point source controlspoint source controls

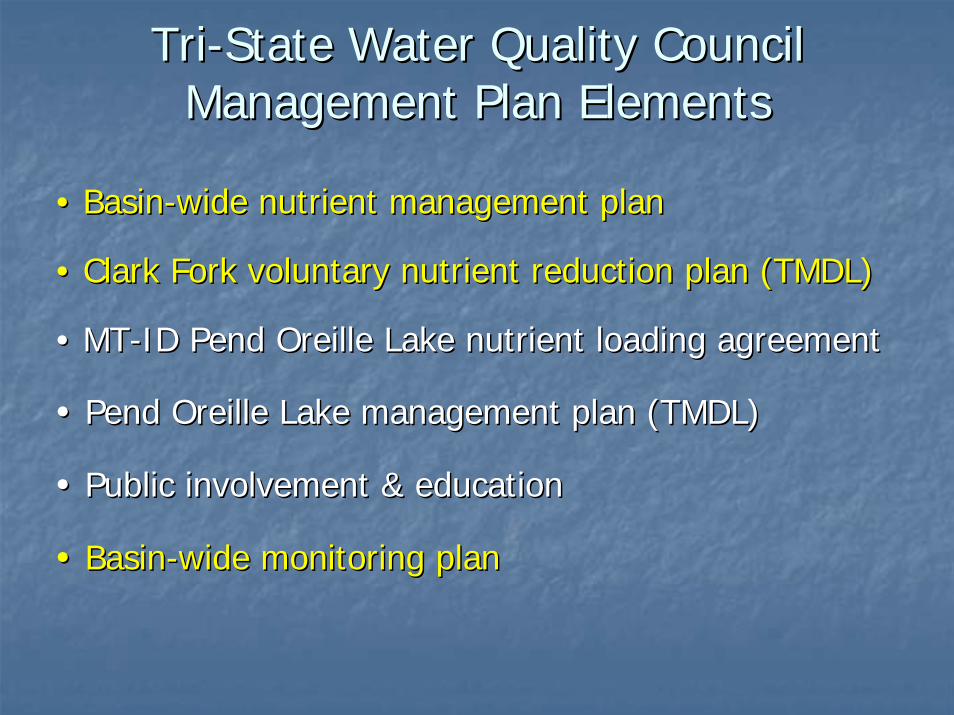
TriTri--State Water Quality CouncilState Water Quality CouncilManagement Plan ElementsManagement Plan Elements
•• BasinBasin--wide nutrient management planwide nutrient management plan
• Clark Fork voluntary nutrient reduction plan (TMDL)• Clark Fork voluntary nutrient reduction plan (TMDL)
• MT• MT--ID Pend Oreille Lake nutrient loading agreementID Pend Oreille Lake nutrient loading agreement
• • Pend Oreille Lake management plan (TMDL)Pend Oreille Lake management plan (TMDL)
• • Public involvement & educationPublic involvement & education
• • BasinBasin--wide monitoring planwide monitoring plan

Monitoring Program GoalsMonitoring Program Goals
Clark Fork RiverClark Fork River ––
• evaluate time trends for nutrient concentrations• evaluate time trends for nutrient concentrations
• evaluate time trends for periphyton standing crops• evaluate time trends for periphyton standing crops
• evaluate compliance with mid• evaluate compliance with mid--summer nutrientsummer nutrient
concentration targetsconcentration targets
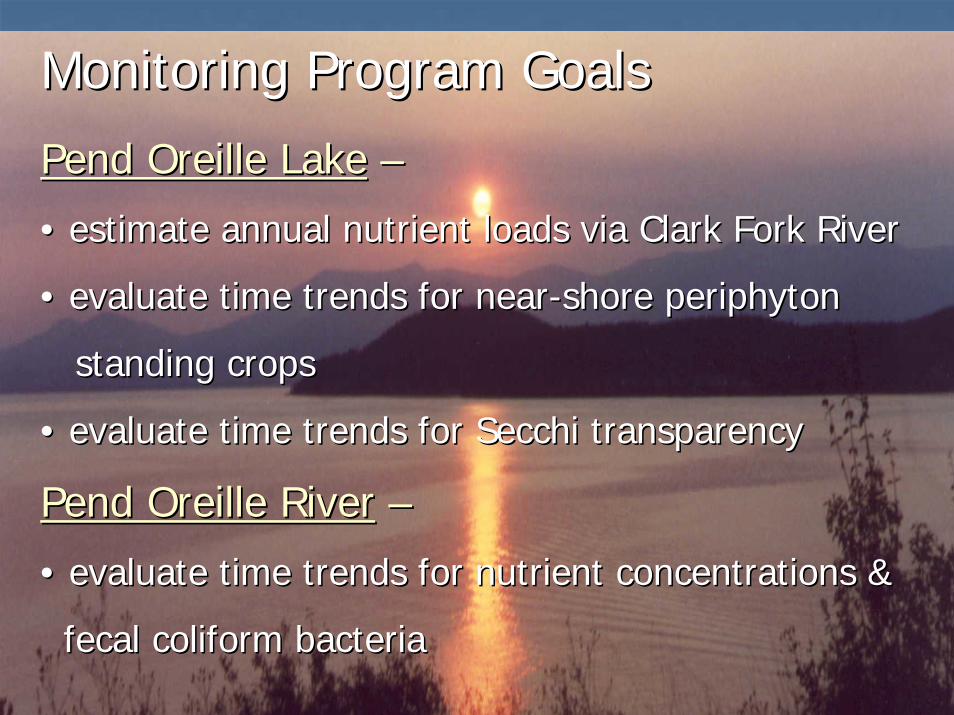
Pend Oreille LakePend Oreille Lake ––
• estimate annual nutrient loads via Clark Fork River• estimate annual nutrient loads via Clark Fork River
• evaluate time trends for near• evaluate time trends for near--shore periphytonshore periphyton
standing cropsstanding crops
• evaluate time trends for Secchi transparency• evaluate time trends for Secchi transparency
Monitoring Program GoalsMonitoring Program Goals
Pend Oreille RiverPend Oreille River ––
• evaluate time trends for nutrient concentrations & • evaluate time trends for nutrient concentrations &
fecal coliform bacteriafecal coliform bacteria

Water Quality Trends AnalysisWater Quality Trends Analysis
•• 1919--year data set available from Triyear data set available from Tri--State Council State Council and former MT DEQ monitoring programsand former MT DEQ monitoring programs
• 10• 10--year evaluation of triyear evaluation of tri--state management plan state management plan & 5& 5--year evaluation of VNRP year evaluation of VNRP
• results will be used to evaluate progress &• results will be used to evaluate progress &adjust management plan adjust management plan

Clark Fork River Nutrient Trend Clark Fork River Nutrient Trend DetectionDetection
Management Goal: Management Goal: Improve water quality Improve water quality
Monitoring Goal: Monitoring Goal: Detect significant trends in nutrient concentrationsDetect significant trends in nutrient concentrations
Definition of Water Definition of Water Quality:Quality:
Total phosphorus, total nitrogen, soluble reactive Total phosphorus, total nitrogen, soluble reactive phosphorus, total soluble inorganic nitrogen phosphorus, total soluble inorganic nitrogen
Definition of Definition of Trend: Trend:
50% change in 1050% change in 10--year period at 95% confidence level, year period at 95% confidence level, 90% power or 40% change at 90% C.L., 80% power 90% power or 40% change at 90% C.L., 80% power
Statistical Statistical Methodology: Methodology:
Seasonal Kendall with Sen slope estimate Seasonal Kendall with Sen slope estimate
Statistical Statistical Hypothesis: Hypothesis:
Ho: No trend exists Ho: No trend exists Ha: Trend existsHa: Trend exists
Data Analysis Data Analysis Result: Result:
Conclusions regarding presence of trends; Provide Conclusions regarding presence of trends; Provide estimate of trend magnitudeestimate of trend magnitude
Information Information Product: Product:
Management goal met when no trend exists, or indicates Management goal met when no trend exists, or indicates improvement improvement


Number of Statistically Significant Number of Statistically Significant Parameter/Flow CorrelationsParameter/Flow Correlations
Positive (+) Negative (-) % Significant
Total
Total P 21 0 63%
Total N 13 4 52%
Total Cu 20 0 61%
Total Zn 14 0 42%
Dissolved
TSIN 3 11 42%
SRP 14 2 48%
Flow 3 9 36%

Number of Statistically Significant Number of Statistically Significant TrendsTrends
Positive (+) Negative (-) % Total
Total
Total P 1 14 43%
Total N 0 15 43%
Total Cu 3 4 20%
Total Zn 3 5 23%
Dissolved
TSIN 14 4 51%
SRP 2 17 57%
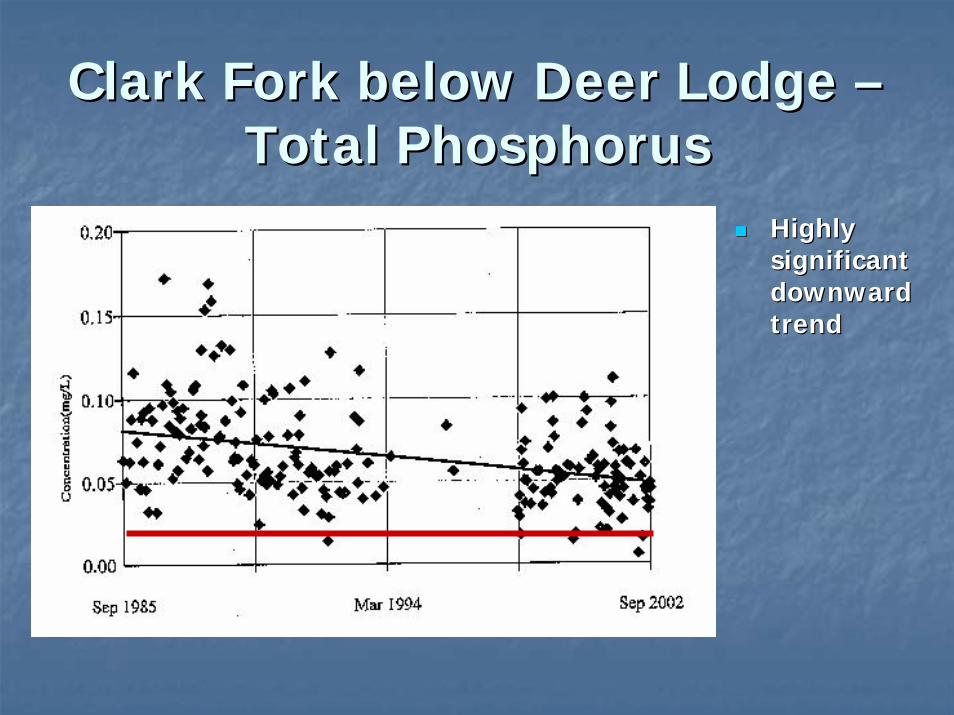
Clark Fork below Deer Lodge Clark Fork below Deer Lodge ––Total PhosphorusTotal Phosphorus
Highly Highly significant significant downward downward trendtrend

Clark Fork below Deer Lodge Clark Fork below Deer Lodge ––Total NitrogenTotal Nitrogen
Highly Highly significant significant downward downward trendtrend

Clark Fork below vs. above Missoula Clark Fork below vs. above Missoula ––Total Total PhophorusPhophorus
Clark Fork above Missoula
y = 1E-06x - 0.0233R2 = 0.0087
0.00
0.05
0.10
0.15
0.20
0.25
Jan-84 Jan-85 Jan-86 Jan-87 Jan-88 Jan-89 Jan-90 Jan-91 Jan-92 Jan-93 Jan-94 Jan-95 Jan-96 Jan-97 Jan-98 Jan-99 Jan-00 Jan-01 Jan-02
Tota
l Pho
spho
rus
(mg/
L)
Clark Fork below Missoula
y = -3E-06x + 0.1438R2 = 0.0606
0.00
0.02
0.04
0.06
0.08
0.10
0.12
0.14
0.16
0.18
0.20
Jan-84 Jan-85 Jan-86 Jan-87 Jan-88 Jan-89 Jan-90 Jan-91 Jan-92 Jan-93 Jan-94 Jan-95 Jan-96 Jan-97 Jan-98 Jan-99 Jan-00 Jan-01 Jan-02
Tota
l Pho
spho
rus
(mg/
L)
Highly significant Highly significant downward trend downward trend below Missoula below Missoula (30(30--40% total 40% total reduction)reduction)
No significant No significant trend was present trend was present above Missoulaabove Missoula

Clark Fork below vs. above Missoula Clark Fork below vs. above Missoula ––Total NitrogenTotal Nitrogen
No significant No significant upward or upward or downward trend downward trend below Missoulabelow Missoula
Moderately Moderately significant significant downward trend downward trend above Missoulaabove Missoula

Clark Fork below vs. above Missoula Clark Fork below vs. above Missoula ––Dissolved NitrogenDissolved Nitrogen
No significant No significant upward or upward or downward trend downward trend above Missoulaabove Missoula
Highly significant Highly significant upward trend upward trend below Missoulabelow Missoula

Bitterroot River Bitterroot River –– Dissolved NitrogenDissolved Nitrogen
Highly Highly significant significant upward trendupward trend

Conclusions Conclusions –– Clark Fork RiverClark Fork RiverConcentrations for most nutrient variables have Concentrations for most nutrient variables have declined in response to management actionsdeclined in response to management actions
Summer nutrient concentrations are Summer nutrient concentrations are approaching targets but are not yet in approaching targets but are not yet in compliance at most stationscompliance at most stations
Trend slopes suggest P targets will be attained Trend slopes suggest P targets will be attained at most stations within a few yearsat most stations within a few years
Soluble N concentrations are increasing in the Soluble N concentrations are increasing in the middle segments of the river in response to middle segments of the river in response to development activitiesdevelopment activities

Application of Results Application of Results ––Connecting the Feedback LoopConnecting the Feedback Loop
•• Management measures have been effective at improving Management measures have been effective at improving water quality throughout much of the riverwater quality throughout much of the river
• At the same time, local & regional development activities • At the same time, local & regional development activities are offsetting some of these improvements & are are offsetting some of these improvements & are compromising the ability to achieve WQ goalscompromising the ability to achieve WQ goals
• Basin• Basin--wide nutrient management plan assumptions & wide nutrient management plan assumptions & elements will need to be adjusted to place more elements will need to be adjusted to place more emphasis on growth issuesemphasis on growth issues
• Results will be used to fine• Results will be used to fine--tune the monitoring program tune the monitoring program

Some Lessons LearnedSome Lessons Learned•• A longA long--term trends monitoring program applied at the term trends monitoring program applied at the
watershed scale can be invaluable in documenting watershed scale can be invaluable in documenting effectiveness of management actions & and in detecting effectiveness of management actions & and in detecting emerging problems early onemerging problems early on
• This program has helped the Council to establish trust • This program has helped the Council to establish trust among stakeholders & neutralize contentious issuesamong stakeholders & neutralize contentious issues
• The program has provided a means to educate basin • The program has provided a means to educate basin residents & stakeholders, elicit cooperation, give credit residents & stakeholders, elicit cooperation, give credit to partners, & demonstrate commitment to downstream to partners, & demonstrate commitment to downstream neighborsneighbors
• Despite the best monitoring design efforts, the answers • Despite the best monitoring design efforts, the answers won’t always be cut & dried won’t always be cut & dried