Embed Size (px)
Citation preview
CLACKAMAS COUNTY
ECONOMIC LANDSCAPE:
Emerging Trends and Strategies
June 22, 2012
Prepared by
This entire report is made of readily recyclable materials.
June 2012 Clackamas County Economic Landscape Update page 2
www.fcsgroup.comFCS GROUP
Table of Contents
Section I: Introduction and Background ...................................................................................... 3
Background ............................................................................................................................. 4
Section II: Emerging Trends ........................................................................................................ 5
II.A. Global, National and Regional trends ............................................................................... 5
II.B. Employment Growth Forecast ......................................................................................... 12
II.C Business Formation Trends ............................................................................................ 13
Section III: Key Clusters ............................................................................................................ 17
III.A. Overall findings ............................................................................................................ 17
III.B. Key Clusters .................................................................................................................. 18
III.B.1. Professional Business Services .................................................................................... 22
III.B.2. Health Care ................................................................................................................. 24
III.B.3. Wholesale Trade ......................................................................................................... 26
III.B.4. Advanced Manufacturing – Metals & Machinery .......................................................... 28
III.B.5. High Tech ................................................................................................................... 30
III.B.6. Nurseries & Greenhouses............................................................................................ 32
III.B.7. Trucking & Distribution .............................................................................................. 34
III.B.8. Food & Beverage Processing ....................................................................................... 36
III.B.9. Wood Product Manufacturing ...................................................................................... 38
III.B.10. Agriculture & Food Production .................................................................................. 40
III.C. Regional Cluster Marketing Efforts ................................................................................ 42
III.D. Business Location Criteria ............................................................................................. 42
III.E. Targeted business outreach ........................................................................................... 43
Section IV: Development Overview ............................................................................................ 46
IV.A. Public investments ........................................................................................................ 46
IV.B. Public/Private investments ............................................................................................ 46
IV.C. Private investments ...................................................................................................... 47
Section V: Employment Centers Analysis .................................................................................. 51
Section VI: Summary and Policy Discussion .............................................................................. 54
V.A Summary of Findings ...................................................................................................... 54
VI.B. Policy considerations .................................................................................................... 55
Appendix A – Glossary ............................................................................................................. 56
June 2012 Clackamas County Economic Landscape Update page 3
www.fcsgroup.comFCS GROUP
Section I: Introduction and Background
Clackamas County Business and Community Services continues to focus on efforts to
broaden the county‘s knowledge and understanding of the ―economic landscape‖ of the
county, specifically within the context of the greater Portland regional economy.
Keeping abreast of current emerging trends enables the county to proactively develop
public policies and strategies that enhance economic development potential and create local
opportunities that have a beneficial ―ripple effect‖ throughout the region. This report assists
the county in achieving its economic goals, which include:
Increasing the jobs-to-housing ratio
Increasing the average wages earned within the county
Ensuring that we are efficiently using our land and infrastructure for the highest and
best value, and that it balances economic opportunity with quality of life measures
Encouraging the region to gain a similar understanding across jurisdictions that will
enable us to market and promote the region in a coordinated and cohesive manner;
thereby optimizing all regional opportunities.
Clackamas County commissioned FCS GROUP (with assistance from Real Urban Geographics)
to update prior economic landscape analysis using emerging trends that take into account
the impact of the recent national economic recession. Specifically, the FCS GROUP scope of
work is ―to convey the current economic forces that are driving the Clackamas County local
economy…‖ through several tasks as follows:
Task 1: Analyze Emerging Trends
Task 2: Prepare Graphics
Task 3: Document Findings
June 2012 Clackamas County Economic Landscape Update page 4
www.fcsgroup.comFCS GROUP
BACKGROUND
The prior Clackamas County Economic Landscape analysis provided a deeper understanding
of the global context in which Clackamas County and the greater Portland region
―competes‖ for business investment. Prior work was managed by FCS GROUP with strategic
input from Michael Gallis and Associates, a renowned international econometric and
planning firm. That effort concluded that Clackamas County functions as an integral part of
the greater Portland region; and the long-term success of the region is dependent upon our
ability to optimize land, infrastructure, and human capital collaboratively. On the local level,
county, city and business investment and policy decisions interact to create new
opportunities for economic development activity.
The findings contained in the prior 2010 Clackamas County Economic Landscape analysis
utilized estimates for employment and other measures of economic activity using 2006 and
2007 data. The prior Economic Landscape study formulated an innovative methodology and
approach for analyzing and understanding local and regional economies, using measures of
economic ―value added‖ and ―output‖ that go beyond direct payroll and employment activity.
Innovative methods were also used to ―map‖ the economic contribution of key industry
clusters, and to quantify measures of economic activity per acre of land area within select
employment centers.
Because the impact of the recent national economic recession were not documented in the
prior Economic Landscape study, it is important to revisit those findings—using a similar
―data mining‖ approach that documents emerging trends and key clusters that are expected
to drive the county‘s economy over the next decade.1
This report relies primarily upon data derived from the IMPLAN (Impact Analysis Model for
Planning) to convey local county and regional trends. Since the results of the IMPLAN model
is based on a methodology that is different from that used by the Oregon Employment
Department for estimating employment and calculating earnings, direct comparisons
between IMPLAN and Oregon Employment Department data sets is not recommended.
1 According to the National Bureau of Economic Research, the most recent U.S. recession lasted 19 months
(December 2007 to June 2009); the longest recession on record since the beginning of the “Great Depression” which started in August 1929.
June 2012 Clackamas County Economic Landscape Update page 5
www.fcsgroup.comFCS GROUP
Section II. Emerging Trends
This section summarizes the results from the emerging trends analysis. The work
undertaken by FCS GROUP to complete the analysis included:
Compiling and reviewing relevant available background materials, reports, studies, data,
land use plans, and related information
Evaluating direct, indirect and induced economic activity within the Clackamas County
and greater Portland regional economy, using the IMPLAN model. Please refer to
www.implan.com and the Glossary provided in this report for an explanation of terms
and definitions utilized by the IMPLAN model.
Summarizing results and identifying trends in business formations, employment, and
investment activity.
The results included in this document are intended to help inform the Clackamas County
and interested local and regional stakeholders about the opportunities within key clusters
or business types. The findings could also serve as a potential basis for allocating local
funding to assist with constructing projects or managing activities that help influence
strategic private investment.
II.A. GLOBAL, NATIONAL AND REGIONAL TRENDS
The Portland MSA is the largest regional economy between San Francisco and Seattle and
ranks 5th in the Western United States in terms of regional population. The Portland MSA
contains over 2.2 million residents, has a civilian labor force of 1.2 million, and generates
an annual GDP in excess of $117 billion.
The U.S. and Oregon economy are currently recovering from an 18-month economic
recession that began in December 2007 and officially ended in June 2008, according to the
National Bureau of Economic Research. The recent ―Great Recession‖ is the longest on
record since 1939 and has resulted in an economic slowdown across the U.S.
As of 2012, moderate economic expansion is occurring nationally and in Oregon. According
to the U.S. Bureau of Economic Analysis, real Gross Domestic Product (GDP is the measure
of the value of all goods and services produced annually) increased in 2011 at an annual
rate of 1.7%; and increased at an annual rate of 3.0% in 2010.
June 2012 Clackamas County Economic Landscape Update page 6
www.fcsgroup.comFCS GROUP
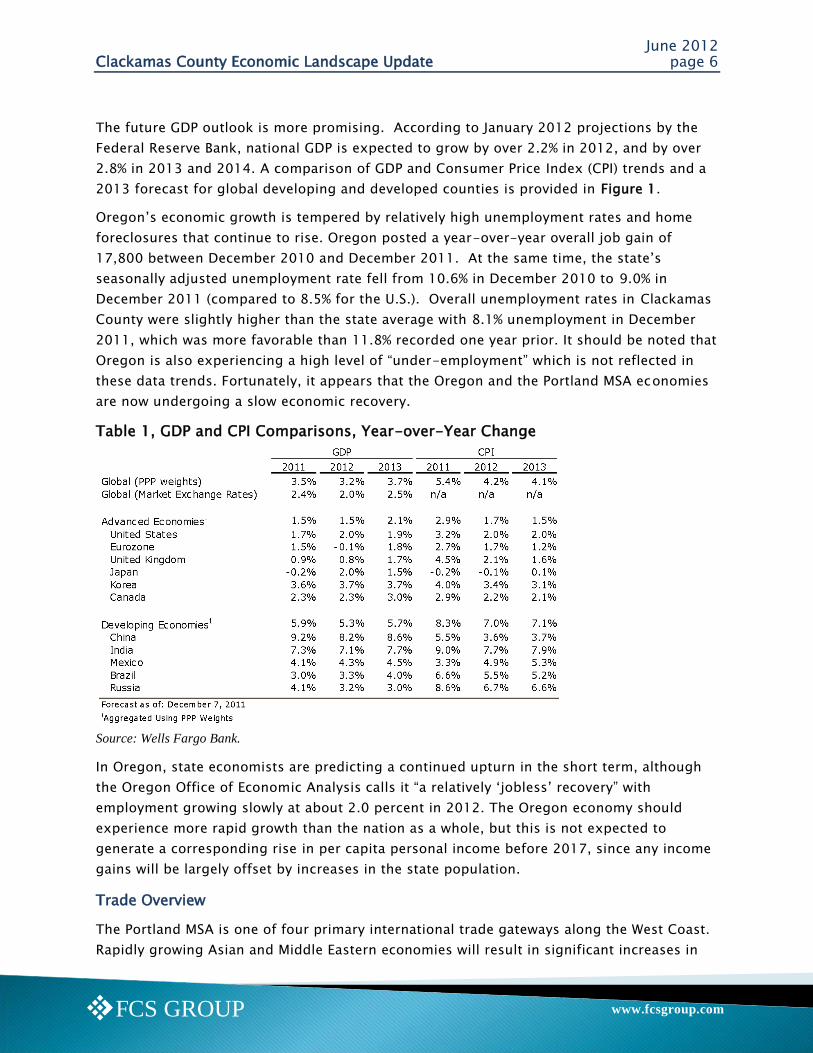
The future GDP outlook is more promising. According to January 2012 projections by the
Federal Reserve Bank, national GDP is expected to grow by over 2.2% in 2012, and by over
2.8% in 2013 and 2014. A comparison of GDP and Consumer Price Index (CPI) trends and a
2013 forecast for global developing and developed counties is provided in Figure 1.
Oregon‘s economic growth is tempered by relatively high unemployment rates and home
foreclosures that continue to rise. Oregon posted a year-over-year overall job gain of
17,800 between December 2010 and December 2011. At the same time, the state‘s
seasonally adjusted unemployment rate fell from 10.6% in December 2010 to 9.0% in
December 2011 (compared to 8.5% for the U.S.). Overall unemployment rates in Clackamas
County were slightly higher than the state average with 8.1% unemployment in December
2011, which was more favorable than 11.8% recorded one year prior. It should be noted that
Oregon is also experiencing a high level of ―under-employment‖ which is not reflected in
these data trends. Fortunately, it appears that the Oregon and the Portland MSA economies
are now undergoing a slow economic recovery.
Table 1, GDP and CPI Comparisons, Year-over-Year Change
Source: Wells Fargo Bank.
In Oregon, state economists are predicting a continued upturn in the short term, although
the Oregon Office of Economic Analysis calls it ―a relatively ‗jobless‘ recovery‖ with
employment growing slowly at about 2.0 percent in 2012. The Oregon economy should
experience more rapid growth than the nation as a whole, but this is not expected to
generate a corresponding rise in per capita personal income before 2017, since any income
gains will be largely offset by increases in the state population.
Trade Overview
The Portland MSA is one of four primary international trade gateways along the West Coast.
Rapidly growing Asian and Middle Eastern economies will result in significant increases in
June 2012 Clackamas County Economic Landscape Update page 7
www.fcsgroup.comFCS GROUP
demand for trade into and out of most international and regional ports, including the Port
of Portland. Commodity flow forecasts for the region project a doubling of freight volume
over the next 20 years. This growth equates to an average annual growth rate of 2-3%,
which is faster than the regional population growth rate.
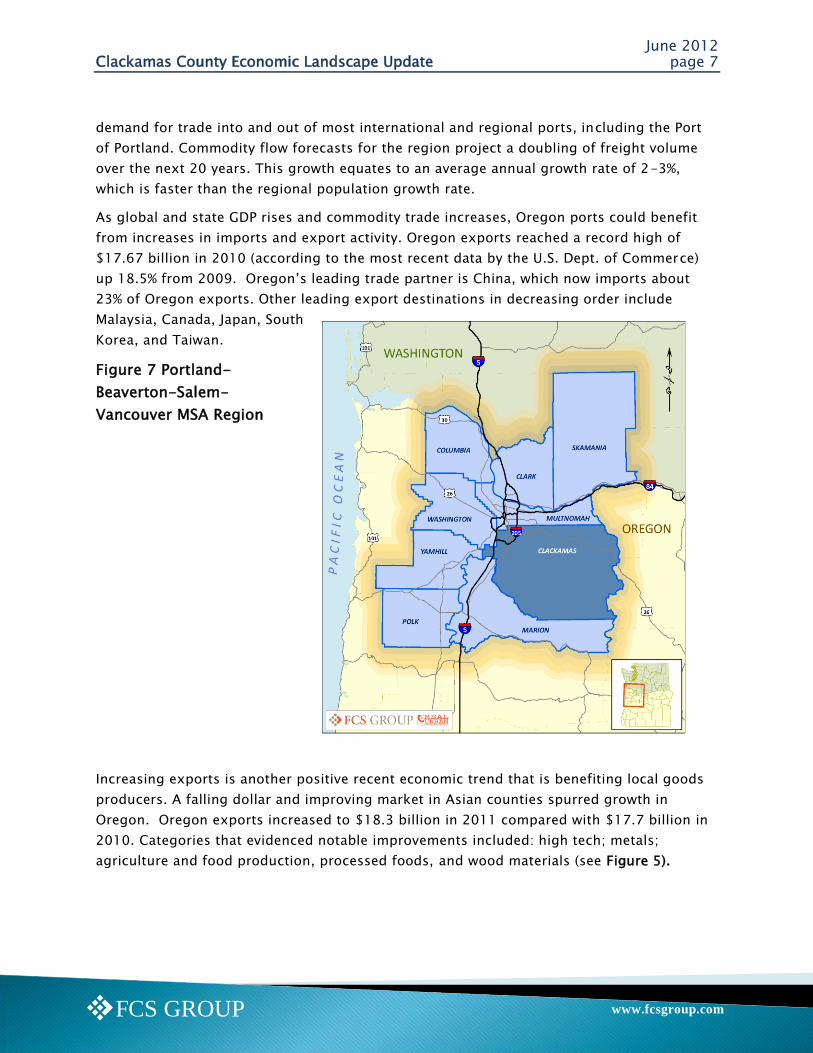
As global and state GDP rises and commodity trade increases, Oregon ports could benefit
from increases in imports and export activity. Oregon exports reached a record high of
$17.67 billion in 2010 (according to the most recent data by the U.S. Dept. of Commerce)
up 18.5% from 2009. Oregon‘s leading trade partner is China, which now imports about
23% of Oregon exports. Other leading export destinations in decreasing order include
Malaysia, Canada, Japan, South
Korea, and Taiwan.
Figure 7 Portland-
Beaverton-Salem-
Vancouver MSA Region
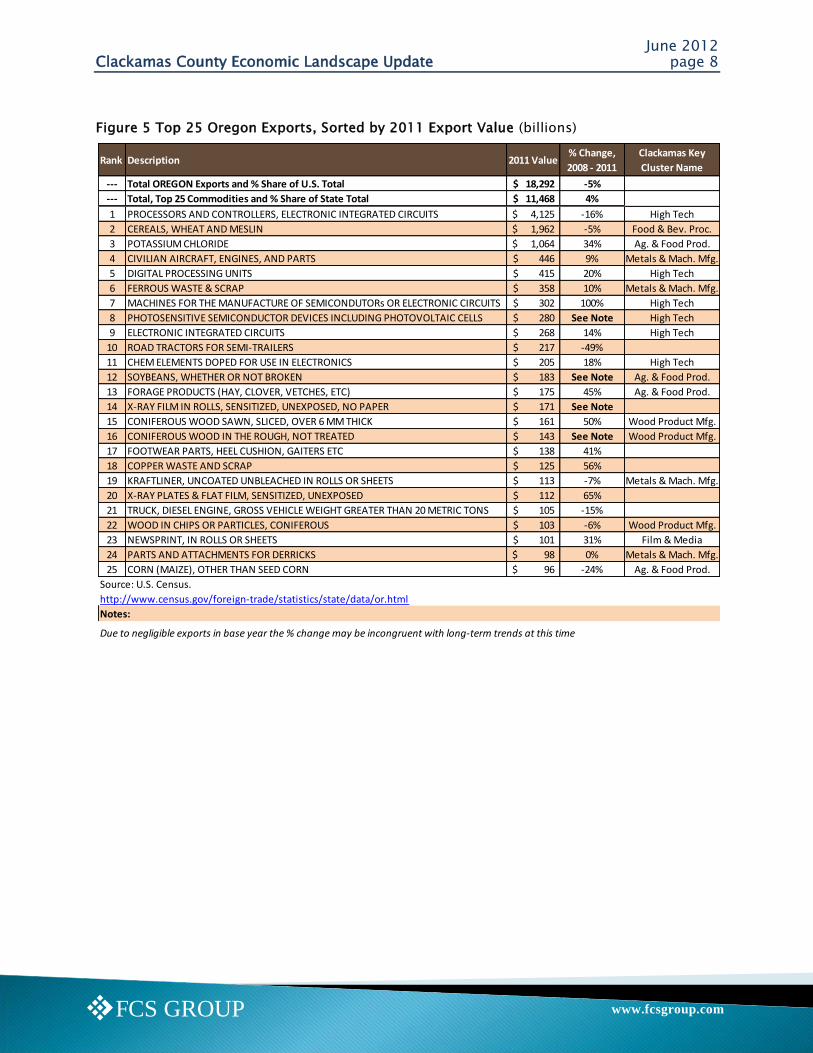
Increasing exports is another positive recent economic trend that is benefiting local goods
producers. A falling dollar and improving market in Asian counties spurred growth in
Oregon. Oregon exports increased to $18.3 billion in 2011 compared with $17.7 billion in
2010. Categories that evidenced notable improvements included: high tech; metals;
agriculture and food production, processed foods, and wood materials (see Figure 5).
June 2012 Clackamas County Economic Landscape Update page 8
www.fcsgroup.comFCS GROUP
Figure 5 Top 25 Oregon Exports, Sorted by 2011 Export Value (billions)
Rank Description 2011 Value% Change,
2008 - 2011
Clackamas Key
Cluster Name
--- Total OREGON Exports and % Share of U.S. Total 18,292$ -5%
--- Total, Top 25 Commodities and % Share of State Total 11,468$ 4%
1 PROCESSORS AND CONTROLLERS, ELECTRONIC INTEGRATED CIRCUITS 4,125$ -16% High Tech
2 CEREALS, WHEAT AND MESLIN 1,962$ -5% Food & Bev. Proc.
3 POTASSIUM CHLORIDE 1,064$ 34% Ag. & Food Prod.
4 CIVILIAN AIRCRAFT, ENGINES, AND PARTS 446$ 9% Metals & Mach. Mfg.
5 DIGITAL PROCESSING UNITS 415$ 20% High Tech
6 FERROUS WASTE & SCRAP 358$ 10% Metals & Mach. Mfg.
7 MACHINES FOR THE MANUFACTURE OF SEMICONDUTORs OR ELECTRONIC CIRCUITS 302$ 100% High Tech
8 PHOTOSENSITIVE SEMICONDUCTOR DEVICES INCLUDING PHOTOVOLTAIC CELLS 280$ See Note High Tech
9 ELECTRONIC INTEGRATED CIRCUITS 268$ 14% High Tech
10 ROAD TRACTORS FOR SEMI-TRAILERS 217$ -49%
11 CHEM ELEMENTS DOPED FOR USE IN ELECTRONICS 205$ 18% High Tech
12 SOYBEANS, WHETHER OR NOT BROKEN 183$ See Note Ag. & Food Prod.
13 FORAGE PRODUCTS (HAY, CLOVER, VETCHES, ETC) 175$ 45% Ag. & Food Prod.
14 X-RAY FILM IN ROLLS, SENSITIZED, UNEXPOSED, NO PAPER 171$ See Note
15 CONIFEROUS WOOD SAWN, SLICED, OVER 6 MM THICK 161$ 50% Wood Product Mfg.
16 CONIFEROUS WOOD IN THE ROUGH, NOT TREATED 143$ See Note Wood Product Mfg.
17 FOOTWEAR PARTS, HEEL CUSHION, GAITERS ETC 138$ 41%
18 COPPER WASTE AND SCRAP 125$ 56%
19 KRAFTLINER, UNCOATED UNBLEACHED IN ROLLS OR SHEETS 113$ -7% Metals & Mach. Mfg.
20 X-RAY PLATES & FLAT FILM, SENSITIZED, UNEXPOSED 112$ 65%
21 TRUCK, DIESEL ENGINE, GROSS VEHICLE WEIGHT GREATER THAN 20 METRIC TONS 105$ -15%
22 WOOD IN CHIPS OR PARTICLES, CONIFEROUS 103$ -6% Wood Product Mfg.
23 NEWSPRINT, IN ROLLS OR SHEETS 101$ 31% Film & Media
24 PARTS AND ATTACHMENTS FOR DERRICKS 98$ 0% Metals & Mach. Mfg.
25 CORN (MAIZE), OTHER THAN SEED CORN 96$ -24% Ag. & Food Prod.
Source: U.S. Census.
http://www.census.gov/foreign-trade/statistics/state/data/or.html
Notes:
Due to negligible exports in base year the % change may be incongruent with long-term trends at this time
June 2012 Clackamas County Economic Landscape Update page 9
www.fcsgroup.comFCS GROUP
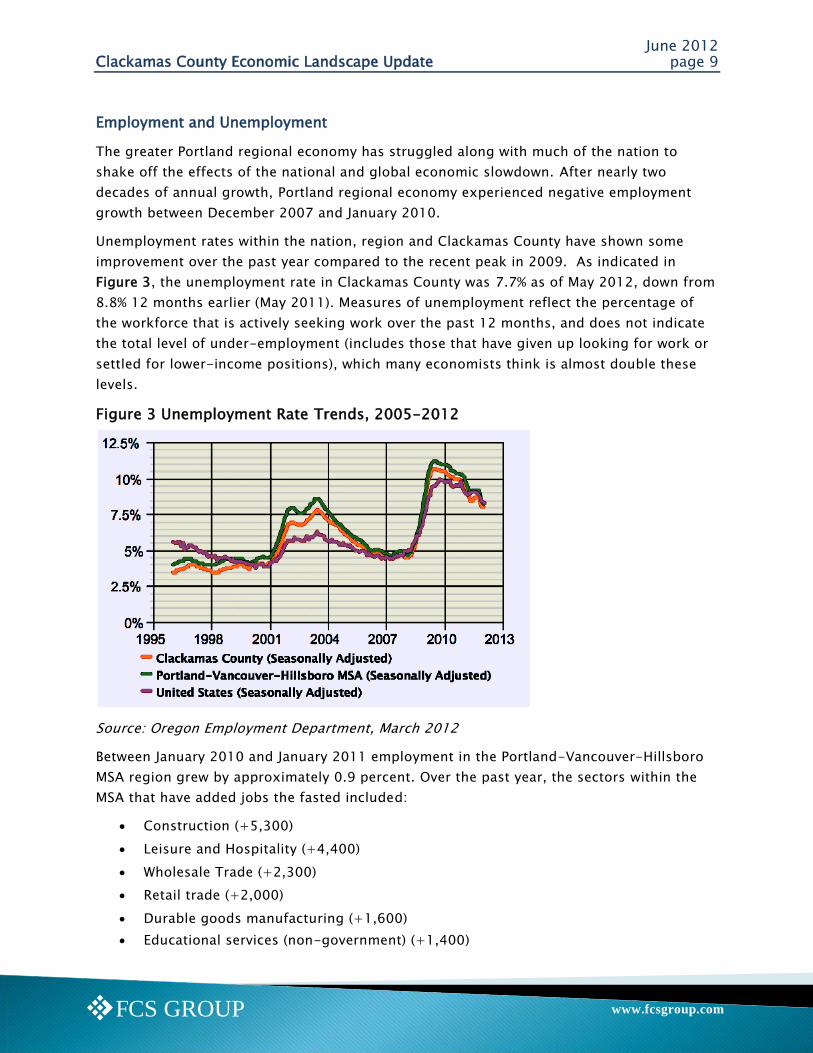
Employment and Unemployment
The greater Portland regional economy has struggled along with much of the nation to
shake off the effects of the national and global economic slowdown. After nearly two
decades of annual growth, Portland regional economy experienced negative employment
growth between December 2007 and January 2010.
Unemployment rates within the nation, region and Clackamas County have shown some
improvement over the past year compared to the recent peak in 2009. As indicated in
Figure 3, the unemployment rate in Clackamas County was 7.7% as of May 2012, down from
8.8% 12 months earlier (May 2011). Measures of unemployment reflect the percentage of
the workforce that is actively seeking work over the past 12 months, and does not indicate
the total level of under-employment (includes those that have given up looking for work or
settled for lower-income positions), which many economists think is almost double these
levels.
Figure 3 Unemployment Rate Trends, 2005-2012
Source: Oregon Employment Department, March 2012
Between January 2010 and January 2011 employment in the Portland-Vancouver-Hillsboro
MSA region grew by approximately 0.9 percent. Over the past year, the sectors within the
MSA that have added jobs the fasted included:
Construction (+5,300)
Leisure and Hospitality (+4,400)
Wholesale Trade (+2,300)
Retail trade (+2,000)
Durable goods manufacturing (+1,600)
Educational services (non-government) (+1,400)
June 2012 Clackamas County Economic Landscape Update page 10
www.fcsgroup.comFCS GROUP
Health care and social assistance (+1,300)
Arts, entertainment & recreation (+1,200)
Professional and business services (+200)
Software publishers (+200)
Truck transportation (+100)
Nondurable goods manufacturing ( no change)
The sectors within the MSA showing the largest declines in employment over the past year
include:
Local government (-1,600)
Administrative and support services (-1,200)
Information (-600)
Federal government (-400)
Financial activities (-400)
Misc. services (-400)
Management of companies and enterprises (-300)
Membership associations and organizations (-1,100)
State government (-200)
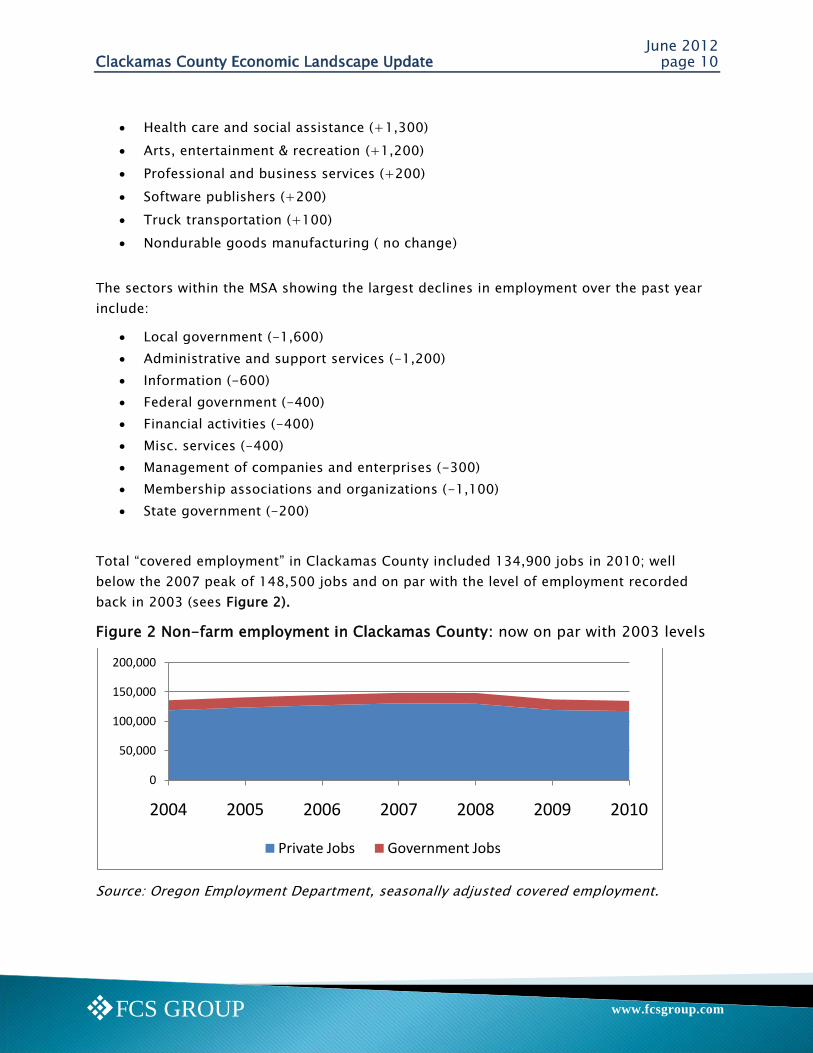
Total ―covered employment‖ in Clackamas County included 134,900 jobs in 2010; well
below the 2007 peak of 148,500 jobs and on par with the level of employment recorded
back in 2003 (sees Figure 2).
Figure 2 Non-farm employment in Clackamas County: now on par with 2003 levels
Source: Oregon Employment Department, seasonally adjusted covered employment.
0
50,000
100,000
150,000
200,000
2004 2005 2006 2007 2008 2009 2010
Private Jobs Government Jobs
June 2012 Clackamas County Economic Landscape Update page 11
www.fcsgroup.comFCS GROUP
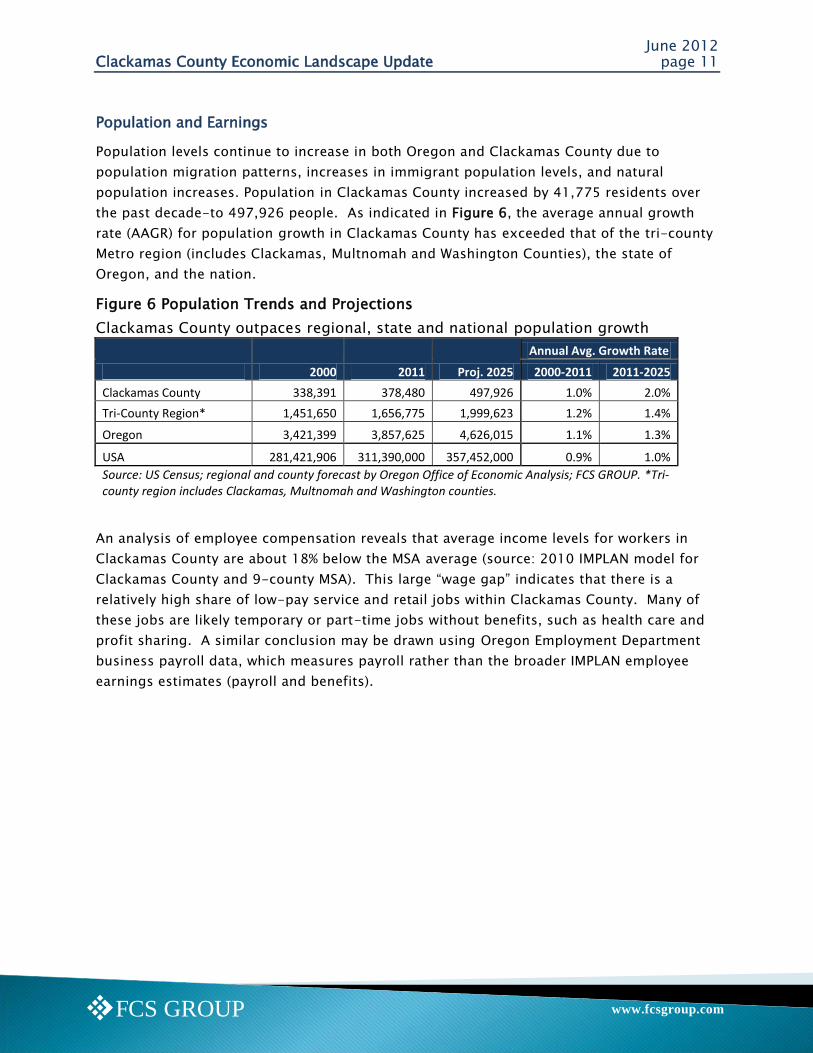
Population and Earnings
Population levels continue to increase in both Oregon and Clackamas County due to
population migration patterns, increases in immigrant population levels, and natural
population increases. Population in Clackamas County increased by 41,775 residents over
the past decade-to 497,926 people. As indicated in Figure 6, the average annual growth
rate (AAGR) for population growth in Clackamas County has exceeded that of the tri-county
Metro region (includes Clackamas, Multnomah and Washington Counties), the state of
Oregon, and the nation.
Figure 6 Population Trends and Projections
Clackamas County outpaces regional, state and national population growth
2000 2011 Proj. 2025
Annual Avg. Growth Rate
2000-2011 2011-2025
Clackamas County 338,391 378,480 497,926 1.0% 2.0%
Tri-County Region* 1,451,650 1,656,775 1,999,623 1.2% 1.4%
Oregon 3,421,399 3,857,625 4,626,015 1.1% 1.3%
USA 281,421,906 311,390,000 357,452,000 0.9% 1.0%
Source: US Census; regional and county forecast by Oregon Office of Economic Analysis; FCS GROUP. *Tri-county region includes Clackamas, Multnomah and Washington counties.
An analysis of employee compensation reveals that average income levels for workers in
Clackamas County are about 18% below the MSA average (source: 2010 IMPLAN model for
Clackamas County and 9-county MSA). This large ―wage gap‖ indicates that there is a
relatively high share of low-pay service and retail jobs within Clackamas County. Many of
these jobs are likely temporary or part-time jobs without benefits, such as health care and
profit sharing. A similar conclusion may be drawn using Oregon Employment Department
business payroll data, which measures payroll rather than the broader IMPLAN employee
earnings estimates (payroll and benefits).
June 2012 Clackamas County Economic Landscape Update page 12
www.fcsgroup.comFCS GROUP
II.B. EMPLOYMENT GROWTH FORECAST
Over the long-term, Metro anticipates that the region will continue to add people and
attract jobs. Metro expects the nine-county Portland-Beaverton-Hillsboro-Vancouver PMSA
to add nearly one million new residents by year 2050.2 Within the larger PMSA, the tri-
county Metro region (consisting of Clackamas, Multnomah and Washington counties) is
expected to add nearly 336,000 new households and 629,000 new jobs over the 2005-
2035 timeframe.
The long-term Metro growth forecast generally indicates that Clackamas County will
continue to maintain a relatively low employment-to-housing ratio in comparison to the tri-
county region. This finding is likely attributed to the current established regional commuter
patterns, with Portland serving as the regional city center, with relatively large employment
centers located in and around Airport Way (Multnomah County) and the Sunset Corridor
(Washington County).
As the existing urban employment centers within Clackamas County approach build-out
(such as Kruse Way, Clackamas Industrial Area, North Milwaukie Industrial Area, and the
East Wilsonville Industrial Area), the county will be hard pressed to significantly enhance the
ratio of jobs to housing. In fact, unless new employment areas are established in locations
such as the Rock Creek Employment Center (Happy Valley) and in and around Oregon City
(such as the Beavercreek area) the employment to household ratio could fall below 1.0 in
Clackamas County.
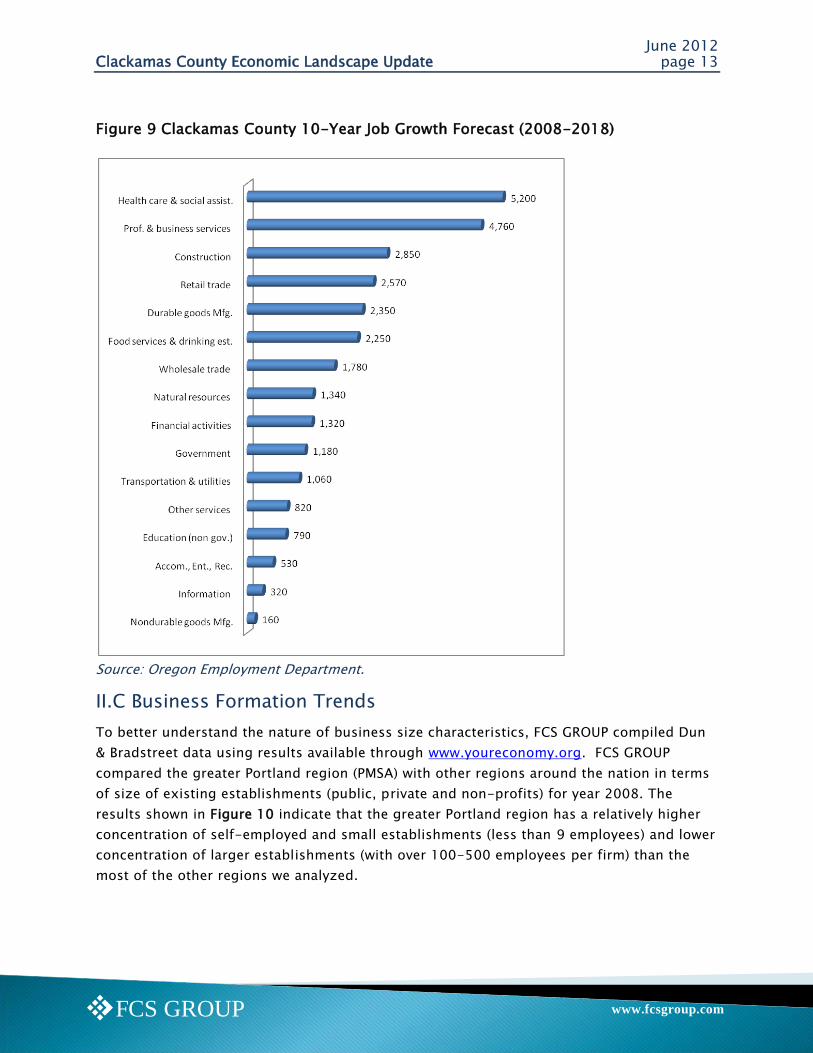
While long-term population and employment forecast for growth appear to be very positive
for Oregon and the greater Portland region, the short-term forecast is less certain. The 10-
year Clackamas County employment growth projections prepared by the Oregon
Employment Department (2010 to 2020) anticipate Clackamas County employment will
increase from 139,140 to 168,270, or by approximately 29,130 new jobs. Nearly two-thirds
of Clackamas County‘s job growth is expected to occur in three sectors: health care & social
services; professional & business services; and leisure & hospitality (includes hotels, motels
and restaurants), as indicated in Figure 9.
2 The Portland-Vancouver-Hillsboro MSA consists of nine counties in OR and WA, including: Clackamas,
Multnomah, Washington, Columbia, Yamhill, Marion, Polk, Clark and Skamania.
June 2012 Clackamas County Economic Landscape Update page 13
www.fcsgroup.comFCS GROUP
Figure 9 Clackamas County 10-Year Job Growth Forecast (2008-2018)
Source: Oregon Employment Department.
II.C Business Formation Trends
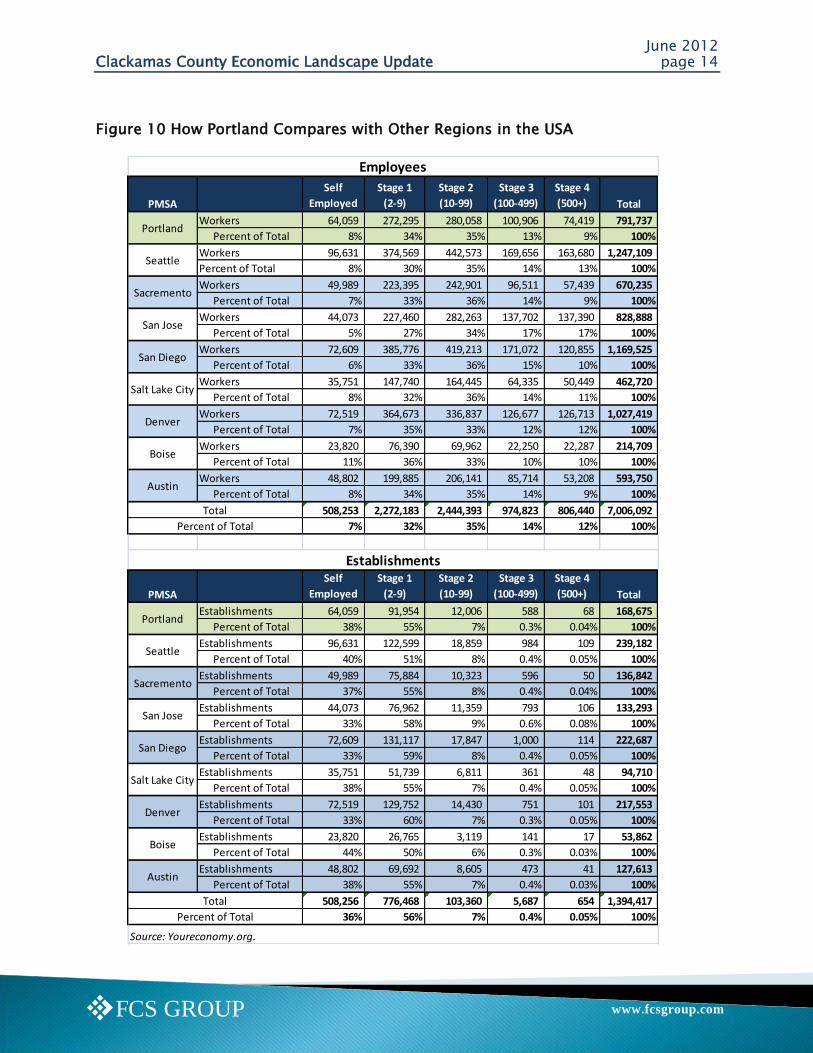
To better understand the nature of business size characteristics, FCS GROUP compiled Dun
& Bradstreet data using results available through www.youreconomy.org. FCS GROUP
compared the greater Portland region (PMSA) with other regions around the nation in terms
of size of existing establishments (public, private and non-profits) for year 2008. The
results shown in Figure 10 indicate that the greater Portland region has a relatively higher
concentration of self-employed and small establishments (less than 9 employees) and lower
concentration of larger establishments (with over 100-500 employees per firm) than the
most of the other regions we analyzed.
June 2012 Clackamas County Economic Landscape Update page 14
www.fcsgroup.comFCS GROUP
PMSA
Self
Employed
Stage 1
(2-9)
Stage 2
(10-99)
Stage 3
(100-499)
Stage 4
(500+) Total
Workers 64,059 272,295 280,058 100,906 74,419 791,737
Percent of Total 8% 34% 35% 13% 9% 100%
Workers 96,631 374,569 442,573 169,656 163,680 1,247,109
Percent of Total 8% 30% 35% 14% 13% 100%
Workers 49,989 223,395 242,901 96,511 57,439 670,235
Percent of Total 7% 33% 36% 14% 9% 100%
Workers 44,073 227,460 282,263 137,702 137,390 828,888
Percent of Total 5% 27% 34% 17% 17% 100%
Workers 72,609 385,776 419,213 171,072 120,855 1,169,525
Percent of Total 6% 33% 36% 15% 10% 100%
Workers 35,751 147,740 164,445 64,335 50,449 462,720
Percent of Total 8% 32% 36% 14% 11% 100%
Workers 72,519 364,673 336,837 126,677 126,713 1,027,419
Percent of Total 7% 35% 33% 12% 12% 100%
Workers 23,820 76,390 69,962 22,250 22,287 214,709
Percent of Total 11% 36% 33% 10% 10% 100%
Workers 48,802 199,885 206,141 85,714 53,208 593,750
Percent of Total 8% 34% 35% 14% 9% 100%
508,253 2,272,183 2,444,393 974,823 806,440 7,006,092
7% 32% 35% 14% 12% 100%
PMSA
Self
Employed
Stage 1
(2-9)
Stage 2
(10-99)
Stage 3
(100-499)
Stage 4
(500+) Total
Establishments 64,059 91,954 12,006 588 68 168,675
Percent of Total 38% 55% 7% 0.3% 0.04% 100%
Establishments 96,631 122,599 18,859 984 109 239,182
Percent of Total 40% 51% 8% 0.4% 0.05% 100%
Establishments 49,989 75,884 10,323 596 50 136,842
Percent of Total 37% 55% 8% 0.4% 0.04% 100%
Establishments 44,073 76,962 11,359 793 106 133,293
Percent of Total 33% 58% 9% 0.6% 0.08% 100%
Establishments 72,609 131,117 17,847 1,000 114 222,687
Percent of Total 33% 59% 8% 0.4% 0.05% 100%
Establishments 35,751 51,739 6,811 361 48 94,710
Percent of Total 38% 55% 7% 0.4% 0.05% 100%
Establishments 72,519 129,752 14,430 751 101 217,553
Percent of Total 33% 60% 7% 0.3% 0.05% 100%
Establishments 23,820 26,765 3,119 141 17 53,862
Percent of Total 44% 50% 6% 0.3% 0.03% 100%
Establishments 48,802 69,692 8,605 473 41 127,613
Percent of Total 38% 55% 7% 0.4% 0.03% 100%
508,256 776,468 103,360 5,687 654 1,394,417
36% 56% 7% 0.4% 0.05% 100%
Salt Lake City
Employees
Establishments
Source: Youreconomy.org.
Portland
Seattle
Sacremento
San Jose
San Diego
Denver
Boise
Austin
Total
Portland
Austin
Total
Percent of Total
Percent of Total
Sacremento
San Jose
San Diego
Salt Lake City
Denver
Boise
Seattle
Figure 10 How Portland Compares with Other Regions in the USA
June 2012 Clackamas County Economic Landscape Update page 15
www.fcsgroup.comFCS GROUP
The high concentration of self-employed businesses and low proportion of larger
businesses is evident in Clackamas County, where about 92% of the establishments had less
than 9 workers in 2008 (source; Dun & Bradstreet).
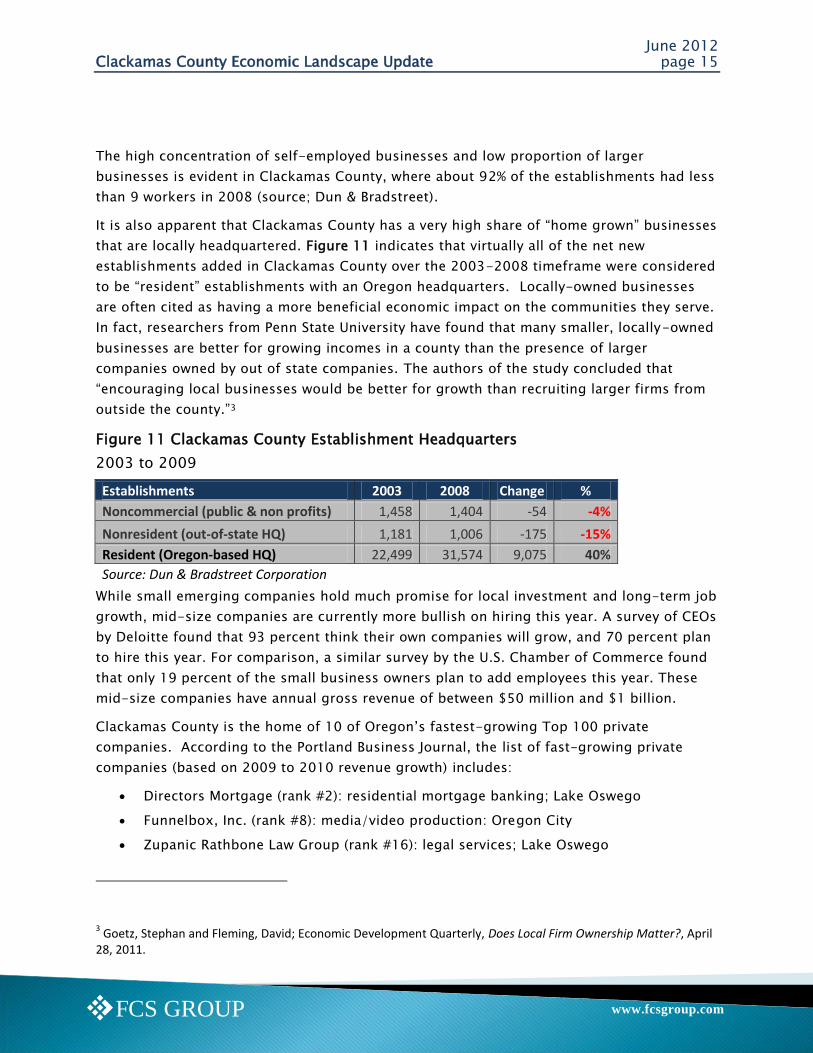
It is also apparent that Clackamas County has a very high share of ―home grown‖ businesses
that are locally headquartered. Figure 11 indicates that virtually all of the net new
establishments added in Clackamas County over the 2003-2008 timeframe were considered
to be ―resident‖ establishments with an Oregon headquarters. Locally-owned businesses
are often cited as having a more beneficial economic impact on the communities they serve.
In fact, researchers from Penn State University have found that many smaller, locally-owned
businesses are better for growing incomes in a county than the presence of larger
companies owned by out of state companies. The authors of the study concluded that
―encouraging local businesses would be better for growth than recruiting larger firms from
outside the county.‖3
Figure 11 Clackamas County Establishment Headquarters
2003 to 2009
Establishments 2003 2008 Change %
Noncommercial (public & non profits) 1,458 1,404 -54 -4%
Nonresident (out-of-state HQ) 1,181 1,006 -175 -15%
Resident (Oregon-based HQ) 22,499 31,574 9,075 40%
Source: Dun & Bradstreet Corporation
While small emerging companies hold much promise for local investment and long-term job
growth, mid-size companies are currently more bullish on hiring this year. A survey of CEOs
by Deloitte found that 93 percent think their own companies will grow, and 70 percent plan
to hire this year. For comparison, a similar survey by the U.S. Chamber of Commerce found
that only 19 percent of the small business owners plan to add employees this year. These
mid-size companies have annual gross revenue of between $50 million and $1 billion.
Clackamas County is the home of 10 of Oregon‘s fastest-growing Top 100 private
companies. According to the Portland Business Journal, the list of fast-growing private
companies (based on 2009 to 2010 revenue growth) includes:
Directors Mortgage (rank #2): residential mortgage banking; Lake Oswego
Funnelbox, Inc. (rank #8): media/video production: Oregon City
Zupanic Rathbone Law Group (rank #16): legal services; Lake Oswego
3 Goetz, Stephan and Fleming, David; Economic Development Quarterly, Does Local Firm Ownership Matter?, April
28, 2011.
June 2012 Clackamas County Economic Landscape Update page 16
www.fcsgroup.comFCS GROUP
The Bank of Oswego (rank #26): banking; Lake Oswego
EthicsPoint, Inc. (rank #46): enterprise risk consulting; Lake Oswego
Johnson RV (rank #49): recreation vehicle sales; Sandy
Cook Security Group (rank #78): service/installation of security systems; Milwaukie
InfoGroup Northwest (rank #82): employee search/consultants; Lake Oswego
Vigilan Inc. (rank #83): software for community health care; Wilsonville
Clackamas County is also home to many large publically traded companies, including
several key cluster businesses, which are identified in the next section.
June 2012 Clackamas County Economic Landscape Update page 17
www.fcsgroup.comFCS GROUP
III Key Clusters
III.A. OVERALL FINDINGS
To update prior Economic Landscape findings, FCS GROUP utilized the IMPLAN model
(Impact analysis for planning model) for Clackamas County and the greater Portland region
(9-county area) using 2009 data (adjusted to 2011 dollar values).
The IMPLAN model is an economic model that a useful tool for understanding the inputs
and outputs of local and regional economies by measuring the direct and secondary
benefits of changes in industrial output (sales), GDP (valued added), income, taxes, and
employment. The IMPLAN model takes into account national, regional and local economic
trends and spending multipliers to estimate: direct impacts (income, sales, wages, profits
associated directly with producing a good or service); indirect impacts (backward linkages
including supplies/services needed as inputs for producing the good or service); and
induced impacts (forward linkages that depict how the direct and indirect impacts cause a
multiplier effect in the regional economy as income is spent and re-spent on various goods,
services and investments. The IMPLAN model includes up to 506 specific industry sectors,
of which 299 are represented in Clackamas County.
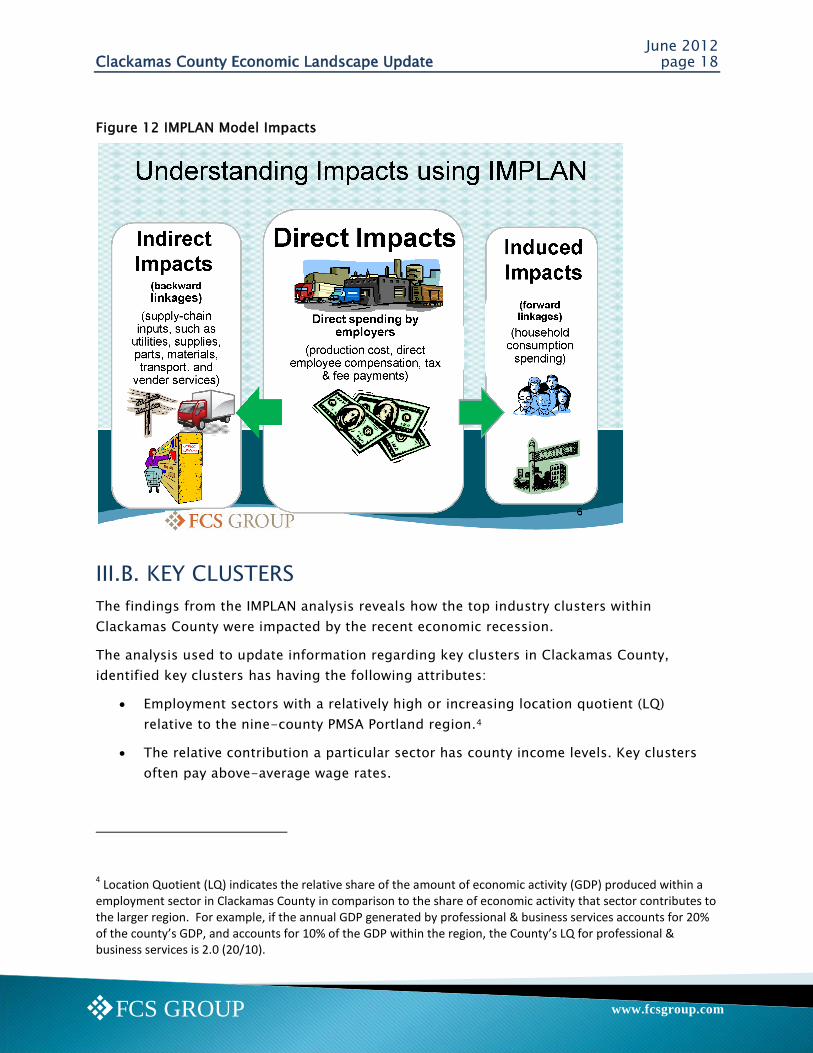
Figure 12 illustrates how IMPLAN uses input-output multipliers to estimate how direct
spending by businesses translates into indirect impacts (purchases from suppliers) and
induced impacts (household spending based on employee earnings). Please refer to
www.implan.com and Appendix A for more detailed information regarding the IMPLAN
model.
The overall results indicate that the 9-county regional economy grew between 2006 and
2010 from $118 billion to $121billion in real gross domestic product (GDP), measured in
constant 2011 dollars. In comparison, between 2006 and 2010, the Clackamas County
economy grew from $14.5 billion to $15.5 billion in GDP. The relative share of the regional
GDP that is attributed to Clackamas County is estimated to have increased slightly from
12.5% in 2006 to 12.8% in 2010.
June 2012 Clackamas County Economic Landscape Update page 18
www.fcsgroup.comFCS GROUP
Figure 12 IMPLAN Model Impacts
III.B. KEY CLUSTERS
The findings from the IMPLAN analysis reveals how the top industry clusters within
Clackamas County were impacted by the recent economic recession.
The analysis used to update information regarding key clusters in Clackamas County,
identified key clusters has having the following attributes:
Employment sectors with a relatively high or increasing location quotient (LQ)
relative to the nine-county PMSA Portland region.4
The relative contribution a particular sector has county income levels. Key clusters
often pay above-average wage rates.
4 Location Quotient (LQ) indicates the relative share of the amount of economic activity (GDP) produced within a
employment sector in Clackamas County in comparison to the share of economic activity that sector contributes to the larger region. For example, if the annual GDP generated by professional & business services accounts for 20% of the county’s GDP, and accounts for 10% of the GDP within the region, the County’s LQ for professional & business services is 2.0 (20/10).
June 2012 Clackamas County Economic Landscape Update page 19
www.fcsgroup.comFCS GROUP
The prior Economic Landscape study identified the following 10 key clusters within
Clackamas County:
Nurseries and Greenhouses (primarily includes growing plants, herbs, trees, and
shrubs for wholesale markets).
Transportation & Distribution (includes truck transport & warehousing).
Wood Product Manufacturing (includes lumber mills and finished wood products).
Professional & Business Services (includes professional business consulting, finance,
insurance, engineering, design, and related services, but does not include
commercial banking, advertising and photography services).
Wholesale Trade (includes businesses that sell goods to other businesses, as the
agent or distributor between the producer and the retail seller of goods).
Advanced Manufacturing – Metals and Machinery (includes manufacturing of primary
and fabricated metal products, such as metal hand tools and machinery
manufacturing and assembly).
High Tech (includes manufacturing of computer and measuring equipment, software
design and computer programming).
Health Care (primarily includes health service occupations).
Food and Beverage Processing (includes producers of food and beverages for
wholesale or retail use. This is an emerging cluster that was identified in 2010, since
it has experienced growth in Clackamas County in spite of the recent economic
recession).
Agriculture and Food Production cluster (includes businesses focused on food
production as well as related industries, such as fertilizer and pesticide
manufacturing, medicinal botanical manufacturing, and support industries).
The Film and Media Production cluster is an emerging cluster that is still evolving in
Clackamas County with the production of many television series (i.e., Leverage) occurring in
the Clackamas Industrial Area, and several multi-media companies based in Clackamas
County. In addition to motion picture and video production, this cluster includes
advertising, photography, publishing, sound recording, broadcasting, writers, performers
and agents/promoters of performing arts and sports.
Total GDP in Clackamas County was approximately $15.5 billion in 2010. The combined
direct impact of the 10 key clusters combined with the Film and Media cluster in Clackamas
County accounted for approximately $7.7 billion in direct annual GDP (nearly 50% of the
total county GDP) and accounted for 42% of the county‘s jobs. According to the IMPLAN
model for Clackamas County, the average employee compensation for the key clusters was
June 2012 Clackamas County Economic Landscape Update page 20
www.fcsgroup.comFCS GROUP
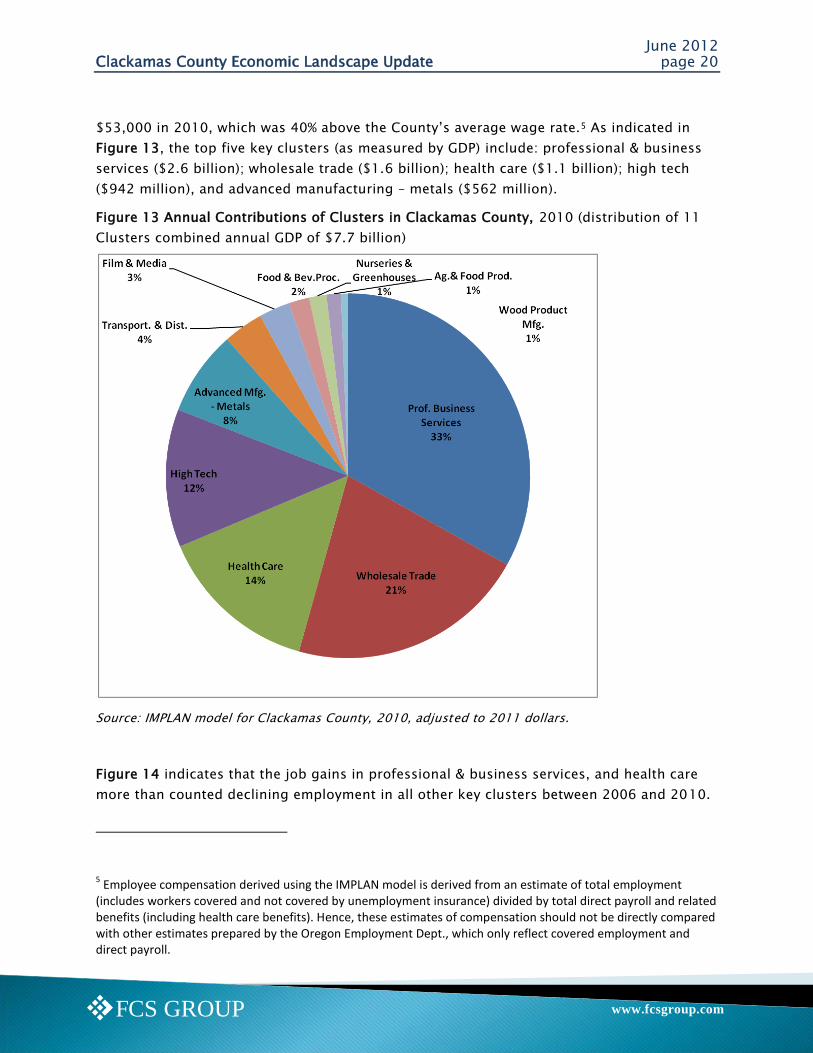
$53,000 in 2010, which was 40% above the County‘s average wage rate.5 As indicated in
Figure 13, the top five key clusters (as measured by GDP) include: professional & business
services ($2.6 billion); wholesale trade ($1.6 billion); health care ($1.1 billion); high tech
($942 million), and advanced manufacturing – metals ($562 million).
Figure 13 Annual Contributions of Clusters in Clackamas County, 2010 (distribution of 11
Clusters combined annual GDP of $7.7 billion)
Source: IMPLAN model for Clackamas County, 2010, adjusted to 2011 dollars.
Figure 14 indicates that the job gains in professional & business services, and health care
more than counted declining employment in all other key clusters between 2006 and 2010.
5 Employee compensation derived using the IMPLAN model is derived from an estimate of total employment
(includes workers covered and not covered by unemployment insurance) divided by total direct payroll and related benefits (including health care benefits). Hence, these estimates of compensation should not be directly compared with other estimates prepared by the Oregon Employment Dept., which only reflect covered employment and direct payroll.
June 2012 Clackamas County Economic Landscape Update page 21
www.fcsgroup.comFCS GROUP
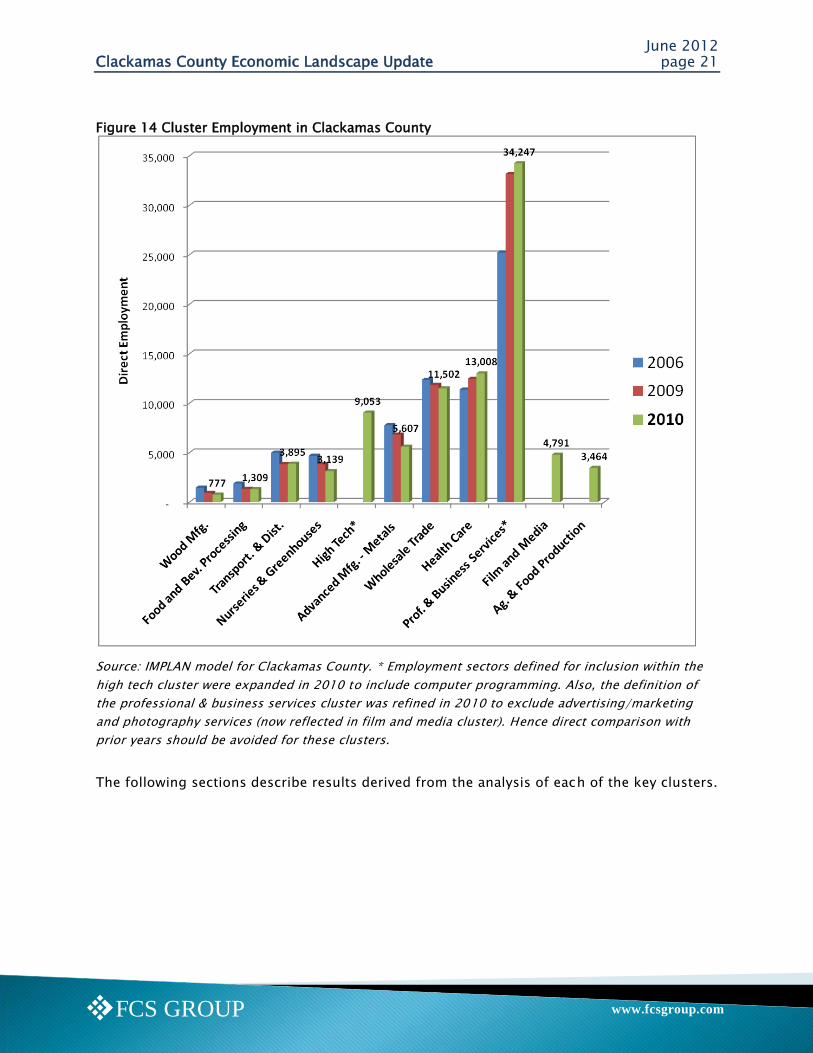
Figure 14 Cluster Employment in Clackamas County
Source: IMPLAN model for Clackamas County. * Employment sectors defined for inclusion within the
high tech cluster were expanded in 2010 to include computer programming. Also, the definition of
the professional & business services cluster was refined in 2010 to exclude advertising/marketing
and photography services (now reflected in film and media cluster). Hence direct comparison with
prior years should be avoided for these clusters.
The following sections describe results derived from the analysis of each of the key clusters.
June 2012 Clackamas County Economic Landscape Update page 22
www.fcsgroup.comFCS GROUP
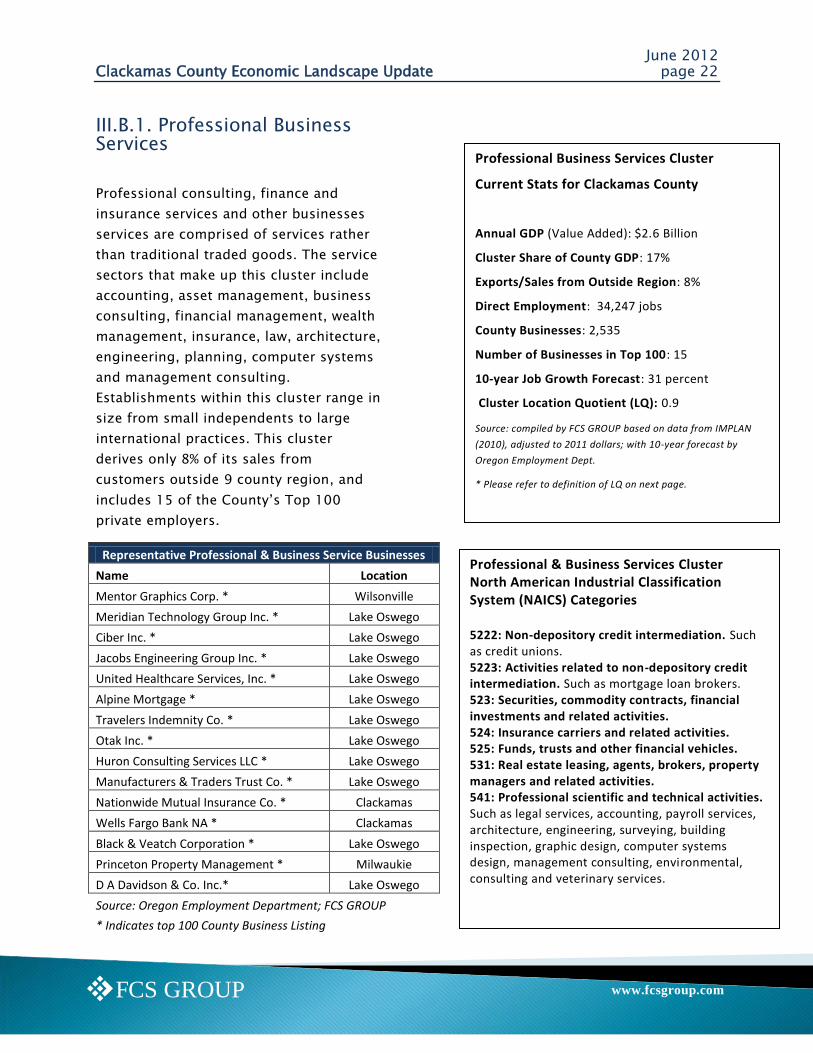
Professional Business Services Cluster
Current Stats for Clackamas County
Annual GDP (Value Added): $2.6 Billion
Cluster Share of County GDP: 17%
Exports/Sales from Outside Region: 8%
Direct Employment: 34,247 jobs
County Businesses: 2,535
Number of Businesses in Top 100: 15
10-year Job Growth Forecast: 31 percent
Cluster Location Quotient (LQ): 0.9
Source: compiled by FCS GROUP based on data from IMPLAN
(2010), adjusted to 2011 dollars; with 10-year forecast by
Oregon Employment Dept.
* Please refer to definition of LQ on next page.
III.B.1. Professional Business Services
Professional consulting, finance and
insurance services and other businesses
services are comprised of services rather
than traditional traded goods. The service
sectors that make up this cluster include
accounting, asset management, business
consulting, financial management, wealth
management, insurance, law, architecture,
engineering, planning, computer systems
and management consulting.
Establishments within this cluster range in
size from small independents to large
international practices. This cluster
derives only 8% of its sales from
customers outside 9 county region, and
includes 15 of the County‘s Top 100
private employers.
Representative Professional & Business Service Businesses
Name Location
Mentor Graphics Corp. * Wilsonville
Meridian Technology Group Inc. * Lake Oswego
Ciber Inc. * Lake Oswego
Jacobs Engineering Group Inc. * Lake Oswego
United Healthcare Services, Inc. * Lake Oswego
Alpine Mortgage * Lake Oswego
Travelers Indemnity Co. * Lake Oswego
Otak Inc. * Lake Oswego
Huron Consulting Services LLC * Lake Oswego
Manufacturers & Traders Trust Co. * Lake Oswego
Nationwide Mutual Insurance Co. * Clackamas
Wells Fargo Bank NA * Clackamas
Black & Veatch Corporation * Lake Oswego
Princeton Property Management * Milwaukie
D A Davidson & Co. Inc.* Lake Oswego
Source: Oregon Employment Department; FCS GROUP
* Indicates top 100 County Business Listing
Professional & Business Services Cluster North American Industrial Classification System (NAICS) Categories 5222: Non-depository credit intermediation. Such as credit unions. 5223: Activities related to non-depository credit intermediation. Such as mortgage loan brokers. 523: Securities, commodity contracts, financial investments and related activities. 524: Insurance carriers and related activities. 525: Funds, trusts and other financial vehicles. 531: Real estate leasing, agents, brokers, property managers and related activities. 541: Professional scientific and technical activities. Such as legal services, accounting, payroll services, architecture, engineering, surveying, building inspection, graphic design, computer systems design, management consulting, environmental, consulting and veterinary services.
June 2012 Clackamas County Economic Landscape Update page 23
www.fcsgroup.comFCS GROUP
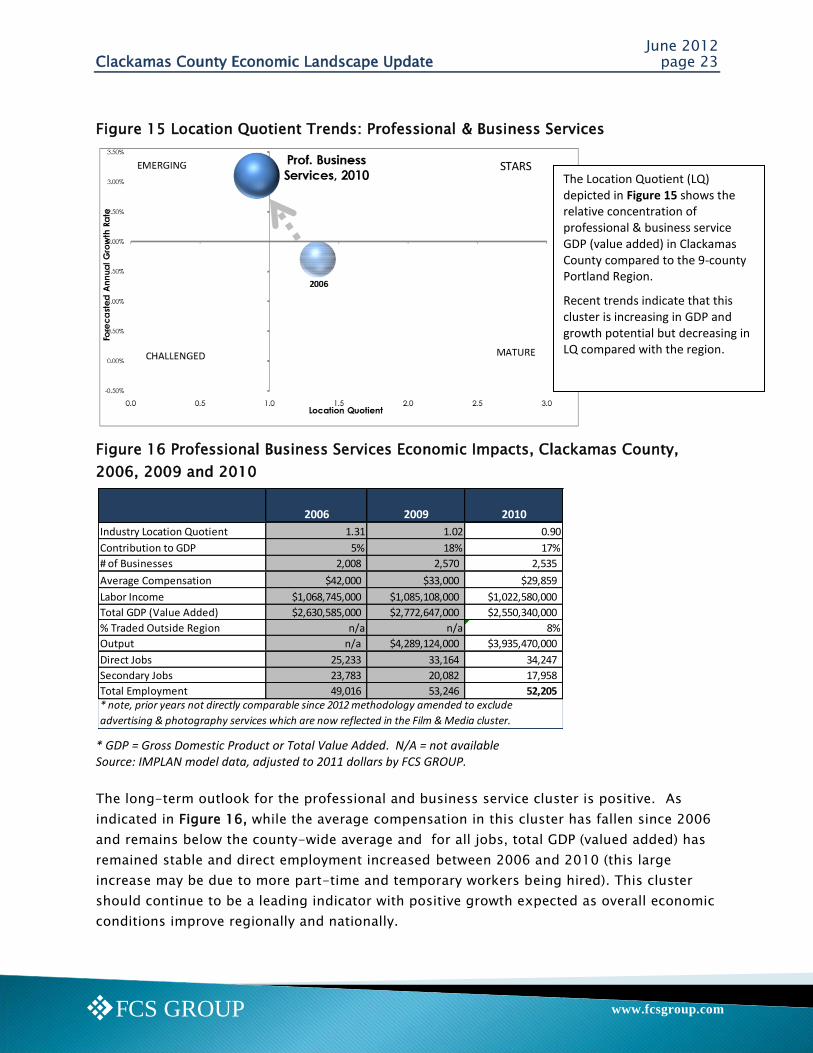
Figure 15 Location Quotient Trends: Professional & Business Services
Figure 16 Professional Business Services Economic Impacts, Clackamas County,
2006, 2009 and 2010
* GDP = Gross Domestic Product or Total Value Added. N/A = not available Source: IMPLAN model data, adjusted to 2011 dollars by FCS GROUP.
The long-term outlook for the professional and business service cluster is positive. As
indicated in Figure 16, while the average compensation in this cluster has fallen since 2006
and remains below the county-wide average and for all jobs, total GDP (valued added) has
remained stable and direct employment increased between 2006 and 2010 (this large
increase may be due to more part-time and temporary workers being hired). This cluster
should continue to be a leading indicator with positive growth expected as overall economic
conditions improve regionally and nationally.
2006 2009 2010
Industry Location Quotient 1.31 1.02 0.90
Contribution to GDP 5% 18% 17%
# of Businesses 2,008 2,570 2,535
Average Compensation $42,000 $33,000 $29,859
Labor Income $1,068,745,000 $1,085,108,000 $1,022,580,000
Total GDP (Value Added) $2,630,585,000 $2,772,647,000 $2,550,340,000
% Traded Outside Region n/a n/a 8%
Output n/a $4,289,124,000 $3,935,470,000
Direct Jobs 25,233 33,164 34,247
Secondary Jobs 23,783 20,082 17,958
Total Employment 49,016 53,246 52,205 * note, prior years not directly comparable since 2012 methodology amended to exclude
advertising & photography services which are now reflected in the Film & Media cluster.
The Location Quotient (LQ) depicted in Figure 15 shows the relative concentration of professional & business service GDP (value added) in Clackamas County compared to the 9-county Portland Region.
Recent trends indicate that this cluster is increasing in GDP and growth potential but decreasing in LQ compared with the region.
June 2012 Clackamas County Economic Landscape Update page 24
www.fcsgroup.comFCS GROUP
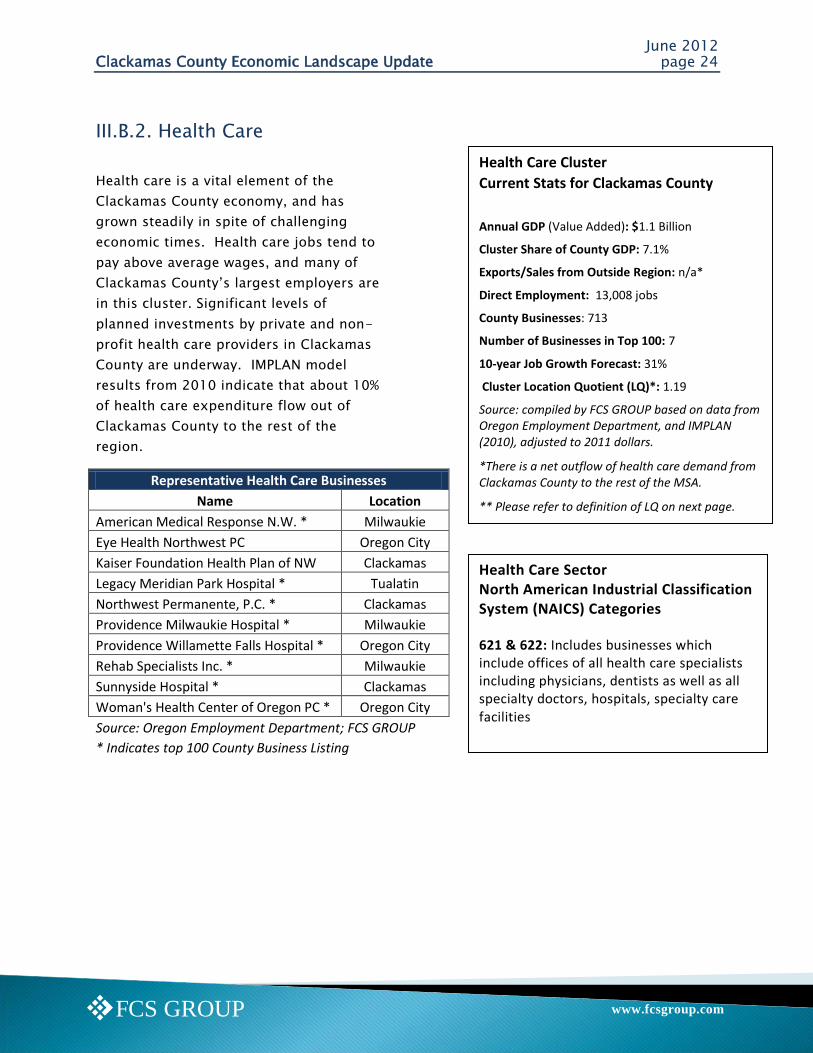
III.B.2. Health Care
Health care is a vital element of the
Clackamas County economy, and has
grown steadily in spite of challenging
economic times. Health care jobs tend to
pay above average wages, and many of
Clackamas County‘s largest employers are
in this cluster. Significant levels of
planned investments by private and non-
profit health care providers in Clackamas
County are underway. IMPLAN model
results from 2010 indicate that about 10%
of health care expenditure flow out of
Clackamas County to the rest of the
region.
Representative Health Care Businesses
Name Location
American Medical Response N.W. * Milwaukie
Eye Health Northwest PC Oregon City
Kaiser Foundation Health Plan of NW Clackamas
Legacy Meridian Park Hospital * Tualatin
Northwest Permanente, P.C. * Clackamas
Providence Milwaukie Hospital * Milwaukie
Providence Willamette Falls Hospital * Oregon City
Rehab Specialists Inc. * Milwaukie
Sunnyside Hospital * Clackamas
Woman's Health Center of Oregon PC * Oregon City
Source: Oregon Employment Department; FCS GROUP
* Indicates top 100 County Business Listing
Health Care Cluster
Current Stats for Clackamas County
Annual GDP (Value Added): $1.1 Billion
Cluster Share of County GDP: 7.1%
Exports/Sales from Outside Region: n/a*
Direct Employment: 13,008 jobs
County Businesses: 713
Number of Businesses in Top 100: 7
10-year Job Growth Forecast: 31%
Cluster Location Quotient (LQ)*: 1.19
Source: compiled by FCS GROUP based on data from Oregon Employment Department, and IMPLAN (2010), adjusted to 2011 dollars.
*There is a net outflow of health care demand from Clackamas County to the rest of the MSA.
** Please refer to definition of LQ on next page.
Health Care Sector North American Industrial Classification System (NAICS) Categories 621 & 622: Includes businesses which include offices of all health care specialists including physicians, dentists as well as all specialty doctors, hospitals, specialty care facilities
June 2012 Clackamas County Economic Landscape Update page 25
www.fcsgroup.comFCS GROUP
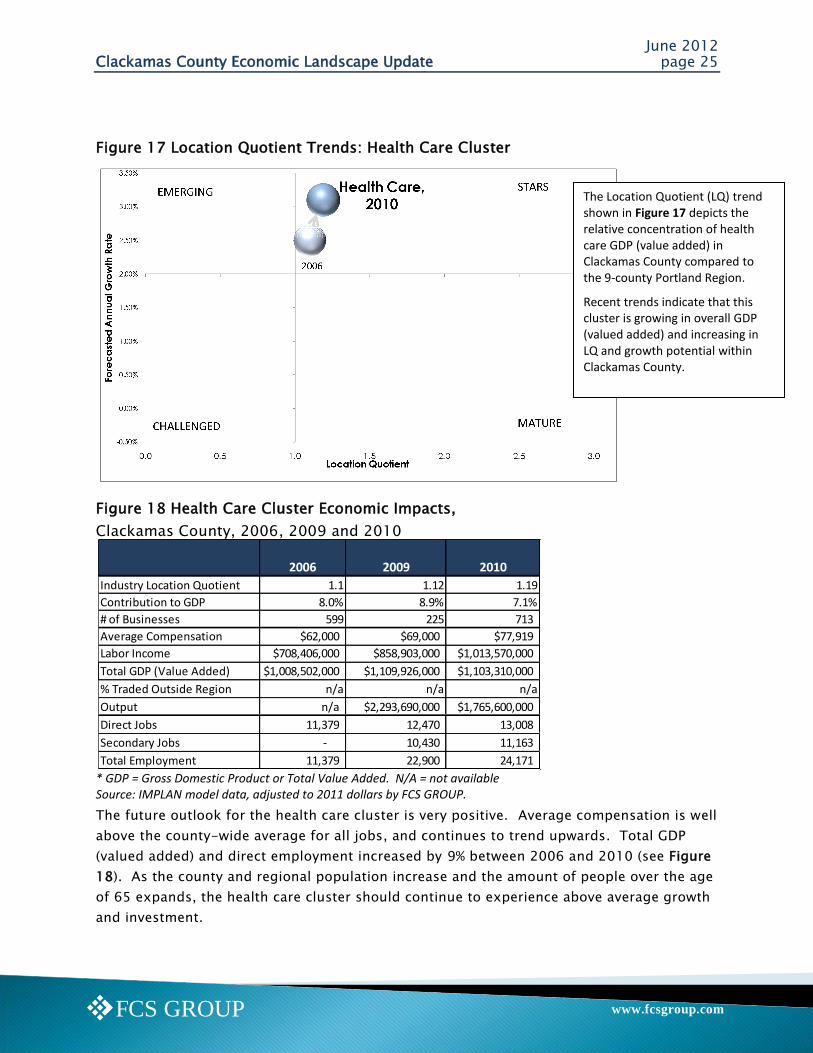
Figure 17 Location Quotient Trends: Health Care Cluster
Figure 18 Health Care Cluster Economic Impacts,
Clackamas County, 2006, 2009 and 2010
* GDP = Gross Domestic Product or Total Value Added. N/A = not available Source: IMPLAN model data, adjusted to 2011 dollars by FCS GROUP.
The future outlook for the health care cluster is very positive. Average compensation is well
above the county-wide average for all jobs, and continues to trend upwards. Total GDP
(valued added) and direct employment increased by 9% between 2006 and 2010 (see Figure
18). As the county and regional population increase and the amount of people over the age
of 65 expands, the health care cluster should continue to experience above average growth
and investment.
2006 2009 2010
Industry Location Quotient 1.1 1.12 1.19
Contribution to GDP 8.0% 8.9% 7.1%
# of Businesses 599 225 713
Average Compensation $62,000 $69,000 $77,919
Labor Income $708,406,000 $858,903,000 $1,013,570,000
Total GDP (Value Added) $1,008,502,000 $1,109,926,000 $1,103,310,000
% Traded Outside Region n/a n/a n/a
Output n/a $2,293,690,000 $1,765,600,000
Direct Jobs 11,379 12,470 13,008
Secondary Jobs - 10,430 11,163
Total Employment 11,379 22,900 24,171
The Location Quotient (LQ) trend shown in Figure 17 depicts the relative concentration of health care GDP (value added) in Clackamas County compared to the 9-county Portland Region.
Recent trends indicate that this cluster is growing in overall GDP (valued added) and increasing in LQ and growth potential within Clackamas County.
June 2012 Clackamas County Economic Landscape Update page 26
www.fcsgroup.comFCS GROUP
Wholesale Trade Cluster
Current Stats for Clackamas County
Annual GDP (Value Added): $1.6 Billion
Cluster Share of County GDP: 10%
Exports/Sales from Outside Region: 45%
Direct Employment: 11,502 jobs
County Businesses: 1,186
Number of Businesses in Top 100: 14
10-year Job Growth Forecast: 17%
Cluster Location Quotient (LQ)*: 1.35
Source: compiled by FCS GROUP based on data from IMPLAN (2010), adjusted to 2011 dollars; and Oregon Employment Dept. 10-year forecast.
* Please refer to definition of LQ on next page.
III.B.3. Wholesale Trade
Wholesale trade is an essential part of the greater
Portland regional economy. Wholesalers connect
goods producers--from raw materials to finished
products, with distributors and retailers in a cost-
effective and time-sensitive manner. In addition to
long time employers in Clackamas County, such as
Kroger, OREPAC Building Products, Pacific Seafood
Company, Sysco Foods, and Smith Kline Beecham,
Clackamas County is also home to younger firms
that are rapidly expanding.
The number of Clackamas County businesses in
this cluster increased from 1,101 in 2008 to 1,194
in 2010. This cluster now has 14 of the Top 100
private companies in Clackamas County.
Representative Wholesale Trade Businesses
Name Location
Kroger Inc. * Clackamas
Unified Western Grocers Inc. * Portland
Sysco Portland Inc. * Wilsonville
Kendal Floral Supply LLC * Canby
Pacific Sea Food Company Inc. * Clackamas
Acosta Sales & Marketing Company * Tualatin
Kahut Waste Services * Clackamas
Core Mark International Inc. * Clackamas
Blackwell North America Inc. * Lake Oswego
Biotronik Inc. * Lake Oswego
Owens & Minor * Wilsonville
General Distributors Inc. * Oregon City
Orepac Building Products Inc. * Wilsonville
Smithkline Beecham Corporation * West Linn
Cisco Systems MFG Inc. * Lake Oswego
Source: Oregon Employment Department; FCS GROUP
* Indicates top 100 County Business Listing
Professional Business Services Sector North American Industrial Classification System (NAICS) Categories 423: Wholesale Trade, Durable Goods. Includes businesses that sell durable goods to other businesses. Durable goods may be new or used items with an expected life of three or more years. Typical goods include motor vehicles, furniture, construction materials, machinery, and appliances. 424: Wholesale Trade, Nondurable Goods. This industry is focused on nondurable goods with a normal life of less than three years. Typical nondurable products include paper, chemicals, drugs, textiles, apparel, footwear, groceries, farm products, petroleum, alcoholic beverages, food, books and nursery stock. 425: Wholesale Trade, Electronic Goods. Businesses include wholesale electronic markets, agents and brokers for the sale of goods owned by others. They act on behalf of the buyers and sellers of goods.
June 2012 Clackamas County Economic Landscape Update page 27
www.fcsgroup.comFCS GROUP
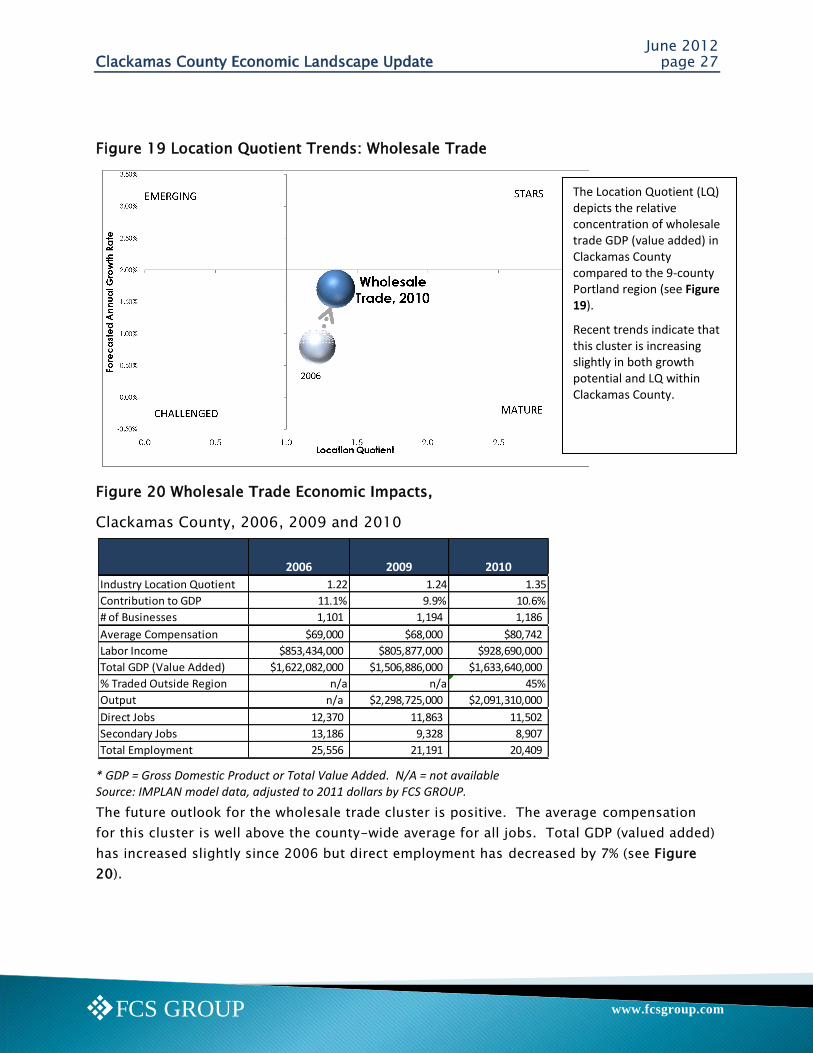
Figure 19 Location Quotient Trends: Wholesale Trade
Figure 20 Wholesale Trade Economic Impacts,
Clackamas County, 2006, 2009 and 2010
* GDP = Gross Domestic Product or Total Value Added. N/A = not available Source: IMPLAN model data, adjusted to 2011 dollars by FCS GROUP.
The future outlook for the wholesale trade cluster is positive. The average compensation
for this cluster is well above the county-wide average for all jobs. Total GDP (valued added)
has increased slightly since 2006 but direct employment has decreased by 7% (see Figure
20).
2006 2009 2010
Industry Location Quotient 1.22 1.24 1.35
Contribution to GDP 11.1% 9.9% 10.6%
# of Businesses 1,101 1,194 1,186
Average Compensation $69,000 $68,000 $80,742
Labor Income $853,434,000 $805,877,000 $928,690,000
Total GDP (Value Added) $1,622,082,000 $1,506,886,000 $1,633,640,000
% Traded Outside Region n/a n/a 45%
Output n/a $2,298,725,000 $2,091,310,000
Direct Jobs 12,370 11,863 11,502
Secondary Jobs 13,186 9,328 8,907
Total Employment 25,556 21,191 20,409
The Location Quotient (LQ) depicts the relative concentration of wholesale trade GDP (value added) in Clackamas County compared to the 9-county Portland region (see Figure 19).
Recent trends indicate that this cluster is increasing slightly in both growth potential and LQ within Clackamas County.
June 2012 Clackamas County Economic Landscape Update page 28
www.fcsgroup.comFCS GROUP
Advanced Manufacturing – Metals and Machinery Cluster
Current Stats for Clackamas County
Annual GDP (Value Added): $582 M
Cluster Share of County GDP: 4%
Exports/Sales from Outside Region: 77%
Direct Employment: 5,607 jobs
County Businesses: 223
Number of Businesses in Top 100: 8
10-year Job Growth Forecast: 23%
Cluster Location Quotient (LQ) *: 2.62
Source: compiled by FCS GROUP based on data from IMPLAN (2010), adjusted to 2011 dollars; and Oregon Economic Development 10-year forecast.
* Please refer to definition of LQ on next page.
III.B.4. Advanced Manufacturing – Metals & Machinery
Metals and machinery manufacturing is a mature
industry within Clackamas County that has generally
done well in spite of the recent economic recession.
Clackamas County‘s metals and machinery industries
produce a wide range of goods such as computer
components, jet engines, turbines for wind power
generators, streetcars, rebar and multipurpose tools.
Some of Oregon‘s largest metals employers, such as
Consolidated Metco, Oregon Cutting Systems,
Oregon Steel Mills and Precision Castparts have
established roots in Clackamas County.
This cluster added 13 business establishments
between 2008 and 2010, and recorded an increase in
valued added. Oregon‘s exports of metals and
machinery approached $1.6 billion in 2010, up 38%
from the preceding year.
Representative Metals & Machinery Businesses
Name Location
PCC Structurals, Inc. * Clackamas
Oregon Cutting Systems * Portland
Oregon Iron Works Inc. * Clackamas
Cleanpak International Inc. * Clackamas
Benchmade Knife Company Inc. * Oregon City
Wriglesworth and Willock Metal * Milwaukie
The Stanley Works * Milwaukie
Sandvik Medical Solutions Oregon City
SSI Shredding Systems Inc. * Wilsonville
Eagle Foundry Co. Eagle Creek
Source: Oregon Employment Department Compiled by FCS GROUP
* Indicates top 100 County Business Listing
Advanced Manufacturing- Metals & Machinery Cluster North American Industrial Classification System (NAICS) Categories 331: Primary Metal Manufacturing. This sector includes the smelting or refinement of ferrous and non ferrous metals. Establishments in this sector also manufacture metal alloys used in rolling and extruding operations to make sheet, strip, bar, rod, or wire for castings and other basic metal products. 332: Fabricated metal Product Manufacturing. Industries in this sector transform metal into intermediate or end products, excluding machinery, computers, electronics, metal furniture and related products. Fabricated metal processes include forging, stamping, bending forming, machining, welding and assembling. Examples include metal pipe manufacturing. 333: Machinery Manufacturing. Industries in this sector transform metal into machinery or tools used for the manufacture of goods.
June 2012 Clackamas County Economic Landscape Update page 29
www.fcsgroup.comFCS GROUP
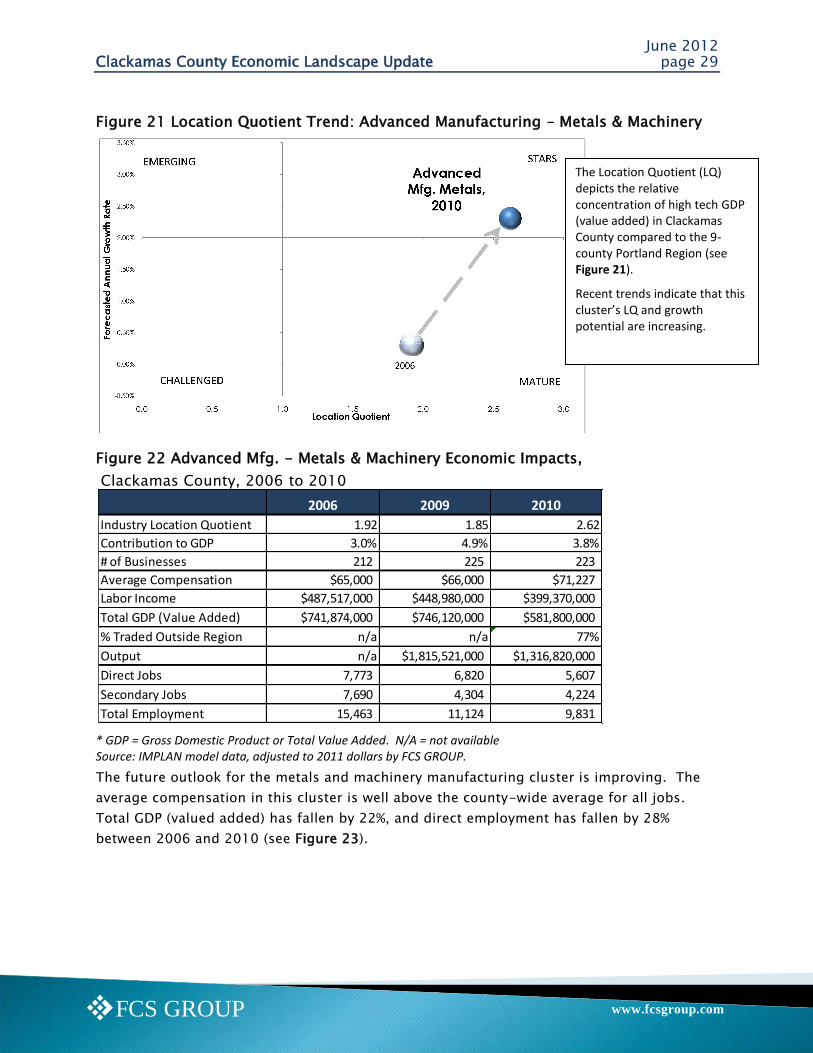
Figure 21 Location Quotient Trend: Advanced Manufacturing – Metals & Machinery
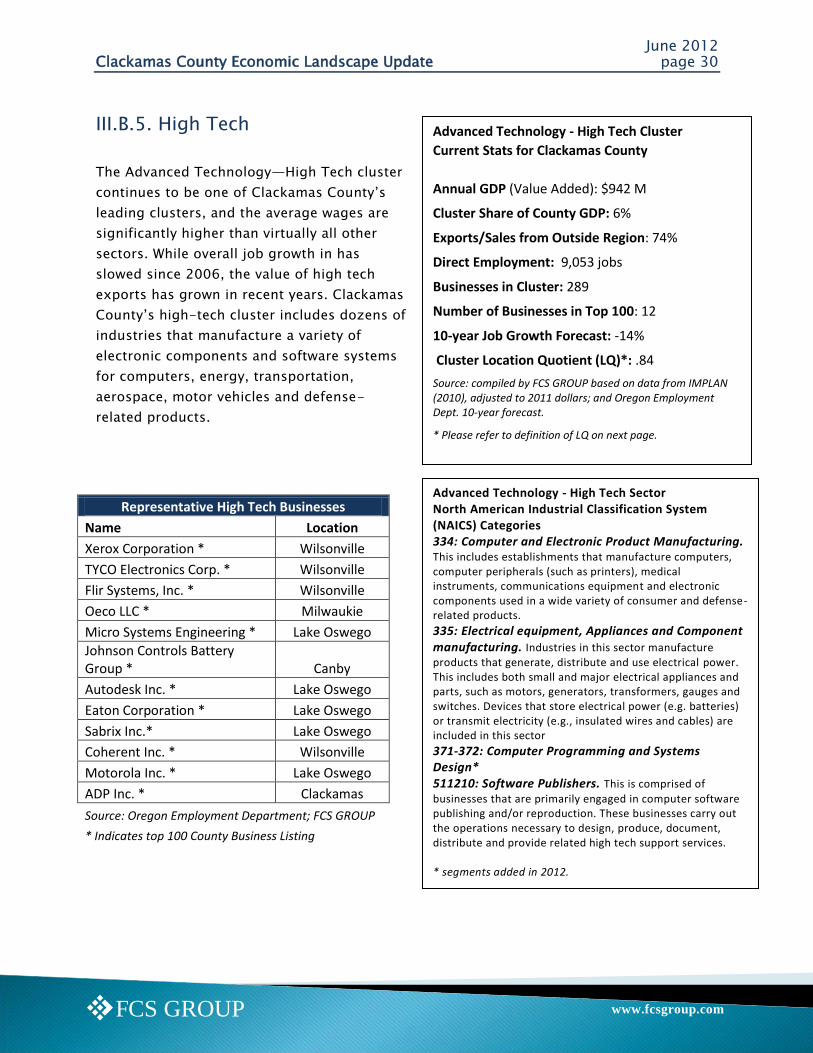
Figure 22 Advanced Mfg. - Metals & Machinery Economic Impacts,
Clackamas County, 2006 to 2010
* GDP = Gross Domestic Product or Total Value Added. N/A = not available Source: IMPLAN model data, adjusted to 2011 dollars by FCS GROUP.
The future outlook for the metals and machinery manufacturing cluster is improving. The
average compensation in this cluster is well above the county-wide average for all jobs.
Total GDP (valued added) has fallen by 22%, and direct employment has fallen by 28%
between 2006 and 2010 (see Figure 23).
2006 2009 2010
Industry Location Quotient 1.92 1.85 2.62
Contribution to GDP 3.0% 4.9% 3.8%
# of Businesses 212 225 223
Average Compensation $65,000 $66,000 $71,227
Labor Income $487,517,000 $448,980,000 $399,370,000
Total GDP (Value Added) $741,874,000 $746,120,000 $581,800,000
% Traded Outside Region n/a n/a 77%
Output n/a $1,815,521,000 $1,316,820,000
Direct Jobs 7,773 6,820 5,607
Secondary Jobs 7,690 4,304 4,224
Total Employment 15,463 11,124 9,831
The Location Quotient (LQ) depicts the relative concentration of high tech GDP (value added) in Clackamas County compared to the 9-county Portland Region (see Figure 21).
Recent trends indicate that this cluster’s LQ and growth potential are increasing.
June 2012 Clackamas County Economic Landscape Update page 30
www.fcsgroup.comFCS GROUP
Advanced Technology - High Tech Cluster
Current Stats for Clackamas County
Annual GDP (Value Added): $942 M
Cluster Share of County GDP: 6%
Exports/Sales from Outside Region: 74%
Direct Employment: 9,053 jobs
Businesses in Cluster: 289
Number of Businesses in Top 100: 12
10-year Job Growth Forecast: -14%
Cluster Location Quotient (LQ)*: .84
Source: compiled by FCS GROUP based on data from IMPLAN (2010), adjusted to 2011 dollars; and Oregon Employment Dept. 10-year forecast.
* Please refer to definition of LQ on next page.
Advanced Technology - High Tech Sector North American Industrial Classification System (NAICS) Categories 334: Computer and Electronic Product Manufacturing. This includes establishments that manufacture computers, computer peripherals (such as printers), medical instruments, communications equipment and electronic components used in a wide variety of consumer and defense-related products.
335: Electrical equipment, Appliances and Component manufacturing. Industries in this sector manufacture products that generate, distribute and use electrical power. This includes both small and major electrical appliances and parts, such as motors, generators, transformers, gauges and switches. Devices that store electrical power (e.g. batteries) or transmit electricity (e.g., insulated wires and cables) are included in this sector
371-372: Computer Programming and Systems Design* 511210: Software Publishers. This is comprised of
businesses that are primarily engaged in computer software publishing and/or reproduction. These businesses carry out the operations necessary to design, produce, document, distribute and provide related high tech support services. * segments added in 2012.
III.B.5. High Tech
The Advanced Technology—High Tech cluster
continues to be one of Clackamas County‘s
leading clusters, and the average wages are
significantly higher than virtually all other
sectors. While overall job growth in has
slowed since 2006, the value of high tech
exports has grown in recent years. Clackamas
County‘s high-tech cluster includes dozens of
industries that manufacture a variety of
electronic components and software systems
for computers, energy, transportation,
aerospace, motor vehicles and defense-
related products.
Representative High Tech Businesses
Name Location
Xerox Corporation * Wilsonville
TYCO Electronics Corp. * Wilsonville
Flir Systems, Inc. * Wilsonville
Oeco LLC * Milwaukie
Micro Systems Engineering * Lake Oswego
Johnson Controls Battery Group * Canby
Autodesk Inc. * Lake Oswego
Eaton Corporation * Lake Oswego
Sabrix Inc.* Lake Oswego
Coherent Inc. * Wilsonville
Motorola Inc. * Lake Oswego
ADP Inc. * Clackamas
Source: Oregon Employment Department; FCS GROUP
* Indicates top 100 County Business Listing
June 2012 Clackamas County Economic Landscape Update page 31
www.fcsgroup.comFCS GROUP
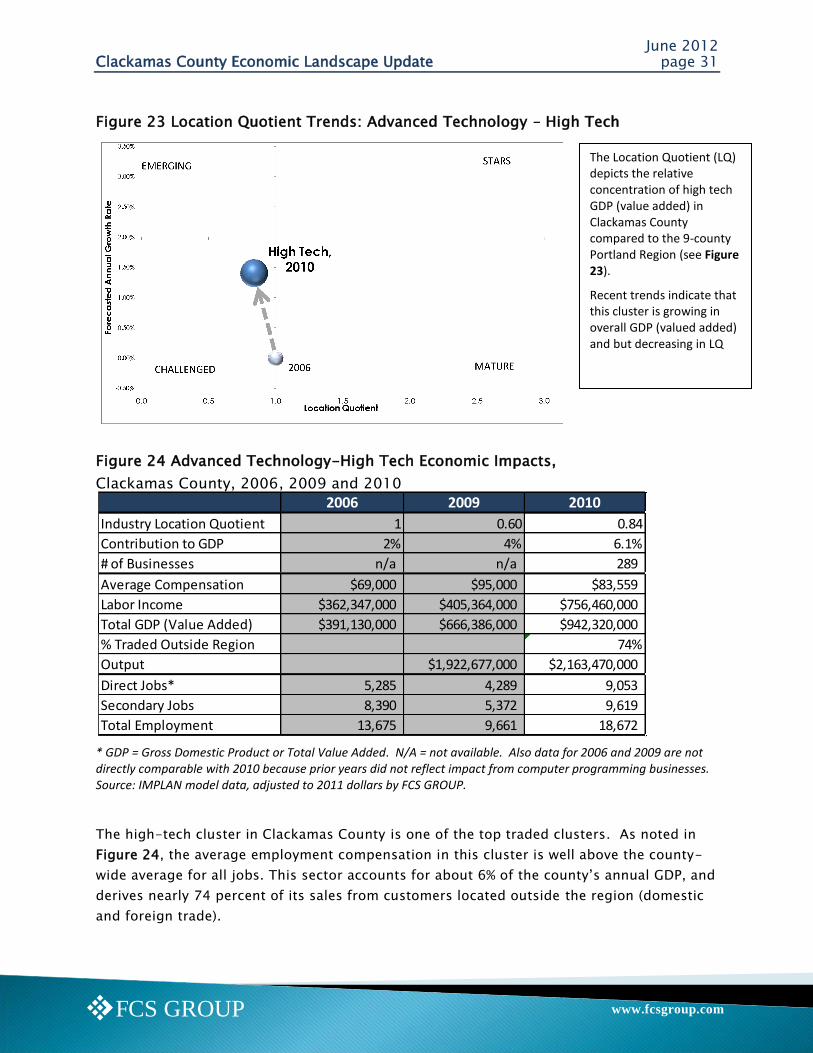
Figure 23 Location Quotient Trends: Advanced Technology – High Tech
Figure 24 Advanced Technology-High Tech Economic Impacts,
Clackamas County, 2006, 2009 and 2010
* GDP = Gross Domestic Product or Total Value Added. N/A = not available. Also data for 2006 and 2009 are not directly comparable with 2010 because prior years did not reflect impact from computer programming businesses. Source: IMPLAN model data, adjusted to 2011 dollars by FCS GROUP.
The high-tech cluster in Clackamas County is one of the top traded clusters. As noted in
Figure 24, the average employment compensation in this cluster is well above the county-
wide average for all jobs. This sector accounts for about 6% of the county‘s annual GDP, and
derives nearly 74 percent of its sales from customers located outside the region (domestic
and foreign trade).
2006 2009 2010
Industry Location Quotient 1 0.60 0.84
Contribution to GDP 2% 4% 6.1%
# of Businesses n/a n/a 289
Average Compensation $69,000 $95,000 $83,559
Labor Income $362,347,000 $405,364,000 $756,460,000
Total GDP (Value Added) $391,130,000 $666,386,000 $942,320,000
% Traded Outside Region 74%
Output $1,922,677,000 $2,163,470,000
Direct Jobs* 5,285 4,289 9,053
Secondary Jobs 8,390 5,372 9,619
Total Employment 13,675 9,661 18,672
The Location Quotient (LQ) depicts the relative concentration of high tech GDP (value added) in Clackamas County compared to the 9-county Portland Region (see Figure 23).
Recent trends indicate that this cluster is growing in overall GDP (valued added) and but decreasing in LQ
June 2012 Clackamas County Economic Landscape Update page 32
www.fcsgroup.comFCS GROUP
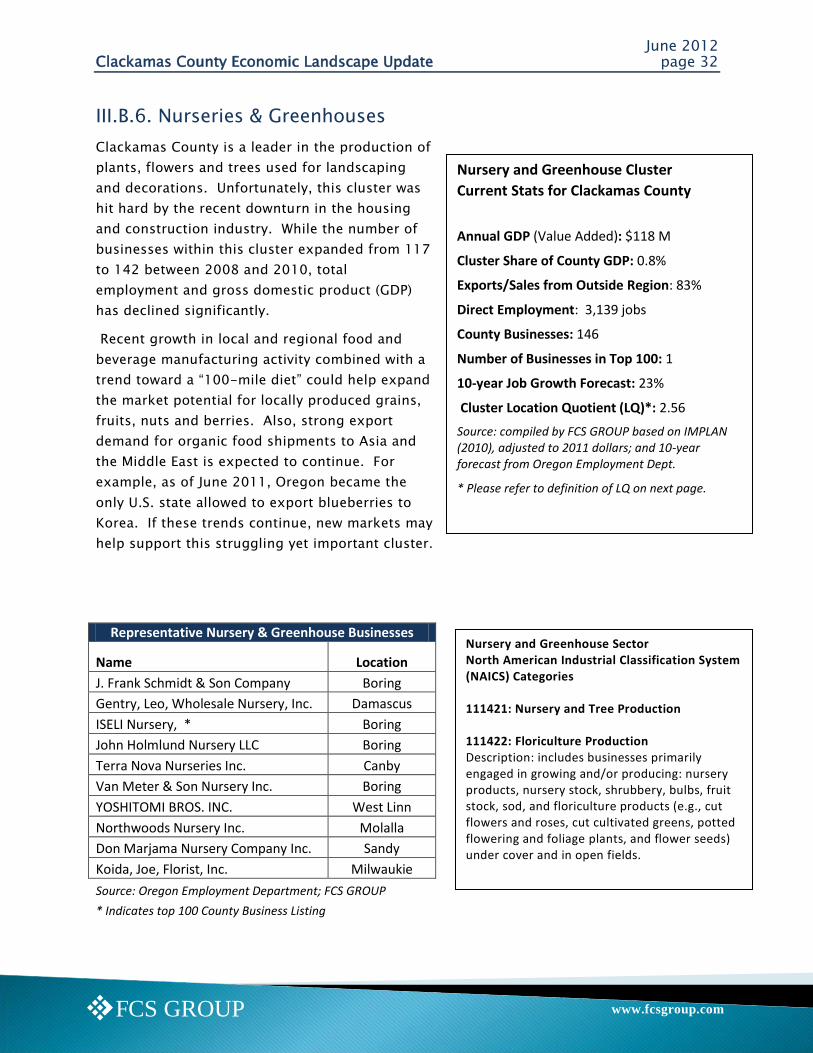
Nursery and Greenhouse Sector North American Industrial Classification System (NAICS) Categories 111421: Nursery and Tree Production 111422: Floriculture Production Description: includes businesses primarily engaged in growing and/or producing: nursery products, nursery stock, shrubbery, bulbs, fruit stock, sod, and floriculture products (e.g., cut flowers and roses, cut cultivated greens, potted flowering and foliage plants, and flower seeds) under cover and in open fields.
Nursery and Greenhouse Cluster
Current Stats for Clackamas County
Annual GDP (Value Added): $118 M
Cluster Share of County GDP: 0.8%
Exports/Sales from Outside Region: 83%
Direct Employment: 3,139 jobs
County Businesses: 146
Number of Businesses in Top 100: 1
10-year Job Growth Forecast: 23%
Cluster Location Quotient (LQ)*: 2.56
Source: compiled by FCS GROUP based on IMPLAN (2010), adjusted to 2011 dollars; and 10-year forecast from Oregon Employment Dept.
* Please refer to definition of LQ on next page.
III.B.6. Nurseries & Greenhouses
Clackamas County is a leader in the production of
plants, flowers and trees used for landscaping
and decorations. Unfortunately, this cluster was
hit hard by the recent downturn in the housing
and construction industry. While the number of
businesses within this cluster expanded from 117
to 142 between 2008 and 2010, total
employment and gross domestic product (GDP)
has declined significantly.
Recent growth in local and regional food and
beverage manufacturing activity combined with a
trend toward a ―100-mile diet‖ could help expand
the market potential for locally produced grains,
fruits, nuts and berries. Also, strong export
demand for organic food shipments to Asia and
the Middle East is expected to continue. For
example, as of June 2011, Oregon became the
only U.S. state allowed to export blueberries to
Korea. If these trends continue, new markets may
help support this struggling yet important cluster.
Representative Nursery & Greenhouse Businesses
Name Location
J. Frank Schmidt & Son Company Boring
Gentry, Leo, Wholesale Nursery, Inc. Damascus
ISELI Nursery, * Boring
John Holmlund Nursery LLC Boring
Terra Nova Nurseries Inc. Canby
Van Meter & Son Nursery Inc. Boring
YOSHITOMI BROS. INC. West Linn
Northwoods Nursery Inc. Molalla
Don Marjama Nursery Company Inc. Sandy
Koida, Joe, Florist, Inc. Milwaukie
Source: Oregon Employment Department; FCS GROUP
* Indicates top 100 County Business Listing
June 2012 Clackamas County Economic Landscape Update page 33
www.fcsgroup.comFCS GROUP
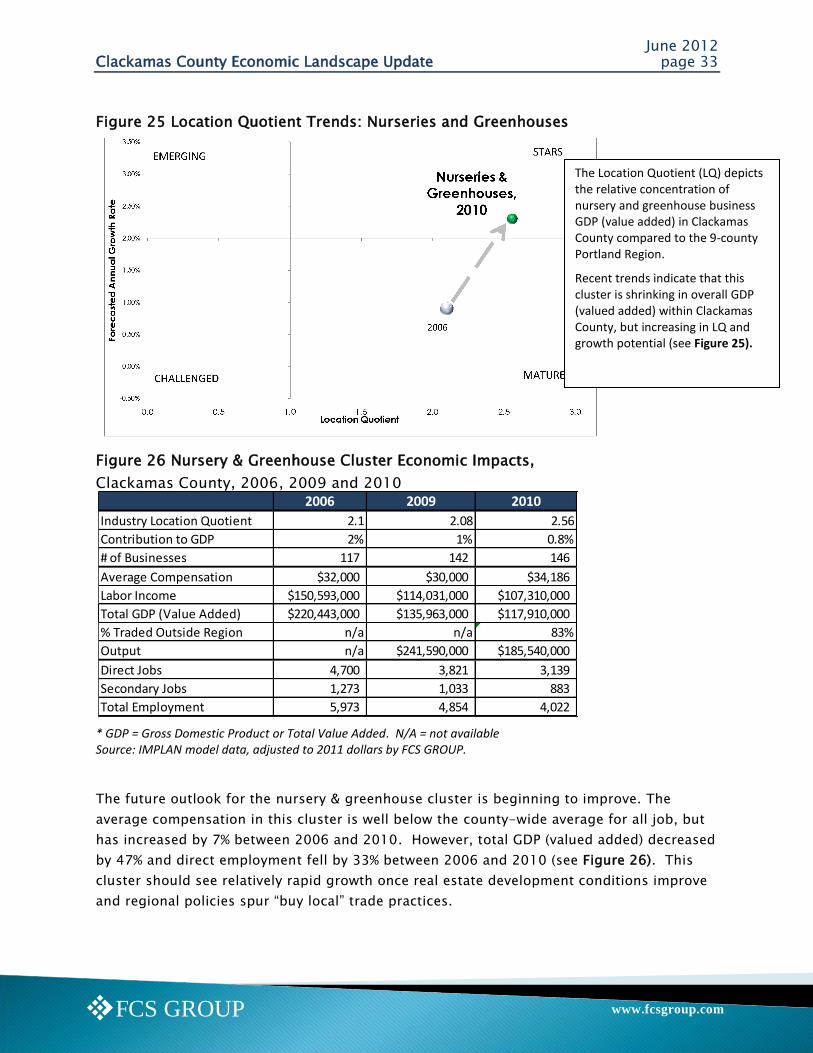
Figure 25 Location Quotient Trends: Nurseries and Greenhouses
Figure 26 Nursery & Greenhouse Cluster Economic Impacts,
Clackamas County, 2006, 2009 and 2010
* GDP = Gross Domestic Product or Total Value Added. N/A = not available Source: IMPLAN model data, adjusted to 2011 dollars by FCS GROUP.
The future outlook for the nursery & greenhouse cluster is beginning to improve. The
average compensation in this cluster is well below the county-wide average for all job, but
has increased by 7% between 2006 and 2010. However, total GDP (valued added) decreased
by 47% and direct employment fell by 33% between 2006 and 2010 (see Figure 26). This
cluster should see relatively rapid growth once real estate development conditions improve
and regional policies spur ―buy local‖ trade practices.
2006 2009 2010
Industry Location Quotient 2.1 2.08 2.56
Contribution to GDP 2% 1% 0.8%
# of Businesses 117 142 146
Average Compensation $32,000 $30,000 $34,186
Labor Income $150,593,000 $114,031,000 $107,310,000
Total GDP (Value Added) $220,443,000 $135,963,000 $117,910,000
% Traded Outside Region n/a n/a 83%
Output n/a $241,590,000 $185,540,000
Direct Jobs 4,700 3,821 3,139
Secondary Jobs 1,273 1,033 883
Total Employment 5,973 4,854 4,022
The Location Quotient (LQ) depicts the relative concentration of nursery and greenhouse business GDP (value added) in Clackamas County compared to the 9-county Portland Region.
Recent trends indicate that this cluster is shrinking in overall GDP (valued added) within Clackamas County, but increasing in LQ and growth potential (see Figure 25).
June 2012 Clackamas County Economic Landscape Update page 34
www.fcsgroup.comFCS GROUP
Trucking and Distribution Cluster
Current Stats for Clackamas County*
Annual GDP (Value Added): $274 M
Cluster Share of County GDP: 1.7%
Exports/Sales from Outside Region: 35%
Direct Employment: 3,895 jobs
County Businesses: 166
Number of Businesses in Top 100: 5
10-year Job Growth Forecast: 24%
Cluster Location Quotient (LQ)*: 1.86
Source: compiled by FCS GROUP based on IMPLAN (2010), adjusted to 2011 dollars; and 10-year job forecast from Oregon Employment Dept.
* Please refer to definition of LQ on next page.
III.B.7. Trucking & Distribution
Trucking and warehousing has long been served by
Clackamas County‘s excellent rail and interstate
highway connections. Trucking and warehousing
activities closely follow wholesale trade patterns,
which are an important component of the broader
regional and national economy. Some of Clackamas
County‘s largest employers including Safeway, USF
Reddaway, and Rite Aid are contained in this cluster,
While wage rate in this cluster tend to be well above
the county-wide average, the recent national
recession and increase in fuel costs had a severe
impact on the trucking and distribution industry. It
may take at least five years for this industry to reach
employment levels that were attained in 2006.
Representative Trucking & Distribution Businesses
Name Location
USF Reddaway, Inc. * Clackamas
Safeway Stores, Inc. * Clackamas
Interstate Distributor Co. * Wilsonville
Gordon Trucking Inc. * Clackamas
Rite Aid * Wilsonville
Distribution Inc. Clackamas
Ruan Transport Corporation Canby
Kool Pak LLC Lake Oswego
Beauty Systems Group LLC Clackamas
J & D Refrigerated Services Clackamas
Source: Oregon Employment Department; FCS GROUP
* Indicates top 100 County Business Listing
Trucking and Distribution Sector North American Industrial Classification System (NAICS) Categories 484: Truck Transportation. Businesses within this sector provide over-the-road transportation using trucks and tractor trailers. This includes general freight distribution. 111422: Warehousing and Storage. This sector includes businesses that operate warehousing and storage facilities for general merchandise, refrigerated goods and other warehouse products. These establishments take responsibility for storing goods and keeping them secure. They also may provide incidental services involving shipping logistics, such as labeling, breaking bulk containers, inventory control, light assembly, order entry, packaging, price marking, ticketing and transportation arrangement
June 2012 Clackamas County Economic Landscape Update page 35
www.fcsgroup.comFCS GROUP
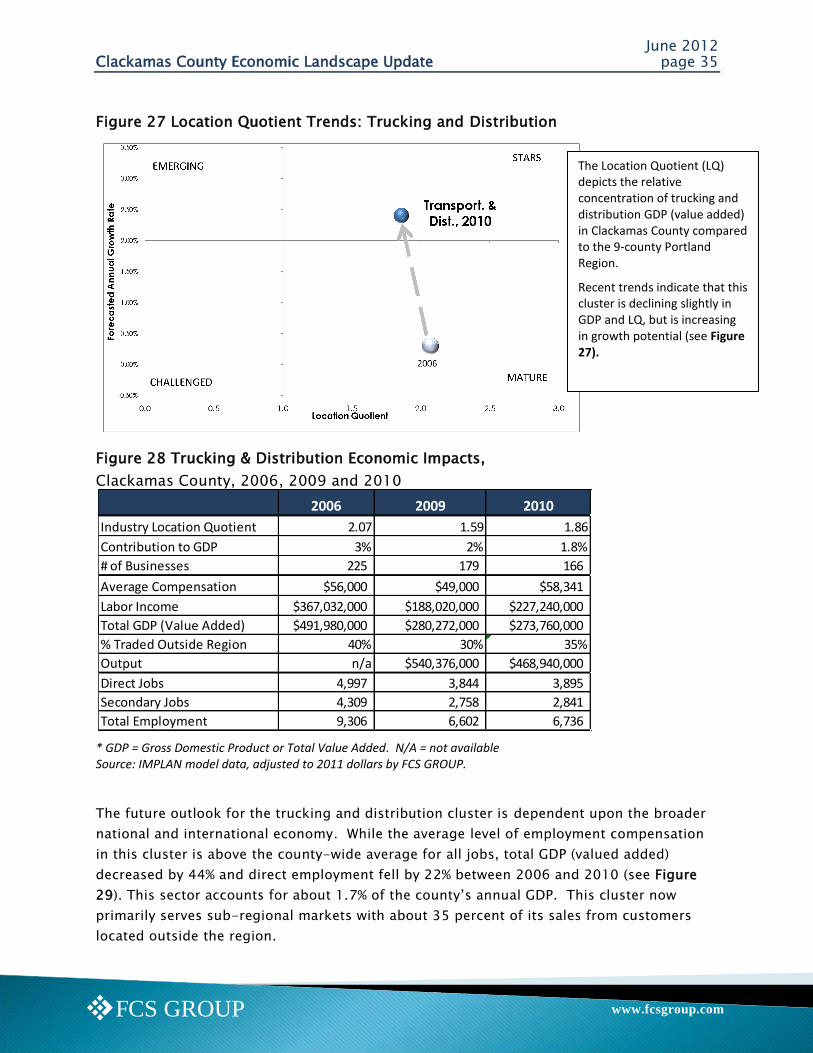
Figure 27 Location Quotient Trends: Trucking and Distribution
Figure 28 Trucking & Distribution Economic Impacts,
Clackamas County, 2006, 2009 and 2010
* GDP = Gross Domestic Product or Total Value Added. N/A = not available Source: IMPLAN model data, adjusted to 2011 dollars by FCS GROUP.
The future outlook for the trucking and distribution cluster is dependent upon the broader
national and international economy. While the average level of employment compensation
in this cluster is above the county-wide average for all jobs, total GDP (valued added)
decreased by 44% and direct employment fell by 22% between 2006 and 2010 (see Figure
29). This sector accounts for about 1.7% of the county‘s annual GDP. This cluster now
primarily serves sub-regional markets with about 35 percent of its sales from customers
located outside the region.
2006 2009 2010
Industry Location Quotient 2.07 1.59 1.86
Contribution to GDP 3% 2% 1.8%
# of Businesses 225 179 166
Average Compensation $56,000 $49,000 $58,341
Labor Income $367,032,000 $188,020,000 $227,240,000
Total GDP (Value Added) $491,980,000 $280,272,000 $273,760,000
% Traded Outside Region 40% 30% 35%
Output n/a $540,376,000 $468,940,000
Direct Jobs 4,997 3,844 3,895
Secondary Jobs 4,309 2,758 2,841
Total Employment 9,306 6,602 6,736
The Location Quotient (LQ) depicts the relative concentration of trucking and distribution GDP (value added) in Clackamas County compared to the 9-county Portland Region.
Recent trends indicate that this cluster is declining slightly in GDP and LQ, but is increasing in growth potential (see Figure 27).
June 2012 Clackamas County Economic Landscape Update page 36
www.fcsgroup.comFCS GROUP
Food & Beverage Processing Cluster
Current Stats for Clackamas County
Annual GDP (Value Added): $139 Million
Cluster Share of County GDP: 0.9%
Exports/Sales from Outside MSA: 35%
Direct Employment: 1,309 jobs
County Businesses: 50
Number of Businesses in Top 100: 7
10-year Job Growth Forecast: 5%
Cluster Location Quotient (LQ)*: 0.8
Source: compiled by FCS GROUP based on IMPLAN (2010), adjusted to 2011 dollars; and 10-year growth forecast by Oregon Employment Department.
* Please refer to definition of LQ on next page.
III.B.8. Food & Beverage Processing
Food and beverage processing is a key cluster in
Clackamas County. Establishments within this
cluster range in size from small independents to
large international practices. This cluster now
derives the majority of its sales from customers
outside Clackamas County, and includes 7 of
the County‘s Top 100 private employers.
Representative Food & Beverage Mfg. Businesses
Name Location
AG Specialty Foods Inc. Gladstone
BCI Coca Cola Bottling Co. * Wilsonville
Bob’s Red Mill Natural Foods * Milwaukie
Ever Fresh Fruit Company * Boring
Fred Meyer Inc. * Clackamas
Integrated Bakery Resources* Lake Oswego
Interstate Meat Distributors * Clackamas
S.A. Piazza & Associates LLC Clackamas
Safeway Stores, Inc. * Clackamas
Saint Honore Bakery LLC Lake Oswego
Source: Oregon Employment Department; FCS GROUP
* Indicates top 100 County Business Listing
Food and Beverage Processing North American Industrial Classification System (NAICS) Categories 311: Food processing and manufacturing. Such as milling, baking and refining raw food products. These processes produce food and other edible items such as coffee and seasoning. 312: Beverage manufacturing. Such as bottling, producing, fermenting and distilling beverages. This includes breweries, wineries, bottling plants and liquor distilleries

June 2012 Clackamas County Economic Landscape Update page 37
www.fcsgroup.comFCS GROUP
Figure 29 Location Quotient Trends: Food & Beverage Processing
Figure 30 Food & Beverage Processing Economic Impacts,
Clackamas County, 2009 and 2010
* GDP = Gross Domestic Product or Total Value Added. N/A = not available Source: IMPLAN model data, adjusted to 2011 dollars by FCS GROUP.
The future outlook for the food and beverage manufacturing cluster continues to improve.
As indicated in Figure 30, the average compensation in this cluster is well above the
county-wide average for all jobs, total GDP (valued added) increased by 25% between 2009
and 2010. However, direct employment decreased by 3% during the same time period. This
cluster currently accounts for only1% of the county‘s annual GDP, but derives 35% of its
sales from customers located outside the region (domestic and foreign trade). This cluster
should continue to experience positive growth as overall economic conditions improve
nationally and internationally.
2009 2010
Industry Location Quotient 0.63 0.80
Contribution to GDP 0.7% 0.6%
# of Businesses 56 50
Average Compensation $51,995 $55,985
Labor Income $69,847,874 $73,285,000
Total GDP (Value Added) $107,827,748 $134,988,000
% Traded Outside Region n/a 35%
Output $597,403,584 $677,257,000
Direct Jobs 1,343 1,309
Secondary Jobs 1,314 856
Total Employment 2,657 4,320
The Location Quotient (LQ) depicts the relative concentration of food & beverage manufacturing GDP (value added) in Clackamas County compared to the 9-county Portland Region.
Recent trends indicate that this cluster is increasing in GDP, LQ and growth potential (see Figure 29).
June 2012 Clackamas County Economic Landscape Update page 38
www.fcsgroup.comFCS GROUP
Wood Products Manufacturing Cluster
Current Stats for Clackamas County*
Annual GDP (Value Added): $47 M
Cluster Share of County GDP: 0.3%
Exports/Sales from Outside Region: 56%
Direct Employment: 777 jobs
County Businesses: 26
Number of Businesses in Top 100: 0
10-year Job Growth Forecast: 18%
Cluster Location Quotient (LQ)*: 1.12
Source: compiled by FCS GROUP based on IMPLAN (2010), adjusted to 2011 dollars; and 10-year job forecast from Oregon Employment Department.
* Please refer to definition of LQ on next page.
III.B.9. Wood Product Manufacturing
The wood product manufacturing cluster has deep
roots in Clackamas County, and is still one of the top
10 traded clusters. The presence of the Mt. Hood
National Forest provides a resource of timber that has
traditionally fed local wood mills in rural cities, such
as Estacada and Molalla. Locally produced wood
products in Clackamas County include lumber,
plywood, wood trusses, cabinets and pallets.
This cluster is reeling from the recent economic
recession and housing industry downtown. On the
bright side, exports of wood products from Oregon
jumped 53% between 2009 and 2010, with the total
value of wood exports exceeding $220 million. Also
the total number of Clackamas County businesses
within this cluster expanded from 30 to 34 between
2008 and 2010.
Representative Wood Products Businesses
Name Location
Brentwood Corp. Molalla
Sanders Wood Products Inc. Molalla
Interfor Pacific Inc Molalla
Precision Roof Trusses', Inc. Clackamas
Classic Manufacturing NW LLC Wilsonville
Summit Woodworking Inc. Oregon City
Lazy s Lumber, Inc. Beavercreek
Pacific Lumber Company Lake Oswego
Savannah Pacific Molalla LLC Molalla
McGriff Lumber Co. Boring
Source: Oregon Employment Department; FCS GROUP
* Indicates top 100 County Business Listing
Wood Product Manufacturing Sector North American Industrial Classification System (NAICS) Categories 3211: Sawmills and wood preservation
3212: Veneer, plywood and engineered wood products
3219: Other wood product manufacturing, such as millwork, flooring, trusses, cabinets, containers and ballets.
Includes businesses primarily engaged in the manufacturing of wood products, such as lumber, plywood, veneers, wood containers, flooring, trusses and prefabricated wood buildings.
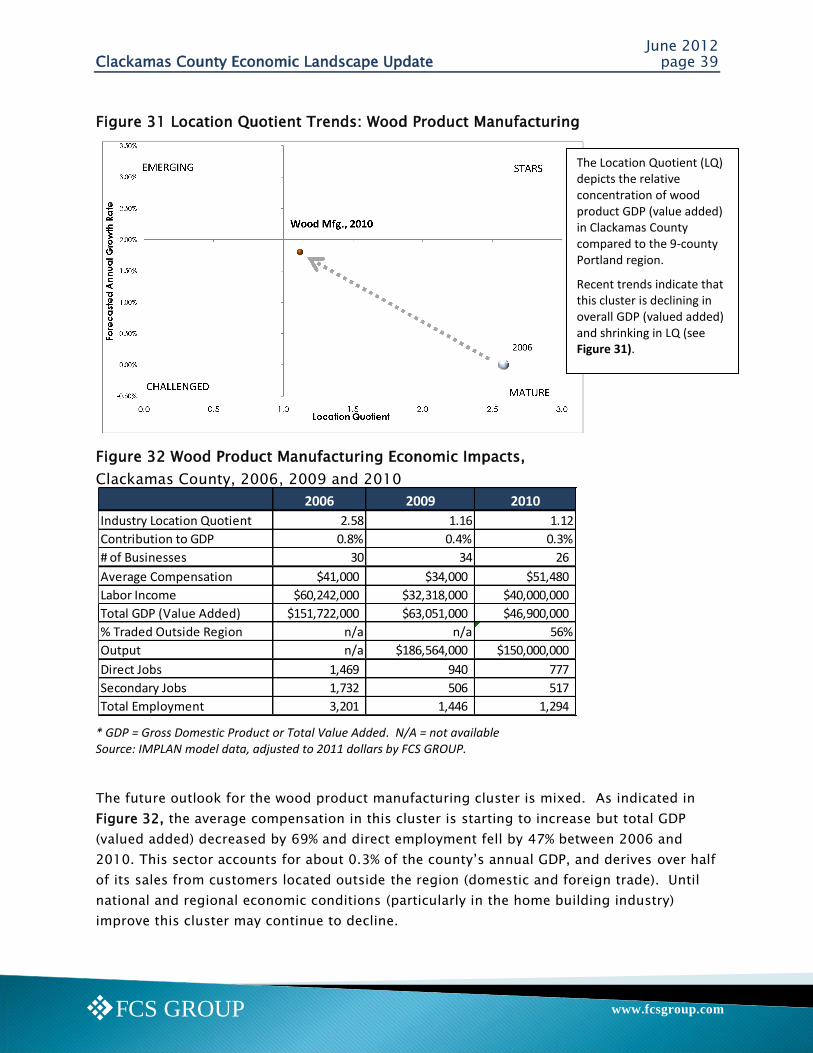
June 2012 Clackamas County Economic Landscape Update page 39
www.fcsgroup.comFCS GROUP
Figure 31 Location Quotient Trends: Wood Product Manufacturing
Figure 32 Wood Product Manufacturing Economic Impacts,
Clackamas County, 2006, 2009 and 2010
* GDP = Gross Domestic Product or Total Value Added. N/A = not available Source: IMPLAN model data, adjusted to 2011 dollars by FCS GROUP.
The future outlook for the wood product manufacturing cluster is mixed. As indicated in
Figure 32, the average compensation in this cluster is starting to increase but total GDP
(valued added) decreased by 69% and direct employment fell by 47% between 2006 and
2010. This sector accounts for about 0.3% of the county‘s annual GDP, and derives over half
of its sales from customers located outside the region (domestic and foreign trade). Until
national and regional economic conditions (particularly in the home building industry)
improve this cluster may continue to decline.
2006 2009 2010
Industry Location Quotient 2.58 1.16 1.12
Contribution to GDP 0.8% 0.4% 0.3%
# of Businesses 30 34 26
Average Compensation $41,000 $34,000 $51,480
Labor Income $60,242,000 $32,318,000 $40,000,000
Total GDP (Value Added) $151,722,000 $63,051,000 $46,900,000
% Traded Outside Region n/a n/a 56%
Output n/a $186,564,000 $150,000,000
Direct Jobs 1,469 940 777
Secondary Jobs 1,732 506 517
Total Employment 3,201 1,446 1,294
The Location Quotient (LQ) depicts the relative concentration of wood product GDP (value added) in Clackamas County compared to the 9-county Portland region.
Recent trends indicate that this cluster is declining in overall GDP (valued added) and shrinking in LQ (see Figure 31).
June 2012 Clackamas County Economic Landscape Update page 40
www.fcsgroup.comFCS GROUP
Agriculture & Food Production Cluster
Current Stats for Clackamas County*
Annual GDP (Value Added): $99 M
Cluster Share of County GDP: 2%
Exports/Sales from Outside MSA: 45%
Direct Employment: 3,464 jobs
County Businesses: 135
Number of Businesses in Top 100: 0
10-year Job Growth Forecast: 31%
Cluster Location Quotient (LQ)*: 1.39
Source: compiled by FCS GROUP based on IMPLAN (2010), adjusted to 2011 dollars; and 10-year job forecast from Oregon Employment Department.
* Please refer to definition of LQ on next page.
III.B.10. Agriculture & Food Production
There is a growing trend towards buying locally
produced food and organic products for all types.
According to the U.S. Bureau of Labor Statistics people
spend approximately 10% of their gross earnings on
food, and this level of spending amounts to nearly
$1.9 billion in Clackamas County and $7.5 billion in
the nine-county Portland MSA region every year. In
addition, there is a significant level of food purchased
by businesses, such as food processors, breweries,
and restaurants. While this cluster represents only 2%
($99 million) of the annual GDP produced by
Clackamas County, the actual value of this cluster to
the local and regional economy is much greater than
that amount. In the book You Can‘t Eat GDP,
Economics as if Ecology Matters, author Eric Davidson
points out that existing GDP is not a good indicator
for measuring the value of agriculture and food
production. Special environmental considerations about where and how food is obtained are
probably more important to air, water, and land resources. A supplemental analysis by FCS
GROUP indicates that increasing local purchases by 20% could generate about 105 jobs and
induce regional GDP by $44 million (with Clackamas County capturing 15-20% of this
increase).
Representative Ag. & Food Production Businesses
Name Location
CALFARMS Oregon City
EISELE Farms Boring
Health Wright Products Clackamas
Kip & Anna Tipikin Molalla
Kirkman Group Lake Oswego
Montecucco Farms Canby
Rose Agri-Seed Canby
Sandy Farms Sandy
Willamette Egg Farms Canby
Source: Oregon Employment Department; FCS GROUP
* Indicates top 100 County Business Listing
Agriculture & Food Production Cluster North American Industrial Classification System (NAICS) Categories 111: Farming and food production (excluding 1114 nurseries and greenhouses)
112: Animal production, egg production, ranching
114: Fishing, hunting and trapping
115: Support activities for agriculture & forestry
3253: Fertilizer and pesticide manufacturing
3254: Medicinal and botanical manufacturing
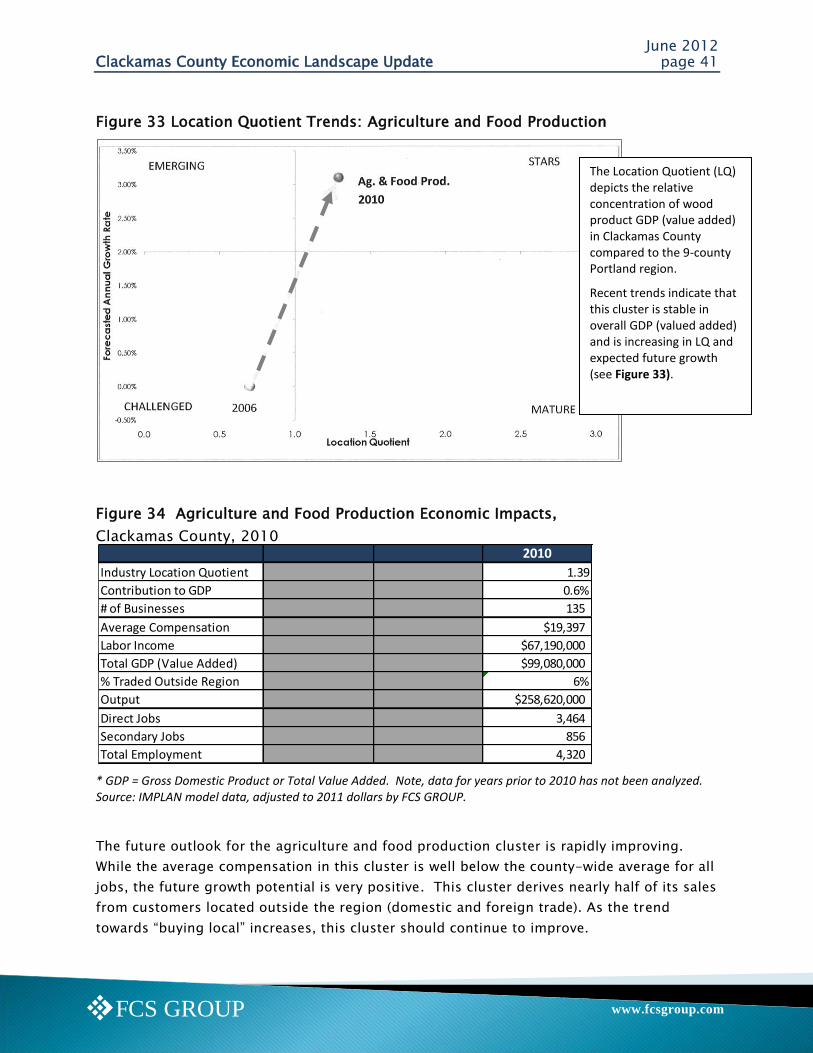
June 2012 Clackamas County Economic Landscape Update page 41
www.fcsgroup.comFCS GROUP
Figure 33 Location Quotient Trends: Agriculture and Food Production
Figure 34 Agriculture and Food Production Economic Impacts,
Clackamas County, 2010
* GDP = Gross Domestic Product or Total Value Added. Note, data for years prior to 2010 has not been analyzed. Source: IMPLAN model data, adjusted to 2011 dollars by FCS GROUP.
The future outlook for the agriculture and food production cluster is rapidly improving.
While the average compensation in this cluster is well below the county-wide average for all
jobs, the future growth potential is very positive. This cluster derives nearly half of its sales
from customers located outside the region (domestic and foreign trade). As the trend
towards ―buying local‖ increases, this cluster should continue to improve.
2010
Industry Location Quotient 1.39
Contribution to GDP 0.6%
# of Businesses 135
Average Compensation $19,397
Labor Income $67,190,000
Total GDP (Value Added) $99,080,000
% Traded Outside Region 6%
Output $258,620,000
Direct Jobs 3,464
Secondary Jobs 856
Total Employment 4,320
The Location Quotient (LQ) depicts the relative concentration of wood product GDP (value added) in Clackamas County compared to the 9-county Portland region.
Recent trends indicate that this cluster is stable in overall GDP (valued added) and is increasing in LQ and expected future growth (see Figure 33).
June 2012 Clackamas County Economic Landscape Update page 42
www.fcsgroup.comFCS GROUP
III.C. REGIONAL CLUSTER MARKETING EFFORTS
Focused marketing and business recruitment efforts are being made by the State of Oregon,
Portland Business Alliance, and local economic development officials to attract certain
established and emerging business clusters. The business and industry clusters currently
targeted by the Oregon Business Development Department, Portland Business Alliance, and
the Portland Development Commission include advanced manufacturing; clean technology
(with sustainability sub-clusters in green building, solar, and wind power); active
wear/outdoor gear; and software.
According to the Oregon Employment Department, the job sectors with the highest potentia l
for new growth in the greater Portland region include: health care; hotel/motel
accommodations and food services; business administration and waste management;
professional; scientific and technical service (such as computer science and engineering);
state and local government; wholesale trade; finance and insurance; retail trade;
transportation; and utilities (includes warehousing, distribution and energy research, and
private utilities).6
The manufacturing sectors with the greatest net new job growth potential in the greater
Portland metropolitan region include: computer-related parts manufacturing; transportation
equipment; other miscellaneous durable goods (such as solar panels); and miscellaneous
non-durable goods (such as apparel research and design). Health-related medical devices
and biomedical research, and organic food and beverage processing are also growing
business sectors within the broader economy.
Clackamas County is well positioned to attract business investment in manufacturing,
clean-technology and health-related medical research and service sectors. Efforts to retain
existing employers, accommodate emerging small businesses, and attract new businesses
are equally important. To optimize business investment potential, Clackamas County should
evaluate its perceived advantages and disadvantages vis-à-vis the factors used for business
location decision, as identified below.
III.D. BUSINESS LOCATION CRITERIA
Supporting research on business location decisions is quite extensive and findings tend to
vary by type of industry, market orientation, establishment size, and other factors. Research
by professors Fahri Karakaya (University of Massachusetts) and Cem Canel (University of
North Carolina) published in 1998 included a survey of 84 firms which was completed by a
chief executive officer. The firms included a mix of small, medium and large service and
6 These emerging business clusters are documented in the regional WIRED (Workforce Innovation and
Regional Economic Development, Global Development Strategy, prepared by FCS GROUP et.al, 2008.
June 2012 Clackamas County Economic Landscape Update page 43
www.fcsgroup.comFCS GROUP
manufacturing industries. The business survey results indicate that the top 10 factors
considered for business location decision making include:
1. Availability of skilled labor
2. Availability of transportation facilities
3. State tax rate
4. Proximity to major airports
5. State regulatory environment
6. Real estate tax rate
7. Proximity to major highways/seaports
8. Availability of local airport
9. Cost of utilities
10. Availability of unskilled labor
III.E. TARGETED BUSINESS OUTREACH
FCS GROUP utilized the IMPLAN model to analyze 145 detailed sectors within the 10 key
clusters to identify emerging sectors within key traded clusters. The process used for the
analysis in illustrated in Figure 35. This process allows Clackamas County to ―screen‖ each
sector to determine businesses that most likely to grow a rate faster than average with
measurable levels of GDP and employment growth over the next 5-10 years.
Specific target sectors (within Clusters) were identified that met at least 6 of 7 criteria,
including:
Generated at least $10 million in annual economic output within the sector;
GDP (value added) per employee above County average ($71,000+/job)
Foreign exports over $0.1 million
Industry location quotient greater than 1.0
Commodity location quotient greater than 1.0
Inter-regional exports/sales greater than 50% of total output
Negative value (net outflow) of commodity demand from Clackamas County (this
indicates more demand than supply of a particular commodity)
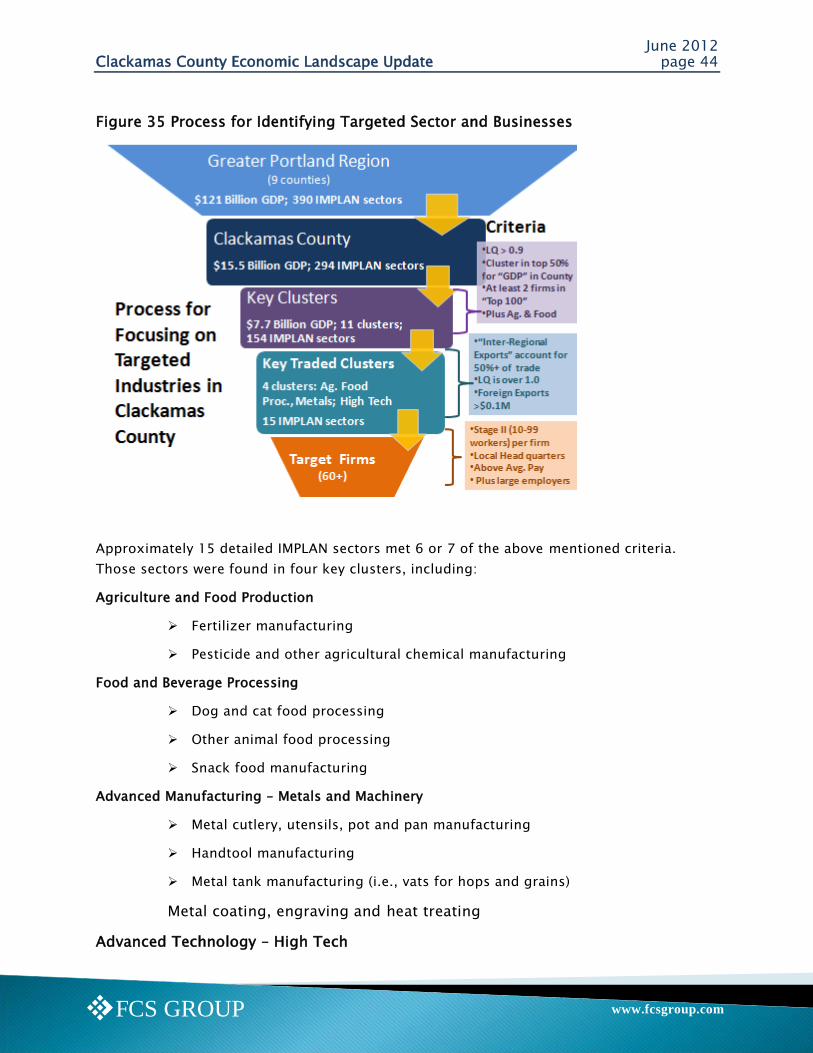
June 2012 Clackamas County Economic Landscape Update page 44
www.fcsgroup.comFCS GROUP
Figure 35 Process for Identifying Targeted Sector and Businesses
Approximately 15 detailed IMPLAN sectors met 6 or 7 of the above mentioned criteria.
Those sectors were found in four key clusters, including:
Agriculture and Food Production
Fertilizer manufacturing
Pesticide and other agricultural chemical manufacturing
Food and Beverage Processing
Dog and cat food processing
Other animal food processing
Snack food manufacturing
Advanced Manufacturing – Metals and Machinery
Metal cutlery, utensils, pot and pan manufacturing
Handtool manufacturing
Metal tank manufacturing (i.e., vats for hops and grains)
Metal coating, engraving and heat treating
Advanced Technology – High Tech
June 2012 Clackamas County Economic Landscape Update page 45
www.fcsgroup.comFCS GROUP
Computer terminals and peripheral equipment manufacturing
Audio and video equipment manufacturing*
Magnetic and optical recording media manufacturing*
Storage battery manufacturing
Communications and energy wire cable manufacturing*7
Clackamas County businesses within these 14 sectors were then screened using the Oregon
Employment Department data base to identify specific businesses that met the following
criteria:
Stage II employment levels (10 to 99 workers) with local Clackamas County head
quarters and above average annual pay rates.
Approximately 60 businesses within the 14 emerging sectors met these criteria. It is very
likely that those businesses will experience significant growth over the next 5-10 years and
it is recommended that Clackamas County staff conduct interviews with their
representatives to ensure that their growth needs can be met, particularly as it relates to
the key business location criteria listed in Section III.D.
It is also recommended that the County‘s larger Stage IV businesses (500+ employees) also
be contacted to ensure that their site expansion needs and other key factors are being
addressed locally or regionally.
7 *Note, these sectors may also be reflected within the emerging film industry cluster in Clackamas County.
June 2012 Clackamas County Economic Landscape Update page 46
www.fcsgroup.comFCS GROUP
IV Development Overview
This section provides a summary of the major public and private development investments
underway or recently completed in Clackamas County. While this is not to be considered a
complete listing of all projects and investment activities, it is intended to represent the level
of major investment activity that is occurring throughout the county. Please refer to Figures
36 and 37 for a list and location of major public, private and public/private investment
projects in Clackamas County.
IV.A. PUBLIC INVESTMENTS
Clackamas County is partnering with ODOT, Trimet and local cities to complete major
transportation, parks and infrastructure facilities investments. Major recent and on-going
construction projects include:
MAX Orange Line – Light Rail Transit (Portland to Milwaukie)
172nd Ave. roadway improvements (Happy Valley)
Lawnfield Road and Mather Road improvements (Clackamas Industrial Area)
Tolbert Bridge (Clackamas Industrial Area)
Sunrise Corridor Phase 1 Construction (I-205 to 122nd Avenue)
Tri Cities sewer system capacity upgrades (serving Oregon City, West Linn,
Gladstone, and other areas)
Stafford-Borland Roundabout (north of I-205 in Stafford area)
Monterey ―Main Street‖ improvements (North Clackamas area)
Oregon City Bridge renovation (Oregon City)
Highway 224 improvements (ODOT led project included new pavement, streetlights,
medians, intersections and landscaping)
I-5/Wilsonville Road interchange
Other major institutional construction activities in Clackamas County include over $75
million in federal and local government investment at Camp Withycomb. Also, the Oregon
Institute of Technology has relcoated into a 2,000 student college campus in Wilsonville..
IV.B. PUBLIC/PRIVATE INVESTMENTS
Local cities and special districts are working with property owners to complete several
public/private developments. Selected activities include:
June 2012 Clackamas County Economic Landscape Update page 47
www.fcsgroup.comFCS GROUP
Rock Creek Employment Center (planned 200-acre employment area in Happy Valley
expected to attract 2,000 to 3,000 new jobs at buildout)
Foothills Redevelopment (planned transit oriented redevelopment near downtown
Lake Oswego with a $1.1 million design plan underway)
North Clackamas Urban Renewal Area (sewer upgrades and connections being
completed using federal grants, local urban renewal and private investment)
Blue Heron Site (historic brownfield site in downtown Oregon City now being
considered for a variety of public and private uses)
Estacada Industrial expansion (city has added 130 acres of industrial zoned land to
its UGB in 2011, targeted for large users)
In 2011, Clackamas County created a Strategic Investment Zone (SIZ) and Rural Renewable
Energy Development Zone (RRED). These programs are valuable business recruitment tools
to attract new businesses, create jobs and increase investment in Clackamas County.
IV.C. PRIVATE INVESTMENTS
Despite the weak economy, several major private developments are moving forward in
Clackamas County. Selected private developments include:
Lake Grove developments (major reconstruction of the former Wizer grocery store
and shopping center is now underway, along new office buildings, and senior
housing developments along Boones Ferry Road)
Villebois neighborhood (private construction continues with new homes being added
each month at this $400 million, 2,800 unit planned development in Wilsonville)
Fred Meyer Center (new 145,000 sf commercial center to open this summer)
Shimadzu expansion ($5 million factor expansion completed in Canby adding 54,000
sf of industrial floor area)
Oregon Iron Works expansion ($40 million plant expansion underway in Clackamas
Industrial Area) to make room for the first modern streetcar built in the United States
in 60 years. The streetcar project is projected to create 50 to 100 jobs.
Coca Cola Plant expansion (new 150,000 bottling and distribution plant in
Wilsonville)
Rockwell Collins expansion (private expansion in Wilsonville with 150 jobs added
this year)
OECO expanded their operation in Milwaukie to include the Pacific Scientific Electro
Kinetics Division formerly located in California. OECO is a leading manufacturer of
highly specialized alternator and generator systems and associated electronics and
has supplied hardware for military and commercial programs. The expansion has the
potential of adding 100 new employees to the Milwaukie facility.
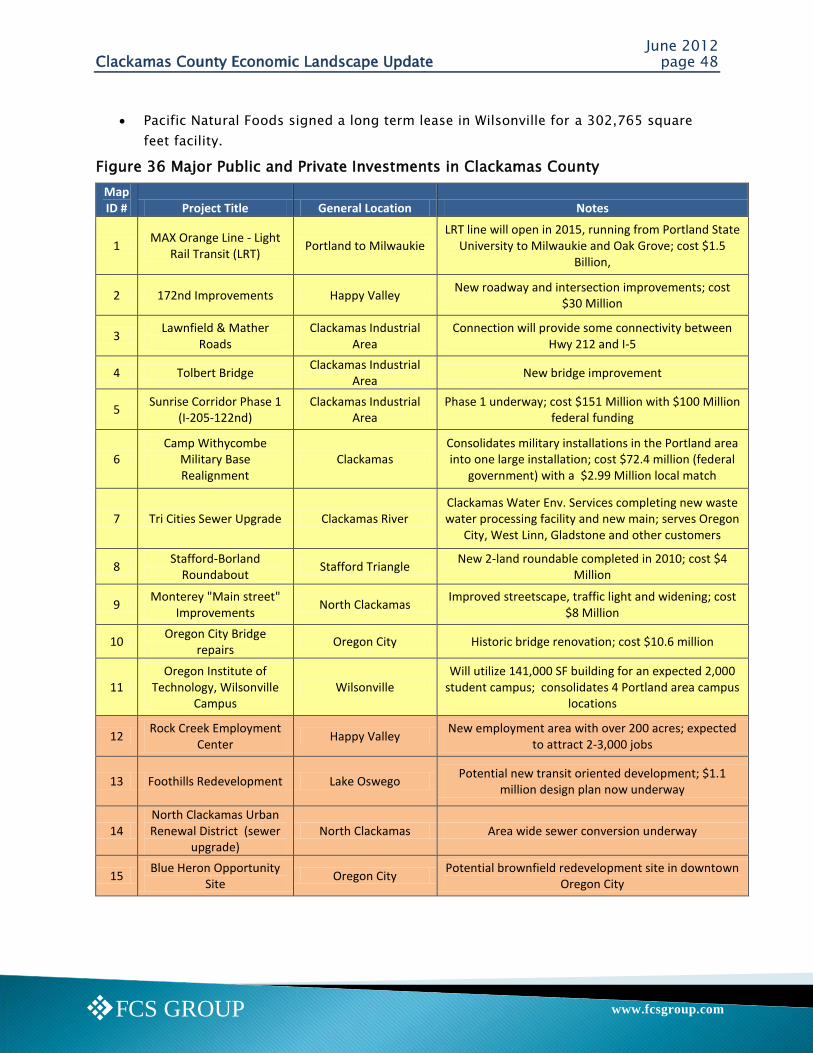
June 2012 Clackamas County Economic Landscape Update page 48
www.fcsgroup.comFCS GROUP
Pacific Natural Foods signed a long term lease in Wilsonville for a 302,765 square
feet facility.
Figure 36 Major Public and Private Investments in Clackamas County
Map ID # Project Title General Location Notes
1 MAX Orange Line - Light
Rail Transit (LRT) Portland to Milwaukie
LRT line will open in 2015, running from Portland State University to Milwaukie and Oak Grove; cost $1.5
Billion,
2 172nd Improvements Happy Valley New roadway and intersection improvements; cost
$30 Million
3 Lawnfield & Mather
Roads Clackamas Industrial
Area Connection will provide some connectivity between
Hwy 212 and I-5
4 Tolbert Bridge Clackamas Industrial
Area New bridge improvement
5 Sunrise Corridor Phase 1
(I-205-122nd) Clackamas Industrial
Area Phase 1 underway; cost $151 Million with $100 Million
federal funding
6 Camp Withycombe
Military Base Realignment
Clackamas Consolidates military installations in the Portland area into one large installation; cost $72.4 million (federal
government) with a $2.99 Million local match
7 Tri Cities Sewer Upgrade Clackamas River Clackamas Water Env. Services completing new waste water processing facility and new main; serves Oregon
City, West Linn, Gladstone and other customers
8 Stafford-Borland
Roundabout Stafford Triangle
New 2-land roundable completed in 2010; cost $4 Million
9 Monterey "Main street"
Improvements North Clackamas
Improved streetscape, traffic light and widening; cost $8 Million
10 Oregon City Bridge
repairs Oregon City Historic bridge renovation; cost $10.6 million
11 Oregon Institute of
Technology, Wilsonville Campus
Wilsonville Will utilize 141,000 SF building for an expected 2,000
student campus; consolidates 4 Portland area campus locations
12 Rock Creek Employment
Center Happy Valley
New employment area with over 200 acres; expected to attract 2-3,000 jobs
13 Foothills Redevelopment Lake Oswego Potential new transit oriented development; $1.1
million design plan now underway
14 North Clackamas Urban Renewal District (sewer
upgrade) North Clackamas Area wide sewer conversion underway
15 Blue Heron Opportunity
Site Oregon City
Potential brownfield redevelopment site in downtown Oregon City
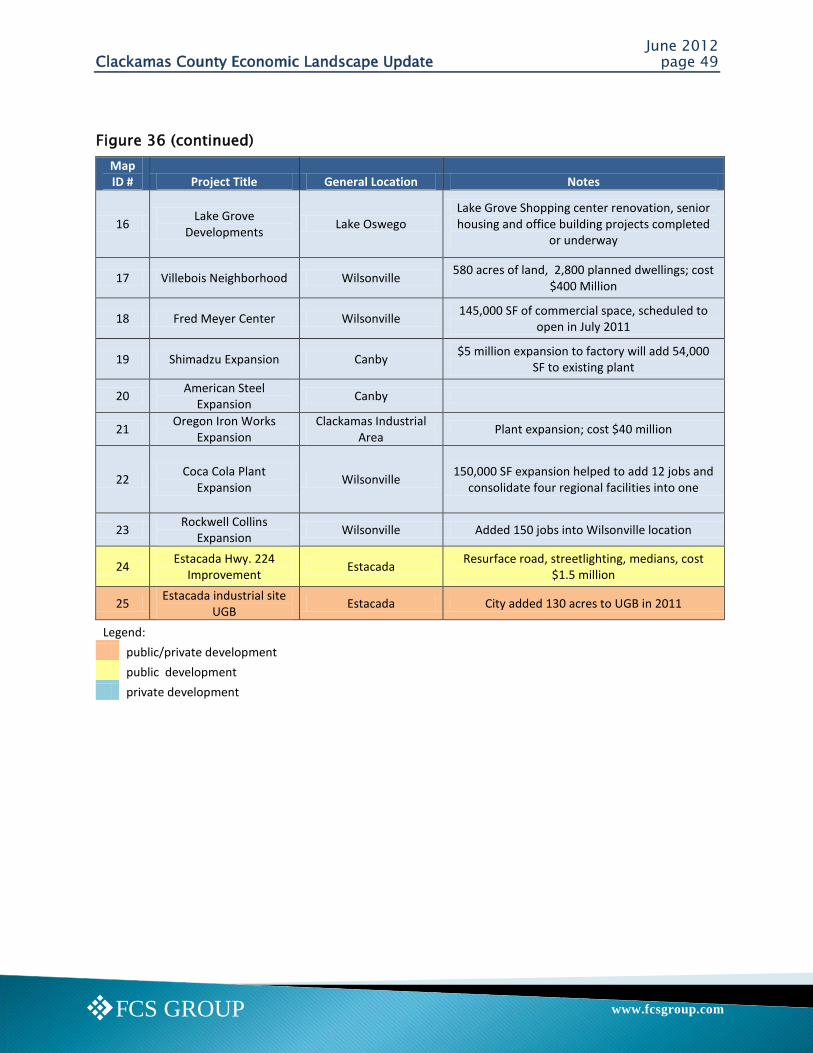
June 2012 Clackamas County Economic Landscape Update page 49
www.fcsgroup.comFCS GROUP
Figure 36 (continued)
Map ID # Project Title General Location Notes
16 Lake Grove
Developments Lake Oswego
Lake Grove Shopping center renovation, senior housing and office building projects completed
or underway
17 Villebois Neighborhood Wilsonville 580 acres of land, 2,800 planned dwellings; cost
$400 Million
18 Fred Meyer Center Wilsonville 145,000 SF of commercial space, scheduled to
open in July 2011
19 Shimadzu Expansion Canby $5 million expansion to factory will add 54,000
SF to existing plant
20 American Steel
Expansion Canby
21 Oregon Iron Works
Expansion Clackamas Industrial
Area Plant expansion; cost $40 million
22 Coca Cola Plant
Expansion Wilsonville
150,000 SF expansion helped to add 12 jobs and consolidate four regional facilities into one
23 Rockwell Collins
Expansion Wilsonville Added 150 jobs into Wilsonville location
24 Estacada Hwy. 224
Improvement Estacada
Resurface road, streetlighting, medians, cost $1.5 million
25 Estacada industrial site
UGB Estacada City added 130 acres to UGB in 2011
Legend:
public/private development
public development
private development
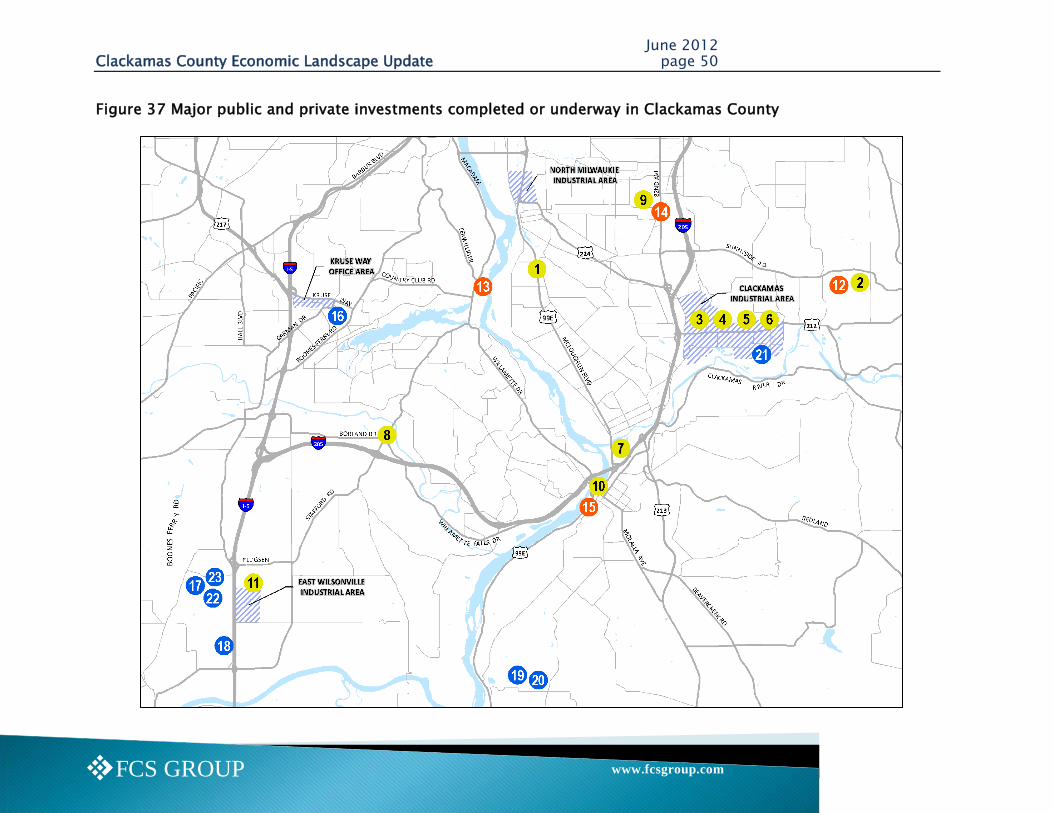
June 2012 Clackamas County Economic Landscape Update page 50
www.fcsgroup.comFCS GROUP
Figure 37 Major public and private investments completed or underway in Clackamas County
June 2012 Clackamas County Economic Landscape Update page 51
www.fcsgroup.com FCS GROUP
V Employment Centers Analysis
This section provides a summary comparison of the economic benefit derived from four
major employment centers in Clackamas County.
To better understand the economic and fiscal benefit of land use planning policies for
employment areas, an evaluation of four established employment centers was conducted.
The four employment areas are shown in Figure 38 and included:
North Milwaukie Industrial Area – vintage 1960 to1970 industrial park location,
created before I-205 was constructed.
Clackamas Industrial Area – planned industrial area that was developed primarily in
the 1980s and 1990s after I-205 was constructed; additional investment in the early
2000s.
East Wilsonville Industrial Area – a planned industrial campus and R&D area that
includes high tech corporate campuses for firms such as Xerox. Development
occurred primarily in the 1990s and 2000s.
Kruse Way Area – a planned office corridor that was developed primarily in the 1990s
and 2000s
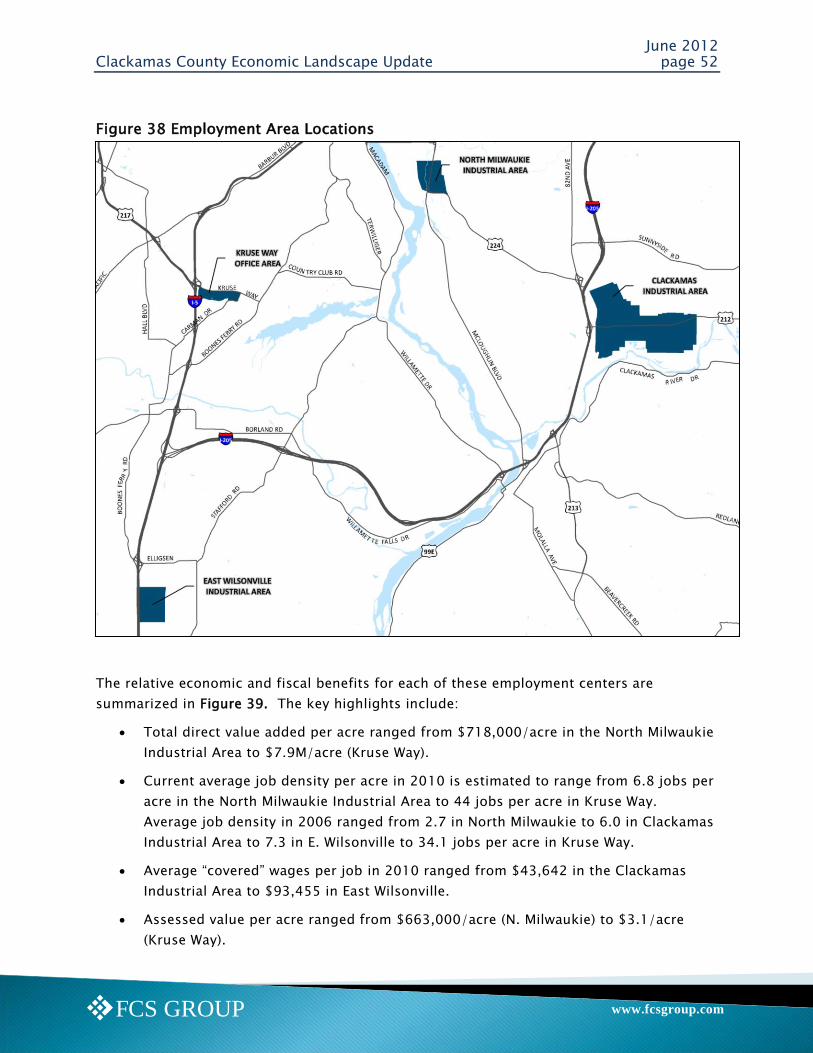
June 2012 Clackamas County Economic Landscape Update page 52
www.fcsgroup.com FCS GROUP
Figure 38 Employment Area Locations
The relative economic and fiscal benefits for each of these employment centers are
summarized in Figure 39. The key highlights include:
Total direct value added per acre ranged from $718,000/acre in the North Milwaukie
Industrial Area to $7.9M/acre (Kruse Way).
Current average job density per acre in 2010 is estimated to range from 6.8 jobs per
acre in the North Milwaukie Industrial Area to 44 jobs per acre in Kruse Way.
Average job density in 2006 ranged from 2.7 in North Milwaukie to 6.0 in Clackamas
Industrial Area to 7.3 in E. Wilsonville to 34.1 jobs per acre in Kruse Way.
Average ―covered‖ wages per job in 2010 ranged from $43,642 in the Clackamas
Industrial Area to $93,455 in East Wilsonville.
Assessed value per acre ranged from $663,000/acre (N. Milwaukie) to $3.1/acre
(Kruse Way).
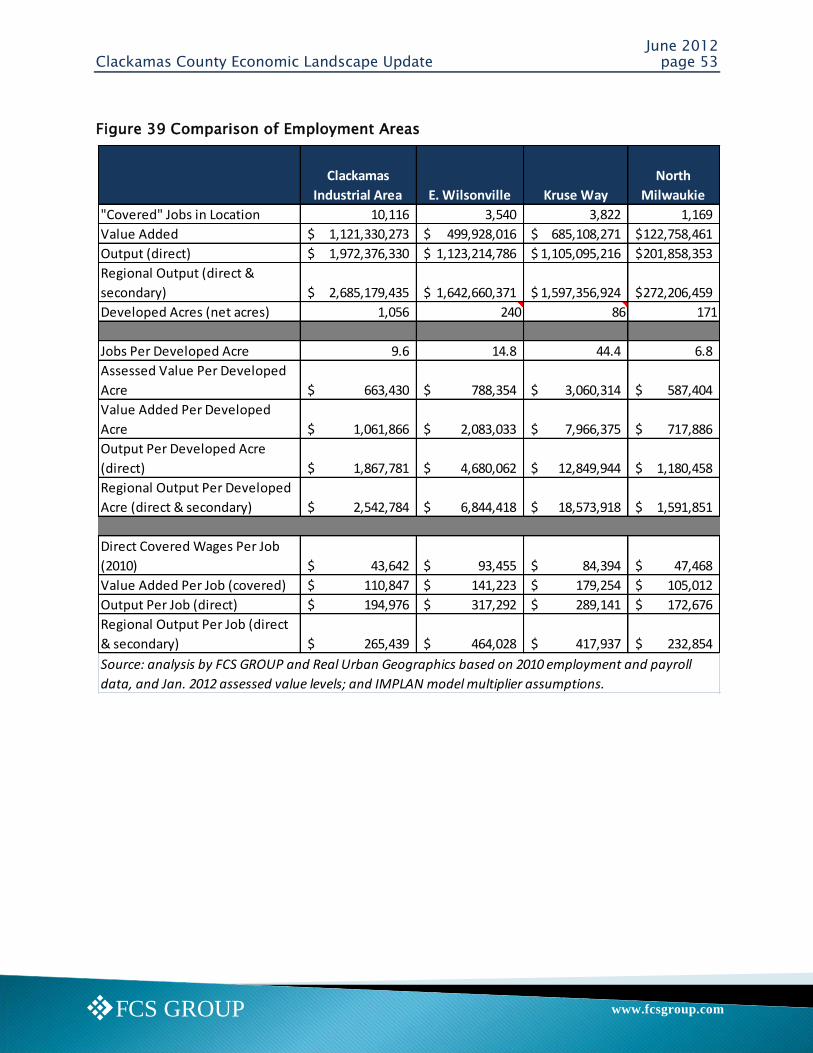
June 2012 Clackamas County Economic Landscape Update page 53
www.fcsgroup.com FCS GROUP
Figure 39 Comparison of Employment Areas
Clackamas
Industrial Area E. Wilsonville Kruse Way
North
Milwaukie
"Covered" Jobs in Location 10,116 3,540 3,822 1,169
Value Added 1,121,330,273$ 499,928,016$ 685,108,271$ 122,758,461$
Output (direct) 1,972,376,330$ 1,123,214,786$ 1,105,095,216$ 201,858,353$
Regional Output (direct &
secondary) 2,685,179,435$ 1,642,660,371$ 1,597,356,924$ 272,206,459$
Developed Acres (net acres) 1,056 240 86 171
Jobs Per Developed Acre 9.6 14.8 44.4 6.8
Assessed Value Per Developed
Acre 663,430$ 788,354$ 3,060,314$ 587,404$
Value Added Per Developed
Acre 1,061,866$ 2,083,033$ 7,966,375$ 717,886$
Output Per Developed Acre
(direct) 1,867,781$ 4,680,062$ 12,849,944$ 1,180,458$
Regional Output Per Developed
Acre (direct & secondary) 2,542,784$ 6,844,418$ 18,573,918$ 1,591,851$
Direct Covered Wages Per Job
(2010) 43,642$ 93,455$ 84,394$ 47,468$
Value Added Per Job (covered) 110,847$ 141,223$ 179,254$ 105,012$
Output Per Job (direct) 194,976$ 317,292$ 289,141$ 172,676$
Regional Output Per Job (direct
& secondary) 265,439$ 464,028$ 417,937$ 232,854$
Source: analysis by FCS GROUP and Real Urban Geographics based on 2010 employment and payroll
data, and Jan. 2012 assessed value levels; and IMPLAN model multiplier assumptions.
June 2012 Clackamas County Economic Landscape Update page 54
www.fcsgroup.com FCS GROUP
VI Summary and Policy Discussion
VI.A. SUMMARY OF FINDINGS
This Clackamas Economic Landscape Update reflects the significant economic changes that
have occurred over the past few years, as the local and regional economy slowly emerge
from the ―Great Recession‖ and reflect changing national and international economic
conditions. The findings indicate that modest positive growth in Clackamas County gross
domestic product (GDP) did occur over the 2006-2010 timeframe, as the county GDP
increased to $15.5 billion (expressed in 2011 dollars).
During the 2006 to 2010 time frame the County growth in GDP did slightly outpace the
nine-county region. However, average earnings within Clackamas County continue to lag
significantly below the regional average. Continued efforts to spur business investment
within the key clusters are expected to enhance growth average earnings and GDP within
the County.
Certain clusters are performing better than others in Clackamas County. Among the key
clusters, there are several sectors within the Agriculture and Food Production, Food and
Beverage Processing, Advanced Manufacturing- Metals and Machinery, and Advanced
Technology-High Tech clusters that show significant growth potential over the next 5-10
years.
A focused business outreach effort aimed at Stage II (9-100 workers) businesses within key
growth industry sectors is recommended. Clackamas County has a very large proportion of
small and self-employed establishments, and ―home based‖ business enterprises. The
targeted Stage II companies could include several ―gazelle‖ firms that are expected to
growth significantly over the next few years.
Marketing efforts aimed at spurring local purchases of agriculture and food could also have
measurable impacts on GDP and job growth within Clackamas County and the region.
A more focused cluster development strategy may be required for Clackamas County to fully
capitalize on the emerging film and media production cluster.
Focused employment growth in new emerging locations, such Rock Creek Employment
Center in Happy Valley, Estacada, Molalla, Canby and Oregon City may represent the best
remaining future industrial job growth areas within the county over the coming decades.
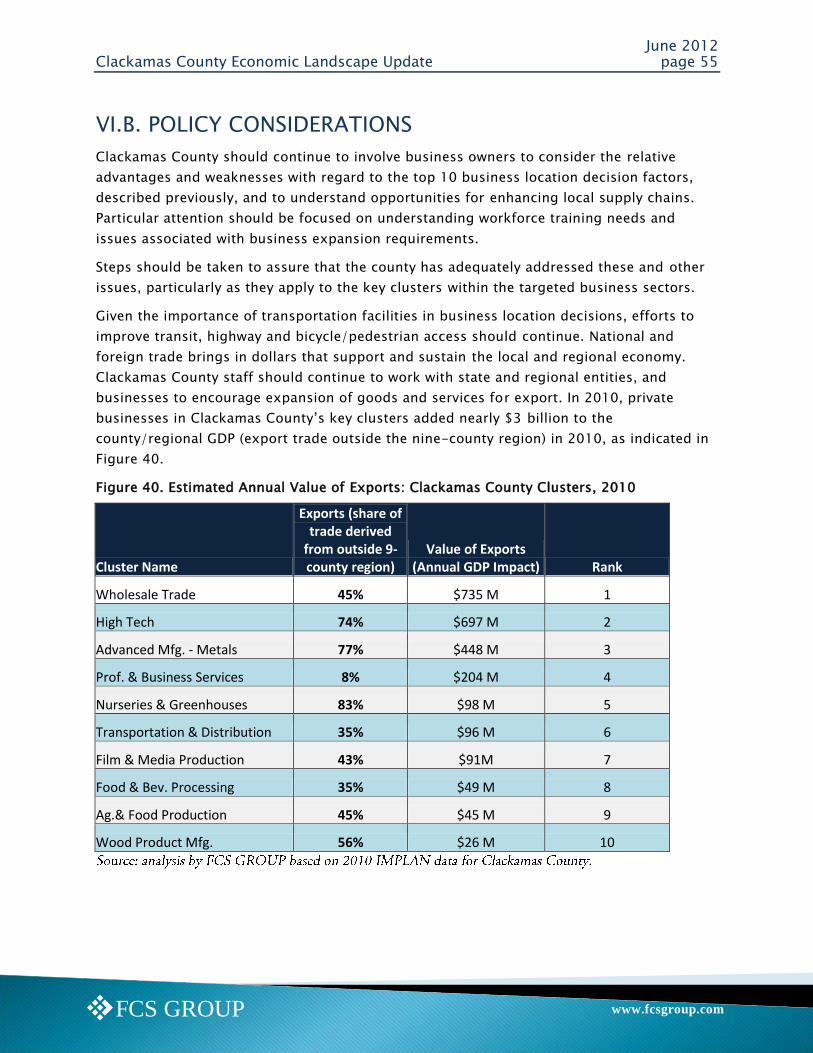
June 2012 Clackamas County Economic Landscape Update page 55
www.fcsgroup.com FCS GROUP
VI.B. POLICY CONSIDERATIONS
Clackamas County should continue to involve business owners to consider the relative
advantages and weaknesses with regard to the top 10 business location decision factors,
described previously, and to understand opportunities for enhancing local supply chains.
Particular attention should be focused on understanding workforce training needs and
issues associated with business expansion requirements.
Steps should be taken to assure that the county has adequately addressed these and other
issues, particularly as they apply to the key clusters within the targeted business sectors.
Given the importance of transportation facilities in business location decisions, efforts to
improve transit, highway and bicycle/pedestrian access should continue. National and
foreign trade brings in dollars that support and sustain the local and regional economy.
Clackamas County staff should continue to work with state and regional entities, and
businesses to encourage expansion of goods and services for export. In 2010, private
businesses in Clackamas County‘s key clusters added nearly $3 billion to the
county/regional GDP (export trade outside the nine-county region) in 2010, as indicated in
Figure 40.
Figure 40. Estimated Annual Value of Exports: Clackamas County Clusters, 2010
Cluster Name
Exports (share of trade derived
from outside 9-county region)
Value of Exports (Annual GDP Impact) Rank
Wholesale Trade 45% $735 M 1
High Tech 74% $697 M 2
Advanced Mfg. - Metals 77% $448 M 3
Prof. & Business Services 8% $204 M 4
Nurseries & Greenhouses 83% $98 M 5
Transportation & Distribution 35% $96 M 6
Film & Media Production 43% $91M 7
Food & Bev. Processing 35% $49 M 8
Ag.& Food Production 45% $45 M 9
Wood Product Mfg. 56% $26 M 10
June 2012 Clackamas County Economic Landscape Update page 56
www.fcsgroup.com FCS GROUP
Appendix A – Glossary
Assessed Value (AV)
The AV is the amount of estimated taxable valuation of land and improvements on a taxable
parcel; often obtained by the county assessor.
BEA
Bureau of Economic Analysis is the economic analysis division contained within the U.S.
Department of Commerce.
Covered Employment
The total number of jobs reported to the Oregon Employment Department at public, private
and non-profit establishments for unemployment insurance compensation accounting
purposes.
Direct (Primary) Effects
The direct economic activity (employment, labor income, value added, output) per change in
final demand specified for a given sector. Sometimes referred to by economists as first
round impacts attributed to changes in investment or spending within a local economy.
Earnings Multipliers
Input-output ratios that measure earnings paid to households by employment throughout
the economy, directly and indirectly, in connection with delivery of $1 million of final
demand for a specific commodity.
Economic Census
Economic census provides a detailed portrait of the nation's economy once every 5 years,
from the national to the local level. The basic statistics collected cover nearly all of the U.S.
economy except agriculture and government, which are covered by concurrent economic
censuses. Several related programs collect additional statistics, including those on
minority- and women-owned businesses. The economic census is conducted largely by the
Census Bureau; the census of agriculture is conducted by the U.S. Department of
Agriculture. The economic census for 1997 compiled and published data primarily on a
NAICS basis for the first time.
June 2012 Clackamas County Economic Landscape Update page 57
www.fcsgroup.com FCS GROUP
Economic Output
Economic output represents the value of industry production. In IMPLAN, these are annual
production estimates for the year of the data set and are in producer prices. For
manufacturers this would be sales plus/minus change in inventory. For service sectors,
production equals sales. For retail and wholesale trade, output equals gross margin and not
gross sales. Indirect and induced economic output is derived from the I-O total
requirements tables, the output multipliers show the amount of output required to satisfy a
given level of final-use expenditures. For the commodity-by-commodity total requirements
table, it is the production required both directly and indirectly of the commodity at the
beginning of each row per dollar of delivery to final use of the commodity at the top of the
column. For the industry-by-commodity total requirements table, it is the industry output
required to deliver a dollar of a commodity to final users. For the industry-by-industry total
requirements table, it is the industry output required to deliver a dollar of industry output
to final users.
Economic Production
Economic production is an activity carried out under the control and responsibility of an
institutional unit that uses inputs of labor, capital, and goods and services to produce
outputs of goods or services.
Employee or Employment
An employee is a person who enters an agreement, which may be formal or informal, with
an enterprise to work for the enterprise in return for remuneration in cash or in kind.
Employee Compensation
Employee compensation in IMPLAN is the total payroll cost of the employee paid by the
employer. This includes, wage and salary, all benefits (e.g., health, retirement, etc) and
employer paid payroll taxes (e.g., employer side of social security, unemployment taxes,
etc).
Establishment
An economic unit—business or industrial—at a single physical location where business is
conducted or where services or industrial operations are performed. Examples include a
factory, mill, store, hotel, movie theater, mine, farm, ranch, bank, railroad depot, air line
terminal, sales office, warehouse, or central administrative office. One or more
establishments make up an enterprise or a company. However, a single establishment may
be comprised of subunits, departments, or divisions. In the industry classification systems—
the establishment is the basic unit for collecting many types of economic information.
An establishment is an enterprise, or part of an enterprise, that is situated in a single
location and in which only a single (non-ancillary) productive activity is carried out or in
which the principal productive activity accounts for most of the value added.
June 2012 Clackamas County Economic Landscape Update page 58
www.fcsgroup.com FCS GROUP
Exempt AV
Exempt AV is the amount of estimated taxable valuation of land and improvements that is
excluded in the calculation of total assessed value for a taxable parcel; often obtained by
the county assessor.
Gross Domestic Product (GDP)
The difference between an industry‘s or an establishment‘s total output and the cost of its
intermediate inputs. It equals gross output (sales or receipts and other operating income,
plus inventory change) minus intermediate inputs (consumption of goods and services
purchased from other industries or imported). The IMPLAN model includes labor income,
proprietor profits, business income and tax payments as measures of GDP. See also ―value
added.‖
Households
Residents of the study area. Final users of nondurable goods and services. One of several
institutions in IMPLAN.
IMPLAN
An economic model published by the Minnesota IMPLAN Group, also known as the Impact
Model for Planning. IMPLAN was originally developed in the 1970s for the U.S. Government
for use in understanding the economic effects of various industry sectors on local and
regional economies. IMPLAN version 3.0 software was utilized for this analysis.
Indirect Business Taxes (IBT)
Prior to the 2003 comprehensive National Income and Product Accounts (NIPA) revision, IBT
was the name of one of the three components of value added. It consists of tax and nontax
liabilities that are chargeable to business expenses when calculating profit-type incomes
and of certain other business liabilities to government agencies that are treated like taxes.
Thus, IBT includes taxes on sales, property, and production, but it excludes employer
contributions for social insurance and taxes on income. As part of the NIPA revision, this
component was modified and termed ―taxes on production and imports less subsidies.‖ The
major differences between the two are attributable to the treatments of subsidies and non-
taxes.
Indirect Effects
The indirect change in a measure of economic activity (employment, labor income, value
added, output) per change in the amount of final demand specified for a given sector.
Indirect ratios show the production required of an industry and of all other industries to
meet that industry‘s initial demand for production.
June 2012 Clackamas County Economic Landscape Update page 59
www.fcsgroup.com FCS GROUP
Induced Effects
The induced change in a measure of economic activity (employment, labor income, value
added, output) per change in the amount of final demand specified for a given sector,
resulting from interaction of institutions – usually associated with the indirect effects of
household spending.
Input-Output Analysis
A type of applied economic analysis that tracks the interdependence among various
producing and consuming sectors of an economy. More particularly, it measures the
relationship between a given set of demands for final goods and services and the inputs
required to satisfy those demands.
Labor Income
All forms of employment income, including Employee Compensation (wages and benefits)
and Proprietor Income.
Location Quotient
Propensity of jobs to locate in Clackamas County in comparison to the entire Regional
PMSA.
NAICS
North American Industry Classification System. A system of industrial classification—
developed and used by the United States, Canada, and Mexico—for grouping establishments
by similarity of production process. Beginning with the 1997 economic census, NAICS has
replaced the 1987 Standard Industrial Classifications as the primary industry classification
system used for U.S. economic statistics. NAICS features more detailed classifications for
the services industries and improved classifications for the high-tech industries. (See also
―Economic Census‖.)
Proprietor Income
Proprietor income consists of payments received by self-employed individuals and
unincorporated business owners. This income also includes the capital consumption
allowance.
Real Market Value (RMV)
Real market value is the estimated total market value of land and improvements on a
taxable parcel; often obtained by the county assessor based on an appraised value or
recorded sales transaction.
June 2012 Clackamas County Economic Landscape Update page 60
www.fcsgroup.com FCS GROUP
Regional Purchase Coefficient
A regional purchase coefficient (RPC) is the proportion of the total demand for a commodity
by all users in the Study Area that is supplied by producers located within the Study Area.
For example, if the RPC for the commodity ‘fish‘ is 0.8, then 80 percent of the demand by
local fish processors, fish wholesalers, and other fish consumers are met by local fish
producers. Conversely, 20 percent of the demand for fish is satisfied by imports.
Sector
In the national economic accounts, the institutional units that make up the total economy:
business, households and institutions, and general government. The sectors are generally
the two-digit NAICS level—though manufacturing, retail, and transportation and
warehousing span several two-digit codes.
Total Impacts
Total impacts equal the sum of the direct, indirect and induced impacts.
Value Added
The difference between an industry‘s, or an establishment‘s total output and the cost of its
intermediate inputs. It equals gross output (sales or receipts and other operating income,
plus inventory change) minus intermediate inputs (consumption of goods and services
purchased from other industries or imported). Value added consists of compensation of
employees, taxes on production and imports less subsidies (formerly indirect business
taxes and nontax payments), and gross operating surplus (formerly ―other value added‖).
Gross value added is the value of output less the value of intermediate consumption; it is a
measure of the contribution to GDP made by an individual producer, industry or sector;
gross value added is the source from which the primary incomes of the SNA are generated
and is therefore carried forward into the primary distribution of income account.
June 2012 Clackamas County Economic Landscape Update page 61
www.fcsgroup.com FCS GROUP
If you have any questions or comments about the Clackamas County Economic Landscape
project, please contact:
Clackamas County Business & Economic Development Department
503-742-4329


