Embed Size (px)
Citation preview
CITY SANITATION PLAN GULBARGA
ADMINISTRATIVE STAFF COLLEGE OF INDIA, HYDERABAD 2 | P a g e
TABLE OF CONTENTS
ABBREVIATIONS............................................................................................................................................................ 11
EXECUTIVE SUMMARY ............................................................................................................................................... 14
ACKNOWLEDGEMENTS .............................................................................................................................................. 16
CSTF MEMBERS .............................................................................................................................................................. 17
FOREWORD (by CSTF Chairperson) ...................................................................................................................... 18
ASCI TEAM MEMBERS ................................................................................................................................................. 19
Chapter 1 ........................................................................................................................................................................... 20
Introduction ..................................................................................................................................................................... 20
1.1 BACKGROUND ............................................................................................................................................. 20
1.2 OBJECTIVES OF CITY-WIDE SANITATION PLAN .......................................................................... 20
1.3 CONTEXT ....................................................................................................................................................... 21
1.4 CITY SANITATION PLANNING IN GULBARGA ............................................................................... 23
1.5 PROCESS, DETAILED STEPS AND LIMITATIONS .......................................................................... 26
ACTIVITY UPDATE ON GULBARGA CSP ..................................................................................................... 32
1.6 VERIFICATION OF MOUD CHECKLIST .............................................................................................. 35
1.7 CHAPTER PLAN ........................................................................................................................................... 40
Chapter 2 ........................................................................................................................................................................... 42
State Urban Sanitation Policies & Programmes – A review ......................................................................... 42
2.1 NATIONAL URBAN SANITATION POLICY (NUSP) ........................................................................ 42
2.2 MUNICIPAL SOLID WASTE RULES, 2000 ......................................................................................... 45
2.3 KARNATAKA URBAN DRINKING WATER AND SANITATION POLICY, 2002 .................... 46
2.4 KARNATAKA URBAN INFRASTRUCTURE DEVELOPMENT AND FINANCE
CORPORATION (KUIDFC) ...................................................................................................................................... 46
2.5 INTEGRATED LOW COST SANITATION (ILCS) .............................................................................. 49
2.6 ASHA KIRAN MAHITI (AKM) ................................................................................................................. 49
2.7 JNNURM .......................................................................................................................................................... 49
2.8 URBAN INFRASTRUCTURE DEVELOPMENT SCHEME FOR SMALL & MEDIUM TOWNS
(UIDSSMT) ................................................................................................................................................................... 50
2.9 RAJIV AWAS YOJANA ................................................................................................................................ 50
2.10 URBAN STATISTICS FOR HR AND ASSESSMENTS (USHA)” ..................................................... 52
2.11 INTEREST SUBSIDY SCHEME FOR HOUSING THE URBAN POOR (ISHUP) ........................ 52
2.12 13TH CENTRAL FINANCE COMMISSION (CFC) ............................................................................. 53
2.13 NATIONAL MISSION ON SUSTAINABLE HABITAT ...................................................................... 53
CITY SANITATION PLAN GULBARGA
ADMINISTRATIVE STAFF COLLEGE OF INDIA, HYDERABAD 3 | P a g e
Chapter 3 ........................................................................................................................................................................... 55
Profile of Gulbarga City ............................................................................................................................................... 55
3.1 INTRODUCTION .......................................................................................................................................... 55
3.2 LOCATION AND REGIONAL LINKAGES ............................................................................................. 55
3.3 Climate ............................................................................................................................................................ 56
3.4 Topography .................................................................................................................................................. 56
3.5 BRIEF HISTORY ........................................................................................................................................... 56
3.6 REGIONAL IMPORTANCE ....................................................................................................................... 57
3.7 economy ......................................................................................................................................................... 57
3.8 Demography ................................................................................................................................................. 57
3.8.1 Population Projections ................................................................................................................... 59
3.8.2 Population Density ........................................................................................................................... 60
3.8.3 Sex Ratio ............................................................................................................................................... 60
3.8.4 Literacy ................................................................................................................................................. 60
3.8.5 WARDWISE POPULATION DISTRIBUTION AND GROWTH POTENTIAL .................. 61
3.9 Housing Scenario ........................................................................................................................................ 64
Ownership Status ................................................................................................................................................. 64
3.10 Slums and squatter settlements ...................................................................................................... 65
3.11 Existing Landuse ......................................................................................................................................... 72
3.12 MUNICIPAL Governance .......................................................................................................................... 72
Chapter 4 ........................................................................................................................................................................... 77
Environmental Sanitation – An Assessment ...................................................................................................... 77
4.1 Sanitation Situation Analysis ................................................................................................................. 77
Introduction ........................................................................................................................................................... 77
4.1.1 Household Sanitation ...................................................................................................................... 77
4.1.2 Slum sanitation .................................................................................................................................. 79
4.1.3 Open defecation areas .................................................................................................................... 85
4.1.4 community toilets ............................................................................................................................. 86
4.1.5 Public toilets ....................................................................................................................................... 88
4.1.6 school sanitation ............................................................................................................................... 91
4.1.7 wastewater treatment in Gulbarga ........................................................................................... 93
4.1.8 Septage Management ...................................................................................................................... 95
4.1.9 service level benchmarking indicators .................................................................................... 96
4.1.10 Waste water projections ................................................................................................................ 96
4.2 STORM WATER DRAINAGE SYSTEM ................................................................................................. 98
CITY SANITATION PLAN GULBARGA
ADMINISTRATIVE STAFF COLLEGE OF INDIA, HYDERABAD 4 | P a g e
Introduction ........................................................................................................................................................... 98
4.2.1 EXISTING DRAINAGE NETWORK .............................................................................................. 98
4.2.2 coverage ............................................................................................................................................... 99
4.2.3 Outfalls .................................................................................................................................................. 99
4.2.4 Existing Drainage Conditions ...................................................................................................... 99
4.2.5 Local Flooding Areas/ Low Lying Areas ............................................................................... 100
4.2.6 STANDARDIZED SERVICE LEVEL INDICATORS ................................................................ 101
4.3 SOLID WASTE MANAGEMENT ........................................................................................................... 102
4.3.1 Primary collection and coverage .............................................................................................. 102
4.3.2 Street sweeping ............................................................................................................................... 104
4.3.3 Waste generation, Segregation, quantity and characteristics ...................................... 105
4.3.4 Secondary Collection ..................................................................................................................... 106
4.3.5 Transportation ................................................................................................................................. 107
4.3.6 Treatment & Disposal ................................................................................................................... 108
4.3.7 Institutional setup & Health of sanitary workers .............................................................. 108
4.3.8 Operation & Maintenance (O&M) ............................................................................................ 108
4.3.9 Service level benchmarking indicators ................................................................................. 109
4.3.10 Future demand and gap ............................................................................................................... 109
4.4 WATER SUPPLY ........................................................................................................................................ 111
4.4.1 Source of water ................................................................................................................................ 111
4.4.2 Existing transmission, distribution and storage capacities .......................................... 112
4.4.3 Service coverage ............................................................................................................................. 116
4.4.4 Standardized Service Level indicators ................................................................................... 119
4.4.5 Future demand and gap ............................................................................................................... 119
Chapter 5 ......................................................................................................................................................................... 121
Institutional capacity and finance ........................................................................................................................ 121
Chapter 6 ......................................................................................................................................................................... 127
Sanitation Situation w.r.t. National Ranking Parameters ........................................................................... 127
6.1 SANITATION SITUATION W.R.T. NATIONAL SANITATION RANKING PARAMETERS 127
Chapter 7 ......................................................................................................................................................................... 131
City-Wide Sanitation .................................................................................................................................................. 131
7.1. INTRODUCTION ........................................................................................................................................ 131
7.2. VISION AND CITY- WIDE SANITATION PLANNING ................................................................... 131
7.2.1 VISION STATEMENT ..................................................................................................................... 131
7.2.2 PRINCIPLES OF CSP ....................................................................................................................... 132
CITY SANITATION PLAN GULBARGA
ADMINISTRATIVE STAFF COLLEGE OF INDIA, HYDERABAD 5 | P a g e
7.2.3 ASSUMPTIONS, NORMS AND UNITS COSTS ........................................................................ 134
7.2.4 VARIOUS OCCURRENCE OF ISSUES VERSUS CONSEQUENCES IN GULBARGA .... 136
7.3. SUBSECTOR STRATEGIES ..................................................................................................................... 138
7.3.1 OPEN DEFECATION FREE STATUS BY ENSURING ACCESS TO ALL (INCLUDING
POOR AND SLUM DWELLERS AS WELL AS VISITING POPULATION). ........................................ 138
7.3.2 Excreta Disposal and Waste Water Management ............................................................. 155
7.3.3 Improvement of Integrated Solid Waste Management ................................................... 166
7.3.4 Improvement of STORM WATER MANAGEMENT IN GULBARGA .............................. 170
7.4. ENABLING AND SUSTAINING STRATEGIES .................................................................................. 171
7.4.1 Awareness raising, hygiene promotion and community participation. ................... 171
7.4.2 Financing Requirements & Mechanisms ............................................................................... 178
7.4.3 Institutional Arrangement and Responsibility ................................................................... 181
7.5. MONITORING AND EVALUATION ..................................................................................................... 185
7.5.1 Monitoring and Review ................................................................................................................ 185
7.5.2 Launching Reward scheme: ....................................................................................................... 186
7.5.3 Incentives and Disincentives by MC/NPS ............................................................................. 187
GLOSSARY .................................................................................................................................................................. 188
Annexure .................................................................................................................................................................... 191
ANNEXURE1: TECHNOLOGY OPTION IN URBAN SANITATION ......................................................... 191
ANNEXURE 2: GOOD PRACTICES ..................................................................................................................... 197
ANNEXURE 3: REVIEWED POLICIES, LEGAL AND ADMINISTRATIVE FRAMEWORK AND
PROGRAMMES ......................................................................................................................................................... 200
Annexure 4: Building Application Receipt ................................................................................................... 204
Annexure 5: CSTF constitution in gulbarga ................................................................................................. 205
Annexure 6: First CSTF Workshop Proceedings,Gulbarga .................................................................... 207
Annexure 8: Secondary Data Formats – Profiling of the ULBs ............................................................. 211
ANNEXURE 9: Primary data survey formats ............................................................................................... 225
LIST OF TABLES
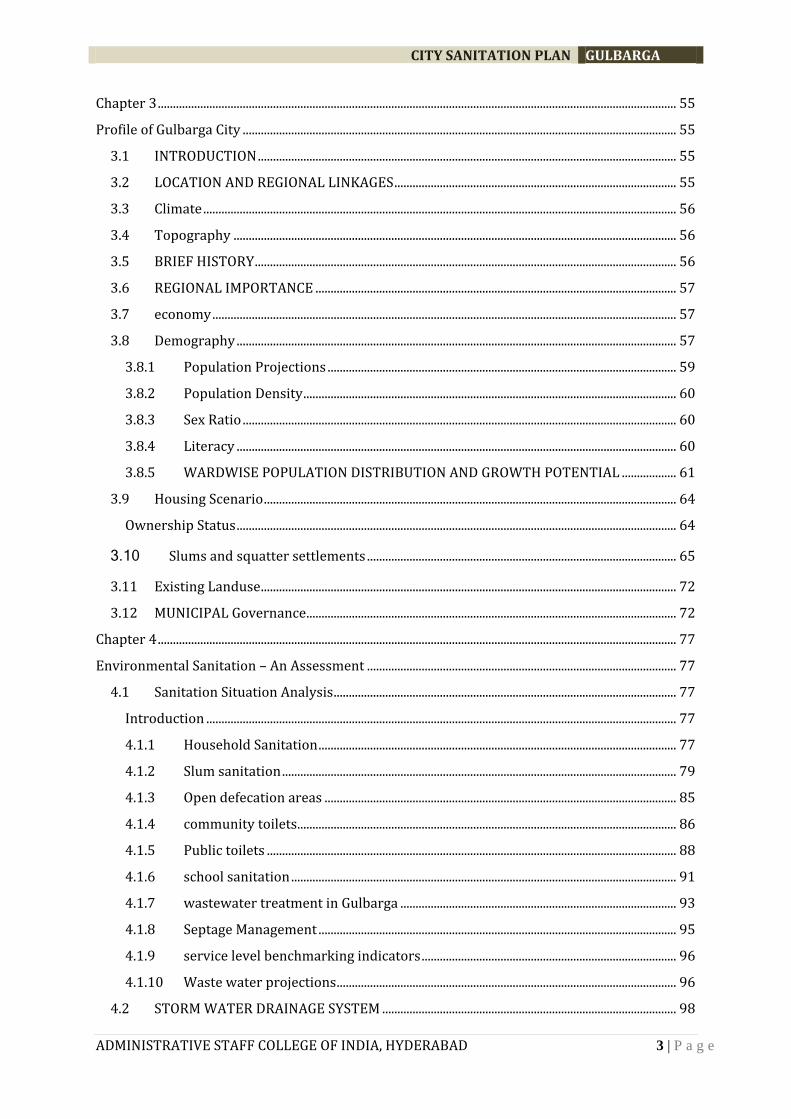
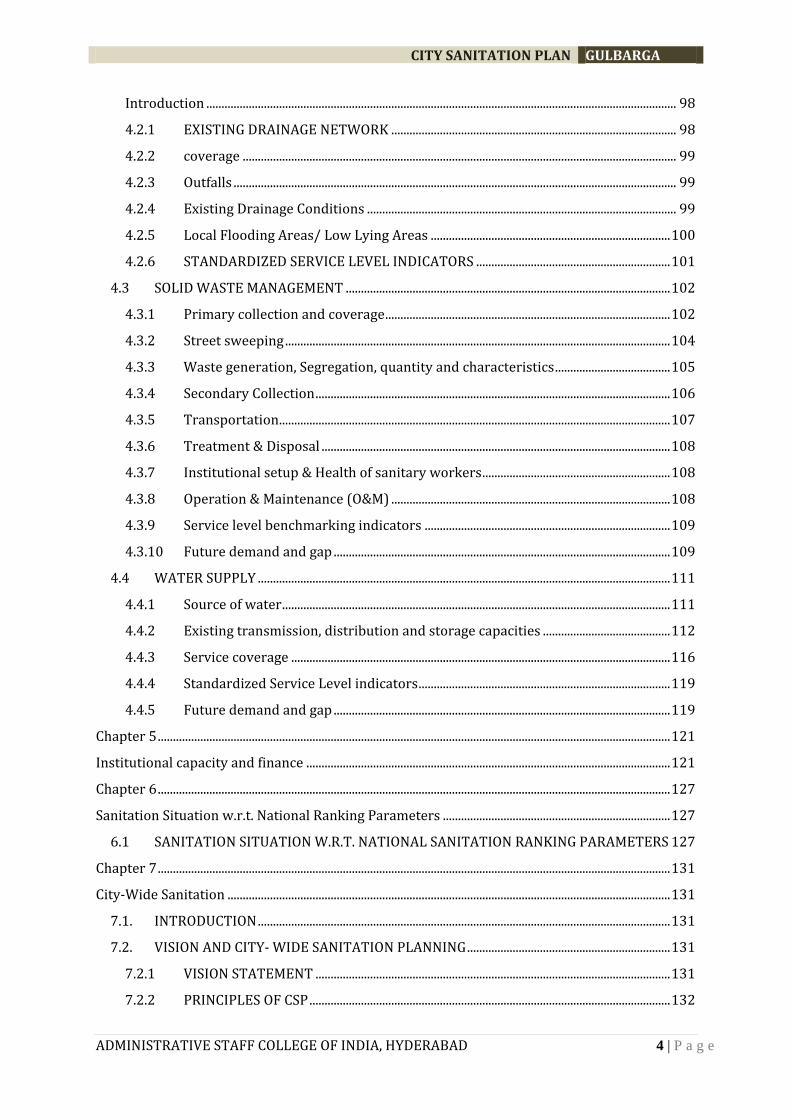
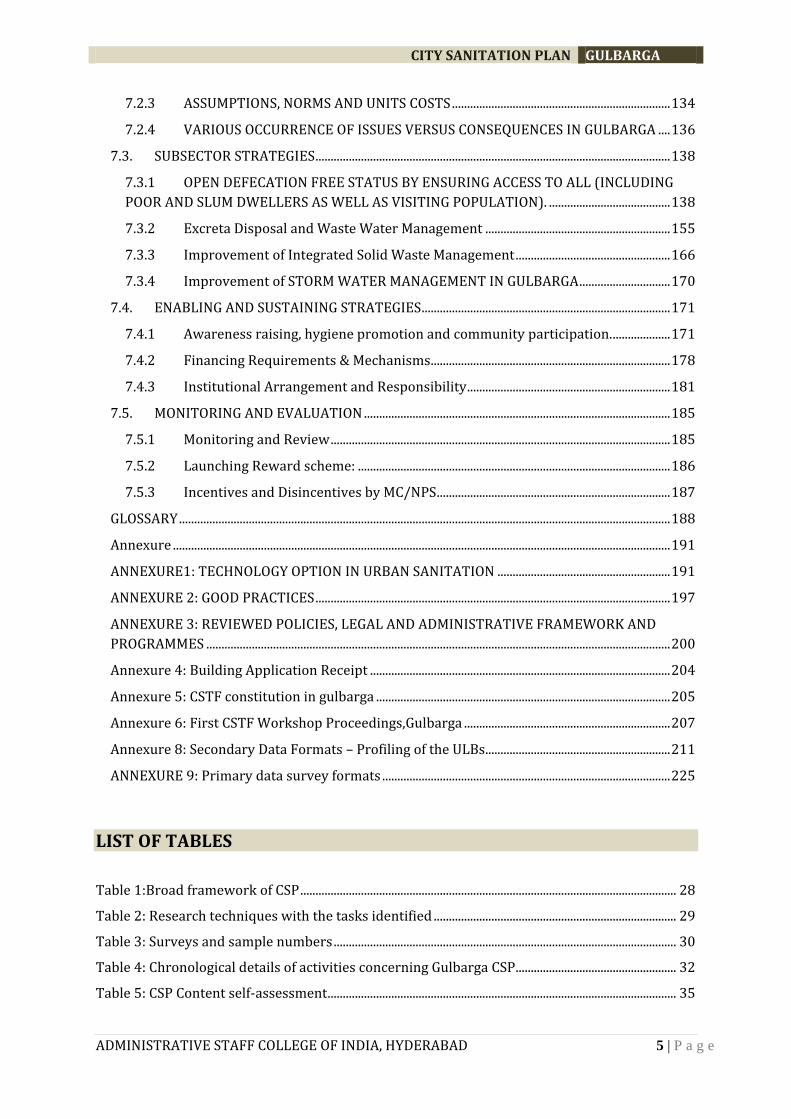
Table 1:Broad framework of CSP ............................................................................................................................ 28
Table 2: Research techniques with the tasks identified ................................................................................ 29
Table 3: Surveys and sample numbers ................................................................................................................. 30
Table 4: Chronological details of activities concerning Gulbarga CSP ..................................................... 32
Table 5: CSP Content self-assessment ................................................................................................................... 35
CITY SANITATION PLAN GULBARGA
ADMINISTRATIVE STAFF COLLEGE OF INDIA, HYDERABAD 6 | P a g e
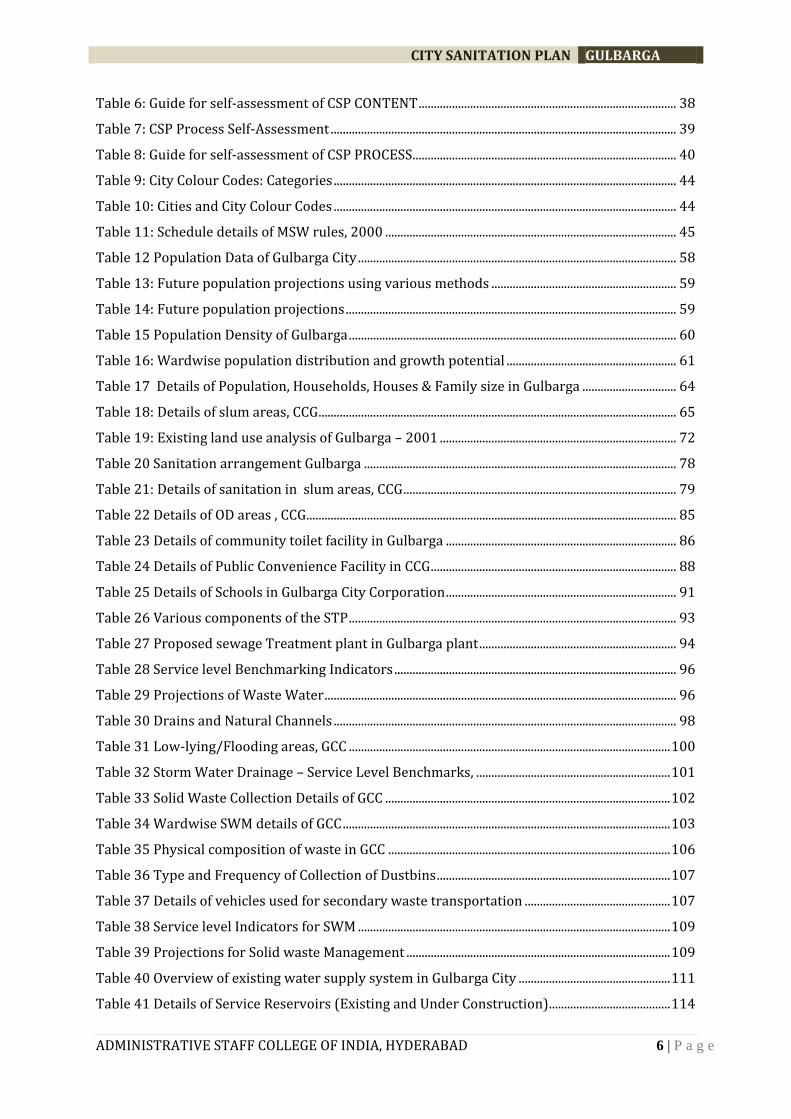
Table 6: Guide for self-assessment of CSP CONTENT ..................................................................................... 38
Table 7: CSP Process Self-Assessment .................................................................................................................. 39
Table 8: Guide for self-assessment of CSP PROCESS....................................................................................... 40
Table 9: City Colour Codes: Categories ................................................................................................................. 44
Table 10: Cities and City Colour Codes ................................................................................................................. 44
Table 11: Schedule details of MSW rules, 2000 ................................................................................................ 45
Table 12 Population Data of Gulbarga City ......................................................................................................... 58
Table 13: Future population projections using various methods ............................................................. 59
Table 14: Future population projections ............................................................................................................. 59
Table 15 Population Density of Gulbarga ............................................................................................................ 60
Table 16: Wardwise population distribution and growth potential ........................................................ 61
Table 17 Details of Population, Households, Houses & Family size in Gulbarga ............................... 64
Table 18: Details of slum areas, CCG ...................................................................................................................... 65
Table 19: Existing land use analysis of Gulbarga – 2001 .............................................................................. 72
Table 20 Sanitation arrangement Gulbarga ....................................................................................................... 78
Table 21: Details of sanitation in slum areas, CCG .......................................................................................... 79
Table 22 Details of OD areas , CCG .......................................................................................................................... 85
Table 23 Details of community toilet facility in Gulbarga ............................................................................ 86
Table 24 Details of Public Convenience Facility in CCG ................................................................................. 88
Table 25 Details of Schools in Gulbarga City Corporation ............................................................................ 91
Table 26 Various components of the STP ............................................................................................................ 93
Table 27 Proposed sewage Treatment plant in Gulbarga plant ................................................................. 94
Table 28 Service level Benchmarking Indicators ............................................................................................. 96
Table 29 Projections of Waste Water .................................................................................................................... 96
Table 30 Drains and Natural Channels ................................................................................................................. 98
Table 31 Low-lying/Flooding areas, GCC .......................................................................................................... 100
Table 32 Storm Water Drainage – Service Level Benchmarks, ................................................................ 101
Table 33 Solid Waste Collection Details of GCC .............................................................................................. 102
Table 34 Wardwise SWM details of GCC ............................................................................................................ 103
Table 35 Physical composition of waste in GCC ............................................................................................. 106
Table 36 Type and Frequency of Collection of Dustbins ............................................................................. 107
Table 37 Details of vehicles used for secondary waste transportation ................................................ 107
Table 38 Service level Indicators for SWM ....................................................................................................... 109
Table 39 Projections for Solid waste Management ....................................................................................... 109
Table 40 Overview of existing water supply system in Gulbarga City .................................................. 111
Table 41 Details of Service Reservoirs (Existing and Under Construction) ........................................ 114
CITY SANITATION PLAN GULBARGA
ADMINISTRATIVE STAFF COLLEGE OF INDIA, HYDERABAD 7 | P a g e
Table 42 Details of service reservoirs in GCC .................................................................................................. 114
Table 43 Zone-wise Distribution system ........................................................................................................... 115
Table 44 Water quality maintenance .................................................................................................................. 116
Table 45 Sharanabasaveshwar Tank Water, Gulbarga City water sample analysis ........................ 117
Table 46 water testing results for bore wells and open well water sources, samples collected on
27-08-2010 .................................................................................................................................................................... 117
Table 47 Details of Water Tariff for Gulbarga City ........................................................................................ 118
Table 48 Service Level Indicators for Water Supply ..................................................................................... 119
Table 49 Projection of water supply requirement ........................................................................................ 119
Table 50 Salient Features Of Gulbarga Demonstration Zone 24X7 Water Supply ........................... 120
Table 51 BUDGET SUMMARY STATEMENT FOR THE YEAR 2007-2008 ............................................. 121
Table 52 BUDGET SUMMARY STATEMENT FOR THE YEAR 2008-2009 ............................................. 122
Table 53 BUDGET SUMMARY STATEMENT FOR THE YEAR 2009-2010 ............................................. 124
Table 54 BUDGET SUMMARY STATEMENT FOR THE YEAR 2010-2011 ............................................. 125
Table 55: Sanitation Ranking for Gulbarga City Corporation.................................................................... 128
Table 56: Goals for City-wide Sanitation Planning, Gulbarga ................................................................... 131
Table 57: Components of City Wide Sanitation Strategies ......................................................................... 133
Table 58: Norms for Household Sanitation ...................................................................................................... 134
Table 59: Indicative figures in Household Sanitation Arrangements over CSP Implementation
Period ............................................................................................................................................................................... 139
Table 60: Estimation of Proposed Pay and Use complex (Each unit) .................................................... 141
Table 61 Indicative investment requirements, O&M Costs And User Charges For Public/
Community Sanitary Conveniences ..................................................................................................................... 143
Table 62 Priority wise details of wards for the determination of location of community toilets
............................................................................................................................................................................................. 146
Table 63: Addressing access to various categories of uses ....................................................................... 151
Table 64: Management Strategies ....................................................................................................................... 152
Table 65: Intended benefits for the six technology systems. ................................................................... 156
Table 66: Waste water treatment options for Non UGD areas ................................................................. 156
Table 67: Starters for UGD ....................................................................................................................................... 157
Table 68: Degree of Treatment Needed for Land Application .................................................................. 161
Table 69: Cost of Construction of the Wastewater Treatment system ................................................. 163
Table 70:Cost of Operation and Maintenance ................................................................................................. 164
Table 71: Land Requirement .................................................................................................................................. 164
Table 72: Projection of solid waste generation for future .......................................................................... 166
Table 73: ISWM Action Plan ................................................................................................................................... 167
CITY SANITATION PLAN GULBARGA
ADMINISTRATIVE STAFF COLLEGE OF INDIA, HYDERABAD 8 | P a g e
Table 74: IEC and Advocacy Plan for Environmental Sanitation ............................................................. 172
Table 75: Methods and implementation of awareness activities ............................................................ 174
Table 76: Phase wise distribution of works .................................................................................................... 176
Table 77 Financial Requirements and Mechanisms...................................................................................... 178
Table 77: Comparison of Standards (issued by CPCB) with effluent values ....................................... 186
Table 78:Recommended sizes of septic tanks ................................................................................................. 191
Table 79: Reviewed Policies, Legal and Administrative Framework and Programmes ................ 200
Table 80: Functions of ULB...................................................................................................................................... 201
LIST OF FIGURES
Figure 1 CSP Implementation Roadmap .............................................................................................................. 25
Figure 2 Process for CSP Data Assimilation ....................................................................................................... 30
Figure 3 Population growth trends, Gulbarga City .......................................................................................... 58
Figure 4 Type of House Ownership in Gulbarga ............................................................................................... 64
Figure 5 Organizational Structure .......................................................................................................................... 74
Figure 6 Percentage distribution of HHs w.r.t. type of toilets ..................................................................... 77
Figure 7: Percentage distribution of HHs w.r.t. type of toilets ................................................................... 79
Figure 8 Condition of public toilets, CCG ............................................................................................................. 89
Figure 9 Sanitation details in Schools of Gulbarga City Corporation ...................................................... 91
Figure 10 Water supply facilities in schools of GCC ........................................................................................ 92
Figure 11 Category wise waste generation & collection ............................................................................. 105
Figure 12 Category of waste generated in GCC ............................................................................................... 105
Figure 13 Budget Estimate of Revenue receipts & Payments ................................................................... 126
Figure 14 Budget Estimate of Capital receipts & Payments ...................................................................... 126
Figure 15: Components of CSP strategies .......................................................................................................... 137
Figure 16: Connecting to UGD – typical layout ................................................................................................ 158
Figure 17: Proposed institutional set-up for sanitation .............................................................................. 184
LIST OF MAPS Map 1 Location of Gulbarga city .............................................................................................................................. 55
Map 2 Regional linkages of Gulbarga .................................................................................................................... 55
Map 3 Showing the density range(persons/hectare),CCG ward wise ..................................................... 63
Map 4 Location map of slum & Non-slum areas ............................................................................................... 71
Map 5 Location map of identified open defecation ward ............................................................................. 85
CITY SANITATION PLAN GULBARGA
ADMINISTRATIVE STAFF COLLEGE OF INDIA, HYDERABAD 9 | P a g e
Map 6 Location of community & Public toilets ................................................................................................. 90
Map 7 Location map of water logging areas, CCG .......................................................................................... 100
Map 8: Proposed locations for new public toilets .......................................................................................... 145
Map 9 Probable spatial locations of community toilets .............................................................................. 148
CITY SANITATION PLAN GULBARGA
ADMINISTRATIVE STAFF COLLEGE OF INDIA, HYDERABAD 10 | P a g e
LIST OF INFORMATION BOXES Information Box 1: National Urban Sanitation Policy (Nusp) ..................................................................... 21
Information Box 2: Definitions Of Household Sanitation Arrangements According To Census
2001 .................................................................................................................................................................................... 78
Information Box 3: Guidelines Of Total Sanitation Campaign(Tsc) For School Sanitation............ 92
Information Box 4: Septic Tank Maintenance Norms .................................................................................... 95
Information Box 5: Sewerage And Sanitation – The Key Observations .................................................. 97
Information Box 6: Storm Water Drainage – The Key Observations ..................................................... 101
Information Box 7: Initiatives By The Governement For Swm ................................................................ 110
Information Box 8: Solid Waste Management– The Key Observations ................................................ 110
Information Box 9: Assumptions For City Sanitation Plan ......................................................................... 134
Information Box 10: Finance Options Models For Community Latrines .............................................. 148
Information Box 11: Proposed Scheme For Mechanical Aid For Cleaning Of Sewers And Septic
Tanks (Smacss) ............................................................................................................................................................. 179
Information Box 12: Tools To Measure 100% Sanitation Milestone Achievements ....................... 185
Information Box 13: The Condominial Sewerage System In Brazil ........................................................ 198
CITY SANITATION PLAN GULBARGA
ADMINISTRATIVE STAFF COLLEGE OF INDIA, HYDERABAD 11 | P a g e
ABBREVIATIONS
ASCI Administrative Staff College of India
BOD Biological Oxygen Demand
BOT Buy-Own-Operate
BPL Below Poverty Line
BSUP Basic Services to the Urban Poor
CAA Constitution Amendment Act
CD&MA Commissioner and Director of Municipal Administration
COD Chemical Oxygen Demand
CPHEEO Central Public Health and Environmental Engineering Organization
CSP City Sanitation Plan
CT Community Toilets
CTF City sanitation Task Force
DMA Directorate of Municipal Administration
DMHO District Medical Health Officer
DPR Detailed Project Report
ELSR Elevated Service Reservoir
FGD Focus Group Discussions
FY Financial Year
GIS Geographic Information System
GoK Government of Karnataka
GoI Government of India
HHs Households
HSC House Service Connections
IEC Information, Education, Communication
ILCS Integrated Low Cost Sanitation
JnNURM Jawaharlal Nehru National Urban Renewal Mission
MAUD Municipal Administration and Urban Development
MSL Mean Sea Level
MSW Municipal Solid Waste
GCC Gulbarga City Corporation
NRW Non Revenue Water
NUSP National Urban Sanitation Policy
ODF Open Defecation
O&M Operations and Maintenance
PHED Public Health and Engineering Department
PSP Public Stand Posts
RVM Rajiv Vidya Mission
RWA Residents Welfare Association
SI Sanitary Inspector
SLB Service Level Benchmarking
SJSRY Swarna Jayanti Shehri Rojgar Yojana
SSA Sarva Shiksha Abhiyan
SSHE School Sanitation and Hygiene Education
STP Sewage Treatment Plant
CITY SANITATION PLAN GULBARGA
ADMINISTRATIVE STAFF COLLEGE OF INDIA, HYDERABAD 12 | P a g e
SWM Solid Waste Management
ULB Urban Local Body
UGD Under Ground Drainage
WC Water Closet
Units of Measure
lpcd litres per capita per day
m metre
MLD Million Litres per Day
MT Metric Tons
sq.m square metre
TPD Tonnes per Day
CITY SANITATION PLAN GULBARGA
ADMINISTRATIVE STAFF COLLEGE OF INDIA, HYDERABAD 13 | P a g e
CITY SANITATION PLAN GULBARGA
ADMINISTRATIVE STAFF COLLEGE OF INDIA, HYDERABAD 14 | P a g e
EXECUTIVE SUMMARY
This document presents City Sanitation Plan (CSP) of Gulbarga City Corporation. Gulbarga is one
of the 8 cities whose CSPs have been prepared by ASCI in partnership with Directorate of
Municipal Administration (DMA), Government of Karnataka and City Managers’ Association,
Karnataka (CMAK)
The CSP process in Gulbarga endeavors to identify the various areas that are affected by various
issues with different sectors of sanitation, (viz. sewerage, solid waste management, storm water
drainage and water supply) and also to provide guidance towards the solutions of the said
issues.
This has been made possible through an extensive participatory approach including field visits,
repeated discussions with various stakeholders, sample surveys, etc. Acquiring and assimilation
of varied secondary information also formed an important part of the process.
The plan preparation process was carried out using methodology requiring wide range of data
in various areas and population groups, to develop robust analysis and produce outputs. The
data collection included both primary and secondary sources and detail analysis of them.
The analysis in turn has paved the way for the preparation of the proposal for various strategies
to alleviate the sanitary conditions of the place, so that Gulbarga may well overcome the various
plaguing issues and thereby a healthy sanitized environment prevails for the citizens.
The report has two major sections –
A. The Situational Analysis
B. The Sanitation Strategies.
The former section deals with depicting the city and its present status with regards to
sanitation. The aim is to highlight the existing conditions regarding access and coverage of
sanitary facilities, identify the gaps and striking issues, and understand the behavioral aspects of
various sections of the society. This section is covered from Chapter 1 to Chapter 5.
The latter section thereafter provides strategies and solutions to bridge the identified gaps,
mitigate the existing issues, and provide ways and means to aid the sustenance of the existing
and proposed strategies and projects. There have been presented in Chapter 6.
A. The Situational Analysis
Chapter 1 gives an introduction to the CSP process, its background, and the objectives behind it.
This is followed by the step-by-step methodology of the CSP process, as well as the status of the
CSP for the particular city. The process of collection of baseline information – both primary and
secondary, has been explained at length. The chapter also presents a review of the policies &
programmes that are prevalent and followed in the state to improve the sanitation conditions in
the urban areas. It gives detailed insight into the NUSP and the sanitation ranking of cities, the
MSW 2000 rules, the ILCS projects, and other such projects which have been taken up for the
improvement of access and coverage of sanitary facilities.
CITY SANITATION PLAN GULBARGA
ADMINISTRATIVE STAFF COLLEGE OF INDIA, HYDERABAD 15 | P a g e
Chapter 2 deals with the City Profile where the various aspects of the city are discussed in
order to get a fair idea about the city itself. Aspects such as location, regional linkages,
demography, economic, landuse and housing profiles, the urban governance, the slums and
squatter settlements are discussed in brief.
Chapter 3 forms the central focus of Section A – i.e. The Situational Analysis. The aim of the
chapter is to present a clear picture of the existing systems of sanitation in the city. It contains
four sectors – Sewerage and sanitation, Storm water system, Solid waste Management and the
Water supply system of the city. Within each sector, the gaps and issues in access and coverage
are identified, the problem areas are clearly demarcated, the performance of each of the sectors
is evaluated through Service Level Benchmarking (SLB) indicators, and projections are also
made for the future years.
Chapter 4 aims to evaluate the institutional capacity and the financial structure, to find out if
the ULB along with the associated organizations is able to cater to the sanitation needs of the
society, with regards to both adequate qualified personnel and adequate financial sources.
Chapter 5 presents the evaluation of the sanitation condition of Gulbarga City Corporation on
the basis of the indicators and the scoring methodology used by MoUD for the sanitation
ranking of cities.
B. The Sanitation Strategies
The strategies are presented in Chapter 6. It provides the vision for the CSP and its goals, and
the basic guiding principles on which the strategies are based. Thereafter, strategies have been
provided to improve coverage and access to sanitation facilities, to implement effectively the
various proposals, and options and mechanisms for effectively financing the strategies and
proposals along with proper phasing.
CITY SANITATION PLAN GULBARGA
ADMINISTRATIVE STAFF COLLEGE OF INDIA, HYDERABAD 16 | P a g e
ACKNOWLEDGEMENTS
“Water is Life and Sanitation is Dignity.”
The above quote well impresses upon one the fact that sanitation is the most important aspect
for a healthy and dignified living.
Often sanitation is considered to be synonymous to solid waste management, especially in the
ULBs. To set right this flawed concept, sanitation ideally can be defined as safe management of
human excreta, including its safe confinement treatment, disposal and associated hygiene-
related practices. With increasing urbanization sanitation is becoming a severe problem in all
cities in our country.
Hence there arises a need for integrated solutions to take account of the various elements of
environmental sanitation, fecal management and disposal, solid waste management; generation
of industrial and other specialized / hazardous wastes; drainage; as also the management of
drinking water supply. This is the main aim and purpose behind the preparation of City
Sanitation Plans.
We take an opportunity to express our sincere gratitude to all the people who have helped and
supported us throughout the process which made the completion of the report possible.
Extensive and rigorous discussions with the APMDP and the ULB officials gave a well formed
shape to the effort. Hence, their help and co-operation is very much solicited for the success of
the CSP.
The City Sanitation Plan for the city of Gulbarga looks forward to develop effective strategies for
safe disposal of solid and liquid waste generating throughout the city by suggesting
environment friendly low cost technical options for the same.
Prof. Srinivasa Chary Vedala
Dean & Director
Centre for Energy, Environment,Urban Governance & Infrastructure Development
(CEEUG&ID),
Administrative Staff College of India (ASCI)
CITY SANITATION PLAN GULBARGA
ADMINISTRATIVE STAFF COLLEGE OF INDIA, HYDERABAD 17 | P a g e
CSTF MEMBERS
The City Sanitation Task Force (CSTF) plays a very important part in the formulation and
implementation of the CSP in a city. The importance of CSTF and their functions were clearly
portrayed to the authorities at DMA, CMAK and the officials from various ULBs at the State Level
Launch Workshop on 25th November, 2010. Based on the discussions from the workshop, the
ULBs formed the CSTF for their respective cities. The list of CSTF members went through quite a
number of revisions. The final list of CSTF members for Gulbarga is as follows.
CITY SANITATION PLAN GULBARGA
ADMINISTRATIVE STAFF COLLEGE OF INDIA, HYDERABAD 18 | P a g e
FOREWORD (by CSTF Chairperson)
CITY SANITATION PLAN GULBARGA
ADMINISTRATIVE STAFF COLLEGE OF INDIA, HYDERABAD 19 | P a g e
ASCI TEAM MEMBERS
The team which has put forth dedicated efforts towards the completion of this CSP report,
consists of the following people.
Prof. Srinivasa Chary Vedala, Dean and Director, Centre for Energy, Environment, Urban
Governance & Infrastructure Development
Mrs. Vasavi Narla, Assistant Professor
Mr. Anil Kumar Palakodeti, Senior Research Associate
Ms. Lakshmy Poorna, Senior Research Associate
Ms. Krithika Sridharan, Senior Research Associate
Ms. Sneha Mala Kesiraju, Senior Research Associate
Ms. Uzra Sultana, Senior Research Associate
CITY SANITATION PLAN GULBARGA
ADMINISTRATIVE STAFF COLLEGE OF INDIA, HYDERABAD 20 | P a g e
Chapter 1
Introduction
1.1 BACKGROUND The National Urban sanitation Policy launched during 2008 envisages “All Indian cities and
towns become totally sanitized, healthy and liveable and ensure and sustain good public health
and environmental outcomes for all their citizens with a special focus on hygienic and
affordable sanitation facilities for the urban poor and women.”
The overall goal of National policy is to transform Urban India into community-driven, totally
sanitized, healthy and liveable cities and towns. Specific goals include:
A. Awareness Generation and Behaviour Change,
B. Open Defecation Free Cities,
C. Integrated City-Wide Sanitation,
D. Sanitary and Safe Disposal, and
E. Proper Operation & Maintenance of all Sanitary Installations.
Against this background, and in recognition of its importance to national and state development,
the Integrated City-Wide Sanitation Plan for Gulbarga City is prepared to provide city-wide
systematic approach and framework to achieve the goals contemplated under NUSP.
1.2 OBJECTIVES OF CITY-WIDE SANITATION PLAN
The City Sanitation Plan (CSP) is aimed at developing and maintaining a clean, safe and pleasant
physical environment in Gulbarga city to promote social, economic and physical well-being of all
sections of the population. It encompasses plan of action for achieving 100% sanitation in the
city of Gulbarga through demand generation and awareness campaign, sustainable technology
selection, construction and maintenance of sanitary infrastructure, provision of services, O&M
issues, institutional roles and responsibilities, public education, community and individual
action, regulation and legislation.
The principal components of city-wide approach include:
(a) Collection and sanitary disposal of wastes, including solid wastes, liquid wastes, excreta,
industrial wastes, clinical and other hazardous wastes;
(b) Storm water drainage;
(c) Cleansing of thoroughfares, markets and other public spaces;
(d) Environmental sanitation education;
(e) Inspection and enforcement of sanitary regulations;
(f) Monitoring the observance of environmental standards.
CITY SANITATION PLAN GULBARGA
ADMINISTRATIVE STAFF COLLEGE OF INDIA, HYDERABAD 21 | P a g e
INFORMATION BOX 1: NATIONAL URBAN SANITATION POLICY (NUSP)
The Vision of the NUSP is:
All Indian cities and towns become totally sanitized, healthy and livable; and ensure and sustain
good public health and environmental outcomes for all their citizens with a special focus on
hygienic and affordable sanitation facilities for the urban poor and women.
To transform Urban India into community-driven, totally sanitized, healthy and livable cities
and towns, the policy sets out the following goals:
A AWARENESS GENERATION AND BEHAVIOUR CHANGE
B OPEN DEFECATION FREE CITIES
C INTEGRATED CITY-WIDE SANITATION
1. Re-orienting Institutions and Mainstreaming Sanitation
2. Sanitary and safe disposal: 100% of human excreta and liquid wastes must be disposed of
safely
3. Proper Operations and maintenance (O&M) of all sanitary installations
The policy envisages the preparation of State Sanitation Strategies within the overall National
Policy framework. In turn, cities are expected to prepare their city-wide sanitation plans that
need to be prepared in a consultative and participatory manner, and using an incremental
approach to addressing the issue of sanitation in a comprehensive city-wide manner.
Source: NUSP, 2008.
1.3 CONTEXT Karnataka has been declared as third most urbanized state in India due to rapid economic
growth and urban population increase witnessed in the last two decades. As per 2001 census,
34% of the state population lives in urban areas. Urban Local Bodies are responsible to maintain
water and sanitation services, once the infrastructure is created and handed over by Karnataka
Urban Water Supply and Drainage Board (KUWS&DB). In the state, 36 ULBs are provided with
partial underground drainage facilities, covering 24% of the urban population. Others rely on
soak pits, septic tanks and community latrines. In few ULBs, low cost sanitation technology like
DEWATS, eco-sanitation etc. is being explored as pilot project.
As per 2001 census, only 25% of urban households do not have access to toilets while the
remaining 75% of households have accessibility to various types of latrines. About 42 and 39
percent of households have access to closed and open drainage system respectively.
The state needs to renew its focus towards this problem and hence there is dire need for proper
planning, management and execution of sanitation related activities at ULB levels with the
active involvement of stakeholders. In view of the different institutional structure and different
sets of issues involved in the delivery of the services in urban areas, the need for a separate
policy statement for sanitation sector is felt.
CITY SANITATION PLAN GULBARGA
ADMINISTRATIVE STAFF COLLEGE OF INDIA, HYDERABAD 22 | P a g e
In spite of various programmes implemented by the State Government and the Urban Local
Bodies (ULBs) the problem of urban sanitation has not been resolved yet. Therefore, the State
Government, as a decisive step to resolve the problems pertaining to Urban Sanitation, has
initiated the Karnataka State Urban Sanitation Policy (KSUSP) and City Sanitation Plans in
consonance with the NUSP. CSPs are envisaged to be prepared in a consultative manner for
enhancing ownership among stakeholders in the city. The cities selected for the aforesaid
purpose are as follows:
Bellary
Belgaum
GULBARGA
Hubli-Dharwad
Mangalore
Mysore
Shimoga
Tumkur
Most of these towns also embarked on implementing Under Ground Drainage (UGD) system
with huge capital investments while accessing projects under different schemes. At this juncture
GoK felt the need to review sanitation situation, problems and opportunities to improve
sanitation in these cities/ towns particularly and in the state. This will mandate and guide State
and all ULBs to plan for delivering sanitary outcomes.
CITY SANITATION PLAN GULBARGA
ADMINISTRATIVE STAFF COLLEGE OF INDIA, HYDERABAD 23 | P a g e
1.4 CITY SANITATION PLANNING IN GULBARGA
CSP tries to detail out how the city plan is to deliver the sanitary outcomes defined in NUSP and
state strategy, in coordination with other line departments to ensure a well collaborated
approach engaging all stakeholders including governmental and nongovernmental service
providers. The scope of CSPs broadly encompass following major tasks:
A. COLLECTION OF SECONDARY DATA
Secondary data collection and review of available data from various sources as per demands of
City Sanitation Plan (the officials of City Municipal Corporations, Water Boards, or any other
parastatal agencies).
B. PREPARATORY WORK (PROFILING OF ULB AND PREPARING CITY REPORT)
As a preparatory work, a preliminary profiling of ULBs (Refer Annexure 5) will be undertaken
using SLB indicators and City Ratings to highlight the open defecation free (ODF) status,
sanitation situation, health indicators and current projects. This will also guide further
investigation through field visits and primary data collection.
C. STAKEHOLDER ANALYSIS AND CITY SANITATION TASK FORCE (CSTF)
CONSTITUTION
As per the requirement of CSP, major role is to be played by the members of institutions,
organizations, individuals, NGOs, academics, journals, local councilors, industry owners,
consultants, representatives of private sector, etc. Constitution of CSTF was facilitated by
drawing members from these groups in consensus with ULBs who will be constantly
supporting the CSP preparation by analyzing the strengths and competencies required to
overcome the current situation and for better sanitation facilities. Refer Annexure 4 and 4.a for
more information on CSTF and the workshop.
D. PRIMARY DATA COLLECTION AND SAMPLING
Data collection to a limited extent through rapid field surveys, case studies, consultations,
transacts walks, FGDs, etc. to validate and supplement the secondary data(obtained in step 4.1)
The data will be collected as per formats/templates and questionnaires after brief orientation
to the stakeholders. Random stratified sampling in typical cases (slums, schools, wards
commercial places, public latrines, surface drains, solid waste arrangements, industries, health
and educational Institutions etc.) evenly distributed all over the town to cover all
representative types of situations.
E. REVIEW/STUDY OF THE CURRENT PRACTICES
This includes a review of sector strategies in water , sanitation and solid waste management at
state and city level. DPRs prepared on these sectors will be studied in detail and analysed. Also
regional and state urban strategies to know the dynamics of urbanisation pattern will be
looked in to.
F. CONDITION ASSESSMENT
Choices of toilet in the city and their effectiveness along with pictures on super structure,
below ground, design models and materials used for different uses like residential, industries,
public spaces and new areas. Field tests facilitation (soil percolation, waste water effluents,
CITY SANITATION PLAN GULBARGA
ADMINISTRATIVE STAFF COLLEGE OF INDIA, HYDERABAD 24 | P a g e
water bodies’ contamination) in critical points in drains, ground water after a reconnaissance
survey which would also assist in gauging the situation where the information is not adequate.
G. WARD PROFILING AS PER CITY SANITATION RANKING PARAMETERS
City as a number of spatial units will look at indicators pertaining to the practice of open
defecation, access to sanitation (individual, community and public), collection, treatment and
disposal of solid and liquid wastes, proper upkeep and maintenance of the sanitation
infrastructure, clear institutional roles and responsibilities and improvements in health and
environment as per the “City Sanitation Rating”.
H. COMMUNICATION GAP AND NEEDS ASSESSMENT
IEC needs assessment will be carried out and broad communication strategy will be developed
in consultation with the ULB officials and other stakeholders.
I. DEVELOPING A SITUATION ANALYSIS REPORT
The situation analysis, prepared by taking into consideration the ground realities, local
conditions, and assessment of the present sanitation situation. It will include inputs from all
the above activities with the details of existing household sanitation arrangements, public
sanitary conveniences, wastewater disposal, solid waste management and water supply. The
report will also include an analysis of the ULB legal framework and byelaws, financial analysis
of the ULB, data on key public and environmental health, user charges, willingness to pay, etc.
J. FORMULATION OF VISION
This involves understanding the major aspirations with respect to urban development in the
State through consultations and building an overarching vision that may be appropriate to the
articulations. This involves following;
Secondary information, data analysis and report review
Brainstorming with key stakeholders and focus groups
Understanding visions of concerned sectors and other constituents e.g., cities and
development agencies and concerned authorities.
K. DEVELOPMENT OF STRATEGY
This involves understanding the major issues of the sector, major priorities laid down and an
assessment of how the current arrangements are working with respect to urban development
in the city. Also, the key strengths, major weaknesses, potential opportunities as well as likely
threats would also be analysed to move towards the identification of the action
areas/intervention areas that form the strategy development. This involves:
Completion of information analysis, even with quick estimates, and review of
current policies and priorities
Consultations with key stakeholders/ focus groups concerning
Detailed discussion with departments/ agencies/ cities/ authorities
L. PREPARATION OF DRAFT CSP
Finalization of CSP along with recommendations based on the situation and solutions for
making city open defecation free and totally sanitized, public toilet and community toilets
models and operational models; proto - type design recommendation for all typical situations,
waste disposal mechanisms, starters for sewerage layouts and estimation of requirement in
terms of capacities, quantity and finances.
CITY SANITATION PLAN GULBARGA
ADMINISTRATIVE STAFF COLLEGE OF INDIA, HYDERABAD 25 | P a g e
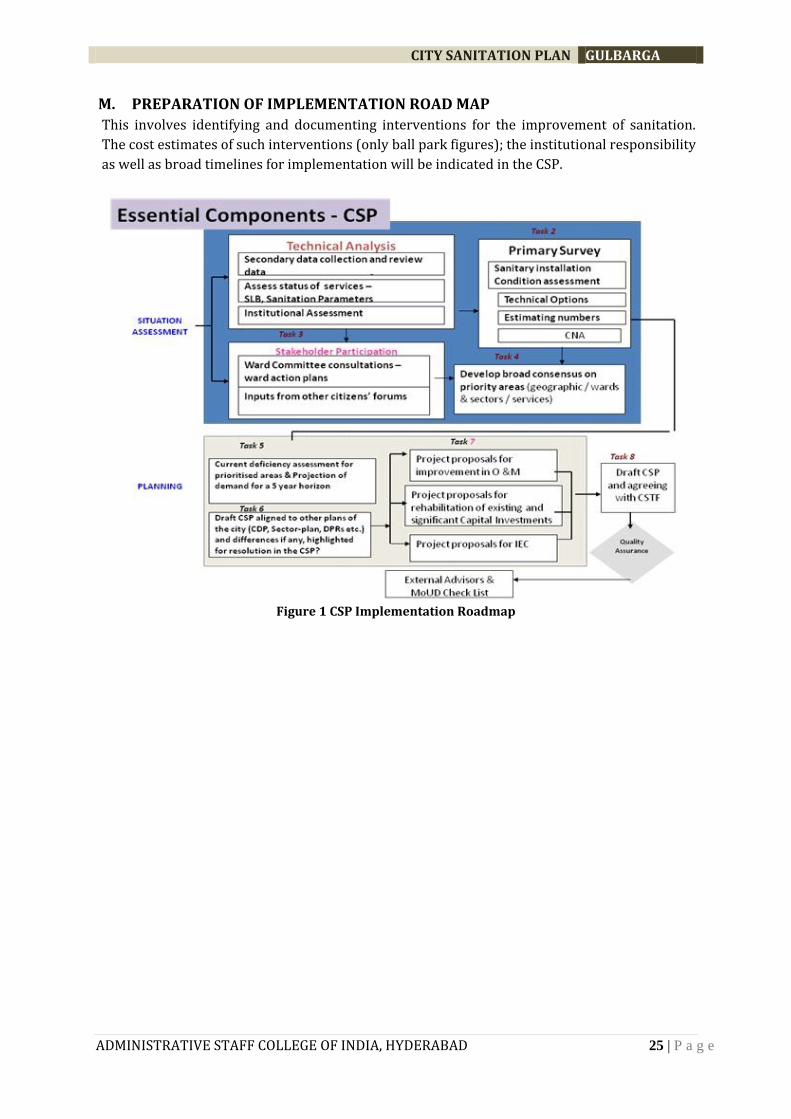
M. PREPARATION OF IMPLEMENTATION ROAD MAP
This involves identifying and documenting interventions for the improvement of sanitation.
The cost estimates of such interventions (only ball park figures); the institutional responsibility
as well as broad timelines for implementation will be indicated in the CSP.
Figure 1 CSP Implementation Roadmap
CITY SANITATION PLAN GULBARGA
ADMINISTRATIVE STAFF COLLEGE OF INDIA, HYDERABAD 26 | P a g e
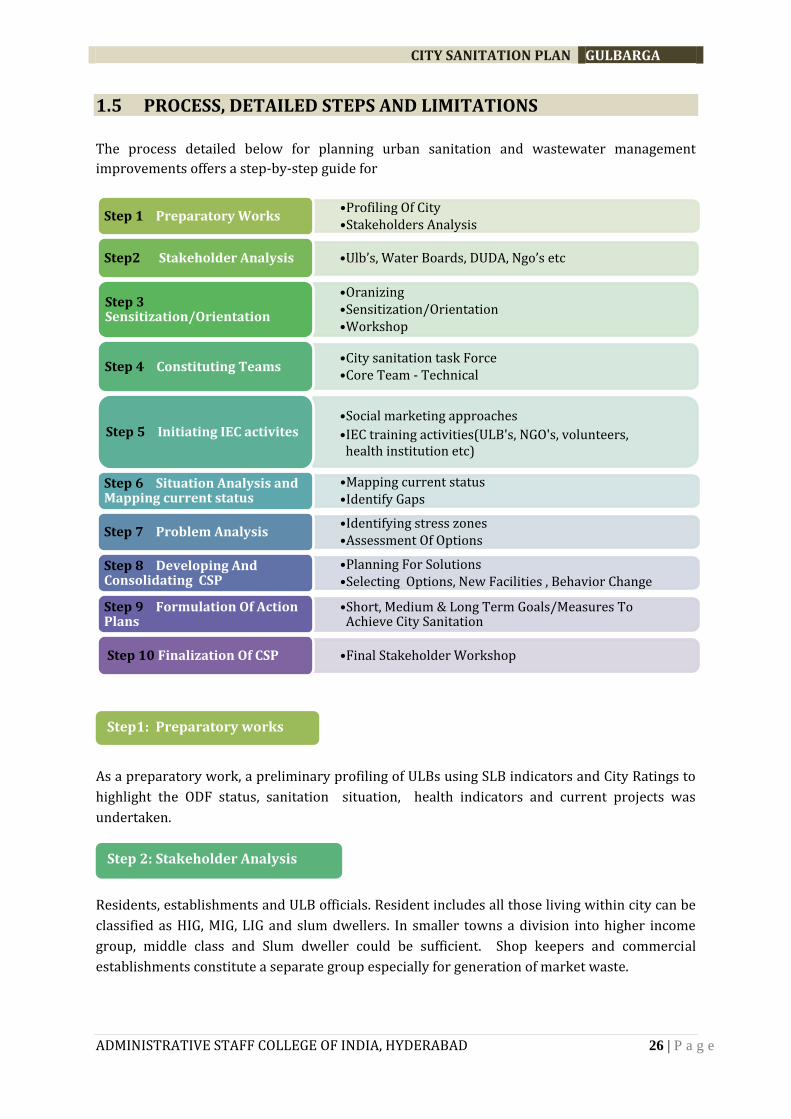
1.5 PROCESS, DETAILED STEPS AND LIMITATIONS
The process detailed below for planning urban sanitation and wastewater management
improvements offers a step-by-step guide for
As a preparatory work, a preliminary profiling of ULBs using SLB indicators and City Ratings to
highlight the ODF status, sanitation situation, health indicators and current projects was
undertaken.
Residents, establishments and ULB officials. Resident includes all those living within city can be
classified as HIG, MIG, LIG and slum dwellers. In smaller towns a division into higher income
group, middle class and Slum dweller could be sufficient. Shop keepers and commercial
establishments constitute a separate group especially for generation of market waste.
Step1: Preparatory works
Step 2: Stakeholder Analysis
•Profiling Of City •Stakeholders Analysis
Step 1 Preparatory Works
•Ulb’s, Water Boards, DUDA, Ngo’s etc Step2 Stakeholder Analysis
•Oranizing •Sensitization/Orientation •Workshop
Step 3 Sensitization/Orientation
•City sanitation task Force •Core Team - Technical
Step 4 Constituting Teams
•Social marketing approaches
•IEC training activities(ULB's, NGO's, volunteers, health institution etc)
Step 5 Initiating IEC activites
•Mapping current status •Identify Gaps
Step 6 Situation Analysis and Mapping current status
•Identifying stress zones •Assessment Of Options
Step 7 Problem Analysis
•Planning For Solutions •Selecting Options, New Facilities , Behavior Change
Step 8 Developing And Consolidating CSP
•Short, Medium & Long Term Goals/Measures To Achieve City Sanitation
Step 9 Formulation Of Action Plans
•Final Stakeholder Workshop Step 10 Finalization Of CSP
CITY SANITATION PLAN GULBARGA
ADMINISTRATIVE STAFF COLLEGE OF INDIA, HYDERABAD 27 | P a g e
Opinion leaders to be targeted as a high influence group both for FGDs and implementation of
Communications strategies.
Key officials-Commissioners, sanitation inspectors, medical/health officers,
Councilors, Community elders,
City media: newspapers reporters,
RWA office bearers,
NGOs,
Safaikaramcharies union office bearers,
Heads of Commercial establishments and shopkeepers, including public places such as bus
stands
Slum residents
Residents from neighborhoods
School teachers, employees
School children
2. Parameters: three key parameters
Environmental Sanitation SWM: market waste, domestic waste, waste segregation at
source and at collection point, waste disposal measures
ODF: public toilets, individual latrines, toilet maintenance, disposal of human waste,
UGS: awareness, user charges,
Issues on these parameters as explored in primary data will create a basis for topics to
be raised in FDGs
With this background knowledge, a City level orientation workshop at city level involving
identified stakeholders was organised. Ms. Uzra Sultana represented the team from ASCI. It was
attended by the Commissioner, other ULB officials from other departments, and the various
concerned stakeholders. The purpose of the workshop was to highlight the need to engage with
issues relating to access and arrangement especially in slums; awareness generation for
changed behaviour and practices; community participation and mobilization to accord
sanitation priority at all levels from policy to action on ground; and a number of technical,
institutional and financial issues to be addressed in CSP and its various steps of preparation.
a. City sanitation Task Force (CTF)
The first step in making the cities 100% sanitized is to elevate the consciousness about
sanitation in the mind of municipal agencies, government agencies and most importantly,
amongst the people of the city. For this purpose, CSTF has to be constituted in the ULB and it has
Step 3: Sensitization / Orientation Workshop
Step 4: Constituting: City Sanitation Task Force
Core Team – Technical
CITY SANITATION PLAN GULBARGA
ADMINISTRATIVE STAFF COLLEGE OF INDIA, HYDERABAD 28 | P a g e
to organize a multi-stakeholder, multi-party meeting in the preparatory stage, and take a formal
resolution to make the city 100% sanitized. CSTF has been constituted in Gulbarga City
Corporation.
The roles and responsibilities of CSTF include:
• Launching the City 100% Sanitation Campaign
• Generating awareness
• Approving materials and progress reports
• Approving the City Sanitation Plan
• Providing overall guidance
• Fixing of responsibilities on a permanent basis.
The objective of well driven IEC has to be demand-driven with social marketing approaches to
increase demand for toilets and ensure hygiene behaviours, promote no subsidies for household
toilets in future and encourage diversity in technology and design. For this purpose ULBs may
utilise suitable player for inter-personal IEC and training from the existing system like; ward
development committees, health institutions, schools, National Service Scheme (NSC)
Volunteers, the private sector (retailers, contractors, suppliers, plumbers, masons),
neighbourhood committees and NGOs, Angan Wadi workers.
The Situation Analysis, prepared by taking into consideration the ground realities, local
conditions, and assessment of the present sanitation situation has been undertaken and broad
framework is indicated below:
Table 1:Broad framework of CSP
Sectors Spatial units Finances Institutional
Service levels and
benchmarks for:
Solid Waste Management
Water Supply Storm Water Drainage
Health Situation –
Statistics and Anecdotal
Comment
Environmental Situation
– Local and Downstream
and Groundwater.
Household Sanitation Slums Public Sanitary
Conveniences School Sanitation Institutional
Sanitation Map spatially
Any town specific areas.
Cost Recovery–Policy–Tariffs–Collections–
Budget Transfers.
PPPs. Study of current
programmes (SJSRY, ILCS, etc
Institutional Arrangement – Policies, Plans, implementation, management.
Staffing, Organization &
Competence
Step 5: Initiating IEC activities
Step 6: Situation Analysis and Mapping Current Status
CITY SANITATION PLAN GULBARGA
ADMINISTRATIVE STAFF COLLEGE OF INDIA, HYDERABAD 29 | P a g e
Tools Used: Data Templates, Survey Formats, Transect Walks along with schedules of
interviews (Slums, industrial areas, water bodies), FGDs (3-4 nos), Technical Analysis,
Impact, Indicators, Stakeholder Consultations at city level ( 2-3) etc.
Table 2: Research techniques with the tasks identified
Number Tasks Research Tools
1
To assess the current social and
environmental issues in Urban
Gulbarga
Literature review Baseline survey Case studies Consultations/FGDs
2
To assess the policies, acts,
operational procedures to address,
mitigate and manage the social and
environmental issues in sanitation.
Literature review Survey FGDs Case studies Discussions Stakeholder consultations
3
To assess the people’s perception on
sanitation, its maintenance and
investment (Analysis of data)
Literature review Secondary information review Case studies Analysis of Rapid survey data FGDs Stakeholder Consultations
4
To assess and recommend on the
existing institutional arrangements
in the urban sector in managing and
mitigating social and environmental
issues.
Literature review Stakeholder Consultations FGDs Survey data analysis
5
To evolve a social and
environmental framework to
mitigate adverse/negative impacts.
Literature review Stakeholder consultations
CITY SANITATION PLAN GULBARGA
ADMINISTRATIVE STAFF COLLEGE OF INDIA, HYDERABAD 30 | P a g e
Process followed for data assimilation:
Figure 2 Process for CSP Data Assimilation
Sample survey results for the basic services
Purpose: The objective of conducting the sample field survey was to assess the services at the
customer level / field level and validate the information given by the officials.
Methodology: A total of 2389 samples were taken across the different parts of the city to
validate the information. The distribution of the samples is given in the table as follows.
Areas covered: The survey took spatially from all parts of the city, but the main focus was
given to the following areas.
Table 3: Surveys and sample numbers
Sl.
No.
Type of surveys Sample nos.
1 HH surveys 2389(Non-slums: 690,
Slums:1674,
2 Community toilets 20
3 Public toilets 10
4 Commercial places 10
5 Schools 50
6 Institutions 3
CITY SANITATION PLAN GULBARGA
ADMINISTRATIVE STAFF COLLEGE OF INDIA, HYDERABAD 31 | P a g e
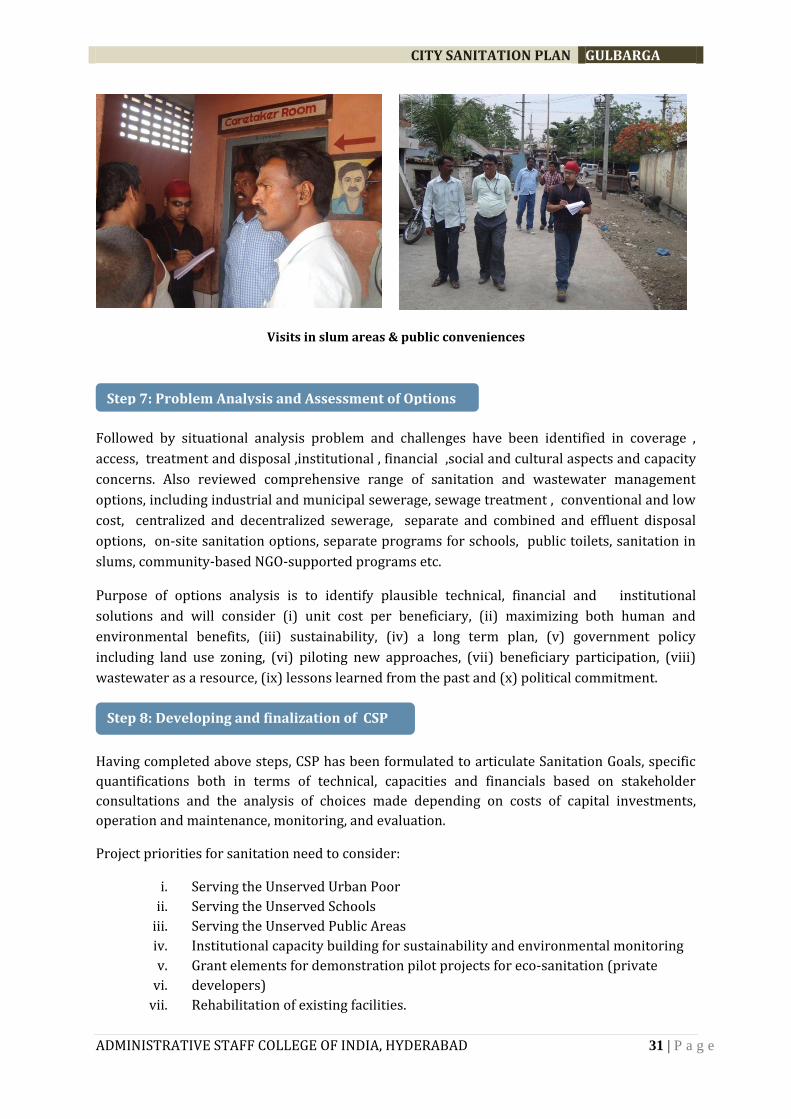
Visits in slum areas & public conveniences
Followed by situational analysis problem and challenges have been identified in coverage ,
access, treatment and disposal ,institutional , financial ,social and cultural aspects and capacity
concerns. Also reviewed comprehensive range of sanitation and wastewater management
options, including industrial and municipal sewerage, sewage treatment , conventional and low
cost, centralized and decentralized sewerage, separate and combined and effluent disposal
options, on-site sanitation options, separate programs for schools, public toilets, sanitation in
slums, community-based NGO-supported programs etc.
Purpose of options analysis is to identify plausible technical, financial and institutional
solutions and will consider (i) unit cost per beneficiary, (ii) maximizing both human and
environmental benefits, (iii) sustainability, (iv) a long term plan, (v) government policy
including land use zoning, (vi) piloting new approaches, (vii) beneficiary participation, (viii)
wastewater as a resource, (ix) lessons learned from the past and (x) political commitment.
Having completed above steps, CSP has been formulated to articulate Sanitation Goals, specific
quantifications both in terms of technical, capacities and financials based on stakeholder
consultations and the analysis of choices made depending on costs of capital investments,
operation and maintenance, monitoring, and evaluation.
Project priorities for sanitation need to consider:
i. Serving the Unserved Urban Poor
ii. Serving the Unserved Schools
iii. Serving the Unserved Public Areas
iv. Institutional capacity building for sustainability and environmental monitoring
v. Grant elements for demonstration pilot projects for eco-sanitation (private
vi. developers)
vii. Rehabilitation of existing facilities.
Step 7: Problem Analysis and Assessment of Options
Step 8: Developing and finalization of CSP
CITY SANITATION PLAN GULBARGA
ADMINISTRATIVE STAFF COLLEGE OF INDIA, HYDERABAD 32 | P a g e
viii. Improvement of existing sanitation (septic tank sludge and effluent treatment).
ix. Extension of existing sewerage and sewage treatment (as a last priority).
ACTIVITY UPDATE ON GULBARGA CSP
Table 4: Chronological details of activities concerning Gulbarga CSP
Progress made Activity
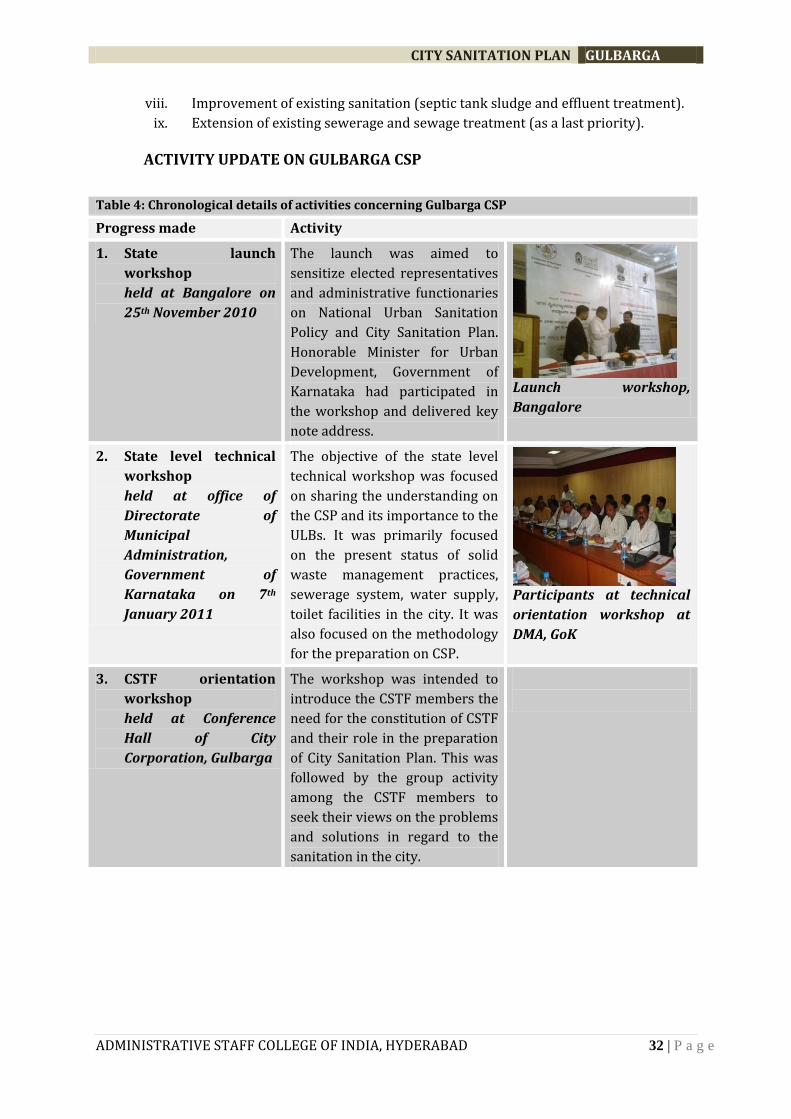
1. State launch
workshop
held at Bangalore on
25th November 2010
The launch was aimed to
sensitize elected representatives
and administrative functionaries
on National Urban Sanitation
Policy and City Sanitation Plan.
Honorable Minister for Urban
Development, Government of
Karnataka had participated in
the workshop and delivered key
note address.
Launch workshop,
Bangalore
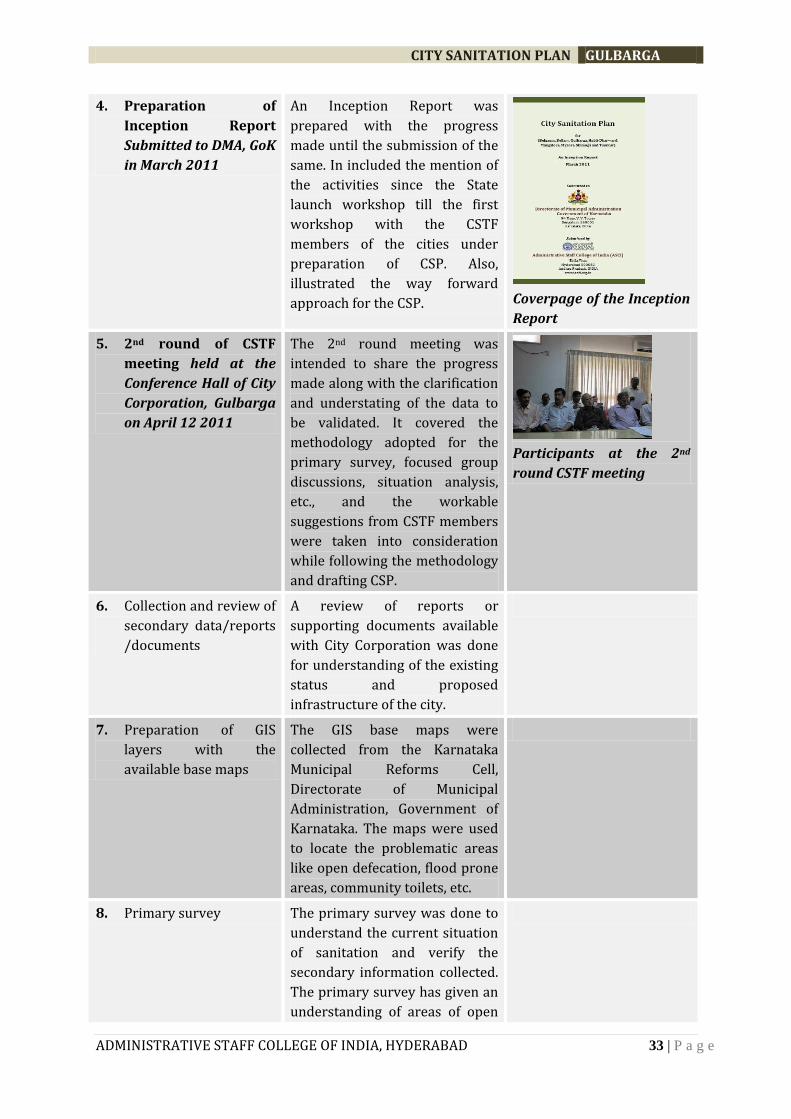
2. State level technical
workshop
held at office of
Directorate of
Municipal
Administration,
Government of
Karnataka on 7th
January 2011
The objective of the state level
technical workshop was focused
on sharing the understanding on
the CSP and its importance to the
ULBs. It was primarily focused
on the present status of solid
waste management practices,
sewerage system, water supply,
toilet facilities in the city. It was
also focused on the methodology
for the preparation on CSP.
Participants at technical
orientation workshop at
DMA, GoK
3. CSTF orientation
workshop
held at Conference
Hall of City
Corporation, Gulbarga
The workshop was intended to
introduce the CSTF members the
need for the constitution of CSTF
and their role in the preparation
of City Sanitation Plan. This was
followed by the group activity
among the CSTF members to
seek their views on the problems
and solutions in regard to the
sanitation in the city.
CITY SANITATION PLAN GULBARGA
ADMINISTRATIVE STAFF COLLEGE OF INDIA, HYDERABAD 33 | P a g e
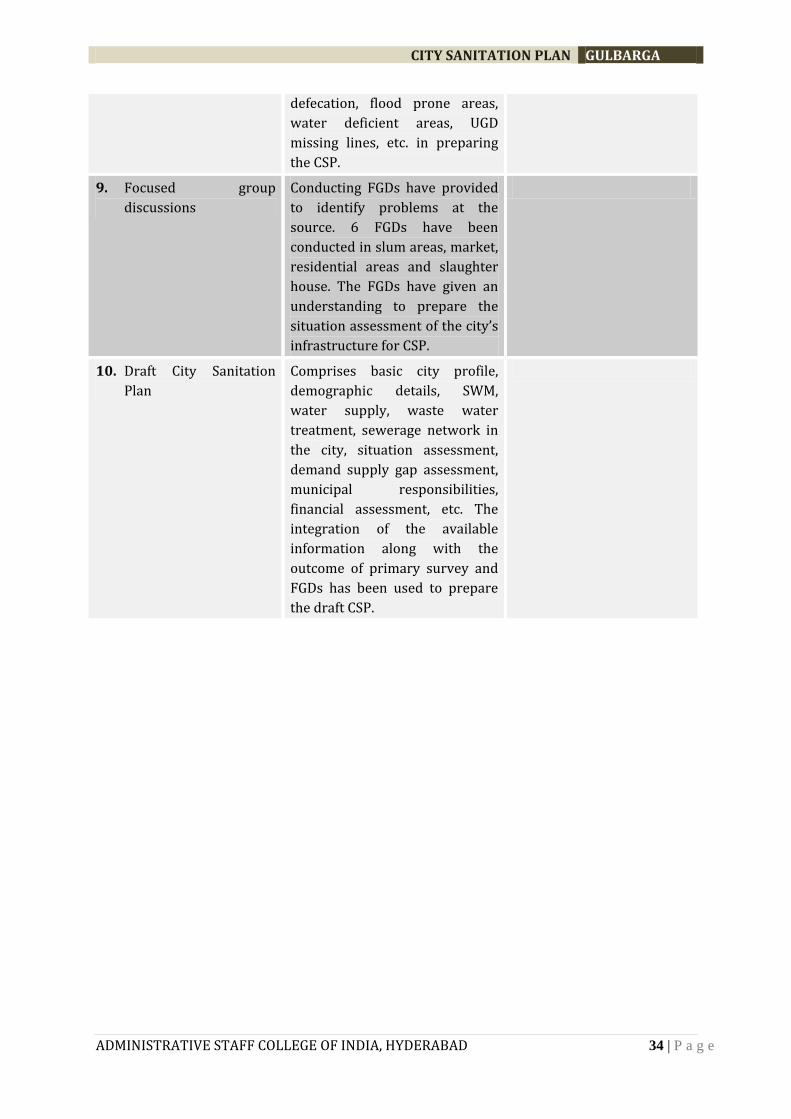
4. Preparation of
Inception Report
Submitted to DMA, GoK
in March 2011
An Inception Report was
prepared with the progress
made until the submission of the
same. In included the mention of
the activities since the State
launch workshop till the first
workshop with the CSTF
members of the cities under
preparation of CSP. Also,
illustrated the way forward
approach for the CSP.
Coverpage of the Inception
Report
5. 2nd round of CSTF
meeting held at the
Conference Hall of City
Corporation, Gulbarga
on April 12 2011
The 2nd round meeting was
intended to share the progress
made along with the clarification
and understating of the data to
be validated. It covered the
methodology adopted for the
primary survey, focused group
discussions, situation analysis,
etc., and the workable
suggestions from CSTF members
were taken into consideration
while following the methodology
and drafting CSP.
Participants at the 2nd
round CSTF meeting
6. Collection and review of
secondary data/reports
/documents
A review of reports or
supporting documents available
with City Corporation was done
for understanding of the existing
status and proposed
infrastructure of the city.
7. Preparation of GIS
layers with the
available base maps
The GIS base maps were
collected from the Karnataka
Municipal Reforms Cell,
Directorate of Municipal
Administration, Government of
Karnataka. The maps were used
to locate the problematic areas
like open defecation, flood prone
areas, community toilets, etc.
8. Primary survey The primary survey was done to
understand the current situation
of sanitation and verify the
secondary information collected.
The primary survey has given an
understanding of areas of open
CITY SANITATION PLAN GULBARGA
ADMINISTRATIVE STAFF COLLEGE OF INDIA, HYDERABAD 34 | P a g e
defecation, flood prone areas,
water deficient areas, UGD
missing lines, etc. in preparing
the CSP.
9. Focused group
discussions
Conducting FGDs have provided
to identify problems at the
source. 6 FGDs have been
conducted in slum areas, market,
residential areas and slaughter
house. The FGDs have given an
understanding to prepare the
situation assessment of the city’s
infrastructure for CSP.
10. Draft City Sanitation
Plan
Comprises basic city profile,
demographic details, SWM,
water supply, waste water
treatment, sewerage network in
the city, situation assessment,
demand supply gap assessment,
municipal responsibilities,
financial assessment, etc. The
integration of the available
information along with the
outcome of primary survey and
FGDs has been used to prepare
the draft CSP.
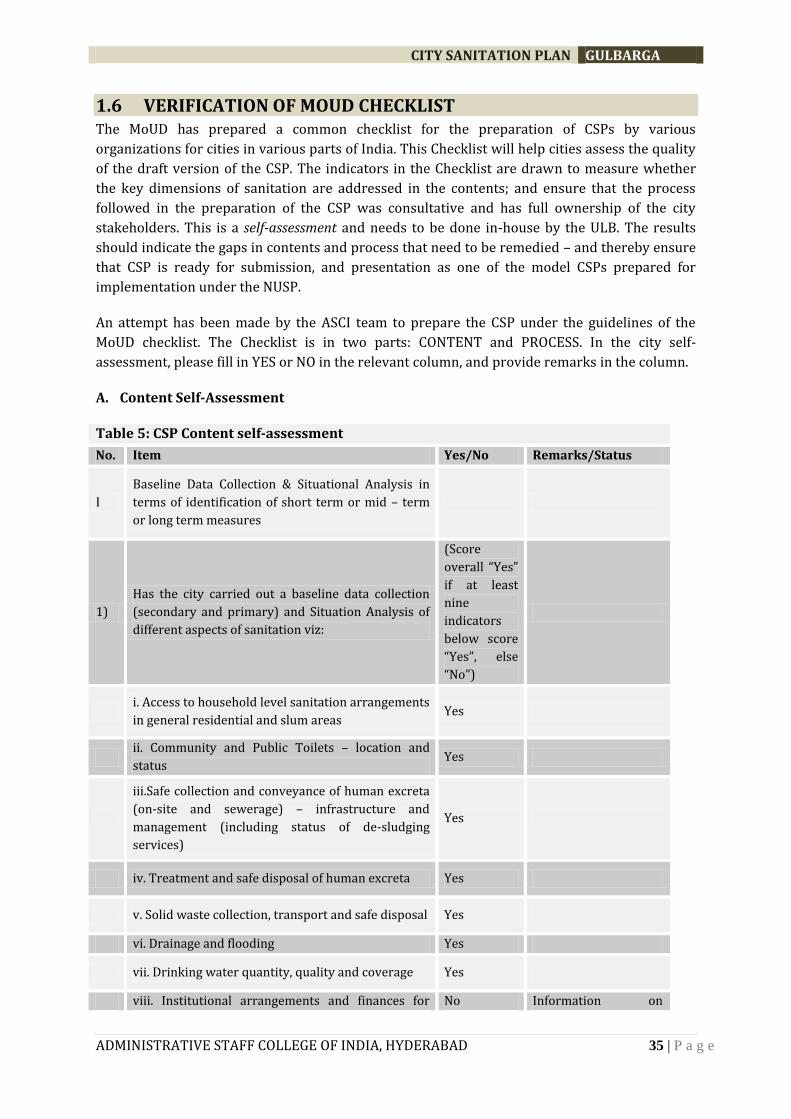
CITY SANITATION PLAN GULBARGA
ADMINISTRATIVE STAFF COLLEGE OF INDIA, HYDERABAD 35 | P a g e
1.6 VERIFICATION OF MOUD CHECKLIST The MoUD has prepared a common checklist for the preparation of CSPs by various
organizations for cities in various parts of India. This Checklist will help cities assess the quality
of the draft version of the CSP. The indicators in the Checklist are drawn to measure whether
the key dimensions of sanitation are addressed in the contents; and ensure that the process
followed in the preparation of the CSP was consultative and has full ownership of the city
stakeholders. This is a self-assessment and needs to be done in-house by the ULB. The results
should indicate the gaps in contents and process that need to be remedied – and thereby ensure
that CSP is ready for submission, and presentation as one of the model CSPs prepared for
implementation under the NUSP.
An attempt has been made by the ASCI team to prepare the CSP under the guidelines of the
MoUD checklist. The Checklist is in two parts: CONTENT and PROCESS. In the city self-
assessment, please fill in YES or NO in the relevant column, and provide remarks in the column.
A. Content Self-Assessment
Table 5: CSP Content self-assessment
No. Item Yes/No Remarks/Status
I
Baseline Data Collection & Situational Analysis in
terms of identification of short term or mid – term
or long term measures
1)
Has the city carried out a baseline data collection
(secondary and primary) and Situation Analysis of
different aspects of sanitation viz:
(Score
overall “Yes”
if at least
nine
indicators
below score
“Yes”, else
“No”)
i. Access to household level sanitation arrangements
in general residential and slum areas Yes
ii. Community and Public Toilets – location and
status Yes
iii.Safe collection and conveyance of human excreta
(on-site and sewerage) – infrastructure and
management (including status of de-sludging
services)
Yes
iv. Treatment and safe disposal of human excreta Yes
v. Solid waste collection, transport and safe disposal Yes
vi. Drainage and flooding Yes
vii. Drinking water quantity, quality and coverage Yes
viii. Institutional arrangements and finances for No Information on
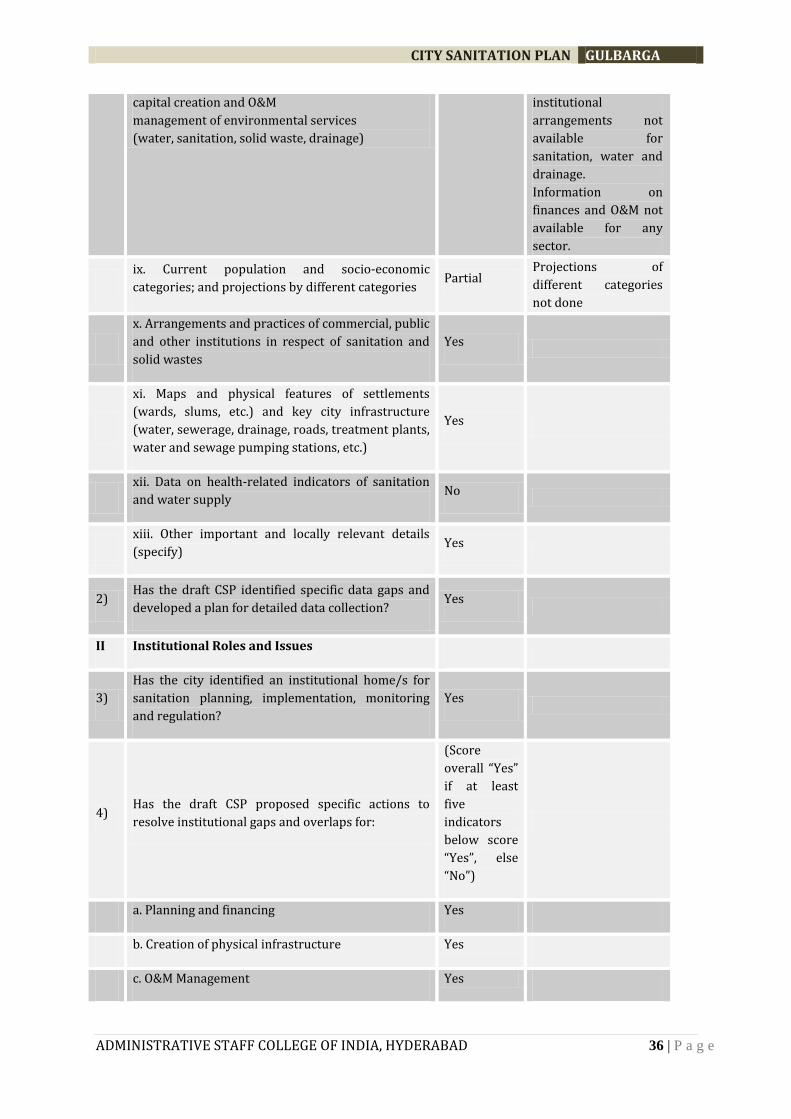
CITY SANITATION PLAN GULBARGA
ADMINISTRATIVE STAFF COLLEGE OF INDIA, HYDERABAD 36 | P a g e
capital creation and O&M
management of environmental services
(water, sanitation, solid waste, drainage)
institutional
arrangements not
available for
sanitation, water and
drainage.
Information on
finances and O&M not
available for any
sector.
ix. Current population and socio-economic
categories; and projections by different categories Partial
Projections of
different categories
not done
x. Arrangements and practices of commercial, public
and other institutions in respect of sanitation and
solid wastes
Yes
xi. Maps and physical features of settlements
(wards, slums, etc.) and key city infrastructure
(water, sewerage, drainage, roads, treatment plants,
water and sewage pumping stations, etc.)
Yes
xii. Data on health-related indicators of sanitation
and water supply No
xiii. Other important and locally relevant details
(specify) Yes
2) Has the draft CSP identified specific data gaps and
developed a plan for detailed data collection? Yes
II Institutional Roles and Issues
3)
Has the city identified an institutional home/s for
sanitation planning, implementation, monitoring
and regulation?
Yes
4) Has the draft CSP proposed specific actions to
resolve institutional gaps and overlaps for:
(Score
overall “Yes”
if at least
five
indicators
below score
“Yes”, else
“No”)
a. Planning and financing Yes
b. Creation of physical infrastructure Yes
c. O&M Management Yes
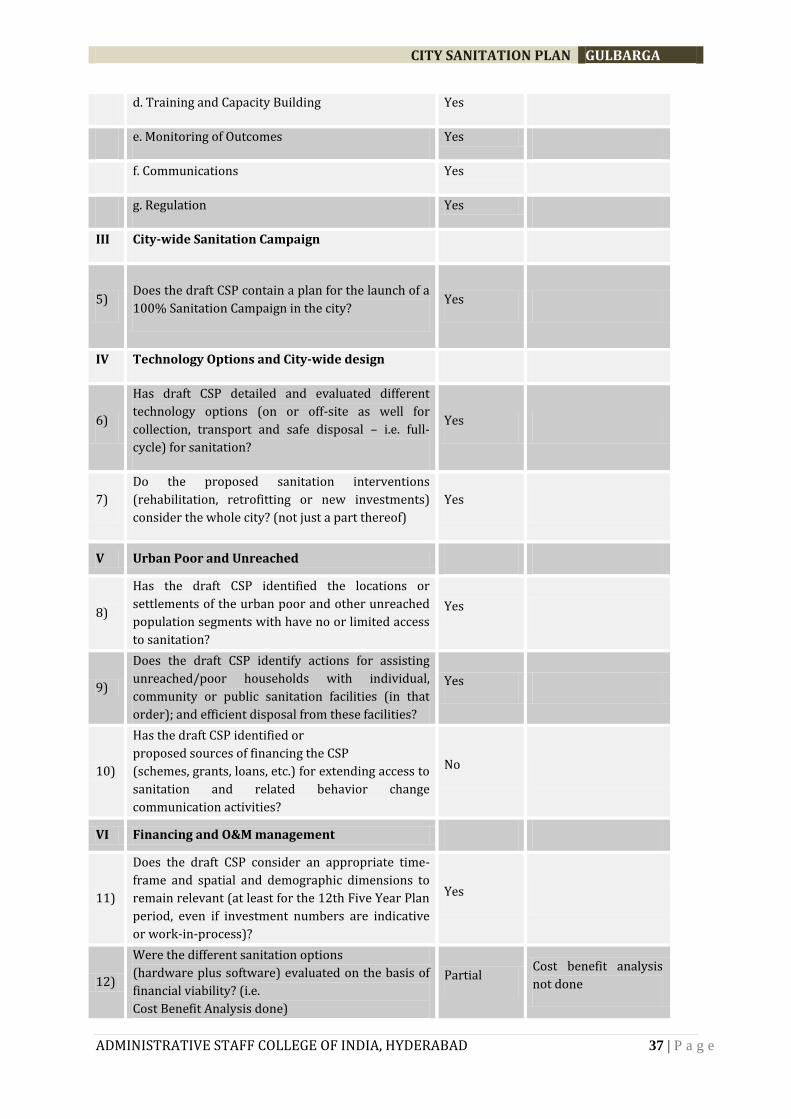
CITY SANITATION PLAN GULBARGA
ADMINISTRATIVE STAFF COLLEGE OF INDIA, HYDERABAD 37 | P a g e
d. Training and Capacity Building Yes
e. Monitoring of Outcomes Yes
f. Communications Yes
g. Regulation Yes
III City-wide Sanitation Campaign
5) Does the draft CSP contain a plan for the launch of a
100% Sanitation Campaign in the city? Yes
IV Technology Options and City-wide design
6)
Has draft CSP detailed and evaluated different
technology options (on or off-site as well for
collection, transport and safe disposal – i.e. full-
cycle) for sanitation?
Yes
7)
Do the proposed sanitation interventions
(rehabilitation, retrofitting or new investments)
consider the whole city? (not just a part thereof)
Yes
V Urban Poor and Unreached
8)
Has the draft CSP identified the locations or
settlements of the urban poor and other unreached
population segments with have no or limited access
to sanitation?
Yes
9)
Does the draft CSP identify actions for assisting
unreached/poor households with individual,
community or public sanitation facilities (in that
order); and efficient disposal from these facilities?
Yes
10)
Has the draft CSP identified or
proposed sources of financing the CSP
(schemes, grants, loans, etc.) for extending access to
sanitation and related behavior change
communication activities?
No
VI Financing and O&M management
11)
Does the draft CSP consider an appropriate time-
frame and spatial and demographic dimensions to
remain relevant (at least for the 12th Five Year Plan
period, even if investment numbers are indicative
or work-in-process)?
Yes
12)
Were the different sanitation options
(hardware plus software) evaluated on the basis of
financial viability? (i.e.
Cost Benefit Analysis done)
Partial Cost benefit analysis
not done
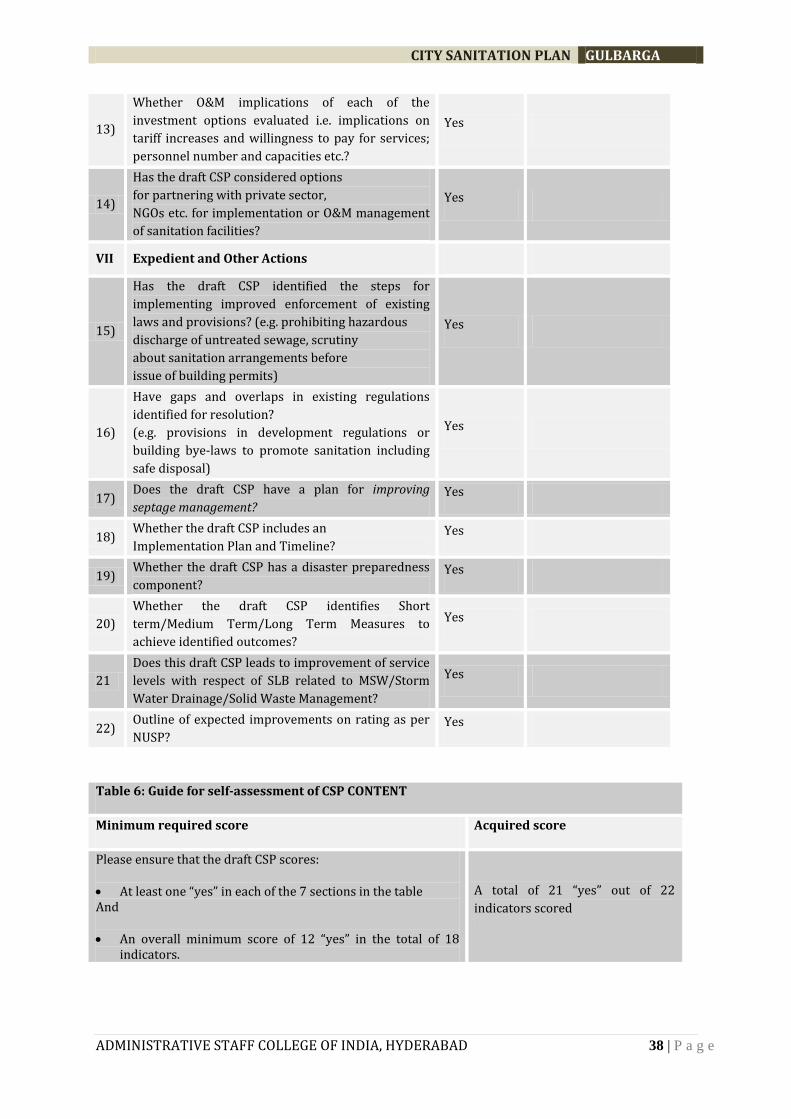
CITY SANITATION PLAN GULBARGA
ADMINISTRATIVE STAFF COLLEGE OF INDIA, HYDERABAD 38 | P a g e
13)
Whether O&M implications of each of the
investment options evaluated i.e. implications on
tariff increases and willingness to pay for services;
personnel number and capacities etc.?
Yes
14)
Has the draft CSP considered options
for partnering with private sector,
NGOs etc. for implementation or O&M management
of sanitation facilities?
Yes
VII Expedient and Other Actions
15)
Has the draft CSP identified the steps for
implementing improved enforcement of existing
laws and provisions? (e.g. prohibiting hazardous
discharge of untreated sewage, scrutiny
about sanitation arrangements before
issue of building permits)
Yes
16)
Have gaps and overlaps in existing regulations
identified for resolution?
(e.g. provisions in development regulations or
building bye-laws to promote sanitation including
safe disposal)
Yes
17) Does the draft CSP have a plan for improving
septage management? Yes
18) Whether the draft CSP includes an
Implementation Plan and Timeline? Yes
19) Whether the draft CSP has a disaster preparedness
component? Yes
20)
Whether the draft CSP identifies Short
term/Medium Term/Long Term Measures to
achieve identified outcomes?
Yes
21
Does this draft CSP leads to improvement of service
levels with respect of SLB related to MSW/Storm
Water Drainage/Solid Waste Management?
Yes
22) Outline of expected improvements on rating as per
NUSP? Yes
Table 6: Guide for self-assessment of CSP CONTENT
Minimum required score Acquired score
Please ensure that the draft CSP scores:
At least one “yes” in each of the 7 sections in the table And
An overall minimum score of 12 “yes” in the total of 18 indicators.
A total of 21 “yes” out of 22
indicators scored
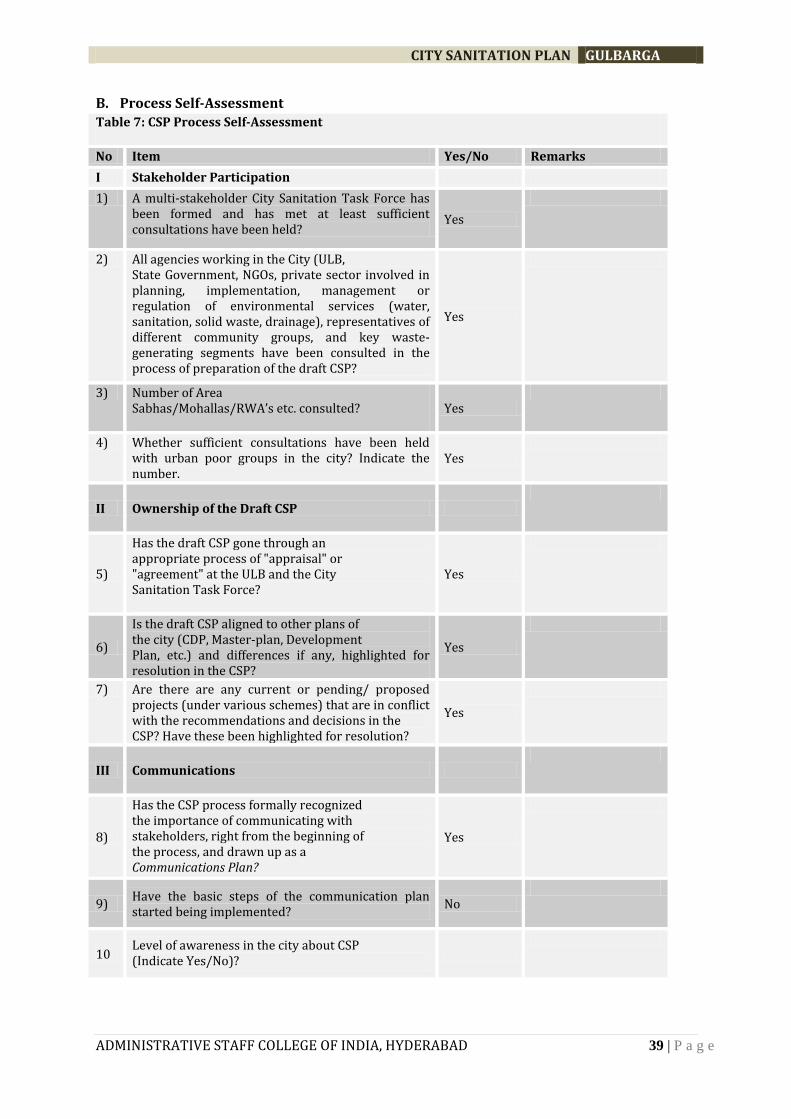
CITY SANITATION PLAN GULBARGA
ADMINISTRATIVE STAFF COLLEGE OF INDIA, HYDERABAD 39 | P a g e
B. Process Self-Assessment
Table 7: CSP Process Self-Assessment
No Item Yes/No Remarks
I Stakeholder Participation
1) A multi-stakeholder City Sanitation Task Force has been formed and has met at least sufficient consultations have been held?
Yes
2) All agencies working in the City (ULB, State Government, NGOs, private sector involved in planning, implementation, management or regulation of environmental services (water, sanitation, solid waste, drainage), representatives of different community groups, and key waste-generating segments have been consulted in the process of preparation of the draft CSP?
Yes
3) Number of Area Sabhas/Mohallas/RWA’s etc. consulted? Yes
4) Whether sufficient consultations have been held with urban poor groups in the city? Indicate the number.
Yes
II Ownership of the Draft CSP
5)
Has the draft CSP gone through an appropriate process of "appraisal" or "agreement" at the ULB and the City Sanitation Task Force?
Yes
6)
Is the draft CSP aligned to other plans of the city (CDP, Master-plan, Development Plan, etc.) and differences if any, highlighted for resolution in the CSP?
Yes
7) Are there are any current or pending/ proposed projects (under various schemes) that are in conflict with the recommendations and decisions in the CSP? Have these been highlighted for resolution?
Yes
III Communications
8)
Has the CSP process formally recognized the importance of communicating with stakeholders, right from the beginning of the process, and drawn up as a Communications Plan?
Yes
9) Have the basic steps of the communication plan started being implemented?
No
10 Level of awareness in the city about CSP (Indicate Yes/No)?
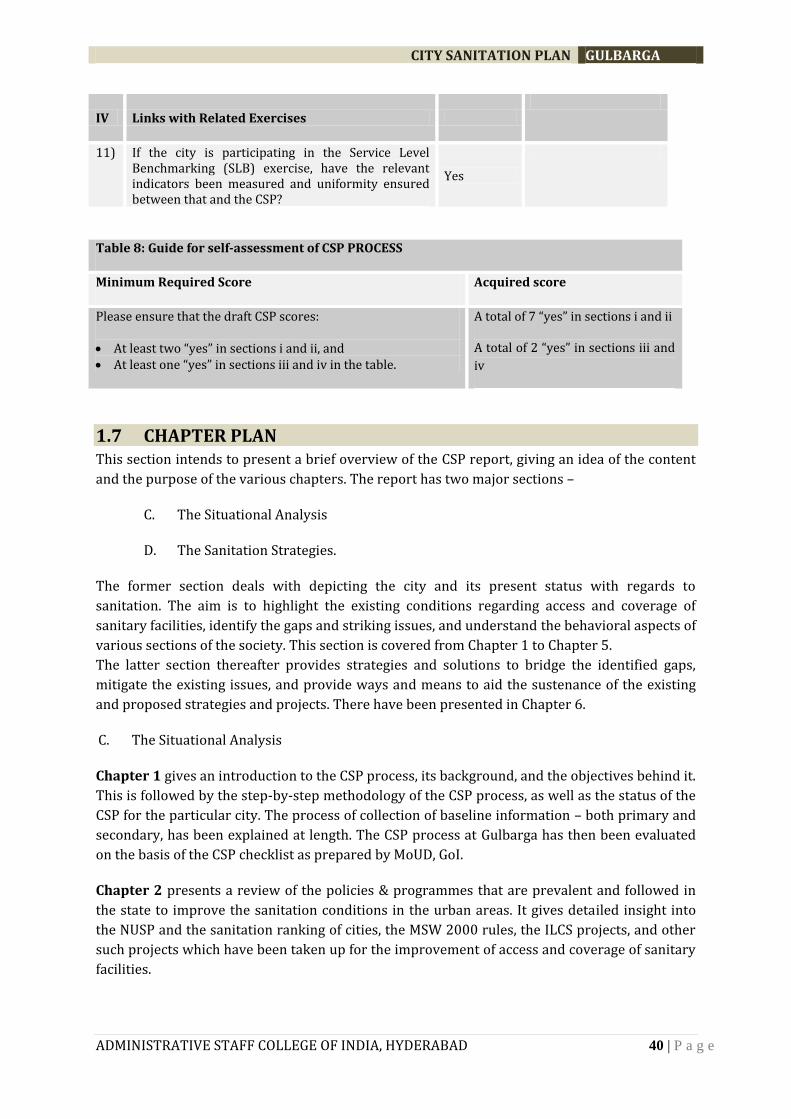
CITY SANITATION PLAN GULBARGA
ADMINISTRATIVE STAFF COLLEGE OF INDIA, HYDERABAD 40 | P a g e
IV Links with Related Exercises
11) If the city is participating in the Service Level Benchmarking (SLB) exercise, have the relevant indicators been measured and uniformity ensured between that and the CSP?
Yes
Table 8: Guide for self-assessment of CSP PROCESS
Minimum Required Score Acquired score
Please ensure that the draft CSP scores:
At least two “yes” in sections i and ii, and At least one “yes” in sections iii and iv in the table.
A total of 7 “yes” in sections i and ii
A total of 2 “yes” in sections iii and
iv
1.7 CHAPTER PLAN This section intends to present a brief overview of the CSP report, giving an idea of the content
and the purpose of the various chapters. The report has two major sections –
C. The Situational Analysis
D. The Sanitation Strategies.
The former section deals with depicting the city and its present status with regards to
sanitation. The aim is to highlight the existing conditions regarding access and coverage of
sanitary facilities, identify the gaps and striking issues, and understand the behavioral aspects of
various sections of the society. This section is covered from Chapter 1 to Chapter 5.
The latter section thereafter provides strategies and solutions to bridge the identified gaps,
mitigate the existing issues, and provide ways and means to aid the sustenance of the existing
and proposed strategies and projects. There have been presented in Chapter 6.
C. The Situational Analysis
Chapter 1 gives an introduction to the CSP process, its background, and the objectives behind it.
This is followed by the step-by-step methodology of the CSP process, as well as the status of the
CSP for the particular city. The process of collection of baseline information – both primary and
secondary, has been explained at length. The CSP process at Gulbarga has then been evaluated
on the basis of the CSP checklist as prepared by MoUD, GoI.
Chapter 2 presents a review of the policies & programmes that are prevalent and followed in
the state to improve the sanitation conditions in the urban areas. It gives detailed insight into
the NUSP and the sanitation ranking of cities, the MSW 2000 rules, the ILCS projects, and other
such projects which have been taken up for the improvement of access and coverage of sanitary
facilities.
CITY SANITATION PLAN GULBARGA
ADMINISTRATIVE STAFF COLLEGE OF INDIA, HYDERABAD 41 | P a g e
Chapter 3 deals with the City Profile where the various aspects of the city are discussed in
order to get a fair idea about the city itself. Aspects such as location, regional linkages,
demography, economic, landuse and housing profiles, the urban governance, the slums and
squatter settlements are discussed in brief.
Chapter 4 forms the central focus of Section A – i.e. The Situational Analysis. The aim of the
chapter is to present a clear picture of the existing systems of sanitation in the city. It contains
four sectors – Sewerage and sanitation, Storm water system, Solid waste Management and the
Water supply system of the city. Within each sector, the gaps and issues in access and coverage
are identified, the problem areas are clearly demarcated, the performance of each of the sectors
is evaluated through Service Level Benchmarking (SLB) indicators, and projections are also
made for the future years.
Chapter 5 aims to evaluate the institutional capacity and the financial structure, to find out if
the ULB along with the associated organizations is able to cater to the sanitation needs of the
society, with regards to both adequate qualified personnel and adequate financial sources.
D. The Situational Analysis
The strategies are presented in Chapter 6. It provides the vision for the CSP and its goals, and
the basic guiding principles on which the strategies are based. Thereafter, strategies have been
provided to improve coverage and access to sanitation facilities, to implement effectively the
various proposals, and options and mechanisms for effectively financing the strategies and
proposals along with proper phasing
CITY SANITATION PLAN GULBARGA
ADMINISTRATIVE STAFF COLLEGE OF INDIA, HYDERABAD 42 | P a g e
Chapter 2
State Urban Sanitation Policies & Programmes – A review
2.1 NATIONAL URBAN SANITATION POLICY (NUSP)
“All Indian cities and towns become totally sanitized, healthy and liveable and ensure and
sustain good public health and environmental outcomes for all their citizens with a special
focus on hygienic and affordable sanitation facilities for the urban poor and women.”
Keeping this vision in view, the National Urban Sanitation Policy (NUSP) has been formulated by
the Government of India in 2008 with a vision to provide appropriate sanitation facilities in all
cities and towns, through policy, institutional, technical and financial interventions. Some of the
areas to address under NUSP include open defecation free towns, providing access to toilets for
poor people, waste water and solid waste treatment and disposal and achieving public health
outcomes and environmental standards.
2.1.1. COMPONENTS OF NATIONAL URBAN SANITATION POLICY
Govt. of India shall support the following components:
Awareness Generation
Institutional Roles
Reaching the Un-Served and Poor Households
Knowledge Development
Capacity Building
Financing
National Monitoring & Evaluation
Coordination at the National Level
2.1.2. NATIONAL AWARD SCHEME FOR SANITATION FOR INDIAN CITIES
Goal
In order to rapidly promote sanitation in urban areas of the country (as provided for in the
National Urban Sanitation Policy and Goals 2008), and to recognize excellent performance in
this area, the Government of India intends to institute an annual award scheme for cities. The
award is based on the premise that improved public health and environmental standards are
the two outcomes that cities must seek to ensure for urban citizens. In doing so, governments in
states and urban areas will need to plan and implement holistic city-wide sanitation plans,
thereby put in place processes that help reach outputs pertaining to safe collection, disposal and
disposal (including conveyance, treatment, and/ or re-use without adverse impacts on the
environment in and around the cities). It may be noted that the awards will not recognize mere
inputs, hardware or expenditure incurred in urban sanitation but assess how these lead to
achievements of intermediate milestones toward the final result of 100 % safe disposal of
wastes from the city on a sustainable basis. Cities will need to raise the awareness of city
CITY SANITATION PLAN GULBARGA
ADMINISTRATIVE STAFF COLLEGE OF INDIA, HYDERABAD 43 | P a g e
stakeholders (households, establishments, industries, municipal functionaries, media, etc.) since
improved sanitation can ensure improved public health and environmental outcomes only if
considerable changes in behaviour and practice take place across the spectrum of society.
Concept of Totally Sanitized Cities
A totally Sanitized City will be one that has achieved the outputs or milestones specified in the
National Urban Sanitation policy, the salient features of which are as follows:
Cities must be open defecation free
Must eliminate the practice of manual scavenging and provide adequate personnel
protection equipment that addresses the safety of sanitation workers.
Municipal wastewater and storm water drainage must be safely managed
Recycle and reuse of treated wastewater for non potable applications should be
implemented wherever possible.
Solid Waste collected and disposed off fully and safely
Services to the Poor and Systems for Sustaining Results
Improved Public Health Outcomes and Environmental Standards
Rating and Categorization of Cities
The rating of cities in regard to their performance in sanitation improvements will be based on
set of objective indicators of outputs, processes and outcomes.
Three Categories of Indicators
The rating exercise will involve three categories of indicators:
1. Output Indicators: pertain to the city having achieved certain results or outputs in
different dimensions of sanitation ranging from behvioural aspects and provision, to safe
collection, treatment and disposal without harm to the city’s environment. There are nine
mainoutput-indicators accounting for 50 points of the total of 100 points.
2. Process Related: indicators pertain to systems and procedures that exist and are practiced
by the city agencies to ensure sustained sanitation. There are seven main process-indicators
accounting for 30 points of the total of 100 points.
3. Outcome Related: indicators include the quality of drinking water and that of water in
water-bodies of city, as also the extent of reduction in sanitation-related and water-borne
diseases in the city over a time period. There are three main outcome-indicators accounting for
20 points of a total of 100 points1.
Ideally, data for the above outputs, processes and outcomes are regularly collected by city
authorities but at present, very few cities will have, at best, partial data available. This rating
exercise will help in highlighting the need for regular data-collection and monitoring of
indicators.
On the basis of the said rating scheme, cities will be placed in different categories as presented
in Table 6. National rating survey data will utilize these categories for publication of results.
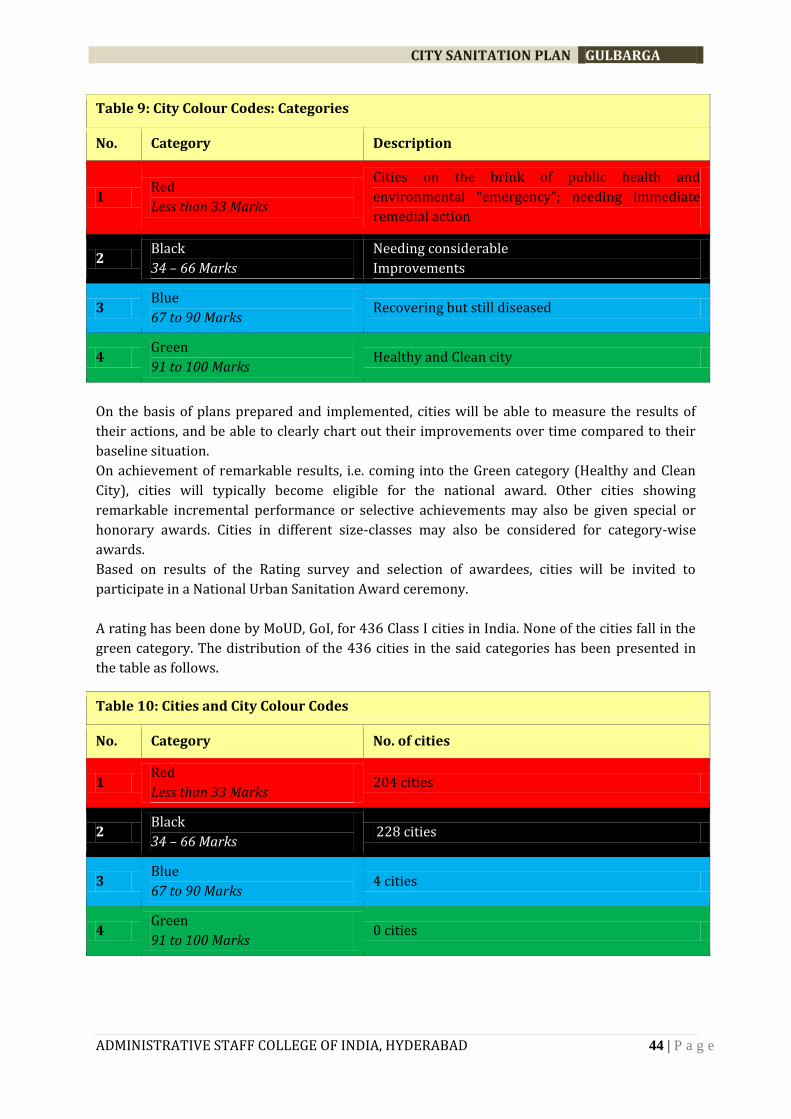
CITY SANITATION PLAN GULBARGA
ADMINISTRATIVE STAFF COLLEGE OF INDIA, HYDERABAD 44 | P a g e
Table 9: City Colour Codes: Categories
No. Category Description
1 Red
Less than 33 Marks
Cities on the brink of public health and
environmental “emergency”; needing immediate
remedial action
2 Black
34 – 66 Marks
Needing considerable
Improvements
3 Blue
67 to 90 Marks Recovering but still diseased
4 Green
91 to 100 Marks Healthy and Clean city
On the basis of plans prepared and implemented, cities will be able to measure the results of
their actions, and be able to clearly chart out their improvements over time compared to their
baseline situation.
On achievement of remarkable results, i.e. coming into the Green category (Healthy and Clean
City), cities will typically become eligible for the national award. Other cities showing
remarkable incremental performance or selective achievements may also be given special or
honorary awards. Cities in different size-classes may also be considered for category-wise
awards.
Based on results of the Rating survey and selection of awardees, cities will be invited to
participate in a National Urban Sanitation Award ceremony.
A rating has been done by MoUD, GoI, for 436 Class I cities in India. None of the cities fall in the
green category. The distribution of the 436 cities in the said categories has been presented in
the table as follows.
Table 10: Cities and City Colour Codes
No. Category No. of cities
1 Red
Less than 33 Marks 204 cities
2 Black
34 – 66 Marks 228 cities
3 Blue
67 to 90 Marks 4 cities
4 Green
91 to 100 Marks 0 cities
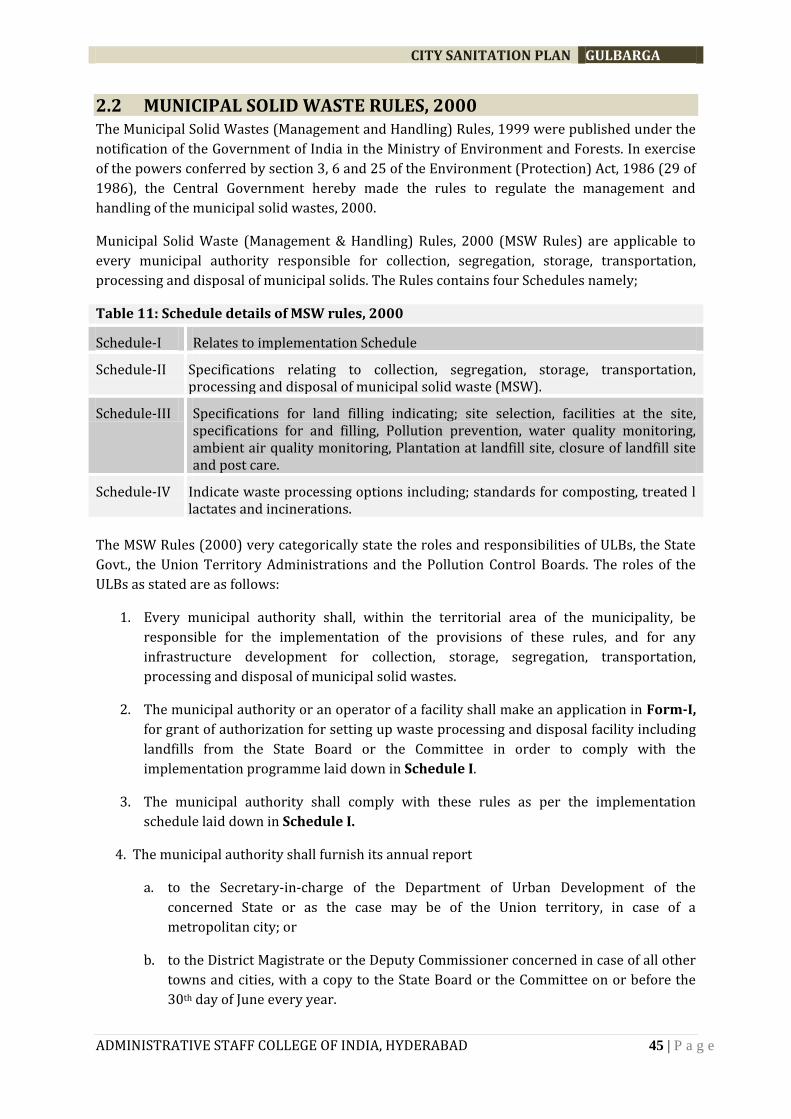
CITY SANITATION PLAN GULBARGA
ADMINISTRATIVE STAFF COLLEGE OF INDIA, HYDERABAD 45 | P a g e
2.2 MUNICIPAL SOLID WASTE RULES, 2000 The Municipal Solid Wastes (Management and Handling) Rules, 1999 were published under the
notification of the Government of India in the Ministry of Environment and Forests. In exercise
of the powers conferred by section 3, 6 and 25 of the Environment (Protection) Act, 1986 (29 of
1986), the Central Government hereby made the rules to regulate the management and
handling of the municipal solid wastes, 2000.
Municipal Solid Waste (Management & Handling) Rules, 2000 (MSW Rules) are applicable to
every municipal authority responsible for collection, segregation, storage, transportation,
processing and disposal of municipal solids. The Rules contains four Schedules namely;
Table 11: Schedule details of MSW rules, 2000
Schedule-I Relates to implementation Schedule
Schedule-II Specifications relating to collection, segregation, storage, transportation, processing and disposal of municipal solid waste (MSW).
Schedule-III Specifications for land filling indicating; site selection, facilities at the site, specifications for and filling, Pollution prevention, water quality monitoring, ambient air quality monitoring, Plantation at landfill site, closure of landfill site and post care.
Schedule-IV Indicate waste processing options including; standards for composting, treated l lactates and incinerations.
The MSW Rules (2000) very categorically state the roles and responsibilities of ULBs, the State
Govt., the Union Territory Administrations and the Pollution Control Boards. The roles of the
ULBs as stated are as follows:
1. Every municipal authority shall, within the territorial area of the municipality, be
responsible for the implementation of the provisions of these rules, and for any
infrastructure development for collection, storage, segregation, transportation,
processing and disposal of municipal solid wastes.
2. The municipal authority or an operator of a facility shall make an application in Form-I,
for grant of authorization for setting up waste processing and disposal facility including
landfills from the State Board or the Committee in order to comply with the
implementation programme laid down in Schedule I.
3. The municipal authority shall comply with these rules as per the implementation
schedule laid down in Schedule I.
4. The municipal authority shall furnish its annual report
a. to the Secretary-in-charge of the Department of Urban Development of the
concerned State or as the case may be of the Union territory, in case of a
metropolitan city; or
b. to the District Magistrate or the Deputy Commissioner concerned in case of all other
towns and cities, with a copy to the State Board or the Committee on or before the
30th day of June every year.
CITY SANITATION PLAN GULBARGA
ADMINISTRATIVE STAFF COLLEGE OF INDIA, HYDERABAD 46 | P a g e
2.3 KARNATAKA URBAN DRINKING WATER AND SANITATION POLICY, 2002
Good quality reliable drinking water supply and sanitation are essential basic needs of every
citizen. Increasing urbanization has resulted in greater pressure on the existing urban water
supply and sanitation systems leading to increasing demand on the one hand to augment the
source and improve distribution and on the other to increase the coverage of underground
drainage (UGD). At the same time, as stated in the State Water Policy brought out by the
Department of the Water Resources, there is an urgent need to conserve the limited water
resources of the State to ensure sufficient availability of water for various needs as well as for
the future. The Government of Karnataka in partnership with urban local bodies in the State, the
Karnataka Urban Water Supply & Drainage Board (KUWS&DB) and the Bangalore Water Supply
and Sewerage Board (BWSSB) will continue and strengthen its efforts to provide all residents of
urban areas of the State, piped water supply and sanitation services at or near their dwellings.
The efforts of the Government of Karnataka and its partner agencies will be to:
1. Ensure universal coverage of water and sanitation services that people want and are
willing to pay for and
2. To do so in a manner that preserves the sustainability of the precious water resources of
the State, project and enhances the commercial and economical sustainability of the
operations at the same time
3. Ensure a minimum level of service to all citizens.
The Government of Karnataka will continue to be responsible for:
Ensuring provision of the bulk of the resources required for capacity creation
Regulation, monitoring and evaluation of the efficiency of operations, including
prescribing reporting requirements, procurement procedures, etc.,
Setting minimal service standard
Encouraging the use of public private partnerships as well as private sector
participation to achieve the sector goals
Promotion of the economic and commercial viability of water supply systems and the
exploitation of economies of scale and scope by appropriate aggregation options
Institution of necessary incentives for urban local bodies and other service providers to
implement sector reforms
Ensuring co-ordination and collaboration among the various agencies both at the policy
and operational level through the establishment of appropriate committees and
agencies.
2.4 KARNATAKA URBAN INFRASTRUCTURE DEVELOPMENT AND FINANCE CORPORATION (KUIDFC)
State Government has appointed Karnataka Urban Infrastructure Development & Finance
Corporation (KUIDFC) as the State Level Nodal Agency (SLNA) under JnNURM to assist Urban
Local Bodies (ULBs), place proposals to SLSC for approval, manages grants, release funds to
ULBs, maintain revolving fund and monitor the physical & financial progress and reforms
implementation as committed in the Memorandum of Agreement.
CITY SANITATION PLAN GULBARGA
ADMINISTRATIVE STAFF COLLEGE OF INDIA, HYDERABAD 47 | P a g e
Funds under the scheme would be released by the Central Government to the Nodal Agency
which in turn would release to the Implementing Agency in the form of loan, soft loan-cum-
grant or grant.
As per the guidelines, at least 25% (for UIG) & 10% ( for BSUP) of the funds released are to be
recovered and ploughed into a Revolving Fund by the nodal agency for financing of further
infrastructure projects and the fund may be upgraded to a state level infrastructure fund.
66 Projects with an investment of Rs. 4602.40 crore have been approved so far. Of this, Central
Government share is Rs. 2002.83 crore and State Government share is Rs. 709.53 crore, against
which the GoI has already released Rs. 1035.50 crore and GoK has contributed its share of Rs.
475.25 crore. Against the total releases of Rs. 1508.75 crore, an amount of Rs. 2503.59 crore has
already been spent (including ULB/IA share). 21 projects have been completed. 50.50% of
approved investment is for Water, Sewerage & Drainage Sector, 0.70% for Solid Waste
Management, 29.70% for Roads and Road related Infrastructure, 0.80% for Heritage & Tourism
and 18.30 % for provision of Basic Services to Urban Poor. For the urban poor, 28,118 dwelling
units will be built in 110 slums which would benefit about 1, 40, 590 people. Till date,
construction of 9548 dwelling units has been completed. 19 DPRs for an estimated investment
of Rs. 1670.07 crore are pending approval of the GoI requiring an ACA of Rs. 962.05 crore.
Further 22 DPRs are under various stages of preparation with an estimated cost of Rs. 4265.57
crore.
PROJECTS
Externally aided projects
Completed
ADB assisted Karnataka Urban Infrastructure Development Project (KUIDP)
Ongoing
ADB assisted Karnataka Urban Development and Coastal Environmental Management
Project (KUDCEMP)
World Bank assisted Karnataka Urban Water Supply Improvement Project (KUWASIP)
ADB assisted North Karnataka Urban Sector Investment Programme (NKUSIP)
World Bank assisted Karnataka Municipal Reforms Project (KMRP)
Other Projects
Centrally sponsored Mega City Scheme
Greater Bangalore Water and Sanitation Project (GBWASP)
2.1.3. KARNATAKA URBAN DEVELOPMENT AND COASTAL ENVIRONMENTAL
MANAGEMENT PROJECT (KUDCEMP)
The Project will support the Government's priority investment in the urban sector, based on an
urban sector development strategy that focuses on improving the welfare of the urban poor and
the devolution of municipal management responsibility from states to urban local bodies. This
integrated urban development project will help meet basic human needs by developing urban
services for water supply and sanitation, solid waste and wastewater management, and slum
and environmental improvements. The Project will also support street improvements and
traffic management, and strengthen other municipal services required to improve the quality of
CITY SANITATION PLAN GULBARGA
ADMINISTRATIVE STAFF COLLEGE OF INDIA, HYDERABAD 48 | P a g e
life in urban areas. The Project will provide assistance in capacity building and community
participation at the state and local levels and in Project implementation.
COMPONENTS OF KUDCEMP
Part A: Capacity Building, Community Participation and Poverty Alleviation
Training and technical assistance to urban local body staff
Community awareness and participation programme
Slum improvement and sites and services for low income groups
Part B: Water Supply Rehabilitation and Expansion
Rehabilitation of existing water supply systems
Providing new water supply schemes to increase the capacity and supply levels
Leak detection and rectification
Promotion of cost recovery
Part C: Urban Environmental Improvement
Waste water management
Underground drainage
Sanitation
Storm water drainage
Solid waste management
Land fill
Vehicles
Awareness
Community involvement
Traffic Management
Roads
Junction improvement
Rehabilitation of existing markets and other municipal facilities
Part D: Street and Bridge Improvement of existing roads
Construction of new roads
Associated road side drainage works
Part E: Coastal Environmental Management
Preparation of coastal resource management and conservation plans
Industrial pollution control and environmental monitoring programme
Urban water front rehabilitation plan for Gulbarga
Coastal erosion prevention through mangrove afforestation
Part F: Implementation Assistance
Support for systematic implementation of the project by appointing consultants for
design, construction, supervision and project management and procuring necessary
equipment and vehicles
KUDCEMP TOWNS
CITY SANITATION PLAN GULBARGA
ADMINISTRATIVE STAFF COLLEGE OF INDIA, HYDERABAD 49 | P a g e
Ankola
Bhatkal
Dandeli
Karwar
Kundapura
Mangalore
Puttur
Sirsi
Udupi
Ullal
2.5 INTEGRATED LOW COST SANITATION (ILCS)
The programme envisages construction of new sanitary latrines in households not having
latrines by adopting the low-cost leach pit system, with an objective to eliminate dry latrines
and manual scavenging. The scheme is being implemented with 63% Hudco loan, 32%
Government of India subsidy and 5% of contribution of beneficiary. Initially during the year
1992 the Integrated Low Cost Sanitation Scheme was taken up in 34 municipalities,
subsequently extended the programme covering all the Urban Local Bodies in a phased
programme. The scheme was implemented in all 113 Urban Local Bodies with HUDCO financial
assistance.
2.6 ASHA KIRAN MAHITI (AKM) Asha Kiran Mahiti is a web-based application of the Karnataka Municipal Reforms Cell,
Directorate of Municipal Administration, Government of Karnataka. It has taken a major step in
the direction of mapping 3,400 notified and non-notified slums all over Karnataka and has the
socio-economic database of six lakh slum households across Karnataka. Based on this, it needs
to generate the social indicators, evolve plans and set targets for improvement in each of them
and measure the audit outcomes periodically.
2.7 JNNURM The aim of JnNURM is to encourage reforms and fast track planned development of identified
cities. Focuses on efficiency in urban infrastructure and service delivery mechanisms,
community participation, and accountability of ULBs/ Parastatal agencies towards citizens.
Objectives of JnNURM:
a. Focused attention to integrated development of infrastructure services in cities covered
under the Mission;
b. Establishment of linkages between asset-creation and asset-management through a slew
of reforms for long-term project sustainability;
c. Ensuring adequate funds to meet the deficiencies in urban infrastructural services;
d. Planned development of identified cities including peri-urban areas, outgrowths and
urban corridors leading to dispersed urbanization;
e. Scale-up delivery of civic amenities and provision of utilities with emphasis on universal
access to the urban poor;
CITY SANITATION PLAN GULBARGA
ADMINISTRATIVE STAFF COLLEGE OF INDIA, HYDERABAD 50 | P a g e
f. Special focus on urban renewal programme for the old city areas to reduce congestion;
and
g. Provision of basic services to the urban poor including security of tenure at affordable
prices, improved housing, water supply and sanitation, and ensuring delivery of other
existing universal services of the government for education, health and social security.
2.8 URBAN INFRASTRUCTURE DEVELOPMENT SCHEME FOR SMALL & MEDIUM TOWNS (UIDSSMT)
UIDSSMT aims at improvement in urban infrastructure in towns and cities in a planned manner.
It shall subsume the existing schemes of Integrated Development of Small and Medium Towns
(IDSMT) and Accelerated Urban Water Supply Programme (AUWSP).
Objectives of UIDSSMT scheme are:
1. Improve infrastructural facilities and help create durable public assets and quality
oriented services in cities & towns
2. Enhance public-private-partnership in infrastructural development and
3. Promote planned integrated development of towns and cities.
2.9 RAJIV AWAS YOJANA Scheme Objectives
The Government has initiated a new scheme called Rajiv Awas Yojana (RAY) for the slum
dwellers and the urban poor. This scheme aims at providing Central support to States that are
willing to assign property rights to slum dwellers. The Government’s effort would be to create a
Slum-free India through the implementation of RAY.
The Ministry of Housing and Urban Poverty Alleviation (MoHUPA) has prepared Guidelines for
Slum Free City Planning to assist the preparatory activities under RAY and this has been
circulated to all States/UTs. RAY calls for a multi-pronged approach focusing on the following
aspects:
• Bringing existing slums within the formal system and enabling them to avail the same
level of basic amenities as the rest of the town/city.
• Redressing the failures of the formal system that lead to the creation of slums; and
• Tackling the shortages of urban land and housing that keep shelter out of reach of the
urban poor and force them to resort to extra-legal solutions in a bid to retain their
sources of livelihood and employment.
Under the Slum Free City Planning guidelines, there is a requirement for the Urban Local Bodies
(ULBs) to build an inventory of existing spatial data available with various agencies. Often ULBs,
other than metropolitan cities, do not have centralized spatial data. Under RAY, it is planned to
have ‘Technical Cell’, which will have responsibilities to coordinate and collect data from state
governments, NRSC/ISRO, Survey of India, National Informatics Centre (NIC) etc. If the city base
map is not available, a base map of the city would be generated using standard guidelines set
forth under the project.
CITY SANITATION PLAN GULBARGA
ADMINISTRATIVE STAFF COLLEGE OF INDIA, HYDERABAD 51 | P a g e
As given in the Slum Free City Planning (SFCP) guidelines, the preparation of Slum-free City Plan
will broadly involve survey of all slums – notified and non-notified; mapping of slums using the
state-of-art technology; integration of geo-spatial and socio-economic data; and identification of
development model proposed for each slum. To achieve these things, a systematic approach is
essential which will be useful for various other developmental planning initiatives for the urban
poor. The present technical manual details the steps to be followed for slum mapping using
satellite data, GPS, Total Station Survey in preparing GIS database, MIS development of non-
spatial data collected and integration of GIS with MIS to enable generating Plan of Action (PoA)
for slum free cities.
Rajiv Awas Yojana envisages that each State would prepare a State Slum-free Plan of Action
(POA). The preparation of legislation for assignment of property rights to slum dwellers would
be the first step for State POA. The POA would need to be in two parts,
Part-1 regarding the upgradation of existing slums and Part-2 regarding the action to prevent
new slums. In Part-1 the State would need to survey and map all exiting slums in selected cities
proposed by the State for coverage under RAY. In Part-2 the Plan would need to assess the rate
of growth of the city with a 20 year perspective, and based on the numbers specify the actions
proposed to be taken to obtain commensurate lands or virtual lands and promote the
construction of affordable EWS houses so as to stay abreast of the demand. This part would
need also to make necessary legislative and administrative changes to enable urban land
expansion, and in town planning regulations to legislate reservations for EWS/LIG housing in all
new developments.
Rajiv Awas Yojana (RAY) for the slum dwellers and the urban poor envisages a ‘Slum-free India’
through encouraging States/Union Territories to tackle the problem of slums in a definitive
manner. It calls for a multi-pronged approach focusing on:
• Bringing existing slums within the formal system and enabling them to avail of the
same level of basic amenities as the rest of the town;
• Redressing the failures of the formal system that lie behind the creation of slums; and
• Tackling the shortages of urban land and housing that keep shelter out of reach of the
urban poor and force them to resort to extra-legal solutions in a bid to retain their
sources of livelihood and employment.
Slum-free City Cell in Urban Local Body headed by the Municipal Commissioner/Executive
Officer will be primarily responsible for the preparation of Slum-free City Plans based on
guidelines provided by the concerned State Government and support extended by the Nodal
Agency for Rajiv Awas Yojana at the State level.
CITY SANITATION PLAN GULBARGA
ADMINISTRATIVE STAFF COLLEGE OF INDIA, HYDERABAD 52 | P a g e
2.10 URBAN STATISTICS FOR HR AND ASSESSMENTS (USHA)” Scheme Objectives
The Central Sector Scheme of “Urban Statistics for HR and Assessments (USHA)” aims at the
development and maintenance of national a database, MIS and knowledge repository relating to
urban poverty, slums, housing, construction and other urbanization-related statistics. Its key
objective is to support the Ministry of Housing & Urban Poverty Alleviation and other Ministries
with an information base and knowledge inputs for the purpose of planning, policy-making,
project design, formulation, implementation, monitoring and evaluation, particularly in the
context of programmes relating to urban poverty, slums and housing. It seeks to specially
support the effective implementation of Jawaharlal Nehru National Urban Renewal Mission –
Basic Services to the Urban Poor (BSUP) and Integrated Housing & Slum Development
Programme (IHSDP). The four pillars of “USHA” are: database including MIS & sample surveys;
action research; impact assessment; and capacity building/training.
USHA will coordinate applied research and capacity building activities pertaining to urban
poverty, slums, housing, construction and other urbanization-related statistics in collaboration
with reputed research and training institutions at national, regional and state levels and experts.
Scheme Components
The following components are envisaged under the “Urban Statistics for HR and Assessments
(USHA)” Scheme for which funding support will be provided:
Data Centre and MIS on Urban Poverty, Slums, Housing, Building Construction and
related Urbanisation Statistics.
Knowledge Centre/National Resource Centre for Urban Poverty and Slums
Sample Surveys in areas of Urban Poverty, Slums, Housing & Building Construction
Socio-Economic Research Studies in areas of Urban Poverty, Slums, Housing &
Building Construction
Capacity Building & Training in areas of Urban Poverty, Slums, Housing & Building
Construction Statistics
Publicity & Awareness
2.11 INTEREST SUBSIDY SCHEME FOR HOUSING THE URBAN POOR (ISHUP)
The Ministry of Housing and Urban Poverty Alleviation (MH&UPA), Government of India has
designed an Interest Subsidy Scheme as an additional instrument for addressing the housing
needs of the EWS/LIG segments in urban areas. The Scheme envisages the provision of interest
subsidy to EWS and LIG segments to enable them to buy or construct houses.
BROAD FEATURES OF THE SCHEME
2.1 Purpose - The Scheme will provide home loan with Central Government subsidy to
EWS/LIG persons for acquisition of house as also for construction of house to such beneficiary,
who does not own a house in his/her name or in the name of his/her spouse or any dependent
CITY SANITATION PLAN GULBARGA
ADMINISTRATIVE STAFF COLLEGE OF INDIA, HYDERABAD 53 | P a g e
child. Such beneficiaries who own land in any urban area but do not have any pucca house in
their name or in the name of their spouse or any dependent child will also be covered under the
Scheme.
2.2 Eligibility - The economic parameter of EWS is defined as households having an average
monthly income upto Rs.3,300 and the economic parameter of LIG is defined as households
having an average monthly income between Rs.3,301 upto Rs.7,300. This will be subject to
revision by the Steering Committee of the Scheme from time to time.
2.3 Loan amount admissible - The scheme will provide a subsidized loan for 15 – 20 years for
a maximum amount of Rs.1,00,000 for an EWS individual A maximum loan amount of
Rs.1,60,000 for a LIG individual for a house at least of 40 sq.mts will be admissible. However,
subsidy will be given for loan amount upto Rs. 1 lakh only. Additional loans, if needed would be
at unsubsidized rates.
In identifying beneficiaries, the ULB or the local agency identified by the State should as far as
possible identify clusters in which land has been allotted and housing can be supported through
this scheme within such clusters. The Preference under the Scheme (subject to beneficiaries
being from EWS/LIG segments) should be given to the following in accordance with their
proportion in the total population of City / urban agglomerate during the 2001 Census.
i. Scheduled Caste;
ii. Scheduled Tribe;
iii. Minorities;
iv. Persons with disabilities; and
v. Women beneficiaries.
2.12 13TH CENTRAL FINANCE COMMISSION (CFC)
Importantly, the report of 13th CFC released in February 2010 recommended general
performance grants and special area performance grants to be linked to performance of ULBs.
Moreover, allocations to ULBs would now be linked to divisible pool replacing the previous ad-
hoc allocation. It has recommended grants of Rs. 23,111 crores to ULBs during 2010-15, a four-
fold growth over the 12th CFC allocation. The 13th CFC recommends state governments and ULBs
to focus on improved property tax revenues, urban service standards, strengthened local body
framework, improved municipal accounting, introduce system of independent ombudsmen, and
put in place a system of electronic transfer of grants to ULBs among other things.
2.13 NATIONAL MISSION ON SUSTAINABLE HABITAT
One of the eight Missions as part of the Prime Minister action plan for climate change, is on the
National Mission on Sustainable Habitat was assigned to this Ministry. MOUD formulated the
Mission document through several round of consultations and discussions. The document was
finally approved by the Prime Minister’s Council on Climate Change in June 2010. The objective
of the Mission is to promote sustainability of habitats through improvements in energy
efficiency in buildings, urban planning, improved management of solid and liquid waste
CITY SANITATION PLAN GULBARGA
ADMINISTRATIVE STAFF COLLEGE OF INDIA, HYDERABAD 54 | P a g e
including recycling and power generation, modal shift towards public transport and
conservation. It also seeks to improve ability of habitats to adapt to climate change by
improving resilience of infrastructure, community based disaster management and measures
for improving advance warning systems for extreme weather events.
Under this cities are eligible for implementing demonstration projects in SWM, storm water
management, and Waste water treatment. MoUD is also identifying capacity needs and
earmarked lot of funds for this purpose.
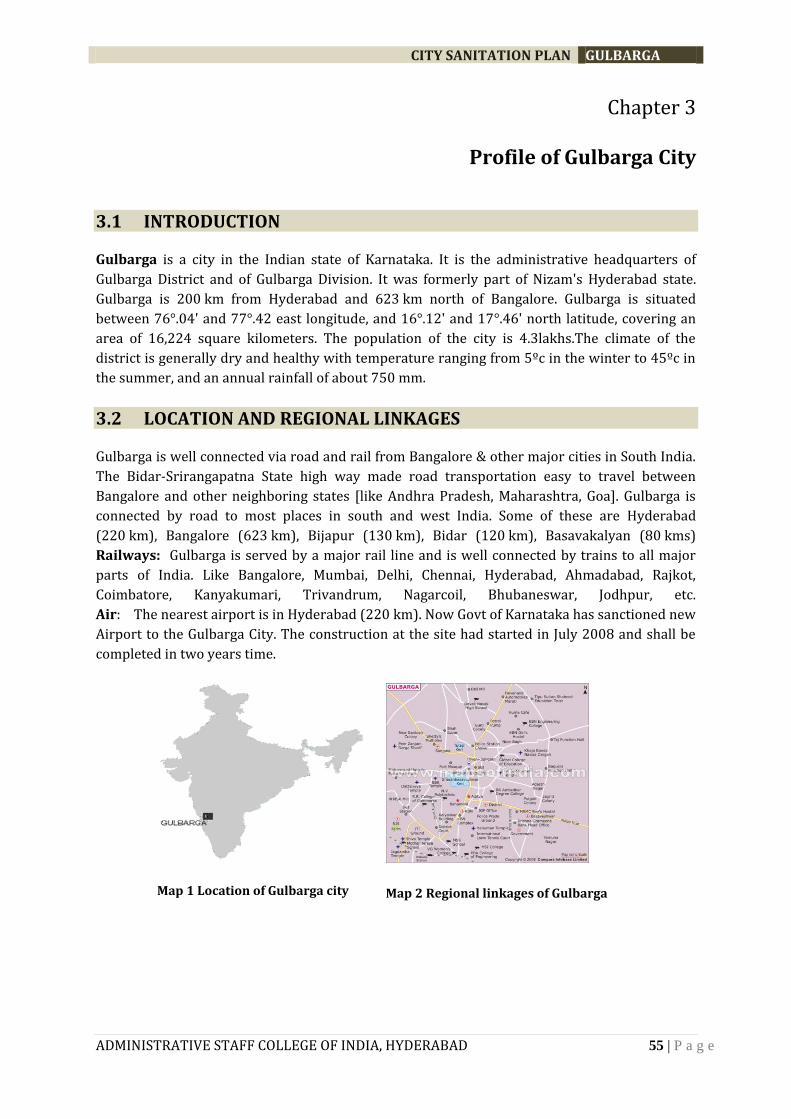
CITY SANITATION PLAN GULBARGA
ADMINISTRATIVE STAFF COLLEGE OF INDIA, HYDERABAD 55 | P a g e
Chapter 3
Profile of Gulbarga City
3.1 INTRODUCTION
Gulbarga is a city in the Indian state of Karnataka. It is the administrative headquarters of
Gulbarga District and of Gulbarga Division. It was formerly part of Nizam's Hyderabad state.
Gulbarga is 200 km from Hyderabad and 623 km north of Bangalore. Gulbarga is situated
between 76°.04' and 77°.42 east longitude, and 16°.12' and 17°.46' north latitude, covering an
area of 16,224 square kilometers. The population of the city is 4.3lakhs.The climate of the
district is generally dry and healthy with temperature ranging from 5ºc in the winter to 45ºc in
the summer, and an annual rainfall of about 750 mm.
3.2 LOCATION AND REGIONAL LINKAGES
Gulbarga is well connected via road and rail from Bangalore & other major cities in South India.
The Bidar-Srirangapatna State high way made road transportation easy to travel between
Bangalore and other neighboring states [like Andhra Pradesh, Maharashtra, Goa]. Gulbarga is
connected by road to most places in south and west India. Some of these are Hyderabad
(220 km), Bangalore (623 km), Bijapur (130 km), Bidar (120 km), Basavakalyan (80 kms)
Railways: Gulbarga is served by a major rail line and is well connected by trains to all major
parts of India. Like Bangalore, Mumbai, Delhi, Chennai, Hyderabad, Ahmadabad, Rajkot,
Coimbatore, Kanyakumari, Trivandrum, Nagarcoil, Bhubaneswar, Jodhpur, etc.
Air: The nearest airport is in Hyderabad (220 km). Now Govt of Karnataka has sanctioned new
Airport to the Gulbarga City. The construction at the site had started in July 2008 and shall be
completed in two years time.
Map 1 Location of Gulbarga city
Map 2 Regional linkages of Gulbarga
CITY SANITATION PLAN GULBARGA
ADMINISTRATIVE STAFF COLLEGE OF INDIA, HYDERABAD 56 | P a g e
3.3 CLIMATE
The weather in Gulbarga constitutes of 3 main seasons. The summer which spans from late
February to mid-June. It is followed by the south west monsoon which spans from the late June
to late September. It is then followed by dry winter weather until mid-January.
Temperatures during the different seasons are:
1. Summer : 40 to 44 °C
2. Monsoon: 27 to 34 °C
3. Winter : 10 to 26 °C
The climate of the region is predominantly extreme in summer season. Although it is divided
into three distinct seasons: summer, from February to July; monsoon, from August to
September; and winter, from October to January; the city experience generally hot and humid
climate with prolonged summer. The Temperature ranges from 40oC to 16oC. The humidity
ranges between 60 percent and 40 percent. The average annual rainfall is around 730 mm. This
region has suffered from failure of monsoons since last three years.
3.4 TOPOGRAPHY
The entire city is situated in Deccan Plateau and the general elevation ranges from 300 to 750
meters above mean sea level. Black and red soil is predominant soil type in the district. Located
on vast expanse of gently undulating plain, the terrain drains towards south and southeast
towards BhimaRiver (25 kms away). The city is surrounded by small hillocks towards the north
and northwest side. The city is spread around the natural lake (The SharanaBasveshwara Tank),
which is the lowest point of the city and catchment for all run-off and storm
3.5 BRIEF HISTORY
In the 6th century, the Rashtrakutas gained control over the area around present-day Gulbarga,
but the Chalukyas regained their domain and reigned for over two hundred years. Around the
close of the 12th century, the Yadavas of Devagiri and the Hoysalas of Halebidu took control of
the district. The present Gulbarga District and Raichur District formed part of their domain.
The city of Gulbarga was founded by the Bahmani Sultans in the 14th century as their capital.
The northern Deccan, including the district of Gulbarga, passed under control of the Muslim
Sultanate of Delhi. The revolt of the Muslim officers appointed from Delhi resulted in founding
of the Bahmani Sultanate in 1347 by Hassan Gangu, who chose Gulbarga (Ahsenabad during this
period) to be his capital.
From 1724 to 1948 Gulbarga was part of Hyderabad state ruled by the famous Nizams. It was
integrated into India in September 1948 after the Indian army defeated the Nizam.
CITY SANITATION PLAN GULBARGA
ADMINISTRATIVE STAFF COLLEGE OF INDIA, HYDERABAD 57 | P a g e
3.6 REGIONAL IMPORTANCE
Gulbarga's old moated fort is in a much deteriorated state, but it has a number of interesting
buildings inside including the Jama Masjid, reputed to have been built by a Moorish architect
during the late 14th or early 15th century who imitated the great mosque in Cordoba, Spain.
The mosque is unique in India, with a huge dome covering the whole area, four smaller ones at
the corners, and 75 smaller still all the way around. The fort itself has 15 towers. Gulbarga also
has a number of imposing tombs of Bahmani kings, a shrine to an important Muslim saint,
SharanaBasaveshwara Temple, Sri Sai baba temple, Sri Ram Mandir and Sri Bhavani Shankar
temple(SriSadashivmaharaj).
Sri KshetraGhangapur is a famous pilgrimage center of God Sri SadguruDattarya, situated very
close to Gulbarga. Thousands of pilgrims visit Gulbarga during the annual festival held at the
holy shrine of KhwajaBande Nawaz Darga to commemorate his death anniversary.
3.7 ECONOMY Agriculture is the main source of income here. Though the land here is dry, much of the farming
is dependent on rains(non-irrigated).Gulbarga is one of the largest red grams producing areas in
the State and has the largest dal mills. The main soil found in the district is black soil, which
facilitates the cultivation of crops like jowar, groundnut, rice, sugarcane, sunflower, wheat,
cotton, linseed and pulses. Gulbarga is also known for rose cultivation. The Upper Krishna
Project in the district is a major irrigational venture. Some of the major industries in the region
are textile, leather and chemical industries. Other major industry is cement, Birla group's
Vasavadatta cement plant is located in Sedam, Rajashree cement is located in Malkhed, ACC
cement in Wadi which are considered as some of the major cluster of cement industries in India.
The next major source of income now is IT as most of the Professionals after completing their
academics move to IT hubs such as Bangalore, Hyderabad etc. There are only two classes of
people here, the very poor and the very rich. The government has yet to take major decisions to
make Gulbarga an IT hub. Education Gulbarga basically developed as an educational hub right
from the Nizams time and continues till date. Gulbarga has a university Gulbarga University
established in 1980. Its jurisdiction extends to the five districts of Gulbarga, Bidar, Raichur,
Bellary and Koppal. Earlier it was a post-graduate centre of Karnatak University, Dharwad since
1970. The main campus is situated on a 860 acres (3.5 km2) of land, 6 kilo meters east of
Gulbarga city. It has 37 post-graduate departments and 4 post-graduate centres located at
Krishnadevarayanagar, Bellary, Raichur and Bidar. Another post-graduate centre at
Basavakalyan is on the anvil. There are 230 colleges affiliated to this University which enroll
graduate/diploma courses in arts, fine arts, music, social sciences, science & technology,
commerce, education and law. A new Plan for the Central University had been proposed to be
built in the city in a few Years. Gulbarga is famous as the 'City of Education' for the Great
Institutions Managed by private as well as the government sectors.
3.8 DEMOGRAPHY
Gulbarga city accounts for 14% of the district’s total population and about 50% of its urban
population. As per census 2001 the city addressed as Gulbarga Urban Agglomeration(GUA)
comprises of city corporation Gulbarga and three outgrowths namely Kusnoor(part), Rajapur
and Kotnoor Darwesh. The city experienced an average population growth rate of 40% in the
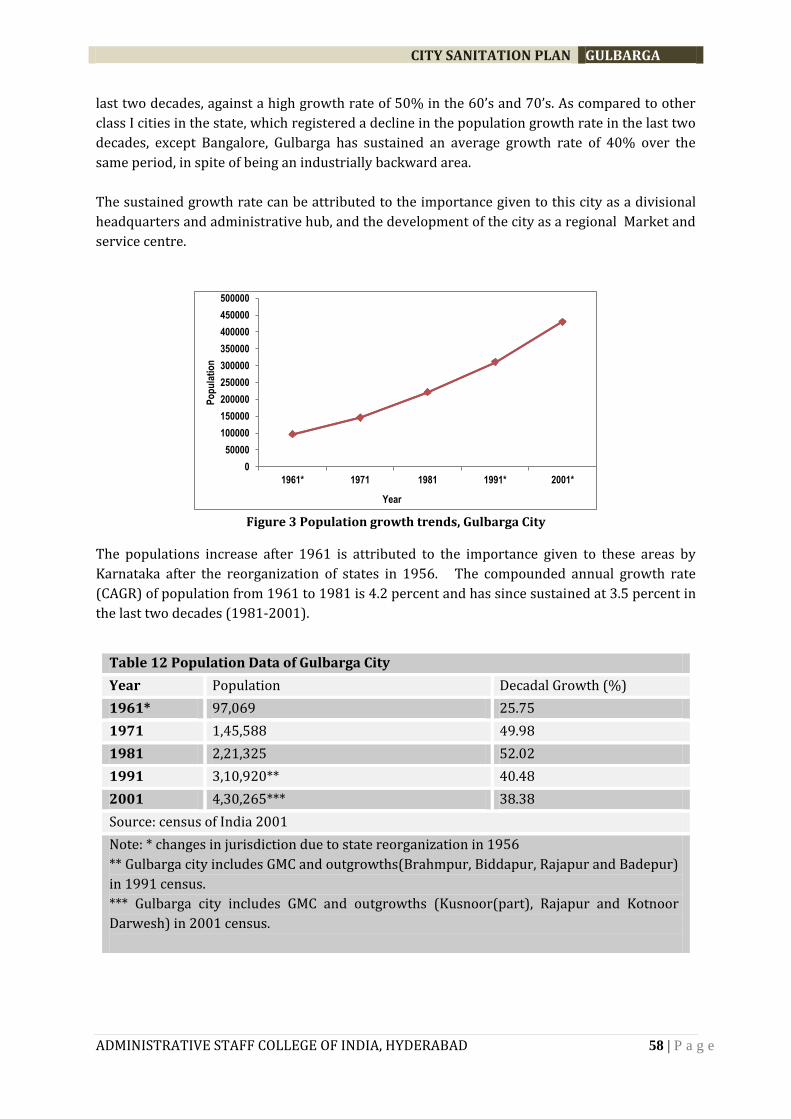
CITY SANITATION PLAN GULBARGA
ADMINISTRATIVE STAFF COLLEGE OF INDIA, HYDERABAD 58 | P a g e
last two decades, against a high growth rate of 50% in the 60’s and 70’s. As compared to other
class I cities in the state, which registered a decline in the population growth rate in the last two
decades, except Bangalore, Gulbarga has sustained an average growth rate of 40% over the
same period, in spite of being an industrially backward area.
The sustained growth rate can be attributed to the importance given to this city as a divisional
headquarters and administrative hub, and the development of the city as a regional Market and
service centre.
Figure 3 Population growth trends, Gulbarga City
The populations increase after 1961 is attributed to the importance given to these areas by
Karnataka after the reorganization of states in 1956. The compounded annual growth rate
(CAGR) of population from 1961 to 1981 is 4.2 percent and has since sustained at 3.5 percent in
the last two decades (1981-2001).
0
50000
100000
150000
200000
250000
300000
350000
400000
450000
500000
1961* 1971 1981 1991* 2001*
Po
pu
lati
on
Year
Table 12 Population Data of Gulbarga City
Year Population Decadal Growth (%)
1961* 97,069 25.75
1971 1,45,588 49.98
1981 2,21,325 52.02
1991 3,10,920** 40.48
2001 4,30,265*** 38.38
Source: census of India 2001
Note: * changes in jurisdiction due to state reorganization in 1956
** Gulbarga city includes GMC and outgrowths(Brahmpur, Biddapur, Rajapur and Badepur)
in 1991 census.
*** Gulbarga city includes GMC and outgrowths (Kusnoor(part), Rajapur and Kotnoor
Darwesh) in 2001 census.
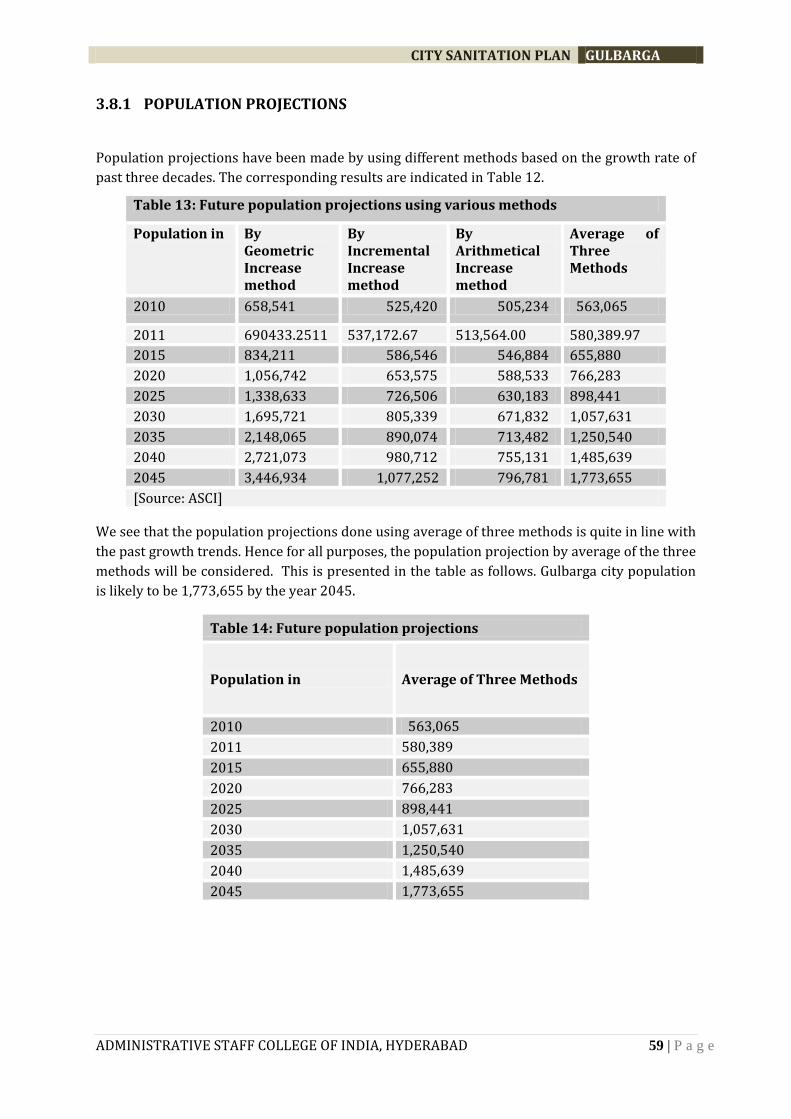
CITY SANITATION PLAN GULBARGA
ADMINISTRATIVE STAFF COLLEGE OF INDIA, HYDERABAD 59 | P a g e
3.8.1 POPULATION PROJECTIONS
Population projections have been made by using different methods based on the growth rate of
past three decades. The corresponding results are indicated in Table 12.
Table 13: Future population projections using various methods
Population in By Geometric Increase method
By Incremental Increase method
By Arithmetical Increase method
Average of Three Methods
2010 658,541 525,420 505,234 563,065
2011 690433.2511 537,172.67 513,564.00 580,389.97
2015 834,211 586,546 546,884 655,880
2020 1,056,742 653,575 588,533 766,283
2025 1,338,633 726,506 630,183 898,441
2030 1,695,721 805,339 671,832 1,057,631
2035 2,148,065 890,074 713,482 1,250,540
2040 2,721,073 980,712 755,131 1,485,639
2045 3,446,934 1,077,252 796,781 1,773,655
[Source: ASCI]
We see that the population projections done using average of three methods is quite in line with
the past growth trends. Hence for all purposes, the population projection by average of the three
methods will be considered. This is presented in the table as follows. Gulbarga city population
is likely to be 1,773,655 by the year 2045.
Table 14: Future population projections
Population in Average of Three Methods
2010 563,065
2011 580,389
2015 655,880
2020 766,283
2025 898,441
2030 1,057,631
2035 1,250,540
2040 1,485,639
2045 1,773,655
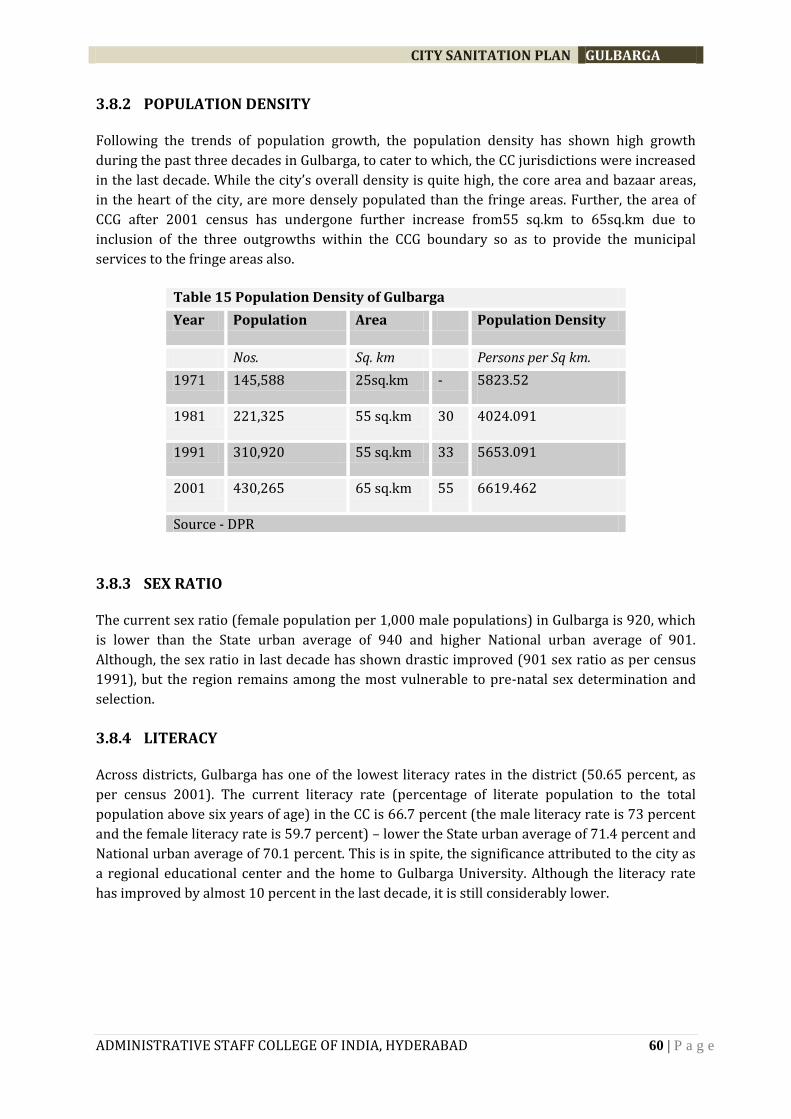
CITY SANITATION PLAN GULBARGA
ADMINISTRATIVE STAFF COLLEGE OF INDIA, HYDERABAD 60 | P a g e
3.8.2 POPULATION DENSITY
Following the trends of population growth, the population density has shown high growth
during the past three decades in Gulbarga, to cater to which, the CC jurisdictions were increased
in the last decade. While the city’s overall density is quite high, the core area and bazaar areas,
in the heart of the city, are more densely populated than the fringe areas. Further, the area of
CCG after 2001 census has undergone further increase from55 sq.km to 65sq.km due to
inclusion of the three outgrowths within the CCG boundary so as to provide the municipal
services to the fringe areas also.
Table 15 Population Density of Gulbarga
Year Population Area Population Density
Nos. Sq. km Persons per Sq km.
1971 145,588 25sq.km - 5823.52
1981 221,325 55 sq.km 30 4024.091
1991 310,920 55 sq.km 33 5653.091
2001 430,265 65 sq.km 55 6619.462
Source - DPR
3.8.3 SEX RATIO
The current sex ratio (female population per 1,000 male populations) in Gulbarga is 920, which
is lower than the State urban average of 940 and higher National urban average of 901.
Although, the sex ratio in last decade has shown drastic improved (901 sex ratio as per census
1991), but the region remains among the most vulnerable to pre-natal sex determination and
selection.
3.8.4 LITERACY
Across districts, Gulbarga has one of the lowest literacy rates in the district (50.65 percent, as
per census 2001). The current literacy rate (percentage of literate population to the total
population above six years of age) in the CC is 66.7 percent (the male literacy rate is 73 percent
and the female literacy rate is 59.7 percent) – lower the State urban average of 71.4 percent and
National urban average of 70.1 percent. This is in spite, the significance attributed to the city as
a regional educational center and the home to Gulbarga University. Although the literacy rate
has improved by almost 10 percent in the last decade, it is still considerably lower.
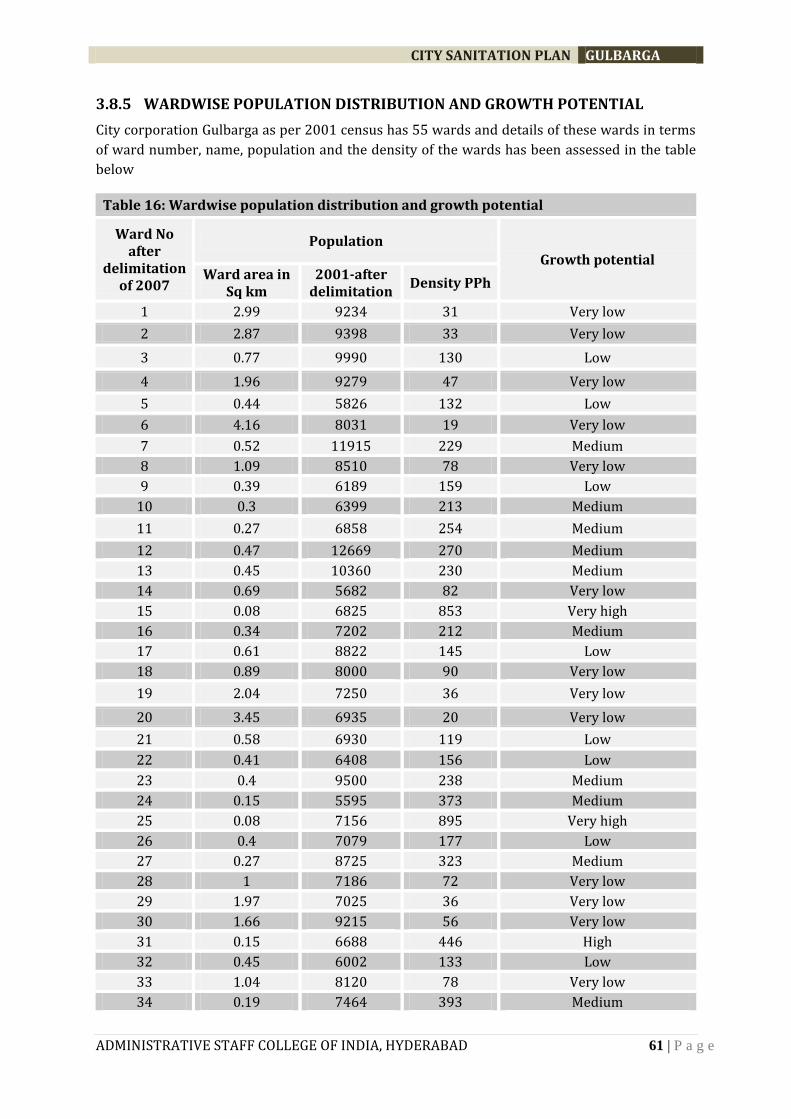
CITY SANITATION PLAN GULBARGA
ADMINISTRATIVE STAFF COLLEGE OF INDIA, HYDERABAD 61 | P a g e
3.8.5 WARDWISE POPULATION DISTRIBUTION AND GROWTH POTENTIAL
City corporation Gulbarga as per 2001 census has 55 wards and details of these wards in terms
of ward number, name, population and the density of the wards has been assessed in the table
below
Table 16: Wardwise population distribution and growth potential
Ward No after
delimitation of 2007
Population
Growth potential Ward area in
Sq km 2001-after
delimitation Density PPh
1 2.99 9234 31 Very low
2 2.87 9398 33 Very low
3 0.77 9990 130 Low
4 1.96 9279 47 Very low
5 0.44 5826 132 Low
6 4.16 8031 19 Very low
7 0.52 11915 229 Medium
8 1.09 8510 78 Very low
9 0.39 6189 159 Low
10 0.3 6399 213 Medium
11 0.27 6858 254 Medium
12 0.47 12669 270 Medium
13 0.45 10360 230 Medium
14 0.69 5682 82 Very low
15 0.08 6825 853 Very high
16 0.34 7202 212 Medium
17 0.61 8822 145 Low
18 0.89 8000 90 Very low
19 2.04 7250 36 Very low
20 3.45 6935 20 Very low
21 0.58 6930 119 Low
22 0.41 6408 156 Low
23 0.4 9500 238 Medium
24 0.15 5595 373 Medium
25 0.08 7156 895 Very high
26 0.4 7079 177 Low
27 0.27 8725 323 Medium
28 1 7186 72 Very low
29 1.97 7025 36 Very low
30 1.66 9215 56 Very low
31 0.15 6688 446 High
32 0.45 6002 133 Low
33 1.04 8120 78 Very low
34 0.19 7464 393 Medium
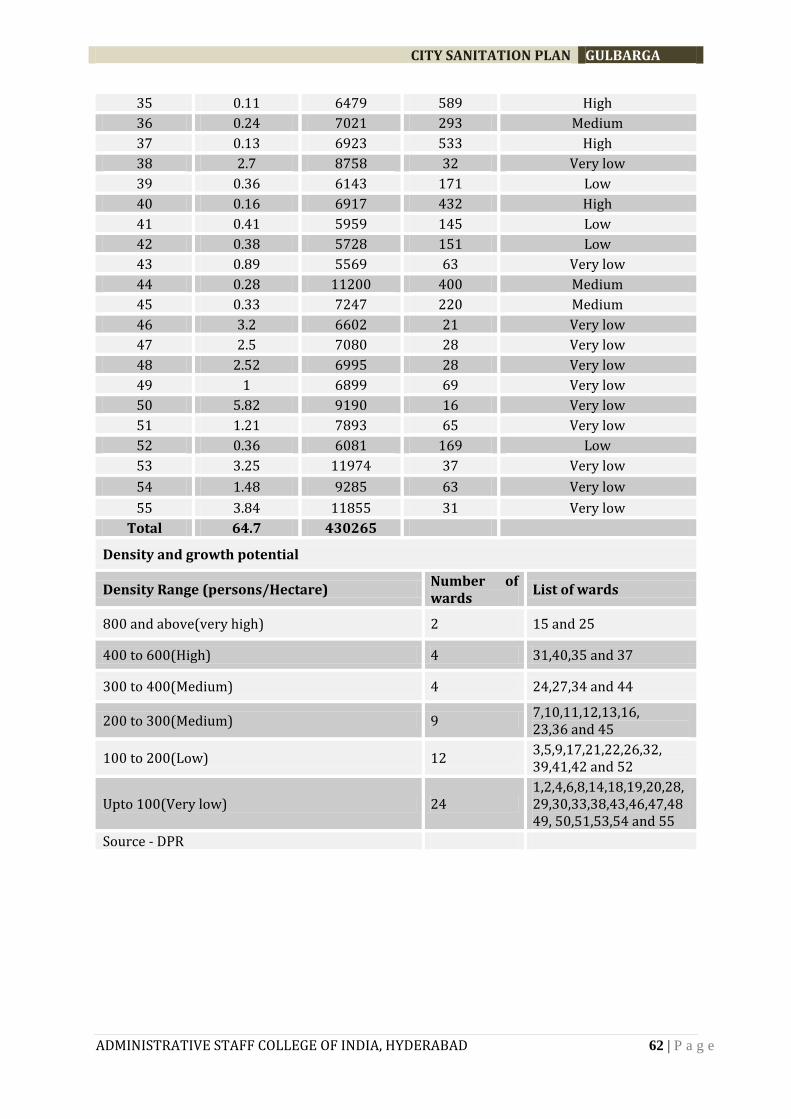
CITY SANITATION PLAN GULBARGA
ADMINISTRATIVE STAFF COLLEGE OF INDIA, HYDERABAD 62 | P a g e
35 0.11 6479 589 High
36 0.24 7021 293 Medium
37 0.13 6923 533 High
38 2.7 8758 32 Very low
39 0.36 6143 171 Low
40 0.16 6917 432 High
41 0.41 5959 145 Low
42 0.38 5728 151 Low
43 0.89 5569 63 Very low
44 0.28 11200 400 Medium
45 0.33 7247 220 Medium
46 3.2 6602 21 Very low
47 2.5 7080 28 Very low
48 2.52 6995 28 Very low
49 1 6899 69 Very low
50 5.82 9190 16 Very low
51 1.21 7893 65 Very low
52 0.36 6081 169 Low
53 3.25 11974 37 Very low
54 1.48 9285 63 Very low
55 3.84 11855 31 Very low
Total 64.7 430265
Density and growth potential
Density Range (persons/Hectare) Number of wards
List of wards
800 and above(very high) 2 15 and 25
400 to 600(High) 4 31,40,35 and 37
300 to 400(Medium) 4 24,27,34 and 44
200 to 300(Medium) 9 7,10,11,12,13,16, 23,36 and 45
100 to 200(Low) 12 3,5,9,17,21,22,26,32, 39,41,42 and 52
Upto 100(Very low) 24 1,2,4,6,8,14,18,19,20,28, 29,30,33,38,43,46,47,48 49, 50,51,53,54 and 55
Source - DPR
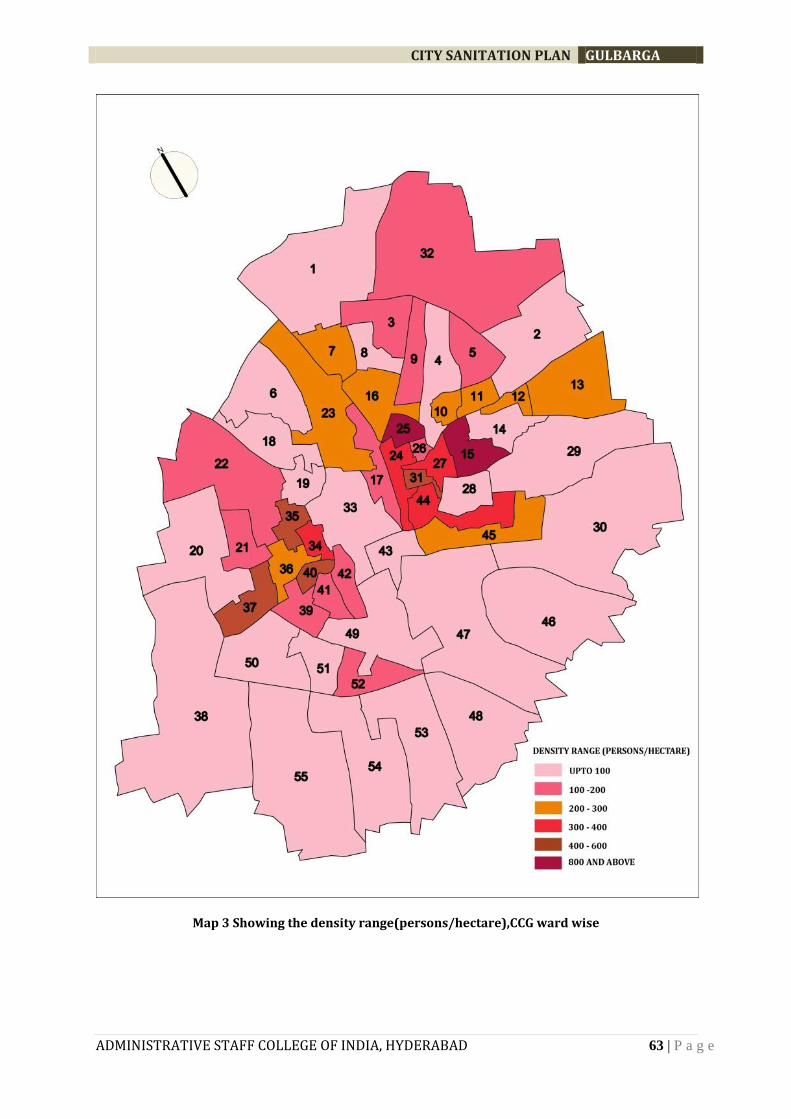
CITY SANITATION PLAN GULBARGA
ADMINISTRATIVE STAFF COLLEGE OF INDIA, HYDERABAD 63 | P a g e
Map 3 Showing the density range(persons/hectare),CCG ward wise
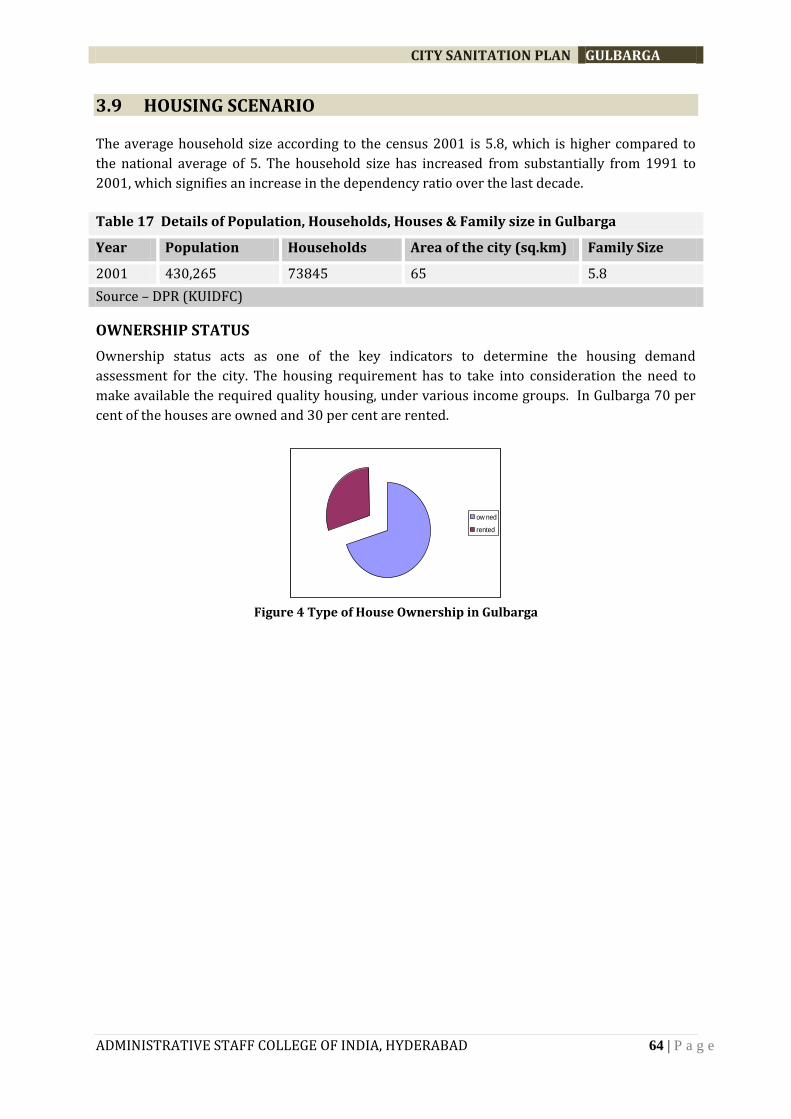
CITY SANITATION PLAN GULBARGA
ADMINISTRATIVE STAFF COLLEGE OF INDIA, HYDERABAD 64 | P a g e
3.9 HOUSING SCENARIO
The average household size according to the census 2001 is 5.8, which is higher compared to
the national average of 5. The household size has increased from substantially from 1991 to
2001, which signifies an increase in the dependency ratio over the last decade.
Table 17 Details of Population, Households, Houses & Family size in Gulbarga
Year Population Households Area of the city (sq.km) Family Size
2001 430,265 73845 65 5.8
Source – DPR (KUIDFC)
OWNERSHIP STATUS
Ownership status acts as one of the key indicators to determine the housing demand
assessment for the city. The housing requirement has to take into consideration the need to
make available the required quality housing, under various income groups. In Gulbarga 70 per
cent of the houses are owned and 30 per cent are rented.
Figure 4 Type of House Ownership in Gulbarga
ow ned
rented
CITY SANITATION PLAN GULBARGA
ADMINISTRATIVE STAFF COLLEGE OF INDIA, HYDERABAD 65 | P a g e
3.10 SLUMS AND SQUATTER SETTLEMENTS
Slums – Existing Scenario
In Gulbarga there are 61 slums. Asha Kiran Mahiti (a web-based project on slums of Karnataka prepared by Municipal Reforms
Cell, Karnataka) has identified 61 slum areas – 43 notified and 18 non-notified. The total population living in the slums is 60196
(year 2010) and accounting to 11 per cent of the city population. The total number of slum households is 12085 accounting to
nearly 16 per cent of the total households in the city.
Table 18: Details of slum areas, CCG
Sl. No.
Ward No.
Slum Name Slum Type
Land ownership
Slum Area
Slum Popn
Slum Density (persons/sq.km)
Slum HHs
BPL Popn
BPL HHs
1 54 Ambika Nagar Tarfile Notified Local Body 0.031 783 25258.06 140 640 116
2 8 Arya Nagar. A.M.P.C Back Notified
State Government 0.008 312 39000.00 58 307 57
3 43 Bapu Nagar Jagat Notified State Government 0.026 2380 91538.46 439 2251 415
4 40 Basava Nagar- Brahmpur Notified Local Body 0.075 813 10840.00 187 798 181
5 6 Basavanna Nagar Non-Notified Other 0.066 339 5136.36 63 315 58
6 3
Bhavani Nagar Ward No. 03. Poojari Math
Non-Notified Private 0.03 1517 50566.67 337 997 211
7 40 Borabai nagar-
Notified Local Body 0.03 207 6900.00 48 62 15
CITY SANITATION PLAN GULBARGA
ADMINISTRATIVE STAFF COLLEGE OF INDIA, HYDERABAD 66 | P a g e
Brahmpur
8 40 Brahmpur Waddar wada Notified
State Government 0.01 1131 113100.00 234 587 122
9 53 Budha Nagar (South)Tarfile Notified Local Body 0.005 727 145400.00 155 625 134
10 53 Budha Nagar Tarfile Notified
State Government 0.007 1397 199571.43 254 1021 192
11 45 CMC Labour Colony. M.B. Nagar Notified
State Government 0.017 620 36470.59 118 246 51
12 22 Gandhi Leprosi Colony Aland Road Notified Local Body 0.012 597 49750.00 134 477 106
13 35 Ganga nagar-Brahmpur Notified Local Body 0.053 1042 19660.38 219 271 56
14 31 Gazipur Notified State Government 0.016 1619 101187.50 307 1278 249
15 31 Gazipura Sy. No. 44 Non-Notified Other 0.003 271 90333.33 50 263 49
16 52 Hamalwadi Non-Notified Private 0.004 464 116000.00 96 464 96
17 48 Hanuman Tanda Naganhalli Notified Local Body 0.029 611 21068.97 129 606 128
18 12 Haralayya Samaj Roza Notified Private 0.003 713 237666.67 147 687 142
CITY SANITATION PLAN GULBARGA
ADMINISTRATIVE STAFF COLLEGE OF INDIA, HYDERABAD 67 | P a g e
19 52 Hauman Nagar Part-1 Notified Private 0.009 696 77333.33 153 589 131
20 52 Hauman nagar Part-2 Notified Private 0.013 1422 109384.62 283 1276 253
21 50 Heerapur Cross (Afzalpur Road)
Non-Notified Other 0.004 47 11750.00 8 11 3
22 38 Heerapur Harijan Wada (Part II)
Non-Notified
State Government 0.188 2059 10952.13 371 1791 325
23 38 Hirapur Notified Local Body 0.067 1622 24208.96 300 1367 251
24 49 Indira Nagar Court Notified Private 0.025 2324 92960.00 527 1691 393
25 45
Jagajeevan Ram Nagar (R.T.O Office Back Area )
Non-Notified
State Government 0.005 264 52800.00 50 264 50
26 43 Jai Bheem nagar Jagat Notified Local Body 0.011 564 51272.73 89 524 83
27 37 Jjlanabad.M.S.K.Mill Area Notified Local Body 0.113 1494 13221.24 293 1359 271
28 17 Joshi wada (Bambu Bazar) Notified
State Government 0.002 508 254000.00 91 491 87
29 21 Kanakpur Non-Notified Private 0.037 1880 50810.81 408 1478 321
30 32 Kapnur Harizan wada (East Part) Notified Local Body 0.025 1668 66720.00 342 1390 278
CITY SANITATION PLAN GULBARGA
ADMINISTRATIVE STAFF COLLEGE OF INDIA, HYDERABAD 68 | P a g e
31 14 Khanapur Roza Notified Local Body 0.021 552 26285.71 103 530 100
32 41 Kunchi Korwar Galli Ram Nagar Notified
State Government 0.005 1518 303600.00 277 1055 190
33 32 Kutuba Kalyan Nagara Notified Other 0.024 471 19625.00 121 344 86
34 23 Kyateshwar Nagar Non-Notified
State Government 0.004 382 95500.00 70 231 43
35 23 Lambani Tanda Shaha Bazar Notified
State Government 0.009 391 43444.44 70 371 67
36 18 Mahadev Nagar Non-Notified Private 0.013 980 75384.62 208 818 177
37 45 Mangarwadi M.R.M.C Opposite Notified
State Government 0.012 1026 85500.00 192 616 119
38 23 Nehru Nagar (D R Polic Qrts)
Non-Notified Other 0.007 529 75571.43 97 526 96
39 23 Nehru Nagar (Filter bed Area)
Non-Notified Private 0.012 6 500.00 1 6 1
40 23 Nehru Nagar Langoti Peer Darga
Non-Notified Private 0.016 858 53625.00 188 616 136
41 32 Pandit Deendayal Upadyanagar Notified Other 0.06 1343 22383.33 285 1337 284
42 46 Rajapur Shahabad Road Sy. No 46
Non-Notified Other 0.004 249 62250.00 50 243 49
CITY SANITATION PLAN GULBARGA
ADMINISTRATIVE STAFF COLLEGE OF INDIA, HYDERABAD 69 | P a g e
43 46 Rajapur Village Notified Local Body 0.041 1490 36341.46 300 1067 210
44 18 Rajiv Gandhi Nagar Shaikh Roza Notified
State Government 0.055 1630 29636.36 314 1565 301
45 12 Ramji Nagar Roza Notified State Government 0.013 1068 82153.85 194 1025 187
46 22 Ramthreeth Nagar (Aland Road)
Non-Notified Other 0.005 281 56200.00 52 245 45
47 44
Sangtras Wadi Near Margamma Temple Notified Private 0.009 752 83555.56 121 654 107
48 6 Sanjay Gandhi Nagar Shaik Roza Notified
State Government 0.04 1711 42775.00 333 1592 309
49 8 Sanjivanagar Gunj Cotton Market Notified
State Government 0.021 897 42714.29 167 897 167
50 23 Shaha Bazar Hrizanwada Notified
State Government 0.005 561 112200.00 106 538 101
51 23 Shaha Bazar Tanda Notified State Government 0.048 726 15125.00 128 678 121
52 42 Shamsunder Nagar. S. B. College Back Notified Local Body 0.006 1251 208500.00 267 751 163
53 23 Shiv Shakti Nagar Non-Notified Private 0.045 439 9755.56 83 403 77
54 50 Siddhartha Nagar Non-
Private 0.018 870 48333.33 184 826 176
CITY SANITATION PLAN GULBARGA
ADMINISTRATIVE STAFF COLLEGE OF INDIA, HYDERABAD 70 | P a g e
Notified
55 23 Sunil nagar Shaha Bazar Notified
State Government 0.002 223 111500.00 44 223 44
56 5 Syed Galli Roza Notified Local Body 0.023 522 22695.65 108 262 49
57 53 Tarfail (East) K.E.B. Non-Notified Private 0.069 694 10057.97 155 661 148
58 53 Tarfile Notified Private 0.031 2966 95677.42 617 2714 571
59 53 Tarfile Ward No. 48
Non-Notified Other 0.027 2514 93111.11 524 2429 510
60 36 Vijay nagar Brahmpur Notified Local Body 0.023 1952 84869.57 458 1541 360
61 41 kirtinagar (Krishna nagar)-Brahmpur Notified
State Government 0.014 1253 89500.00 238 1130 216
Total 60196 4313233.883 12085 50020 10034
[Source: Asha Kiran Mahiti, 2010
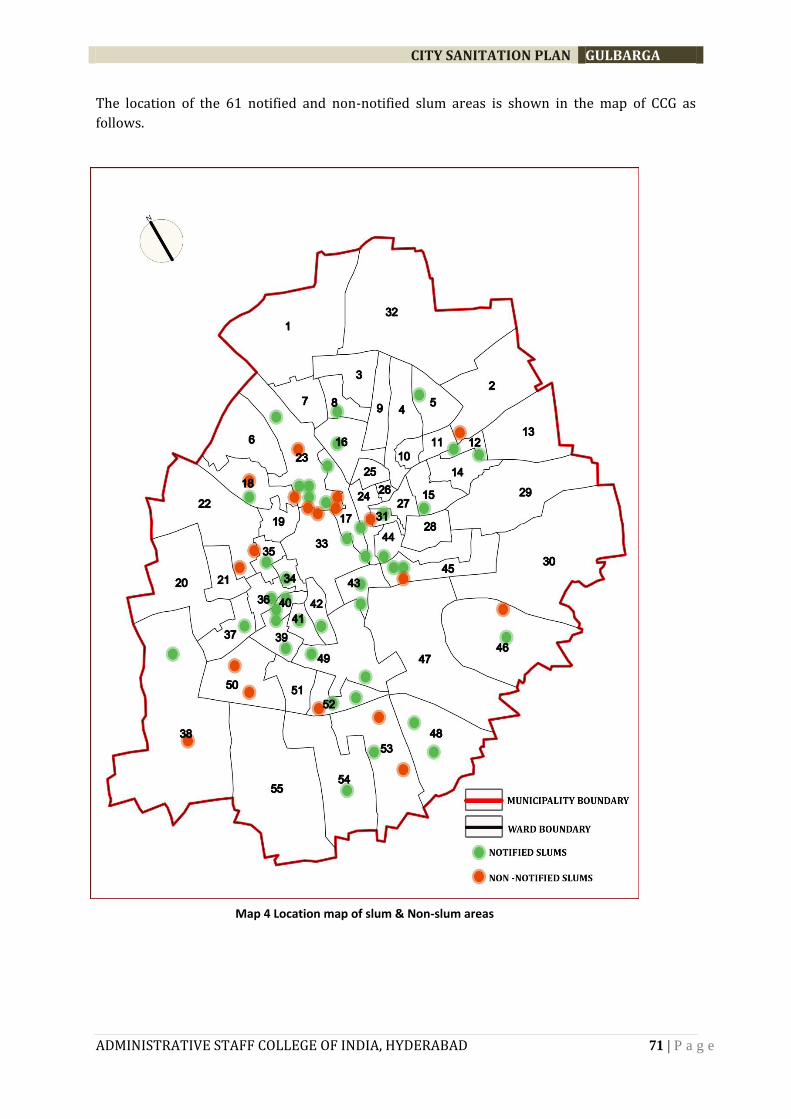
CITY SANITATION PLAN GULBARGA
ADMINISTRATIVE STAFF COLLEGE OF INDIA, HYDERABAD 71 | P a g e
The location of the 61 notified and non-notified slum areas is shown in the map of CCG as
follows.
Map 4 Location map of slum & Non-slum areas
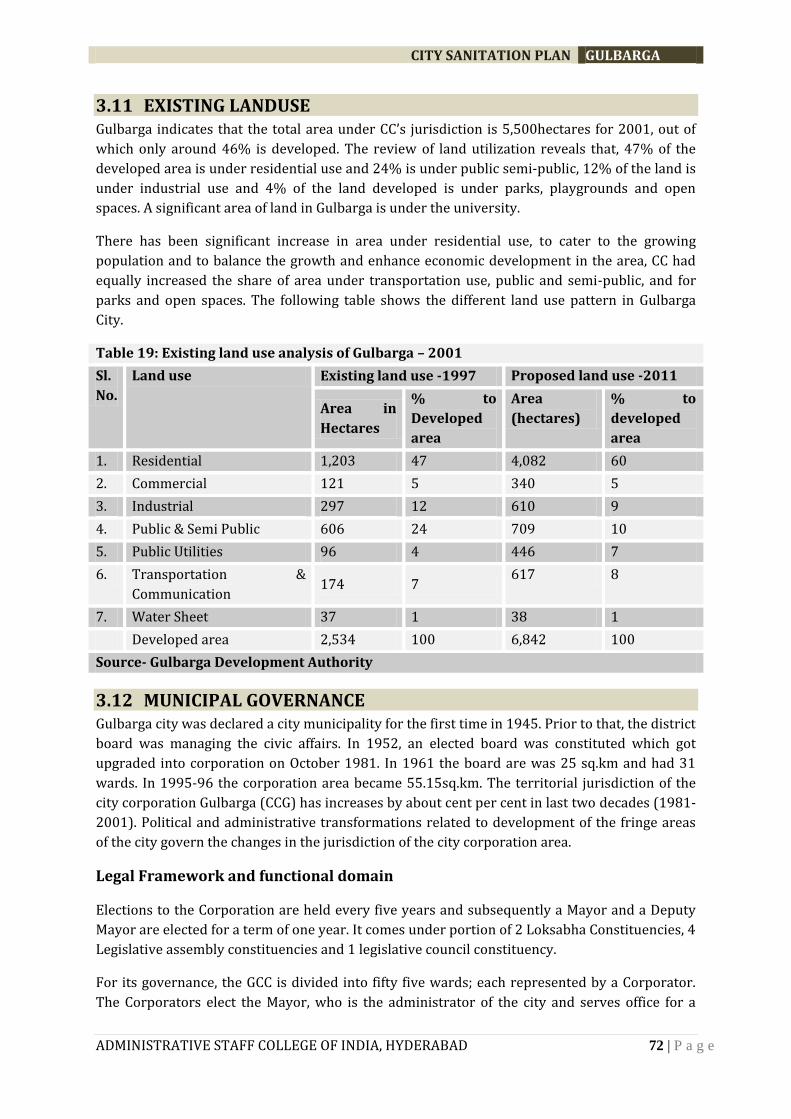
CITY SANITATION PLAN GULBARGA
ADMINISTRATIVE STAFF COLLEGE OF INDIA, HYDERABAD 72 | P a g e
3.11 EXISTING LANDUSE Gulbarga indicates that the total area under CC’s jurisdiction is 5,500hectares for 2001, out of
which only around 46% is developed. The review of land utilization reveals that, 47% of the
developed area is under residential use and 24% is under public semi-public, 12% of the land is
under industrial use and 4% of the land developed is under parks, playgrounds and open
spaces. A significant area of land in Gulbarga is under the university.
There has been significant increase in area under residential use, to cater to the growing
population and to balance the growth and enhance economic development in the area, CC had
equally increased the share of area under transportation use, public and semi-public, and for
parks and open spaces. The following table shows the different land use pattern in Gulbarga
City.
Table 19: Existing land use analysis of Gulbarga – 2001
Sl.
No.
Land use Existing land use -1997 Proposed land use -2011
Area in
Hectares
% to
Developed
area
Area
(hectares)
% to
developed
area
1. Residential 1,203 47 4,082 60
2. Commercial 121 5 340 5
3. Industrial 297 12 610 9
4. Public & Semi Public 606 24 709 10
5. Public Utilities 96 4 446 7
6. Transportation &
Communication 174 7
617 8
7. Water Sheet 37 1 38 1
Developed area 2,534 100 6,842 100
Source- Gulbarga Development Authority
3.12 MUNICIPAL GOVERNANCE Gulbarga city was declared a city municipality for the first time in 1945. Prior to that, the district
board was managing the civic affairs. In 1952, an elected board was constituted which got
upgraded into corporation on October 1981. In 1961 the board are was 25 sq.km and had 31
wards. In 1995-96 the corporation area became 55.15sq.km. The territorial jurisdiction of the
city corporation Gulbarga (CCG) has increases by about cent per cent in last two decades (1981-
2001). Political and administrative transformations related to development of the fringe areas
of the city govern the changes in the jurisdiction of the city corporation area.
Legal Framework and functional domain
Elections to the Corporation are held every five years and subsequently a Mayor and a Deputy
Mayor are elected for a term of one year. It comes under portion of 2 Loksabha Constituencies, 4
Legislative assembly constituencies and 1 legislative council constituency.
For its governance, the GCC is divided into fifty five wards; each represented by a Corporator.
The Corporators elect the Mayor, who is the administrator of the city and serves office for a
CITY SANITATION PLAN GULBARGA
ADMINISTRATIVE STAFF COLLEGE OF INDIA, HYDERABAD 73 | P a g e
term of one year. The administration of the corporation is vested in the commissioner, who is
designated by the state government.
The functional domain of local bodies in the state is derived from respective legislations. The
Municipal Acts list the functions under two categories, namely, “obligatory functions” and
“discretionary functions”. The functional domain was expanded in 1994 as per the 12th Schedule
of the 74th Constitution Amendment Act. In Karnataka, the Corporations and Municipalities Acts
provide for a majority of the functions listed in the 12th Schedule (ref Annexure 1) of the
constitution. In 2003, the Government, after a review of functions of urban local bodies,
transferred five more functions to the urban local bodies through government orders. They are:
Planning for economic and social development
Urban forestry, protection of the environment and promotion of ecological aspects
Urban Poverty Alleviation
Safeguarding the interest of weaker sections including the handicapped and mentally
retarded
Promotion of Cultural and Aesthetic aspects
There is a multiplicity of laws governing the urban areas in the state. These laws may be
classified as follows:
Urban Development Policy and Karnataka is governed by
Planning Legislation:
1. The Karnataka Town and Country Planning Act, 1961
2. Bangalore Development Authority Act, 1976
3. Bangalore Metropolitan Region Development Authority Act, 1985
4. Karnataka Urban Development Authorities Act, 1987
Municipal Legislation:
1. The Karnataka Municipalities Act, 1964
2. The Karnataka Municipal Corporation Act ,1976
Development Legislation:
1. The Karnataka Industrial Area Development Act , 1966
2. The Karnataka Housing Board Act ,1962
3. The Karnataka Urban Water Supply and Drainage Board Act , 1973
4. The Karnataka Slum Area (Improvement) and Clearance Act , 1970
5. Land Acquisition Act, 1894.
Regulatory Legislation:
1. The Karnataka Land Reforms Act ,1964
2. The Karnataka Land Revenue Act, 1964
3. Karnataka Registration Act
Apart from the Acts, there are rules and by-laws regulating various activities in urban areas
Institutional Framework
The GCC is democratically elected by the civic community as per the 74th CAA. At the head is
the Mayor with the Council and the Standing Committee. Next to the Mayor is the Commissioner,
who with the help of the Joint Commissioner heads the various departments The Organogram of
CCG (Figure 3) gives the details.
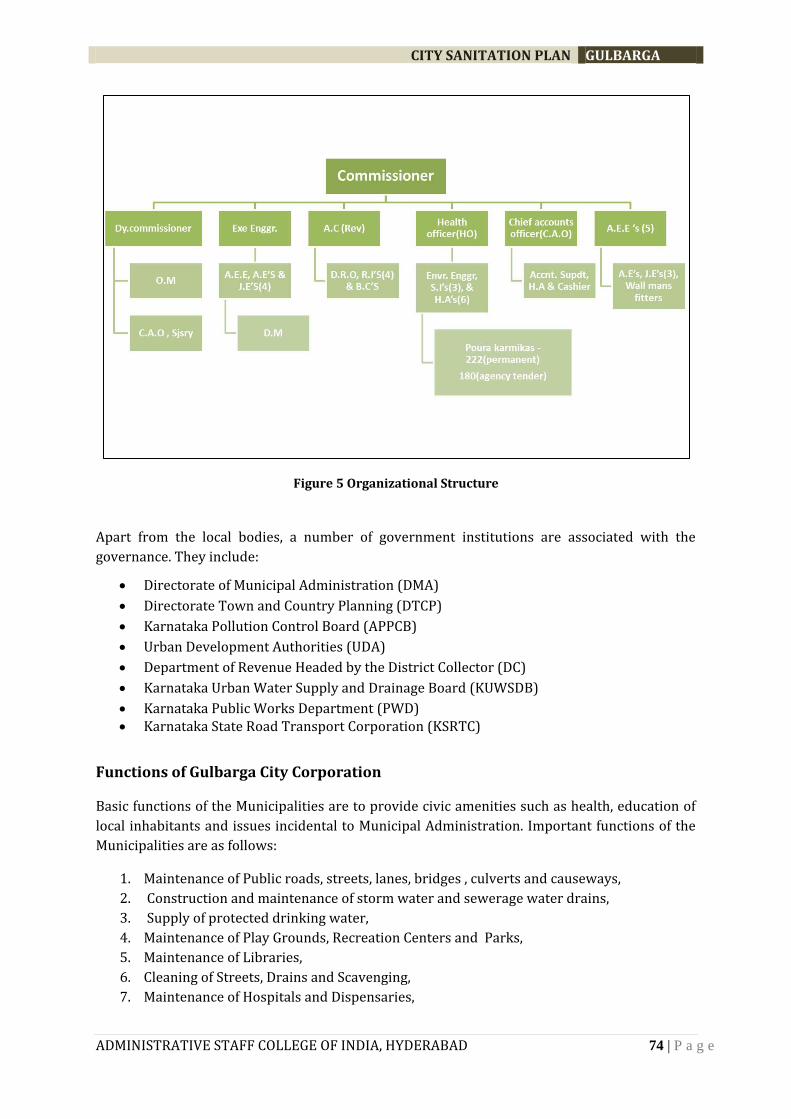
CITY SANITATION PLAN GULBARGA
ADMINISTRATIVE STAFF COLLEGE OF INDIA, HYDERABAD 74 | P a g e
Figure 5 Organizational Structure
Apart from the local bodies, a number of government institutions are associated with the
governance. They include:
Directorate of Municipal Administration (DMA)
Directorate Town and Country Planning (DTCP)
Karnataka Pollution Control Board (APPCB)
Urban Development Authorities (UDA)
Department of Revenue Headed by the District Collector (DC)
Karnataka Urban Water Supply and Drainage Board (KUWSDB)
Karnataka Public Works Department (PWD) Karnataka State Road Transport Corporation (KSRTC)
Functions of Gulbarga City Corporation
Basic functions of the Municipalities are to provide civic amenities such as health, education of
local inhabitants and issues incidental to Municipal Administration. Important functions of the
Municipalities are as follows:
1. Maintenance of Public roads, streets, lanes, bridges , culverts and causeways,
2. Construction and maintenance of storm water and sewerage water drains,
3. Supply of protected drinking water,
4. Maintenance of Play Grounds, Recreation Centers and Parks,
5. Maintenance of Libraries,
6. Cleaning of Streets, Drains and Scavenging,
7. Maintenance of Hospitals and Dispensaries,
CITY SANITATION PLAN GULBARGA
ADMINISTRATIVE STAFF COLLEGE OF INDIA, HYDERABAD 75 | P a g e
8. Control of Epidemics and Endemics,
9. Registration of Births and Deaths,
10. Maintenance of Elementary Schools,
11. Housing,
12. Maintenance and Improvement in Slum Areas,
13. Maintenance of Street Lighting,
14. Maintenance of slaughter houses and markets.
Some of the major departments and their functions are presented as follows.
Revenue Section, Accounts Section and Audit Section
The main functions of the revenue section are
Assessment and levy of various taxes such as property tax, Vacant land tax,
Collection and monitoring of the taxes
The main functions of the Accounts Section are
Preparation of the budgets,
Processing of the bills and payment vouchers,
Monitoring of the revenue generation,
Maintenance of the books of account,
Maintenance of the payroll,
general provident fund,
Management of treasury
The main functions of the Audit Section is
Conducting a pre-audit of all the receipts and payments. Based on the verification and approval
of the audit section, payments will be released
Town Planning Section
Formulation of building rules, master plan rules and zonal regulation
Implementation of master plans
Road widening programmes
Public spaces, Roads and Junctions improvement
Issuance of permission for buildings and layouts
Regularization and demolition of unauthorized constructions
Removal of encroachments
Health Section
The main functions of the public health / sanitation are
Cleaning of the streets and supervision of sanitation
CITY SANITATION PLAN GULBARGA
ADMINISTRATIVE STAFF COLLEGE OF INDIA, HYDERABAD 76 | P a g e
Lifting of garbage and dumping of the same in dumping yard
Spraying disinfecting materials under anti malaria schemes
Maintenance of vehicles, diesel bunks, vehicle sheds, and work shops
Registration of births and deaths
Regulation of dangerous and offensive trades
Maintenance and management of slaughter houses and certification of animals for
slaughter
Prevention of epidemics
Prevention of food adulteration
Management of dispensaries of Indian Medicine System and allopathic system.
Sanitation is one of the key functions of the ULB and the Health Section of ULB is responsible for
all sanitation work in the limits of the ULB. Maintenance and upkeep of urban infrastructure
such as roads, sewerage drains, preventive measures for control of diseases and epidemics,
solid waste management, etc., are some of the key processes which help in maintaining the
sanitary conditions of the ULBs. The key processes of Sanitation-Solid Waste Management
function involve allocation of employees for sweeping and garbage removal, cleaning of drains,
allocation of the vehicles for garbage transportation and disposal of garbage at the dumping
ground, maintenance of the vehicles, maintenance of the public toilets, and carrying out anti-
malarial operations, etc.
Executive Engineering Section
The main functions of the executive engineering section are:
Preparation of plans and estimates for civil works
Construction and maintenance of roads
Construction of buildings
Execution of civil works
Construction and maintenance of drains
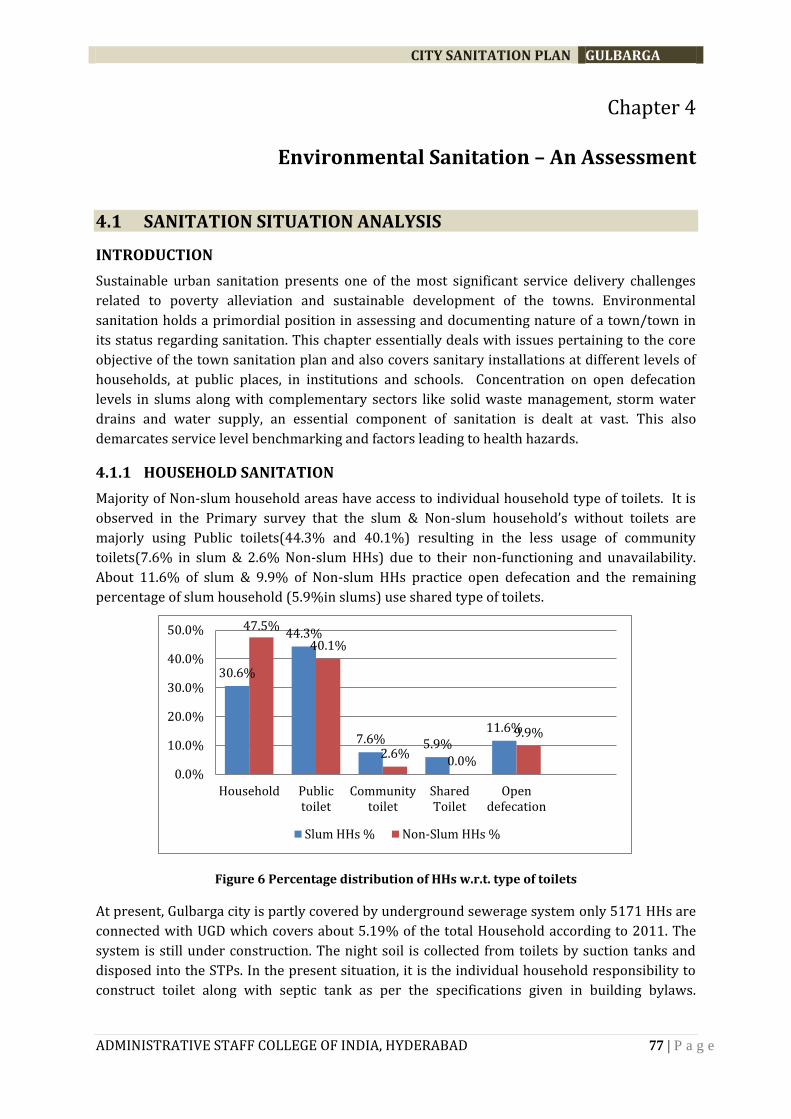
CITY SANITATION PLAN GULBARGA
ADMINISTRATIVE STAFF COLLEGE OF INDIA, HYDERABAD 77 | P a g e
Chapter 4
Environmental Sanitation – An Assessment
4.1 SANITATION SITUATION ANALYSIS
INTRODUCTION
Sustainable urban sanitation presents one of the most significant service delivery challenges
related to poverty alleviation and sustainable development of the towns. Environmental
sanitation holds a primordial position in assessing and documenting nature of a town/town in
its status regarding sanitation. This chapter essentially deals with issues pertaining to the core
objective of the town sanitation plan and also covers sanitary installations at different levels of
households, at public places, in institutions and schools. Concentration on open defecation
levels in slums along with complementary sectors like solid waste management, storm water
drains and water supply, an essential component of sanitation is dealt at vast. This also
demarcates service level benchmarking and factors leading to health hazards.
4.1.1 HOUSEHOLD SANITATION
Majority of Non-slum household areas have access to individual household type of toilets. It is
observed in the Primary survey that the slum & Non-slum household’s without toilets are
majorly using Public toilets(44.3% and 40.1%) resulting in the less usage of community
toilets(7.6% in slum & 2.6% Non-slum HHs) due to their non-functioning and unavailability.
About 11.6% of slum & 9.9% of Non-slum HHs practice open defecation and the remaining
percentage of slum household (5.9%in slums) use shared type of toilets.
Figure 6 Percentage distribution of HHs w.r.t. type of toilets
At present, Gulbarga city is partly covered by underground sewerage system only 5171 HHs are
connected with UGD which covers about 5.19% of the total Household according to 2011. The
system is still under construction. The night soil is collected from toilets by suction tanks and
disposed into the STPs. In the present situation, it is the individual household responsibility to
construct toilet along with septic tank as per the specifications given in building bylaws.
30.6%
44.3%
7.6% 5.9% 11.6%
47.5%
40.1%
2.6% 0.0%
9.9%
0.0%
10.0%
20.0%
30.0%
40.0%
50.0%
Household Publictoilet
Communitytoilet
SharedToilet
Opendefecation
Slum HHs % Non-Slum HHs %
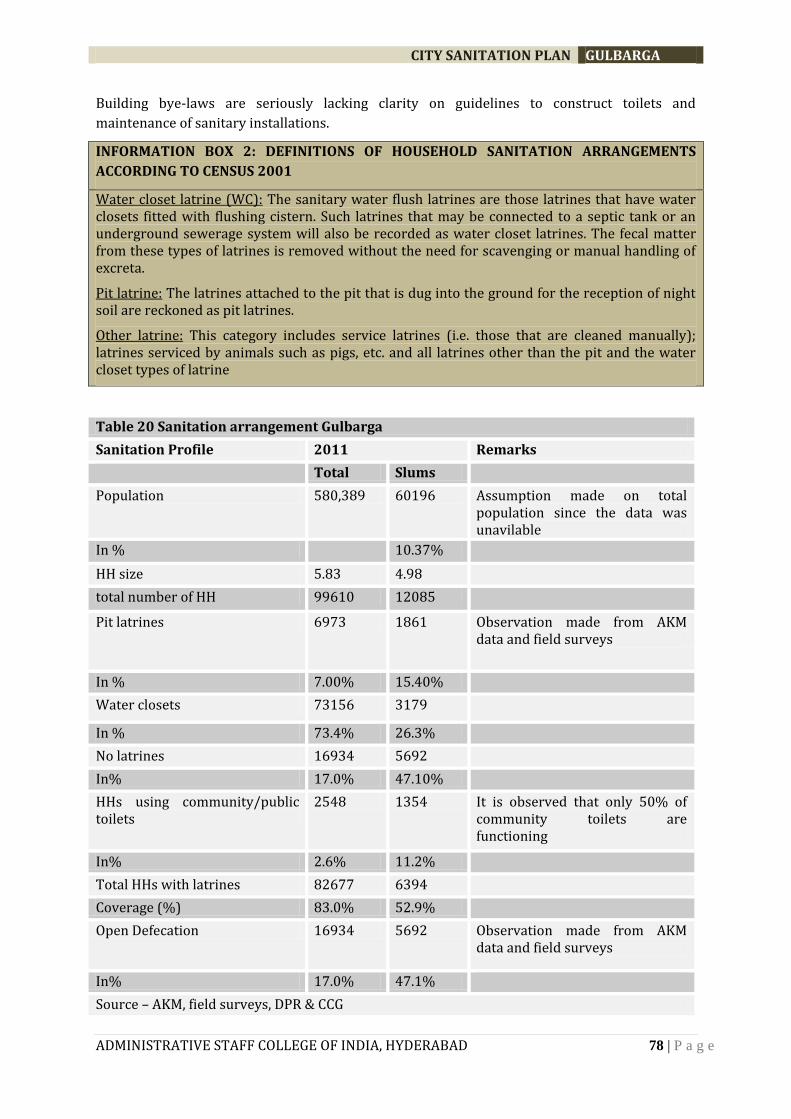
CITY SANITATION PLAN GULBARGA
ADMINISTRATIVE STAFF COLLEGE OF INDIA, HYDERABAD 78 | P a g e
Building bye-laws are seriously lacking clarity on guidelines to construct toilets and
maintenance of sanitary installations.
INFORMATION BOX 2: DEFINITIONS OF HOUSEHOLD SANITATION ARRANGEMENTS
ACCORDING TO CENSUS 2001
Water closet latrine (WC): The sanitary water flush latrines are those latrines that have water closets fitted with flushing cistern. Such latrines that may be connected to a septic tank or an underground sewerage system will also be recorded as water closet latrines. The fecal matter from these types of latrines is removed without the need for scavenging or manual handling of excreta.
Pit latrine: The latrines attached to the pit that is dug into the ground for the reception of night soil are reckoned as pit latrines.
Other latrine: This category includes service latrines (i.e. those that are cleaned manually); latrines serviced by animals such as pigs, etc. and all latrines other than the pit and the water closet types of latrine
Table 20 Sanitation arrangement Gulbarga
Sanitation Profile 2011 Remarks
Total Slums
Population 580,389 60196 Assumption made on total population since the data was unavilable
In % 10.37%
HH size 5.83 4.98
total number of HH 99610 12085
Pit latrines 6973 1861 Observation made from AKM data and field surveys
In % 7.00% 15.40%
Water closets 73156 3179
In % 73.4% 26.3%
No latrines 16934 5692
In% 17.0% 47.10%
HHs using community/public toilets
2548 1354 It is observed that only 50% of community toilets are functioning
In% 2.6% 11.2%
Total HHs with latrines 82677 6394
Coverage (%) 83.0% 52.9%
Open Defecation 16934 5692 Observation made from AKM data and field surveys
In% 17.0% 47.1%
Source – AKM, field surveys, DPR & CCG
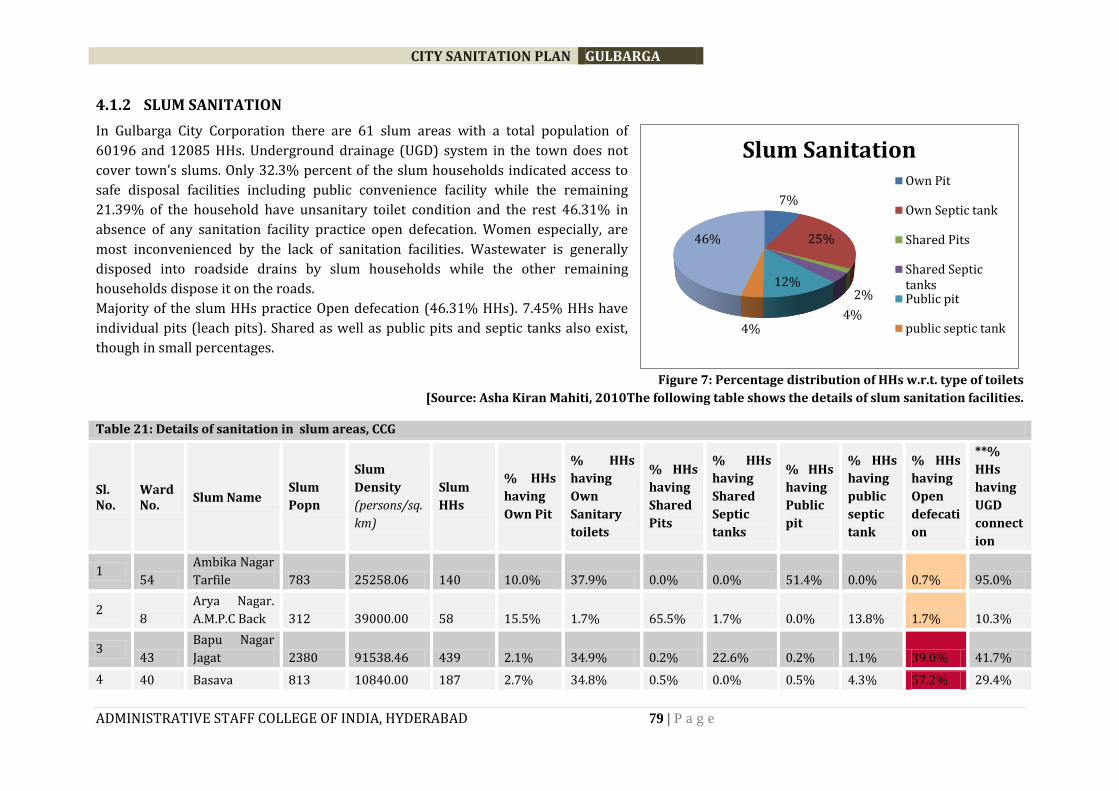
CITY SANITATION PLAN GULBARGA
ADMINISTRATIVE STAFF COLLEGE OF INDIA, HYDERABAD 79 | P a g e
4.1.2 SLUM SANITATION
In Gulbarga City Corporation there are 61 slum areas with a total population of
60196 and 12085 HHs. Underground drainage (UGD) system in the town does not
cover town’s slums. Only 32.3% percent of the slum households indicated access to
safe disposal facilities including public convenience facility while the remaining
21.39% of the household have unsanitary toilet condition and the rest 46.31% in
absence of any sanitation facility practice open defecation. Women especially, are
most inconvenienced by the lack of sanitation facilities. Wastewater is generally
disposed into roadside drains by slum households while the other remaining
households dispose it on the roads.
Majority of the slum HHs practice Open defecation (46.31% HHs). 7.45% HHs have
individual pits (leach pits). Shared as well as public pits and septic tanks also exist,
though in small percentages.
Figure 7: Percentage distribution of HHs w.r.t. type of toilets
[Source: Asha Kiran Mahiti, 2010The following table shows the details of slum sanitation facilities.
Table 21: Details of sanitation in slum areas, CCG
Sl. No.
Ward No.
Slum Name Slum
Popn
Slum
Density
(persons/sq.
km)
Slum
HHs
% HHs
having
Own Pit
% HHs
having
Own
Sanitary
toilets
% HHs
having
Shared
Pits
% HHs
having
Shared
Septic
tanks
% HHs
having
Public
pit
% HHs
having
public
septic
tank
% HHs
having
Open
defecati
on
**%
HHs
having
UGD
connect
ion
1 54
Ambika Nagar
Tarfile 783 25258.06 140 10.0% 37.9% 0.0% 0.0% 51.4% 0.0% 0.7% 95.0%
2 8
Arya Nagar.
A.M.P.C Back 312 39000.00 58 15.5% 1.7% 65.5% 1.7% 0.0% 13.8% 1.7% 10.3%
3 43
Bapu Nagar
Jagat 2380 91538.46 439 2.1% 34.9% 0.2% 22.6% 0.2% 1.1% 39.0% 41.7%
4 40 Basava 813 10840.00 187 2.7% 34.8% 0.5% 0.0% 0.5% 4.3% 57.2% 29.4%
7%
25%
2%
4%
12%
4%
46%
Slum Sanitation Own Pit
Own Septic tank
Shared Pits
Shared SeptictanksPublic pit
public septic tank
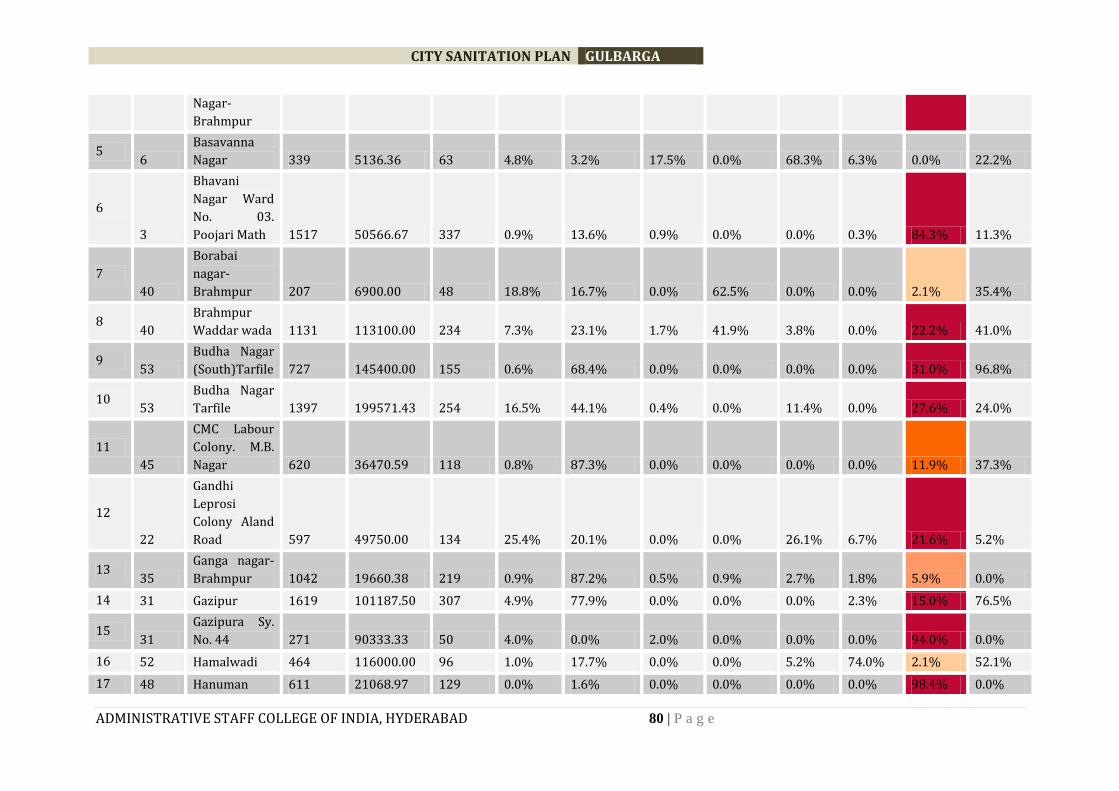
CITY SANITATION PLAN GULBARGA
ADMINISTRATIVE STAFF COLLEGE OF INDIA, HYDERABAD 80 | P a g e
Nagar-
Brahmpur
5 6
Basavanna
Nagar 339 5136.36 63 4.8% 3.2% 17.5% 0.0% 68.3% 6.3% 0.0% 22.2%
6
3
Bhavani
Nagar Ward
No. 03.
Poojari Math 1517 50566.67 337 0.9% 13.6% 0.9% 0.0% 0.0% 0.3% 84.3% 11.3%
7
40
Borabai
nagar-
Brahmpur 207 6900.00 48 18.8% 16.7% 0.0% 62.5% 0.0% 0.0% 2.1% 35.4%
8 40
Brahmpur
Waddar wada 1131 113100.00 234 7.3% 23.1% 1.7% 41.9% 3.8% 0.0% 22.2% 41.0%
9 53
Budha Nagar
(South)Tarfile 727 145400.00 155 0.6% 68.4% 0.0% 0.0% 0.0% 0.0% 31.0% 96.8%
10 53
Budha Nagar
Tarfile 1397 199571.43 254 16.5% 44.1% 0.4% 0.0% 11.4% 0.0% 27.6% 24.0%
11
45
CMC Labour
Colony. M.B.
Nagar 620 36470.59 118 0.8% 87.3% 0.0% 0.0% 0.0% 0.0% 11.9% 37.3%
12
22
Gandhi
Leprosi
Colony Aland
Road 597 49750.00 134 25.4% 20.1% 0.0% 0.0% 26.1% 6.7% 21.6% 5.2%
13 35
Ganga nagar-
Brahmpur 1042 19660.38 219 0.9% 87.2% 0.5% 0.9% 2.7% 1.8% 5.9% 0.0%
14 31 Gazipur 1619 101187.50 307 4.9% 77.9% 0.0% 0.0% 0.0% 2.3% 15.0% 76.5%
15 31
Gazipura Sy.
No. 44 271 90333.33 50 4.0% 0.0% 2.0% 0.0% 0.0% 0.0% 94.0% 0.0%
16 52 Hamalwadi 464 116000.00 96 1.0% 17.7% 0.0% 0.0% 5.2% 74.0% 2.1% 52.1%
17 48 Hanuman 611 21068.97 129 0.0% 1.6% 0.0% 0.0% 0.0% 0.0% 98.4% 0.0%
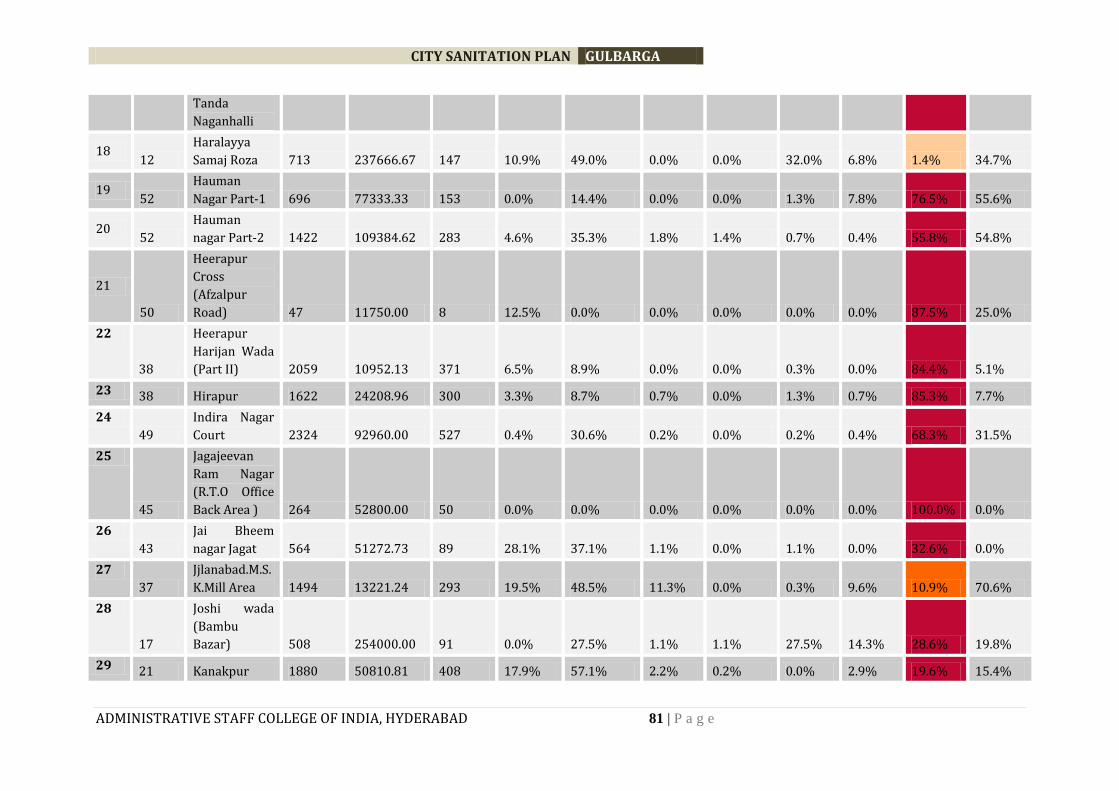
CITY SANITATION PLAN GULBARGA
ADMINISTRATIVE STAFF COLLEGE OF INDIA, HYDERABAD 81 | P a g e
Tanda
Naganhalli
18 12
Haralayya
Samaj Roza 713 237666.67 147 10.9% 49.0% 0.0% 0.0% 32.0% 6.8% 1.4% 34.7%
19 52
Hauman
Nagar Part-1 696 77333.33 153 0.0% 14.4% 0.0% 0.0% 1.3% 7.8% 76.5% 55.6%
20 52
Hauman
nagar Part-2 1422 109384.62 283 4.6% 35.3% 1.8% 1.4% 0.7% 0.4% 55.8% 54.8%
21
50
Heerapur
Cross
(Afzalpur
Road) 47 11750.00 8 12.5% 0.0% 0.0% 0.0% 0.0% 0.0% 87.5% 25.0%
22
38
Heerapur
Harijan Wada
(Part II) 2059 10952.13 371 6.5% 8.9% 0.0% 0.0% 0.3% 0.0% 84.4% 5.1%
23 38 Hirapur 1622 24208.96 300 3.3% 8.7% 0.7% 0.0% 1.3% 0.7% 85.3% 7.7%
24
49
Indira Nagar
Court 2324 92960.00 527 0.4% 30.6% 0.2% 0.0% 0.2% 0.4% 68.3% 31.5%
25
45
Jagajeevan
Ram Nagar
(R.T.O Office
Back Area ) 264 52800.00 50 0.0% 0.0% 0.0% 0.0% 0.0% 0.0% 100.0% 0.0%
26
43
Jai Bheem
nagar Jagat 564 51272.73 89 28.1% 37.1% 1.1% 0.0% 1.1% 0.0% 32.6% 0.0%
27
37
Jjlanabad.M.S.
K.Mill Area 1494 13221.24 293 19.5% 48.5% 11.3% 0.0% 0.3% 9.6% 10.9% 70.6%
28
17
Joshi wada
(Bambu
Bazar) 508 254000.00 91 0.0% 27.5% 1.1% 1.1% 27.5% 14.3% 28.6% 19.8%
29 21 Kanakpur 1880 50810.81 408 17.9% 57.1% 2.2% 0.2% 0.0% 2.9% 19.6% 15.4%
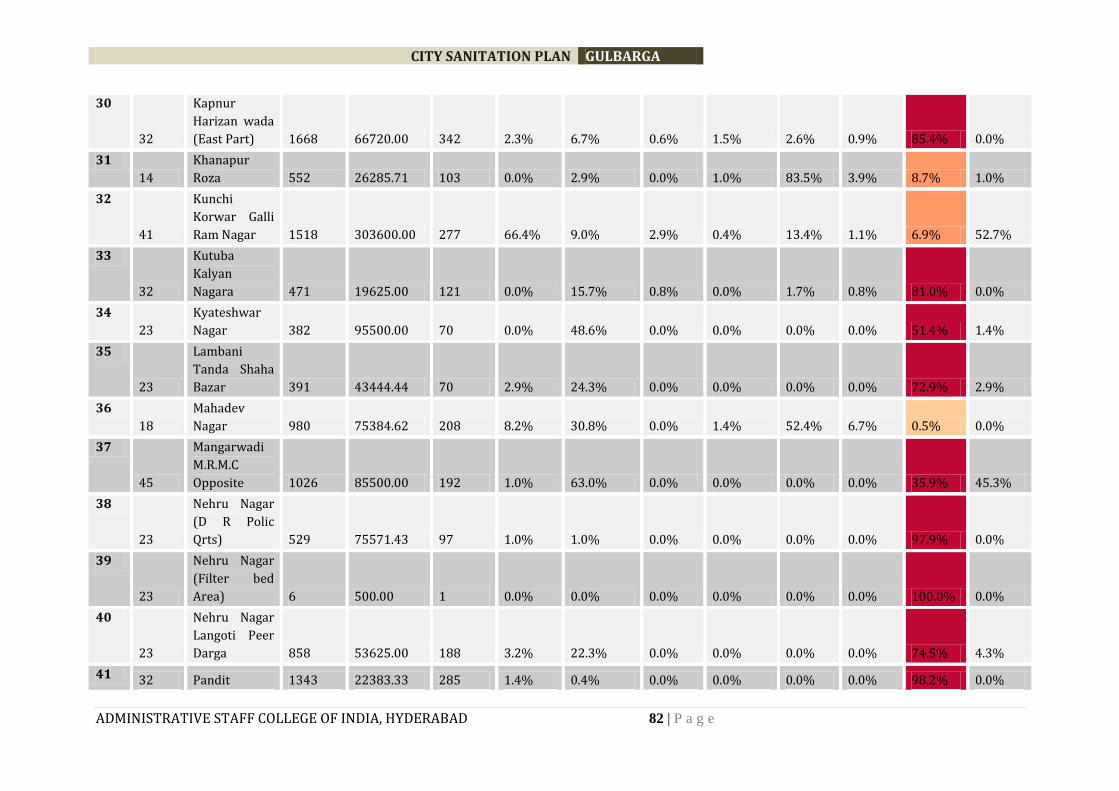
CITY SANITATION PLAN GULBARGA
ADMINISTRATIVE STAFF COLLEGE OF INDIA, HYDERABAD 82 | P a g e
30
32
Kapnur
Harizan wada
(East Part) 1668 66720.00 342 2.3% 6.7% 0.6% 1.5% 2.6% 0.9% 85.4% 0.0%
31
14
Khanapur
Roza 552 26285.71 103 0.0% 2.9% 0.0% 1.0% 83.5% 3.9% 8.7% 1.0%
32
41
Kunchi
Korwar Galli
Ram Nagar 1518 303600.00 277 66.4% 9.0% 2.9% 0.4% 13.4% 1.1% 6.9% 52.7%
33
32
Kutuba
Kalyan
Nagara 471 19625.00 121 0.0% 15.7% 0.8% 0.0% 1.7% 0.8% 81.0% 0.0%
34
23
Kyateshwar
Nagar 382 95500.00 70 0.0% 48.6% 0.0% 0.0% 0.0% 0.0% 51.4% 1.4%
35
23
Lambani
Tanda Shaha
Bazar 391 43444.44 70 2.9% 24.3% 0.0% 0.0% 0.0% 0.0% 72.9% 2.9%
36
18
Mahadev
Nagar 980 75384.62 208 8.2% 30.8% 0.0% 1.4% 52.4% 6.7% 0.5% 0.0%
37
45
Mangarwadi
M.R.M.C
Opposite 1026 85500.00 192 1.0% 63.0% 0.0% 0.0% 0.0% 0.0% 35.9% 45.3%
38
23
Nehru Nagar
(D R Polic
Qrts) 529 75571.43 97 1.0% 1.0% 0.0% 0.0% 0.0% 0.0% 97.9% 0.0%
39
23
Nehru Nagar
(Filter bed
Area) 6 500.00 1 0.0% 0.0% 0.0% 0.0% 0.0% 0.0% 100.0% 0.0%
40
23
Nehru Nagar
Langoti Peer
Darga 858 53625.00 188 3.2% 22.3% 0.0% 0.0% 0.0% 0.0% 74.5% 4.3%
41 32 Pandit 1343 22383.33 285 1.4% 0.4% 0.0% 0.0% 0.0% 0.0% 98.2% 0.0%
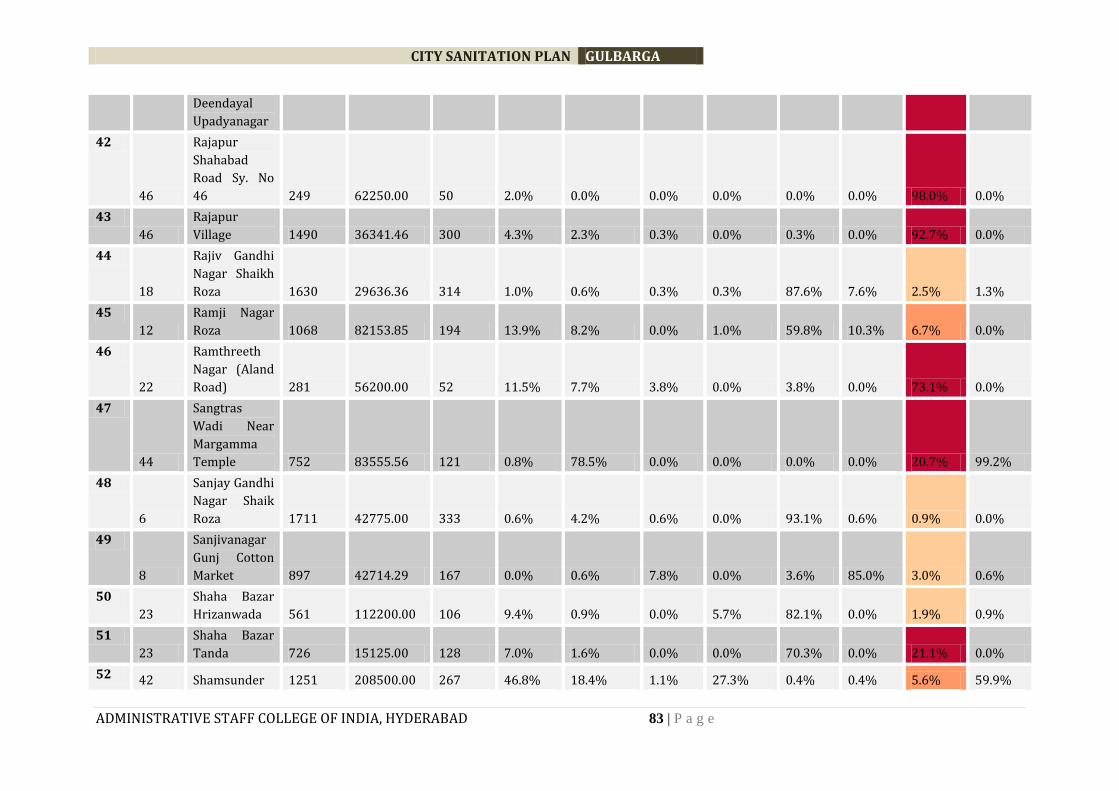
CITY SANITATION PLAN GULBARGA
ADMINISTRATIVE STAFF COLLEGE OF INDIA, HYDERABAD 83 | P a g e
Deendayal
Upadyanagar
42
46
Rajapur
Shahabad
Road Sy. No
46 249 62250.00 50 2.0% 0.0% 0.0% 0.0% 0.0% 0.0% 98.0% 0.0%
43
46
Rajapur
Village 1490 36341.46 300 4.3% 2.3% 0.3% 0.0% 0.3% 0.0% 92.7% 0.0%
44
18
Rajiv Gandhi
Nagar Shaikh
Roza 1630 29636.36 314 1.0% 0.6% 0.3% 0.3% 87.6% 7.6% 2.5% 1.3%
45
12
Ramji Nagar
Roza 1068 82153.85 194 13.9% 8.2% 0.0% 1.0% 59.8% 10.3% 6.7% 0.0%
46
22
Ramthreeth
Nagar (Aland
Road) 281 56200.00 52 11.5% 7.7% 3.8% 0.0% 3.8% 0.0% 73.1% 0.0%
47
44
Sangtras
Wadi Near
Margamma
Temple 752 83555.56 121 0.8% 78.5% 0.0% 0.0% 0.0% 0.0% 20.7% 99.2%
48
6
Sanjay Gandhi
Nagar Shaik
Roza 1711 42775.00 333 0.6% 4.2% 0.6% 0.0% 93.1% 0.6% 0.9% 0.0%
49
8
Sanjivanagar
Gunj Cotton
Market 897 42714.29 167 0.0% 0.6% 7.8% 0.0% 3.6% 85.0% 3.0% 0.6%
50
23
Shaha Bazar
Hrizanwada 561 112200.00 106 9.4% 0.9% 0.0% 5.7% 82.1% 0.0% 1.9% 0.9%
51
23
Shaha Bazar
Tanda 726 15125.00 128 7.0% 1.6% 0.0% 0.0% 70.3% 0.0% 21.1% 0.0%
52 42 Shamsunder 1251 208500.00 267 46.8% 18.4% 1.1% 27.3% 0.4% 0.4% 5.6% 59.9%
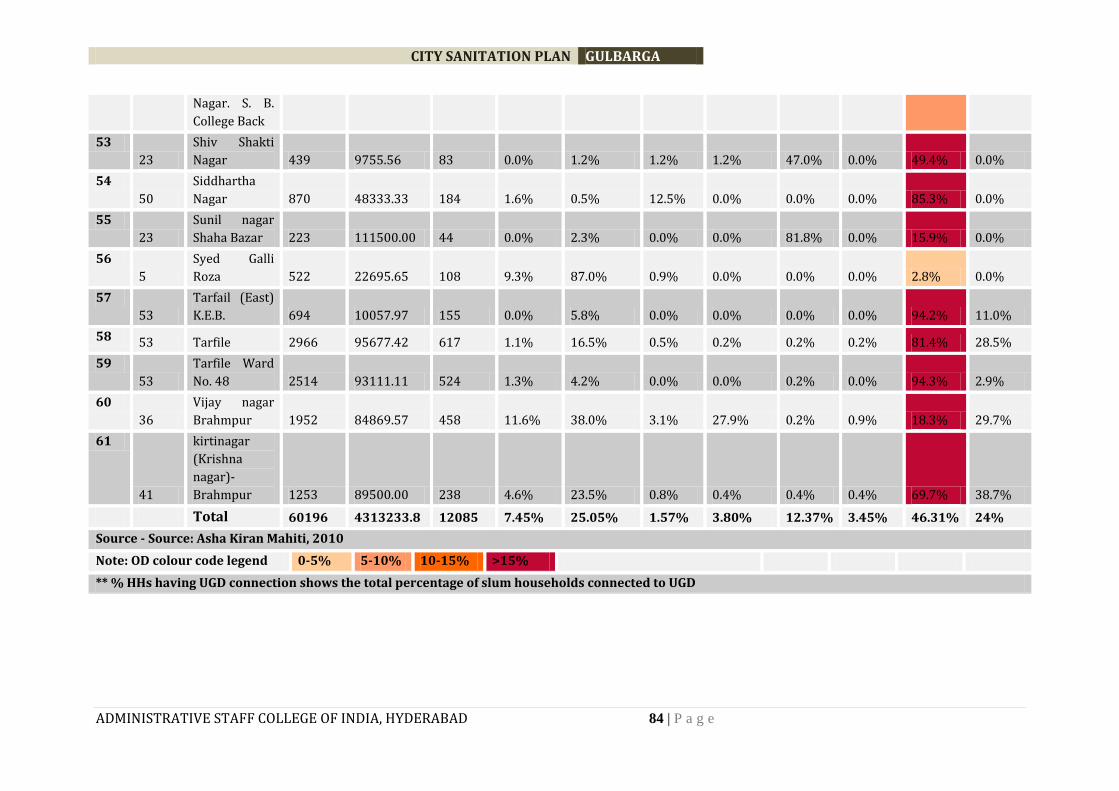
CITY SANITATION PLAN GULBARGA
ADMINISTRATIVE STAFF COLLEGE OF INDIA, HYDERABAD 84 | P a g e
Nagar. S. B.
College Back
53
23
Shiv Shakti
Nagar 439 9755.56 83 0.0% 1.2% 1.2% 1.2% 47.0% 0.0% 49.4% 0.0%
54
50
Siddhartha
Nagar 870 48333.33 184 1.6% 0.5% 12.5% 0.0% 0.0% 0.0% 85.3% 0.0%
55
23
Sunil nagar
Shaha Bazar 223 111500.00 44 0.0% 2.3% 0.0% 0.0% 81.8% 0.0% 15.9% 0.0%
56
5
Syed Galli
Roza 522 22695.65 108 9.3% 87.0% 0.9% 0.0% 0.0% 0.0% 2.8% 0.0%
57
53
Tarfail (East)
K.E.B. 694 10057.97 155 0.0% 5.8% 0.0% 0.0% 0.0% 0.0% 94.2% 11.0%
58 53 Tarfile 2966 95677.42 617 1.1% 16.5% 0.5% 0.2% 0.2% 0.2% 81.4% 28.5%
59
53
Tarfile Ward
No. 48 2514 93111.11 524 1.3% 4.2% 0.0% 0.0% 0.2% 0.0% 94.3% 2.9%
60
36
Vijay nagar
Brahmpur 1952 84869.57 458 11.6% 38.0% 3.1% 27.9% 0.2% 0.9% 18.3% 29.7%
61
41
kirtinagar
(Krishna
nagar)-
Brahmpur 1253 89500.00 238 4.6% 23.5% 0.8% 0.4% 0.4% 0.4% 69.7% 38.7%
Total 60196 4313233.8 12085 7.45% 25.05% 1.57% 3.80% 12.37% 3.45% 46.31% 24%
Source - Source: Asha Kiran Mahiti, 2010
Note: OD colour code legend 0-5% 5-10% 10-15% >15%
** % HHs having UGD connection shows the total percentage of slum households connected to UGD
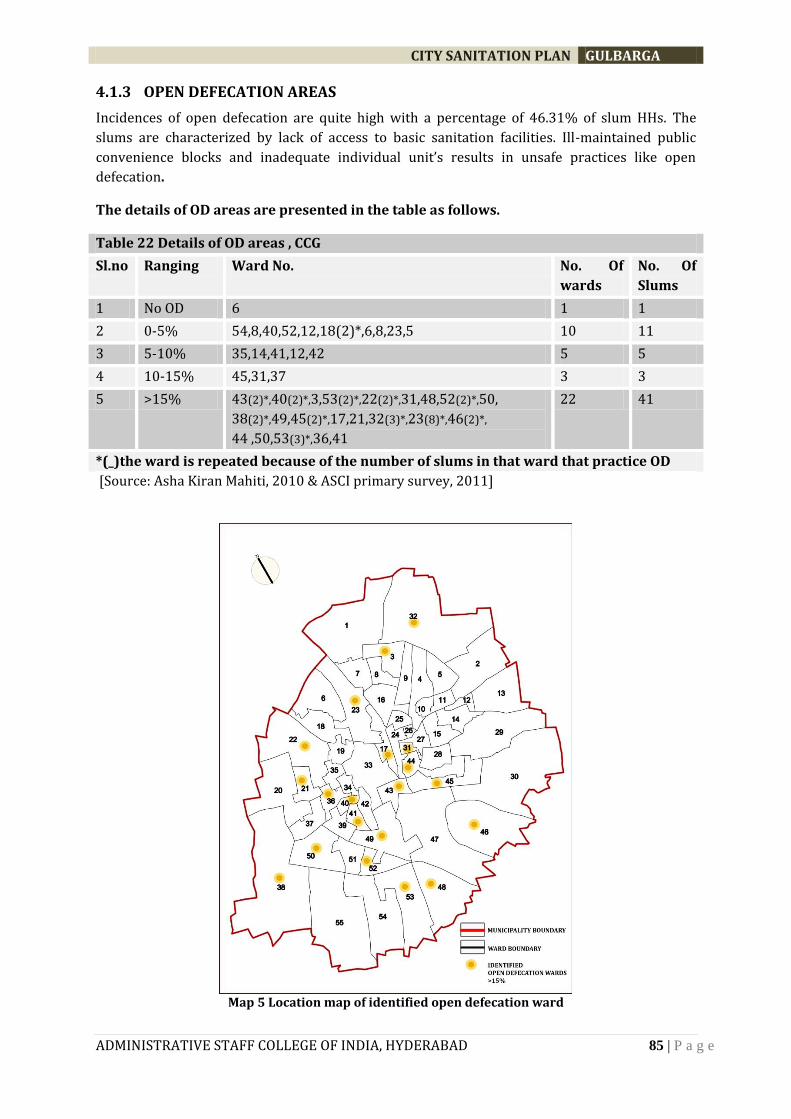
CITY SANITATION PLAN GULBARGA
ADMINISTRATIVE STAFF COLLEGE OF INDIA, HYDERABAD 85 | P a g e
4.1.3 OPEN DEFECATION AREAS
Incidences of open defecation are quite high with a percentage of 46.31% of slum HHs. The
slums are characterized by lack of access to basic sanitation facilities. Ill-maintained public
convenience blocks and inadequate individual unit’s results in unsafe practices like open
defecation.
The details of OD areas are presented in the table as follows.
Table 22 Details of OD areas , CCG
Sl.no Ranging Ward No. No. Of
wards
No. Of
Slums
1 No OD 6 1 1
2 0-5% 54,8,40,52,12,18(2)*,6,8,23,5 10 11
3 5-10% 35,14,41,12,42 5 5
4 10-15% 45,31,37 3 3
5 >15% 43(2)*,40(2)*,3,53(2)*,22(2)*,31,48,52(2)*,50,
38(2)*,49,45(2)*,17,21,32(3)*,23(8)*,46(2)*,
44 ,50,53(3)*,36,41
22 41
*(_)the ward is repeated because of the number of slums in that ward that practice OD
[Source: Asha Kiran Mahiti, 2010 & ASCI primary survey, 2011]
Map 5 Location map of identified open defecation ward
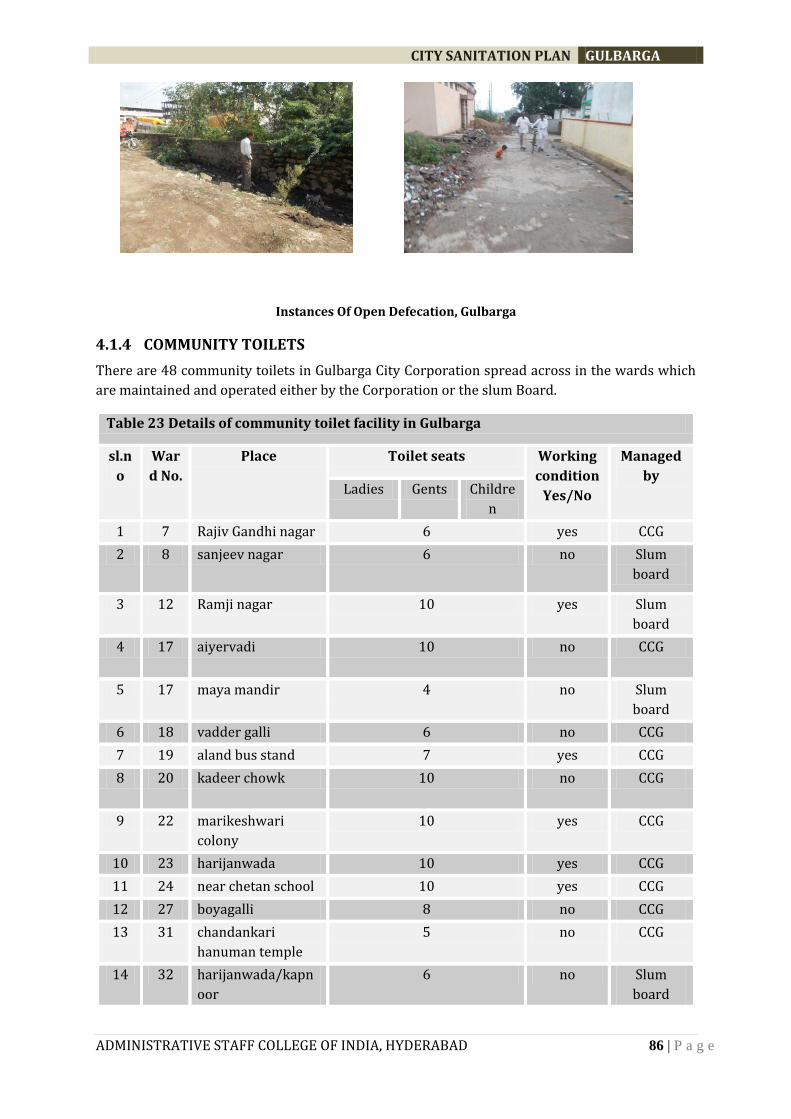
CITY SANITATION PLAN GULBARGA
ADMINISTRATIVE STAFF COLLEGE OF INDIA, HYDERABAD 86 | P a g e
Instances Of Open Defecation, Gulbarga
4.1.4 COMMUNITY TOILETS
There are 48 community toilets in Gulbarga City Corporation spread across in the wards which
are maintained and operated either by the Corporation or the slum Board.
Table 23 Details of community toilet facility in Gulbarga
sl.n
o
War
d No.
Place Toilet seats Working
condition
Yes/No
Managed
by Ladies Gents Childre
n
1 7 Rajiv Gandhi nagar 6 yes CCG
2 8 sanjeev nagar 6 no Slum
board
3 12 Ramji nagar 10 yes Slum
board
4 17 aiyervadi 10 no CCG
5 17 maya mandir 4 no Slum
board
6 18 vadder galli 6 no CCG
7 19 aland bus stand 7 yes CCG
8 20 kadeer chowk 10 no CCG
9 22 marikeshwari
colony
10 yes CCG
10 23 harijanwada 10 yes CCG
11 24 near chetan school 10 yes CCG
12 27 boyagalli 8 no CCG
13 31 chandankari
hanuman temple
5 no CCG
14 32 harijanwada/kapn
oor
6 no Slum
board
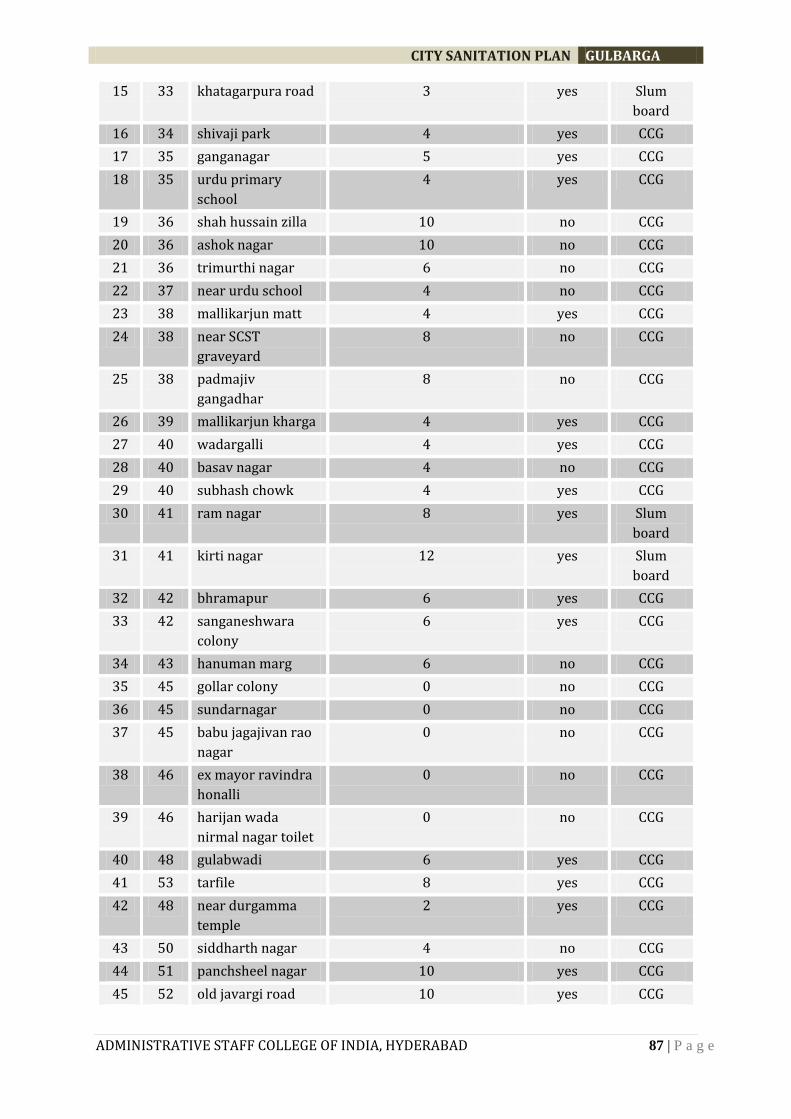
CITY SANITATION PLAN GULBARGA
ADMINISTRATIVE STAFF COLLEGE OF INDIA, HYDERABAD 87 | P a g e
15 33 khatagarpura road 3 yes Slum
board
16 34 shivaji park 4 yes CCG
17 35 ganganagar 5 yes CCG
18 35 urdu primary
school
4 yes CCG
19 36 shah hussain zilla 10 no CCG
20 36 ashok nagar 10 no CCG
21 36 trimurthi nagar 6 no CCG
22 37 near urdu school 4 no CCG
23 38 mallikarjun matt 4 yes CCG
24 38 near SCST
graveyard
8 no CCG
25 38 padmajiv
gangadhar
8 no CCG
26 39 mallikarjun kharga 4 yes CCG
27 40 wadargalli 4 yes CCG
28 40 basav nagar 4 no CCG
29 40 subhash chowk 4 yes CCG
30 41 ram nagar 8 yes Slum
board
31 41 kirti nagar 12 yes Slum
board
32 42 bhramapur 6 yes CCG
33 42 sanganeshwara
colony
6 yes CCG
34 43 hanuman marg 6 no CCG
35 45 gollar colony 0 no CCG
36 45 sundarnagar 0 no CCG
37 45 babu jagajivan rao
nagar
0 no CCG
38 46 ex mayor ravindra
honalli
0 no CCG
39 46 harijan wada
nirmal nagar toilet
0 no CCG
40 48 gulabwadi 6 yes CCG
41 53 tarfile 8 yes CCG
42 48 near durgamma
temple
2 yes CCG
43 50 siddharth nagar 4 no CCG
44 51 panchsheel nagar 10 yes CCG
45 52 old javargi road 10 yes CCG
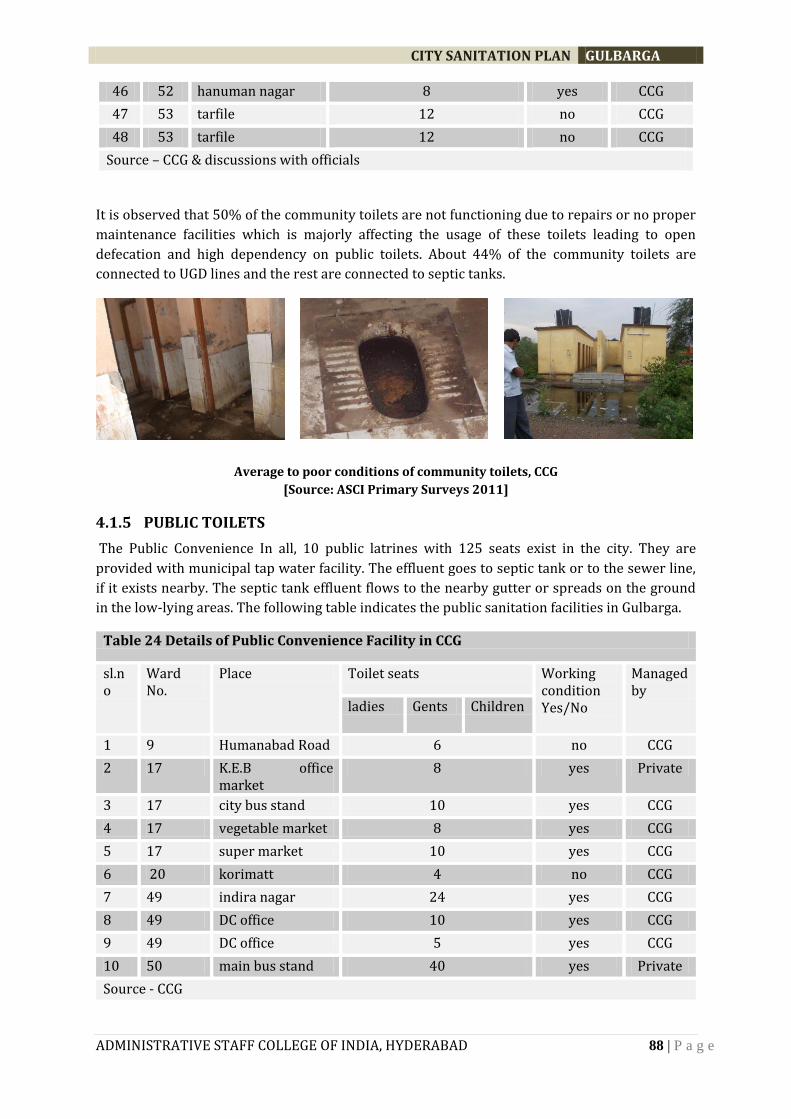
CITY SANITATION PLAN GULBARGA
ADMINISTRATIVE STAFF COLLEGE OF INDIA, HYDERABAD 88 | P a g e
46 52 hanuman nagar 8 yes CCG
47 53 tarfile 12 no CCG
48 53 tarfile 12 no CCG
Source – CCG & discussions with officials
It is observed that 50% of the community toilets are not functioning due to repairs or no proper
maintenance facilities which is majorly affecting the usage of these toilets leading to open
defecation and high dependency on public toilets. About 44% of the community toilets are
connected to UGD lines and the rest are connected to septic tanks.
Average to poor conditions of community toilets, CCG
[Source: ASCI Primary Surveys 2011]
4.1.5 PUBLIC TOILETS
The Public Convenience In all, 10 public latrines with 125 seats exist in the city. They are
provided with municipal tap water facility. The effluent goes to septic tank or to the sewer line,
if it exists nearby. The septic tank effluent flows to the nearby gutter or spreads on the ground
in the low-lying areas. The following table indicates the public sanitation facilities in Gulbarga.
Table 24 Details of Public Convenience Facility in CCG
sl.no
Ward No.
Place Toilet seats Working condition Yes/No
Managed by
ladies Gents Children
1 9 Humanabad Road 6 no CCG
2 17 K.E.B office market
8 yes Private
3 17 city bus stand 10 yes CCG
4 17 vegetable market 8 yes CCG
5 17 super market 10 yes CCG
6 20 korimatt 4 no CCG
7 49 indira nagar 24 yes CCG
8 49 DC office 10 yes CCG
9 49 DC office 5 yes CCG
10 50 main bus stand 40 yes Private
Source - CCG
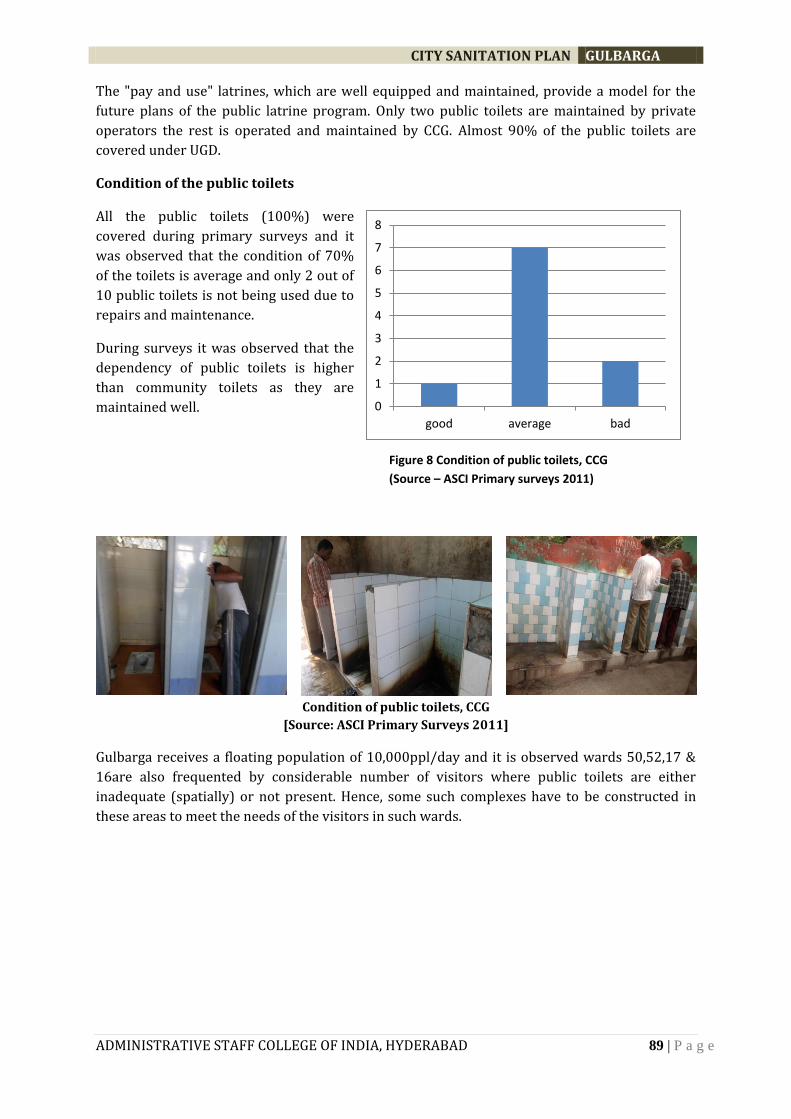
CITY SANITATION PLAN GULBARGA
ADMINISTRATIVE STAFF COLLEGE OF INDIA, HYDERABAD 89 | P a g e
The "pay and use" latrines, which are well equipped and maintained, provide a model for the
future plans of the public latrine program. Only two public toilets are maintained by private
operators the rest is operated and maintained by CCG. Almost 90% of the public toilets are
covered under UGD.
Condition of the public toilets
All the public toilets (100%) were
covered during primary surveys and it
was observed that the condition of 70%
of the toilets is average and only 2 out of
10 public toilets is not being used due to
repairs and maintenance.
During surveys it was observed that the
dependency of public toilets is higher
than community toilets as they are
maintained well.
Condition of public toilets, CCG
[Source: ASCI Primary Surveys 2011]
Gulbarga receives a floating population of 10,000ppl/day and it is observed wards 50,52,17 &
16are also frequented by considerable number of visitors where public toilets are either
inadequate (spatially) or not present. Hence, some such complexes have to be constructed in
these areas to meet the needs of the visitors in such wards.
0
1
2
3
4
5
6
7
8
good average bad
Figure 8 Condition of public toilets, CCG
(Source – ASCI Primary surveys 2011)
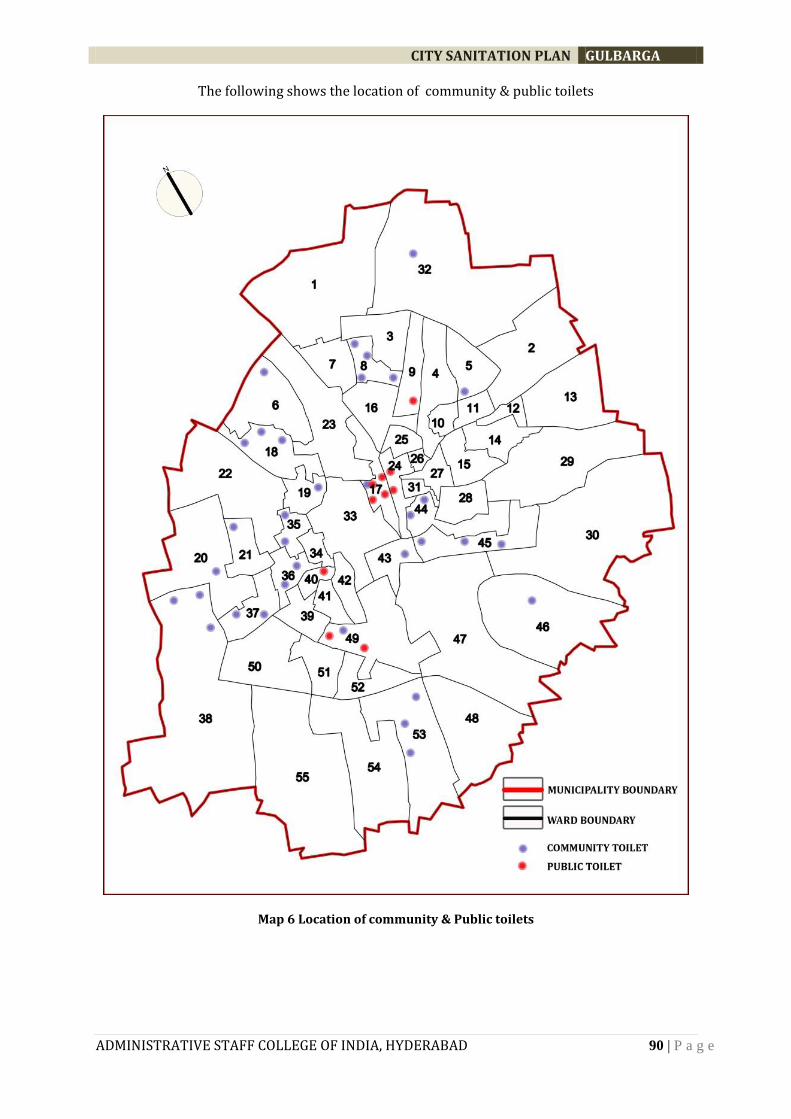
CITY SANITATION PLAN GULBARGA
ADMINISTRATIVE STAFF COLLEGE OF INDIA, HYDERABAD 90 | P a g e
The following shows the location of community & public toilets
Map 6 Location of community & Public toilets
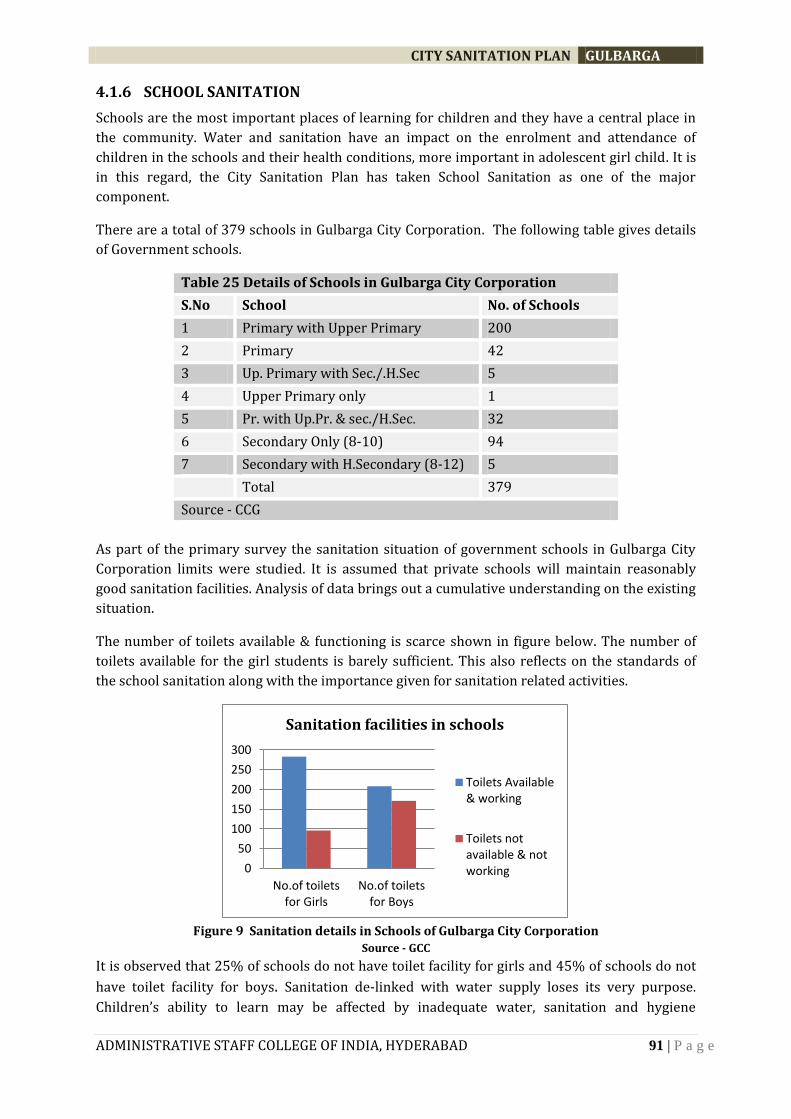
CITY SANITATION PLAN GULBARGA
ADMINISTRATIVE STAFF COLLEGE OF INDIA, HYDERABAD 91 | P a g e
4.1.6 SCHOOL SANITATION
Schools are the most important places of learning for children and they have a central place in
the community. Water and sanitation have an impact on the enrolment and attendance of
children in the schools and their health conditions, more important in adolescent girl child. It is
in this regard, the City Sanitation Plan has taken School Sanitation as one of the major
component.
There are a total of 379 schools in Gulbarga City Corporation. The following table gives details
of Government schools.
Table 25 Details of Schools in Gulbarga City Corporation
S.No School No. of Schools
1 Primary with Upper Primary 200
2 Primary 42
3 Up. Primary with Sec./.H.Sec 5
4 Upper Primary only 1
5 Pr. with Up.Pr. & sec./H.Sec. 32
6 Secondary Only (8-10) 94
7 Secondary with H.Secondary (8-12) 5
Total 379
Source - CCG
As part of the primary survey the sanitation situation of government schools in Gulbarga City
Corporation limits were studied. It is assumed that private schools will maintain reasonably
good sanitation facilities. Analysis of data brings out a cumulative understanding on the existing
situation.
The number of toilets available & functioning is scarce shown in figure below. The number of
toilets available for the girl students is barely sufficient. This also reflects on the standards of
the school sanitation along with the importance given for sanitation related activities.
Figure 9 Sanitation details in Schools of Gulbarga City Corporation
Source - GCC
It is observed that 25% of schools do not have toilet facility for girls and 45% of schools do not
have toilet facility for boys. Sanitation de-linked with water supply loses its very purpose.
Children’s ability to learn may be affected by inadequate water, sanitation and hygiene
0
50
100
150
200
250
300
No.of toiletsfor Girls
No.of toiletsfor Boys
Sanitation facilities in schools
Toilets Available& working
Toilets notavailable & notworking
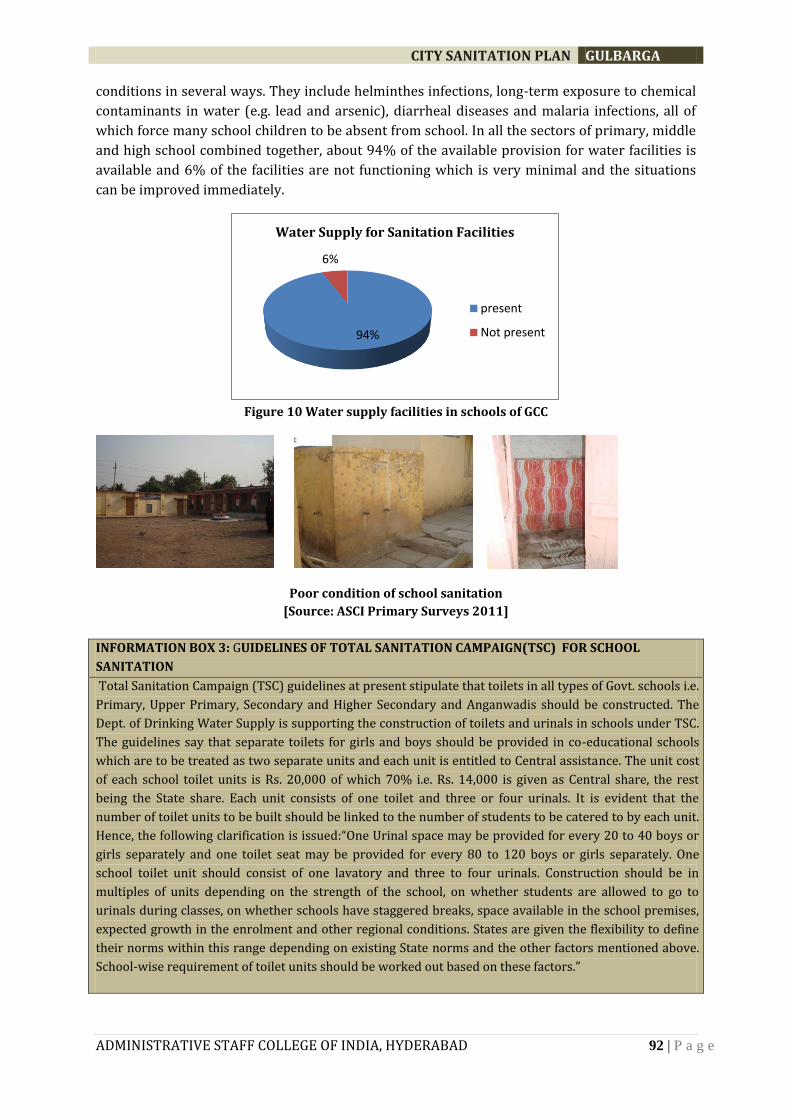
CITY SANITATION PLAN GULBARGA
ADMINISTRATIVE STAFF COLLEGE OF INDIA, HYDERABAD 92 | P a g e
conditions in several ways. They include helminthes infections, long-term exposure to chemical
contaminants in water (e.g. lead and arsenic), diarrheal diseases and malaria infections, all of
which force many school children to be absent from school. In all the sectors of primary, middle
and high school combined together, about 94% of the available provision for water facilities is
available and 6% of the facilities are not functioning which is very minimal and the situations
can be improved immediately.
Figure 10 Water supply facilities in schools of GCC
Poor condition of school sanitation
[Source: ASCI Primary Surveys 2011]
INFORMATION BOX 3: GUIDELINES OF TOTAL SANITATION CAMPAIGN(TSC) FOR SCHOOL
SANITATION
Total Sanitation Campaign (TSC) guidelines at present stipulate that toilets in all types of Govt. schools i.e.
Primary, Upper Primary, Secondary and Higher Secondary and Anganwadis should be constructed. The
Dept. of Drinking Water Supply is supporting the construction of toilets and urinals in schools under TSC.
The guidelines say that separate toilets for girls and boys should be provided in co-educational schools
which are to be treated as two separate units and each unit is entitled to Central assistance. The unit cost
of each school toilet units is Rs. 20,000 of which 70% i.e. Rs. 14,000 is given as Central share, the rest
being the State share. Each unit consists of one toilet and three or four urinals. It is evident that the
number of toilet units to be built should be linked to the number of students to be catered to by each unit.
Hence, the following clarification is issued:“One Urinal space may be provided for every 20 to 40 boys or
girls separately and one toilet seat may be provided for every 80 to 120 boys or girls separately. One
school toilet unit should consist of one lavatory and three to four urinals. Construction should be in
multiples of units depending on the strength of the school, on whether students are allowed to go to
urinals during classes, on whether schools have staggered breaks, space available in the school premises,
expected growth in the enrolment and other regional conditions. States are given the flexibility to define
their norms within this range depending on existing State norms and the other factors mentioned above.
School-wise requirement of toilet units should be worked out based on these factors.”
94%
6%
Water Supply for Sanitation Facilities
present
Not present
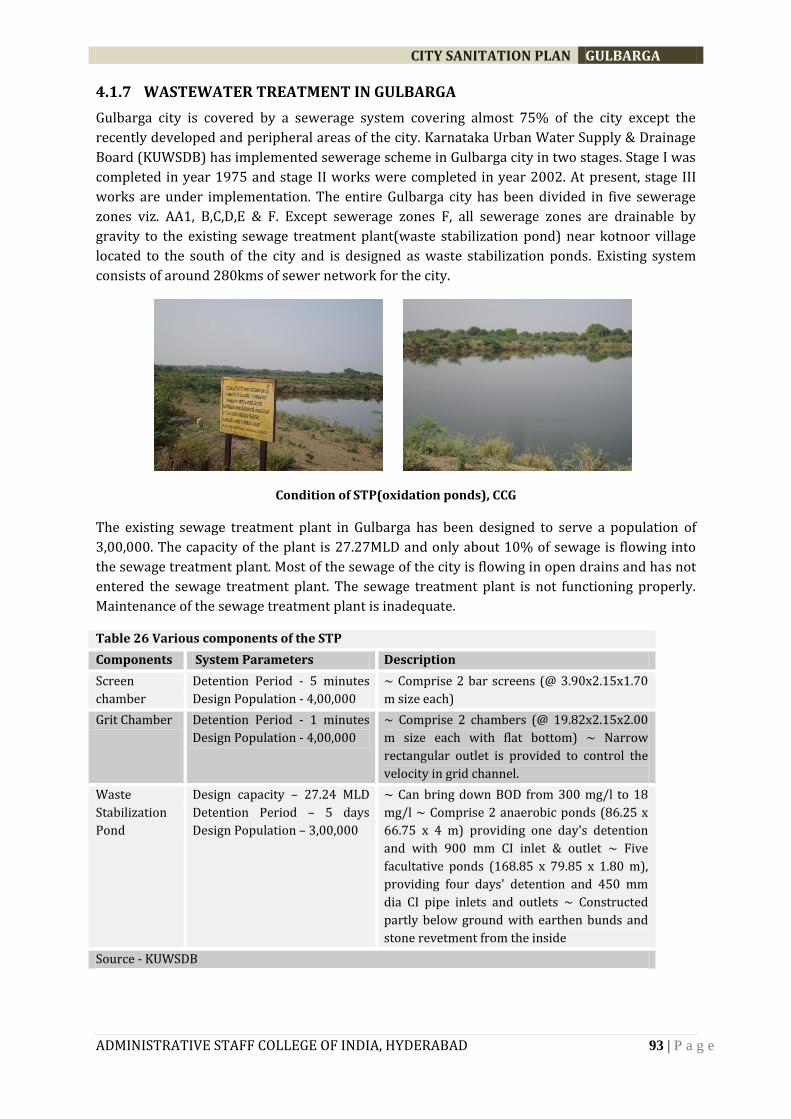
CITY SANITATION PLAN GULBARGA
ADMINISTRATIVE STAFF COLLEGE OF INDIA, HYDERABAD 93 | P a g e
4.1.7 WASTEWATER TREATMENT IN GULBARGA
Gulbarga city is covered by a sewerage system covering almost 75% of the city except the
recently developed and peripheral areas of the city. Karnataka Urban Water Supply & Drainage
Board (KUWSDB) has implemented sewerage scheme in Gulbarga city in two stages. Stage I was
completed in year 1975 and stage II works were completed in year 2002. At present, stage III
works are under implementation. The entire Gulbarga city has been divided in five sewerage
zones viz. AA1, B,C,D,E & F. Except sewerage zones F, all sewerage zones are drainable by
gravity to the existing sewage treatment plant(waste stabilization pond) near kotnoor village
located to the south of the city and is designed as waste stabilization ponds. Existing system
consists of around 280kms of sewer network for the city.
Condition of STP(oxidation ponds), CCG
The existing sewage treatment plant in Gulbarga has been designed to serve a population of
3,00,000. The capacity of the plant is 27.27MLD and only about 10% of sewage is flowing into
the sewage treatment plant. Most of the sewage of the city is flowing in open drains and has not
entered the sewage treatment plant. The sewage treatment plant is not functioning properly.
Maintenance of the sewage treatment plant is inadequate.
Table 26 Various components of the STP
Components System Parameters Description
Screen
chamber
Detention Period - 5 minutes
Design Population - 4,00,000
~ Comprise 2 bar screens (@ 3.90x2.15x1.70
m size each)
Grit Chamber Detention Period - 1 minutes
Design Population - 4,00,000
~ Comprise 2 chambers (@ 19.82x2.15x2.00
m size each with flat bottom) ~ Narrow
rectangular outlet is provided to control the
velocity in grid channel.
Waste
Stabilization
Pond
Design capacity – 27.24 MLD
Detention Period – 5 days
Design Population – 3,00,000
~ Can bring down BOD from 300 mg/l to 18
mg/l ~ Comprise 2 anaerobic ponds (86.25 x
66.75 x 4 m) providing one day's detention
and with 900 mm CI inlet & outlet ~ Five
facultative ponds (168.85 x 79.85 x 1.80 m),
providing four days' detention and 450 mm
dia CI pipe inlets and outlets ~ Constructed
partly below ground with earthen bunds and
stone revetment from the inside
Source - KUWSDB
CITY SANITATION PLAN GULBARGA
ADMINISTRATIVE STAFF COLLEGE OF INDIA, HYDERABAD 94 | P a g e
The works of the plant are completed in year 2002. The quantity of sewage reaching the sewage
treatment plant is meager. Farmers lift raw sewage from the manholes on the outfall sewer. The
samples of influent and effluent are not tested, due to which the effectiveness of the treatment
in terms of removal of BOD and suspended solid are not known.
SEWER CONNECTIONS Out of 73,845 households only 5171 properties have been connected to the sewers. Even
allowing for some unauthorized connections, the utilization of the sewer network appears to be
extremely poor. The UGD domestic connection deposit for onetime payment is about Rs.500.
The number of properties connected to the sewer network is abysmally small. An urgent and
concerted drive to increase the number of sewer connections is called for.
PROPOSED SEWAGE TREATMENT PLANT
A sewer district shall be that area contributing to one STP. Existing sewerage districts are
considered as sub districts. Depending on the utilization of existing sewerage network, STP and
availability of land for STP Gulbarga sewerage system is divided into three STP districts as
below.
District 1 : Kotnoor STP district (1D1 &1D2 sub districts)
District 2 : Nandikur STP district (2D1,2D2,2D3 &2D4 sub districts)
District 3 : kapnoor STP district (3D1 sub district)
Table 27 Proposed sewage Treatment plant in Gulbarga plant
Sewerage
district
Population Sewage generation in MLD
District 1
(Kotnoor)
2011 2026 2041 2011 2026 2041
1D1 26793 44373 63806 3.04 5.03 7.24
1D2 73345 115938 179610 8.32 13.15 20.37
Sub Total 100139 160311 243416 11.36 18.18 27.60
District 2
(Nandikur)
2D1 146625 187824 220132 16.63 21.30 24.96
2D2 154495 221406 284048 17.52 25.11 32.21
2D3 27202 45048 79187 3.08 5.11 8.98
2D4 42501 61195 107354 4.82 6.94 12.17
Sub Total 370823 515473 690721 42.05 58.45 78.33
District 3
(Kapanoor)
3D1 101313 153535 205393 11.49 17.41 23.29
101313 153535 205393 11.49 17.41 23.29
Total 572275 829319 1139530 64.90 94.04 129.22
Source - DPR
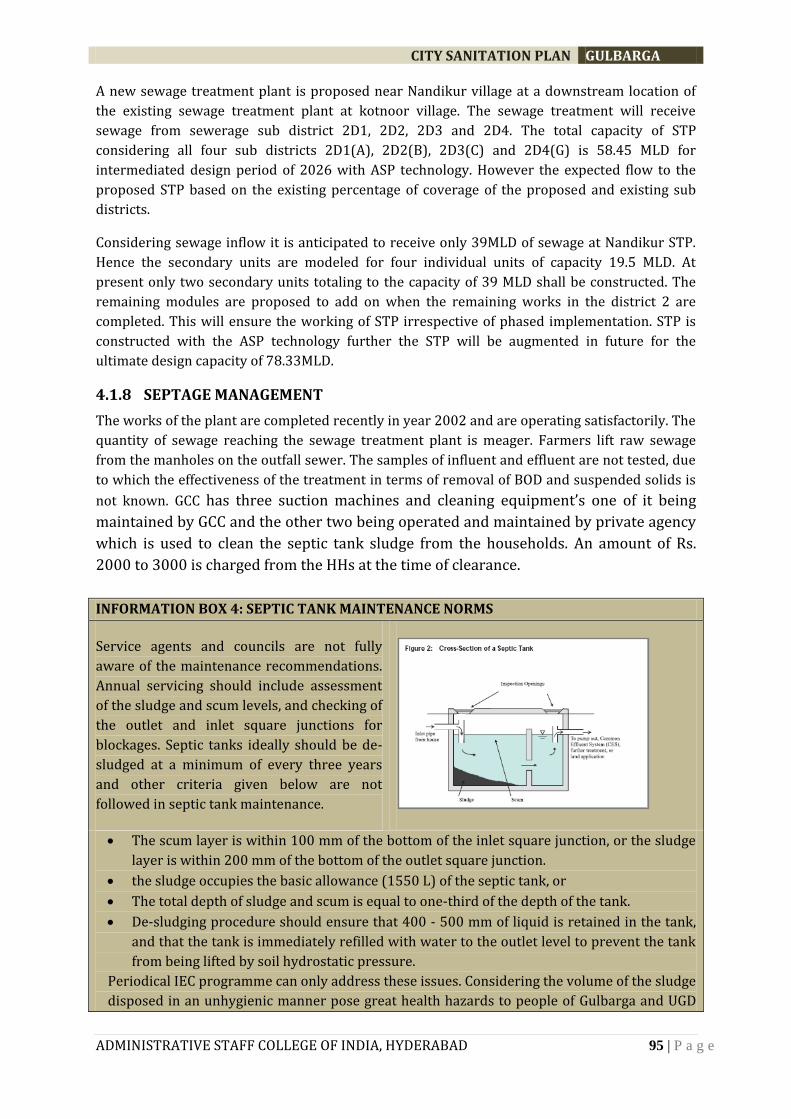
CITY SANITATION PLAN GULBARGA
ADMINISTRATIVE STAFF COLLEGE OF INDIA, HYDERABAD 95 | P a g e
A new sewage treatment plant is proposed near Nandikur village at a downstream location of
the existing sewage treatment plant at kotnoor village. The sewage treatment will receive
sewage from sewerage sub district 2D1, 2D2, 2D3 and 2D4. The total capacity of STP
considering all four sub districts 2D1(A), 2D2(B), 2D3(C) and 2D4(G) is 58.45 MLD for
intermediated design period of 2026 with ASP technology. However the expected flow to the
proposed STP based on the existing percentage of coverage of the proposed and existing sub
districts.
Considering sewage inflow it is anticipated to receive only 39MLD of sewage at Nandikur STP.
Hence the secondary units are modeled for four individual units of capacity 19.5 MLD. At
present only two secondary units totaling to the capacity of 39 MLD shall be constructed. The
remaining modules are proposed to add on when the remaining works in the district 2 are
completed. This will ensure the working of STP irrespective of phased implementation. STP is
constructed with the ASP technology further the STP will be augmented in future for the
ultimate design capacity of 78.33MLD.
4.1.8 SEPTAGE MANAGEMENT
The works of the plant are completed recently in year 2002 and are operating satisfactorily. The
quantity of sewage reaching the sewage treatment plant is meager. Farmers lift raw sewage
from the manholes on the outfall sewer. The samples of influent and effluent are not tested, due
to which the effectiveness of the treatment in terms of removal of BOD and suspended solids is
not known. GCC has three suction machines and cleaning equipment’s one of it being
maintained by GCC and the other two being operated and maintained by private agency
which is used to clean the septic tank sludge from the households. An amount of Rs.
2000 to 3000 is charged from the HHs at the time of clearance.
INFORMATION BOX 4: SEPTIC TANK MAINTENANCE NORMS
Service agents and councils are not fully
aware of the maintenance recommendations.
Annual servicing should include assessment
of the sludge and scum levels, and checking of
the outlet and inlet square junctions for
blockages. Septic tanks ideally should be de-
sludged at a minimum of every three years
and other criteria given below are not
followed in septic tank maintenance.
The scum layer is within 100 mm of the bottom of the inlet square junction, or the sludge
layer is within 200 mm of the bottom of the outlet square junction.
the sludge occupies the basic allowance (1550 L) of the septic tank, or
The total depth of sludge and scum is equal to one-third of the depth of the tank.
De-sludging procedure should ensure that 400 - 500 mm of liquid is retained in the tank,
and that the tank is immediately refilled with water to the outlet level to prevent the tank
from being lifted by soil hydrostatic pressure.
Periodical IEC programme can only address these issues. Considering the volume of the sludge
disposed in an unhygienic manner pose great health hazards to people of Gulbarga and UGD
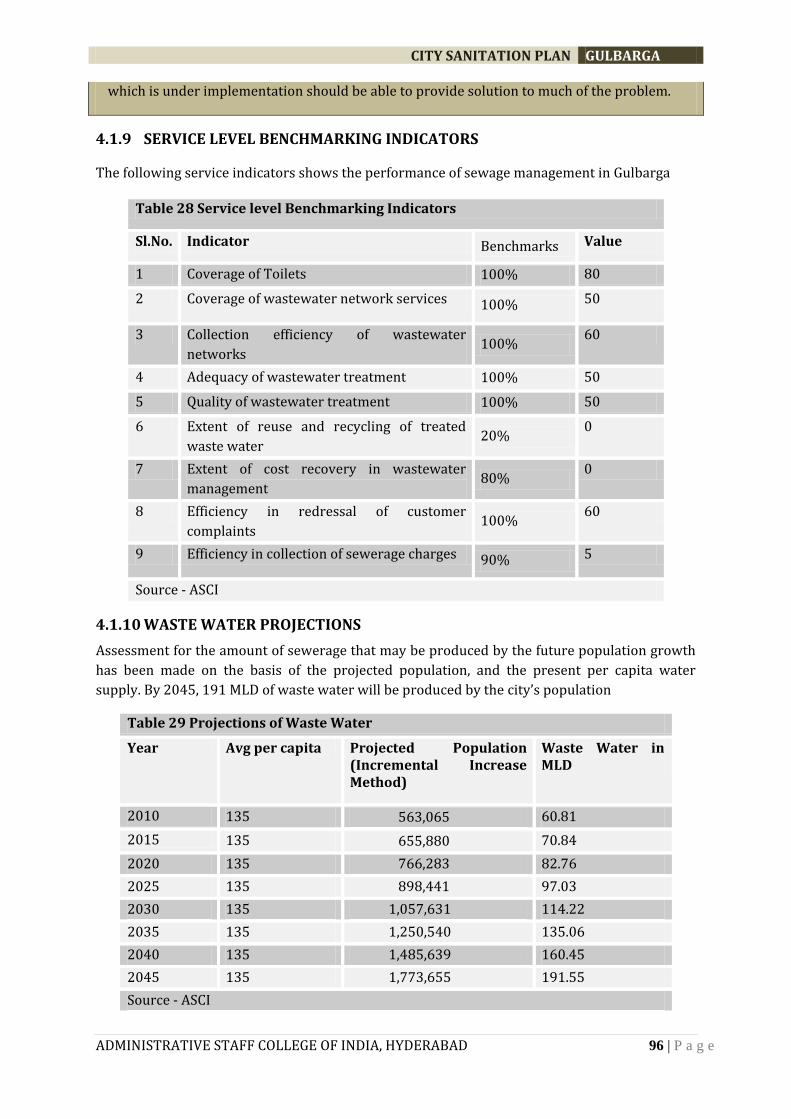
CITY SANITATION PLAN GULBARGA
ADMINISTRATIVE STAFF COLLEGE OF INDIA, HYDERABAD 96 | P a g e
which is under implementation should be able to provide solution to much of the problem.
4.1.9 SERVICE LEVEL BENCHMARKING INDICATORS
The following service indicators shows the performance of sewage management in Gulbarga
Table 28 Service level Benchmarking Indicators
Sl.No. Indicator Benchmarks Value
1 Coverage of Toilets 100% 80
2 Coverage of wastewater network services 100% 50
3 Collection efficiency of wastewater
networks 100%
60
4 Adequacy of wastewater treatment 100% 50
5 Quality of wastewater treatment 100% 50
6 Extent of reuse and recycling of treated
waste water 20%
0
7 Extent of cost recovery in wastewater
management 80%
0
8 Efficiency in redressal of customer
complaints 100%
60
9 Efficiency in collection of sewerage charges 90% 5
Source - ASCI
4.1.10 WASTE WATER PROJECTIONS
Assessment for the amount of sewerage that may be produced by the future population growth
has been made on the basis of the projected population, and the present per capita water
supply. By 2045, 191 MLD of waste water will be produced by the city’s population
Table 29 Projections of Waste Water
Year Avg per capita Projected Population (Incremental Increase Method)
Waste Water in MLD
2010 135 563,065 60.81
2015 135 655,880 70.84
2020 135 766,283 82.76
2025 135 898,441 97.03
2030 135 1,057,631 114.22
2035 135 1,250,540 135.06
2040 135 1,485,639 160.45
2045 135 1,773,655 191.55
Source - ASCI
CITY SANITATION PLAN GULBARGA
ADMINISTRATIVE STAFF COLLEGE OF INDIA, HYDERABAD 97 | P a g e
INFORMATION BOX 5: SEWERAGE AND SANITATION – THE KEY OBSERVATIONS
Only about 10% of sewage is flowing into the STP and most of the sewage is flowing in
open drains and only 7% of the households are connected to the UGD system.
At present the STP is not functioning and the waste water is flowing through open drains.
There is no proper Operation & maintenance of the sewage treatment plant.
Illicit dumping of the solid waste in the open drains chokes the area leading to unhygienic
conditions.
Community toilets are adequate but due to their poor maintenance only 50% of the
community toilets are functioning at present.
Incidences of open defecation are as high as 46.3% in slum areas which need considerable
improvement.
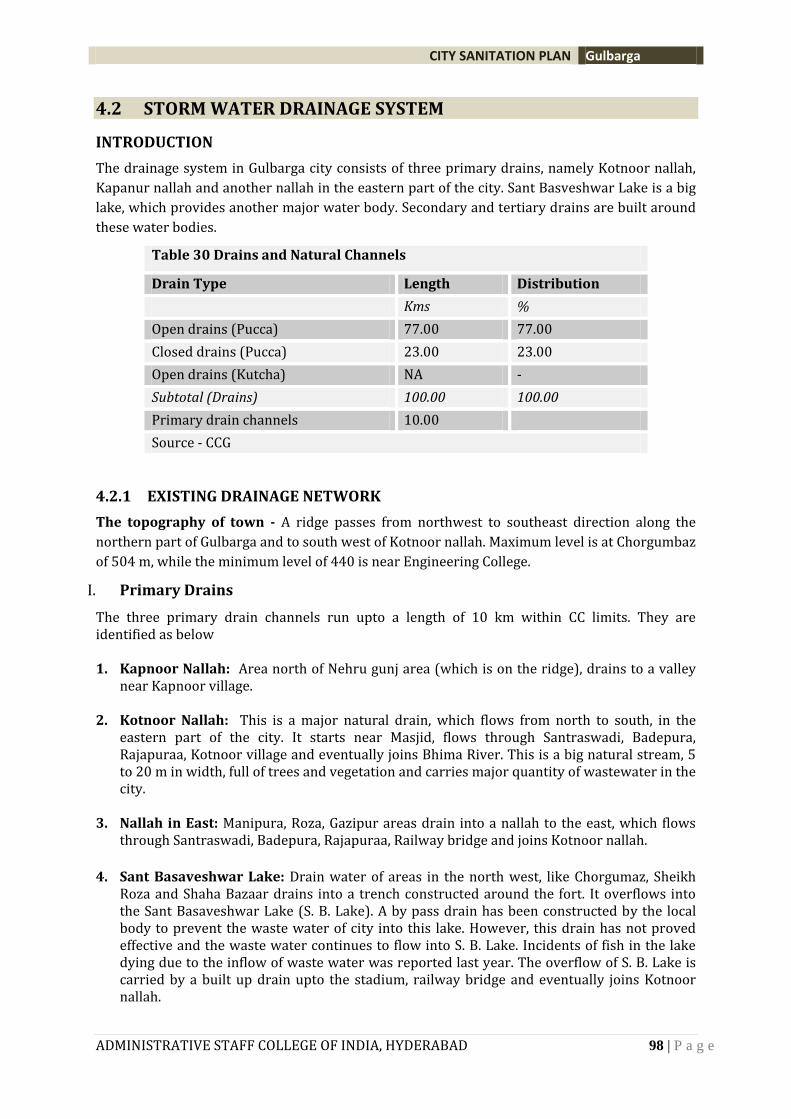
CITY SANITATION PLAN Gulbarga
ADMINISTRATIVE STAFF COLLEGE OF INDIA, HYDERABAD 98 | P a g e
4.2 STORM WATER DRAINAGE SYSTEM
INTRODUCTION
The drainage system in Gulbarga city consists of three primary drains, namely Kotnoor nallah,
Kapanur nallah and another nallah in the eastern part of the city. Sant Basveshwar Lake is a big
lake, which provides another major water body. Secondary and tertiary drains are built around
these water bodies.
Table 30 Drains and Natural Channels
Drain Type Length Distribution
Kms %
Open drains (Pucca) 77.00 77.00
Closed drains (Pucca) 23.00 23.00
Open drains (Kutcha) NA -
Subtotal (Drains) 100.00 100.00
Primary drain channels 10.00
Source - CCG
4.2.1 EXISTING DRAINAGE NETWORK
The topography of town - A ridge passes from northwest to southeast direction along the
northern part of Gulbarga and to south west of Kotnoor nallah. Maximum level is at Chorgumbaz
of 504 m, while the minimum level of 440 is near Engineering College.
I. Primary Drains
The three primary drain channels run upto a length of 10 km within CC limits. They are identified as below 1. Kapnoor Nallah: Area north of Nehru gunj area (which is on the ridge), drains to a valley
near Kapnoor village. 2. Kotnoor Nallah: This is a major natural drain, which flows from north to south, in the
eastern part of the city. It starts near Masjid, flows through Santraswadi, Badepura, Rajapuraa, Kotnoor village and eventually joins Bhima River. This is a big natural stream, 5 to 20 m in width, full of trees and vegetation and carries major quantity of wastewater in the city.
3. Nallah in East: Manipura, Roza, Gazipur areas drain into a nallah to the east, which flows
through Santraswadi, Badepura, Rajapuraa, Railway bridge and joins Kotnoor nallah.
4. Sant Basaveshwar Lake: Drain water of areas in the north west, like Chorgumaz, Sheikh Roza and Shaha Bazaar drains into a trench constructed around the fort. It overflows into the Sant Basaveshwar Lake (S. B. Lake). A by pass drain has been constructed by the local body to prevent the waste water of city into this lake. However, this drain has not proved effective and the waste water continues to flow into S. B. Lake. Incidents of fish in the lake dying due to the inflow of waste water was reported last year. The overflow of S. B. Lake is carried by a built up drain upto the stadium, railway bridge and eventually joins Kotnoor nallah.
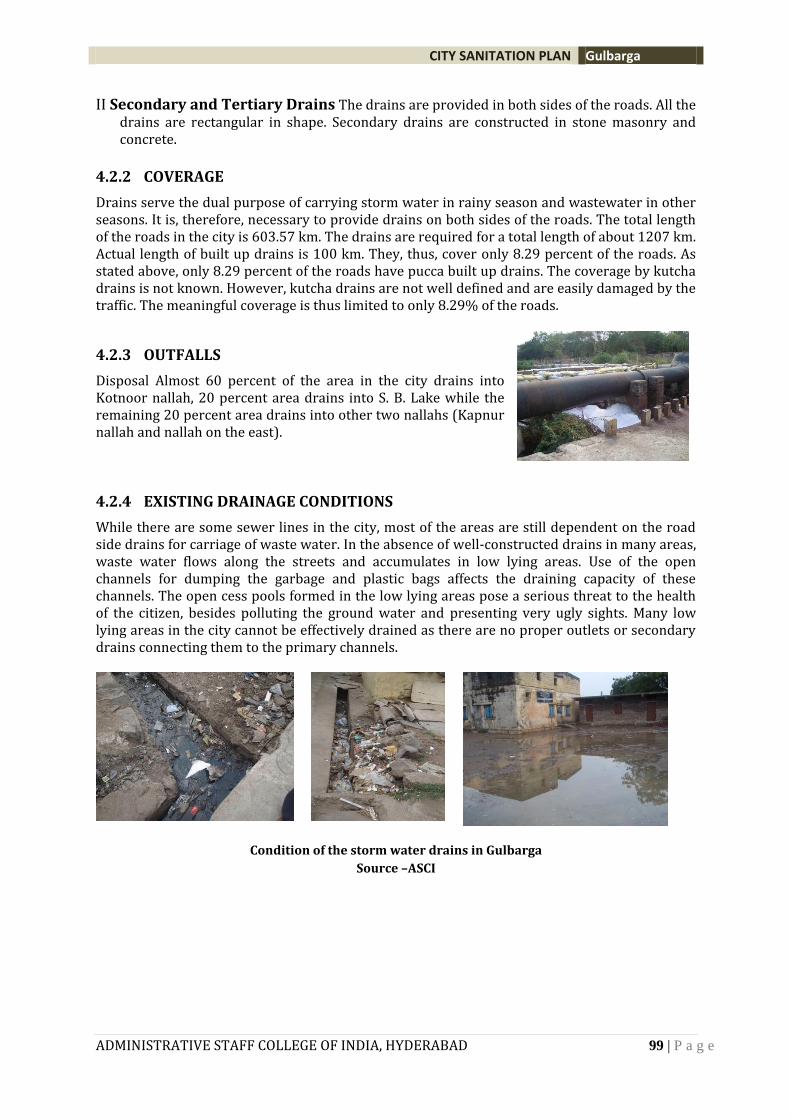
CITY SANITATION PLAN Gulbarga
ADMINISTRATIVE STAFF COLLEGE OF INDIA, HYDERABAD 99 | P a g e
II Secondary and Tertiary Drains The drains are provided in both sides of the roads. All the drains are rectangular in shape. Secondary drains are constructed in stone masonry and concrete.
4.2.2 COVERAGE
Drains serve the dual purpose of carrying storm water in rainy season and wastewater in other seasons. It is, therefore, necessary to provide drains on both sides of the roads. The total length of the roads in the city is 603.57 km. The drains are required for a total length of about 1207 km. Actual length of built up drains is 100 km. They, thus, cover only 8.29 percent of the roads. As stated above, only 8.29 percent of the roads have pucca built up drains. The coverage by kutcha drains is not known. However, kutcha drains are not well defined and are easily damaged by the traffic. The meaningful coverage is thus limited to only 8.29% of the roads.
4.2.3 OUTFALLS
Disposal Almost 60 percent of the area in the city drains into Kotnoor nallah, 20 percent area drains into S. B. Lake while the remaining 20 percent area drains into other two nallahs (Kapnur nallah and nallah on the east).
4.2.4 EXISTING DRAINAGE CONDITIONS
While there are some sewer lines in the city, most of the areas are still dependent on the road side drains for carriage of waste water. In the absence of well-constructed drains in many areas, waste water flows along the streets and accumulates in low lying areas. Use of the open channels for dumping the garbage and plastic bags affects the draining capacity of these channels. The open cess pools formed in the low lying areas pose a serious threat to the health of the citizen, besides polluting the ground water and presenting very ugly sights. Many low lying areas in the city cannot be effectively drained as there are no proper outlets or secondary drains connecting them to the primary channels.
Condition of the storm water drains in Gulbarga
Source –ASCI
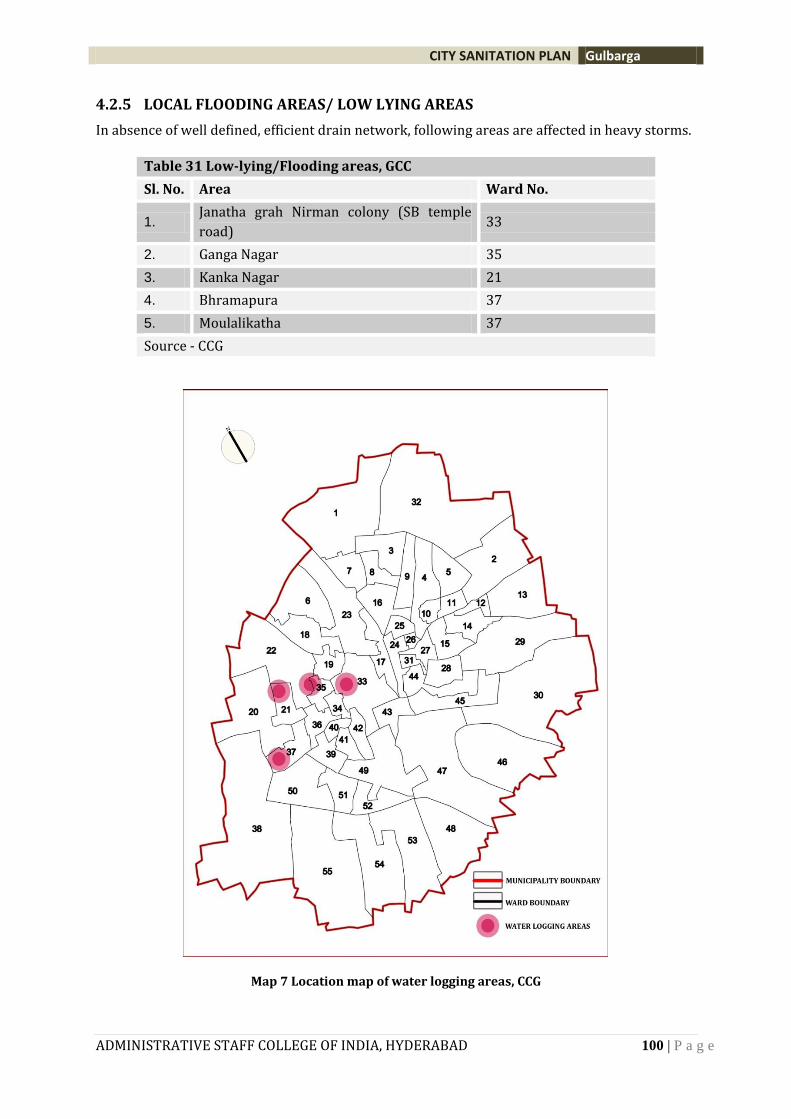
CITY SANITATION PLAN Gulbarga
ADMINISTRATIVE STAFF COLLEGE OF INDIA, HYDERABAD 100 | P a g e
4.2.5 LOCAL FLOODING AREAS/ LOW LYING AREAS
In absence of well defined, efficient drain network, following areas are affected in heavy storms.
Table 31 Low-lying/Flooding areas, GCC
Sl. No. Area Ward No.
1. Janatha grah Nirman colony (SB temple
road) 33
2. Ganga Nagar 35
3. Kanka Nagar 21
4. Bhramapura 37
5. Moulalikatha 37
Source - CCG
Map 7 Location map of water logging areas, CCG
CITY SANITATION PLAN Gulbarga
ADMINISTRATIVE STAFF COLLEGE OF INDIA, HYDERABAD 101 | P a g e
4.2.6 STANDARDIZED SERVICE LEVEL INDICATORS
Table 32 Storm Water Drainage – Service Level Benchmarks,
Sl. No Indicators Benchmarks Status
1 Coverage of storm water drainage
network
100% 70
2 Incidence of water logging 0 3
[Source –SLB notifications of Karnataka ULB’s 2011]
INFORMATION BOX 6: STORM WATER DRAINAGE – THE KEY OBSERVATIONS
Encroachment along natural drains.
No comprehensive plan for improvement of storm water drains.
Water logging and flood prone areas are observed in many parts of Gulbarga.
Inadequate capacity of drains due to silting and weeding of drains.
Partial/ haphazard lining of drains.
Flow of sewage and disposal of solid wastes into drains.
Lack of adequate maintenance of drain channel and associated structures.
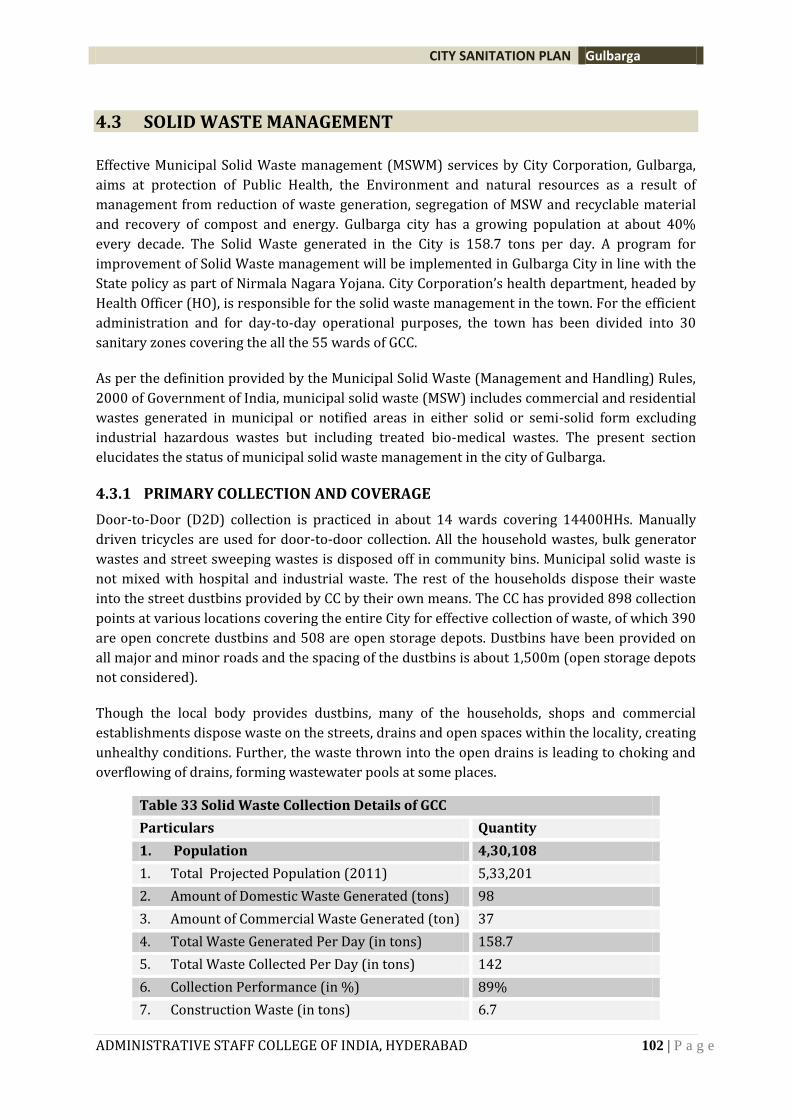
CITY SANITATION PLAN Gulbarga
ADMINISTRATIVE STAFF COLLEGE OF INDIA, HYDERABAD 102 | P a g e
4.3 SOLID WASTE MANAGEMENT
Effective Municipal Solid Waste management (MSWM) services by City Corporation, Gulbarga,
aims at protection of Public Health, the Environment and natural resources as a result of
management from reduction of waste generation, segregation of MSW and recyclable material
and recovery of compost and energy. Gulbarga city has a growing population at about 40%
every decade. The Solid Waste generated in the City is 158.7 tons per day. A program for
improvement of Solid Waste management will be implemented in Gulbarga City in line with the
State policy as part of Nirmala Nagara Yojana. City Corporation’s health department, headed by
Health Officer (HO), is responsible for the solid waste management in the town. For the efficient
administration and for day-to-day operational purposes, the town has been divided into 30
sanitary zones covering the all the 55 wards of GCC.
As per the definition provided by the Municipal Solid Waste (Management and Handling) Rules,
2000 of Government of India, municipal solid waste (MSW) includes commercial and residential
wastes generated in municipal or notified areas in either solid or semi-solid form excluding
industrial hazardous wastes but including treated bio-medical wastes. The present section
elucidates the status of municipal solid waste management in the city of Gulbarga.
4.3.1 PRIMARY COLLECTION AND COVERAGE
Door-to-Door (D2D) collection is practiced in about 14 wards covering 14400HHs. Manually
driven tricycles are used for door-to-door collection. All the household wastes, bulk generator
wastes and street sweeping wastes is disposed off in community bins. Municipal solid waste is
not mixed with hospital and industrial waste. The rest of the households dispose their waste
into the street dustbins provided by CC by their own means. The CC has provided 898 collection
points at various locations covering the entire City for effective collection of waste, of which 390
are open concrete dustbins and 508 are open storage depots. Dustbins have been provided on
all major and minor roads and the spacing of the dustbins is about 1,500m (open storage depots
not considered).
Though the local body provides dustbins, many of the households, shops and commercial
establishments dispose waste on the streets, drains and open spaces within the locality, creating
unhealthy conditions. Further, the waste thrown into the open drains is leading to choking and
overflowing of drains, forming wastewater pools at some places.
Table 33 Solid Waste Collection Details of GCC
Particulars Quantity
1. Population 4,30,108
1. Total Projected Population (2011) 5,33,201
2. Amount of Domestic Waste Generated (tons) 98
3. Amount of Commercial Waste Generated (ton) 37
4. Total Waste Generated Per Day (in tons) 158.7
5. Total Waste Collected Per Day (in tons) 142
6. Collection Performance (in %) 89%
7. Construction Waste (in tons) 6.7
CITY SANITATION PLAN Gulbarga
ADMINISTRATIVE STAFF COLLEGE OF INDIA, HYDERABAD 103 | P a g e
8. Street Sweeping Waste (tons) 15
9. Per capita Waste generated (in kgs) 0.29kgs
Source - GCC
The following table shows the collection & Segregation practiced ward wise in GCC
Table 34 Wardwise SWM details of GCC
Ward No
SWM generated quantity
SWM Collection quantity
Door-to-Door collection HHs
Segregation practiced
No. of local open dumpsites
(MT) (MT) (nos.) (Y/N) (nos.)
1 3422 3080 500 N 5
2 3561 3205 N 4
3 2456 2210 N 4
4 2478 2230 N 12
5 2112 1901 N 10
6 3075 2768 N 12
7 3030 2727 N 5
8 2818 2536 N 8
9 3921 3529 N 3
10 4715 4244 N 4
11 2306 2075 N 8
12 3052 2747 N 5
13 2637 2373 N 3
14 2091 1882 N 12
15 2998 2698 N 3
16 4679 4211 1200 N 9
17 7380 6642 N 16
18 3450 3105 345 N 13
19 2855 2570 317 N 12
20 3554 3199 110 N 6
21 2337 2103 200 N 8
22 2624 2362 676 N 5
23 2442 2198 622 N 9
24 2004 1804 987 N 9
25 2458 2212 N 7
26 2458 2212 N 6
27 2733 2460 N 9
28 2069 1862 N 4
29 2217 1995 N 3
30 2676 2408 N 6
31 2088 1879 N 10
CITY SANITATION PLAN Gulbarga
ADMINISTRATIVE STAFF COLLEGE OF INDIA, HYDERABAD 104 | P a g e
32 6767 6090 N 16
33 2551 2296 N 8
34 2458 2212 N 8
35 3278 2950 N 5
36 2043 1839 N 8
37 2976 2678 N 5
38 3253 2928 N 12
39 2616 2354 N 9
40 2414 2173 N 3
41 2567 2310 168 N 8
42 2393 2154 855 N 10
43 3905 3515 N 6
44 3098 2788 N 12
45 2512 2261 N 9
46 4027 3624 N 4
47 5560 5004 N 8
48 2557 2301 N 6
49 2649 2384 220 N 7
50 3134 2821 N 2
51 2214 1993 1000 N 3
52 2842 2558 N 2
53 4987 4488 N 2
54 2652 2387 N 3
55 2990 2691 N 4
169139 152225 14400 780
Source - GCC
The following table shows that DTD collection is being done only in 14 wards and there is no
segregation of the waste that is practiced in GCC.
4.3.2 STREET SWEEPING
The staff employed is also detailed. All main roads and market streets are swept on a daily basis.
Others are swept alternate days, thrice a week, occasionally or not at all. The road length to be
swept by the sanitary workers is not standardized. Although planning for sweeping is done
many adhoc activities are undertaken and the various processes are not documented.
Depending on the concentration of the people / activity of the roads and lanes there was no
definite yardstick prescribed for the each sanitary worker.
Major activities in solid waste management are street sweeping activity and drain desilting,
which are both, time consuming and labour intensive. GCC manages street sweeping and drain
desilting in all the 30 sanitary zones with 500 sanitary workers, 67 percent of the total sanitary
staff. The total length of municipal roads and streets in Gulbarga is 604 km and total road length
per sweeper including the private staff works out to be more than 1,000m.
CITY SANITATION PLAN Gulbarga
ADMINISTRATIVE STAFF COLLEGE OF INDIA, HYDERABAD 105 | P a g e
Due to insufficient manpower with the local body, frequency of street sweeping and desilting
activities is not uniform all over the city. Depending on the locality and necessity, street
sweeping is being taken up on the priority basis. In all, 30 percent of the streets are cleaned
daily, 45 percent twice a day and 25 percent of the streets are cleaned once a week or
occasionally. The total waste collected in street sweeping is 15TPD which is about 9% of the
total CCG waste generated
4.3.3 WASTE GENERATION, SEGREGATION, QUANTITY AND CHARACTERISTICS
About 158.7 tons of waste is generated per day in Gulbarga City. Gulbarga city corportation
collects about 142 tons (89 %), of the total waste, through its solid waste collection system. The
per capita waste generation in the town is about 297.6 gm per day that is higher than the
normative estimate of 210 gm per capita per day by CPHEEO for the similar size of city.
Segregation of waste is not being practiced in GCC. The following graph gives the details of
category wise waste generated and collected.
Figure 11 Category wise waste generation & collection
In Gulbarga, major source of waste generation, as in any typical Indian cities, has been the
households. The quantum of waste generated from households is about 98 tons, which is 61.8%
percent of the total solid waste generated in the city. The figure shows the quantity of waste
generated from various sources
Figure 12 Category of waste generated in GCC
2940
1110
450 201
60
2646
999
405 150 60
0
500
1000
1500
2000
2500
3000
3500
Residential Commercial Street sweeping Constructionwaste
SlaughterHouses
Qu
an
tity
of
wa
ste
(M
T/
Mo
nth
)
Category of waste
Quantity of waste generated (MT/Month)Quantity of waste collected (MT/Month)
62% 23%
10% 4% 1%
Quantity of waste generated in %
Residential
Commercial
Street sweeping
Construction waste
Slaughter Houses
CITY SANITATION PLAN Gulbarga
ADMINISTRATIVE STAFF COLLEGE OF INDIA, HYDERABAD 106 | P a g e
The commercial establishments generate about 37 tpd (23.3%) percent of the total waste
generation. Commercial establishments included here are like shops, hotels and trade &
commerce establishments. A number of daily and wholesale vegetable and fruit markets
generate organic waste to a quantum of waste such as Super Market, Asif Gunj, Station Area
Market, MSK Mills Market, Santi Market, Roza Market and Bramhapur Vegetable Market are the
largest markets in Gulbarga and contributes major chunk in total market waste. In addition,
there are two daily markets for meat and fish. The fish and meat markets including
slaughterhouse generate 2 tpd, which is about 1.3% of the total waste generation.
Composition of Waste: A study conducted by Health Department of GCC estimated that the
waste contain 58.68 percent of compostable waste, 22.14 percent of recyclable waste such as
paper, plastic etc, 4.66 per cent of hazardous waste and remaining 14.51 percent inert materials.
As depicted in below Table in comparison with the CPHEEO norms, the waste has very high
percentage of organic waste, which is roughly one and half times the norm of 39 percent.
Table 35 Physical composition of waste in GCC
Parameter CPHEEO Norms Gulbarga
% of waste % of waste
Total compostable material 38.95 58.68
Paper 4.71 22.14
Rubber, leather & synthetics 0.71
Glass 0.46
Metals 0.49
Inert Materials 44.73 14.51
Hazardous 4.66
Source: CPHEEO, CC Gulbarga
4.3.4 SECONDARY COLLECTION
The secondary collection refers to collection of waste from community dustbins and
intermediate collection points or transit points. However, in Gulbarga, there are no intermediate
collection points or transit points, and the waste is directly transported to the disposal site from
dustbins. Of the 55 wards, 37 wards have been contracted to private operator, for collection and
transportation operation, and CC Gulbarga is managing 18 wards.
Waste collected from dustbins and open dumping sites is manually loaded onto the
transportation vehicles. In addition to community dust bins provided by the CC, there are
number of undesignated waste-dumping points, which are attended to by the CC. Further, due
to lack of maintenance, many bins are in deteriorating condition. Discussions reveal that, the
residents and owners of shops and commercial establishments do not allow the municipal
authorities to provide dustbin at several places, primarily because of the perception among the
people that it may lead to filthy environment in the locality due to accumulation and irregular
collection of waste from the bins.
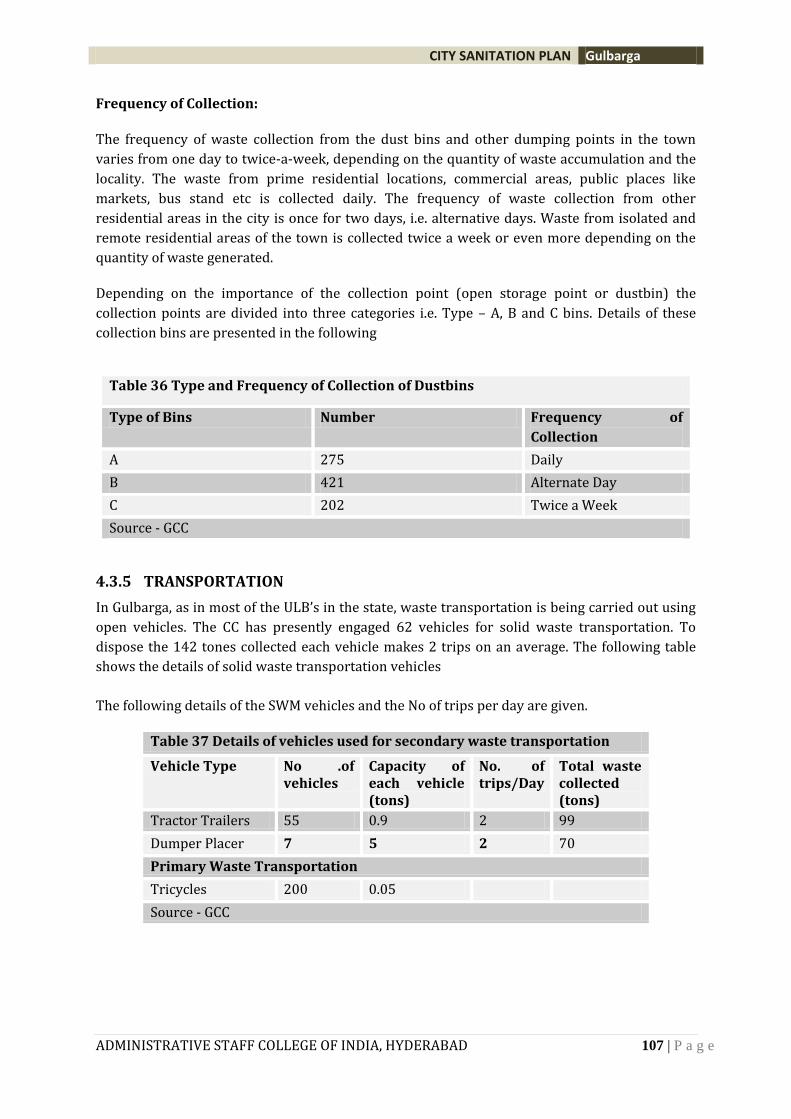
CITY SANITATION PLAN Gulbarga
ADMINISTRATIVE STAFF COLLEGE OF INDIA, HYDERABAD 107 | P a g e
Frequency of Collection:
The frequency of waste collection from the dust bins and other dumping points in the town
varies from one day to twice-a-week, depending on the quantity of waste accumulation and the
locality. The waste from prime residential locations, commercial areas, public places like
markets, bus stand etc is collected daily. The frequency of waste collection from other
residential areas in the city is once for two days, i.e. alternative days. Waste from isolated and
remote residential areas of the town is collected twice a week or even more depending on the
quantity of waste generated.
Depending on the importance of the collection point (open storage point or dustbin) the
collection points are divided into three categories i.e. Type – A, B and C bins. Details of these
collection bins are presented in the following
Table 36 Type and Frequency of Collection of Dustbins
Type of Bins Number Frequency of
Collection
A 275 Daily
B 421 Alternate Day
C 202 Twice a Week
Source - GCC
4.3.5 TRANSPORTATION
In Gulbarga, as in most of the ULB’s in the state, waste transportation is being carried out using
open vehicles. The CC has presently engaged 62 vehicles for solid waste transportation. To
dispose the 142 tones collected each vehicle makes 2 trips on an average. The following table
shows the details of solid waste transportation vehicles
The following details of the SWM vehicles and the No of trips per day are given.
Table 37 Details of vehicles used for secondary waste transportation
Vehicle Type No .of vehicles
Capacity of each vehicle (tons)
No. of trips/Day
Total waste collected (tons)
Tractor Trailers 55 0.9 2 99
Dumper Placer 7 5 2 70
Primary Waste Transportation
Tricycles 200 0.05
Source - GCC
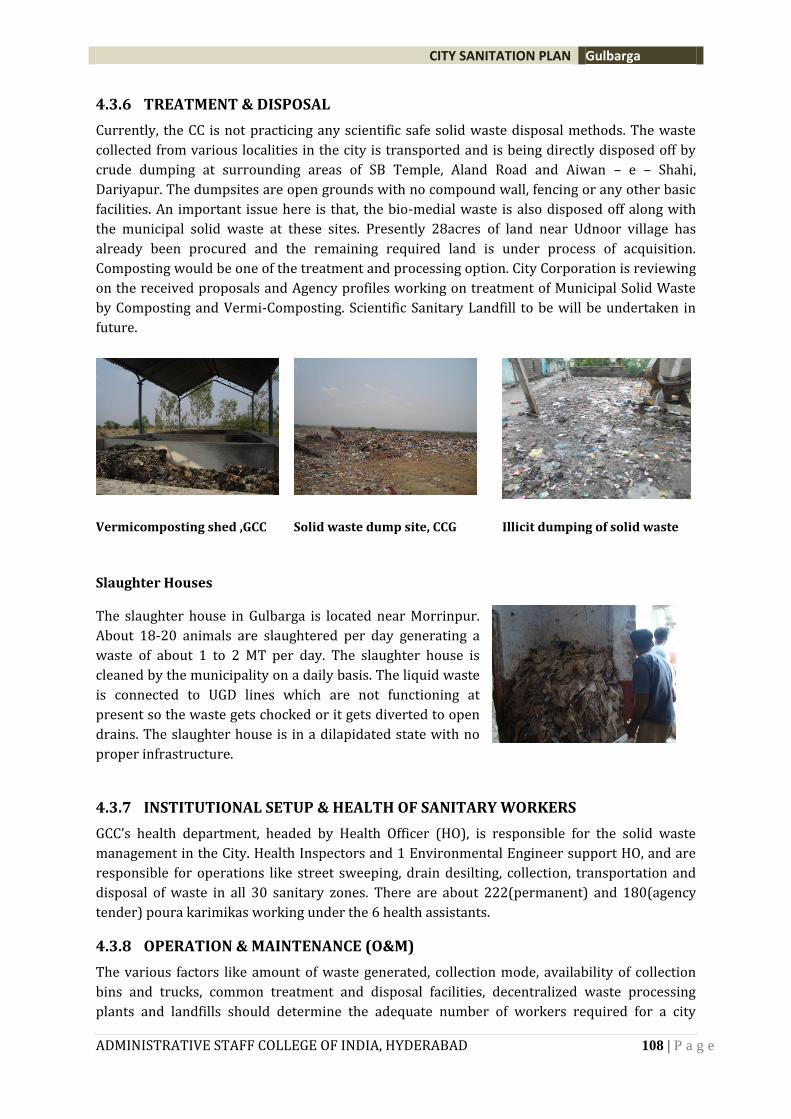
CITY SANITATION PLAN Gulbarga
ADMINISTRATIVE STAFF COLLEGE OF INDIA, HYDERABAD 108 | P a g e
4.3.6 TREATMENT & DISPOSAL
Currently, the CC is not practicing any scientific safe solid waste disposal methods. The waste
collected from various localities in the city is transported and is being directly disposed off by
crude dumping at surrounding areas of SB Temple, Aland Road and Aiwan – e – Shahi,
Dariyapur. The dumpsites are open grounds with no compound wall, fencing or any other basic
facilities. An important issue here is that, the bio-medial waste is also disposed off along with
the municipal solid waste at these sites. Presently 28acres of land near Udnoor village has
already been procured and the remaining required land is under process of acquisition.
Composting would be one of the treatment and processing option. City Corporation is reviewing
on the received proposals and Agency profiles working on treatment of Municipal Solid Waste
by Composting and Vermi-Composting. Scientific Sanitary Landfill to be will be undertaken in
future.
Vermicomposting shed ,GCC Solid waste dump site, CCG Illicit dumping of solid waste
Slaughter Houses
The slaughter house in Gulbarga is located near Morrinpur.
About 18-20 animals are slaughtered per day generating a
waste of about 1 to 2 MT per day. The slaughter house is
cleaned by the municipality on a daily basis. The liquid waste
is connected to UGD lines which are not functioning at
present so the waste gets chocked or it gets diverted to open
drains. The slaughter house is in a dilapidated state with no
proper infrastructure.
4.3.7 INSTITUTIONAL SETUP & HEALTH OF SANITARY WORKERS
GCC’s health department, headed by Health Officer (HO), is responsible for the solid waste
management in the City. Health Inspectors and 1 Environmental Engineer support HO, and are
responsible for operations like street sweeping, drain desilting, collection, transportation and
disposal of waste in all 30 sanitary zones. There are about 222(permanent) and 180(agency
tender) poura karimikas working under the 6 health assistants.
4.3.8 OPERATION & MAINTENANCE (O&M)
The various factors like amount of waste generated, collection mode, availability of collection
bins and trucks, common treatment and disposal facilities, decentralized waste processing
plants and landfills should determine the adequate number of workers required for a city
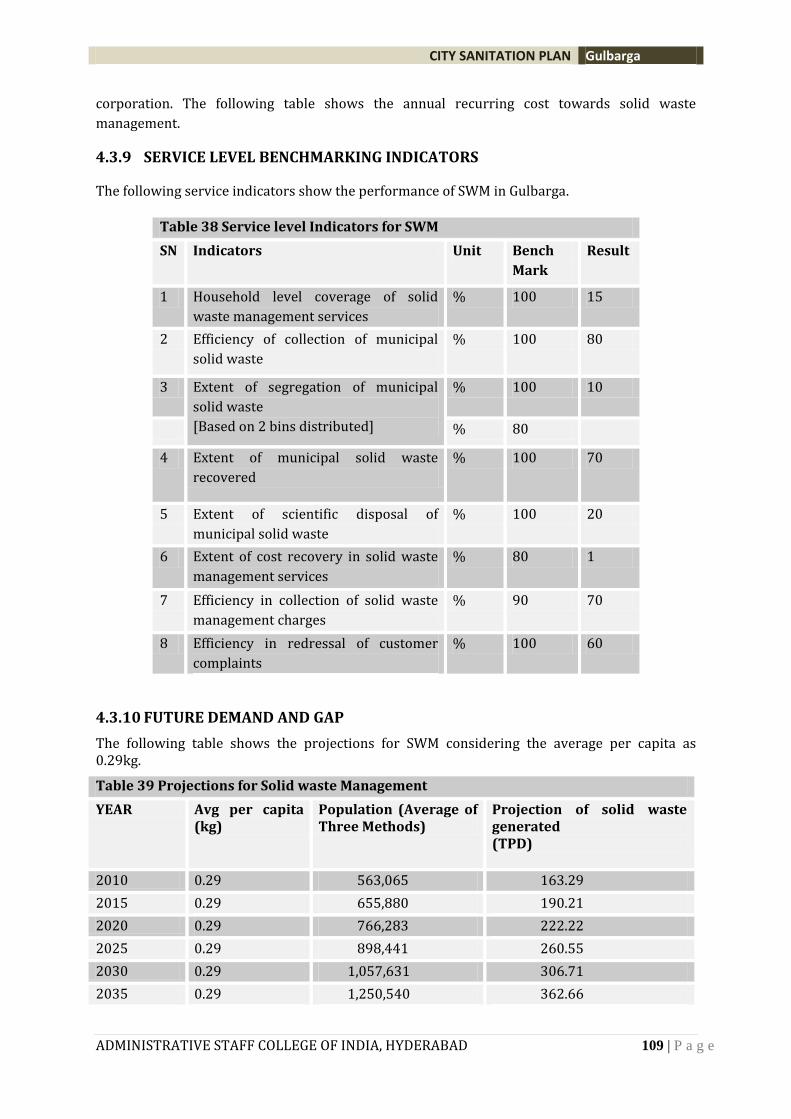
CITY SANITATION PLAN Gulbarga
ADMINISTRATIVE STAFF COLLEGE OF INDIA, HYDERABAD 109 | P a g e
corporation. The following table shows the annual recurring cost towards solid waste
management.
4.3.9 SERVICE LEVEL BENCHMARKING INDICATORS
The following service indicators show the performance of SWM in Gulbarga.
Table 38 Service level Indicators for SWM
SN Indicators Unit Bench
Mark
Result
1 Household level coverage of solid
waste management services
% 100 15
2 Efficiency of collection of municipal
solid waste
% 100 80
3 Extent of segregation of municipal
solid waste
[Based on 2 bins distributed]
% 100 10
% 80
4 Extent of municipal solid waste
recovered
% 100 70
5 Extent of scientific disposal of
municipal solid waste
% 100 20
6 Extent of cost recovery in solid waste
management services
% 80 1
7 Efficiency in collection of solid waste
management charges
% 90 70
8 Efficiency in redressal of customer
complaints
% 100 60
4.3.10 FUTURE DEMAND AND GAP
The following table shows the projections for SWM considering the average per capita as 0.29kg.
Table 39 Projections for Solid waste Management
YEAR Avg per capita (kg)
Population (Average of Three Methods)
Projection of solid waste generated (TPD)
2010 0.29 563,065 163.29
2015 0.29 655,880 190.21
2020 0.29 766,283 222.22
2025 0.29 898,441 260.55
2030 0.29 1,057,631 306.71
2035 0.29 1,250,540 362.66
CITY SANITATION PLAN Gulbarga
ADMINISTRATIVE STAFF COLLEGE OF INDIA, HYDERABAD 110 | P a g e
2040 0.29 1,485,639 430.84
2045 0.29 1,773,655 514.36
[Source: ASCI]
INFORMATION BOX 7: INITIATIVES BY THE GOVERNEMENT FOR SWM
The Karnataka Municipalities Act, 1964 and Karnataka Municipal Corporation Act, 1976, have emphasized the need to collect and dispose ‘rubbish and filth’ in a defined manner, so as to keep public places clean. However, there is no reference to scientific collection and disposal of the same. Hence, rules have been laid down fixing the responsibility of management of solid waste disposal and various standards for disposal solid waste.
The rules that regulate the management and handling of solid waste in Gulbarga are:
Municipal Solid Wastes (Management and Handling) Rules, 2000;
Karnataka State Policy on Integrated Solid Waste Management (ISWM);
Bio-Medical Waste (Management & Handling) Rules, 1998;
Hazardous Waste (Management & Handling) Rules, 1989, 2000, 2003;
Batteries (Management and Handling) Rules, 2001; and
Recycled Plastics (Manufacture and Usage) Rules, 1999.
Guidelines for managing E-waste, 2002
INFORMATION BOX 8: SOLID WASTE MANAGEMENT– THE KEY OBSERVATIONS
DTD collection is being done only in 14 wards leading to only 15% of Household level
coverage.
Crude dumping of solid waste on the roadsides, open drains and vacant lands was
observed which creates unhygienic surroundings.
Segregation of waste is not practiced in Gulbarga city.
At present there is no scientific location for dumping the solid waste. The waste is being
indiscriminately being dumped.
The sanitary workers are not provided with any protective equipment posing health
hazards
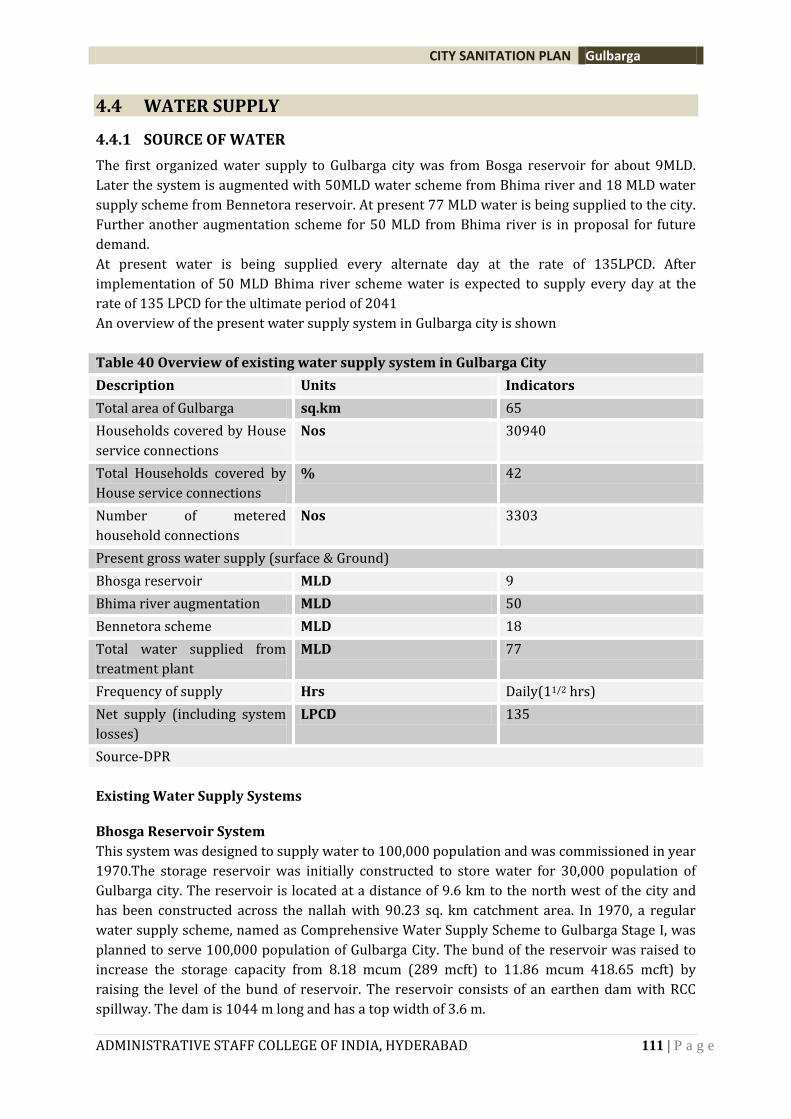
CITY SANITATION PLAN Gulbarga
ADMINISTRATIVE STAFF COLLEGE OF INDIA, HYDERABAD 111 | P a g e
4.4 WATER SUPPLY
4.4.1 SOURCE OF WATER
The first organized water supply to Gulbarga city was from Bosga reservoir for about 9MLD.
Later the system is augmented with 50MLD water scheme from Bhima river and 18 MLD water
supply scheme from Bennetora reservoir. At present 77 MLD water is being supplied to the city.
Further another augmentation scheme for 50 MLD from Bhima river is in proposal for future
demand.
At present water is being supplied every alternate day at the rate of 135LPCD. After
implementation of 50 MLD Bhima river scheme water is expected to supply every day at the
rate of 135 LPCD for the ultimate period of 2041
An overview of the present water supply system in Gulbarga city is shown
Table 40 Overview of existing water supply system in Gulbarga City
Description Units Indicators
Total area of Gulbarga sq.km 65
Households covered by House
service connections
Nos 30940
Total Households covered by
House service connections
% 42
Number of metered
household connections
Nos 3303
Present gross water supply (surface & Ground)
Bhosga reservoir MLD 9
Bhima river augmentation MLD 50
Bennetora scheme MLD 18
Total water supplied from
treatment plant
MLD 77
Frequency of supply Hrs Daily(11/2 hrs)
Net supply (including system
losses)
LPCD 135
Source-DPR
Existing Water Supply Systems
Bhosga Reservoir System
This system was designed to supply water to 100,000 population and was commissioned in year
1970.The storage reservoir was initially constructed to store water for 30,000 population of
Gulbarga city. The reservoir is located at a distance of 9.6 km to the north west of the city and
has been constructed across the nallah with 90.23 sq. km catchment area. In 1970, a regular
water supply scheme, named as Comprehensive Water Supply Scheme to Gulbarga Stage I, was
planned to serve 100,000 population of Gulbarga City. The bund of the reservoir was raised to
increase the storage capacity from 8.18 mcum (289 mcft) to 11.86 mcum 418.65 mcft) by
raising the level of the bund of reservoir. The reservoir consists of an earthen dam with RCC
spillway. The dam is 1044 m long and has a top width of 3.6 m.
CITY SANITATION PLAN Gulbarga
ADMINISTRATIVE STAFF COLLEGE OF INDIA, HYDERABAD 112 | P a g e
The system was designed to supply 18 MLD, but the reservoir storage has been substantially
reduced due to heavy silting of the tank. The source is presently capable of supplying about 9.09
MLD in normal rainfall years. Due to the failure of monsoon in last two years, the reservoir is
completely dry and cannot be depended on for regular water supply to the city.
Transmission.
Water drawn from the reservoir is conveyed by gravity upto the water treatment plant through
one 750 mm diameter RCC main laid for a length of 9.60 kms. There may be some leakages in
the pipeline. However, it is a low-pressure gravity main and can continue to be used, whenever
there is some water in the storage reservoir.
Bennithora River Water Supply System
Second stage water supply development took place in year 1978, with Bennithora river as the
source of water. This system has been designed to supply 9 MLD. The source works are located
at a distance of about 20 kms from the Sultanpur water treatment plant.
River Works Surface water in Bennithora River is drawn through
(i) An intake well of 2.50 m diameter and 3.5 m height;
(ii) 600 mm diameter CI connecting main laid for a length of 51 m;
(iii) 8 m diameter and 16.43 m deep jack well; and
(iv) 12.70 m diameter and 6.60 m high pump house.
The civil structures of the intake works are in good operating condition. The river is not
perennial. However, one irrigation weir on the downstream and occasional releases from
Gandori irrigation storage reservoir, about 15 km on the upstream, provides sufficient water in
the riverbed. The physical, chemical and bacteriological quality of river water needs to be tested
regularly. The pumps are reported to operate for about 22 hours per day. With the design
discharge of each pump of 7900 lpm, the pumping capacity of one pump is about 10 MLD.
However, only about 4.55 MLD water is reported to be reaching the water treatment plant. The
exact discharge of the pumps needs to be ascertained. Installed capacity is about 18 MLD in 20
hours.
Bhima River Water Supply System
Third stage development of Gulbarga city water supply took place in year 1993, as the earlier
two stages from Bhosga Reservoir and Bennithora river were not dependable for steady supply
to the city throughout the year. This system was designed to supply water to 330,000
population expected in year 2011, at 30 gpcd (135 lpcd). The capacity of the system is 25 MLD.
Storage Barrage. A barrage has been constructed across Bhima River, near village Saradgi,
about 27.50 km from the city, to store water in the riverbed. The dependability of the Bhima
river source has thus been ensured by, construction of the barrage and occasional releases of
water from Almatti dam canal irrigating the Bhima basin.
The works are recently constructed and in good condition. This is now the major source of
water supply to Gulbarga city and is used for 22 hours a day.
4.4.2 EXISTING TRANSMISSION, DISTRIBUTION AND STORAGE CAPACITIES
Water Treatment Plant
CITY SANITATION PLAN Gulbarga
ADMINISTRATIVE STAFF COLLEGE OF INDIA, HYDERABAD 113 | P a g e
Old Sultanpur Water Treatment Plant
This plant was designed to treat 2.5 MGD (11.25 MLD) water and has following components.
(i) Three rectangular sedimentation tanks constructed in stone masonry.
(ii) Five rapid sand filter beds, each of 0.5 MGD (2.27 MLD).
(iii) 0.14 ML RCC wash water tank.
The civil structures of the water treatment plant are in reasonably good condition. There
is no proper coagulation and filtration system. Even when there is no water in the Bhosga
reservoir, it will be possible to keep this WTP in operation by diverting Bennithora river water
to this plant.
Sultanpur Water Treatment Plant.
This plant is a conventional water treatment plant, designed to treat 2 MGD (9.09 MLD). This
plant is operating well below its design capacity of 9 MLD. The plant is in reasonably good
condition but suffers from inherent deficiencies like flow cannot be measured, chemical dosing
system is not in use, filter controls are missing, and chemical dosing and filter washing are done
arbitrarily.
Chorgumbaz Water Treatment Plant.
This plant is designed to treat 25 MLD water and has following units.
Aeration fountain, in the form of four cascades, with designed capacity of 50 MLD;
Raw water channel with a weir;
50 MLD capacity flash mixer with electrically operated 3 HP flash mixer;
One clariflocculator, designed to handle 25 MLD, with four 1 HP flocculators and 2 HP
motor operated clarifier scraper bridge;
Six beds of rapid sand filters, each bed designed to treat 5.50 MLD water;
Back wash arrangement, comprising two 10 HP back wash water pumps and 0.337 ML
capacity RCC overhead tank for storing back wash water;
Chemical dosing system installed in a chemical house, with arrangement to prepare
alum solution tanks in three tanks fitted with 0.5 HP alum mixers; and
Gravity feed chlorinator.
The water treatment plant has been performing well, except for a few deficiencies like no facility
to measure the flow, no laboratory support for plant operation, filter controls nonfunctional,
and dosing of chemicals and back washing of filters being done arbitrarily.
New Water Treatment Plant at Intermediate Pumping Station Site
One 2.5 MGD (11.25 MLD) water treatment plant is being constructed at the IPS site. It will have
two flocculators, two tube setting tanks and filters as the main treatment process. This plant,
when completed, is expected to serve areas south of the railway line.
Clear Water Transmission Mains.
Treated water from Chorgumbaz WTP flows to the city through transmission mains, indicated in
Clear Water Transmission Mains.
Water Distribution
Balancing and Service Storage Reservoirs Water supply to the city will be done through 34
balancing or service reservoirs. 21 of these are existing reservoirs and 13 more are being
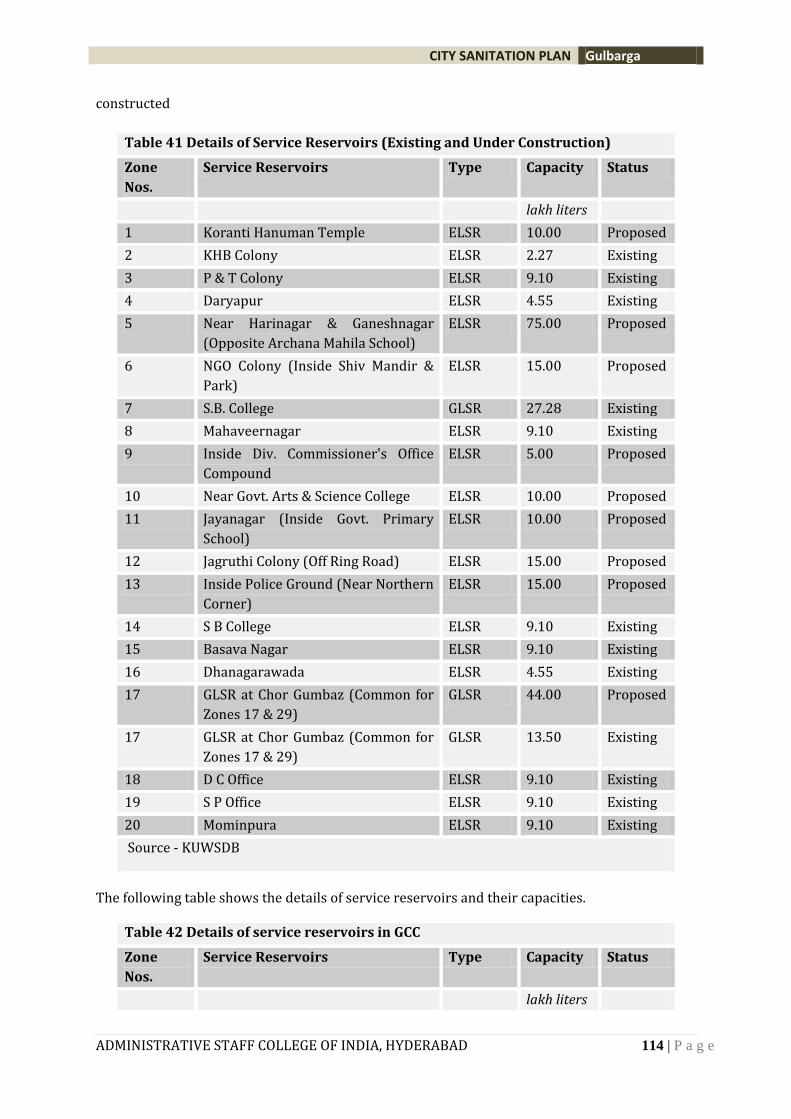
CITY SANITATION PLAN Gulbarga
ADMINISTRATIVE STAFF COLLEGE OF INDIA, HYDERABAD 114 | P a g e
constructed
Table 41 Details of Service Reservoirs (Existing and Under Construction)
Zone
Nos.
Service Reservoirs Type Capacity Status
lakh liters
1 Koranti Hanuman Temple ELSR 10.00 Proposed
2 KHB Colony ELSR 2.27 Existing
3 P & T Colony ELSR 9.10 Existing
4 Daryapur ELSR 4.55 Existing
5 Near Harinagar & Ganeshnagar
(Opposite Archana Mahila School)
ELSR 75.00 Proposed
6 NGO Colony (Inside Shiv Mandir &
Park)
ELSR 15.00 Proposed
7 S.B. College GLSR 27.28 Existing
8 Mahaveernagar ELSR 9.10 Existing
9 Inside Div. Commissioner's Office
Compound
ELSR 5.00 Proposed
10 Near Govt. Arts & Science College ELSR 10.00 Proposed
11 Jayanagar (Inside Govt. Primary
School)
ELSR 10.00 Proposed
12 Jagruthi Colony (Off Ring Road) ELSR 15.00 Proposed
13 Inside Police Ground (Near Northern
Corner)
ELSR 15.00 Proposed
14 S B College ELSR 9.10 Existing
15 Basava Nagar ELSR 9.10 Existing
16 Dhanagarawada ELSR 4.55 Existing
17 GLSR at Chor Gumbaz (Common for
Zones 17 & 29)
GLSR 44.00 Proposed
17 GLSR at Chor Gumbaz (Common for
Zones 17 & 29)
GLSR 13.50 Existing
18 D C Office ELSR 9.10 Existing
19 S P Office ELSR 9.10 Existing
20 Mominpura ELSR 9.10 Existing
Source - KUWSDB
The following table shows the details of service reservoirs and their capacities.
Table 42 Details of service reservoirs in GCC
Zone
Nos.
Service Reservoirs Type Capacity Status
lakh liters
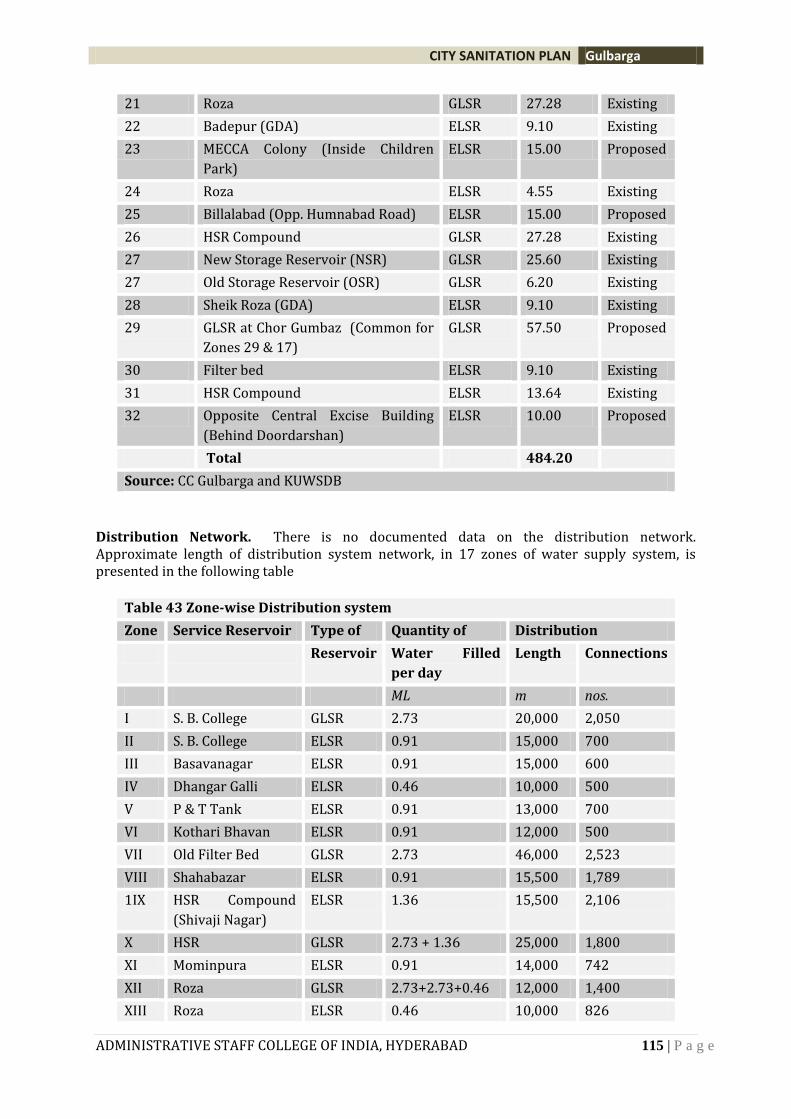
CITY SANITATION PLAN Gulbarga
ADMINISTRATIVE STAFF COLLEGE OF INDIA, HYDERABAD 115 | P a g e
21 Roza GLSR 27.28 Existing
22 Badepur (GDA) ELSR 9.10 Existing
23 MECCA Colony (Inside Children
Park)
ELSR 15.00 Proposed
24 Roza ELSR 4.55 Existing
25 Billalabad (Opp. Humnabad Road) ELSR 15.00 Proposed
26 HSR Compound GLSR 27.28 Existing
27 New Storage Reservoir (NSR) GLSR 25.60 Existing
27 Old Storage Reservoir (OSR) GLSR 6.20 Existing
28 Sheik Roza (GDA) ELSR 9.10 Existing
29 GLSR at Chor Gumbaz (Common for
Zones 29 & 17)
GLSR 57.50 Proposed
30 Filter bed ELSR 9.10 Existing
31 HSR Compound ELSR 13.64 Existing
32 Opposite Central Excise Building
(Behind Doordarshan)
ELSR 10.00 Proposed
Total 484.20
Source: CC Gulbarga and KUWSDB
Distribution Network. There is no documented data on the distribution network. Approximate length of distribution system network, in 17 zones of water supply system, is presented in the following table
Table 43 Zone-wise Distribution system
Zone Service Reservoir Type of Quantity of Distribution
Reservoir Water Filled
per day
Length Connections
ML m nos.
I S. B. College GLSR 2.73 20,000 2,050
II S. B. College ELSR 0.91 15,000 700
III Basavanagar ELSR 0.91 15,000 600
IV Dhangar Galli ELSR 0.46 10,000 500
V P & T Tank ELSR 0.91 13,000 700
VI Kothari Bhavan ELSR 0.91 12,000 500
VII Old Filter Bed GLSR 2.73 46,000 2,523
VIII Shahabazar ELSR 0.91 15,500 1,789
1IX HSR Compound
(Shivaji Nagar)
ELSR 1.36 15,500 2,106
X HSR GLSR 2.73 + 1.36 25,000 1,800
XI Mominpura ELSR 0.91 14,000 742
XII Roza GLSR 2.73+2.73+0.46 12,000 1,400
XIII Roza ELSR 0.46 10,000 826
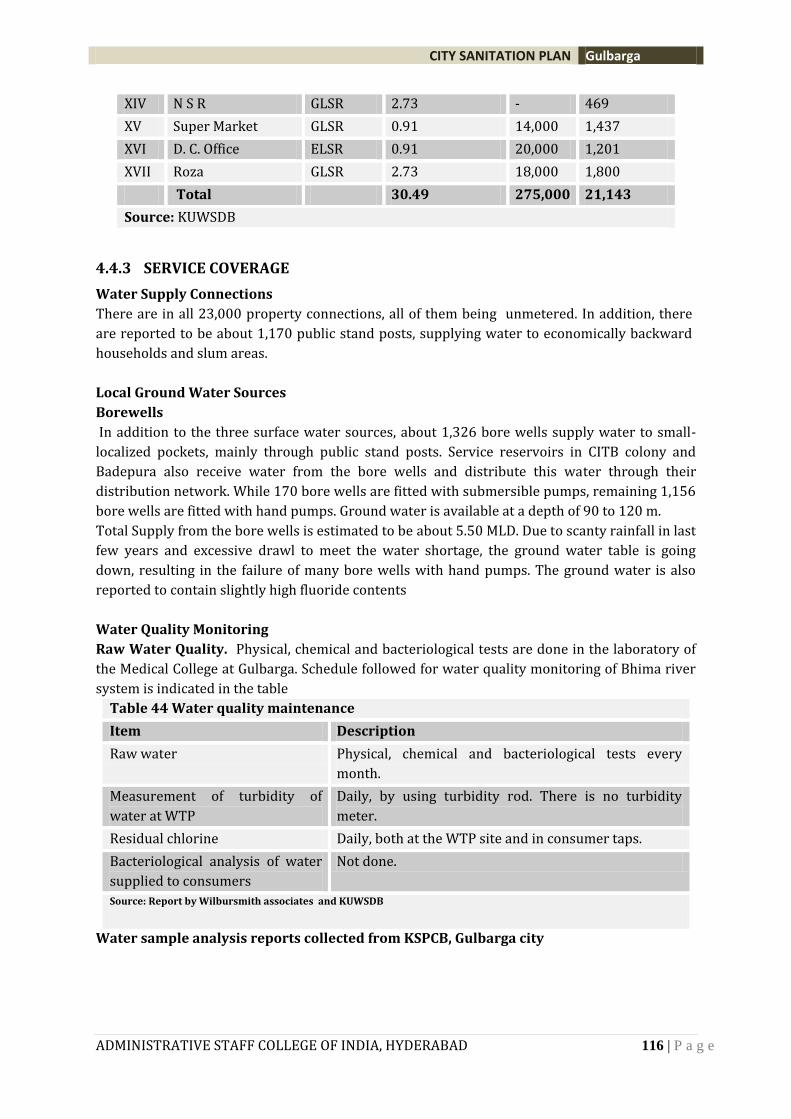
CITY SANITATION PLAN Gulbarga
ADMINISTRATIVE STAFF COLLEGE OF INDIA, HYDERABAD 116 | P a g e
XIV N S R GLSR 2.73 - 469
XV Super Market GLSR 0.91 14,000 1,437
XVI D. C. Office ELSR 0.91 20,000 1,201
XVII Roza GLSR 2.73 18,000 1,800
Total 30.49 275,000 21,143
Source: KUWSDB
4.4.3 SERVICE COVERAGE
Water Supply Connections
There are in all 23,000 property connections, all of them being unmetered. In addition, there
are reported to be about 1,170 public stand posts, supplying water to economically backward
households and slum areas.
Local Ground Water Sources
Borewells
In addition to the three surface water sources, about 1,326 bore wells supply water to small-
localized pockets, mainly through public stand posts. Service reservoirs in CITB colony and
Badepura also receive water from the bore wells and distribute this water through their
distribution network. While 170 bore wells are fitted with submersible pumps, remaining 1,156
bore wells are fitted with hand pumps. Ground water is available at a depth of 90 to 120 m.
Total Supply from the bore wells is estimated to be about 5.50 MLD. Due to scanty rainfall in last
few years and excessive drawl to meet the water shortage, the ground water table is going
down, resulting in the failure of many bore wells with hand pumps. The ground water is also
reported to contain slightly high fluoride contents
Water Quality Monitoring
Raw Water Quality. Physical, chemical and bacteriological tests are done in the laboratory of
the Medical College at Gulbarga. Schedule followed for water quality monitoring of Bhima river
system is indicated in the table
Table 44 Water quality maintenance
Item Description
Raw water Physical, chemical and bacteriological tests every
month.
Measurement of turbidity of
water at WTP
Daily, by using turbidity rod. There is no turbidity
meter.
Residual chlorine Daily, both at the WTP site and in consumer taps.
Bacteriological analysis of water
supplied to consumers
Not done.
Source: Report by Wilbursmith associates and KUWSDB
Water sample analysis reports collected from KSPCB, Gulbarga city
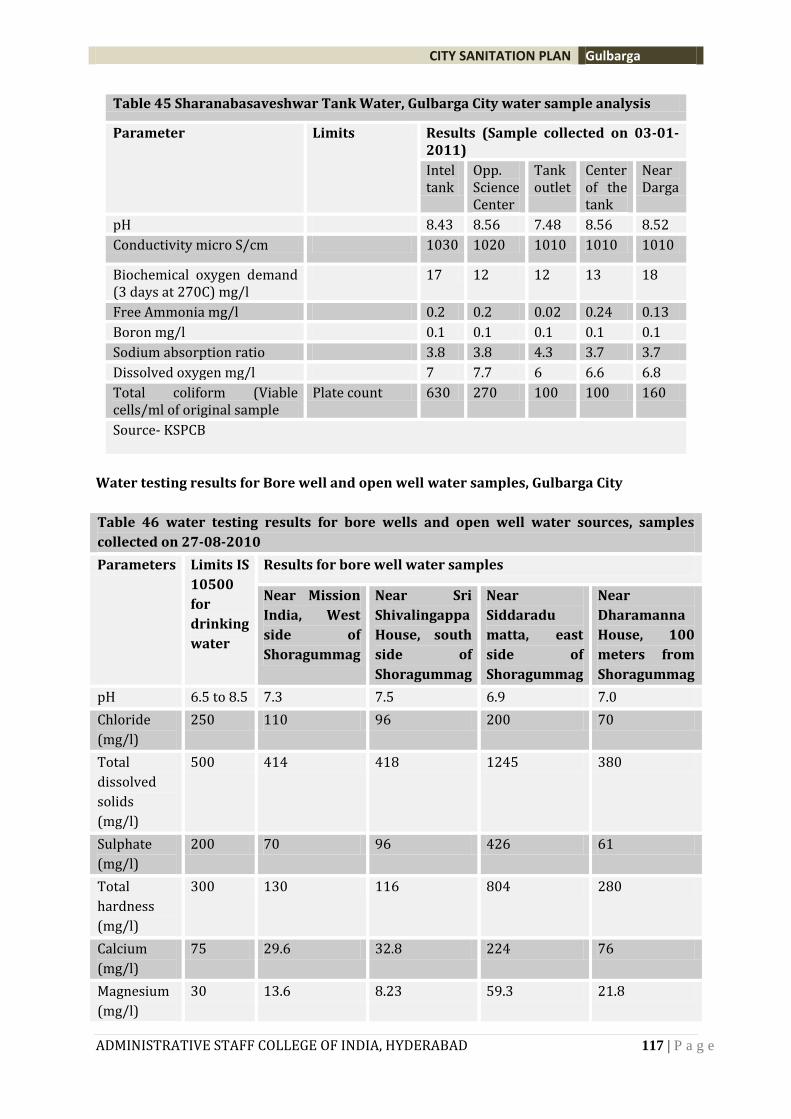
CITY SANITATION PLAN Gulbarga
ADMINISTRATIVE STAFF COLLEGE OF INDIA, HYDERABAD 117 | P a g e
Table 45 Sharanabasaveshwar Tank Water, Gulbarga City water sample analysis
Parameter Limits Results (Sample collected on 03-01-2011)
Intel tank
Opp. Science Center
Tank outlet
Center of the tank
Near Darga
pH 8.43 8.56 7.48 8.56 8.52
Conductivity micro S/cm 1030 1020 1010 1010 1010
Biochemical oxygen demand (3 days at 270C) mg/l
17 12 12 13 18
Free Ammonia mg/l 0.2 0.2 0.02 0.24 0.13
Boron mg/l 0.1 0.1 0.1 0.1 0.1
Sodium absorption ratio 3.8 3.8 4.3 3.7 3.7
Dissolved oxygen mg/l 7 7.7 6 6.6 6.8
Total coliform (Viable cells/ml of original sample
Plate count 630 270 100 100 160
Source- KSPCB
Water testing results for Bore well and open well water samples, Gulbarga City
Table 46 water testing results for bore wells and open well water sources, samples
collected on 27-08-2010
Parameters Limits IS
10500
for
drinking
water
Results for bore well water samples
Near Mission
India, West
side of
Shoragummag
Near Sri
Shivalingappa
House, south
side of
Shoragummag
Near
Siddaradu
matta, east
side of
Shoragummag
Near
Dharamanna
House, 100
meters from
Shoragummag
pH 6.5 to 8.5 7.3 7.5 6.9 7.0
Chloride
(mg/l)
250 110 96 200 70
Total
dissolved
solids
(mg/l)
500 414 418 1245 380
Sulphate
(mg/l)
200 70 96 426 61
Total
hardness
(mg/l)
300 130 116 804 280
Calcium
(mg/l)
75 29.6 32.8 224 76
Magnesium
(mg/l)
30 13.6 8.23 59.3 21.8
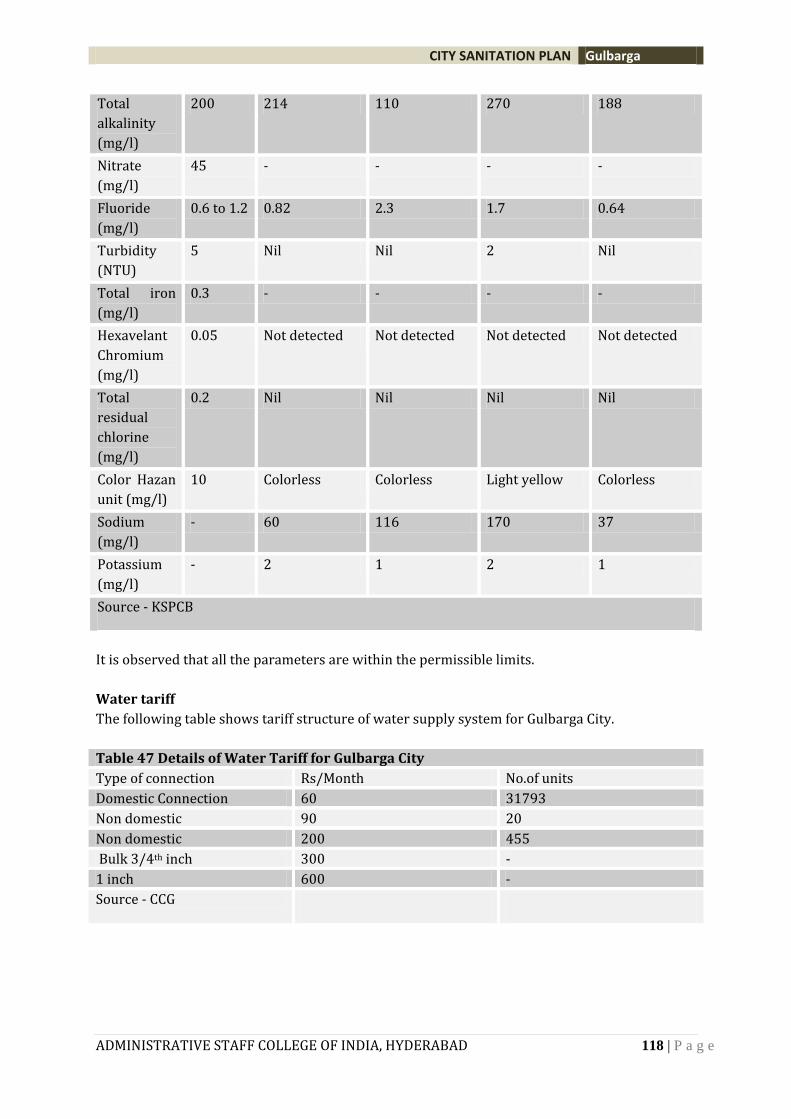
CITY SANITATION PLAN Gulbarga
ADMINISTRATIVE STAFF COLLEGE OF INDIA, HYDERABAD 118 | P a g e
Total
alkalinity
(mg/l)
200 214 110 270 188
Nitrate
(mg/l)
45 - - - -
Fluoride
(mg/l)
0.6 to 1.2 0.82 2.3 1.7 0.64
Turbidity
(NTU)
5 Nil Nil 2 Nil
Total iron
(mg/l)
0.3 - - - -
Hexavelant
Chromium
(mg/l)
0.05 Not detected Not detected Not detected Not detected
Total
residual
chlorine
(mg/l)
0.2 Nil Nil Nil Nil
Color Hazan
unit (mg/l)
10 Colorless Colorless Light yellow Colorless
Sodium
(mg/l)
- 60 116 170 37
Potassium
(mg/l)
- 2 1 2 1
Source - KSPCB
It is observed that all the parameters are within the permissible limits.
Water tariff
The following table shows tariff structure of water supply system for Gulbarga City.
Table 47 Details of Water Tariff for Gulbarga City
Type of connection Rs/Month No.of units
Domestic Connection 60 31793
Non domestic 90 20
Non domestic 200 455
Bulk 3/4th inch 300 -
1 inch 600 -
Source - CCG
CITY SANITATION PLAN Gulbarga
ADMINISTRATIVE STAFF COLLEGE OF INDIA, HYDERABAD 119 | P a g e
4.4.4 STANDARDIZED SERVICE LEVEL INDICATORS
Table 48 Service Level Indicators for Water Supply
S.No Indicator Unit Bench
Mark
Value
1 Coverage of water supply
connections
% 100 80
2 Per capita available of water at
consumer end
LPCD 135 100
3 Extent of metering of water
connections
% 100 10
4 Extent of Non Revenue Water % 15 35
5 Continuity of water supply Hours/Day 24X7 0
6 Efficiency in redressal of
customer complaints
% 80 50
7 Quality of water supplied % 100 95
8 Cost recovery in water supply
services
% 100 30
9 Efficiency in collection of water
supply related charges
% 90 50
4.4.5 FUTURE DEMAND AND GAP
The following table shows the projections for water demand considering the average per capita as being 135 LPCD
Table 49 Projection of water supply requirement
YEAR Avg per capita (lpcd)
Population (Average of Three Methods)
Water Supply requirements (MLD)
2010 135 563,065 76.01
2015 135 655,880 88.54
2020 135 766,283 103.45
2025 135 898,441 121.29
2030 135 1,057,631 142.78
2035 135 1,250,540 168.82
2040 135 1,485,639 200.56
2045 135 1,773,655 239.44
Source - ASCI
CITY SANITATION PLAN Gulbarga
ADMINISTRATIVE STAFF COLLEGE OF INDIA, HYDERABAD 120 | P a g e
Pilot project of 24x 7 water supply
Presently in Gulbarga City Corporation the demonstration for 24x7 water supply has been
introduced in 11 wards. At present the 24X7 water supply has been discontinued as it was not
progressing efficiently.
The details of the following are.
Table 50 Salient Features Of Gulbarga Demonstration Zone 24X7 Water Supply
Total number of covered under demo : 11 Wards (7 part and 4 full)
zone
List of part wards covered under demo : 6, 19, 24, 33, 42, 43 and 49
zone
List of full wards covered under demo : 17, 23, 32 and 44
zone
Areas covered under demo zone : Shah Bazar, Wadargalli, Kadgharpur,
Lalgiri, Sharan Nagar, Vittal Nagar,
Garden area, Gazipur, Super Market,
Kirana Bazar, Lohar galli and
Bamboo bazar.
Source of water supply demo zone : Bennethora River
Bulk water provision for demo zone. : GLSR at Old Filter bed area.
Population of demo zone (2006) : : 64,242
Water demand (2006) 6.87 MLD (1.5 MGD)
Population of demo zone (2008) : 66,831
Water demand (2008) : 7.15 MLD (1.6 MGD)
Population of demo zone (2020) : 84,758
Water demand (2020) : 10.52 MLD (2.3 MGD)
Population of demo zone (2035) : 114,073
Water demand (2035) : 14.91 MLD (3.3 MGD)
Total number of properties in demo : 3,810
zone
CITY SANITATION PLAN Gulbarga
ADMINISTRATIVE STAFF COLLEGE OF INDIA, HYDERABAD 121 | P a g e
Chapter 5
Institutional capacity and finance
Gulbarga City Corporation was established in the year 1981. The CCG has the responsibility of
making provision for basic civic amenities and maintenance of core services in the city viz.,
maintenance of streetlights; provision (maintenance) of drainage and sewer facilities, solid
waste management, maintenance of parks, gardens and play grounds; sanitation and
maintenance of city roads. In addition, it also provides for primary education and medical needs,
markets, cremation and burial grounds, slaughter houses, and regulating advertisements. The
CCG receives however the bulk of its revenue in the form of intergovernmental transfers
through grants.
The financial analysis of CCG has been done on the basis of income and expenditure data
provided by the CCG. The financial analysis of CCG has been done on the basis of income and
expenditure data provided by the CCG, through budget documents from 2007 to 2012 data. On
the income side, under the revenue account, the resources are generated through levying of
various taxes/duties and rental income from municipal properties. The capital and suspense
accounts deal with the transfers (grants and contribution) from government. The expenditure of
CCG is also divided into three major similar headings viz., revenue expenditure, capital
expenditure and suspense account.
Table 51 BUDGET SUMMARY STATEMENT FOR THE YEAR 2007-2008
NAME :CITY CORPORATION, GULBARGA
Rs.In Lakhs
SL No
PARTICULARS Actuals for the previous year 2005-06 (Rs.)
Budget Estimate for the current year 2006-07 (Rs.)
Actuals upto December of the current year 2006-07 (Rs.)
Revised Budget Estimate for the current year 2006-07 (Rs.)
Budget Estimate for 2007-08
1 2 4 5 6 7 8
A OPENING CASH & BANK BALANCE
Cash & Bank balances (Major code 47)
192.41 763.45 763.45 763.45 1046.61
B Revenue account
B1 Revenue Receipts 1440.16 3599.88 2086.98 2861.80 4437.26
B2 Revenue Payments 1246.07 2396.97 1807.82 2771.54 3491.63
Cash Surplus/ (deficit) on Revenue Account
194.09 1202.91 279.16 90.26 945.63
C Capital account
CITY SANITATION PLAN Gulbarga
ADMINISTRATIVE STAFF COLLEGE OF INDIA, HYDERABAD 122 | P a g e
C1 Capital Reveipts 1244.38 1516.36 519.32 761.33 1481.00
C2 Capital Payments 645.37 1684.84 469.49 560.94 2558.14
Cash Surplus/ (deficit) on Capital Account
599.01 -168.48 49.83 200.39 -1077.14
D Extraordinary Account
D1 Extraordinary Receipts
424.18 735.31 375.37 451.95 712.34
D2 Extraordinary Payments
646.24 709.85 389.86 459.44 976.67
Cash Surplus /(deficit) on Extraordinary Account
-222.06 25.46 -14.49 -7.49 -264.33
E TOTAL CASH SURPLUS/( DEFICIT) (B+C+D)
571.04 1059.89 314.50 283.16 -395.84
F CLOSING BALANCE (A+E)
763.45 1823.34 1077.95 1046.61 650.77
Cash & Bank balances (Major code 47)
763.45 1823.34 1077.95 1046.61 650.77
Source - CCG
Table 52 BUDGET SUMMARY STATEMENT FOR THE YEAR 2008-2009
NAME :CITY CORPORATION, GULBARGA
Rs.In Lakhs
SL No
PARTICULARS Actuals for the previous year 2006-07 (Rs.)
Budget Estimate for the current year 2007-08 (Rs.)
Actuals upto December of the current year 2007-08 (Rs.)
Revised Budget Estimate for the current year 2007-08 (Rs.)
Budget Estimate for 2008-09
1 2 3 4 5 6 7
A OPENING CASH & BANK BALANCE
763.45 1330.69 1330.69 1330.69 1602.89
Cash & Bank balances (Major code 47)
B Revenue account
B1 Revenue Receipts
2153.59 4437.27 4212.85 4797.26 6075.07
CITY SANITATION PLAN Gulbarga
ADMINISTRATIVE STAFF COLLEGE OF INDIA, HYDERABAD 123 | P a g e
B2 Revenue Payments
1676.52 3491.64 2586.59 3951.64 1234.240714
Cash Surplus/ (deficit) on Revenue Account
477.07 945.63 1626.26 845.62 4840.829286
C Capital account
C1 Capital Reveipts 596.4 1481 346.2 425.6 1388
C2 Capital Payments
496.05 2558.14 612.14 866.55 2945.09
Cash Surplus/ (deficit) on Capital Account
100.35 -1077.14 -265.94 -440.95 -1557.09
D Extraordinary Account
D1 Extraordinary Receipts
444.27 712.34 385.68 523.44 757.49
D2 Extraordinary Payments
454.45 976.67 392.97 655.91 826.14
Cash Surplus /(deficit) on Extraordinary Account
-10.18 -264.33 -7.29 -132.47 -68.65
E TOTAL CASH SURPLUS/( DEFICIT) (B+C+D)
567.24 -395.84 1353.03 272.2 3215.089286
F CLOSING BALANCE (A+E)
1330.69 934.85 2683.72 1602.89 4817.979286
Cash & Bank balances (Major code 47)
Source - CCG
CITY SANITATION PLAN Gulbarga
ADMINISTRATIVE STAFF COLLEGE OF INDIA, HYDERABAD 124 | P a g e
Table 53 BUDGET SUMMARY STATEMENT FOR THE YEAR 2009-2010
NAME :CITY CORPORATION, GULBARGA
Rs.In Lakhs
SL No
PARTICULARS Actuals for the previous year 2007-08 (Rs.)
Budget Estimate for the current year 2008-09 (Rs.)
Actuals upto December of the current year 2008-09 (Rs.)
Revised Budget Estimate for the current year 2008-09 (Rs.)
Budget Estimate for 2009-10
1 2 3 4 5 6 7
A OPENING CASH & BANK BALANCE
1098.45 1602.89 2088.87 3637.88
Cash & Bank balances (Major code 47)
B Revenue account
B1 Revenue Receipts 4672.39 6075.07 4980.75 11036.80
B2 Revenue Payments 3253.38 5682.74 2445.42 6546.35
Cash Surplus/ (deficit) on Revenue Account 1419.01 392.33 2535.33 4490.45
C Capital account
C1 Capital Reveipts 295.5 1265 395.64 560.00
C2 Capital Payments 1067.44 2945.09 1531.37 7799.79
Cash Surplus/ (deficit) on Capital Account -771.94 -1680.09 -1135.73 -7239.79
D Extraordinary Account 0
D1 Extraordinary Receipts 1207.869 880.49 2952.85 3642.68
D2 Extraordinary Payments 864.51 826.14 2803.44 4096.79
Cash Surplus /(deficit) on Extraordinary Account 343.359 54.35 149.41 -454.11
E TOTAL CASH SURPLUS/( DEFICIT) (B+C+D) 990.429 -1233.41 1549.01 -3203.45
F CLOSING BALANCE (A+E) 2088.879 369.48 3637.88 434.44
Cash & Bank balances (Major code 47)
Source - CCG
CITY SANITATION PLAN Gulbarga
ADMINISTRATIVE STAFF COLLEGE OF INDIA, HYDERABAD 125 | P a g e
Table 54 BUDGET SUMMARY STATEMENT FOR THE YEAR 2010-2011
NAME :CITY CORPORATION, GULBARGA
Rs.In Lakhs
SL No
PARTICULARS Actuals for the previous year 2008-09 (Rs.)
Budget Estimate for the current year 2009-10 (Rs.)
Actuals upto December of the current year 2009-10 (Rs.)
Revised Budget Estimate for the current year 2009-10 (Rs.)
Budget Estimate for 2010-11
1 2 3 4 5 6 7
A OPENING CASH & BANK BALANCE 2088.87 3637.88 3637.88 3637.88 4315.77
Cash & Bank balances (Major code 47)
B Revenue account
B1 Revenue Receipts 4980.75 11036.8 3778.98 4999.21 9848.56
B2 Revenue Payments 2445.42 6546.3 3254.61 4303.88 7013.41
Cash Surplus/ (deficit) on Revenue Account
2535.33 4490.5 524.37 695.33 2835.15
C Capital account
C1 Capital Reveipts 395.64 560.00 416.24 554.99 1210.00
C2 Capital Payments 1531.37 7799.79 1230.29 1640.39 7821.00
Cash Surplus/ (deficit) on Capital Account
-1135.73 -7239.79 -814.05 -1085.40 -6611.00
D Extraordinary Account
D1 Extraordinary Receipts
2952.85 3642.68 1708.93 2630.24 3182.63
D2 Extraordinary Payments
2803.44 4096.79 1171.36 1561.81 3437.04
Cash Surplus /(deficit) on Extraordinary Account
149.41 -454.11 537.57 1068.43 -254.41
E TOTAL CASH SURPLUS/( DEFICIT) (B+C+D)
1549.01 -3203.45 247.89 678.36 -4030.26
CITY SANITATION PLAN Gulbarga
ADMINISTRATIVE STAFF COLLEGE OF INDIA, HYDERABAD 126 | P a g e
F CLOSING BALANCE (A+E)
3637.88 434.44 3885.77 4316.24 285.51
Cash & Bank balances (Major code 47)
Source - CCG
The following graph shows the revenue receipts and Revenue Payments of CCG. It is observed
that the revenue receipts have shown a decline in the year 2010-11 whereas the revenue
payments remain constant for the years 2009-11.
The following graph shows the Capital receipts and Capital Payments of CCG. It is observed that
the capital payments are really high for the past four years.
Figure 14 Budget Estimate of Capital receipts & Payments
0.00
2000.00
4000.00
6000.00
8000.00
10000.00
2007-08 2008-09 2009-10 2010-11
Budget estimate for Capital receipts & Capital payments
Capital Receipts
Capital Payments
0.00
2000.00
4000.00
6000.00
8000.00
10000.00
12000.00
Budget Estimate of Revenue receipts & Revenue payments
Revenue Receipts
Revenue Payments
Figure 13 Budget Estimate of Revenue receipts & Payments
CITY SANITATION PLAN Gulbarga
ADMINISTRATIVE STAFF COLLEGE OF INDIA, HYDERABAD 127 | P a g e
Chapter 6
Sanitation Situation w.r.t. National Ranking Parameters
6.1 SANITATION SITUATION W.R.T. NATIONAL SANITATION RANKING PARAMETERS
The Ministry of Urban Development has identified a set of output, process and outcome
indicators to assess the existing sanitation conditions in the town. The list of indicators pertain
to the practice of open defecation, access to sanitation (individual, community and public),
collection, treatment and disposal of solid and liquid wastes, proper upkeep and maintenance of
the sanitation infrastructure, clear institutional roles and responsibilities and improvements in
health and environment (cf. Annex 1). A total of 19 indicators have been detailed, of which nine
are output-related ( six are direct indicators identified under service level bench marking by
GoUD, GOI) , seven are process-related and three are outcome-related. Sanitation parameters
such as access to community toilets, safe management of human excreta and solid waste
collection and treatment.
Output Indicators: 50/100 ( 9 main output indicators and out of which 6 are SLB indicators)
Behavioural aspects and provision to safe collection, treatment and disposal without harming
city’s environment.
Process Related: 30/100 ( 7 main process-indicators )
Indicators pertain to systems and procedures - exist and practiced by city agencies to ensure
sustained sanitation.
Outcome Related: 20/100 (3 main outcome-indicators)
Indicators include: quality of drinking water & water in water-bodies, reduction in sanitation-
related and water-borne diseases over a time period.
Diseases by faeco-orally transmitted enteric pathogens - 10% of total burden of disease in India.
Intestinal group of diseases claim about 5 million lives and about 50 million people suffer every
year.
Findings of a survey commissioned by the Ministry of Urban Development (MoUD) that rate
Indian cities on safe sanitation practices of 423 Class-I cities (with a population of more than
100,000 ). Four color codes have been assigned to the cities based on the points they obtained
in the rating; red means the cities need 'immediate remedial action', black means 'need
considerable improvement', blue means ‘recovering,’ green means ‘healthy and clean.’
community-driven Nirmal Shahars, or totally sanitized, healthy, and livable cities and towns.
As per national Rankings, Gulbarga has been ranked at 8 out of 423 Class I cities, scoring 27.15
marks out of 100 and in Black category. This means performance of Gulbarga in regard to safe
sanitation has a good scope for improvement on various indicators. A complete profiling of
Gulbarga against 19 parameters has been done indicating present status and identifying few
targets which can be achieved immediately, in a short term and in long term. The goal of
CITY SANITATION PLAN Gulbarga
ADMINISTRATIVE STAFF COLLEGE OF INDIA, HYDERABAD 128 | P a g e
Gulbarga is to strive for 100 percent access to sanitation facilities in next two years and 100
percent safe disposal of all town generated waste in long term.
Table 55: Sanitation Ranking for Gulbarga City Corporation
Sl. No. Indicators Total Marks
Marks awarded
Remarks
1. OUTPUT RELATED INDICATORS
1.a. No Open Defecation
1.a.i.
Access and use of toilets by urban poor and other u-served households by individual and community sanitation facilities
4 0
Field assessment also validated on OD status and agrees with Ranking markings. Short Term Goal - two year (Ref management options on Access.) 1 st year – eliminate OD
1.a.ii. Access and use of toilets by floating and institutional population
4 2 Inadequate only 10 Public toilet as the dependency is high Ref: management options
1.a.iii. No open defecation visible
4 1.17 Short to long term MIS, punitive measures and incentives through IEC.
1.a.iv. Manual Scavenging eliminated in the city
4 4
Overestimated - No protection to sanitary workers. Sustaining efforts throughout CSP process and even after that
1.b.
Proportion of total human excreta generation that is safely collected
6 4.5 Short to Medium – UGD is under construction. Proposal for DEWATS systems in parts of the city.
1.c.
Proportion of total black waste water generation that is treated safely and disposed off
6 0
Damages in UGD system – black water mixes with storm water and drains off into the river. STP not functioning.
1.d.
Proportion of total grey wastewater generation that treated and safely disposed of
3 0
Medium – to long term Nil now 30-40% - 2012 40-100% 2010 onwards Next year – 1 mark
1.e. Proportion of treated wastewater that is re-cycled and re-used
3 0
Medium – to long term Nil now. 1- 10% 2012 10- 20% 2012 -2014 20% and more 2014 onwards.
1.f.
Proportion of total storm-water and drainage that is efficiently and safely managed
3 0
Short – to long 40 – 60% : 2012 60- 80 2012 : 2014 100% 2014 onwards
1.g. Proportion of total solid waste generation that is regularly collected
4 1.25 Short to medium 25%-60% D2D collection improvement by 2012
CITY SANITATION PLAN Gulbarga
ADMINISTRATIVE STAFF COLLEGE OF INDIA, HYDERABAD 129 | P a g e
60 – 100% 2012 onwards Sustenance of system – 2012 onwards
1.h.
Proportion of total solid waste generation that is treated and safely disposed of
4 0 Long Term
1.i.
City wastes cause no adverse impacts on surrounding areas outside city limits
5 0
Long Term Storm water drains clogged with dumped solid waste – in monsoons all the waste gets washed into the river and seas.
OUTPUT RELATED INDICATORS TOTAL
50 12.92
2. PROCESS RELATED INDICATORS
2.a.
Monitoring and Evaluation (M&E) Systems in place to track incidences of Open Defecation (OD)
4 1 Short Term Adhering all
2.b. All sewerage systems working properly and no ex-filtration
5 3.5 Medium to long term
2.c.
All septage / sludge cleaned and safely transported and disposed after treatment, from on-site systems
5 5
2.d. Storm-water drainage systems functioning and maintained
4 2 Frame work plan for maintenance
2.e.
Solid waste management (collection and treatment) efficient (MSW Rules, 2000)
5 1.41 Medium to long term
2.f.
Documented Operational system and clear institutional responsibility assigned for each of the above
4 4 Overestimated.
2.g.
Sanctions for deviance on part of polluters and institutions clearly laid out and followed
3 1 Short Term Frame rules
PROCESS RELATED INDICATORS TOTAL
30 17.91
CITY SANITATION PLAN Gulbarga
ADMINISTRATIVE STAFF COLLEGE OF INDIA, HYDERABAD 130 | P a g e
3. OUTCOME RELATED INDICATORS
3.a. Quality of drinking water in city
7 5.95 Long Term Proposals/strategies for sustenance
3.b. Water quality in water bodies in and around city–
7 0
Overestimated. Several water bodies affected with illicit solid waste dumping. Short – medium term strategies to be adopted
3.c.
Reduction in (sanitation-attributable and) water-borne disease incidence amongst city population
6 0
OUTCOME RELATED INDICATORS TOTAL
20 5.95
GRAND TOTAL 100 36.78
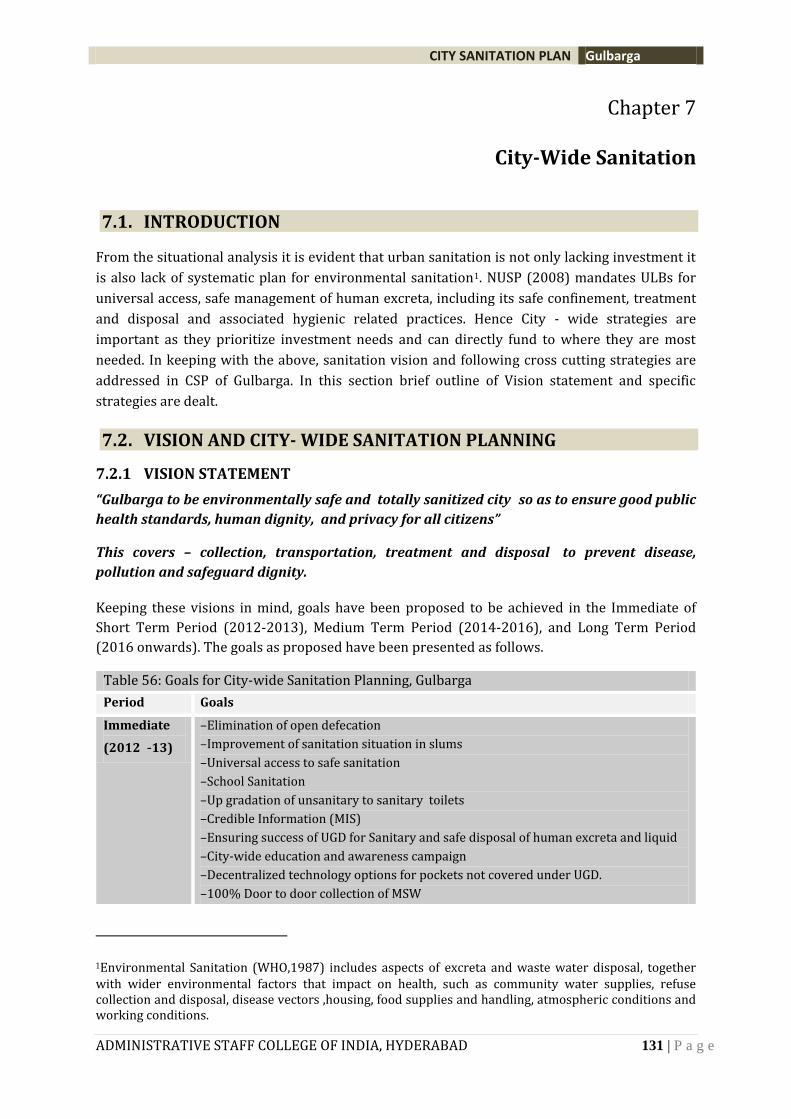
CITY SANITATION PLAN Gulbarga
ADMINISTRATIVE STAFF COLLEGE OF INDIA, HYDERABAD 131 | P a g e
Chapter 7
City-Wide Sanitation
7.1. INTRODUCTION
From the situational analysis it is evident that urban sanitation is not only lacking investment it
is also lack of systematic plan for environmental sanitation1. NUSP (2008) mandates ULBs for
universal access, safe management of human excreta, including its safe confinement, treatment
and disposal and associated hygienic related practices. Hence City - wide strategies are
important as they prioritize investment needs and can directly fund to where they are most
needed. In keeping with the above, sanitation vision and following cross cutting strategies are
addressed in CSP of Gulbarga. In this section brief outline of Vision statement and specific
strategies are dealt.
7.2. VISION AND CITY- WIDE SANITATION PLANNING
7.2.1 VISION STATEMENT
“Gulbarga to be environmentally safe and totally sanitized city so as to ensure good public
health standards, human dignity, and privacy for all citizens”
This covers – collection, transportation, treatment and disposal to prevent disease,
pollution and safeguard dignity.
Keeping these visions in mind, goals have been proposed to be achieved in the Immediate of
Short Term Period (2012-2013), Medium Term Period (2014-2016), and Long Term Period
(2016 onwards). The goals as proposed have been presented as follows.
Table 56: Goals for City-wide Sanitation Planning, Gulbarga
Period Goals
Immediate
(2012 -13)
–Elimination of open defecation
–Improvement of sanitation situation in slums
–Universal access to safe sanitation
–School Sanitation
–Up gradation of unsanitary to sanitary toilets
–Credible Information (MIS)
–Ensuring success of UGD for Sanitary and safe disposal of human excreta and liquid
–City-wide education and awareness campaign
–Decentralized technology options for pockets not covered under UGD.
–100% Door to door collection of MSW
1Environmental Sanitation (WHO,1987) includes aspects of excreta and waste water disposal, together with wider environmental factors that impact on health, such as community water supplies, refuse collection and disposal, disease vectors ,housing, food supplies and handling, atmospheric conditions and working conditions.
CITY SANITATION PLAN Gulbarga
ADMINISTRATIVE STAFF COLLEGE OF INDIA, HYDERABAD 132 | P a g e
–Source segregation of waste
–Framing of laws for deviance on the part of polluters and institutions
–System for maintenance of water bodies
–Reduction in no. of cases of water borne diseases, especially malaria
Medium
term
(2014-2016)
– Sanitary and safe disposal of human excreta and liquid waste (continuing process)
– Regulation of septic tanks and septage management
– Litter free areas
– Sustenance of SWM system
–Systems in place for good O & M (individual, community level toilets and disposal
systems) through behavior change and good management practices.
– Institutional arrangements and Capacity building
–Safe transportation and disposal of MSW
Long term
(2016
onwards )
– Water recycle and reuse
–Controlling adverse effects of city wastes on surrounding areas
– Monitoring and evaluation
– Environmental and financial sustainability.
7.2.2 PRINCIPLES OF CSP
CSP not only emphasis on the physical infrastructure but also focus on behavior change
outcomes, proper usage, institutional reorientation, regular upkeep and maintenance, increased accountability and service delivery by ULBs and their partners. Accordingly the
strategies have been developed on the basis of following principles:
1. Right to sanitation and mobilization of community for demand creation: Access to
sanitation facilities shall be universalized (100%) without any barrier of cost/ fee, land
tenure etc., but also bearing the associated responsibility as well. Household sanitation is
first and foremost the responsibility of a household. Hence, sanitation will be promoted
based on demand i.e. communities and households will be encouraged to priorities by
contributing to a significant portion of the costs involved in providing and running a
sanitation system. Improve sanitation by institutionalizing rewards for good performance
and sanctions against harmful actions and IEC programs to improve sanitation. ULB / Utility
may provide free consultations, designs and drawings and quality control for onsite
sanitation.
2. Focus on sound finances and maintenance: Sanitation system should be sustainable. The
users should pay against use to maintain sustainability. Similarly, polluters should pay for
the cost of cleaning up the impact of their pollution on the environment. Choice and
maintenance of facilities have to be well thought of in advance to make service affordable
and sustainable. Need to ensure last mile connectivity to water supply system and sewerage
system in network coverage area. Door to collection should be 100%.
3. Integrated institutional engagement: Sanitation cannot be maintained without proper
water supply, solid waste management and development is not possible in isolation.
Coordination is necessary between different departments, all tiers of Government and other
stakeholders with clear roles and responsibilities. Need to ensure last mile connectivity to
water supply system and sewerage system in network coverage area. Door to collection
should be 100%.
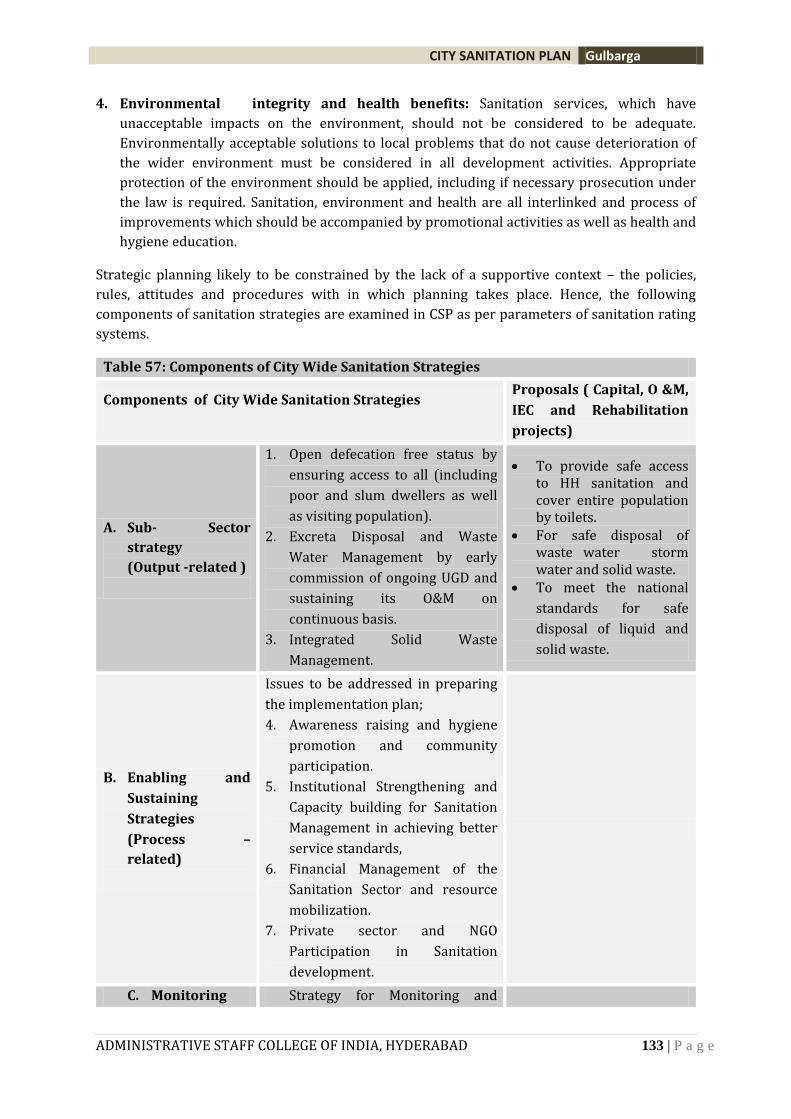
CITY SANITATION PLAN Gulbarga
ADMINISTRATIVE STAFF COLLEGE OF INDIA, HYDERABAD 133 | P a g e
4. Environmental integrity and health benefits: Sanitation services, which have
unacceptable impacts on the environment, should not be considered to be adequate.
Environmentally acceptable solutions to local problems that do not cause deterioration of
the wider environment must be considered in all development activities. Appropriate
protection of the environment should be applied, including if necessary prosecution under
the law is required. Sanitation, environment and health are all interlinked and process of
improvements which should be accompanied by promotional activities as well as health and
hygiene education.
Strategic planning likely to be constrained by the lack of a supportive context – the policies,
rules, attitudes and procedures with in which planning takes place. Hence, the following
components of sanitation strategies are examined in CSP as per parameters of sanitation rating
systems.
Table 57: Components of City Wide Sanitation Strategies
Components of City Wide Sanitation Strategies
Proposals ( Capital, O &M,
IEC and Rehabilitation
projects)
A. Sub- Sector
strategy
(Output -related )
1. Open defecation free status by
ensuring access to all (including
poor and slum dwellers as well
as visiting population).
2. Excreta Disposal and Waste
Water Management by early
commission of ongoing UGD and
sustaining its O&M on
continuous basis.
3. Integrated Solid Waste
Management.
To provide safe access to HH sanitation and cover entire population by toilets.
For safe disposal of waste water storm water and solid waste.
To meet the national
standards for safe
disposal of liquid and
solid waste.
B. Enabling and
Sustaining
Strategies
(Process –
related)
Issues to be addressed in preparing
the implementation plan;
4. Awareness raising and hygiene
promotion and community
participation.
5. Institutional Strengthening and
Capacity building for Sanitation
Management in achieving better
service standards,
6. Financial Management of the
Sanitation Sector and resource
mobilization.
7. Private sector and NGO
Participation in Sanitation
development.
C. Monitoring Strategy for Monitoring and
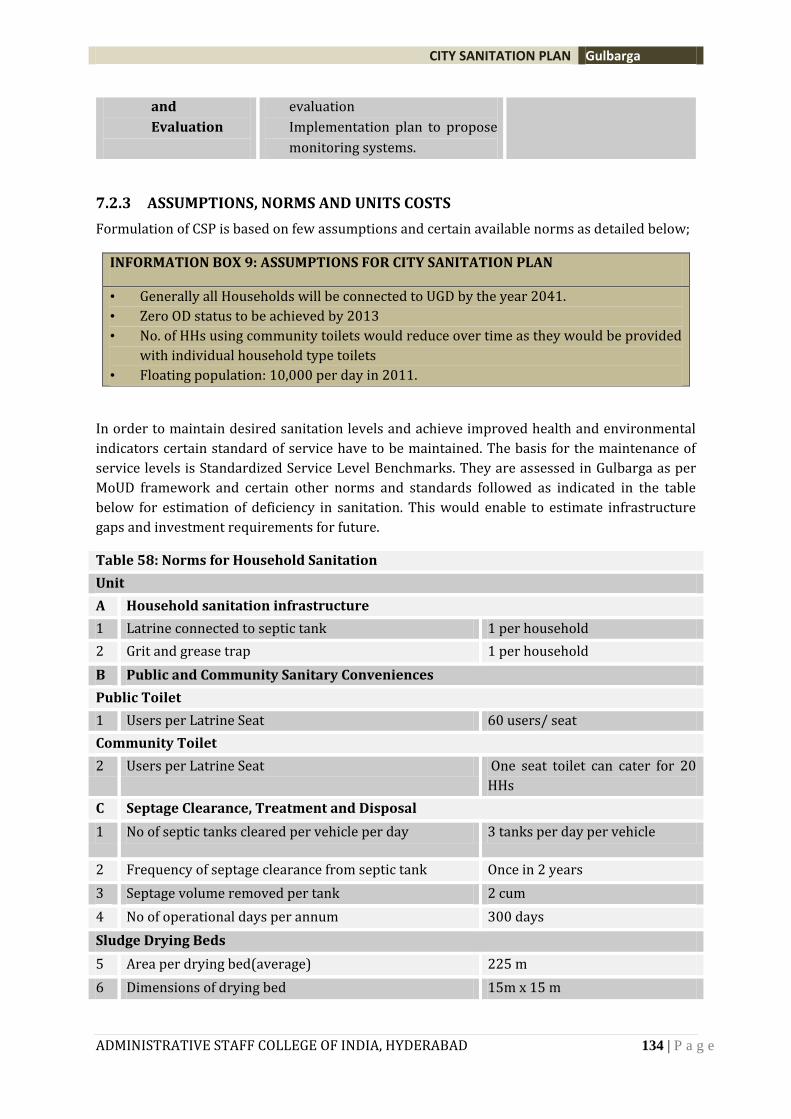
CITY SANITATION PLAN Gulbarga
ADMINISTRATIVE STAFF COLLEGE OF INDIA, HYDERABAD 134 | P a g e
and
Evaluation
evaluation
Implementation plan to propose
monitoring systems.
7.2.3 ASSUMPTIONS, NORMS AND UNITS COSTS
Formulation of CSP is based on few assumptions and certain available norms as detailed below;
INFORMATION BOX 9: ASSUMPTIONS FOR CITY SANITATION PLAN
• Generally all Households will be connected to UGD by the year 2041.
• Zero OD status to be achieved by 2013
• No. of HHs using community toilets would reduce over time as they would be provided
with individual household type toilets
• Floating population: 10,000 per day in 2011.
In order to maintain desired sanitation levels and achieve improved health and environmental
indicators certain standard of service have to be maintained. The basis for the maintenance of
service levels is Standardized Service Level Benchmarks. They are assessed in Gulbarga as per
MoUD framework and certain other norms and standards followed as indicated in the table
below for estimation of deficiency in sanitation. This would enable to estimate infrastructure
gaps and investment requirements for future.
Table 58: Norms for Household Sanitation
Unit
A Household sanitation infrastructure
1 Latrine connected to septic tank 1 per household
2 Grit and grease trap 1 per household
B Public and Community Sanitary Conveniences
Public Toilet
1 Users per Latrine Seat 60 users/ seat
Community Toilet
2 Users per Latrine Seat One seat toilet can cater for 20
HHs
C Septage Clearance, Treatment and Disposal
1 No of septic tanks cleared per vehicle per day 3 tanks per day per vehicle
2 Frequency of septage clearance from septic tank Once in 2 years
3 Septage volume removed per tank 2 cum
4 No of operational days per annum 300 days
Sludge Drying Beds
5 Area per drying bed(average) 225 m
6 Dimensions of drying bed 15m x 15 m
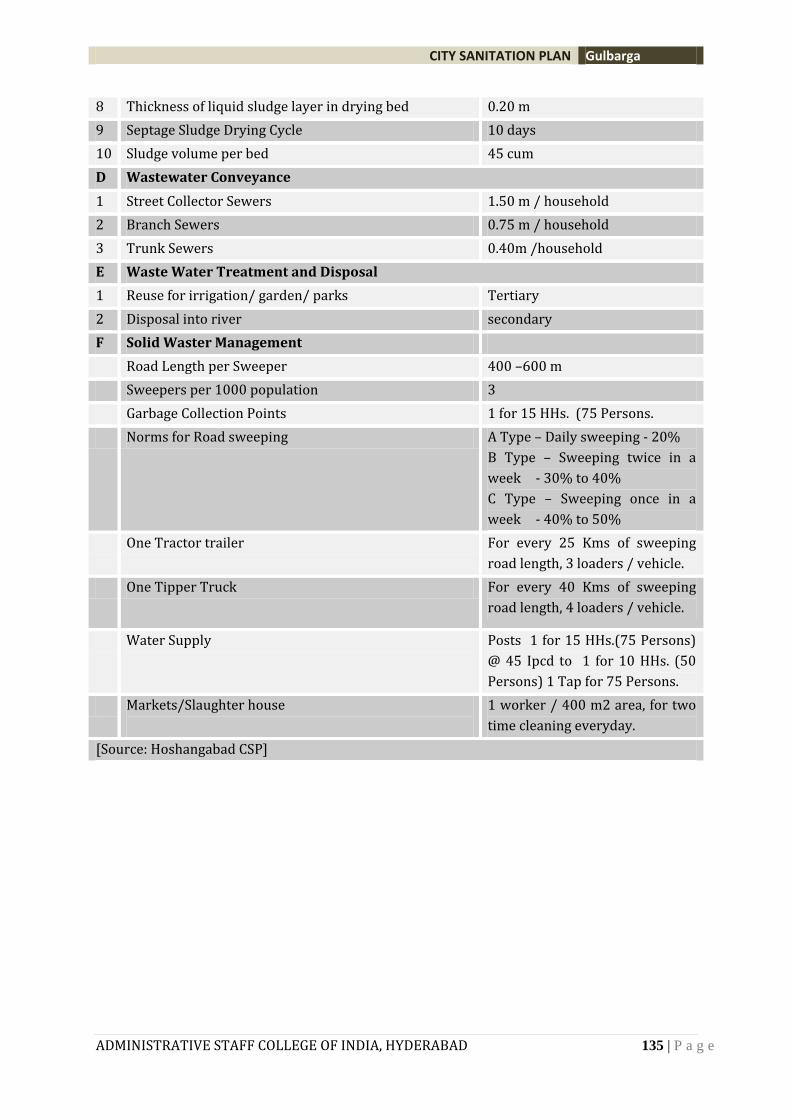
CITY SANITATION PLAN Gulbarga
ADMINISTRATIVE STAFF COLLEGE OF INDIA, HYDERABAD 135 | P a g e
8 Thickness of liquid sludge layer in drying bed 0.20 m
9 Septage Sludge Drying Cycle 10 days
10 Sludge volume per bed 45 cum
D Wastewater Conveyance
1 Street Collector Sewers 1.50 m / household
2 Branch Sewers 0.75 m / household
3 Trunk Sewers 0.40m /household
E Waste Water Treatment and Disposal
1 Reuse for irrigation/ garden/ parks Tertiary
2 Disposal into river secondary
F Solid Waster Management
Road Length per Sweeper 400 –600 m
Sweepers per 1000 population 3
Garbage Collection Points 1 for 15 HHs. (75 Persons.
Norms for Road sweeping A Type – Daily sweeping - 20%
B Type – Sweeping twice in a
week - 30% to 40%
C Type – Sweeping once in a
week - 40% to 50%
One Tractor trailer For every 25 Kms of sweeping
road length, 3 loaders / vehicle.
One Tipper Truck For every 40 Kms of sweeping
road length, 4 loaders / vehicle.
Water Supply Posts 1 for 15 HHs.(75 Persons)
@ 45 Ipcd to 1 for 10 HHs. (50
Persons) 1 Tap for 75 Persons.
Markets/Slaughter house
1 worker / 400 m2 area, for two
time cleaning everyday.
[Source: Hoshangabad CSP]
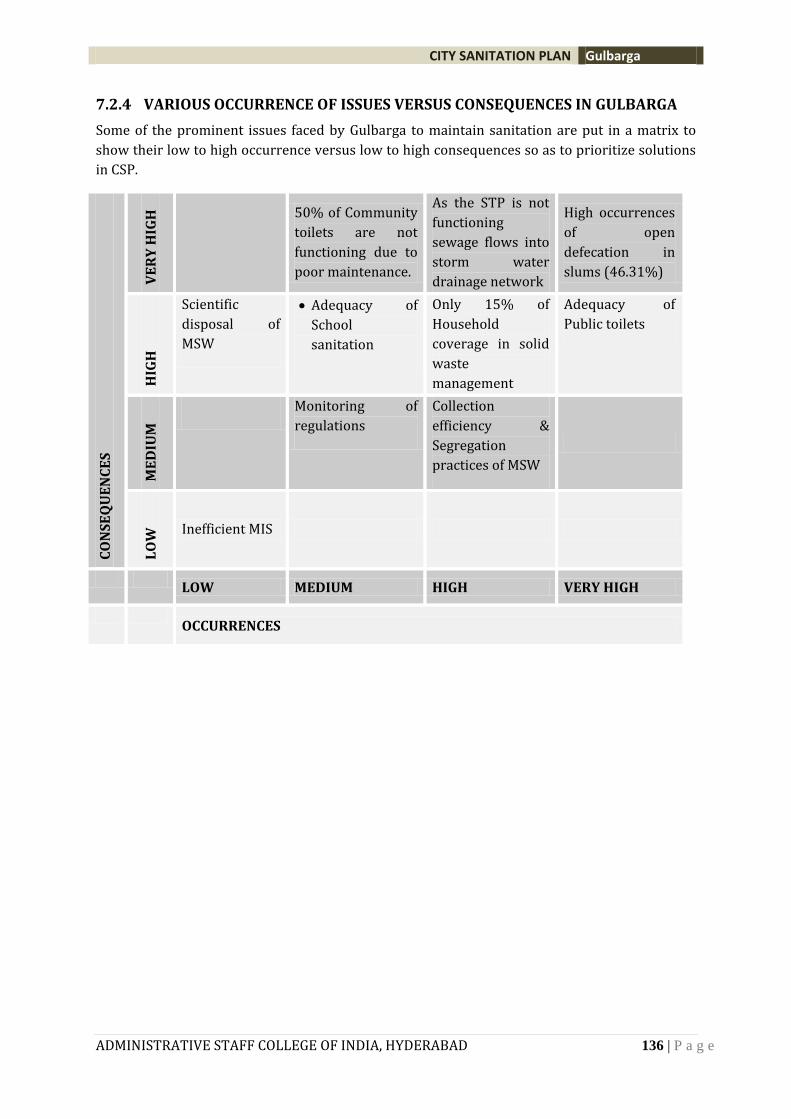
CITY SANITATION PLAN Gulbarga
ADMINISTRATIVE STAFF COLLEGE OF INDIA, HYDERABAD 136 | P a g e
7.2.4 VARIOUS OCCURRENCE OF ISSUES VERSUS CONSEQUENCES IN GULBARGA
Some of the prominent issues faced by Gulbarga to maintain sanitation are put in a matrix to
show their low to high occurrence versus low to high consequences so as to prioritize solutions
in CSP.
CO
NS
EQ
UE
NC
ES
VE
RY
HIG
H
50% of Community
toilets are not
functioning due to
poor maintenance.
As the STP is not
functioning
sewage flows into
storm water
drainage network
High occurrences
of open
defecation in
slums (46.31%)
HIG
H
Scientific
disposal of
MSW
Adequacy of
School
sanitation
Only 15% of
Household
coverage in solid
waste
management
Adequacy of
Public toilets
ME
DIU
M
Monitoring of
regulations
Collection
efficiency &
Segregation
practices of MSW
LO
W Inefficient MIS
LOW MEDIUM HIGH VERY HIGH
OCCURRENCES
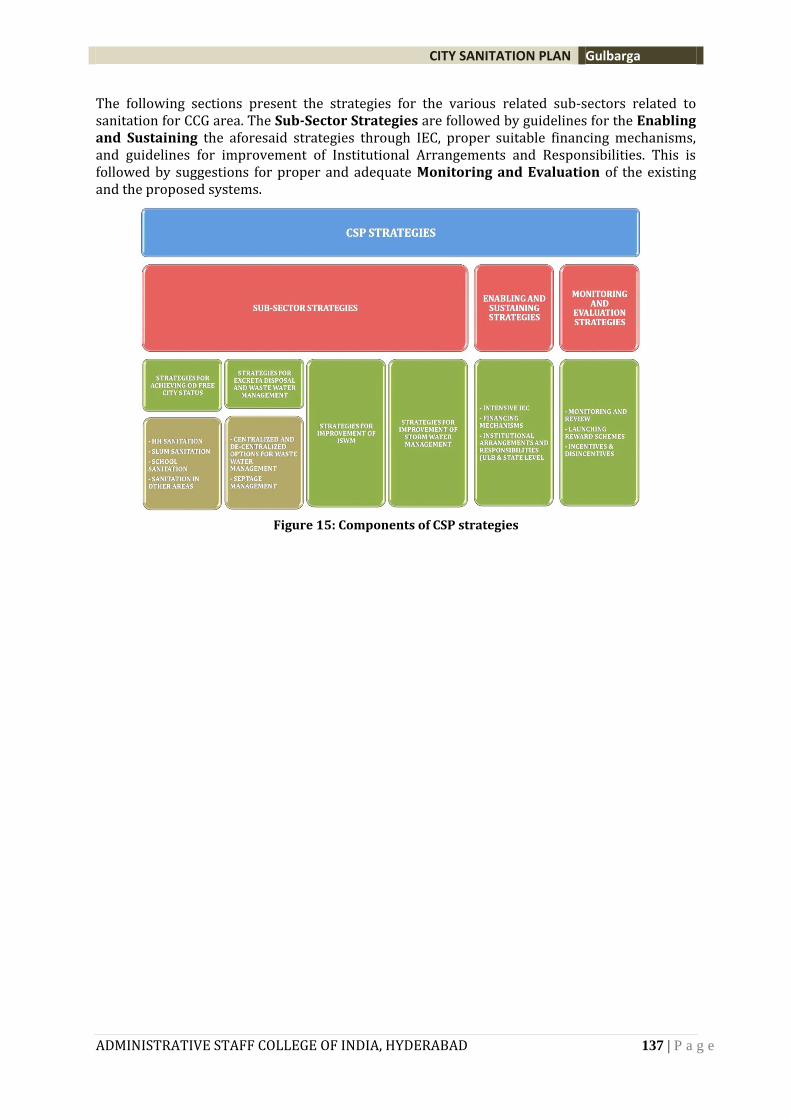
CITY SANITATION PLAN Gulbarga
ADMINISTRATIVE STAFF COLLEGE OF INDIA, HYDERABAD 137 | P a g e
The following sections present the strategies for the various related sub-sectors related to sanitation for CCG area. The Sub-Sector Strategies are followed by guidelines for the Enabling and Sustaining the aforesaid strategies through IEC, proper suitable financing mechanisms, and guidelines for improvement of Institutional Arrangements and Responsibilities. This is followed by suggestions for proper and adequate Monitoring and Evaluation of the existing and the proposed systems.
Figure 15: Components of CSP strategies
CITY SANITATION PLAN Gulbarga
ADMINISTRATIVE STAFF COLLEGE OF INDIA, HYDERABAD 138 | P a g e
7.3. SUBSECTOR STRATEGIES
This CSP aims guiding through next steps in achieving the goal of city wide sanitation for
Gulbarga. Broad strategies identified will try to lay down road map for achieving total sanitation
and hence detailed out. Also in this section along with strategies, infrastructure gaps estimated
as per practiced norms mentioned in previous section. Also both management and technical
options and financial requirement to bridge the gap have been assessed.
7.3.1 OPEN DEFECATION FREE STATUS BY ENSURING ACCESS TO ALL (INCLUDING POOR AND SLUM DWELLERS AS WELL AS VISITING POPULATION).
Open defecation, incidences are really high (46.31%) in slum areas. This mainly pertains to the
behaviour of the people, unavailability of proper public conveniences and the migrant labour
class population in the city. This has to be addressed in immediate term with concerted efforts
to make OD free especially in the context that UGD is going to be operational.
To achieve OD free status socially inclusiveness approaches that can be promoted are:
Promoting access to households with safe sanitation facilities (including proper
disposal arrangements);
Demand driven approach for access and promoting community-planned and managed
toilets wherever necessary, for groups of households who have issues of space, tenure
or economic constraints in gaining access to individual facilities;
• Triggering social action by intensive IEC to prevent OD
• Promotion of no cost/ low costs technologies of right kind
• Adequate availability and 100% upkeep and management of Public Sanitation facilities
in all busy areas and floating population affected areas
• Promoting partnerships to construct community and public toilets - Public Conveyance
blocks
• Increased access of the poor to water for hygiene
• Build capacities, political support and technical trainings
• Norms for sanitation provisions in buildings (including non-residential) and spaces
where public congregate, through bye-laws
• Municipal fund creation for neighbourhood project
CITY SANITATION PLAN Gulbarga
ADMINISTRATIVE STAFF COLLEGE OF INDIA, HYDERABAD 139 | P a g e
A. HOUSEHOLD SANITATION ARRANGEMENTS
UGD system is under construction. At present, only 5171 HHs (5.19%) are connected to the UGD. It can be assumed that 35 % of HHs can be
connected by the year 2016.
Important milestones for Gulbarga:
1. No more open defecation by Year: 2012 - 13 (achieve OD free status by intensive IEC). 2. Halve the pollution of surface waters by human excreta by 2013; 3. Increase the utilisation rates of municipal sewerage services by 2016 4. Unsanitary toilets will be upgraded by the year 2014
Table 59: Indicative figures in Household Sanitation Arrangements over CSP Implementation Period
Sanitation Arrangement
Pre-CSP Year CSP Implementation Period
2011 2012 2013 2014 2015 2016 Remarks
WC Connected to Conventional Sewer (no of HHs)
5171 10263 15871 21819 28125 40609
The UGD proposed will be
completed by 2041 so it is
assumed about 35% of HHs
will be connected till 2016
In % 5.19% 10.00% 15.00% 20.00% 25.00% 35.00%
Sanitary Toilets no of HHs)
67984 73090 80204 79640 76501 67295
In % 68.25% 71.22% 75.80% 73.00% 68.00% 58.00%
Community Toilet User Households
2548 6158 7406 7637 7875 8122 No. of HHs would reduce
over time being provided
with individual household
toilets in % 2.56% 6.00% 7.00% 7.00% 7.00% 7.00%
Households practicing open defecation
16934 8467 0 0 0 0 Zero OD status to be
achieved by 2012
CITY SANITATION PLAN Gulbarga
ADMINISTRATIVE STAFF COLLEGE OF INDIA, HYDERABAD 140 | P a g e
in % 17.00% 8.25% 0.00% 0.00% 0.00% 0.00%
households using unsanitary toilets
6973 4649 2324 0 0 0
Households using unsanitary toilets will be upgraded by 2014
in % 7.00% 4.53% 2.20% 0.00% 0.00% 0.00%
DEWATs and other types no of HHs) 0 0 0 0 300 600
DEWATS should be
proposed in areas which is
not served by UGD about 2
DEWATS units with a
capacity of 300 HHs in each
unit should be proposed. In % 0.00% 0.00% 0.00% 0.00% 0.27% 0.52%
Total Households
99610 102626 105805 109096 112501 116026
CITY SANITATION PLAN Gulbarga
ADMINISTRATIVE STAFF COLLEGE OF INDIA, HYDERABAD 141 | P a g e
B. SLUM SANITATION IMPROVEMENT
Creating demand responsive participatory approach to provision of community blocks
wherever individual toilets are not possible will be important aspect in creating access. This can
be done by giving incentives for private contractors, NGOs, community organizers to work
together to jointly deliver community toilet blocks. Partnerships can be led either by contractor
or NGO with each other. There need be high technical standards, high quality service levels and
provisions for children.
Considering Gulbarga situation, series of options need to be worked in slums as follows:
Sewerage for individual household latrines (IHHL)
Delinking tenure ship for slum residents to build toilets.
Management arrangements to be worked. Eg. CBO members operate and manage toilet
block on their own, or CBO employs the staff like caretaker to operate and manage the
toilet block or CBO contracts a caretaker (individual or family) to manage and operate
the toilet block on its behalf.
In this regard estimation done for number of toilets and urinals needed under various
categories to make the city fully sanitized. Models for providing shared toilets, public toilets2
and urinals as needed and operations and maintenance of the infrastructure, including charging
user fees is indicated below. The planning for public toilets has taken consideration the
following user groups: floating population, population during weekly markets, population that
comes into cities for special occasions like fairs, religious activities etc, population at public
place like bus stands, railway stations etc. Such facilities can be managed through community
groups, NGOs, CBOs and private operators on a self-sustaining basis.
At present about 50% of the community toilets are not functioning and as the dependency is
high an immediate necessity for upgrading is required. The proper O&M is very much necessary
for the sustenance of such toilets. Hence, the City Corporation will act as facilitator and sign an
MOA with local residents who are going to use it for O &M which is going to be the responsibility
of Community.
C. PUBLIC SANITATION FACILITIES
Estimation of public toilet facilities
Table 60: Estimation of Proposed Pay and Use complex (Each unit)
S. No Component Estimated Cost in Rs
1 No. of Seats 12 Nos
2 No. of users for maximum extent -Morning &
Evening. 3 hours + 3 hours
3 One seat can accommodate 60 persons per day
4 Total capacity 12 nos X 60 persons /day
7 Revenue per month (720 persons * 1 per person =
720 x 30 days ) Rs. 21,600/-
2 The current standard for public toilets is one seat for 60 users on a 24 hours rotation basis.
CITY SANITATION PLAN Gulbarga
ADMINISTRATIVE STAFF COLLEGE OF INDIA, HYDERABAD 142 | P a g e
8 Revenue by Ad per month ( one wall) 500
9 Total revenue 22100
10 Cleaning articles Rs 50 x 12 toilets 600
11 Sweepers 2 nos 4000
12 Civic maintenance and other contingencies 1000
13 Caretaker 4000
14 UGD user charges 360
15 Total Expenditure 9960
16 Estimated Private Operator Income
12140
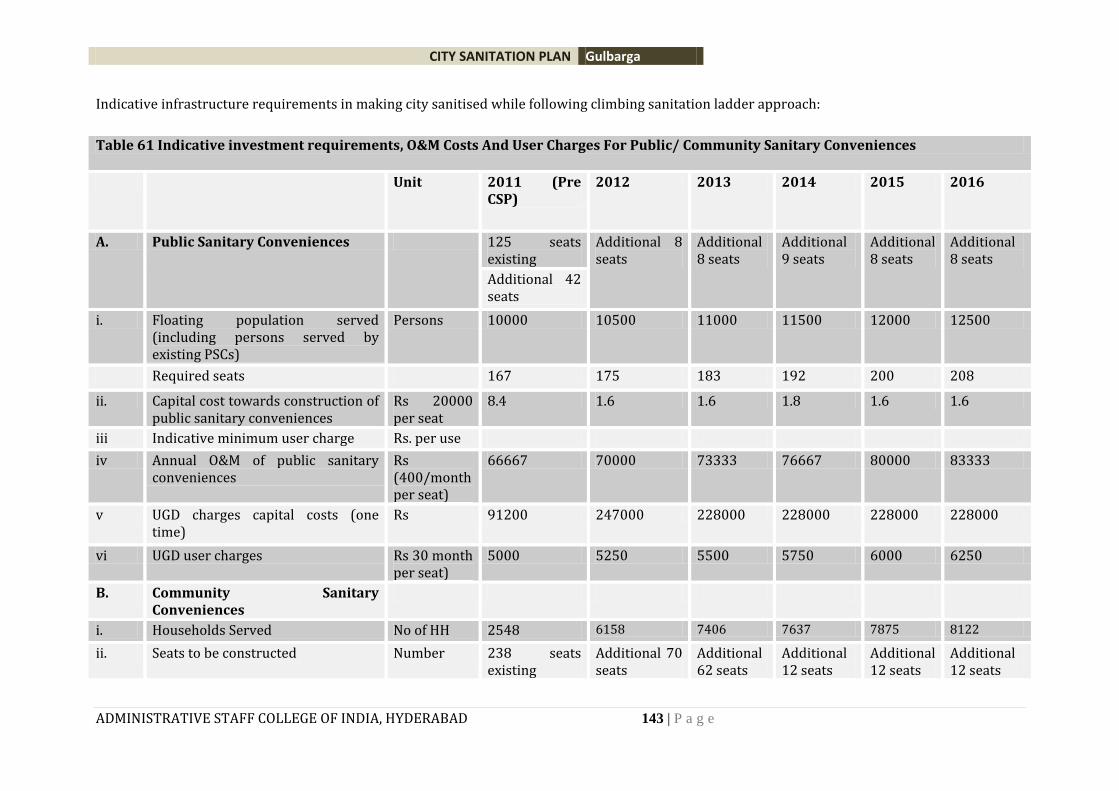
CITY SANITATION PLAN Gulbarga
ADMINISTRATIVE STAFF COLLEGE OF INDIA, HYDERABAD 143 | P a g e
Indicative infrastructure requirements in making city sanitised while following climbing sanitation ladder approach:
Table 61 Indicative investment requirements, O&M Costs And User Charges For Public/ Community Sanitary Conveniences
Unit 2011 (Pre CSP)
2012 2013 2014 2015 2016
A. Public Sanitary Conveniences 125 seats existing
Additional 8 seats
Additional 8 seats
Additional 9 seats
Additional 8 seats
Additional 8 seats
Additional 42 seats
i. Floating population served (including persons served by existing PSCs)
Persons 10000 10500 11000 11500 12000 12500
Required seats 167 175 183 192 200 208
ii. Capital cost towards construction of public sanitary conveniences
Rs 20000 per seat
8.4 1.6 1.6 1.8 1.6 1.6
iii Indicative minimum user charge Rs. per use
iv Annual O&M of public sanitary conveniences
Rs (400/month per seat)
66667 70000 73333 76667 80000 83333
v UGD charges capital costs (one time)
Rs 91200 247000 228000 228000 228000 228000
vi UGD user charges Rs 30 month per seat)
5000 5250 5500 5750 6000 6250
B. Community Sanitary Conveniences
i. Households Served No of HH 2548 6158 7406 7637 7875 8122
ii. Seats to be constructed Number 238 seats existing
Additional 70 seats
Additional 62 seats
Additional 12 seats
Additional 12 seats
Additional 12 seats
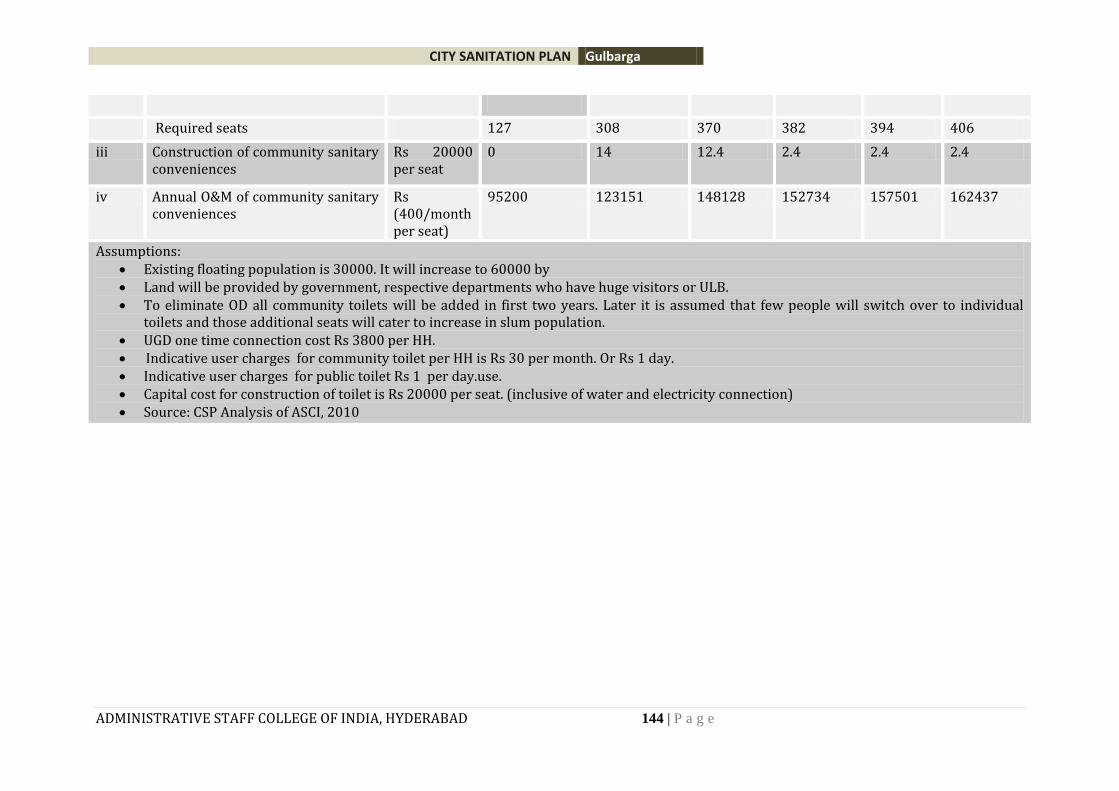
CITY SANITATION PLAN Gulbarga
ADMINISTRATIVE STAFF COLLEGE OF INDIA, HYDERABAD 144 | P a g e
Required seats 127 308 370 382 394 406
iii Construction of community sanitary conveniences
Rs 20000 per seat
0 14 12.4 2.4 2.4 2.4
iv Annual O&M of community sanitary conveniences
Rs (400/month per seat)
95200 123151 148128 152734 157501 162437
Assumptions: Existing floating population is 30000. It will increase to 60000 by Land will be provided by government, respective departments who have huge visitors or ULB. To eliminate OD all community toilets will be added in first two years. Later it is assumed that few people will switch over to individual
toilets and those additional seats will cater to increase in slum population. UGD one time connection cost Rs 3800 per HH. Indicative user charges for community toilet per HH is Rs 30 per month. Or Rs 1 day. Indicative user charges for public toilet Rs 1 per day.use. Capital cost for construction of toilet is Rs 20000 per seat. (inclusive of water and electricity connection) Source: CSP Analysis of ASCI, 2010
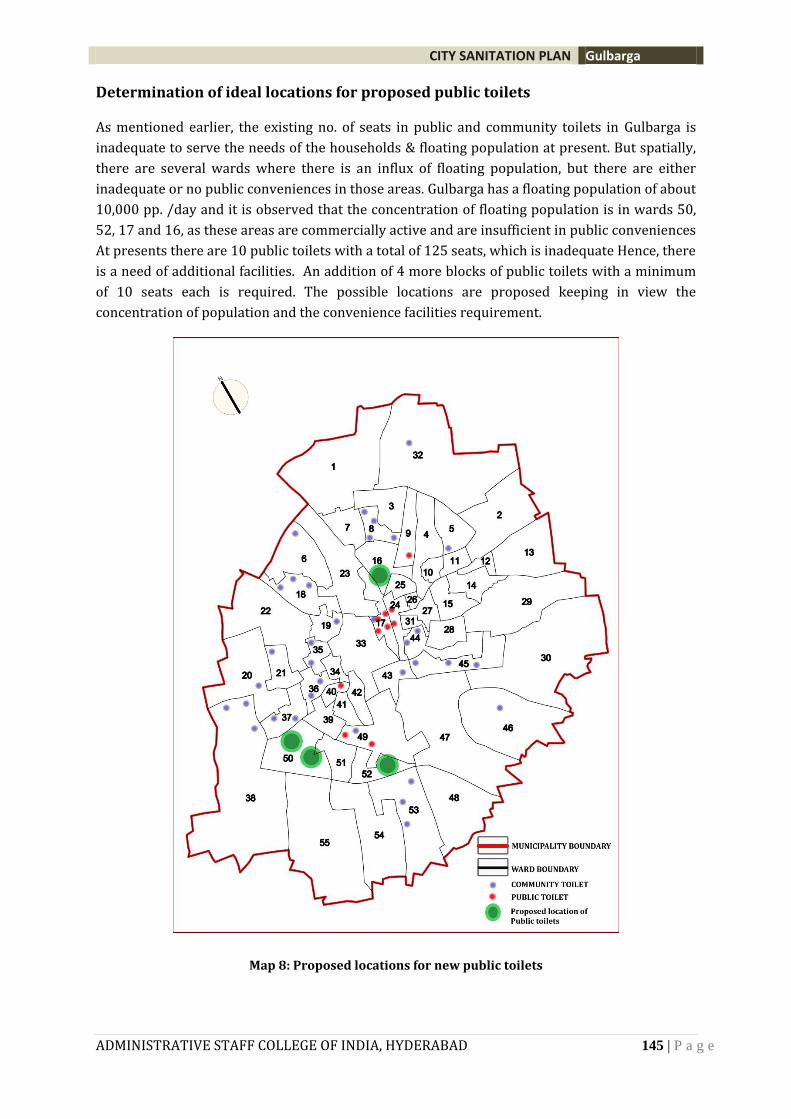
CITY SANITATION PLAN Gulbarga
ADMINISTRATIVE STAFF COLLEGE OF INDIA, HYDERABAD 145 | P a g e
Determination of ideal locations for proposed public toilets
As mentioned earlier, the existing no. of seats in public and community toilets in Gulbarga is
inadequate to serve the needs of the households & floating population at present. But spatially,
there are several wards where there is an influx of floating population, but there are either
inadequate or no public conveniences in those areas. Gulbarga has a floating population of about
10,000 pp. /day and it is observed that the concentration of floating population is in wards 50,
52, 17 and 16, as these areas are commercially active and are insufficient in public conveniences
At presents there are 10 public toilets with a total of 125 seats, which is inadequate Hence, there
is a need of additional facilities. An addition of 4 more blocks of public toilets with a minimum
of 10 seats each is required. The possible locations are proposed keeping in view the
concentration of population and the convenience facilities requirement.
Map 8: Proposed locations for new public toilets
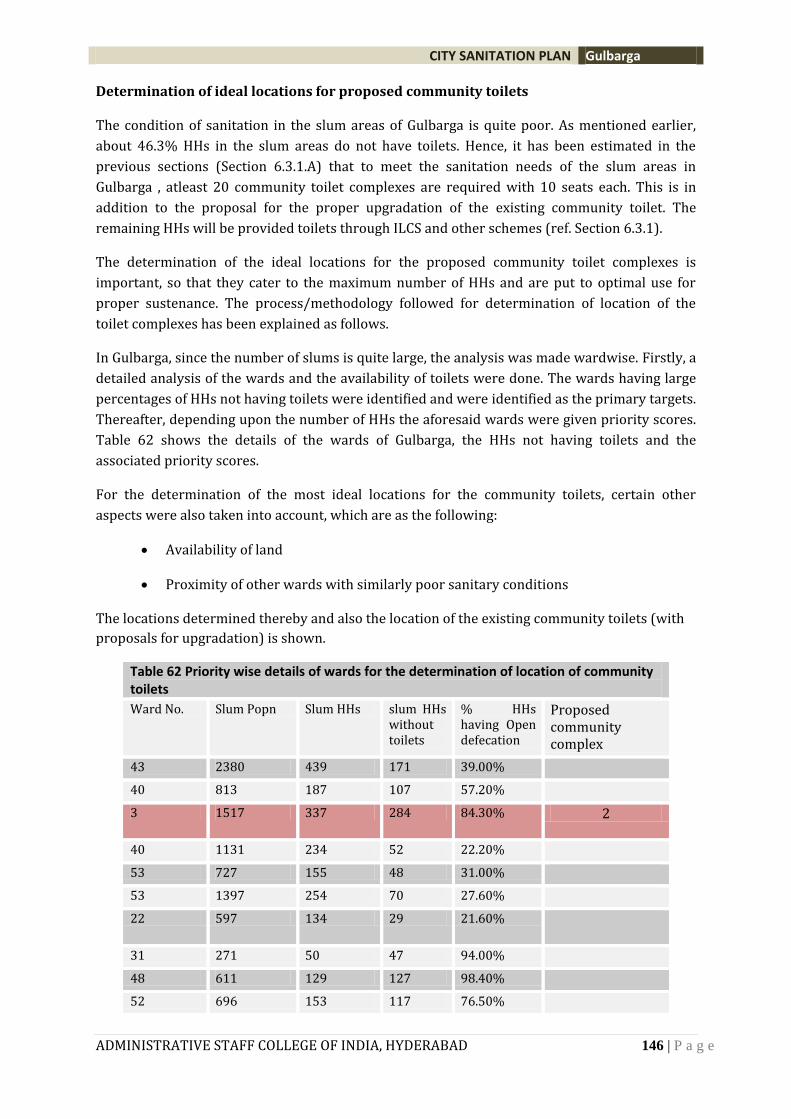
CITY SANITATION PLAN Gulbarga
ADMINISTRATIVE STAFF COLLEGE OF INDIA, HYDERABAD 146 | P a g e
Determination of ideal locations for proposed community toilets
The condition of sanitation in the slum areas of Gulbarga is quite poor. As mentioned earlier,
about 46.3% HHs in the slum areas do not have toilets. Hence, it has been estimated in the
previous sections (Section 6.3.1.A) that to meet the sanitation needs of the slum areas in
Gulbarga , atleast 20 community toilet complexes are required with 10 seats each. This is in
addition to the proposal for the proper upgradation of the existing community toilet. The
remaining HHs will be provided toilets through ILCS and other schemes (ref. Section 6.3.1).
The determination of the ideal locations for the proposed community toilet complexes is
important, so that they cater to the maximum number of HHs and are put to optimal use for
proper sustenance. The process/methodology followed for determination of location of the
toilet complexes has been explained as follows.
In Gulbarga, since the number of slums is quite large, the analysis was made wardwise. Firstly, a
detailed analysis of the wards and the availability of toilets were done. The wards having large
percentages of HHs not having toilets were identified and were identified as the primary targets.
Thereafter, depending upon the number of HHs the aforesaid wards were given priority scores.
Table 62 shows the details of the wards of Gulbarga, the HHs not having toilets and the
associated priority scores.
For the determination of the most ideal locations for the community toilets, certain other
aspects were also taken into account, which are as the following:
Availability of land
Proximity of other wards with similarly poor sanitary conditions
The locations determined thereby and also the location of the existing community toilets (with
proposals for upgradation) is shown.
Table 62 Priority wise details of wards for the determination of location of community toilets
Ward No. Slum Popn Slum HHs slum HHs without toilets
% HHs having Open defecation
Proposed community complex
43 2380 439 171 39.00%
40 813 187 107 57.20%
3 1517 337 284 84.30% 2
40 1131 234 52 22.20%
53 727 155 48 31.00%
53 1397 254 70 27.60%
22 597 134 29 21.60%
31 271 50 47 94.00%
48 611 129 127 98.40%
52 696 153 117 76.50%
CITY SANITATION PLAN Gulbarga
ADMINISTRATIVE STAFF COLLEGE OF INDIA, HYDERABAD 147 | P a g e
52 1422 283 158 55.80%
50 47 8 7 87.50%
38 2059 371 313 84.40% 2
38 1622 300 256 85.30% 1
49 2324 527 360 68.30%
45 264 50 50 100.00%
43 564 89 29 32.60%
17 508 91 26 28.60%
21 1880 408 80 19.60%
32 1668 342 292 85.40% 2
32 471 121 98 81.00% 1
23 382 70 36 51.40%
23 391 70 51 72.90%
45 1026 192 69 35.90%
23 529 97 95 97.90% 1
23 6 1 1 100.00%
23 858 188 140 74.50%
32 1343 285 280 98.20% 2
46 249 50 49 98.00%
46 1490 300 278 92.70% 2
22 281 52 38 73.10%
44 752 121 25 20.70%
23 726 128 27 21.10%
23 439 83 41 49.40%
50 870 184 157 85.30% 1
23 223 44 7 15.90%
53 694 155 146 94.20%
53 2966 617 502 81.40% 3
53 2514 524 494 94.30% 3
36 1952 458 84 18.30%
41 1253 238 166 69.70%
Total 60196 12085 5597 46.31% 20
Source - ASCI
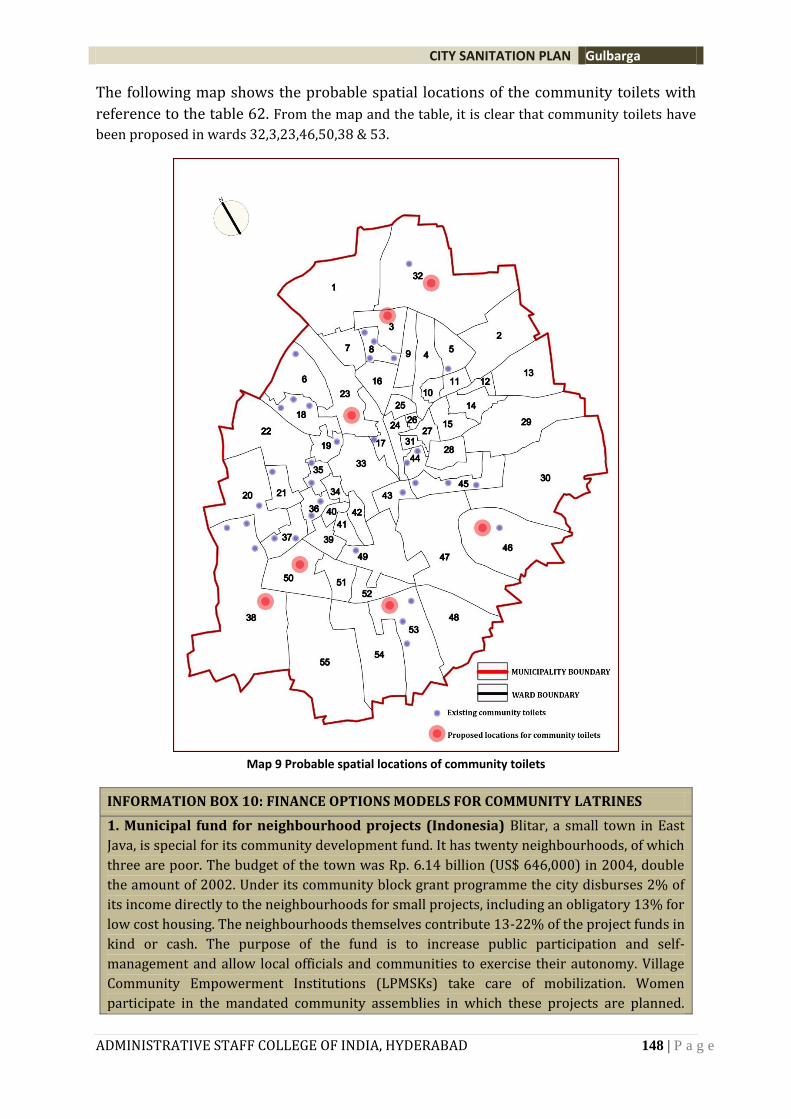
CITY SANITATION PLAN Gulbarga
ADMINISTRATIVE STAFF COLLEGE OF INDIA, HYDERABAD 148 | P a g e
The following map shows the probable spatial locations of the community toilets with
reference to the table 62. From the map and the table, it is clear that community toilets have
been proposed in wards 32,3,23,46,50,38 & 53.
Map 9 Probable spatial locations of community toilets
INFORMATION BOX 10: FINANCE OPTIONS MODELS FOR COMMUNITY LATRINES
1. Municipal fund for neighbourhood projects (Indonesia) Blitar, a small town in East
Java, is special for its community development fund. It has twenty neighbourhoods, of which
three are poor. The budget of the town was Rp. 6.14 billion (US$ 646,000) in 2004, double
the amount of 2002. Under its community block grant programme the city disburses 2% of
its income directly to the neighbourhoods for small projects, including an obligatory 13% for
low cost housing. The neighbourhoods themselves contribute 13-22% of the project funds in
kind or cash. The purpose of the fund is to increase public participation and self-
management and allow local officials and communities to exercise their autonomy. Village
Community Empowerment Institutions (LPMSKs) take care of mobilization. Women
participate in the mandated community assemblies in which these projects are planned.
CITY SANITATION PLAN Gulbarga
ADMINISTRATIVE STAFF COLLEGE OF INDIA, HYDERABAD 149 | P a g e
Since 2003 project selection criteria include the number of poor beneficiaries. Most local
grants go to improvement of infrastructure. From 2005 on, use of funds for hardware is
restricted to 60%. Learning from mistakes is an accepted part of the approach.
2. Slum Sanitation pogramme of Mumbai: A key feature was the involvement of slum
communities in project implementation right from the planning stage. The mobilization
process facilitated collaborations between NGOs, contractors and CBOs. In each slum a CBO
was formed and registered as a trust or a society (under the Bombay Public trust Act. To
express its “demand” each family in the target slum area was asked to pay contribution
Rs.100 per adult (maximum of Rs 500 per family) as a membership fee. The amount was
deposited in a joint bank account. After construction of the toilet block the CBO typically
certifies it’s satisfactory completion and signs a MOU with the municipal Corporation. The
responsibility of maintaining the toilet block is then handed over to the CBO. MOU specifies
that CBO will operate and maintain the toilet block. 3. After the reforms in TSC programme, priority was given for setting up sanitary complexes
in a place acceptable for both men and women. The prescribed unit cost is up to Rs 2 lakh,
shared by GOI, State Government and the community in the ratio of 60:20:20. However, the
community contribution can be made by the local governance from its budget (GOI, CSRS
2002). This approach directly provides subsidy to communities rather than individuals.
Though many households are inclined positively to have IHL, the scarcity of space, the
traditional taboos have become a constraint for construction of IHL. To overcome such
constraints, the integrated Community Latrines Complex (ICLC) becomes a substitute. The
maintenance cost of the community sanitary complexes has to be met by the
Panchayats/voluntary organisations/charitable trusts/Self Help Groups and not the
committee set up by local government.
D. SCHOOL SANITATION PROVISION
In Gulbarga like any other city, school latrines and water points become dirty and run down as
detailed in the situational analysis report. As a result, they are not used and create a health
hazard. School water supply, sanitation and hygiene education are very important for the
following main reasons:
Promotes health and hygiene behaviour at an early stage of childhood.
Improves the health of children and results in a lower dropout rate, especially among
girl children.
Huge network of schools offers a ready-made infrastructure to influence the students,
teachers, parents and hence the community.
Children are the change agents; hence, it ensures generational change in the adoption of
the health and hygiene behaviour.
A good cleaning and maintenance system requires funds, spare parts, people and equipment,
and a clear division of roles and responsibilities among the actors involved. A number of
organizational options for maintenance suggested: through a cleaning committee, by classes
on a rotation basis, with or without a rewarding mechanism, or by individual students.
The children should be encouraged to help to maintain their own school environment and
facilities. The following models are recommended for school sanitation.
CITY SANITATION PLAN Gulbarga
ADMINISTRATIVE STAFF COLLEGE OF INDIA, HYDERABAD 150 | P a g e
a. Health Clubs School health and hygiene clubs are usually involved in helping children for maintenance tasks.
School health clubs (or similar groups with other names) can be very useful for:
stimulating safe hygiene behaviour among children;
monitoring SSHE programme;
reaching out into the community;
Prepare an annual action plan for the School health club;
Organise school activities in planning, teaching, monitoring, and maintenance;
Conduct community activities with the help of headmaster and teachers;
Different actors should be engaged and all work together to promote and implement gender-
responsive sanitation, health and hygiene solutions. This includes:
1. Schools – (parents, PTAs, school councils, teachers,
2. students)
3. NGOs and CBOs
4. Women’s groups
5. Youth organizations
6. Governments – including Ministries of Education, Health, Water
7. Health providers
8. Researchers
b. School committee Often school committees are found very effective and can be established in schools to plan and
implement school sanitation programmes. These Committees may usually consist of students,
teachers, and parents with following roles :
Take a lead in co-ordinating and preparing action plan of SSHE programme.
Involve other actors in mobilizing local resources and support special activities like fund
raising, construction, maintenance and repair;
Organise various activities periodically to collect funds for various programmes;
Budget, allocate and supervise funds.
E. PROVISION OF SANITATION IN OTHER AREAS FOR ACHIEVING CITYWIDE
SANITATION
National Building Code (NBC 2005) of India is basis for all Building Regulations and adopted by
respective states in the country, which clearly specifies that any building meant for human
occupancy or use should have adequate sanitation and disposal facilities irrespective of
availability of sewerage.
Detailed norms are available in the code depending on occupancy saying in no case less than
one water closet should be provided. Wherever disposal facilities are not available they shall be
provided as part of the building design for ensuring highest standards of sanitation condition.
Part 9 on Plumbing services Section 1 of Water Supply Drainage and Sanitation clearly details
the requirements under safe sanitation provision. But authorities are failed in implementation
of NBC and Building regulation to check building plan approvals. CSTF should intervene in this
and two members should be identified from CSTF to ratify building plans for adequate
sanitation provision. Clear rules need to be amended on responsibility of toilet provision in the
premises of any human occupation or use. Various uses generally found in any given city and
options for sanitation provision to achieve citywide sanitation are indicated below:
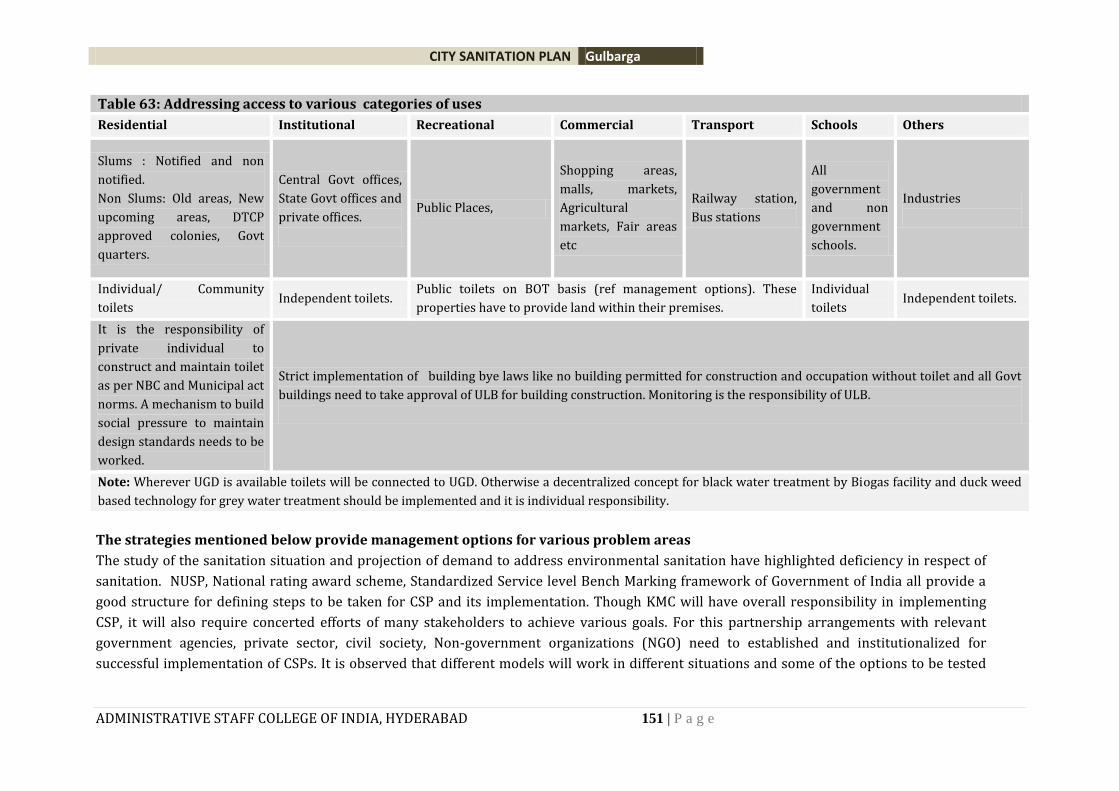
CITY SANITATION PLAN Gulbarga
ADMINISTRATIVE STAFF COLLEGE OF INDIA, HYDERABAD 151 | P a g e
Table 63: Addressing access to various categories of uses
Residential Institutional Recreational Commercial Transport Schools Others
Slums : Notified and non
notified.
Non Slums: Old areas, New
upcoming areas, DTCP
approved colonies, Govt
quarters.
Central Govt offices,
State Govt offices and
private offices.
Public Places,
Shopping areas,
malls, markets,
Agricultural
markets, Fair areas
etc
Railway station,
Bus stations
All
government
and non
government
schools.
Industries
Individual/ Community
toilets Independent toilets.
Public toilets on BOT basis (ref management options). These
properties have to provide land within their premises.
Individual
toilets Independent toilets.
It is the responsibility of
private individual to
construct and maintain toilet
as per NBC and Municipal act
norms. A mechanism to build
social pressure to maintain
design standards needs to be
worked.
Strict implementation of building bye laws like no building permitted for construction and occupation without toilet and all Govt
buildings need to take approval of ULB for building construction. Monitoring is the responsibility of ULB.
Note: Wherever UGD is available toilets will be connected to UGD. Otherwise a decentralized concept for black water treatment by Biogas facility and duck weed
based technology for grey water treatment should be implemented and it is individual responsibility.
The strategies mentioned below provide management options for various problem areas
The study of the sanitation situation and projection of demand to address environmental sanitation have highlighted deficiency in respect of
sanitation. NUSP, National rating award scheme, Standardized Service level Bench Marking framework of Government of India all provide a
good structure for defining steps to be taken for CSP and its implementation. Though KMC will have overall responsibility in implementing
CSP, it will also require concerted efforts of many stakeholders to achieve various goals. For this partnership arrangements with relevant
government agencies, private sector, civil society, Non-government organizations (NGO) need to established and institutionalized for
successful implementation of CSPs. It is observed that different models will work in different situations and some of the options to be tested
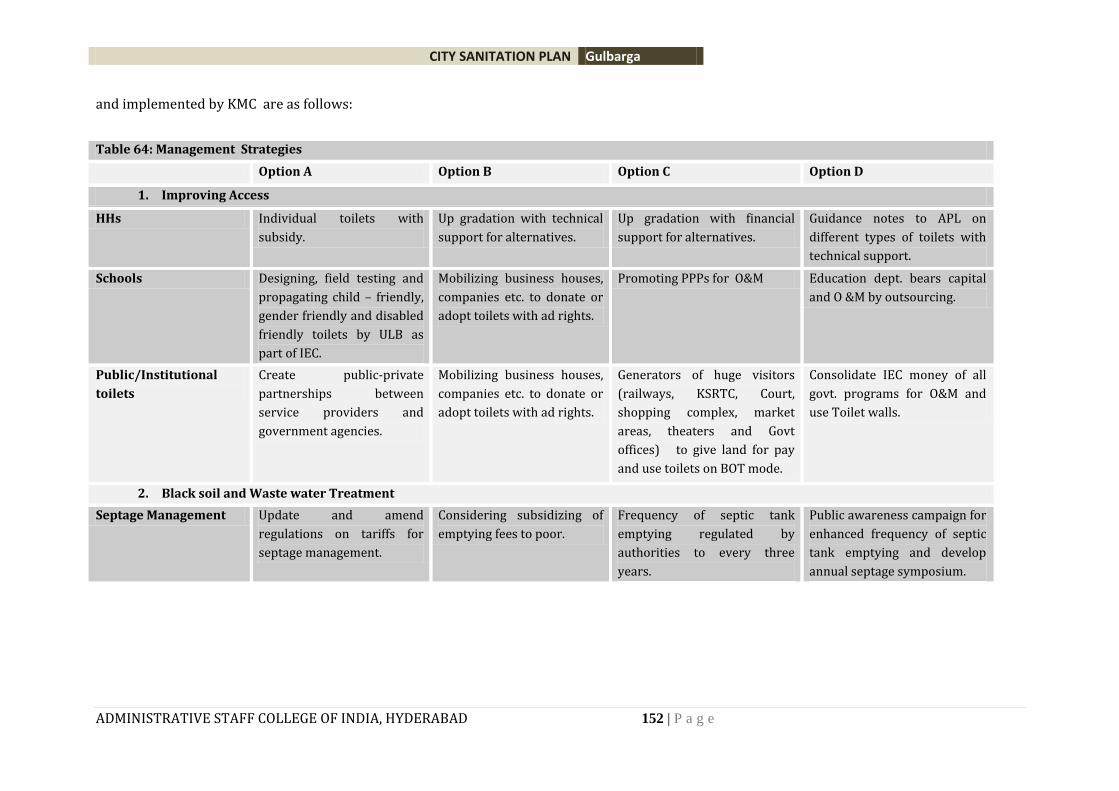
CITY SANITATION PLAN Gulbarga
ADMINISTRATIVE STAFF COLLEGE OF INDIA, HYDERABAD 152 | P a g e
and implemented by KMC are as follows:
Table 64: Management Strategies
Option A Option B Option C Option D
1. Improving Access
HHs Individual toilets with
subsidy.
Up gradation with technical
support for alternatives.
Up gradation with financial
support for alternatives.
Guidance notes to APL on
different types of toilets with
technical support.
Schools Designing, field testing and
propagating child – friendly,
gender friendly and disabled
friendly toilets by ULB as
part of IEC.
Mobilizing business houses,
companies etc. to donate or
adopt toilets with ad rights.
Promoting PPPs for O&M Education dept. bears capital
and O &M by outsourcing.
Public/Institutional
toilets
Create public-private
partnerships between
service providers and
government agencies.
Mobilizing business houses,
companies etc. to donate or
adopt toilets with ad rights.
Generators of huge visitors
(railways, KSRTC, Court,
shopping complex, market
areas, theaters and Govt
offices) to give land for pay
and use toilets on BOT mode.
Consolidate IEC money of all
govt. programs for O&M and
use Toilet walls.
2. Black soil and Waste water Treatment
Septage Management Update and amend
regulations on tariffs for
septage management.
Considering subsidizing of
emptying fees to poor.
Frequency of septic tank
emptying regulated by
authorities to every three
years.
Public awareness campaign for
enhanced frequency of septic
tank emptying and develop
annual septage symposium.
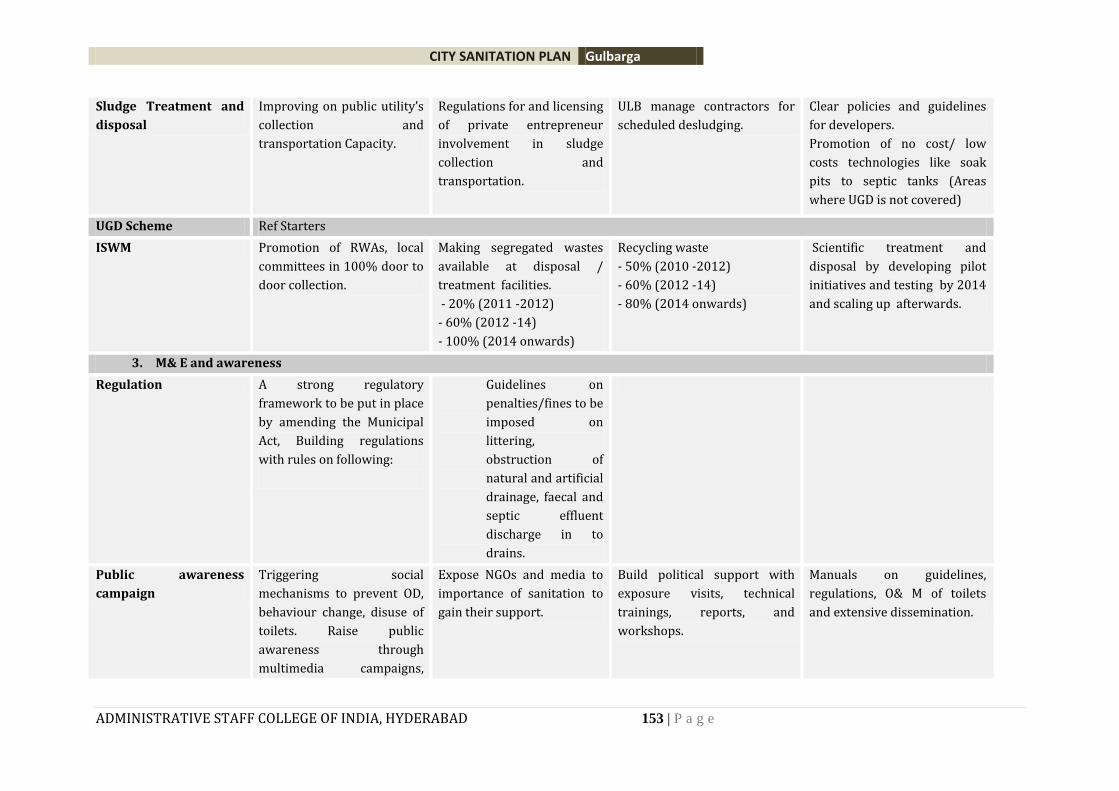
CITY SANITATION PLAN Gulbarga
ADMINISTRATIVE STAFF COLLEGE OF INDIA, HYDERABAD 153 | P a g e
Sludge Treatment and
disposal
Improving on public utility’s
collection and
transportation Capacity.
Regulations for and licensing
of private entrepreneur
involvement in sludge
collection and
transportation.
ULB manage contractors for
scheduled desludging.
Clear policies and guidelines
for developers.
Promotion of no cost/ low
costs technologies like soak
pits to septic tanks (Areas
where UGD is not covered)
UGD Scheme Ref Starters
ISWM Promotion of RWAs, local
committees in 100% door to
door collection.
Making segregated wastes
available at disposal /
treatment facilities.
- 20% (2011 -2012)
- 60% (2012 -14)
- 100% (2014 onwards)
Recycling waste
- 50% (2010 -2012)
- 60% (2012 -14)
- 80% (2014 onwards)
Scientific treatment and
disposal by developing pilot
initiatives and testing by 2014
and scaling up afterwards.
3. M& E and awareness
Regulation A strong regulatory
framework to be put in place
by amending the Municipal
Act, Building regulations
with rules on following:
Guidelines on
penalties/fines to be
imposed on
littering,
obstruction of
natural and artificial
drainage, faecal and
septic effluent
discharge in to
drains.
Public awareness
campaign
Triggering social
mechanisms to prevent OD,
behaviour change, disuse of
toilets. Raise public
awareness through
multimedia campaigns,
Expose NGOs and media to
importance of sanitation to
gain their support.
Build political support with
exposure visits, technical
trainings, reports, and
workshops.
Manuals on guidelines,
regulations, O& M of toilets
and extensive dissemination.
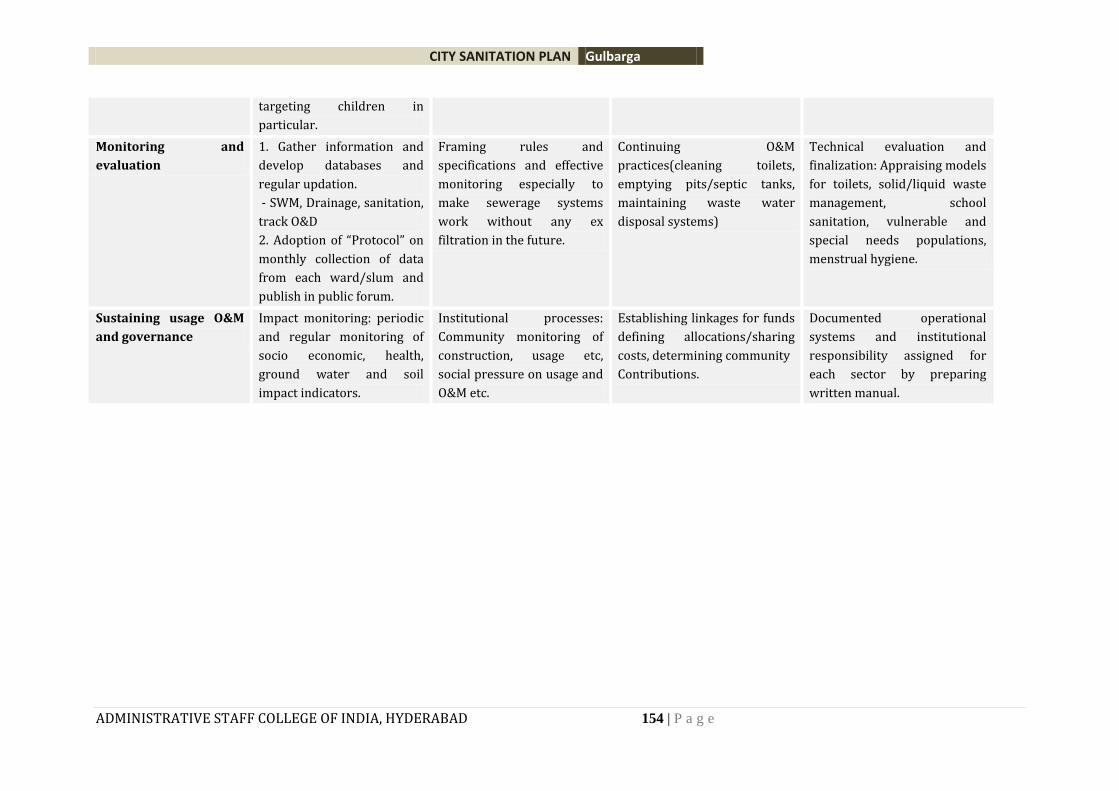
CITY SANITATION PLAN Gulbarga
ADMINISTRATIVE STAFF COLLEGE OF INDIA, HYDERABAD 154 | P a g e
targeting children in
particular.
Monitoring and
evaluation
1. Gather information and
develop databases and
regular updation.
- SWM, Drainage, sanitation,
track O&D
2. Adoption of “Protocol” on
monthly collection of data
from each ward/slum and
publish in public forum.
Framing rules and
specifications and effective
monitoring especially to
make sewerage systems
work without any ex
filtration in the future.
Continuing O&M
practices(cleaning toilets,
emptying pits/septic tanks,
maintaining waste water
disposal systems)
Technical evaluation and
finalization: Appraising models
for toilets, solid/liquid waste
management, school
sanitation, vulnerable and
special needs populations,
menstrual hygiene.
Sustaining usage O&M
and governance
Impact monitoring: periodic
and regular monitoring of
socio economic, health,
ground water and soil
impact indicators.
Institutional processes:
Community monitoring of
construction, usage etc,
social pressure on usage and
O&M etc.
Establishing linkages for funds
defining allocations/sharing
costs, determining community
Contributions.
Documented operational
systems and institutional
responsibility assigned for
each sector by preparing
written manual.
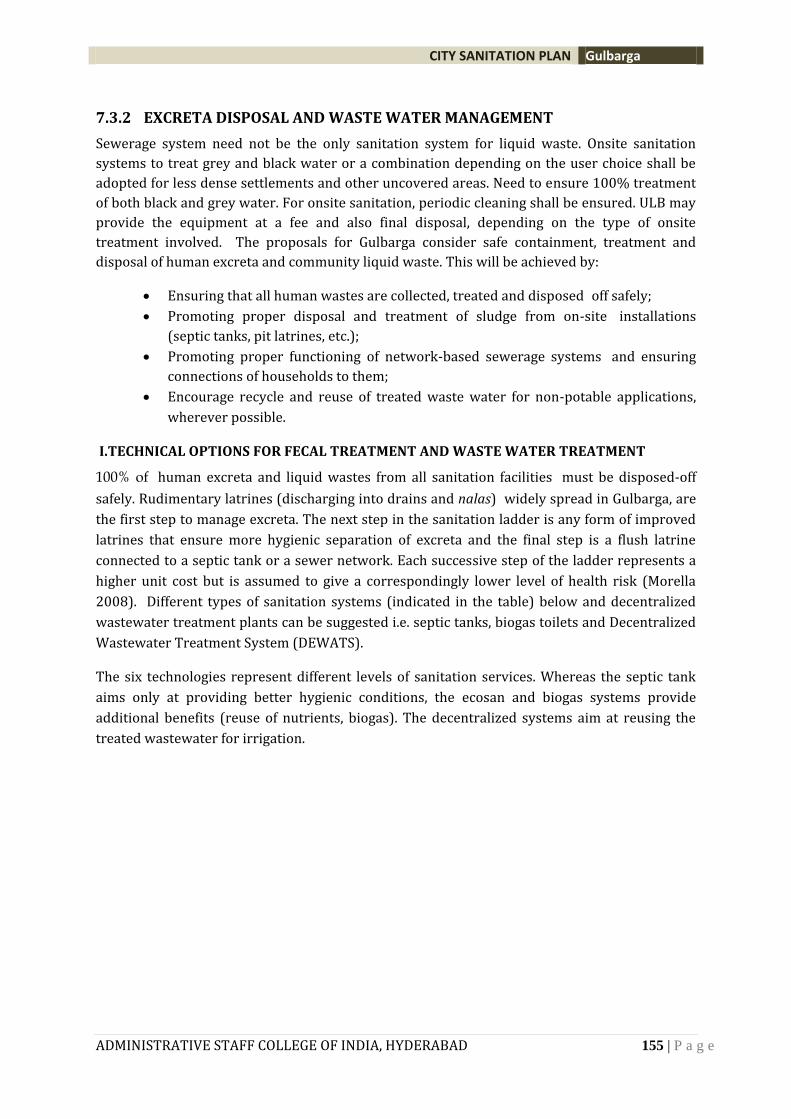
CITY SANITATION PLAN Gulbarga
ADMINISTRATIVE STAFF COLLEGE OF INDIA, HYDERABAD 155 | P a g e
7.3.2 EXCRETA DISPOSAL AND WASTE WATER MANAGEMENT
Sewerage system need not be the only sanitation system for liquid waste. Onsite sanitation
systems to treat grey and black water or a combination depending on the user choice shall be
adopted for less dense settlements and other uncovered areas. Need to ensure 100% treatment
of both black and grey water. For onsite sanitation, periodic cleaning shall be ensured. ULB may
provide the equipment at a fee and also final disposal, depending on the type of onsite
treatment involved. The proposals for Gulbarga consider safe containment, treatment and
disposal of human excreta and community liquid waste. This will be achieved by:
Ensuring that all human wastes are collected, treated and disposed off safely;
Promoting proper disposal and treatment of sludge from on-site installations
(septic tanks, pit latrines, etc.);
Promoting proper functioning of network-based sewerage systems and ensuring
connections of households to them;
Encourage recycle and reuse of treated waste water for non-potable applications,
wherever possible.
I.TECHNICAL OPTIONS FOR FECAL TREATMENT AND WASTE WATER TREATMENT
100% of human excreta and liquid wastes from all sanitation facilities must be disposed-off
safely. Rudimentary latrines (discharging into drains and nalas) widely spread in Gulbarga, are
the first step to manage excreta. The next step in the sanitation ladder is any form of improved
latrines that ensure more hygienic separation of excreta and the final step is a flush latrine
connected to a septic tank or a sewer network. Each successive step of the ladder represents a
higher unit cost but is assumed to give a correspondingly lower level of health risk (Morella
2008). Different types of sanitation systems (indicated in the table) below and decentralized
wastewater treatment plants can be suggested i.e. septic tanks, biogas toilets and Decentralized
Wastewater Treatment System (DEWATS).
The six technologies represent different levels of sanitation services. Whereas the septic tank
aims only at providing better hygienic conditions, the ecosan and biogas systems provide
additional benefits (reuse of nutrients, biogas). The decentralized systems aim at reusing the
treated wastewater for irrigation.
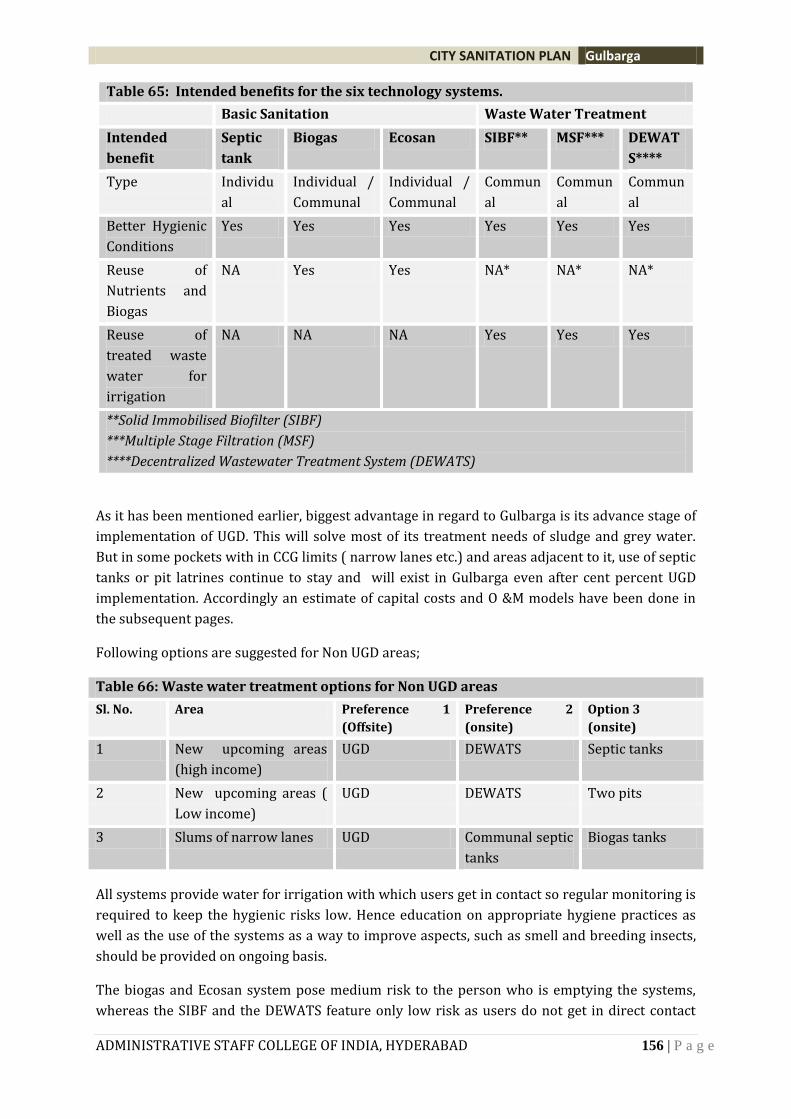
CITY SANITATION PLAN Gulbarga
ADMINISTRATIVE STAFF COLLEGE OF INDIA, HYDERABAD 156 | P a g e
Table 65: Intended benefits for the six technology systems.
Basic Sanitation Waste Water Treatment
Intended
benefit
Septic
tank
Biogas Ecosan SIBF** MSF*** DEWAT
S****
Type Individu
al
Individual /
Communal
Individual /
Communal
Commun
al
Commun
al
Commun
al
Better Hygienic
Conditions
Yes Yes Yes Yes Yes Yes
Reuse of
Nutrients and
Biogas
NA Yes Yes NA* NA* NA*
Reuse of
treated waste
water for
irrigation
NA NA NA Yes Yes Yes
**Solid Immobilised Biofilter (SIBF)
***Multiple Stage Filtration (MSF)
****Decentralized Wastewater Treatment System (DEWATS)
As it has been mentioned earlier, biggest advantage in regard to Gulbarga is its advance stage of
implementation of UGD. This will solve most of its treatment needs of sludge and grey water.
But in some pockets with in CCG limits ( narrow lanes etc.) and areas adjacent to it, use of septic
tanks or pit latrines continue to stay and will exist in Gulbarga even after cent percent UGD
implementation. Accordingly an estimate of capital costs and O &M models have been done in
the subsequent pages.
Following options are suggested for Non UGD areas;
Table 66: Waste water treatment options for Non UGD areas
Sl. No. Area Preference 1
(Offsite)
Preference 2
(onsite)
Option 3
(onsite)
1 New upcoming areas
(high income)
UGD DEWATS Septic tanks
2 New upcoming areas (
Low income)
UGD DEWATS Two pits
3 Slums of narrow lanes UGD Communal septic
tanks
Biogas tanks
All systems provide water for irrigation with which users get in contact so regular monitoring is
required to keep the hygienic risks low. Hence education on appropriate hygiene practices as
well as the use of the systems as a way to improve aspects, such as smell and breeding insects,
should be provided on ongoing basis.
The biogas and Ecosan system pose medium risk to the person who is emptying the systems,
whereas the SIBF and the DEWATS feature only low risk as users do not get in direct contact
CITY SANITATION PLAN Gulbarga
ADMINISTRATIVE STAFF COLLEGE OF INDIA, HYDERABAD 157 | P a g e
with the system. The risk here is dependent on the reuse of water for irrigation practices, type
of crops and how well the prior treatment has worked. One factor of success of the
decentralized systems is the well-organized operation and maintenance, which is either
conducted by a private company or a community committee. Those decentralized systems also
require less energy (and have therefore lower costs) than conventional treatment systems.
Considering the small pockets in new upcoming areas Gulbarga ideally should have following
options for preference in sludge treatment:
II. ENSURING EARLY OPERATIONALISATION OF ONGOING UGD SCHEME IN GULBARGA FOR
WASTE WATER MANAGEMENT AND EXCRETA DISPOSAL
Prime responsibility of Gulbarga is to see high cost intensive UGD to function well with effective
STPs. Otherwise there is a fear that network will be just another conduit to transport all the
waste and dump outside city limits without any treatment. To make UGD functional on
sustained basis selection of STP is utmost important and an intervention of expert committee is
suggested involving district officials, Engineer in chief, PHED, implementing agencies like
Larson & Toubro, consultant of UGD DPR and ULB officials. This should be done on priority
basis and following suggestions are given for effective functioning of UGD;
III. STARTERS FOR SEWERAGE
Major challenge lies in ensuring cent percent connectivity to ongoing UGD. There is no IEC
programme taken up so far to motivate people in raising connection costs, benefits of UGD and
its operation and maintenance. It is highly important that scheme has to be explained in detail
about benefits of having sewerage access, need of maintaining STP as per CPCB norms and huge
O&M costs involved. Hence an intensive communication programme through local cable TV
network, newspapers etc. should be ideally a starting point. Concerns of the stakeholders
provide strength and motivation to the Gulbarga City Corporation to overcome the problem that
may occur and can do midterm corrections. For effective functioning of UGD following
immediate actions are suggested;
Table 67: Starters for UGD
Recommendation Possible Constraints Actions
Ensuring 95% UGD
Coverage
- Mobilizing connections (last
mile connectivity)
- Collection of connection cost
in time
- Bringing more properties in
to PT net ( no of PT
assessments proportionately
increase UGD connections)
- Building positive image of
MC in general public.
- Develop robust MIS in three months (
intensive field verifications, cross checking)
- Widening PT net
- Pro poor policy on UGD connection cost and
IEC. - Modifying building bye-laws to have UGD
connection compulsory
- Establishing coordination between
engineering and revenue sections.
Adopt policy on IEC and Public Awareness
Campaign in mission mode( Sewerage
connection cost Vs Septic tank etc. Need
for safe sanitation)
Operational Strategy How to connect to main sewer - Display of technical drawing with
CITY SANITATION PLAN Gulbarga
ADMINISTRATIVE STAFF COLLEGE OF INDIA, HYDERABAD 158 | P a g e
The following figure shows a typical layout for the UGD network connected to the
Household
Figure 16: Connecting to UGD – typical layout
trunk.(technical
specifications)
Availability of technicians.
Making corpus available for
O&M of STPs. (ref table 37 on
O&M costs )
specifications in all wards and information
dissemination through pamphlets.
- Training local masons on UGD connection
process.
- Managing material flow for hard ware
arrangements.
- Transparent measures - simplification of
procedures for sanction of water supply and
sewerage connections, customer charter, fully
automated bill payment.
Private sector
involvement for O & M
Codified procedures for sewerage, septage,
drainage and SWM. (preparation of protocol manual and monitoring by local communities
on location of samples to be tested, periodicity and parameters to be tested.)
Finance and
administration
Consumers get interest free loans to connect and pay back as part of the tariff;
Introduction of weighed tariffs reflecting the principle ‘the polluter pays’.
Use of local indicators, e.g. type of housing, to determine the category of
payment.
Different loan terms for different groups, e.g. installments.
Timely payments are rewarded, e.g. by a % reduction for the next year.
Just before Septic tank construct
inspection chamber with in
premises and bypass the existing
septic tank
CITY SANITATION PLAN Gulbarga
ADMINISTRATIVE STAFF COLLEGE OF INDIA, HYDERABAD 159 | P a g e
IV. COSTS PER HOUSEHOLD
1. Cost of laying pipes = Rs.80 X 6 = Rs.480
(Considering 80’ max. pipe length and @ Rs.6/ft of pipe)
2. Cost of materials = Rs.1000 (inspection chambers & bricks and cement)
3. Cost of labor = Rs.1000
4. Therefore the total cost of laying pipes = Rs.2500
5. Connection cost/HH = Rs.3800 or Rs2000
6. Total max. cost per HH = Rs.6300 or Rs4300
V. OPERATION AND MAINTENANCE
As of now UGD is not operational and as such there are no O &M activities at present. A
sewerage system as it is known collects wastewater from residences, industries, hospitals and
commercial institutions for conveyance to STPs for treatment and safe disposal. Any obstruction
or overloading of the collection system can have dramatic consequences on public health and
the environment.
It is the responsibility of the City Corporation, to ensure that the performance of the proposed
sewerage system is not compromised in any manner by adopting proper practices of operation
and maintenance of the system. Effective O&M of an underground sewerage scheme is critical
and the direct responsibility rests with the CCG. For ease of operation and maintenance, the
proposed sewerage system has to be of locally available materials, skilled manpower and easily
available mechanical/electrical equipment.
The primary aim of sewage treatment plant‘s (STP) operation and maintenance (O&M), is the
running and maintenance the plant, efficiently and economically, so that the effluent from the
plant meets the prescribed standards in terms of BOD,SS and fecal coliforms laid down by the
local body or the pollution control board while discharging the effluent on land or into water
body.
The basic requirements of successful O&M of STP are:
1. A thorough knowledge of plant and machinery and equipment provided in the STP
and their functions,
2. A thorough knowledge of the processes,
3. Proper and adequate tools,
4. Adequate stock of spare parts and chemical,
5. Assignment of specific responsibilities to operating staff,
6. Schedule of daily preventive maintenance,
7.Systematic and period inspection,
8.Training of all operating staff in operating procedures and maintenance practices,
9.Maintaining records of key activities and operating logs of equipment, and
CITY SANITATION PLAN Gulbarga
ADMINISTRATIVE STAFF COLLEGE OF INDIA, HYDERABAD 160 | P a g e
10. Good housekeeping.
VI. REQUIREMENTS OF MAINTENANCE OF SEWER
As huge investment are generally made for the implementation of the sewerage system, it is
appropriate to operate and maintain the system effectively in order to derive maximum benefit
of the investment. Maintenance of sewer system depends not only on proper design and
construction but also on the availability of competent staff for their operation.
The requirements of the maintenance of the sewerage system are:
1. Protect the sewerage system against damaging materials, which may be discharged
by the public, commercial and industrial institution.
2. Prevent the sewerage system from clogging due to deposition of solids as a result of
inadequate flow
3. Prevent the accumulation of foul gases in the sewerage system due to the anaerobic
decomposition of the deposited solids
4. Save the workers involved in the sewer cleaning from death due to obnoxious gases.
The preventive maintenance methods to achieve the above requirement are:
Ensure self-cleaning velocity in all section of the sewerage system at least once in a day for
prevention of clogging in the sewerage system. The sewer section where it is not possible to
obtain the self-cleansing velocities due to flatness of the gradient especially in the head reaches
of the sewer network, flushing is necessary.
The O&M of the created infrastructure includes manning and maintenance of the STPs, power
charges for the pumping stations, manning for the maintenance of the network, maintenance
and repairs of the sewer cleaning machinery and equipment, administrative expenditure
involved in billing and collection of sewerage cess etc. Also the sewer lines between two
successive manholes should be periodically inspected using intrusive equipments &
arrangement for silting and blockages. The revenue from the sewerage sector is mainly from the
charges being collected while giving new sewerage connection and drainage cess collected along
with house tax.
VII. REUSE OF RECYCLED WATER
Decentralized wastewater systems collect, treat, and reuse or dispose of wastewater at or near
its point of generation. It includes systems that treat wastewater from individual homes or
buildings as well as cluster systems that treat wastewater from groups of two or more houses.
Unlike centralized urban wastewater treatment systems, decentralized systems treat
wastewater close to the source, typically using small pipes for collecting small volumes of
domestic wastewater.. Following guidelines need to be followed for application of sewage
water.
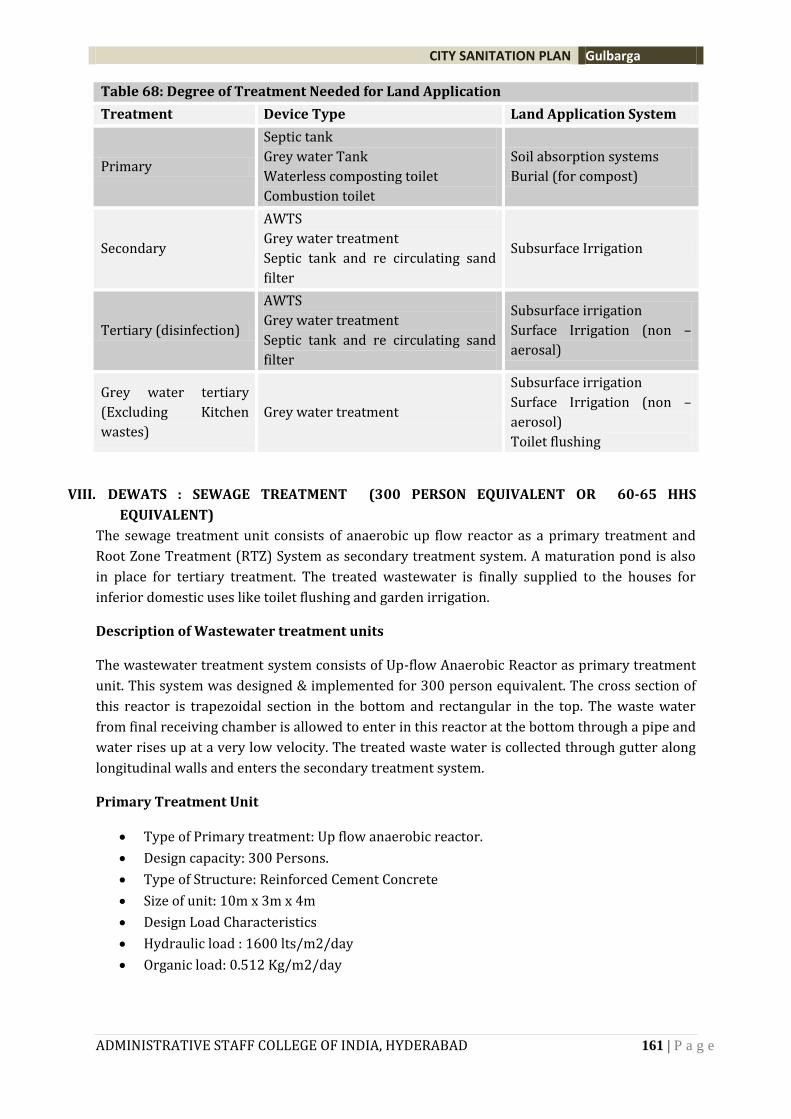
CITY SANITATION PLAN Gulbarga
ADMINISTRATIVE STAFF COLLEGE OF INDIA, HYDERABAD 161 | P a g e
Table 68: Degree of Treatment Needed for Land Application
Treatment Device Type Land Application System
Primary
Septic tank
Grey water Tank
Waterless composting toilet
Combustion toilet
Soil absorption systems
Burial (for compost)
Secondary
AWTS
Grey water treatment
Septic tank and re circulating sand
filter
Subsurface Irrigation
Tertiary (disinfection)
AWTS
Grey water treatment
Septic tank and re circulating sand
filter
Subsurface irrigation
Surface Irrigation (non –
aerosal)
Grey water tertiary
(Excluding Kitchen
wastes)
Grey water treatment
Subsurface irrigation
Surface Irrigation (non –
aerosol)
Toilet flushing
VIII. DEWATS : SEWAGE TREATMENT (300 PERSON EQUIVALENT OR 60-65 HHS
EQUIVALENT)
The sewage treatment unit consists of anaerobic up flow reactor as a primary treatment and
Root Zone Treatment (RTZ) System as secondary treatment system. A maturation pond is also
in place for tertiary treatment. The treated wastewater is finally supplied to the houses for
inferior domestic uses like toilet flushing and garden irrigation.
Description of Wastewater treatment units
The wastewater treatment system consists of Up-flow Anaerobic Reactor as primary treatment
unit. This system was designed & implemented for 300 person equivalent. The cross section of
this reactor is trapezoidal section in the bottom and rectangular in the top. The waste water
from final receiving chamber is allowed to enter in this reactor at the bottom through a pipe and
water rises up at a very low velocity. The treated waste water is collected through gutter along
longitudinal walls and enters the secondary treatment system.
Primary Treatment Unit
Type of Primary treatment: Up flow anaerobic reactor.
Design capacity: 300 Persons.
Type of Structure: Reinforced Cement Concrete
Size of unit: 10m x 3m x 4m
Design Load Characteristics
Hydraulic load : 1600 lts/m2/day
Organic load: 0.512 Kg/m2/day
CITY SANITATION PLAN Gulbarga
ADMINISTRATIVE STAFF COLLEGE OF INDIA, HYDERABAD 162 | P a g e
Actual Load Characteristics
Hydraulic load: 160 lts/m2/day (As per Standards)
Hydraulic load: 177 lts/m2/day (As per Actual measurement before commissioning of
recycling system)
Hydraulic load: 81 lts/m2/day (As per Actual measurement after commissioning of
recycling system)
Organic Load (Maximum): 0.037 Kg/m2/day (As per Actual measurement before
commissioning of recycling system)
Organic Load (Maximum): 0.011 Kg/m2/day (As per Actual measurement after
commissioning of recycling system)
1. Volume: 114 m3
2. Cross sectional area: 12m2
3. Longitudinal Sectional area at the centre: 40m2
Secondary Treatment Unit
The wastewater treatment systems consists of Horizontal root zone system as secondary
treatment which receives partly treated wastewater from primary treatment unit.
Horizontal Root Zone Treatment Unit
The secondary treatment units are implemented in Phase level hence the first level is designed
for 50 persons. In the root zone treatment, wastewater passes through filter bed by uniform
horizontal flow. Root zone treatment are sealed filter beds consisting of sand, gravel and soil
system, occasionally with a cohesive element, planted with vegetation which can grow in
wetlands. The wastewater passes through the filter bed where biodegradation of the
wastewater takes place.
Root Zone Treatment system
Type of treatment system: Horizontal Root Zone treatment.
Type of Structure: Reinforced Concrete floor with Brick walls.
Size of Unit: 10m X 5m X 1.2m
Design Load Characteristics
1. Hydraulic load: 160 lts/m2/day
2. Organic load: 0.024 Kg/m2/day
Actual Load Characteristics
Hydraulic load: 106 lts /m2/day (As per Actual measurement before commissioning of
recycling system)
Hydraulic load: 49 lts /m2/day (As per Actual measurement after commissioning of
recycling system)
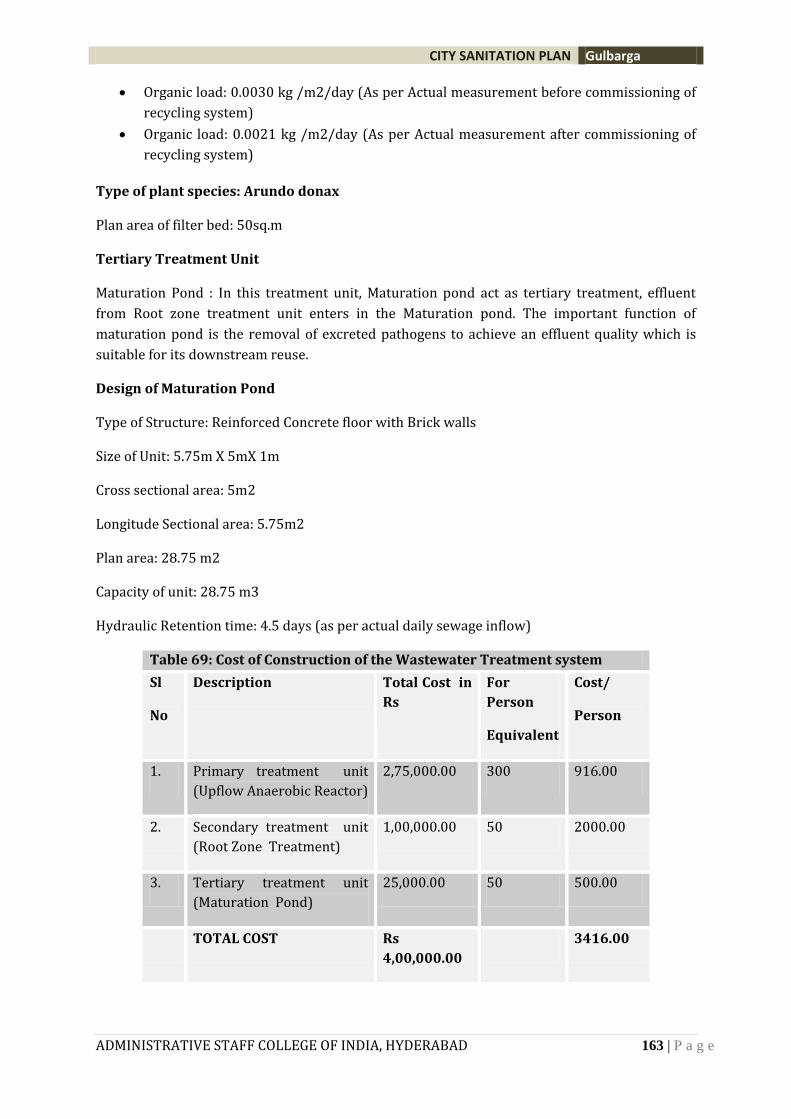
CITY SANITATION PLAN Gulbarga
ADMINISTRATIVE STAFF COLLEGE OF INDIA, HYDERABAD 163 | P a g e
Organic load: 0.0030 kg /m2/day (As per Actual measurement before commissioning of
recycling system)
Organic load: 0.0021 kg /m2/day (As per Actual measurement after commissioning of
recycling system)
Type of plant species: Arundo donax
Plan area of filter bed: 50sq.m
Tertiary Treatment Unit
Maturation Pond : In this treatment unit, Maturation pond act as tertiary treatment, effluent
from Root zone treatment unit enters in the Maturation pond. The important function of
maturation pond is the removal of excreted pathogens to achieve an effluent quality which is
suitable for its downstream reuse.
Design of Maturation Pond
Type of Structure: Reinforced Concrete floor with Brick walls
Size of Unit: 5.75m X 5mX 1m
Cross sectional area: 5m2
Longitude Sectional area: 5.75m2
Plan area: 28.75 m2
Capacity of unit: 28.75 m3
Hydraulic Retention time: 4.5 days (as per actual daily sewage inflow)
Table 69: Cost of Construction of the Wastewater Treatment system
Sl
No
Description Total Cost in
Rs
For
Person
Equivalent
Cost/
Person
1. Primary treatment unit
(Upflow Anaerobic Reactor)
2,75,000.00 300 916.00
2. Secondary treatment unit
(Root Zone Treatment)
1,00,000.00 50 2000.00
3. Tertiary treatment unit
(Maturation Pond)
25,000.00 50 500.00
TOTAL COST Rs
4,00,000.00
3416.00
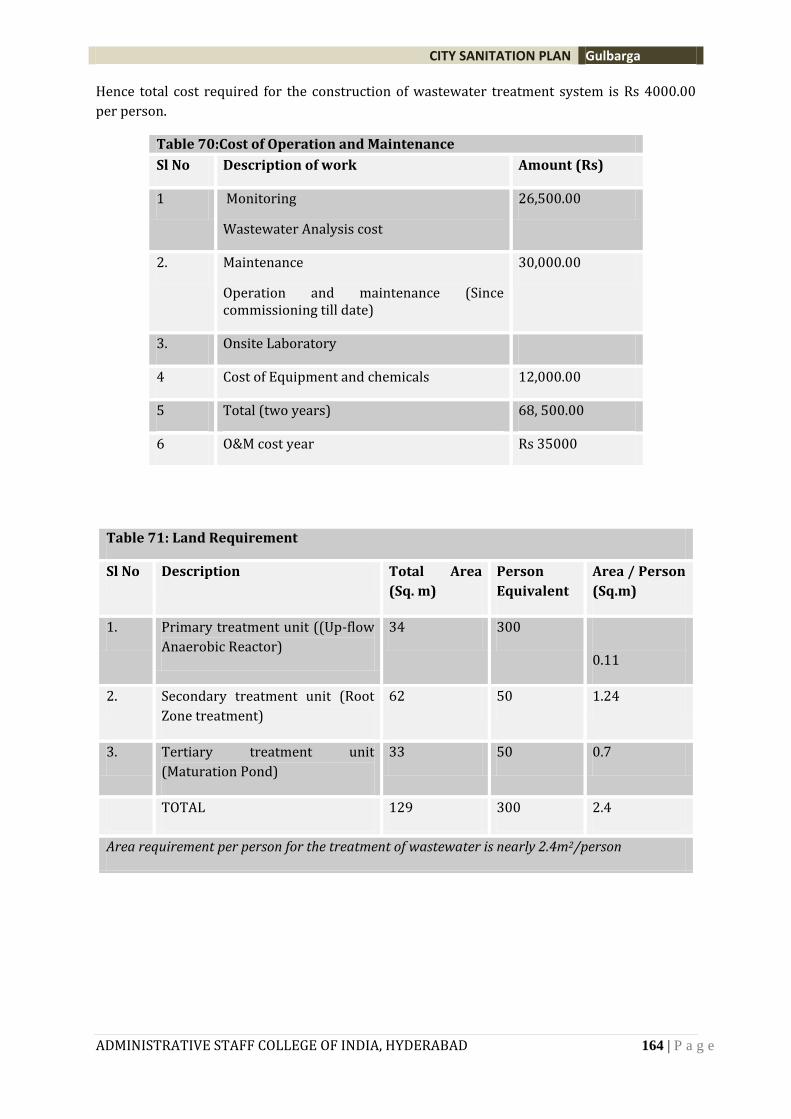
CITY SANITATION PLAN Gulbarga
ADMINISTRATIVE STAFF COLLEGE OF INDIA, HYDERABAD 164 | P a g e
Hence total cost required for the construction of wastewater treatment system is Rs 4000.00
per person.
Table 70:Cost of Operation and Maintenance
Sl No Description of work Amount (Rs)
1 Monitoring
Wastewater Analysis cost
26,500.00
2. Maintenance
Operation and maintenance (Since commissioning till date)
30,000.00
3. Onsite Laboratory
4 Cost of Equipment and chemicals 12,000.00
5 Total (two years) 68, 500.00
6 O&M cost year Rs 35000
Table 71: Land Requirement
Sl No Description Total Area
(Sq. m)
Person
Equivalent
Area / Person
(Sq.m)
1. Primary treatment unit ((Up-flow
Anaerobic Reactor)
34 300
0.11
2. Secondary treatment unit (Root
Zone treatment)
62 50 1.24
3. Tertiary treatment unit
(Maturation Pond)
33 50 0.7
TOTAL 129 300 2.4
Area requirement per person for the treatment of wastewater is nearly 2.4m2/person
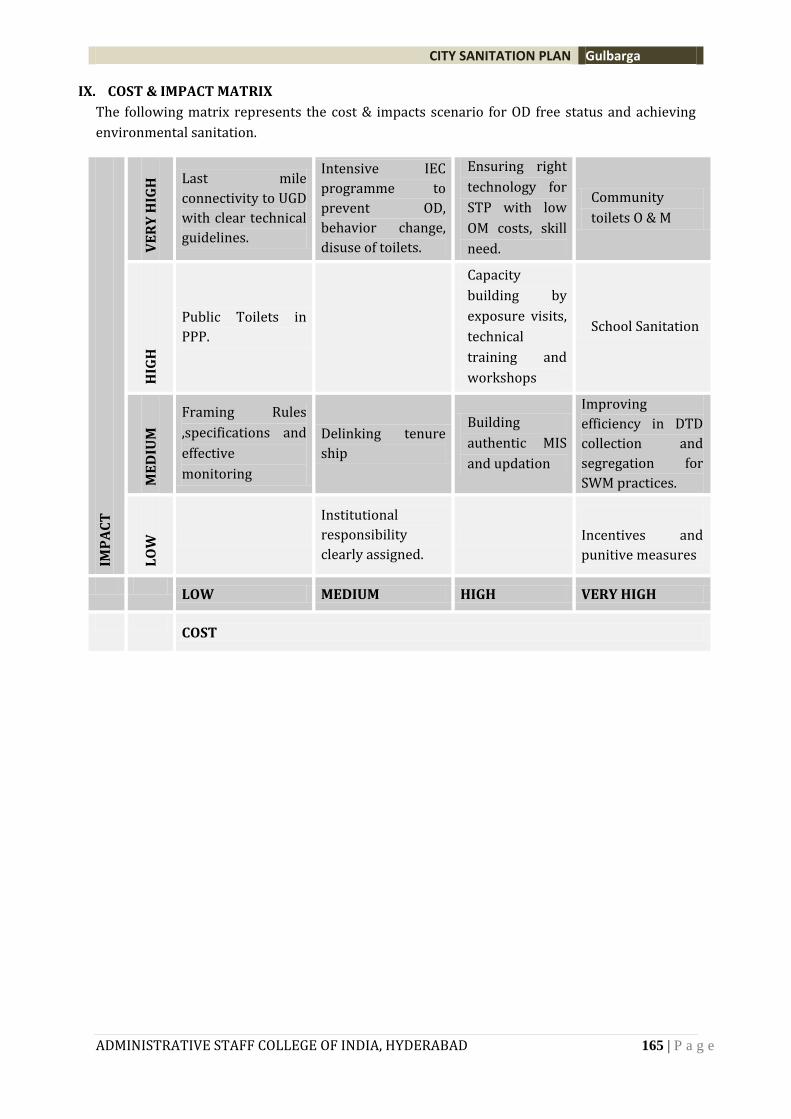
CITY SANITATION PLAN Gulbarga
ADMINISTRATIVE STAFF COLLEGE OF INDIA, HYDERABAD 165 | P a g e
IX. COST & IMPACT MATRIX
The following matrix represents the cost & impacts scenario for OD free status and achieving
environmental sanitation.
IMP
AC
T
VE
RY
HIG
H Last mile
connectivity to UGD
with clear technical
guidelines.
Intensive IEC
programme to
prevent OD,
behavior change,
disuse of toilets.
Ensuring right
technology for
STP with low
OM costs, skill
need.
Community
toilets O & M
HIG
H
Public Toilets in
PPP.
Capacity
building by
exposure visits,
technical
training and
workshops
School Sanitation
ME
DIU
M
Framing Rules
,specifications and
effective
monitoring
Delinking tenure
ship
Building
authentic MIS
and updation
Improving
efficiency in DTD
collection and
segregation for
SWM practices.
LO
W
Institutional
responsibility
clearly assigned.
Incentives and
punitive measures
LOW MEDIUM HIGH VERY HIGH
COST
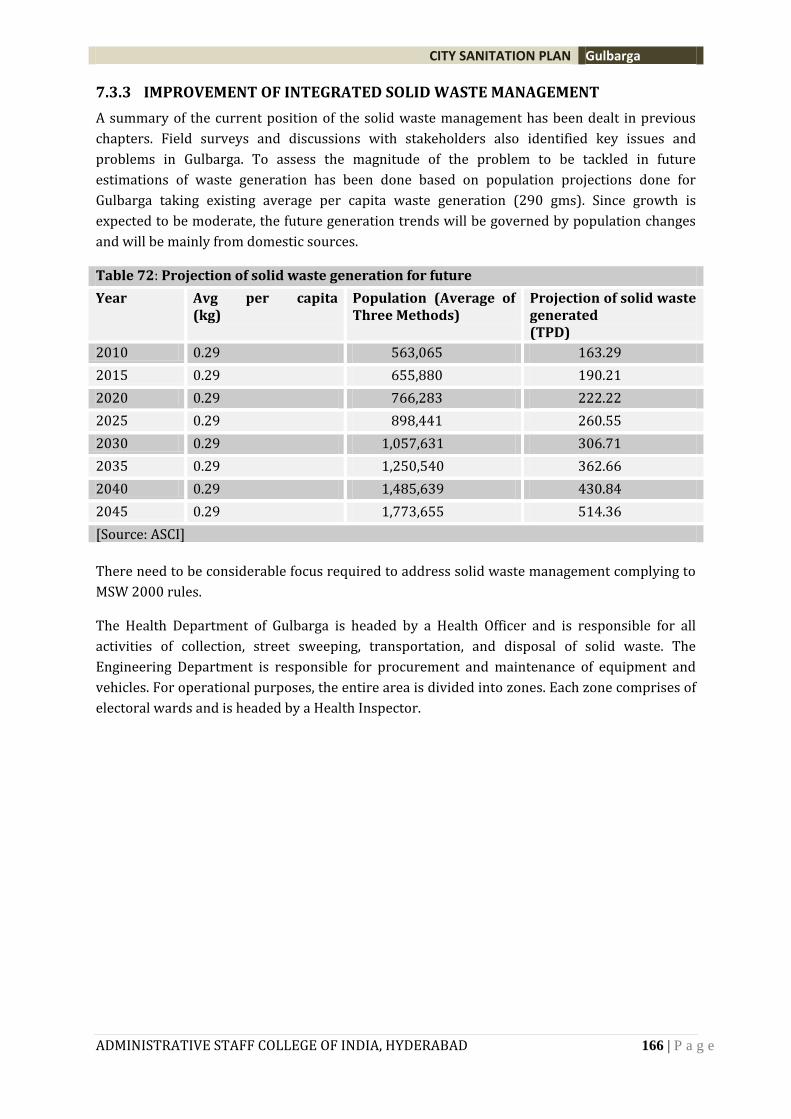
CITY SANITATION PLAN Gulbarga
ADMINISTRATIVE STAFF COLLEGE OF INDIA, HYDERABAD 166 | P a g e
7.3.3 IMPROVEMENT OF INTEGRATED SOLID WASTE MANAGEMENT
A summary of the current position of the solid waste management has been dealt in previous
chapters. Field surveys and discussions with stakeholders also identified key issues and
problems in Gulbarga. To assess the magnitude of the problem to be tackled in future
estimations of waste generation has been done based on population projections done for
Gulbarga taking existing average per capita waste generation (290 gms). Since growth is
expected to be moderate, the future generation trends will be governed by population changes
and will be mainly from domestic sources.
Table 72: Projection of solid waste generation for future
Year Avg per capita (kg)
Population (Average of Three Methods)
Projection of solid waste generated (TPD)
2010 0.29 563,065 163.29
2015 0.29 655,880 190.21
2020 0.29 766,283 222.22
2025 0.29 898,441 260.55
2030 0.29 1,057,631 306.71
2035 0.29 1,250,540 362.66
2040 0.29 1,485,639 430.84
2045 0.29 1,773,655 514.36
[Source: ASCI]
There need to be considerable focus required to address solid waste management complying to
MSW 2000 rules.
The Health Department of Gulbarga is headed by a Health Officer and is responsible for all
activities of collection, street sweeping, transportation, and disposal of solid waste. The
Engineering Department is responsible for procurement and maintenance of equipment and
vehicles. For operational purposes, the entire area is divided into zones. Each zone comprises of
electoral wards and is headed by a Health Inspector.
CITY SANITATION PLAN Gulbarga
ADMINISTRATIVE STAFF COLLEGE OF INDIA, HYDERABAD 167 | P a g e
A systematic action plan for maintaining solid waste management while achieving each recommendation as outlined below:
Table 73: ISWM Action Plan
Recommendation Strategy to be adopted Actions Possible Constraints
1 Achieving benchmark
cleanliness (following SLB
indicators and parameter
in Sanitation rankings in
phases )
Establish work norms (per worker)
for roads (both congested and
wide), open spaces.
Regularize sanitary worker
attendance by biometric system.
Encourage successes of visible clean
areas.
Involve Corporators and a few other
who will support such efforts in
their Wards.
Promote clean wards/slums/Colony etc. by
well-planned door to door collection.
Increased involvement of NGOs/Private
operators etc.
Good working conditions and recognition
mechanisms for workforce.
Increasing efficiency and
productivity of existing
staff.
Possible protest from
employees.
2 Source segregation of
waste into specified types
Maximum recycling and maximum
local composting of bio-degradable
waste.
Provide separate collection
mechanism for Bulk Waste
Producers, Construction waste /
Debris, Garden/ Green Waste.
Overall training and capacity
building of MSW personnel in order
to achieve segregation of solid waste
at source.
Good communication and
awareness programme.
Promote source segregation by keeping “wet” &
“dry” wastes separately, doorstep collection of
“wet” waste for bulk waste producers with extra
rates, to compost all bio – degradable and recycle
dry wastes.
Associate with trade & industry associations for
better marketing to segregate recyclable
material
Give priority to the source segregation of
recyclable waste by shops and establishments
and later concentrate on segregation at the
3household level.
Targeting behaviour
change of households.
Increased public health
and hygiene levels
CITY SANITATION PLAN Gulbarga
ADMINISTRATIVE STAFF COLLEGE OF INDIA, HYDERABAD 168 | P a g e
3 Minimizing ,primary
collection, transport and
handling costs per ton
Encourage PPP and out sourcing. Reduce expenditure on collection per household
by imposing user charges @ Rs.one per day),
encourage source segregation and reduce waste
reduction to at least 15%.Planning and
optimizing vehicle routing with robust MIS and
waste generation data base.
Introduction of GPS and monitoring of MSW
vehicles in a centralized locality.
4 Management Information
Systems
Regular reporting and data
updating.
Appropriate division of roles and
responsibilities.
Developing information base on :
Daily/weekly/monthly reports at
town/ward/zone level.
Spatial and seasonal waste generation quantities
and nature (Ward-wise waste), collection points
linking to GIS, asset inventory, category wise
waste generation, number of workers in each
ward for collection, transportation and disposal.
Recording weigh-bridge on-site
Number of staff and expected clearance
frequencies.
Funds and leadership
5 Levy user charges Polluter pays principle and a policy
on SWM user charges.
Simple procedures and strict
enforcement of regulations.
Share MSW information with the
Public.
Display boards with details of MSW in specific
area including Contractor’s phone number on
the dustbins to be cleared by them and specify
how residents can handover waste to municipal
body.
Charges for business or trade, eating-houses or
hostels, health-care facilities, shops, offices,
street-food, fairs and exhibitions and
ceremonies.
Avoid NIMBY by sanitizing all wastes near point
of collection until composting commence.
Lack of political will.
CITY SANITATION PLAN Gulbarga
ADMINISTRATIVE STAFF COLLEGE OF INDIA, HYDERABAD 169 | P a g e
6 Advanced locality
Management (ALM)
Strong citizen’s group to work closely
with ULB to develop strategy and
improve ISWM as well as other civic
amenities in their local area.
Organize citizen meeting in neighbourhood and
explain concept of ALM through public meetings.
Select ALM committee from all representative
building, lanes etc.
7 Promoting Public Private
Participation (PPP)
Performance improvement criteria
based contracting system.
Enhancing the strength of ULBs and ability of
engaged contractors to perform.
Take up pilot in newly developed areas, under-
served areas and particularly in the areas where
local bodies have not been providing service
through their own labour force.
PPP can be considered in:
D2D collection of household waste, commercial
waste, hospital waste, hotel waste, construction
waste and market waste.
Setting-up, operation and maintenance of waste
disposal facility, operation and maintenance of
waste treatment or processing plants.
Supplying refuse collection vehicles on lease,
repairs and maintenance of vehicles at a private
garage, transportation of waste on contractual
basis, etc.
Lack of credible
information
Inadequate internal
capacities to monitor
private operator
8 Selection of treatment
technologies.
Developing environmentally
sustainable models especially in
disposal e.g. scientific landfills (SLFs).
Setup expert committee. Coordination and Internal
capacities issues.
CITY SANITATION PLAN Gulbarga
ADMINISTRATIVE STAFF COLLEGE OF INDIA, HYDERABAD 170 | P a g e
7.3.4 IMPROVEMENT OF STORM WATER MANAGEMENT IN GULBARGA
The existing situation of the storm water drainage network has already been discussed at length
in. There are a couple of areas wherein there are instances of water logging during the rainy
seasons. These areas get quite seriously affected during such times. Following are some
strategies that may be adopted to improve these areas by a large extent.
Suggested strategies for storm water management
Identifying the water logged areas and their frequency of water logging. As a short term
plan rehabilitation of drains in those areas can be taken on priority.
Considering the existing problems of water logging in rainy seasons, the use of the
debris generating from civil works like road constructions and construction sites can be
utilized as infilling in the low lying areas where water accumulates during rainy seasons,
however, proper treatment of compaction and execution is essential on such sites. These
works can be taken up as short term measures.
There should be immediate provision made in order to stop mixing of solid waste into
open drains so as to prevent choking of drains
Augmenting the existing drainage network by converting existing Kachha drains into
pucca drains by providing proper cross sections along the running length of the roads.
Construction of new drainage channels (covered) along the roads where there is no
provision of drainage system should be taken up based on detail surveys
Disposing the collected water safely into identified areas. The existing lakes can be
considered for discharging the surface water and storm water. Development of
collection and conveyance system for storm water is suggested as a midterm which will
discharge the water into existing lakes or water bodies and will help recharging and
rejuvenating the existing lakes which at present are drying due to climatic changes.
Considering options for Rain water harvesting suitable to city context. It can be
recommended in the building regulations and bye-laws for newly developing areas,
residential colonies and institutional campuses to develop rain water harvesting system.
CITY SANITATION PLAN Gulbarga
ADMINISTRATIVE STAFF COLLEGE OF INDIA, HYDERABAD 171 | P a g e
7.4. ENABLING AND SUSTAINING STRATEGIES
7.4.1 AWARENESS RAISING, HYGIENE PROMOTION AND COMMUNITY PARTICIPATION.
The first step in making cities 100% sanitized is to elevate the consciousness about sanitation
in the mind of municipal agencies, government agencies and most importantly, amongst the
people of the city. The policy also aims to transform cities into totally sanitized, healthy and
livable cities and towns. This can be achieved only by:
Generating awareness amongst households and institutions about sanitation and its
linkages with public and environmental health;
Promoting mechanisms to bring about and sustain behavioral changes aimed at
adoption of healthy sanitation practices;
There needs to be considerable engagement with households and communities on changing
mindsets, and understanding incentives to change behavior and practices. A communication
strategy has been drafted to create support for and facilitate effective implementation of city-
wide, demand-based sanitation programs; and for generating awareness amongst urban
households on sanitation and its linkages with health, economic productivity and the
environment along with facilitating behavior change towards adoption of safe sanitation
practices among households.
One reason for the low support to sanitation is that opinion leaders, policy makers and
managers do not see the links between sanitation, public health and economics. The first step in
making cities 100% sanitized is to elevate the consciousness about sanitation in the mind of
municipal agencies, government agencies and most importantly, amongst the people of the city.
ULBs are in the frontline of implementation and have a key role in ensuring sanitation and
should focus on demand responsive approach. To meet this challenge a systematic
“Communication Need Assessment (CNA)” for different Target Groups has been taken up as part
of CSP and objective of well driven IEC is for sanitation to be demand-driven with social
marketing approaches to increase demand for toilets and ensure hygiene behaviors, promote no
subsidies for household toilets in future and encourage diversity in technology and design.
ULBs are in the frontline of implementation and have a key role in ensuring sanitation and
should focus on demand responsive approach. State government should ensure support to ULBs
in providing enabling environment in all respects and provide communication and awareness
strategy. The following table details out IEC and advocacy plan in achieving desired goals of
environmental sanitation:
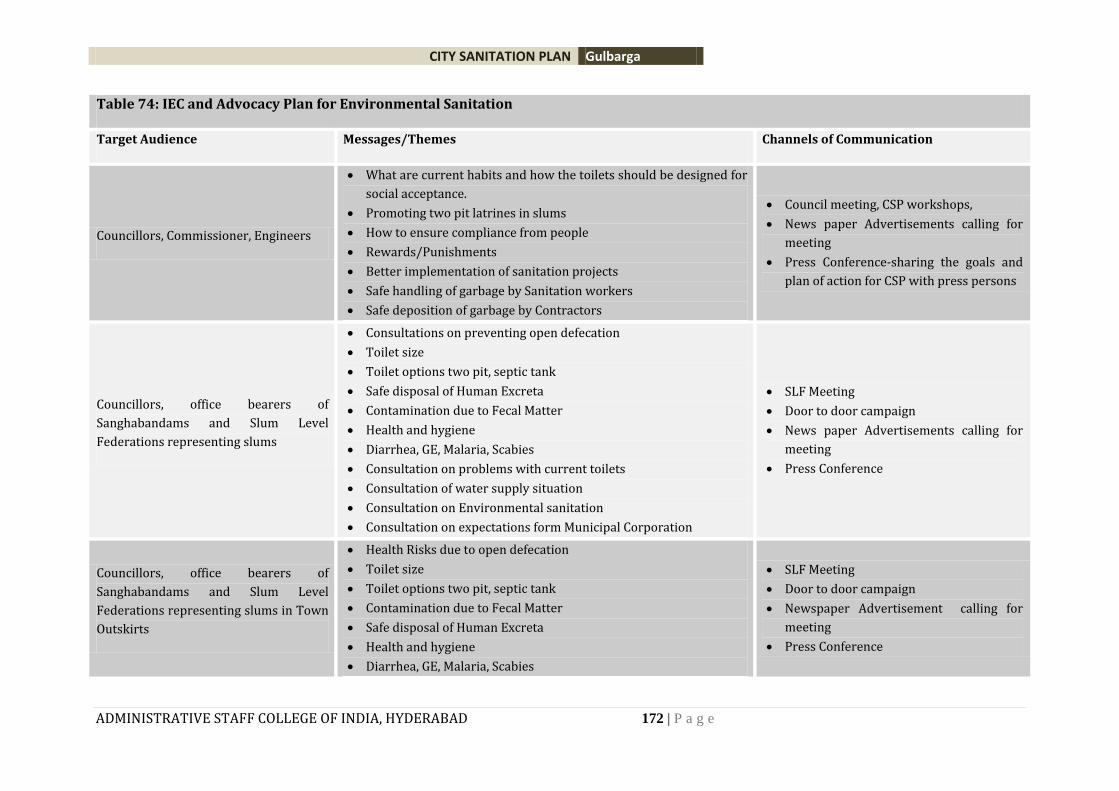
CITY SANITATION PLAN Gulbarga
ADMINISTRATIVE STAFF COLLEGE OF INDIA, HYDERABAD 172 | P a g e
Table 74: IEC and Advocacy Plan for Environmental Sanitation
Target Audience Messages/Themes Channels of Communication
Councillors, Commissioner, Engineers
What are current habits and how the toilets should be designed for
social acceptance.
Promoting two pit latrines in slums
How to ensure compliance from people
Rewards/Punishments
Better implementation of sanitation projects
Safe handling of garbage by Sanitation workers
Safe deposition of garbage by Contractors
Council meeting, CSP workshops,
News paper Advertisements calling for
meeting
Press Conference-sharing the goals and
plan of action for CSP with press persons
Councillors, office bearers of
Sanghabandams and Slum Level
Federations representing slums
Consultations on preventing open defecation
Toilet size
Toilet options two pit, septic tank
Safe disposal of Human Excreta
Contamination due to Fecal Matter
Health and hygiene
Diarrhea, GE, Malaria, Scabies
Consultation on problems with current toilets
Consultation of water supply situation
Consultation on Environmental sanitation
Consultation on expectations form Municipal Corporation
SLF Meeting
Door to door campaign
News paper Advertisements calling for
meeting
Press Conference
Councillors, office bearers of
Sanghabandams and Slum Level
Federations representing slums in Town
Outskirts
Health Risks due to open defecation
Toilet size
Toilet options two pit, septic tank
Contamination due to Fecal Matter
Safe disposal of Human Excreta
Health and hygiene
Diarrhea, GE, Malaria, Scabies
SLF Meeting
Door to door campaign
Newspaper Advertisement calling for
meeting
Press Conference
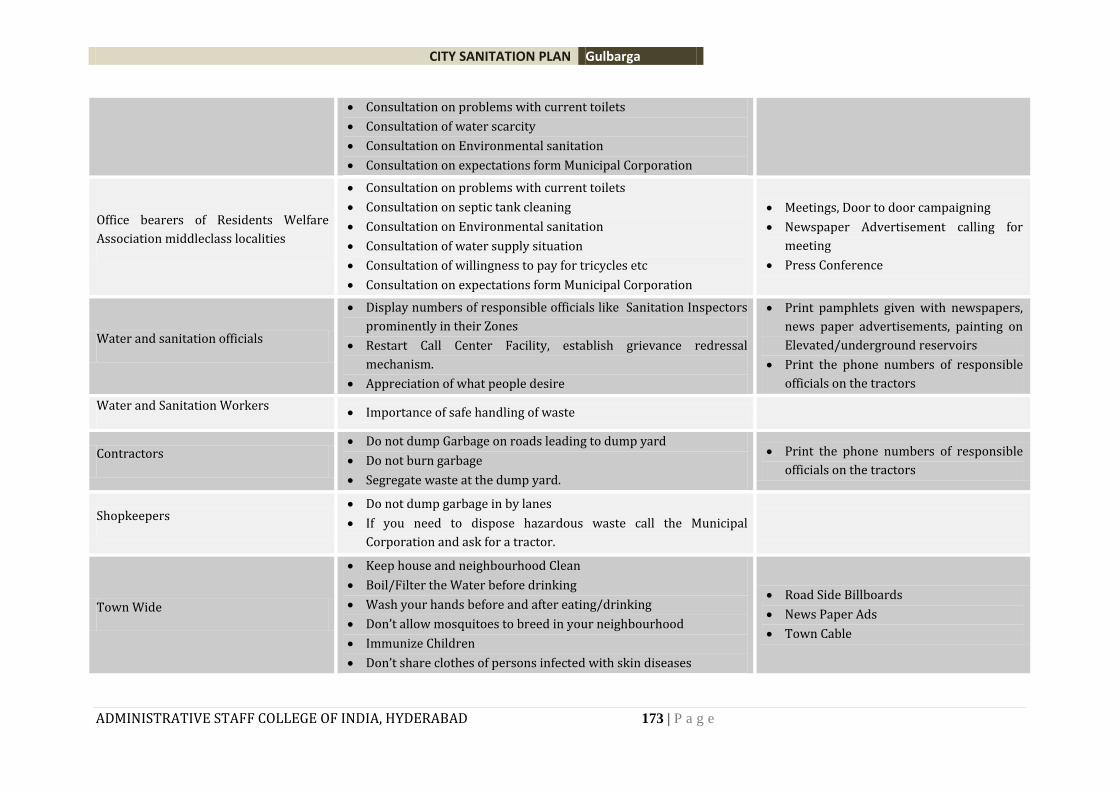
CITY SANITATION PLAN Gulbarga
ADMINISTRATIVE STAFF COLLEGE OF INDIA, HYDERABAD 173 | P a g e
Consultation on problems with current toilets
Consultation of water scarcity
Consultation on Environmental sanitation
Consultation on expectations form Municipal Corporation
Office bearers of Residents Welfare
Association middleclass localities
Consultation on problems with current toilets
Consultation on septic tank cleaning
Consultation on Environmental sanitation
Consultation of water supply situation
Consultation of willingness to pay for tricycles etc
Consultation on expectations form Municipal Corporation
Meetings, Door to door campaigning
Newspaper Advertisement calling for
meeting
Press Conference
Water and sanitation officials
Display numbers of responsible officials like Sanitation Inspectors
prominently in their Zones
Restart Call Center Facility, establish grievance redressal
mechanism.
Appreciation of what people desire
Print pamphlets given with newspapers,
news paper advertisements, painting on
Elevated/underground reservoirs
Print the phone numbers of responsible
officials on the tractors
Water and Sanitation Workers Importance of safe handling of waste
Contractors Do not dump Garbage on roads leading to dump yard
Do not burn garbage
Segregate waste at the dump yard.
Print the phone numbers of responsible
officials on the tractors
Shopkeepers Do not dump garbage in by lanes
If you need to dispose hazardous waste call the Municipal
Corporation and ask for a tractor.
Town Wide
Keep house and neighbourhood Clean
Boil/Filter the Water before drinking
Wash your hands before and after eating/drinking
Don’t allow mosquitoes to breed in your neighbourhood
Immunize Children
Don’t share clothes of persons infected with skin diseases
Road Side Billboards
News Paper Ads
Town Cable
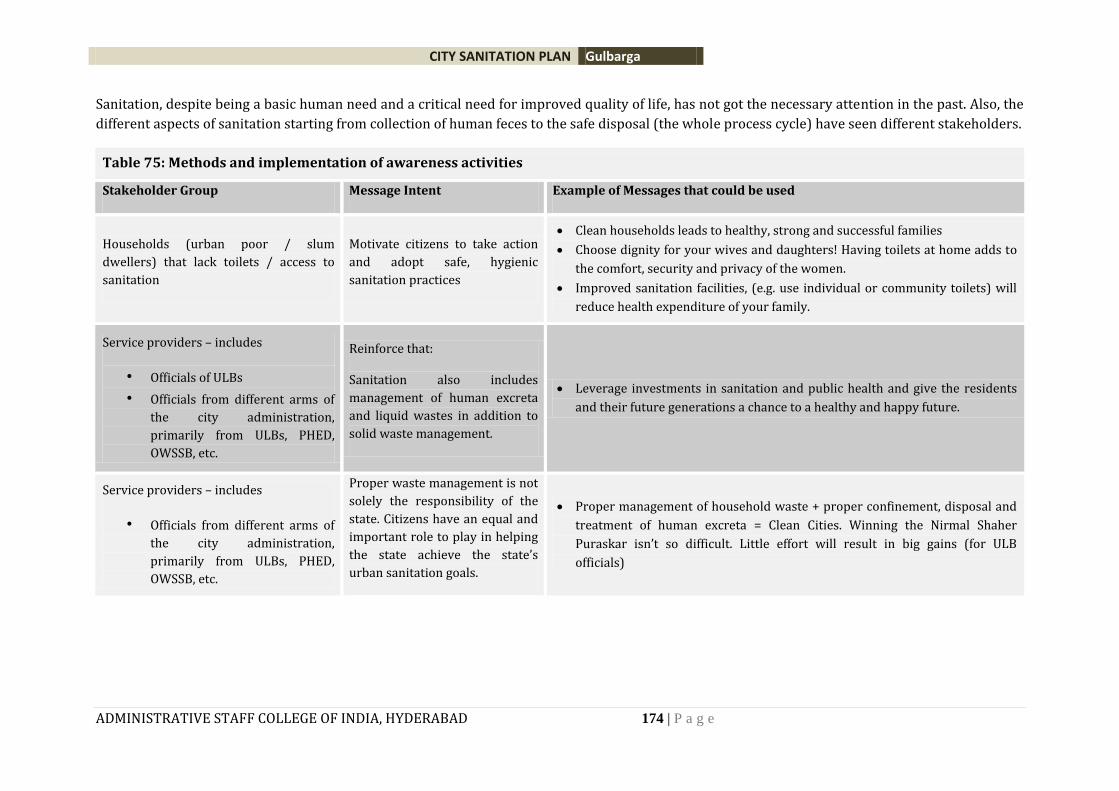
CITY SANITATION PLAN Gulbarga
ADMINISTRATIVE STAFF COLLEGE OF INDIA, HYDERABAD 174 | P a g e
Sanitation, despite being a basic human need and a critical need for improved quality of life, has not got the necessary attention in the past. Also, the
different aspects of sanitation starting from collection of human feces to the safe disposal (the whole process cycle) have seen different stakeholders.
Table 75: Methods and implementation of awareness activities
Stakeholder Group Message Intent Example of Messages that could be used
Households (urban poor / slum
dwellers) that lack toilets / access to
sanitation
Motivate citizens to take action
and adopt safe, hygienic
sanitation practices
Clean households leads to healthy, strong and successful families
Choose dignity for your wives and daughters! Having toilets at home adds to
the comfort, security and privacy of the women.
Improved sanitation facilities, (e.g. use individual or community toilets) will
reduce health expenditure of your family.
Service providers – includes
• Officials of ULBs
• Officials from different arms of
the city administration,
primarily from ULBs, PHED,
OWSSB, etc.
Reinforce that:
Sanitation also includes
management of human excreta
and liquid wastes in addition to
solid waste management.
Leverage investments in sanitation and public health and give the residents
and their future generations a chance to a healthy and happy future.
Service providers – includes
• Officials from different arms of
the city administration,
primarily from ULBs, PHED,
OWSSB, etc.
Proper waste management is not
solely the responsibility of the
state. Citizens have an equal and
important role to play in helping
the state achieve the state’s
urban sanitation goals.
Proper management of household waste + proper confinement, disposal and
treatment of human excreta = Clean Cities. Winning the Nirmal Shaher
Puraskar isn’t so difficult. Little effort will result in big gains (for ULB
officials)
CITY SANITATION PLAN Gulbarga
ADMINISTRATIVE STAFF COLLEGE OF INDIA, HYDERABAD 175 | P a g e
Politicians
Helping provide basic needs like
sanitation will strengthen your
popularity with your
constituents and could further
improve political mandate
Improve the quality of life of your constituents by influencing them to adopt
good sanitation practices
There are three important components to the communication strategy
1. Inter-personal communications: Using opinion leaders
2. Engaging media and NGOs as partners in promoting sanitation consciousness
3. Adapting and developing multimedia IEC materials for sanitation campaigns
Interpersonal means are known to be very effective in behavior change communications. These are tedious processes to carry out but offer better
returns. It is important to understand the needs of the local community and select opinion leaders who could influence the community to further
sanitation consciousness. These opinion leaders could be local NGOs, cooperators, school teachers or any other respected elder. A newspaper ad or a
public service message on TV without ground level work through opinion leaders will fail to be sustainable in the long run.
For better targeting a need based IEC actions to be implemented categorized into following phases.
CITY SANITATION PLAN Gulbarga
ADMINISTRATIVE STAFF COLLEGE OF INDIA, HYDERABAD 176 | P a g e
Table 76: Phase wise distribution of works
Phase 1 (1-2 months)
Awareness Raising Phase
Phase 2 (3 months)
Educational Phase:
Phase 3 ( Continuous) Continuing Education -
Action Promotion Phase
Aimed at generating high awareness and a sense of
alarm or concern about the OD, problem situation and
UGD promotion. Consists of easy to grasp messages
(e.g. disease incidences from contaminated water are
rising).
Technical guidance to proper UGD laying.
Short advertisements in various media or
communication channels.
To deepen the knowledge and appreciation of
the target audience. Information and
educational approaches to stress properly
designed septic tanks and periodic septic tank
inspections and desludging every 2- 3 years.
Promotional phase with short campaigns at least
once a year.
Action to dominate.
To trigger the actual adoption of the practices being
marketed.
Organise interactive programmes for effective
implementation of UGD. Organise walks by
children, meeting/workshop with stakeholders eg.
shopkeepers, RWA, NGOs, communities etc.
Institutionalize regular discussion between various
departments for increased co-ordination to further
goals of CSP.
Seeking feedback from Councilors to help effective
implementation.
Media options:
Local Cable TV ads (30 secs)
Local newspaper ads
Billboards
Tarpaulin posters mounted on mobile vans
Leaflets for those attending meetings
News releases in print, radio
and TV
Discussions on radio
Organize interactive programmes for
effective implementation of UGD. Organize
walks by children, meeting/workshop with
stakeholders e.g. shopkeepers, RWA, NGOs,
communities etc.
Institutionalize regular discussion between
various departments for increased co-
ordination to further goals of CSP.
Seeking feedback from Councilors to help
effective implementation.
Media options:
Local Cable TV ads (30 secs)
Local newspaper ads
Billboards
Tarpaulin posters mounted on mobile
vans
Leaflets for those attending meetings
News releases in print, radio
and TV
Organize interactive programmes for effective
implementation of UGD. Organize walks by
children, meeting/workshop with stakeholders
eg. shopkeepers, RWA, NGOs, communities etc.
Institutionalize regular discussion between
various departments for increased co-
ordination to further goals of CSP.
Seeking feedback from Councilors to help
effective implementation.
Media options:
Continuing radio, TV, print ads
Continuing house to house
visits
Continuing short film showing
in theaters
Continuing billboards
Continuing but less frequent
assemblies, SLF meetings
Continuing news releases on all platforms
CITY SANITATION PLAN Gulbarga
ADMINISTRATIVE STAFF COLLEGE OF INDIA, HYDERABAD 177 | P a g e
Discussions on radio Continuing feature articles
Media: TV, Radio, Door to door, billboards,
leaflets. Mass announcements Budget: 3 – 3.5 lakhs / year
CITY SANITATION PLAN Gulbarga
ADMINISTRATIVE STAFF COLLEGE OF INDIA, HYDERABAD 178 | P a g e
7.4.2 FINANCING REQUIREMENTS & MECHANISMS
The financial requirements have been estimated in terms of the need of sanitation situation in
Gulbarga.
Table 77 Financial Requirements and Mechanisms
S. No.
Existing situation
Proposed action / budget head
Number of units (seats) for CSP implementation period (2012-2016)
cost per unit
Total cost
1 No of places of open defecation
Construction of Sulabh toilets for public conveniences
208 100000 2,08,00,000
*2 Construction of Individual toilets
1709 20000 3,41,80,000
3 Construction for community toilets
406 100000 4,06,00,000
Amount in Crores
4 No proper disposal of effluent from toilets
*(a) connection to sewer line or drain 35438 15000
53.15 crores
5 disposal of effluent from septic tanks
*(b)connection to sewer line
6973 20000 13.94crores
6 Recycling and reuse of wastewater
At least 30% wastewater is recycled and reused(70.84)
21.25 1.25 crore 1.25 crores
Solid waste Management in (Quantity) Total quantity Quantity that needs to be
considered
1 DTD collection 100% 20% 100%
2 Composting At least 20% waste should be composted
158.7TPD 31.7TPD
3 Generation of fuel or electricity by waste recycling
at least 5% waste is processed and is used as a fuel
158.7TPD 7.9TPD
4 Recycling and reuse of dry waste
Recycling and reuse of all related waste through rag pickers or through
agencies or NGO
Environment & Awareness
1 Water resources that are polluted Study of water pollution levels and suggestive measure to arrest pollution
25 lakh per
Zone(approx.)
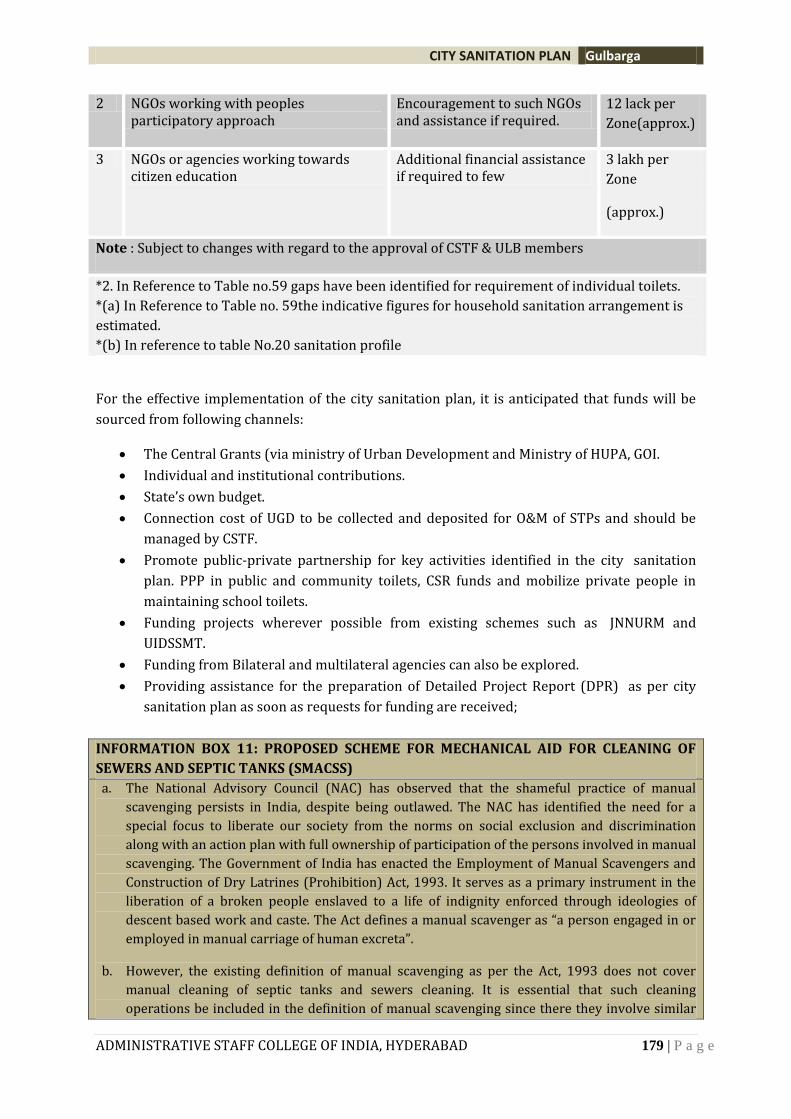
CITY SANITATION PLAN Gulbarga
ADMINISTRATIVE STAFF COLLEGE OF INDIA, HYDERABAD 179 | P a g e
2 NGOs working with peoples participatory approach
Encouragement to such NGOs and assistance if required.
12 lack per
Zone(approx.)
3 NGOs or agencies working towards citizen education
Additional financial assistance if required to few
3 lakh per
Zone
(approx.)
Note : Subject to changes with regard to the approval of CSTF & ULB members
*2. In Reference to Table no.59 gaps have been identified for requirement of individual toilets.
*(a) In Reference to Table no. 59the indicative figures for household sanitation arrangement is
estimated.
*(b) In reference to table No.20 sanitation profile
For the effective implementation of the city sanitation plan, it is anticipated that funds will be
sourced from following channels:
The Central Grants (via ministry of Urban Development and Ministry of HUPA, GOI.
Individual and institutional contributions.
State’s own budget.
Connection cost of UGD to be collected and deposited for O&M of STPs and should be
managed by CSTF.
Promote public-private partnership for key activities identified in the city sanitation
plan. PPP in public and community toilets, CSR funds and mobilize private people in
maintaining school toilets.
Funding projects wherever possible from existing schemes such as JNNURM and
UIDSSMT.
Funding from Bilateral and multilateral agencies can also be explored.
Providing assistance for the preparation of Detailed Project Report (DPR) as per city
sanitation plan as soon as requests for funding are received;
INFORMATION BOX 11: PROPOSED SCHEME FOR MECHANICAL AID FOR CLEANING OF
SEWERS AND SEPTIC TANKS (SMACSS)
a. The National Advisory Council (NAC) has observed that the shameful practice of manual
scavenging persists in India, despite being outlawed. The NAC has identified the need for a
special focus to liberate our society from the norms on social exclusion and discrimination
along with an action plan with full ownership of participation of the persons involved in manual
scavenging. The Government of India has enacted the Employment of Manual Scavengers and
Construction of Dry Latrines (Prohibition) Act, 1993. It serves as a primary instrument in the
liberation of a broken people enslaved to a life of indignity enforced through ideologies of
descent based work and caste. The Act defines a manual scavenger as “a person engaged in or
employed in manual carriage of human excreta”.
b. However, the existing definition of manual scavenging as per the Act, 1993 does not cover
manual cleaning of septic tanks and sewers cleaning. It is essential that such cleaning
operations be included in the definition of manual scavenging since there they involve similar
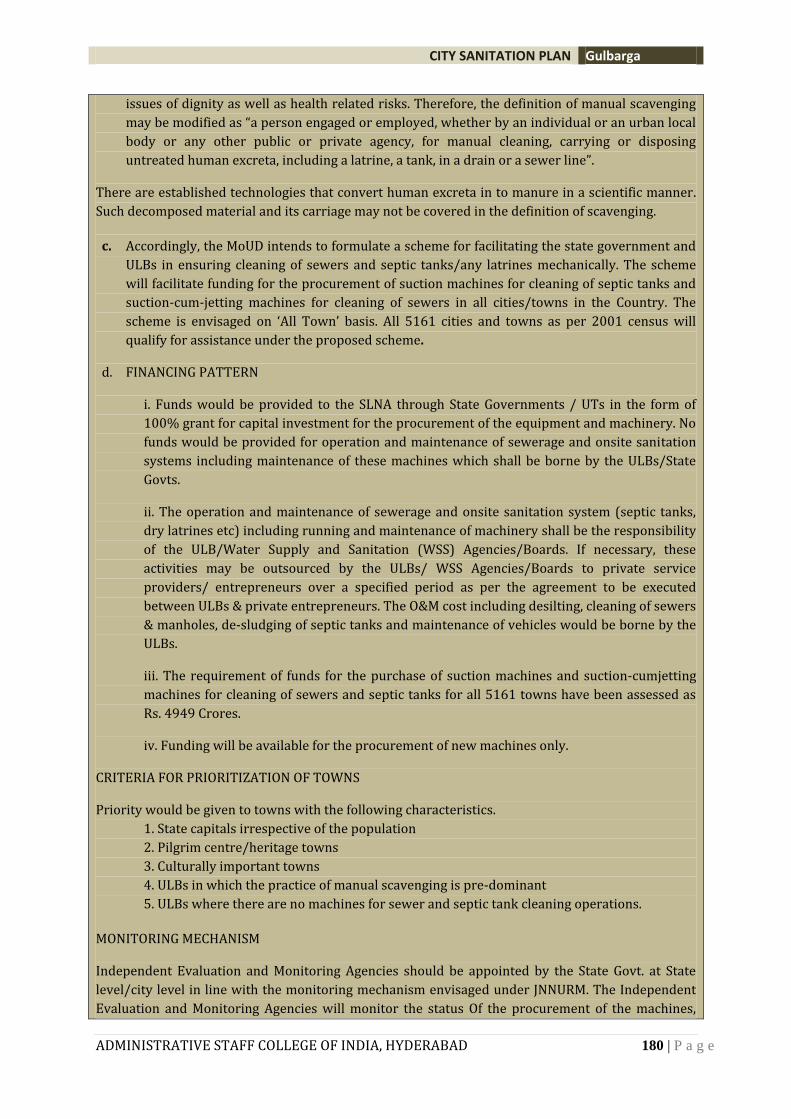
CITY SANITATION PLAN Gulbarga
ADMINISTRATIVE STAFF COLLEGE OF INDIA, HYDERABAD 180 | P a g e
issues of dignity as well as health related risks. Therefore, the definition of manual scavenging
may be modified as “a person engaged or employed, whether by an individual or an urban local
body or any other public or private agency, for manual cleaning, carrying or disposing
untreated human excreta, including a latrine, a tank, in a drain or a sewer line”.
There are established technologies that convert human excreta in to manure in a scientific manner.
Such decomposed material and its carriage may not be covered in the definition of scavenging.
c. Accordingly, the MoUD intends to formulate a scheme for facilitating the state government and
ULBs in ensuring cleaning of sewers and septic tanks/any latrines mechanically. The scheme
will facilitate funding for the procurement of suction machines for cleaning of septic tanks and
suction-cum-jetting machines for cleaning of sewers in all cities/towns in the Country. The
scheme is envisaged on ‘All Town’ basis. All 5161 cities and towns as per 2001 census will
qualify for assistance under the proposed scheme.
d. FINANCING PATTERN
i. Funds would be provided to the SLNA through State Governments / UTs in the form of
100% grant for capital investment for the procurement of the equipment and machinery. No
funds would be provided for operation and maintenance of sewerage and onsite sanitation
systems including maintenance of these machines which shall be borne by the ULBs/State
Govts.
ii. The operation and maintenance of sewerage and onsite sanitation system (septic tanks,
dry latrines etc) including running and maintenance of machinery shall be the responsibility
of the ULB/Water Supply and Sanitation (WSS) Agencies/Boards. If necessary, these
activities may be outsourced by the ULBs/ WSS Agencies/Boards to private service
providers/ entrepreneurs over a specified period as per the agreement to be executed
between ULBs & private entrepreneurs. The O&M cost including desilting, cleaning of sewers
& manholes, de-sludging of septic tanks and maintenance of vehicles would be borne by the
ULBs.
iii. The requirement of funds for the purchase of suction machines and suction-cumjetting
machines for cleaning of sewers and septic tanks for all 5161 towns have been assessed as
Rs. 4949 Crores.
iv. Funding will be available for the procurement of new machines only.
CRITERIA FOR PRIORITIZATION OF TOWNS
Priority would be given to towns with the following characteristics.
1. State capitals irrespective of the population
2. Pilgrim centre/heritage towns
3. Culturally important towns
4. ULBs in which the practice of manual scavenging is pre-dominant
5. ULBs where there are no machines for sewer and septic tank cleaning operations.
MONITORING MECHANISM
Independent Evaluation and Monitoring Agencies should be appointed by the State Govt. at State
level/city level in line with the monitoring mechanism envisaged under JNNURM. The Independent
Evaluation and Monitoring Agencies will monitor the status Of the procurement of the machines,
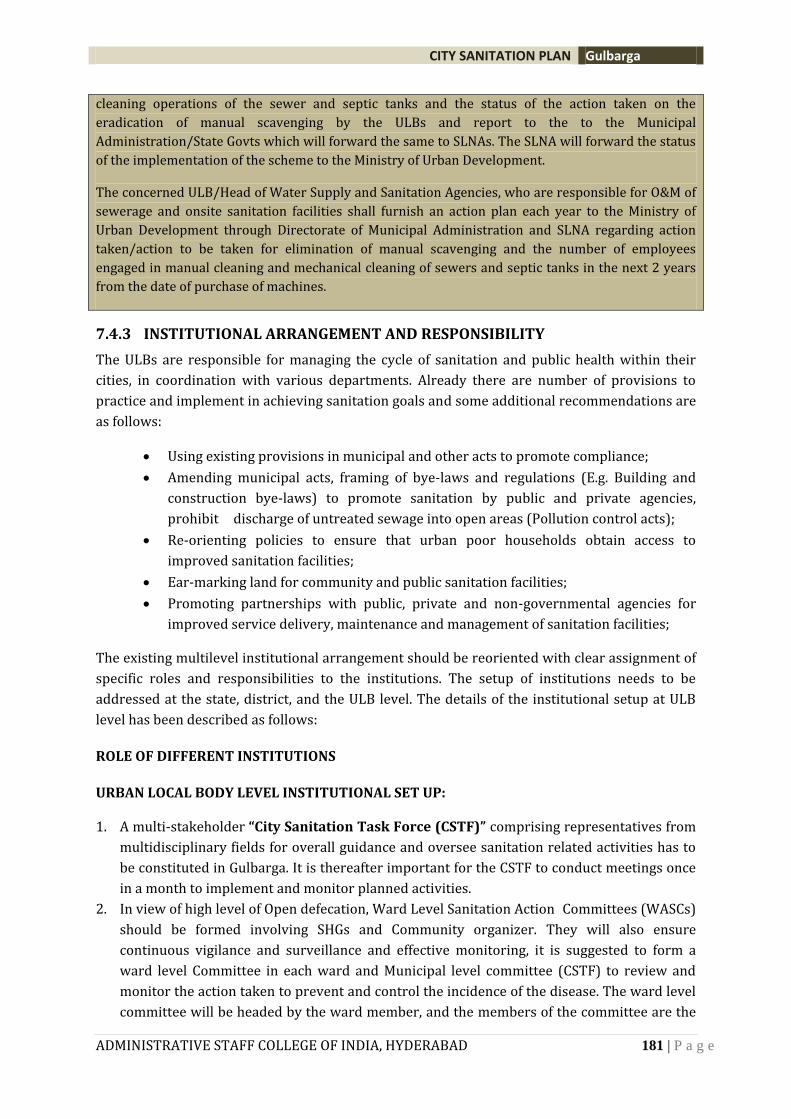
CITY SANITATION PLAN Gulbarga
ADMINISTRATIVE STAFF COLLEGE OF INDIA, HYDERABAD 181 | P a g e
cleaning operations of the sewer and septic tanks and the status of the action taken on the
eradication of manual scavenging by the ULBs and report to the to the Municipal
Administration/State Govts which will forward the same to SLNAs. The SLNA will forward the status
of the implementation of the scheme to the Ministry of Urban Development.
The concerned ULB/Head of Water Supply and Sanitation Agencies, who are responsible for O&M of
sewerage and onsite sanitation facilities shall furnish an action plan each year to the Ministry of
Urban Development through Directorate of Municipal Administration and SLNA regarding action
taken/action to be taken for elimination of manual scavenging and the number of employees
engaged in manual cleaning and mechanical cleaning of sewers and septic tanks in the next 2 years
from the date of purchase of machines.
7.4.3 INSTITUTIONAL ARRANGEMENT AND RESPONSIBILITY
The ULBs are responsible for managing the cycle of sanitation and public health within their
cities, in coordination with various departments. Already there are number of provisions to
practice and implement in achieving sanitation goals and some additional recommendations are
as follows:
Using existing provisions in municipal and other acts to promote compliance;
Amending municipal acts, framing of bye-laws and regulations (E.g. Building and construction bye-laws) to promote sanitation by public and private agencies, prohibit discharge of untreated sewage into open areas (Pollution control acts);
Re-orienting policies to ensure that urban poor households obtain access to improved sanitation facilities;
Ear-marking land for community and public sanitation facilities;
Promoting partnerships with public, private and non-governmental agencies for improved service delivery, maintenance and management of sanitation facilities;
The existing multilevel institutional arrangement should be reoriented with clear assignment of
specific roles and responsibilities to the institutions. The setup of institutions needs to be
addressed at the state, district, and the ULB level. The details of the institutional setup at ULB
level has been described as follows:
ROLE OF DIFFERENT INSTITUTIONS
URBAN LOCAL BODY LEVEL INSTITUTIONAL SET UP:
1. A multi-stakeholder “City Sanitation Task Force (CSTF)” comprising representatives from
multidisciplinary fields for overall guidance and oversee sanitation related activities has to
be constituted in Gulbarga. It is thereafter important for the CSTF to conduct meetings once
in a month to implement and monitor planned activities.
2. In view of high level of Open defecation, Ward Level Sanitation Action Committees (WASCs)
should be formed involving SHGs and Community organizer. They will also ensure
continuous vigilance and surveillance and effective monitoring, it is suggested to form a
ward level Committee in each ward and Municipal level committee (CSTF) to review and
monitor the action taken to prevent and control the incidence of the disease. The ward level
committee will be headed by the ward member, and the members of the committee are the
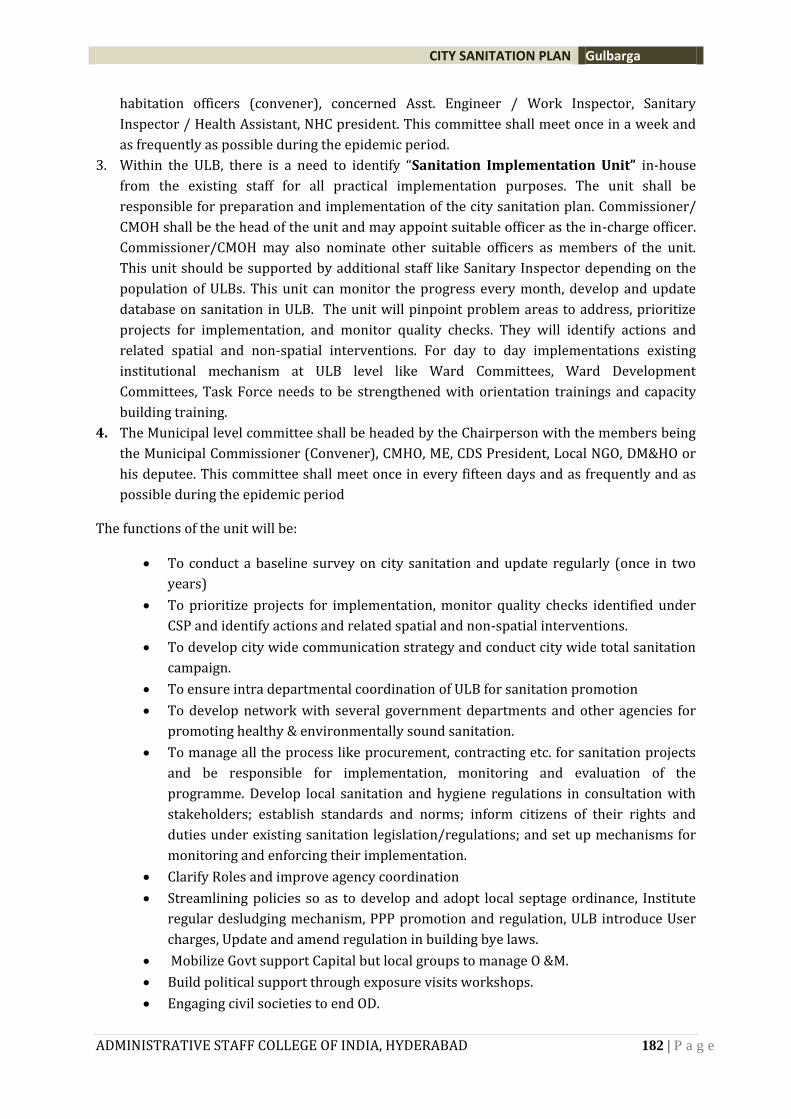
CITY SANITATION PLAN Gulbarga
ADMINISTRATIVE STAFF COLLEGE OF INDIA, HYDERABAD 182 | P a g e
habitation officers (convener), concerned Asst. Engineer / Work Inspector, Sanitary
Inspector / Health Assistant, NHC president. This committee shall meet once in a week and
as frequently as possible during the epidemic period.
3. Within the ULB, there is a need to identify “Sanitation Implementation Unit” in-house
from the existing staff for all practical implementation purposes. The unit shall be
responsible for preparation and implementation of the city sanitation plan. Commissioner/
CMOH shall be the head of the unit and may appoint suitable officer as the in-charge officer.
Commissioner/CMOH may also nominate other suitable officers as members of the unit.
This unit should be supported by additional staff like Sanitary Inspector depending on the
population of ULBs. This unit can monitor the progress every month, develop and update
database on sanitation in ULB. The unit will pinpoint problem areas to address, prioritize
projects for implementation, and monitor quality checks. They will identify actions and
related spatial and non-spatial interventions. For day to day implementations existing
institutional mechanism at ULB level like Ward Committees, Ward Development
Committees, Task Force needs to be strengthened with orientation trainings and capacity
building training.
4. The Municipal level committee shall be headed by the Chairperson with the members being
the Municipal Commissioner (Convener), CMHO, ME, CDS President, Local NGO, DM&HO or
his deputee. This committee shall meet once in every fifteen days and as frequently and as
possible during the epidemic period
The functions of the unit will be:
To conduct a baseline survey on city sanitation and update regularly (once in two
years)
To prioritize projects for implementation, monitor quality checks identified under
CSP and identify actions and related spatial and non-spatial interventions.
To develop city wide communication strategy and conduct city wide total sanitation
campaign.
To ensure intra departmental coordination of ULB for sanitation promotion
To develop network with several government departments and other agencies for
promoting healthy & environmentally sound sanitation.
To manage all the process like procurement, contracting etc. for sanitation projects
and be responsible for implementation, monitoring and evaluation of the
programme. Develop local sanitation and hygiene regulations in consultation with
stakeholders; establish standards and norms; inform citizens of their rights and
duties under existing sanitation legislation/regulations; and set up mechanisms for
monitoring and enforcing their implementation.
Clarify Roles and improve agency coordination
Streamlining policies so as to develop and adopt local septage ordinance, Institute
regular desludging mechanism, PPP promotion and regulation, ULB introduce User
charges, Update and amend regulation in building bye laws.
Mobilize Govt support Capital but local groups to manage O &M.
Build political support through exposure visits workshops.
Engaging civil societies to end OD.
CITY SANITATION PLAN Gulbarga
ADMINISTRATIVE STAFF COLLEGE OF INDIA, HYDERABAD 183 | P a g e
For day to day implementations existing institutional mechanism at ULB level like Ward
Committees, Ward Development Committees, Task Force needs to be strengthened with
orientation trainings and capacity building training.
Poverty wing of ULB should be responsible to design, implement, and monitor the sanitation
promotion programmes, converging the source of funds and preparing the budget. ULB should
also plan and budget for the operation and maintenance of sanitation systems. It is also
responsible for assisting households to provide their own sanitation and to build their own
toilet facilities. Specific responsibilities include –
To design integrated planning and communication strategy for City sanitation
promotion.
To provide access to sanitation to all urban population
To make communities aware of the importance of sanitation in terms of health.
To launch together with the communities, health and hygiene promotion
programmes.
To monitor the health of communities.
Establish and improve septage management requirements and guidelines
Providing technical support, guidance and training .
To assist households to operate and maintain sanitation facilities
To assist Ward Education Committee for the improvement of school
infrastructure, including sanitation and for implementing School health promotion
programmes to create safe and healthy school.
To coordinate all the internal departments like PWD, Sanitation, Health and
Education, and also involving the Community Based Organizations, Welfare
Associations, youth clubs, market committees etc. for Total Sanitation Approach
and Campaign in the ULB, and make the city open defecation free.
To develop and design ward wise, & slum wise incentive schemes for reaching the
ultimate goal of Nirmal Sahar
STATE URBAN SANITATION CELL (SUSC)
DMA needs to be strengthened for the purpose of functioning as a Sanitation Nodal Agency with
a dedicated Sanitation Cell. The Cell will have a complete office set up with the following
constitution, terms of reference. (To elaborate on Roles and responsibilities, on investment
flows, Policy and standards setting, Asset Creation, Financing of Capital Investments, Planning
and implementation, Operation and maintenance, Environmental Regulation, Monitoring and
Evaluation, Land Use / Building regulations, Ongoing programs, Implementation, Execution,
Legal Regulatory Responsibility, Capacity Building and IEC).
Constitution of State Urban Sanitation Cell (SUSC):
Creation of a strategic urban sanitation cell at DMA, GoK, to be headed by a “Director”
equivalent officer with a fixed tenure of five of mission period for better coordination
and integrated development.
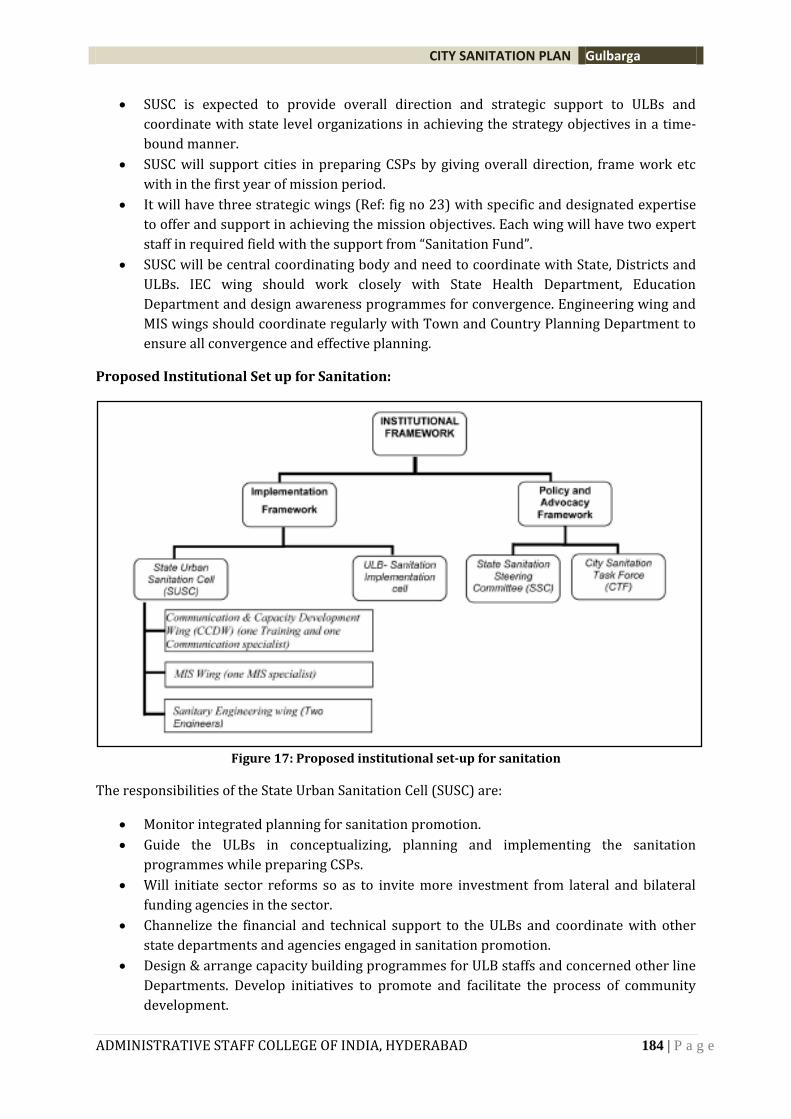
CITY SANITATION PLAN Gulbarga
ADMINISTRATIVE STAFF COLLEGE OF INDIA, HYDERABAD 184 | P a g e
SUSC is expected to provide overall direction and strategic support to ULBs and
coordinate with state level organizations in achieving the strategy objectives in a time-
bound manner.
SUSC will support cities in preparing CSPs by giving overall direction, frame work etc
with in the first year of mission period.
It will have three strategic wings (Ref: fig no 23) with specific and designated expertise
to offer and support in achieving the mission objectives. Each wing will have two expert
staff in required field with the support from “Sanitation Fund”.
SUSC will be central coordinating body and need to coordinate with State, Districts and
ULBs. IEC wing should work closely with State Health Department, Education
Department and design awareness programmes for convergence. Engineering wing and
MIS wings should coordinate regularly with Town and Country Planning Department to
ensure all convergence and effective planning.
Proposed Institutional Set up for Sanitation:
Figure 17: Proposed institutional set-up for sanitation
The responsibilities of the State Urban Sanitation Cell (SUSC) are:
Monitor integrated planning for sanitation promotion.
Guide the ULBs in conceptualizing, planning and implementing the sanitation
programmes while preparing CSPs.
Will initiate sector reforms so as to invite more investment from lateral and bilateral
funding agencies in the sector.
Channelize the financial and technical support to the ULBs and coordinate with other
state departments and agencies engaged in sanitation promotion.
Design & arrange capacity building programmes for ULB staffs and concerned other line
Departments. Develop initiatives to promote and facilitate the process of community
development.
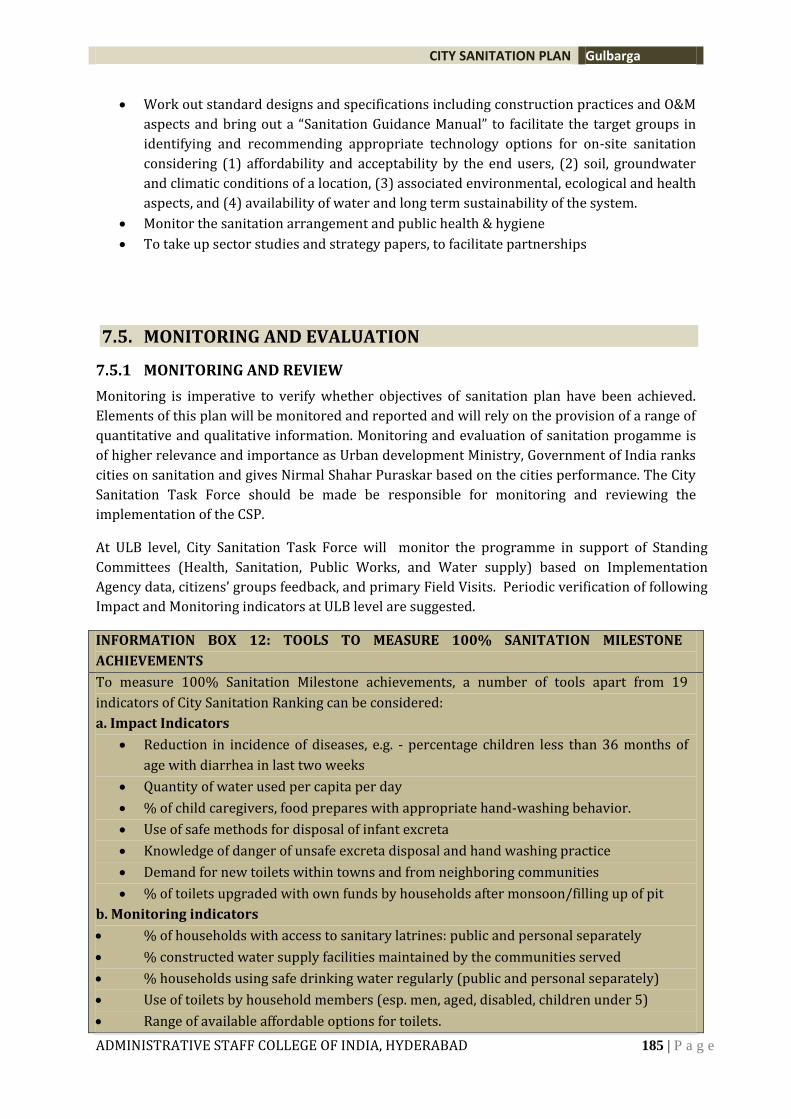
CITY SANITATION PLAN Gulbarga
ADMINISTRATIVE STAFF COLLEGE OF INDIA, HYDERABAD 185 | P a g e
Work out standard designs and specifications including construction practices and O&M
aspects and bring out a “Sanitation Guidance Manual” to facilitate the target groups in
identifying and recommending appropriate technology options for on-site sanitation
considering (1) affordability and acceptability by the end users, (2) soil, groundwater
and climatic conditions of a location, (3) associated environmental, ecological and health
aspects, and (4) availability of water and long term sustainability of the system.
Monitor the sanitation arrangement and public health & hygiene
To take up sector studies and strategy papers, to facilitate partnerships
7.5. MONITORING AND EVALUATION
7.5.1 MONITORING AND REVIEW
Monitoring is imperative to verify whether objectives of sanitation plan have been achieved.
Elements of this plan will be monitored and reported and will rely on the provision of a range of
quantitative and qualitative information. Monitoring and evaluation of sanitation progamme is
of higher relevance and importance as Urban development Ministry, Government of India ranks
cities on sanitation and gives Nirmal Shahar Puraskar based on the cities performance. The City
Sanitation Task Force should be made be responsible for monitoring and reviewing the
implementation of the CSP.
At ULB level, City Sanitation Task Force will monitor the programme in support of Standing
Committees (Health, Sanitation, Public Works, and Water supply) based on Implementation
Agency data, citizens’ groups feedback, and primary Field Visits. Periodic verification of following
Impact and Monitoring indicators at ULB level are suggested.
INFORMATION BOX 12: TOOLS TO MEASURE 100% SANITATION MILESTONE
ACHIEVEMENTS
To measure 100% Sanitation Milestone achievements, a number of tools apart from 19
indicators of City Sanitation Ranking can be considered:
a. Impact Indicators
Reduction in incidence of diseases, e.g. - percentage children less than 36 months of
age with diarrhea in last two weeks
Quantity of water used per capita per day
% of child caregivers, food prepares with appropriate hand-washing behavior.
Use of safe methods for disposal of infant excreta
Knowledge of danger of unsafe excreta disposal and hand washing practice
Demand for new toilets within towns and from neighboring communities
% of toilets upgraded with own funds by households after monsoon/filling up of pit
b. Monitoring indicators
% of households with access to sanitary latrines: public and personal separately
% constructed water supply facilities maintained by the communities served
% households using safe drinking water regularly (public and personal separately)
Use of toilets by household members (esp. men, aged, disabled, children under 5)
Range of available affordable options for toilets.
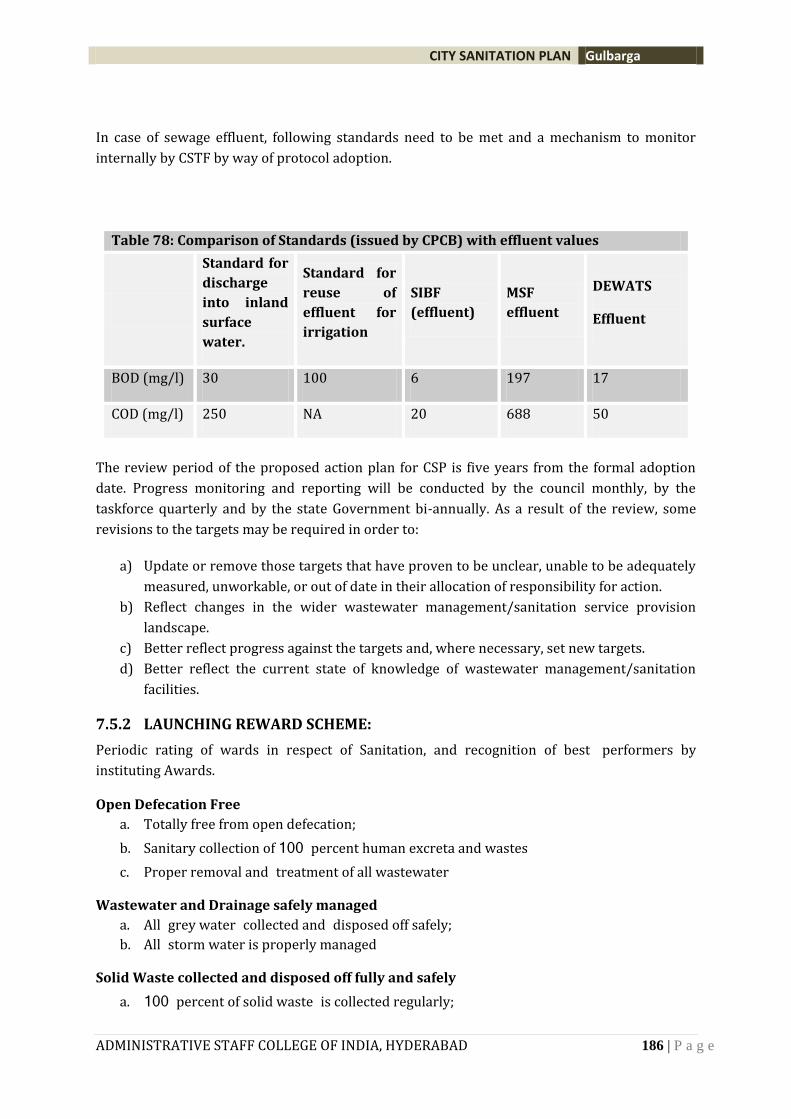
CITY SANITATION PLAN Gulbarga
ADMINISTRATIVE STAFF COLLEGE OF INDIA, HYDERABAD 186 | P a g e
In case of sewage effluent, following standards need to be met and a mechanism to monitor
internally by CSTF by way of protocol adoption.
Table 78: Comparison of Standards (issued by CPCB) with effluent values
Standard for
discharge
into inland
surface
water.
Standard for
reuse of
effluent for
irrigation
SIBF
(effluent)
MSF
effluent
DEWATS
Effluent
BOD (mg/l) 30 100 6 197 17
COD (mg/l) 250 NA 20 688 50
The review period of the proposed action plan for CSP is five years from the formal adoption
date. Progress monitoring and reporting will be conducted by the council monthly, by the
taskforce quarterly and by the state Government bi-annually. As a result of the review, some
revisions to the targets may be required in order to:
a) Update or remove those targets that have proven to be unclear, unable to be adequately
measured, unworkable, or out of date in their allocation of responsibility for action.
b) Reflect changes in the wider wastewater management/sanitation service provision
landscape.
c) Better reflect progress against the targets and, where necessary, set new targets.
d) Better reflect the current state of knowledge of wastewater management/sanitation
facilities.
7.5.2 LAUNCHING REWARD SCHEME:
Periodic rating of wards in respect of Sanitation, and recognition of best performers by
instituting Awards.
Open Defecation Free
a. Totally free from open defecation;
b. Sanitary collection of 100 percent human excreta and wastes
c. Proper removal and treatment of all wastewater
Wastewater and Drainage safely managed
a. All grey water collected and disposed off safely;
b. All storm water is properly managed
Solid Waste collected and disposed off fully and safely
a. 100 percent of solid waste is collected regularly;
CITY SANITATION PLAN Gulbarga
ADMINISTRATIVE STAFF COLLEGE OF INDIA, HYDERABAD 187 | P a g e
b. Solid wastes are disposed off safely (including treatment and re-use)
7.5.3 INCENTIVES AND DISINCENTIVES BY MC/NPS
The incentives within the City Sanitation Plans could provide infrastructure funding to those
communities that successfully meet reward scheme or by way of incentives that may include:
The provision of collective ‘in kind’ rewards to motivators that successfully support
wards and neighbourhoods meeting reward scheme.
Publicly recognizing those wards and neighbourhoods that achieve ‘excreta free’, ‘litter
free’ or ‘foul water free’ status.
Placing a signboard to this effect at the entrance to the neighbourhood / ward.
The disincentives the ULBs may consider within the CSP include:
Exercising all provisions within the Municipal Act/ Water Act to levy fines, bills for costs
incurred and instigate court proceedings for encroachments, releases of industrial waste
or effluent, illegal slaughter houses, markets, burial grounds, and the provision of
essential water/sewerage/drainage connections.
The provision of ‘fine’ for all individuals that dispose excreta, litter or foul water in an
unhygienic manner in public spaces (Polluter pay principle).
Sanctions against harmful actions and/or failure to act - for instance, a ban, supported
by fines on the use of untreated sewage to irrigate crops/water bodies.

CITY SANITATION PLAN Gulbarga
ADMINISTRATIVE STAFF COLLEGE OF INDIA, HYDERABAD 188 | P a g e
GLOSSARY 1. Activated sludge: An aerobic treatment process in which oxygen and micro-organism
concentrations in wastewater are artificially elevated to facilitate rapid digestion of
biodegradable organic matter.
2. Aerated pond or lagoon: A natural or artificial wastewater treatment pond in which
mechanical or diffused air aeration is used to supplement the natural reoxygenation
processes.
3. Aerobic treatment: Treatment of wastewater with the help of micro-organisms that
rely on oxygen.
4. Anaerobic digestion: Decomposition of organic material by anaerobic bacteria in the
absence of air.
5. Anaerobic lagoon: A system for treatment of high-strength wastewater and sludge that
involves retention under anaerobic conditions.
6. Biochemical oxygen demand: A measure of the organic pollutant strength of
wastewater.
7. Biosolids: See Sewage sludge.
8. Blackwater: Wastewater discharge from toilets.
9. Bucket latrine: A traditional but unhygienic form of sanitation in which feces is
deposited into a bucket which is collected regularly (usually at night) and taken away
(usually by ‘sweepers’).
10. Composting latrine: A latrine designed to receive both feces and waste vegetable
matter with the aim of reducing moisture content and achieving a carbon-to-nitrogen
ratio that promotes rapid that promotes rapid decomposition.
11. Dry latrines: All forms of latrines that do not require water for flushing.
12. Desludging: Removal of sludge or settled solid matter from treatment tanks such as
septic/Imhoff tank, interceptor tank or sedimentation tanks.
13. Disposal: Discharge, deposition or dumping of any liquid or solid waste onto land or
water so that it may enter the environment.
14. Domestic sewage: All forms of wastewater derived from residential properties, as well
as blackwater and greywater from commercial and institutions buildings.
15. Dry sanitation: Disposal of human excreta without the use of water for flushing or anal
cleansing.
16. Ecological sanitation (ecosan): A form of dry sanitation that involves separation of
feces and urine in order to facilitate recycling of nutrients in local agricultural systems.
17. Effluent: Any form of wastewater or liquid waste that flows from an operation or
activity.
18. Excreta: Feces and urine.
19. Fecal sludge: The undigested sludge that is collected from pit latrines and leach pits.
20. Greywater (also known as sullage): Wastewater produced by washing and bathing
activities.
21. Lagoon: See technology data sheet on ‘Wastewater and Fecal Sludge Treatment: Waste
Stabilization Ponds’ (page 104).
22. Leachfield: A trench filled with sand, soil, gravel and brickbats for disposal of septic
tank overflow into the surrounding soil.
23. Leach pit (sometimes known as a cesspit): An underground tank that is used where
there is no sewer and household wastewaters are drained into them to permit leaching
of the liquid into the surrounding soil.
CITY SANITATION PLAN Gulbarga
ADMINISTRATIVE STAFF COLLEGE OF INDIA, HYDERABAD 189 | P a g e
24. Night soil: Human excreta, with or without anal cleansing material, which are deposited
into a bucket or other receptacle for manual removal.
25. On-plot sanitation: A sanitation system that is wholly contained within the plot
occupied by a private dwelling and its immediate surroundings. Commonly, on-plot
sanitation is equivalent to ‘household latrine’, but may also include facilities shared by
several households living together on the same plot.
26. On-plot facilities: The components of a sanitation system located within a
householder’s plot.
27. Off-site sanitation: A system of sanitation that involves collection and transportation of
waste (wastewater either by sewerage or septage/fecal sludge by vacuum truck) to a
location away from the immediate locality.
28. Pathogens: Micro-organisms such as bacteria, viruses and protozoa that cause disease.
29. Percolation rate: The rate at which liquids move through soil.
30. Pit latrine: A form of on-plot sanitation with a pit for accumulation and decomposition
of excreta from which liquid infiltrates into the surrounding soil.
31. Pour flush toilet: A type of latrine where a water seal trap is used to prevent smells and
to reduce insects.
32. Sanitation: Interventions (usually construction of facilities such as latrines) that
improve the management of excreta and promote sanitary (healthy) conditions.
33. Septage: Mixture of wastewater and sludge removed from a septic tank during cleaning
operations.
34. Septic tank: A form of on-plot sanitation for the anaerobic treatment of
sewage/blackwater.
35. Sewage: A mixture of wastewater from all urban activates from residential, commercial
properties. It may also contain a component of industrial wastewater.
36. Sewer: A conduit, usually a pipe, which is used to collect and convey wastewater away
from its point of production to its point of disposal.
37. Sewage sludge (sometimes referred to as biosoilds): A semisolid residue generated
during the treatment of domestic sewage including both solids removed by
sedimentation and biological sludge produced by biological treatment.
38. Sewerage: A network of interconnected sewers in an area, district or town.
39. Soak pit/Soakaway: A pit, typically after a septic tank from where wastewater slowly
seeps into the ground through perforated sides and bottom.
40. Sullage (also known as greywater): Wastewater from bathing, laundry, preparation of
food, cooking, and other personal and domestic activates.
41. Superstructure: Screen or building enclosing a latrine to provide privacy and
protection for users.
42. Suction truck: A vehicle used for mechanized sludge removal from septic tanks and
lined latrine pits.
43. Ventilated improved pit latrine (VIP): A dry latrine system, with a dark interior and a
screened vent pipe to reduce odor and fly problems.
44. Vent pipe: A pipe that facilitates the escape of gases and odors from a latrine or septic
tank.
45. Wastewater: Liquid waste from households or commercial or industrial operations,
along with any surface water/storm water.
CITY SANITATION PLAN Gulbarga
ADMINISTRATIVE STAFF COLLEGE OF INDIA, HYDERABAD 190 | P a g e
46. Wastewater treatment: A combination of physical, chemical and biological processes
to remove suspended solids, dissolved pollutants, and pathogens and render the water
harmless to the environment.
47. Water closet: A pan, incorporating a water seal, in which excreta are deposited before
being flushed away using water.
48. Water seal: Water held in a U-shaped pipe or hemispherical bowl connecting a pan to a
pipe, channel or pit to prevent the escape of gases and insects from the sewer or pit.
CITY SANITATION PLAN Gulbarga
ADMINISTRATIVE STAFF COLLEGE OF INDIA, HYDERABAD 191 | P a g e
ANNEXURE
ANNEXURE1: TECHNOLOGY OPTION IN URBAN SANITATION All sanitation technologies are either ‘’Wet’’ or ’’ Dry’’.
Wet technologies require water as the name indicates flush out the feces and they drain in to a
leach pit, septic tank or sewer- common practice.
Dry technology: Does not require water as the name indicates. This is our age old pit latrine,
ventilated improved pits etc. This is our usually adopted in hilly area where the water table is
pretty deep.
To feel clean water is a must, so wet latrines are preferred by common man.
‘ON SITE’ AND ‘OFF SITE’ SYSTEMS
On site: Retaining waste in a pit or tank.
Off site: Removing waste to a distant place for treatment and disposal or disposal alone. Even in
‘On site’ system periodical removal of sludge/septage is necessary
The conventional offsite disposal system involves collection of the sewage through pipes and
conveying to a sewage treatment plant, treatment and disposal. This is an expensive option,
requires extensive land etc. So the communities were forced to think of alternative low cost
onsite disposal methods of which the most widely used options are ‘Septic tank’ and Twin pit
pour flush latrines.
SEPTIC TANK
A septic tank is a combined sedimentation and digestion tank where sewage is held for one or
two days. During the period, the suspended solids settle down to the bottom. This is
accompanied by anaerobic digestion of settled solids (sludge) and liquid resulting in reduction
in the volume of sludge, reduction in bio degradable organic matter and release of gases like
Carbon dioxide, methane etc. The effluent although clarified to a large extent still contains
appreciable amount of dissolved and suspended organic solids and pathogens. So the effluent is
to be disposed in a very careful way. Because of this unsatisfactory condition of the effluent and
also difficulty in providing proper effluent disposal system, septic tanks are limited to individual
houses, institutions whose contributory population does not exceed so as to reduce the volume
of effluent and thereby reduce the difficulty in treatment. The septic tanks are normally
rectangular in shape and can either be a single tank or double tank. In case of double tank, the
solid concentration is considerably lower and the first compartment is usually twice the size of
the second. The liquid depth is 1-2 m and the length to breadth 2 to 1. Recommend sizes of
septic tanks up to 2 users and for 300 users are given below.
Table 79:Recommended sizes of septic tanks
No: users Length in m Breadth in m Liquid depth in m cleaning
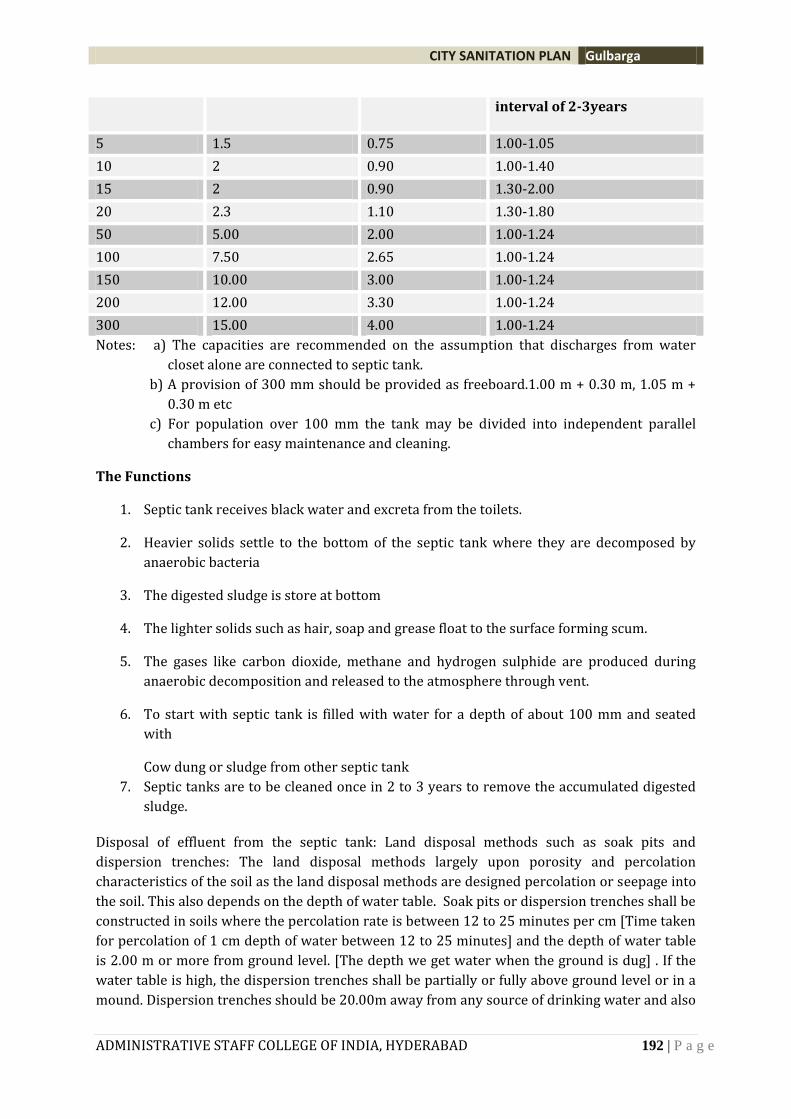
CITY SANITATION PLAN Gulbarga
ADMINISTRATIVE STAFF COLLEGE OF INDIA, HYDERABAD 192 | P a g e
interval of 2-3years
5 1.5 0.75 1.00-1.05
10 2 0.90 1.00-1.40
15 2 0.90 1.30-2.00
20 2.3 1.10 1.30-1.80
50 5.00 2.00 1.00-1.24
100 7.50 2.65 1.00-1.24
150 10.00 3.00 1.00-1.24
200 12.00 3.30 1.00-1.24
300 15.00 4.00 1.00-1.24
Notes: a) The capacities are recommended on the assumption that discharges from water
closet alone are connected to septic tank.
b) A provision of 300 mm should be provided as freeboard.1.00 m + 0.30 m, 1.05 m +
0.30 m etc
c) For population over 100 mm the tank may be divided into independent parallel
chambers for easy maintenance and cleaning.
The Functions
1. Septic tank receives black water and excreta from the toilets.
2. Heavier solids settle to the bottom of the septic tank where they are decomposed by
anaerobic bacteria
3. The digested sludge is store at bottom
4. The lighter solids such as hair, soap and grease float to the surface forming scum.
5. The gases like carbon dioxide, methane and hydrogen sulphide are produced during
anaerobic decomposition and released to the atmosphere through vent.
6. To start with septic tank is filled with water for a depth of about 100 mm and seated
with
Cow dung or sludge from other septic tank
7. Septic tanks are to be cleaned once in 2 to 3 years to remove the accumulated digested
sludge.
Disposal of effluent from the septic tank: Land disposal methods such as soak pits and
dispersion trenches: The land disposal methods largely upon porosity and percolation
characteristics of the soil as the land disposal methods are designed percolation or seepage into
the soil. This also depends on the depth of water table. Soak pits or dispersion trenches shall be
constructed in soils where the percolation rate is between 12 to 25 minutes per cm [Time taken
for percolation of 1 cm depth of water between 12 to 25 minutes] and the depth of water table
is 2.00 m or more from ground level. [The depth we get water when the ground is dug] . If the
water table is high, the dispersion trenches shall be partially or fully above ground level or in a
mound. Dispersion trenches should be 20.00m away from any source of drinking water and also
CITY SANITATION PLAN Gulbarga
ADMINISTRATIVE STAFF COLLEGE OF INDIA, HYDERABAD 193 | P a g e
it should be at least 7.00m away from any house. For soils which have percolation rate more
than 25cm other methods shall be adopted for disposal of effluents.
SOAK PITS
The soak pits may be of any regular shape and filled with rubble or brick bats. Soak pits need be
prepared only when the water table is sufficiently below or when a porous layer underlies an in
previous layer at top. Minimum dimension of the soak pit shall be 1.00m and the depth below
the invert level or inlet pipe surrounding land to avoid flooding.
SOAK PIT OR SEEPAGE PIT
All seepage pits shall have a diameter of 1.00m.
All seepage pits shall be designed as any of the following two types
1. Hollow and lined with acceptable material.
2. Filled with coarse stone or similar material that range from fines, sand, clay or
organic material.
Pits filled with coarse stone are prepared over hollow lined pits
Lining of brick, stone, block or similar materials shall have a minimum thickness of 100
mm and shall be laid with overlapping, tight-butted joints
Below the inlet level, mortar shall be used in the horizontal joints only. Above the inlet,
all joints shall be filled fully with mortar.
For hollow- lined pits, the inlet pipe should extend horizontally at least 300 mm into
the pit with a tee to divert flow downward and prevent washing and eroding the side
wall
A minimum annular space of 150 mm between the lining and excavation wall shall be
filled with crushed rock or gravel varying in diameter from 20 mm to 65 mm and free
from fines, sand, clay, or organic material. The maximum fines in the gravel shall be 2
percent by weight passing through a Standard 10mesh (2.0 millimeter) sieve. Clean
coarse gravel or rock at least 150 mm deep shall be placed in the bottom of each pit.
A structurally sound and otherwise suitable top shall be provided that will prevent
entrance of surface water, dirt or other foreign material, and be capable of supporting
the overburden of earth and any reasonable load to which it is subjected
Access to each hollow –lined pit shall be provided by means of a manhole, not less than
450 mm in minimum horizontal dimension, or by means of an easily removable cover.
The top of the pit shall be covered with a minimum of 150 mm of backfill.
In pits filled with coarse stone, the perforated distribution pipe shall run across each pit.
A layer of crushed rock or gravel shall be used for leveling the distribution pipe.
DISPERSION TRENCHES
Narrow and shallow trenches about 0.5m to 1.00m deep and 0.3m to 1.00m wide excavated to a
slight slope. Open jointed stone ware or concrete pipes 80 to 100 mm diameter are laid in the
trenches over a bed of 15 to 25 cm of washed gravel or crushed stone. The top of pipes shall be
covered by coarse gravel and crushed stone to a minimum depth of 15 cm. The balance portion
CITY SANITATION PLAN Gulbarga
ADMINISTRATIVE STAFF COLLEGE OF INDIA, HYDERABAD 194 | P a g e
may be filled with earth and finished in the form of a mound above the ground to avoid flooding
of trenches during rain.
Width of trench:300 to 600 mm wide
Depth :500to 600 mm
Dispersion pipe: 100 mm diameter open jointed S.W. pipes/ 75mm to 90mm OD
perforated PVC pipes
Maximum length of each trench: 30 m
Spacing of the trench : 1.8 m
Slope of the pipe :1 in 400
Media: 20 to 65 mm size broken stones for a thickness of 150 mm below the pipe.
Separation distance of trees and rooted plants;
Trees and other large rooted plants shall not be allowed to grow near to dispersion
trenches
It is desirable to cover the area over onsite soil absorption systems with lawn grass or
other shallow –rooted plants
Soil absorption systems should not be located under vegetable gardens.
The separation distance of trenches must be at least equal to 3 times the deepest
effective depth of trench with a minimum separation of 370 mm between trenches
POUR FLUSH WATER SEAL LATRINES
Pour flush latrines as the nature indicates, the excreta is hand flushed by pouring about 1.6 to 2
lit of water. The pour flush latrines are with a single leach pit and squatting pan over it. When
the pit in use gets filled up another pit is dug and the squatting platform and the slab is placed
on it.
The first pit is covered with earth and allowed to decay. After one or two years, the digested
excreta is used as a manure. The disadvantage of this system is that desludging has to be done
almost immediately after the pit has been filled up which involved handling of fresh and
undigested excreta. So this is appropriate only if it is desludged mechanically. To tide over this
situation a twin pit design was introduced. When one pit is full, the excreta is diverted into the
second pit. The filled up pit can be conveniently implied after 1⅟₂ to 2 years when most of the
pathogens die off. The sludge can be used as manure.
LEACH PIT
Leach pits serve a dual function of
a) Storage and digestion of excreted solids and
CITY SANITATION PLAN Gulbarga
ADMINISTRATIVE STAFF COLLEGE OF INDIA, HYDERABAD 195 | P a g e
b) Infilteration of waste liquids.
Leach pits are designed based on the following parameters.
1) Solid accumulation rate.
2) Long term infilteration rate.
3) Hydraulic loading.
4) Minimum period required for effective pathogen destruction
5) Optimal pit emptying frequency.
The pits are lined with honey come brick work, open jointed or with perforated burnt clay or
concrete rings. The pits are circular and used alternatively and designed for 3 years filling
period. When one pit is filled it is stopped, the excreta being diverted to second pit. The contents
become lich organic humus, innocuous and free from pathogens as well as smell. When
convenient, it is emptied and contents used as organic manure.
The size of leach pits depends on a number of factors mentioned above. The effective volume
under dry conditions should be at least 0.135 m³ percapita of the house hold for a period of 3
years. In the case of wet pit where water table is high the volume shall be 0.210 m³ per capita of
the house hold for a period of 3 years. Leach pit configuration can be varied to suit site
conditions while the least cost design in a twin circular pits.
Design of pits under different conditions
a) In water logged area: The pit top should be raised by 300 mm above likely level of water
above ground level at the time of water logging. Earth should then be filled will
compacted all round the pits up to 1.00 m distance from the pit up to its top. The raising
of the pit will necessitate raising of the latrine floor also.
b) In high sub soil water level: Where the sub soil water level rises to less than 300 mm
above the likely sub soil water level and earth should be filled all round the pits and
latrine floor raised.
c) In rock strata: In rocky strata with soil layer in between, the leach pits should be
designed as for ordinary leach pit construction with low subsoil water level.
d) Where space is a constraint: Where circular pits of standard sizes cannot be constructed
due to space constraints, deeper pit with smell diameter (not less than 750 mm) or
combined oval square or rectangular pits divided into two equal compartments by a
partition wall may be provided. In case combined pits the partition wall should not have
holes. The partition wall should go 250 mm deeper than the pit lining and plastered on
both sides with cement mortar.
AQUA PRIVY
This is a simplified form of septic tank. This consists of a masonry tank filled with water, a
squatting pan or a platform placed above the tank and ventilation pipe. A long chute or pipe
from the squatting is submerged in the tank water. The excreta falls through this chute or pipe
into the tank and undergoes anaerobic digestion as in a septic tank. The accumulated sludge
(digested) from the tank is to be removed periodically. To compensate for evaporation and
CITY SANITATION PLAN Gulbarga
ADMINISTRATIVE STAFF COLLEGE OF INDIA, HYDERABAD 196 | P a g e
leakage losses and to maintain the water seal. I.e. submergence of chute in the water, water is
added every time after its use.
CITY SANITATION PLAN Gulbarga
ADMINISTRATIVE STAFF COLLEGE OF INDIA, HYDERABAD 197 | P a g e
ANNEXURE 2: GOOD PRACTICES
1. Tiruchirapally (Trichy to most people), the famous temple town of the South, is the fourth-
largest city in Tamil Nadu, and is located on the banks of the Cauvery with a population of just
over a million — of which 25 per cent live in slums. Trichy has 211 “approved” slums and as
many as 75 “unapproved” slums which are located on railway land, Government of India land,
and land belonging to the Waqf Board and other private owners. Until the end of the 1990s the
slums of Trichy, with their sanitation and toilet facilities in an appalling state, were no different
from the rest of the country. But things began to change about 10 years ago, and Trichy has not
looked back since. The city was ranked 6th in India in the sanitation ranking of Indian cities by
the ministry of urban development in 2009-10.
It all started with a major initiative launched by the NGO Gramalaya in 2000, mobilising women
in the slums in self-help groups (SHGs) and launching an awareness campaign on sanitation
through training. They were able to get the support of Water-Aid, a UK-based NGO, to fund the
building/renovation of 25 community toilets and child-friendly toilets in the slums, which
would be managed by the women of the community on a pay-and-use basis. Sanitation health
education teams were set up by the SHGs to propagate the message of sanitation, monitor the
behaviour of residents, and supervise the maintenance of the toilets.
A community toilet complex typically has 10-12 seats for women and 10-12 for men. Child-
friendly toilets are separately provided in an adjacent area, for children up to the age of eight.
Each toilet has a tap which supplies 24×7 water. Some have graduated to “sanitary complexes”
with room for bathing and washing. Each facility receives its water supply from the Trichy City
Corporation (TCC), and a bore well is also provided by the corporation. Each has a provision of
underground storage of water and an overhead tank to which water is pumped. TCC has
ensured that water is made available also in summer months through tankers. The corporation
waives the electricity charge for the pumping of water for the first few years of operating the
toilets. Afterwards, the tariff for community toilets is levied at the lower domestic rate and not
commercial rate.
The cost of a typical community toilet was around Rs 3 lakh in the initial years that Water-Aid
built such complexes. Today, the cost is around Rs 12 lakh. The success of the women in
managing and maintaining the community toilets encouraged the TCC to build more of them, so
that all the 211 approved slums now have community toilets. Out of a total of 347 such toilets
(some slums have more than one), 284 are connected to the sewerage system and 63 function
through a septic tank. About 100 toilets are being managed on a pay and use basis by SHGs with
Gramalaya, and another 40 by other NGOs. For the rest, the TCC and/or ward councillors take
the responsibility for managing the toilets.
The Kamala Nehru Nagar slum where the toilet was inside the slum area. In West Devathanam,
another complex where the toilet is located between the slum and a public road and caters to
the needs of the slum as well as the floating population surrounding the slum. At the community
toilets run by SHGs, sanitary health education team members take turns to sit at a table placed
outside the toilet complex with tokens to sell as people come to use the toilet. They engage
cleaners who clean the complex two to three times a day. I found that the toilets were cleaner
than what we may typically find in cinema halls in Delhi.
CITY SANITATION PLAN Gulbarga
ADMINISTRATIVE STAFF COLLEGE OF INDIA, HYDERABAD 198 | P a g e
It is clear from the systems they have put in place to manage and maintain these toilets that
these women understand the economics of it all. The collection from user charges is used to pay
their electricity bills, the cleaner, the guard who keeps the watch, and expenses of minor repairs.
The typical user charge varies from 50 paise to Re 1 per use, while children, the elderly and the
physically challenged have free access. The accounts are meticulously-kept and are audited by
the TCC.
All teams make a small subscription to come together under Women’s Action for Village
Empowerment (WAVE) which is a registered society. Monthly meetings of WAVE allow them to
discuss their problems and learn from each other in finding solutions. A member of the TCC is
also invited to these meetings. They are now extending their sphere to cover solid waste
management and better delivery of other public services.
After initial resistance to their cause, men wanted to have a part of the action when the women
seemed to be succeeding in making their slums clean. The women obliged by creating AWASH
(Association for Water, Sanitation and Hygiene) so that men could also contribute to improving
the water and sanitation scenario of their joint habitat. Men also find a role through WATSAN
(water and sanitation) committees in monitoring the progress of the overall sanitation status of
the slums in the city. The municipal commissioner, T. T. Balsamy, was very appreciative of the
role played by the NGOs and the communities in bringing about the much overdue
transformation. As Geetha Jegan, executive director of Gramalaya put it: “Together, the city
corporation, the NGOs and the communities from the slums of Trichy have transformed the
sanitation scenario in Trichy.”
Trichy has shown the way. Other cities in India must follow to completely get rid of open
defecation and work for better sanitary conditions.
INFORMATION BOX 13: THE CONDOMINIAL SEWERAGE SYSTEM IN BRAZIL
The "condominial" system is the brainchild of Jose Carlos de Melo, a socially committed
engineer from Recife. The name condominial was given for two reasons. First, a block of houses
was treated like a horizontal apartment building (or condominial in Portuguese) (see figure).
Second, "Condominial" was a popular Brazilian soap opera and associated with the best in
urban life. As is evident in the figure, the result is a radically different layout, with a shorter grid
of smaller and shallower "feeder" sewers running through the backyards and with the effects of
shallower connections to the mains rippling through the system. These innovations cut
construction costs to between 20 and 30 per cent of those of a conventional system. The more
fundamental and radical innovation, however, is the active involvement of the population in
choosing their level of service, and in operating and maintaining the "feeder" infrastructure. The
key elements are that families can choose to continue with their current sanitation system, to
connect to a conventional waterborne system or to connect to a condominial system. If a family
chooses to connect to a condominial system, it has to pay a connection charge, which can be
financed by the water company, and a monthly tariff. If on the other hand, the family wants a
conventional connection, it has to pay an initial cost and a monthly tariff (both of which are
about three times higher) reflecting the different capital and operating costs. Families are free
to continue with their current system, which usually means a holding tank discharging into an
open street drain.
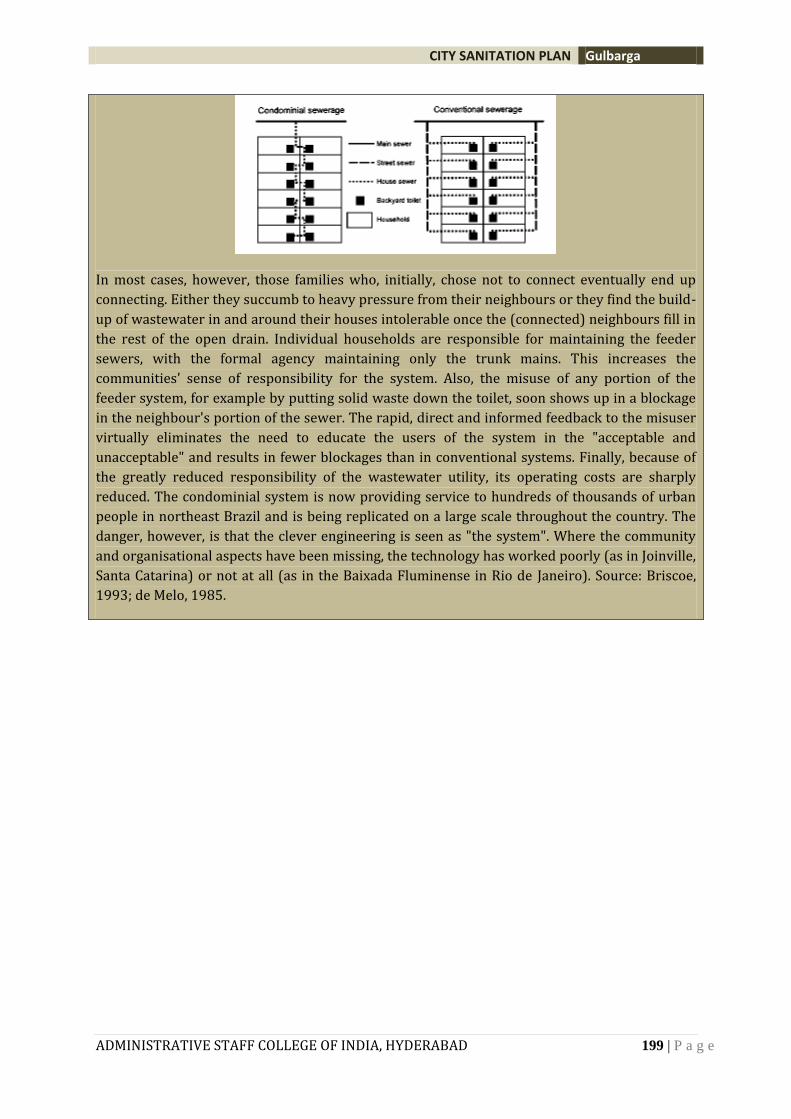
CITY SANITATION PLAN Gulbarga
ADMINISTRATIVE STAFF COLLEGE OF INDIA, HYDERABAD 199 | P a g e
In most cases, however, those families who, initially, chose not to connect eventually end up
connecting. Either they succumb to heavy pressure from their neighbours or they find the build-
up of wastewater in and around their houses intolerable once the (connected) neighbours fill in
the rest of the open drain. Individual households are responsible for maintaining the feeder
sewers, with the formal agency maintaining only the trunk mains. This increases the
communities' sense of responsibility for the system. Also, the misuse of any portion of the
feeder system, for example by putting solid waste down the toilet, soon shows up in a blockage
in the neighbour's portion of the sewer. The rapid, direct and informed feedback to the misuser
virtually eliminates the need to educate the users of the system in the "acceptable and
unacceptable" and results in fewer blockages than in conventional systems. Finally, because of
the greatly reduced responsibility of the wastewater utility, its operating costs are sharply
reduced. The condominial system is now providing service to hundreds of thousands of urban
people in northeast Brazil and is being replicated on a large scale throughout the country. The
danger, however, is that the clever engineering is seen as "the system". Where the community
and organisational aspects have been missing, the technology has worked poorly (as in Joinville,
Santa Catarina) or not at all (as in the Baixada Fluminense in Rio de Janeiro). Source: Briscoe,
1993; de Melo, 1985.
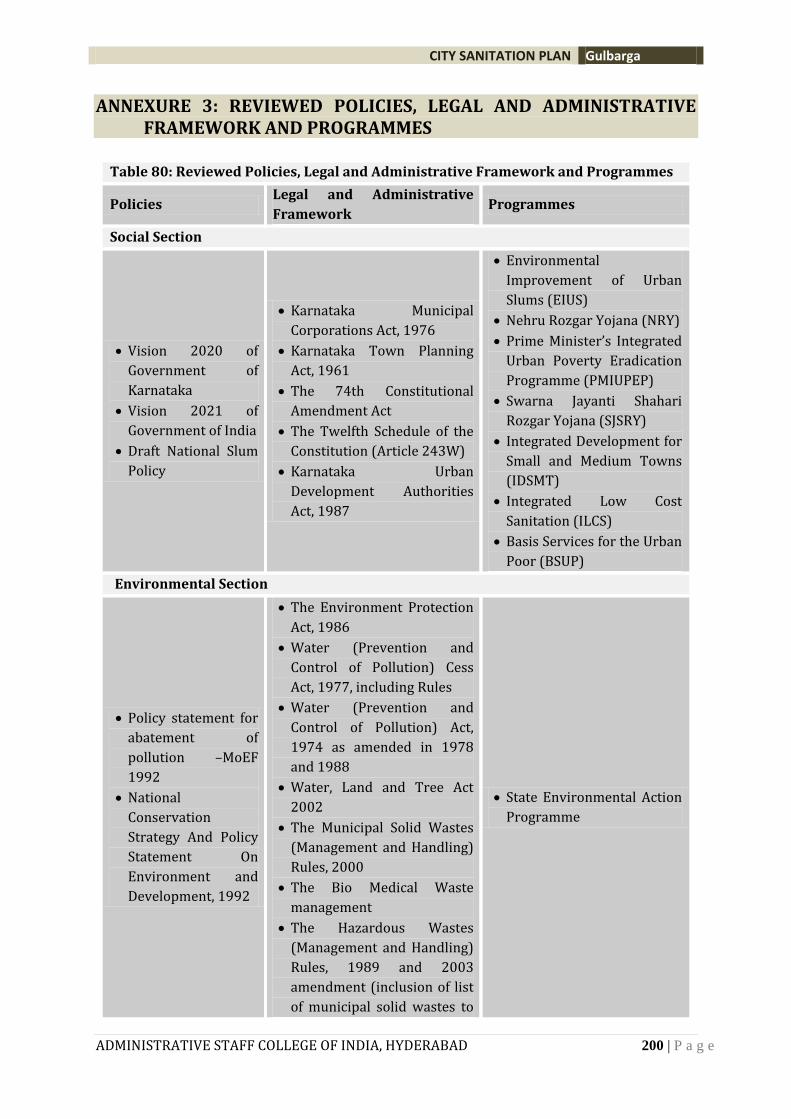
CITY SANITATION PLAN Gulbarga
ADMINISTRATIVE STAFF COLLEGE OF INDIA, HYDERABAD 200 | P a g e
ANNEXURE 3: REVIEWED POLICIES, LEGAL AND ADMINISTRATIVE FRAMEWORK AND PROGRAMMES
Table 80: Reviewed Policies, Legal and Administrative Framework and Programmes
Policies Legal and Administrative
Framework Programmes
Social Section
Vision 2020 of
Government of
Karnataka
Vision 2021 of
Government of India
Draft National Slum
Policy
Karnataka Municipal
Corporations Act, 1976
Karnataka Town Planning
Act, 1961
The 74th Constitutional
Amendment Act
The Twelfth Schedule of the
Constitution (Article 243W)
Karnataka Urban
Development Authorities
Act, 1987
Environmental
Improvement of Urban
Slums (EIUS)
Nehru Rozgar Yojana (NRY)
Prime Minister’s Integrated
Urban Poverty Eradication
Programme (PMIUPEP)
Swarna Jayanti Shahari
Rozgar Yojana (SJSRY)
Integrated Development for
Small and Medium Towns
(IDSMT)
Integrated Low Cost
Sanitation (ILCS)
Basis Services for the Urban
Poor (BSUP)
Environmental Section
Policy statement for
abatement of
pollution –MoEF
1992
National
Conservation
Strategy And Policy
Statement On
Environment and
Development, 1992
The Environment Protection
Act, 1986
Water (Prevention and
Control of Pollution) Cess
Act, 1977, including Rules
Water (Prevention and
Control of Pollution) Act,
1974 as amended in 1978
and 1988
Water, Land and Tree Act
2002
The Municipal Solid Wastes
(Management and Handling)
Rules, 2000
The Bio Medical Waste
management
The Hazardous Wastes
(Management and Handling)
Rules, 1989 and 2003
amendment (inclusion of list
of municipal solid wastes to
State Environmental Action
Programme
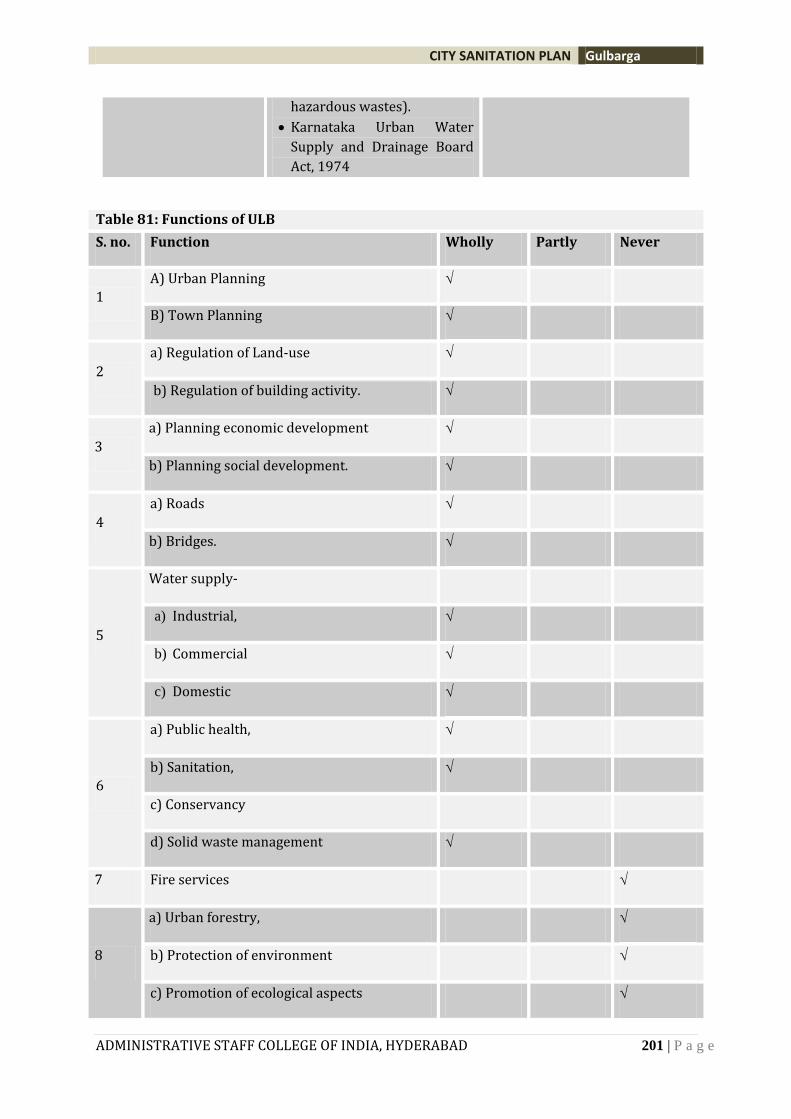
CITY SANITATION PLAN Gulbarga
ADMINISTRATIVE STAFF COLLEGE OF INDIA, HYDERABAD 201 | P a g e
hazardous wastes).
Karnataka Urban Water
Supply and Drainage Board
Act, 1974
Table 81: Functions of ULB
S. no. Function Wholly Partly Never
1
A) Urban Planning
B) Town Planning
2
a) Regulation of Land-use
b) Regulation of building activity.
3
a) Planning economic development
b) Planning social development.
4
a) Roads
b) Bridges.
5
Water supply-
a) Industrial,
b) Commercial
c) Domestic
6
a) Public health,
b) Sanitation,
c) Conservancy
d) Solid waste management
7 Fire services
8
a) Urban forestry,
b) Protection of environment
c) Promotion of ecological aspects
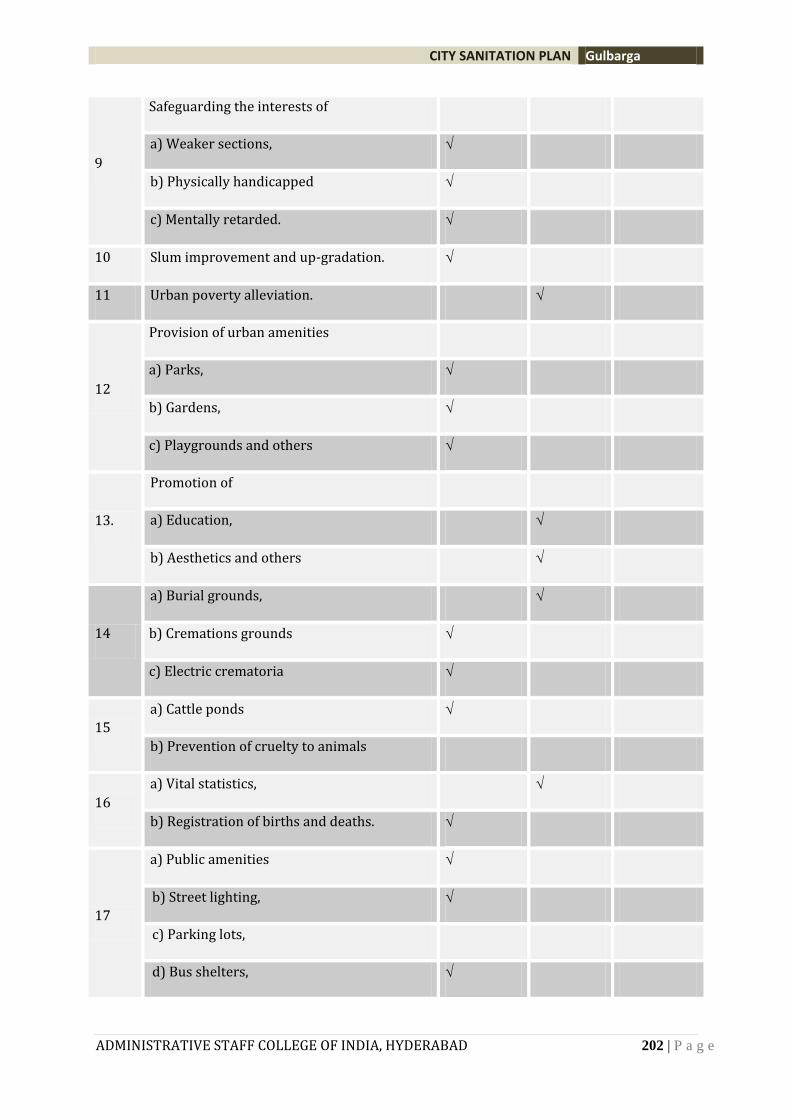
CITY SANITATION PLAN Gulbarga
ADMINISTRATIVE STAFF COLLEGE OF INDIA, HYDERABAD 202 | P a g e
9
Safeguarding the interests of
a) Weaker sections,
b) Physically handicapped
c) Mentally retarded.
10 Slum improvement and up-gradation.
11 Urban poverty alleviation.
12
Provision of urban amenities
a) Parks,
b) Gardens,
c) Playgrounds and others
13.
Promotion of
a) Education,
b) Aesthetics and others
14
a) Burial grounds,
b) Cremations grounds
c) Electric crematoria
15
a) Cattle ponds
b) Prevention of cruelty to animals
16
a) Vital statistics,
b) Registration of births and deaths.
17
a) Public amenities
b) Street lighting,
c) Parking lots,
d) Bus shelters,
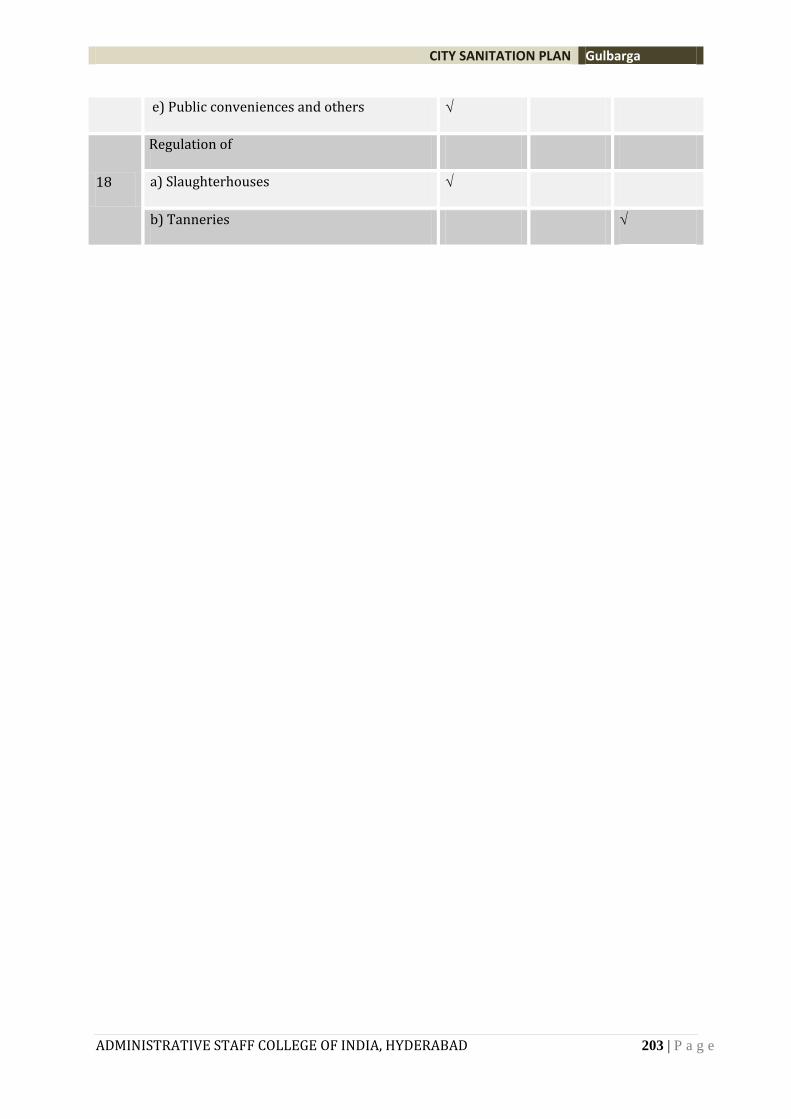
CITY SANITATION PLAN Gulbarga
ADMINISTRATIVE STAFF COLLEGE OF INDIA, HYDERABAD 203 | P a g e
e) Public conveniences and others
18
Regulation of
a) Slaughterhouses
b) Tanneries
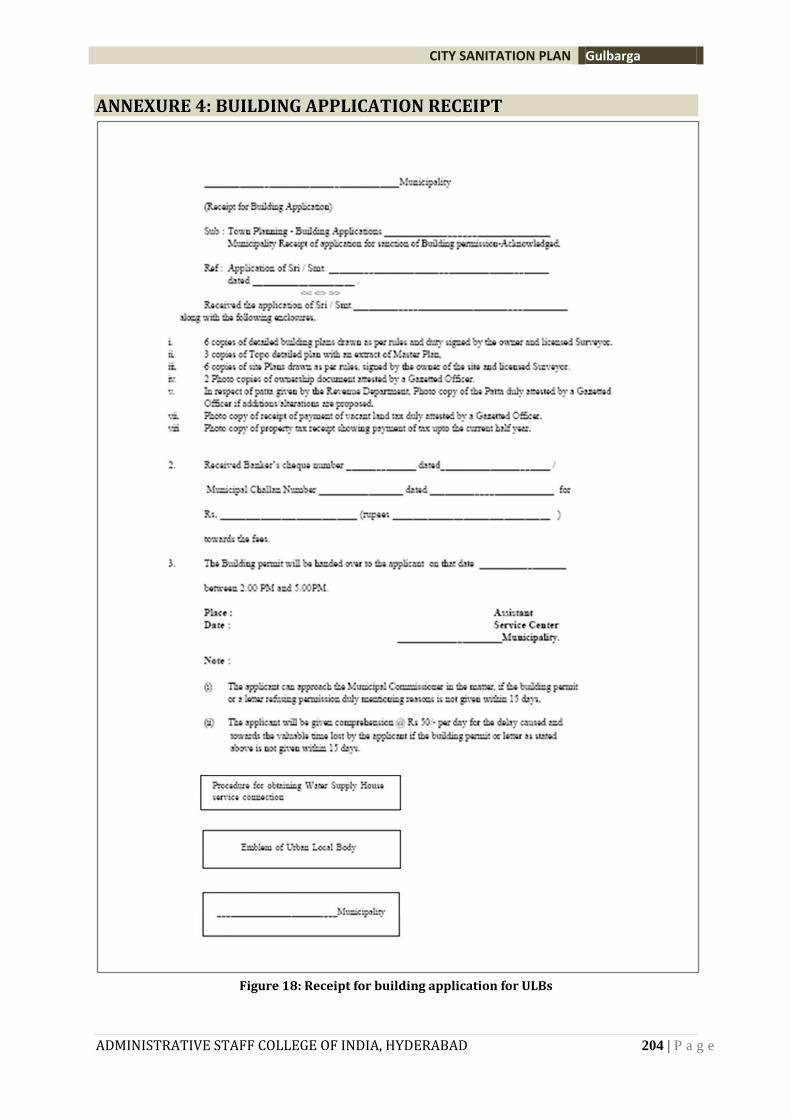
CITY SANITATION PLAN Gulbarga
ADMINISTRATIVE STAFF COLLEGE OF INDIA, HYDERABAD 204 | P a g e
ANNEXURE 4: BUILDING APPLICATION RECEIPT
Figure 18: Receipt for building application for ULBs
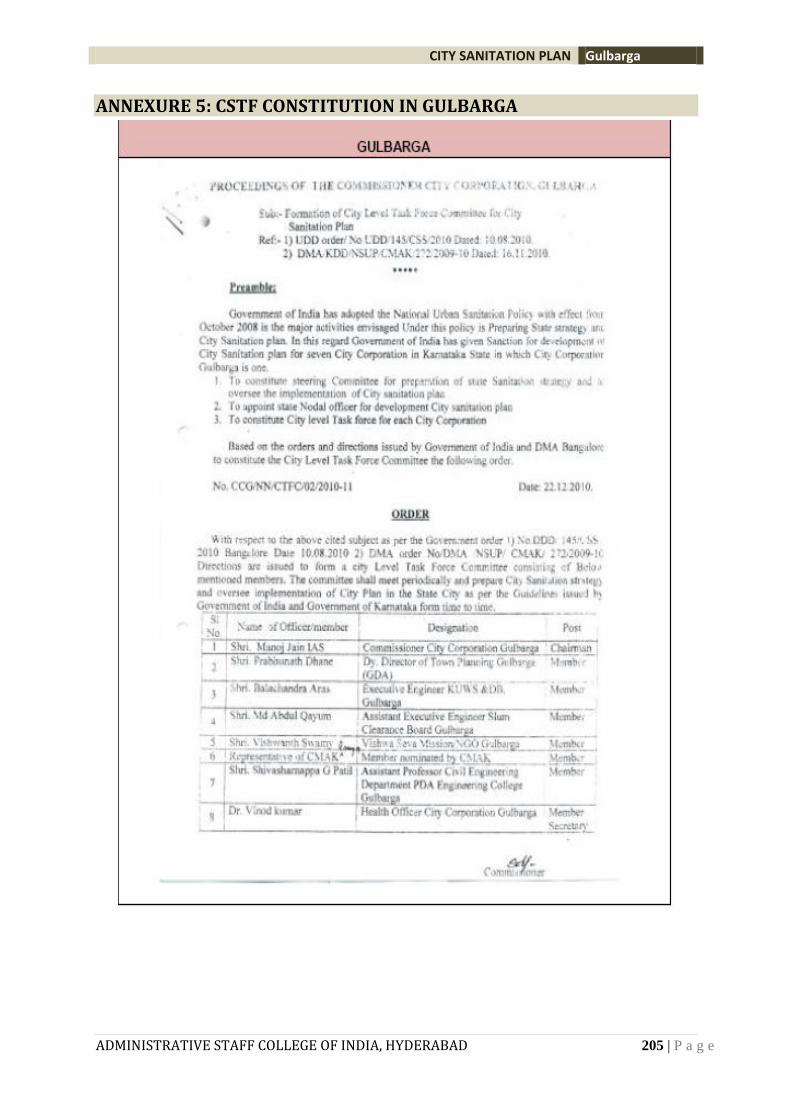
CITY SANITATION PLAN Gulbarga
ADMINISTRATIVE STAFF COLLEGE OF INDIA, HYDERABAD 205 | P a g e
ANNEXURE 5: CSTF CONSTITUTION IN GULBARGA
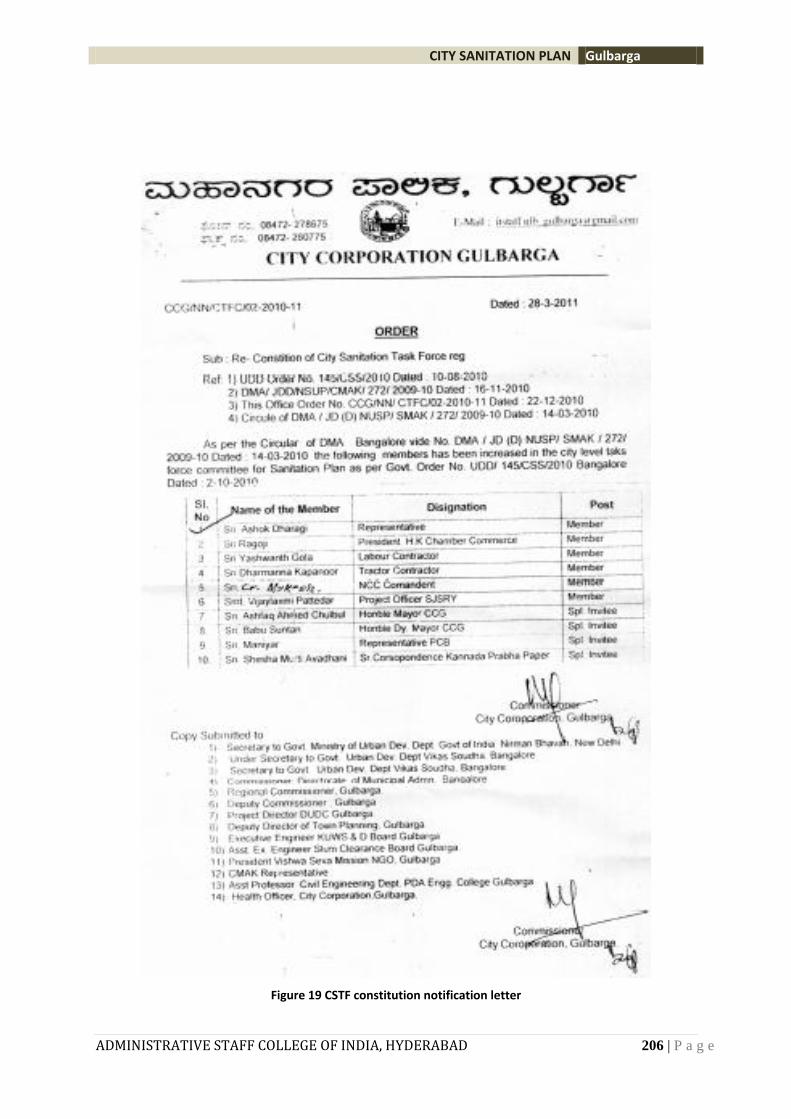
CITY SANITATION PLAN Gulbarga
ADMINISTRATIVE STAFF COLLEGE OF INDIA, HYDERABAD 206 | P a g e
Figure 19 CSTF constitution notification letter
CITY SANITATION PLAN Gulbarga
ADMINISTRATIVE STAFF COLLEGE OF INDIA, HYDERABAD 207 | P a g e
ANNEXURE 6: FIRST CSTF WORKSHOP PROCEEDINGS, GULBARGA
The workshop started with a welcome speech by Sri. Ashwaq Ahmed, Mayor, Gulbarga and Sri.
Manoj Jain, Commissioner, Gulbarga City Corporation, Gulbarga. The agenda listed the need for
the constitution of CSTF members and their role in the preparation of City Sanitation Plan
followed by the group activity among the CSTF members to seek their views on the problems
and solutions in regard to the sanitation in their respective city, as given below. The number of
participants was approximately 75 which included Mayor, Commissioner, Environmental
Engineers, Health Officer, Corporators, Sanitary Inspectors, Social development Officers,
Environment Officer, KSPCB, Community Development Officer, NGOs, Town Planners, ASCI’s
team, CMAK and Bhageerath. The discussions on the various issues raised by the CSTF members
were noted and relevant inference was drawn. The session concluded with the closing remarks
by the Commissioner of City Corporation, Gulbarga and ASCI team thanked the CSTF members
for their support and interaction. Following are the views expressed and outcome issues of the
group activity drawn to identify the problems and appropriate solutions to rectify the problems
in sanitation.
Views expressed by the CSTF members
1. Burning of solid waste is causing major problem in the city. There should be regular
collection from time to time in order to avoid burning of waste. The Commissioner, Gulbarga
City Corporation replied saying that there will be utmost care taken in managing solid waste
right from collection till the dumping at the landfill site. A complete management of solid
waste is expected to be established before the rainy season begins.
One of the Corporator raised a very important issue of burning of waste by the sanitary
workers, which is relevant all over the country and in all the urban local bodies. The
suggestion was a no cost measure where the Municipal Health Officer can call the sanitary
workers and instruct them not to burn the waste through explaining the health hazards
caused by such acts rather than stereotypical way of issuing notice. Issuing notice culture
would not fetch any result as the importance of such issue would never be understood.
2. Utilization of polythene bags in Gulbarga is another issue of concern. The plastic bags can be
replaced by the paper bags which are biodegradable in nature. The city has once
experienced a death of a cow due to consumption of plastic bags disposed at the road side of
the city. The Commissioner, Gulbarga City Corporation immediately instructed the
Environmental Engineer, Gulbarga City Corporation to issue an order to the plastic
manufacturing industries to stop their production and take necessary action in case of
violating the orders.
3. The city has limited community toilets in the slum locations. The number of toilets needs to
be improved and needs appropriate guidance to have basic facilities within the city. Dr.
Nandakishor advised some of the relevant ways of achieving such facilities in the city. The
suggestions were to seek guidance and support from the Government to construct and aid
with financial support. To involve in the Public Private Partnership (PPP) models and Self
Help Groups (SHGs) in the construction, operation and maintenance of the community
CITY SANITATION PLAN Gulbarga
ADMINISTRATIVE STAFF COLLEGE OF INDIA, HYDERABAD 208 | P a g e
toilets. To have pay and use approach for the proper and hygienic maintenance of
community toilets.
4. The solid waste management in the city is insufficient especially door to door collection. Due
to this, the waste is dumped by the road side areas or at the neighboring areas causing
unhygienic atmosphere to the people nearby. There should be regular awareness
programmes to the general public regarding disposal of solid waste and its importance in
maintaining good health.
GROUP ACTIVITY
GROUP I: Open defecation free city
Issues
1. Defecation in open fields in some parts of the city.
2. It is difficult for many families to have basic toilet facility because they are living in
crowded place.
3. Lack of education and ignorance.
4. Creation of unhealthy/unhygienic conditions.
5. 80% of diseases occur due to unhygienic conditions.
6. Shortage of water and improper water management.
Solutions
1. Construction of community toilets.
2. Efficient sewage connections for all the households.
3. Conduct workshops on scientific information and in-turn trying to change their mindset.
4. Taking help of media (display pictures) in public places to create awareness.
5. Public involvement.
6. Create awareness to build a healthy society.
7. Creating awareness towards living in hygiene conditions.
8. Improve water supply and water management methodologies.
GROUP II: Waste water treatment
Issues
1. Storm water drains leakage
2. Dumping of plastic waste into the drains
3. The damaged pipelines causes severe problem to the water system
4. Mixing of storm water into the potable water lines
5. The waste water from the UGD pipelines mixes in the drinking water lines causing serious
health impacts
6. 24/7water supply is not attended to all the 55 wards
Solutions
1. Regular maintenance of water connections and its lines
2. Cleaning of drains on regular basis
3. Ban on plastic bags use
4. Awareness of impacts on plastic usage
5. Replacing of new pipe lines in case of any severe damage
CITY SANITATION PLAN Gulbarga
ADMINISTRATIVE STAFF COLLEGE OF INDIA, HYDERABAD 209 | P a g e
6. 24/7 water supply to be followed in all the wards.
7. Advanced technology should be used for waste water treatment
GROUP III: Sanitation facilities to poor
Issues
1. Difficulty in paying monthly usage charges of toilets
2. No IEC programs in slum areas
3. No proper open drains for the outlet of waste water
4. No UGD in slum areas
5. No public toilet
6. Difficulty to get UGD connection due to high cost
7. Difficulty in construction of individual toilets due to high cost.
8. No supply of chlorinated water to poor
Solutions
1. Recommended to provide sanitation facilities free of cost
2. Organizing regular IEC programmes
3. Open drains needs to be clear and regularly maintained
4. UGD coverage for all the wards
5. Arrange public toilets to avoid open defecation
6. To provide chlorinated water for drinking purpose.
GROUP IV: Door to door collection of solid waste, treatment and disposal
Issues
1. Lack of awareness in general public
2. Improper storage of garbage facilities in the house
3. Lack of cooperation in giving monthly charges
4. Lack of cooperation from leaders
5. Lack of solid waste segregation at source
6. Maximum utilization of plastic
7. No proper dumping of waste into the dustbins
8. Lack of atleast secondary segregation points in city
9. Burning of waste within the containers
Solutions
1. Awareness in public through IEC. Programmes in schools, door to door campaign by NGO,
local leaders and government officials
2. Separate dust bins to be used in the house
3. SHGs should be involved in proper collection and segregation of solid waste
4. Payment to SHGs should through Corporation
5. Ban on plastic bags which is more than 20 microns
6. Separate containers are maintained for wet waste and dry waste.
7. Complete supervision of door to door waste collection
GROUP V: Regarding IEC for solid waste management
Views
CITY SANITATION PLAN Gulbarga
ADMINISTRATIVE STAFF COLLEGE OF INDIA, HYDERABAD 210 | P a g e
1. Awareness is adequate and the entire city is lacking with information.
2. Less people participation in IEC programs (public give excuses saying they have to attend
jobs and other tasks).
3. IEC programs should be implemented more in rural areas compared to cities.
4. Media’s involvement should be made while creating IEC programmes in the cities for more
publicity.
5. We should have a bigger morcha (andolan), street plays, jathas, etc., to create awareness.
6. Officials, public servants, politicians, etc., have to extensively participate in IEC programs.
7. Other agencies should not neglect IEC by saying the task (IEC) has been assigned to some
other agency.
8. Training to school and college children needs to happen.
9. Regular workshp should be conducted on environmental awareness to the SHGs, CBOs,
NGOs, RWCs, etc.
10. Reformation for ward level committees along with regular ward level meetings.
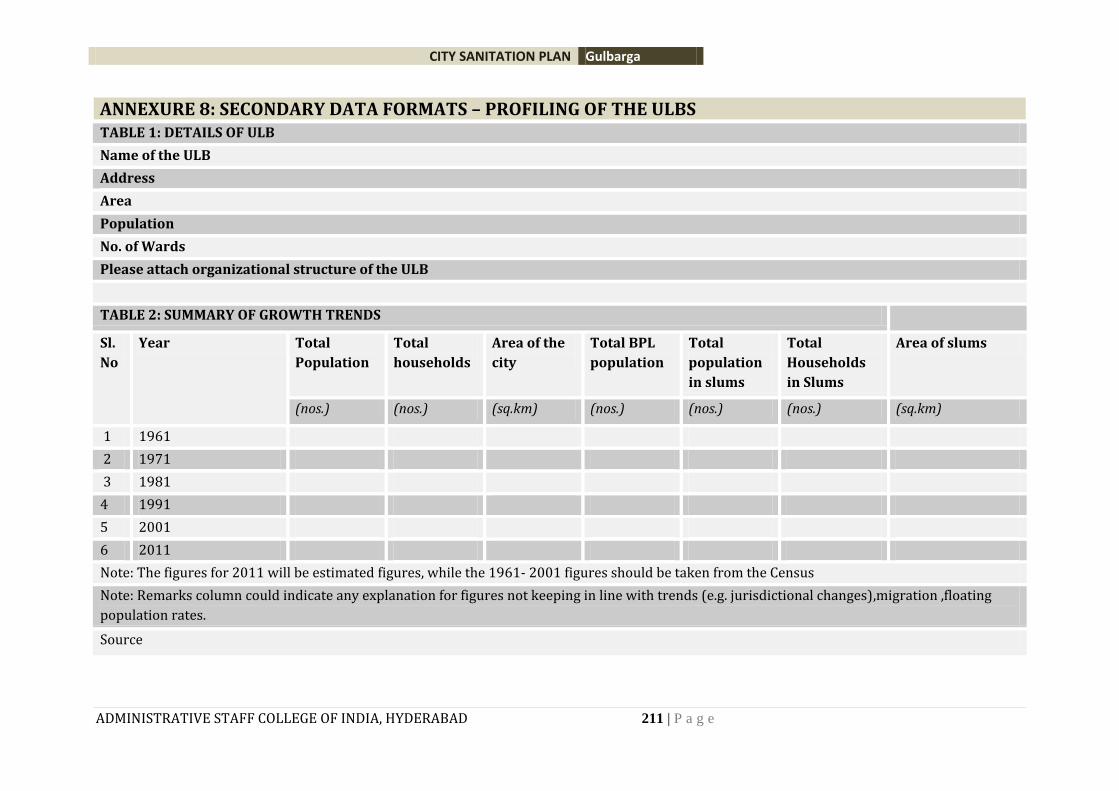
CITY SANITATION PLAN Gulbarga
ADMINISTRATIVE STAFF COLLEGE OF INDIA, HYDERABAD 211 | P a g e
ANNEXURE 8: SECONDARY DATA FORMATS – PROFILING OF THE ULBS TABLE 1: DETAILS OF ULB
Name of the ULB
Address
Area
Population
No. of Wards
Please attach organizational structure of the ULB
TABLE 2: SUMMARY OF GROWTH TRENDS
Sl.
No
Year Total
Population
Total
households
Area of the
city
Total BPL
population
Total
population
in slums
Total
Households
in Slums
Area of slums
(nos.) (nos.) (sq.km) (nos.) (nos.) (nos.) (sq.km)
1 1961
2 1971
3 1981
4 1991
5 2001
6 2011
Note: The figures for 2011 will be estimated figures, while the 1961- 2001 figures should be taken from the Census
Note: Remarks column could indicate any explanation for figures not keeping in line with trends (e.g. jurisdictional changes),migration ,floating
population rates.
Source
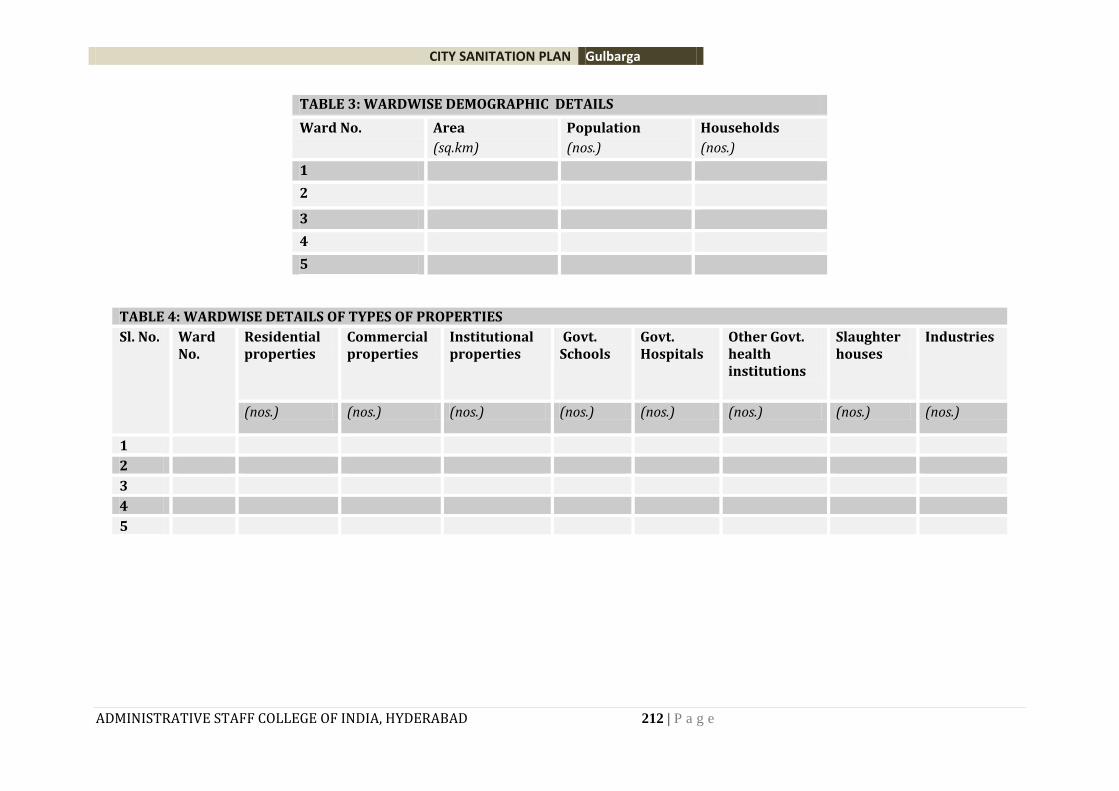
CITY SANITATION PLAN Gulbarga
ADMINISTRATIVE STAFF COLLEGE OF INDIA, HYDERABAD 212 | P a g e
TABLE 3: WARDWISE DEMOGRAPHIC DETAILS
Ward No. Area
(sq.km)
Population
(nos.)
Households
(nos.)
1
2
3
4
5
TABLE 4: WARDWISE DETAILS OF TYPES OF PROPERTIES
Sl. No. Ward No.
Residential properties
Commercial properties
Institutional properties
Govt. Schools
Govt. Hospitals
Other Govt. health institutions
Slaughter houses
Industries
(nos.) (nos.) (nos.) (nos.) (nos.) (nos.) (nos.) (nos.)
1
2
3
4
5
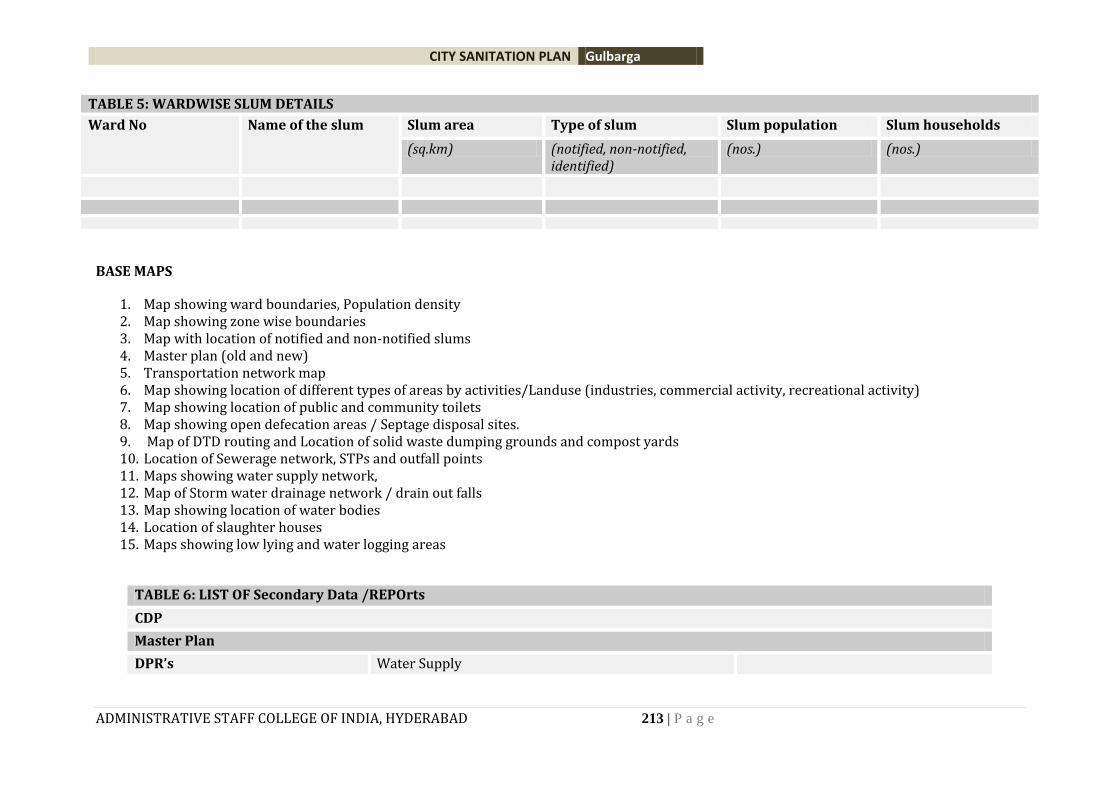
CITY SANITATION PLAN Gulbarga
ADMINISTRATIVE STAFF COLLEGE OF INDIA, HYDERABAD 213 | P a g e
TABLE 5: WARDWISE SLUM DETAILS
Ward No Name of the slum Slum area Type of slum Slum population Slum households
(sq.km) (notified, non-notified, identified)
(nos.) (nos.)
BASE MAPS
1. Map showing ward boundaries, Population density 2. Map showing zone wise boundaries 3. Map with location of notified and non-notified slums 4. Master plan (old and new) 5. Transportation network map 6. Map showing location of different types of areas by activities/Landuse (industries, commercial activity, recreational activity) 7. Map showing location of public and community toilets 8. Map showing open defecation areas / Septage disposal sites. 9. Map of DTD routing and Location of solid waste dumping grounds and compost yards 10. Location of Sewerage network, STPs and outfall points 11. Maps showing water supply network, 12. Map of Storm water drainage network / drain out falls 13. Map showing location of water bodies 14. Location of slaughter houses 15. Maps showing low lying and water logging areas
TABLE 6: LIST OF Secondary Data /REPOrts
CDP
Master Plan
DPR’s Water Supply
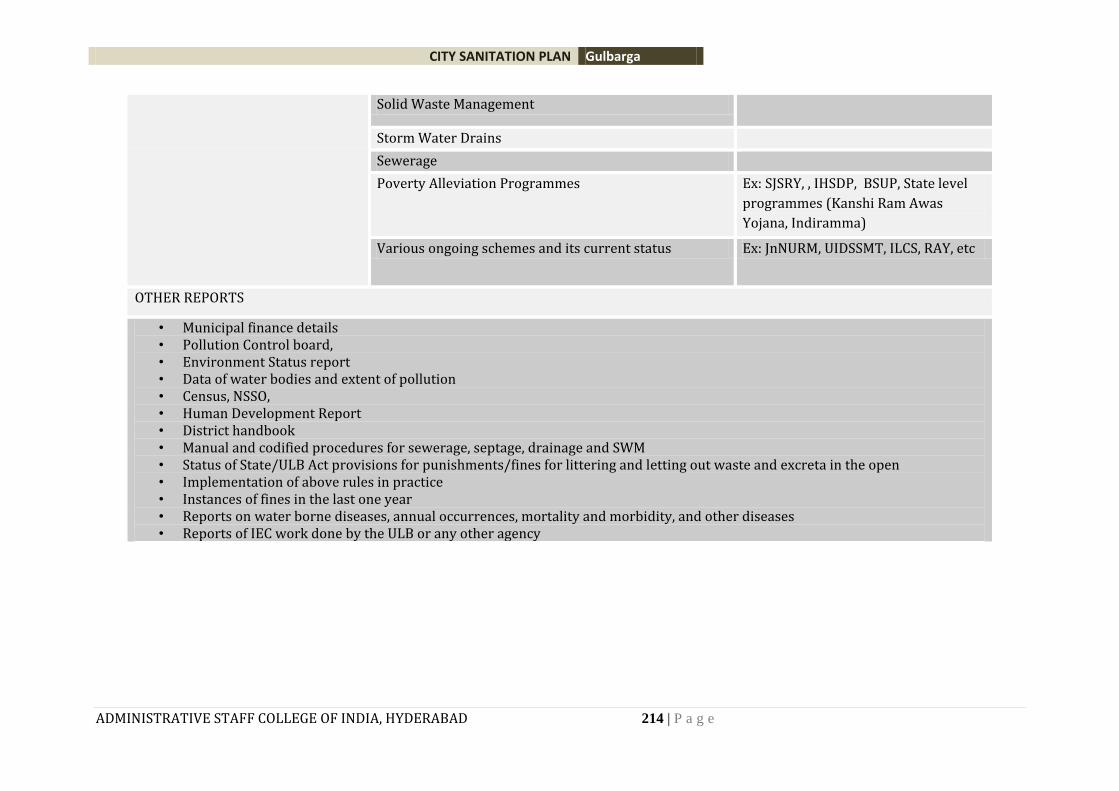
CITY SANITATION PLAN Gulbarga
ADMINISTRATIVE STAFF COLLEGE OF INDIA, HYDERABAD 214 | P a g e
Solid Waste Management
Storm Water Drains
Sewerage
Poverty Alleviation Programmes Ex: SJSRY, , IHSDP, BSUP, State level
programmes (Kanshi Ram Awas
Yojana, Indiramma)
Various ongoing schemes and its current status Ex: JnNURM, UIDSSMT, ILCS, RAY, etc
OTHER REPORTS
• Municipal finance details • Pollution Control board, • Environment Status report • Data of water bodies and extent of pollution • Census, NSSO, • Human Development Report • District handbook • Manual and codified procedures for sewerage, septage, drainage and SWM • Status of State/ULB Act provisions for punishments/fines for littering and letting out waste and excreta in the open • Implementation of above rules in practice • Instances of fines in the last one year • Reports on water borne diseases, annual occurrences, mortality and morbidity, and other diseases • Reports of IEC work done by the ULB or any other agency
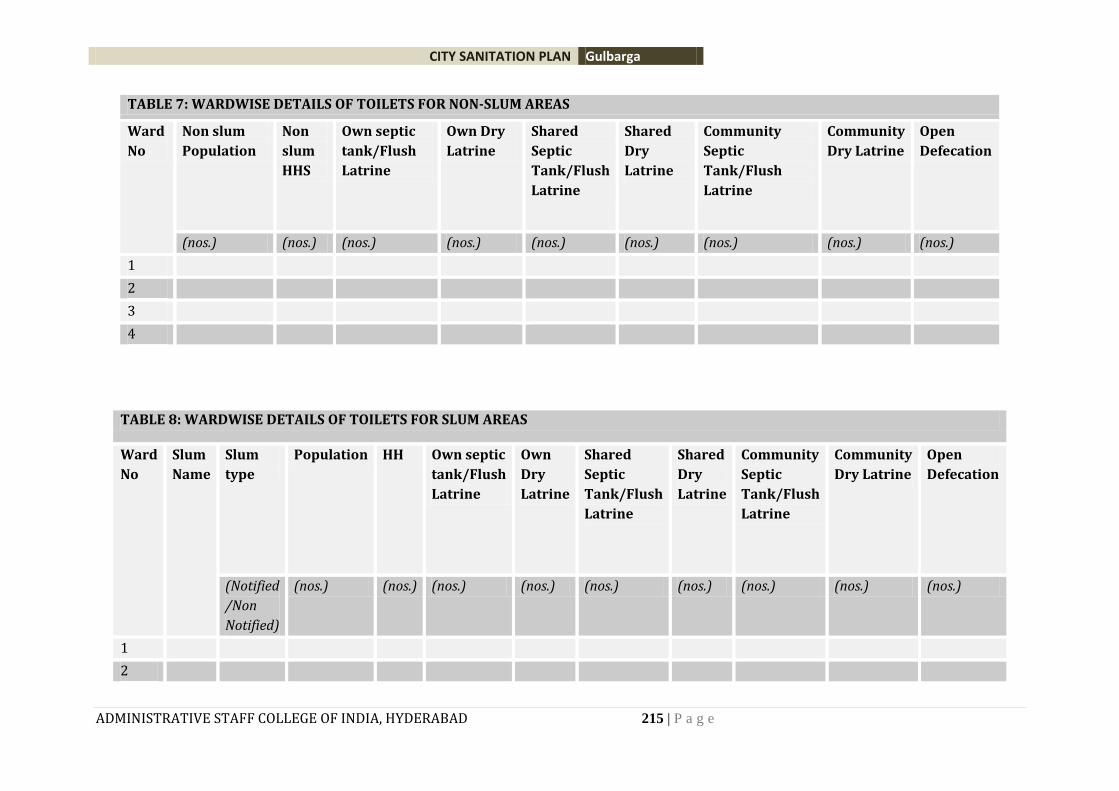
CITY SANITATION PLAN Gulbarga
ADMINISTRATIVE STAFF COLLEGE OF INDIA, HYDERABAD 215 | P a g e
TABLE 7: WARDWISE DETAILS OF TOILETS FOR NON-SLUM AREAS
Ward
No
Non slum
Population
Non
slum
HHS
Own septic
tank/Flush
Latrine
Own Dry
Latrine
Shared
Septic
Tank/Flush
Latrine
Shared
Dry
Latrine
Community
Septic
Tank/Flush
Latrine
Community
Dry Latrine
Open
Defecation
(nos.) (nos.) (nos.) (nos.) (nos.) (nos.) (nos.) (nos.) (nos.)
1
2
3
4
TABLE 8: WARDWISE DETAILS OF TOILETS FOR SLUM AREAS
Ward
No
Slum
Name
Slum
type
Population HH Own septic
tank/Flush
Latrine
Own
Dry
Latrine
Shared
Septic
Tank/Flush
Latrine
Shared
Dry
Latrine
Community
Septic
Tank/Flush
Latrine
Community
Dry Latrine
Open
Defecation
(Notified
/Non
Notified)
(nos.) (nos.) (nos.) (nos.) (nos.) (nos.) (nos.) (nos.) (nos.)
1
2
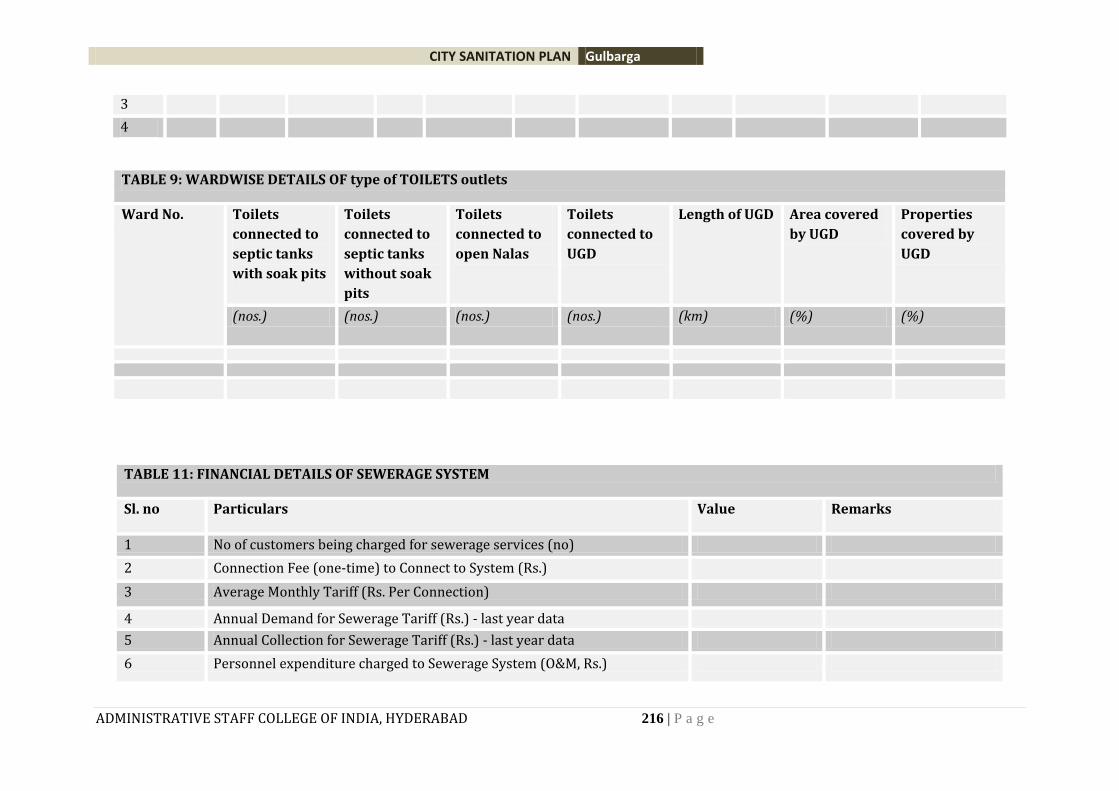
CITY SANITATION PLAN Gulbarga
ADMINISTRATIVE STAFF COLLEGE OF INDIA, HYDERABAD 216 | P a g e
3
4
TABLE 9: WARDWISE DETAILS OF type of TOILETS outlets
Ward No. Toilets
connected to
septic tanks
with soak pits
Toilets
connected to
septic tanks
without soak
pits
Toilets
connected to
open Nalas
Toilets
connected to
UGD
Length of UGD Area covered
by UGD
Properties
covered by
UGD
(nos.) (nos.) (nos.) (nos.) (km) (%) (%)
TABLE 11: FINANCIAL DETAILS OF SEWERAGE SYSTEM
Sl. no Particulars Value Remarks
1 No of customers being charged for sewerage services (no)
2 Connection Fee (one-time) to Connect to System (Rs.)
3 Average Monthly Tariff (Rs. Per Connection)
4 Annual Demand for Sewerage Tariff (Rs.) - last year data
5 Annual Collection for Sewerage Tariff (Rs.) - last year data
6 Personnel expenditure charged to Sewerage System (O&M, Rs.)
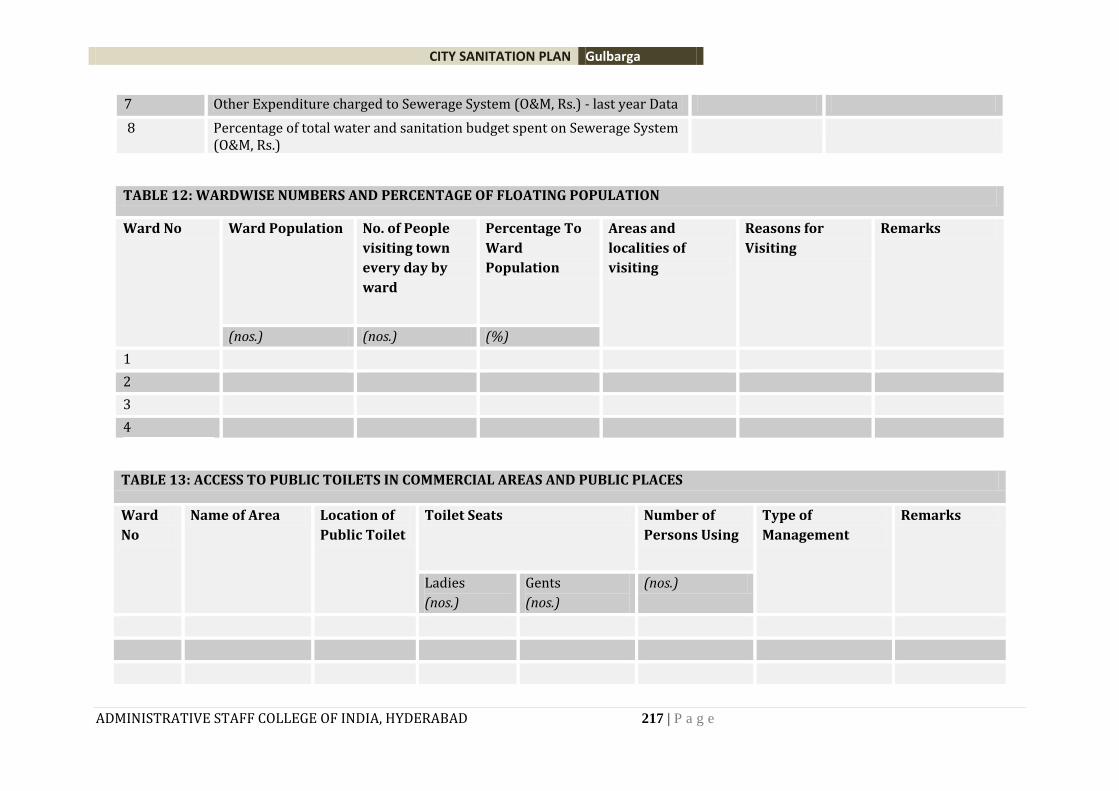
CITY SANITATION PLAN Gulbarga
ADMINISTRATIVE STAFF COLLEGE OF INDIA, HYDERABAD 217 | P a g e
7 Other Expenditure charged to Sewerage System (O&M, Rs.) - last year Data
8 Percentage of total water and sanitation budget spent on Sewerage System (O&M, Rs.)
TABLE 12: WARDWISE NUMBERS AND PERCENTAGE OF FLOATING POPULATION
Ward No Ward Population No. of People
visiting town
every day by
ward
Percentage To
Ward
Population
Areas and
localities of
visiting
Reasons for
Visiting
Remarks
(nos.) (nos.) (%)
1
2
3
4
TABLE 13: ACCESS TO PUBLIC TOILETS IN COMMERCIAL AREAS AND PUBLIC PLACES
Ward
No
Name of Area Location of
Public Toilet
Toilet Seats Number of
Persons Using
Type of
Management
Remarks
Ladies
(nos.)
Gents
(nos.)
(nos.)
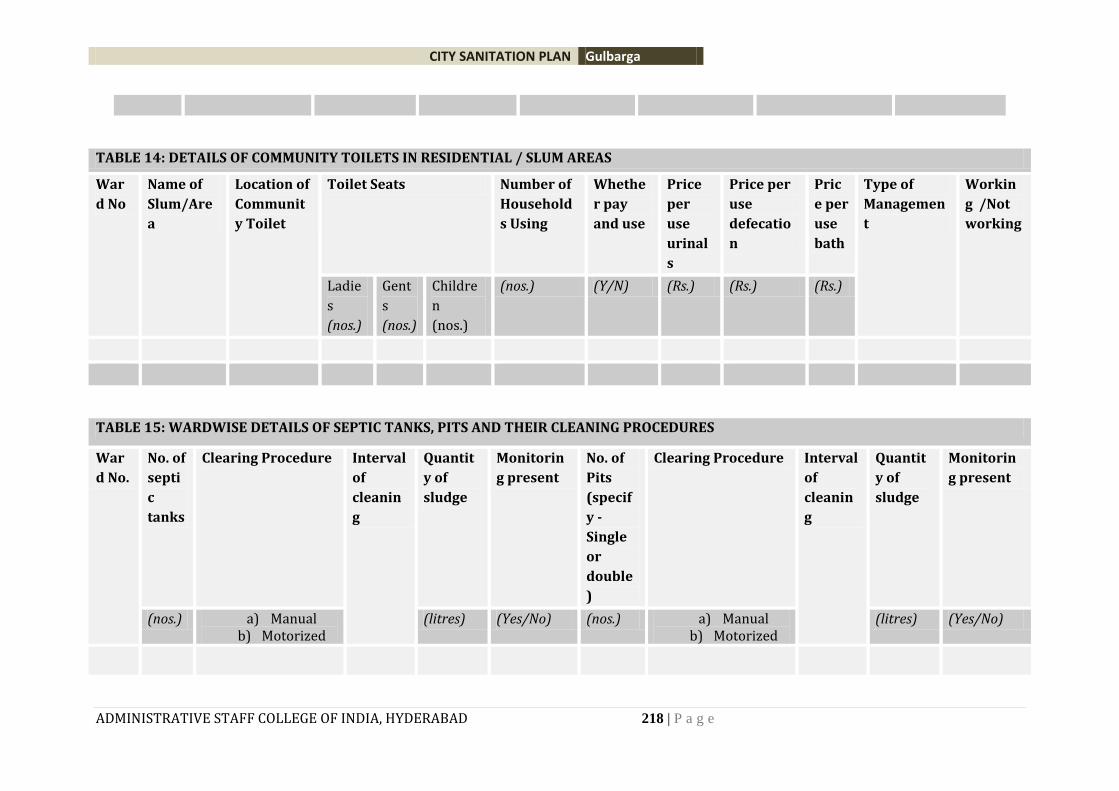
CITY SANITATION PLAN Gulbarga
ADMINISTRATIVE STAFF COLLEGE OF INDIA, HYDERABAD 218 | P a g e
TABLE 14: DETAILS OF COMMUNITY TOILETS IN RESIDENTIAL / SLUM AREAS
War
d No
Name of
Slum/Are
a
Location of
Communit
y Toilet
Toilet Seats Number of
Household
s Using
Whethe
r pay
and use
Price
per
use
urinal
s
Price per
use
defecatio
n
Pric
e per
use
bath
Type of
Managemen
t
Workin
g /Not
working
Ladie
s
(nos.)
Gent
s
(nos.)
Childre
n
(nos.)
(nos.) (Y/N) (Rs.) (Rs.) (Rs.)
TABLE 15: WARDWISE DETAILS OF SEPTIC TANKS, PITS AND THEIR CLEANING PROCEDURES
War
d No.
No. of
septi
c
tanks
Clearing Procedure Interval
of
cleanin
g
Quantit
y of
sludge
Monitorin
g present
No. of
Pits
(specif
y -
Single
or
double
)
Clearing Procedure Interval
of
cleanin
g
Quantit
y of
sludge
Monitorin
g present
(nos.) a) Manual b) Motorized
(litres) (Yes/No) (nos.) a) Manual b) Motorized
(litres) (Yes/No)
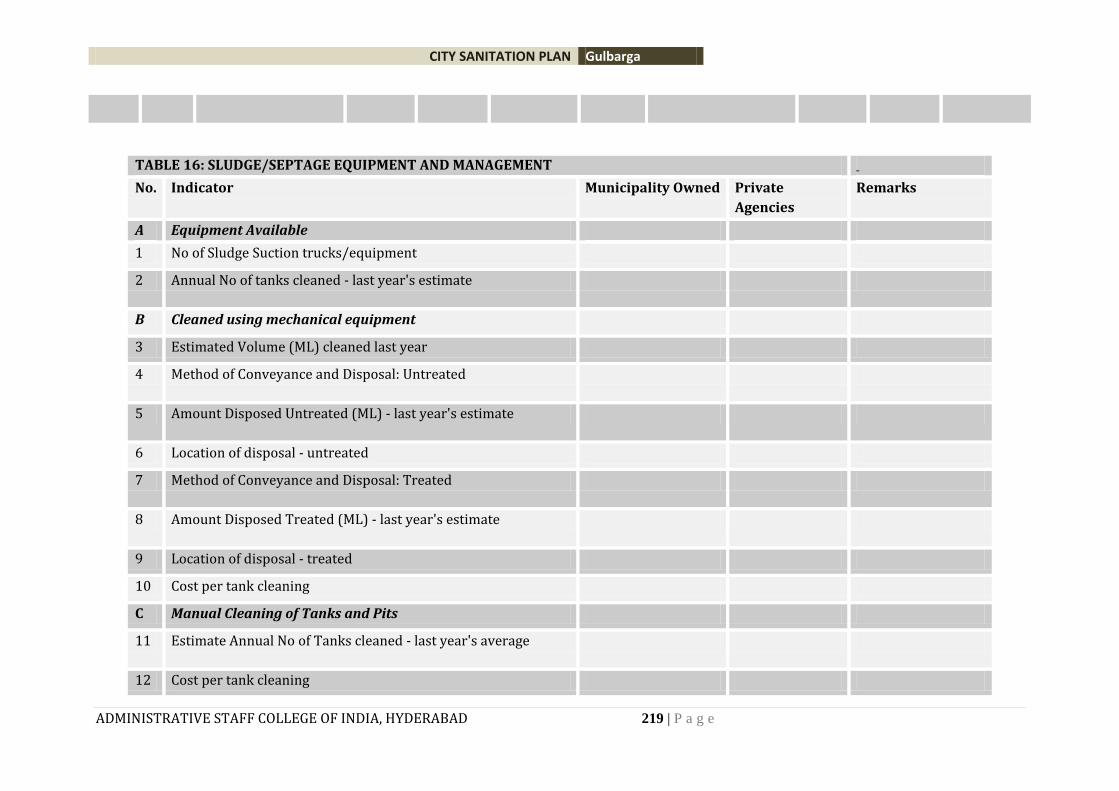
CITY SANITATION PLAN Gulbarga
ADMINISTRATIVE STAFF COLLEGE OF INDIA, HYDERABAD 219 | P a g e
TABLE 16: SLUDGE/SEPTAGE EQUIPMENT AND MANAGEMENT
No. Indicator Municipality Owned Private
Agencies
Remarks
A Equipment Available
1 No of Sludge Suction trucks/equipment
2 Annual No of tanks cleaned - last year's estimate
B Cleaned using mechanical equipment
3 Estimated Volume (ML) cleaned last year
4 Method of Conveyance and Disposal: Untreated
5 Amount Disposed Untreated (ML) - last year's estimate
6 Location of disposal - untreated
7 Method of Conveyance and Disposal: Treated
8 Amount Disposed Treated (ML) - last year's estimate
9 Location of disposal - treated
10 Cost per tank cleaning
C Manual Cleaning of Tanks and Pits
11 Estimate Annual No of Tanks cleaned - last year's average
12 Cost per tank cleaning
CITY SANITATION PLAN Gulbarga
ADMINISTRATIVE STAFF COLLEGE OF INDIA, HYDERABAD 220 | P a g e
13 Method of disposal of sludge cleaned
14 Who are the persons cleaning tanks?
ML = Million Litres
TABLE 17: WARDWISE DETAILS OF GOVT. SCHOOLS AND THEIR SANITATION FACILITIES
Ward No. Name of
the
school
Category No. of toilets No. of toilets
working
Is water
supply
present
in
toilets?
Toilet outlets
Girls Boys Girls Boys Sewerage
system
Septic
tanks
Open
nallas
(PS. UPS,HS) (nos.) (nos.) (nos.) (nos.) (Y/N)
Please find attached questionnaire of school sanitation surveys
TABLE 18: WARDWISE DETAILS OF ANGANWADIS AND THEIR SANITATION FACILITIES
Ward No. Name of
the
Anganwadi
centre
No. of toilets No. of toilets working Is water
supply
present in
toilets?
Toilet outlets
Girls Boys Girls Boys Sewerage
system
Septic
tanks
Open nallas
(nos.) (nos.) (nos.) (nos.) (Y/N)
CITY SANITATION PLAN Gulbarga
ADMINISTRATIVE STAFF COLLEGE OF INDIA, HYDERABAD 221 | P a g e
INFORMATION REQUIRED ON SOLID WASTE MANAGEMENT FACILITIES IN THE ULB
• Waste segregation, process, quantities, • Bio-hazardous/ industrial waste quantity, treatment procedure • Treatment facilities, capacities, identification of dumpsites, area, no. of years of operation, present status • Technology of waste processing and recycling, proportion of waste that is processed and recycled • Category wise numbers of public health workers (cadre, contractual, permanent), provision of safety equipment for them • Complaints redressal system, efficiency • SWM tariff structure • Future SWM projects and proposals
TABLE 19: WARDWISE SWM DETAILS
Ward No SWM generated
Quantity
SWM Collection
Quantity
Door-to-
Door collection HHs
Segregation
practiced
No. of local open
dumpsites
(MT) (MT) (nos.) (Yes/No) (nos.)
1
2
3
4
TABLE 20: DETAILS OF VEHICLES USED FOR DOOR TO DOOR WASTE COLLECTION
CITY SANITATION PLAN Gulbarga
ADMINISTRATIVE STAFF COLLEGE OF INDIA, HYDERABAD 222 | P a g e
Vehicle Type No .of vehicles Capacity of each vehicle
(Tons)
No. of trips Total waste collected
(Tons)
TABLE 21: DETAILS OF VEHICLES USED FOR SECONDARY WASTE TRANSPORTATION
Vehicle Type No. of vehicles Capacity of each vehicle
(Tons)
No. of trips Total waste collected
(Tons)
TABLE 21: DETAILS OF WASTE ACCORDING TO DIFFERENT CATEGORIES
Category of waste Quantity of waste
generated
(MT/Month)
Quantity of
waste collected
(MT/Month)
Category of waste Quantity of waste
generated
(MT/Month)
Quantity of waste
collected
(MT/Month)
Residential Slaughter Houses
Commercial Industries
Street sweeping Construction waste
Market waste Any other (please
specify)
CITY SANITATION PLAN Gulbarga
ADMINISTRATIVE STAFF COLLEGE OF INDIA, HYDERABAD 223 | P a g e
INFORMATION REQUIRED ON WATER SUPPLY SYSTEM IN THE ULB
• Source, treatment facilities, • Capacity, present production • Length of distribution network, coverage • Water quality • Complaints redressal system, efficiency • Water tariff structure • Future water supply projects and proposals
TABLE 22: WARDWISE DETAILS OF WATER SUPPLY SYSTEM
Ward
No.
HHS connected
to Piped Water
(nos.)
No. of
hours per
day
HHS
connected to
stand posts
(nos.)
No. of
hours per
day
HHS connected
to Tube
wells/own
sources and
others
(nos.)
Bulk
connections
(nos.)
Other
properties
connected to
piped water
system
(nos.)
1
2
3
4
5
INFORMATION REQUIRED ON STORM WATER DRAINAGE SYSTEM IN THE ULB
• Outfall points,
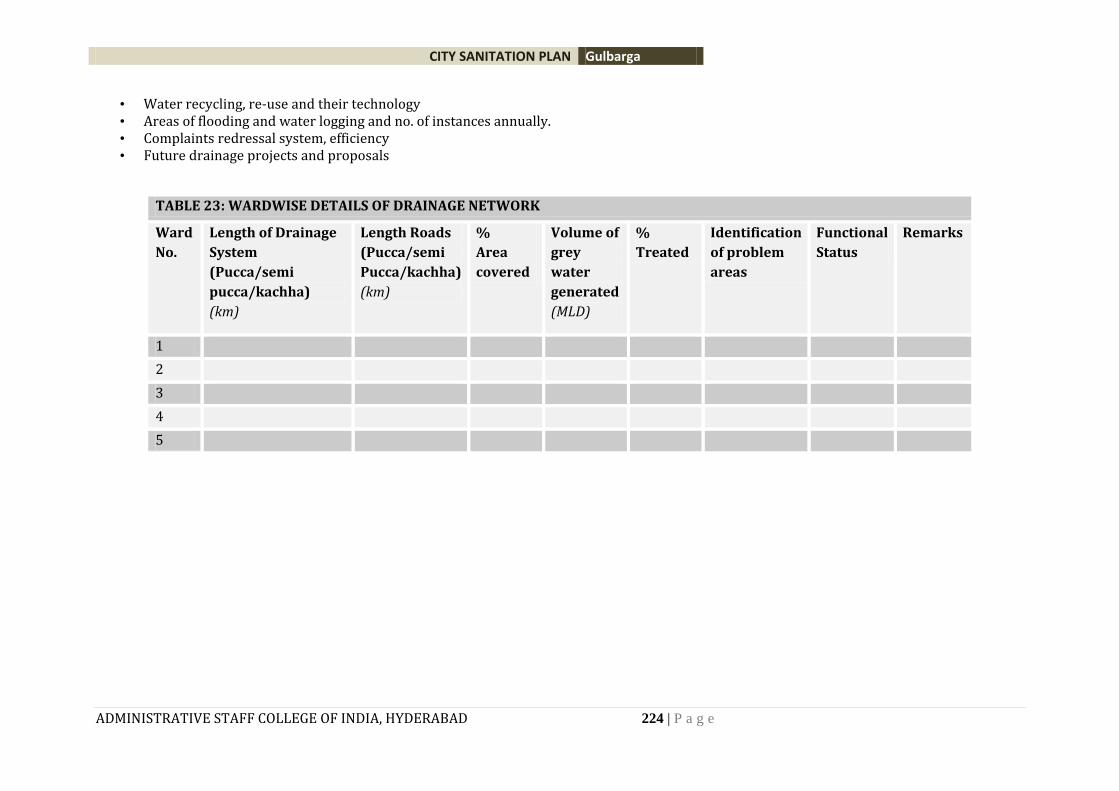
CITY SANITATION PLAN Gulbarga
ADMINISTRATIVE STAFF COLLEGE OF INDIA, HYDERABAD 224 | P a g e
• Water recycling, re-use and their technology • Areas of flooding and water logging and no. of instances annually. • Complaints redressal system, efficiency • Future drainage projects and proposals
TABLE 23: WARDWISE DETAILS OF DRAINAGE NETWORK
Ward
No.
Length of Drainage
System
(Pucca/semi
pucca/kachha)
(km)
Length Roads
(Pucca/semi
Pucca/kachha)
(km)
%
Area
covered
Volume of
grey
water
generated
(MLD)
%
Treated
Identification
of problem
areas
Functional
Status
Remarks
1
2
3
4
5
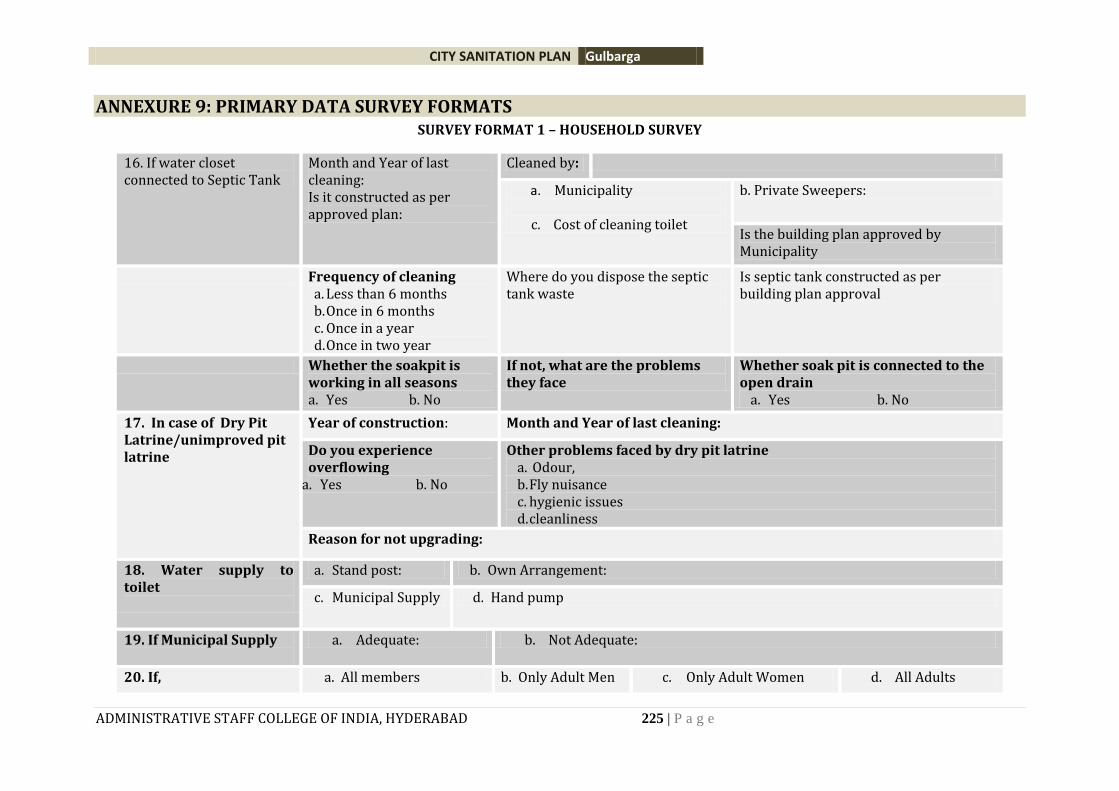
CITY SANITATION PLAN Gulbarga
ADMINISTRATIVE STAFF COLLEGE OF INDIA, HYDERABAD 225 | P a g e
ANNEXURE 9: PRIMARY DATA SURVEY FORMATS SURVEY FORMAT 1 – HOUSEHOLD SURVEY
16. If water closet connected to Septic Tank
Month and Year of last cleaning: Is it constructed as per approved plan:
Cleaned by:
a. Municipality
c. Cost of cleaning toilet
b. Private Sweepers:
Is the building plan approved by Municipality
Frequency of cleaning a. Less than 6 months b. Once in 6 months c. Once in a year d. Once in two year
Where do you dispose the septic tank waste
Is septic tank constructed as per building plan approval
Whether the soakpit is working in all seasons a. Yes b. No
If not, what are the problems they face
Whether soak pit is connected to the open drain
a. Yes b. No
17. In case of Dry Pit Latrine/unimproved pit latrine
Year of construction: Month and Year of last cleaning:
Do you experience overflowing
a. Yes b. No
Other problems faced by dry pit latrine a. Odour, b. Fly nuisance c. hygienic issues d. cleanliness
Reason for not upgrading:
18. Water supply to toilet
a. Stand post: b. Own Arrangement:
c. Municipal Supply d. Hand pump
19. If Municipal Supply
a. Adequate: b. Not Adequate:
20. If, a. All members b. Only Adult Men c. Only Adult Women d. All Adults
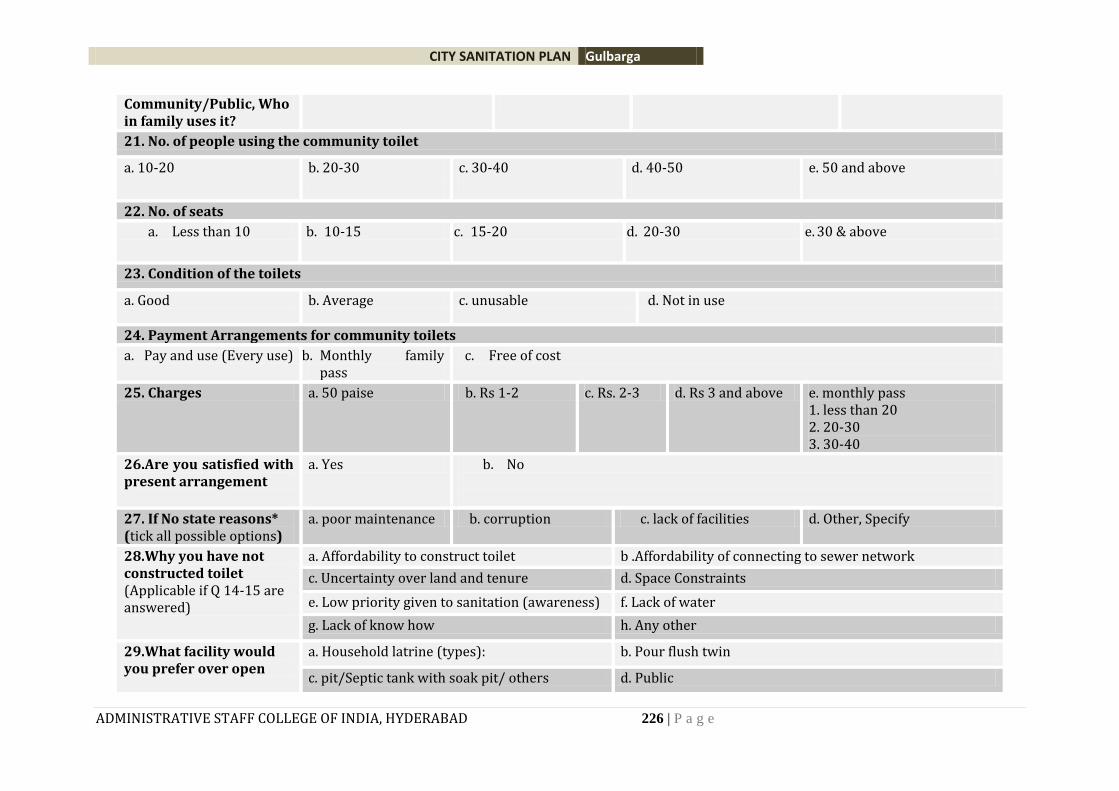
CITY SANITATION PLAN Gulbarga
ADMINISTRATIVE STAFF COLLEGE OF INDIA, HYDERABAD 226 | P a g e
Community/Public, Who in family uses it?
21. No. of people using the community toilet
a. 10-20 b. 20-30
c. 30-40
d. 40-50
e. 50 and above
22. No. of seats
a. Less than 10 b. 10-15 c. 15-20 d. 20-30 e. 30 & above
23. Condition of the toilets
a. Good b. Average c. unusable d. Not in use
24. Payment Arrangements for community toilets
a. Pay and use (Every use) b. Monthly family pass
c. Free of cost
25. Charges a. 50 paise b. Rs 1-2 c. Rs. 2-3 d. Rs 3 and above e. monthly pass 1. less than 20 2. 20-30 3. 30-40
26.Are you satisfied with present arrangement
a. Yes b. No
27. If No state reasons* (tick all possible options)
a. poor maintenance b. corruption c. lack of facilities d. Other, Specify
28.Why you have not constructed toilet (Applicable if Q 14-15 are answered)
a. Affordability to construct toilet b .Affordability of connecting to sewer network
c. Uncertainty over land and tenure d. Space Constraints
e. Low priority given to sanitation (awareness) f. Lack of water
g. Lack of know how h. Any other
29.What facility would you prefer over open
a. Household latrine (types): b. Pour flush twin
c. pit/Septic tank with soak pit/ others d. Public
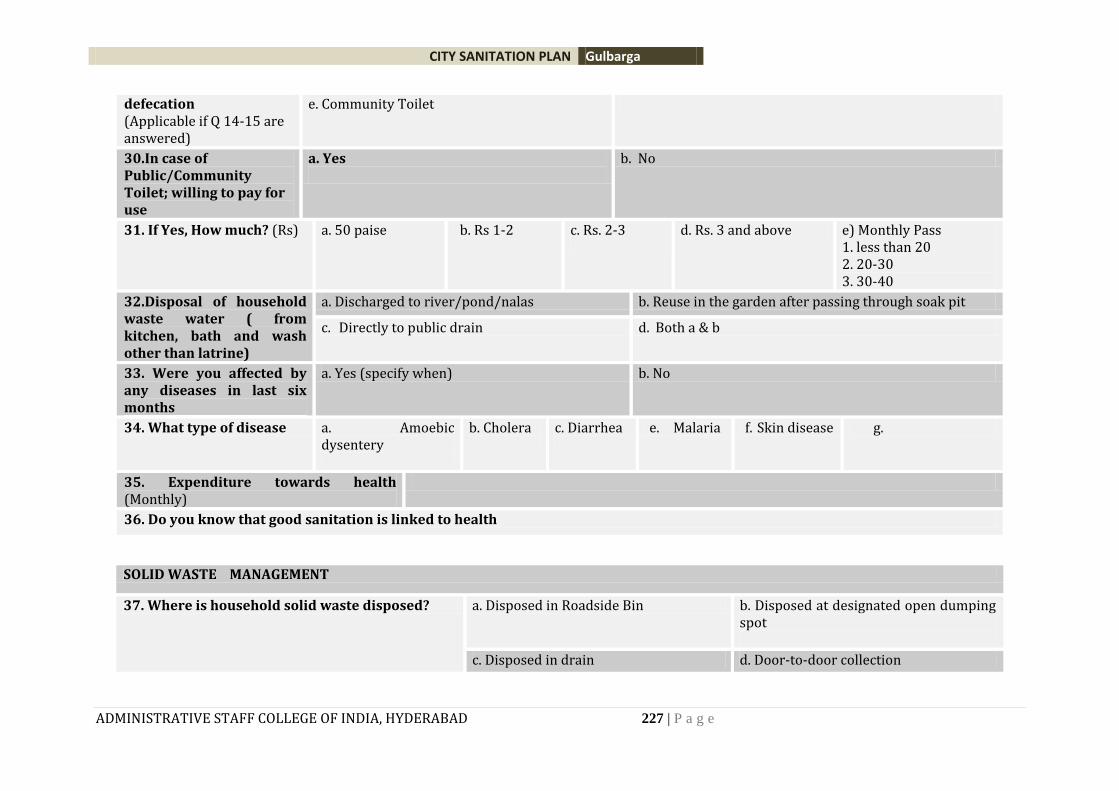
CITY SANITATION PLAN Gulbarga
ADMINISTRATIVE STAFF COLLEGE OF INDIA, HYDERABAD 227 | P a g e
defecation (Applicable if Q 14-15 are answered)
e. Community Toilet
30.In case of Public/Community Toilet; willing to pay for use
a. Yes
b. No
31. If Yes, How much? (Rs) a. 50 paise b. Rs 1-2 c. Rs. 2-3
d. Rs. 3 and above e) Monthly Pass 1. less than 20 2. 20-30 3. 30-40
32.Disposal of household waste water ( from kitchen, bath and wash other than latrine)
a. Discharged to river/pond/nalas b. Reuse in the garden after passing through soak pit
c. Directly to public drain d. Both a & b
33. Were you affected by any diseases in last six months
a. Yes (specify when) b. No
34. What type of disease a. Amoebic dysentery
b. Cholera
c. Diarrhea
e. Malaria f. Skin disease g.
35. Expenditure towards health (Monthly)
36. Do you know that good sanitation is linked to health
SOLID WASTE MANAGEMENT
37. Where is household solid waste disposed? a. Disposed in Roadside Bin b. Disposed at designated open dumping spot
c. Disposed in drain d. Door-to-door collection
CITY SANITATION PLAN Gulbarga
ADMINISTRATIVE STAFF COLLEGE OF INDIA, HYDERABAD 228 | P a g e
38. Distance to Disposal Spot (Feet)
a. Less than 50 b. 50 to 100
c. 100 to 200 d. 200 to 500
e. More than 500
39. Does municipality carry the waste dumped in your locality?
a. Yes
b. No
40. Do you have door to door collection?
a. Yes
b. No
41. Frequency of collection? a. Daily twice
b. Daily once
c. Once in 2 days
d. Once in three days
e. Three days & Above
42. Is the waste segregated at the source?
a. Yes
b. No
43. Do you pay for the waste collected from the municipality?
a. Yes
b. No
44.How much do you pay
(Rs per month)
a. 0-10 b. 10-20 c. 20-25 d. 25-30 e. 30-35 e. 35 and above
45.Are you satisfied with the service a. Very good b. Good c. Average d. Bad
46. Frequency of road sweeping a. Daily once b. Once in two days
c. Twice weekly
d. Once in a week e. Irregular
47.Frequency of cleaning drains a. Daily once b. Once in two days
c. once in 3 days
d. once in a week e. Irregular
Housing
48. Structure a) Pucca b) semi-Pucca c) Kutcha
Flooding
CITY SANITATION PLAN Gulbarga
ADMINISTRATIVE STAFF COLLEGE OF INDIA, HYDERABAD 229 | P a g e
49. Whether the area is prone to flooding during rains? a) Yes b) No
50. Frequency of flooding/Water Logging a) During rainy season b) Once in a while
Sewerage
51. Do you have sewer connection? a) Yes b) No
52. If yes, How much do you pay? a) 20-50 b) 50-80 c) 80-100 d) 100-130 e) 130-150 f) 150-180
g) 180 & above
Grievance redressal mechanism
53. whom do you approach to give your complaint Regarding sanitation and water supply?
a) Sanitary Supervisor
b) Corporator c) MLA
d) NGO e) RWA f) others (Specify)
54. How do you make complaints? a) Direct (By word)
b) Letter
c) Phone d) Internet
55.Time taken to solve the problem
1) Water leakage a) 0-5 Hours b) 5-10 Hours c)10-15 Hours d)Within 24 Hours
2) Solid Waste Management
a) 0-5 Hours b) 5-10 Hours c) 10-24 Hours e) More than a day
3) Sanitation a) 0-24 Hours
b) Two Day c) Three days d) More than 3 days
56. Are you satisfied with present system a) Highly Satisfied b) Satisfied c) Partially d) Bad e)worse
57. Are you informed about City Sanitation if yes how?
YES/ No How: News paper Advertisement Wall poster
Suggestions:
1. Open Defecation 2. Disposal of Sludge 3. Disposal of Liquid waste (Black and grey)
CITY SANITATION PLAN Gulbarga
ADMINISTRATIVE STAFF COLLEGE OF INDIA, HYDERABAD 230 | P a g e
SURVEY FORMAT - 02
COMMUNICATION NEED ASSESSMENT: FOCUSED GROUP DISCUSSIONS (FGD)
The key idea is to carry out a needs assessment within the existing infrastructure as well as the strategy to go with expansion of infrastructure. Following steps identified before visiting the field.
1. Identifying stakeholder groups and available channels of communication categorize them
2. Focus Group Discussions, Interviews, Transect Walks. 3. Topic Guides were prepared for each stakeholder group. 4. Data Collection. Field assessment of communications needs was carried out.
Stakeholders: FGDs will target the stakeholder groups eg. Residents, establishments and ULB officials. Opinion leaders also needs to be targeted as a high influence group both for interviews and implementation of communications strategies. Following are the key personnel to be interviewed:
• Key officials-Commissioners, sanitation inspectors, medical/health officers, • Councilors, Community elders, • City media: newspapers reporters, • RWA office bearers, • NGOs, • Safaikaramcharies union office bearers, • Heads of Commercial establishments and shopkeepers, including public places such as bus - stands • Random Samples of Residents from Rich neighborhoods. • Slum residents • School teachers, employees • School children Hospital employees and doctors
IEC Probes for field trip
As per the City Sanitation Rankings the OUPUT, PROCESS and OUTCOME indicators cover a whole range of issues such as, Quality of water supply (also in non-slum areas), Practices of SWM, dumping, segregation at source, collection (also in non-slum areas), ODF, types of latrines, problems and gaps. We conduct FGDs with reference to how city fared on each of these indicators.
1. Residents in Slum
• Awareness regarding Health and Hygiene: The current level of awareness regarding ill-effects of lack of sanitation, ODF, Hand washing, SWM etc
• Awareness regarding Govt. policies for improving water and sanitation: NUSP, Sources and channels of such knowledge and communication
• Awareness regarding technical options such as Toilet options
• Willingness to upgrade financial and behavioral constraints
• Participation in any public awareness campaign regarding sanitation, Agencies that carried the campaign and learning’s from the campaign
• Activities of local SHG's and other community organization, areas of engagement
• In non-slum areas - check for RWAs
CITY SANITATION PLAN Gulbarga
ADMINISTRATIVE STAFF COLLEGE OF INDIA, HYDERABAD 231 | P a g e
• Media consumption patterns reading newspapers, Cable TV etc (also in non-slum areas)
• Information regarding demography of the slum (To be gathered from surveys)
• Complaint resolution system: complaints and mechanisms of resolution, how do they deal with water and sanitation crisis, Approaching local corporator, Complain to Municipality, Agitate
2. Municipal officials (including Safaikaramcharies)
• Role envisaged for communication for implementing NUSP.
• Channels of communication are at ULB’s disposal, Extent to which these channels are being exploited.
• Technological options, geographic and infrastructural issues involved in implementing Water and Sanitation schemes.
• M&E, feedback, support, rewards: Maintenance of citizen grievance records, discernible patterns in complaints, efficiency of complaint redressal.
• Details of any specific communication campaign being take up, Content, Channels used, budget allocated, awareness regarding multiplying message through media.
• Kinds of training and tools are given to Safaikaramcharies for safe disposal of waste etc and their satisfaction at what has been provided.
3. Commercial establishment and Public places
• Observation regarding sanitation is these places
• Practices involved in disposal of commercial waste such as segregation, shopkeeper participation
• O&M, regular upkeep of public places
4. School Sanitation
Status of school sanitation Health Problems issues-drop out rates/ enrollment rates, girl children, status of SSA , O&M problems, Health problems.
5. Hospitals
Examine Disposal of hazardous waste, specifically if effluents are being left into open drains
Disease burden of the town, data from District Medical/Health Officer, information on campaigns to mitigate, budget allocated
Disease burden, Diarrhea, GET, Cholera, Malaria, Skin problems Communication efforts with reference to diarrhea, malaria etc.
6. Media Persons
Main Sanitation issues in the city Sanitation news stories Municipality PR. Who answers media enquiries? Municipal Advertisements in dailies.
CITY SANITATION PLAN Gulbarga
ADMINISTRATIVE STAFF COLLEGE OF INDIA, HYDERABAD 232 | P a g e
Checklists
1. Messages: Behavior change communication for residents, sustaining behavior and attitude change, attitudes of officials. Creating awareness about health and hygiene, environmental sanitation, helping officials be good listeners, improving management within existing constraints through better communication. Developing content for manuals for best communication practices, posters etc.
2. Channels of communication: these include grievance redressal mechanism of the MC, MC’s interaction with people- feedback seeking mechanisms, postures, hoardings, exhibitions, school activities, cable TV, FM Radio, Handbills, Newspapers, Street Plays, Meetings/seminars, workshops, presentations and interpersonal means.
Interpersonal means include interactive group education and door to door motivational programmes. Here the role of NGO’s is important.
3. Parameters: OUTPUT, PROCESS, OUTCOME as per NUSP
• Environmental Sanitation
SWM: market waste, domestic waste, waste segregation at source and at collection point, waste disposal measures
Treatment of solid waste and dump Deviance on part of polluters and institutions such as hospitals Proportion of solid waste, grey water, black water generated that is treated and
disposed safely ODF: public toilets, individual latrines, toilet maintenance, disposal of human waste, M&E to Track OD Check if Sewage systems are working properly Disposal of septage UGS: awareness, usercharges, problems Water, Quality of water in the city, in the water bodies in and around city, Reduction in water borne diseases amongst city-population
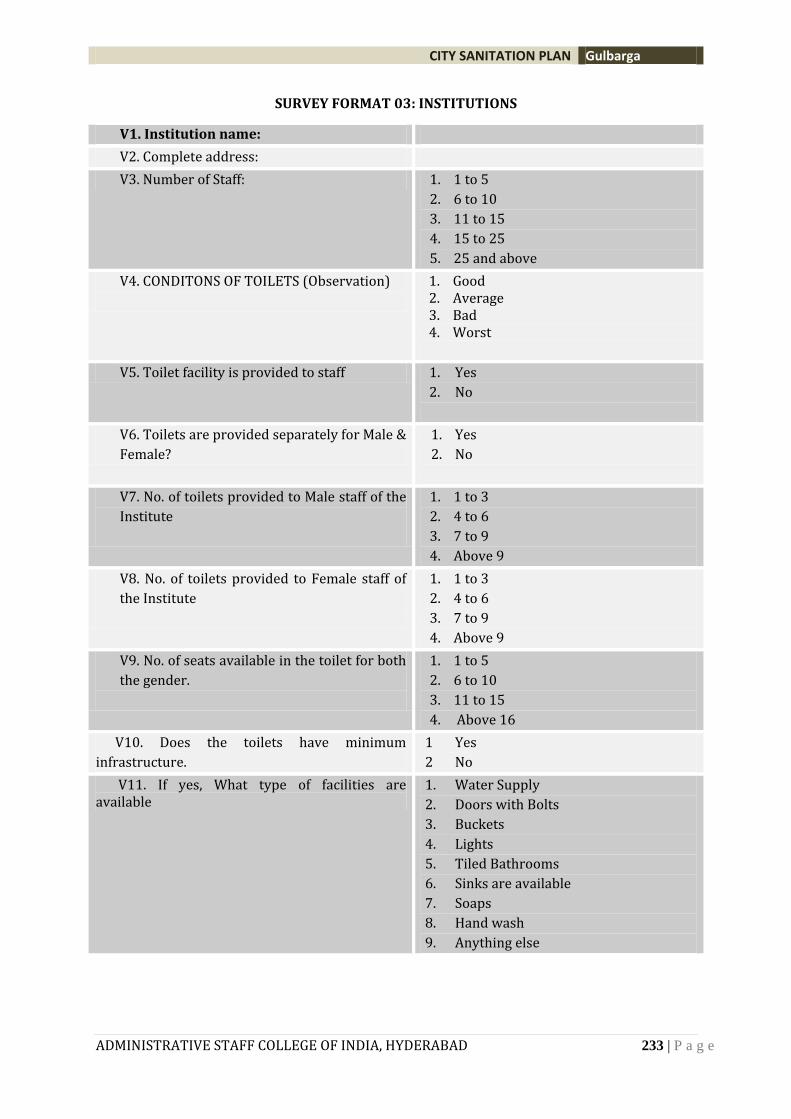
CITY SANITATION PLAN Gulbarga
ADMINISTRATIVE STAFF COLLEGE OF INDIA, HYDERABAD 233 | P a g e
SURVEY FORMAT 03: INSTITUTIONS
V1. Institution name:
V2. Complete address:
V3. Number of Staff: 1. 1 to 5
2. 6 to 10
3. 11 to 15
4. 15 to 25
5. 25 and above
V4. CONDITONS OF TOILETS (Observation)
1. Good 2. Average 3. Bad 4. Worst
V5. Toilet facility is provided to staff 1. Yes
2. No
V6. Toilets are provided separately for Male &
Female?
1. Yes
2. No
V7. No. of toilets provided to Male staff of the
Institute
1. 1 to 3
2. 4 to 6
3. 7 to 9
4. Above 9
V8. No. of toilets provided to Female staff of
the Institute
1. 1 to 3
2. 4 to 6
3. 7 to 9
4. Above 9
V9. No. of seats available in the toilet for both
the gender.
1. 1 to 5
2. 6 to 10
3. 11 to 15
4. Above 16
V10. Does the toilets have minimum
infrastructure.
1 Yes
2 No
V11. If yes, What type of facilities are available
1. Water Supply
2. Doors with Bolts
3. Buckets
4. Lights
5. Tiled Bathrooms
6. Sinks are available
7. Soaps
8. Hand wash
9. Anything else
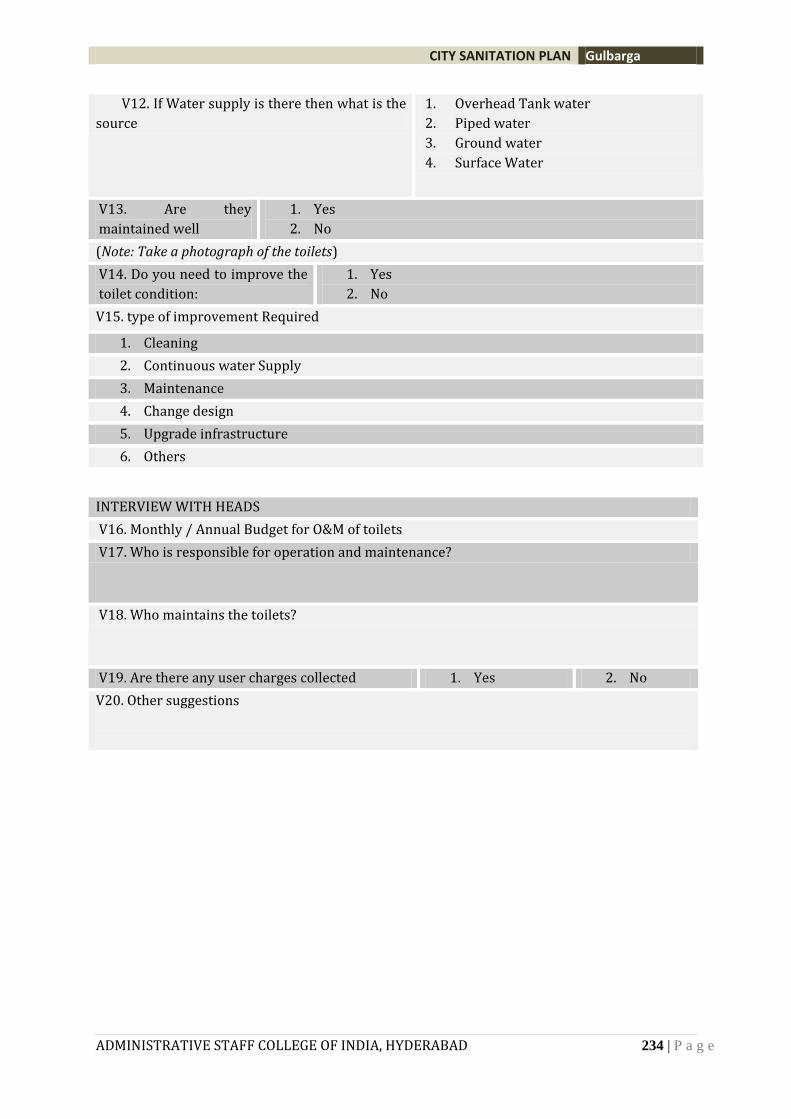
CITY SANITATION PLAN Gulbarga
ADMINISTRATIVE STAFF COLLEGE OF INDIA, HYDERABAD 234 | P a g e
V12. If Water supply is there then what is the
source
1. Overhead Tank water
2. Piped water
3. Ground water
4. Surface Water
V13. Are they
maintained well
1. Yes
2. No
(Note: Take a photograph of the toilets)
V14. Do you need to improve the
toilet condition:
1. Yes
2. No
V15. type of improvement Required
1. Cleaning
2. Continuous water Supply
3. Maintenance
4. Change design
5. Upgrade infrastructure
6. Others
INTERVIEW WITH HEADS
V16. Monthly / Annual Budget for O&M of toilets
V17. Who is responsible for operation and maintenance?
V18. Who maintains the toilets?
V19. Are there any user charges collected 1. Yes 2. No
V20. Other suggestions
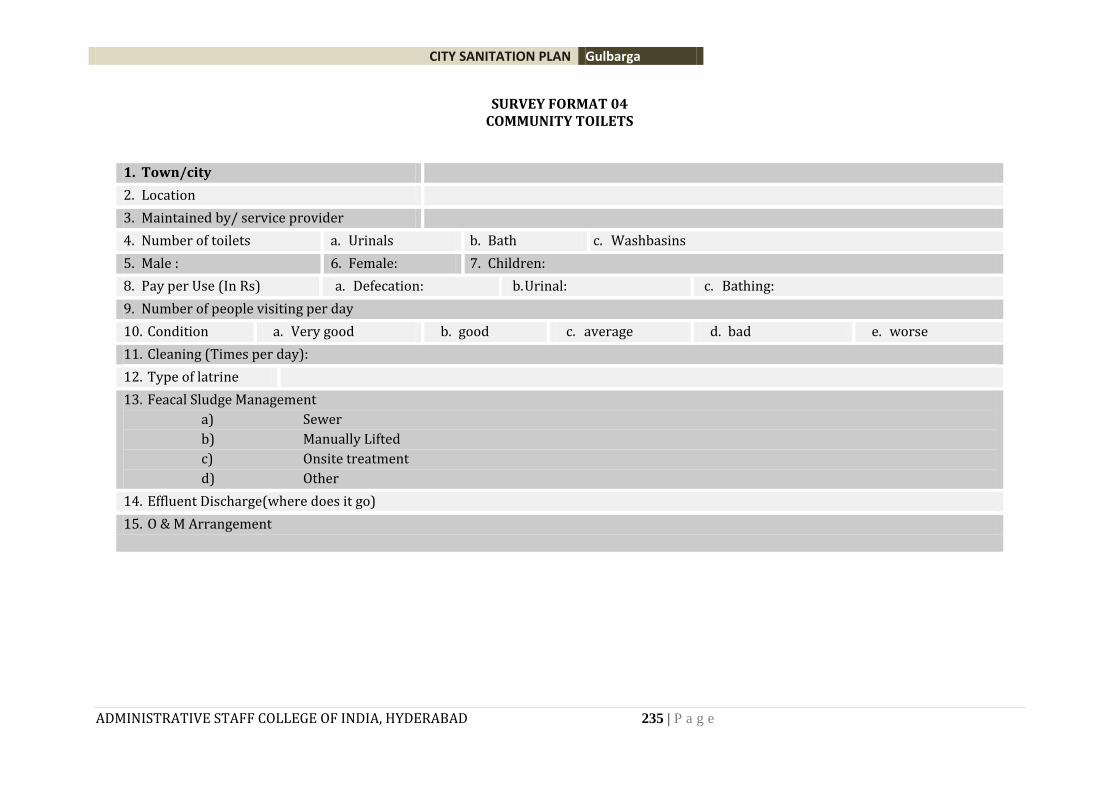
CITY SANITATION PLAN Gulbarga
ADMINISTRATIVE STAFF COLLEGE OF INDIA, HYDERABAD 235 | P a g e
SURVEY FORMAT 04 COMMUNITY TOILETS
1. Town/city
2. Location
3. Maintained by/ service provider
4. Number of toilets a. Urinals b. Bath c. Washbasins
5. Male : 6. Female: 7. Children:
8. Pay per Use (In Rs) a. Defecation: b. Urinal: c. Bathing:
9. Number of people visiting per day
10. Condition a. Very good b. good c. average d. bad e. worse
11. Cleaning (Times per day):
12. Type of latrine
13. Feacal Sludge Management
a) Sewer
b) Manually Lifted
c) Onsite treatment
d) Other
14. Effluent Discharge(where does it go)
15. O & M Arrangement
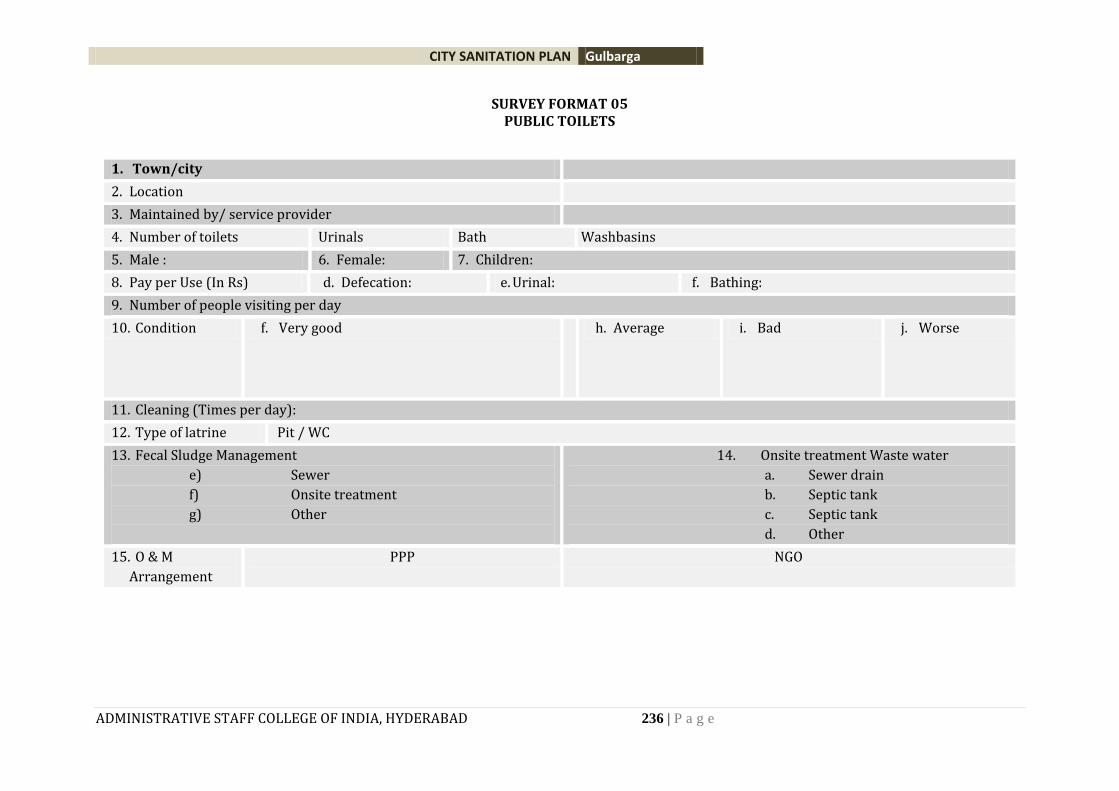
CITY SANITATION PLAN Gulbarga
ADMINISTRATIVE STAFF COLLEGE OF INDIA, HYDERABAD 236 | P a g e
SURVEY FORMAT 05 PUBLIC TOILETS
1. Town/city
2. Location
3. Maintained by/ service provider
4. Number of toilets Urinals Bath Washbasins
5. Male : 6. Female: 7. Children:
8. Pay per Use (In Rs) d. Defecation: e. Urinal: f. Bathing:
9. Number of people visiting per day
10. Condition f. Very good g. g
o
o
d
h. Average i. Bad j. Worse
11. Cleaning (Times per day):
12. Type of latrine Pit / WC
13. Fecal Sludge Management
e) Sewer
f) Onsite treatment
g) Other
14. Onsite treatment Waste water
a. Sewer drain
b. Septic tank
c. Septic tank
d. Other
15. O & M
Arrangement
PPP NGO
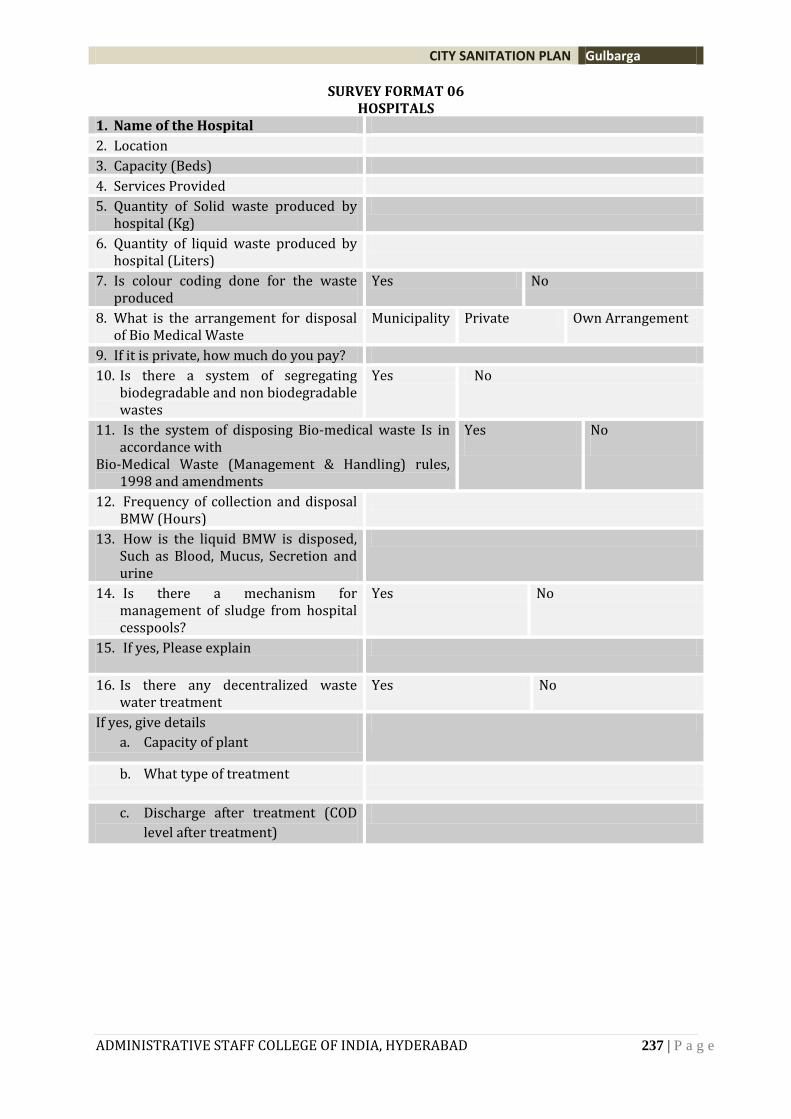
CITY SANITATION PLAN Gulbarga
ADMINISTRATIVE STAFF COLLEGE OF INDIA, HYDERABAD 237 | P a g e
SURVEY FORMAT 06 HOSPITALS
1. Name of the Hospital
2. Location
3. Capacity (Beds)
4. Services Provided
5. Quantity of Solid waste produced by hospital (Kg)
6. Quantity of liquid waste produced by hospital (Liters)
7. Is colour coding done for the waste produced
Yes No
8. What is the arrangement for disposal of Bio Medical Waste
Municipality Private Own Arrangement
9. If it is private, how much do you pay?
10. Is there a system of segregating biodegradable and non biodegradable wastes
Yes No
11. Is the system of disposing Bio-medical waste Is in accordance with
Bio-Medical Waste (Management & Handling) rules, 1998 and amendments
Yes
No
12. Frequency of collection and disposal BMW (Hours)
13. How is the liquid BMW is disposed, Such as Blood, Mucus, Secretion and urine
14. Is there a mechanism for management of sludge from hospital cesspools?
Yes No
15. If yes, Please explain
16. Is there any decentralized waste water treatment
Yes No
If yes, give details
a. Capacity of plant
b. What type of treatment
c. Discharge after treatment (COD
level after treatment)
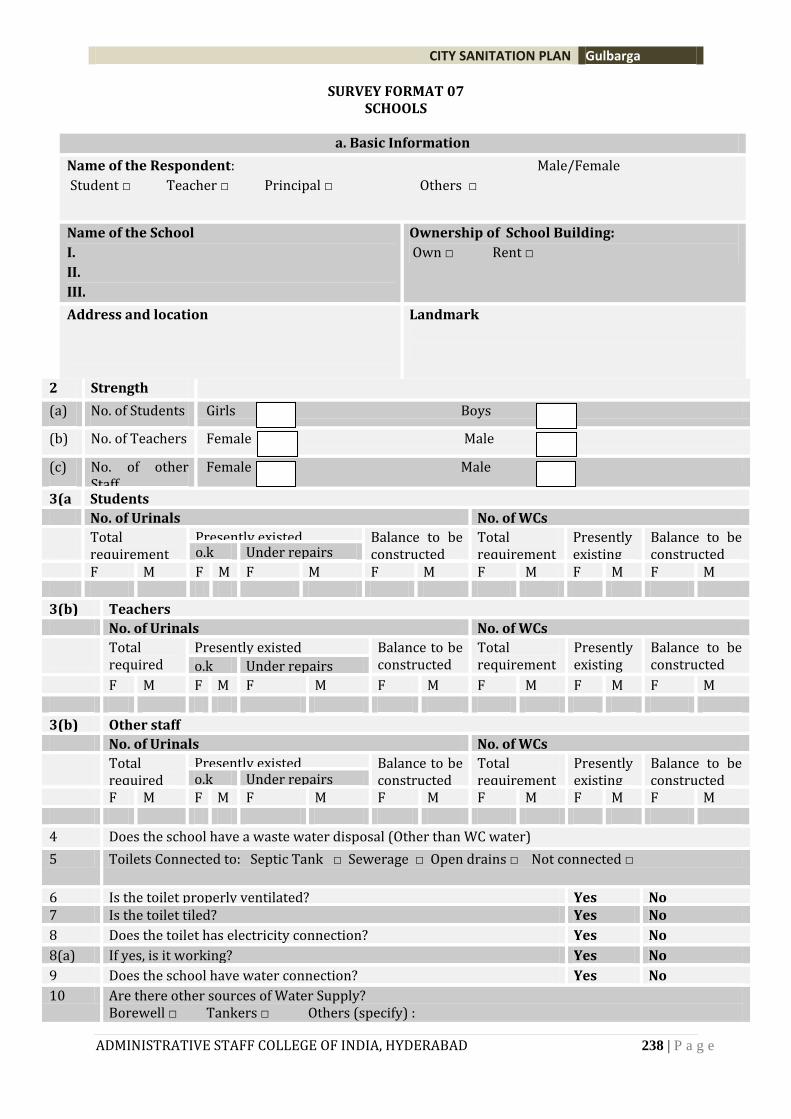
CITY SANITATION PLAN Gulbarga
ADMINISTRATIVE STAFF COLLEGE OF INDIA, HYDERABAD 238 | P a g e
SURVEY FORMAT 07 SCHOOLS
2
Strength No. of Students
(a) No. of Students Girls Boys
(b) No. of Teachers Female Male
(c) No. of other Staff
Female Male
3(a Students
No. of Urinals No. of WCs
Total requirement
Presently existed Balance to be constructed
Total requirement
Presently existing
Balance to be constructed o.k Under repairs
F M F M F M F M F M F M F M
3(b) Teachers
No. of Urinals No. of WCs
Total required
Presently existed Balance to be constructed
Total requirement
Presently existing
Balance to be constructed o.k Under repairs
F M F M F M F M F M F M F M
3(b) Other staff
No. of Urinals No. of WCs
Total required
Presently existed Balance to be constructed
Total requirement
Presently existing
Balance to be constructed o.k Under repairs
F M F M F M F M F M F M F M
4 Does the school have a waste water disposal (Other than WC water) Yes
No
5 Toilets Connected to: Septic Tank □ Sewerage □ Open drains □ Not connected □
6 Is the toilet properly ventilated? Yes No 7 Is the toilet tiled? Yes No
8 Does the toilet has electricity connection? Yes No
8(a) If yes, is it working? Yes No
9 Does the school have water connection? Yes No
10 Are there other sources of Water Supply? Borewell □ Tankers □ Others (specify) :
a. Basic Information
Name of the Respondent: Male/Female
Student □ Teacher □ Principal □ Others □
Name of the School
I.
II.
III.
Ownership of School Building:
Own □ Rent □
Address and location
Landmark
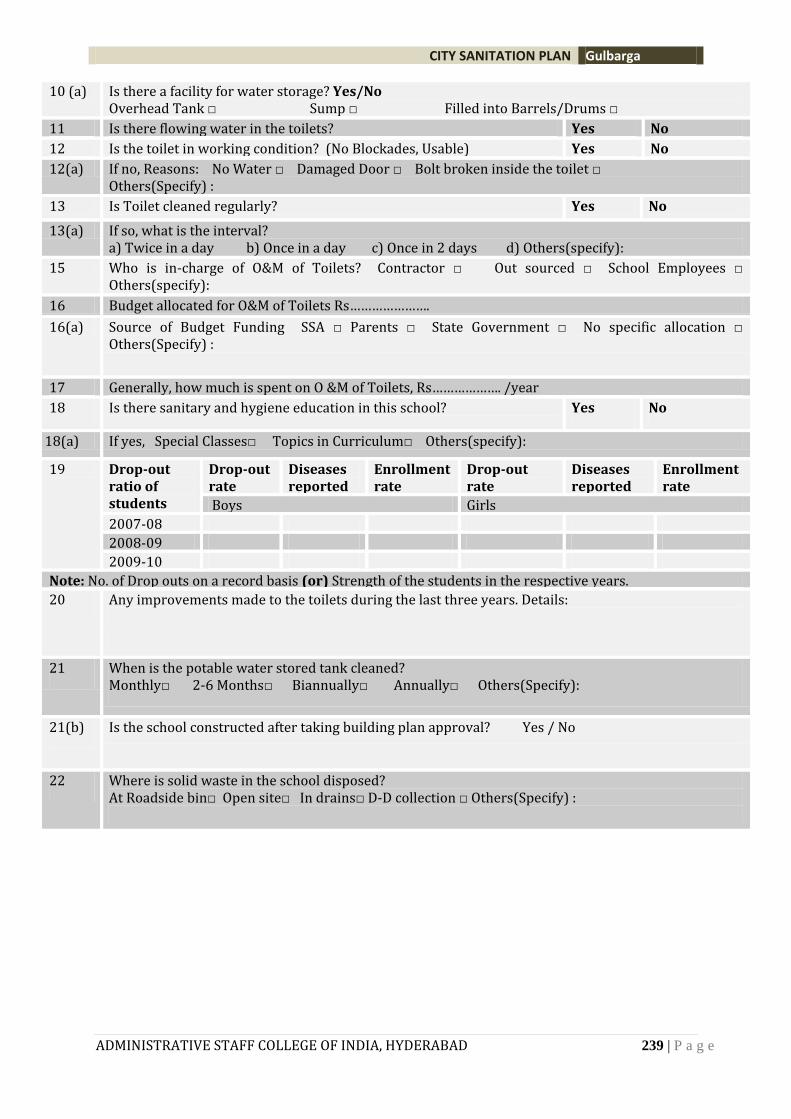
CITY SANITATION PLAN Gulbarga
ADMINISTRATIVE STAFF COLLEGE OF INDIA, HYDERABAD 239 | P a g e
10 (a) Is there a facility for water storage? Yes/No Overhead Tank □ Sump □ Filled into Barrels/Drums □
11 Is there flowing water in the toilets? Yes No
12 Is the toilet in working condition? (No Blockades, Usable) Yes No
12(a) If no, Reasons: No Water □ Damaged Door □ Bolt broken inside the toilet □ Others(Specify) :
13 Is Toilet cleaned regularly? Yes No
13(a) If so, what is the interval? a) Twice in a day b) Once in a day c) Once in 2 days d) Others(specify):
15 Who is in-charge of O&M of Toilets? Contractor □ Out sourced □ School Employees □ Others(specify):
16 Budget allocated for O&M of Toilets Rs………………….
16(a) Source of Budget Funding SSA □ Parents □ State Government □ No specific allocation □ Others(Specify) :
17 Generally, how much is spent on O &M of Toilets, Rs………………. /year
18 Is there sanitary and hygiene education in this school? Yes No
18(a) If yes, Special Classes□ Topics in Curriculum□ Others(specify):
19 Drop-out ratio of students
Drop-out rate
Diseases reported
Enrollment rate
Drop-out rate
Diseases reported
Enrollment rate
Boys Girls
2007-08
2008-09
2009-10
Note: No. of Drop outs on a record basis (or) Strength of the students in the respective years.
20 Any improvements made to the toilets during the last three years. Details:
21 When is the potable water stored tank cleaned? Monthly□ 2-6 Months□ Biannually□ Annually□ Others(Specify):
21(b) Is the school constructed after taking building plan approval? Yes / No
22 Where is solid waste in the school disposed? At Roadside bin□ Open site□ In drains□ D-D collection □ Others(Specify) :
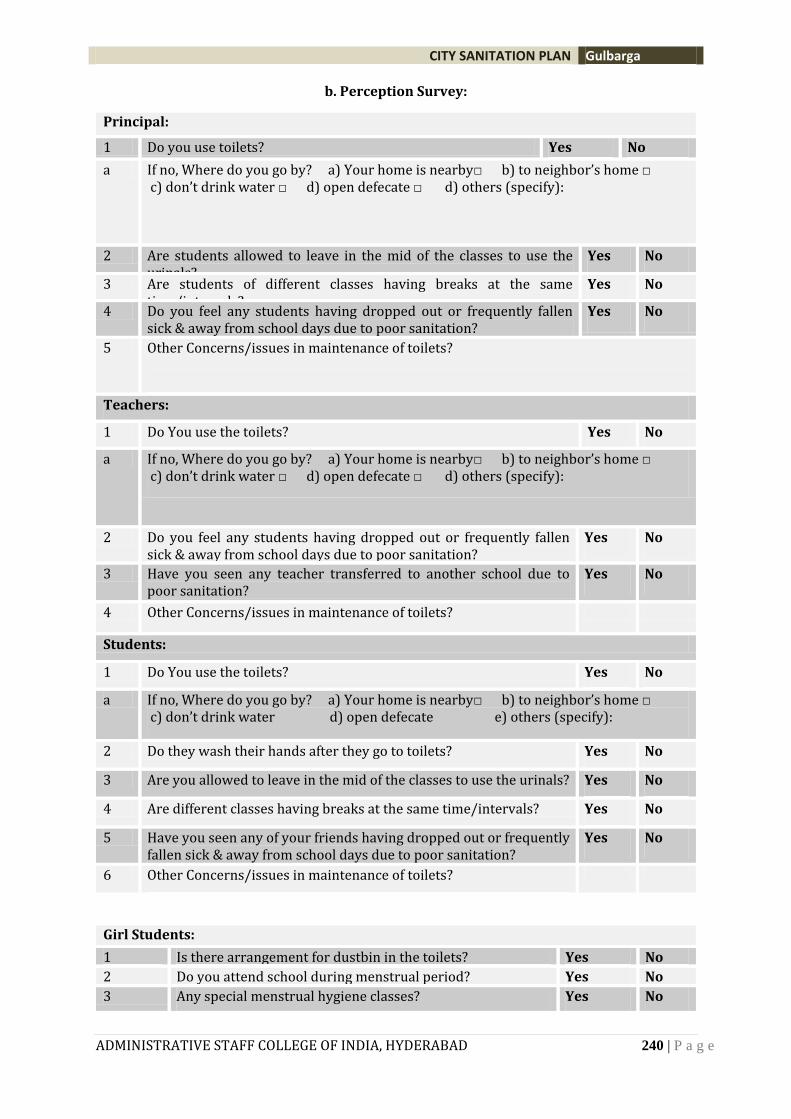
CITY SANITATION PLAN Gulbarga
ADMINISTRATIVE STAFF COLLEGE OF INDIA, HYDERABAD 240 | P a g e
b. Perception Survey:
Principal:
1 Do you use toilets? Yes No
a If no, Where do you go by? a) Your home is nearby□ b) to neighbor’s home □ c) don’t drink water □ d) open defecate □ d) others (specify):
2 Are students allowed to leave in the mid of the classes to use the urinals?
Yes No
3 Are students of different classes having breaks at the same time/intervals?
Yes No
4 Do you feel any students having dropped out or frequently fallen sick & away from school days due to poor sanitation?
Yes No
5 Other Concerns/issues in maintenance of toilets?
Teachers:
1 Do You use the toilets? Yes No
a If no, Where do you go by? a) Your home is nearby□ b) to neighbor’s home □ c) don’t drink water □ d) open defecate □ d) others (specify):
2 Do you feel any students having dropped out or frequently fallen sick & away from school days due to poor sanitation?
Yes No
3 Have you seen any teacher transferred to another school due to poor sanitation?
Yes No
4 Other Concerns/issues in maintenance of toilets?
Students:
1 Do You use the toilets? Yes No
a If no, Where do you go by? a) Your home is nearby□ b) to neighbor’s home □ c) don’t drink water d) open defecate e) others (specify):
2 Do they wash their hands after they go to toilets? Yes No
3 Are you allowed to leave in the mid of the classes to use the urinals? Yes No
4 Are different classes having breaks at the same time/intervals? Yes No
5 Have you seen any of your friends having dropped out or frequently fallen sick & away from school days due to poor sanitation?
Yes No
6 Other Concerns/issues in maintenance of toilets?
Girl Students:
1 Is there arrangement for dustbin in the toilets? Yes No
2 Do you attend school during menstrual period? Yes No
3 Any special menstrual hygiene classes? Yes No
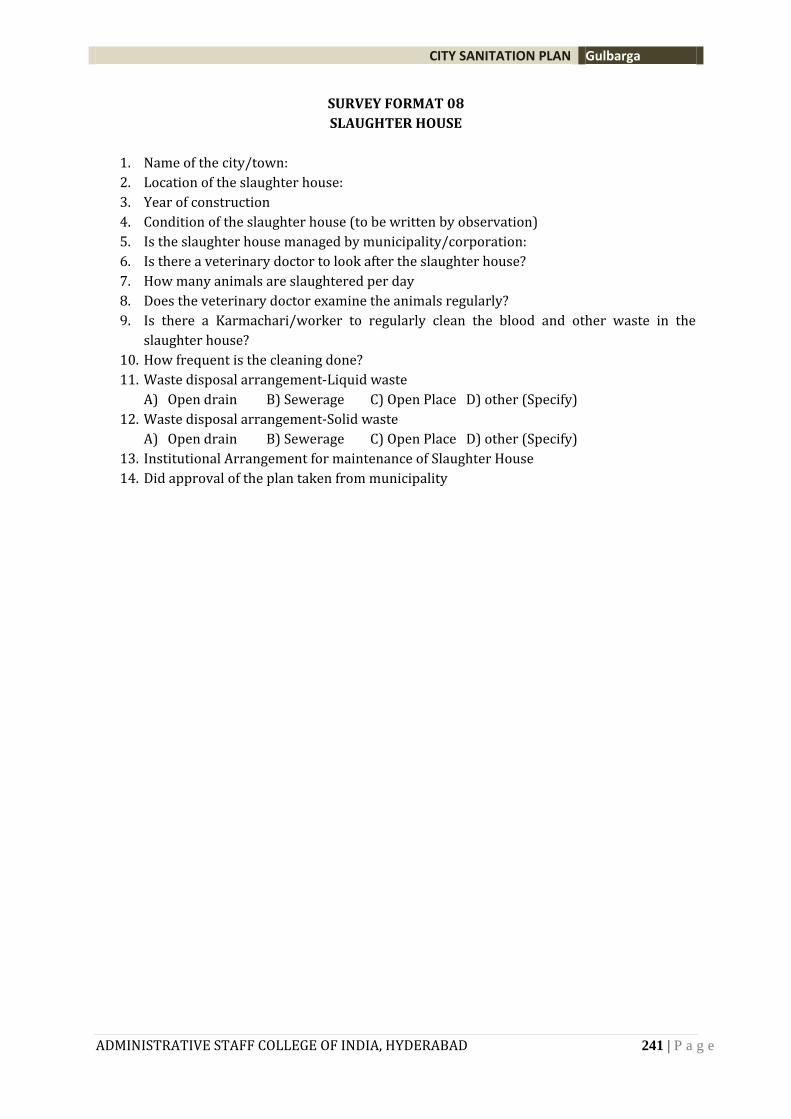
CITY SANITATION PLAN Gulbarga
ADMINISTRATIVE STAFF COLLEGE OF INDIA, HYDERABAD 241 | P a g e
SURVEY FORMAT 08
SLAUGHTER HOUSE
1. Name of the city/town:
2. Location of the slaughter house:
3. Year of construction
4. Condition of the slaughter house (to be written by observation)
5. Is the slaughter house managed by municipality/corporation:
6. Is there a veterinary doctor to look after the slaughter house?
7. How many animals are slaughtered per day
8. Does the veterinary doctor examine the animals regularly?
9. Is there a Karmachari/worker to regularly clean the blood and other waste in the
slaughter house?
10. How frequent is the cleaning done?
11. Waste disposal arrangement-Liquid waste
A) Open drain B) Sewerage C) Open Place D) other (Specify)
12. Waste disposal arrangement-Solid waste
A) Open drain B) Sewerage C) Open Place D) other (Specify)
13. Institutional Arrangement for maintenance of Slaughter House
14. Did approval of the plan taken from municipality
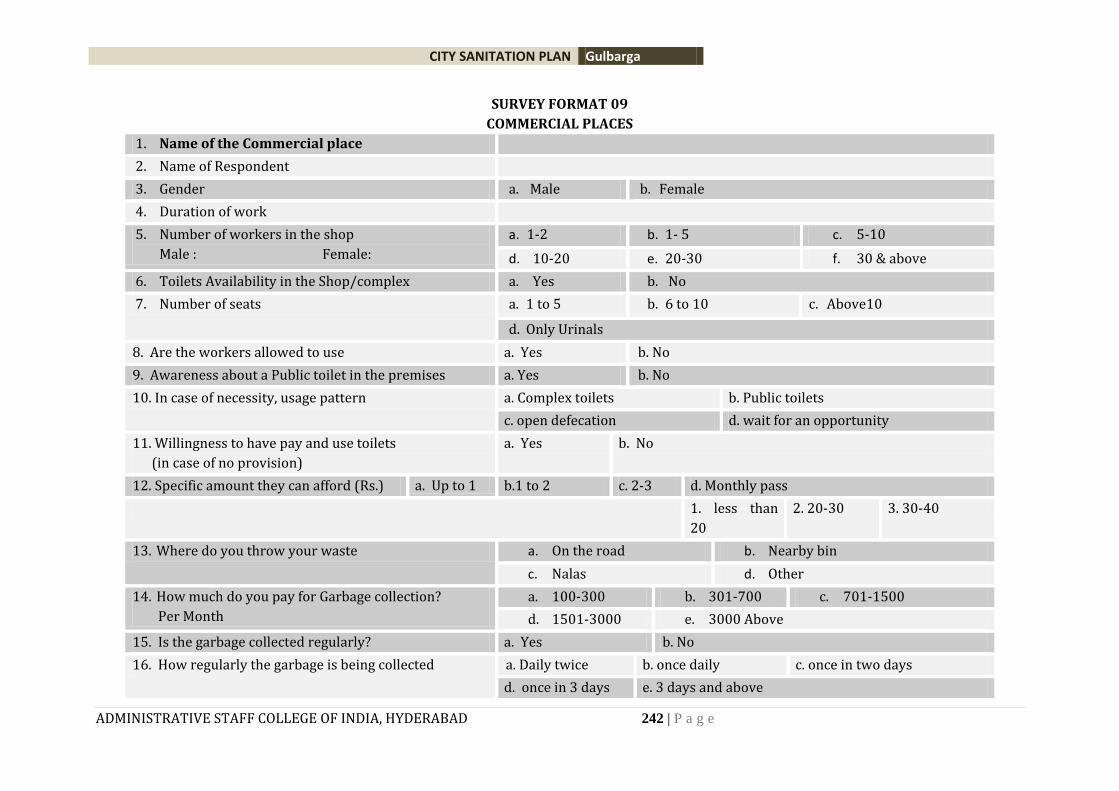
CITY SANITATION PLAN Gulbarga
ADMINISTRATIVE STAFF COLLEGE OF INDIA, HYDERABAD 242 | P a g e
SURVEY FORMAT 09
COMMERCIAL PLACES
1. Name of the Commercial place
2. Name of Respondent
3. Gender a. Male b. Female
4. Duration of work
5. Number of workers in the shop
Male : Female:
a. 1-2 b. 1- 5 c. 5-10
d. 10-20 e. 20-30 f. 30 & above
6. Toilets Availability in the Shop/complex a. Yes b. No
7. Number of seats a. 1 to 5 b. 6 to 10 c. Above10
d. Only Urinals
8. Are the workers allowed to use a. Yes b. No
9. Awareness about a Public toilet in the premises a. Yes b. No
10. In case of necessity, usage pattern a. Complex toilets b. Public toilets
c. open defecation d. wait for an opportunity
11. Willingness to have pay and use toilets
(in case of no provision)
a. Yes b. No
12. Specific amount they can afford (Rs.) a. Up to 1 b.1 to 2 c. 2-3 d. Monthly pass
1. less than
20
2. 20-30 3. 30-40
13. Where do you throw your waste a. On the road b. Nearby bin
c. Nalas d. Other
14. How much do you pay for Garbage collection?
Per Month
a. 100-300 b. 301-700 c. 701-1500
d. 1501-3000 e. 3000 Above
15. Is the garbage collected regularly? a. Yes b. No
16. How regularly the garbage is being collected a. Daily twice b. once daily c. once in two days
d. once in 3 days e. 3 days and above
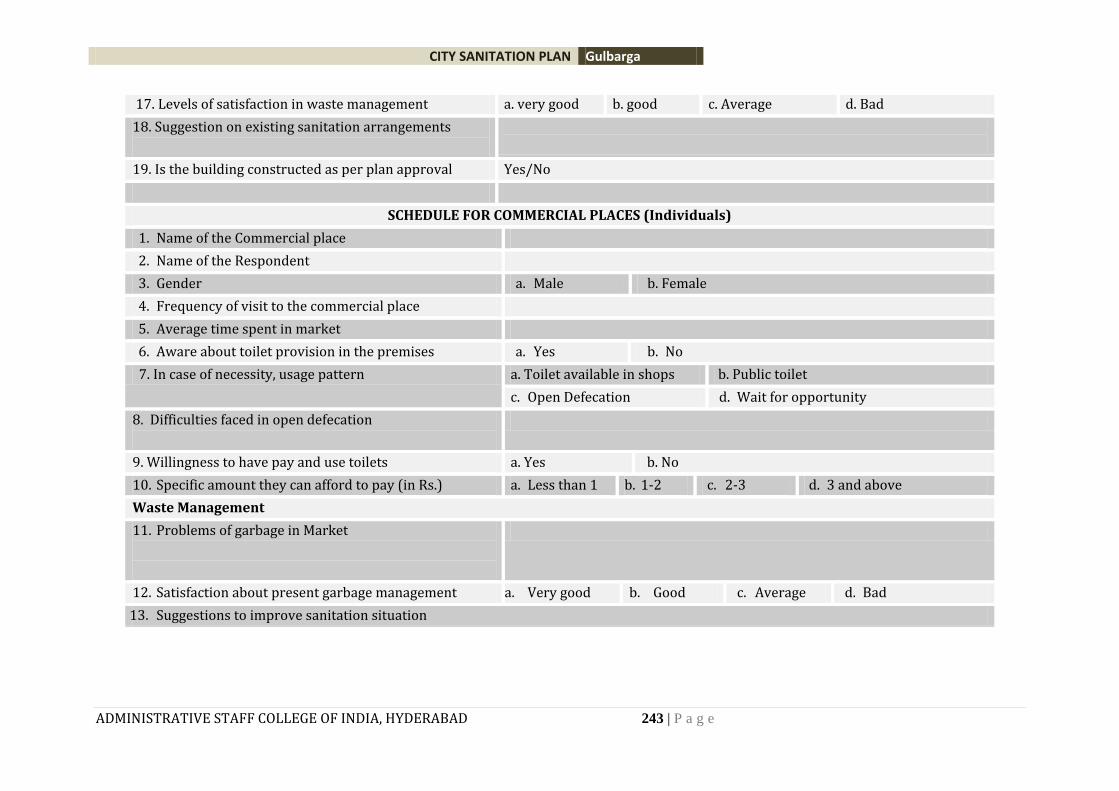
CITY SANITATION PLAN Gulbarga
ADMINISTRATIVE STAFF COLLEGE OF INDIA, HYDERABAD 243 | P a g e
17. Levels of satisfaction in waste management a. very good b. good c. Average d. Bad
18. Suggestion on existing sanitation arrangements
19. Is the building constructed as per plan approval Yes/No
SCHEDULE FOR COMMERCIAL PLACES (Individuals)
1. Name of the Commercial place
2. Name of the Respondent
3. Gender a. Male b. Female
4. Frequency of visit to the commercial place
5. Average time spent in market
6. Aware about toilet provision in the premises a. Yes b. No
7. In case of necessity, usage pattern a. Toilet available in shops b. Public toilet
c. Open Defecation d. Wait for opportunity
8. Difficulties faced in open defecation
9. Willingness to have pay and use toilets a. Yes b. No
10. Specific amount they can afford to pay (in Rs.) a. Less than 1 b. 1-2 c. 2-3 d. 3 and above
Waste Management
11. Problems of garbage in Market
12. Satisfaction about present garbage management a. Very good b. Good c. Average d. Bad
13. Suggestions to improve sanitation situation
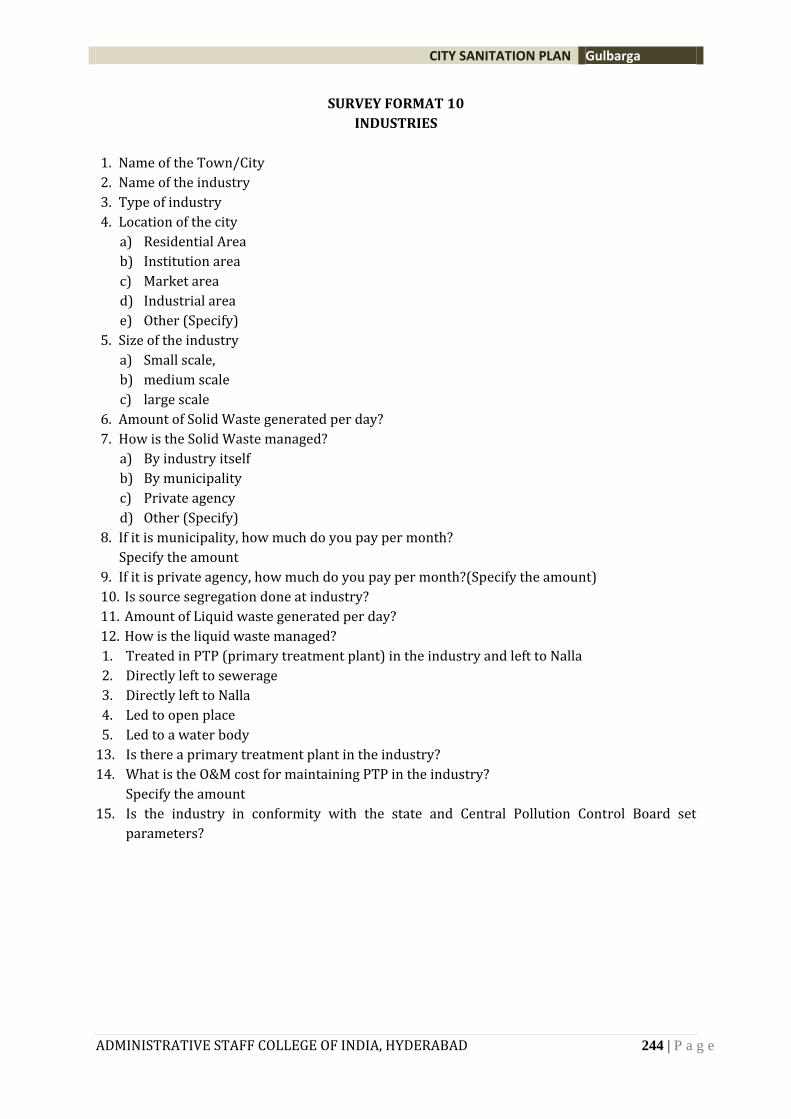
CITY SANITATION PLAN Gulbarga
ADMINISTRATIVE STAFF COLLEGE OF INDIA, HYDERABAD 244 | P a g e
SURVEY FORMAT 10
INDUSTRIES
1. Name of the Town/City
2. Name of the industry
3. Type of industry
4. Location of the city
a) Residential Area
b) Institution area
c) Market area
d) Industrial area
e) Other (Specify)
5. Size of the industry
a) Small scale,
b) medium scale
c) large scale
6. Amount of Solid Waste generated per day?
7. How is the Solid Waste managed?
a) By industry itself
b) By municipality
c) Private agency
d) Other (Specify)
8. If it is municipality, how much do you pay per month?
Specify the amount
9. If it is private agency, how much do you pay per month?(Specify the amount)
10. Is source segregation done at industry?
11. Amount of Liquid waste generated per day?
12. How is the liquid waste managed?
1. Treated in PTP (primary treatment plant) in the industry and left to Nalla
2. Directly left to sewerage
3. Directly left to Nalla
4. Led to open place
5. Led to a water body
13. Is there a primary treatment plant in the industry?
14. What is the O&M cost for maintaining PTP in the industry?
Specify the amount
15. Is the industry in conformity with the state and Central Pollution Control Board set
parameters?
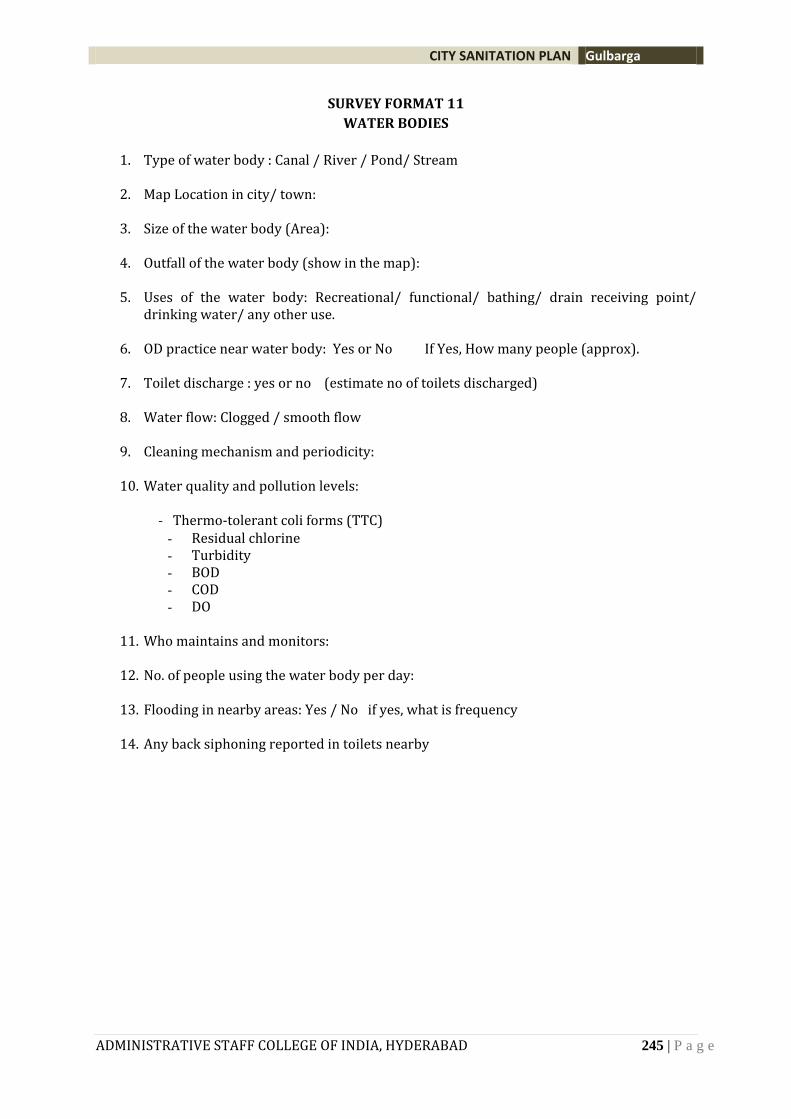
CITY SANITATION PLAN Gulbarga
ADMINISTRATIVE STAFF COLLEGE OF INDIA, HYDERABAD 245 | P a g e
SURVEY FORMAT 11
WATER BODIES
1. Type of water body : Canal / River / Pond/ Stream
2. Map Location in city/ town:
3. Size of the water body (Area):
4. Outfall of the water body (show in the map):
5. Uses of the water body: Recreational/ functional/ bathing/ drain receiving point/
drinking water/ any other use.
6. OD practice near water body: Yes or No If Yes, How many people (approx).
7. Toilet discharge : yes or no (estimate no of toilets discharged)
8. Water flow: Clogged / smooth flow
9. Cleaning mechanism and periodicity:
10. Water quality and pollution levels:
- Thermo-tolerant coli forms (TTC) - Residual chlorine - Turbidity - BOD - COD - DO
11. Who maintains and monitors:
12. No. of people using the water body per day:
13. Flooding in nearby areas: Yes / No if yes, what is frequency
14. Any back siphoning reported in toilets nearby
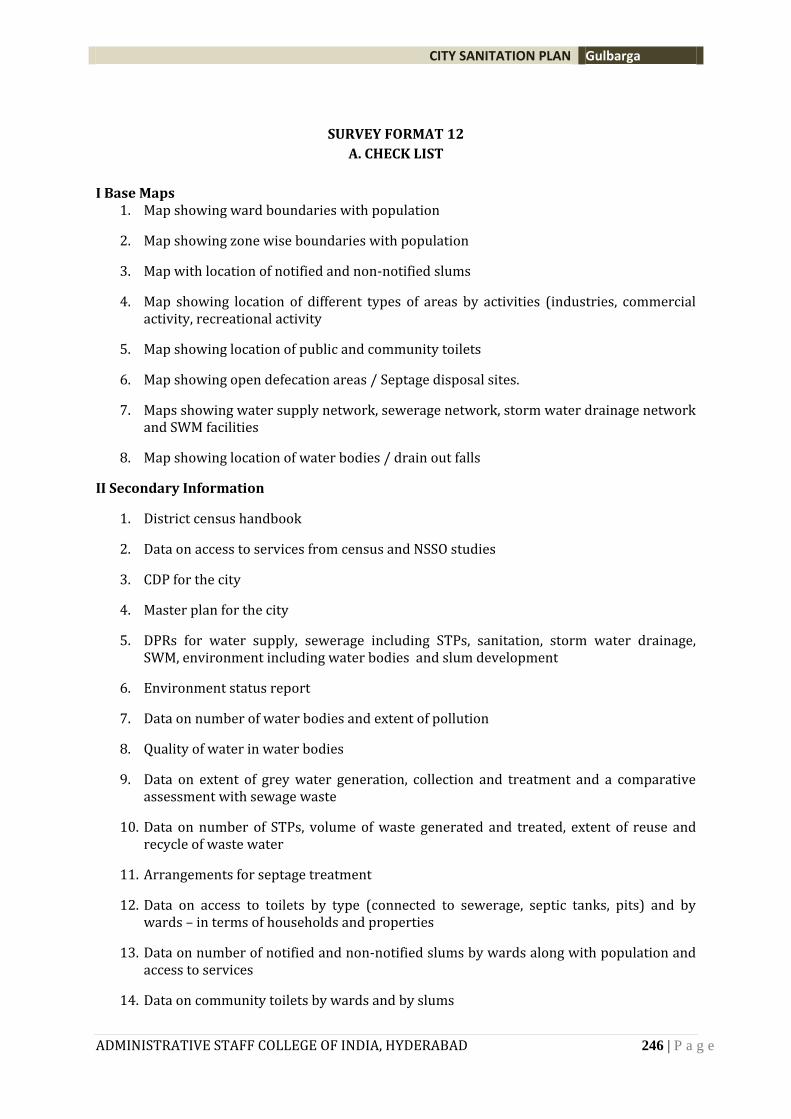
CITY SANITATION PLAN Gulbarga
ADMINISTRATIVE STAFF COLLEGE OF INDIA, HYDERABAD 246 | P a g e
SURVEY FORMAT 12
A. CHECK LIST
I Base Maps 1. Map showing ward boundaries with population
2. Map showing zone wise boundaries with population
3. Map with location of notified and non-notified slums
4. Map showing location of different types of areas by activities (industries, commercial activity, recreational activity
5. Map showing location of public and community toilets
6. Map showing open defecation areas / Septage disposal sites.
7. Maps showing water supply network, sewerage network, storm water drainage network and SWM facilities
8. Map showing location of water bodies / drain out falls
II Secondary Information
1. District census handbook
2. Data on access to services from census and NSSO studies
3. CDP for the city
4. Master plan for the city
5. DPRs for water supply, sewerage including STPs, sanitation, storm water drainage, SWM, environment including water bodies and slum development
6. Environment status report
7. Data on number of water bodies and extent of pollution
8. Quality of water in water bodies
9. Data on extent of grey water generation, collection and treatment and a comparative assessment with sewage waste
10. Data on number of STPs, volume of waste generated and treated, extent of reuse and recycle of waste water
11. Arrangements for septage treatment
12. Data on access to toilets by type (connected to sewerage, septic tanks, pits) and by wards – in terms of households and properties
13. Data on number of notified and non-notified slums by wards along with population and access to services
14. Data on community toilets by wards and by slums
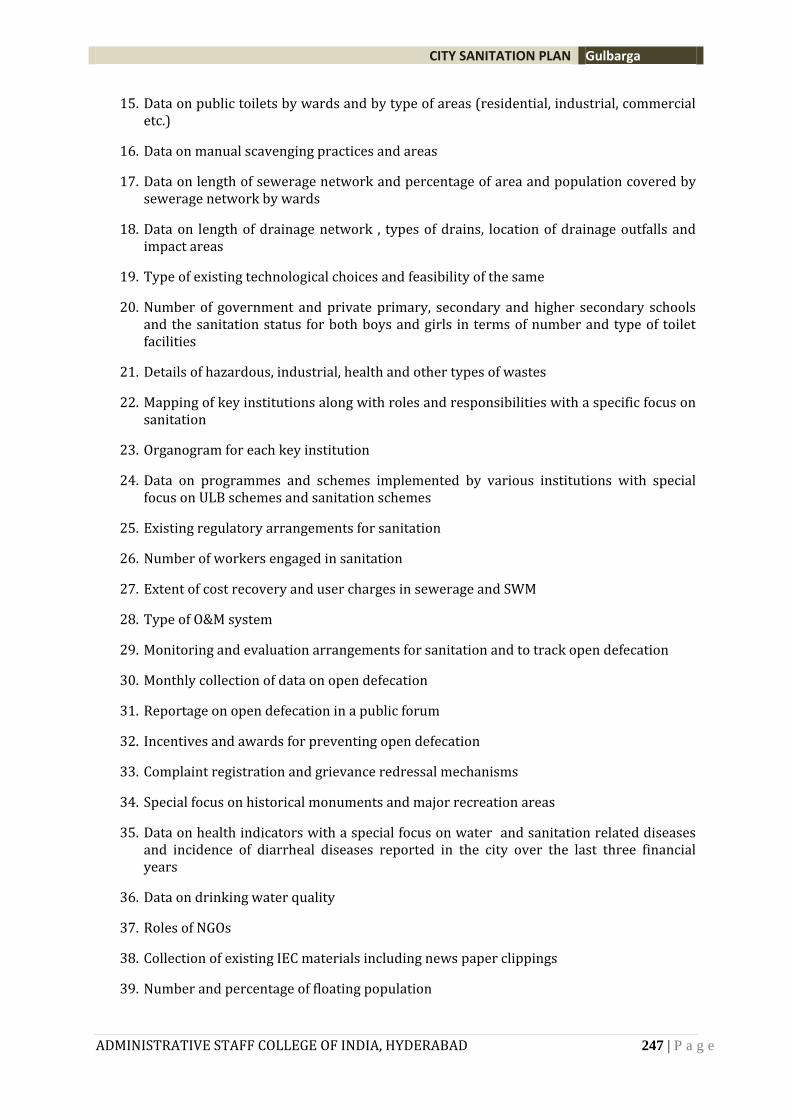
CITY SANITATION PLAN Gulbarga
ADMINISTRATIVE STAFF COLLEGE OF INDIA, HYDERABAD 247 | P a g e
15. Data on public toilets by wards and by type of areas (residential, industrial, commercial etc.)
16. Data on manual scavenging practices and areas
17. Data on length of sewerage network and percentage of area and population covered by sewerage network by wards
18. Data on length of drainage network , types of drains, location of drainage outfalls and impact areas
19. Type of existing technological choices and feasibility of the same
20. Number of government and private primary, secondary and higher secondary schools and the sanitation status for both boys and girls in terms of number and type of toilet facilities
21. Details of hazardous, industrial, health and other types of wastes
22. Mapping of key institutions along with roles and responsibilities with a specific focus on sanitation
23. Organogram for each key institution
24. Data on programmes and schemes implemented by various institutions with special focus on ULB schemes and sanitation schemes
25. Existing regulatory arrangements for sanitation
26. Number of workers engaged in sanitation
27. Extent of cost recovery and user charges in sewerage and SWM
28. Type of O&M system
29. Monitoring and evaluation arrangements for sanitation and to track open defecation
30. Monthly collection of data on open defecation
31. Reportage on open defecation in a public forum
32. Incentives and awards for preventing open defecation
33. Complaint registration and grievance redressal mechanisms
34. Special focus on historical monuments and major recreation areas
35. Data on health indicators with a special focus on water and sanitation related diseases and incidence of diarrheal diseases reported in the city over the last three financial years
36. Data on drinking water quality
37. Roles of NGOs
38. Collection of existing IEC materials including news paper clippings
39. Number and percentage of floating population
CITY SANITATION PLAN Gulbarga
ADMINISTRATIVE STAFF COLLEGE OF INDIA, HYDERABAD 248 | P a g e
40. Number of flooding and waterlogging incidences
41. Percentage of households/properties openly depositing human excreta into nalas and drains
42. Proportion of storm water that is efficiently and safely managed – 100% pacca drains and flooding and water logging incidences
43. Protective gear and safety equipment to sewerage and STP workers
44. Mechanical, CCTV, systems are being used for monitoring and cleaning sewers
45. Whether workers are provided insurance/provident fund/gratuity
46. Whether there is functioning grievance redressal mechanism for complaints related to sewerage and septage
47. Whether septage/sullage (cleaners) workers use protective gear and safety equipment
48. Whether mechanical (non-manual) systems are being used for cleaning tanks and pits
49. Whether the cleaning and disposal of sludge from tanks and pits is monitored
50. Centralized data base, maps exist for drainage system
51. Pre-monsoon and one other season cleaning, repairs and maintenance of drains undertaken
52. Coverage of households and establishments by daily door-to-door collection
53. Proportion of city streets effectively covered by regular street sweeping, at least once a day
54. Proportion of waste that is processes and recycled
55. Cost recovery for SWM services
56. Availability of written manual and codified procedures for sewerage, septage, drainage and SWM
57. Status of State/ULB Acti provisions for punishments/fines for littering and letting out untreated excreta in the open
58. Implementation of above rules in practice
59. Instances of fines in the last one year for littering and letting out in open
60. Conditions at dumping site and treatment plant