Embed Size (px)
DESCRIPTION
Â
Citation preview
C I T Y O F E D M O N D , O K L A H OM A BUDGE T AND F I NA NC I A L PL AN
FISCAL YEAR 2 0 1 5 – 2 0 1 6
T H E B I G P I C T U R EProviding Trustworthy Service Through Continuous Improvement

THE CITY OF EDMOND, OKLAHOMA
BUDGET FY 15-16
TABLE OF CONTENTS
INTRODUCTION:
Budget Message ................................................................................................................................................ I – XIII
BUDGET SUMMARIES:
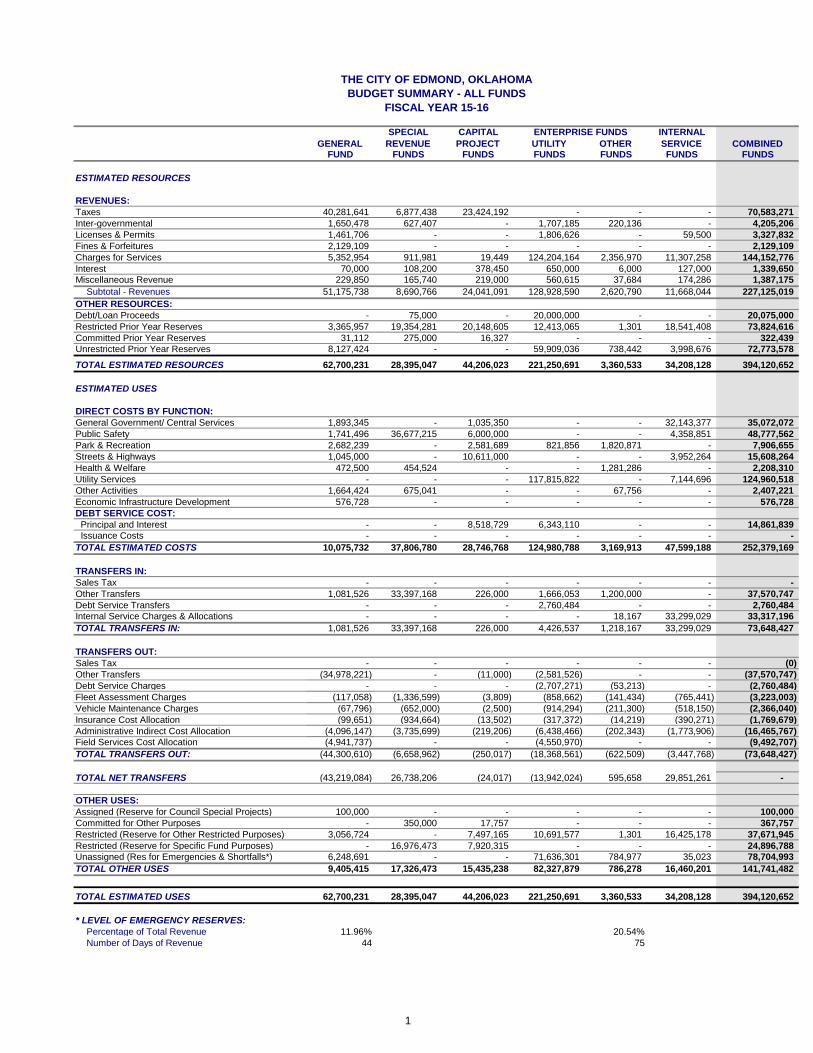
Budget Summary - All Funds ..................................................................................................................................... 1
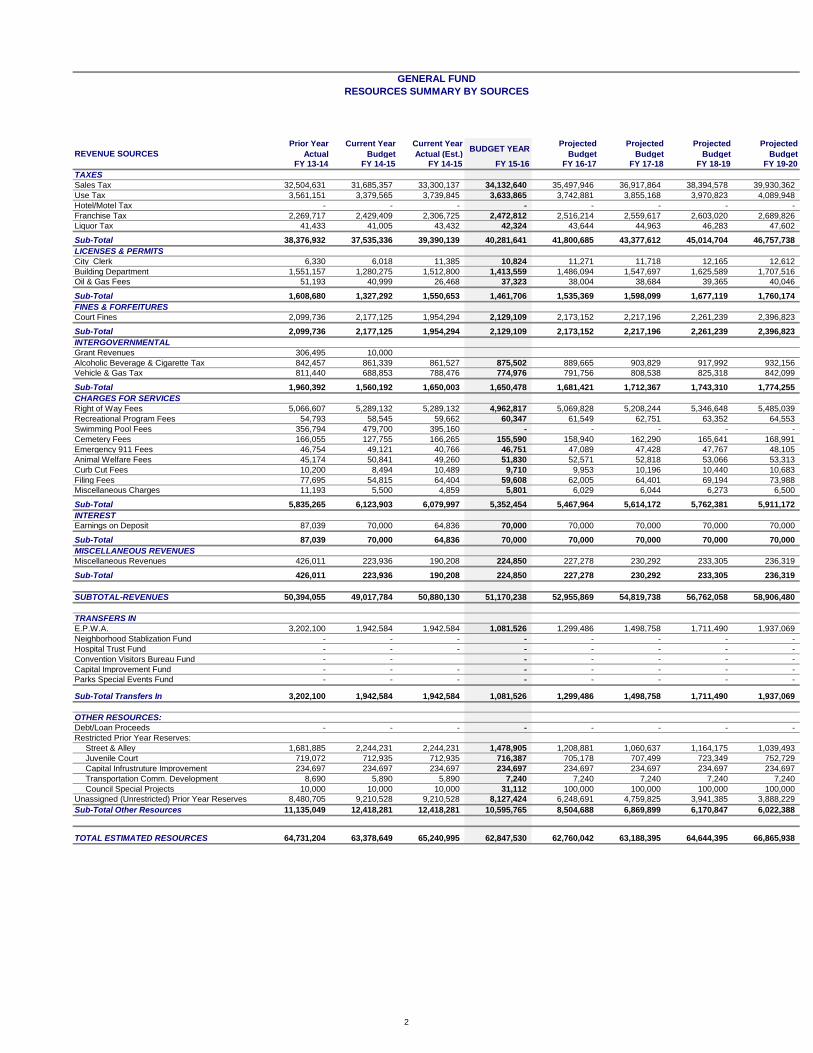
Summary of Revenues by Source-General Fund ........................................................................................................ 2
Summary of Revenues by Source-EPWA Funds ........................................................................................................ 3
Fund Graph-Combined Budgets-All Funds ................................................................................................................ 4
Fund Graph-Total Estimated Revenue-All Funds ....................................................................................................... 5
Fund Graph-Total Direct Cost by Function-All Funds ............................................................................................... 6
Fund Graph-Total Other Uses Reserves ..................................................................................................................... 7
GENERAL FUND:
Fund Description ........................................................................................................................................................ 8
Fund Budget Summary ............................................................................................................................................... 9
DEPARTMENT DETAIL:
General Government ..........................................................................................................................................10 - 11
City Council ........................................................................................................................................................12 - 13
Parks and Recreation ..........................................................................................................................................14 - 15
Street Maintenance & Construction ....................................................................................................................16 - 17
Court Services/Municipal Court .........................................................................................................................18 - 19
Senior Citizens Center ........................................................................................................................................20 - 21
Social Agencies ..................................................................................................................................................22 - 23
Community Development & Preservation Agencies ...........................................................................................24 - 25
Emergency Management .....................................................................................................................................26 - 27
Cemetery .............................................................................................................................................................28 - 29
Community Image (Code Enforcement & Urban Forestry) ...............................................................................30 - 31
Planning & Zoning ..............................................................................................................................................32 - 33
Festival Marketplace ...........................................................................................................................................34 - 35
THE CITY OF EDMOND, OKLAHOMA
BUDGET FY 15-16
TABLE OF CONTENTS
Building Services ................................................................................................................................................36 - 37
Downtown Community Center ...........................................................................................................................38 - 39
Historical Society................................................................................................................................................40 - 41
Edmond Electric Economic Development Fund .................................................................................................42 - 43
Parks Special Events Fund ................................................................................................................................. 44 – 45
SPECIAL REVENUE FUNDS:
Fund Descriptions ...............................................................................................................................................46 - 50
Fund Budget Summaries and Detail:
Senior Citizens Fund ....................................................................................................................................... 51 – 52
Community Development (Planning) Fund .................................................................................................... 53 – 54
Asset Forfeiture Fund .....................................................................................................................................55 - 56
Fire Public Safety Limited Tax Fund ...............................................................................................................57 - 58
Police Public Safety Limited Tax Fund ..........................................................................................................59 - 60
Hospital Sale Trust Fund .................................................................................................................................61 - 62
Real Property Fund ..........................................................................................................................................63 - 64
Convention & Visitors Bureau Fund .............................................................................................................. 65 – 66
Ambulatory Services Fund.............................................................................................................................. 67 – 68
CAPITAL PROJECT FUNDS:
Fund Budget Summaries and Detail:
Capital Improvements Fund ..............................................................................................................................69 - 70
Roadway Improvements Fund ..........................................................................................................................71 - 72
1996 Capital Improvements Tax Fund..............................................................................................................73 - 74
Art in Public Places Fund .................................................................................................................................75 -76
Cemetery Care Fund ..........................................................................................................................................77 -78
Parks Tax Fund ..................................................................................................................................................79 -80
2000 Capital Improvements Tax Fund..............................................................................................................81 - 82
THE CITY OF EDMOND, OKLAHOMA
BUDGET FY 15-16
TABLE OF CONTENTS
2012 Public Safety Center - Capital Improvements Tax Fund ..........................................................................83 - 84
EPWA UTILITY FUNDS:
Fund Description ...............................................................................................................................................85 - 86
Funds Budget Summaries ......................................................................................................................................... 87
FUND DETAIL:
Electric Utility ...................................................................................................................................................88 - 89
Water Utility ......................................................................................................................................................90 - 91
Solid Waste Utility .............................................................................................................................................92- 93
Wastewater Utility .............................................................................................................................................94 - 95
Arcadia Lake ......................................................................................................................................................96 - 97
Drainage Utility .................................................................................................................................................98 - 99
EPWA Sewer Impact .....................................................................................................................................100 - 101
EPWA Revenue Bonds ..................................................................................................................................102 - 103
OTHER ENTERPRISE FUNDS:
KickingBird Golf Course Fund .......................................................................................................................104 - 105
YourGovShop Fund ....................................................................................................................................... 106 – 107
Public Transportation – CITYLINK ............................................................................................................. 108 – 109
INTERNAL SERVICE FUNDS:
Fund Descriptions ..........................................................................................................................................110 - 111
Fund Budget Summaries and Detail:
Liability/Tort Claims Fund (Risk Management) ............................................................................................112 - 113
Employee Group Insurance Fund ..................................................................................................................114 - 115
Vehicle Maintenance Fund ............................................................................................................................116 - 117
Administrative Support Services Fund ..........................................................................................................118 - 119
THE CITY OF EDMOND, OKLAHOMA
BUDGET FY 15-16
TABLE OF CONTENTS
DEPARTMENT DETAIL:
General Government ......................................................................................................................................120 - 121
City Treasurer ............................................................................................................................................... 122 - 123
City Manager ................................................................................................................................................ 124 – 125
Public Safety Communications ......................................................................................................................126 - 127
Information Technologies ..............................................................................................................................128 - 129
Financial Services ..........................................................................................................................................130 - 131
Human Resources ..........................................................................................................................................132 - 133
City Clerk ......................................................................................................................................................134 - 135
Facility Maintenance ......................................................................................................................................136 - 137
Legal Services ............................................................................................................................................... 138 – 139
Engineering ................................................................................................................................................... 140 – 141
Market and Public Relations ..........................................................................................................................142 - 143
Public Works Administration ........................................................................................................................144 - 145
Operations Central Warehousing ...................................................................................................................146 - 147
Utility Customer Service ................................................................................................................................148 - 149
Fleet Management Fund ................................................................................................................................150 - 151
Field Services Fund .......................................................................................................................................152 - 153
PERSONNEL ................................................................................................................................................ 154 – 160
CAPITAL OUTLAY .................................................................................................................................... 161 – 165

Introduction Tab
i
Honorable Mayor and Members of the City Council: This document includes the proposed annual budget and Five-Year Financial Plan for the City of Edmond. The new fiscal (budget) year begins July 1, 2015, and the five-year plan includes years 15-16 through 2019-20 and represents a true multi-year financial plan. As we all know Finance Director Ross VanderHamm is the driving force behind the coordination and preparation our budget, a process that he began last October. His very capable assistant, Kelly Neal, is also directly involved in this entire process. City staff from the various departments have also been involved in their respective areas of operation. We continue to emphasize the internal mission and focus of our organization, Trustworthy Service through Continuous Improvement, as well as our seven core values of Integrity, Customer Service, Accountability, Communication, Teamwork, Professionalism and Innovation. BIG PICTURE PERSPECTIVE The total estimated costs (expenditures) in the 15-16 budget are $252,379,169, which is a decrease of about 6% ($16M) and results from reduced capital spending for next year primarily due to the Public Safety Center project. Edmond remains very fortunate that City sales tax revenue continues to significantly exceed our projections, and for the first eleven months of the current year we are pleased to report a 4.66% increase above last year’s revised budget (actuals)—as compared to a ZERO growth projection from last year’s actual total. The three sales taxes approved by voters in 2000 continue to provide critical revenue for both Public Safety (police and fire) and capital projects. The Fire Dept. receives a quarter-cent tax, the Police Dept. a one-eighth cent tax, and a three-quarter cent tax is allocated for capital improvements. The net result of the public safety taxes is that basically two-thirds of General Fund revenue is automatically allocated to fire and police operations. Our total sales rate remains at 8.25%. This rate is comprised of 3.75% in local taxes (including a half-cent five-year tax for the Public Safety Center) and a 4.5% state tax that is charged to all cities. One cent of the two-cent allocation to the General Fund will need to be renewed by voters by the spring of 2017. The City Council recently created a Capital Improvements Advisory Task Force to examine the possibility of extending the half-cent PSC tax to fund major capital projects from a recommended list. The big unknown factor that we are certainly monitoring is what will happen to the price of oil in the next year, which currently is less than half of what it was last summer. Although we can’t identify a specific local impact at this point, there is no doubt that a continuation of the current downturn will directly impact all cities in Oklahoma. In this volatile environment we are conservatively projecting a slight decrease in fuel costs at $1.1M ($1.2M this year).
ii
CITY COUNCIL STRATEGIC PLAN This annual plan is updated each year, and it includes current and future goals, performance targets, and general City Council policies. GENERAL FUND: REVENUES The lifeblood of this fund continues to be sales tax, which is even more critical in Edmond because we do not have a limited amount of property tax (ad valorem) revenue for capital projects as do most medium and large cities in the state. We have noted our over-reliance on sales tax on many occasions, and we still need to develop a more diversified long-term revenue strategy at some point. It is encouraging that the Mayors of both Oklahoma City and Tulsa are currently working with the Oklahoma Municipal League to initiate a statewide discussion of diversifying local revenues. The 15-16 budget includes a conservative 2.5% increase in sales tax collections from this year’s revised budget, and the outer four years of the Plan each project 4% increases. A conscious effort has been made in recent years to maintain an appropriate level of unreserved fund balance in the General Fund, and the City Council adopted a formal policy that identified a preference for a minimum of 10%. For the current year this ending balance is estimated at around 15%, and the Fund Budget Summary on page 9 identifies an 11.96% balance for next year, and the outer year estimates are also included. Total General Fund revenue is projected to increase by 4.3% ($2,148,954) due to increased sales tax revenue. Of course the fire and police operations will receive about two-thirds of these additional funds. A $100,000 allocation to the Reserve for Council Special Projects (contingency fund) is continued in all five years of the Plan. We continue to anticipate very modest income from City investments, as the $70,000 number in the current budget is carried forward for all five years of the Plan. Automatic transfers to Police and Fire are projected at $18,398,440 for Police (36.8%) and $14,998,728 for Fire (30%). GENERAL FUND: ASSISTANCE FOR OUTSIDE AGENCIES Social Agencies & Community Enrichment Sixteen entities make up these two categories as identified on pages 23 and 24 including a new $10,000 annual allocation to the new Mitch Park YMCA to help provide assistance to those people who cannot afford to utilize Y services. The Community Agency Review Commission annually conducts a thorough review of these programs and their funding recommendations are included in the proposed budget. The maximum allocation for Social Agencies is 1.44% of estimated sales tax collections for the current year, and 1.75% for Community Enrichment, resulting in a total cap of 3.2%.
iii
The CD&P portion of this assistance includes $100,000 for the Guthrie/Edmond Regional Airport and $25,000 for the Edmond Historic Preservation Trust. Guthrie/Edmond Regional Airport The two communities equally share in operating and capital expenses for this facility in Guthrie, and the partnership has now been in effect for eleven years. For the 15-16 budget each city will provide a total of $100,000, primarily for operating costs. The airport operation has been minimally funded for the past several years. Edmond remains concerned about the need to increase the level of activity at the airport through the attraction of additional corporate clients, which would also help to address long-term airport revenue. Electric Economic Development Fund Ongoing allocations from our electric utility and recently the General Fund have helped to provide economic development financial enhancements to both help grow existing businesses and attractive appropriate new businesses (page 43). Since this fund now has a healthy balance ($900,000) no additional allocations are included in the 15-16 budget. PUBLIC SAFETY LIMITED TAX FUNDS Fire Department The Fire and Police budgets both continue to benefit significantly from additional revenue from stronger than budgeted sales tax collections. In the current budget the Fire Department will receive $920,076 in such additional revenue. All five years of the Fire budget are not only balanced but also include significant reserves (pages 57-58). For the second consecutive year a recruit academy will be initiated to address current and pending vacancies from retirements, and 10 new firefighters are anticipated from the class to return the department to full strength. Police Department Unlike the current plan, the new five-year Plan projects a return to balanced budgets and healthy reserves in all five years. In the current budget the Police Department will also receive $1,129,477 in additional sales tax revenue as identified above. The two-year construction of the new Public Safety Center continues to make significant progress, and completion is now anticipated in late September. This long-needed project has changed the landscape of Edmond’s downtown and established a new standard for future City buildings in the downtown area. The South Support Facility is scheduled for completion in early summer. The five-year half-cent sales tax that voters approved to fund these projects will end in April of 2017.
iv
We also hope to make progress in returning the Police Department to full strength, as a new 12-member recruiting academy will be initiated this year to help address vacancies from military leave and retirements. A recent staffing study by the Police Executive Research Forum determined that the current staffing level is appropriate for our community. ADMINISTRATIVE SUPPORT SERVICES FUND The City departments that directly deliver services to our citizens receive critical support from sixteen internal departments that are identified in this fund (page118-153). These internal service departments are funded by “cost allocations” that are internal budgeted charges, and for many years we have used the same outside consultant to facilitate this highly interactive process with the various departments. EDMOND PUBLIC WORKS AUTHORITY Right-of-Way Use Fees Every City utility except Solid Waste and Drainage pay an annual fee for the use of City rights-of-way (ROW), for the purpose of identifying a cost of doing business that is more comparable to private utilities. This fee has been set at 5% for the last nine years, and it needs to be re-evaluated to determine what a comparable percentage should be. These total fees for the 15-16 budget will be $4,962,817. It is our intention to accomplish an internal review in the next year. Electric Fund Our City-owned and operated electric utility, Edmond Electric, continues to feature competitive rates while continuing the tradition of providing reliable and consistent electric service to most of our residents for over a hundred years (pages 88-89). In addition our organization and the Edmond community continue to benefit from EE’s ongoing support of general government operations. In next year’s budget the support from EE to the General Fund will be a direct transfer of $662,797 and $3,179,344 in ROW use fees. This assistance in the first two years of the Plan will be much less than in the past, primarily due to a continuing increase in wholesale power costs that averaged a significant 6.6 cents per kilowatt-hour in calendar year 2014. Next year’s budget includes a debt issuance of $20M for capital projects, and the debt will be serviced through future rate increases. Only the fifth year of the new Plan reflects a negative balance, as compared to the outer four years in the current plan. The necessary steps have been and are continuing to be taken to correct the temporary imbalance situation, and these steps include rate adjustments, more timely fuel cost adjustments and temporary internal budget adjustments. It is important to remind our residents of the major benefits of having a locally-owned and competitive electric utility, and an aggressive marketing strategy is designed to maintain such awareness. This strategy includes continuing to promote geothermal technology, residential and commercial air conditioning and heat pump rebates, and commercial efficiency upgrade rebates. These programs help our customers realize significant long-term energy savings through reduced consumption and also a
v
reduced total energy demand that results in purchasing less additional power during the summer months. Water Fund The City’s drinking water system includes over 500 miles of distribution lines, 56 water wells, and the treatment plant at Arcadia Lake (pages 90-91). The 15-16 budget does not provide for rate increases, as a rate study will be completed this summer. Increases have been necessary in recent years to address major capital needs, both in terms of infrastructure improvements (replacing 40-yr. old water lines, for example) and developing new water sources. In response to the new Water and Wastewater Master Plan staff is moving forward with the design of many of the major projects identified to meet with the growing need for water supply. These include a new intake structure from Arcadia Lake, expansion of the Water Treatment Plant, and the NW Water Tower. The tower is expected to be completed by the fall of 2016 at an estimated cost of $5M. The plant expansion and intake structure projects should be completed by 2020 at an estimated cost of $100M. The total anticipated cost for capital improvements for our water infrastructure over the five years is around $150M. These major costs will financed by issuing debt (bonds) and servicing the debt through rate increases. It should be remembered that such major water, and sewer, infrastructure costs are not unique to Edmond, as virtually all cities are/will be addressing similar issues. The water well rehabilitation program continues to move forward in the direction identified earlier regarding ground water supply. Of course the City of Edmond will continue to emphasize water conservation and work is progressing on identified conservation measures. The City continues to participate in a mandatory outdoor schedule identified by Oklahoma City for all metro cities that purchase water from OKC. An allocation of $1,263,040 in both operating transfers and ROW use fees is included in next year’s budget for ongoing support of general City services. Wastewater Fund This operation maintains over 400 miles of lines, lift stations and other wastewater facilities, and also runs the Coffee Creek Wastewater Treatment Plant (pages 94-95). The current rate study is reviewing both water and wastewater rates, but anticipated future rate increases will not begin in next year’s budget. The same rationale applies to increases as identified in the Water Fund, to address major capital needs that include infrastructure improvements (in this situation sixty-year old sewer lines) and capacity upgrades to the plant and lift stations. Design work continues on projects identified in the Master Plan, not only to meet future system demand needs but also to be in compliance with the upcoming state permit requirements. Projects identified include the Spring Creek Lift Station, Chisholm Creek Lift Station, and expansion of the Wastewater Treatment Plant. The lift stations are expected to be completed in 2017 at an estimated cost of $17M. The plant expansion should be completed in 2020 at an estimated cost of $80M. The total anticipated cost for capital improvements for wastewater infrastructure over the next five years is also around $150M.
vi
Solid Waste Fund This operation provides collection and disposal services for over 28,000 residential and over 1,500 commercial customers, with user fees being the only source of revenue. A lack of funding will delay the initiation of a City-operated composting program, but such a project is still anticipated at some point in the future. However, the program will be more expensive and complex than originally envisioned because of federal regulations regarding leachate and storm water runoff. A low-interest loan remains a possibility through the State Revolving Loan Fund, with the debt being serviced by a rate increase. The results of the enhanced recycling program begun in 2013 continue to be encouraging and participation has more than doubled as has the amount of recycled material. The program features single stream recycling, full-size carts with lids and rollers, the inclusion of cardboard, and every other week curbside pickup. We will need to continue to adjust rates periodically as operating costs continue to rise. An additional pickup route and truck is projected for funding year three of the Plan. Equipment replacement life cycles have been shortened to reduce the major repair expenses that occur during the latter years of equipment life. Departmental efficiencies are continuously reviewed, recently including an educational outreach. Support of the General Fund will continue through an operating transfer of $354,736. This utility is not charged a ROW use fee. Drainage Fund The only source of revenue for this operation is a monthly fee charged to all utility customers ($3 for residential), and insufficient revenue is an ongoing concern (pages 98-99). One of the most major accomplishments of this fund was the Willowood Drainage Project in the area of 2nd and Coltrane. This project was completed last year and we should soon receive reimbursement for the state participation. The Meadowlakes Drainage Project located in the addition north of the rodeo grounds will be constructed in the next budget year, and two other projects (Brookhaven and Taurus Drive/ Craig Drive) are in the design and easement acquisition stage. Arcadia Fund City recreational opportunities at Arcadia Lake are provided through this fund (pages 96-97), and our ongoing goal remains that this fund will generate enough revenue to pay the operating expenses. Our projection is that this goal will be met for all five years of the Plan, as attendance continues to increase as more people continue to take advantage of the variety of activities available. Our people continue to explore the possibility of new improvements to accommodate a growing attendance. The second round of improvements to the new Carl Reherman Park at 33rd & Air Depot
vii
will be accomplished in the next two budget years, including another boat launch and boat parking, day use picnic sites, a pavilion and restrooms. These improvements will be financed by the Park Tax fund. Despite encountering numerous delays for a variety of reasons, our people still hope to have the paved trail along Spring Creek from I-35 to Spring Creek Park completed in this calendar year. It is envisioned that this facility will be the initial leg of a trail system that eventually circles the entire lake. However, major private fundraising will be needed to help build the full system, which would be an outstanding regional attraction. Discussions continue concerning a potential public/private partnership development that would include a marina, some lake cabins and an attractive recreational vehicle park. A significant $250,000 reduction in the revenue bond transfer is identified in the fourth year of the Plan. These bonds were used for recreation improvements, and money is transferred from the General Fund until 2024 to make these payments which will continue at the reduced amount until the bonds are retired. Golf Course Fund The ongoing goal is to operate Kickingbird Golf Course as an enterprise fund (pages 104-105), with operating expenses covered by revenues. The Park Tax Fund will continue to provide assistance with capital improvements, including a new maintenance facility that will be constructed in the 15-16 budget year. Each year of the Plan identifies a reserve, although not the 20% amount that is our goal but nonetheless encouraging. It needs to be remembered that weather will always have a significant impact on the revenue for the golf course facility. The Edmond area is very competitive for golf courses, and our course will continue to be operated in a professional, businesslike manner that will allow us to be successful in this competition. Growing interest in the sport continues to be a focus for our outstanding staff, including youth golf opportunities, tournaments for people of all ages and skill levels, and family night events. A public/private partnership opportunity for an indoor training facility continues to be pursued as well. Park Tax Fund This fund accounts for the proceeds of the 1/8 cents sales tax for parks (pages 79-80), which has been primarily used for capital improvements. As an ongoing example, the tax finances regular replacements and upgrades to playground equipment in all City parks. Major improvements at the golf course and Arcadia Lake have also been accomplished through this tax. The operational expenses at Mitch Park now also include the expenses associated with the competitive pool, and the agreement with the Edmond Public Schools stipulates that they will contribute up to $50,000 each year. The YMCA operates the entire facility, and competitive pool area expenses are partially offset by swim club rentals. At this point we are annually budgeting $175,000 for net expenses. We are still working through startup expenses and through all the revenue potential of the swim clubs
viii
and swim meets. We believe this amount will be less after we go through all these new operational aspects. The construction of both the Mitch Park YMCA/Edmond Public Schools Competition Pool project and the Edmond 66 Softball Complex were partially financed by this fund, along with the 2000 Capital Improvements Sales Tax. Another major project financed by this tax is the City’s initial aquatic Splash Pad in a portion of the Barnett Field area at Kelly and Main, and it will also support the second phase of this pad development with a restroom and picnic shelter. Work is also underway to reuse the water from the Splash Pad to water soccer fields. The two main construction projects in next year’s budget will involve continued development of Carl Reherman Park and the new maintenance building at the golf course. Our people continue to work with the Park Board in identifying the next major projects the City should pursue, using the new Park Master Plan as a guide. The outer years of the Plan feature the accumulation of reserve funds, which is intentional and designed to provide more time to identify the next priority projects. More trail development, development of a synthetic turf workout area at the Blake-Service Soccer Complex, and the development of a second splash pad are all anticipated in future years. Ambulatory Services Fund Ambulance service to our residents is provided through Edmond’s participation in the EMSA (Emergency Medical Services Authority) regional service (pages 67-68). Several years ago we switched the funding for our EMSA subsidy to a $3.00 monthly charge on residential utility bills, as most participating cities have done to reduce pressure on the General Fund. This charge covers out-of-pocket expenses for the EMSACare ambulance service through EMSA. All residential customers are enrolled automatically in this program, but in October of every year people can opt out if they choose. However, such a choice means that residents will be responsible for these significant ambulance expenses, which now start at around $2,000. The $3.00 monthly amount was initially established with a goal of going five years without an increase, but we are pleased to report that the goal has now been exceeded and we anticipate it will be possible to continue this original charge for a few more years—good news for our residents. Due to lower contractual costs, ending balances for all five years remain positive; consequently, no increase in the original monthly charge is anticipated in this 5 year plan. Appendix A identifies EMSA’s subsidy request for the 15-16 budget is the second consecutive year that a decrease from previous years is identified, primarily resulting from the lower contract amount established a year ago by EMSA with the new service provider. It is important for our residents to realize that EMSA continues to be recognized nationally for excellent clinical care. CAPITAL IMPROVEMENTS FUNDS CIP-General Fund Limited capital funding for smaller, specific needs is provided by this fund (pages 69-70). All five years of the Plan include a $200,000 allocation for ADA (Americans with Disabilities Act) improvements and
ix
$60,000 for school zone improvements. There are no funds allocated next year for projects related to the Bicycle Master Plan, as the Bicycle Committee received permission to move up the anticipated annual $100,000 funding allocation for next year to the current budget year, in order to move forward with a larger number of projects in the same time frame. $100,000 is also included for the Downtown Urban Board’s parking lot/signage improvements. The first three years of the Plan also identifies the City's participation with five other metro cities to move forward with start-up and initial operation expenses of a Regional Transit Authority that would develop and operate a regional transit system. Such an initiative will be administered by ACOG through a task force. The costs for each city are proportional based on population. Edmond's projected shares are: FY15-16: $46, 060.63; FY16-17: $86, 352.42 and FY17-18: $56,787.09.
These funds will come from the General Government budget in the General Fund. 1996 Capital Improvements Fund For the past couple of years there has been only one project remaining to be accomplished through this fund (page 74), the 33rd Street widening project from Coltrane to I-35. This project has been moved back several times in the state (ODOT) funding cycle because of reductions in both traffic volume and accidents. However, since the remaining funds were very limited and not nearly enough to provide the City match for this project, these funds ($237,588) will now be spent in the Safe Routes to Schools program for sidewalks this year in the above fund, and as a result the ‘96 fund will be closed starting with the next budget. 2000 Capital Improvements Sales Tax Fund This fund is the main source of financing for capital improvements in our community (pages 81-82). Voters initially authorized this three-quarter cent tax in 1996 and then extended it indefinitely in 2000. The number and dollar amount of capital projects accomplished through this fund is very impressive regardless of how success is defined, and it is hard to imagine the Edmond that we know today without these improvements. Over $100M in bond financing issued through this fund has funded most of the major improvement projects in our community over the last 15 years, and the total value of projects constructed from this fund exceeds $160M. Last year featured the opening of the Mitch Park YMCA/Edmond Public Schools Competitive Pool, and also the Kelly Street Widening from Covell to Coffee Creek. The most recently completed project is the adult softball complex in Edmond Park 66 which just opened in April and is receiving great comments from various user groups. In the next few months construction will begin on the Spring Creek Trail from I-35 to Spring Creek Park at Arcadia Lake. We hope this represents only the first phase of a significant regional trail project that would wind around the entire lake. Private funding and pursuit of additional grants are being explored to continue this trail, which when constructed would provide a comprehensive biking, running and walking trail network for the citizens of Edmond and the people of central Oklahoma. The list of upcoming projects is also impressive. The next phase of improvements on Covell, from Fairfax Boulevard to I-35, is scheduled to begin later this year and also includes funding assistance from a highway grant. This project will complement the work that has already been initiated at the interchange as part of the major economic development project associated with the development of a Hotel/Conference Center (HCC). The goal is that roadway improvements will be completed as the HCC is ready to open. The anticipated development on the two northern corners of I-35 & Covell represent the
x
most significant City involvement by far in any economic development project. Edmond has committed $11M from this fund for the purchase of land for the HCC on the northwest corner ($2.2M), the purchase of land for an Indoor Sports Complex on the northeast corner ($2M), infrastructure improvements to serve development on the west side of the interchange ($2M), and funding assistance for the construction of the Conference Center ($4.8M). The HCC has been identified numerous times as a longstanding need for the community, and the Indoor Sports Complex supports a City Council goal of Edmond being a major activity hub for youth sports. These building projects should have construction contracts awarded by the private developers in the next few months. The executed development agreements provide for the City to be repaid $9M of the $11M investment in 15 years as the developers buy out the City’s interest in the land and the conference center improvements. This major economic development initiative will stimulate significant new visitor traffic to Edmond, and the development area will provide new construction-ready sites for new retail opportunities for additional sales tax collections along the I-35 corridor. The development of an Intelligent Traffic System (ITS) continues as a multi-year program which features improved traffic control equipment at local intersections that features continuous communication with a central computer system. This centralized control can be monitored and adjusted in real time to meet specific traffic issues as they arise to improve traffic flow, which our recent citizen’s survey told us emphatically is the number one concern in Edmond. The replacement of outdated signal equipment will also make this infrastructure more reliable. The first improvement corridor is under construction along 2nd Street/Edmond Road from Santa Fe on the west to Boulevard on the east. Highway grant funds are providing major funding assistance for the ITS improvements. The design is completed for the next phase of this project, which includes signals along Broadway and is now awaiting grant support. Our citizens clearly told us in the recent survey that traffic issues are their biggest concern. We then polled residents electronically to identify the specific locations that are the highest priority. Three projects will soon be under construction that will directly address three identified high priority locations. The first is an ODOT grant project that will begin this summer for additional turn lanes at 33rd and Broadway. The other two construction projects involve work to create additional turn lanes at intersections on Covell at both Santa Fe and Bryant. Since it will be several years before funding is available to the complete the roadway improvements needed for these intersections, these additional turn lanes will be added as interim improvements to improve traffic flow in the short-term. Next year’s budget also includes $2.1M for the continuation of the popular Street Overlay Program to resurface, reconstruct and rehabilitate local streets, and an annual 2.5% inflation adjustment is included in each of the outer four years of the Plan. In the past several years the City has taken full advantage of opportunities to refund past bond issues with improved interest rates, resulting in an impressive $13M in savings through refunding and guaranteed investment contracts. Most recently, the last available refunding was accomplished in the current budget and resulted in over $2M in additional revenue. As we have discussed in recent years, the ability of this fund to provide adequate long-term revenue for major capital projects is a serious concern, and the Five-Year Plan identifies a significant reduction in the number of projects being considered because of reduced funding. The initial bond ($20M) issued from this tax will not be retired until 2021. If the trend of growing sales tax revenue continues it might be possible to have another small ($12M) bond issue within the next couple of years. It important to remember however that the list of projects identified with the passage of the extension in 2000 have basically been completed—just as our public was promised. As Edmond continues to grow the funding
xi
gap will continue to widen between available revenue and an ever-increasing list of new projects to be considered. 2012 Public Safety Center—Capital Improvements Fund This fund includes the revenues and expenditures associated with the design and construction of the Public Safety Center project (page 84). In April of 2012 the City began collecting this five-year half-cent sales tax, and the tax will expire in April of 2017. A two-year construction time frame was identified, and the project remains on target for completion in September of this year. CITYLINK Public Transportation Fund Edmond initiated its own public transportation service seven years ago, and the service includes four local routes, one express route to and from OKC, and an on-demand paratransit service (pages 108-109). The City service has proven to be very popular, as total ridership has increased over 312% and total annual ridership is now over 277,000. As we have discussed in recent years however, we remain concerned about the City’s costs for this program that come entirely from the General Fund. The costs have increased with increased demand, and also because of reduced or eliminated grant funding. The 15-16 budget identifies a net estimated cost of $1.2M, which at first glance is a 36% increase from this year ($882,323). The increase primarily results from an increased contractor with the service provider (McDonald Transit) and the replacement of three busses. However, the cost increase does not reflect an anticipated reimbursement of $150,000 for two of the new busses and potentially another $240,000 in grant assistance. In addition, staff and the Transportation Committee are continuing to review options presented in the revenue study that was prepared last year by an outside consultant. The two most viable options at this point appear to be revenue from advertising and some kind of charge (fare) per ride, initially being considered for the express route. While no revenue from these potential sources has been included in next year’s budget, it is anticipated that some additional revenue from at least the initiation of an advertising program will be realized in the coming year. Art in Public Places Fund This fund provides for the financing of public art in our community (pages 75-76), and the program features a public/private partnership that is a dollar-for-dollar match for the several pieces of art that are normally placed each year. The public funds will only be spent as the private donations are received. The annual request from the Visual Arts Commission for $100,000 is included in the 15-16 budget for the matching funds program, along with an annual request for a $15,000 maintenance allocation. The collection of public art now totals around 150 pieces, most of which are located in public parks or along streets. A continuation of the Utility Bill Check-Off program is included through $3,000 allocations in all five years of the Plan. Those utility customers who choose to make a donation provide these funds. The third component of this fund is the City’s contribution of up to 1% of the total cost of municipal construction projects over $250,000 to public art.

xii
Hospital Sale Trust Fund The proceeds from the City sale in 1982 of the hospital facility now known as OU Medical Center Edmond are accounted for in this fund (pages 61-62). This fund annually receives a portion of the accrued interest. Voter approval is required to spend any of the principal, and in 2011 voters approved a LOAN of the full principal amount ($7,098,616) to provide interim initial financing of the Public Safety Center project. The proceeds from the five-year half-cent sales tax that is funding the PSC will repay the full principal amount, no later than April of 2017 (end of fifth year). Real Property Fund The interest from the Hospital Trust Fund is the only source of revenue for this fund (pages 63-64), which provides for the purchase of property for City use as needed. In recent years only a limited amount of revenue has been available, and in the short-term it would be prudent to consider another source of revenue. CDBG Fund This fund provides for the operation of Edmond’s Community Development Block Grant program (pages-53-54). The only source of funding is the annual federal CDBG allocation to Edmond as an “entitlement” community (over 50,000 population). We now identify this budget for the next year only, as we never know the amount of the federal allocation until after the budget has been prepared. Of course only the funds actually received are actually spent. Convention and Visitors Bureau Fund The sole source of revenue for this fund is the 4% hotel/motel (bed) tax (pages 65-66). Employee Pension Fund This self-funded program includes all City employees except uniformed police and fire personnel and the City Manager, and the projected contributions are identified in the individual fund budgets. The longstanding and growing disparity between the City’s contribution percentage and the individual employee contribution percentage, due to declining investment earnings, was addressed last year by the Pension Board. A new policy was established that provides that if/when the City’s contribution rate reaches 9.5%, a review of the employee contribution rate will automatically be triggered. The Board hires an actuary who annually determines the City contribution rate that is needed to maintain full funding. This individual has recommended an increase for the 15-16 budget from the current 8.32% to 8.61%, and I support this recommendation. The individual employee contribution will remain at 5.25%. We always use the annual City rate for all five years of the Plan, since we cannot determine the future economic conditions that might affect this program.

xiii
HUMAN RESOURCES The proposed personnel budget as identified by Human Resources Lisa Goodpasture is contained in the detailed information found in the Personnel section at the end of the budget document. Employee Group Insurance Fund The City’s self-funded health insurance program has long been the most significant employment benefit for full and some part-time City employees (pages 114-115). The City provides the full cost of individual coverage for all employees, except that those who select employee-only coverage under the Enhanced Plan option now pay $40 per month. The City also provides 75% of the cost for optional dependent coverage. As all other public and private entities are also doing, we continue to prepare for the changes that are currently known resulting from the federal Affordable Care Act. The Insurance Committee, along with McGriff, Seibels & Williams, Inc. who are the City’s Insurance Consultant, will be reviewing the last twelve months claims data to determine plan changes or premium adjustments. A major new additional employee benefit became a reality last August when the City opened the Employee Health Clinic in the downtown Community Center for employees and dependents. The clinic has proven to be tremendously popular in the first ten months of operation, as it provides a more accessible, centralized and no direct cost alternative for primary health care. We have been very pleased with Care ATC, the outside entity who was hired to operate the clinic, especially with Dr. Kathryn Lofgren and her two assistants who are already well-known for their personal care skills. The entire funding for the clinic comes from the reserves in this fund (Reserve for Other Restricted Purposes). This amount for next year’s budget is $673,422. We are also optimistic that the increase in employee wellness/prevention will at some point result in some stabilization of costs in this fund. Conclusion The preparation of the City of Edmond budget is, by very intentional design, a professional, transparent and open process that is a source of pride for our organization. Our internal mission and seven core values are important considerations in preparing the proposed budget and Five-Year Financial Plan. We clearly understand that the City of Edmond exists to provide services, and hopefully most our citizens believe that we are good steward of their tax dollars. It is my genuine pleasure to work every day with the exceptional people in our organization. Respectfully submitted,
Larry Stevens City Manager

Budget Summaries Tab
THE CITY OF EDMOND, OKLAHOMA
BUDGET SUMMARY - ALL FUNDS
FISCAL YEAR 15-16
SPECIAL CAPITAL ENTERPRISE FUNDS INTERNAL
GENERAL REVENUE PROJECT UTILITY OTHER SERVICE COMBINEDFUND FUNDS FUNDS FUNDS FUNDS FUNDS FUNDS
ESTIMATED RESOURCES
REVENUES:
Taxes 40,281,641 6,877,438 23,424,192 - - - 70,583,271
Inter-governmental 1,650,478 627,407 - 1,707,185 220,136 - 4,205,206
Licenses & Permits 1,461,706 - - 1,806,626 - 59,500 3,327,832
Fines & Forfeitures 2,129,109 - - - - - 2,129,109
Charges for Services 5,352,954 911,981 19,449 124,204,164 2,356,970 11,307,258 144,152,776
Interest 70,000 108,200 378,450 650,000 6,000 127,000 1,339,650
Miscellaneous Revenue 229,850 165,740 219,000 560,615 37,684 174,286 1,387,175
Subtotal - Revenues 51,175,738 8,690,766 24,041,091 128,928,590 2,620,790 11,668,044 227,125,019
OTHER RESOURCES:
Debt/Loan Proceeds - 75,000 - 20,000,000 - - 20,075,000
Restricted Prior Year Reserves 3,365,957 19,354,281 20,148,605 12,413,065 1,301 18,541,408 73,824,616
Committed Prior Year Reserves 31,112 275,000 16,327 - - - 322,439
Unrestricted Prior Year Reserves 8,127,424 - - 59,909,036 738,442 3,998,676 72,773,578
TOTAL ESTIMATED RESOURCES 62,700,231 28,395,047 44,206,023 221,250,691 3,360,533 34,208,128 394,120,652
ESTIMATED USES
DIRECT COSTS BY FUNCTION:
General Government/ Central Services 1,893,345 - 1,035,350 - - 32,143,377 35,072,072
Public Safety 1,741,496 36,677,215 6,000,000 - - 4,358,851 48,777,562
Park & Recreation 2,682,239 - 2,581,689 821,856 1,820,871 - 7,906,655
Streets & Highways 1,045,000 - 10,611,000 - - 3,952,264 15,608,264
Health & Welfare 472,500 454,524 - - 1,281,286 - 2,208,310
Utility Services - - - 117,815,822 - 7,144,696 124,960,518
Other Activities 1,664,424 675,041 - - 67,756 - 2,407,221
Economic Infrastructure Development 576,728 - - - - - 576,728
DEBT SERVICE COST:
Principal and Interest - - 8,518,729 6,343,110 - - 14,861,839
Issuance Costs - - - - - - -
TOTAL ESTIMATED COSTS 10,075,732 37,806,780 28,746,768 124,980,788 3,169,913 47,599,188 252,379,169
TRANSFERS IN:
Sales Tax - - - - - - -
Other Transfers 1,081,526 33,397,168 226,000 1,666,053 1,200,000 - 37,570,747
Debt Service Transfers - - - 2,760,484 - - 2,760,484
Internal Service Charges & Allocations - - - - 18,167 33,299,029 33,317,196
TOTAL TRANSFERS IN: 1,081,526 33,397,168 226,000 4,426,537 1,218,167 33,299,029 73,648,427
TRANSFERS OUT:
Sales Tax - - - - - - (0)
Other Transfers (34,978,221) - (11,000) (2,581,526) - - (37,570,747)
Debt Service Charges - - - (2,707,271) (53,213) - (2,760,484)
Fleet Assessment Charges (117,058) (1,336,599) (3,809) (858,662) (141,434) (765,441) (3,223,003)
Vehicle Maintenance Charges (67,796) (652,000) (2,500) (914,294) (211,300) (518,150) (2,366,040)
Insurance Cost Allocation (99,651) (934,664) (13,502) (317,372) (14,219) (390,271) (1,769,679)
Administrative Indirect Cost Allocation (4,096,147) (3,735,699) (219,206) (6,438,466) (202,343) (1,773,906) (16,465,767)
Field Services Cost Allocation (4,941,737) - - (4,550,970) - - (9,492,707)
TOTAL TRANSFERS OUT: (44,300,610) (6,658,962) (250,017) (18,368,561) (622,509) (3,447,768) (73,648,427)
TOTAL NET TRANSFERS (43,219,084) 26,738,206 (24,017) (13,942,024) 595,658 29,851,261 -
OTHER USES:
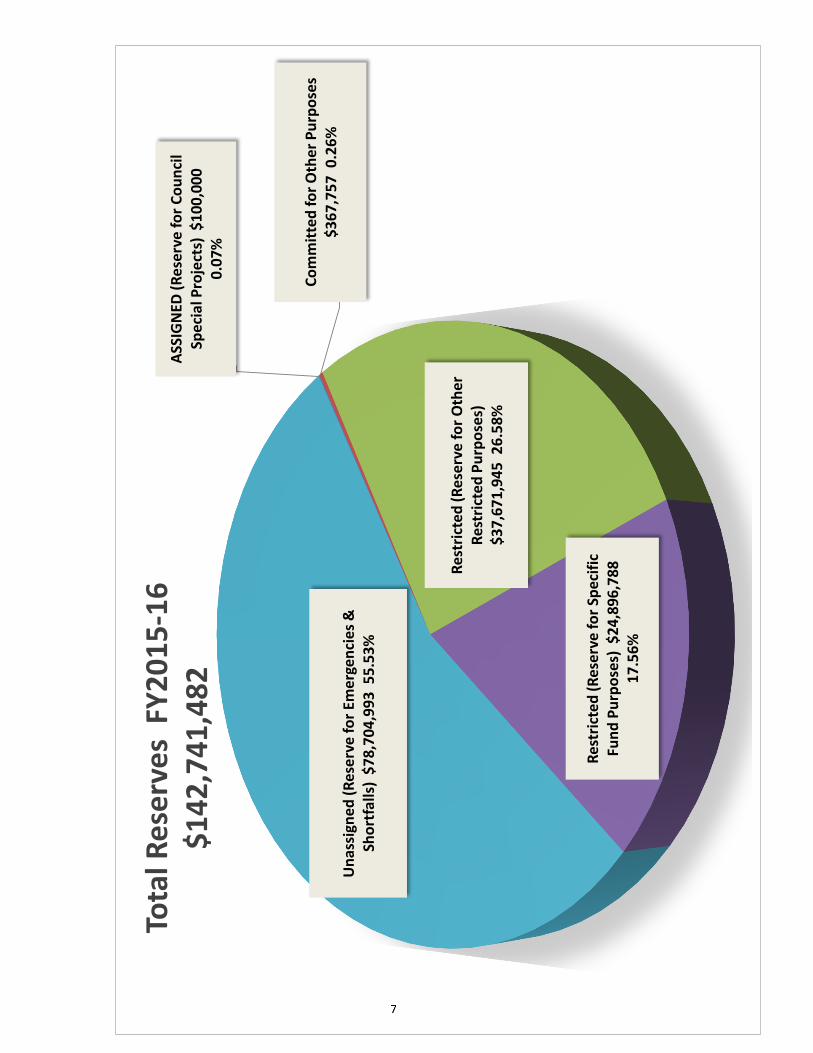
Assigned (Reserve for Council Special Projects) 100,000 - - - - - 100,000
Committed for Other Purposes - 350,000 17,757 - - - 367,757
Restricted (Reserve for Other Restricted Purposes) 3,056,724 - 7,497,165 10,691,577 1,301 16,425,178 37,671,945
Restricted (Reserve for Specific Fund Purposes) - 16,976,473 7,920,315 - - - 24,896,788
Unassigned (Res for Emergencies & Shortfalls*) 6,248,691 - - 71,636,301 784,977 35,023 78,704,993
TOTAL OTHER USES 9,405,415 17,326,473 15,435,238 82,327,879 786,278 16,460,201 141,741,482
TOTAL ESTIMATED USES 62,700,231 28,395,047 44,206,023 221,250,691 3,360,533 34,208,128 394,120,652
* LEVEL OF EMERGENCY RESERVES:
Percentage of Total Revenue 11.96% 20.54%
Number of Days of Revenue 44 75
1
GENERAL FUND
RESOURCES SUMMARY BY SOURCES
REVENUE SOURCES
Prior Year
Actual
Current Year
Budget
Current Year
Actual (Est.)BUDGET YEAR
Projected
Budget
Projected
Budget
Projected
Budget
Projected
Budget
FY 13-14 FY 14-15 FY 14-15 FY 15-16 FY 16-17 FY 17-18 FY 18-19 FY 19-20
TAXES
Sales Tax 32,504,631 31,685,357 33,300,137 34,132,640 35,497,946 36,917,864 38,394,578 39,930,362
Use Tax 3,561,151 3,379,565 3,739,845 3,633,865 3,742,881 3,855,168 3,970,823 4,089,948
Hotel/Motel Tax - - - - - - - -
Franchise Tax 2,269,717 2,429,409 2,306,725 2,472,812 2,516,214 2,559,617 2,603,020 2,689,826
Liquor Tax 41,433 41,005 43,432 42,324 43,644 44,963 46,283 47,602
Sub-Total 38,376,932 37,535,336 39,390,139 40,281,641 41,800,685 43,377,612 45,014,704 46,757,738
LICENSES & PERMITS
City Clerk 6,330 6,018 11,385 10,824 11,271 11,718 12,165 12,612
Building Department 1,551,157 1,280,275 1,512,800 1,413,559 1,486,094 1,547,697 1,625,589 1,707,516
Oil & Gas Fees 51,193 40,999 26,468 37,323 38,004 38,684 39,365 40,046
Sub-Total 1,608,680 1,327,292 1,550,653 1,461,706 1,535,369 1,598,099 1,677,119 1,760,174
FINES & FORFEITURES
Court Fines 2,099,736 2,177,125 1,954,294 2,129,109 2,173,152 2,217,196 2,261,239 2,396,823
Sub-Total 2,099,736 2,177,125 1,954,294 2,129,109 2,173,152 2,217,196 2,261,239 2,396,823
INTERGOVERNMENTAL
Grant Revenues 306,495 10,000
Alcoholic Beverage & Cigarette Tax 842,457 861,339 861,527 875,502 889,665 903,829 917,992 932,156
Vehicle & Gas Tax 811,440 688,853 788,476 774,976 791,756 808,538 825,318 842,099
Sub-Total 1,960,392 1,560,192 1,650,003 1,650,478 1,681,421 1,712,367 1,743,310 1,774,255
CHARGES FOR SERVICES
Right of Way Fees 5,066,607 5,289,132 5,289,132 4,962,817 5,069,828 5,208,244 5,346,648 5,485,039
Recreational Program Fees 54,793 58,545 59,662 60,347 61,549 62,751 63,352 64,553
Swimming Pool Fees 356,794 479,700 395,160 - - - - -
Cemetery Fees 166,055 127,755 166,265 155,590 158,940 162,290 165,641 168,991
Emergency 911 Fees 46,754 49,121 40,766 46,751 47,089 47,428 47,767 48,105
Animal Welfare Fees 45,174 50,841 49,260 51,830 52,571 52,818 53,066 53,313
Curb Cut Fees 10,200 8,494 10,489 9,710 9,953 10,196 10,440 10,683
Filing Fees 77,695 54,815 64,404 59,608 62,005 64,401 69,194 73,988
Miscellaneous Charges 11,193 5,500 4,859 5,801 6,029 6,044 6,273 6,500
Sub-Total 5,835,265 6,123,903 6,079,997 5,352,454 5,467,964 5,614,172 5,762,381 5,911,172
INTEREST
Earnings on Deposit 87,039 70,000 64,836 70,000 70,000 70,000 70,000 70,000
Sub-Total 87,039 70,000 64,836 70,000 70,000 70,000 70,000 70,000
MISCELLANEOUS REVENUES
Miscellaneous Revenues 426,011 223,936 190,208 224,850 227,278 230,292 233,305 236,319
Sub-Total 426,011 223,936 190,208 224,850 227,278 230,292 233,305 236,319
SUBTOTAL-REVENUES 50,394,055 49,017,784 50,880,130 51,170,238 52,955,869 54,819,738 56,762,058 58,906,480
TRANSFERS IN
E.P.W.A. 3,202,100 1,942,584 1,942,584 1,081,526 1,299,486 1,498,758 1,711,490 1,937,069
Neighborhood Stablization Fund - - - - - - - -
Hospital Trust Fund - - - - - - - -
Convention Visitors Bureau Fund - - - - - - -
Capital Improvement Fund - - - - - - - -
Parks Special Events Fund - - - - - - - -
Sub-Total Transfers In 3,202,100 1,942,584 1,942,584 1,081,526 1,299,486 1,498,758 1,711,490 1,937,069
OTHER RESOURCES:
Debt/Loan Proceeds - - - - - - - -
Restricted Prior Year Reserves:
Street & Alley 1,681,885 2,244,231 2,244,231 1,478,905 1,208,881 1,060,637 1,164,175 1,039,493
Juvenile Court 719,072 712,935 712,935 716,387 705,178 707,499 723,349 752,729
Capital Infrustruture Improvement 234,697 234,697 234,697 234,697 234,697 234,697 234,697 234,697
Transportation Comm. Development 8,690 5,890 5,890 7,240 7,240 7,240 7,240 7,240
Council Special Projects 10,000 10,000 10,000 31,112 100,000 100,000 100,000 100,000
Unassigned (Unrestricted) Prior Year Reserves 8,480,705 9,210,528 9,210,528 8,127,424 6,248,691 4,759,825 3,941,385 3,888,229
Sub-Total Other Resources 11,135,049 12,418,281 12,418,281 10,595,765 8,504,688 6,869,899 6,170,847 6,022,388
TOTAL ESTIMATED RESOURCES 64,731,204 63,378,649 65,240,995 62,847,530 62,760,042 63,188,395 64,644,395 66,865,938
2
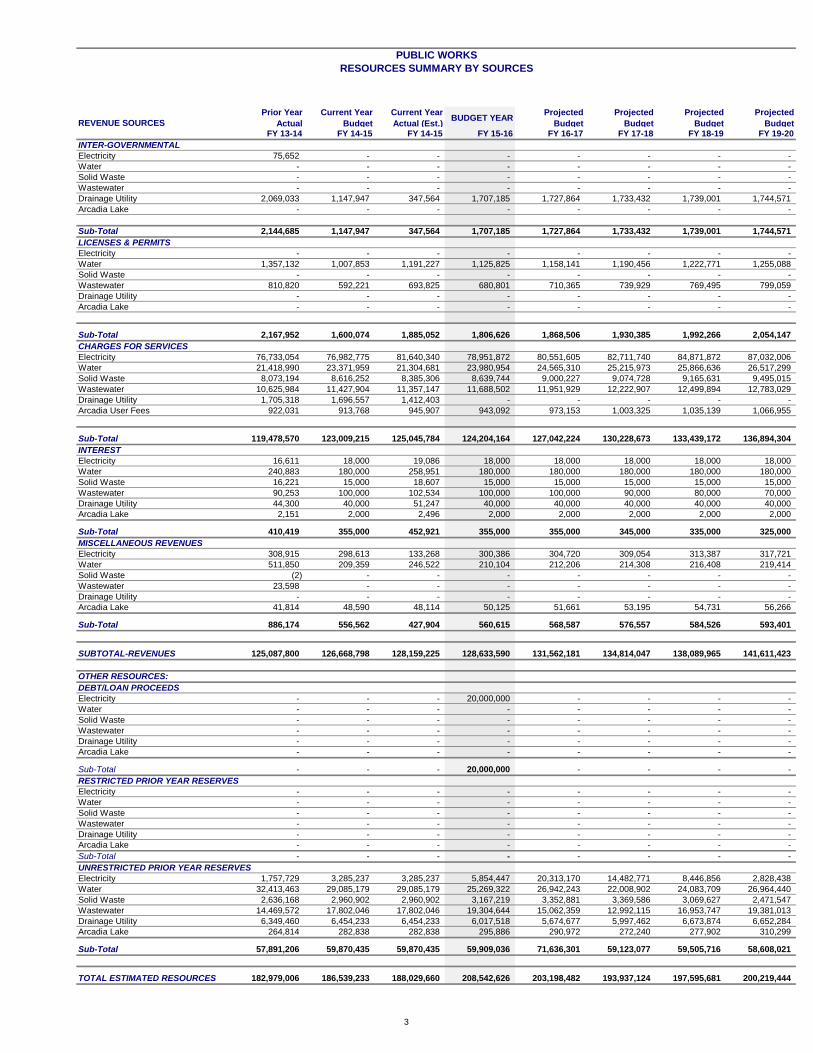
PUBLIC WORKS
RESOURCES SUMMARY BY SOURCES
REVENUE SOURCES
Prior Year
Actual
Current Year
Budget
Current Year
Actual (Est.)BUDGET YEAR
Projected
Budget
Projected
Budget
Projected
Budget
Projected
BudgetFY 13-14 FY 14-15 FY 14-15 FY 15-16 FY 16-17 FY 17-18 FY 18-19 FY 19-20
INTER-GOVERNMENTAL
Electricity 75,652 - - - - - - -
Water - - - - - - - -
Solid Waste - - - - - - - -
Wastewater - - - - - - - -
Drainage Utility 2,069,033 1,147,947 347,564 1,707,185 1,727,864 1,733,432 1,739,001 1,744,571
Arcadia Lake - - - - - - - -
Sub-Total 2,144,685 1,147,947 347,564 1,707,185 1,727,864 1,733,432 1,739,001 1,744,571
LICENSES & PERMITS
Electricity - - - - - - - -
Water 1,357,132 1,007,853 1,191,227 1,125,825 1,158,141 1,190,456 1,222,771 1,255,088
Solid Waste - - - - - - - -
Wastewater 810,820 592,221 693,825 680,801 710,365 739,929 769,495 799,059
Drainage Utility - - - - - - - -
Arcadia Lake - - - - - - - -
Sub-Total 2,167,952 1,600,074 1,885,052 1,806,626 1,868,506 1,930,385 1,992,266 2,054,147
CHARGES FOR SERVICES
Electricity 76,733,054 76,982,775 81,640,340 78,951,872 80,551,605 82,711,740 84,871,872 87,032,006
Water 21,418,990 23,371,959 21,304,681 23,980,954 24,565,310 25,215,973 25,866,636 26,517,299
Solid Waste 8,073,194 8,616,252 8,385,306 8,639,744 9,000,227 9,074,728 9,165,631 9,495,015
Wastewater 10,625,984 11,427,904 11,357,147 11,688,502 11,951,929 12,222,907 12,499,894 12,783,029
Drainage Utility 1,705,318 1,696,557 1,412,403 - - - - -
Arcadia User Fees 922,031 913,768 945,907 943,092 973,153 1,003,325 1,035,139 1,066,955
Sub-Total 119,478,570 123,009,215 125,045,784 124,204,164 127,042,224 130,228,673 133,439,172 136,894,304
INTEREST
Electricity 16,611 18,000 19,086 18,000 18,000 18,000 18,000 18,000
Water 240,883 180,000 258,951 180,000 180,000 180,000 180,000 180,000
Solid Waste 16,221 15,000 18,607 15,000 15,000 15,000 15,000 15,000
Wastewater 90,253 100,000 102,534 100,000 100,000 90,000 80,000 70,000
Drainage Utility 44,300 40,000 51,247 40,000 40,000 40,000 40,000 40,000
Arcadia Lake 2,151 2,000 2,496 2,000 2,000 2,000 2,000 2,000
Sub-Total 410,419 355,000 452,921 355,000 355,000 345,000 335,000 325,000
MISCELLANEOUS REVENUES
Electricity 308,915 298,613 133,268 300,386 304,720 309,054 313,387 317,721
Water 511,850 209,359 246,522 210,104 212,206 214,308 216,408 219,414
Solid Waste (2) - - - - - - -
Wastewater 23,598 - - - - - - -
Drainage Utility - - - - - - - -
Arcadia Lake 41,814 48,590 48,114 50,125 51,661 53,195 54,731 56,266
Sub-Total 886,174 556,562 427,904 560,615 568,587 576,557 584,526 593,401
SUBTOTAL-REVENUES 125,087,800 126,668,798 128,159,225 128,633,590 131,562,181 134,814,047 138,089,965 141,611,423
OTHER RESOURCES:
DEBT/LOAN PROCEEDS
Electricity - - - 20,000,000 - - - -
Water - - - - - - - -
Solid Waste - - - - - - - -
Wastewater - - - - - - - -
Drainage Utility - - - - - - - -
Arcadia Lake - - - - - - - -
Sub-Total - - - 20,000,000 - - - -
RESTRICTED PRIOR YEAR RESERVES
Electricity - - - - - - - -
Water - - - - - - - -
Solid Waste - - - - - - - -
Wastewater - - - - - - - -
Drainage Utility - - - - - - - -
Arcadia Lake - - - - - - - -
Sub-Total - - - - - - - -
UNRESTRICTED PRIOR YEAR RESERVES
Electricity 1,757,729 3,285,237 3,285,237 5,854,447 20,313,170 14,482,771 8,446,856 2,828,438
Water 32,413,463 29,085,179 29,085,179 25,269,322 26,942,243 22,008,902 24,083,709 26,964,440
Solid Waste 2,636,168 2,960,902 2,960,902 3,167,219 3,352,881 3,369,586 3,069,627 2,471,547
Wastewater 14,469,572 17,802,046 17,802,046 19,304,644 15,062,359 12,992,115 16,953,747 19,381,013
Drainage Utility 6,349,460 6,454,233 6,454,233 6,017,518 5,674,677 5,997,462 6,673,874 6,652,284
Arcadia Lake 264,814 282,838 282,838 295,886 290,972 272,240 277,902 310,299
Sub-Total 57,891,206 59,870,435 59,870,435 59,909,036 71,636,301 59,123,077 59,505,716 58,608,021
TOTAL ESTIMATED RESOURCES 182,979,006 186,539,233 188,029,660 208,542,626 203,198,482 193,937,124 197,595,681 200,219,444
3
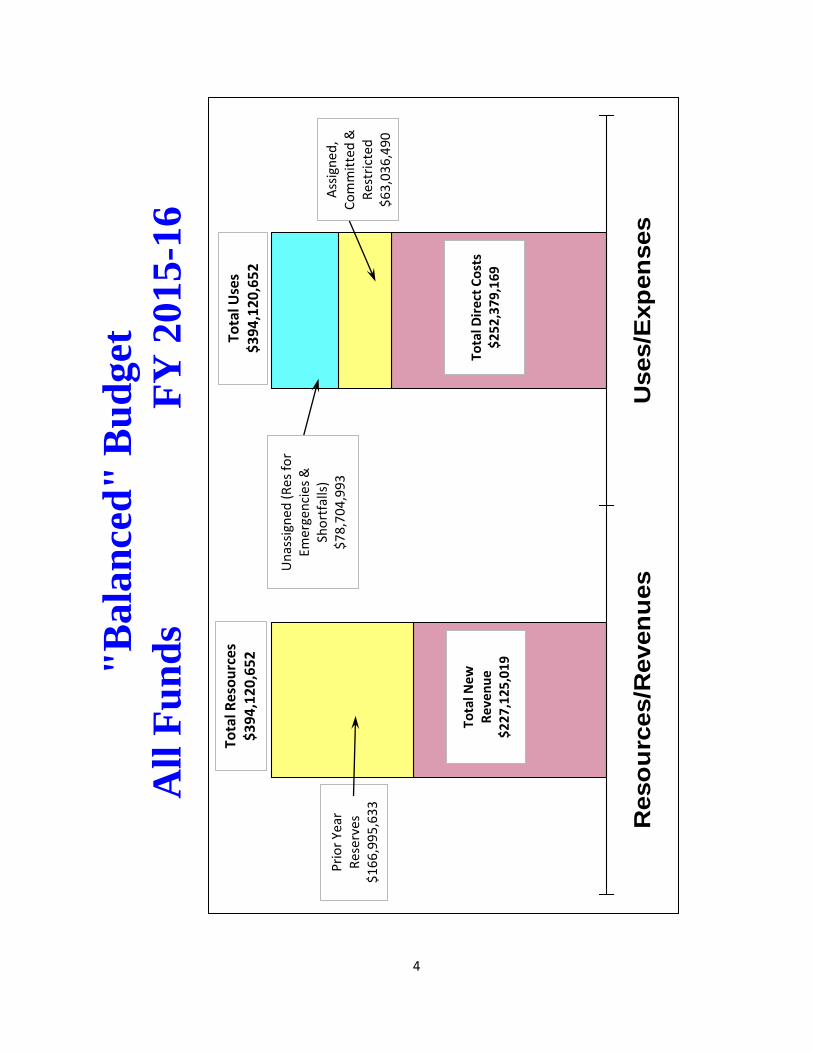
"B
ala
nce
d"
Bu
dget
All
Fu
nd
s
F
Y 2
01
5-1
6
Reso
urc
es/R
even
ues
Uses/E
xp
en
ses
Un
assi
gned
(R
es
for
Emer
gen
cies
&
Sho
rtfa
lls)
$
78
,70
4,9
93
Ass
ign
ed,
Co
mm
itte
d &
R
estr
icte
d
$6
3,0
36
,49
0
Pri
or
Year
R
ese
rves
$
16
6,9
95,
633
Tota
lNe
w
Rev
enu
e
$2
27
,125
,01
9
Tota
l Dir
ect
Co
sts
$2
52
,37
9,1
69
Tota
l Res
ou
rce
s$
39
4,1
20
,65
2To
tal U
ses
$
39
4,1
20
,65
2
4
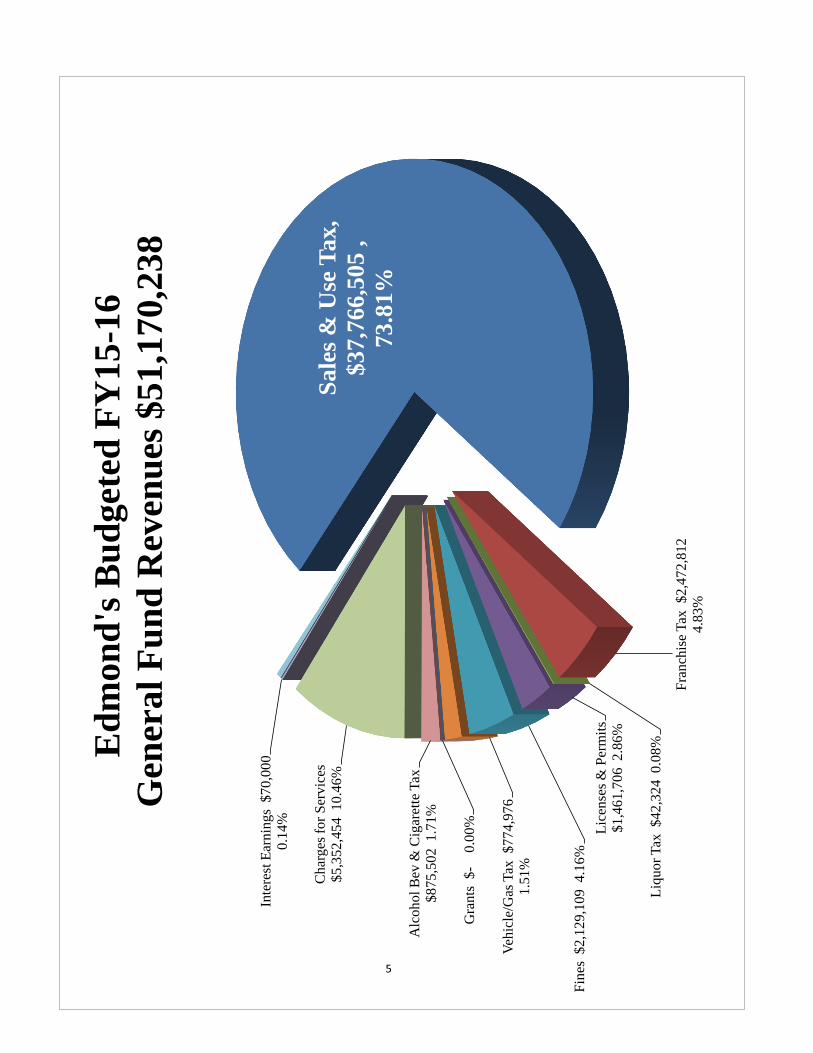
Sa
les
& U
se T
ax
,
$37,7
66,5
05 ,
73.8
1%
Fra
nch
ise
Tax
$2
,47
2,8
12
4.8
3%
Liq
uo
r T
ax$
42
,32
4 0
.08
%
Lic
ense
s &
Per
mit
s
$1
,46
1,7
06 2
.86
%
Fin
es$
2,1
29
,10
9 4
.16
%
Veh
icle
/Gas
Tax
$7
74
,97
6
1.5
1%
Gra
nts
$-
0.0
0%
Alc
oh
ol
Bev
& C
igar
ette
Tax
$8
75
,50
2 1
.71
%
Ch
arg
es f
or
Ser
vic
es
$5
,35
2,4
54 1
0.4
6%
Inte
rest
Ear
nin
gs
$7
0,0
00
0.1
4%
Ed
mon
d's
Bu
dget
ed F
Y15
-16
Gen
eral
Fu
nd
Rev
enu
es $
51,1
70,2
38
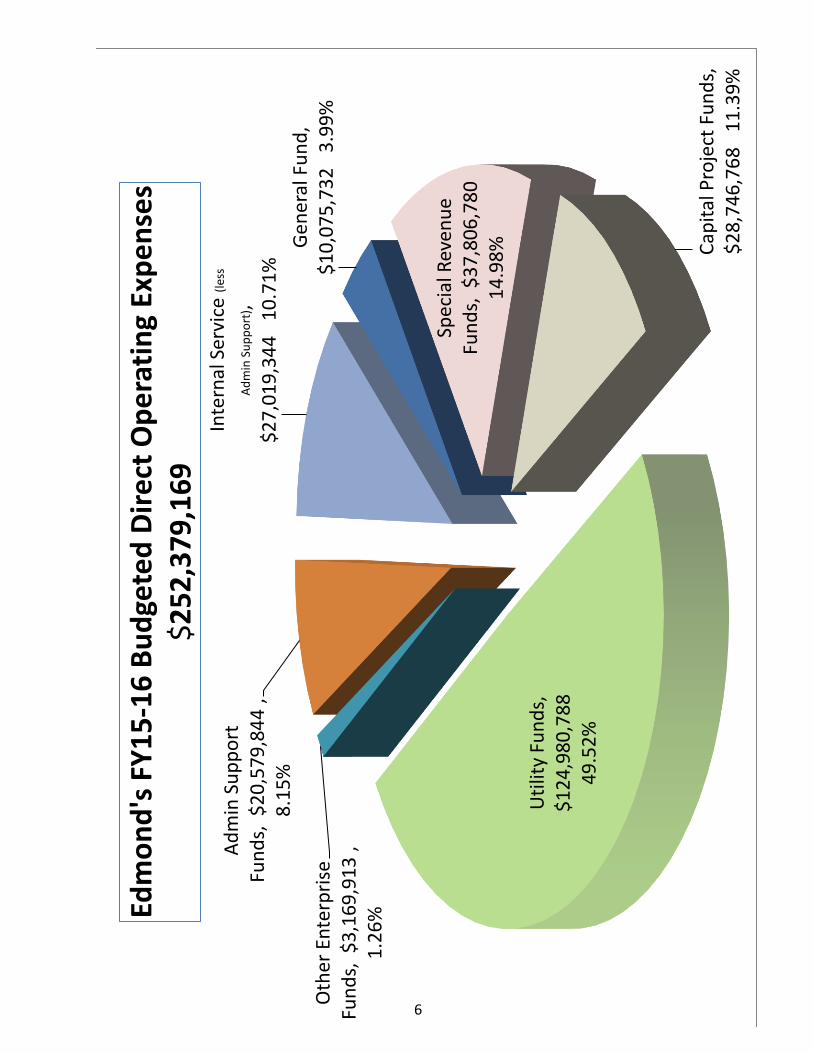
Gen
eral
Fu
nd
, $
10
,07
5,7
32
3
.99
%
Spec
ial R
even
ue
Fun
ds,
$3
7,8
06
,78
0
14
.98
% Cap
ital
Pro
ject
Fu
nd
s,
$2
8,7
46
,76
8
11
.39
%
Uti
lity
Fun
ds,
$
12
4,9
80
,78
8
49
.52
%
Oth
er E
nte
rpri
se
Fun
ds,
$3
,16
9,9
13
,
1.2
6%
Ad
min
Su
pp
ort
Fu
nd
s, $
20
,57
9,8
44
,
8.1
5%
Inte
rnal
Ser
vice
(les
s
Ad
min
Su
pp
ort
),
$2
7,0
19
,34
4
10
.71
%
Edm
on
d's
FY
15
-16
Bu
dge
ted
Dir
ect
Op
era
tin
g Ex
pe
nse
s
$2
52
,37
9,1
69
6
ASS
IGN
ED (
Re
serv
e f
or
Co
un
cil
Spe
cial
Pro
ject
s)$
10
0,0
00
0
.07
%
Co
mm
itte
d f
or
Oth
er
Pu
rpo
ses
$3
67
,75
7 0
.26
%
Re
stri
cte
d (
Re
serv
e f
or
Oth
er
Re
stri
cte
d P
urp
ose
s)$
37
,67
1,9
45
26
.58
%
Re
stri
cte
d (
Re
serv
e f
or
Spe
cifi
c Fu
nd
Pu
rpo
ses)
$2
4,8
96
,78
8
17
.56
%
Un
assi
gne
d (
Re
serv
e f
or
Eme
rge
nci
es
&
Sho
rtfa
lls)
$7
8,7
04
,99
3 5
5.5
3%
Tota
l Re
serv
es
FY
20
15
-16
$
14
2,7
41
,48
2


General Fund Tab
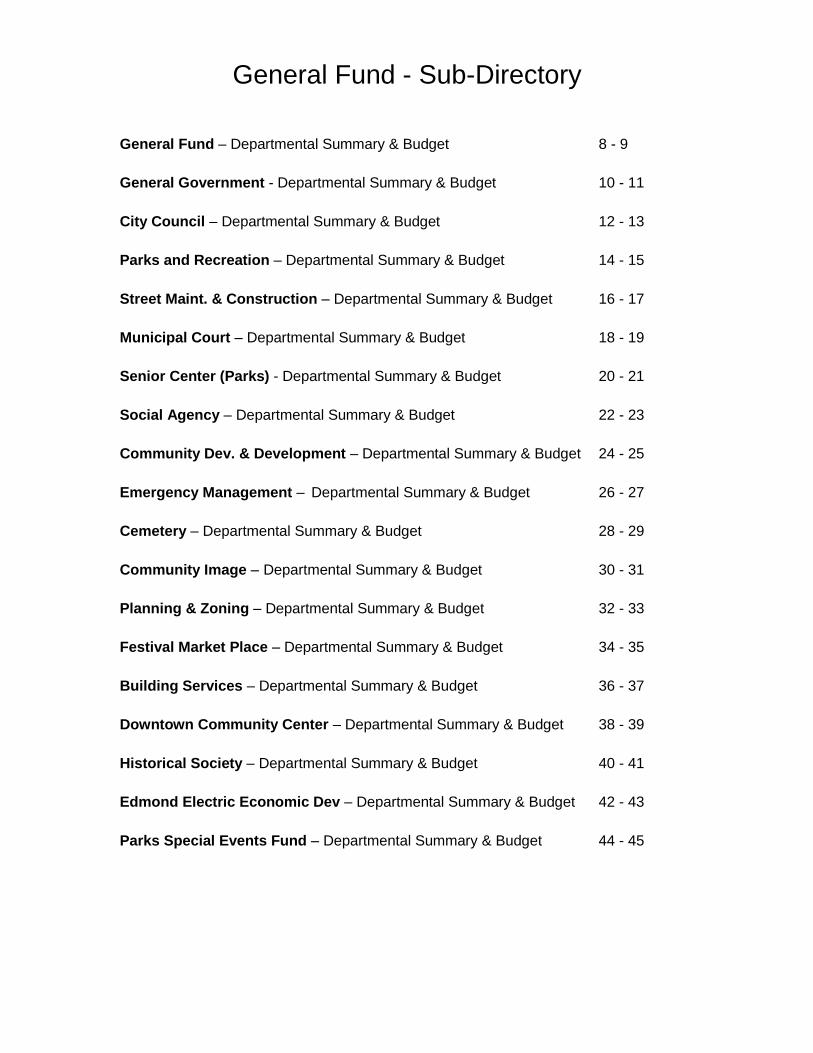
General Fund - Sub-Directory
General Fund – Departmental Summary & Budget 8 - 9
General Government - Departmental Summary & Budget 10 - 11
City Council – Departmental Summary & Budget 12 - 13
Parks and Recreation – Departmental Summary & Budget 14 - 15
Street Maint. & Construction – Departmental Summary & Budget 16 - 17
Municipal Court – Departmental Summary & Budget 18 - 19
Senior Center (Parks) - Departmental Summary & Budget 20 - 21
Social Agency – Departmental Summary & Budget 22 - 23
Community Dev. & Development – Departmental Summary & Budget 24 - 25
Emergency Management – Departmental Summary & Budget 26 - 27
Cemetery – Departmental Summary & Budget 28 - 29
Community Image – Departmental Summary & Budget 30 - 31
Planning & Zoning – Departmental Summary & Budget 32 - 33
Festival Market Place – Departmental Summary & Budget 34 - 35
Building Services – Departmental Summary & Budget 36 - 37
Downtown Community Center – Departmental Summary & Budget 38 - 39
Historical Society – Departmental Summary & Budget 40 - 41
Edmond Electric Economic Dev – Departmental Summary & Budget 42 - 43
Parks Special Events Fund – Departmental Summary & Budget 44 - 45

8
General Fund
2015-2016
Departmental Summary
D E P A R T M E N T A L D E S C R I P T I O N
The General Fund is the principal fund of the City which accounts for all transactions not
accounted for in the other funds. It accounts for the costs of operating many of the City’s
general basic services, such as street maintenance, parks and recreation, and general
government. Financing is primarily provided by City sales tax, franchise taxes and EPWA
transfers, fines, licenses, and permits, charges for services and interest earnings.
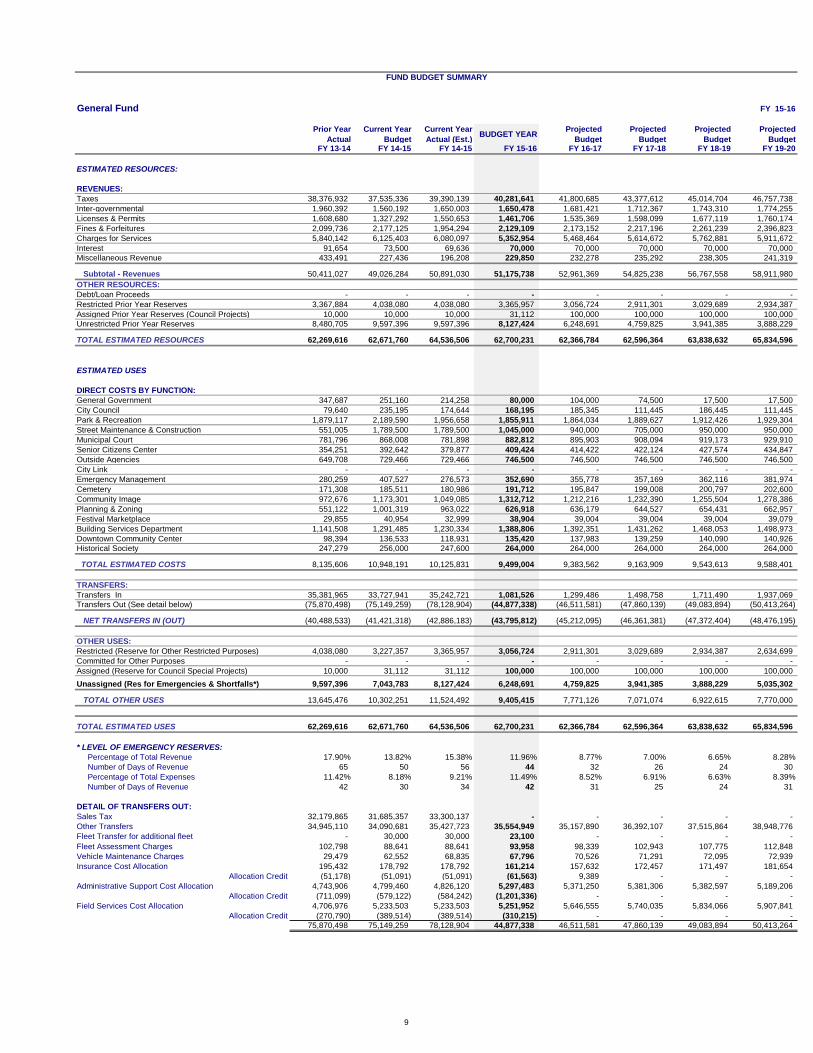
FUND BUDGET SUMMARY
General Fund FY 15-16
Prior Year
Actual
Current Year
Budget
Current Year
Actual (Est.)BUDGET YEAR
Projected
Budget
Projected
Budget
Projected
Budget
Projected
BudgetFY 13-14 FY 14-15 FY 14-15 FY 15-16 FY 16-17 FY 17-18 FY 18-19 FY 19-20
ESTIMATED RESOURCES:
REVENUES:
Taxes 38,376,932 37,535,336 39,390,139 40,281,641 41,800,685 43,377,612 45,014,704 46,757,738
Inter-governmental 1,960,392 1,560,192 1,650,003 1,650,478 1,681,421 1,712,367 1,743,310 1,774,255
Licenses & Permits 1,608,680 1,327,292 1,550,653 1,461,706 1,535,369 1,598,099 1,677,119 1,760,174
Fines & Forfeitures 2,099,736 2,177,125 1,954,294 2,129,109 2,173,152 2,217,196 2,261,239 2,396,823
Charges for Services 5,840,142 6,125,403 6,080,097 5,352,954 5,468,464 5,614,672 5,762,881 5,911,672
Interest 91,654 73,500 69,636 70,000 70,000 70,000 70,000 70,000
Miscellaneous Revenue 433,491 227,436 196,208 229,850 232,278 235,292 238,305 241,319
Subtotal - Revenues 50,411,027 49,026,284 50,891,030 51,175,738 52,961,369 54,825,238 56,767,558 58,911,980
OTHER RESOURCES:
Debt/Loan Proceeds - - - - - - - -
Restricted Prior Year Reserves 3,367,884 4,038,080 4,038,080 3,365,957 3,056,724 2,911,301 3,029,689 2,934,387
Assigned Prior Year Reserves (Council Projects) 10,000 10,000 10,000 31,112 100,000 100,000 100,000 100,000
Unrestricted Prior Year Reserves 8,480,705 9,597,396 9,597,396 8,127,424 6,248,691 4,759,825 3,941,385 3,888,229
TOTAL ESTIMATED RESOURCES 62,269,616 62,671,760 64,536,506 62,700,231 62,366,784 62,596,364 63,838,632 65,834,596
ESTIMATED USES
DIRECT COSTS BY FUNCTION:
General Government 347,687 251,160 214,258 80,000 104,000 74,500 17,500 17,500
City Council 79,640 235,195 174,644 168,195 185,345 111,445 186,445 111,445
Park & Recreation 1,879,117 2,189,590 1,956,658 1,855,911 1,864,034 1,889,627 1,912,426 1,929,304
Street Maintenance & Construction 551,005 1,789,500 1,789,500 1,045,000 940,000 705,000 950,000 950,000
Municipal Court 781,796 868,008 781,898 882,812 895,903 908,094 919,173 929,910
Senior Citizens Center 354,251 392,642 379,877 409,424 414,422 422,124 427,574 434,847
Outside Agencies 649,708 729,466 729,466 746,500 746,500 746,500 746,500 746,500
City Link - - - - - - - -
Emergency Management 280,259 407,527 276,573 352,690 355,778 357,169 362,116 381,974
Cemetery 171,308 185,511 180,986 191,712 195,847 199,008 200,797 202,600
Community Image 972,676 1,173,301 1,049,085 1,312,712 1,212,216 1,232,390 1,255,504 1,278,386
Planning & Zoning 551,122 1,001,319 963,022 626,918 636,179 644,527 654,431 662,957
Festival Marketplace 29,855 40,954 32,999 38,904 39,004 39,004 39,004 39,079
Building Services Department 1,141,508 1,291,485 1,230,334 1,388,806 1,392,351 1,431,262 1,468,053 1,498,973
Downtown Community Center 98,394 136,533 118,931 135,420 137,983 139,259 140,090 140,926
Historical Society 247,279 256,000 247,600 264,000 264,000 264,000 264,000 264,000
TOTAL ESTIMATED COSTS 8,135,606 10,948,191 10,125,831 9,499,004 9,383,562 9,163,909 9,543,613 9,588,401
TRANSFERS:
Transfers In 35,381,965 33,727,941 35,242,721 1,081,526 1,299,486 1,498,758 1,711,490 1,937,069
Transfers Out (See detail below) (75,870,498) (75,149,259) (78,128,904) (44,877,338) (46,511,581) (47,860,139) (49,083,894) (50,413,264)
NET TRANSFERS IN (OUT) (40,488,533) (41,421,318) (42,886,183) (43,795,812) (45,212,095) (46,361,381) (47,372,404) (48,476,195)
OTHER USES:
Restricted (Reserve for Other Restricted Purposes) 4,038,080 3,227,357 3,365,957 3,056,724 2,911,301 3,029,689 2,934,387 2,634,699
Committed for Other Purposes - - - - - - - -
Assigned (Reserve for Council Special Projects) 10,000 31,112 31,112 100,000 100,000 100,000 100,000 100,000
Unassigned (Res for Emergencies & Shortfalls*) 9,597,396 7,043,783 8,127,424 6,248,691 4,759,825 3,941,385 3,888,229 5,035,302
TOTAL OTHER USES 13,645,476 10,302,251 11,524,492 9,405,415 7,771,126 7,071,074 6,922,615 7,770,000
TOTAL ESTIMATED USES 62,269,616 62,671,760 64,536,506 62,700,231 62,366,784 62,596,364 63,838,632 65,834,596
* LEVEL OF EMERGENCY RESERVES:
Percentage of Total Revenue 17.90% 13.82% 15.38% 11.96% 8.77% 7.00% 6.65% 8.28%
Number of Days of Revenue 65 50 56 44 32 26 24 30
Percentage of Total Expenses 11.42% 8.18% 9.21% 11.49% 8.52% 6.91% 6.63% 8.39%
Number of Days of Revenue 42 30 34 42 31 25 24 31
DETAIL OF TRANSFERS OUT:
Sales Tax 32,179,865 31,685,357 33,300,137 - - - - -
Other Transfers 34,945,110 34,090,681 35,427,723 35,554,949 35,157,890 36,392,107 37,515,864 38,948,776
Fleet Transfer for additional fleet - 30,000 30,000 23,100 - - - -
Fleet Assessment Charges 102,798 88,641 88,641 93,958 98,339 102,943 107,775 112,848
Vehicle Maintenance Charges 29,479 62,552 68,835 67,796 70,526 71,291 72,095 72,939
Insurance Cost Allocation 195,432 178,792 178,792 161,214 157,632 172,457 171,497 181,654
Allocation Credit (51,178) (51,091) (51,091) (61,563) 9,389 - - -
Administrative Support Cost Allocation 4,743,906 4,799,460 4,826,120 5,297,483 5,371,250 5,381,306 5,382,597 5,189,206
Allocation Credit (711,099) (579,122) (584,242) (1,201,336) - - - -
Field Services Cost Allocation 4,706,976 5,233,503 5,233,503 5,251,952 5,646,555 5,740,035 5,834,066 5,907,841
Allocation Credit (270,790) (389,514) (389,514) (310,215) - - - -
75,870,498 75,149,259 78,128,904 44,877,338 46,511,581 47,860,139 49,083,894 50,413,264
9
10
General Government
2015-2016
Departmental summary
D E P A R T M E N T A L D E S C R I P T I O N
This department details the transfers that come out of the General Fund which are listed on
the following page. In previous years, this included the costs that are now a part of the
Central Communications budget.

DE
PA
RT
ME
NT
BU
DG
ET
SU
MM
AR
Y
DE
PA
RT
ME
NT
: G
en
era
l G
overn
men
t F
UN
D:
GE
NE
RA
L F
UN
DF
Y 15-1
6
EX
PE
ND
ITU
RE
Pri
or
Year
Actu
al
Cu
rren
t Y
ear
Bu
dg
et
Cu
rren
t Y
ear
Actu
al (E
st.
)B
UD
GE
T Y
EA
RP
roje
cte
d
Bu
dg
et
Pro
jecte
d
Bu
dg
et
Pro
jecte
d
Bu
dg
et
Pro
jecte
d
Bu
dg
et
CL
AS
SIF
ICA
TIO
NF
Y 1
3-1
4F
Y 1
4-1
5F
Y 1
4-1
5F
Y 1
5-1
6F
Y 1
6-1
7F
Y 1
7-1
8F
Y 1
8-1
9F
Y 1
9-2
0
Pers
onal S
erv
ices
-
-
-
-
-
-
-
-
Mate
rials
& S
upplie
s-
-
-
-
-
-
-
-
Oth
er
Serv
ices &
Charg
es
301,0
56
98,9
60
198,2
58
64,0
00
104,0
00
74,5
00
17,5
00
17,5
00
Capital O
utlay
46,4
46
-
-
-
-
-
-
-
Debt S
erv
ice
-
-
-
-
-
-
-
-
Tra
nsfe
rs73,6
90,3
84
72,8
41,7
88
75,7
93,6
10
42,3
40,2
67
45,0
12,8
74
46,4
07,8
39
47,6
96,0
64
49,0
21,1
48
TO
TA
L74,0
37,8
87
72,9
40,7
48
75,9
91,8
68
42,4
04,2
67
45,1
16,8
74
46,4
82,3
39
47,7
13,5
64
49,0
38,6
48
DE
TA
IL O
F T
RA
NS
FE
RS
:
Edm
ond P
ublic
Work
s A
uth
ority
(S
ale
s T
ax)
**
32,1
79,8
65
31,6
85,3
57
33,3
00,1
37
Fire P
ublic
Safe
ty L
imited T
ax F
und
14,4
73,0
12
14,2
37,2
78
15,1
58,0
47
14,9
98,7
28
15,5
26,6
34
16,0
81,0
11
16,6
55,0
24
17,2
94,7
68
Polic
e P
ublic
Safe
ty L
imited T
ax F
und
17,7
53,5
62
17,4
64,3
94
18,5
93,8
71
18,3
98,4
40
19,0
46,0
05
19,7
26,0
41
20,4
30,1
63
21,2
14,9
15
Capital Im
pro
vem
ent F
und
856,7
84
665,0
00
250,0
00
100,0
00
100,0
00
100,0
00
200,0
00
200,0
00
Arc
adia
Lake
504,7
80
495,1
21
65,1
50
166,0
53
485,2
51
485,0
55
230,6
76
239,0
93
Art
s in P
ublic
Pla
ces F
und
190,8
13
178,8
88
110,6
55
115,0
00
-
-
-
-
Edm
ond E
conom
ic D
evelo
pm
ent F
und (
EE
DA
)528,4
29
565,4
19
565,4
19
576,7
28
576,7
28
576,7
28
576,7
28
576,7
28
Edm
ond E
lectr
ic E
conom
ic D
evelo
pm
ent F
und
50,0
00
50,0
00
50,0
00
Adm
inis
trative S
upport
1,8
05,0
80
1,7
75,5
00
1,7
75,5
00
2,2
93,3
60
2,3
53,7
75
2,3
69,5
01
2,3
88,6
43
2,2
05,7
25
Allo
cation C
redit
(230,7
08)
(155,0
78)
(155,0
78)
(446,8
81)
-
-
-
-
Insura
nce A
ssessm
ent
46,1
92
46,3
89
46,3
89
26,2
77
27,9
26
29,4
68
30,7
63
32,0
78
Allo
cation C
redit
(19,7
69)
(10,4
69)
(10,4
69)
(29,1
75)
-
-
-
-
Fie
ld S
erv
ices
4,7
06,9
76
5,2
33,5
03
5,2
33,5
03
5,2
51,9
52
5,6
46,5
55
5,7
40,0
35
5,8
34,0
66
5,9
07,8
41
Allo
cation C
redit
(270,7
90)
(389,5
14)
(389,5
14)
(310,2
15)
-
-
-
-
CD
BG
13,1
58
-
-
-
-
-
-
-
CityLin
k1,1
03,0
00
1,0
00,0
00
1,2
00,0
00
1,2
00,0
00
1,2
50,0
00
1,3
00,0
00
1,3
50,0
00
1,3
50,0
00
Vehic
le M
ain
tenance
-
-
-
-
-
-
-
73,6
90,3
84
72,8
41,7
88
75,7
93,6
10
42,3
40,2
67
45,0
12,8
74
46,4
07,8
39
47,6
96,0
64
49,0
21,1
48
**A
ppro
priation o
f th
e C
ity's
sale
s tax r
evenue to the E
dm
ond P
ublic
Work
s A
uth
ority
is in a
ccord
ance w
ith the s
enio
r lie
n b
ond Indentu
re.
11
12
City Council
2015-2016
Departmental Summary
D E P A R T M E N T A L D E S C R I P T I O N
The Edmond City Council’s vision is that Edmond will be a diverse and innovative hometown committed to
excellence through leadership, balanced growth, and cooperation. These high standards will only be accomplished
in full partnership with the community. The mission of the Edmond City Council is to lead by setting policy for
City direction, by balancing growth, and by serving as stewards of assets for today’s, as well as tomorrow’s,
community & citizens. The following goals were adopted Fall 2014.
Current Goals (< 2 years, short term in nature, defined with a specific time range for completion)
1. Complete the Hotel/Conference Center
2. Develop a more effective Plan Amendment Request review process for Edmond Plan IV to include the
incorporation of the following: Parks and Trails Plan, Transportation Plan, Bicycle Plan, Basin
Drainage/Flood Plan Studies and Downtown Master Plan
3. Promote Edmond’s unique and historical downtown, including a closer connection with Central
Edmond Urban District Board on implementing the 2014 Edmond Downtown Master Plan
4. Identify plans for development of the current Police Department building and other City of Edmond
buildings that need repurposing
5. Implement Phase II of Intelligent Traffic System
6. Renew existing General Fund second penny sales tax
7. Develop a process to determine items on capital expenditures project list
8. Create a unified brand to enhance communication with citizens
9. Establish tree canopy percentage goal and identify steps for implementation
Future Goals (> 2 years, long term in nature, time range will be defined through Council discussions)
1. Continue development to become a destination to experience art, entertainment, amateur sporting
events and outdoor recreation, including possible development of a performing arts center
2. Continue economic development of I-35 corridor
3. Promote Edmond as a livable community with access to recreation and transportation via:
a. Participation in Association of Central Oklahoma Governments’ Regional Transit Planning
b. Development of bike and multi-use trails
4. Explore expansion of library services
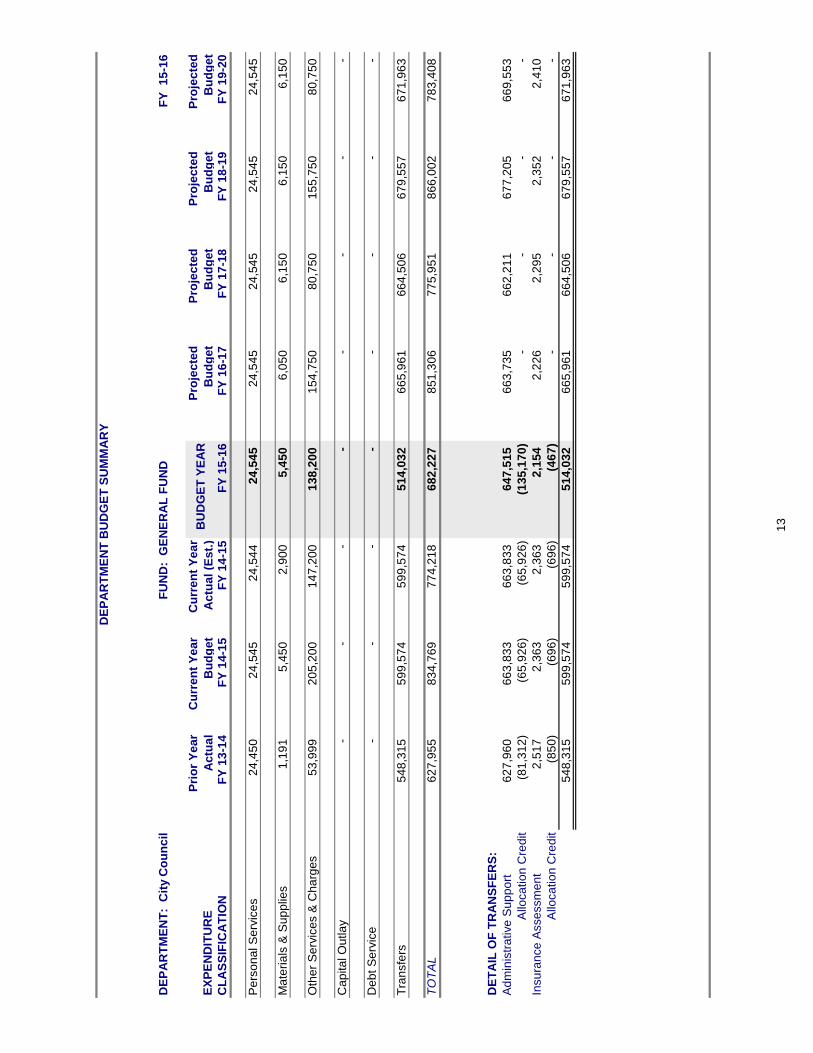
DE
PA
RT
ME
NT
BU
DG
ET
SU
MM
AR
Y
DE
PA
RT
ME
NT
: C
ity C
ou
nc
il
FU
ND
: G
EN
ER
AL
FU
ND
FY
1
5-1
6
EX
PE
ND
ITU
RE
Pri
or
Ye
ar
Ac
tua
l
Cu
rre
nt
Ye
ar
Bu
dg
et
Cu
rre
nt
Ye
ar
Ac
tua
l (E
st.
)B
UD
GE
T Y
EA
RP
roje
cte
d
Bu
dg
et
Pro
jec
ted
Bu
dg
et
Pro
jec
ted
Bu
dg
et
Pro
jec
ted
Bu
dg
et
CL
AS
SIF
ICA
TIO
NF
Y 1
3-1
4F
Y 1
4-1
5F
Y 1
4-1
5F
Y 1
5-1
6F
Y 1
6-1
7F
Y 1
7-1
8F
Y 1
8-1
9F
Y 1
9-2
0
Pe
rso
na
l S
erv
ice
s2
4,4
50
24
,54
5
2
4,5
44
24
,54
5
2
4,5
45
24
,54
5
2
4,5
45
24
,54
5
Ma
teri
als
& S
up
plie
s1
,19
1
5,4
50
2
,90
0
5,4
50
6
,05
0
6,1
50
6
,15
0
6,1
50
Oth
er
Se
rvic
es &
Cha
rge
s5
3,9
99
20
5,2
00
1
47
,20
0
13
8,2
00
1
54
,75
0
80
,75
0
1
55
,75
0
80
,75
0
Ca
pita
l O
utla
y-
-
-
-
-
-
-
-
De
bt
Se
rvic
e-
-
-
-
-
-
-
-
Tra
nsfe
rs5
48
,31
5
59
9,5
74
5
99
,57
4
51
4,0
32
6
65
,96
1
66
4,5
06
6
79
,55
7
67
1,9
63
TO
TA
L6
27
,95
5
83
4,7
69
7
74
,21
8
68
2,2
27
8
51
,30
6
77
5,9
51
8
66
,00
2
78
3,4
08
DE
TA
IL O
F T
RA
NS
FE
RS
:
Ad
min
istr
ative
Su
pp
ort
62
7,9
60
6
63
,83
3
66
3,8
33
6
47
,51
5
66
3,7
35
6
62
,21
1
67
7,2
05
6
69
,55
3
Allo
ca
tio
n C
red
it(8
1,3
12
)
(65
,92
6)
(6
5,9
26
)
(13
5,1
70
)
-
-
-
-
Insu
ran
ce
Asse
ssm
en
t2
,51
7
2,3
63
2
,36
3
2,1
54
2
,22
6
2,2
95
2
,35
2
2,4
10
Allo
ca
tio
n C
red
it(8
50
)
(6
96
)
(6
96
)
(4
67
)
-
-
-
-
54
8,3
15
5
99
,57
4
59
9,5
74
5
14
,03
2
66
5,9
61
6
64
,50
6
67
9,5
57
6
71
,96
3
13
14
Park Department
2015-2016
Departmental Summary
D E P A R T M E N T A L D E S C R I P T I O N:
The Parks and Recreation Department’s vision is to provide a premier parks and recreation
system with well-maintained facilities, outstanding programs and a customer loyalty focus.
Funding for maintenance operations recreational programs comes from general tax revenues and
the Park Tax Fund. New projects construction/renovations are funded thru Park Tax Fund and
Edmonds Capital Improvement Project Fund (CIP). Community trails, increasing interactive
programming and development of community parks are our current focus.
1. Assure that the quality of parks and facilities meet the public’s expectations.
2. Provide for additional recreational opportunities with an emphasis on outdoor and non-
traditional athletic programs.
3. Increase entertainment offered at Hafer Park and Mitch Park Amphitheater stages.
4. Use effective and efficient marketing methods to ensure that the public is well-informed
of our offerings.
5. Explore partnerships in recreational programs.
S T A F F I N G (FT-PT-S)
Current Level Year 1 Year 2 Year 3 Year 4 Year 5 20.5*-7-127 20.5*-7-127 20.5*-7-127 20.5*-7-127 20.5*-7-127 20.5*-7-127
*Staffing level includes Park Admin-Park Maintenance-Cemetery-Recreation-Pelican Bay-Parks Tax (Mitch Park Maintenance crew). The MAC building custodian is counted as .5 FT in Parks and .5FT in Senior Center.
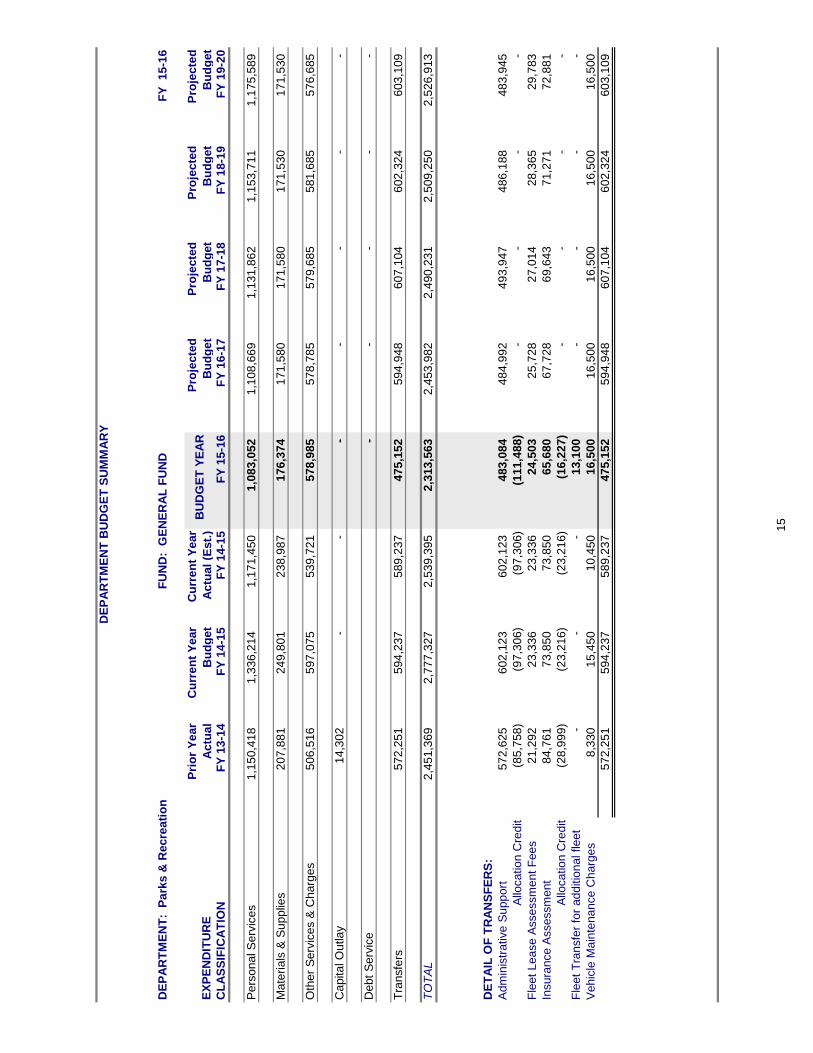
DE
PA
RT
ME
NT
BU
DG
ET
SU
MM
AR
Y
DE
PA
RT
ME
NT
: P
ark
s &
Rec
rea
tio
n
FU
ND
: G
EN
ER
AL
FU
ND
FY
1
5-1
6
EX
PE
ND
ITU
RE
Pri
or
Ye
ar
Ac
tua
l
Cu
rre
nt
Ye
ar
Bu
dg
et
Cu
rre
nt
Ye
ar
Ac
tua
l (E
st.
)B
UD
GE
T Y
EA
RP
roje
cte
d
Bu
dg
et
Pro
jecte
d
Bu
dg
et
Pro
jecte
d
Bu
dg
et
Pro
jecte
d
Bu
dg
et
CL
AS
SIF
ICA
TIO
NF
Y 1
3-1
4F
Y 1
4-1
5F
Y 1
4-1
5F
Y 1
5-1
6F
Y 1
6-1
7F
Y 1
7-1
8F
Y 1
8-1
9F
Y 1
9-2
0
Pe
rso
na
l S
erv
ices
1,1
50
,418
1
,336
,214
1
,171
,450
1
,083
,052
1
,108
,669
1
,131
,862
1
,153
,711
1
,175
,589
Ma
terials
& S
upp
lies
207
,881
2
49
,801
2
38
,987
1
76
,374
1
71
,580
1
71
,580
1
71
,530
1
71
,530
Oth
er
Se
rvic
es &
Ch
arg
es
506
,516
5
97
,075
5
39
,721
5
78
,985
5
78
,785
5
79
,685
5
81
,685
5
76
,685
Ca
pita
l O
utla
y1
4,3
02
-
-
-
-
-
-
-
De
bt
Se
rvic
e-
-
-
-
-
Tra
nsfe
rs5
72
,251
5
94
,237
5
89
,237
4
75
,152
5
94
,948
6
07
,104
6
02
,324
6
03
,109
TO
TA
L2
,451
,369
2
,777
,327
2
,539
,395
2
,313
,563
2
,453
,982
2
,490
,231
2
,509
,250
2
,526
,913
DE
TA
IL O
F T
RA
NS
FE
RS
:
Ad
min
istr
ative
Su
pp
ort
572
,625
6
02
,123
6
02
,123
4
83
,084
4
84
,992
4
93
,947
4
86
,188
4
83
,945
Allo
catio
n C
redit
(85,7
58
)
(97,3
06
)
(97,3
06
)
(111
,488
)
-
-
-
-
Fle
et
Lea
se A
sse
ssm
ent
Fee
s2
1,2
92
23,3
36
23,3
36
24,5
03
25,7
28
27,0
14
28,3
65
29,7
83
Insura
nce
Asse
ssm
ent
84,7
61
73,8
50
73,8
50
65,6
80
67,7
28
69,6
43
71,2
71
72,8
81
Allo
catio
n C
redit
(28,9
99
)
(23,2
16
)
(23,2
16
)
(16,2
27
)
-
-
-
-
Fle
et
Tra
nsfe
r fo
r a
dd
itio
na
l fle
et
-
-
-
1
3,1
00
-
-
-
-
Ve
hic
le M
ain
tena
nce
Ch
arg
es
8,3
30
1
5,4
50
10,4
50
16,5
00
16,5
00
16,5
00
16,5
00
16,5
00
572
,251
5
94
,237
5
89
,237
4
75
,152
5
94
,948
6
07
,104
6
02
,324
6
03
,109
15
16
Street Maintenance & Construction
2015-2016
Departmental Summary
D E P A R T M E N T A L D E S C R I P T I O N
This department included all maintenance activities with Street Maintenance until the creation of the Field Services operation which started in FY 06-07 Budget. The remaining funds involve the expenditures of resources which are dedicated through the gasoline tax from the state. These will be used for major maintenance projects. Unused gasoline tax funds remain in the General Fund as “Other Restricted Purposes”.
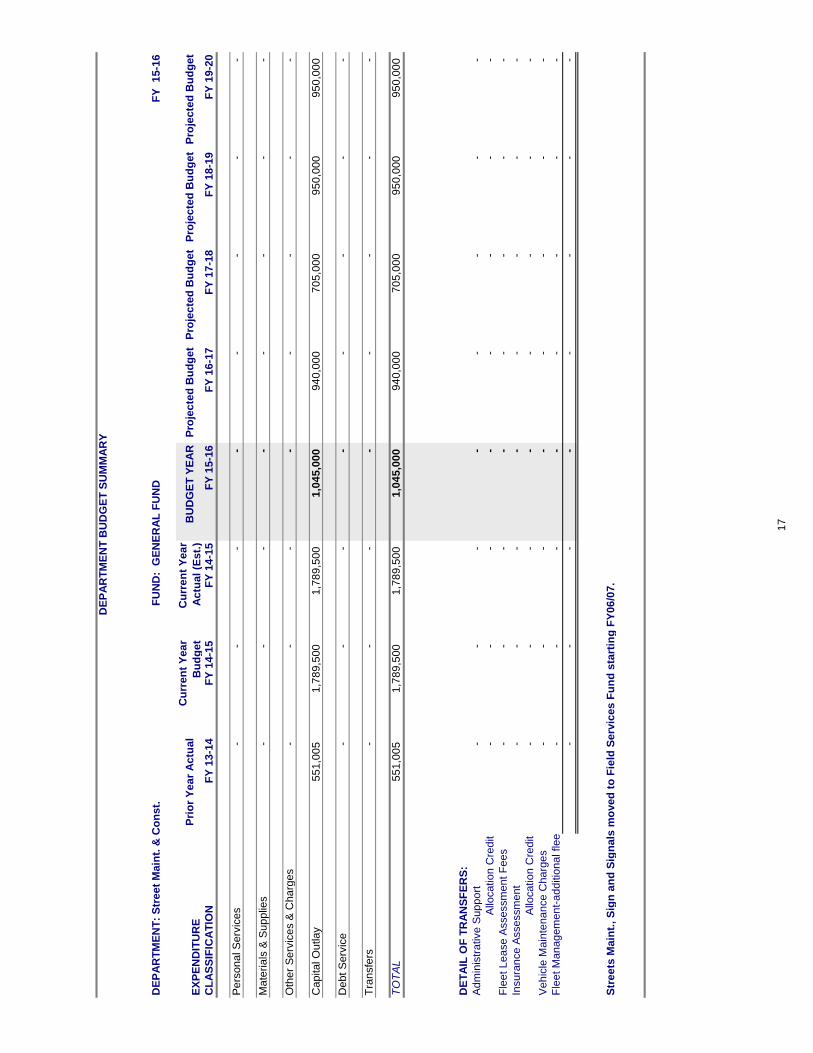
DE
PA
RT
ME
NT
BU
DG
ET
SU
MM
AR
Y
DE
PA
RT
ME
NT
: S
tree
t M
ain
t. &
Co
nst.
F
UN
D:
GE
NE
RA
L F
UN
DF
Y 1
5-1
6
EX
PE
ND
ITU
RE
Pri
or
Yea
r A
ctu
al
Cu
rren
t Y
ea
r
Bu
dg
et
Cu
rren
t Y
ea
r
Actu
al
(Est.
)B
UD
GE
T Y
EA
RP
roje
cte
d B
ud
get
Pro
jec
ted
Bu
dg
et
Pro
jec
ted
Bu
dg
et
Pro
jec
ted
Bu
dg
et
CL
AS
SIF
ICA
TIO
NF
Y 1
3-1
4F
Y 1
4-1
5F
Y 1
4-1
5F
Y 1
5-1
6F
Y 1
6-1
7F
Y 1
7-1
8F
Y 1
8-1
9F
Y 1
9-2
0
Pers
on
al S
erv
ices
-
-
-
-
-
-
-
-
Mate
rials
& S
up
plie
s-
-
-
-
-
-
-
-
Oth
er
Serv
ices &
Cha
rge
s-
-
-
-
-
-
-
-
Cap
ital O
utlay
55
1,0
05
1,7
89,5
00
1,7
89,5
00
1,0
45,0
00
94
0,0
00
70
5,0
00
95
0,0
00
95
0,0
00
Deb
t S
erv
ice
-
-
-
-
-
-
-
-
Tra
nsfe
rs-
-
-
-
-
-
-
-
TO
TA
L55
1,0
05
1,7
89,5
00
1,7
89,5
00
1,0
45,0
00
94
0,0
00
70
5,0
00
95
0,0
00
95
0,0
00
DE
TA
IL O
F T
RA
NS
FE
RS
:
Adm
inis
trative S
up
po
rt-
-
-
-
-
-
-
-
Allo
cation
Cre
dit
-
-
-
-
-
-
-
-
Fle
et L
ea
se A
ssessm
en
t F
ee
s-
-
-
-
-
-
-
-
Insura
nce A
ssessm
en
t-
-
-
-
-
-
-
-
Allo
cation
Cre
dit
-
-
-
-
-
-
-
-
Veh
icle
Main
tena
nce
Cha
rge
s-
-
-
-
-
-
-
-
Fle
et M
an
ag
em
en
t-ad
ditio
na
l flee
t-
-
-
-
-
-
-
-
-
-
-
-
-
-
-
-
Str
ee
ts M
ain
t.,
Sig
n a
nd
Sig
nals
mo
ved
to
Fie
ld S
erv
ices
Fu
nd
sta
rtin
g F
Y06
/07.
17
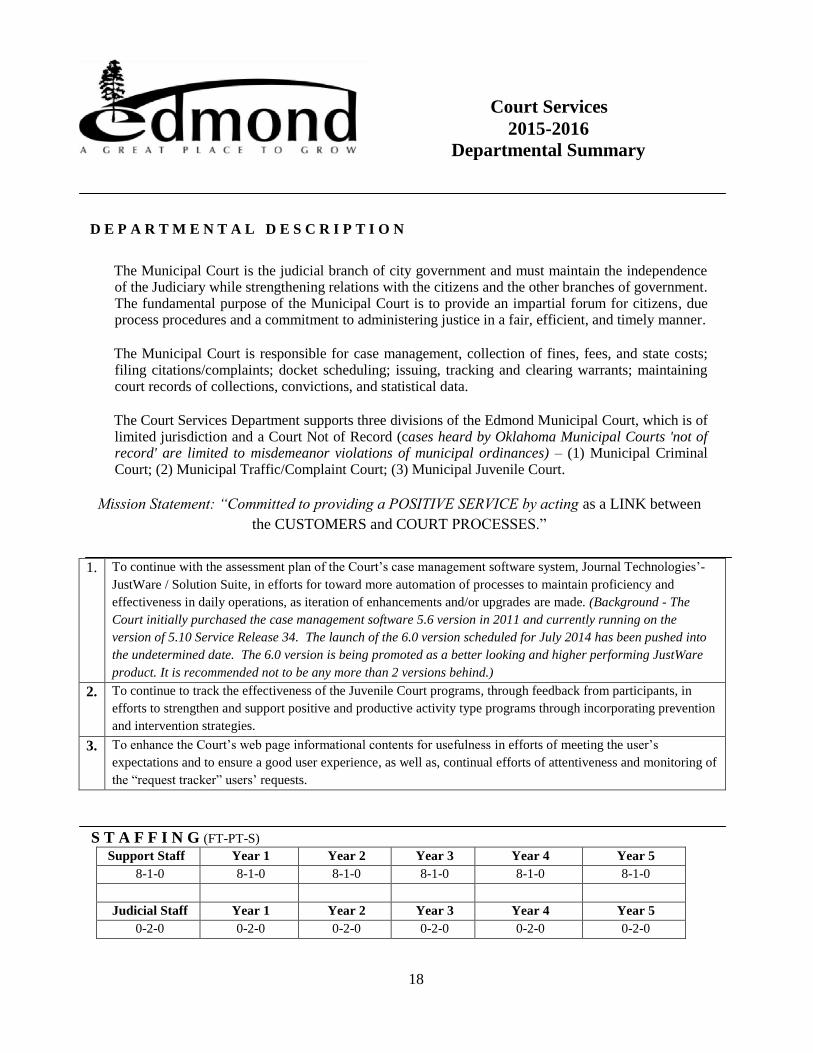
18
Court Services
2015-2016
Departmental Summary
D E P A R T M E N T A L D E S C R I P T I O N
The Municipal Court is the judicial branch of city government and must maintain the independence of the Judiciary while strengthening relations with the citizens and the other branches of government. The fundamental purpose of the Municipal Court is to provide an impartial forum for citizens, due process procedures and a commitment to administering justice in a fair, efficient, and timely manner.
The Municipal Court is responsible for case management, collection of fines, fees, and state costs; filing citations/complaints; docket scheduling; issuing, tracking and clearing warrants; maintaining court records of collections, convictions, and statistical data.
The Court Services Department supports three divisions of the Edmond Municipal Court, which is of limited jurisdiction and a Court Not of Record (cases heard by Oklahoma Municipal Courts 'not of record' are limited to misdemeanor violations of municipal ordinances) – (1) Municipal Criminal Court; (2) Municipal Traffic/Complaint Court; (3) Municipal Juvenile Court.
Mission Statement: “Committed to providing a POSITIVE SERVICE by acting as a LINK between
the CUSTOMERS and COURT PROCESSES.”
1. To continue with the assessment plan of the Court’s case management software system, Journal Technologies’-
JustWare / Solution Suite, in efforts for toward more automation of processes to maintain proficiency and
effectiveness in daily operations, as iteration of enhancements and/or upgrades are made. (Background - The
Court initially purchased the case management software 5.6 version in 2011 and currently running on the
version of 5.10 Service Release 34. The launch of the 6.0 version scheduled for July 2014 has been pushed into
the undetermined date. The 6.0 version is being promoted as a better looking and higher performing JustWare
product. It is recommended not to be any more than 2 versions behind.)
2. To continue to track the effectiveness of the Juvenile Court programs, through feedback from participants, in
efforts to strengthen and support positive and productive activity type programs through incorporating prevention
and intervention strategies.
3. To enhance the Court’s web page informational contents for usefulness in efforts of meeting the user’s
expectations and to ensure a good user experience, as well as, continual efforts of attentiveness and monitoring of
the “request tracker” users’ requests.
S T A F F I N G (FT-PT-S) Support Staff Year 1 Year 2 Year 3 Year 4 Year 5
8-1-0 8-1-0 8-1-0 8-1-0 8-1-0 8-1-0
Judicial Staff Year 1 Year 2 Year 3 Year 4 Year 5
0-2-0 0-2-0 0-2-0 0-2-0 0-2-0 0-2-0
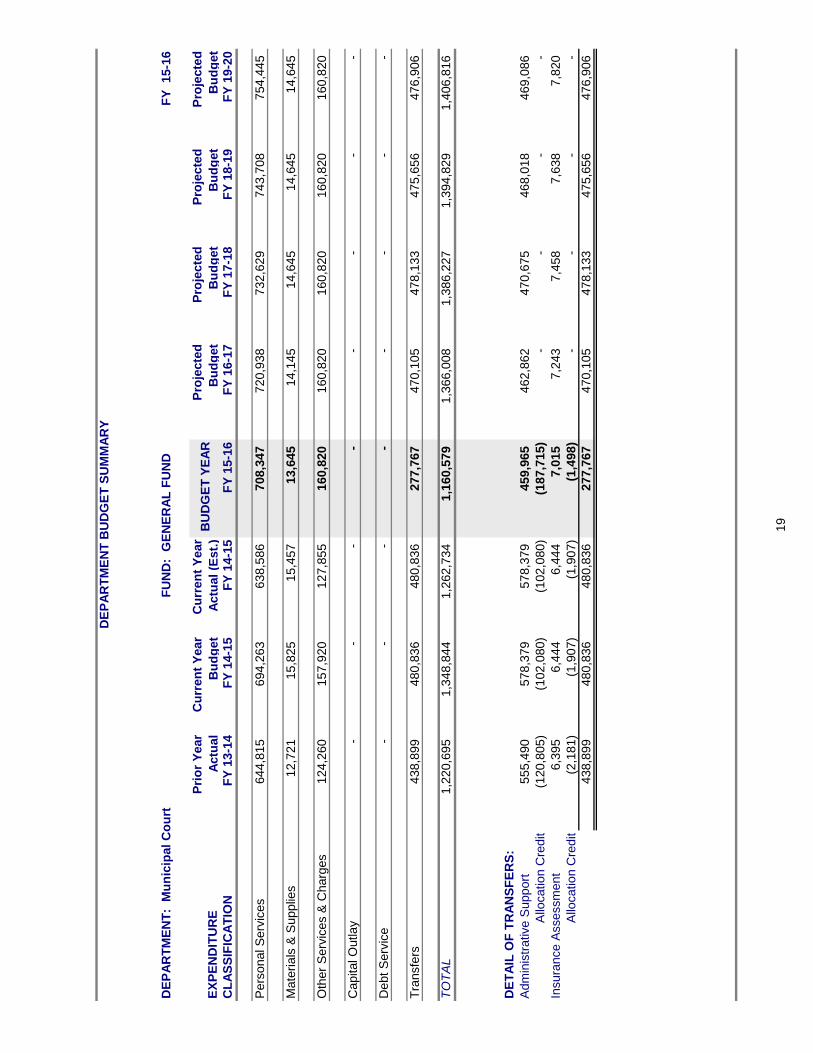
DE
PA
RT
ME
NT
BU
DG
ET
SU
MM
AR
Y
DE
PA
RT
ME
NT
: M
un
icip
al
Co
urt
F
UN
D:
GE
NE
RA
L F
UN
DF
Y
15-1
6
EX
PE
ND
ITU
RE
Pri
or
Year
Actu
al
Cu
rren
t Y
ear
Bu
dg
et
Cu
rren
t Y
ear
Actu
al
(Est.
)B
UD
GE
T Y
EA
RP
roje
cte
d
Bu
dg
et
Pro
jecte
d
Bu
dg
et
Pro
jecte
d
Bu
dg
et
Pro
jecte
d
Bu
dg
et
CL
AS
SIF
ICA
TIO
NF
Y 1
3-1
4F
Y 1
4-1
5F
Y 1
4-1
5F
Y 1
5-1
6F
Y 1
6-1
7F
Y 1
7-1
8F
Y 1
8-1
9F
Y 1
9-2
0
Pers
onal S
erv
ices
644,8
15
694,2
63
638,5
86
708,3
47
720,9
38
732,6
29
743,7
08
754,4
45
Mate
rials
& S
upplie
s12,7
21
15,8
25
15,4
57
13,6
45
14,1
45
14,6
45
14,6
45
14,6
45
Oth
er
Serv
ices &
Charg
es
124,2
60
157,9
20
127,8
55
160,8
20
160,8
20
160,8
20
160,8
20
160,8
20
Capital O
utlay
-
-
-
-
-
-
-
-
Debt
Serv
ice
-
-
-
-
-
-
-
-
Tra
nsfe
rs438,8
99
480,8
36
480,8
36
277,7
67
470,1
05
478,1
33
475,6
56
476,9
06
TO
TA
L1,2
20,6
95
1,3
48,8
44
1,2
62,7
34
1,1
60,5
79
1,3
66,0
08
1,3
86,2
27
1,3
94,8
29
1,4
06,8
16
DE
TA
IL O
F T
RA
NS
FE
RS
:
Adm
inis
trative S
upport
555,4
90
578,3
79
578,3
79
459,9
65
462,8
62
470,6
75
468,0
18
469,0
86
Allo
cation C
redit
(120,8
05)
(102,0
80)
(102,0
80)
(187,7
15)
-
-
-
-
Insura
nce A
ssessm
ent
6,3
95
6,4
44
6,4
44
7,0
15
7,2
43
7,4
58
7,6
38
7,8
20
Allo
cation C
redit
(2,1
81)
(1,9
07)
(1,9
07)
(1,4
98)
-
-
-
-
438,8
99
480,8
36
480,8
36
277,7
67
470,1
05
478,1
33
475,6
56
476,9
06
19
20
Senior Citizens Center
2015-2016
Departmental Summary
D E P A R T M E N T A L D E S C R I P T I O N
The mission of the Edmond Senior Center is:
“To improve the quality of life for senior adults in the Edmond community by providing comprehensive programming including recreational, nutritional, social, educational and
referral.”
Our continuing focus will be to strive for the highest quality leisure programs and activities
for senior adults 55 years old and better, through diligent attention to our customers' needs,
interests and concerns.
1. Generate quality leisure programs to attract older adults.
2. Promote public awareness of center activities to attract community resources & support.
3. Promote wellness awareness through exercise, diet, and education.
4. Promote safety awareness through educational programs.
S T A F F I N G (FT-PT-S)
Current Level Year 1 Year 2 Year 3 Year 4 Year 5 4.5 - 1 – 0 4.5 -1 – 0 4.5 - 1 – 0 4.5 - 1 – 0 4.5 - 1 – 0 4.5 - 1 – 0
*.5 FT custodian split between Senior Center budget and Parks & Recreation budget.
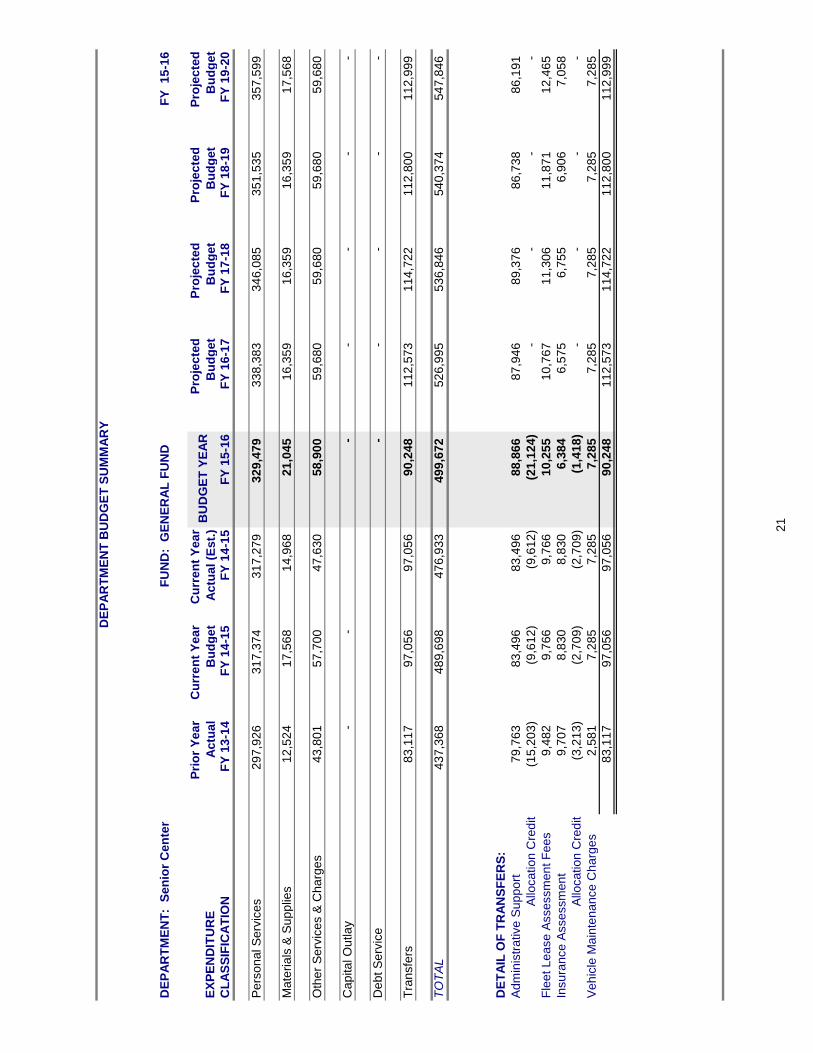
DE
PA
RT
ME
NT
BU
DG
ET
SU
MM
AR
Y
DE
PA
RT
ME
NT
: S
en
ior
Ce
nte
r F
UN
D:
GE
NE
RA
L F
UN
DF
Y 1
5-1
6
EX
PE
ND
ITU
RE
Pri
or
Ye
ar
Ac
tua
l
Cu
rre
nt
Ye
ar
Bu
dg
et
Cu
rre
nt
Ye
ar
Ac
tua
l (E
st.
)B
UD
GE
T Y
EA
RP
roje
cte
d
Bu
dg
et
Pro
jec
ted
Bu
dg
et
Pro
jec
ted
Bu
dg
et
Pro
jec
ted
Bu
dg
et
CL
AS
SIF
ICA
TIO
NF
Y 1
3-1
4F
Y 1
4-1
5F
Y 1
4-1
5F
Y 1
5-1
6F
Y 1
6-1
7F
Y 1
7-1
8F
Y 1
8-1
9F
Y 1
9-2
0
Pe
rso
na
l S
erv
ice
s2
97
,92
6
31
7,3
74
31
7,2
79
32
9,4
79
33
8,3
83
34
6,0
85
35
1,5
35
35
7,5
99
Ma
teri
als
& S
up
plie
s1
2,5
24
17
,56
8
14
,96
8
21
,04
5
16
,35
9
16
,35
9
16
,35
9
17
,56
8
Oth
er
Se
rvic
es &
Ch
arg
es
43
,80
1
57
,70
0
47
,63
0
58
,90
0
59
,68
0
59
,68
0
59
,68
0
59
,68
0
Ca
pita
l O
utla
y-
-
-
-
-
-
-
De
bt S
erv
ice
-
-
-
-
-
Tra
nsfe
rs8
3,1
17
97
,05
6
97
,05
6
90
,24
8
11
2,5
73
11
4,7
22
11
2,8
00
11
2,9
99
TO
TA
L4
37
,36
8
48
9,6
98
47
6,9
33
49
9,6
72
52
6,9
95
53
6,8
46
54
0,3
74
54
7,8
46
DE
TA
IL O
F T
RA
NS
FE
RS
:
Ad
min
istr
ative
Su
pp
ort
79
,76
3
83
,49
6
83
,49
6
88
,86
6
87
,94
6
89
,37
6
86
,73
8
86
,19
1
Allo
ca
tio
n C
red
it(1
5,2
03
)
(9,6
12
)
(9,6
12
)
(21
,12
4)
-
-
-
-
Fle
et L
ea
se
Asse
ssm
en
t F
ee
s9
,48
2
9,7
66
9,7
66
10
,25
5
10
,76
7
11
,30
6
11
,87
1
12
,46
5
Insu
ran
ce
Asse
ssm
en
t9
,70
7
8,8
30
8,8
30
6,3
84
6,5
75
6,7
55
6,9
06
7,0
58
Allo
ca
tio
n C
red
it(3
,21
3)
(2,7
09
)
(2,7
09
)
(1,4
18
)
-
-
-
-
Ve
hic
le M
ain
ten
an
ce
Ch
arg
es
2,5
81
7,2
85
7,2
85
7,2
85
7,2
85
7,2
85
7,2
85
7,2
85
83
,11
7
97
,05
6
97
,05
6
90
,24
8
11
2,5
73
11
4,7
22
11
2,8
00
11
2,9
99
21
22
Community Agency Review Commission
2015-2016
Departmental Summary
D E P A R T M E N T A L D E S C R I P T I O N
The Community Agency Review Commission performs an annual review of local community
agencies to determine eligibility and necessity for funding. After the annual review the
Commission issues a formal recommendation to the Edmond City Council, for funding of the
agencies. A community agency is directly engaged in charitable, educational, health, social
services, community enrichment or related activities, which provide a direct and distinct benefit to
the City of Edmond and its residents. The community agency primarily serves those residing in
the City of Edmond.
1. Provide oversight of the supplemental funding request process pertaining to agencies requesting funding
within the City of Edmond that serve a charitable, education, health, or social service that meet the
requirements set forth in the criteria and receive approval from the City Council.
2. Oversee contracts between the City of Edmond and the funded agencies, reviewing progress there under,
determining accountability, and forwarding the Community Agency Review Commission
recommendations to Council no later than forty-five days prior to the date of the formal adoption of the
City Budget, as to agencies monetary requests, program formats and related matters.
C R I T E R I A F O R F U N D I N G
1. Applying organizations shall conduct a recognized program of contracted service in or for the community,
and must show evidence to the City of Edmond that it is effectively meeting a social need, and providing a
direct and distinct benefit to the City of Edmond and its residents.
2. Applying organizations shall have a plan of organization which gives evidence of a properly chosen Board
of Directors which meets at least quarterly, and which in actual fact assumes responsibility to the public
for efficient management of the agency it represents.
3. Applying organizations must provide the City of Edmond with annual financial statements and annual
statistical reports of services rendered. Agency shall have its finances audited annual by an auditing
concern acceptable to the City of Edmond.
4. Applying organizations must provide to the City of Edmond a statement of budgetary needs and provide
any other operational information upon request by the City of Edmond.
5. Applying organizations must complete and submit for approval the contract services application form.
Submission of an application does not assure the social agency of financial assistance from the City of
Edmond.
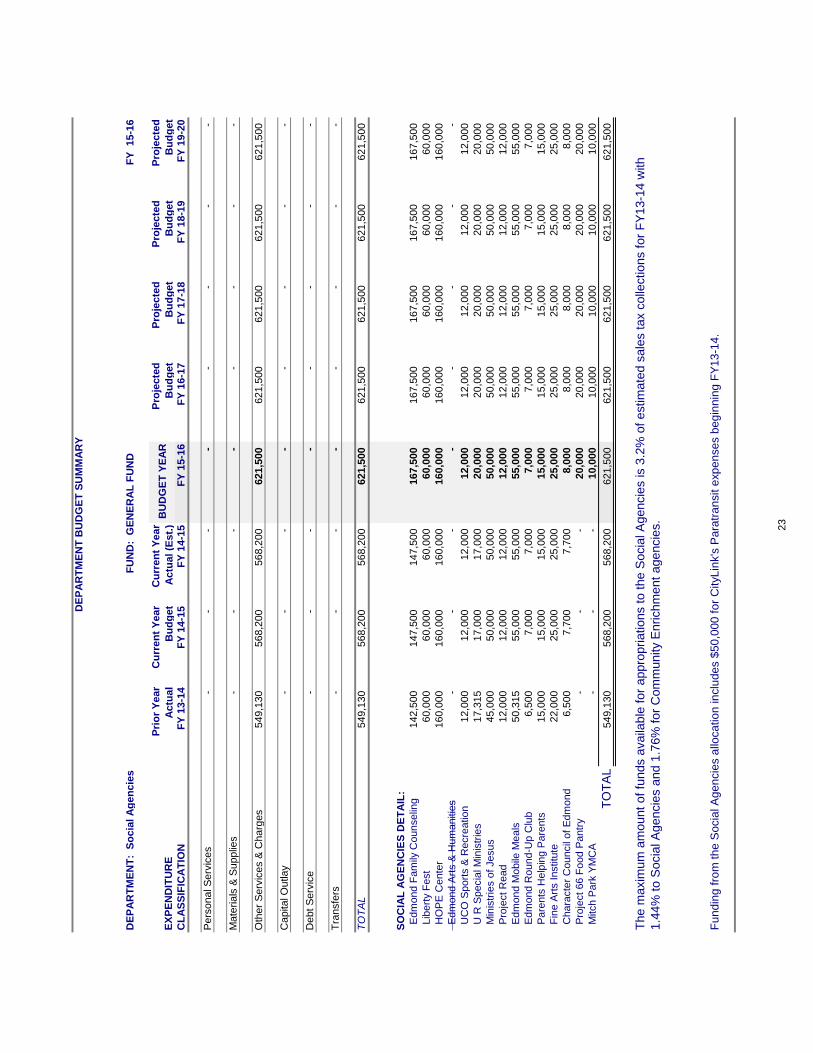
DE
PA
RT
ME
NT
BU
DG
ET
SU
MM
AR
Y
DE
PA
RT
ME
NT
: S
ocia
l A
gen
cie
s F
UN
D:
GE
NE
RA
L F
UN
DF
Y 15-1
6
EX
PE
ND
ITU
RE
Pri
or
Year
Actu
al
Cu
rren
t Y
ear
Bu
dg
et
Cu
rren
t Y
ear
Actu
al (E
st.
)B
UD
GE
T Y
EA
RP
roje
cte
d
Bu
dg
et
Pro
jecte
d
Bu
dg
et
Pro
jecte
d
Bu
dg
et
Pro
jecte
d
Bu
dg
et
CL
AS
SIF
ICA
TIO
NF
Y 1
3-1
4F
Y 1
4-1
5F
Y 1
4-1
5F
Y 1
5-1
6F
Y 1
6-1
7F
Y 1
7-1
8F
Y 1
8-1
9F
Y 1
9-2
0
Pers
onal S
erv
ices
-
-
-
-
-
-
-
-
Mate
rials
& S
upplie
s-
-
-
-
-
-
-
-
Oth
er
Serv
ices &
Charg
es
549,1
30
568,2
00
568,2
00
621,5
00
621,5
00
621,5
00
621,5
00
621,5
00
Capital O
utlay
-
-
-
-
-
-
-
-
Debt S
erv
ice
-
-
-
-
-
-
-
-
Tra
nsfe
rs-
-
-
-
-
-
-
-
TO
TA
L549,1
30
568,2
00
568,2
00
621,5
00
621,5
00
621,5
00
621,5
00
621,5
00
SO
CIA
L A
GE
NC
IES
DE
TA
IL:
E
dm
ond F
am
ily C
ounselin
g142,5
00
147,5
00
147,5
00
167,5
00
167,5
00
167,5
00
167,5
00
167,5
00
Lib
ert
y F
est
60,0
00
60,0
00
60,0
00
60,0
00
60,0
00
60,0
00
60,0
00
60,0
00
H
OP
E C
ente
r160,0
00
160,0
00
160,0
00
160,0
00
160,0
00
160,0
00
160,0
00
160,0
00
E
dm
ond A
rts &
Hum
anitie
s-
-
-
-
-
-
-
-
U
CO
Sport
s &
Recre
ation
12,0
00
12,0
00
12,0
00
12,0
00
12,0
00
12,0
00
12,0
00
12,0
00
U
R S
pecia
l M
inis
trie
s17,3
15
17,0
00
17,0
00
20,0
00
20,0
00
20,0
00
20,0
00
20,0
00
M
inis
trie
s o
f Jesus
45,0
00
50,0
00
50,0
00
50,0
00
50,0
00
50,0
00
50,0
00
50,0
00
P
roje
ct R
ead
12,0
00
12,0
00
12,0
00
12,0
00
12,0
00
12,0
00
12,0
00
12,0
00
E
dm
ond M
obile
Meals
50,3
15
55,0
00
55,0
00
55,0
00
55,0
00
55,0
00
55,0
00
55,0
00
E
dm
ond R
ound-U
p C
lub
6,5
00
7,0
00
7,0
00
7,0
00
7,0
00
7,0
00
7,0
00
7,0
00
P
are
nts
Help
ing P
are
nts
15,0
00
15,0
00
15,0
00
15,0
00
15,0
00
15,0
00
15,0
00
15,0
00
F
ine A
rts Institu
te22,0
00
25,0
00
25,0
00
25,0
00
25,0
00
25,0
00
25,0
00
25,0
00
C
hara
cte
r C
ouncil
of E
dm
ond
6,5
00
7,7
00
7,7
00
8,0
00
8,0
00
8,0
00
8,0
00
8,0
00
P
roje
ct 66 F
ood P
antr
y-
-
-
20,0
00
20,0
00
20,0
00
20,0
00
20,0
00
M
itch P
ark
YM
CA
-
-
-
10,0
00
10,0
00
10,0
00
10,0
00
10,0
00
TO
TA
L549,1
30
568,2
00
568,2
00
621,5
00
621,5
00
621,5
00
621,5
00
621,5
00
Fu
nd
ing
fro
m t
he
Socia
l A
ge
ncie
s a
lloca
tio
n in
clu
de
s $
50
,00
0 f
or
CityL
ink's
Pa
ratr
an
sit e
xp
en
se
s b
eg
inn
ing F
Y1
3-1
4.
The m
axim
um
am
ount
of
funds a
vaila
ble
for
appro
priations t
o t
he S
ocia
l A
gencie
s is 3
.2%
of
estim
ate
d s
ale
s t
ax c
olle
ctions f
or
FY
13-1
4 w
ith
1.4
4%
to S
ocia
l A
gencie
s a
nd 1
.76%
for
Com
munity E
nrichm
ent
agencie
s.
23
24
Community Development &
Enrichment Agencies
2015-2016
Departmental Summary
D E P A R T M E N T A L D E S C R I P T I O N
The following department is the area for expensing contracts that are between the City and other agencies. Airport Services with the Edmond Guthrie Regional Airport, Land Conservancy activities with the Edmond Land Conservancy and support of historic preservation projects with the Edmond Historic Preservation Trust.
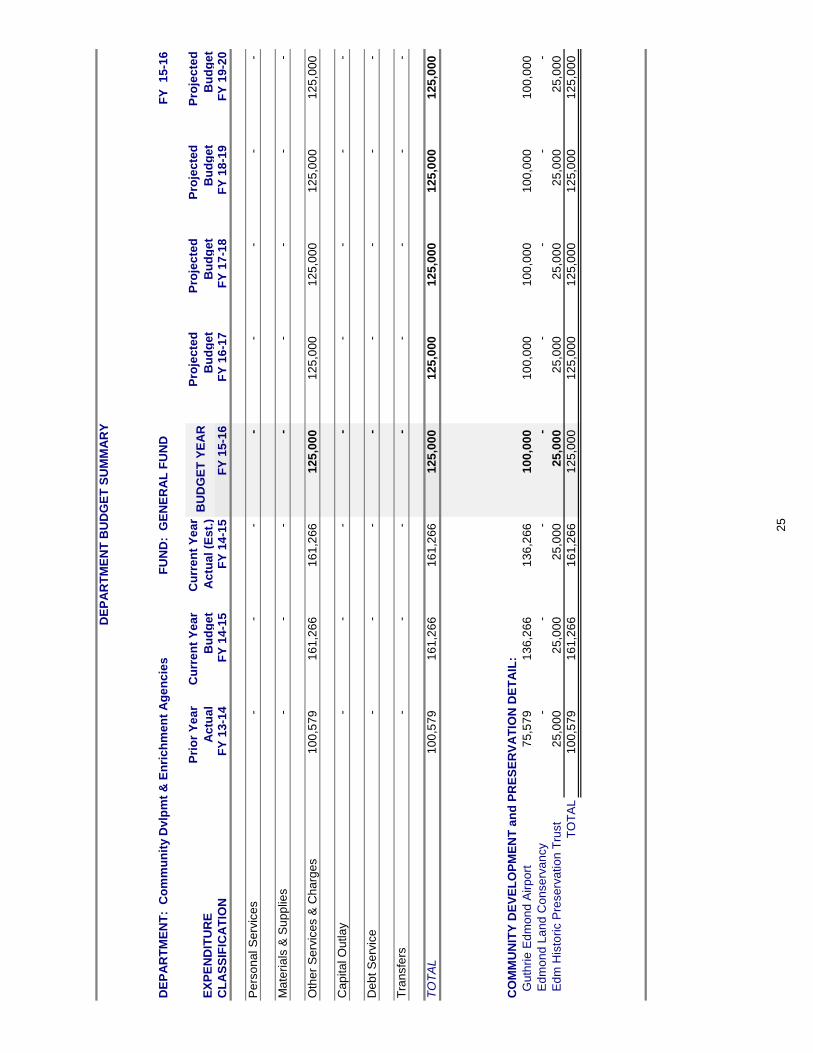
DE
PA
RT
ME
NT
BU
DG
ET
SU
MM
AR
Y
DE
PA
RT
ME
NT
: C
om
mu
nit
y D
vlp
mt
& E
nri
ch
me
nt
Ag
en
cie
s
FU
ND
: G
EN
ER
AL
FU
ND
FY
1
5-1
6
EX
PE
ND
ITU
RE
Pri
or
Ye
ar
Ac
tua
l
Cu
rre
nt
Ye
ar
Bu
dg
et
Cu
rre
nt
Ye
ar
Ac
tua
l (E
st.
)B
UD
GE
T Y
EA
RP
roje
cte
d
Bu
dg
et
Pro
jec
ted
Bu
dg
et
Pro
jec
ted
Bu
dg
et
Pro
jec
ted
Bu
dg
et
CL
AS
SIF
ICA
TIO
NF
Y 1
3-1
4F
Y 1
4-1
5F
Y 1
4-1
5F
Y 1
5-1
6F
Y 1
6-1
7F
Y 1
7-1
8F
Y 1
8-1
9F
Y 1
9-2
0
Pe
rso
na
l S
erv
ice
s-
-
-
-
-
-
-
-
Ma
teri
als
& S
up
plie
s-
-
-
-
-
-
-
-
Oth
er
Se
rvic
es &
Cha
rge
s1
00
,57
9
1
61
,26
6
1
61
,26
6
1
25
,00
0
1
25
,00
0
1
25
,00
0
1
25
,00
0
1
25
,00
0
Cap
ita
l O
utla
y-
-
-
-
-
-
-
-
Deb
t S
erv
ice
-
-
-
-
-
-
-
-
Tra
nsfe
rs-
-
-
-
-
-
-
-
TO
TA
L1
00
,57
9
1
61
,26
6
1
61
,26
6
1
25
,00
0
1
25
,00
0
1
25
,00
0
1
25
,00
0
1
25
,00
0
CO
MM
UN
ITY
DE
VE
LO
PM
EN
T a
nd
PR
ES
ER
VA
TIO
N D
ET
AIL
:
G
uth
rie
Ed
mo
nd
Air
po
rt7
5,5
79
1
36
,26
6
1
36
,26
6
1
00
,00
0
1
00
,00
0
1
00
,00
0
1
00
,00
0
1
00
,00
0
E
dm
on
d L
an
d C
on
se
rva
ncy
-
-
-
-
-
-
-
-
E
dm
His
tori
c P
rese
rva
tio
n T
rust
25
,00
0
25
,00
0
25
,00
0
25
,00
0
25
,00
0
25
,00
0
25
,00
0
25
,00
0
TO
TA
L1
00
,57
9
1
61
,26
6
1
61
,26
6
1
25
,00
0
1
25
,00
0
1
25
,00
0
1
25
,00
0
1
25
,00
0
25

26
Emergency Management
2015-2016
Departmental Summary
D E P A R T M E N T A L D E S C R I P T I O N
Committed to protecting our citizens from the effects of disasters through mitigation,
preparedness and response and recovery actions.
G O A L S
1. Increase training levels for Emergency Management staff personnel.
2. Ensure the City of Edmond Emergency Operation Plan (EOP) is current and
accurate. (2nd quarter)
3. Continue to expand and enhance the Public Education Program, with special
emphasis on the Community Emergency Response Teams (CERT).
4. Upgrade the existing Outdoor Warning Device (OWD) system and expand the system
to fill in remaining gaps.
5. Expand the NOAA Programmable “All Hazards” Alert Radio Program
6. Maintain a viable and supportable Emergency Operation Center (EOC).
7. Successfully move EOC and Administrative functions to the new Public Safety
Center
S T A F F I N G (FT-PT-S)
Current Level Year 1 Year 2 Year 3 Year 4 Year 5 2.2-0-0 2.2-0-0 2.2-0-0 2.2-0-0 2.2-0-0 2.2-0-0
*.2 Split with Public Safety Communications
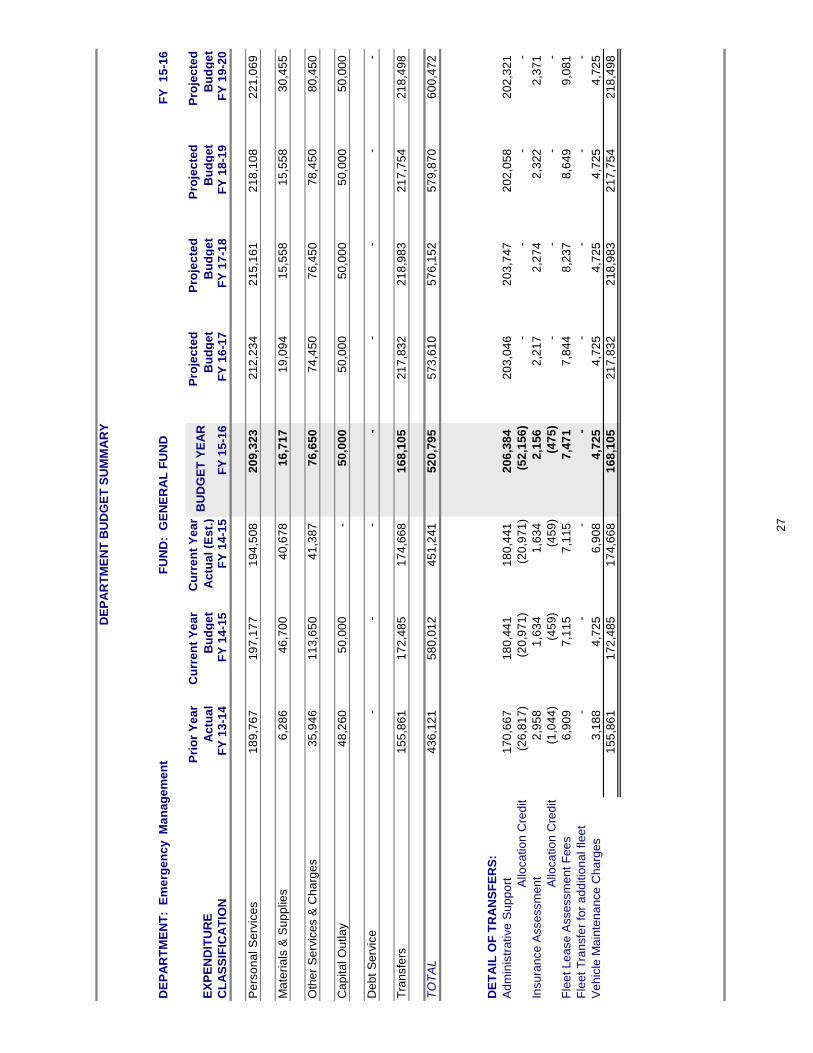
DE
PA
RT
ME
NT
BU
DG
ET
SU
MM
AR
Y
DE
PA
RT
ME
NT
: E
me
rge
nc
y
Ma
na
ge
me
nt
F
UN
D:
GE
NE
RA
L F
UN
DF
Y
15
-16
EX
PE
ND
ITU
RE
Pri
or
Ye
ar
Ac
tua
l
Cu
rre
nt
Ye
ar
Bu
dg
et
Cu
rre
nt
Ye
ar
Ac
tua
l (E
st.
)B
UD
GE
T Y
EA
RP
roje
cte
d
Bu
dg
et
Pro
jec
ted
Bu
dg
et
Pro
jec
ted
Bu
dg
et
Pro
jec
ted
Bu
dg
et
CL
AS
SIF
ICA
TIO
NF
Y 1
3-1
4F
Y 1
4-1
5F
Y 1
4-1
5F
Y 1
5-1
6F
Y 1
6-1
7F
Y 1
7-1
8F
Y 1
8-1
9F
Y 1
9-2
0
Pe
rso
na
l S
erv
ice
s1
89
,76
7
1
97
,17
7
1
94
,50
8
2
09
,32
3
2
12
,23
4
2
15
,16
1
2
18
,10
8
2
21
,06
9
Ma
teri
als
& S
up
plie
s6
,28
6
4
6,7
00
4
0,6
78
1
6,7
17
1
9,0
94
1
5,5
58
1
5,5
58
3
0,4
55
Oth
er
Se
rvic
es &
Cha
rge
s3
5,9
46
1
13
,65
0
4
1,3
87
7
6,6
50
7
4,4
50
7
6,4
50
7
8,4
50
8
0,4
50
Cap
ita
l O
utla
y4
8,2
60
5
0,0
00
-
50
,00
0
50
,00
0
50
,00
0
50
,00
0
50
,00
0
Deb
t S
erv
ice
-
-
-
-
-
-
-
-
Tra
nsfe
rs1
55
,86
1
1
72
,48
5
1
74
,66
8
1
68
,10
5
2
17
,83
2
2
18
,98
3
2
17
,75
4
2
18
,49
8
TO
TA
L4
36
,12
1
5
80
,01
2
4
51
,24
1
5
20
,79
5
5
73
,61
0
5
76
,15
2
5
79
,87
0
6
00
,47
2
DE
TA
IL O
F T
RA
NS
FE
RS
:
Ad
min
istr
ative
Su
pp
ort
17
0,6
67
18
0,4
41
18
0,4
41
20
6,3
84
20
3,0
46
20
3,7
47
20
2,0
58
20
2,3
21
Allo
ca
tio
n C
red
it(2
6,8
17
)
(20
,97
1)
(2
0,9
71
)
(52
,15
6)
-
-
-
-
Insu
ran
ce
Asse
ssm
en
t2
,95
8
1
,63
4
1
,63
4
2
,15
6
2
,21
7
2
,27
4
2
,32
2
2
,37
1
Allo
ca
tio
n C
red
it(1
,04
4)
(45
9)
(4
59
)
(47
5)
-
-
-
-
Fle
et
Le
ase
Asse
ssm
en
t F
ee
s6
,90
9
7
,11
5
7
,11
5
7
,47
1
7
,84
4
8
,23
7
8
,64
9
9
,08
1
Fle
et
Tra
nsfe
r fo
r a
dd
itio
na
l fle
et
-
-
-
-
-
-
-
-
Ve
hic
le M
ain
ten
an
ce
Ch
arg
es
3,1
88
4,7
25
6,9
08
4,7
25
4,7
25
4,7
25
4,7
25
4,7
25
15
5,8
61
17
2,4
85
17
4,6
68
16
8,1
05
21
7,8
32
21
8,9
83
21
7,7
54
21
8,4
98
27

28
Cemetery
2015-2016
Departmental Summary
D E P A R T M E N T A L D E S C R I P T I O N
The Cemetery’s mission is to serve the Public with their interment needs and provide landscape maintenance for 50 acres of Cemetery grounds. The Cemetery averages 130 interments per year, sets approximately 70 monuments/footings and sells an average of 120 burial spaces per year. Estimate of availability of burial spaces is 15 years.
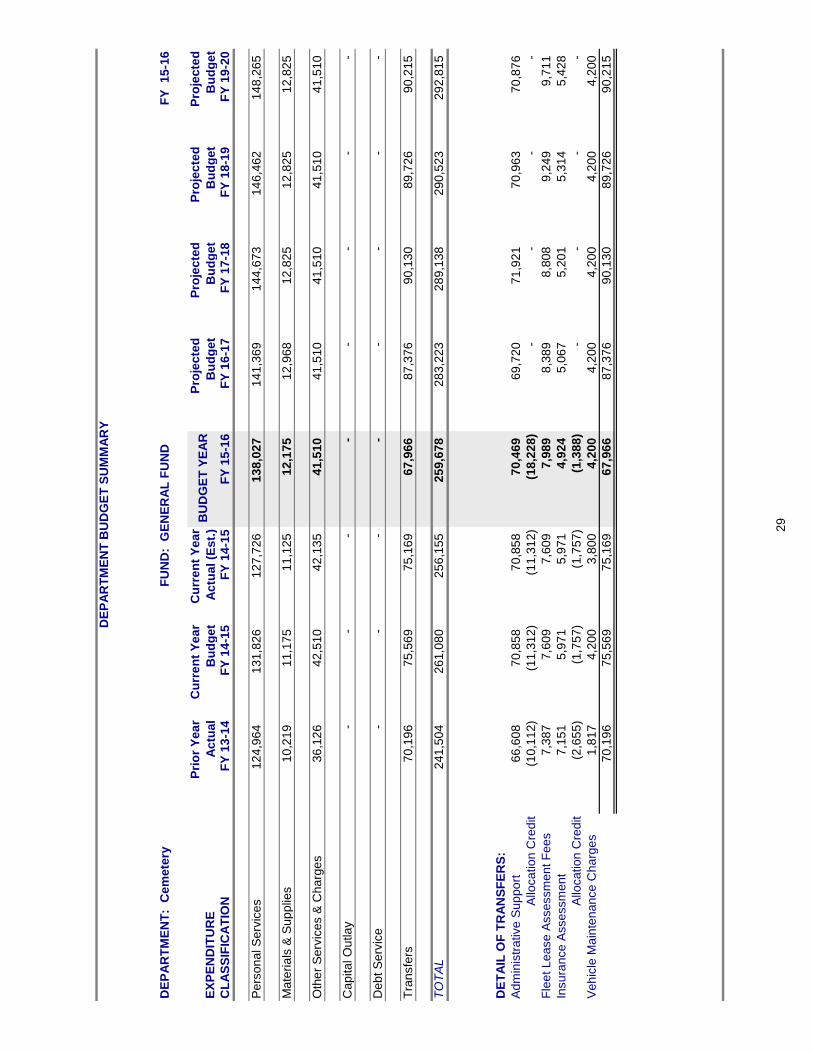
DE
PA
RT
ME
NT
BU
DG
ET
SU
MM
AR
Y
DE
PA
RT
ME
NT
: C
em
ete
ry F
UN
D:
GE
NE
RA
L F
UN
DF
Y 1
5-1
6
EX
PE
ND
ITU
RE
Pri
or
Ye
ar
Ac
tua
l
Cu
rre
nt
Ye
ar
Bu
dg
et
Cu
rre
nt
Ye
ar
Ac
tua
l (E
st.
)B
UD
GE
T Y
EA
RP
roje
cte
d
Bu
dg
et
Pro
jec
ted
Bu
dg
et
Pro
jec
ted
Bu
dg
et
Pro
jec
ted
Bu
dg
et
CL
AS
SIF
ICA
TIO
NF
Y 1
3-1
4F
Y 1
4-1
5F
Y 1
4-1
5F
Y 1
5-1
6F
Y 1
6-1
7F
Y 1
7-1
8F
Y 1
8-1
9F
Y 1
9-2
0
Pe
rso
na
l S
erv
ice
s1
24
,96
4
13
1,8
26
12
7,7
26
13
8,0
27
14
1,3
69
14
4,6
73
14
6,4
62
14
8,2
65
Ma
teri
als
& S
up
plie
s1
0,2
19
11
,17
5
11
,12
5
12
,17
5
12
,96
8
12
,82
5
12
,82
5
12
,82
5
Oth
er
Se
rvic
es &
Ch
arg
es
36
,12
6
42
,51
0
42
,13
5
41
,51
0
41
,51
0
41
,51
0
41
,51
0
41
,51
0
Ca
pita
l O
utla
y-
-
-
-
-
-
-
-
De
bt S
erv
ice
-
-
-
-
-
-
-
-
Tra
nsfe
rs7
0,1
96
75
,56
9
75
,16
9
67
,96
6
87
,37
6
90
,13
0
89
,72
6
90
,21
5
TO
TA
L2
41
,50
4
26
1,0
80
25
6,1
55
25
9,6
78
28
3,2
23
28
9,1
38
29
0,5
23
29
2,8
15
DE
TA
IL O
F T
RA
NS
FE
RS
:
Ad
min
istr
ative
Su
pp
ort
66
,60
8
70
,85
8
70
,85
8
70
,46
9
69
,72
0
71
,92
1
70
,96
3
70
,87
6
Allo
ca
tio
n C
red
it(1
0,1
12
)
(11
,31
2)
(11
,31
2)
(18
,22
8)
-
-
-
-
Fle
et L
ea
se
Asse
ssm
en
t F
ee
s7
,38
7
7,6
09
7,6
09
7,9
89
8,3
89
8,8
08
9,2
49
9,7
11
Insu
ran
ce
Asse
ssm
en
t7
,15
1
5,9
71
5,9
71
4,9
24
5,0
67
5,2
01
5,3
14
5,4
28
Allo
ca
tio
n C
red
it(2
,65
5)
(1,7
57
)
(1,7
57
)
(1,3
88
)
-
-
-
-
Ve
hic
le M
ain
ten
an
ce
Ch
arg
es
1,8
17
4,2
00
3,8
00
4,2
00
4,2
00
4,2
00
4,2
00
4,2
00
70
,19
6
75
,56
9
75
,16
9
67
,96
6
87
,37
6
90
,13
0
89
,72
6
90
,21
5
29
30
Community Image
2015-2016
Departmental Summary
D E P A R T M E N T A L D E S C R I P T I O N
The Community Image department is comprised of two divisions: Code Enforcement & Urban Forestry. Even though their daily duties differ significantly, their primary goal is to preserve and improve the overall appearance of our community.
Code Enforcement Division - OPERATIONAL DUTIES: Code Enforcement works to identify violations of City Ordinances and State Laws within the Edmond City Limits and seeks voluntary compliance from citizens through proactive enforcement. Once a code violation is identified the responsible party is notified to take corrective action. In addition to working Health, Safety and Welfare issues, Code Enforcement also issues Temporary Business Promotional Sign permits and patrols the business districts daily to insure all sign ordinances are being followed. All Code staff have been trained in emergency 1st responder’s positions with advanced First Aide, Search and Rescue, Search and Recovery and Damage Assessment. Another enterprise of Code Enforcement is the Edmond Neighborhood Initiative Program (ENIP). ENIP matches citizens with volunteer groups that assist in correcting any Code Enforcement issues that have been found. The Code Enforcement Division also monitors existing and new Oil and Gas wells, pipelines and pipeline crossings and the EPA Fats, Oils and Grease (FOG) program within the City limits. Annual inspections are made to insure Ordinances, State Laws and safety issues are adhered to and that illicit discharges into the sanitary sewer systems do not occur.
G O A L S
Code Enforcement
1. Develop programs that partner with community groups and citizens.
2. Implement Phase V of the Fats, Oil & Grease (FOG) program (Education for residential)
3. Review ordinances used by Code Enforcement to meet developing community issues
Urban Forestry
1. Recommend landscape code revisions and improve site plan process
2. Correct median landscapes where needed. Install trees/landscapes in unimproved medians.
3. Expand foster a tree program, complete canopy study project, expand arbor week events.
S T A F F I N G (FT-PT-S)
Code Enforcement Current Level Year 1 Year 2 Year 3 Year 4 Year 5
4.75-0-0 5.75-0-0 5.75-0-0 5.75-0-0 5.75-0-0 5.75-0-0 In the coming years, an additional staff position will need to be considered as inspection responsibilities grow with the additional programs (like the FOG Program) and community growth so the department can maintain a proactive approach of identifying problems.
Urban Forestry
Current Level Year 1 Year 2 Year 3 Year 4 Year 5
2.25-0-0 3.25-0-0 3.25-0-0 3.25-0-0 3.25-0-0 3.25-0-0 *Administrative Specialist II position is split .75 with Code and .25 with Urban Forestry
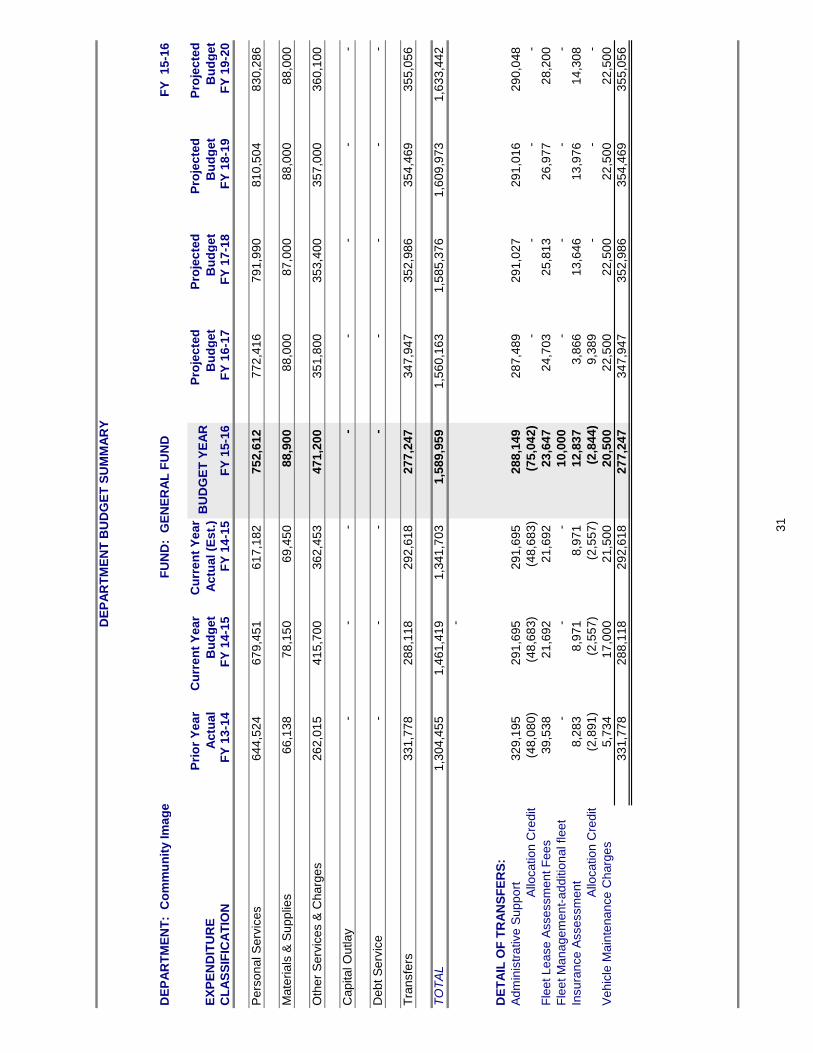
DE
PA
RT
ME
NT
BU
DG
ET
SU
MM
AR
Y
DE
PA
RT
ME
NT
: C
om
mu
nit
y Im
ag
e F
UN
D:
GE
NE
RA
L F
UN
DF
Y 1
5-1
6
EX
PE
ND
ITU
RE
Pri
or
Ye
ar
Ac
tua
l
Cu
rre
nt
Ye
ar
Bu
dg
et
Cu
rre
nt
Ye
ar
Ac
tua
l (E
st.
)B
UD
GE
T Y
EA
RP
roje
cte
d
Bu
dg
et
Pro
jec
ted
Bu
dg
et
Pro
jec
ted
Bu
dg
et
Pro
jec
ted
Bu
dg
et
CL
AS
SIF
ICA
TIO
NF
Y 1
3-1
4F
Y 1
4-1
5F
Y 1
4-1
5F
Y 1
5-1
6F
Y 1
6-1
7F
Y 1
7-1
8F
Y 1
8-1
9F
Y 1
9-2
0
Pe
rso
na
l S
erv
ice
s6
44
,52
4
67
9,4
51
61
7,1
82
75
2,6
12
77
2,4
16
79
1,9
90
81
0,5
04
83
0,2
86
Ma
teri
als
& S
up
plie
s6
6,1
38
78
,15
0
69
,45
0
88
,90
0
88
,00
0
87
,00
0
88
,00
0
88
,00
0
Oth
er
Se
rvic
es &
Ch
arg
es
26
2,0
15
41
5,7
00
36
2,4
53
47
1,2
00
35
1,8
00
35
3,4
00
35
7,0
00
36
0,1
00
Ca
pita
l O
utla
y-
-
-
-
-
-
-
-
De
bt S
erv
ice
-
-
-
-
-
-
-
-
Tra
nsfe
rs3
31
,77
8
28
8,1
18
29
2,6
18
27
7,2
47
34
7,9
47
35
2,9
86
35
4,4
69
35
5,0
56
TO
TA
L1
,30
4,4
55
1,4
61
,41
9
1,3
41
,70
3
1,5
89
,95
9
1,5
60
,16
3
1,5
85
,37
6
1,6
09
,97
3
1,6
33
,44
2
-
DE
TA
IL O
F T
RA
NS
FE
RS
:
Ad
min
istr
ative
Su
pp
ort
32
9,1
95
29
1,6
95
29
1,6
95
28
8,1
49
28
7,4
89
29
1,0
27
29
1,0
16
29
0,0
48
Allo
ca
tio
n C
red
it(4
8,0
80
)
(48
,68
3)
(48
,68
3)
(75
,04
2)
-
-
-
-
Fle
et L
ea
se
Asse
ssm
en
t F
ee
s3
9,5
38
21
,69
2
21
,69
2
23
,64
7
24
,70
3
25
,81
3
26
,97
7
28
,20
0
Fle
et M
an
ag
em
en
t-a
dd
itio
na
l fle
et
-
-
-
10
,00
0
-
-
-
-
Insu
ran
ce
Asse
ssm
en
t8
,28
3
8,9
71
8,9
71
12
,83
7
3,8
66
13
,64
6
13
,97
6
14
,30
8
Allo
ca
tio
n C
red
it(2
,89
1)
(2,5
57
)
(2,5
57
)
(2,8
44
)
9,3
89
-
-
-
Ve
hic
le M
ain
ten
an
ce
Ch
arg
es
5,7
34
17
,00
0
21
,50
0
20
,50
0
22
,50
0
22
,50
0
22
,50
0
22
,50
0
33
1,7
78
28
8,1
18
29
2,6
18
27
7,2
47
34
7,9
47
35
2,9
86
35
4,4
69
35
5,0
56
31
32
Planning and Zoning Department
2015-2016
Departmental Summary
D E P A R T M E N T A L D E S C R I P T I O N
The mission statement of the Planning & Zoning department is:
“To provide impartial, accurate and timely interpretation of the development codes and
communication to individuals, organizations, Boards and Commissions.”
The core business of the Planning and Zoning Department includes a review and action of
development applications and sign permits. Many of the applications are required to be
considered by the Planning Commission and City Council or the Board of Adjustment or
Appeals. Special purpose studies include work for the Edmond Bicycle Committee, Urban
Board, Edmond Plan IV, and Sustainability Programs.
1. Complete staff reports and permits in the 10 core work activities and present reviews to
the required committees.
2. Provide staff support to active committees or special study committees, such as the
Bicycle Committee, Urban Board, and Transportation Committee.
3. Organize Planning/Zoning Department information, meeting long term record
requirements, sign compliance, and land use projections for the Edmond Plan.
S T A F F I N G (FT-PT-S)
Current Level Year 1 Year 2 Year 3 Year 4 Year 5 6-0-0 6-0-0 6-0-0 6-0-0 6-0-0 6-0-0
.
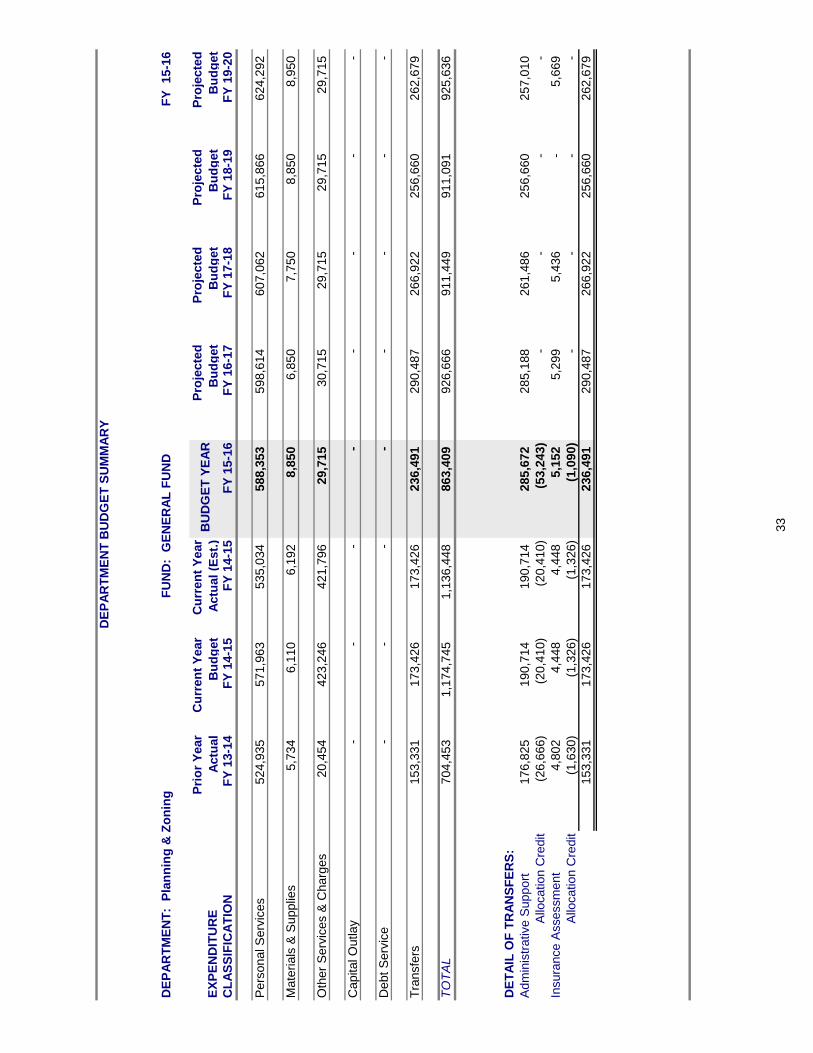
DE
PA
RT
ME
NT
BU
DG
ET
SU
MM
AR
Y
DE
PA
RT
ME
NT
: P
lan
nin
g &
Zo
nin
g
FU
ND
: G
EN
ER
AL
FU
ND
FY
15-1
6
EX
PE
ND
ITU
RE
Pri
or
Year
Actu
al
Cu
rren
t Y
ear
Bu
dg
et
Cu
rren
t Y
ear
Actu
al
(Est.
)B
UD
GE
T Y
EA
RP
roje
cte
d
Bu
dg
et
Pro
jecte
d
Bu
dg
et
Pro
jecte
d
Bu
dg
et
Pro
jecte
d
Bu
dg
et
CL
AS
SIF
ICA
TIO
NF
Y 1
3-1
4F
Y 1
4-1
5F
Y 1
4-1
5F
Y 1
5-1
6F
Y 1
6-1
7F
Y 1
7-1
8F
Y 1
8-1
9F
Y 1
9-2
0
Pers
onal S
erv
ices
524,9
35
571,9
63
535,0
34
588,3
53
598,6
14
607,0
62
615,8
66
624,2
92
Mate
rials
& S
upplie
s5,7
34
6,1
10
6,1
92
8,8
50
6,8
50
7,7
50
8,8
50
8,9
50
Oth
er
Serv
ices &
Charg
es
20,4
54
423,2
46
421,7
96
29,7
15
30,7
15
29,7
15
29,7
15
29,7
15
Capital O
utlay
-
-
-
-
-
-
-
-
Debt
Serv
ice
-
-
-
-
-
-
-
-
Tra
nsfe
rs153,3
31
173,4
26
173,4
26
236,4
91
290,4
87
266,9
22
256,6
60
262,6
79
TO
TA
L704,4
53
1,1
74,7
45
1,1
36,4
48
863,4
09
926,6
66
911,4
49
911,0
91
925,6
36
DE
TA
IL O
F T
RA
NS
FE
RS
:
Adm
inis
trative S
upport
176,8
25
190,7
14
190,7
14
285,6
72
285,1
88
261,4
86
256,6
60
257,0
10
Allo
cation C
redit
(26,6
66)
(2
0,4
10)
(2
0,4
10)
(5
3,2
43)
-
-
-
-
Insura
nce A
ssessm
ent
4,8
02
4,4
48
4,4
48
5,1
52
5,2
99
5,4
36
-
5,6
69
Allo
cation C
redit
(1,6
30)
(1,3
26)
(1,3
26)
(1,0
90)
-
-
-
-
153,3
31
173,4
26
173,4
26
236,4
91
290,4
87
266,9
22
256,6
60
262,6
79
33
34
Festival Market Place
2015-2016
Departmental Summary
D E P A R T M E N T A L D E S C R I P T I O N
The Festival Market Place’s mission is to be a focal point for community life and a setting for cultural and civic
activities and special events, which complement the Festival Market Place and its location in the Downtown
Edmond business district. The Festival Market Place is home to the Edmond Farmers Market (spring, summer
and fall), many City of Edmond-Sponsored and Affiliated events, and can be rented for private functions, such as
wedding receptions and customer appreciation events as well.
1. Provide a high quality Farmers Market that will provide regional produce, Made in Oklahoma items
and educate the community on the benefits of buying local.
S T A F F I N G (FT-PT-S)
Current Level Year 1 Year 2 Year 3 Year 4 Year 5
0-0-1 0-1-0 0-1-0 0-1-0 0-1-0 0-1-0
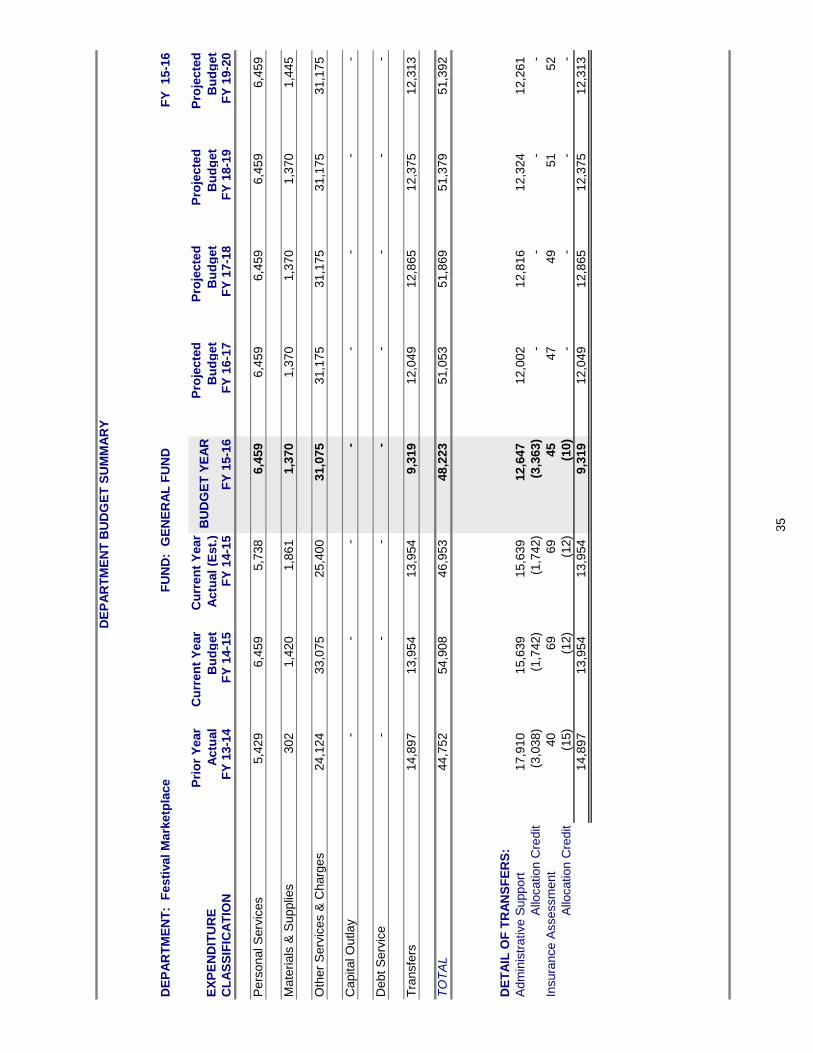
DE
PA
RT
ME
NT
BU
DG
ET
SU
MM
AR
Y
DE
PA
RT
ME
NT
: F
esti
val
Mark
etp
lace
F
UN
D:
GE
NE
RA
L F
UN
DF
Y
15-1
6
EX
PE
ND
ITU
RE
Pri
or
Year
Actu
al
Cu
rren
t Y
ear
Bu
dg
et
Cu
rren
t Y
ear
Actu
al
(Est.
)B
UD
GE
T Y
EA
RP
roje
cte
d
Bu
dg
et
Pro
jecte
d
Bu
dg
et
Pro
jecte
d
Bu
dg
et
Pro
jecte
d
Bu
dg
et
CL
AS
SIF
ICA
TIO
NF
Y 1
3-1
4F
Y 1
4-1
5F
Y 1
4-1
5F
Y 1
5-1
6F
Y 1
6-1
7F
Y 1
7-1
8F
Y 1
8-1
9F
Y 1
9-2
0
Pers
onal S
erv
ices
5,4
29
6,4
59
5,7
38
6,4
59
6,4
59
6,4
59
6,4
59
6,4
59
Mate
rials
& S
upplie
s302
1,4
20
1,8
61
1,3
70
1,3
70
1,3
70
1,3
70
1,4
45
Oth
er
Serv
ices &
Charg
es
24,1
24
33,0
75
25,4
00
31,0
75
31,1
75
31,1
75
31,1
75
31,1
75
Capital O
utlay
-
-
-
-
-
-
-
-
Debt
Serv
ice
-
-
-
-
-
-
-
-
Tra
nsfe
rs14,8
97
13,9
54
13,9
54
9,3
19
12,0
49
12,8
65
12,3
75
12,3
13
TO
TA
L44,7
52
54,9
08
46,9
53
48,2
23
51,0
53
51,8
69
51,3
79
51,3
92
DE
TA
IL O
F T
RA
NS
FE
RS
:
Adm
inis
trative S
upport
17,9
10
15,6
39
15,6
39
12,6
47
12,0
02
12,8
16
12,3
24
12,2
61
Allo
cation C
redit
(3,0
38)
(1
,742)
(1
,742)
(3
,363)
-
-
-
-
Insura
nce A
ssessm
ent
40
69
69
45
47
49
51
52
Allo
cation C
redit
(15)
(12)
(12)
(10)
-
-
-
-
14,8
97
13,9
54
13,9
54
9,3
19
12,0
49
12,8
65
12,3
75
12,3
13
35
36
Building & Fire Code Services
2015-2016
Departmental Summary
D E P A R T M E N T A L D E S C R I P T I O N
The Building & Fire Code Services Department exists to promote safe quality living and
working conditions to the citizens of Edmond through efficient use of available resources in
every aspect of the department. The activities encompassed by the department include
building and trades permitting, plan reviews, and inspections.
1. Expand on our opportunities for communications with external customers.
2. Expand communication and cooperation for all our internal customers with
emphasis on our top 3 internal customers.
3. Focus on our reconfiguration of our plan review department and training of three
new inspectors.
4. Continue to explore ways to enhance our customer service through upgrades in our
levels of service.
S T A F F I N G (FT-PT-S)
Current Level Year 1 Year 2 Year 3 Year 4 Year 5 13 14 14 14 14 14
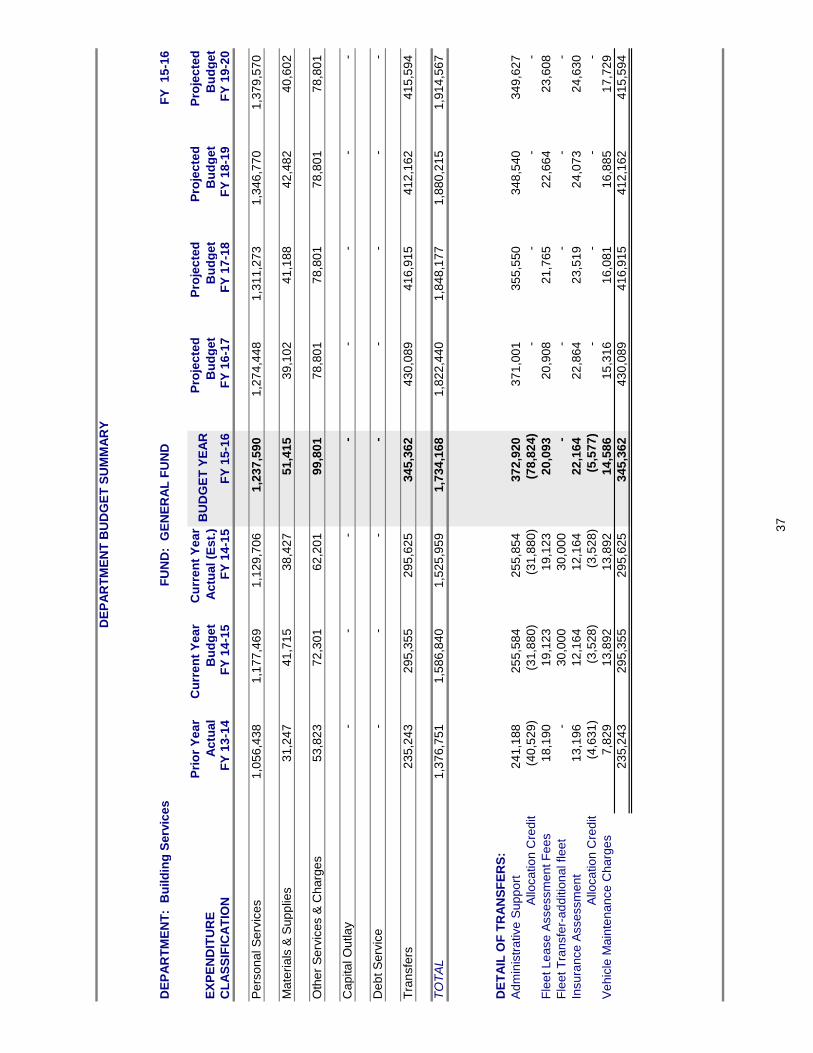
DE
PA
RT
ME
NT
BU
DG
ET
SU
MM
AR
Y
DE
PA
RT
ME
NT
: B
uild
ing
Se
rvic
es
F
UN
D:
GE
NE
RA
L F
UN
DF
Y 1
5-1
6
EX
PE
ND
ITU
RE
Pri
or
Ye
ar
Ac
tua
l
Cu
rre
nt
Ye
ar
Bu
dg
et
Cu
rre
nt
Ye
ar
Ac
tua
l (E
st.
)B
UD
GE
T Y
EA
RP
roje
cte
d
Bu
dg
et
Pro
jec
ted
Bu
dg
et
Pro
jec
ted
Bu
dg
et
Pro
jec
ted
Bu
dg
et
CL
AS
SIF
ICA
TIO
NF
Y 1
3-1
4F
Y 1
4-1
5F
Y 1
4-1
5F
Y 1
5-1
6F
Y 1
6-1
7F
Y 1
7-1
8F
Y 1
8-1
9F
Y 1
9-2
0
Pe
rso
na
l S
erv
ice
s1
,05
6,4
38
1,1
77
,46
9
1,1
29
,70
6
1,2
37
,59
0
1,2
74
,44
8
1,3
11
,27
3
1,3
46
,77
0
1,3
79
,57
0
Ma
teri
als
& S
up
plie
s3
1,2
47
41
,71
5
38
,42
7
51
,41
5
39
,10
2
41
,18
8
42
,48
2
40
,60
2
Oth
er
Se
rvic
es &
Ch
arg
es
53
,82
3
72
,30
1
62
,20
1
99
,80
1
78
,80
1
78
,80
1
78
,80
1
78
,80
1
Ca
pita
l O
utla
y-
-
-
-
-
-
-
-
De
bt S
erv
ice
-
-
-
-
-
-
-
-
Tra
nsfe
rs2
35
,24
3
29
5,3
55
29
5,6
25
34
5,3
62
43
0,0
89
41
6,9
15
41
2,1
62
41
5,5
94
TO
TA
L1
,37
6,7
51
1,5
86
,84
0
1,5
25
,95
9
1,7
34
,16
8
1,8
22
,44
0
1,8
48
,17
7
1,8
80
,21
5
1,9
14
,56
7
DE
TA
IL O
F T
RA
NS
FE
RS
:
Ad
min
istr
ative
Su
pp
ort
24
1,1
88
25
5,5
84
25
5,8
54
37
2,9
20
37
1,0
01
35
5,5
50
34
8,5
40
34
9,6
27
Allo
ca
tio
n C
red
it(4
0,5
29
)
(31
,88
0)
(31
,88
0)
(78
,82
4)
-
-
-
-
Fle
et L
ea
se
Asse
ssm
en
t F
ee
s1
8,1
90
19
,12
3
19
,12
3
20
,09
3
20
,90
8
21
,76
5
22
,66
4
23
,60
8
Fle
et T
ran
sfe
r-a
dd
itio
na
l fle
et
-
30
,00
0
30
,00
0
-
-
-
-
-
Insu
ran
ce
Asse
ssm
en
t1
3,1
96
12
,16
4
12
,16
4
22
,16
4
22
,86
4
23
,51
9
24
,07
3
24
,63
0
Allo
ca
tio
n C
red
it(4
,63
1)
(3,5
28
)
(3,5
28
)
(5,5
77
)
-
-
-
-
Ve
hic
le M
ain
ten
an
ce
Ch
arg
es
7,8
29
13
,89
2
13
,89
2
14
,58
6
15
,31
6
16
,08
1
16
,88
5
17
,72
9
23
5,2
43
29
5,3
55
29
5,6
25
34
5,3
62
43
0,0
89
41
6,9
15
41
2,1
62
41
5,5
94
37
38
Downtown Community Center
2015-2016
Departmental Summary
D E P A R T M E N T A L D E S C R I P T I O N
The Downtown Community Center delivers high quality, cost effective best in class
trustworthy service to our customers. The department provides a clean, safe, reasonably
priced, and quality rental facility to accommodate City of Edmond related events and
functions as well as diverse events and functions held by and for the public and private
sectors. The department strives for excellence in customer service and maintains the building
in a manner that prompts a positive customer response. The department evaluates written and
verbal customer requests for service and facility use as a consideration for future annual
budget needs and, as possible, promote those requests which best promote the public interest.
1. Provide unparalleled customer service to internal and external customers.
2
Improve the performance of the technical staff with at least one job related training course per
year.
3
Update rental information on DCC services and provide to Marketing Department for use on
the COE website.
4 Promote continuous improvement within the department.
5 Reduce departmental operations & maintenance costs.
S T A F F I N G (FT-PT-S)
Current Level Year 1 Year 2 Year 3 Year 4 Year 5
1-1-0 1-1-0 1-1-0 1-1-0 1-1-0 1-1-0
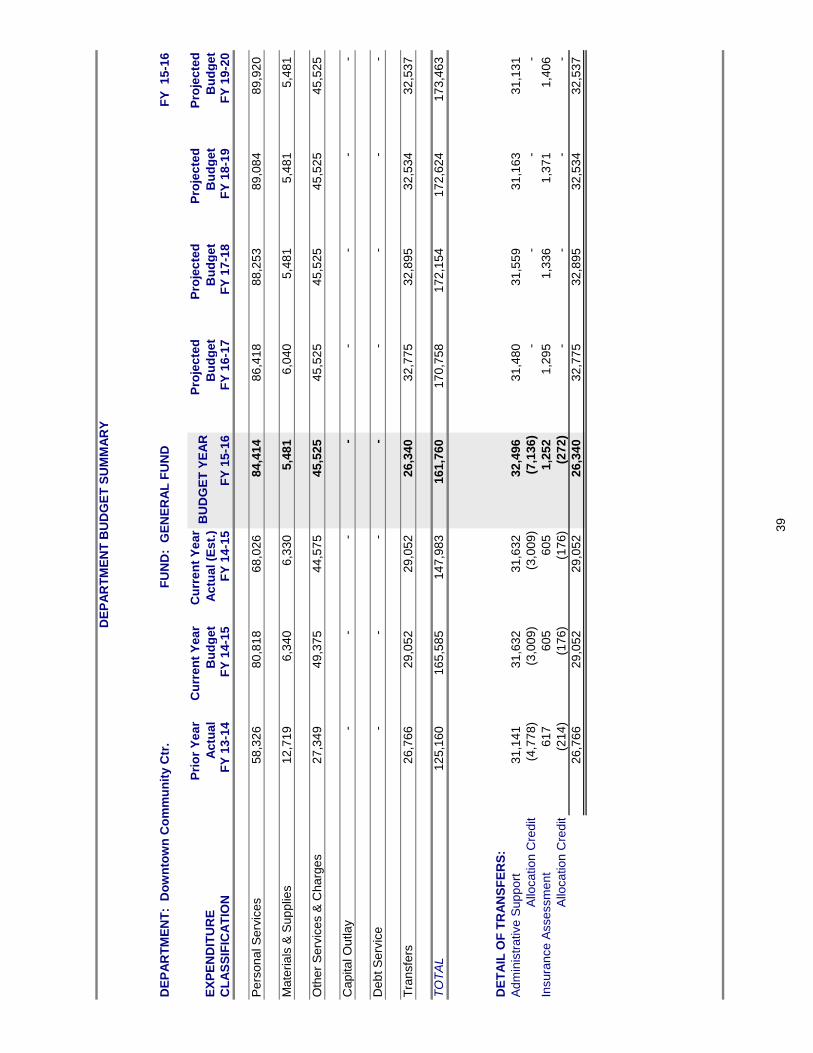
DE
PA
RT
ME
NT
BU
DG
ET
SU
MM
AR
Y
DE
PA
RT
ME
NT
: D
ow
nto
wn
Co
mm
un
ity C
tr.
F
UN
D:
GE
NE
RA
L F
UN
DF
Y 1
5-1
6
EX
PE
ND
ITU
RE
Pri
or
Ye
ar
Ac
tua
l
Cu
rre
nt
Ye
ar
Bu
dg
et
Cu
rre
nt
Ye
ar
Ac
tua
l (E
st.
)B
UD
GE
T Y
EA
RP
roje
cte
d
Bu
dg
et
Pro
jec
ted
Bu
dg
et
Pro
jec
ted
Bu
dg
et
Pro
jec
ted
Bu
dg
et
CL
AS
SIF
ICA
TIO
NF
Y 1
3-1
4F
Y 1
4-1
5F
Y 1
4-1
5F
Y 1
5-1
6F
Y 1
6-1
7F
Y 1
7-1
8F
Y 1
8-1
9F
Y 1
9-2
0
Pe
rso
na
l S
erv
ice
s5
8,3
26
80
,81
8
68
,02
6
84
,41
4
86
,41
8
88
,25
3
89
,08
4
89
,92
0
Ma
teri
als
& S
up
plie
s1
2,7
19
6,3
40
6,3
30
5,4
81
6,0
40
5,4
81
5,4
81
5,4
81
Oth
er
Se
rvic
es &
Ch
arg
es
27
,34
9
49
,37
5
44
,57
5
45
,52
5
45
,52
5
45
,52
5
45
,52
5
45
,52
5
Ca
pita
l O
utla
y-
-
-
-
-
-
-
-
De
bt S
erv
ice
-
-
-
-
-
-
-
-
Tra
nsfe
rs2
6,7
66
29
,05
2
29
,05
2
26
,34
0
32
,77
5
32
,89
5
32
,53
4
32
,53
7
TO
TA
L1
25
,16
0
16
5,5
85
14
7,9
83
16
1,7
60
17
0,7
58
17
2,1
54
17
2,6
24
17
3,4
63
DE
TA
IL O
F T
RA
NS
FE
RS
:
Ad
min
istr
ative
Su
pp
ort
31
,14
1
31
,63
2
31
,63
2
32
,49
6
31
,48
0
31
,55
9
31
,16
3
31
,13
1
Allo
ca
tio
n C
red
it(4
,77
8)
(3,0
09
)
(3,0
09
)
(7,1
36
)
-
-
-
-
Insu
ran
ce
Asse
ssm
en
t6
17
60
5
60
5
1,2
52
1,2
95
1,3
36
1,3
71
1,4
06
Allo
ca
tio
n C
red
it(2
14
)
(17
6)
(17
6)
(27
2)
-
-
-
-
26
,76
6
29
,05
2
29
,05
2
26
,34
0
32
,77
5
32
,89
5
32
,53
4
32
,53
7
39
40
Historical Society
2015-2016
Departmental Summary
D E P A R T M E N T A L D E S C R I P T I O N
The Edmond Historical Society is a 501(c) (3) non-profit organization that was formed in 1983 and incorporated in 1984. It was formed to establish, maintain and operate a local museum of history; to collect, preserve and exhibit artifacts, photographs and documents that interpret the history and development of Edmond and the surrounding area.
PURPOSE OF THE MUSEUM
1. The Society shall assume the responsibility of all functions of the Museum under the
direction of the Board of Directors.
2. The Museum shall exhibit and interpret the history of Edmond and the surrounding area,
shall engage traveling exhibits, and shall offer educations programs, including off-site
exhibits.
3. The Museum collection shall be the sole property of the Society as defined in the
collection policy.
4. The Museum shall be open to the public on an established schedule at a minimum of 120
days a calendar year and closed on legal holidays; shall schedule special events, and shall
be staffed by docents, volunteers, and/or staff during open hours.
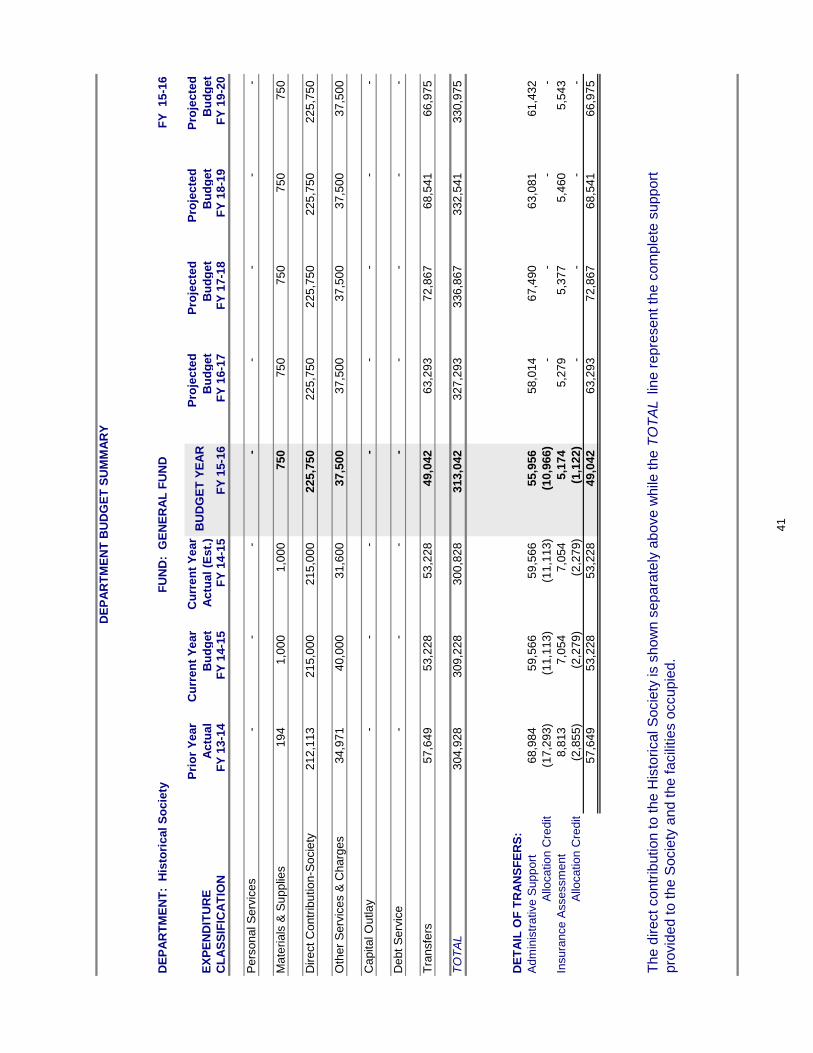
DE
PA
RT
ME
NT
BU
DG
ET
SU
MM
AR
Y
DE
PA
RT
ME
NT
: H
isto
ric
al
So
cie
ty
FU
ND
: G
EN
ER
AL
FU
ND
FY
1
5-1
6
EX
PE
ND
ITU
RE
Pri
or
Ye
ar
Ac
tua
l
Cu
rre
nt
Ye
ar
Bu
dg
et
Cu
rre
nt
Ye
ar
Ac
tua
l (E
st.
)B
UD
GE
T Y
EA
RP
roje
cte
d
Bu
dg
et
Pro
jecte
d
Bu
dg
et
Pro
jecte
d
Bu
dg
et
Pro
jecte
d
Bu
dg
et
CL
AS
SIF
ICA
TIO
NF
Y 1
3-1
4F
Y 1
4-1
5F
Y 1
4-1
5F
Y 1
5-1
6F
Y 1
6-1
7F
Y 1
7-1
8F
Y 1
8-1
9F
Y 1
9-2
0
Pe
rso
na
l S
erv
ices
-
-
-
-
-
-
-
-
Ma
terials
& S
upp
lies
194
1,0
00
1,0
00
750
750
750
750
750
Dire
ct
Co
ntr
ibutio
n-S
ocie
ty2
12
,113
215
,000
215
,000
225
,750
225
,750
225
,750
225
,750
225
,750
Oth
er
Se
rvic
es &
Ch
arg
es
34,9
71
4
0,0
00
3
1,6
00
3
7,5
00
3
7,5
00
3
7,5
00
3
7,5
00
3
7,5
00
Ca
pita
l O
utla
y-
-
-
-
-
-
-
-
De
bt
Se
rvic
e-
-
-
-
-
-
-
-
Tra
nsfe
rs5
7,6
49
5
3,2
28
5
3,2
28
4
9,0
42
6
3,2
93
7
2,8
67
6
8,5
41
6
6,9
75
TO
TA
L3
04
,928
309
,228
300
,828
313
,042
327
,293
336
,867
332
,541
330
,975
DE
TA
IL O
F T
RA
NS
FE
RS
:
Ad
min
istr
ative
Su
pp
ort
68,9
84
5
9,5
66
5
9,5
66
5
5,9
56
5
8,0
14
6
7,4
90
6
3,0
81
6
1,4
32
Allo
catio
n C
redit
(17,2
93
)
(1
1,1
13
)
(1
1,1
13
)
(1
0,9
66
)
-
-
-
-
Insura
nce
Asse
ssm
ent
8,8
13
7,0
54
7,0
54
5,1
74
5,2
79
5,3
77
5,4
60
5,5
43
Allo
catio
n C
redit
(2,8
55
)
(2,2
79
)
(2,2
79
)
(1,1
22
)
-
-
-
-
57,6
49
5
3,2
28
5
3,2
28
4
9,0
42
6
3,2
93
7
2,8
67
6
8,5
41
6
6,9
75
The d
irect
contr
ibution t
o t
he H
isto
rical S
ocie
ty is s
how
n s
epara
tely
above w
hile
the T
OT
AL
lin
e r
epre
sent
the c
om
ple
te s
upport
pro
vid
ed t
o t
he S
ocie
ty a
nd t
he f
acili
tie
s o
ccupie
d.
41
42
Edmond Electric
Economic Development Fund
2015-2016
Departmental Summary
D E P A R T M E N T A L D E S C R I P T I O N
The Edmond Electric Economic Development Fund has been established to stimulate the growth of Edmond’s economy by offering services that facilitate the growth and expansion of new and existing businesses and generating opportunities to increase the sales tax base of the City of Edmond. Funding for this activity the past 3 years has been provided by Edmond Electric and the General Fund with the transfer of $50,000 each annually.
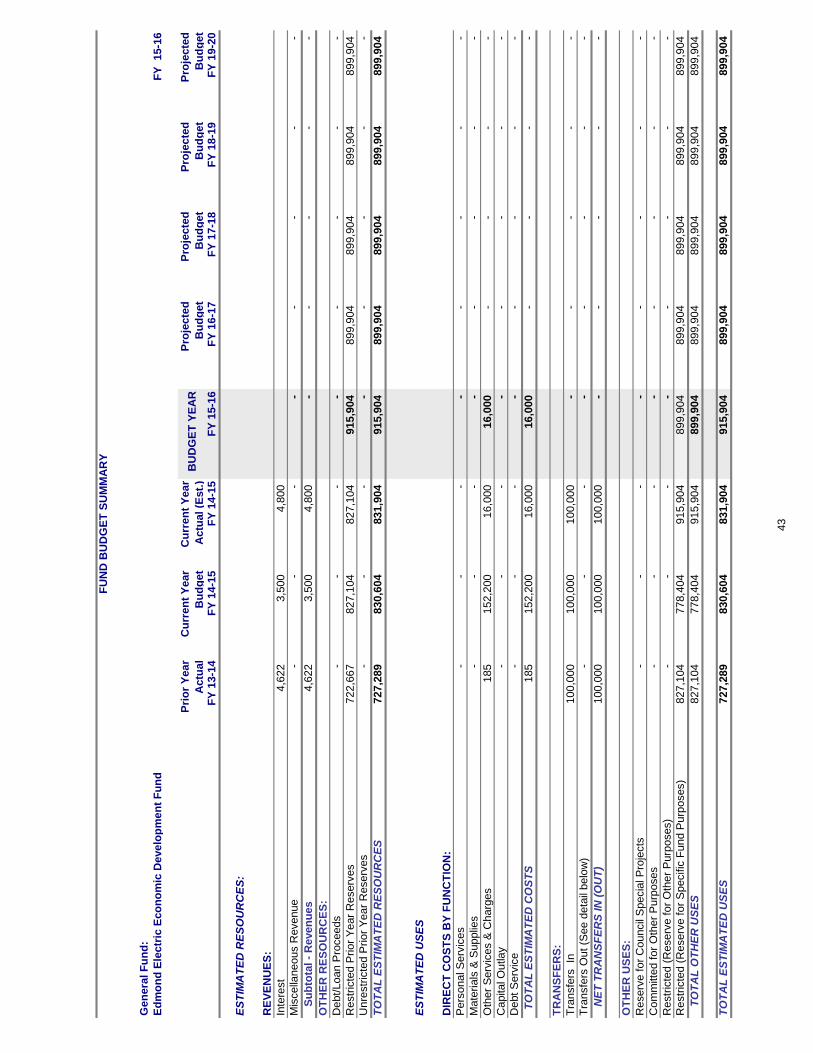
FU
ND
BU
DG
ET
SU
MM
AR
Y
Gen
era
l F
un
d:
Ed
mo
nd
Ele
ctr
ic E
co
no
mic
Develo
pm
en
t F
un
dF
Y 15-1
6
Pri
or
Year
Actu
al
Cu
rren
t Y
ear
Bu
dg
et
Cu
rren
t Y
ear
Actu
al (E
st.
)B
UD
GE
T Y
EA
RP
roje
cte
d
Bu
dg
et
Pro
jecte
d
Bu
dg
et
Pro
jecte
d
Bu
dg
et
Pro
jecte
d
Bu
dg
et
FY
13-1
4F
Y 1
4-1
5F
Y 1
4-1
5F
Y 1
5-1
6F
Y 1
6-1
7F
Y 1
7-1
8F
Y 1
8-1
9F
Y 1
9-2
0
ES
TIM
AT
ED
RE
SO
UR
CE
S:
RE
VE
NU
ES
:
Inte
rest
4,6
22
3,5
00
4,8
00
Mis
cella
neous R
evenue
-
-
-
-
-
-
-
-
S
ub
tota
l -
Reven
ues
4,6
22
3,5
00
4,8
00
-
-
-
-
-
OT
HE
R R
ES
OU
RC
ES
:
Debt/Loan P
roceeds
-
-
-
-
-
-
-
-
Restr
icte
d P
rior
Year
Reserv
es
722,6
67
827,1
04
827,1
04
915,9
04
899,9
04
899,9
04
899,9
04
899,9
04
Unre
str
icte
d P
rior
Year
Reserv
es
-
-
-
-
-
-
-
-
TO
TA
L E
ST
IMA
TE
D R
ES
OU
RC
ES
727,2
89
830,6
04
831,9
04
915,9
04
899,9
04
899,9
04
899,9
04
899,9
04
ES
TIM
AT
ED
US
ES
DIR
EC
T C
OS
TS
BY
FU
NC
TIO
N:
Pers
onal S
erv
ices
-
-
-
-
-
-
-
-
Mate
rials
& S
upplie
s-
-
-
-
-
-
-
-
Oth
er
Serv
ices &
Charg
es
185
152,2
00
16,0
00
16,0
00
-
-
-
-
Capital O
utlay
-
-
-
-
-
-
-
-
Debt S
erv
ice
-
-
-
-
-
-
-
-
T
OT
AL
ES
TIM
AT
ED
CO
ST
S185
152,2
00
16,0
00
16,0
00
-
-
-
-
TR
AN
SF
ER
S:
Tra
nsfe
rs In
100,0
00
100,0
00
100,0
00
-
-
-
-
-
Tra
nsfe
rs O
ut (S
ee d
eta
il belo
w)
-
-
-
-
-
-
-
-
N
ET
TR
AN
SF
ER
S IN
(O
UT
)100,0
00
100,0
00
100,0
00
-
-
-
-
-
OT
HE
R U
SE
S:
Reserv
e f
or
Council
Specia
l P
roje
cts
-
-
-
-
-
-
-
-
Com
mitte
d f
or
Oth
er
Purp
oses
-
-
-
-
-
-
-
-
Restr
icte
d (
Reserv
e f
or
Oth
er
Purp
oses)
-
-
-
-
-
-
-
-
Restr
icte
d (
Reserv
e f
or
Specific
Fund P
urp
oses)
827,1
04
778,4
04
915,9
04
899,9
04
899,9
04
899,9
04
899,9
04
899,9
04
T
OT
AL
OT
HE
R U
SE
S827,1
04
778,4
04
915,9
04
899,9
04
899,9
04
899,9
04
899,9
04
899,9
04
TO
TA
L E
ST
IMA
TE
D U
SE
S727,2
89
830,6
04
831,9
04
915,9
04
899,9
04
899,9
04
899,9
04
899,9
04
43

44
Parks & Recreation Special Events Fund
2015-2016
Departmental Summary
D E P A R T M E N T A L D E S C R I P T I O N
The Parks Special Events Fund tracks activity and fees for special events provided through the Edmond Parks & Recreation Department’s Program Division.
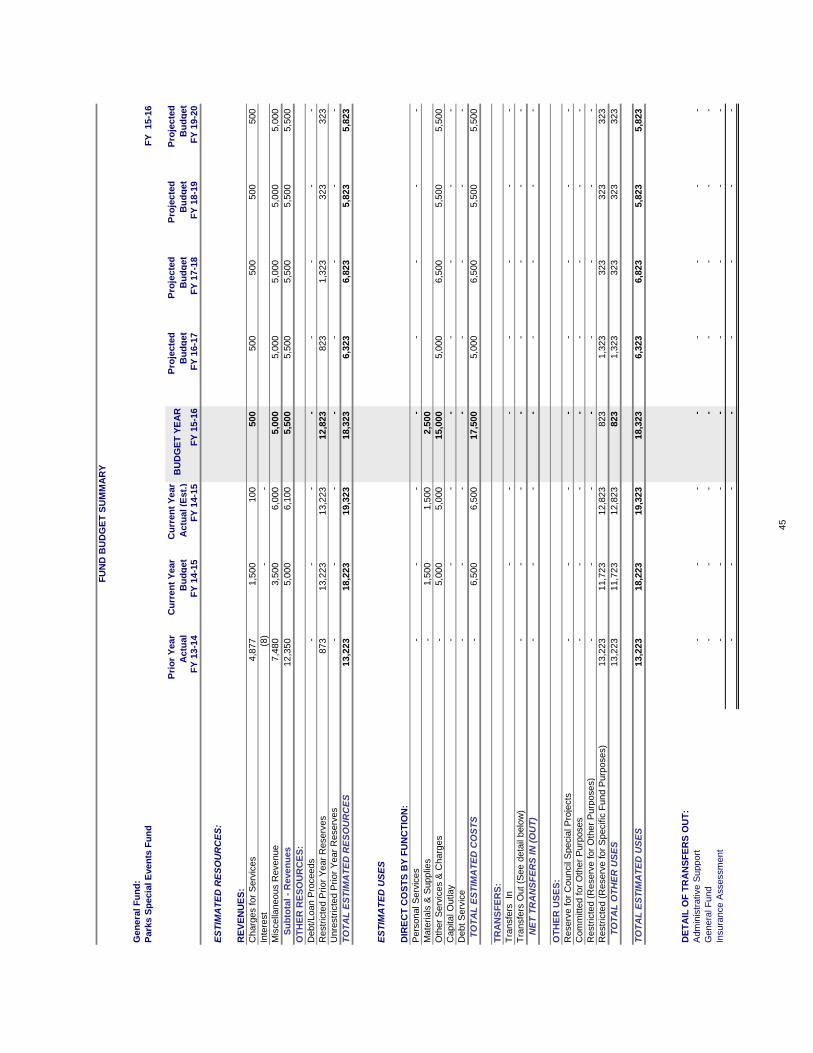
FU
ND
BU
DG
ET
SU
MM
AR
Y
Gen
era
l F
un
d:
Park
s S
pecia
l E
ven
ts F
un
dF
Y 15-1
6
Pri
or
Year
Actu
al
Cu
rren
t Y
ear
Bu
dg
et
Cu
rren
t Y
ear
Actu
al (E
st.
)B
UD
GE
T Y
EA
RP
roje
cte
d
Bu
dg
et
Pro
jecte
d
Bu
dg
et
Pro
jecte
d
Bu
dg
et
Pro
jecte
d
Bu
dg
et
FY
13-1
4F
Y 1
4-1
5F
Y 1
4-1
5F
Y 1
5-1
6F
Y 1
6-1
7F
Y 1
7-1
8F
Y 1
8-1
9F
Y 1
9-2
0
ES
TIM
AT
ED
RE
SO
UR
CE
S:
RE
VE
NU
ES
:
Charg
es for
Serv
ices
4,8
77
1,5
00
100
500
500
500
500
500
Inte
rest
(8)
-
-
Mis
cella
neous R
evenue
7,4
80
3,5
00
6,0
00
5,0
00
5,0
00
5,0
00
5,0
00
5,0
00
S
ub
tota
l -
Reven
ues
12,3
50
5,0
00
6,1
00
5,5
00
5,5
00
5,5
00
5,5
00
5,5
00
OT
HE
R R
ES
OU
RC
ES
:
Debt/Loan P
roceeds
-
-
-
-
-
-
-
-
Restr
icte
d P
rior
Year
Reserv
es
873
13,2
23
13,2
23
12,8
23
823
1,3
23
323
323
Unre
str
icte
d P
rior
Year
Reserv
es
-
-
-
-
-
-
-
-
TO
TA
L E
ST
IMA
TE
D R
ES
OU
RC
ES
13,2
23
18,2
23
19,3
23
18,3
23
6,3
23
6,8
23
5,8
23
5,8
23
ES
TIM
AT
ED
US
ES
DIR
EC
T C
OS
TS
BY
FU
NC
TIO
N:
Pers
onal S
erv
ices
-
-
-
-
-
-
-
-
Mate
rials
& S
upplie
s-
1,5
00
1,5
00
2,5
00
Oth
er
Serv
ices &
Charg
es
-
5,0
00
5,0
00
15,0
00
5,0
00
6,5
00
5,5
00
5,5
00
Capital O
utlay
-
-
-
-
-
-
-
-
Debt S
erv
ice
-
-
-
-
-
-
-
-
T
OT
AL
ES
TIM
AT
ED
CO
ST
S-
6,5
00
6,5
00
17,5
00
5,0
00
6,5
00
5,5
00
5,5
00
TR
AN
SF
ER
S:
Tra
nsfe
rs In
-
-
-
-
-
-
-
Tra
nsfe
rs O
ut (S
ee d
eta
il belo
w)
-
-
-
-
-
-
-
-
N
ET
TR
AN
SF
ER
S IN
(O
UT
)-
-
-
-
-
-
-
-
OT
HE
R U
SE
S:
Reserv
e for
Council
Specia
l P
roje
cts
-
-
-
-
-
-
-
-
Com
mitte
d for
Oth
er
Purp
oses
-
-
-
-
-
-
-
-
Restr
icte
d (
Reserv
e for
Oth
er
Purp
oses)
-
-
-
-
-
-
-
-
Restr
icte
d (
Reserv
e for
Specific
Fund P
urp
oses)
13,2
23
11,7
23
12,8
23
823
1,3
23
323
323
323
T
OT
AL
OT
HE
R U
SE
S13,2
23
11,7
23
12,8
23
823
1,3
23
323
323
323
TO
TA
L E
ST
IMA
TE
D U
SE
S13,2
23
18,2
23
19,3
23
18,3
23
6,3
23
6,8
23
5,8
23
5,8
23
DE
TA
IL O
F T
RA
NS
FE
RS
OU
T:
Adm
inis
trative S
upport
-
-
-
-
-
-
-
-
Genera
l F
und
-
-
-
-
-
-
-
-
Insura
nce A
ssessm
ent
-
-
-
-
-
-
-
-
-
-
-
-
-
-
-
-
45

Special Revenue Funds
Tab
Special Revenue - Sub-Directory
Fund Description 46-50 Senior Citizens Fund - Description 51 Senior Citizens Budget - Summary 52 Community Development (CDBG) - Description 53 Community Development (CDBG) Budget Summary 54 Asset Forfeiture Fund – Description 55 Asset Forfeiture – Budget Summary 56 Edmond Fire Department – Description 57 Edmond Fire Department – Budget Summary 58 Police - Description 59 Police – Budget Summary 60 Hospital Sale Trust Fund – Description 61 Hospital Sale Trust Fund – Budget Summary 62 Real Property Fund – Description 63 Real Property Fund – Budget Summary 64 Convention & Visitors Bureau – Description 65 Convention & Visitors Bureau – Budget Summary 66 Ambulatory Services Fund – Description 67 Ambulatory Services Fund – Budget Summary 68
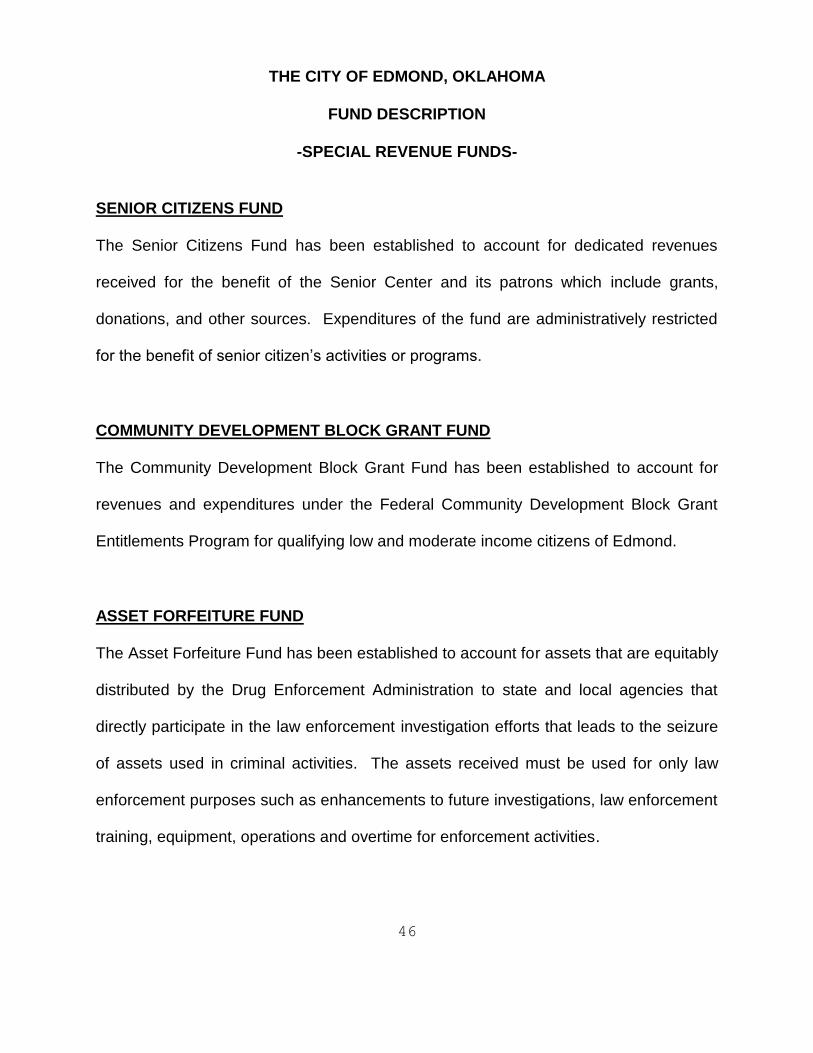
46
THE CITY OF EDMOND, OKLAHOMA
FUND DESCRIPTION
-SPECIAL REVENUE FUNDS-
SENIOR CITIZENS FUND
The Senior Citizens Fund has been established to account for dedicated revenues
received for the benefit of the Senior Center and its patrons which include grants,
donations, and other sources. Expenditures of the fund are administratively restricted
for the benefit of senior citizen’s activities or programs.
COMMUNITY DEVELOPMENT BLOCK GRANT FUND
The Community Development Block Grant Fund has been established to account for
revenues and expenditures under the Federal Community Development Block Grant
Entitlements Program for qualifying low and moderate income citizens of Edmond.
ASSET FORFEITURE FUND
The Asset Forfeiture Fund has been established to account for assets that are equitably
distributed by the Drug Enforcement Administration to state and local agencies that
directly participate in the law enforcement investigation efforts that leads to the seizure
of assets used in criminal activities. The assets received must be used for only law
enforcement purposes such as enhancements to future investigations, law enforcement
training, equipment, operations and overtime for enforcement activities.
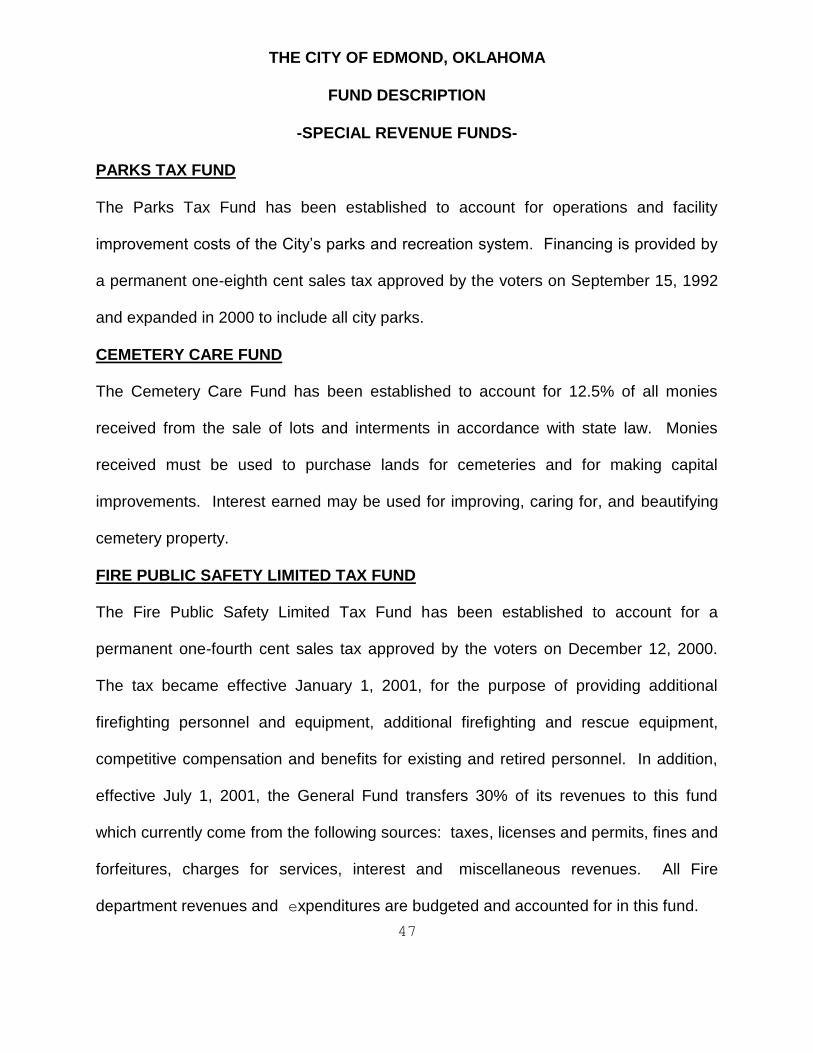
47
THE CITY OF EDMOND, OKLAHOMA
FUND DESCRIPTION
-SPECIAL REVENUE FUNDS-
PARKS TAX FUND
The Parks Tax Fund has been established to account for operations and facility
improvement costs of the City’s parks and recreation system. Financing is provided by
a permanent one-eighth cent sales tax approved by the voters on September 15, 1992
and expanded in 2000 to include all city parks.
CEMETERY CARE FUND The Cemetery Care Fund has been established to account for 12.5% of all monies
received from the sale of lots and interments in accordance with state law. Monies
received must be used to purchase lands for cemeteries and for making capital
improvements. Interest earned may be used for improving, caring for, and beautifying
cemetery property.
FIRE PUBLIC SAFETY LIMITED TAX FUND The Fire Public Safety Limited Tax Fund has been established to account for a
permanent one-fourth cent sales tax approved by the voters on December 12, 2000.
The tax became effective January 1, 2001, for the purpose of providing additional
firefighting personnel and equipment, additional firefighting and rescue equipment,
competitive compensation and benefits for existing and retired personnel. In addition,
effective July 1, 2001, the General Fund transfers 30% of its revenues to this fund
which currently come from the following sources: taxes, licenses and permits, fines and
forfeitures, charges for services, interest and miscellaneous revenues. All Fire
department revenues and expenditures are budgeted and accounted for in this fund.
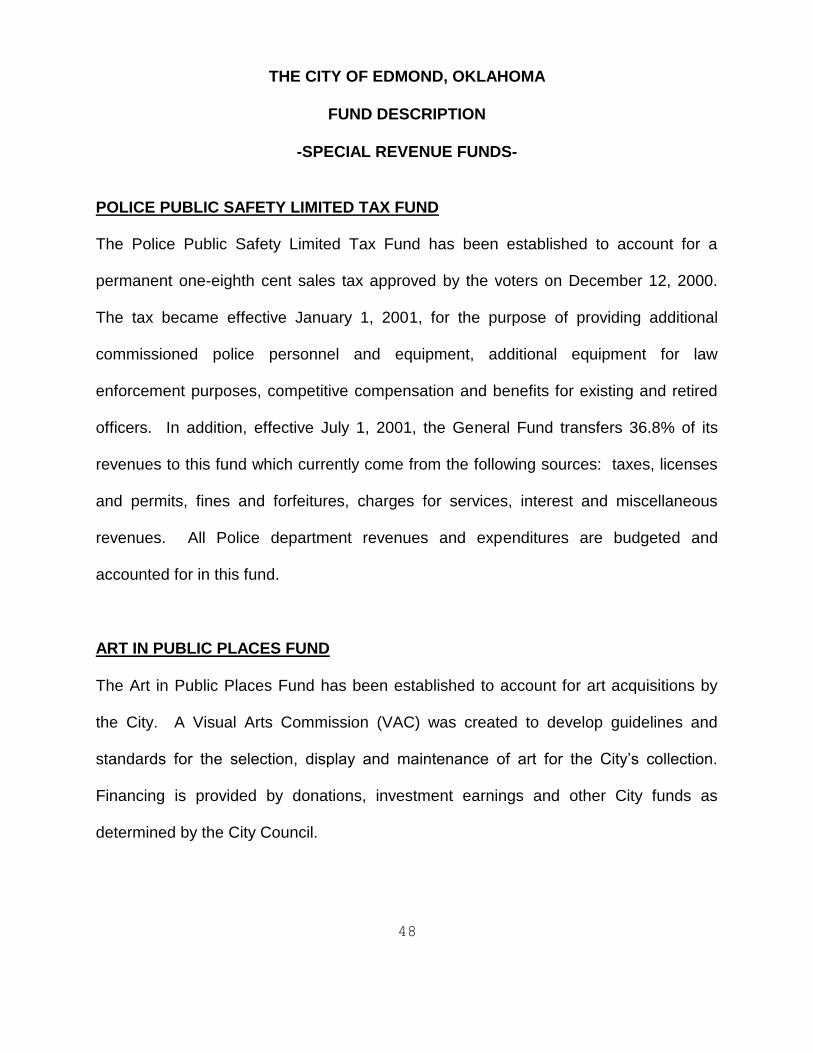
48
THE CITY OF EDMOND, OKLAHOMA
FUND DESCRIPTION
-SPECIAL REVENUE FUNDS-
POLICE PUBLIC SAFETY LIMITED TAX FUND The Police Public Safety Limited Tax Fund has been established to account for a
permanent one-eighth cent sales tax approved by the voters on December 12, 2000.
The tax became effective January 1, 2001, for the purpose of providing additional
commissioned police personnel and equipment, additional equipment for law
enforcement purposes, competitive compensation and benefits for existing and retired
officers. In addition, effective July 1, 2001, the General Fund transfers 36.8% of its
revenues to this fund which currently come from the following sources: taxes, licenses
and permits, fines and forfeitures, charges for services, interest and miscellaneous
revenues. All Police department revenues and expenditures are budgeted and
accounted for in this fund.
ART IN PUBLIC PLACES FUND
The Art in Public Places Fund has been established to account for art acquisitions by
the City. A Visual Arts Commission (VAC) was created to develop guidelines and
standards for the selection, display and maintenance of art for the City’s collection.
Financing is provided by donations, investment earnings and other City funds as
determined by the City Council.
49
THE CITY OF EDMOND, OKLAHOMA
FUND DESCRIPTION
-SPECIAL REVENUE FUNDS-
EDMOND ELECTRIC ECONOMIC DEVELOPMENT FUND
The Edmond Electric Economic Development Fund has been established to stimulate
the growth of Edmond's economy by offering services that facilitate the growth and
expansion of new and existing businesses and generating opportunities to increase the
sales tax base of the City of Edmond.
HOSPITAL SALE TRUST FUND
This fund accounts for the proceeds received from the 1981 sale of the Edmond
Memorial Hospital. Its only revenue source is interest earnings from the investment of
the proceeds. The interest earnings may be used for capital improvements as
determined by the City Council and the proceeds may be used for projects only as
approved by a vote of the citizens of Edmond.
REAL PROPERTY FUND
The Real Property Fund has been established to accumulate resources for future real
property acquisitions of the City. Initially financing was provided by a one-time transfer
of $463,230 reserved for land acquisition in the Capital Improvements Fund. Current
funding is being provided by annual transfers from the Hospital Sale Trust Fund.
50
THE CITY OF EDMOND, OKLAHOMA
FUND DESCRIPTION
-SPECIAL REVENUE FUNDS-
CONVENTION & VISITORS BUREAU FUND
The Convention and Visitors Bureau (CVB) special revenue fund was established to
operate the CVB while under the City's control which became effective July 1, 2004
when their contract was not renewed by Edmond's Chamber of Commerce. CVB is
completely funded by the 4% hotel/motel tax received by the City in the General Fund.
The CVB uses this tax revenue source for the purpose of encouraging, promoting and
fostering conventions and tourism for the City of Edmond.
AMBULATORY SERVICES FUND
The Ambulatory Services Fund has been established to accumulate resources for the
regional ambulance service, including the TotaCare Program. Initially, these expenses
were paid through the General Fund, but in FY09-10, a small fee was added to utility
bills for those who elected to participate in the TotalCare Program offered by EMSA.
PARKS SPECIAL EVENTS FUND
The Parks Special Events Fund has been established to account for the various special
recreational events put on by the Park Department and paid for by private donations
and fees.

51
Senior Citizens Fund
2015-2016
Departmental Summary
D E P A R T M E N T A L D E S C R I P T I O N
The Senior Citizens Fund has been established to account for dedicated revenues received for the benefit of the Senior Center and its patrons which include grants, donations and other sources. Expenditures of the fund are administratively restricted for the benefit of senior citizen’s activities or programs.
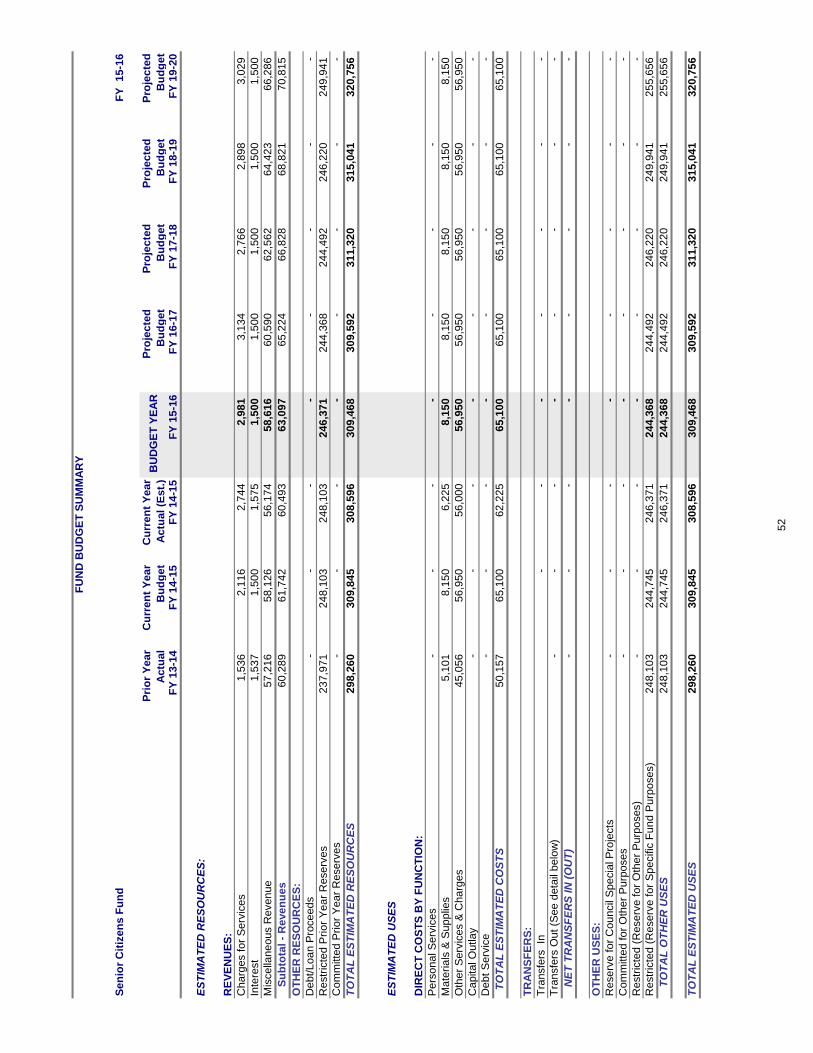
FU
ND
BU
DG
ET
SU
MM
AR
Y
Sen
ior
Cit
ize
ns F
un
dF
Y 1
5-1
6
Pri
or
Yea
r
Actu
al
Cu
rren
t Y
ea
r
Bu
dg
et
Cu
rren
t Y
ea
r
Actu
al
(Est.
)B
UD
GE
T Y
EA
RP
roje
cte
d
Bu
dg
et
Pro
jec
ted
Bu
dg
et
Pro
jec
ted
Bu
dg
et
Pro
jec
ted
Bu
dg
et
FY
13-1
4F
Y 1
4-1
5F
Y 1
4-1
5F
Y 1
5-1
6F
Y 1
6-1
7F
Y 1
7-1
8F
Y 1
8-1
9F
Y 1
9-2
0
ES
TIM
AT
ED
RE
SO
UR
CE
S:
RE
VE
NU
ES
:
Cha
rge
s fo
r S
erv
ices
1,5
36
2,1
16
2,7
44
2,9
81
3,1
34
2,7
66
2,8
98
3,0
29
Inte
rest
1,5
37
1,5
00
1,5
75
1,5
00
1,5
00
1,5
00
1,5
00
1,5
00
Mis
cella
neo
us R
even
ue
57
,216
58
,126
56
,174
58
,616
60
,590
62
,562
64
,423
66
,286
S
ub
tota
l -
Reven
ues
60
,289
61
,742
60
,493
63
,097
65
,224
66
,828
68
,821
70
,815
OT
HE
R R
ES
OU
RC
ES
:
Deb
t/L
oa
n P
roce
ed
s-
-
-
-
-
-
-
-
Restr
icte
d P
rior
Yea
r R
ese
rves
23
7,9
71
24
8,1
03
24
8,1
03
24
6,3
71
24
4,3
68
24
4,4
92
24
6,2
20
24
9,9
41
Com
mitte
d P
rior
Yea
r R
ese
rves
-
-
-
-
-
-
-
-
TO
TA
L E
ST
IMA
TE
D R
ES
OU
RC
ES
29
8,2
60
30
9,8
45
30
8,5
96
30
9,4
68
30
9,5
92
31
1,3
20
31
5,0
41
32
0,7
56
ES
TIM
AT
ED
US
ES
DIR
EC
T C
OS
TS
BY
FU
NC
TIO
N:
Pers
on
al S
erv
ices
-
-
-
-
-
-
-
-
Mate
rials
& S
up
plie
s5,1
01
8,1
50
6,2
25
8,1
50
8,1
50
8,1
50
8,1
50
8,1
50
Oth
er
Serv
ices &
Cha
rge
s45
,056
56
,950
56
,000
56
,950
56
,950
56
,950
56
,950
56
,950
Cap
ital O
utlay
-
-
-
-
-
-
-
-
Deb
t S
erv
ice
-
-
-
-
-
-
-
-
T
OT
AL
ES
TIM
AT
ED
CO
ST
S50
,157
65
,100
62
,225
65
,100
65
,100
65
,100
65
,100
65
,100
TR
AN
SF
ER
S:
Tra
nsfe
rs In
-
-
-
-
-
-
-
Tra
nsfe
rs O
ut (S
ee
deta
il b
elo
w)
-
-
-
-
-
-
-
-
N
ET
TR
AN
SF
ER
S IN
(O
UT
)-
-
-
-
-
-
-
-
OT
HE
R U
SE
S:
Rese
rve f
or
Cou
ncil
Spe
cia
l P
roje
cts
-
-
-
-
-
-
-
-
Com
mitte
d f
or
Oth
er
Purp
oses
-
-
-
-
-
-
-
-
Restr
icte
d (
Rese
rve f
or
Oth
er
Purp
oses)
-
-
-
-
-
-
-
-
Restr
icte
d (
Rese
rve f
or
Spe
cific
Fun
d P
urp
oses)
24
8,1
03
24
4,7
45
24
6,3
71
24
4,3
68
24
4,4
92
24
6,2
20
24
9,9
41
25
5,6
56
T
OT
AL
OT
HE
R U
SE
S24
8,1
03
24
4,7
45
24
6,3
71
24
4,3
68
24
4,4
92
24
6,2
20
24
9,9
41
25
5,6
56
TO
TA
L E
ST
IMA
TE
D U
SE
S29
8,2
60
30
9,8
45
30
8,5
96
30
9,4
68
30
9,5
92
31
1,3
20
31
5,0
41
32
0,7
56
52
53
Community Development (CDBG)
2015-2016
Departmental Summary
DE P A R T M E N T A L D E S C R I P T I O N
Within the Community Development Division of the Planning Department, there are 2 current functions: CDBG and Edmond Rental Housing Education Program. Grant funds pay for the administrative costs for these functions.
1. Community Development Block Grant (CDBG) - Each year, the US Department of HUD provides eligible metropolitan cities with Community Development Block Grant (CDBG) funds to revitalize neighborhoods, develop affordable housing, expand economic opportunities and provide public services, principally to benefit low and moderate income persons or households. The amount of the 2014-15 CDBG allocations was $379,783 and the 2015-16 allocation will be $386,354. Edmond’s 10 CDBG programs benefit more than 2,700 residents per year.
2. Edmond Rental Housing Education Program - In conjunction with UCO and Metro Fair Housing of Greater OKC, the city launched the Edmond Rental Housing Education Program to thoroughly educate landlords and tenants about the many facets of leasing a home in Edmond. This program consists of three main components: educational materials, outreach and enforcement.
1. Eliminate barriers and improve access to affordable, safe, energy efficient, and fair housing.
2. Provide needed public and social services, especially for those with functional needs
3. Support neighborhood organization and community
4. Prevent and eliminate safety hazards and crime in the target area
S T A F F I N G (FT-PT-S)
Current Level Year 1 Year 2 Year 3 Year 4 Year 5
.1-0-0 .1-0-0 .1-0-0 .1-0-0 .1-0-0 .1-0-0
.
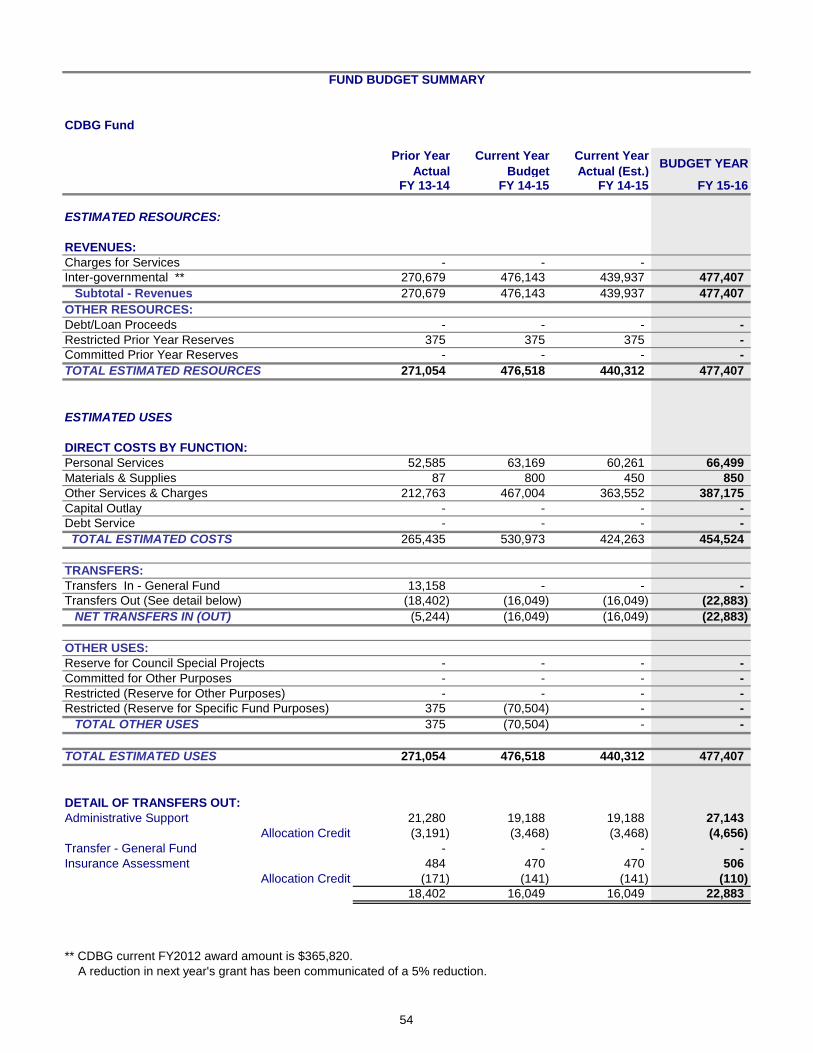
FUND BUDGET SUMMARY
CDBG Fund
Prior Year
Actual
Current Year
Budget
Current Year
Actual (Est.)BUDGET YEAR
FY 13-14 FY 14-15 FY 14-15 FY 15-16
ESTIMATED RESOURCES:
REVENUES:
Charges for Services - - -
Inter-governmental ** 270,679 476,143 439,937 477,407
Subtotal - Revenues 270,679 476,143 439,937 477,407
OTHER RESOURCES:
Debt/Loan Proceeds - - - -
Restricted Prior Year Reserves 375 375 375 -
Committed Prior Year Reserves - - - -
TOTAL ESTIMATED RESOURCES 271,054 476,518 440,312 477,407
ESTIMATED USES
DIRECT COSTS BY FUNCTION:
Personal Services 52,585 63,169 60,261 66,499
Materials & Supplies 87 800 450 850
Other Services & Charges 212,763 467,004 363,552 387,175
Capital Outlay - - - -
Debt Service - - - -
TOTAL ESTIMATED COSTS 265,435 530,973 424,263 454,524
TRANSFERS:
Transfers In - General Fund 13,158 - - -
Transfers Out (See detail below) (18,402) (16,049) (16,049) (22,883)
NET TRANSFERS IN (OUT) (5,244) (16,049) (16,049) (22,883)
OTHER USES:
Reserve for Council Special Projects - - - -
Committed for Other Purposes - - - -
Restricted (Reserve for Other Purposes) - - - -
Restricted (Reserve for Specific Fund Purposes) 375 (70,504) - -
TOTAL OTHER USES 375 (70,504) - -
TOTAL ESTIMATED USES 271,054 476,518 440,312 477,407
DETAIL OF TRANSFERS OUT:
Administrative Support 21,280 19,188 19,188 27,143
Allocation Credit (3,191) (3,468) (3,468) (4,656)
Transfer - General Fund - - - -
Insurance Assessment 484 470 470 506
Allocation Credit (171) (141) (141) (110)
18,402 16,049 16,049 22,883
** CDBG current FY2012 award amount is $365,820.
A reduction in next year's grant has been communicated of a 5% reduction.
54
55
Asset Forfeiture Fund
2015-2016
Departmental Summary
D E P A R T M E N T A L D E S C R I P T I O N
The Asset Forfeiture Fund has been established to account for the Edmond Police Department’s share
of assets that have been seized. Assets seized can vary from monetary instruments (cash, checks,
stocks, bonds, etc.), hauling conveyances (cars, trucks, boats, airplanes, etc.) or any other real
property with monetary value. The seizures are the result of a criminal investigation and are divided
among all the agencies assisting in the investigation based on their level of involvement. While these
have historically been derived from narcotics investigations, they can be initiated on other criminal
investigations where the seized property was used in the commission of or was derived from the
criminal act.
Asset Forfeiture Funds must be used to increase or supplement the resources of the Edmond Police
Department and shall not be used to replace or supplant the normal police department budget.
Regulations require that these funds be tracked and the police department must benefit directly from
them. The Edmond Police Department completes a Federal Annual Certification Report with the
United States Department of the Treasury documenting the activity in this fund.
Acceptable uses of these monies include:
• Activities Calculated to Enhance Future Investigations
• Law Enforcement Training
• Law Enforcement Equipment and Operations
• Law Enforcement Facilities and Equipment
• Overtime for Enforcement Activities
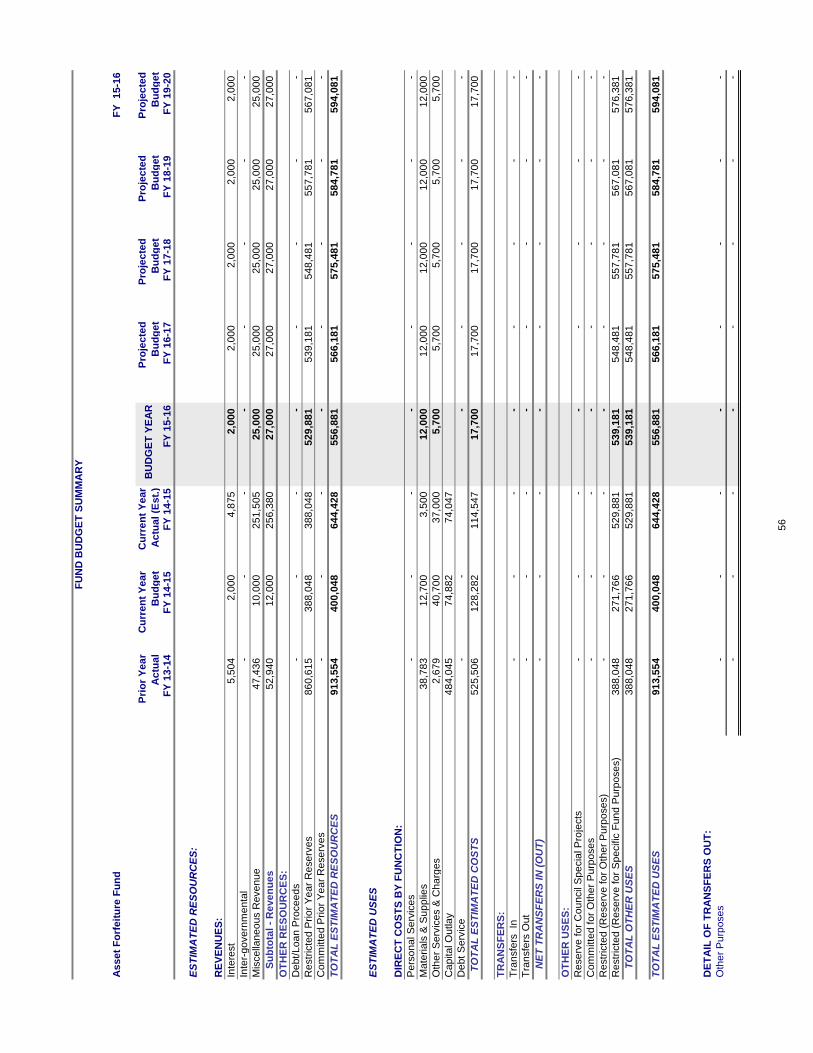
FU
ND
BU
DG
ET
SU
MM
AR
Y
As
se
t F
orf
eit
ure
Fu
nd
FY
1
5-1
6
Pri
or
Ye
ar
Ac
tua
l
Cu
rre
nt
Ye
ar
Bu
dg
et
Cu
rre
nt
Ye
ar
Ac
tua
l (E
st.
)B
UD
GE
T Y
EA
RP
roje
cte
d
Bu
dg
et
Pro
jec
ted
Bu
dg
et
Pro
jec
ted
Bu
dg
et
Pro
jec
ted
Bu
dg
et
FY
13
-14
FY
14
-15
FY
14
-15
FY
15
-16
FY
16
-17
FY
17
-18
FY
18
-19
FY
19
-20
ES
TIM
AT
ED
RE
SO
UR
CE
S:
RE
VE
NU
ES
:
Inte
rest
5,5
04
2
,00
0
4,8
75
2
,00
0
2,0
00
2
,00
0
2,0
00
2
,00
0
Inte
r-g
ove
rnm
en
tal
-
-
-
-
-
-
-
-
Mis
ce
llan
eo
us R
eve
nu
e4
7,4
36
10
,00
0
2
51
,50
5
25
,00
0
2
5,0
00
25
,00
0
2
5,0
00
25
,00
0
S
ub
tota
l -
Re
ve
nu
es
52
,94
0
1
2,0
00
25
6,3
80
2
7,0
00
27
,00
0
2
7,0
00
27
,00
0
2
7,0
00
OT
HE
R R
ES
OU
RC
ES
:
De
bt/
Lo
an
Pro
ce
ed
s-
-
-
-
-
-
-
-
Re
str
icte
d P
rio
r Y
ea
r R
ese
rve
s8
60
,61
5
38
8,0
48
3
88
,04
8
52
9,8
81
5
39
,18
1
54
8,4
81
5
57
,78
1
56
7,0
81
Co
mm
itte
d P
rio
r Y
ea
r R
ese
rve
s-
-
-
-
-
-
-
-
TO
TA
L E
ST
IMA
TE
D R
ES
OU
RC
ES
91
3,5
54
4
00
,04
8
64
4,4
28
5
56
,88
1
56
6,1
81
5
75
,48
1
58
4,7
81
5
94
,08
1
ES
TIM
AT
ED
US
ES
DIR
EC
T C
OS
TS
BY
FU
NC
TIO
N:
Pe
rso
na
l S
erv
ice
s-
-
-
-
-
-
-
-
Ma
teria
ls &
Su
pp
lies
38
,78
3
1
2,7
00
3,5
00
1
2,0
00
12
,00
0
1
2,0
00
12
,00
0
1
2,0
00
Oth
er
Se
rvic
es &
Ch
arg
es
2,6
79
4
0,7
00
37
,00
0
5
,70
0
5,7
00
5
,70
0
5,7
00
5
,70
0
Ca
pita
l O
utla
y4
84
,04
5
74
,88
2
7
4,0
47
De
bt
Se
rvic
e-
-
-
-
-
-
-
T
OT
AL
ES
TIM
AT
ED
CO
ST
S5
25
,50
6
12
8,2
82
1
14
,54
7
17
,70
0
1
7,7
00
17
,70
0
1
7,7
00
17
,70
0
TR
AN
SF
ER
S:
Tra
nsfe
rs
In-
-
-
-
-
-
-
-
Tra
nsfe
rs O
ut
-
-
-
-
-
-
-
-
N
ET
TR
AN
SF
ER
S IN
(O
UT
)-
-
-
-
-
-
-
-
OT
HE
R U
SE
S:
Re
se
rve
fo
r C
ou
ncil
Sp
ecia
l P
roje
cts
-
-
-
-
-
-
-
-
Co
mm
itte
d f
or
Oth
er
Pu
rpo
se
s-
-
-
-
-
-
-
-
Re
str
icte
d (
Re
se
rve
fo
r O
the
r P
urp
ose
s)
-
-
-
-
-
-
-
-
Re
str
icte
d (
Re
se
rve
fo
r S
pe
cific
Fu
nd
Pu
rpo
se
s)
38
8,0
48
2
71
,76
6
52
9,8
81
5
39
,18
1
54
8,4
81
5
57
,78
1
56
7,0
81
5
76
,38
1
T
OT
AL
OT
HE
R U
SE
S3
88
,04
8
27
1,7
66
5
29
,88
1
53
9,1
81
5
48
,48
1
55
7,7
81
5
67
,08
1
57
6,3
81
TO
TA
L E
ST
IMA
TE
D U
SE
S9
13
,55
4
40
0,0
48
6
44
,42
8
55
6,8
81
5
66
,18
1
57
5,4
81
5
84
,78
1
59
4,0
81
DE
TA
IL O
F T
RA
NS
FE
RS
OU
T:
Oth
er
Pu
rpo
se
s-
-
-
-
-
-
-
-
-
-
-
-
-
-
-
-
56
57
Fire Department
2015-2016
Departmental Summary
D E P A R T M E N T A L D E S C R I P T I O N
The mission statement of the Edmond Fire Department is “To faithfully provide trustworthy
service necessary to safeguard life, health, and the welfare of our community through
preparedness, emergency response, prevention, education, and training.” The Edmond Fire
Department is dedicated to a unified set of values that define who we are and how we operate.
We value Integrity, Professionalism, Trustworthiness, Dedication, and Ethics.
1. Deliver trustworthy service
2. Revise and implement standard operating procedures
3. Revise and implement updated policy manual
4. Complete Standard of Cover for all hazards emergency response.
5. Improve communications to better serve the department and community.
6. Review and implement the department strategic plan including organizational analysis
recommendations.
7. Implement a collaborative CAD and Records Management Systems with Edmond Police and
Communications
8. Develop a contingency plan for the delivery of emergency medical services within the City of
Edmond.
P E R F O R M A N C E M E A S U R E S
1. Evaluate 100% of all call types and response areas within twelve (12) months.
2. Revise and implement the target hazard identification program within the next six(6) months.
3. Complete ISO evaluation within the next four (4) months
4. Decrease fractal response time cumulatively by fifteen (15) percent within twelve (12) months.
5. Identify mutual and automatic aid opportunities and establish formal agreements for emergency response
within six (6) months.
6. Revise 100% of existing policies and procedures within the next twelve (12) months.
7. Implement an officer develop/succession plan within nine (9) months.
8. Implement department wide continuing training plan within the nine (9) months.
S T A F F I N G (FT-PT-S) Current Level Year 1 Year 2 Year 3 Year 4 Year 5
122-0-0 122-0-0 122-0-0 122-0-0 122-0-0 122-0-0 *Currently staffed with 123 of the 124 FT approved positions. Two civilian positions are supervised by Fire and budgeted
through Building Services.
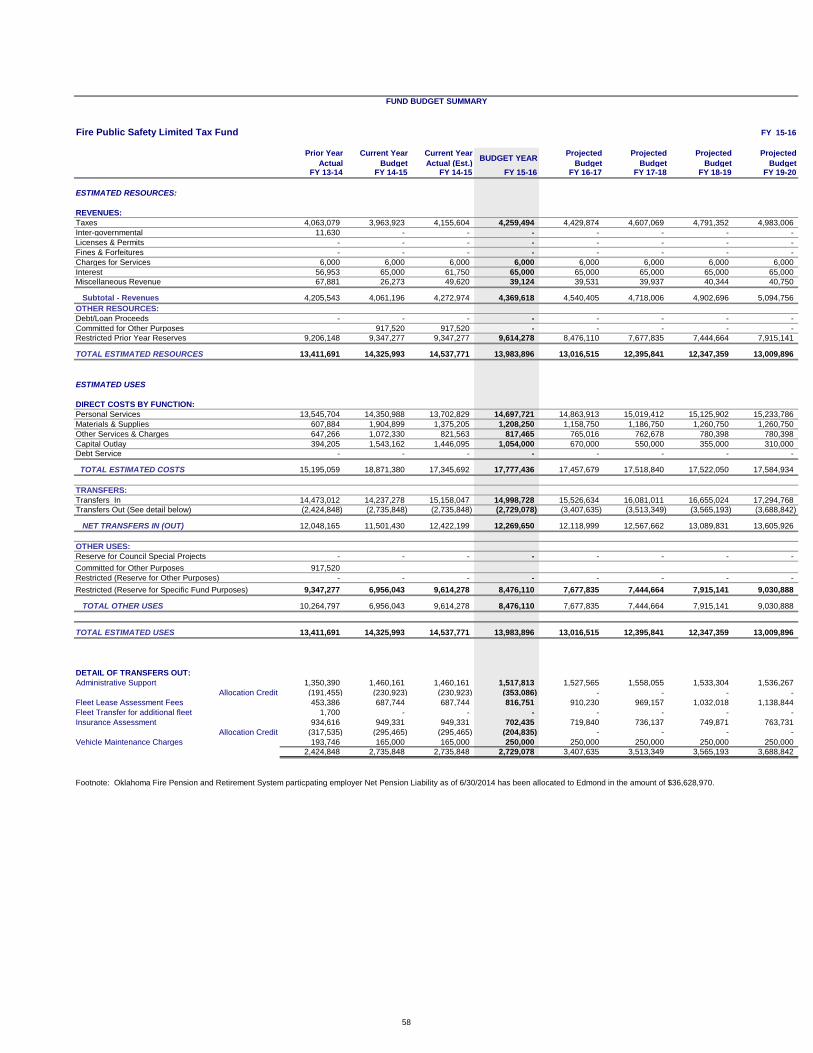
FUND BUDGET SUMMARY
Fire Public Safety Limited Tax Fund FY 15-16
Prior Year
Actual
Current Year
Budget
Current Year
Actual (Est.)BUDGET YEAR
Projected
Budget
Projected
Budget
Projected
Budget
Projected
BudgetFY 13-14 FY 14-15 FY 14-15 FY 15-16 FY 16-17 FY 17-18 FY 18-19 FY 19-20
ESTIMATED RESOURCES:
REVENUES:
Taxes 4,063,079 3,963,923 4,155,604 4,259,494 4,429,874 4,607,069 4,791,352 4,983,006
Inter-governmental 11,630 - - - - - - -
Licenses & Permits - - - - - - - -
Fines & Forfeitures - - - - - - - -
Charges for Services 6,000 6,000 6,000 6,000 6,000 6,000 6,000 6,000
Interest 56,953 65,000 61,750 65,000 65,000 65,000 65,000 65,000
Miscellaneous Revenue 67,881 26,273 49,620 39,124 39,531 39,937 40,344 40,750
Subtotal - Revenues 4,205,543 4,061,196 4,272,974 4,369,618 4,540,405 4,718,006 4,902,696 5,094,756
OTHER RESOURCES:
Debt/Loan Proceeds - - - - - - - -
Committed for Other Purposes 917,520 917,520 - - - - -
Restricted Prior Year Reserves 9,206,148 9,347,277 9,347,277 9,614,278 8,476,110 7,677,835 7,444,664 7,915,141
TOTAL ESTIMATED RESOURCES 13,411,691 14,325,993 14,537,771 13,983,896 13,016,515 12,395,841 12,347,359 13,009,896
ESTIMATED USES
DIRECT COSTS BY FUNCTION:
Personal Services 13,545,704 14,350,988 13,702,829 14,697,721 14,863,913 15,019,412 15,125,902 15,233,786
Materials & Supplies 607,884 1,904,899 1,375,205 1,208,250 1,158,750 1,186,750 1,260,750 1,260,750
Other Services & Charges 647,266 1,072,330 821,563 817,465 765,016 762,678 780,398 780,398
Capital Outlay 394,205 1,543,162 1,446,095 1,054,000 670,000 550,000 355,000 310,000
Debt Service - - - - - - - -
TOTAL ESTIMATED COSTS 15,195,059 18,871,380 17,345,692 17,777,436 17,457,679 17,518,840 17,522,050 17,584,934
TRANSFERS:
Transfers In 14,473,012 14,237,278 15,158,047 14,998,728 15,526,634 16,081,011 16,655,024 17,294,768
Transfers Out (See detail below) (2,424,848) (2,735,848) (2,735,848) (2,729,078) (3,407,635) (3,513,349) (3,565,193) (3,688,842)
NET TRANSFERS IN (OUT) 12,048,165 11,501,430 12,422,199 12,269,650 12,118,999 12,567,662 13,089,831 13,605,926
OTHER USES:
Reserve for Council Special Projects - - - - - - - -
Committed for Other Purposes 917,520
Restricted (Reserve for Other Purposes) - - - - - - - -
Restricted (Reserve for Specific Fund Purposes) 9,347,277 6,956,043 9,614,278 8,476,110 7,677,835 7,444,664 7,915,141 9,030,888
TOTAL OTHER USES 10,264,797 6,956,043 9,614,278 8,476,110 7,677,835 7,444,664 7,915,141 9,030,888
TOTAL ESTIMATED USES 13,411,691 14,325,993 14,537,771 13,983,896 13,016,515 12,395,841 12,347,359 13,009,896
DETAIL OF TRANSFERS OUT:
Administrative Support 1,350,390 1,460,161 1,460,161 1,517,813 1,527,565 1,558,055 1,533,304 1,536,267
Allocation Credit (191,455) (230,923) (230,923) (353,086) - - - -
Fleet Lease Assessment Fees 453,386 687,744 687,744 816,751 910,230 969,157 1,032,018 1,138,844
Fleet Transfer for additional fleet 1,700 - - - - - - -
Insurance Assessment 934,616 949,331 949,331 702,435 719,840 736,137 749,871 763,731
Allocation Credit (317,535) (295,465) (295,465) (204,835) - - - -
Vehicle Maintenance Charges 193,746 165,000 165,000 250,000 250,000 250,000 250,000 250,000
2,424,848 2,735,848 2,735,848 2,729,078 3,407,635 3,513,349 3,565,193 3,688,842
Footnote: Oklahoma Fire Pension and Retirement System particpating employer Net Pension Liability as of 6/30/2014 has been allocated to Edmond in the amount of $36,628,970.
58
59
Police Department
2015-2016
Department Summary
D E P A R T M E N T A L D E S C R I P T I O N
The mission of the Edmond Police Department is: “Trustworthy Service”. We work hard to
maintain a good relationship with the community, which in turn allows us to provide a higher
degree of service. Some of the ways we do this is with Community Oriented Policing and the
Citizen’s Police Academy. Through these venues the citizens can begin to get an
understanding of the complexities encountered policing the City of Edmond. The citizens get
to know the Officers and feel they have someone they can call if they have problems or a
question. This cooperation and trust is critical to accomplishing the mission.
G O A L S
1. Provide a Safe Community Environment
2. Deliver Trustworthy Service
3. Maintain High Levels of Professionalism
4. Expand Community Partnerships
S T A F F I N G (FT-PT-S)
Current Level Year 1 Year 2 Year 3 Year 4 Year 5
157-0-0 159-0-0 159-0-0 161-0-0 162-0-0 164-0-0 *Includes Special Services, Patrol, Investigations, and Animal Welfare.
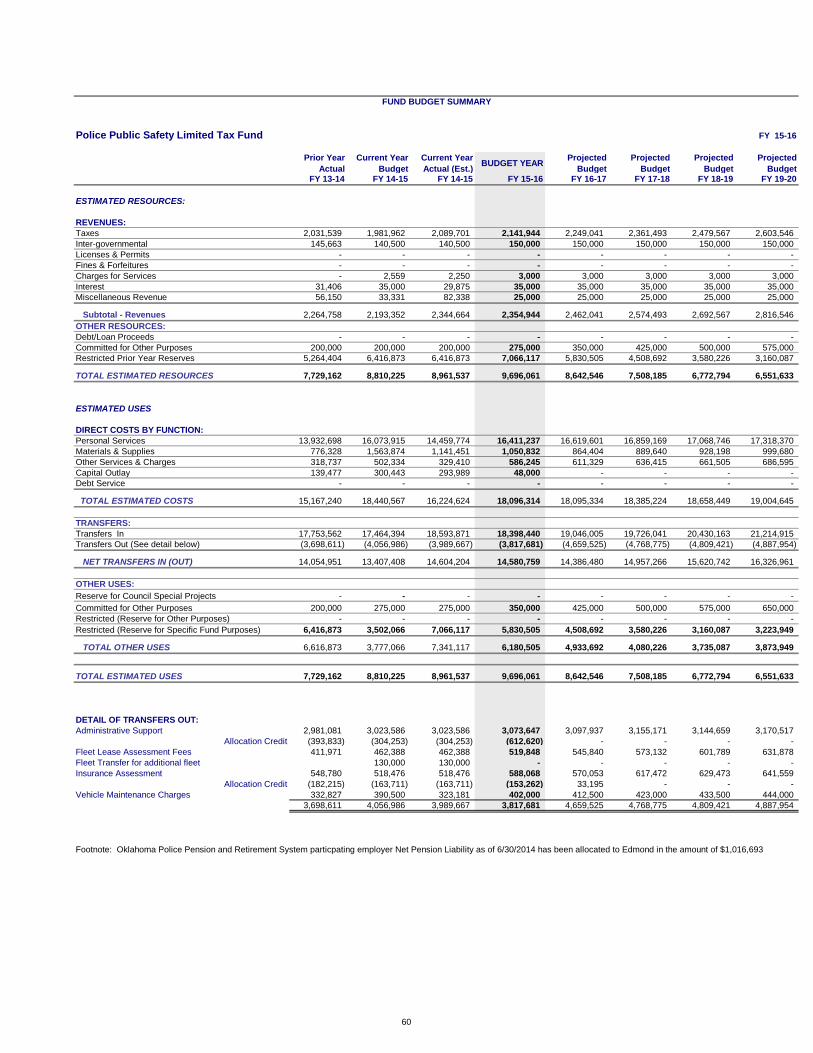
FUND BUDGET SUMMARY
Police Public Safety Limited Tax Fund FY 15-16
Prior Year
Actual
Current Year
Budget
Current Year
Actual (Est.)BUDGET YEAR
Projected
Budget
Projected
Budget
Projected
Budget
Projected
BudgetFY 13-14 FY 14-15 FY 14-15 FY 15-16 FY 16-17 FY 17-18 FY 18-19 FY 19-20
ESTIMATED RESOURCES:
REVENUES:
Taxes 2,031,539 1,981,962 2,089,701 2,141,944 2,249,041 2,361,493 2,479,567 2,603,546
Inter-governmental 145,663 140,500 140,500 150,000 150,000 150,000 150,000 150,000
Licenses & Permits - - - - - - - -
Fines & Forfeitures - - - - - - - -
Charges for Services - 2,559 2,250 3,000 3,000 3,000 3,000 3,000
Interest 31,406 35,000 29,875 35,000 35,000 35,000 35,000 35,000
Miscellaneous Revenue 56,150 33,331 82,338 25,000 25,000 25,000 25,000 25,000
Subtotal - Revenues 2,264,758 2,193,352 2,344,664 2,354,944 2,462,041 2,574,493 2,692,567 2,816,546
OTHER RESOURCES:
Debt/Loan Proceeds - - - - - - - -
Committed for Other Purposes 200,000 200,000 200,000 275,000 350,000 425,000 500,000 575,000
Restricted Prior Year Reserves 5,264,404 6,416,873 6,416,873 7,066,117 5,830,505 4,508,692 3,580,226 3,160,087
TOTAL ESTIMATED RESOURCES 7,729,162 8,810,225 8,961,537 9,696,061 8,642,546 7,508,185 6,772,794 6,551,633
ESTIMATED USES
DIRECT COSTS BY FUNCTION:
Personal Services 13,932,698 16,073,915 14,459,774 16,411,237 16,619,601 16,859,169 17,068,746 17,318,370
Materials & Supplies 776,328 1,563,874 1,141,451 1,050,832 864,404 889,640 928,198 999,680
Other Services & Charges 318,737 502,334 329,410 586,245 611,329 636,415 661,505 686,595
Capital Outlay 139,477 300,443 293,989 48,000 - - - -
Debt Service - - - - - - - -
TOTAL ESTIMATED COSTS 15,167,240 18,440,567 16,224,624 18,096,314 18,095,334 18,385,224 18,658,449 19,004,645
TRANSFERS:
Transfers In 17,753,562 17,464,394 18,593,871 18,398,440 19,046,005 19,726,041 20,430,163 21,214,915
Transfers Out (See detail below) (3,698,611) (4,056,986) (3,989,667) (3,817,681) (4,659,525) (4,768,775) (4,809,421) (4,887,954)
NET TRANSFERS IN (OUT) 14,054,951 13,407,408 14,604,204 14,580,759 14,386,480 14,957,266 15,620,742 16,326,961
OTHER USES:
Reserve for Council Special Projects - - - - - - - -
Committed for Other Purposes 200,000 275,000 275,000 350,000 425,000 500,000 575,000 650,000
Restricted (Reserve for Other Purposes) - - - - - - - -
Restricted (Reserve for Specific Fund Purposes) 6,416,873 3,502,066 7,066,117 5,830,505 4,508,692 3,580,226 3,160,087 3,223,949
TOTAL OTHER USES 6,616,873 3,777,066 7,341,117 6,180,505 4,933,692 4,080,226 3,735,087 3,873,949
TOTAL ESTIMATED USES 7,729,162 8,810,225 8,961,537 9,696,061 8,642,546 7,508,185 6,772,794 6,551,633
DETAIL OF TRANSFERS OUT:
Administrative Support 2,981,081 3,023,586 3,023,586 3,073,647 3,097,937 3,155,171 3,144,659 3,170,517
Allocation Credit (393,833) (304,253) (304,253) (612,620) - - - -
Fleet Lease Assessment Fees 411,971 462,388 462,388 519,848 545,840 573,132 601,789 631,878
Fleet Transfer for additional fleet 130,000 130,000 - - - - -
Insurance Assessment 548,780 518,476 518,476 588,068 570,053 617,472 629,473 641,559
Allocation Credit (182,215) (163,711) (163,711) (153,262) 33,195 - - -
Vehicle Maintenance Charges 332,827 390,500 323,181 402,000 412,500 423,000 433,500 444,000
3,698,611 4,056,986 3,989,667 3,817,681 4,659,525 4,768,775 4,809,421 4,887,954
Footnote: Oklahoma Police Pension and Retirement System particpating employer Net Pension Liability as of 6/30/2014 has been allocated to Edmond in the amount of $1,016,693
60

61
Hospital Sale Trust Fund
2015-2016
Departmental Summary
D E P A R T M E N T A L D E S C R I P T I O N
This fund accounts for the proceeds received from the 1981 sale of the Edmond Memorial Hospital. Its only revenue source is interest earnings from the investment of the proceeds. The interest earnings may be used for capital improvements as determined by the City Council and the proceeds may be used for projects only as approved by a vote of the citizens of Edmond.
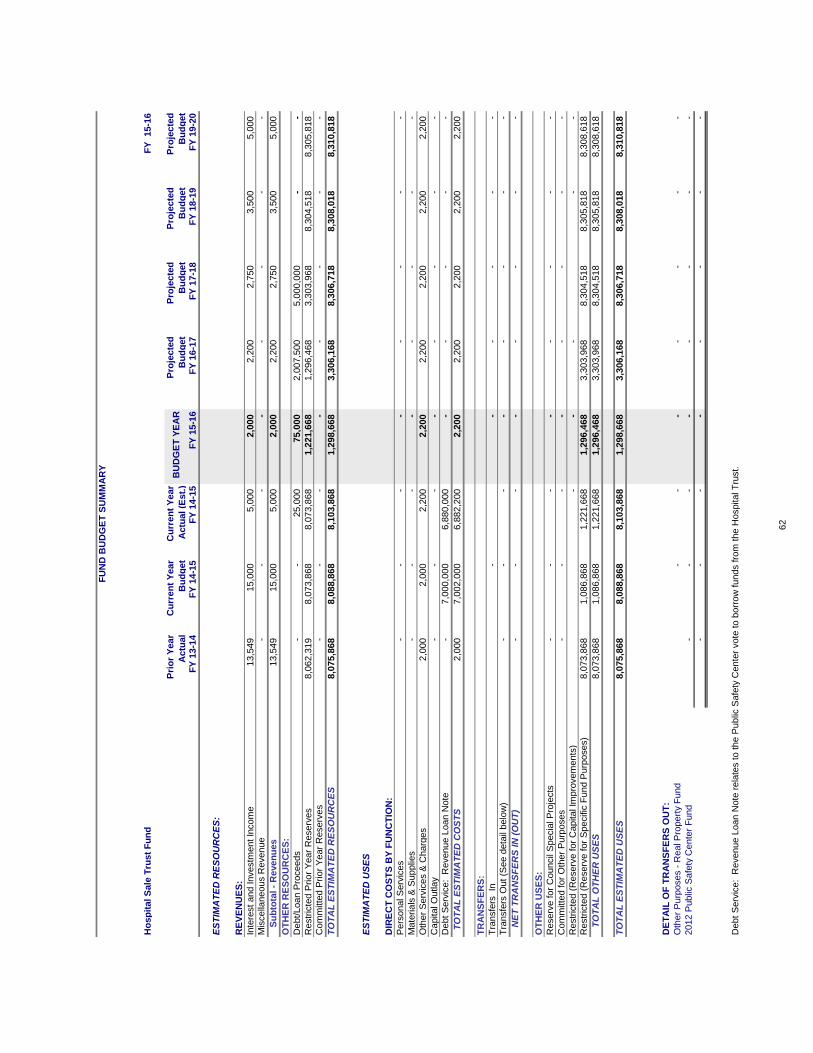
FU
ND
BU
DG
ET
SU
MM
AR
Y
Ho
sp
ital S
ale
Tru
st
Fu
nd
FY
15-1
6
Pri
or
Year
Actu
al
Cu
rren
t Y
ear
Bu
dg
et
Cu
rren
t Y
ear
Actu
al (E
st.
)B
UD
GE
T Y
EA
RP
roje
cte
d
Bu
dg
et
Pro
jecte
d
Bu
dg
et
Pro
jecte
d
Bu
dg
et
Pro
jecte
d
Bu
dg
et
FY
13-1
4F
Y 1
4-1
5F
Y 1
4-1
5F
Y 1
5-1
6F
Y 1
6-1
7F
Y 1
7-1
8F
Y 1
8-1
9F
Y 1
9-2
0
ES
TIM
AT
ED
RE
SO
UR
CE
S:
RE
VE
NU
ES
:
Inte
rest and Investm
ent In
com
e13,5
49
15,0
00
5,0
00
2,0
00
2,2
00
2,7
50
3,5
00
5,0
00
Mis
cella
neous R
evenue
-
-
-
-
-
-
-
-
S
ub
tota
l -
Reven
ues
13,5
49
15,0
00
5,0
00
2,0
00
2,2
00
2,7
50
3,5
00
5,0
00
OT
HE
R R
ES
OU
RC
ES
:
Debt/Loan P
roceeds
-
-
25,0
00
75,0
00
2,0
07,5
00
5,0
00,0
00
-
-
Restr
icte
d P
rior
Year
Reserv
es
8,0
62,3
19
8,0
73,8
68
8,0
73,8
68
1,2
21,6
68
1,2
96,4
68
3,3
03,9
68
8,3
04,5
18
8,3
05,8
18
Com
mitte
d P
rior
Year
Reserv
es
-
-
-
-
-
-
-
-
TO
TA
L E
ST
IMA
TE
D R
ES
OU
RC
ES
8,0
75,8
68
8,0
88,8
68
8,1
03,8
68
1,2
98,6
68
3,3
06,1
68
8,3
06,7
18
8,3
08,0
18
8,3
10,8
18
ES
TIM
AT
ED
US
ES
DIR
EC
T C
OS
TS
BY
FU
NC
TIO
N:
Pers
onal S
erv
ices
-
-
-
-
-
-
-
-
Mate
rials
& S
upplie
s-
-
-
-
-
-
-
-
Oth
er
Serv
ices &
Charg
es
2,0
00
2,0
00
2,2
00
2,2
00
2,2
00
2,2
00
2,2
00
2,2
00
Capital O
utlay
-
-
-
-
-
-
-
-
Debt S
erv
ice: R
evenue L
oan N
ote
-
7,0
00,0
00
6,8
80,0
00
-
-
-
-
-
T
OT
AL
ES
TIM
AT
ED
CO
ST
S2,0
00
7,0
02,0
00
6,8
82,2
00
2,2
00
2,2
00
2,2
00
2,2
00
2,2
00
TR
AN
SF
ER
S:
Tra
nsfe
rs In
-
-
-
-
-
-
Tra
nsfe
rs O
ut (S
ee d
eta
il belo
w)
-
-
-
-
-
-
-
-
N
ET
TR
AN
SF
ER
S IN
(O
UT
)-
-
-
-
-
-
-
-
OT
HE
R U
SE
S:
Reserv
e for
Council
Specia
l P
roje
cts
-
-
-
-
-
-
-
-
Com
mitte
d for
Oth
er
Purp
oses
-
-
-
-
-
-
-
-
Restr
icte
d (
Reserv
e for
Capital Im
pro
vem
ents
)-
-
-
-
-
Restr
icte
d (
Reserv
e for
Specific
Fund P
urp
oses)
8,0
73,8
68
1,0
86,8
68
1,2
21,6
68
1,2
96,4
68
3,3
03,9
68
8,3
04,5
18
8,3
05,8
18
8,3
08,6
18
T
OT
AL
OT
HE
R U
SE
S8,0
73,8
68
1,0
86,8
68
1,2
21,6
68
1,2
96,4
68
3,3
03,9
68
8,3
04,5
18
8,3
05,8
18
8,3
08,6
18
TO
TA
L E
ST
IMA
TE
D U
SE
S8,0
75,8
68
8,0
88,8
68
8,1
03,8
68
1,2
98,6
68
3,3
06,1
68
8,3
06,7
18
8,3
08,0
18
8,3
10,8
18
DE
TA
IL O
F T
RA
NS
FE
RS
OU
T:
Oth
er
Purp
oses -
Real P
ropert
y F
und
-
-
-
-
-
-
-
2012 P
ublic
Safe
ty C
ente
r F
und
-
-
-
-
-
-
-
-
-
-
-
-
-
-
-
-
Debt S
erv
ice: R
evenue L
oan N
ote
rela
tes to the P
ublic
Safe
ty C
ente
r vote
to b
orr
ow
funds fro
m the H
ospital T
rust.
62
63
Real Property Fund
2015-2016
Departmental Summary
D E P A R T M E N T A L D E S C R I P T I O N
The Real Property Fund has been established to accumulate resources for future real property acquisitions of the City. Initially financing was provided by a one-time transfer of $463,230 reserved for land acquisition in the Capital Improvements Fund. Current funding is being provided by annual transfers from the Hospital Sale Trust Fund.

FU
ND
BU
DG
ET
SU
MM
AR
Y
Real
Pro
pe
rty F
un
dF
Y
15-1
6
Pri
or
Year
Actu
al
Cu
rren
t Y
ear
Bu
dg
et
Cu
rren
t Y
ear
Actu
al
(Est.
)B
UD
GE
T Y
EA
RP
roje
cte
d
Bu
dg
et
Pro
jecte
d
Bu
dg
et
Pro
jecte
d
Bu
dg
et
Pro
jecte
d
Bu
dg
et
FY
13-1
4F
Y 1
4-1
5F
Y 1
4-1
5F
Y 1
5-1
6F
Y 1
6-1
7F
Y 1
7-1
8F
Y 1
8-1
9F
Y 1
9-2
0
ES
TIM
AT
ED
RE
SO
UR
CE
S:
RE
VE
NU
ES
:
Inte
rest
2,6
46
1,5
00
750
1,0
00
-
-
-
-
-
Mis
cella
neous R
evenue
-
-
-
-
S
ub
tota
l -
Reven
ue
s2,6
46
1,5
00
750
1,0
00
-
-
-
-
OT
HE
R R
ES
OU
RC
ES
:
Debt/
Loan P
roceeds
-
-
-
-
-
-
-
-
Restr
icte
d P
rio
r Y
ear
Reserv
es
402,1
59
152,5
28
152,5
28
153,2
38
-
-
-
-
Com
mitte
d P
rio
r Y
ear
Reserv
es
-
-
-
-
-
-
-
-
TO
TA
L E
ST
IMA
TE
D R
ES
OU
RC
ES
404,8
05
154,0
28
153,2
78
154,2
38
-
-
-
-
ES
TIM
AT
ED
US
ES
DIR
EC
T C
OS
TS
BY
FU
NC
TIO
N:
Pers
onal S
erv
ices
-
-
-
-
-
-
-
-
Mate
ria
ls &
Supplie
s-
-
-
-
-
-
-
-
Oth
er
Serv
ices &
Charg
es
100
75
40
75
Capital O
utla
y252,1
77
100,0
00
-
154,1
63
Debt
Serv
ice
-
-
-
-
-
-
-
-
T
OT
AL
ES
TIM
AT
ED
CO
ST
S252,2
77
100,0
75
40
154,2
38
-
-
-
-
TR
AN
SF
ER
S:
Tra
nsfe
rs
In-
-
-
-
-
-
-
Tra
nsfe
rs O
ut
(See d
eta
il belo
w)
-
-
-
-
-
-
-
N
ET
TR
AN
SF
ER
S IN
(O
UT
)-
-
-
-
-
-
-
-
OT
HE
R U
SE
S:
Reserv
e f
or
Council
Specia
l P
roje
cts
-
-
-
-
-
-
-
-
Com
mitte
d f
or
Oth
er
Purp
oses
-
-
-
-
-
-
-
-
Restr
icte
d (
Reserv
e f
or
Capital Im
pro
vem
ents
)-
-
-
-
-
-
-
-
Restr
icte
d (
Reserv
e f
or
Specific
Fu
nd P
urp
oses)
152,5
28
53,9
53
153,2
38
-
-
-
-
-
T
OT
AL
OT
HE
R U
SE
S152,5
28
53,9
53
153,2
38
-
-
-
-
-
TO
TA
L E
ST
IMA
TE
D U
SE
S404,8
05
154,0
28
153,2
78
154,2
38
-
-
-
-
64
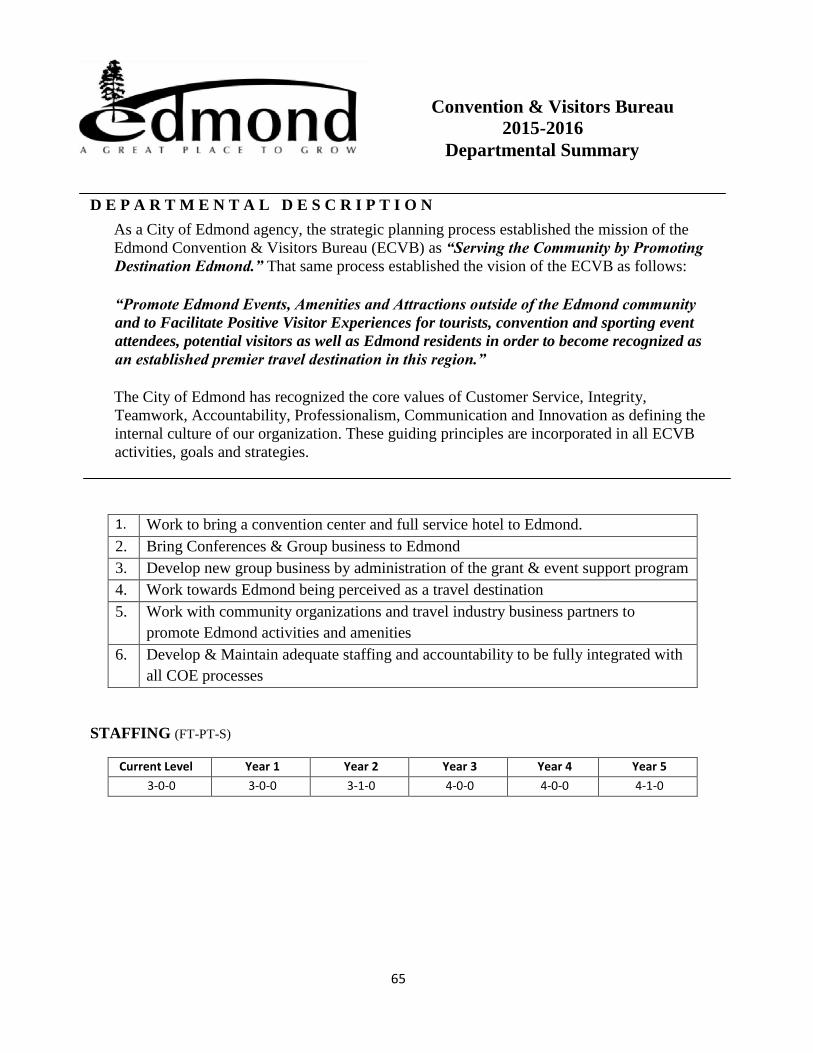
65
Convention & Visitors Bureau
2015-2016
Departmental Summary
D E P A R T M E N T A L D E S C R I P T I O N
As a City of Edmond agency, the strategic planning process established the mission of the Edmond Convention & Visitors Bureau (ECVB) as “Serving the Community by Promoting
Destination Edmond.” That same process established the vision of the ECVB as follows:
“Promote Edmond Events, Amenities and Attractions outside of the Edmond community
and to Facilitate Positive Visitor Experiences for tourists, convention and sporting event
attendees, potential visitors as well as Edmond residents in order to become recognized as
an established premier travel destination in this region.”
The City of Edmond has recognized the core values of Customer Service, Integrity,
Teamwork, Accountability, Professionalism, Communication and Innovation as defining the
internal culture of our organization. These guiding principles are incorporated in all ECVB
activities, goals and strategies.
1. Work to bring a convention center and full service hotel to Edmond.
2. Bring Conferences & Group business to Edmond
3. Develop new group business by administration of the grant & event support program
4. Work towards Edmond being perceived as a travel destination
5. Work with community organizations and travel industry business partners to
promote Edmond activities and amenities
6. Develop & Maintain adequate staffing and accountability to be fully integrated with
all COE processes
STAFFING (FT-PT-S)
Current Level Year 1 Year 2 Year 3 Year 4 Year 5
3-0-0 3-0-0 3-1-0 4-0-0 4-0-0 4-1-0
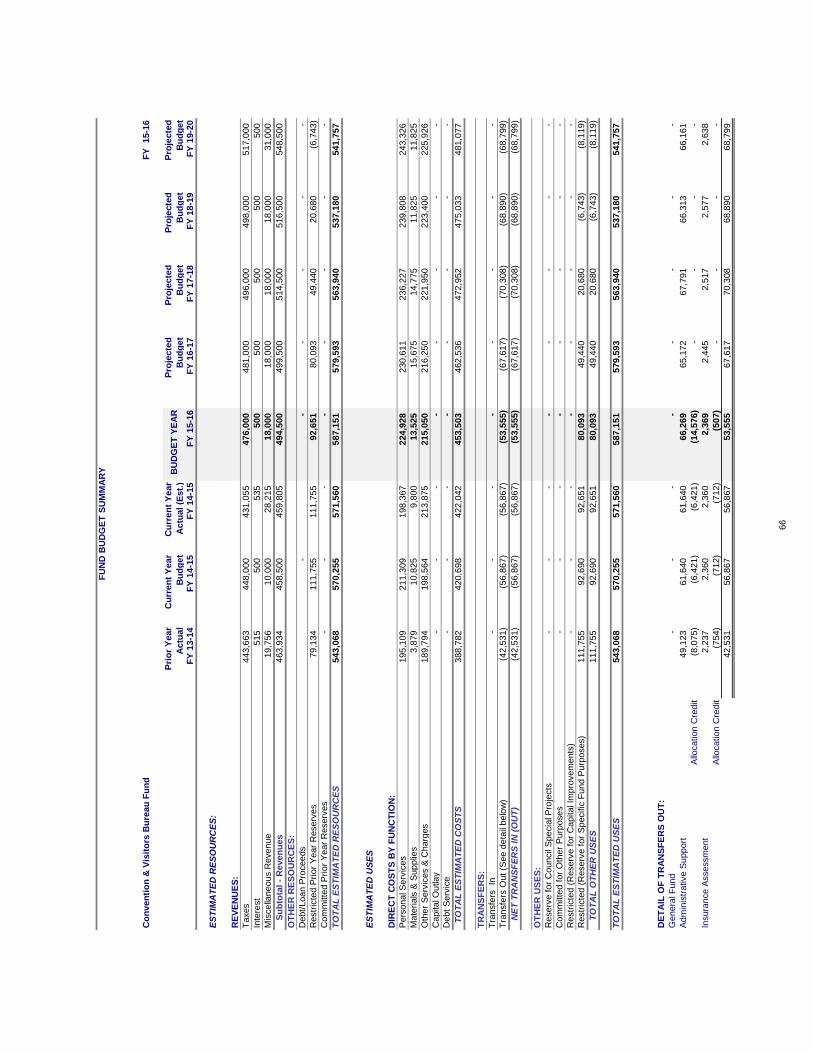
FU
ND
BU
DG
ET
SU
MM
AR
Y
Co
nv
en
tio
n &
Vis
ito
rs B
ure
au
Fu
nd
FY
1
5-1
6
Pri
or
Ye
ar
Ac
tua
l
Cu
rre
nt
Ye
ar
Bu
dg
et
Cu
rre
nt
Ye
ar
Ac
tua
l (E
st.
)B
UD
GE
T Y
EA
RP
roje
cte
d
Bu
dg
et
Pro
jecte
d
Bu
dg
et
Pro
jecte
d
Bu
dg
et
Pro
jecte
d
Bu
dg
et
FY
13-1
4F
Y 1
4-1
5F
Y 1
4-1
5F
Y 1
5-1
6F
Y 1
6-1
7F
Y 1
7-1
8F
Y 1
8-1
9F
Y 1
9-2
0
ES
TIM
AT
ED
RE
SO
UR
CE
S:
RE
VE
NU
ES
:
Ta
xes
443
,663
4
48
,000
4
31
,055
4
76
,000
4
81
,000
4
96
,000
4
98
,000
5
17
,000
Inte
rest
515
500
535
500
500
500
500
500
Mis
ce
llane
ou
s R
eve
nu
e1
9,7
56
1
0,0
00
2
8,2
15
1
8,0
00
1
8,0
00
1
8,0
00
1
8,0
00
3
1,0
00
S
ub
tota
l -
Re
ve
nu
es
463
,934
4
58
,500
4
59
,805
4
94
,500
4
99
,500
5
14
,500
5
16
,500
5
48
,500
OT
HE
R R
ES
OU
RC
ES
:
De
bt/
Loa
n P
rocee
ds
-
-
-
-
-
-
Re
str
icte
d P
rio
r Y
ear
Re
serv
es
79,1
34
1
11
,755
1
11
,755
9
2,6
51
8
0,0
93
4
9,4
40
2
0,6
80
(6
,743
)
Co
mm
itte
d P
rio
r Y
ear
Re
serv
es
-
-
-
-
-
-
-
-
TO
TA
L E
ST
IMA
TE
D R
ES
OU
RC
ES
543
,068
5
70
,255
5
71
,560
5
87
,151
5
79
,593
5
63
,940
5
37
,180
5
41
,757
ES
TIM
AT
ED
US
ES
DIR
EC
T C
OS
TS
BY
FU
NC
TIO
N:
Pe
rso
na
l S
erv
ice
s1
95
,109
2
11
,309
1
98
,367
2
24
,928
2
30
,611
2
36
,227
2
39
,808
2
43
,326
Ma
teri
als
& S
upp
lies
3,8
79
10,8
25
9
,800
13,5
25
1
5,6
75
1
4,7
75
1
1,8
25
1
1,8
25
Oth
er
Se
rvic
es &
Ch
arg
es
189
,794
1
98
,564
2
13
,875
2
15
,050
2
16
,250
2
21
,950
2
23
,400
2
25
,926
Ca
pita
l O
utla
y-
-
-
-
-
-
-
-
De
bt
Se
rvic
e-
-
-
-
-
-
-
-
T
OT
AL
ES
TIM
AT
ED
CO
ST
S3
88
,782
4
20
,698
4
22
,042
4
53
,503
4
62
,536
4
72
,952
4
75
,033
4
81
,077
TR
AN
SF
ER
S:
Tra
nsfe
rs
In-
-
-
-
-
-
-
-
Tra
nsfe
rs O
ut
(Se
e d
eta
il b
elo
w)
(42,5
31
)
(56,8
67
)
(56,8
67
)
(53,5
55
)
(67,6
17
)
(70,3
08
)
(68,8
90
)
(68,7
99
)
N
ET
TR
AN
SF
ER
S I
N (
OU
T)
(42,5
31
)
(56,8
67
)
(56,8
67
)
(53,5
55
)
(67,6
17
)
(70,3
08
)
(68,8
90
)
(68,7
99
)
OT
HE
R U
SE
S:
Re
serv
e f
or
Co
un
cil
Sp
ecia
l P
roje
cts
-
-
-
-
-
-
-
-
Co
mm
itte
d f
or
Oth
er
Pu
rpose
s-
-
-
-
-
-
-
-
Re
str
icte
d (
Re
serv
e f
or
Ca
pita
l Im
pro
ve
me
nts
)-
-
-
-
-
-
-
-
Re
str
icte
d (
Re
serv
e f
or
Sp
ecific
Fu
nd
Pu
rpose
s)
111
,755
9
2,6
90
9
2,6
51
8
0,0
93
4
9,4
40
2
0,6
80
(6
,743
)
(8
,119
)
T
OT
AL
OT
HE
R U
SE
S1
11
,755
9
2,6
90
9
2,6
51
8
0,0
93
4
9,4
40
2
0,6
80
(6
,743
)
(8
,119
)
TO
TA
L E
ST
IMA
TE
D U
SE
S5
43
,068
5
70
,255
5
71
,560
5
87
,151
5
79
,593
5
63
,940
5
37
,180
5
41
,757
DE
TA
IL O
F T
RA
NS
FE
RS
OU
T:
Ge
ne
ral F
und
-
-
-
-
-
-
-
-
Ad
min
istr
ative
Su
pp
ort
49,1
23
6
1,6
40
6
1,6
40
6
6,2
69
6
5,1
72
6
7,7
91
6
6,3
13
6
6,1
61
Allo
catio
n C
redit
(8,0
75
)
(6
,421
)
(6
,421
)
(1
4,5
76
)
-
-
-
-
Insura
nce
Asse
ssm
ent
2,2
37
2,3
60
2,3
60
2,3
69
2,4
45
2,5
17
2,5
77
2,6
38
Allo
catio
n C
redit
(754
)
(712
)
(712
)
(507
)
-
-
-
-
42,5
31
5
6,8
67
5
6,8
67
5
3,5
55
6
7,6
17
7
0,3
08
6
8,8
90
6
8,7
99
66
67
Ambulatory Services Fund
2015-2016
Departmental Summary
D E P A R T M E N T A L D E S C R I P T I O N
The Ambulatory Services Fund provides funding of the City of Edmond’s Ambulance Services through the regional Emergency Medical Services Authority (EMSA). It primarily covers those citizens who have elected to participate in the TotalCare Program which began in FY09-10.
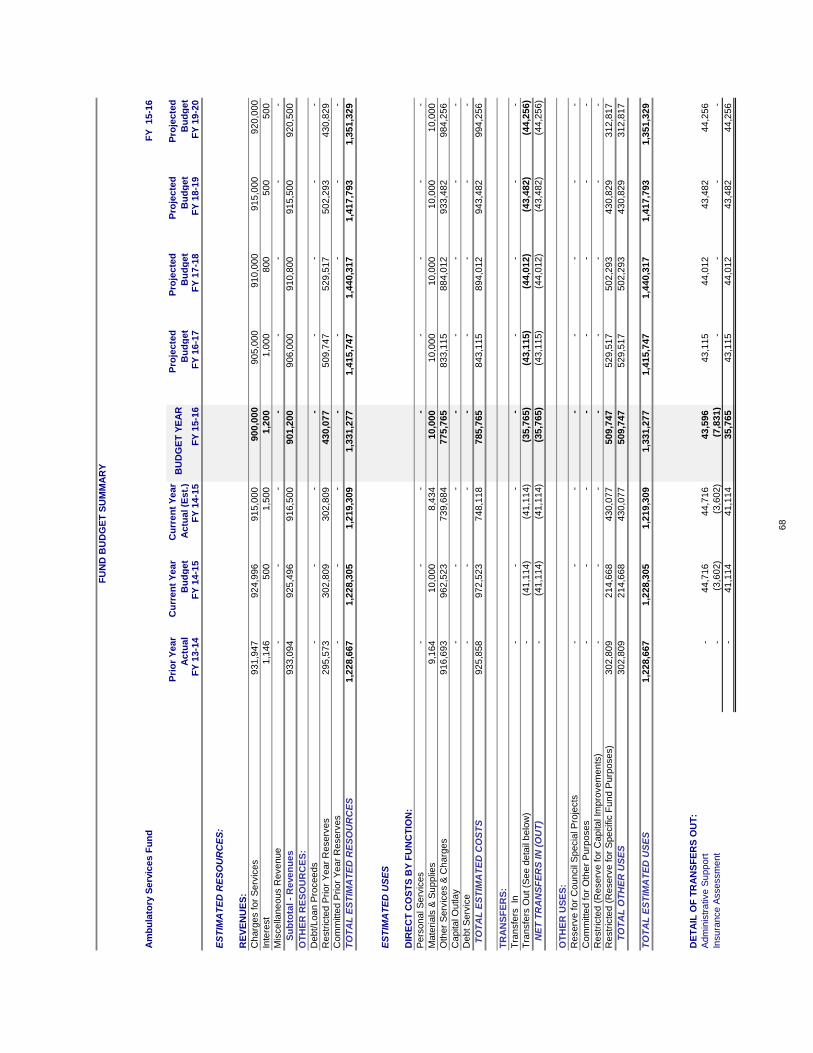
FU
ND
BU
DG
ET
SU
MM
AR
Y
Am
bu
lato
ry S
erv
ice
s F
un
dF
Y 1
5-1
6
Pri
or
Ye
ar
Ac
tua
l
Cu
rre
nt
Ye
ar
Bu
dg
et
Cu
rre
nt
Ye
ar
Ac
tua
l (E
st.
)B
UD
GE
T Y
EA
RP
roje
cte
d
Bu
dg
et
Pro
jec
ted
Bu
dg
et
Pro
jec
ted
Bu
dg
et
Pro
jec
ted
Bu
dg
et
FY
13
-14
FY
14
-15
FY
14
-15
FY
15
-16
FY
16
-17
FY
17
-18
FY
18
-19
FY
19
-20
ES
TIM
AT
ED
RE
SO
UR
CE
S:
RE
VE
NU
ES
:
Ch
arg
es f
or
Se
rvic
es
93
1,9
47
92
4,9
96
91
5,0
00
90
0,0
00
90
5,0
00
91
0,0
00
91
5,0
00
92
0,0
00
Inte
rest
1,1
46
50
0
1,5
00
1,2
00
1,0
00
80
0
50
0
50
0
Mis
ce
llan
eo
us R
eve
nu
e-
-
-
-
-
-
-
-
S
ub
tota
l -
Re
ve
nu
es
93
3,0
94
92
5,4
96
91
6,5
00
90
1,2
00
90
6,0
00
91
0,8
00
91
5,5
00
92
0,5
00
OT
HE
R R
ES
OU
RC
ES
:
De
bt/L
oa
n P
roce
ed
s-
-
-
-
-
-
-
-
Re
str
icte
d P
rio
r Y
ea
r R
ese
rve
s2
95
,57
3
30
2,8
09
30
2,8
09
43
0,0
77
50
9,7
47
52
9,5
17
50
2,2
93
43
0,8
29
Co
mm
itte
d P
rio
r Y
ea
r R
ese
rve
s-
-
-
-
-
-
-
-
TO
TA
L E
ST
IMA
TE
D R
ES
OU
RC
ES
1,2
28
,66
7
1,2
28
,30
5
1,2
19
,30
9
1,3
31
,27
7
1,4
15
,74
7
1,4
40
,31
7
1,4
17
,79
3
1,3
51
,32
9
ES
TIM
AT
ED
US
ES
DIR
EC
T C
OS
TS
BY
FU
NC
TIO
N:
Pe
rso
na
l S
erv
ice
s-
-
-
-
-
-
-
-
Ma
teri
als
& S
up
plie
s9
,16
4
10
,00
0
8,4
34
10
,00
0
10
,00
0
10
,00
0
10
,00
0
10
,00
0
Oth
er
Se
rvic
es &
Ch
arg
es
91
6,6
93
96
2,5
23
73
9,6
84
77
5,7
65
83
3,1
15
88
4,0
12
93
3,4
82
98
4,2
56
Ca
pita
l O
utla
y-
-
-
-
-
-
-
-
De
bt S
erv
ice
-
-
-
-
-
-
-
-
T
OT
AL
ES
TIM
AT
ED
CO
ST
S9
25
,85
8
97
2,5
23
74
8,1
18
78
5,7
65
84
3,1
15
89
4,0
12
94
3,4
82
99
4,2
56
TR
AN
SF
ER
S:
Tra
nsfe
rs In
-
-
-
-
-
-
-
-
Tra
nsfe
rs O
ut (S
ee
de
tail
be
low
)-
(41
,11
4)
(41
,11
4)
(35
,76
5)
(43
,11
5)
(44
,01
2)
(43
,48
2)
(44
,25
6)
N
ET
TR
AN
SF
ER
S IN
(O
UT
)-
(41
,11
4)
(41
,11
4)
(35
,76
5)
(43
,11
5)
(44
,01
2)
(43
,48
2)
(44
,25
6)
OT
HE
R U
SE
S:
Re
se
rve
fo
r C
ou
ncil
Sp
ecia
l P
roje
cts
-
-
-
-
-
-
-
-
Co
mm
itte
d f
or
Oth
er
Pu
rpo
se
s-
-
-
-
-
-
-
-
Re
str
icte
d (
Re
se
rve
fo
r C
ap
ita
l Im
pro
ve
me
nts
)-
-
-
-
-
-
-
-
Re
str
icte
d (
Re
se
rve
fo
r S
pe
cific
Fu
nd
Pu
rpo
se
s)
30
2,8
09
21
4,6
68
43
0,0
77
50
9,7
47
52
9,5
17
50
2,2
93
43
0,8
29
31
2,8
17
T
OT
AL
OT
HE
R U
SE
S3
02
,80
9
21
4,6
68
43
0,0
77
50
9,7
47
52
9,5
17
50
2,2
93
43
0,8
29
31
2,8
17
TO
TA
L E
ST
IMA
TE
D U
SE
S1
,22
8,6
67
1,2
28
,30
5
1,2
19
,30
9
1,3
31
,27
7
1,4
15
,74
7
1,4
40
,31
7
1,4
17
,79
3
1,3
51
,32
9
DE
TA
IL O
F T
RA
NS
FE
RS
OU
T:
Ad
min
istr
ative
Su
pp
ort
-
44
,71
6
44
,71
6
43
,59
6
43
,11
5
44
,01
2
43
,48
2
44
,25
6
Insu
ran
ce
Asse
ssm
en
t-
(3,6
02
)
(3,6
02
)
(7,8
31
)
-
-
-
-
-
41
,11
4
41
,11
4
35
,76
5
43
,11
5
44
,01
2
43
,48
2
44
,25
6
68


Capital Project Funds
Tab

Capital Project Funds - Sub-Directory
Capital Improvement Fund – Description 69 Capital Improvement Fund - Summary 70 Roadway Improvement Fund - Description 71 Roadway Improvement Fund - Budget Summary 72 1996 Capital Improvement Tax Fund – Description 73 1996 Capital Improvement Tax Fund – Budget Summary 74 Art In Public Places Fund – Description 75 Art In Public Places Fund – Budget Summary 76 Cemetery Care Fund – Description 77 Cemetery Care Fund – Budget Summary 78 Park Tax Fund – Description 79 Park Tax Fund – Budget Summary 80 2000 Capital Improvement Tax Fund – Description 81 2000 Capital Improvement Tax Fund – Budget Summary 82 2012 Public Safety Center-Capital Imp. Tax Fund – Description 83 2012 Public Safety Center-Capital Imp. Tax Fund – Budget Summary 84
69
Capital Improvement Fund
2015-2016
Departmental Summary
D E P A R T M E N T A L D E S C R I P T I O N
The Capital Improvements Fund has been established to account for major capital improvements and ADA (Americans with Disability Act) projects that are financed by the General Fund and other designated sources.
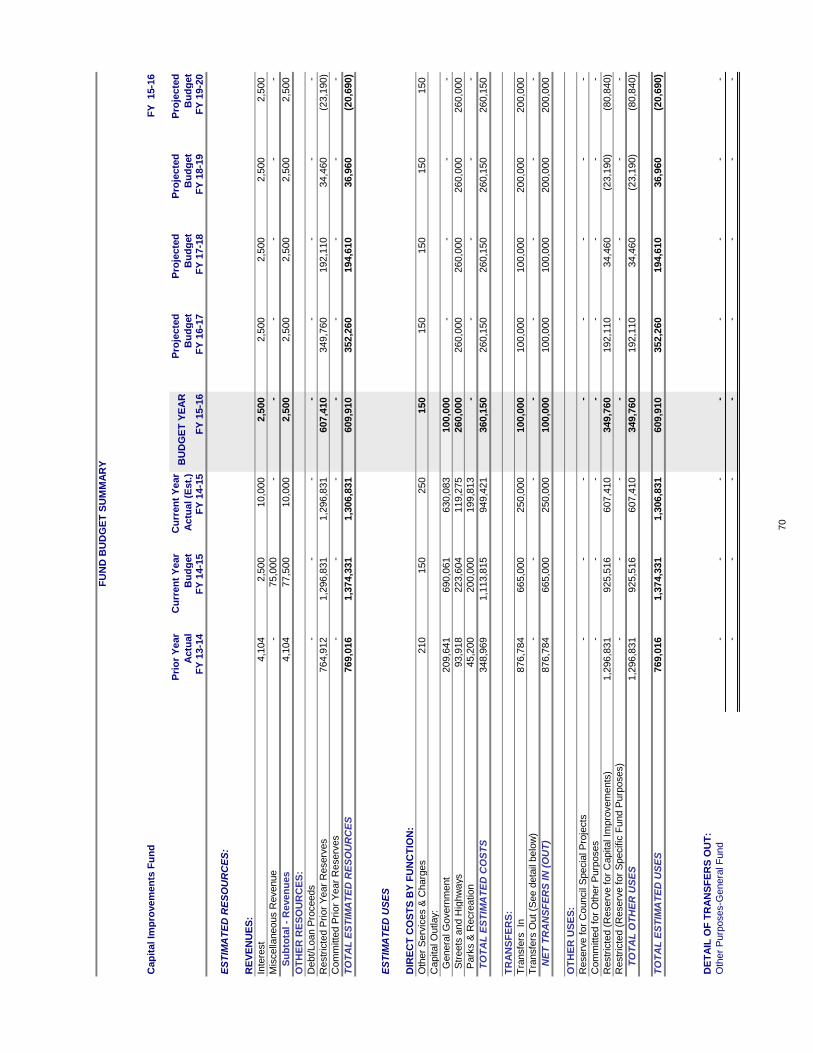
FU
ND
BU
DG
ET
SU
MM
AR
Y
Cap
ital Im
pro
vem
en
ts F
un
dF
Y 15-1
6
Pri
or
Year
Actu
al
Cu
rren
t Y
ear
Bu
dg
et
Cu
rren
t Y
ear
Actu
al (E
st.
)B
UD
GE
T Y
EA
RP
roje
cte
d
Bu
dg
et
Pro
jecte
d
Bu
dg
et
Pro
jecte
d
Bu
dg
et
Pro
jecte
d
Bu
dg
et
FY
13-1
4F
Y 1
4-1
5F
Y 1
4-1
5F
Y 1
5-1
6F
Y 1
6-1
7F
Y 1
7-1
8F
Y 1
8-1
9F
Y 1
9-2
0
ES
TIM
AT
ED
RE
SO
UR
CE
S:
RE
VE
NU
ES
:
Inte
rest
4,1
04
2,5
00
10,0
00
2,5
00
2,5
00
2,5
00
2,5
00
2,5
00
Mis
cella
neous R
evenue
-
75,0
00
-
-
-
-
-
-
S
ub
tota
l -
Reven
ues
4,1
04
77,5
00
10,0
00
2,5
00
2,5
00
2,5
00
2,5
00
2,5
00
OT
HE
R R
ES
OU
RC
ES
:
Debt/Loan P
roceeds
-
-
-
-
-
-
-
-
Restr
icte
d P
rior
Year
Reserv
es
764,9
12
1,2
96,8
31
1,2
96,8
31
607,4
10
349,7
60
192,1
10
34,4
60
(23,1
90)
Com
mitte
d P
rior
Year
Reserv
es
-
-
-
-
-
-
-
-
TO
TA
L E
ST
IMA
TE
D R
ES
OU
RC
ES
769,0
16
1,3
74,3
31
1,3
06,8
31
609,9
10
352,2
60
194,6
10
36,9
60
(20,6
90)
ES
TIM
AT
ED
US
ES
DIR
EC
T C
OS
TS
BY
FU
NC
TIO
N:
Oth
er
Serv
ices &
Charg
es
210
150
250
150
150
150
150
150
Capital O
utlay:
G
enera
l G
overn
ment
209,6
41
690,0
61
630,0
83
100,0
00
-
-
-
-
S
treets
and H
ighw
ays
93,9
18
223,6
04
119,2
75
260,0
00
260,0
00
260,0
00
260,0
00
260,0
00
P
ark
s &
Recre
ation
45,2
00
200,0
00
199,8
13
-
-
-
-
-
T
OT
AL
ES
TIM
AT
ED
CO
ST
S348,9
69
1,1
13,8
15
949,4
21
360,1
50
260,1
50
260,1
50
260,1
50
260,1
50
TR
AN
SF
ER
S:
Tra
nsfe
rs In
876,7
84
665,0
00
250,0
00
100,0
00
100,0
00
100,0
00
200,0
00
200,0
00
Tra
nsfe
rs O
ut (S
ee d
eta
il belo
w)
-
-
-
-
-
-
-
-
N
ET
TR
AN
SF
ER
S IN
(O
UT
)876,7
84
665,0
00
250,0
00
100,0
00
100,0
00
100,0
00
200,0
00
200,0
00
OT
HE
R U
SE
S:
Reserv
e f
or
Council
Specia
l P
roje
cts
-
-
-
-
-
-
-
-
Com
mitte
d f
or
Oth
er
Purp
oses
-
-
-
-
-
-
-
-
Restr
icte
d (
Reserv
e f
or
Capital Im
pro
vem
ents
)1,2
96,8
31
925,5
16
607,4
10
349,7
60
192,1
10
34,4
60
(23,1
90)
(80,8
40)
Restr
icte
d (
Reserv
e f
or
Specific
Fund P
urp
oses)
-
-
-
-
-
-
-
-
T
OT
AL
OT
HE
R U
SE
S1,2
96,8
31
925,5
16
607,4
10
349,7
60
192,1
10
34,4
60
(23,1
90)
(80,8
40)
TO
TA
L E
ST
IMA
TE
D U
SE
S769,0
16
1,3
74,3
31
1,3
06,8
31
609,9
10
352,2
60
194,6
10
36,9
60
(20,6
90)
DE
TA
IL O
F T
RA
NS
FE
RS
OU
T:
Oth
er
Purp
oses-G
enera
l F
und
-
-
-
-
-
-
-
-
-
-
-
-
-
-
-
-
70
71
Roadway Improvements Fund
2015-2016
Departmental Summary
D E P A R T M E N T A L D E S C R I P T I O N
The Roadway Improvements Fund has been established to account for street construction and improvement projects as approved by the voters on May 10, 1994. The improvements were financed by a temporary seven-eight cent sales tax totaling $2,495,703. The remaining funds are planned to be expended in the Budget year for street improvements.
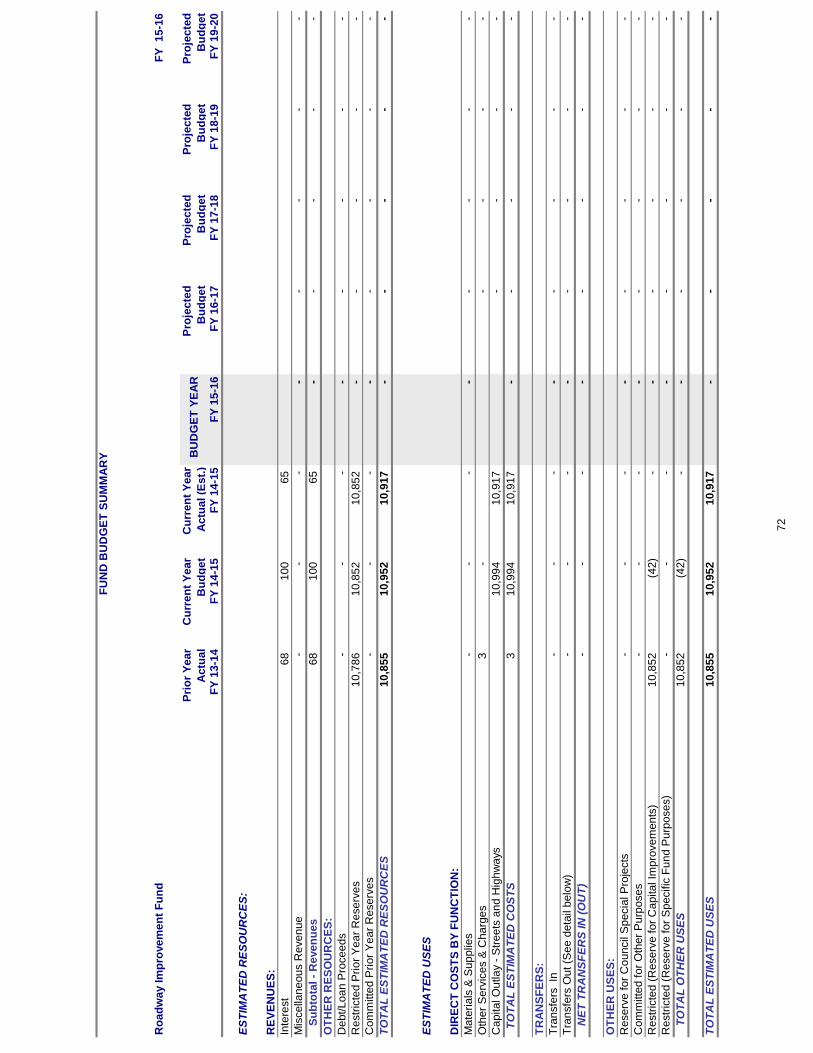
FU
ND
BU
DG
ET
SU
MM
AR
Y
Ro
ad
wa
y Im
pro
ve
me
nt
Fu
nd
FY
1
5-1
6
Pri
or
Ye
ar
Ac
tua
l
Cu
rre
nt
Ye
ar
Bu
dg
et
Cu
rre
nt
Ye
ar
Ac
tua
l (E
st.
)B
UD
GE
T Y
EA
RP
roje
cte
d
Bu
dg
et
Pro
jec
ted
Bu
dg
et
Pro
jec
ted
Bu
dg
et
Pro
jec
ted
Bu
dg
et
FY
13
-14
FY
14
-15
FY
14
-15
FY
15
-16
FY
16
-17
FY
17
-18
FY
18
-19
FY
19
-20
ES
TIM
AT
ED
RE
SO
UR
CE
S:
RE
VE
NU
ES
:
Inte
rest
68
10
0
65
Mis
ce
llan
eo
us R
eve
nu
e-
-
-
-
-
-
-
-
S
ub
tota
l -
Re
ve
nu
es
68
10
0
65
-
-
-
-
-
OT
HE
R R
ES
OU
RC
ES
:
De
bt/L
oa
n P
roce
ed
s-
-
-
-
-
-
-
-
Re
str
icte
d P
rio
r Y
ea
r R
ese
rve
s1
0,7
86
10
,85
2
10
,85
2
-
-
-
-
-
Co
mm
itte
d P
rio
r Y
ea
r R
ese
rve
s-
-
-
-
-
-
-
-
TO
TA
L E
ST
IMA
TE
D R
ES
OU
RC
ES
10
,85
5
10
,95
2
10
,91
7
-
-
-
-
-
ES
TIM
AT
ED
US
ES
DIR
EC
T C
OS
TS
BY
FU
NC
TIO
N:
Ma
teri
als
& S
up
plie
s-
-
-
-
-
-
-
-
Oth
er
Se
rvic
es &
Ch
arg
es
3
-
-
-
-
-
Ca
pita
l O
utla
y -
Str
ee
ts a
nd
Hig
hw
ays
10
,99
4
10
,91
7
-
-
-
-
T
OT
AL
ES
TIM
AT
ED
CO
ST
S3
10
,99
4
10
,91
7
-
-
-
-
-
TR
AN
SF
ER
S:
Tra
nsfe
rs In
-
-
-
-
-
-
-
-
Tra
nsfe
rs O
ut (S
ee
de
tail
be
low
)-
-
-
-
-
-
-
-
N
ET
TR
AN
SF
ER
S IN
(O
UT
)-
-
-
-
-
-
-
-
OT
HE
R U
SE
S:
Re
se
rve
fo
r C
ou
ncil
Sp
ecia
l P
roje
cts
-
-
-
-
-
-
-
-
Co
mm
itte
d f
or
Oth
er
Pu
rpo
se
s-
-
-
-
-
-
-
-
Re
str
icte
d (
Re
se
rve
fo
r C
ap
ita
l Im
pro
ve
me
nts
)1
0,8
52
(42
)
-
-
-
-
-
-
Re
str
icte
d (
Re
se
rve
fo
r S
pe
cific
Fu
nd
Pu
rpo
se
s)
-
-
-
-
-
-
-
-
T
OT
AL
OT
HE
R U
SE
S1
0,8
52
(42
)
-
-
-
-
-
-
TO
TA
L E
ST
IMA
TE
D U
SE
S1
0,8
55
10
,95
2
10
,91
7
-
-
-
-
-
72
73
1996 Capital Improvements Tax Fund
2015-2016
Departmental Summary
D E P A R T M E N T A L D E S C R I P T I O N
The 1996 Capital Improvements Tax Fund was established to account for various capital improvements recommended by the Citizens Capital Improvements Planning Committee and approved by the voters on August 27, 1996. The improvements were financed by a three-fourths cent sales tax for a five year period beginning November 1, 1996. Funded from the tax were street improvements, radio communication system and computer aided dispatch, water treatment plant expansion, library expansion, senior citizen center, and a city wide sidewalk project. This sales tax was replaced by the 2000 Capital Improvement Tax.
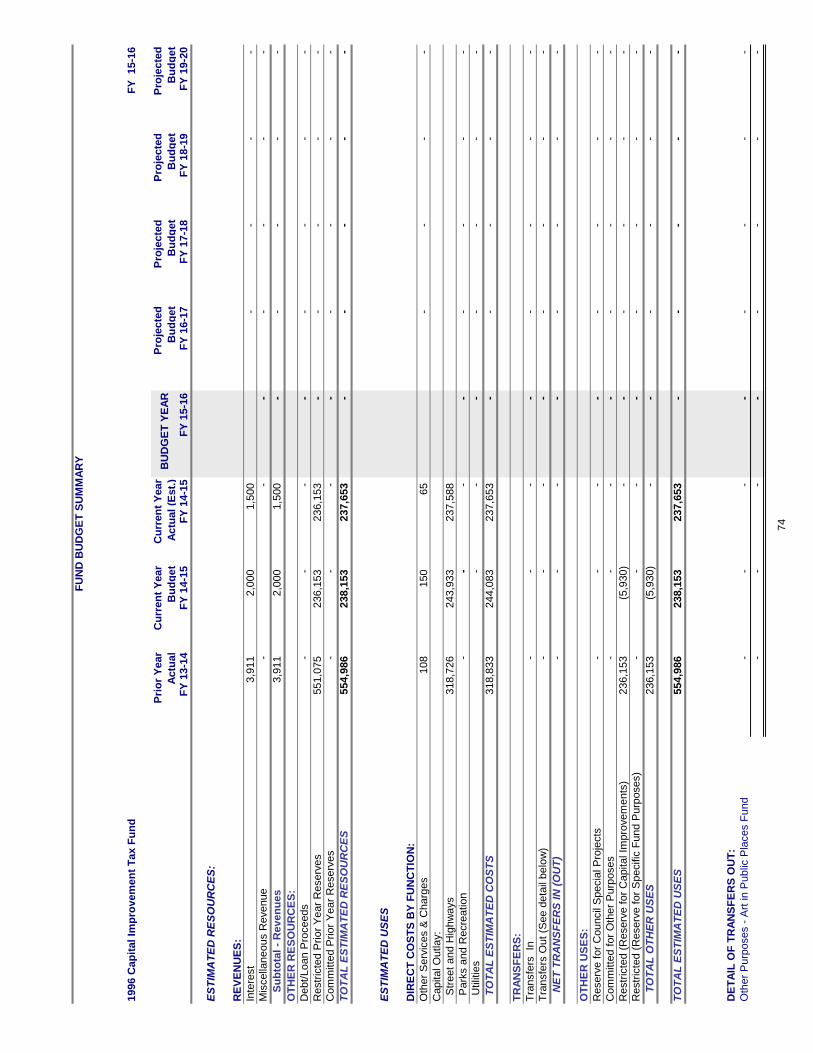
FU
ND
BU
DG
ET
SU
MM
AR
Y
1996 C
ap
ital
Imp
rov
em
en
t T
ax F
un
dF
Y
15-1
6
Pri
or
Year
Actu
al
Cu
rren
t Y
ear
Bu
dg
et
Cu
rren
t Y
ear
Actu
al
(Est.
)B
UD
GE
T Y
EA
RP
roje
cte
d
Bu
dg
et
Pro
jecte
d
Bu
dg
et
Pro
jecte
d
Bu
dg
et
Pro
jecte
d
Bu
dg
et
FY
13-1
4F
Y 1
4-1
5F
Y 1
4-1
5F
Y 1
5-1
6F
Y 1
6-1
7F
Y 1
7-1
8F
Y 1
8-1
9F
Y 1
9-2
0
ES
TIM
AT
ED
RE
SO
UR
CE
S:
RE
VE
NU
ES
:
Inte
rest
3,9
11
2,0
00
1,5
00
-
-
-
-
Mis
cella
neous R
evenue
-
-
-
-
-
-
-
S
ub
tota
l -
Reven
ue
s3,9
11
2,0
00
1,5
00
-
-
-
-
-
OT
HE
R R
ES
OU
RC
ES
:
Debt/
Loan P
roceeds
-
-
-
-
-
-
-
-
Restr
icte
d P
rio
r Y
ear
Reserv
es
551,0
75
236,1
53
236,1
53
-
-
-
-
-
Com
mitte
d P
rio
r Y
ear
Reserv
es
-
-
-
-
-
-
-
-
TO
TA
L E
ST
IMA
TE
D R
ES
OU
RC
ES
554,9
86
238,1
53
237,6
53
-
-
-
-
-
ES
TIM
AT
ED
US
ES
DIR
EC
T C
OS
TS
BY
FU
NC
TIO
N:
Oth
er
Serv
ices &
Charg
es
108
150
65
-
-
-
-
Capital O
utla
y:
S
treet
and H
ighw
ays
318,7
26
243,9
33
237,5
88
P
ark
s a
nd R
ecre
atio
n-
-
-
-
-
-
-
-
U
tilit
ies
-
-
-
-
-
-
-
T
OT
AL
ES
TIM
AT
ED
CO
ST
S318,8
33
244,0
83
237,6
53
-
-
-
-
-
TR
AN
SF
ER
S:
Tra
nsfe
rs
In-
-
-
-
-
-
-
-
Tra
nsfe
rs O
ut
(See d
eta
il belo
w)
-
-
-
-
-
-
-
-
N
ET
TR
AN
SF
ER
S IN
(O
UT
)-
-
-
-
-
-
-
-
OT
HE
R U
SE
S:
Reserv
e f
or
Council
Specia
l P
roje
cts
-
-
-
-
-
-
-
-
Com
mitte
d f
or
Oth
er
Purp
oses
-
-
-
-
-
-
-
-
Restr
icte
d (
Reserv
e f
or
Capital Im
pro
vem
ents
)236,1
53
(5
,930)
-
-
-
-
-
-
Restr
icte
d (
Reserv
e f
or
Specific
Fu
nd P
urp
oses)
-
-
-
-
-
-
-
-
T
OT
AL
OT
HE
R U
SE
S236,1
53
(5
,930)
-
-
-
-
-
-
TO
TA
L E
ST
IMA
TE
D U
SE
S554,9
86
238,1
53
237,6
53
-
-
-
-
-
DE
TA
IL O
F T
RA
NS
FE
RS
OU
T:
Oth
er
Purp
oses -
Art
in
Public
Pla
ces F
und
-
-
-
-
-
-
-
-
-
-
-
-
-
-
-
-
74
75
Art In Public Places (VAC)
2015-2016
Departmental Summary
D E P A R T M E N T A L D E S C R I P T I O N
Ordinance purpose is to provide means to fund the acquisition of works of art by the City and
which art shall be in the City’s collection, to create a Visual Arts Commission, to provide a
means to select works of art for the collection, to provide for the display of the collection, and
to provide for the maintenance and repair of the works of art in the collection (Ord.2653, 1,
Oct.8, 2001).
G O A L S
1. Control methods of selection of art objects and appropriate locations for display.
2. Identify and preserve art objects that may be displayed in public places.
3. Build partnerships with private and corporate entities to purchase artwork.
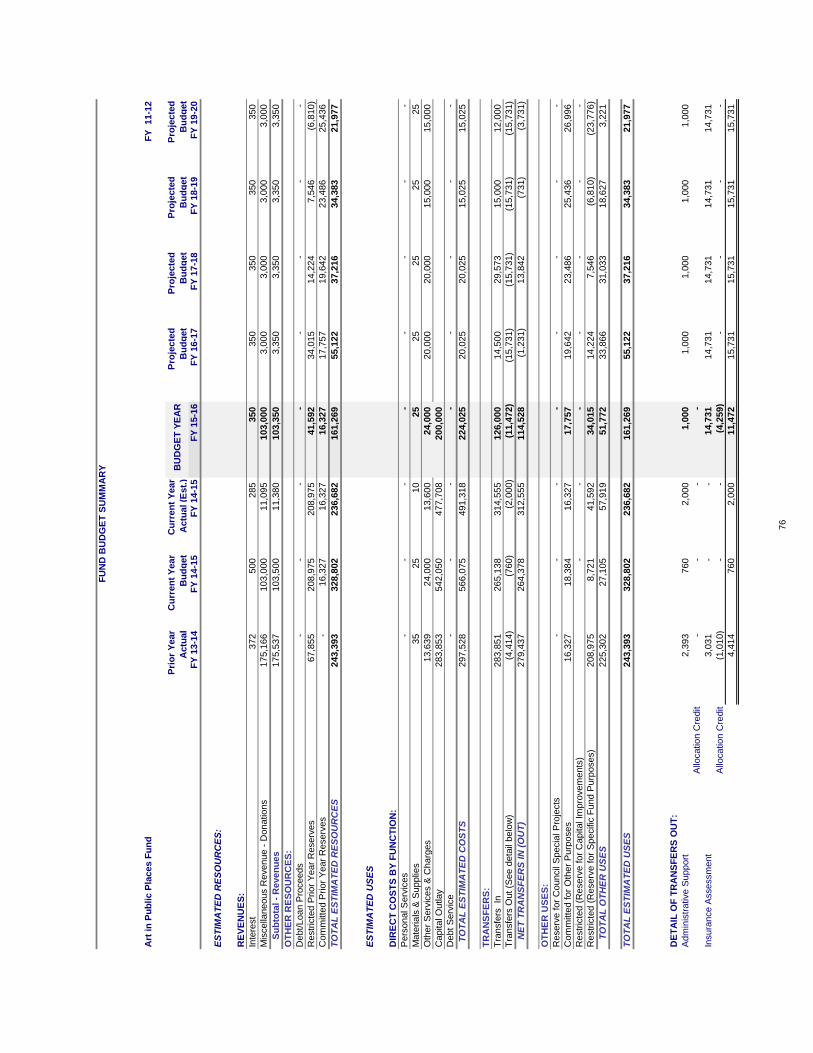
FU
ND
BU
DG
ET
SU
MM
AR
Y
Art
in
Pu
blic P
laces F
un
dF
Y 11-1
2
Pri
or
Year
Actu
al
Cu
rren
t Y
ear
Bu
dg
et
Cu
rren
t Y
ear
Actu
al (E
st.
)B
UD
GE
T Y
EA
RP
roje
cte
d
Bu
dg
et
Pro
jecte
d
Bu
dg
et
Pro
jecte
d
Bu
dg
et
Pro
jecte
d
Bu
dg
et
FY
13-1
4F
Y 1
4-1
5F
Y 1
4-1
5F
Y 1
5-1
6F
Y 1
6-1
7F
Y 1
7-1
8F
Y 1
8-1
9F
Y 1
9-2
0
ES
TIM
AT
ED
RE
SO
UR
CE
S:
RE
VE
NU
ES
:
Inte
rest
372
500
285
350
350
350
350
350
Mis
cella
neous R
evenue -
Donations
175,1
66
103,0
00
11,0
95
103,0
00
3,0
00
3,0
00
3,0
00
3,0
00
S
ub
tota
l -
Reven
ues
175,5
37
103,5
00
11,3
80
103,3
50
3,3
50
3,3
50
3,3
50
3,3
50
OT
HE
R R
ES
OU
RC
ES
:
Debt/Loan P
roceeds
-
-
-
-
-
-
-
-
Restr
icte
d P
rior
Year
Reserv
es
67,8
55
208,9
75
208,9
75
41,5
92
34,0
15
14,2
24
7,5
46
(6,8
10)
Com
mitte
d P
rior
Year
Reserv
es
-
16,3
27
16,3
27
16,3
27
17,7
57
19,6
42
23,4
86
25,4
36
TO
TA
L E
ST
IMA
TE
D R
ES
OU
RC
ES
243,3
93
328,8
02
236,6
82
161,2
69
55,1
22
37,2
16
34,3
83
21,9
77
ES
TIM
AT
ED
US
ES
DIR
EC
T C
OS
TS
BY
FU
NC
TIO
N:
Pers
onal S
erv
ices
-
-
-
-
-
-
-
-
Mate
rials
& S
upplie
s35
25
10
25
25
25
25
25
Oth
er
Serv
ices &
Charg
es
13,6
39
24,0
00
13,6
00
24,0
00
20,0
00
20,0
00
15,0
00
15,0
00
Capital O
utlay
283,8
53
542,0
50
477,7
08
200,0
00
Debt S
erv
ice
-
-
-
-
-
-
-
-
T
OT
AL
ES
TIM
AT
ED
CO
ST
S297,5
28
566,0
75
491,3
18
224,0
25
20,0
25
20,0
25
15,0
25
15,0
25
TR
AN
SF
ER
S:
Tra
nsfe
rs In
283,8
51
265,1
38
314,5
55
126,0
00
14,5
00
29,5
73
15,0
00
12,0
00
Tra
nsfe
rs O
ut (S
ee d
eta
il belo
w)
(4,4
14)
(760)
(2,0
00)
(11,4
72)
(15,7
31)
(15,7
31)
(15,7
31)
(15,7
31)
N
ET
TR
AN
SF
ER
S IN
(O
UT
)279,4
37
264,3
78
312,5
55
114,5
28
(1,2
31)
13,8
42
(731)
(3,7
31)
OT
HE
R U
SE
S:
Reserv
e for
Council
Specia
l P
roje
cts
-
-
-
-
-
-
-
-
Com
mitte
d for
Oth
er
Purp
oses
16,3
27
18,3
84
16,3
27
17,7
57
19,6
42
23,4
86
25,4
36
26,9
96
Restr
icte
d (
Reserv
e for
Capital Im
pro
vem
ents
)-
-
-
-
-
-
-
Restr
icte
d (
Reserv
e for
Specific
Fund P
urp
oses)
208,9
75
8,7
21
41,5
92
34,0
15
14,2
24
7,5
46
(6,8
10)
(23,7
76)
T
OT
AL
OT
HE
R U
SE
S225,3
02
27,1
05
57,9
19
51,7
72
33,8
66
31,0
33
18,6
27
3,2
21
TO
TA
L E
ST
IMA
TE
D U
SE
S243,3
93
328,8
02
236,6
82
161,2
69
55,1
22
37,2
16
34,3
83
21,9
77
DE
TA
IL O
F T
RA
NS
FE
RS
OU
T:
Adm
inis
trative S
upport
2,3
93
760
2,0
00
1,0
00
1,0
00
1,0
00
1,0
00
1,0
00
Allo
cation C
redit
-
-
-
-
Insura
nce A
ssessm
ent
3,0
31
-
-
14,7
31
14,7
31
14,7
31
14,7
31
14,7
31
Allo
cation C
redit
(1,0
10)
-
-
(4,2
59)
-
-
-
-
4,4
14
760
2,0
00
11,4
72
15,7
31
15,7
31
15,7
31
15,7
31
76

77
Cemetery Care Fund
2015-2016
Departmental Summary
D E P A R T M E N T A L D E S C R I P T I O N
The Cemetery Care Fund has been established to account for 12.5% of all monies received from the sale of lots and interments in accordance with state law. Monies received must be used to purchase lands for cemeteries and for making capital improvements. Interest earned may be used for improving, caring for and beautifying cemetery property.
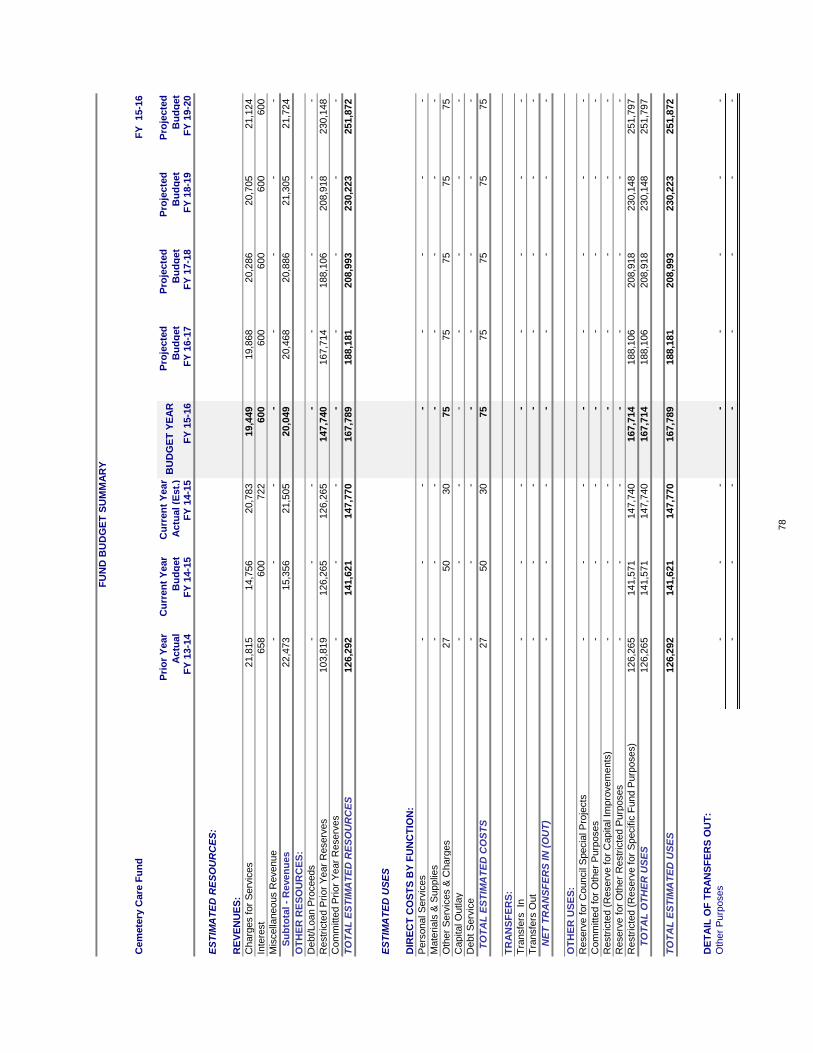
FU
ND
BU
DG
ET
SU
MM
AR
Y
Cem
ete
ry C
are
Fu
nd
FY
15-1
6
Pri
or
Year
Actu
al
Cu
rren
t Y
ear
Bu
dg
et
Cu
rren
t Y
ear
Actu
al (E
st.
)B
UD
GE
T Y
EA
RP
roje
cte
d
Bu
dg
et
Pro
jecte
d
Bu
dg
et
Pro
jecte
d
Bu
dg
et
Pro
jecte
d
Bu
dg
et
FY
13-1
4F
Y 1
4-1
5F
Y 1
4-1
5F
Y 1
5-1
6F
Y 1
6-1
7F
Y 1
7-1
8F
Y 1
8-1
9F
Y 1
9-2
0
ES
TIM
AT
ED
RE
SO
UR
CE
S:
RE
VE
NU
ES
:
Charg
es f
or
Serv
ices
21,8
15
14,7
56
20,7
83
19,4
49
19,8
68
20,2
86
20,7
05
21,1
24
Inte
rest
658
600
722
600
600
600
600
600
Mis
cella
neous R
evenue
-
-
-
-
-
-
-
-
S
ub
tota
l -
Reven
ues
22,4
73
15,3
56
21,5
05
20,0
49
20,4
68
20,8
86
21,3
05
21,7
24
OT
HE
R R
ES
OU
RC
ES
:
Debt/Loan P
roceeds
-
-
-
-
-
-
-
-
Restr
icte
d P
rior
Year
Reserv
es
103,8
19
126,2
65
126,2
65
147,7
40
167,7
14
188,1
06
208,9
18
230,1
48
Com
mitte
d P
rior
Year
Reserv
es
-
-
-
-
-
-
-
-
TO
TA
L E
ST
IMA
TE
D R
ES
OU
RC
ES
126,2
92
141,6
21
147,7
70
167,7
89
188,1
81
208,9
93
230,2
23
251,8
72
ES
TIM
AT
ED
US
ES
DIR
EC
T C
OS
TS
BY
FU
NC
TIO
N:
Pers
onal S
erv
ices
-
-
-
-
-
-
-
-
Mate
rials
& S
upplie
s-
-
-
-
-
-
-
-
Oth
er
Serv
ices &
Charg
es
27
50
30
75
75
75
75
75
Capital O
utlay
-
-
-
-
-
-
-
-
Debt S
erv
ice
-
-
-
-
-
-
-
-
T
OT
AL
ES
TIM
AT
ED
CO
ST
S27
50
30
75
75
75
75
75
TR
AN
SF
ER
S:
Tra
nsfe
rs In
-
-
-
-
-
-
-
-
Tra
nsfe
rs O
ut
-
-
-
-
-
-
-
-
N
ET
TR
AN
SF
ER
S IN
(O
UT
)-
-
-
-
-
-
-
-
OT
HE
R U
SE
S:
Reserv
e f
or
Council
Specia
l P
roje
cts
-
-
-
-
-
-
-
-
Com
mitte
d f
or
Oth
er
Purp
oses
-
-
-
-
-
-
-
-
Restr
icte
d (
Reserv
e f
or
Capital Im
pro
vem
ents
)-
-
-
-
-
-
-
-
Reserv
e f
or
Oth
er
Restr
icte
d P
urp
oses
-
-
-
-
-
-
-
-
Restr
icte
d (
Reserv
e f
or
Specific
Fund P
urp
oses)
126,2
65
141,5
71
147,7
40
167,7
14
188,1
06
208,9
18
230,1
48
251,7
97
T
OT
AL
OT
HE
R U
SE
S126,2
65
141,5
71
147,7
40
167,7
14
188,1
06
208,9
18
230,1
48
251,7
97
TO
TA
L E
ST
IMA
TE
D U
SE
S126,2
92
141,6
21
147,7
70
167,7
89
188,1
81
208,9
93
230,2
23
251,8
72
DE
TA
IL O
F T
RA
NS
FE
RS
OU
T:
Oth
er
Purp
oses
-
-
-
-
-
-
-
-
-
-
-
-
-
-
-
-
78
79
Park Tax Fund
2015-2016
Departmental Summary
D E P A R T M E N T A L D E S C R I P T I O N
The Park Tax Fund is a dedicated 1/8 cent City sales tax for operations and improvements within the Parks & Recreation Department and its various divisions such as Arcadia Lake, KickingBird Golf & Tennis and our sports partners—such as EASI, Edmond Soccer, Rodeo, Adult Softball, Lacrosse benefit from this funding source.
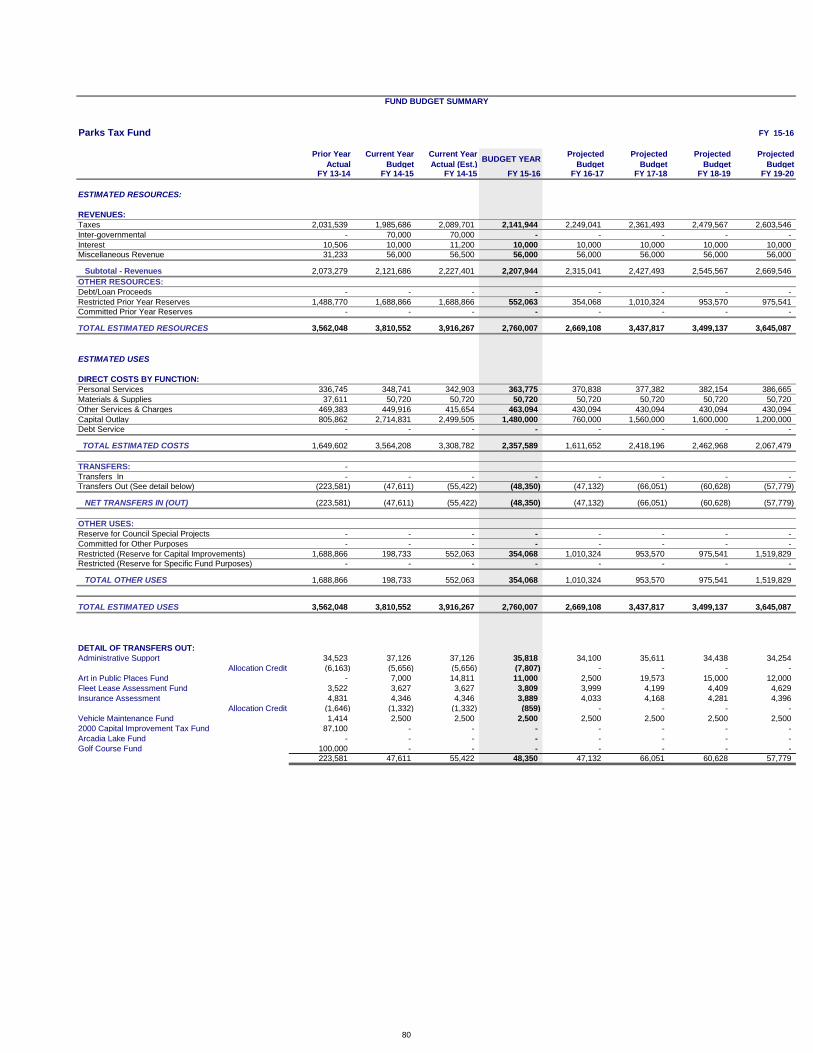
FUND BUDGET SUMMARY
Parks Tax Fund FY 15-16
Prior Year
Actual
Current Year
Budget
Current Year
Actual (Est.)BUDGET YEAR
Projected
Budget
Projected
Budget
Projected
Budget
Projected
BudgetFY 13-14 FY 14-15 FY 14-15 FY 15-16 FY 16-17 FY 17-18 FY 18-19 FY 19-20
ESTIMATED RESOURCES:
REVENUES:
Taxes 2,031,539 1,985,686 2,089,701 2,141,944 2,249,041 2,361,493 2,479,567 2,603,546
Inter-governmental - 70,000 70,000 - - - - -
Interest 10,506 10,000 11,200 10,000 10,000 10,000 10,000 10,000
Miscellaneous Revenue 31,233 56,000 56,500 56,000 56,000 56,000 56,000 56,000
Subtotal - Revenues 2,073,279 2,121,686 2,227,401 2,207,944 2,315,041 2,427,493 2,545,567 2,669,546
OTHER RESOURCES:
Debt/Loan Proceeds - - - - - - - -
Restricted Prior Year Reserves 1,488,770 1,688,866 1,688,866 552,063 354,068 1,010,324 953,570 975,541
Committed Prior Year Reserves - - - - - - - -
TOTAL ESTIMATED RESOURCES 3,562,048 3,810,552 3,916,267 2,760,007 2,669,108 3,437,817 3,499,137 3,645,087
ESTIMATED USES
DIRECT COSTS BY FUNCTION:
Personal Services 336,745 348,741 342,903 363,775 370,838 377,382 382,154 386,665
Materials & Supplies 37,611 50,720 50,720 50,720 50,720 50,720 50,720 50,720
Other Services & Charges 469,383 449,916 415,654 463,094 430,094 430,094 430,094 430,094
Capital Outlay 805,862 2,714,831 2,499,505 1,480,000 760,000 1,560,000 1,600,000 1,200,000
Debt Service - - - - - - - -
TOTAL ESTIMATED COSTS 1,649,602 3,564,208 3,308,782 2,357,589 1,611,652 2,418,196 2,462,968 2,067,479
TRANSFERS: -
Transfers In - - - - - - - -
Transfers Out (See detail below) (223,581) (47,611) (55,422) (48,350) (47,132) (66,051) (60,628) (57,779)
NET TRANSFERS IN (OUT) (223,581) (47,611) (55,422) (48,350) (47,132) (66,051) (60,628) (57,779)
OTHER USES:
Reserve for Council Special Projects - - - - - - - -
Committed for Other Purposes - - - - - - - -
Restricted (Reserve for Capital Improvements) 1,688,866 198,733 552,063 354,068 1,010,324 953,570 975,541 1,519,829
Restricted (Reserve for Specific Fund Purposes) - - - - - - - -
TOTAL OTHER USES 1,688,866 198,733 552,063 354,068 1,010,324 953,570 975,541 1,519,829
TOTAL ESTIMATED USES 3,562,048 3,810,552 3,916,267 2,760,007 2,669,108 3,437,817 3,499,137 3,645,087
DETAIL OF TRANSFERS OUT:
Administrative Support 34,523 37,126 37,126 35,818 34,100 35,611 34,438 34,254
Allocation Credit (6,163) (5,656) (5,656) (7,807) - - - -
Art in Public Places Fund - 7,000 14,811 11,000 2,500 19,573 15,000 12,000
Fleet Lease Assessment Fund 3,522 3,627 3,627 3,809 3,999 4,199 4,409 4,629
Insurance Assessment 4,831 4,346 4,346 3,889 4,033 4,168 4,281 4,396
Allocation Credit (1,646) (1,332) (1,332) (859) - - - -
Vehicle Maintenance Fund 1,414 2,500 2,500 2,500 2,500 2,500 2,500 2,500
2000 Capital Improvement Tax Fund 87,100 - - - - - - -
Arcadia Lake Fund - - - - - - - -
Golf Course Fund 100,000 - - - - - - -
223,581 47,611 55,422 48,350 47,132 66,051 60,628 57,779
80
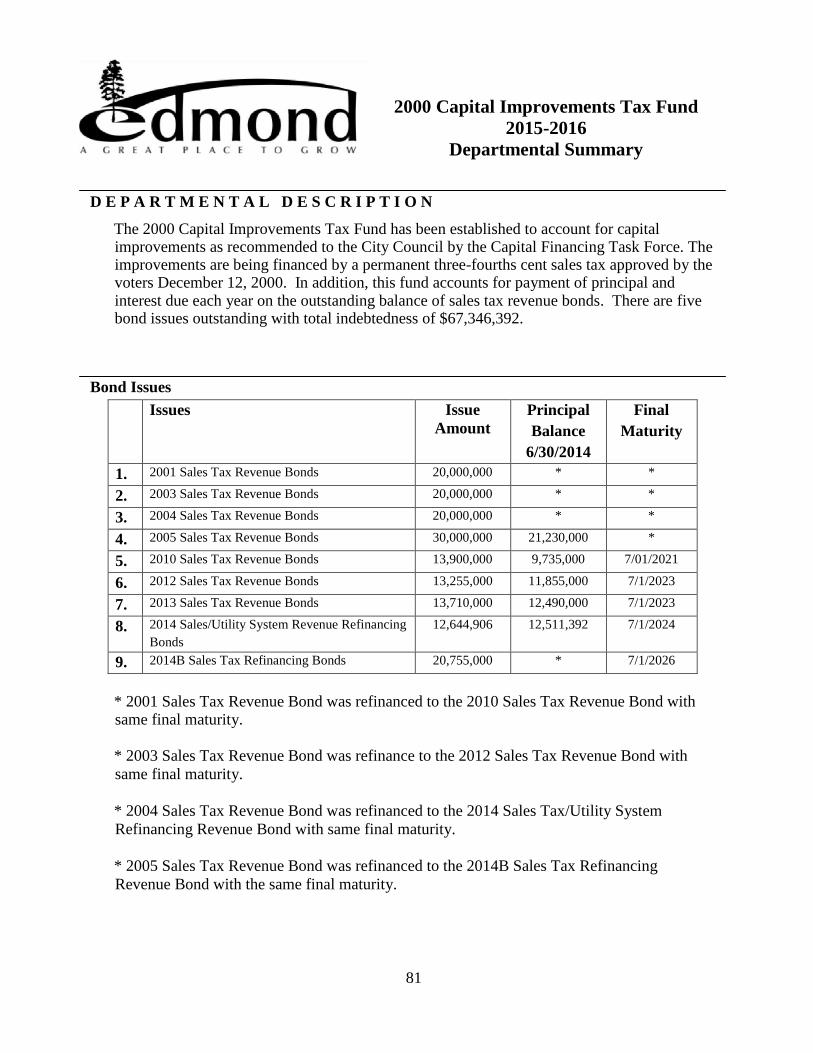
81
2000 Capital Improvements Tax Fund
2015-2016
Departmental Summary
D E P A R T M E N T A L D E S C R I P T I O N
The 2000 Capital Improvements Tax Fund has been established to account for capital improvements as recommended to the City Council by the Capital Financing Task Force. The improvements are being financed by a permanent three-fourths cent sales tax approved by the voters December 12, 2000. In addition, this fund accounts for payment of principal and interest due each year on the outstanding balance of sales tax revenue bonds. There are five bond issues outstanding with total indebtedness of $67,346,392.
Bond Issues
Issues Issue
Amount
Principal
Balance
6/30/2014
Final
Maturity
1. 2001 Sales Tax Revenue Bonds 20,000,000 * *
2. 2003 Sales Tax Revenue Bonds 20,000,000 * *
3. 2004 Sales Tax Revenue Bonds 20,000,000 * *
4. 2005 Sales Tax Revenue Bonds 30,000,000 21,230,000 *
5. 2010 Sales Tax Revenue Bonds 13,900,000 9,735,000 7/01/2021
6. 2012 Sales Tax Revenue Bonds 13,255,000 11,855,000 7/1/2023
7. 2013 Sales Tax Revenue Bonds 13,710,000 12,490,000 7/1/2023
8. 2014 Sales/Utility System Revenue Refinancing
Bonds
12,644,906 12,511,392 7/1/2024
9. 2014B Sales Tax Refinancing Bonds 20,755,000 * 7/1/2026
* 2001 Sales Tax Revenue Bond was refinanced to the 2010 Sales Tax Revenue Bond with same final maturity.
* 2003 Sales Tax Revenue Bond was refinance to the 2012 Sales Tax Revenue Bond with
same final maturity.
* 2004 Sales Tax Revenue Bond was refinanced to the 2014 Sales Tax/Utility System
Refinancing Revenue Bond with same final maturity.
* 2005 Sales Tax Revenue Bond was refinanced to the 2014B Sales Tax Refinancing
Revenue Bond with the same final maturity.
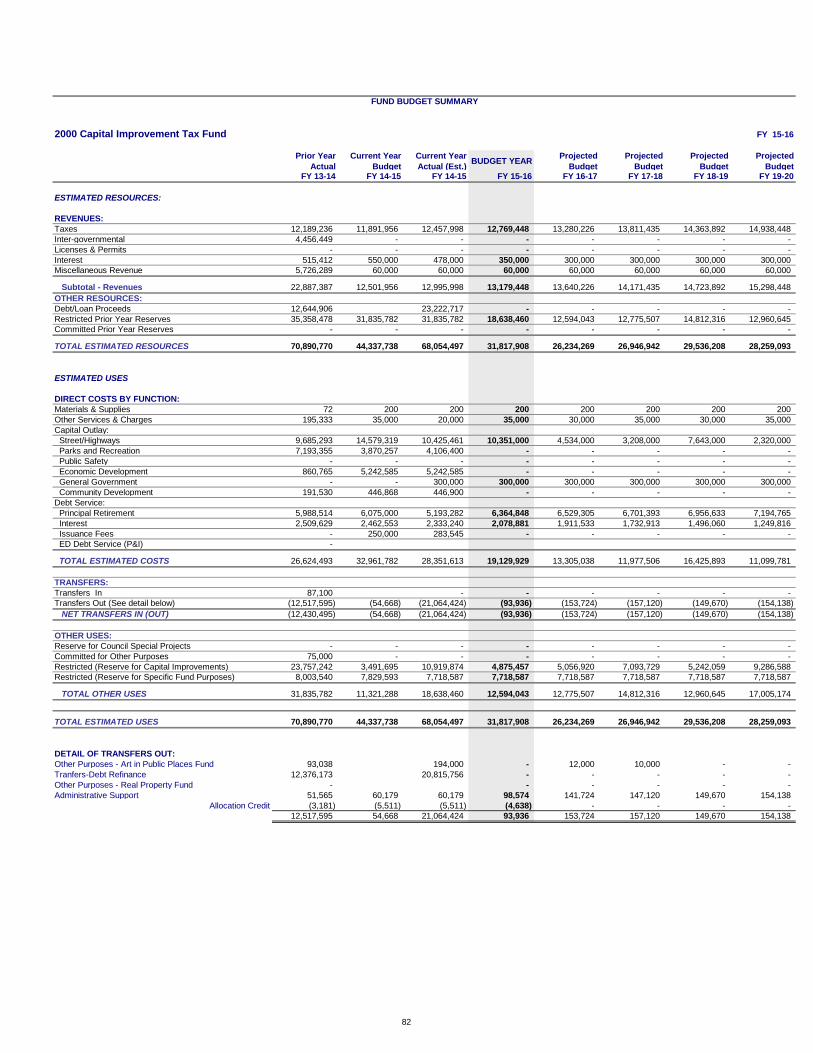
FUND BUDGET SUMMARY
2000 Capital Improvement Tax Fund FY 15-16
Prior Year
Actual
Current Year
Budget
Current Year
Actual (Est.)BUDGET YEAR
Projected
Budget
Projected
Budget
Projected
Budget
Projected
BudgetFY 13-14 FY 14-15 FY 14-15 FY 15-16 FY 16-17 FY 17-18 FY 18-19 FY 19-20
ESTIMATED RESOURCES:
REVENUES:
Taxes 12,189,236 11,891,956 12,457,998 12,769,448 13,280,226 13,811,435 14,363,892 14,938,448
Inter-governmental 4,456,449 - - - - - - -
Licenses & Permits - - - - - - - -
Interest 515,412 550,000 478,000 350,000 300,000 300,000 300,000 300,000
Miscellaneous Revenue 5,726,289 60,000 60,000 60,000 60,000 60,000 60,000 60,000
Subtotal - Revenues 22,887,387 12,501,956 12,995,998 13,179,448 13,640,226 14,171,435 14,723,892 15,298,448
OTHER RESOURCES:
Debt/Loan Proceeds 12,644,906 23,222,717 - - - - -
Restricted Prior Year Reserves 35,358,478 31,835,782 31,835,782 18,638,460 12,594,043 12,775,507 14,812,316 12,960,645
Committed Prior Year Reserves - - - - - - - -
TOTAL ESTIMATED RESOURCES 70,890,770 44,337,738 68,054,497 31,817,908 26,234,269 26,946,942 29,536,208 28,259,093
ESTIMATED USES
DIRECT COSTS BY FUNCTION:
Materials & Supplies 72 200 200 200 200 200 200 200
Other Services & Charges 195,333 35,000 20,000 35,000 30,000 35,000 30,000 35,000
Capital Outlay:
Street/Highways 9,685,293 14,579,319 10,425,461 10,351,000 4,534,000 3,208,000 7,643,000 2,320,000
Parks and Recreation 7,193,355 3,870,257 4,106,400 - - - - -
Public Safety - - - - - - - -
Economic Development 860,765 5,242,585 5,242,585 - - - - -
General Government - - 300,000 300,000 300,000 300,000 300,000 300,000
Community Development 191,530 446,868 446,900 - - - - -
Debt Service:
Principal Retirement 5,988,514 6,075,000 5,193,282 6,364,848 6,529,305 6,701,393 6,956,633 7,194,765
Interest 2,509,629 2,462,553 2,333,240 2,078,881 1,911,533 1,732,913 1,496,060 1,249,816
Issuance Fees - 250,000 283,545 - - - - -
ED Debt Service (P&I) -
TOTAL ESTIMATED COSTS 26,624,493 32,961,782 28,351,613 19,129,929 13,305,038 11,977,506 16,425,893 11,099,781
TRANSFERS:
Transfers In 87,100 - - - - - -
Transfers Out (See detail below) (12,517,595) (54,668) (21,064,424) (93,936) (153,724) (157,120) (149,670) (154,138)
NET TRANSFERS IN (OUT) (12,430,495) (54,668) (21,064,424) (93,936) (153,724) (157,120) (149,670) (154,138)
OTHER USES:
Reserve for Council Special Projects - - - - - - - -
Committed for Other Purposes 75,000 - - - - - - -
Restricted (Reserve for Capital Improvements) 23,757,242 3,491,695 10,919,874 4,875,457 5,056,920 7,093,729 5,242,059 9,286,588
Restricted (Reserve for Specific Fund Purposes) 8,003,540 7,829,593 7,718,587 7,718,587 7,718,587 7,718,587 7,718,587 7,718,587
TOTAL OTHER USES 31,835,782 11,321,288 18,638,460 12,594,043 12,775,507 14,812,316 12,960,645 17,005,174
TOTAL ESTIMATED USES 70,890,770 44,337,738 68,054,497 31,817,908 26,234,269 26,946,942 29,536,208 28,259,093
DETAIL OF TRANSFERS OUT:
Other Purposes - Art in Public Places Fund 93,038 194,000 - 12,000 10,000 - -
Tranfers-Debt Refinance 12,376,173 20,815,756 - - - - -
Other Purposes - Real Property Fund - - - - - -
Administrative Support 51,565 60,179 60,179 98,574 141,724 147,120 149,670 154,138
Allocation Credit (3,181) (5,511) (5,511) (4,638) - - - -
12,517,595 54,668 21,064,424 93,936 153,724 157,120 149,670 154,138
82
83
2012 Public Safety Center -Capital
Improvements Tax Fund
2015-2016
Departmental Summary
D E P A R T M E N T A L D E S C R I P T I O N
The 2012 Public Safety Center -Capital Improvements Tax Fund was established to account for the capital construction costs of a new Public Safety Center. The improvements are being financed by a 5-year one-half cent sales tax approved by the voters October 11th, 2011. The one-half cent sales tax began April 1st, 2012 and will end March 31st, 2017.
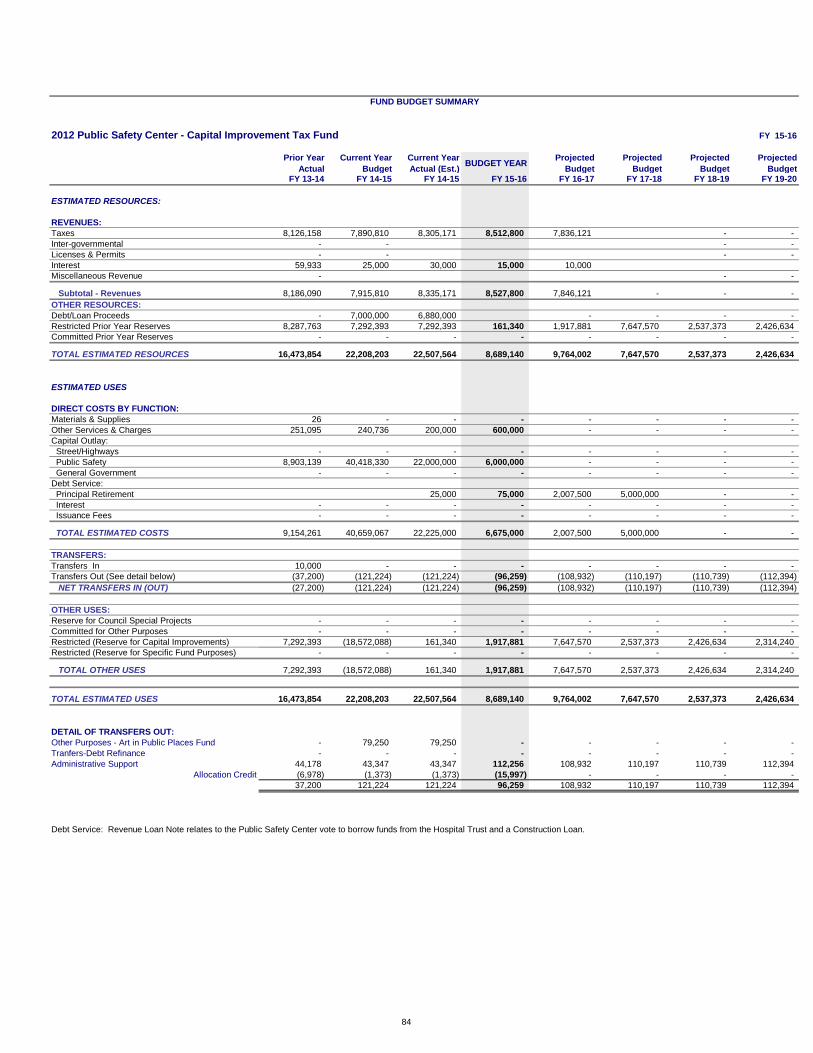
FUND BUDGET SUMMARY
2012 Public Safety Center - Capital Improvement Tax Fund FY 15-16
Prior Year
Actual
Current Year
Budget
Current Year
Actual (Est.)BUDGET YEAR
Projected
Budget
Projected
Budget
Projected
Budget
Projected
BudgetFY 13-14 FY 14-15 FY 14-15 FY 15-16 FY 16-17 FY 17-18 FY 18-19 FY 19-20
ESTIMATED RESOURCES:
REVENUES:
Taxes 8,126,158 7,890,810 8,305,171 8,512,800 7,836,121 - -
Inter-governmental - - - -
Licenses & Permits - - - -
Interest 59,933 25,000 30,000 15,000 10,000
Miscellaneous Revenue - - -
Subtotal - Revenues 8,186,090 7,915,810 8,335,171 8,527,800 7,846,121 - - -
OTHER RESOURCES:
Debt/Loan Proceeds - 7,000,000 6,880,000 - - - -
Restricted Prior Year Reserves 8,287,763 7,292,393 7,292,393 161,340 1,917,881 7,647,570 2,537,373 2,426,634
Committed Prior Year Reserves - - - - - - - -
TOTAL ESTIMATED RESOURCES 16,473,854 22,208,203 22,507,564 8,689,140 9,764,002 7,647,570 2,537,373 2,426,634
ESTIMATED USES
DIRECT COSTS BY FUNCTION:
Materials & Supplies 26 - - - - - - -
Other Services & Charges 251,095 240,736 200,000 600,000 - - - -
Capital Outlay:
Street/Highways - - - - - - - -
Public Safety 8,903,139 40,418,330 22,000,000 6,000,000 - - - -
General Government - - - - - - - -
Debt Service:
Principal Retirement 25,000 75,000 2,007,500 5,000,000 - -
Interest - - - - - - - -
Issuance Fees - - - - - - - -
TOTAL ESTIMATED COSTS 9,154,261 40,659,067 22,225,000 6,675,000 2,007,500 5,000,000 - -
TRANSFERS:
Transfers In 10,000 - - - - - - -
Transfers Out (See detail below) (37,200) (121,224) (121,224) (96,259) (108,932) (110,197) (110,739) (112,394)
NET TRANSFERS IN (OUT) (27,200) (121,224) (121,224) (96,259) (108,932) (110,197) (110,739) (112,394)
OTHER USES:
Reserve for Council Special Projects - - - - - - - -
Committed for Other Purposes - - - - - - - -
Restricted (Reserve for Capital Improvements) 7,292,393 (18,572,088) 161,340 1,917,881 7,647,570 2,537,373 2,426,634 2,314,240
Restricted (Reserve for Specific Fund Purposes) - - - - - - - -
TOTAL OTHER USES 7,292,393 (18,572,088) 161,340 1,917,881 7,647,570 2,537,373 2,426,634 2,314,240
TOTAL ESTIMATED USES 16,473,854 22,208,203 22,507,564 8,689,140 9,764,002 7,647,570 2,537,373 2,426,634
DETAIL OF TRANSFERS OUT:
Other Purposes - Art in Public Places Fund - 79,250 79,250 - - - - -
Tranfers-Debt Refinance - - - - - - - -
Administrative Support 44,178 43,347 43,347 112,256 108,932 110,197 110,739 112,394
Allocation Credit (6,978) (1,373) (1,373) (15,997) - - - -
37,200 121,224 121,224 96,259 108,932 110,197 110,739 112,394
Debt Service: Revenue Loan Note relates to the Public Safety Center vote to borrow funds from the Hospital Trust and a Construction Loan.
84


EPWA Utility Funds
Tab
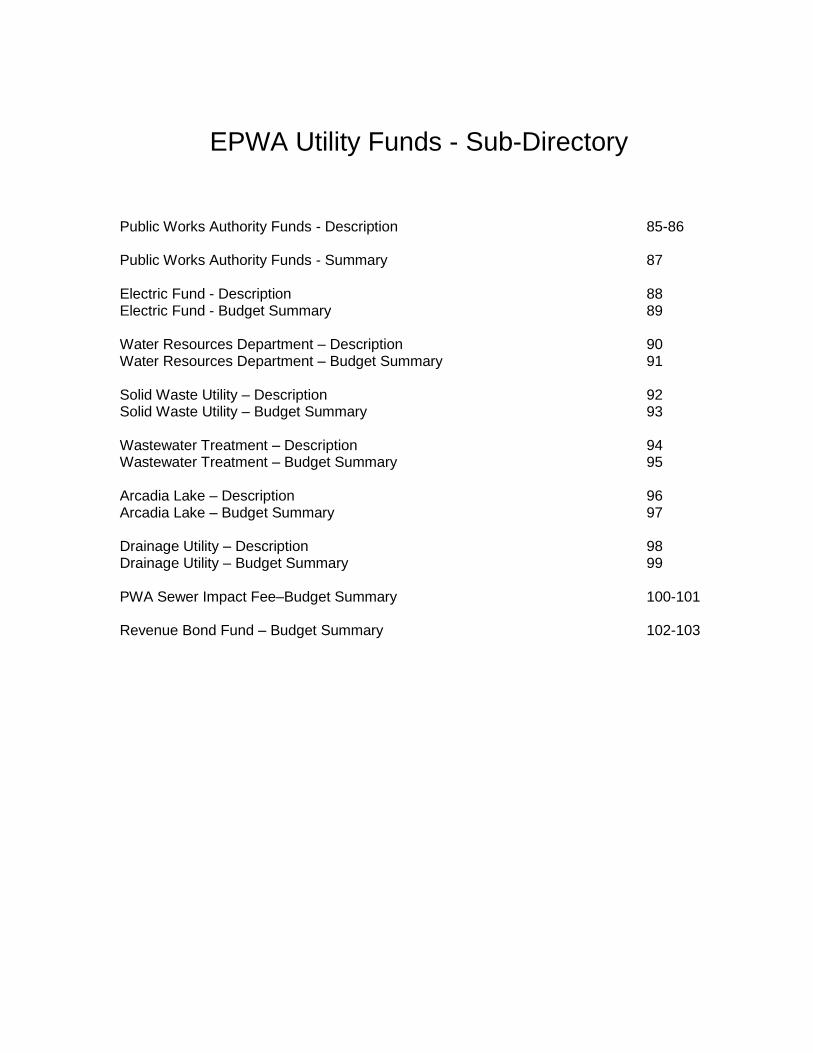
EPWA Utility Funds - Sub-Directory
Public Works Authority Funds - Description 85-86 Public Works Authority Funds - Summary 87 Electric Fund - Description 88 Electric Fund - Budget Summary 89 Water Resources Department – Description 90 Water Resources Department – Budget Summary 91 Solid Waste Utility – Description 92 Solid Waste Utility – Budget Summary 93 Wastewater Treatment – Description 94 Wastewater Treatment – Budget Summary 95 Arcadia Lake – Description 96 Arcadia Lake – Budget Summary 97 Drainage Utility – Description 98 Drainage Utility – Budget Summary 99 PWA Sewer Impact Fee–Budget Summary 100-101 Revenue Bond Fund – Budget Summary 102-103


85
THE CITY OF EDMOND, OKLAHOMA FUND DESCRIPTION -EPWA UTILITY FUNDS- The EPWA Utility Funds are used to account for the cost of providing all utility services
(electricity, water, wastewater, drainage, solid waste) to the citizens of Edmond funded
with the revenue generated by the charges for services represented by the utility bills.
The costs incurred include personnel, operation and maintenance and capital outlay costs
necessary to adequately develop and maintain a high level of service in the utility
facilities. The fund also accounts for the operations of the Arcadia Lake recreational
facilities. These facilities are financed through user fees and General Fund and Park Tax
Fund transfers.
EPWA SEWER IMPACT FUND
The EPWA Sewer Impact Fund is used to account for impact fees collected on new
developments in accordance with Ordinance #2077. This ordinance, which was repealed
in July 2002, established a fee of $100 per toilet to be used for the sole purpose of
acquiring, equipping, and/or making capital improvements to the City’s sewer facilities.
The funds may also be used for debt service under certain conditions.
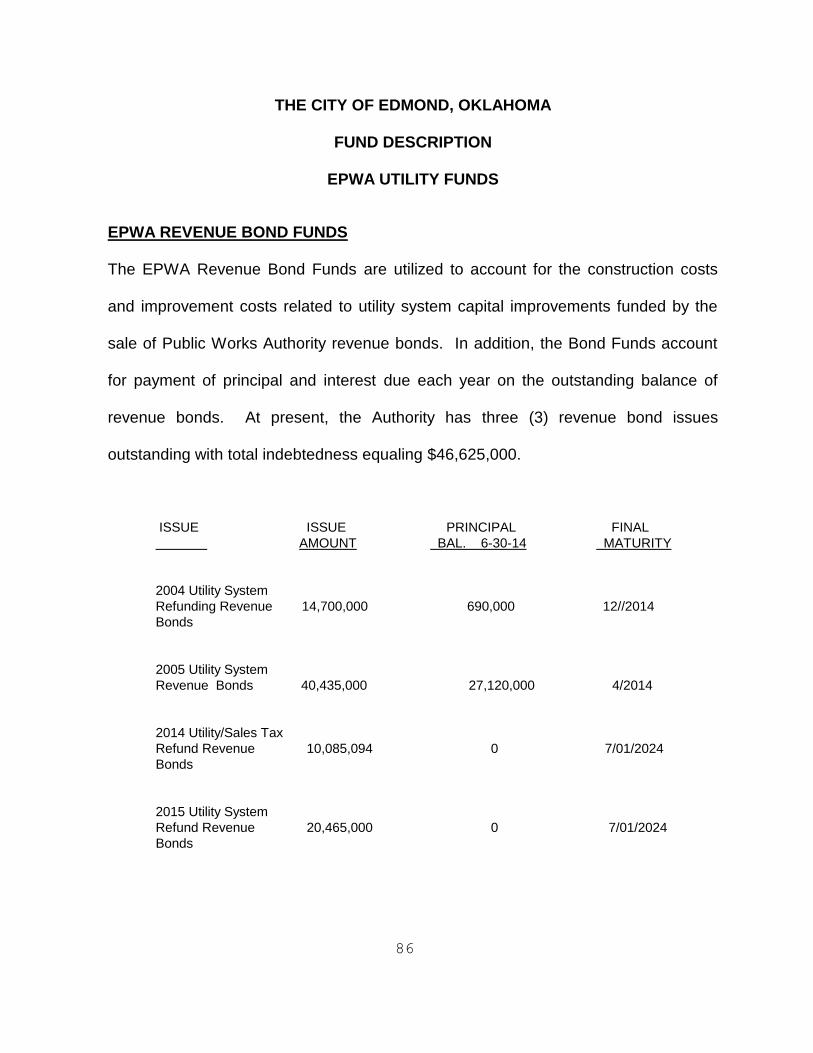
86
THE CITY OF EDMOND, OKLAHOMA
FUND DESCRIPTION
EPWA UTILITY FUNDS
EPWA REVENUE BOND FUNDS
The EPWA Revenue Bond Funds are utilized to account for the construction costs
and improvement costs related to utility system capital improvements funded by the
sale of Public Works Authority revenue bonds. In addition, the Bond Funds account
for payment of principal and interest due each year on the outstanding balance of
revenue bonds. At present, the Authority has three (3) revenue bond issues
outstanding with total indebtedness equaling $46,625,000.
ISSUE ISSUE PRINCIPAL FINAL
AMOUNT BAL. 6-30-14 MATURITY
2004 Utility System
Refunding Revenue 14,700,000 690,000 12//2014
Bonds
2005 Utility System
Revenue Bonds 40,435,000 27,120,000 4/2014
2014 Utility/Sales Tax
Refund Revenue 10,085,094 0 7/01/2024
Bonds
2015 Utility System
Refund Revenue 20,465,000 0 7/01/2024
Bonds
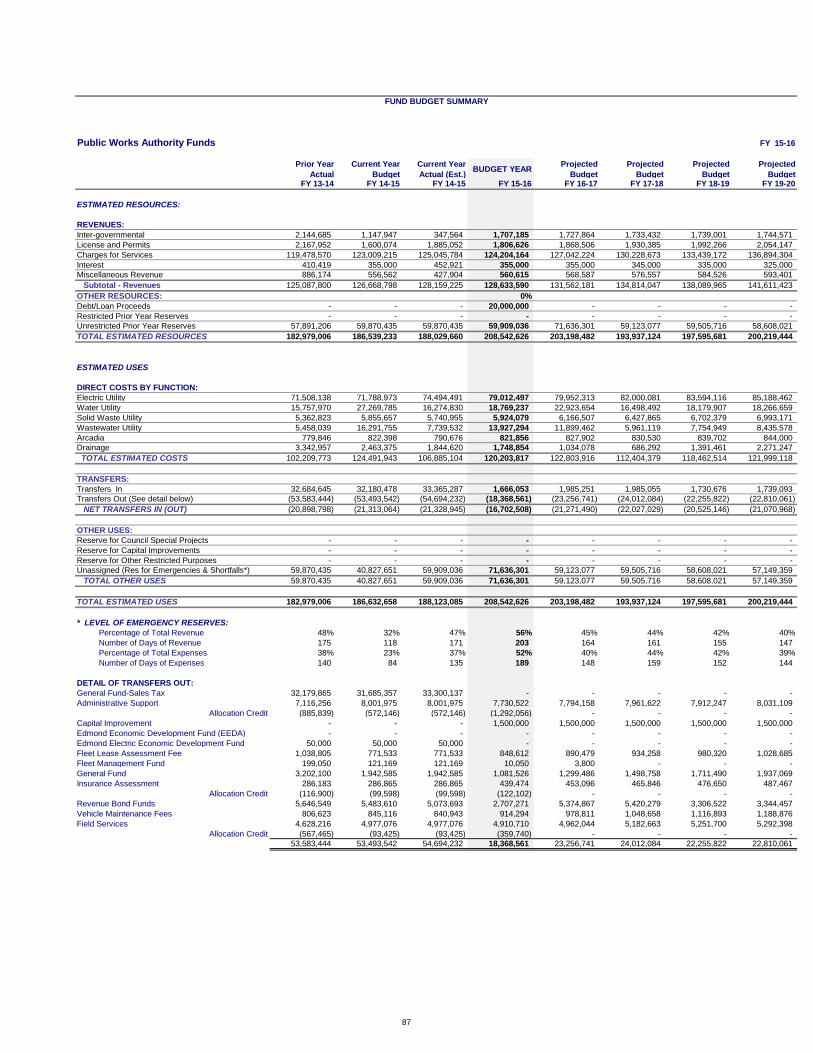
FUND BUDGET SUMMARY
Public Works Authority Funds FY 15-16
Prior Year
Actual
Current Year
Budget
Current Year
Actual (Est.)BUDGET YEAR
Projected
Budget
Projected
Budget
Projected
Budget
Projected
BudgetFY 13-14 FY 14-15 FY 14-15 FY 15-16 FY 16-17 FY 17-18 FY 18-19 FY 19-20
ESTIMATED RESOURCES:
REVENUES:
Inter-governmental 2,144,685 1,147,947 347,564 1,707,185 1,727,864 1,733,432 1,739,001 1,744,571
License and Permits 2,167,952 1,600,074 1,885,052 1,806,626 1,868,506 1,930,385 1,992,266 2,054,147
Charges for Services 119,478,570 123,009,215 125,045,784 124,204,164 127,042,224 130,228,673 133,439,172 136,894,304
Interest 410,419 355,000 452,921 355,000 355,000 345,000 335,000 325,000
Miscellaneous Revenue 886,174 556,562 427,904 560,615 568,587 576,557 584,526 593,401
Subtotal - Revenues 125,087,800 126,668,798 128,159,225 128,633,590 131,562,181 134,814,047 138,089,965 141,611,423
OTHER RESOURCES: 0%
Debt/Loan Proceeds - - - 20,000,000 - - - -
Restricted Prior Year Reserves - - - - - - - -
Unrestricted Prior Year Reserves 57,891,206 59,870,435 59,870,435 59,909,036 71,636,301 59,123,077 59,505,716 58,608,021
TOTAL ESTIMATED RESOURCES 182,979,006 186,539,233 188,029,660 208,542,626 203,198,482 193,937,124 197,595,681 200,219,444
ESTIMATED USES
DIRECT COSTS BY FUNCTION:
Electric Utility 71,508,138 71,788,973 74,494,491 79,012,497 79,952,313 82,000,081 83,594,116 85,188,462
Water Utility 15,757,970 27,269,785 16,274,830 18,769,237 22,923,654 16,498,492 18,179,907 18,266,659
Solid Waste Utility 5,362,823 5,855,657 5,740,955 5,924,079 6,166,507 6,427,865 6,702,379 6,993,171
Wastewater Utility 5,458,039 16,291,755 7,739,532 13,927,294 11,899,462 5,961,119 7,754,949 8,435,578
Arcadia 779,846 822,398 790,676 821,856 827,902 830,530 839,702 844,000
Drainage 3,342,957 2,463,375 1,844,620 1,748,854 1,034,078 686,292 1,391,461 2,271,247
TOTAL ESTIMATED COSTS 102,209,773 124,491,943 106,885,104 120,203,817 122,803,916 112,404,379 118,462,514 121,999,118
TRANSFERS:
Transfers In 32,684,645 32,180,478 33,365,287 1,666,053 1,985,251 1,985,055 1,730,676 1,739,093
Transfers Out (See detail below) (53,583,444) (53,493,542) (54,694,232) (18,368,561) (23,256,741) (24,012,084) (22,255,822) (22,810,061)
NET TRANSFERS IN (OUT) (20,898,798) (21,313,064) (21,328,945) (16,702,508) (21,271,490) (22,027,029) (20,525,146) (21,070,968)
OTHER USES:
Reserve for Council Special Projects - - - - - - - -
Reserve for Capital Improvements - - - - - - - -
Reserve for Other Restricted Purposes - - - - - - - -
Unassigned (Res for Emergencies & Shortfalls*) 59,870,435 40,827,651 59,909,036 71,636,301 59,123,077 59,505,716 58,608,021 57,149,359
TOTAL OTHER USES 59,870,435 40,827,651 59,909,036 71,636,301 59,123,077 59,505,716 58,608,021 57,149,359
TOTAL ESTIMATED USES 182,979,006 186,632,658 188,123,085 208,542,626 203,198,482 193,937,124 197,595,681 200,219,444
* LEVEL OF EMERGENCY RESERVES:
Percentage of Total Revenue 48% 32% 47% 56% 45% 44% 42% 40%
Number of Days of Revenue 175 118 171 203 164 161 155 147
Percentage of Total Expenses 38% 23% 37% 52% 40% 44% 42% 39%
Number of Days of Expenses 140 84 135 189 148 159 152 144
DETAIL OF TRANSFERS OUT:
General Fund-Sales Tax 32,179,865 31,685,357 33,300,137 - - - - -
Administrative Support 7,116,256 8,001,975 8,001,975 7,730,522 7,794,158 7,961,622 7,912,247 8,031,109
Allocation Credit (885,839) (572,146) (572,146) (1,292,056) - - - -
Capital Improvement - - - 1,500,000 1,500,000 1,500,000 1,500,000 1,500,000
Edmond Economic Development Fund (EEDA) - - - - - - - -
Edmond Electric Economic Development Fund 50,000 50,000 50,000 - - - - -
Fleet Lease Assessment Fee 1,038,805 771,533 771,533 848,612 890,479 934,258 980,320 1,028,685
Fleet Management Fund 199,050 121,169 121,169 10,050 3,800 - - -
General Fund 3,202,100 1,942,585 1,942,585 1,081,526 1,299,486 1,498,758 1,711,490 1,937,069
Insurance Assessment 286,183 286,865 286,865 439,474 453,096 465,846 476,650 487,467
Allocation Credit (116,900) (99,598) (99,598) (122,102) - - - -
Revenue Bond Funds 5,646,549 5,483,610 5,073,693 2,707,271 5,374,867 5,420,279 3,306,522 3,344,457
Vehicle Maintenance Fees 806,623 845,116 840,943 914,294 978,811 1,048,658 1,116,893 1,188,876
Field Services 4,628,216 4,977,076 4,977,076 4,910,710 4,962,044 5,182,663 5,251,700 5,292,398
Allocation Credit (567,465) (93,425) (93,425) (359,740) - - - -
53,583,444 53,493,542 54,694,232 18,368,561 23,256,741 24,012,084 22,255,822 22,810,061
87
88
Edmond Electric
2015-2016
Departmental Summary
D E P A R T M E N T A L D E S C R I P T I O N
Edmond Electric's mission is to provide high quality electric service at a competitive price responding to our customers' needs with trustworthy service.
Edmond Electric is Oklahoma's largest community-owned electric utility. Edmond Electric has served the Edmond community since 1908. Today, Edmond Electric provides electric services to more than 36,000 customers within the City of Edmond corporate city limits.
As a publicly owned power company and a city department, Edmond Electric returns profits to the community annually. Our profits support vital city services such as police, fire, streets and parks. Because of Edmond Electric's support, our community maintains a high quality of living yet has one of the lowest sales tax rates in the state for a city our size. Plus, Edmond Electric provides fast, reliable service and a reliability rating of over 99.98%!
G O A L S
1. Provide High Quality Electric Service
2. Maintain Cost Competitiveness and Responsive Rates
3. Maintain Long-Term Investment Value of System
4. Provide Responsive Customer Service
5. Provide Proactive Employee Development
S T A F F I N G (FT-PT-S)
Current Level Year 1 Year 2 Year 3 Year 4 Year 5
50.6-0-0 50.6-0-0 50.6-0-0 50.6-0-0 50.6-0-0 50.6-0-0
*Staffing Level adjusted for transfer of .4 full-time equivalent personnel to Warehouse budget.
Current level includes Utility Forester position. Year 1- 5 will reflect Utility Forester/Forester Technician split.
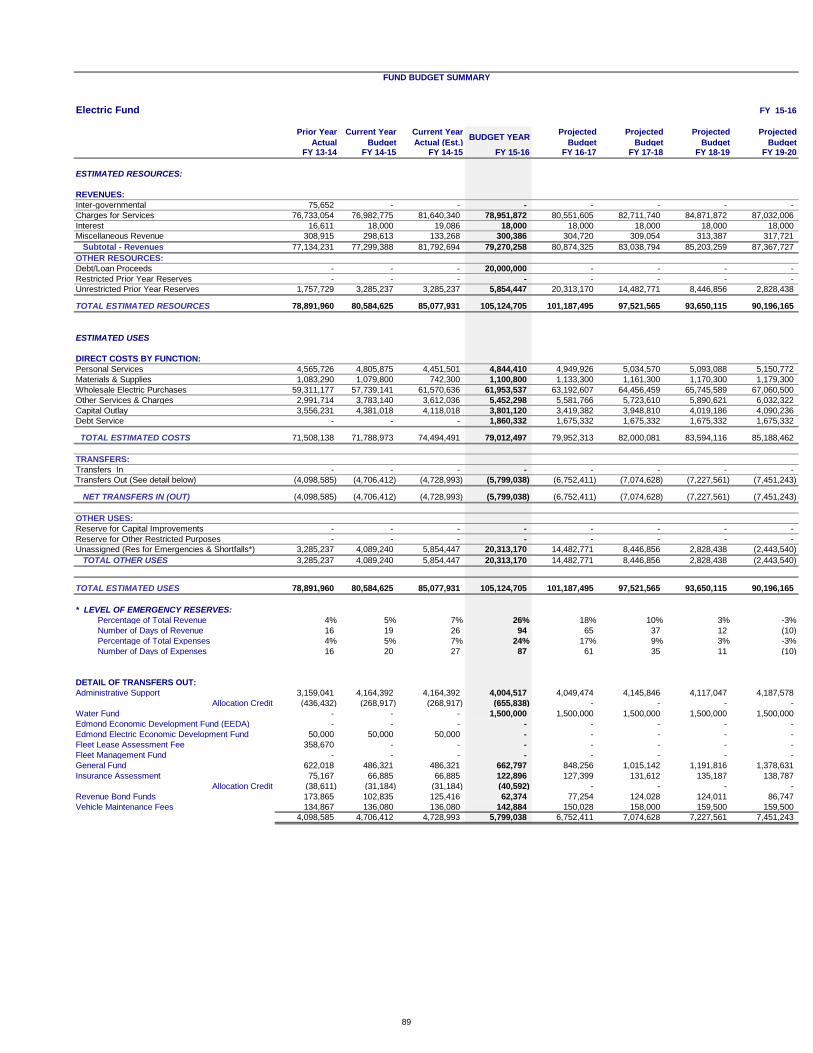
FUND BUDGET SUMMARY
Electric Fund FY 15-16
Prior Year
Actual
Current Year
Budget
Current Year
Actual (Est.)BUDGET YEAR
Projected
Budget
Projected
Budget
Projected
Budget
Projected
BudgetFY 13-14 FY 14-15 FY 14-15 FY 15-16 FY 16-17 FY 17-18 FY 18-19 FY 19-20
ESTIMATED RESOURCES:
REVENUES:
Inter-governmental 75,652 - - - - - - -
Charges for Services 76,733,054 76,982,775 81,640,340 78,951,872 80,551,605 82,711,740 84,871,872 87,032,006
Interest 16,611 18,000 19,086 18,000 18,000 18,000 18,000 18,000
Miscellaneous Revenue 308,915 298,613 133,268 300,386 304,720 309,054 313,387 317,721
Subtotal - Revenues 77,134,231 77,299,388 81,792,694 79,270,258 80,874,325 83,038,794 85,203,259 87,367,727
OTHER RESOURCES:
Debt/Loan Proceeds - - - 20,000,000 - - - -
Restricted Prior Year Reserves - - - - - - - -
Unrestricted Prior Year Reserves 1,757,729 3,285,237 3,285,237 5,854,447 20,313,170 14,482,771 8,446,856 2,828,438
TOTAL ESTIMATED RESOURCES 78,891,960 80,584,625 85,077,931 105,124,705 101,187,495 97,521,565 93,650,115 90,196,165
ESTIMATED USES
DIRECT COSTS BY FUNCTION:
Personal Services 4,565,726 4,805,875 4,451,501 4,844,410 4,949,926 5,034,570 5,093,088 5,150,772
Materials & Supplies 1,083,290 1,079,800 742,300 1,100,800 1,133,300 1,161,300 1,170,300 1,179,300
Wholesale Electric Purchases 59,311,177 57,739,141 61,570,636 61,953,537 63,192,607 64,456,459 65,745,589 67,060,500
Other Services & Charges 2,991,714 3,783,140 3,612,036 5,452,298 5,581,766 5,723,610 5,890,621 6,032,322
Capital Outlay 3,556,231 4,381,018 4,118,018 3,801,120 3,419,382 3,948,810 4,019,186 4,090,236
Debt Service - - - 1,860,332 1,675,332 1,675,332 1,675,332 1,675,332
TOTAL ESTIMATED COSTS 71,508,138 71,788,973 74,494,491 79,012,497 79,952,313 82,000,081 83,594,116 85,188,462
TRANSFERS:
Transfers In - - - - - - - -
Transfers Out (See detail below) (4,098,585) (4,706,412) (4,728,993) (5,799,038) (6,752,411) (7,074,628) (7,227,561) (7,451,243)
NET TRANSFERS IN (OUT) (4,098,585) (4,706,412) (4,728,993) (5,799,038) (6,752,411) (7,074,628) (7,227,561) (7,451,243)
OTHER USES:
Reserve for Capital Improvements - - - - - - - -
Reserve for Other Restricted Purposes - - - - - - - -
Unassigned (Res for Emergencies & Shortfalls*) 3,285,237 4,089,240 5,854,447 20,313,170 14,482,771 8,446,856 2,828,438 (2,443,540)
TOTAL OTHER USES 3,285,237 4,089,240 5,854,447 20,313,170 14,482,771 8,446,856 2,828,438 (2,443,540)
TOTAL ESTIMATED USES 78,891,960 80,584,625 85,077,931 105,124,705 101,187,495 97,521,565 93,650,115 90,196,165
* LEVEL OF EMERGENCY RESERVES:
Percentage of Total Revenue 4% 5% 7% 26% 18% 10% 3% -3%
Number of Days of Revenue 16 19 26 94 65 37 12 (10)
Percentage of Total Expenses 4% 5% 7% 24% 17% 9% 3% -3%
Number of Days of Expenses 16 20 27 87 61 35 11 (10)
DETAIL OF TRANSFERS OUT:
Administrative Support 3,159,041 4,164,392 4,164,392 4,004,517 4,049,474 4,145,846 4,117,047 4,187,578
Allocation Credit (436,432) (268,917) (268,917) (655,838) - - - -
Water Fund - - - 1,500,000 1,500,000 1,500,000 1,500,000 1,500,000
Edmond Economic Development Fund (EEDA) - - - - - - - -
Edmond Electric Economic Development Fund 50,000 50,000 50,000 - - - - -
Fleet Lease Assessment Fee 358,670 - - - - - - -
Fleet Management Fund - - - - - - - -
General Fund 622,018 486,321 486,321 662,797 848,256 1,015,142 1,191,816 1,378,631
Insurance Assessment 75,167 66,885 66,885 122,896 127,399 131,612 135,187 138,787
Allocation Credit (38,611) (31,184) (31,184) (40,592) - - - -
Revenue Bond Funds 173,865 102,835 125,416 62,374 77,254 124,028 124,011 86,747
Vehicle Maintenance Fees 134,867 136,080 136,080 142,884 150,028 158,000 159,500 159,500
4,098,585 4,706,412 4,728,993 5,799,038 6,752,411 7,074,628 7,227,561 7,451,243
89
90
Water Resources
2015-2016
Departmental Summary
D E P A R T M E N T A L D E S C R I P T I O N
Water Resources has three (3) divisions: 1. Water Production comprised of the Edmond
Water Plant, water towers, storage tanks, and water pumping stations; 2. Water Wells charged
with operation and maintenance of the City’s 56 water wells; and 3. Wastewater Treatment,
consisting of the Coffee Creek Wastewater Treatment Plant and 9 lift stations. The overall
mission of Water Resources is to meet the water and wastewater needs of Edmond’s
customers by providing effective, efficient and trustworthy water and wastewater services.
G O A L S
1. Compliance with EPA and ODEQ Regulations, Reporting and Rules
2. Implementation of the Water and Wastewater Master Plan
3. Program Development
4. Work Process Improvement
Water Quality:
1) Drinking Water Compliance Rate (percent): 100 X (number of days in full compliance for the
year ÷ 365 days). Goal: 100%
2) Wastewater Treatment Effectiveness Rate (percent): 100 X (365 – total number of standard non-
compliance days ÷ 365 days). Goal: 100%
3) Chemical use per volume delivered/processed: Amount of chemicals used ÷ MG
delivered/processed.
Customer Service:
1) Drinking water flow and pressure: Flow and pressure will be maintained in adequate volumes to
meet customer needs for potable, fire safety and non-potable uses. This will be determined by
dividing days experiencing water volume issues by 365 days per year.
2) Customer service complaint rate: 1,000 X (customer service associated complaints ÷ number of
active customer accounts).
Continuous Improvement:
1) Planned maintenance ratio by hours (percent): 100 X ((hours of planned maintenance) ÷ (hours of
planned + corrective maintenance)). Goal: 75% Planned Maintenance
3) Training hours per employee: Total of qualified formal training hours for all employees ÷ total
FTE’s worked by employees during the year.
S T A F F I N G (FT-PT-S)
Current Level Year 1 Year 2 Year 3 Year 4 Year 5 31-0-0 32-0-0 32-0-0 32-0-0 32-0-0 32-0-0
*Includes Water Plant, Water Wells, and Wastewater Plant

FUND BUDGET SUMMARY
Water Fund FY 15-16
Prior Year
Actual
Current Year
Budget
Current Year
Actual (Est.)BUDGET YEAR
Projected
Budget
Projected
Budget
Projected
Budget
Projected
Budget
FY 13-14 FY 14-15 FY 14-15 FY 15-16 FY 16-17 FY 17-18 FY 18-19 FY 19-20
ESTIMATED RESOURCES:
REVENUES:
Inter-governmental - - - - - - - -
License & Permits:
Water Tap Fees 278,876 204,857 270,627 246,907 253,915 260,923 267,931 274,940
Capacity Fees 1,078,256 802,996 920,600 878,918 904,226 929,533 954,840 980,148
Charges for Services 21,418,990 23,371,959 21,304,681 23,980,954 24,565,310 25,215,973 25,866,636 26,517,299
Interest 240,883 180,000 258,951 180,000 180,000 180,000 180,000 180,000
Miscellaneous Revenue 511,850 209,359 246,522 210,104 212,206 214,308 216,408 219,414
Subtotal - Revenues 23,528,855 24,769,171 23,001,381 25,496,883 26,115,657 26,800,737 27,485,815 28,171,801
OTHER RESOURCES:
Debt/Loan Proceeds - - - - - - - -
Restricted Prior Year Reserves - - - - - - - -
Unrestricted Prior Year Reserves 32,413,463 29,085,179 29,085,179 25,269,322 26,942,243 22,008,902 24,083,709 26,964,440
TOTAL ESTIMATED RESOURCES 55,942,318 53,854,350 52,086,560 50,766,205 53,057,900 48,809,639 51,569,524 55,136,241
ESTIMATED USES
DIRECT COSTS BY FUNCTION:
Personal Services 1,512,596 1,656,370 1,567,745 1,773,403 1,809,356 1,845,979 1,880,166 1,915,387
Materials & Supplies 587,324 770,944 662,740 775,439 795,943 813,657 837,469 863,781
Other Services & Charges 5,115,796 6,286,595 5,658,072 4,089,980 4,163,679 4,280,824 4,403,957 4,529,809
Capital Outlay 7,308,344 16,863,707 6,694,104 10,440,007 14,462,007 7,864,007 9,364,007 9,264,007
Debt Service 1,233,910 1,692,169 1,692,169 1,690,408 1,692,669 1,694,025 1,694,308 1,693,675
Debt Issuance Costs - - - - - - - -
Debt Reserves - - - - - - - -
TOTAL ESTIMATED COSTS 15,757,970 27,269,785 16,274,830 18,769,237 22,923,654 16,498,492 18,179,907 18,266,659
TRANSFERS:
Transfers In 32,179,865 31,685,357 33,300,137 1,500,000 1,500,000 1,500,000 1,500,000 1,500,000
Transfers Out (See detail below) (43,279,033) (42,307,133) (43,842,545) (6,554,725) (9,625,344) (9,727,438) (7,925,178) (8,066,134)
NET TRANSFERS IN (OUT) (11,099,168) (10,621,776) (10,542,408) (5,054,725) (8,125,344) (8,227,438) (6,425,178) (6,566,134)
OTHER USES:
Reserve for Council Special Projects - - - - - - - -
Reserve for Capital Improvements - - - - - - - -
Reserve for Other Restricted Purposes - - - - - - - -
Unassigned (Res for Emergencies & Shortfalls*) 29,085,179 15,962,789 25,269,322 26,942,243 22,008,902 24,083,709 26,964,440 30,303,448
TOTAL OTHER USES 29,085,179 15,962,789 25,269,322 26,942,243 22,008,902 24,083,709 26,964,440 30,303,448
TOTAL ESTIMATED USES 55,942,318 53,854,350 52,086,560 50,766,205 53,057,900 48,809,639 51,569,524 55,136,241
* LEVEL OF EMERGENCY RESERVES:
Percentage of Total Revenue 124% 64% 110% 106% 84% 90% 98% 108%
Number of Days of Revenue 451 235 401 386 308 328 358 393
Percentage of Total Expenses 108% 42% 94% 106% 68% 92% 103% 115%
Number of Days of Expenses 395 154 344 388 247 335 377 420
DETAIL OF TRANSFERS OUT:
General Fund - Sales Tax 32,179,865 31,685,357 33,300,137 - - - - -
General Fund 2,100,000 1,074,416 1,074,416 63,992 78,350 88,813 101,954 116,763
Revenue Bond Funds 4,672,351 4,787,206 4,717,011 2,317,672 4,646,224 4,645,029 2,789,588 2,855,581
Administrative Support Fund 1,884,157 1,786,685 1,786,685 1,736,515 1,758,597 1,800,770 1,795,355 1,824,022
Allocation Credit (229,616) (143,914) (143,914) (290,144) - - - -
Insurance Assessment 65,891 55,533 55,533 101,890 104,350 106,654 108,607 110,559
Allocation Credit (23,473) (17,928) (17,928) (22,097) - - - -
Vehicle Maintenance Fees 24,122 30,201 21,028 40,000 41,200 42,437 43,709 45,021
Fleet Lease Assessment Fee 38,367 44,867 44,867 52,509 54,882 57,374 59,990 62,738
Fleet Management Fund 39,050 121,169 121,169 10,050 3,800 - - -
Field Services Fund 2,648,762 2,896,586 2,896,586 2,785,431 2,937,941 2,986,361 3,025,975 3,051,450
Allocation Credit (120,442) (13,045) (13,045) (241,093) - - - -
43,279,033 42,307,133 43,842,545 6,554,725 9,625,344 9,727,438 7,925,178 8,066,134
91
92
Solid Waste
2015-2016
Departmental Summary
D E P A R T M E N T A L D E S C R I P T I O N
The Solid Waste Utility’s vision is to continuously improve solid waste services for the benefit of delivering “Trustworthy Service” to citizens.
Solid Waste department delivers safe, high quality, cost effective trustworthy solid waste collection service to our customers. Department focuses on streamlined solid waste route management and promotes safe vehicle operations with employee safety incentive programs. The department is accelerating use of new technologies to continuously improve delivery and lower cost of service to our customers.
1. Provide quality and consistent customer service to internal and external customers.
2. Reduce maintenance costs/overtime within the department.
3. Improve overall department performance with emphasis on work practices review
and routing efficiencies.
4. Reduce departmental maintenance costs by 10 %.
5. Improve department safety by reducing number of vehicle accidents.
6. Promote continuous improvement within the department.
7. Make necessary changes in equipment to modernize the fleet.
S T A F F I N G (FT-PT-S)
Current Level Year 1 Year 2 Year 3 Year 4 Year 5 20-0-0 20-0-0 20-0-0 20-0-0 20-0-0 20-0-0
*Includes Solid Waste Administration, Residential, Commercial, Recycling, and Roll Off
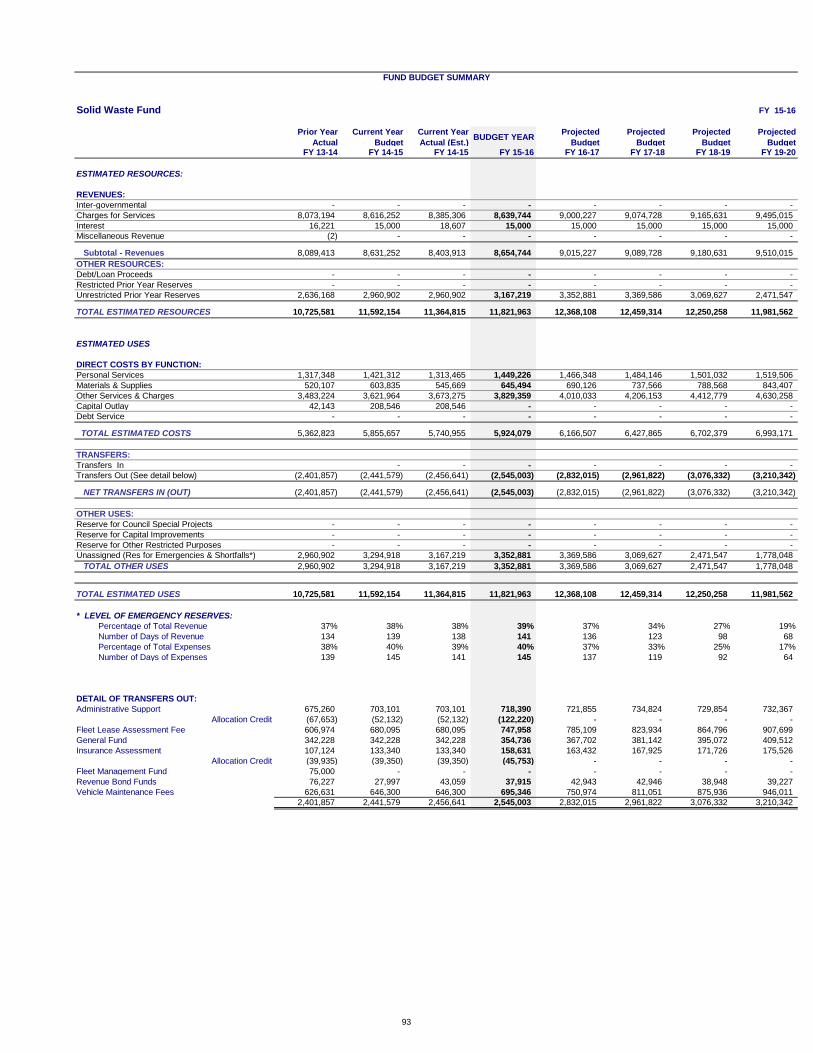
FUND BUDGET SUMMARY
Solid Waste Fund FY 15-16
Prior Year
Actual
Current Year
Budget
Current Year
Actual (Est.)BUDGET YEAR
Projected
Budget
Projected
Budget
Projected
Budget
Projected
BudgetFY 13-14 FY 14-15 FY 14-15 FY 15-16 FY 16-17 FY 17-18 FY 18-19 FY 19-20
ESTIMATED RESOURCES:
REVENUES:
Inter-governmental - - - - - - - -
Charges for Services 8,073,194 8,616,252 8,385,306 8,639,744 9,000,227 9,074,728 9,165,631 9,495,015
Interest 16,221 15,000 18,607 15,000 15,000 15,000 15,000 15,000
Miscellaneous Revenue (2) - - - - - - -
Subtotal - Revenues 8,089,413 8,631,252 8,403,913 8,654,744 9,015,227 9,089,728 9,180,631 9,510,015
OTHER RESOURCES:
Debt/Loan Proceeds - - - - - - - -
Restricted Prior Year Reserves - - - - - - - -
Unrestricted Prior Year Reserves 2,636,168 2,960,902 2,960,902 3,167,219 3,352,881 3,369,586 3,069,627 2,471,547
TOTAL ESTIMATED RESOURCES 10,725,581 11,592,154 11,364,815 11,821,963 12,368,108 12,459,314 12,250,258 11,981,562
ESTIMATED USES
DIRECT COSTS BY FUNCTION:
Personal Services 1,317,348 1,421,312 1,313,465 1,449,226 1,466,348 1,484,146 1,501,032 1,519,506
Materials & Supplies 520,107 603,835 545,669 645,494 690,126 737,566 788,568 843,407
Other Services & Charges 3,483,224 3,621,964 3,673,275 3,829,359 4,010,033 4,206,153 4,412,779 4,630,258
Capital Outlay 42,143 208,546 208,546 - - - - -
Debt Service - - - - - - - -
TOTAL ESTIMATED COSTS 5,362,823 5,855,657 5,740,955 5,924,079 6,166,507 6,427,865 6,702,379 6,993,171
TRANSFERS:
Transfers In - - - - - - -
Transfers Out (See detail below) (2,401,857) (2,441,579) (2,456,641) (2,545,003) (2,832,015) (2,961,822) (3,076,332) (3,210,342)
NET TRANSFERS IN (OUT) (2,401,857) (2,441,579) (2,456,641) (2,545,003) (2,832,015) (2,961,822) (3,076,332) (3,210,342)
OTHER USES:
Reserve for Council Special Projects - - - - - - - -
Reserve for Capital Improvements - - - - - - - -
Reserve for Other Restricted Purposes - - - - - - - -
Unassigned (Res for Emergencies & Shortfalls*) 2,960,902 3,294,918 3,167,219 3,352,881 3,369,586 3,069,627 2,471,547 1,778,048
TOTAL OTHER USES 2,960,902 3,294,918 3,167,219 3,352,881 3,369,586 3,069,627 2,471,547 1,778,048
TOTAL ESTIMATED USES 10,725,581 11,592,154 11,364,815 11,821,963 12,368,108 12,459,314 12,250,258 11,981,562
* LEVEL OF EMERGENCY RESERVES:
Percentage of Total Revenue 37% 38% 38% 39% 37% 34% 27% 19%
Number of Days of Revenue 134 139 138 141 136 123 98 68
Percentage of Total Expenses 38% 40% 39% 40% 37% 33% 25% 17%
Number of Days of Expenses 139 145 141 145 137 119 92 64
DETAIL OF TRANSFERS OUT:
Administrative Support 675,260 703,101 703,101 718,390 721,855 734,824 729,854 732,367
Allocation Credit (67,653) (52,132) (52,132) (122,220) - - - -
Fleet Lease Assessment Fee 606,974 680,095 680,095 747,958 785,109 823,934 864,796 907,699
General Fund 342,228 342,228 342,228 354,736 367,702 381,142 395,072 409,512
Insurance Assessment 107,124 133,340 133,340 158,631 163,432 167,925 171,726 175,526
Allocation Credit (39,935) (39,350) (39,350) (45,753) - - - -
Fleet Management Fund 75,000 - - - - - - -
Revenue Bond Funds 76,227 27,997 43,059 37,915 42,943 42,946 38,948 39,227
Vehicle Maintenance Fees 626,631 646,300 646,300 695,346 750,974 811,051 875,936 946,011
2,401,857 2,441,579 2,456,641 2,545,003 2,832,015 2,961,822 3,076,332 3,210,342
93
94
Wastewater Treatment
2015-2016
Departmental Summary
D E P A R T M E N T A L D E S C R I P T I O N
Wastewater Treatment is a division of the Water Resources Department. It is comprised of
the Coffee Creek Wastewater Treatment Plant and Lift Stations. The overall mission of
Water Resources is:
“To meet the water and wastewater needs of Edmond’s customers by providing effective,
efficient, and trustworthy water and wastewater services.”
The Wastewater Treatment Division provides operations, maintenance, and monitoring of the
Coffee Creek Wastewater Treatment Plant and 9 lift stations. Divisional staff is eight (8)
persons. Those positions, and divisional performance measures, are included in the Water
Resources Departmental Summary information.
G O A L S
1. Compliance with EPA and ODEQ Regulations, Reporting and Rules
2. Implementation of the Water and Wastewater Master Plan
3. Program Development
4. Work Process Improvement
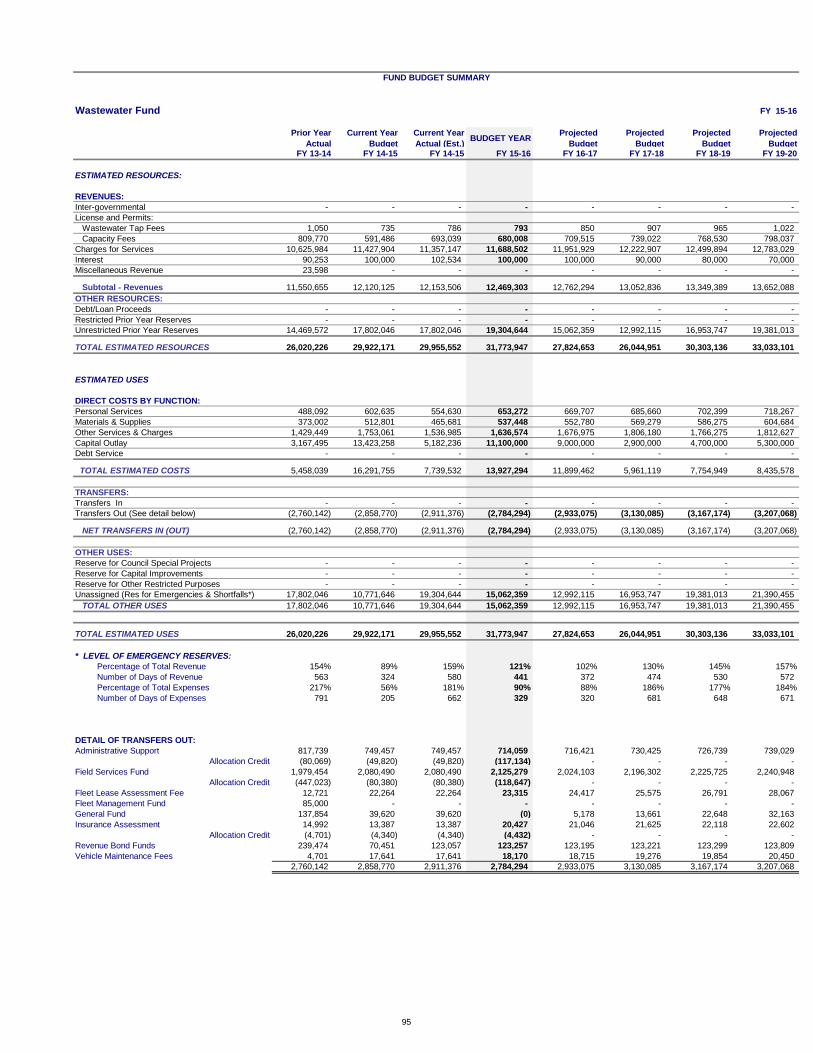
FUND BUDGET SUMMARY
Wastewater Fund FY 15-16
Prior Year
Actual
Current Year
Budget
Current Year
Actual (Est.)BUDGET YEAR
Projected
Budget
Projected
Budget
Projected
Budget
Projected
BudgetFY 13-14 FY 14-15 FY 14-15 FY 15-16 FY 16-17 FY 17-18 FY 18-19 FY 19-20
ESTIMATED RESOURCES:
REVENUES:
Inter-governmental - - - - - - - -
License and Permits:
Wastewater Tap Fees 1,050 735 786 793 850 907 965 1,022
Capacity Fees 809,770 591,486 693,039 680,008 709,515 739,022 768,530 798,037
Charges for Services 10,625,984 11,427,904 11,357,147 11,688,502 11,951,929 12,222,907 12,499,894 12,783,029
Interest 90,253 100,000 102,534 100,000 100,000 90,000 80,000 70,000
Miscellaneous Revenue 23,598 - - - - - - -
Subtotal - Revenues 11,550,655 12,120,125 12,153,506 12,469,303 12,762,294 13,052,836 13,349,389 13,652,088
OTHER RESOURCES:
Debt/Loan Proceeds - - - - - - - -
Restricted Prior Year Reserves - - - - - - - -
Unrestricted Prior Year Reserves 14,469,572 17,802,046 17,802,046 19,304,644 15,062,359 12,992,115 16,953,747 19,381,013
TOTAL ESTIMATED RESOURCES 26,020,226 29,922,171 29,955,552 31,773,947 27,824,653 26,044,951 30,303,136 33,033,101
ESTIMATED USES
DIRECT COSTS BY FUNCTION:
Personal Services 488,092 602,635 554,630 653,272 669,707 685,660 702,399 718,267
Materials & Supplies 373,002 512,801 465,681 537,448 552,780 569,279 586,275 604,684
Other Services & Charges 1,429,449 1,753,061 1,536,985 1,636,574 1,676,975 1,806,180 1,766,275 1,812,627
Capital Outlay 3,167,495 13,423,258 5,182,236 11,100,000 9,000,000 2,900,000 4,700,000 5,300,000
Debt Service - - - - - - - -
TOTAL ESTIMATED COSTS 5,458,039 16,291,755 7,739,532 13,927,294 11,899,462 5,961,119 7,754,949 8,435,578
TRANSFERS:
Transfers In - - - - - - - -
Transfers Out (See detail below) (2,760,142) (2,858,770) (2,911,376) (2,784,294) (2,933,075) (3,130,085) (3,167,174) (3,207,068)
NET TRANSFERS IN (OUT) (2,760,142) (2,858,770) (2,911,376) (2,784,294) (2,933,075) (3,130,085) (3,167,174) (3,207,068)
OTHER USES:
Reserve for Council Special Projects - - - - - - - -
Reserve for Capital Improvements - - - - - - - -
Reserve for Other Restricted Purposes - - - - - - - -
Unassigned (Res for Emergencies & Shortfalls*) 17,802,046 10,771,646 19,304,644 15,062,359 12,992,115 16,953,747 19,381,013 21,390,455
TOTAL OTHER USES 17,802,046 10,771,646 19,304,644 15,062,359 12,992,115 16,953,747 19,381,013 21,390,455
TOTAL ESTIMATED USES 26,020,226 29,922,171 29,955,552 31,773,947 27,824,653 26,044,951 30,303,136 33,033,101
* LEVEL OF EMERGENCY RESERVES:
Percentage of Total Revenue 154% 89% 159% 121% 102% 130% 145% 157%
Number of Days of Revenue 563 324 580 441 372 474 530 572
Percentage of Total Expenses 217% 56% 181% 90% 88% 186% 177% 184%
Number of Days of Expenses 791 205 662 329 320 681 648 671
DETAIL OF TRANSFERS OUT:
Administrative Support 817,739 749,457 749,457 714,059 716,421 730,425 726,739 739,029
Allocation Credit (80,069) (49,820) (49,820) (117,134) - - - -
Field Services Fund 1,979,454 2,080,490 2,080,490 2,125,279 2,024,103 2,196,302 2,225,725 2,240,948
Allocation Credit (447,023) (80,380) (80,380) (118,647) - - - -
Fleet Lease Assessment Fee 12,721 22,264 22,264 23,315 24,417 25,575 26,791 28,067
Fleet Management Fund 85,000 - - - - - - -
General Fund 137,854 39,620 39,620 (0) 5,178 13,661 22,648 32,163
Insurance Assessment 14,992 13,387 13,387 20,427 21,046 21,625 22,118 22,602
Allocation Credit (4,701) (4,340) (4,340) (4,432) - - - -
Revenue Bond Funds 239,474 70,451 123,057 123,257 123,195 123,221 123,299 123,809
Vehicle Maintenance Fees 4,701 17,641 17,641 18,170 18,715 19,276 19,854 20,450
2,760,142 2,858,770 2,911,376 2,784,294 2,933,075 3,130,085 3,167,174 3,207,068
95
96
Arcadia Lake
2015-2016
Departmental Summary
D E P A R T M E N T A L D E S C R I P T I O N
Arcadia Lake provides quality outdoor recreational experiences such as, camping, boating,
swimming, hiking/biking, fishing, hunting and picnicking to the community.
1. Search for New Revenue Sources
2. Improve Internal Operations to Best Meet Customer Needs
3. Provide Quality Maintenance Services
4. Identify Capital Improvements and schedule appropriately.
5. Engage in Partnerships to Benefit Arcadia Lake services.
S T A F F I N G (FT-PT-S)
Current Level Year 1 Year 2 Year 3 Year 4 Year 5 6-4-23 6-5-23 6-5-23 6-5-23 6-5-27 6-5-27
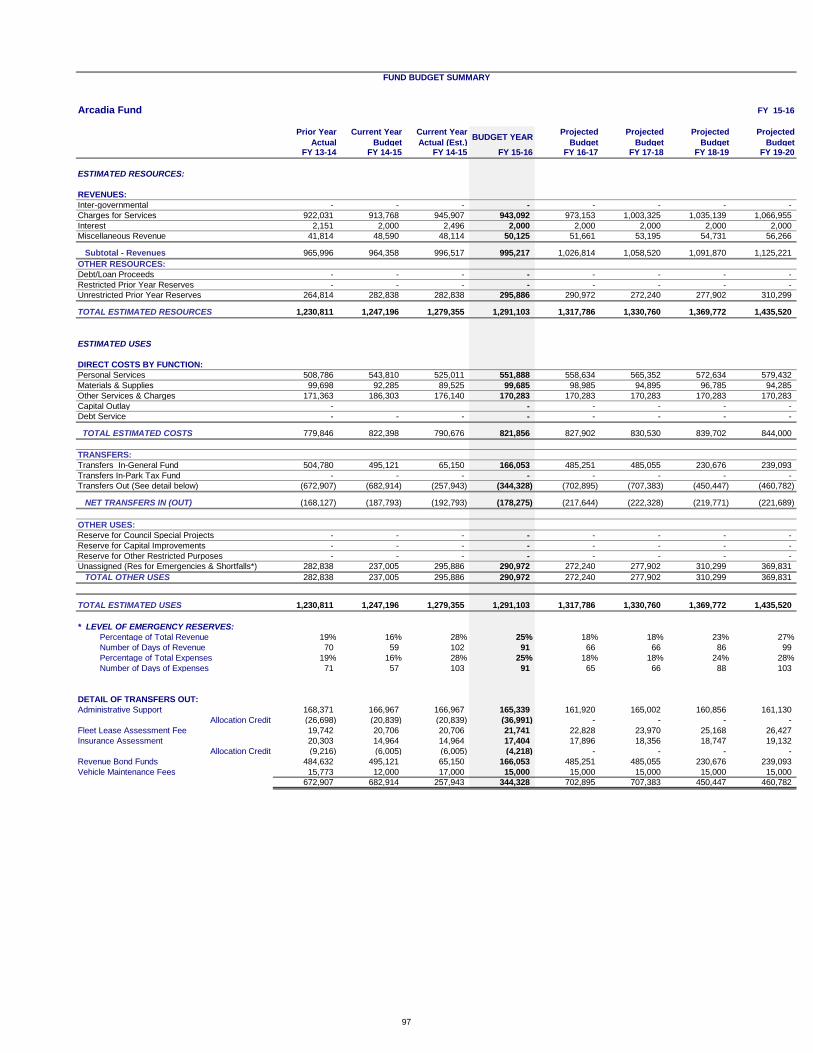
FUND BUDGET SUMMARY
Arcadia Fund FY 15-16
Prior Year
Actual
Current Year
Budget
Current Year
Actual (Est.)BUDGET YEAR
Projected
Budget
Projected
Budget
Projected
Budget
Projected
BudgetFY 13-14 FY 14-15 FY 14-15 FY 15-16 FY 16-17 FY 17-18 FY 18-19 FY 19-20
ESTIMATED RESOURCES:
REVENUES:
Inter-governmental - - - - - - - -
Charges for Services 922,031 913,768 945,907 943,092 973,153 1,003,325 1,035,139 1,066,955
Interest 2,151 2,000 2,496 2,000 2,000 2,000 2,000 2,000
Miscellaneous Revenue 41,814 48,590 48,114 50,125 51,661 53,195 54,731 56,266
Subtotal - Revenues 965,996 964,358 996,517 995,217 1,026,814 1,058,520 1,091,870 1,125,221
OTHER RESOURCES:
Debt/Loan Proceeds - - - - - - - -
Restricted Prior Year Reserves - - - - - - - -
Unrestricted Prior Year Reserves 264,814 282,838 282,838 295,886 290,972 272,240 277,902 310,299
TOTAL ESTIMATED RESOURCES 1,230,811 1,247,196 1,279,355 1,291,103 1,317,786 1,330,760 1,369,772 1,435,520
ESTIMATED USES
DIRECT COSTS BY FUNCTION:
Personal Services 508,786 543,810 525,011 551,888 558,634 565,352 572,634 579,432
Materials & Supplies 99,698 92,285 89,525 99,685 98,985 94,895 96,785 94,285
Other Services & Charges 171,363 186,303 176,140 170,283 170,283 170,283 170,283 170,283
Capital Outlay - - - - - -
Debt Service - - - - - - - -
TOTAL ESTIMATED COSTS 779,846 822,398 790,676 821,856 827,902 830,530 839,702 844,000
TRANSFERS:
Transfers In-General Fund 504,780 495,121 65,150 166,053 485,251 485,055 230,676 239,093
Transfers In-Park Tax Fund - - - - - - - -
Transfers Out (See detail below) (672,907) (682,914) (257,943) (344,328) (702,895) (707,383) (450,447) (460,782)
NET TRANSFERS IN (OUT) (168,127) (187,793) (192,793) (178,275) (217,644) (222,328) (219,771) (221,689)
OTHER USES:
Reserve for Council Special Projects - - - - - - - -
Reserve for Capital Improvements - - - - - - - -
Reserve for Other Restricted Purposes - - - - - - - -
Unassigned (Res for Emergencies & Shortfalls*) 282,838 237,005 295,886 290,972 272,240 277,902 310,299 369,831
TOTAL OTHER USES 282,838 237,005 295,886 290,972 272,240 277,902 310,299 369,831
TOTAL ESTIMATED USES 1,230,811 1,247,196 1,279,355 1,291,103 1,317,786 1,330,760 1,369,772 1,435,520
* LEVEL OF EMERGENCY RESERVES:
Percentage of Total Revenue 19% 16% 28% 25% 18% 18% 23% 27%
Number of Days of Revenue 70 59 102 91 66 66 86 99
Percentage of Total Expenses 19% 16% 28% 25% 18% 18% 24% 28%
Number of Days of Expenses 71 57 103 91 65 66 88 103
DETAIL OF TRANSFERS OUT:
Administrative Support 168,371 166,967 166,967 165,339 161,920 165,002 160,856 161,130
Allocation Credit (26,698) (20,839) (20,839) (36,991) - - - -
Fleet Lease Assessment Fee 19,742 20,706 20,706 21,741 22,828 23,970 25,168 26,427
Insurance Assessment 20,303 14,964 14,964 17,404 17,896 18,356 18,747 19,132
Allocation Credit (9,216) (6,005) (6,005) (4,218) - - - -
Revenue Bond Funds 484,632 495,121 65,150 166,053 485,251 485,055 230,676 239,093
Vehicle Maintenance Fees 15,773 12,000 17,000 15,000 15,000 15,000 15,000 15,000
672,907 682,914 257,943 344,328 702,895 707,383 450,447 460,782
97

98
Drainage Utility
2015-2016
Departmental Summary
D E P A R T M E N T A L D E S C R I P T I O N
Drainage Utility is one of the three divisions comprising the Engineering Department. It is
funded by the stormwater drainage system service charge that is collected through the utility
billing system. Drainage Utility focuses on all aspects of stormwater drainage including storm-
water planning, floodplain management, and environmental protection of Edmond’s waterways.
.
1. Work towards making the public aware of the benefits as well as the hazards of
floodplains using public outreach activities.
2. Work towards making the public aware of what it can do to help improve the quality of
stormwater runoff using public outreach activities.
3. Improve the quality of Edmond’s waterways through an Illicit Discharge Detection and
Elimination (IDDE) Program to curtail pollution.
S T A F F I N G (FT-PT-S)
Current Level Year 1 Year 2 Year 3 Year 4 Year 5
5 - 0 - 0 5 - 0 - 0 5 - 0 - 0 5 - 0 - 0 5 - 0 - 0 5 - 0 - 0
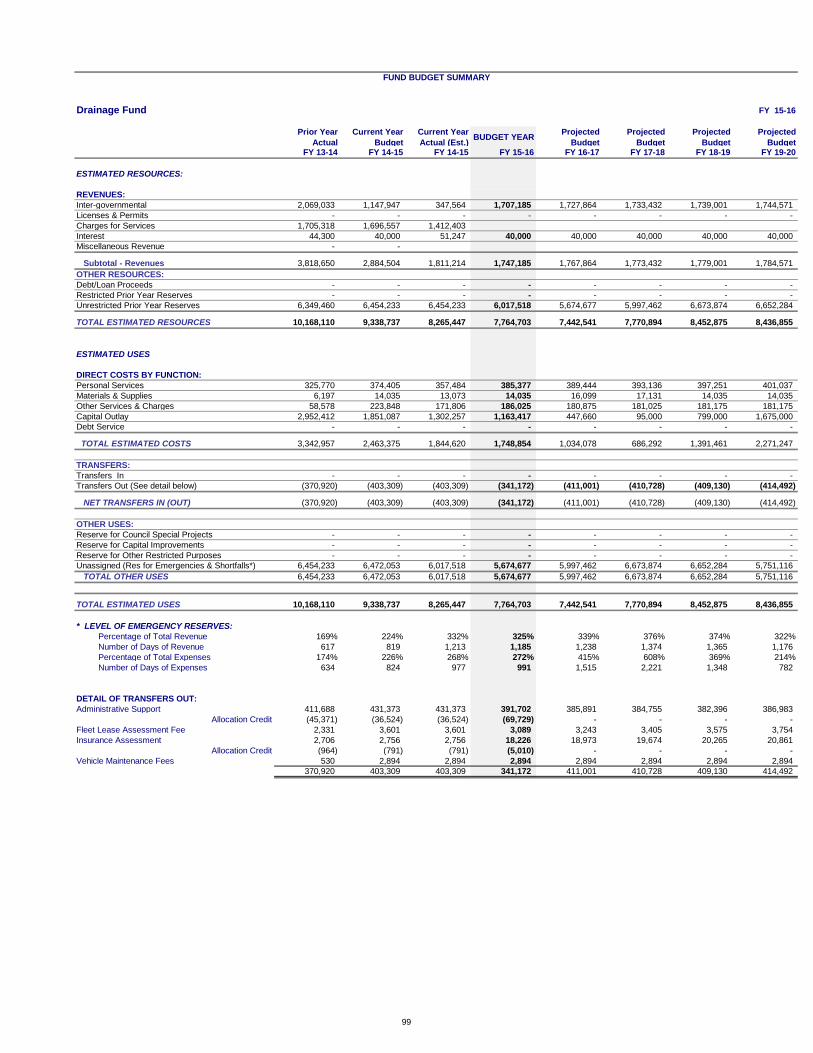
FUND BUDGET SUMMARY
Drainage Fund FY 15-16
Prior Year
Actual
Current Year
Budget
Current Year
Actual (Est.)BUDGET YEAR
Projected
Budget
Projected
Budget
Projected
Budget
Projected
BudgetFY 13-14 FY 14-15 FY 14-15 FY 15-16 FY 16-17 FY 17-18 FY 18-19 FY 19-20
ESTIMATED RESOURCES:
REVENUES:
Inter-governmental 2,069,033 1,147,947 347,564 1,707,185 1,727,864 1,733,432 1,739,001 1,744,571
Licenses & Permits - - - - - - - -
Charges for Services 1,705,318 1,696,557 1,412,403
Interest 44,300 40,000 51,247 40,000 40,000 40,000 40,000 40,000
Miscellaneous Revenue - -
Subtotal - Revenues 3,818,650 2,884,504 1,811,214 1,747,185 1,767,864 1,773,432 1,779,001 1,784,571
OTHER RESOURCES:
Debt/Loan Proceeds - - - - - - - -
Restricted Prior Year Reserves - - - - - - - -
Unrestricted Prior Year Reserves 6,349,460 6,454,233 6,454,233 6,017,518 5,674,677 5,997,462 6,673,874 6,652,284
TOTAL ESTIMATED RESOURCES 10,168,110 9,338,737 8,265,447 7,764,703 7,442,541 7,770,894 8,452,875 8,436,855
ESTIMATED USES
DIRECT COSTS BY FUNCTION:
Personal Services 325,770 374,405 357,484 385,377 389,444 393,136 397,251 401,037
Materials & Supplies 6,197 14,035 13,073 14,035 16,099 17,131 14,035 14,035
Other Services & Charges 58,578 223,848 171,806 186,025 180,875 181,025 181,175 181,175
Capital Outlay 2,952,412 1,851,087 1,302,257 1,163,417 447,660 95,000 799,000 1,675,000
Debt Service - - - - - - - -
TOTAL ESTIMATED COSTS 3,342,957 2,463,375 1,844,620 1,748,854 1,034,078 686,292 1,391,461 2,271,247
TRANSFERS:
Transfers In - - - - - - - -
Transfers Out (See detail below) (370,920) (403,309) (403,309) (341,172) (411,001) (410,728) (409,130) (414,492)
NET TRANSFERS IN (OUT) (370,920) (403,309) (403,309) (341,172) (411,001) (410,728) (409,130) (414,492)
OTHER USES:
Reserve for Council Special Projects - - - - - - - -
Reserve for Capital Improvements - - - - - - - -
Reserve for Other Restricted Purposes - - - - - - - -
Unassigned (Res for Emergencies & Shortfalls*) 6,454,233 6,472,053 6,017,518 5,674,677 5,997,462 6,673,874 6,652,284 5,751,116
TOTAL OTHER USES 6,454,233 6,472,053 6,017,518 5,674,677 5,997,462 6,673,874 6,652,284 5,751,116
TOTAL ESTIMATED USES 10,168,110 9,338,737 8,265,447 7,764,703 7,442,541 7,770,894 8,452,875 8,436,855
* LEVEL OF EMERGENCY RESERVES:
Percentage of Total Revenue 169% 224% 332% 325% 339% 376% 374% 322%
Number of Days of Revenue 617 819 1,213 1,185 1,238 1,374 1,365 1,176
Percentage of Total Expenses 174% 226% 268% 272% 415% 608% 369% 214%
Number of Days of Expenses 634 824 977 991 1,515 2,221 1,348 782
DETAIL OF TRANSFERS OUT:
Administrative Support 411,688 431,373 431,373 391,702 385,891 384,755 382,396 386,983
Allocation Credit (45,371) (36,524) (36,524) (69,729) - - - -
Fleet Lease Assessment Fee 2,331 3,601 3,601 3,089 3,243 3,405 3,575 3,754
Insurance Assessment 2,706 2,756 2,756 18,226 18,973 19,674 20,265 20,861
Allocation Credit (964) (791) (791) (5,010) - - - -
Vehicle Maintenance Fees 530 2,894 2,894 2,894 2,894 2,894 2,894 2,894
370,920 403,309 403,309 341,172 411,001 410,728 409,130 414,492
99
100
EPWA Sewer Impact Fund
2015-2016
Departmental Summary
D E P A R T M E N T A L D E S C R I P T I O N
The EPWA Sewer Impact Fund is used to account for impact fees collected on new developments in accordance with ordinance #2077. This ordinance, which was repealed in July 2002, established a fee of $100 per toilet to be used for the sole purpose of acquiring, equipping, and/or making capital improvements to the City’s sewer facilities. The funds may also be used for debt service under certain conditions.
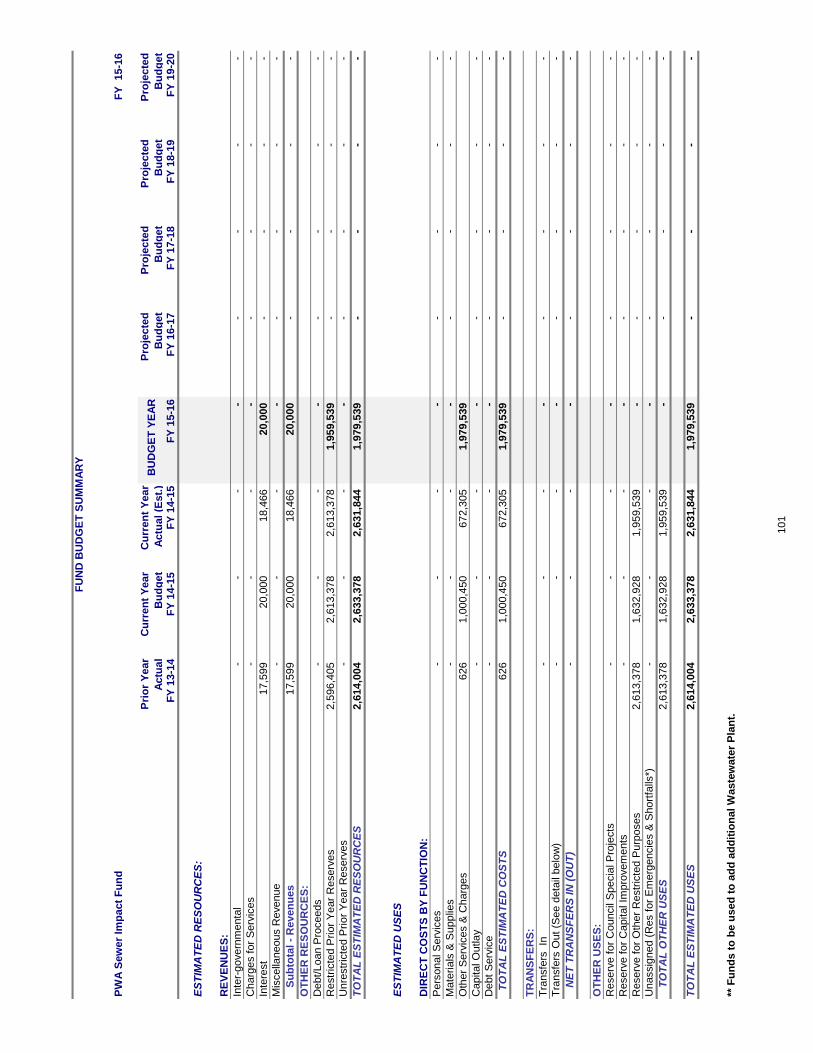
FU
ND
BU
DG
ET
SU
MM
AR
Y
PW
A S
ew
er
Imp
act
Fu
nd
FY
15-1
6
Pri
or
Year
Actu
al
Cu
rren
t Y
ear
Bu
dg
et
Cu
rren
t Y
ear
Actu
al
(Est.
)B
UD
GE
T Y
EA
RP
roje
cte
d
Bu
dg
et
Pro
jecte
d
Bu
dg
et
Pro
jecte
d
Bu
dg
et
Pro
jecte
d
Bu
dg
et
FY
13-1
4F
Y 1
4-1
5F
Y 1
4-1
5F
Y 1
5-1
6F
Y 1
6-1
7F
Y 1
7-1
8F
Y 1
8-1
9F
Y 1
9-2
0
ES
TIM
AT
ED
RE
SO
UR
CE
S:
RE
VE
NU
ES
:
Inte
r-govern
menta
l-
-
-
-
-
-
-
-
Charg
es f
or
Serv
ices
-
-
-
-
-
-
-
-
Inte
rest
17,5
99
20,0
00
18,4
66
20,0
00
-
-
-
-
Mis
cella
neous R
evenue
-
-
-
-
-
-
-
-
S
ub
tota
l -
Reven
ue
s17,5
99
20,0
00
18,4
66
20,0
00
-
-
-
-
OT
HE
R R
ES
OU
RC
ES
:
Debt/
Loan P
roceeds
-
-
-
-
-
-
-
-
Restr
icte
d P
rio
r Y
ear
Reserv
es
2,5
96,4
05
2,6
13,3
78
2,6
13,3
78
1,9
59,5
39
-
-
-
-
Unre
str
icte
d P
rio
r Y
ear
Reserv
es
-
-
-
-
-
-
-
-
TO
TA
L E
ST
IMA
TE
D R
ES
OU
RC
ES
2,6
14,0
04
2,6
33,3
78
2,6
31,8
44
1,9
79,5
39
-
-
-
-
ES
TIM
AT
ED
US
ES
DIR
EC
T C
OS
TS
BY
FU
NC
TIO
N:
Pers
onal S
erv
ices
-
-
-
-
-
-
-
-
Mate
ria
ls &
Supplie
s-
-
-
-
-
-
-
-
Oth
er
Serv
ices &
Charg
es
626
1,0
00,4
50
672,3
05
1,9
79,5
39
Capital O
utla
y-
-
-
-
-
-
-
-
Debt
Serv
ice
-
-
-
-
-
-
-
-
T
OT
AL
ES
TIM
AT
ED
CO
ST
S626
1,0
00,4
50
672,3
05
1,9
79,5
39
-
-
-
-
TR
AN
SF
ER
S:
Tra
nsfe
rs
In-
-
-
-
-
-
-
-
Tra
nsfe
rs O
ut
(See d
eta
il belo
w)
-
-
-
-
-
-
-
-
N
ET
TR
AN
SF
ER
S IN
(O
UT
)-
-
-
-
-
-
-
-
OT
HE
R U
SE
S:
Reserv
e f
or
Council
Specia
l P
roje
cts
-
-
-
-
-
-
-
-
Reserv
e f
or
Capital Im
pro
vem
ents
-
-
-
-
-
-
-
-
Reserv
e f
or
Oth
er
Restr
icte
d P
urp
oses
2,6
13,3
78
1,6
32,9
28
1,9
59,5
39
-
-
-
-
-
Unassig
ned (
Res f
or
Em
erg
encie
s &
Short
falls
*)-
-
-
-
-
-
-
-
T
OT
AL
OT
HE
R U
SE
S2,6
13,3
78
1,6
32,9
28
1,9
59,5
39
-
-
-
-
-
TO
TA
L E
ST
IMA
TE
D U
SE
S2,6
14,0
04
2,6
33,3
78
2,6
31,8
44
1,9
79,5
39
-
-
-
-
** F
un
ds t
o b
e u
sed
to
ad
d a
dd
itio
na
l W
aste
wate
r P
lan
t.
101
102
EPWA Revenue Bond Funds
2015-2016
Departmental Summary
D E P A R T M E N T A L D E S C R I P T I O N
The EPWA Revenue Bond Funds are utilized to account for the construction costs and improvement costs related to utility system capital improvements funded by the sale of Public Works Authority revenue bonds. In addition, the Bond Funds account for payment of principal and interest due each year on the outstanding balance of revenue bonds. At present, the Authority has two revenue bond issues outstanding with total indebtedness equaling $21,550,094.
Revenue Bond Issues
Issue Issue
Amount
Principal Bal.
6/30/2014
Final
Maturity
1. 2004 Utility System Revenue Bonds 14,700,000 690,000 12/2014
2. 2005 Utility System Refunding Revenue Bonds 40,435,000 27,120,000 4/2014
3. 2014 Utility/Sales Tax System Refunding
Revenue Bonds
10,085,094 0 7/1/2024
4. 2015 Utility System Refunding Revenue Bonds 20,465,000 0 7/1/2024
During the last fiscal year, the City refinanced the 2004 and 2005 Utility Bonds that is
reflected in the 2014 and 2015 Refunding Bonds respectfully.
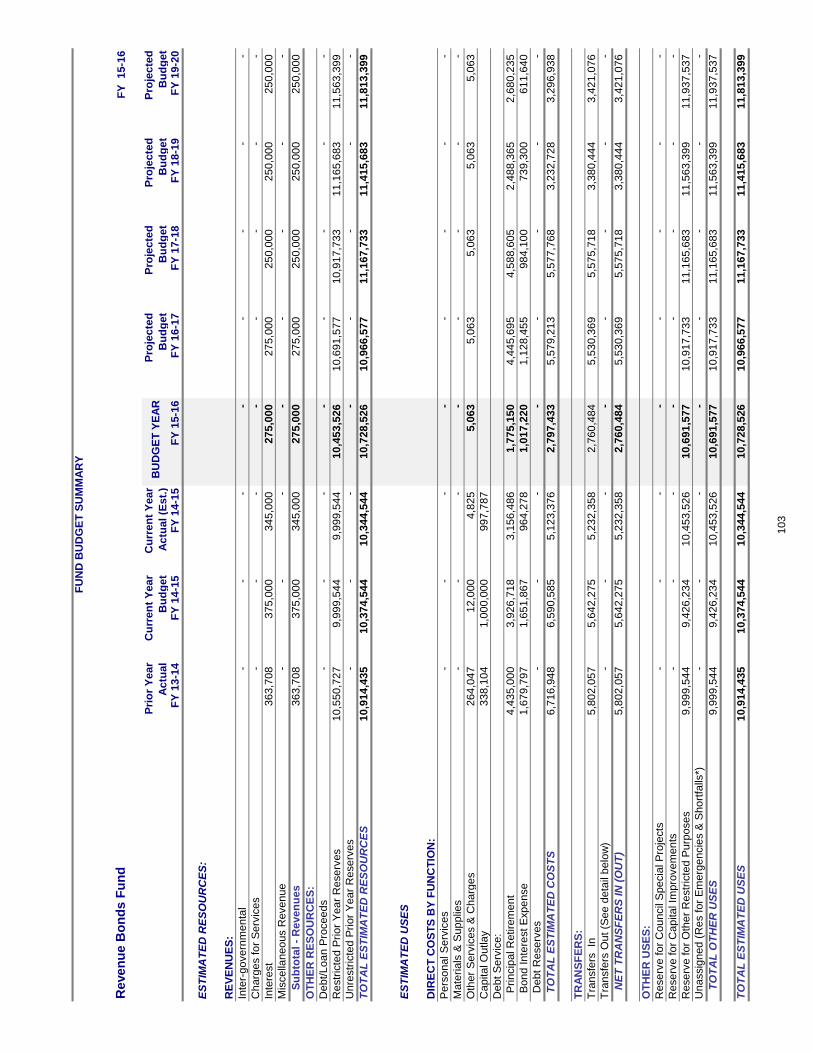
FU
ND
BU
DG
ET
SU
MM
AR
Y
Re
ve
nu
e B
on
ds
Fu
nd
FY
1
5-1
6
Pri
or
Yea
r
Actu
al
Cu
rren
t Y
ea
r
Bu
dg
et
Cu
rren
t Y
ea
r
Actu
al
(Est.
)B
UD
GE
T Y
EA
RP
roje
cte
d
Bu
dg
et
Pro
jec
ted
Bu
dg
et
Pro
jec
ted
Bu
dg
et
Pro
jec
ted
Bu
dg
et
FY
13-1
4F
Y 1
4-1
5F
Y 1
4-1
5F
Y 1
5-1
6F
Y 1
6-1
7F
Y 1
7-1
8F
Y 1
8-1
9F
Y 1
9-2
0
ES
TIM
AT
ED
RE
SO
UR
CE
S:
RE
VE
NU
ES
:
Inte
r-go
vern
men
tal
-
-
-
-
-
-
-
-
Cha
rge
s fo
r S
erv
ices
-
-
-
-
-
-
-
-
Inte
rest
36
3,7
08
37
5,0
00
34
5,0
00
27
5,0
00
27
5,0
00
25
0,0
00
25
0,0
00
25
0,0
00
Mis
cella
neo
us R
even
ue
-
-
-
-
-
-
-
-
S
ub
tota
l -
Reven
ues
36
3,7
08
37
5,0
00
34
5,0
00
27
5,0
00
27
5,0
00
25
0,0
00
25
0,0
00
25
0,0
00
OT
HE
R R
ES
OU
RC
ES
:
Deb
t/L
oa
n P
roce
ed
s-
-
-
-
-
-
-
-
Restr
icte
d P
rior
Yea
r R
ese
rves
10
,550
,727
9,9
99,5
44
9,9
99,5
44
10
,453
,526
10
,691
,577
10
,917
,733
11
,165
,683
11
,563
,399
Unre
str
icte
d P
rior
Yea
r R
ese
rves
-
-
-
-
-
-
-
-
TO
TA
L E
ST
IMA
TE
D R
ES
OU
RC
ES
10
,914
,435
10
,374
,544
10
,344
,544
10
,728
,526
10
,966
,577
11
,167
,733
11
,415
,683
11
,813
,399
ES
TIM
AT
ED
US
ES
DIR
EC
T C
OS
TS
BY
FU
NC
TIO
N:
Pers
on
al S
erv
ices
-
-
-
-
-
-
-
-
Mate
rials
& S
up
plie
s-
-
-
-
-
-
-
-
Oth
er
Serv
ices &
Cha
rge
s26
4,0
47
12
,000
4,8
25
5,0
63
5,0
63
5,0
63
5,0
63
5,0
63
Cap
ital O
utlay
33
8,1
04
1,0
00,0
00
99
7,7
87
Deb
t S
erv
ice:
P
rin
cip
al R
etire
men
t4,4
35,0
00
3,9
26,7
18
3,1
56,4
86
1,7
75,1
50
4,4
45,6
95
4,5
88,6
05
2,4
88,3
65
2,6
80,2
35
B
on
d I
nte
rest
Expe
nse
1,6
79,7
97
1,6
51,8
67
96
4,2
78
1,0
17,2
20
1,1
28,4
55
98
4,1
00
73
9,3
00
61
1,6
40
D
ebt
Rese
rves
-
-
-
-
-
-
-
-
T
OT
AL
ES
TIM
AT
ED
CO
ST
S6,7
16,9
48
6,5
90,5
85
5,1
23,3
76
2,7
97,4
33
5,5
79,2
13
5,5
77,7
68
3,2
32,7
28
3,2
96,9
38
TR
AN
SF
ER
S:
Tra
nsfe
rs In
5,8
02,0
57
5,6
42,2
75
5,2
32,3
58
2,7
60,4
84
5,5
30,3
69
5,5
75,7
18
3,3
80,4
44
3,4
21,0
76
Tra
nsfe
rs O
ut (S
ee
deta
il b
elo
w)
-
-
-
-
-
-
-
-
N
ET
TR
AN
SF
ER
S IN
(O
UT
)5,8
02,0
57
5,6
42,2
75
5,2
32,3
58
2,7
60,4
84
5,5
30,3
69
5,5
75,7
18
3,3
80,4
44
3,4
21,0
76
OT
HE
R U
SE
S:
Rese
rve f
or
Cou
ncil
Spe
cia
l P
roje
cts
-
-
-
-
-
-
-
-
Rese
rve f
or
Cap
ital Im
pro
vem
en
ts-
-
-
-
-
-
-
-
Rese
rve f
or
Oth
er
Restr
icte
d P
urp
oses
9,9
99,5
44
9,4
26,2
34
10
,453
,526
10
,691
,577
10
,917
,733
11
,165
,683
11
,563
,399
11
,937
,537
Una
ssig
ned
(R
es f
or
Em
erg
encie
s &
Sho
rtfa
lls*)
-
-
-
-
-
-
-
-
T
OT
AL
OT
HE
R U
SE
S9,9
99,5
44
9,4
26,2
34
10
,453
,526
10
,691
,577
10
,917
,733
11
,165
,683
11
,563
,399
11
,937
,537
TO
TA
L E
ST
IMA
TE
D U
SE
S10
,914
,435
10
,374
,544
10
,344
,544
10
,728
,526
10
,966
,577
11
,167
,733
11
,415
,683
11
,813
,399
10
3


Other Enterprise Funds
Tab

Other Enterprise Funds- Sub-Directory
Kicking Bird Golf Club- Description 104 Kicking Bird Golf Club- Summary 105 YourGovShop- Description 106 YourGovShop- Summary 107 Public Transportation – CityLink Description 108 Public Transportation – CityLink Summary 109
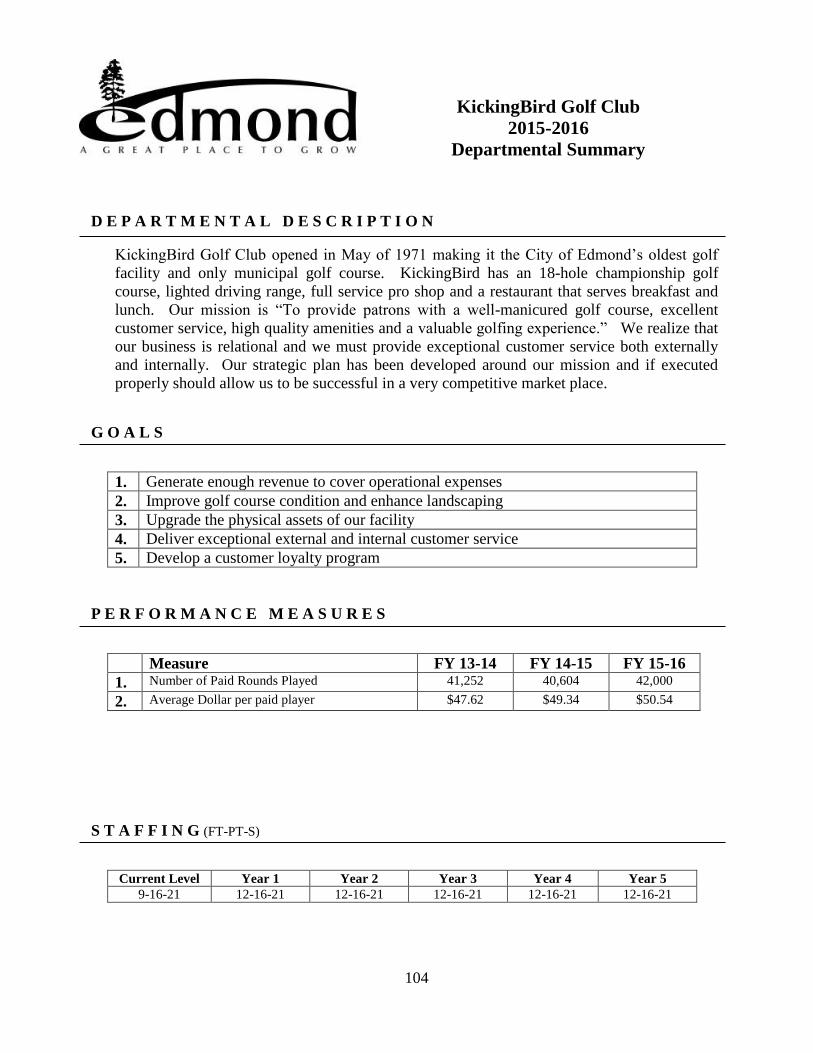
104
KickingBird Golf Club
2015-2016
Departmental Summary
D E P A R T M E N T A L D E S C R I P T I O N
KickingBird Golf Club opened in May of 1971 making it the City of Edmond’s oldest golf
facility and only municipal golf course. KickingBird has an 18-hole championship golf
course, lighted driving range, full service pro shop and a restaurant that serves breakfast and
lunch. Our mission is “To provide patrons with a well-manicured golf course, excellent
customer service, high quality amenities and a valuable golfing experience.” We realize that
our business is relational and we must provide exceptional customer service both externally
and internally. Our strategic plan has been developed around our mission and if executed
properly should allow us to be successful in a very competitive market place.
G O A L S
1. Generate enough revenue to cover operational expenses
2. Improve golf course condition and enhance landscaping
3. Upgrade the physical assets of our facility
4. Deliver exceptional external and internal customer service
5. Develop a customer loyalty program
P E R F O R M A N C E M E A S U R E S
Measure FY 13-14 FY 14-15 FY 15-16
1. Number of Paid Rounds Played 41,252 40,604 42,000
2. Average Dollar per paid player $47.62 $49.34 $50.54
S T A F F I N G (FT-PT-S)
Current Level Year 1 Year 2 Year 3 Year 4 Year 5
9-16-21 12-16-21 12-16-21 12-16-21 12-16-21 12-16-21
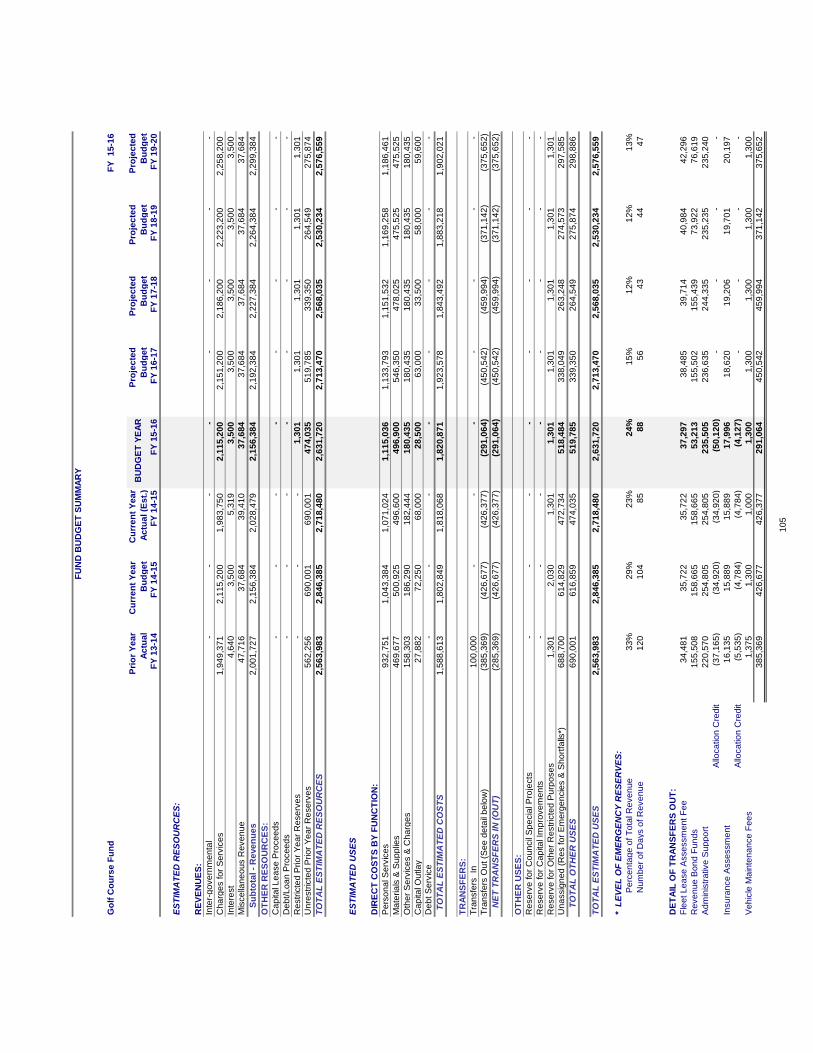
FU
ND
BU
DG
ET
SU
MM
AR
Y
Go
lf C
ou
rse
Fu
nd
FY
1
5-1
6
Pri
or
Ye
ar
Ac
tua
l
Cu
rre
nt
Ye
ar
Bu
dg
et
Cu
rre
nt
Ye
ar
Ac
tua
l (E
st.
)B
UD
GE
T Y
EA
RP
roje
cte
d
Bu
dg
et
Pro
jec
ted
Bu
dg
et
Pro
jec
ted
Bu
dg
et
Pro
jec
ted
Bu
dg
et
FY
13
-14
FY
14
-15
FY
14
-15
FY
15
-16
FY
16
-17
FY
17
-18
FY
18
-19
FY
19
-20
ES
TIM
AT
ED
RE
SO
UR
CE
S:
RE
VE
NU
ES
:
Inte
r-g
ove
rnm
en
tal
-
-
-
-
-
-
-
-
Ch
arg
es fo
r S
erv
ice
s1
,94
9,3
71
2,1
15
,20
0
1,9
83
,75
0
2,1
15
,20
0
2,1
51
,20
0
2,1
86
,20
0
2,2
23
,20
0
2,2
58
,20
0
Inte
rest
4,6
40
3,5
00
5,3
19
3,5
00
3,5
00
3,5
00
3,5
00
3,5
00
Mis
ce
llan
eo
us R
eve
nu
e4
7,7
16
37
,68
4
39
,41
0
37
,68
4
37
,68
4
37
,68
4
37
,68
4
37
,68
4
S
ub
tota
l -
Re
ve
nu
es
2,0
01
,72
7
2,1
56
,38
4
2,0
28
,47
9
2,1
56
,38
4
2,1
92
,38
4
2,2
27
,38
4
2,2
64
,38
4
2,2
99
,38
4
OT
HE
R R
ES
OU
RC
ES
:
Ca
pita
l L
ea
se
Pro
ce
ed
s-
-
-
-
-
-
-
-
De
bt/L
oa
n P
roce
ed
s-
-
-
-
-
-
-
-
Re
str
icte
d P
rio
r Y
ea
r R
ese
rve
s-
-
-
1,3
01
1,3
01
1,3
01
1,3
01
1,3
01
Un
restr
icte
d P
rio
r Y
ea
r R
ese
rve
s5
62
,25
6
69
0,0
01
69
0,0
01
47
4,0
35
51
9,7
85
33
9,3
50
26
4,5
49
27
5,8
74
TO
TA
L E
ST
IMA
TE
D R
ES
OU
RC
ES
2,5
63
,98
3
2,8
46
,38
5
2,7
18
,48
0
2,6
31
,72
0
2,7
13
,47
0
2,5
68
,03
5
2,5
30
,23
4
2,5
76
,55
9
ES
TIM
AT
ED
US
ES
DIR
EC
T C
OS
TS
BY
FU
NC
TIO
N:
Pe
rso
na
l S
erv
ice
s9
32
,75
1
1,0
43
,38
4
1,0
71
,02
4
1,1
15
,03
6
1,1
33
,79
3
1,1
51
,53
2
1,1
69
,25
8
1,1
86
,46
1
Ma
teria
ls &
Su
pp
lies
46
9,6
77
50
0,9
25
49
6,6
00
49
6,9
00
54
6,3
50
47
8,0
25
47
5,5
25
47
5,5
25
Oth
er
Se
rvic
es &
Ch
arg
es
15
8,3
03
18
6,2
90
18
2,4
44
18
0,4
35
18
0,4
35
18
0,4
35
18
0,4
35
18
0,4
35
Ca
pita
l O
utla
y2
7,8
82
72
,25
0
68
,00
0
28
,50
0
63
,00
0
33
,50
0
58
,00
0
59
,60
0
De
bt S
erv
ice
-
-
-
-
-
-
-
-
T
OT
AL
ES
TIM
AT
ED
CO
ST
S1
,58
8,6
13
1,8
02
,84
9
1,8
18
,06
8
1,8
20
,87
1
1,9
23
,57
8
1,8
43
,49
2
1,8
83
,21
8
1,9
02
,02
1
TR
AN
SF
ER
S:
Tra
nsfe
rs In
10
0,0
00
-
-
-
-
-
-
-
Tra
nsfe
rs O
ut (S
ee
de
tail
be
low
)(3
85
,36
9)
(42
6,6
77
)
(42
6,3
77
)
(29
1,0
64
)
(45
0,5
42
)
(45
9,9
94
)
(37
1,1
42
)
(37
5,6
52
)
N
ET
TR
AN
SF
ER
S IN
(O
UT
)(2
85
,36
9)
(42
6,6
77
)
(42
6,3
77
)
(29
1,0
64
)
(45
0,5
42
)
(45
9,9
94
)
(37
1,1
42
)
(37
5,6
52
)
OT
HE
R U
SE
S:
Re
se
rve
fo
r C
ou
ncil
Sp
ecia
l P
roje
cts
-
-
-
-
-
-
-
-
Re
se
rve
fo
r C
ap
ita
l Im
pro
ve
me
nts
-
-
-
-
-
-
-
-
Re
se
rve
fo
r O
the
r R
estr
icte
d P
urp
ose
s1
,30
1
2,0
30
1,3
01
1,3
01
1,3
01
1,3
01
1,3
01
1,3
01
Un
assig
ne
d (
Re
s fo
r E
me
rge
ncie
s &
Sh
ort
falls
*)6
88
,70
0
61
4,8
29
47
2,7
34
51
8,4
84
33
8,0
49
26
3,2
48
27
4,5
73
29
7,5
85
T
OT
AL
OT
HE
R U
SE
S6
90
,00
1
61
6,8
59
47
4,0
35
51
9,7
85
33
9,3
50
26
4,5
49
27
5,8
74
29
8,8
86
TO
TA
L E
ST
IMA
TE
D U
SE
S2
,56
3,9
83
2,8
46
,38
5
2,7
18
,48
0
2,6
31
,72
0
2,7
13
,47
0
2,5
68
,03
5
2,5
30
,23
4
2,5
76
,55
9
* L
EV
EL
OF
EM
ER
GE
NC
Y R
ES
ER
VE
S:
Pe
rce
nta
ge
of T
ota
l R
eve
nu
e3
3%
29
%2
3%
24
%1
5%
12
%1
2%
13
%
Nu
mb
er
of D
ays o
f R
eve
nu
e1
20
10
4
85
88
56
43
44
47
DE
TA
IL O
F T
RA
NS
FE
RS
OU
T:
Fle
et L
ea
se
Asse
ssm
en
t F
ee
34
,48
1
35
,72
2
35
,72
2
37
,29
7
38
,48
5
39
,71
4
40
,98
4
42
,29
6
Re
ve
nu
e B
on
d F
un
ds
15
5,5
08
15
8,6
65
15
8,6
65
53
,21
3
15
5,5
02
15
5,4
39
73
,92
2
76
,61
9
Ad
min
istr
ative
Su
pp
ort
22
0,5
70
25
4,8
05
25
4,8
05
23
5,5
05
23
6,6
35
24
4,3
35
23
5,2
35
23
5,2
40
Allo
ca
tio
n C
red
it(3
7,1
65
)
(34
,92
0)
(34
,92
0)
(50
,12
0)
-
-
-
-
Insu
ran
ce
Asse
ssm
en
t1
6,1
35
15
,88
9
15
,88
9
17
,99
6
18
,62
0
19
,20
6
19
,70
1
20
,19
7
Allo
ca
tio
n C
red
it(5
,53
5)
(4,7
84
)
(4,7
84
)
(4,1
27
)
-
-
-
-
Ve
hic
le M
ain
ten
an
ce
Fe
es
1,3
75
1,3
00
1,0
00
1,3
00
1,3
00
1,3
00
1,3
00
1,3
00
38
5,3
69
42
6,6
77
42
6,3
77
29
1,0
64
45
0,5
42
45
9,9
94
37
1,1
42
37
5,6
52
10
5
106
YourGovShop
2015-2016
Departmental Summary
D E P A R T M E N T A L D E S C R I P T I O N
YourGovShop’s mission is to aggregate material purchase for member cities to obtain
discounted pricing. Our plan is to generate sufficient revenues through supplier rebates to
cover its operational costs and generate a profit. Financial activity and results of operations
will be monitored separately. Profits generated (if any) from the plan will be used to offset
the expenses of the City’s Purchasing department or to expand this joint purchasing program
into other areas.
1. Generate sufficient revenue to cover cost of operations.
2. Increase awareness and participation in the program through marketing
3. Expand our customer base annually.
S T A F F I N G (FT-PT-S)
Current Level Year 1 Year 2 Year 3 Year 4 Year 5 .3 .3 .3 .3 .3 .3
*The remaining .7 of the YourGovShop employee is accounted for in the Finance staffing levels as the Purchasing Manager.

FU
ND
BU
DG
ET
SU
MM
AR
Y
Yo
urG
ovS
ho
p F
un
dF
Y 15-1
6
Pri
or
Year
Actu
al
Cu
rren
t Y
ear
Bu
dg
et
Cu
rren
t Y
ear
Actu
al (E
st.
)B
UD
GE
T Y
EA
RP
roje
cte
d
Bu
dg
et
Pro
jecte
d
Bu
dg
et
Pro
jecte
d
Bu
dg
et
Pro
jecte
d
Bu
dg
et
FY
13-1
4F
Y 1
4-1
5F
Y 1
4-1
5F
Y 1
5-1
6F
Y 1
6-1
7F
Y 1
7-1
8F
Y 1
8-1
9F
Y 1
9-2
0
ES
TIM
AT
ED
RE
SO
UR
CE
S:
RE
VE
NU
ES
:
Inte
r-govern
menta
l-
-
-
-
-
-
-
-
Charg
es for
Serv
ices
56,4
13
50,0
00
60,6
53
50,0
00
50,0
00
50,0
00
50,0
00
50,0
00
Inte
rest
1,1
53
1,5
00
1,2
00
1,5
00
1,5
00
1,5
00
1,5
00
1,5
00
Mis
cella
neous R
evenue
-
-
-
-
-
-
-
-
S
ub
tota
l -
Reven
ues
57,5
66
51,5
00
61,8
53
51,5
00
51,5
00
51,5
00
51,5
00
51,5
00
OT
HE
R R
ES
OU
RC
ES
:
Debt/Loan P
roceeds
-
-
-
-
-
-
-
-
Restr
icte
d P
rior
Year
Reserv
es
-
-
-
-
-
-
-
-
Unre
str
icte
d P
rior
Year
Reserv
es
194,5
29
207,8
60
207,8
60
220,2
76
219,2
18
217,4
24
214,7
61
212,3
01
TO
TA
L E
ST
IMA
TE
D R
ES
OU
RC
ES
252,0
95
259,3
60
269,7
13
271,7
76
270,7
18
268,9
24
266,2
61
263,8
01
ES
TIM
AT
ED
US
ES
DIR
EC
T C
OS
TS
BY
FU
NC
TIO
N:
Pers
onal S
erv
ices
29,6
45
29,9
12
28,5
78
31,4
06
32,1
17
32,7
64
32,8
44
32,9
25
Mate
rials
& S
upplie
s289
1,4
00
800
1,4
00
1,4
00
1,7
00
1,4
00
1,4
00
Oth
er
Serv
ices &
Charg
es
27,6
02
34,9
50
35,5
07
34,9
50
34,9
50
35,1
00
35,1
00
35,1
00
Capital O
utlay
-
-
-
-
-
-
-
-
Debt S
erv
ice
-
-
-
-
-
-
-
-
T
OT
AL
ES
TIM
AT
ED
CO
ST
S57,5
36
66,2
62
64,8
85
67,7
56
68,4
67
69,5
64
69,3
44
69,4
25
TR
AN
SF
ER
S:
Tra
nsfe
rs In
17,9
76
17,7
54
17,7
54
18,1
67
18,3
54
18,6
48
18,5
89
18,6
10
Tra
nsfe
rs O
ut (S
ee d
eta
il belo
w)
(4,6
75)
(2,3
06)
(2,3
06)
(2,9
69)
(3,1
81)
(3,2
47)
(3,2
05)
(3,2
14)
N
ET
TR
AN
SF
ER
S IN
(O
UT
)13,3
01
15,4
48
15,4
48
15,1
98
15,1
73
15,4
01
15,3
84
15,3
96
OT
HE
R U
SE
S:
Reserv
e for
Council
Specia
l P
roje
cts
-
-
-
-
-
-
-
-
Reserv
e for
Capital Im
pro
vem
ents
-
-
-
-
-
-
-
-
Reserv
e for
Oth
er
Restr
icte
d P
urp
oses
-
-
-
-
-
-
-
-
Unassig
ned (
Res for
Em
erg
encie
s &
Short
falls
*)207,8
60
208,5
46
220,2
76
219,2
18
217,4
24
214,7
61
212,3
01
209,7
72
T
OT
AL
OT
HE
R U
SE
S207,8
60
208,5
46
220,2
76
219,2
18
217,4
24
214,7
61
212,3
01
209,7
72
TO
TA
L E
ST
IMA
TE
D U
SE
S252,0
95
259,3
60
269,7
13
271,7
76
270,7
18
268,9
24
266,2
61
263,8
01
* L
EV
EL
OF
EM
ER
GE
NC
Y R
ES
ER
VE
S:
Perc
enta
ge o
f T
ota
l R
evenue
275%
301%
277%
315%
311%
306%
303%
299%
Num
ber
of D
ays
of R
evenue
1,0
04
1,0
99
1,0
10
1,1
49
1,1
36
1,1
17
1,1
06
1,0
92
DE
TA
IL O
F T
RA
NS
FE
RS
OU
T:
Adm
inis
trative S
upport
4,6
80
3,3
70
3,3
70
3,5
51
3,1
81
3,2
47
3,2
05
3,2
14
Allo
cation C
redit
(5)
(1
,064)
(1,0
64)
(582)
-
-
-
-
Insura
nce A
ssessm
ent
-
-
-
-
-
-
-
-
Allo
cation C
redit
-
-
-
-
-
-
-
-
4,6
75
2,3
06
2,3
06
2,9
69
3,1
81
3,2
47
3,2
05
3,2
14
107
108
Public Transportation - Citylink
2015-2016
Departmental Summary
D E P A R T M E N T A L D E S C R I P T I O N
The mission of Edmond’s public transportation service, Citylink, is to provide quality, reliable, affordable, customer-friendly transportation service to the residents of Edmond for access to employment, shopping, medical, education and social destinations.
Citylink is operated by McDonald Transit and Associates through a 5-year agreement with the Edmond Public Works Authority. Citylink utilizes 11 transit buses to operate 4 local fixed routes and a door-to-door paratransit service, Monday through Saturday. It also provides 12 daily round trips between Edmond and Oklahoma City, Monday through Friday. All Citylink services are fare-free, including Expresslink and paratransit. All Citylink buses are equipped with bike racks and 2 wheel-chair tie-down and lifts.
Since Citylink started in July 2009, ridership has increased more than 300% compared to the previous service.
G O A L S
1. Create a 3 to 5-Year Citylink Operations and Financial Plan.
2. Continue marketing and communications with citizens, EPTC, UCO and private-partners.
3. Continue to seek funding for operations, capital needs and the Edmond Multimodal Transit
Center.
S T A F F I N G (FT-PT-S)
Current Level Year 1 Year 2 Year 3 Year 4 Year 5 1-0-0 1-0-0 1-0-0 1-0-0 1-0-0 1-0-0
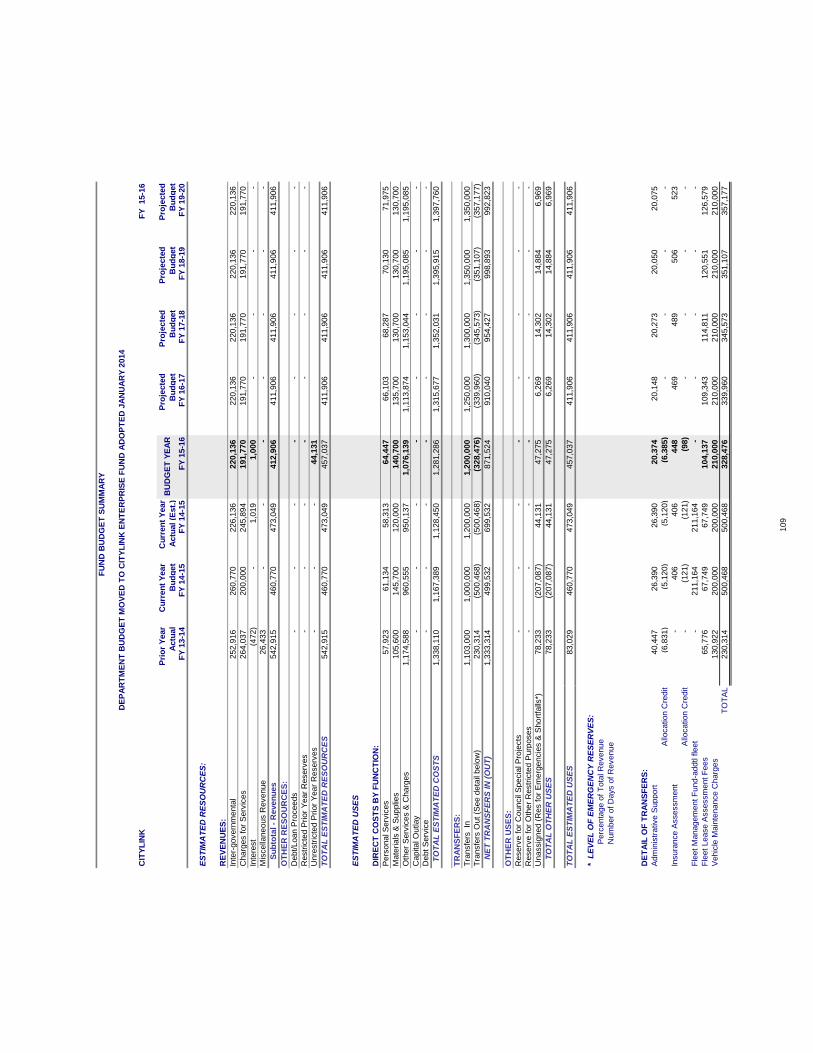
FU
ND
BU
DG
ET
SU
MM
AR
Y
DE
PA
RT
ME
NT
BU
DG
ET
MO
VE
D T
O C
ITY
LIN
K E
NT
ER
PR
ISE
FU
ND
AD
OP
TE
D J
AN
UA
RY
2014
CIT
YL
INK
FY
15-1
6
Pri
or
Year
Actu
al
Cu
rren
t Y
ear
Bu
dg
et
Cu
rren
t Y
ear
Actu
al (E
st.
)B
UD
GE
T Y
EA
RP
roje
cte
d
Bu
dg
et
Pro
jecte
d
Bu
dg
et
Pro
jecte
d
Bu
dg
et
Pro
jecte
d
Bu
dg
et
FY
13-1
4F
Y 1
4-1
5F
Y 1
4-1
5F
Y 1
5-1
6F
Y 1
6-1
7F
Y 1
7-1
8F
Y 1
8-1
9F
Y 1
9-2
0
ES
TIM
AT
ED
RE
SO
UR
CE
S:
RE
VE
NU
ES
:
Inte
r-govern
menta
l252,9
16
260,7
70
226,1
36
220,1
36
220,1
36
220,1
36
220,1
36
220,1
36
Charg
es for
Serv
ices
264,0
37
200,0
00
245,8
94
191,7
70
191,7
70
191,7
70
191,7
70
191,7
70
Inte
rest
(472)
-
1,0
19
1,0
00
-
-
-
-
Mis
cella
neous R
evenue
26,4
33
-
-
-
-
-
-
-
S
ub
tota
l -
Reven
ues
542,9
15
460,7
70
473,0
49
412,9
06
411,9
06
411,9
06
411,9
06
411,9
06
OT
HE
R R
ES
OU
RC
ES
:
Debt/Loan P
roceeds
-
-
-
-
-
-
-
-
Restr
icte
d P
rior
Year
Reserv
es
-
-
-
-
-
-
-
-
Unre
str
icte
d P
rior
Year
Reserv
es
-
-
-
44,1
31
TO
TA
L E
ST
IMA
TE
D R
ES
OU
RC
ES
542,9
15
460,7
70
473,0
49
457,0
37
411,9
06
411,9
06
411,9
06
411,9
06
ES
TIM
AT
ED
US
ES
DIR
EC
T C
OS
TS
BY
FU
NC
TIO
N:
Pers
onal S
erv
ices
57,9
23
61,1
34
58,3
13
64,4
47
66,1
03
68,2
87
70,1
30
71,9
75
Mate
rials
& S
upplie
s105,6
00
145,7
00
120,0
00
140,7
00
135,7
00
130,7
00
130,7
00
130,7
00
Oth
er
Serv
ices &
Charg
es
1,1
74,5
88
960,5
55
950,1
37
1,0
76,1
39
1,1
13,8
74
1,1
53,0
44
1,1
95,0
85
1,1
95,0
85
Capital O
utlay
-
-
-
-
-
-
-
-
Debt S
erv
ice
-
-
-
-
-
-
-
-
T
OT
AL
ES
TIM
AT
ED
CO
ST
S1,3
38,1
10
1,1
67,3
89
1,1
28,4
50
1,2
81,2
86
1,3
15,6
77
1,3
52,0
31
1,3
95,9
15
1,3
97,7
60
TR
AN
SF
ER
S:
Tra
nsfe
rs In
1,1
03,0
00
1,0
00,0
00
1,2
00,0
00
1,2
00,0
00
1,2
50,0
00
1,3
00,0
00
1,3
50,0
00
1,3
50,0
00
Tra
nsfe
rs O
ut (S
ee d
eta
il belo
w)
230,3
14
(500,4
68)
(500,4
68)
(328,4
76)
(339,9
60)
(345,5
73)
(351,1
07)
(357,1
77)
N
ET
TR
AN
SF
ER
S IN
(O
UT
)1,3
33,3
14
499,5
32
699,5
32
871,5
24
910,0
40
954,4
27
998,8
93
992,8
23
OT
HE
R U
SE
S:
Reserv
e for
Council
Specia
l P
roje
cts
-
-
-
-
-
-
-
-
Reserv
e for
Oth
er
Restr
icte
d P
urp
oses
-
-
-
-
-
-
-
-
Unassig
ned (
Res for
Em
erg
encie
s &
Short
falls
*)78,2
33
(207,0
87)
44,1
31
47,2
75
6,2
69
14,3
02
14,8
84
6,9
69
T
OT
AL
OT
HE
R U
SE
S78,2
33
(207,0
87)
44,1
31
47,2
75
6,2
69
14,3
02
14,8
84
6,9
69
TO
TA
L E
ST
IMA
TE
D U
SE
S83,0
29
460,7
70
473,0
49
457,0
37
411,9
06
411,9
06
411,9
06
411,9
06
* L
EV
EL
OF
EM
ER
GE
NC
Y R
ES
ER
VE
S:
Perc
enta
ge o
f T
ota
l R
evenue
Num
ber
of D
ays o
f R
evenue
DE
TA
IL O
F T
RA
NS
FE
RS
:
Adm
inis
trative S
upport
40,4
47
26,3
90
26,3
90
20,3
74
20,1
48
20,2
73
20,0
50
20,0
75
Allo
cation C
redit
(6,8
31)
(5,1
20)
(5,1
20)
(6,3
85)
-
-
-
-
Insura
nce A
ssessm
ent
-
406
406
448
469
489
506
523
Allo
cation C
redit
-
(121)
(121)
(98)
-
-
-
-
Fle
et M
anagem
ent F
und-a
ddtl fle
et
-
211,1
64
211,1
64
-
-
-
-
-
Fle
et Lease A
ssessm
ent F
ees
65,7
76
67,7
49
67,7
49
104,1
37
109,3
43
114,8
11
120,5
51
126,5
79
Vehic
le M
ain
tenance C
harg
es
130,9
22
200,0
00
200,0
00
210,0
00
210,0
00
210,0
00
210,0
00
210,0
00
TO
TA
L230,3
14
500,4
68
500,4
68
328,4
76
339,9
60
345,5
73
351,1
07
357,1
77
109


Internal Services Funds
Tab
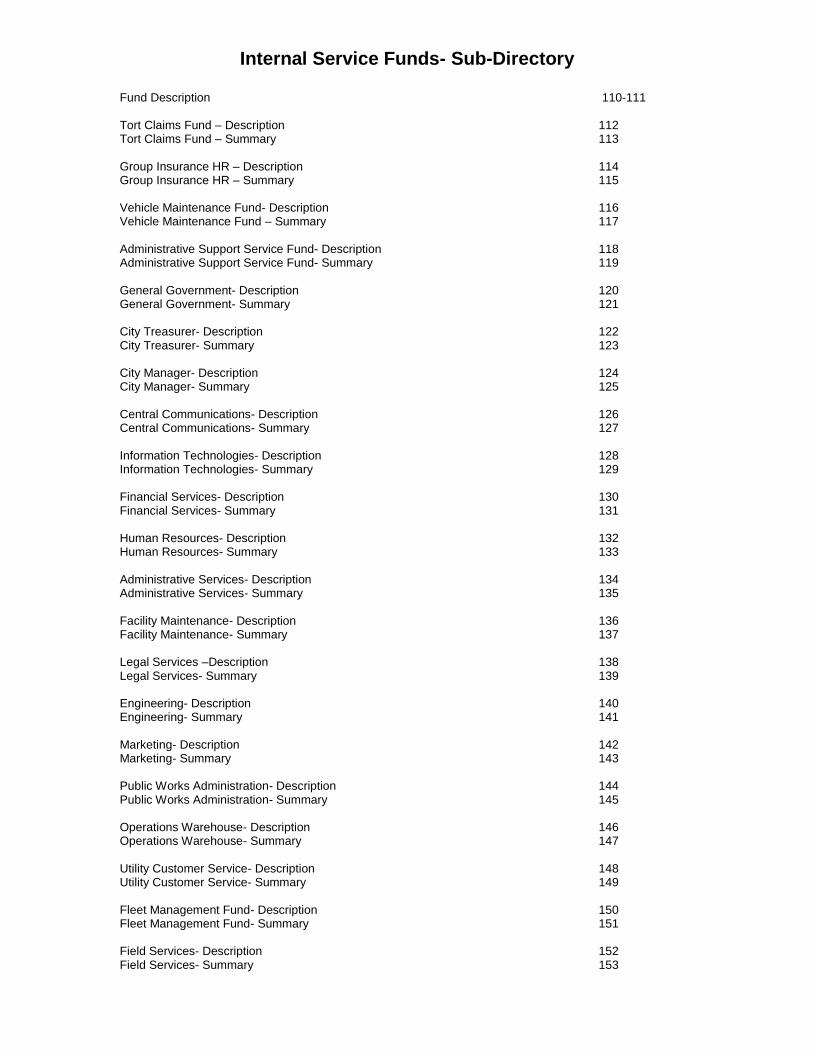
Internal Service Funds- Sub-Directory
Fund Description 110-111 Tort Claims Fund – Description 112 Tort Claims Fund – Summary 113 Group Insurance HR – Description 114 Group Insurance HR – Summary 115 Vehicle Maintenance Fund- Description 116 Vehicle Maintenance Fund – Summary 117 Administrative Support Service Fund- Description 118 Administrative Support Service Fund- Summary 119 General Government- Description 120 General Government- Summary 121 City Treasurer- Description 122 City Treasurer- Summary 123 City Manager- Description 124 City Manager- Summary 125 Central Communications- Description 126 Central Communications- Summary 127 Information Technologies- Description 128 Information Technologies- Summary 129 Financial Services- Description 130 Financial Services- Summary 131 Human Resources- Description 132 Human Resources- Summary 133 Administrative Services- Description 134 Administrative Services- Summary 135 Facility Maintenance- Description 136 Facility Maintenance- Summary 137 Legal Services –Description 138 Legal Services- Summary 139 Engineering- Description 140 Engineering- Summary 141 Marketing- Description 142 Marketing- Summary 143 Public Works Administration- Description 144 Public Works Administration- Summary 145 Operations Warehouse- Description 146 Operations Warehouse- Summary 147 Utility Customer Service- Description 148 Utility Customer Service- Summary 149 Fleet Management Fund- Description 150 Fleet Management Fund- Summary 151 Field Services- Description 152 Field Services- Summary 153
110
THE CITY OF EDMOND, OKLAHOMA
FUND DESCRIPTION
-INTERNAL SERVICE FUNDS-
LIABILITY/TORT CLAIM FUND
The Liability/Tort Claim Fund has been established to account for direct and indirect costs
for the payment of judgments and settled claims relating to torts and Workers’
Compensation. Financing is provided through billings to user departments.
EMPLOYEE GROUP INSURANCE FUND
The Employee Group Insurance Fund has been established to account for the direct and
indirect costs of administering a self-funded and fully insured group health insurance plan.
Financing is provided by the General Fund, Public Safety Tax Funds, Edmond Public
Works Authority, City employees, and interest earnings on fund investments. Costs
associated with the plan include the payment of employee, dependent and retiree health,
dental and vision claims, third party administrative costs, re-insurance (specific and
aggregate), and insurance premium payments for catastrophic claims, COBRA
administration, fully insured life, accidental death and dismemberment, long term
disability insurance and Wellness Program expenses.
VEHICLE MAINTENANCE FUND
The Vehicle Maintenance Fund has been established to account for expenditures
necessary to maintain City vehicles. Financing is provided through billings to user
departments.
111
THE CITY OF EDMOND, OKLAHOMA
FUND DESCRIPTION
-INTERNAL SERVICE FUNDS-
ADMINISTRATIVE SUPPORT SERVICES FUND
The Administrative Support Services Fund has been established to allocate
administrative overhead costs to user departments of the City. Financing is provided
through billings to user departments based upon applicable cost accounting methods.
FLEET MANAGEMENT FUND
The Fleet Management Fund has been established to accumulate resources for the
replacement of vehicles and other equipment on a systematic basis. Financing is
provided by fleet lease assessments from those funds that purchase City vehicles and
equipment through the Fleet fund.
FIELD SERVICES FUND
The Field Services Fund has been established to provide street maintenance,
water/wastewater line maintenance and traffic control systems maintenance. By
combining this workforce, it allows the employees to develop diverse skill sets. Financing
is provided by the General Fund, Water and Wastewater Fund based upon applicable
cost accounting methods.
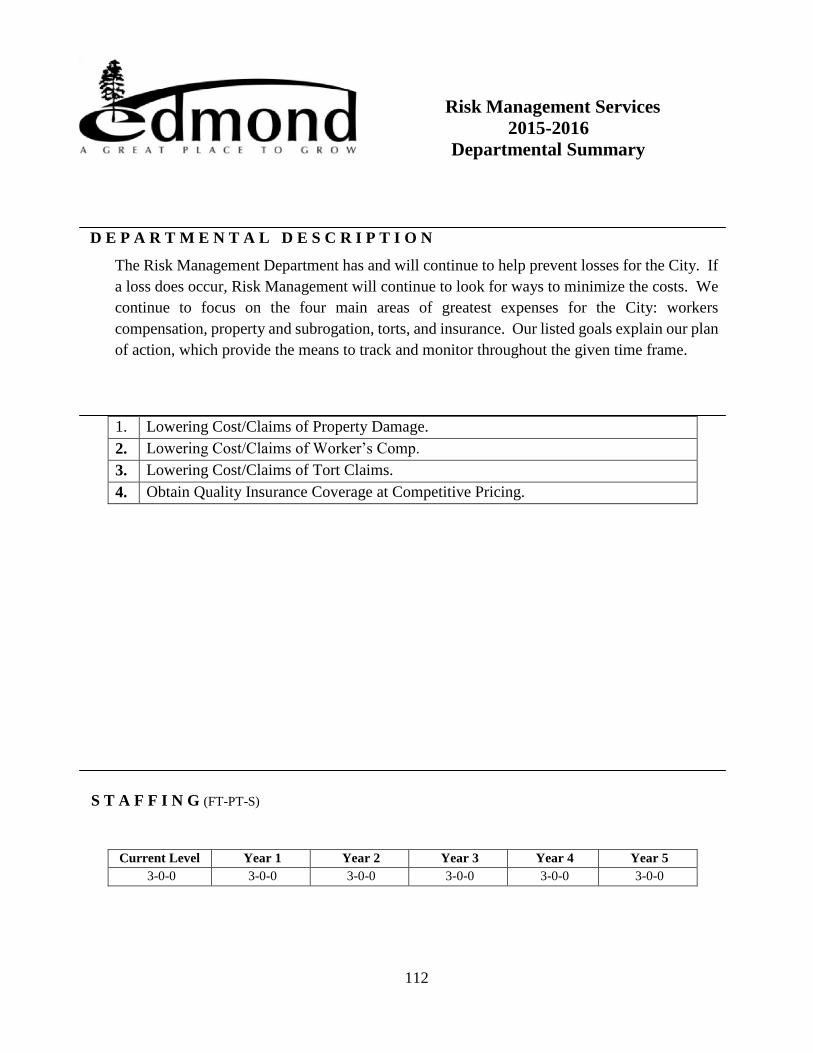
112
Risk Management Services
2015-2016
Departmental Summary
D E P A R T M E N T A L D E S C R I P T I O N
The Risk Management Department has and will continue to help prevent losses for the City. If
a loss does occur, Risk Management will continue to look for ways to minimize the costs. We
continue to focus on the four main areas of greatest expenses for the City: workers
compensation, property and subrogation, torts, and insurance. Our listed goals explain our plan
of action, which provide the means to track and monitor throughout the given time frame.
1. Lowering Cost/Claims of Property Damage.
2. Lowering Cost/Claims of Worker’s Comp.
3. Lowering Cost/Claims of Tort Claims.
4. Obtain Quality Insurance Coverage at Competitive Pricing.
S T A F F I N G (FT-PT-S)
Current Level Year 1 Year 2 Year 3 Year 4 Year 5 3-0-0 3-0-0 3-0-0 3-0-0 3-0-0 3-0-0
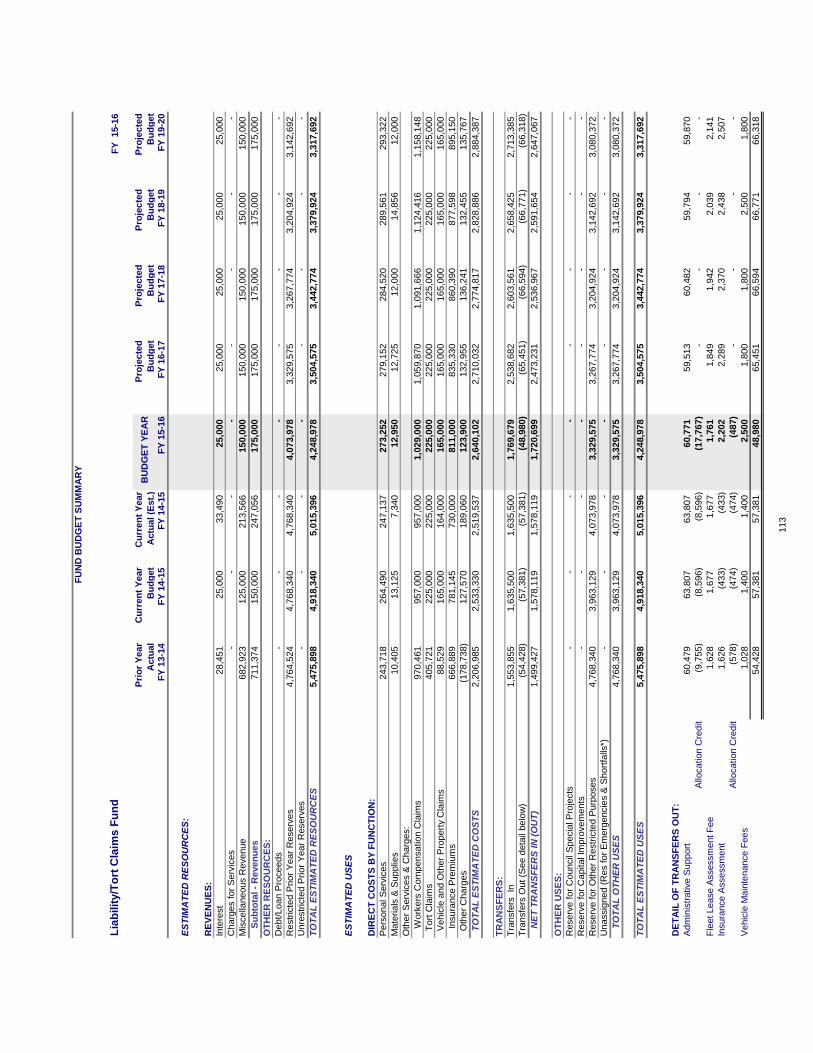
FU
ND
BU
DG
ET
SU
MM
AR
Y
Lia
bilit
y/T
ort
Cla
ims
Fu
nd
FY
15-1
6
Pri
or
Year
Actu
al
Cu
rren
t Y
ear
Bu
dg
et
Cu
rren
t Y
ear
Actu
al (E
st.
)B
UD
GE
T Y
EA
RP
roje
cte
d
Bu
dg
et
Pro
jecte
d
Bu
dg
et
Pro
jecte
d
Bu
dg
et
Pro
jecte
d
Bu
dg
et
FY
13-1
4F
Y 1
4-1
5F
Y 1
4-1
5F
Y 1
5-1
6F
Y 1
6-1
7F
Y 1
7-1
8F
Y 1
8-1
9F
Y 1
9-2
0
ES
TIM
AT
ED
RE
SO
UR
CE
S:
RE
VE
NU
ES
:
Inte
rest
28,4
51
25,0
00
33,4
90
25,0
00
25,0
00
25,0
00
25,0
00
25,0
00
Charg
es for
Serv
ices
-
-
-
-
-
-
-
-
Mis
cella
neous R
evenue
682,9
23
125,0
00
213,5
66
150,0
00
150,0
00
150,0
00
150,0
00
150,0
00
S
ub
tota
l -
Reven
ues
711,3
74
150,0
00
247,0
56
175,0
00
175,0
00
175,0
00
175,0
00
175,0
00
OT
HE
R R
ES
OU
RC
ES
:
Debt/Loan P
roceeds
-
-
-
-
-
-
-
-
Restr
icte
d P
rior
Year
Reserv
es
4,7
64,5
24
4,7
68,3
40
4,7
68,3
40
4,0
73,9
78
3,3
29,5
75
3,2
67,7
74
3,2
04,9
24
3,1
42,6
92
Unre
str
icte
d P
rior
Year
Reserv
es
-
-
-
-
-
-
-
-
TO
TA
L E
ST
IMA
TE
D R
ES
OU
RC
ES
5,4
75,8
98
4,9
18,3
40
5,0
15,3
96
4,2
48,9
78
3,5
04,5
75
3,4
42,7
74
3,3
79,9
24
3,3
17,6
92
ES
TIM
AT
ED
US
ES
DIR
EC
T C
OS
TS
BY
FU
NC
TIO
N:
Pers
onal S
erv
ices
243,7
18
264,4
90
247,1
37
273,2
52
279,1
52
284,5
20
289,5
61
293,3
22
Mate
rials
& S
upplie
s10,4
05
13,1
25
7,3
40
12,9
50
12,7
25
12,0
00
14,8
56
12,0
00
Oth
er
Serv
ices &
Charg
es:
W
ork
ers
Com
pensation C
laim
s970,4
61
957,0
00
957,0
00
1,0
29,0
00
1,0
59,8
70
1,0
91,6
66
1,1
24,4
16
1,1
58,1
48
T
ort
Cla
ims
405,7
21
225,0
00
225,0
00
225,0
00
225,0
00
225,0
00
225,0
00
225,0
00
V
ehic
le a
nd O
ther
Pro
pert
y C
laim
s88,5
29
165,0
00
164,0
00
165,0
00
165,0
00
165,0
00
165,0
00
165,0
00
Insura
nce P
rem
ium
s666,8
89
781,1
45
730,0
00
811,0
00
835,3
30
860,3
90
877,5
98
895,1
50
O
ther
Charg
es
(178,7
38)
127,5
70
189,0
60
123,9
00
132,9
55
136,2
41
132,4
55
135,7
67
T
OT
AL
ES
TIM
AT
ED
CO
ST
S2,2
06,9
85
2,5
33,3
30
2,5
19,5
37
2,6
40,1
02
2,7
10,0
32
2,7
74,8
17
2,8
28,8
86
2,8
84,3
87
TR
AN
SF
ER
S:
Tra
nsfe
rs In
1,5
53,8
55
1,6
35,5
00
1,6
35,5
00
1,7
69,6
79
2,5
38,6
82
2,6
03,5
61
2,6
58,4
25
2,7
13,3
85
Tra
nsfe
rs O
ut (S
ee d
eta
il belo
w)
(54,4
28)
(57,3
81)
(57,3
81)
(48,9
80)
(65,4
51)
(66,5
94)
(66,7
71)
(66,3
18)
N
ET
TR
AN
SF
ER
S IN
(O
UT
)1,4
99,4
27
1,5
78,1
19
1,5
78,1
19
1,7
20,6
99
2,4
73,2
31
2,5
36,9
67
2,5
91,6
54
2,6
47,0
67
OT
HE
R U
SE
S:
Reserv
e for
Council
Specia
l P
roje
cts
-
-
-
-
-
-
-
-
Reserv
e for
Capital Im
pro
vem
ents
-
-
-
-
-
-
-
-
Reserv
e for
Oth
er
Restr
icte
d P
urp
oses
4,7
68,3
40
3,9
63,1
29
4,0
73,9
78
3,3
29,5
75
3,2
67,7
74
3,2
04,9
24
3,1
42,6
92
3,0
80,3
72
Unassig
ned (
Res for
Em
erg
encie
s &
Short
falls
*)-
-
-
-
-
-
-
-
T
OT
AL
OT
HE
R U
SE
S4,7
68,3
40
3,9
63,1
29
4,0
73,9
78
3,3
29,5
75
3,2
67,7
74
3,2
04,9
24
3,1
42,6
92
3,0
80,3
72
TO
TA
L E
ST
IMA
TE
D U
SE
S5,4
75,8
98
4,9
18,3
40
5,0
15,3
96
4,2
48,9
78
3,5
04,5
75
3,4
42,7
74
3,3
79,9
24
3,3
17,6
92
DE
TA
IL O
F T
RA
NS
FE
RS
OU
T:
Adm
inis
trative S
upport
60,4
79
63,8
07
63,8
07
60,7
71
59,5
13
60,4
82
59,7
94
59,8
70
Allo
cation C
redit
(9,7
55)
(8,5
96)
(8,5
96)
(17,7
67)
-
-
-
-
Fle
et Lease A
ssessm
ent F
ee
1,6
28
1,6
77
1,6
77
1,7
61
1,8
49
1,9
42
2,0
39
2,1
41
Insura
nce A
ssessm
ent
1,6
26
(433)
(433)
2,2
02
2,2
89
2,3
70
2,4
38
2,5
07
Allo
cation C
redit
(578)
(474)
(474)
(487)
-
-
-
-
Vehic
le M
ain
tenance F
ees
1,0
28
1,4
00
1,4
00
2,5
00
1,8
00
1,8
00
2,5
00
1,8
00
54,4
28
57,3
81
57,3
81
48,9
80
65,4
51
66,5
94
66,7
71
66,3
18
113

114
HR/Training/Employee Group Insurance
2015-2016
Departmental Summary
D E P A R T M E N T A L D E S C R I P T I O N
The Human Resources Department is comprised of three divisions: Human Resources Administration, Training, and Benefits. We are dedicated to providing quality HR services to
attract, develop, motivate and retain a productive and diverse workforce within a supportive work environment by:
• Providing friendly trustworthy service to all internal and external customers;
• Attracting and hiring through comprehensive Human Resources selection and planning;
• Retaining qualified employees through training and recognition programs;
• Providing sustainable benefit products and services responsive to and valued by employees.
G O A L S
1. Promote a high quality workforce and collaborative relationships between management and
employees.
2. Develop and provide citywide training and recognition programs to enhance personal and
professional growth.
3. Provide a competitive benefits package that enhances recruitment and retention through prudent
management of resources.
4. Provide a comprehensive wellness program to assist and promote employee well being.
5. Review processes, making changes as needed, to improve efficiency and/or greater customer
service.
S T A F F I N G (FT-PT-S)
Current Level Year 1 Year 2 Year 3 Year 4 Year 5
5-0-0 5-0-0 5-0-0 5-0-0 5-0-0 5-0-0
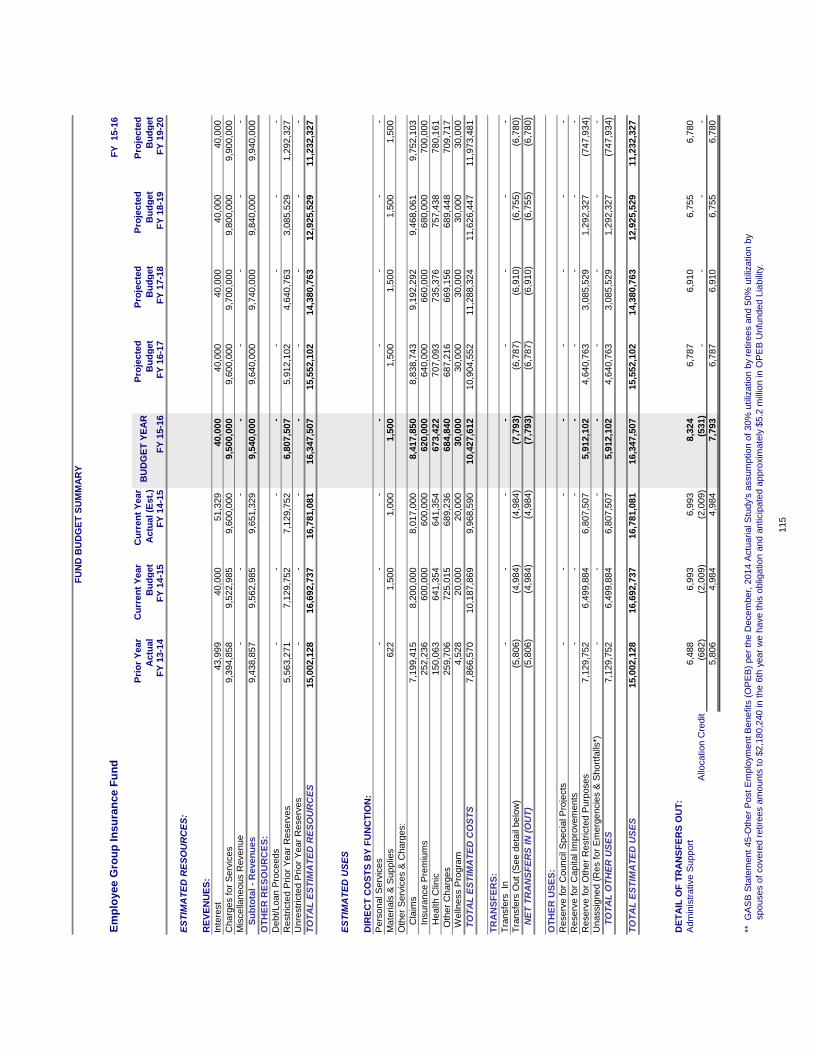
FU
ND
BU
DG
ET
SU
MM
AR
Y
Em
plo
yee G
rou
p In
su
ran
ce F
un
dF
Y 15-1
6
Pri
or
Year
Actu
al
Cu
rren
t Y
ear
Bu
dg
et
Cu
rren
t Y
ear
Actu
al (E
st.
)B
UD
GE
T Y
EA
RP
roje
cte
d
Bu
dg
et
Pro
jecte
d
Bu
dg
et
Pro
jecte
d
Bu
dg
et
Pro
jecte
d
Bu
dg
et
FY
13-1
4F
Y 1
4-1
5F
Y 1
4-1
5F
Y 1
5-1
6F
Y 1
6-1
7F
Y 1
7-1
8F
Y 1
8-1
9F
Y 1
9-2
0
ES
TIM
AT
ED
RE
SO
UR
CE
S:
RE
VE
NU
ES
:
Inte
rest
43,9
99
40,0
00
51,3
29
40,0
00
40,0
00
40,0
00
40,0
00
40,0
00
Charg
es for
Serv
ices
9,3
94,8
58
9,5
22,9
85
9,6
00,0
00
9,5
00,0
00
9,6
00,0
00
9,7
00,0
00
9,8
00,0
00
9,9
00,0
00
Mis
cella
neous R
evenue
-
-
-
-
-
-
-
-
S
ub
tota
l -
Reven
ues
9,4
38,8
57
9,5
62,9
85
9,6
51,3
29
9,5
40,0
00
9,6
40,0
00
9,7
40,0
00
9,8
40,0
00
9,9
40,0
00
OT
HE
R R
ES
OU
RC
ES
:
Debt/Loan P
roceeds
-
-
-
-
-
-
-
-
Restr
icte
d P
rior
Year
Reserv
es
5,5
63,2
71
7,1
29,7
52
7,1
29,7
52
6,8
07,5
07
5,9
12,1
02
4,6
40,7
63
3,0
85,5
29
1,2
92,3
27
Unre
str
icte
d P
rior
Year
Reserv
es
-
-
-
-
-
-
-
-
TO
TA
L E
ST
IMA
TE
D R
ES
OU
RC
ES
15,0
02,1
28
16,6
92,7
37
16,7
81,0
81
16,3
47,5
07
15,5
52,1
02
14,3
80,7
63
12,9
25,5
29
11,2
32,3
27
ES
TIM
AT
ED
US
ES
DIR
EC
T C
OS
TS
BY
FU
NC
TIO
N:
Pers
onal S
erv
ices
-
-
-
-
-
-
-
-
Mate
rials
& S
upplie
s622
1,5
00
1,0
00
1,5
00
1,5
00
1,5
00
1,5
00
1,5
00
Oth
er
Serv
ices &
Charg
es:
C
laim
s7,1
99,4
15
8,2
00,0
00
8,0
17,0
00
8,4
17,8
50
8,8
38,7
43
9,1
92,2
92
9,4
68,0
61
9,7
52,1
03
Insura
nce P
rem
ium
s252,2
36
600,0
00
600,0
00
620,0
00
640,0
00
660,0
00
680,0
00
700,0
00
H
ealth C
linic
150,0
63
641,3
54
641,3
54
673,4
22
707,0
93
735,3
76
757,4
38
780,1
61
O
ther
Charg
es
259,7
06
725,0
15
689,2
36
684,8
40
687,2
16
669,1
56
689,4
48
709,7
17
W
elln
ess P
rogra
m4,5
28
20,0
00
20,0
00
30,0
00
30,0
00
30,0
00
30,0
00
30,0
00
T
OT
AL
ES
TIM
AT
ED
CO
ST
S7,8
66,5
70
10,1
87,8
69
9,9
68,5
90
10,4
27,6
12
10,9
04,5
52
11,2
88,3
24
11,6
26,4
47
11,9
73,4
81
TR
AN
SF
ER
S:
Tra
nsfe
rs In
-
-
-
-
-
-
-
-
Tra
nsfe
rs O
ut (S
ee d
eta
il belo
w)
(5,8
06)
(4,9
84)
(4,9
84)
(7,7
93)
(6,7
87)
(6,9
10)
(6,7
55)
(6,7
80)
N
ET
TR
AN
SF
ER
S IN
(O
UT
)(5
,806)
(4,9
84)
(4,9
84)
(7,7
93)
(6,7
87)
(6,9
10)
(6,7
55)
(6,7
80)
OT
HE
R U
SE
S:
Reserv
e for
Council
Specia
l P
roje
cts
-
-
-
-
-
-
-
-
Reserv
e for
Capital Im
pro
vem
ents
-
-
-
-
-
-
-
-
Reserv
e for
Oth
er
Restr
icte
d P
urp
oses
7,1
29,7
52
6,4
99,8
84
6,8
07,5
07
5,9
12,1
02
4,6
40,7
63
3,0
85,5
29
1,2
92,3
27
(747,9
34)
Unassig
ned (
Res for
Em
erg
encie
s &
Short
falls
*)-
-
-
-
-
-
-
-
T
OT
AL
OT
HE
R U
SE
S7,1
29,7
52
6,4
99,8
84
6,8
07,5
07
5,9
12,1
02
4,6
40,7
63
3,0
85,5
29
1,2
92,3
27
(747,9
34)
TO
TA
L E
ST
IMA
TE
D U
SE
S15,0
02,1
28
16,6
92,7
37
16,7
81,0
81
16,3
47,5
07
15,5
52,1
02
14,3
80,7
63
12,9
25,5
29
11,2
32,3
27
DE
TA
IL O
F T
RA
NS
FE
RS
OU
T:
Adm
inis
trative S
upport
6,4
88
6,9
93
6,9
93
8,3
24
6,7
87
6,9
10
6,7
55
6,7
80
Allo
cation C
redit
(682)
(2
,009)
(2,0
09)
(531)
-
-
-
-
5,8
06
4,9
84
4,9
84
7,7
93
6,7
87
6,9
10
6,7
55
6,7
80
** G
AS
B S
tate
ment 45-O
ther
Post E
mplo
yment B
enefits
(O
PE
B)
per
the D
ecem
ber,
2014 A
ctu
arial S
tudy'
s a
ssum
ption o
f 30%
utiliz
ation b
y re
tire
es a
nd 5
0%
utiliz
ation b
y
s
pouses o
f covere
d r
etire
es a
mounts
to $
2,1
80,2
40 in the 6
th y
ear
we h
ave this
oblig
ation a
nd a
nticip
ate
d a
ppro
xim
ate
ly $
5.2
mill
ion in O
PE
B U
nfu
nded L
iabili
ty.
115
116
Vehicle Maintenance
2015-2016
Departmental Summary
D E P A R T M E N T A L D E S C R I P T I O N
Vehicle Maintenance is an ASE Certified Blue Seal Facility. Vehicle maintenance delivers
high quality, cost effective best in class trustworthy service to our customers. The department
provides repair and preventative maintenance support services for the City’s approximately
480 vehicles and equipment. Employees are responsible for maintaining and repairing
vehicles/equipment, ordering and installing parts, tire repair and tire replacement. The
department also provides “on call” mechanic available when the shop is not open who
provides emergency repair service for any type of vehicle/equipment.
1. Provide unparalleled customer service to customers.
2. Maintain the ASE Blue Seal of Excellence program for departmental technicians and
facility.
3. Diagnose, analyze and repair vehicles/equipment and/or outsource for repairs not
provided in-house.
4. Develop an alternate fuel infrastructure to provide Expand use of L.P.G. and C.N.G.
for selected owned vehicles.
5. Promote continuous improvement within the department.
6. Evaluate all new technologies in an effort to protect the environment.
7. Examine new technologies and training opportunities to lower departmental costs.
S T A F F I N G (FT-PT-S)
Current Level Year 1 Year 2 Year 3 Year 4 Year 5 11.35-0-0 11.35-0-0 11.35-0-0 11.35-0-0 11.35-0-0 11.35-0-0
*.65 Split with Fleet Management Fund
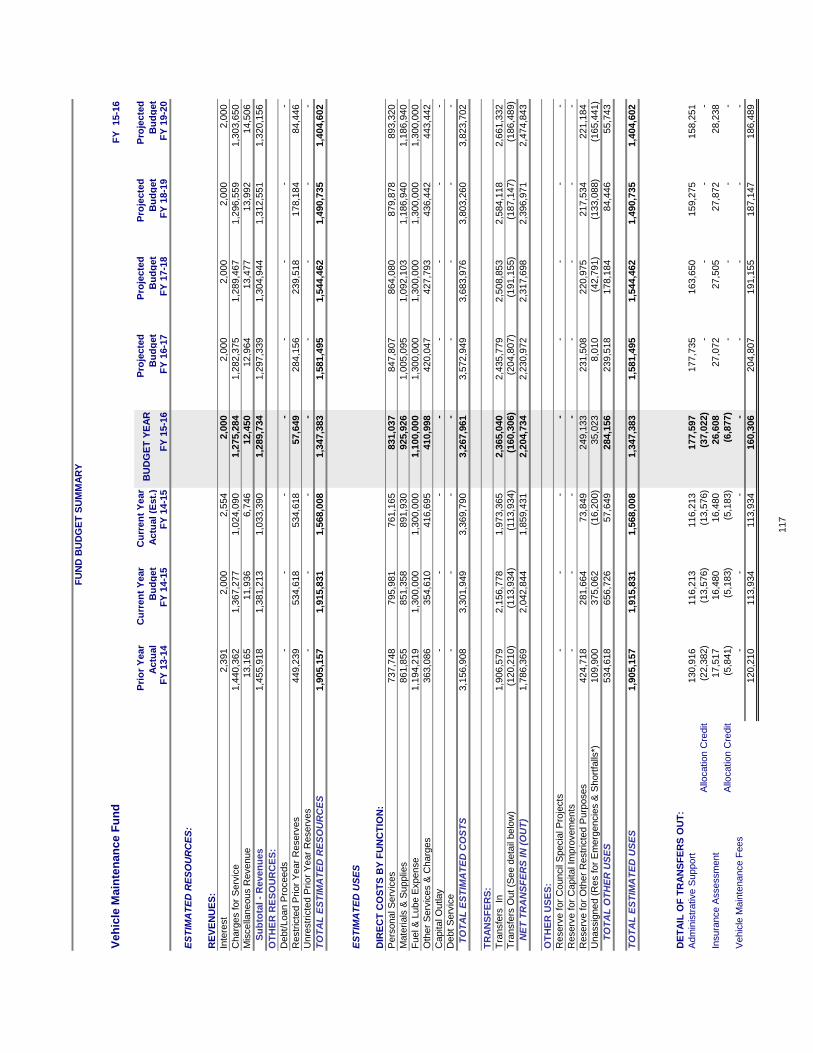
FU
ND
BU
DG
ET
SU
MM
AR
Y
Veh
icle
Main
ten
an
ce F
un
dF
Y
15-1
6
Pri
or
Year
Actu
al
Cu
rren
t Y
ear
Bu
dg
et
Cu
rren
t Y
ear
Actu
al
(Est.
)B
UD
GE
T Y
EA
RP
roje
cte
d
Bu
dg
et
Pro
jecte
d
Bu
dg
et
Pro
jecte
d
Bu
dg
et
Pro
jecte
d
Bu
dg
et
FY
13-1
4F
Y 1
4-1
5F
Y 1
4-1
5F
Y 1
5-1
6F
Y 1
6-1
7F
Y 1
7-1
8F
Y 1
8-1
9F
Y 1
9-2
0
ES
TIM
AT
ED
RE
SO
UR
CE
S:
RE
VE
NU
ES
:
Inte
rest
2,3
91
2,0
00
2,5
54
2,0
00
2,0
00
2,0
00
2,0
00
2,0
00
Charg
es f
or
Serv
ice
1,4
40,3
62
1,3
67,2
77
1,0
24,0
90
1,2
75,2
84
1,2
82,3
75
1,2
89,4
67
1,2
96,5
59
1,3
03,6
50
Mis
cella
neous R
evenue
13,1
65
11,9
36
6,7
46
12,4
50
12,9
64
13,4
77
13,9
92
14,5
06
S
ub
tota
l -
Reven
ues
1,4
55,9
18
1,3
81,2
13
1,0
33,3
90
1,2
89,7
34
1,2
97,3
39
1,3
04,9
44
1,3
12,5
51
1,3
20,1
56
OT
HE
R R
ES
OU
RC
ES
:
Debt/
Loan P
roceeds
-
-
-
-
-
-
-
-
Restr
icte
d P
rior
Year
Reserv
es
449,2
39
534,6
18
534,6
18
57,6
49
284,1
56
239,5
18
178,1
84
84,4
46
Unre
str
icte
d P
rior
Year
Reserv
es
-
-
-
-
-
-
-
-
TO
TA
L E
ST
IMA
TE
D R
ES
OU
RC
ES
1,9
05,1
57
1,9
15,8
31
1,5
68,0
08
1,3
47,3
83
1,5
81,4
95
1,5
44,4
62
1,4
90,7
35
1,4
04,6
02
ES
TIM
AT
ED
US
ES
DIR
EC
T C
OS
TS
BY
FU
NC
TIO
N:
Pers
onal S
erv
ices
737,7
48
795,9
81
761,1
65
831,0
37
847,8
07
864,0
80
879,8
78
893,3
20
Mate
rials
& S
upplie
s861,8
55
851,3
58
891,9
30
925,9
26
1,0
05,0
95
1,0
92,1
03
1,1
86,9
40
1,1
86,9
40
Fuel &
Lube E
xpense
1,1
94,2
19
1,3
00,0
00
1,3
00,0
00
1,1
00,0
00
1,3
00,0
00
1,3
00,0
00
1,3
00,0
00
1,3
00,0
00
Oth
er
Serv
ices &
Charg
es
363,0
86
354,6
10
416,6
95
410,9
98
420,0
47
427,7
93
436,4
42
443,4
42
Capital O
utlay
-
-
-
-
-
-
-
-
Debt
Serv
ice
-
-
-
-
-
-
-
-
T
OT
AL
ES
TIM
AT
ED
CO
ST
S3,1
56,9
08
3,3
01,9
49
3,3
69,7
90
3,2
67,9
61
3,5
72,9
49
3,6
83,9
76
3,8
03,2
60
3,8
23,7
02
TR
AN
SF
ER
S:
Tra
nsfe
rs
In1,9
06,5
79
2,1
56,7
78
1,9
73,3
65
2,3
65,0
40
2,4
35,7
79
2,5
08,8
53
2,5
84,1
18
2,6
61,3
32
Tra
nsfe
rs O
ut
(See d
eta
il belo
w)
(120,2
10)
(113,9
34)
(113,9
34)
(160,3
06)
(204,8
07)
(191,1
55)
(187,1
47)
(186,4
89)
N
ET
TR
AN
SF
ER
S IN
(O
UT
)1,7
86,3
69
2,0
42,8
44
1,8
59,4
31
2,2
04,7
34
2,2
30,9
72
2,3
17,6
98
2,3
96,9
71
2,4
74,8
43
OT
HE
R U
SE
S:
Reserv
e f
or
Council
Specia
l P
roje
cts
-
-
-
-
-
-
-
-
Reserv
e f
or
Capital Im
pro
vem
ents
-
-
-
-
-
-
-
-
Reserv
e f
or
Oth
er
Restr
icte
d P
urp
oses
424,7
18
281,6
64
73,8
49
249,1
33
231,5
08
220,9
75
217,5
34
221,1
84
Unassig
ned (
Res f
or
Em
erg
encie
s &
Short
falls
*)109,9
00
375,0
62
(1
6,2
00)
35,0
23
8,0
10
(4
2,7
91)
(1
33,0
88)
(165,4
41)
T
OT
AL
OT
HE
R U
SE
S534,6
18
656,7
26
57,6
49
284,1
56
239,5
18
178,1
84
84,4
46
55,7
43
TO
TA
L E
ST
IMA
TE
D U
SE
S1,9
05,1
57
1,9
15,8
31
1,5
68,0
08
1,3
47,3
83
1,5
81,4
95
1,5
44,4
62
1,4
90,7
35
1,4
04,6
02
DE
TA
IL O
F T
RA
NS
FE
RS
OU
T:
Adm
inis
trative S
upport
130,9
16
116,2
13
116,2
13
177,5
97
177,7
35
163,6
50
159,2
75
158,2
51
Allo
cation C
redit
(22,3
82)
(1
3,5
76)
(1
3,5
76)
(3
7,0
22)
-
-
-
-
Insura
nce A
ssessm
ent
17,5
17
16,4
80
16,4
80
26,6
08
27,0
72
27,5
05
27,8
72
28,2
38
Allo
cation C
redit
(5,8
41)
(5,1
83)
(5,1
83)
(6,8
77)
-
-
-
-
Vehic
le M
ain
tenance F
ees
-
-
-
-
-
-
-
-
120,2
10
113,9
34
113,9
34
160,3
06
204,8
07
191,1
55
187,1
47
186,4
89
117
118
Administrative Support Services
2015-2016
Departmental Summary
D E P A R T M E N T A L D E S C R I P T I O N
The Administrative Support Services Fund has been established to allocate administrative overhead costs to user departments of the City. Financing is provided through billings to user departments based upon applicable cost accounting methods.
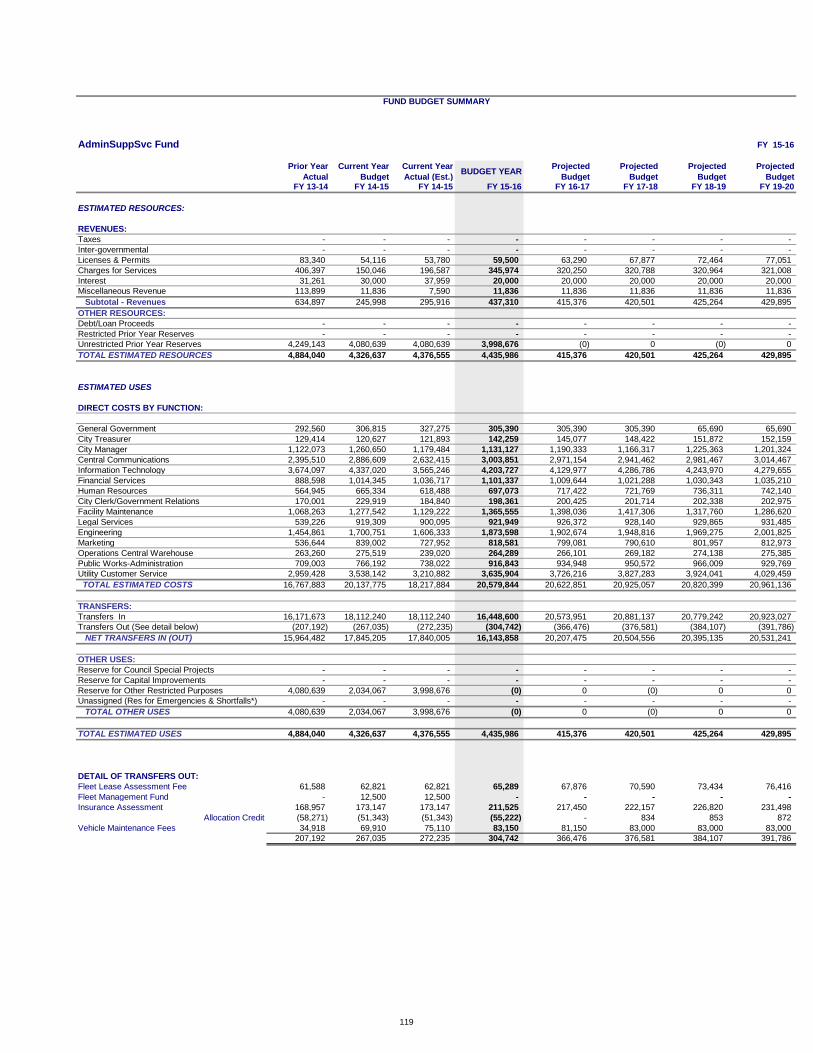
FUND BUDGET SUMMARY
AdminSuppSvc Fund FY 15-16
Prior Year
Actual
Current Year
Budget
Current Year
Actual (Est.)BUDGET YEAR
Projected
Budget
Projected
Budget
Projected
Budget
Projected
BudgetFY 13-14 FY 14-15 FY 14-15 FY 15-16 FY 16-17 FY 17-18 FY 18-19 FY 19-20
ESTIMATED RESOURCES:
REVENUES:
Taxes - - - - - - - -
Inter-governmental - - - - - - - -
Licenses & Permits 83,340 54,116 53,780 59,500 63,290 67,877 72,464 77,051
Charges for Services 406,397 150,046 196,587 345,974 320,250 320,788 320,964 321,008
Interest 31,261 30,000 37,959 20,000 20,000 20,000 20,000 20,000
Miscellaneous Revenue 113,899 11,836 7,590 11,836 11,836 11,836 11,836 11,836
Subtotal - Revenues 634,897 245,998 295,916 437,310 415,376 420,501 425,264 429,895
OTHER RESOURCES:
Debt/Loan Proceeds - - - - - - - -
Restricted Prior Year Reserves - - - - - - - -
Unrestricted Prior Year Reserves 4,249,143 4,080,639 4,080,639 3,998,676 (0) 0 (0) 0
TOTAL ESTIMATED RESOURCES 4,884,040 4,326,637 4,376,555 4,435,986 415,376 420,501 425,264 429,895
ESTIMATED USES
DIRECT COSTS BY FUNCTION:
General Government 292,560 306,815 327,275 305,390 305,390 305,390 65,690 65,690
City Treasurer 129,414 120,627 121,893 142,259 145,077 148,422 151,872 152,159
City Manager 1,122,073 1,260,650 1,179,484 1,131,127 1,190,333 1,166,317 1,225,363 1,201,324
Central Communications 2,395,510 2,886,609 2,632,415 3,003,851 2,971,154 2,941,462 2,981,467 3,014,467
Information Technology 3,674,097 4,337,020 3,565,246 4,203,727 4,129,977 4,286,786 4,243,970 4,279,655
Financial Services 888,598 1,014,345 1,036,717 1,101,337 1,009,644 1,021,288 1,030,343 1,035,210
Human Resources 564,945 665,334 618,488 697,073 717,422 721,769 736,311 742,140
City Clerk/Government Relations 170,001 229,919 184,840 198,361 200,425 201,714 202,338 202,975
Facility Maintenance 1,068,263 1,277,542 1,129,222 1,365,555 1,398,036 1,417,306 1,317,760 1,286,620
Legal Services 539,226 919,309 900,095 921,949 926,372 928,140 929,865 931,485
Engineering 1,454,861 1,700,751 1,606,333 1,873,598 1,902,674 1,948,816 1,969,275 2,001,825
Marketing 536,644 839,002 727,952 818,581 799,081 790,610 801,957 812,973
Operations Central Warehouse 263,260 275,519 239,020 264,289 266,101 269,182 274,138 275,385
Public Works-Administration 709,003 766,192 738,022 916,843 934,948 950,572 966,009 929,769
Utility Customer Service 2,959,428 3,538,142 3,210,882 3,635,904 3,726,216 3,827,283 3,924,041 4,029,459
TOTAL ESTIMATED COSTS 16,767,883 20,137,775 18,217,884 20,579,844 20,622,851 20,925,057 20,820,399 20,961,136
TRANSFERS:
Transfers In 16,171,673 18,112,240 18,112,240 16,448,600 20,573,951 20,881,137 20,779,242 20,923,027
Transfers Out (See detail below) (207,192) (267,035) (272,235) (304,742) (366,476) (376,581) (384,107) (391,786)
NET TRANSFERS IN (OUT) 15,964,482 17,845,205 17,840,005 16,143,858 20,207,475 20,504,556 20,395,135 20,531,241
OTHER USES:
Reserve for Council Special Projects - - - - - - - -
Reserve for Capital Improvements - - - - - - - -
Reserve for Other Restricted Purposes 4,080,639 2,034,067 3,998,676 (0) 0 (0) 0 0
Unassigned (Res for Emergencies & Shortfalls*) - - - - - - - -
TOTAL OTHER USES 4,080,639 2,034,067 3,998,676 (0) 0 (0) 0 0
TOTAL ESTIMATED USES 4,884,040 4,326,637 4,376,555 4,435,986 415,376 420,501 425,264 429,895
DETAIL OF TRANSFERS OUT:
Fleet Lease Assessment Fee 61,588 62,821 62,821 65,289 67,876 70,590 73,434 76,416
Fleet Management Fund - 12,500 12,500 - - - - -
Insurance Assessment 168,957 173,147 173,147 211,525 217,450 222,157 226,820 231,498
Allocation Credit (58,271) (51,343) (51,343) (55,222) - 834 853 872
Vehicle Maintenance Fees 34,918 69,910 75,110 83,150 81,150 83,000 83,000 83,000
207,192 267,035 272,235 304,742 366,476 376,581 384,107 391,786
119
120
General Government
2015-2016
Departmental summary
D E P A R T M E N T A L D E S C R I P T I O N
This department details the general, non-specific operating costs for the Administrative Support Service Departments listed on the following pages.
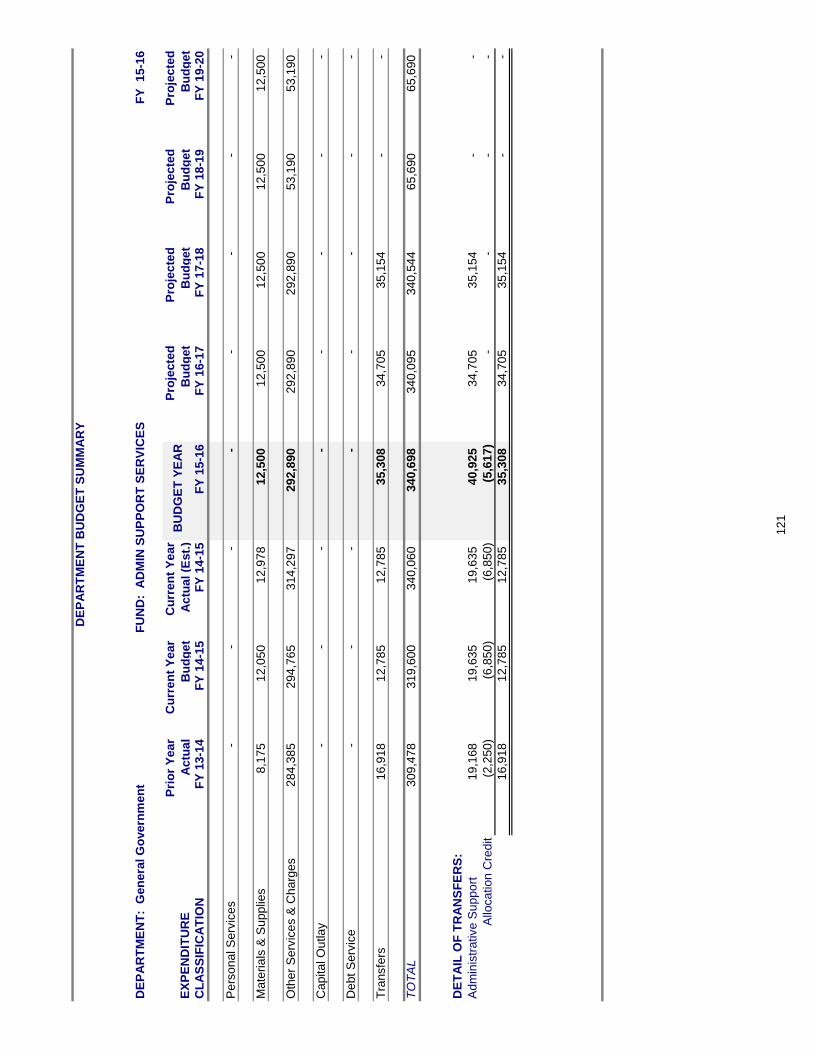
DE
PA
RT
ME
NT
BU
DG
ET
SU
MM
AR
Y
DE
PA
RT
ME
NT
: G
en
era
l G
overn
men
t F
UN
D:
AD
MIN
SU
PP
OR
T S
ER
VIC
ES
FY
15-1
6
EX
PE
ND
ITU
RE
Pri
or
Year
Actu
al
Cu
rren
t Y
ear
Bu
dg
et
Cu
rren
t Y
ear
Actu
al (E
st.
)B
UD
GE
T Y
EA
RP
roje
cte
d
Bu
dg
et
Pro
jecte
d
Bu
dg
et
Pro
jecte
d
Bu
dg
et
Pro
jecte
d
Bu
dg
et
CL
AS
SIF
ICA
TIO
NF
Y 1
3-1
4F
Y 1
4-1
5F
Y 1
4-1
5F
Y 1
5-1
6F
Y 1
6-1
7F
Y 1
7-1
8F
Y 1
8-1
9F
Y 1
9-2
0
Pers
onal S
erv
ices
-
-
-
-
-
-
-
-
Mate
rials
& S
upplie
s8,1
75
12,0
50
12,9
78
12,5
00
12,5
00
12,5
00
12,5
00
12,5
00
Oth
er
Serv
ices &
Charg
es
284,3
85
294,7
65
314,2
97
292,8
90
292,8
90
292,8
90
53,1
90
53,1
90
Capital O
utlay
-
-
-
-
-
-
-
-
Debt S
erv
ice
-
-
-
-
-
-
-
-
Tra
nsfe
rs16,9
18
12,7
85
12,7
85
35,3
08
34,7
05
35,1
54
-
-
TO
TA
L309,4
78
319,6
00
340,0
60
340,6
98
340,0
95
340,5
44
65,6
90
65,6
90
DE
TA
IL O
F T
RA
NS
FE
RS
:
Adm
inis
trative S
upport
19,1
68
19,6
35
19,6
35
40,9
25
34,7
05
35,1
54
-
-
Allo
cation C
redit
(2,2
50)
(6,8
50)
(6,8
50)
(5,6
17)
-
-
-
-
16,9
18
12,7
85
12,7
85
35,3
08
34,7
05
35,1
54
-
-
121
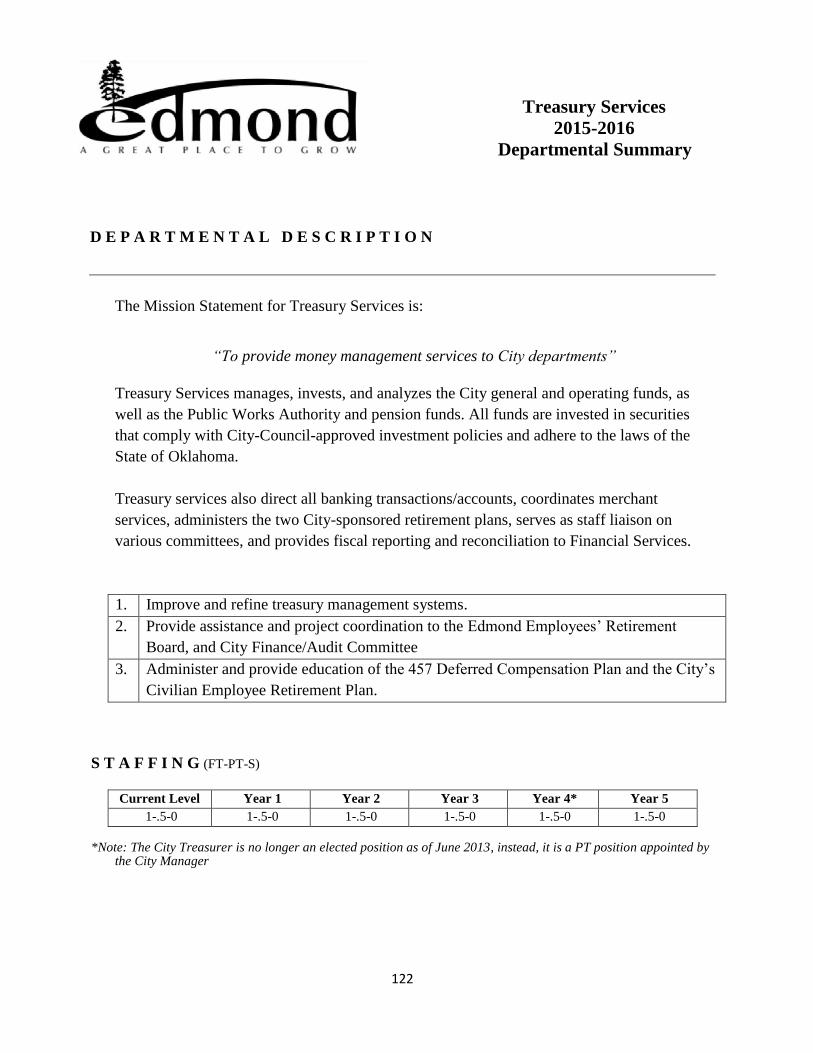
122
Treasury Services
2015-2016
Departmental Summary
D E P A R T M E N T A L D E S C R I P T I O N
The Mission Statement for Treasury Services is:
“To provide money management services to City departments”
Treasury Services manages, invests, and analyzes the City general and operating funds, as
well as the Public Works Authority and pension funds. All funds are invested in securities
that comply with City-Council-approved investment policies and adhere to the laws of the
State of Oklahoma.
Treasury services also direct all banking transactions/accounts, coordinates merchant
services, administers the two City-sponsored retirement plans, serves as staff liaison on
various committees, and provides fiscal reporting and reconciliation to Financial Services.
1. Improve and refine treasury management systems.
2. Provide assistance and project coordination to the Edmond Employees’ Retirement
Board, and City Finance/Audit Committee
3. Administer and provide education of the 457 Deferred Compensation Plan and the City’s
Civilian Employee Retirement Plan.
S T A F F I N G (FT-PT-S) Current Level Year 1 Year 2 Year 3 Year 4* Year 5
1-.5-0 1-.5-0 1-.5-0 1-.5-0 1-.5-0 1-.5-0 *Note: The City Treasurer is no longer an elected position as of June 2013, instead, it is a PT position appointed by
the City Manager
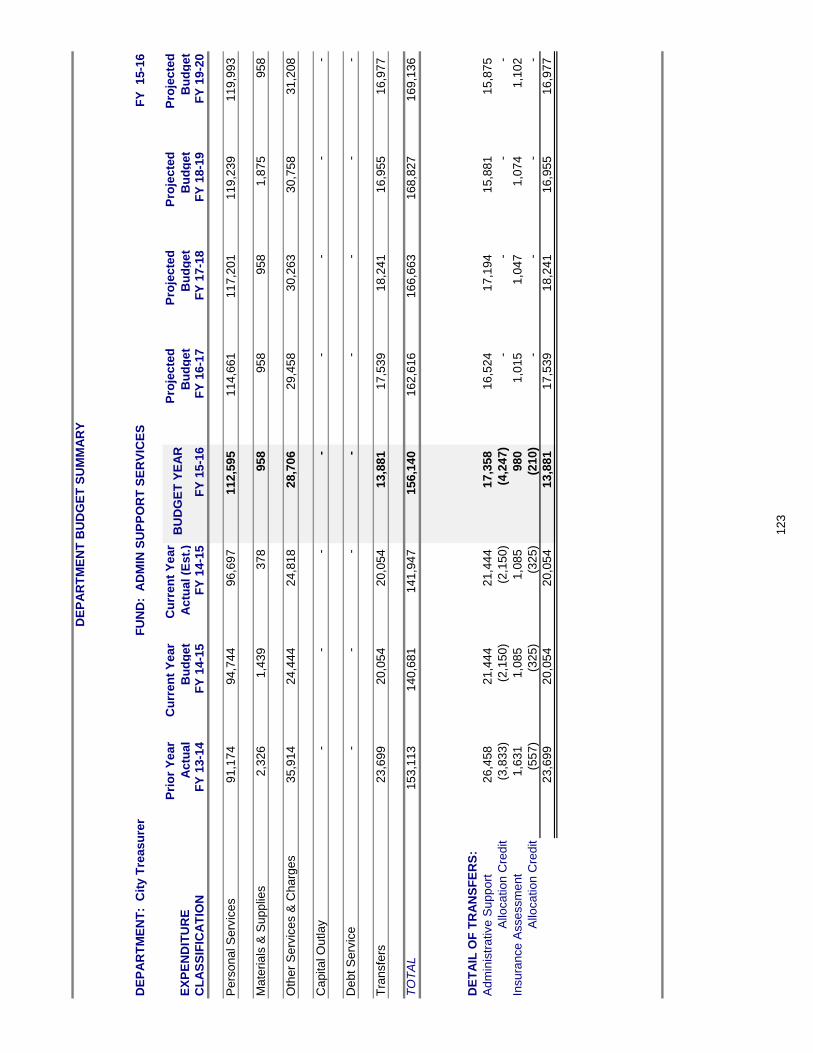
DE
PA
RT
ME
NT
BU
DG
ET
SU
MM
AR
Y
DE
PA
RT
ME
NT
: C
ity T
reasu
rer
FU
ND
: A
DM
IN S
UP
PO
RT
SE
RV
ICE
SF
Y 15-1
6
EX
PE
ND
ITU
RE
Pri
or
Year
Actu
al
Cu
rren
t Y
ear
Bu
dg
et
Cu
rren
t Y
ear
Actu
al (E
st.
)B
UD
GE
T Y
EA
RP
roje
cte
d
Bu
dg
et
Pro
jecte
d
Bu
dg
et
Pro
jecte
d
Bu
dg
et
Pro
jecte
d
Bu
dg
et
CL
AS
SIF
ICA
TIO
NF
Y 1
3-1
4F
Y 1
4-1
5F
Y 1
4-1
5F
Y 1
5-1
6F
Y 1
6-1
7F
Y 1
7-1
8F
Y 1
8-1
9F
Y 1
9-2
0
Pers
onal S
erv
ices
91,1
74
94,7
44
96,6
97
112,5
95
114,6
61
117,2
01
119,2
39
119,9
93
Mate
rials
& S
upplie
s2,3
26
1,4
39
378
958
958
958
1,8
75
958
Oth
er
Serv
ices &
Charg
es
35,9
14
24,4
44
24,8
18
28,7
06
29,4
58
30,2
63
30,7
58
31,2
08
Capital O
utlay
-
-
-
-
-
-
-
-
Debt S
erv
ice
-
-
-
-
-
-
-
-
Tra
nsfe
rs23,6
99
20,0
54
20,0
54
13,8
81
17,5
39
18,2
41
16,9
55
16,9
77
TO
TA
L153,1
13
140,6
81
141,9
47
156,1
40
162,6
16
166,6
63
168,8
27
169,1
36
DE
TA
IL O
F T
RA
NS
FE
RS
:
Adm
inis
trative S
upport
26,4
58
21,4
44
21,4
44
17,3
58
16,5
24
17,1
94
15,8
81
15,8
75
Allo
cation C
redit
(3,8
33)
(2,1
50)
(2,1
50)
(4,2
47)
-
-
-
-
Insura
nce A
ssessm
ent
1,6
31
1,0
85
1,0
85
980
1,0
15
1,0
47
1,0
74
1,1
02
Allo
cation C
redit
(557)
(325)
(325)
(210)
-
-
-
-
23,6
99
20,0
54
20,0
54
13,8
81
17,5
39
18,2
41
16,9
55
16,9
77
123
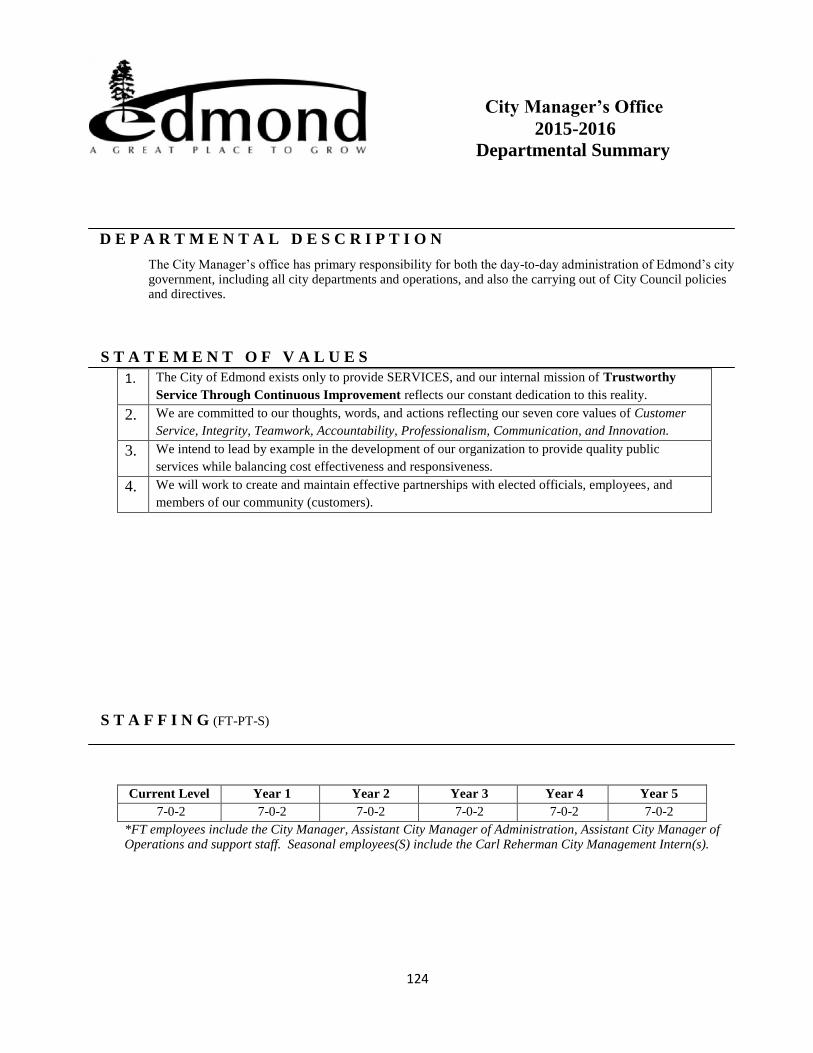
124
City Manager’s Office
2015-2016
Departmental Summary
D E P A R T M E N T A L D E S C R I P T I O N
The City Manager’s office has primary responsibility for both the day-to-day administration of Edmond’s city government, including all city departments and operations, and also the carrying out of City Council policies and directives.
S T A T E M E N T O F V A L U E S
1. The City of Edmond exists only to provide SERVICES, and our internal mission of Trustworthy
Service Through Continuous Improvement reflects our constant dedication to this reality.
2. We are committed to our thoughts, words, and actions reflecting our seven core values of Customer
Service, Integrity, Teamwork, Accountability, Professionalism, Communication, and Innovation.
3. We intend to lead by example in the development of our organization to provide quality public
services while balancing cost effectiveness and responsiveness.
4. We will work to create and maintain effective partnerships with elected officials, employees, and
members of our community (customers).
S T A F F I N G (FT-PT-S)
Current Level Year 1 Year 2 Year 3 Year 4 Year 5 7-0-2 7-0-2 7-0-2 7-0-2 7-0-2 7-0-2
*FT employees include the City Manager, Assistant City Manager of Administration, Assistant City Manager of Operations and support staff. Seasonal employees(S) include the Carl Reherman City Management Intern(s).
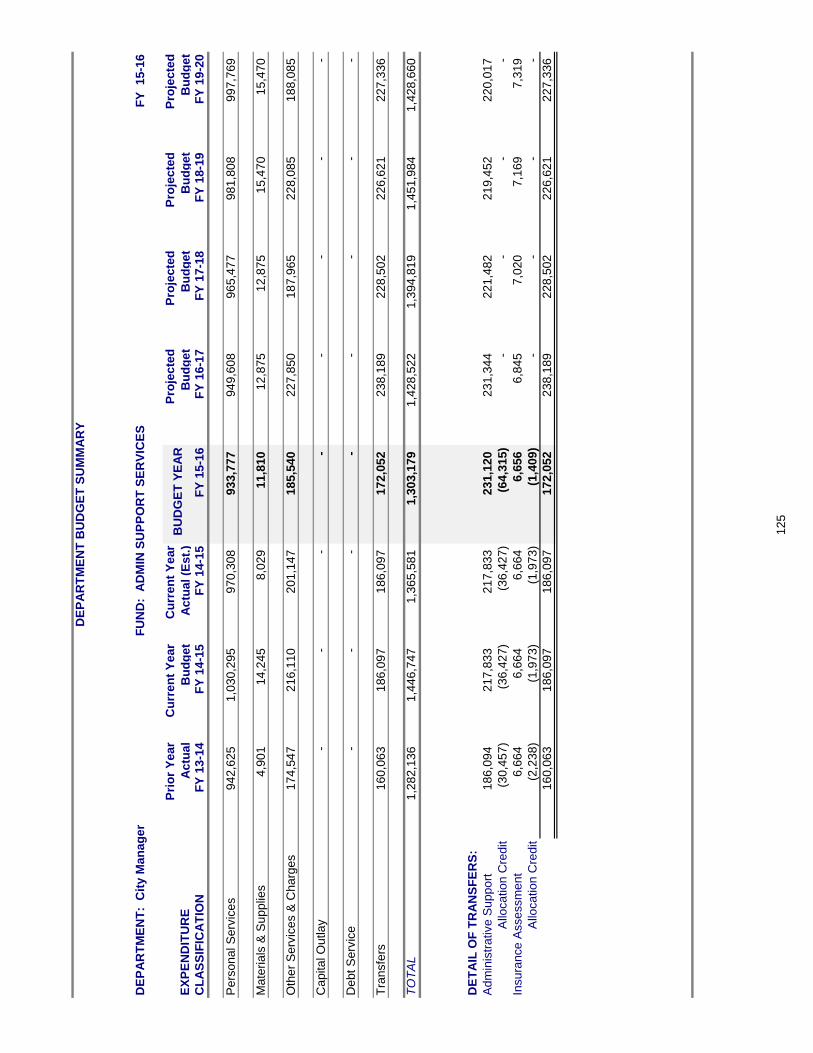
DE
PA
RT
ME
NT
BU
DG
ET
SU
MM
AR
Y
DE
PA
RT
ME
NT
: C
ity M
an
ag
er
FU
ND
: A
DM
IN S
UP
PO
RT
SE
RV
ICE
SF
Y 15-1
6
EX
PE
ND
ITU
RE
Pri
or
Year
Actu
al
Cu
rren
t Y
ear
Bu
dg
et
Cu
rren
t Y
ear
Actu
al (E
st.
)B
UD
GE
T Y
EA
RP
roje
cte
d
Bu
dg
et
Pro
jecte
d
Bu
dg
et
Pro
jecte
d
Bu
dg
et
Pro
jecte
d
Bu
dg
et
CL
AS
SIF
ICA
TIO
NF
Y 1
3-1
4F
Y 1
4-1
5F
Y 1
4-1
5F
Y 1
5-1
6F
Y 1
6-1
7F
Y 1
7-1
8F
Y 1
8-1
9F
Y 1
9-2
0
Pers
onal S
erv
ices
942,6
25
1,0
30,2
95
970,3
08
933,7
77
949,6
08
965,4
77
981,8
08
997,7
69
Mate
rials
& S
upplie
s4,9
01
14,2
45
8,0
29
11,8
10
12,8
75
12,8
75
15,4
70
15,4
70
Oth
er
Serv
ices &
Charg
es
174,5
47
216,1
10
201,1
47
185,5
40
227,8
50
187,9
65
228,0
85
188,0
85
Capital O
utlay
-
-
-
-
-
-
-
-
Debt S
erv
ice
-
-
-
-
-
-
-
-
Tra
nsfe
rs160,0
63
186,0
97
186,0
97
172,0
52
238,1
89
228,5
02
226,6
21
227,3
36
TO
TA
L1,2
82,1
36
1,4
46,7
47
1,3
65,5
81
1,3
03,1
79
1,4
28,5
22
1,3
94,8
19
1,4
51,9
84
1,4
28,6
60
DE
TA
IL O
F T
RA
NS
FE
RS
:
Adm
inis
trative S
upport
186,0
94
217,8
33
217,8
33
231,1
20
231,3
44
221,4
82
219,4
52
220,0
17
Allo
cation C
redit
(30,4
57)
(36,4
27)
(36,4
27)
(64,3
15)
-
-
-
-
Insura
nce A
ssessm
ent
6,6
64
6,6
64
6,6
64
6,6
56
6,8
45
7,0
20
7,1
69
7,3
19
Allo
cation C
redit
(2,2
38)
(1,9
73)
(1,9
73)
(1,4
09)
-
-
-
-
160,0
63
186,0
97
186,0
97
172,0
52
238,1
89
228,5
02
226,6
21
227,3
36
125
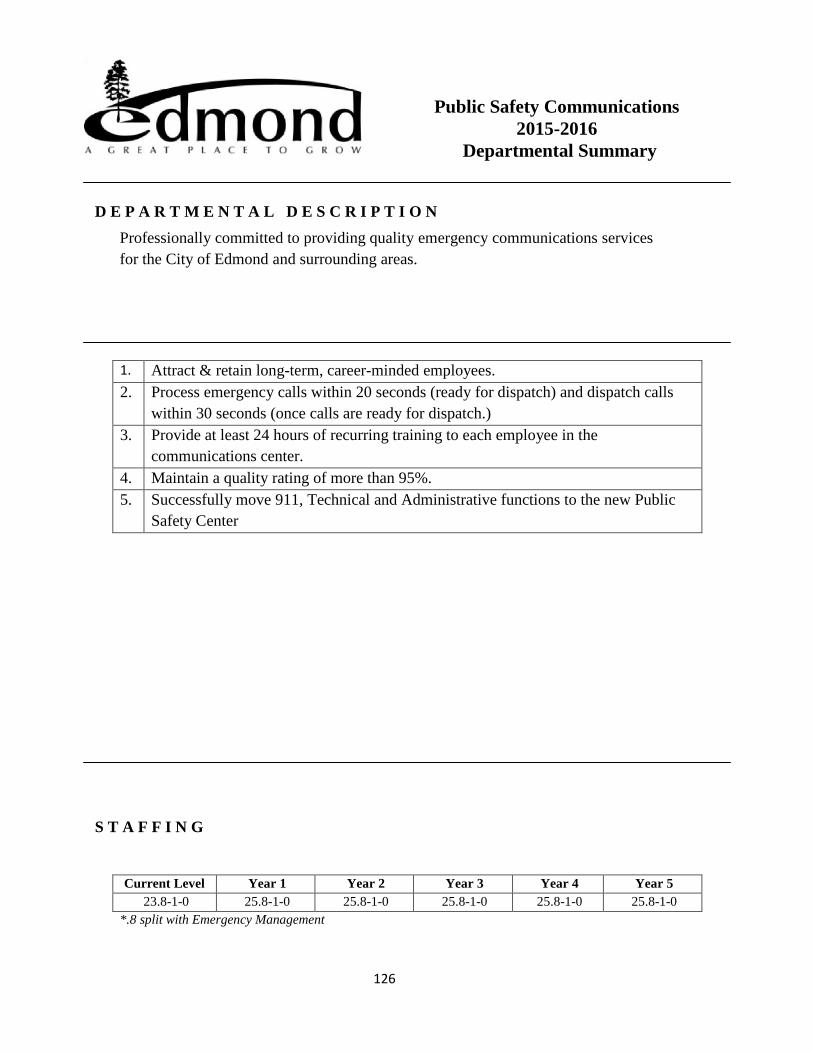
126
Public Safety Communications
2015-2016
Departmental Summary
D E P A R T M E N T A L D E S C R I P T I O N
Professionally committed to providing quality emergency communications services
for the City of Edmond and surrounding areas.
1. Attract & retain long-term, career-minded employees.
2. Process emergency calls within 20 seconds (ready for dispatch) and dispatch calls
within 30 seconds (once calls are ready for dispatch.)
3. Provide at least 24 hours of recurring training to each employee in the
communications center.
4. Maintain a quality rating of more than 95%.
5. Successfully move 911, Technical and Administrative functions to the new Public
Safety Center
S T A F F I N G
Current Level Year 1 Year 2 Year 3 Year 4 Year 5 23.8-1-0 25.8-1-0 25.8-1-0 25.8-1-0 25.8-1-0 25.8-1-0
*.8 split with Emergency Management
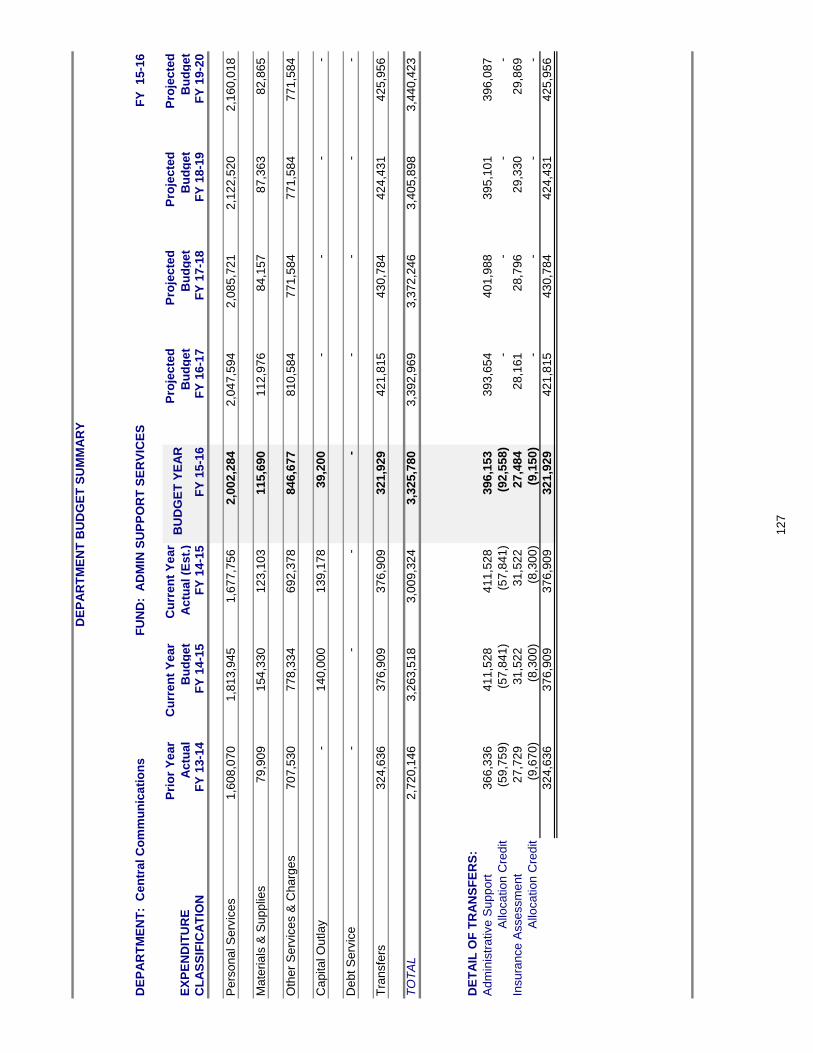
DE
PA
RT
ME
NT
BU
DG
ET
SU
MM
AR
Y
DE
PA
RT
ME
NT
: C
en
tral C
om
mu
nic
ati
on
s F
UN
D:
AD
MIN
SU
PP
OR
T S
ER
VIC
ES
FY
15-1
6
EX
PE
ND
ITU
RE
Pri
or
Year
Actu
al
Cu
rren
t Y
ear
Bu
dg
et
Cu
rren
t Y
ear
Actu
al (E
st.
)B
UD
GE
T Y
EA
RP
roje
cte
d
Bu
dg
et
Pro
jecte
d
Bu
dg
et
Pro
jecte
d
Bu
dg
et
Pro
jecte
d
Bu
dg
et
CL
AS
SIF
ICA
TIO
NF
Y 1
3-1
4F
Y 1
4-1
5F
Y 1
4-1
5F
Y 1
5-1
6F
Y 1
6-1
7F
Y 1
7-1
8F
Y 1
8-1
9F
Y 1
9-2
0
Pers
onal S
erv
ices
1,6
08,0
70
1,8
13,9
45
1,6
77,7
56
2,0
02,2
84
2,0
47,5
94
2,0
85,7
21
2,1
22,5
20
2,1
60,0
18
Mate
rials
& S
upplie
s79,9
09
154,3
30
123,1
03
115,6
90
112,9
76
84,1
57
87,3
63
82,8
65
Oth
er
Serv
ices &
Charg
es
707,5
30
778,3
34
692,3
78
846,6
77
810,5
84
771,5
84
771,5
84
771,5
84
Capital O
utlay
-
140,0
00
139,1
78
39,2
00
-
-
-
-
Debt S
erv
ice
-
-
-
-
-
-
-
-
Tra
nsfe
rs324,6
36
376,9
09
376,9
09
321,9
29
421,8
15
430,7
84
424,4
31
425,9
56
TO
TA
L2,7
20,1
46
3,2
63,5
18
3,0
09,3
24
3,3
25,7
80
3,3
92,9
69
3,3
72,2
46
3,4
05,8
98
3,4
40,4
23
DE
TA
IL O
F T
RA
NS
FE
RS
:
Adm
inis
trative S
upport
366,3
36
411,5
28
411,5
28
396,1
53
393,6
54
401,9
88
395,1
01
396,0
87
Allo
cation C
redit
(59,7
59)
(57,8
41)
(57,8
41)
(92,5
58)
-
-
-
-
Insura
nce A
ssessm
ent
27,7
29
31,5
22
31,5
22
27,4
84
28,1
61
28,7
96
29,3
30
29,8
69
Allo
cation C
redit
(9,6
70)
(8,3
00)
(8,3
00)
(9,1
50)
-
-
-
-
324,6
36
376,9
09
376,9
09
321,9
29
421,8
15
430,7
84
424,4
31
425,9
56
127
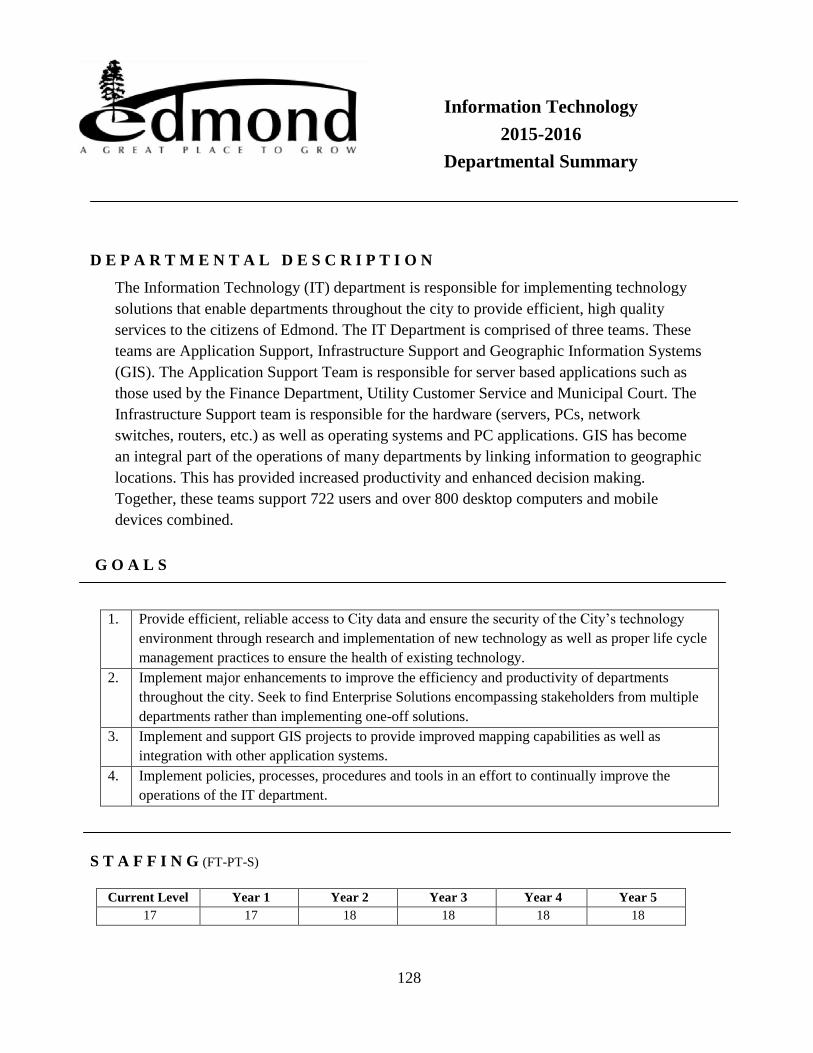
128
Information Technology
2015-2016
Departmental Summary
D E P A R T M E N T A L D E S C R I P T I O N
The Information Technology (IT) department is responsible for implementing technology
solutions that enable departments throughout the city to provide efficient, high quality
services to the citizens of Edmond. The IT Department is comprised of three teams. These
teams are Application Support, Infrastructure Support and Geographic Information Systems
(GIS). The Application Support Team is responsible for server based applications such as
those used by the Finance Department, Utility Customer Service and Municipal Court. The
Infrastructure Support team is responsible for the hardware (servers, PCs, network
switches, routers, etc.) as well as operating systems and PC applications. GIS has become
an integral part of the operations of many departments by linking information to geographic
locations. This has provided increased productivity and enhanced decision making.
Together, these teams support 722 users and over 800 desktop computers and mobile
devices combined.
G O A L S
1. Provide efficient, reliable access to City data and ensure the security of the City’s technology
environment through research and implementation of new technology as well as proper life cycle
management practices to ensure the health of existing technology.
2. Implement major enhancements to improve the efficiency and productivity of departments
throughout the city. Seek to find Enterprise Solutions encompassing stakeholders from multiple
departments rather than implementing one-off solutions.
3. Implement and support GIS projects to provide improved mapping capabilities as well as
integration with other application systems.
4. Implement policies, processes, procedures and tools in an effort to continually improve the
operations of the IT department.
S T A F F I N G (FT-PT-S)
Current Level Year 1 Year 2 Year 3 Year 4 Year 5
17 17 18 18 18 18
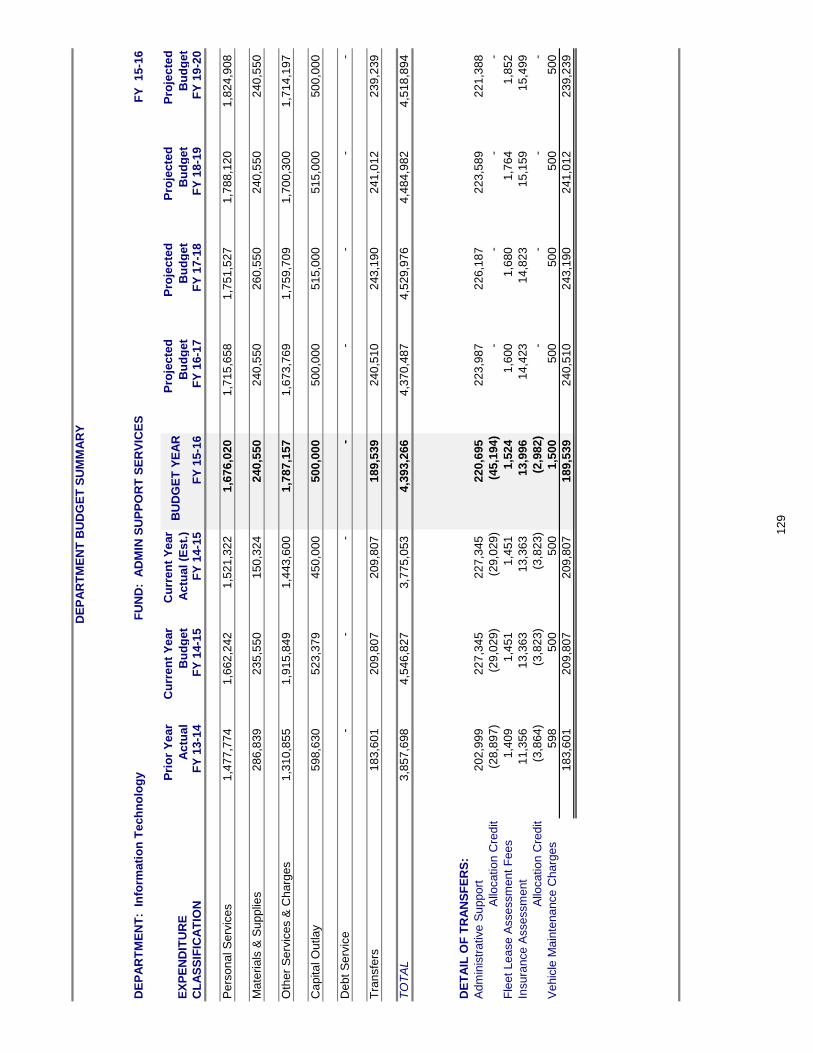
DE
PA
RT
ME
NT
BU
DG
ET
SU
MM
AR
Y
DE
PA
RT
ME
NT
: I
nfo
rma
tio
n T
ech
no
log
y F
UN
D:
AD
MIN
SU
PP
OR
T S
ER
VIC
ES
FY
1
5-1
6
EX
PE
ND
ITU
RE
Pri
or
Ye
ar
Ac
tua
l
Cu
rre
nt
Ye
ar
Bu
dg
et
Cu
rre
nt
Ye
ar
Ac
tua
l (E
st.
)B
UD
GE
T Y
EA
RP
roje
cte
d
Bu
dg
et
Pro
jecte
d
Bu
dg
et
Pro
jecte
d
Bu
dg
et
Pro
jecte
d
Bu
dg
et
CL
AS
SIF
ICA
TIO
NF
Y 1
3-1
4F
Y 1
4-1
5F
Y 1
4-1
5F
Y 1
5-1
6F
Y 1
6-1
7F
Y 1
7-1
8F
Y 1
8-1
9F
Y 1
9-2
0
Pe
rso
na
l S
erv
ices
1,4
77
,774
1
,662
,242
1
,521
,322
1
,676
,020
1
,715
,658
1
,751
,527
1
,788
,120
1
,824
,908
Ma
terials
& S
upp
lies
286
,839
2
35
,550
1
50
,324
2
40
,550
2
40
,550
2
60
,550
2
40
,550
2
40
,550
Oth
er
Se
rvic
es &
Ch
arg
es
1,3
10
,855
1
,915
,849
1
,443
,600
1
,787
,157
1
,673
,769
1
,759
,709
1
,700
,300
1
,714
,197
Ca
pita
l O
utla
y5
98
,630
5
23
,379
4
50
,000
5
00
,000
5
00
,000
5
15
,000
5
15
,000
5
00
,000
De
bt
Se
rvic
e-
-
-
-
-
-
-
-
Tra
nsfe
rs1
83
,601
2
09
,807
2
09
,807
1
89
,539
2
40
,510
2
43
,190
2
41
,012
2
39
,239
TO
TA
L3
,857
,698
4
,546
,827
3
,775
,053
4
,393
,266
4
,370
,487
4
,529
,976
4
,484
,982
4
,518
,894
DE
TA
IL O
F T
RA
NS
FE
RS
:
Ad
min
istr
ative
Su
pp
ort
202
,999
2
27
,345
2
27
,345
2
20
,695
2
23
,987
2
26
,187
2
23
,589
2
21
,388
Allo
catio
n C
redit
(28,8
97
)
(29,0
29
)
(29,0
29
)
(45,1
94
)
-
-
-
-
Fle
et
Lea
se A
sse
ssm
ent
Fee
s1
,409
1
,451
1
,451
1
,524
1
,600
1
,680
1
,764
1
,852
Insura
nce
Asse
ssm
ent
11,3
56
13,3
63
13,3
63
13,9
96
14,4
23
14,8
23
15,1
59
15,4
99
Allo
catio
n C
redit
(3,8
64
)
(3
,823
)
(3
,823
)
(2
,982
)
-
-
-
-
Ve
hic
le M
ain
tena
nce
Ch
arg
es
598
500
500
1,5
00
500
500
500
500
183
,601
2
09
,807
2
09
,807
1
89
,539
2
40
,510
2
43
,190
2
41
,012
2
39
,239
129
130
Financial Services
2015-2016
Departmental Summary
D E P A R T M E N T A L D E S C R I P T I O N
The Mission Statement for the Financial Services Department is:
“To provide quality management of financial information”
The Financial Service Department contains four divisions: Finance, Payroll, Purchasing and
Treasury. The Finance division administers the day-to-day accounting functions, including
the development of the Comprehensive Annual Financial Report (CAFR) and Audit, as well
as the annual 5 Year Budget Plan.
Payroll manages all employee payroll related items, including bi-weekly checks, tracking of
earned vacation and sick leave benefits, and all related federal and state payroll taxes.
Purchasing directs the competitive bid process for various city-wide services and products, as
well as accounts payable.
Treasury manages all banking transactions/accounts, as well as investments.
S T A F F I N G (FT-PT-S)
Current Level Year 1 Year 2 Year 3 Year 4 Year 5 7.7*-0-0 7.7*-.5-0 7.7*-.5-0 7.7*-.5-0 7.7*-.5-0 7.7*-.5-0
* Staffing level includes the Financial Services, Payroll, Treasury, and Purchasing Departments. .3 of the Purchasing Manager is accounted for in the YourGovShop budget and 1 FT & .5 PT is in Treasury.
1. Continue refinement and implementation of IFAS software
2. Strengthen controls and internal policies and procedures
3. Continuous Customer Service Improvement
4. Automate Employee Time and Attendance Capabilities
5. Improve and refine Treasury Management Systems
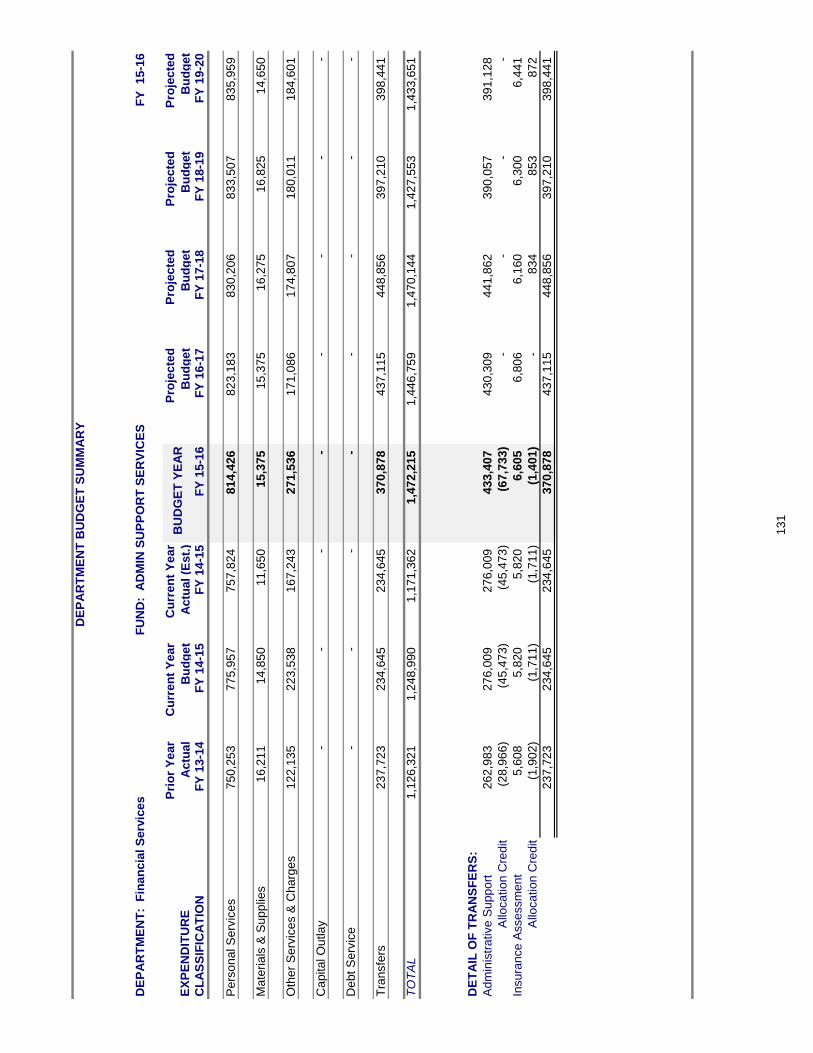
DE
PA
RT
ME
NT
BU
DG
ET
SU
MM
AR
Y
DE
PA
RT
ME
NT
: F
inan
cia
l S
erv
ices
FU
ND
: A
DM
IN S
UP
PO
RT
SE
RV
ICE
SF
Y 15-1
6
EX
PE
ND
ITU
RE
Pri
or
Year
Actu
al
Cu
rren
t Y
ear
Bu
dg
et
Cu
rren
t Y
ear
Actu
al (E
st.
)B
UD
GE
T Y
EA
RP
roje
cte
d
Bu
dg
et
Pro
jecte
d
Bu
dg
et
Pro
jecte
d
Bu
dg
et
Pro
jecte
d
Bu
dg
et
CL
AS
SIF
ICA
TIO
NF
Y 1
3-1
4F
Y 1
4-1
5F
Y 1
4-1
5F
Y 1
5-1
6F
Y 1
6-1
7F
Y 1
7-1
8F
Y 1
8-1
9F
Y 1
9-2
0
Pers
onal S
erv
ices
750,2
53
775,9
57
757,8
24
814,4
26
823,1
83
830,2
06
833,5
07
835,9
59
Mate
rials
& S
upplie
s16,2
11
14,8
50
11,6
50
15,3
75
15,3
75
16,2
75
16,8
25
14,6
50
Oth
er
Serv
ices &
Charg
es
122,1
35
223,5
38
167,2
43
271,5
36
171,0
86
174,8
07
180,0
11
184,6
01
Capital O
utlay
-
-
-
-
-
-
-
-
Debt S
erv
ice
-
-
-
-
-
-
-
-
Tra
nsfe
rs237,7
23
234,6
45
234,6
45
370,8
78
437,1
15
448,8
56
397,2
10
398,4
41
TO
TA
L1,1
26,3
21
1,2
48,9
90
1,1
71,3
62
1,4
72,2
15
1,4
46,7
59
1,4
70,1
44
1,4
27,5
53
1,4
33,6
51
DE
TA
IL O
F T
RA
NS
FE
RS
:
Adm
inis
trative S
upport
262,9
83
276,0
09
276,0
09
433,4
07
430,3
09
441,8
62
390,0
57
391,1
28
Allo
cation C
redit
(28,9
66)
(45,4
73)
(45,4
73)
(67,7
33)
-
-
-
-
Insura
nce A
ssessm
ent
5,6
08
5,8
20
5,8
20
6,6
05
6,8
06
6,1
60
6,3
00
6,4
41
Allo
cation C
redit
(1,9
02)
(1,7
11)
(1,7
11)
(1,4
01)
-
834
853
872
237,7
23
234,6
45
234,6
45
370,8
78
437,1
15
448,8
56
397,2
10
398,4
41
131
132
Human Resources
2015-2016
Departmental Summary
D E P A R T M E N T A L D E S C R I P T I O N
The Human Resources Department is comprised of three divisions: Human Resources
Administration, Training, and Benefits. We are dedicated to providing quality HR services to
attract, develop, motivate and retain a productive and diverse workforce within a supportive work environment by:
• Providing friendly trustworthy service to all internal and external customers;
• Attracting and hiring through comprehensive Human Resources selection and planning;
• Retaining qualified employees through training and recognition programs;
• Providing sustainable benefit products and services responsive to and valued by employees.
G O A L S
1. Promote a high quality workforce and collaborative relationships between management and
employees.
2. Develop and provide citywide training and recognition programs to enhance personal and
professional growth.
3. Provide a competitive benefits package that enhances recruitment and retention through prudent
management of resources.
4. Provide a comprehensive wellness program to assist and promote employee well being.
5. Review processes, making changes as needed, to improve efficiency and/or greater customer
service.
S T A F F I N G (FT-PT-S)
Current Level Year 1 Year 2 Year 3 Year 4 Year 5
5-0-0 5-0-0 5-0-0 5-0-0 5-0-0 5-0-0
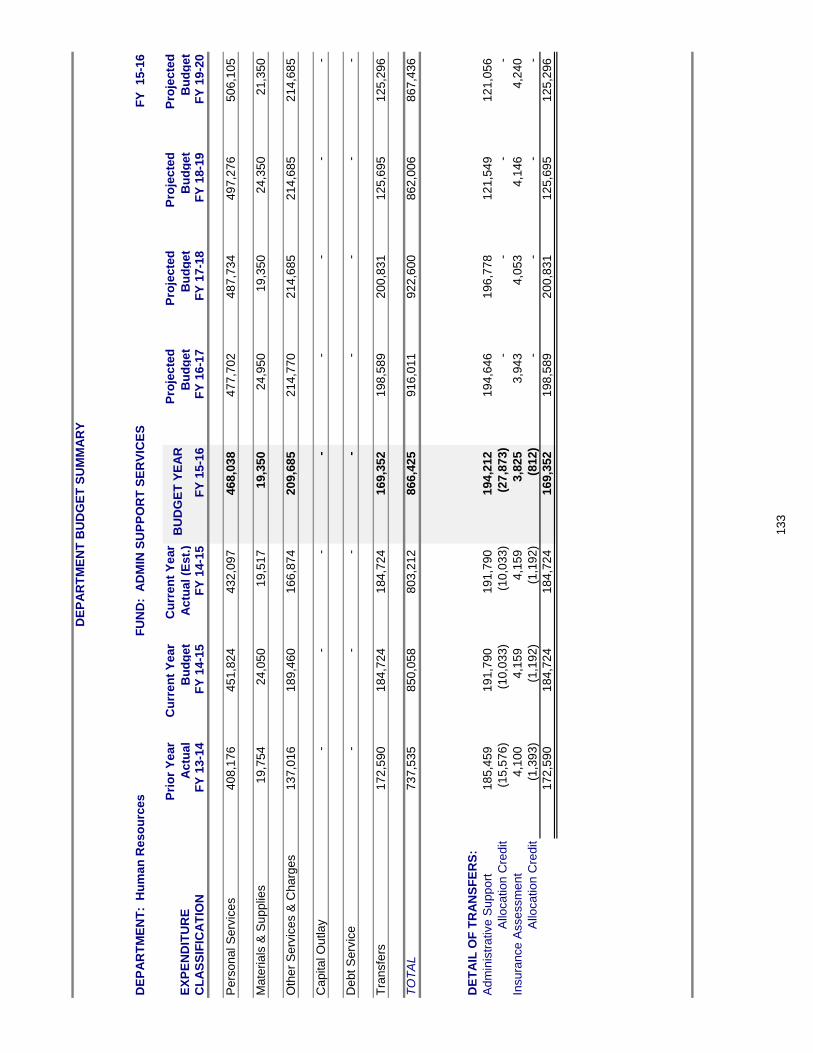
DE
PA
RT
ME
NT
BU
DG
ET
SU
MM
AR
Y
DE
PA
RT
ME
NT
: H
um
an
Reso
urc
es
FU
ND
: A
DM
IN S
UP
PO
RT
SE
RV
ICE
SF
Y 15-1
6
EX
PE
ND
ITU
RE
Pri
or
Year
Actu
al
Cu
rren
t Y
ear
Bu
dg
et
Cu
rren
t Y
ear
Actu
al (E
st.
)B
UD
GE
T Y
EA
RP
roje
cte
d
Bu
dg
et
Pro
jecte
d
Bu
dg
et
Pro
jecte
d
Bu
dg
et
Pro
jecte
d
Bu
dg
et
CL
AS
SIF
ICA
TIO
NF
Y 1
3-1
4F
Y 1
4-1
5F
Y 1
4-1
5F
Y 1
5-1
6F
Y 1
6-1
7F
Y 1
7-1
8F
Y 1
8-1
9F
Y 1
9-2
0
Pers
onal S
erv
ices
408,1
76
451,8
24
432,0
97
468,0
38
477,7
02
487,7
34
497,2
76
506,1
05
Mate
rials
& S
upplie
s19,7
54
24,0
50
19,5
17
19,3
50
24,9
50
19,3
50
24,3
50
21,3
50
Oth
er
Serv
ices &
Charg
es
137,0
16
189,4
60
166,8
74
209,6
85
214,7
70
214,6
85
214,6
85
214,6
85
Capital O
utlay
-
-
-
-
-
-
-
-
Debt S
erv
ice
-
-
-
-
-
-
-
-
Tra
nsfe
rs172,5
90
184,7
24
184,7
24
169,3
52
198,5
89
200,8
31
125,6
95
125,2
96
TO
TA
L737,5
35
850,0
58
803,2
12
866,4
25
916,0
11
922,6
00
862,0
06
867,4
36
DE
TA
IL O
F T
RA
NS
FE
RS
:
Adm
inis
trative S
upport
185,4
59
191,7
90
191,7
90
194,2
12
194,6
46
196,7
78
121,5
49
121,0
56
Allo
cation C
redit
(15,5
76)
(10,0
33)
(10,0
33)
(27,8
73)
-
-
-
-
Insura
nce A
ssessm
ent
4,1
00
4,1
59
4,1
59
3,8
25
3,9
43
4,0
53
4,1
46
4,2
40
Allo
cation C
redit
(1,3
93)
(1,1
92)
(1,1
92)
(812)
-
-
-
-
172,5
90
184,7
24
184,7
24
169,3
52
198,5
89
200,8
31
125,6
95
125,2
96
133
134
City Clerk
2015-2016
Departmental Summary
D E P A R T M E N T A L D E S C R I P T I O N
The City Clerk’s office will continue to provide diverse administrative services to support city departments. Internal services include city clerk responsibilities, records administration and management, and Gracelawn Cemetery lot sales, working with local Funeral Homes and families to arrange funerals and all other record management associated with operations of the Cemetery.
1. Continue working with local Funeral Homes and families to arrange burials in
Gracelawn Cemetery plus accurate records management of cemetery records. Also
issue invoices for monument setting services and collection of all fees associated
with these services.
2. Accurately issue, document, maintain and organize official city records.
3. Timely issuance of occupational licenses, permits, collection of miscellaneous
charges and fees, abatement and certification of nuisances, processing requests for
information, coordination of legal publications and codification of ordinances
S T A F F I N G L E V E L S
Current Level Year 1 Year 2 Year 3 Year 4 Year 5 2-0-0 2-0-0 2-0-0 2-0-0 2-0-0 2-0-0

DE
PA
RT
ME
NT
BU
DG
ET
SU
MM
AR
Y
DE
PA
RT
ME
NT
: C
ity C
lerk
/Go
ve
rnm
en
t R
ela
tio
ns
FU
ND
: A
DM
IN S
UP
PO
RT
SE
RV
ICE
SF
Y 1
5-1
6
EX
PE
ND
ITU
RE
Pri
or
Ye
ar
Ac
tua
l
Cu
rre
nt
Ye
ar
Bu
dg
et
Cu
rre
nt
Ye
ar
Ac
tua
l (E
st.
)B
UD
GE
T Y
EA
RP
roje
cte
d
Bu
dg
et
Pro
jec
ted
Bu
dg
et
Pro
jec
ted
Bu
dg
et
Pro
jec
ted
Bu
dg
et
CL
AS
SIF
ICA
TIO
NF
Y 1
3-1
4F
Y 1
4-1
5F
Y 1
4-1
5F
Y 1
5-1
6F
Y 1
6-1
7F
Y 1
7-1
8F
Y 1
8-1
9F
Y 1
9-2
0
Pe
rso
na
l S
erv
ice
s1
30
,14
5
14
1,8
19
13
4,8
19
14
5,9
61
14
8,0
25
14
9,3
14
14
9,9
38
15
0,5
75
Ma
terials
& S
up
plie
s5
,35
5
4,2
00
3,4
31
3,2
00
3,2
00
3,2
00
3,2
00
3,2
00
Oth
er
Se
rvic
es &
Ch
arg
es
34
,50
0
83
,90
0
46
,59
0
49
,20
0
49
,20
0
49
,20
0
49
,20
0
49
,20
0
Ca
pita
l O
utlay
-
-
-
-
-
-
-
-
De
bt S
erv
ice
-
-
-
-
-
-
-
-
Tra
nsfe
rs8
5,2
22
79
,09
1
79
,09
1
64
,83
5
84
,08
1
88
,18
8
86
,43
7
86
,62
0
TO
TA
L2
55
,22
3
30
9,0
10
26
3,9
31
26
3,1
96
28
4,5
06
28
9,9
02
28
8,7
75
28
9,5
95
DE
TA
IL O
F T
RA
NS
FE
RS
:
Ad
min
istr
ative
Su
pp
ort
10
0,4
18
91
,48
0
91
,48
0
83
,20
8
81
,40
8
85
,44
2
83
,62
9
83
,74
9
Allo
ca
tion
Cre
dit
(17
,06
3)
(13
,96
2)
(13
,96
2)
(20
,32
8)
-
-
-
-
Fle
et L
ea
se
Asse
ssm
en
t F
ee
s-
-
-
-
-
-
-
-
Insu
ran
ce
Asse
ssm
en
t2
,81
4
2,2
39
2,2
39
2,5
94
2,6
73
2,7
46
2,8
08
2,8
71
Allo
ca
tion
Cre
dit
(94
7)
(66
6)
(66
6)
(63
9)
-
-
-
-
Ve
hic
le M
ain
ten
an
ce
Ch
arg
es
-
-
-
-
-
-
-
-
85
,22
2
79
,09
1
79
,09
1
64
,83
5
84
,08
1
88
,18
8
86
,43
7
86
,62
0
13
5

136
Facility Maintenance
2015-2016
Departmental Summary
D E P A R T M E N T A L D E S C R I P T I O N
Facility Maintenance delivers high quality, cost effective best in class trustworthy service to our customers. The department provides a clean, safe, quality working environment for City of Edmond employees and the public by maintaining, repairing, cleaning and improving City facilities. The department tracks processes and procedures through use of City works for asset management and timely response to the needs of internal and external customers. This encompasses 60 different C.O.E. divisions and over 600,000 square feet of occupied working space. The Facility Maintenance Department’s service is to ensure a safe and comfortable working environment for our customers.
Objectives: The Facility Maintenance Department’s objective and vision is to continuously improve facility maintenance services for the benefit of delivering “Trustworthy Service” to internal and external customers.
S T A F F I N G (FT-PT-S)
Current Level Year 1 Year 2 Year 3 Year 4 Year 5
11-0-0 11-0-0 12-1-0 13-1-0 13-1-0 14-1-0
1. Provide unparalleled customer service – meet with Department Heads
2. Improve the performance of the technical staff with at least one job related training course per
year, if possible, bring to our campus for a group type training
3. Diagnose, analyze, and repair buildings and associated equipment and /or outsource for repairs
not provided in house.
4. Reduce COE energy costs by implementing Led lighting
5. Reduce departmental operations & maintenance costs.
6. Promote continuous improvement within the department.
7.
Reduce COE energy costs by implementing predictive maintenance- changing out older HVAC
units with newer, efficient equipment.
8. When possible on roof replacements, use a white color to help in reflection of heat during the
summer months reducing COE energy costs.
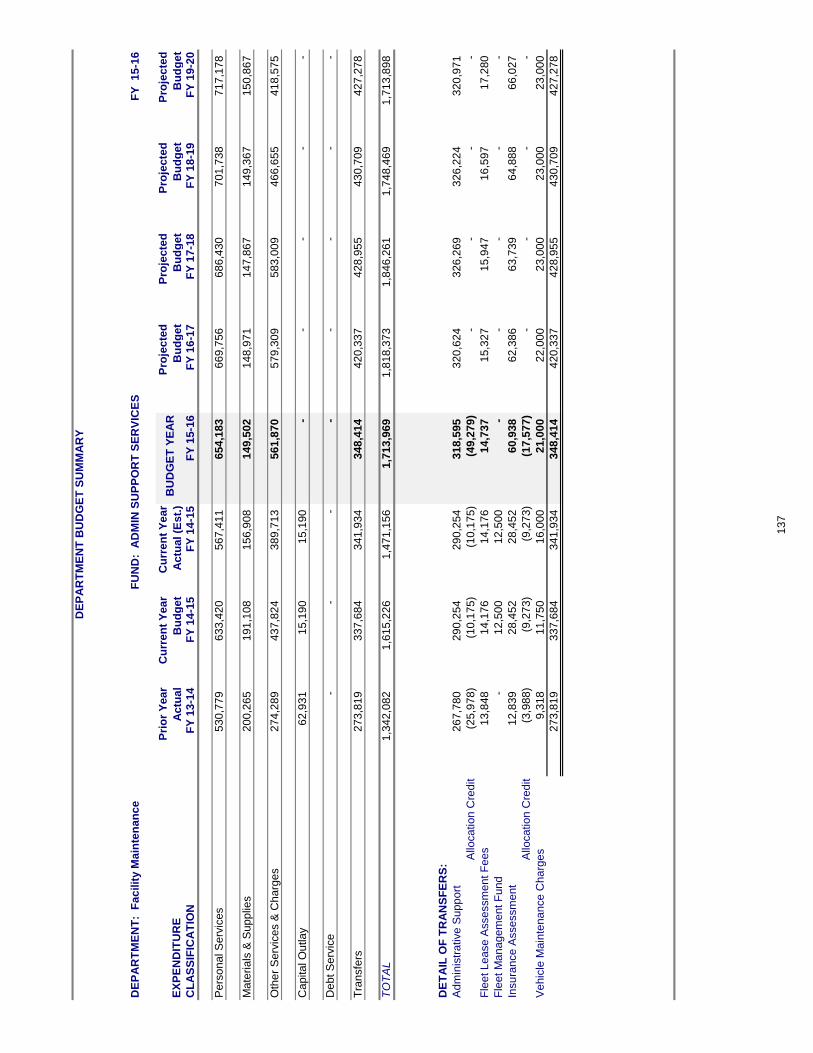
DE
PA
RT
ME
NT
BU
DG
ET
SU
MM
AR
Y
DE
PA
RT
ME
NT
: F
ac
ilit
y M
ain
ten
an
ce
FU
ND
: A
DM
IN S
UP
PO
RT
SE
RV
ICE
SF
Y 1
5-1
6
EX
PE
ND
ITU
RE
Pri
or
Ye
ar
Ac
tua
l
Cu
rre
nt
Ye
ar
Bu
dg
et
Cu
rre
nt
Ye
ar
Ac
tua
l (E
st.
)B
UD
GE
T Y
EA
RP
roje
cte
d
Bu
dg
et
Pro
jec
ted
Bu
dg
et
Pro
jec
ted
Bu
dg
et
Pro
jec
ted
Bu
dg
et
CL
AS
SIF
ICA
TIO
NF
Y 1
3-1
4F
Y 1
4-1
5F
Y 1
4-1
5F
Y 1
5-1
6F
Y 1
6-1
7F
Y 1
7-1
8F
Y 1
8-1
9F
Y 1
9-2
0
Pe
rso
na
l S
erv
ice
s5
30
,77
9
63
3,4
20
56
7,4
11
65
4,1
83
66
9,7
56
68
6,4
30
70
1,7
38
71
7,1
78
Ma
teri
als
& S
up
plie
s2
00
,26
5
19
1,1
08
15
6,9
08
14
9,5
02
14
8,9
71
14
7,8
67
14
9,3
67
15
0,8
67
Oth
er
Se
rvic
es &
Ch
arg
es
27
4,2
89
43
7,8
24
38
9,7
13
56
1,8
70
57
9,3
09
58
3,0
09
46
6,6
55
41
8,5
75
Ca
pita
l O
utla
y6
2,9
31
15
,19
0
15
,19
0
-
-
-
-
-
De
bt S
erv
ice
-
-
-
-
-
-
-
-
Tra
nsfe
rs2
73
,81
9
33
7,6
84
34
1,9
34
34
8,4
14
42
0,3
37
42
8,9
55
43
0,7
09
42
7,2
78
TO
TA
L1
,34
2,0
82
1,6
15
,22
6
1,4
71
,15
6
1,7
13
,96
9
1,8
18
,37
3
1,8
46
,26
1
1,7
48
,46
9
1,7
13
,89
8
DE
TA
IL O
F T
RA
NS
FE
RS
:
Ad
min
istr
ative
Su
pp
ort
26
7,7
80
29
0,2
54
29
0,2
54
31
8,5
95
32
0,6
24
32
6,2
69
32
6,2
24
32
0,9
71
Allo
ca
tio
n C
red
it(2
5,9
78
)
(10
,17
5)
(10
,17
5)
(49
,27
9)
-
-
-
-
Fle
et L
ea
se
Asse
ssm
en
t F
ee
s1
3,8
48
14
,17
6
14
,17
6
14
,73
7
15
,32
7
15
,94
7
16
,59
7
17
,28
0
Fle
et M
an
ag
em
en
t F
un
d-
12
,50
0
12
,50
0
-
-
-
-
-
Insu
ran
ce
Asse
ssm
en
t1
2,8
39
28
,45
2
28
,45
2
60
,93
8
62
,38
6
63
,73
9
64
,88
8
66
,02
7
Allo
ca
tio
n C
red
it(3
,98
8)
(9,2
73
)
(9,2
73
)
(17
,57
7)
-
-
-
-
Ve
hic
le M
ain
ten
an
ce
Ch
arg
es
9,3
18
11
,75
0
16
,00
0
21
,00
0
22
,00
0
23
,00
0
23
,00
0
23
,00
0
27
3,8
19
33
7,6
84
34
1,9
34
34
8,4
14
42
0,3
37
42
8,9
55
43
0,7
09
42
7,2
78
13
7
138
Legal Services
2015-2016
Departmental Summary
D E P A R T M E N T A L D E S C R I P T I O N
The Edmond City Attorney is appointed by the Mayor and City Council to direct the
management of all legal matters for the City. The Legal Services office provides legal
assistance to the Mayor and Council, the Edmond Public Works Authority and other City
departments. The office also provides assistance to various committees, boards and city
agencies.
The City Attorney or the Assistant City Attorney represents the City in all litigation in
Edmond Municipal Court, Oklahoma County District Court, Oklahoma State Court and the
Federal Court System.
Risk Management, a division of the City Attorney’s office, handles subrogation recovery,
liability, property insurance as well as other multiple lines of insurance for the City.
G O A L S
1. Provide advice and legal services for the Mayor and City Council
2. Provide quality legal services for the City of Edmond
3. Provide advice and training for City departments as needed
4. Defend City of Edmond in lawsuits, and traffic and juvenile court
S T A F F I N G (FT-PT-S)
Current Level Year 1 Year 2 Year 3 Year 4 Year 5
4-0-0 4-0-0 4-0-0 4-0-0 4-0-0 4-0-0
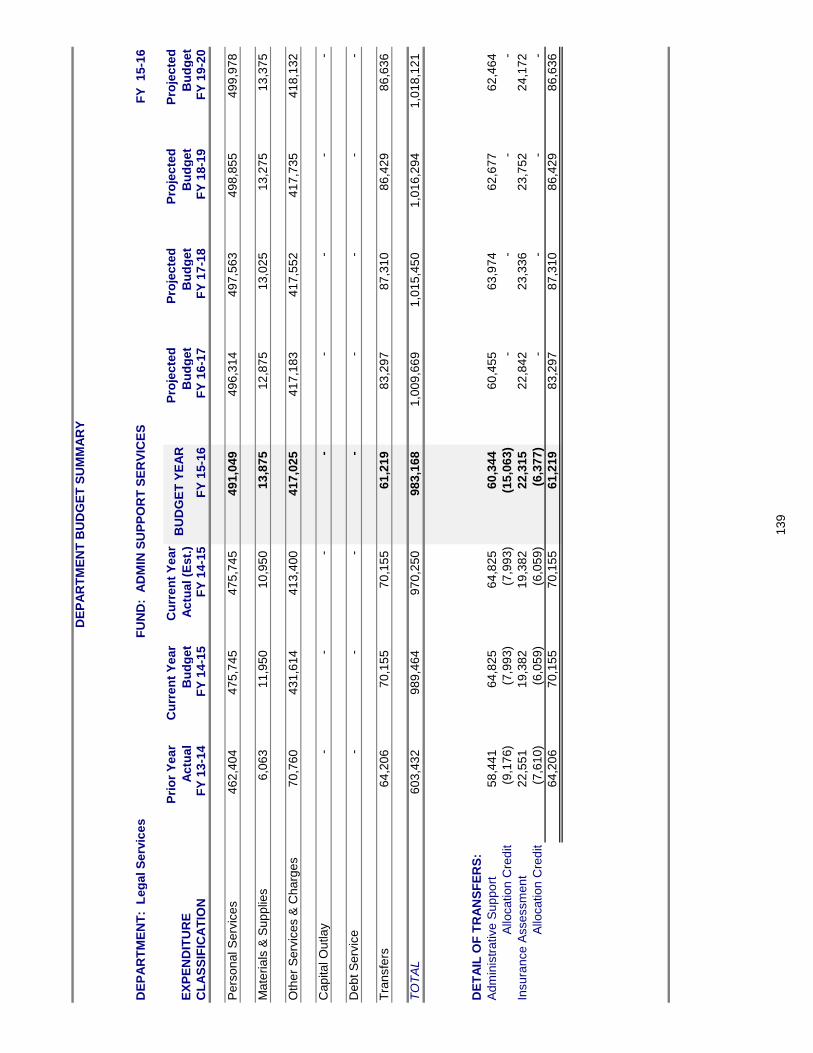
DE
PA
RT
ME
NT
BU
DG
ET
SU
MM
AR
Y
DE
PA
RT
ME
NT
: L
eg
al S
erv
ice
s F
UN
D:
AD
MIN
SU
PP
OR
T S
ER
VIC
ES
FY
1
5-1
6
EX
PE
ND
ITU
RE
Pri
or
Ye
ar
Ac
tua
l
Cu
rre
nt
Ye
ar
Bu
dg
et
Cu
rre
nt
Ye
ar
Ac
tua
l (E
st.
)B
UD
GE
T Y
EA
RP
roje
cte
d
Bu
dg
et
Pro
jec
ted
Bu
dg
et
Pro
jec
ted
Bu
dg
et
Pro
jec
ted
Bu
dg
et
CL
AS
SIF
ICA
TIO
NF
Y 1
3-1
4F
Y 1
4-1
5F
Y 1
4-1
5F
Y 1
5-1
6F
Y 1
6-1
7F
Y 1
7-1
8F
Y 1
8-1
9F
Y 1
9-2
0
Pe
rso
na
l S
erv
ice
s4
62
,40
4
47
5,7
45
47
5,7
45
49
1,0
49
49
6,3
14
49
7,5
63
49
8,8
55
49
9,9
78
Ma
teri
als
& S
up
plie
s6
,06
3
11
,95
0
10
,95
0
13
,87
5
12
,87
5
13
,02
5
13
,27
5
13
,37
5
Oth
er
Se
rvic
es &
Ch
arg
es
70
,76
0
43
1,6
14
41
3,4
00
41
7,0
25
41
7,1
83
41
7,5
52
41
7,7
35
41
8,1
32
Ca
pita
l O
utla
y-
-
-
-
-
-
-
-
De
bt S
erv
ice
-
-
-
-
-
-
-
-
Tra
nsfe
rs6
4,2
06
70
,15
5
70
,15
5
61
,21
9
83
,29
7
87
,31
0
86
,42
9
86
,63
6
TO
TA
L6
03
,43
2
98
9,4
64
97
0,2
50
98
3,1
68
1,0
09
,66
9
1,0
15
,45
0
1,0
16
,29
4
1,0
18
,12
1
DE
TA
IL O
F T
RA
NS
FE
RS
:
Ad
min
istr
ative
Su
pp
ort
58
,44
1
64
,82
5
64
,82
5
60
,34
4
60
,45
5
63
,97
4
62
,67
7
62
,46
4
Allo
ca
tio
n C
red
it(9
,17
6)
(7,9
93
)
(7,9
93
)
(15
,06
3)
-
-
-
-
Insu
ran
ce
Asse
ssm
en
t2
2,5
51
19
,38
2
19
,38
2
22
,31
5
22
,84
2
23
,33
6
23
,75
2
24
,17
2
Allo
ca
tio
n C
red
it(7
,61
0)
(6,0
59
)
(6,0
59
)
(6,3
77
)
-
-
-
-
64
,20
6
70
,15
5
70
,15
5
61
,21
9
83
,29
7
87
,31
0
86
,42
9
86
,63
6
13
9
140
Engineering Department
2015-2016
Departmental Summary
D E P A R T M E N T A L D E S C R I P T I O N
The Engineering Department is dedicated to effective, timely, and reliable technical service
and expertise to Council, developers, contractors, City departments, staff, and citizens, as it
relates to the expansion of the City’s infrastructure and the capital improvements.
1. Conduct traffic studies on Major Transportation Corridors.
2. Improve services provided to other City departments and improve quality and
efficiency of service to both internal and external customers.
3. Continued implementation of TRAKiT Software as it relates to Engineering
projects.
S T A F F I N G (FT-PT-S)
Current Level Year 1 Year 2 Year 3 Year 4 Year 5 16-0-0 17-0-0 17-0-0 17-0-0 17-0-0 17-0-0
*Includes Engineering Administration and Inspections
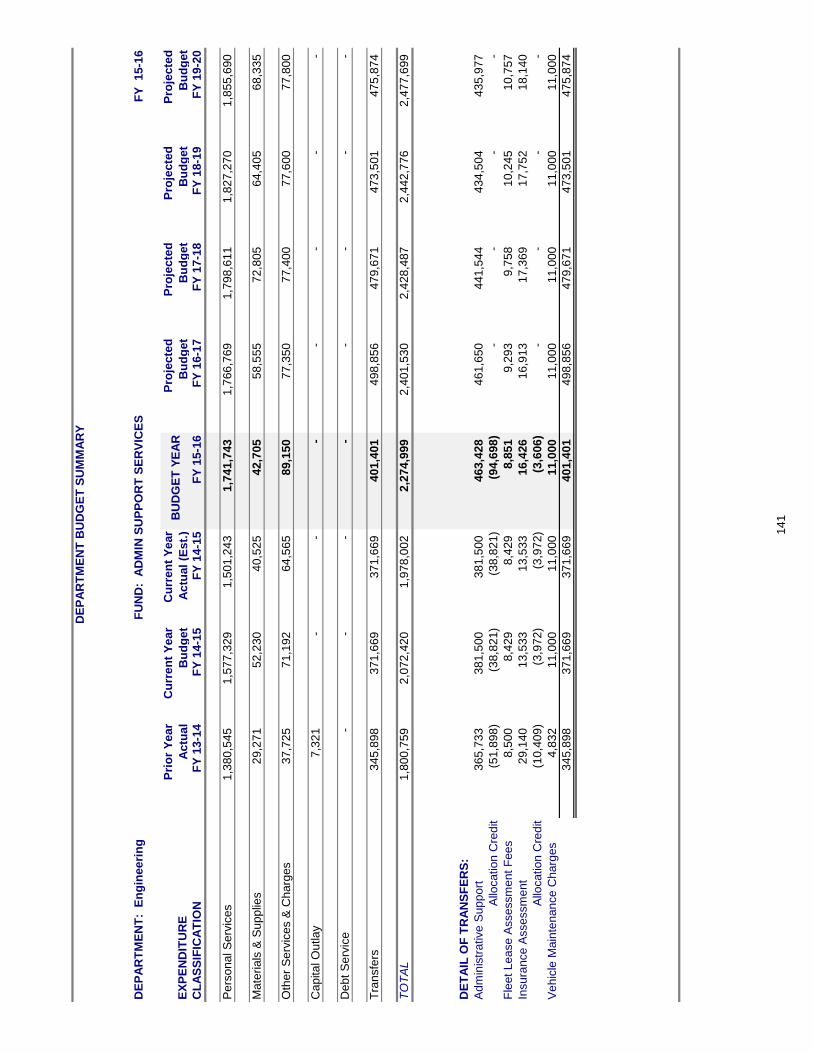
DE
PA
RT
ME
NT
BU
DG
ET
SU
MM
AR
Y
DE
PA
RT
ME
NT
: E
ng
inee
rin
g F
UN
D:
AD
MIN
SU
PP
OR
T S
ER
VIC
ES
FY
1
5-1
6
EX
PE
ND
ITU
RE
Pri
or
Ye
ar
Ac
tua
l
Cu
rre
nt
Ye
ar
Bu
dg
et
Cu
rre
nt
Ye
ar
Ac
tua
l (E
st.
)B
UD
GE
T Y
EA
RP
roje
cte
d
Bu
dg
et
Pro
jecte
d
Bu
dg
et
Pro
jecte
d
Bu
dg
et
Pro
jecte
d
Bu
dg
et
CL
AS
SIF
ICA
TIO
NF
Y 1
3-1
4F
Y 1
4-1
5F
Y 1
4-1
5F
Y 1
5-1
6F
Y 1
6-1
7F
Y 1
7-1
8F
Y 1
8-1
9F
Y 1
9-2
0
Pe
rso
na
l S
erv
ices
1,3
80
,545
1
,577
,329
1
,501
,243
1
,741
,743
1
,766
,769
1
,798
,611
1
,827
,270
1
,855
,690
Ma
terials
& S
upp
lies
29,2
71
52,2
30
40,5
25
42,7
05
58,5
55
72,8
05
64,4
05
68,3
35
Oth
er
Se
rvic
es &
Ch
arg
es
37,7
25
71,1
92
64,5
65
89,1
50
77,3
50
77,4
00
77,6
00
77,8
00
Ca
pita
l O
utla
y7
,321
-
-
-
-
-
-
-
De
bt
Se
rvic
e-
-
-
-
-
-
-
-
Tra
nsfe
rs3
45
,898
3
71
,669
3
71
,669
4
01
,401
4
98
,856
4
79
,671
4
73
,501
4
75
,874
TO
TA
L1
,800
,759
2
,072
,420
1
,978
,002
2
,274
,999
2
,401
,530
2
,428
,487
2
,442
,776
2
,477
,699
DE
TA
IL O
F T
RA
NS
FE
RS
:
Ad
min
istr
ative
Su
pp
ort
365
,733
3
81
,500
3
81
,500
4
63
,428
4
61
,650
4
41
,544
4
34
,504
4
35
,977
Allo
catio
n C
redit
(51,8
98
)
(38,8
21
)
(38,8
21
)
(94,6
98
)
-
-
-
-
Fle
et
Lea
se A
sse
ssm
ent
Fee
s8
,500
8
,429
8
,429
8
,851
9
,293
9
,758
1
0,2
45
10,7
57
Insura
nce
Asse
ssm
ent
29,1
40
13,5
33
13,5
33
16,4
26
16,9
13
17,3
69
17,7
52
18,1
40
Allo
catio
n C
redit
(10,4
09
)
(3,9
72
)
(3
,972
)
(3
,606
)
-
-
-
-
Ve
hic
le M
ain
tena
nce
Ch
arg
es
4,8
32
1
1,0
00
11,0
00
11,0
00
11,0
00
11,0
00
11,0
00
11,0
00
345
,898
3
71
,669
3
71
,669
4
01
,401
4
98
,856
4
79
,671
4
73
,501
4
75
,874
141
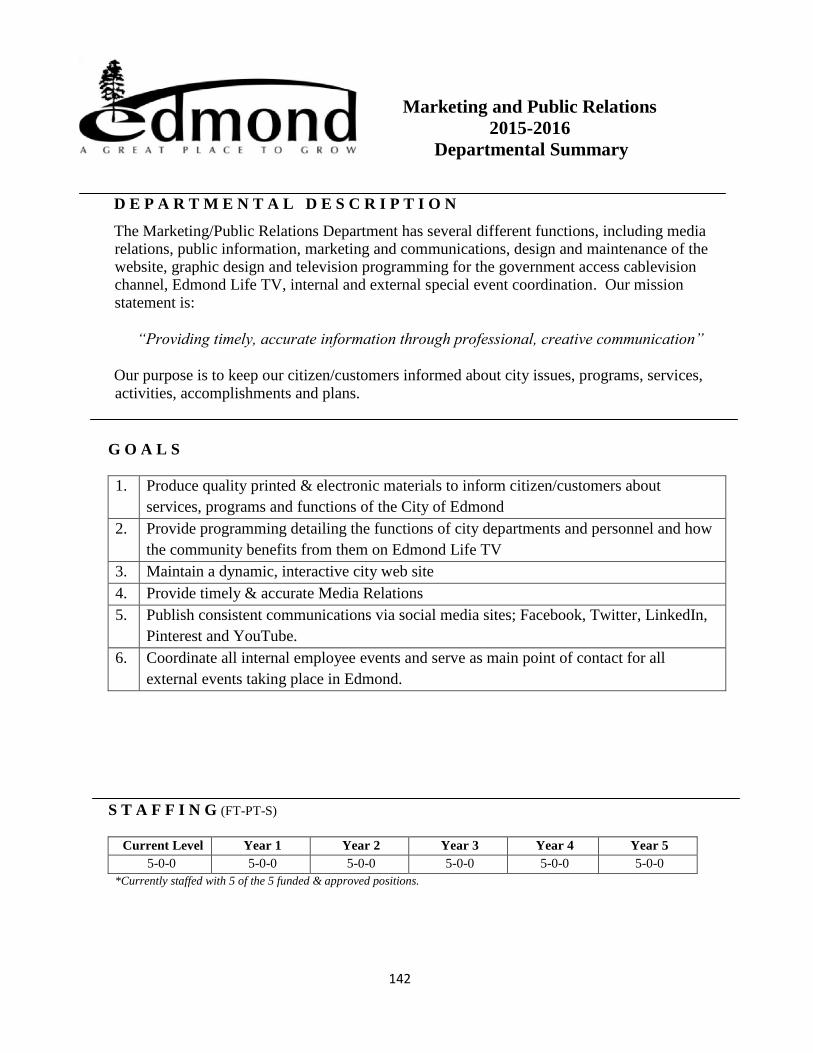
142
Marketing and Public Relations
2015-2016
Departmental Summary
D E P A R T M E N T A L D E S C R I P T I O N
The Marketing/Public Relations Department has several different functions, including media relations, public information, marketing and communications, design and maintenance of the website, graphic design and television programming for the government access cablevision channel, Edmond Life TV, internal and external special event coordination. Our mission statement is:
“Providing timely, accurate information through professional, creative communication”
Our purpose is to keep our citizen/customers informed about city issues, programs, services, activities, accomplishments and plans.
G O A L S
1. Produce quality printed & electronic materials to inform citizen/customers about
services, programs and functions of the City of Edmond
2. Provide programming detailing the functions of city departments and personnel and how
the community benefits from them on Edmond Life TV
3. Maintain a dynamic, interactive city web site
4. Provide timely & accurate Media Relations
5. Publish consistent communications via social media sites; Facebook, Twitter, LinkedIn,
Pinterest and YouTube.
6. Coordinate all internal employee events and serve as main point of contact for all
external events taking place in Edmond.
S T A F F I N G (FT-PT-S) Current Level Year 1 Year 2 Year 3 Year 4 Year 5
5-0-0 5-0-0 5-0-0 5-0-0 5-0-0 5-0-0 *Currently staffed with 5 of the 5 funded & approved positions.
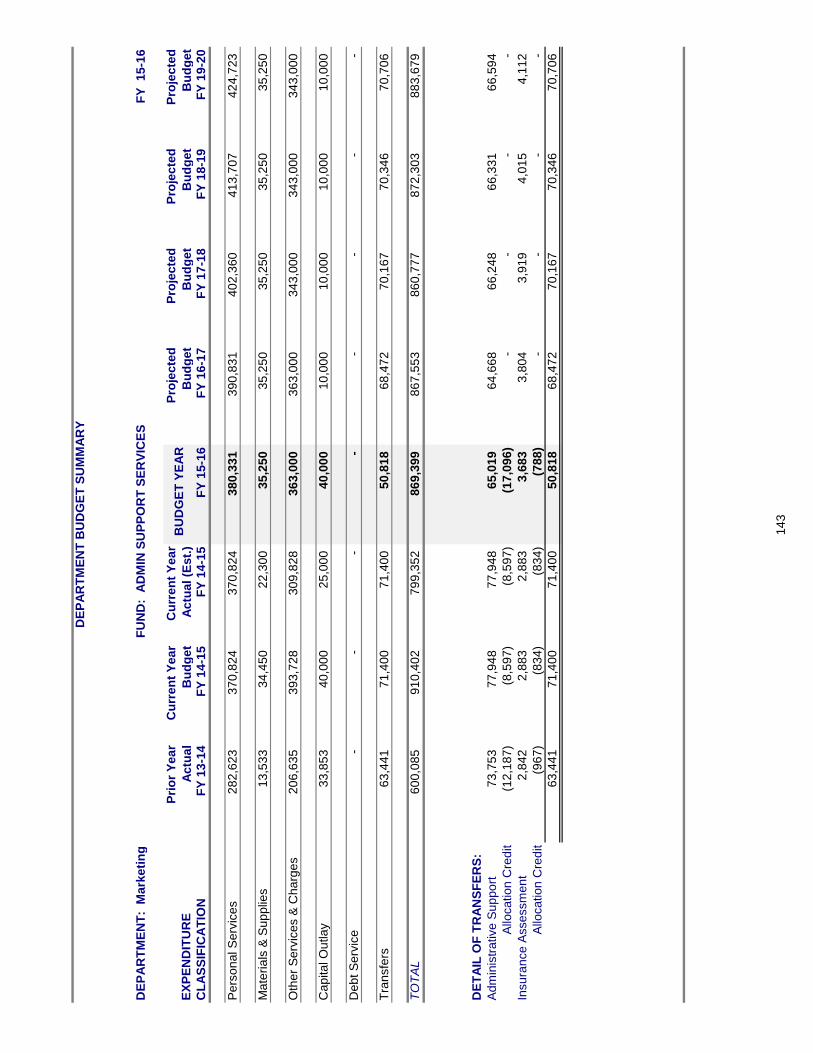
DE
PA
RT
ME
NT
BU
DG
ET
SU
MM
AR
Y
DE
PA
RT
ME
NT
: M
ark
eti
ng
FU
ND
: A
DM
IN S
UP
PO
RT
SE
RV
ICE
SF
Y 1
5-1
6
EX
PE
ND
ITU
RE
Pri
or
Ye
ar
Ac
tua
l
Cu
rre
nt
Ye
ar
Bu
dg
et
Cu
rre
nt
Ye
ar
Ac
tua
l (E
st.
)B
UD
GE
T Y
EA
RP
roje
cte
d
Bu
dg
et
Pro
jec
ted
Bu
dg
et
Pro
jec
ted
Bu
dg
et
Pro
jec
ted
Bu
dg
et
CL
AS
SIF
ICA
TIO
NF
Y 1
3-1
4F
Y 1
4-1
5F
Y 1
4-1
5F
Y 1
5-1
6F
Y 1
6-1
7F
Y 1
7-1
8F
Y 1
8-1
9F
Y 1
9-2
0
Pe
rso
na
l S
erv
ice
s2
82
,62
3
37
0,8
24
37
0,8
24
38
0,3
31
39
0,8
31
40
2,3
60
41
3,7
07
42
4,7
23
Ma
teri
als
& S
up
plie
s1
3,5
33
34
,45
0
22
,30
0
35
,25
0
35
,25
0
35
,25
0
35
,25
0
35
,25
0
Oth
er
Se
rvic
es &
Ch
arg
es
20
6,6
35
39
3,7
28
30
9,8
28
36
3,0
00
36
3,0
00
34
3,0
00
34
3,0
00
34
3,0
00
Ca
pita
l O
utla
y3
3,8
53
40
,00
0
25
,00
0
40
,00
0
10
,00
0
10
,00
0
10
,00
0
10
,00
0
De
bt S
erv
ice
-
-
-
-
-
-
-
-
Tra
nsfe
rs6
3,4
41
71
,40
0
71
,40
0
50
,81
8
68
,47
2
70
,16
7
70
,34
6
70
,70
6
TO
TA
L6
00
,08
5
91
0,4
02
79
9,3
52
86
9,3
99
86
7,5
53
86
0,7
77
87
2,3
03
88
3,6
79
DE
TA
IL O
F T
RA
NS
FE
RS
:
Ad
min
istr
ative
Su
pp
ort
73
,75
3
77
,94
8
77
,94
8
65
,01
9
64
,66
8
66
,24
8
66
,33
1
66
,59
4
Allo
ca
tio
n C
red
it(1
2,1
87
)
(8,5
97
)
(8,5
97
)
(17
,09
6)
-
-
-
-
Insu
ran
ce
Asse
ssm
en
t2
,84
2
2,8
83
2,8
83
3,6
83
3,8
04
3,9
19
4,0
15
4,1
12
Allo
ca
tio
n C
red
it(9
67
)
(83
4)
(83
4)
(78
8)
-
-
-
-
63
,44
1
71
,40
0
71
,40
0
50
,81
8
68
,47
2
70
,16
7
70
,34
6
70
,70
6
14
3
144
Public Works Administration
2015-2016
Departmental Summary
D E P A R T M E N T A L D E S C R I P T I O N
Public Works Administration provides a call center for Public Works, handles the recording
of field work and asset history, payroll, budget management, and accounts payable for Field
Services, Solid Waste and Facility Maintenance, analyzes the quality of data, and facilitates
accurate reporting and assistance to division heads. Also included in this Public Works
division is the offices of the Public Works Director and Public Works Training
Coordinator.
1. Improve Public Works administrative staff’s software and professional communication
skills.
2. Maintain cross-functional competency for all Public Works office support staff
members.
3. Improve Public Works daily, monthly and quarterly reports.
4. Review and improve the viability of the service request/work order data collections
systems as they pertain to Public Works.
5. Revise the Public Works Administration Procedural Manual.
6. Oversee Public Works training and Center for Municipal Excellence services.
7. Maintain and update Public Works APWA accreditation and re-certification
requirements.
8. Maintain and ensure Public Works emergency response plans and capabilities.
S T A F F I N G (FT-PT-S)
Current Level Year 1 Year 2 Year 3 Year 4 Year 5 11-0-0 11-0-0 11-0-0 11-0-0 11-0-0 11-0-0
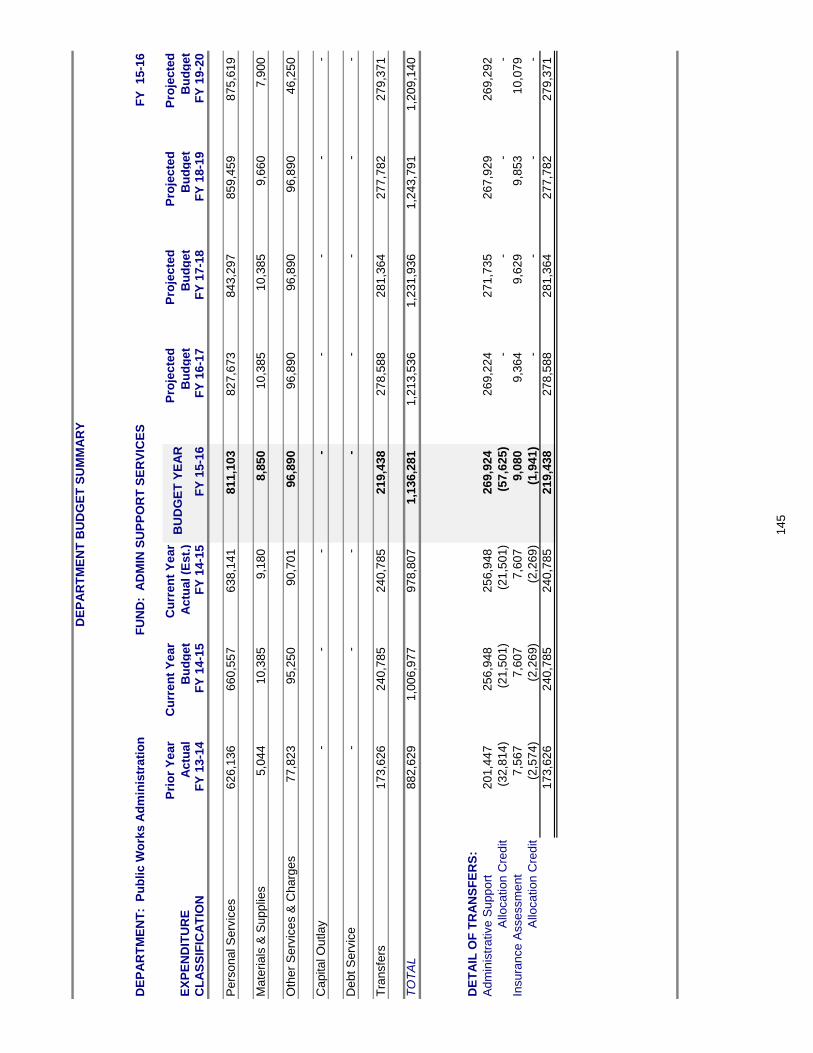
DE
PA
RT
ME
NT
BU
DG
ET
SU
MM
AR
Y
DE
PA
RT
ME
NT
: P
ub
lic W
ork
s A
dm
inis
trati
on
FU
ND
: A
DM
IN S
UP
PO
RT
SE
RV
ICE
SF
Y 15-1
6
EX
PE
ND
ITU
RE
Pri
or
Year
Actu
al
Cu
rren
t Y
ear
Bu
dg
et
Cu
rren
t Y
ear
Actu
al (E
st.
)B
UD
GE
T Y
EA
RP
roje
cte
d
Bu
dg
et
Pro
jecte
d
Bu
dg
et
Pro
jecte
d
Bu
dg
et
Pro
jecte
d
Bu
dg
et
CL
AS
SIF
ICA
TIO
NF
Y 1
3-1
4F
Y 1
4-1
5F
Y 1
4-1
5F
Y 1
5-1
6F
Y 1
6-1
7F
Y 1
7-1
8F
Y 1
8-1
9F
Y 1
9-2
0
Pers
onal S
erv
ices
626,1
36
660,5
57
638,1
41
811,1
03
827,6
73
843,2
97
859,4
59
875,6
19
Mate
rials
& S
upplie
s5,0
44
10,3
85
9,1
80
8,8
50
10,3
85
10,3
85
9,6
60
7,9
00
Oth
er
Serv
ices &
Charg
es
77,8
23
95,2
50
90,7
01
96,8
90
96,8
90
96,8
90
96,8
90
46,2
50
Capital O
utlay
-
-
-
-
-
-
-
-
Debt S
erv
ice
-
-
-
-
-
-
-
-
Tra
nsfe
rs173,6
26
240,7
85
240,7
85
219,4
38
278,5
88
281,3
64
277,7
82
279,3
71
TO
TA
L882,6
29
1,0
06,9
77
978,8
07
1,1
36,2
81
1,2
13,5
36
1,2
31,9
36
1,2
43,7
91
1,2
09,1
40
DE
TA
IL O
F T
RA
NS
FE
RS
:
Adm
inis
trative S
upport
201,4
47
256,9
48
256,9
48
269,9
24
269,2
24
271,7
35
267,9
29
269,2
92
Allo
cation C
redit
(32,8
14)
(21,5
01)
(21,5
01)
(57,6
25)
-
-
-
-
Insura
nce A
ssessm
ent
7,5
67
7,6
07
7,6
07
9,0
80
9,3
64
9,6
29
9,8
53
10,0
79
Allo
cation C
redit
(2,5
74)
(2,2
69)
(2,2
69)
(1,9
41)
-
-
-
-
173,6
26
240,7
85
240,7
85
219,4
38
278,5
88
281,3
64
277,7
82
279,3
71
145
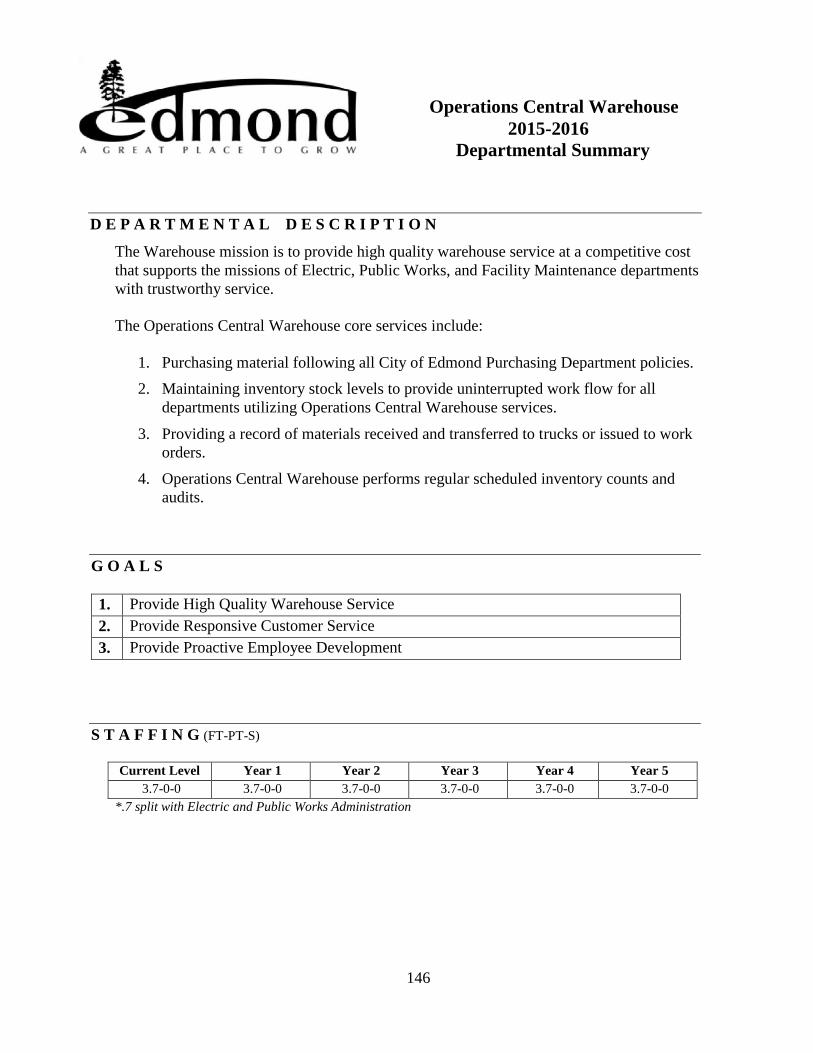
146
Operations Central Warehouse
2015-2016
Departmental Summary
D E P A R T M E N T A L D E S C R I P T I O N
The Warehouse mission is to provide high quality warehouse service at a competitive cost
that supports the missions of Electric, Public Works, and Facility Maintenance departments
with trustworthy service.
The Operations Central Warehouse core services include:
1. Purchasing material following all City of Edmond Purchasing Department policies.
2. Maintaining inventory stock levels to provide uninterrupted work flow for all
departments utilizing Operations Central Warehouse services.
3. Providing a record of materials received and transferred to trucks or issued to work
orders.
4. Operations Central Warehouse performs regular scheduled inventory counts and
audits.
G O A L S
S T A F F I N G (FT-PT-S)
Current Level Year 1 Year 2 Year 3 Year 4 Year 5 3.7-0-0 3.7-0-0 3.7-0-0 3.7-0-0 3.7-0-0 3.7-0-0
*.7 split with Electric and Public Works Administration
1. Provide High Quality Warehouse Service
2. Provide Responsive Customer Service
3. Provide Proactive Employee Development

DE
PA
RT
ME
NT
BU
DG
ET
SU
MM
AR
Y
DE
PA
RT
ME
NT
: O
pera
tio
ns C
en
tral W
are
ho
usin
g F
UN
D:
AD
MIN
SU
PP
OR
T S
ER
VIC
ES
FY
15-1
6
EX
PE
ND
ITU
RE
Pri
or
Year
Actu
al
Cu
rren
t Y
ear
Bu
dg
et
Cu
rren
t Y
ear
Actu
al (E
st.
)B
UD
GE
T Y
EA
RP
roje
cte
d
Bu
dg
et
Pro
jecte
d
Bu
dg
et
Pro
jecte
d
Bu
dg
et
Pro
jecte
d
Bu
dg
et
CL
AS
SIF
ICA
TIO
NF
Y 1
3-1
4F
Y 1
4-1
5F
Y 1
4-1
5F
Y 1
5-1
6F
Y 1
6-1
7F
Y 1
7-1
8F
Y 1
8-1
9F
Y 1
9-2
0
Pers
onal S
erv
ices
246,0
00
253,7
69
222,3
20
242,4
84
245,4
86
248,3
32
251,0
98
253,8
35
Mate
rials
& S
upplie
s4,1
60
6,2
75
4,4
00
6,1
50
4,7
75
4,8
75
6,5
65
5,0
75
Oth
er
Serv
ices &
Charg
es
13,1
00
15,4
75
12,3
00
15,6
55
15,8
40
15,9
75
16,4
75
16,4
75
Capital O
utlay
-
-
-
-
-
-
-
-
Debt S
erv
ice
-
-
-
-
-
-
-
-
Tra
nsfe
rs35,1
45
38,8
77
39,8
27
47,9
38
55,2
91
56,3
40
55,8
98
56,2
06
TO
TA
L298,4
05
314,3
96
278,8
47
312,2
27
321,3
92
325,5
22
330,0
36
331,5
91
DE
TA
IL O
F T
RA
NS
FE
RS
:
Adm
inis
trative S
upport
27,8
81
26,9
93
26,9
93
39,2
74
39,1
33
39,9
81
39,3
45
39,4
57
Allo
cation C
redit
(3,8
72)
(3,4
06)
(3,4
06)
(9,4
39)
-
-
-
-
Fle
et Lease A
ssessm
ent F
ees
6,5
68
6,7
53
6,7
53
6,8
79
7,0
08
7,1
40
7,2
75
7,4
12
Insura
nce A
ssessm
ent
1,3
66
1,4
44
1,4
44
1,5
76
1,6
50
1,7
19
1,7
78
1,8
37
Allo
cation C
redit
(494)
(407)
(407)
(352)
-
-
-
-
Vehic
le M
ain
tenance C
harg
es
3,6
96
7,5
00
8,4
50
10,0
00
7,5
00
7,5
00
7,5
00
7,5
00
35,1
45
38,8
77
39,8
27
47,9
38
55,2
91
56,3
40
55,8
98
56,2
06
147
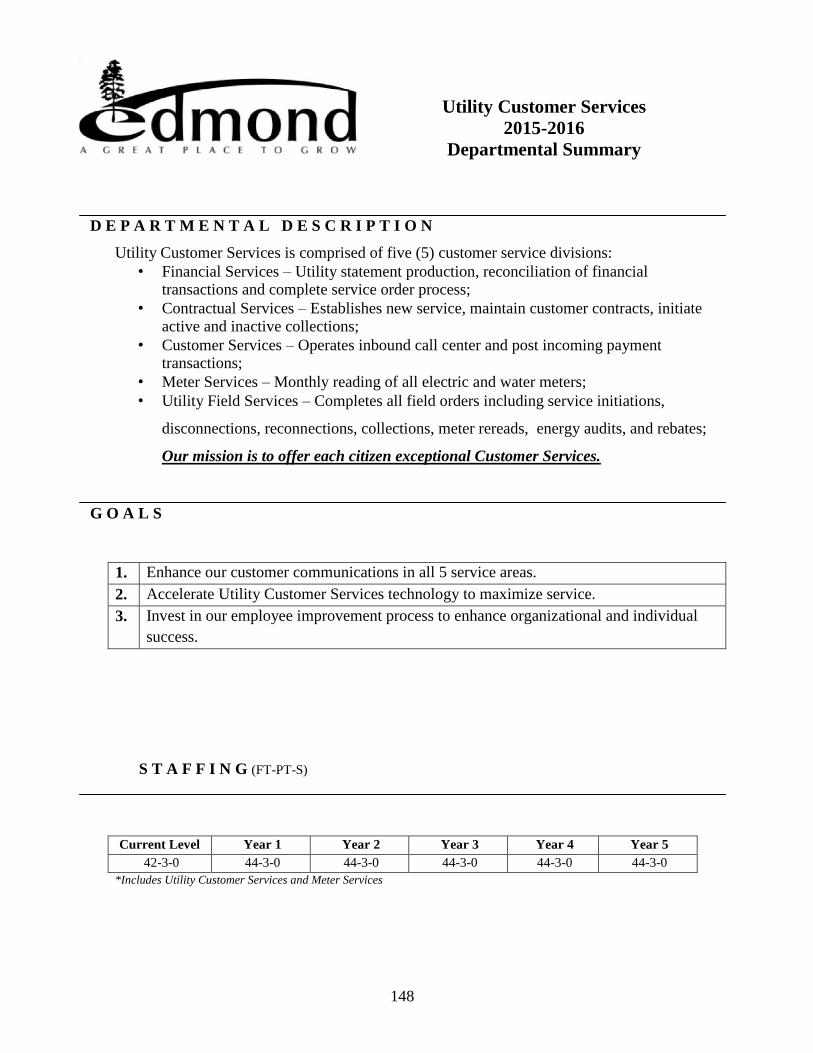
148
Utility Customer Services
2015-2016
Departmental Summary
D E P A R T M E N T A L D E S C R I P T I O N
Utility Customer Services is comprised of five (5) customer service divisions:
• Financial Services – Utility statement production, reconciliation of financial transactions and complete service order process;
• Contractual Services – Establishes new service, maintain customer contracts, initiate active and inactive collections;
• Customer Services – Operates inbound call center and post incoming payment transactions;
• Meter Services – Monthly reading of all electric and water meters;
• Utility Field Services – Completes all field orders including service initiations,
disconnections, reconnections, collections, meter rereads, energy audits, and rebates;
Our mission is to offer each citizen exceptional Customer Services.
G O A L S
1. Enhance our customer communications in all 5 service areas.
2. Accelerate Utility Customer Services technology to maximize service.
3. Invest in our employee improvement process to enhance organizational and individual
success.
S T A F F I N G (FT-PT-S)
Current Level Year 1 Year 2 Year 3 Year 4 Year 5 42-3-0 44-3-0 44-3-0 44-3-0 44-3-0 44-3-0
*Includes Utility Customer Services and Meter Services
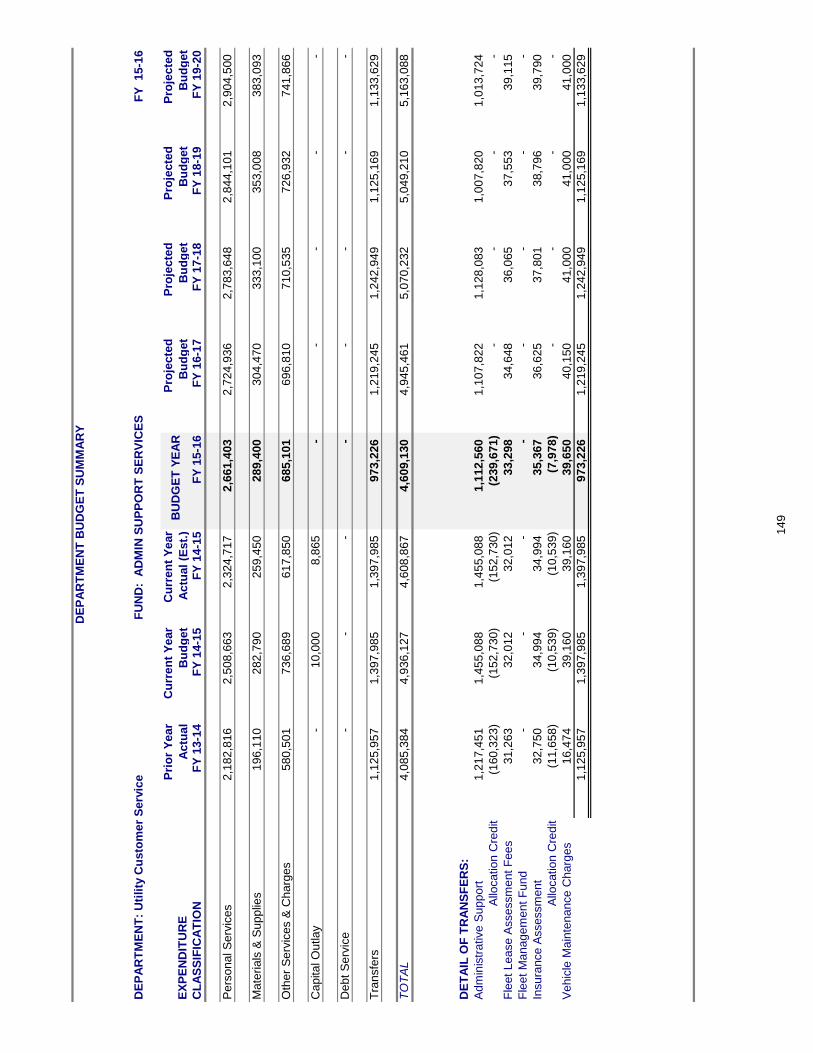
DE
PA
RT
ME
NT
BU
DG
ET
SU
MM
AR
Y
DE
PA
RT
ME
NT
: U
tili
ty C
usto
me
r S
erv
ice
FU
ND
: A
DM
IN S
UP
PO
RT
SE
RV
ICE
SF
Y
15-1
6
EX
PE
ND
ITU
RE
Pri
or
Ye
ar
Ac
tua
l
Cu
rre
nt
Ye
ar
Bu
dg
et
Cu
rre
nt
Ye
ar
Ac
tua
l (E
st.
)B
UD
GE
T Y
EA
RP
roje
cte
d
Bu
dg
et
Pro
jecte
d
Bu
dg
et
Pro
jecte
d
Bu
dg
et
Pro
jecte
d
Bu
dg
et
CL
AS
SIF
ICA
TIO
NF
Y 1
3-1
4F
Y 1
4-1
5F
Y 1
4-1
5F
Y 1
5-1
6F
Y 1
6-1
7F
Y 1
7-1
8F
Y 1
8-1
9F
Y 1
9-2
0
Pe
rso
na
l S
erv
ices
2,1
82
,816
2
,508
,663
2
,324
,717
2
,661
,403
2
,724
,936
2
,783
,648
2
,844
,101
2
,904
,500
Ma
terials
& S
upp
lies
196
,110
2
82
,790
2
59
,450
2
89
,400
3
04
,470
3
33
,100
3
53
,008
3
83
,093
Oth
er
Se
rvic
es &
Ch
arg
es
580
,501
7
36
,689
6
17
,850
6
85
,101
6
96
,810
7
10
,535
7
26
,932
7
41
,866
Ca
pita
l O
utla
y-
10,0
00
8,8
65
-
-
-
-
-
De
bt
Se
rvic
e-
-
-
-
-
-
-
-
Tra
nsfe
rs1
,125
,957
1
,397
,985
1
,397
,985
9
73
,226
1
,219
,245
1
,242
,949
1
,125
,169
1
,133
,629
TO
TA
L4
,085
,384
4
,936
,127
4
,608
,867
4
,609
,130
4
,945
,461
5
,070
,232
5
,049
,210
5
,163
,088
DE
TA
IL O
F T
RA
NS
FE
RS
:
Ad
min
istr
ative
Su
pp
ort
1,2
17
,451
1
,455
,088
1
,455
,088
1
,112
,560
1
,107
,822
1
,128
,083
1
,007
,820
1
,013
,724
Allo
catio
n C
redit
(160
,323
)
(1
52
,730
)
(1
52
,730
)
(2
39
,671
)
-
-
-
-
Fle
et
Lea
se A
sse
ssm
ent
Fee
s3
1,2
63
32,0
12
32,0
12
33,2
98
34,6
48
36,0
65
37,5
53
39,1
15
Fle
et
Ma
na
ge
me
nt
Fun
d-
-
-
-
-
-
-
-
Insura
nce
Asse
ssm
ent
32,7
50
34,9
94
34,9
94
35,3
67
36,6
25
37,8
01
38,7
96
39,7
90
Allo
catio
n C
redit
(11,6
58
)
(10,5
39
)
(10,5
39
)
(7,9
78
)
-
-
-
-
Ve
hic
le M
ain
tena
nce
Ch
arg
es
16,4
74
39,1
60
39,1
60
39,6
50
40,1
50
41,0
00
41,0
00
41,0
00
1,1
25
,957
1
,397
,985
1
,397
,985
9
73
,226
1
,219
,245
1
,242
,949
1
,125
,169
1
,133
,629
149
150
Fleet Management
2015-2016
Departmental Summary
D E P A R T M E N T A L D E S C R I P T I O N
Fleet Management provides administrative support in the most cost efficient manner to all City departments who operate city owned vehicles/equipment. The department manages the fleet replacement fund and establishes budget figures for each fiscal year for fuel, parts accounts, car wash expense and vehicle/equipment replacement. The department manages the bid process for new vehicle and equipment. Personnel are committed to exploring all means in which to aid departments in meeting the needs of their customers and the public sector.
GOALS:
• Increase the awareness of city’s personnel in the need to support the preventive maintenance service program for vehicle/equipment so that safety standards are continually met, liabilities are reduced and an overall reduction in maintenance costs can be achieved.
• Work with city departments to obtain vehicles/equipment that will be utilized to their maximum potential and remove obsolete and under-utilized vehicles/equipment from inventory.
• Draft specifications that combine the needs of the division and the financial aspects of the purchase together so as to ensure the most cost effective purchase.
• Continue to provide a more streamlined process for the replacement of city vehicles/equipment through the use of unit expense reporting.
• Support and assist all departments with new programs that will help reduce the costs and support city policies.
S T A F F I N G (FT-PT-S)
Current Level Year 1 Year 2 Year 3 Year 4 Year 5 .65-0-0 .65-0-0 .65-0-0 .65-0-0 .65-0-0 .65-0-0
* Split with Vehicle Maintenance
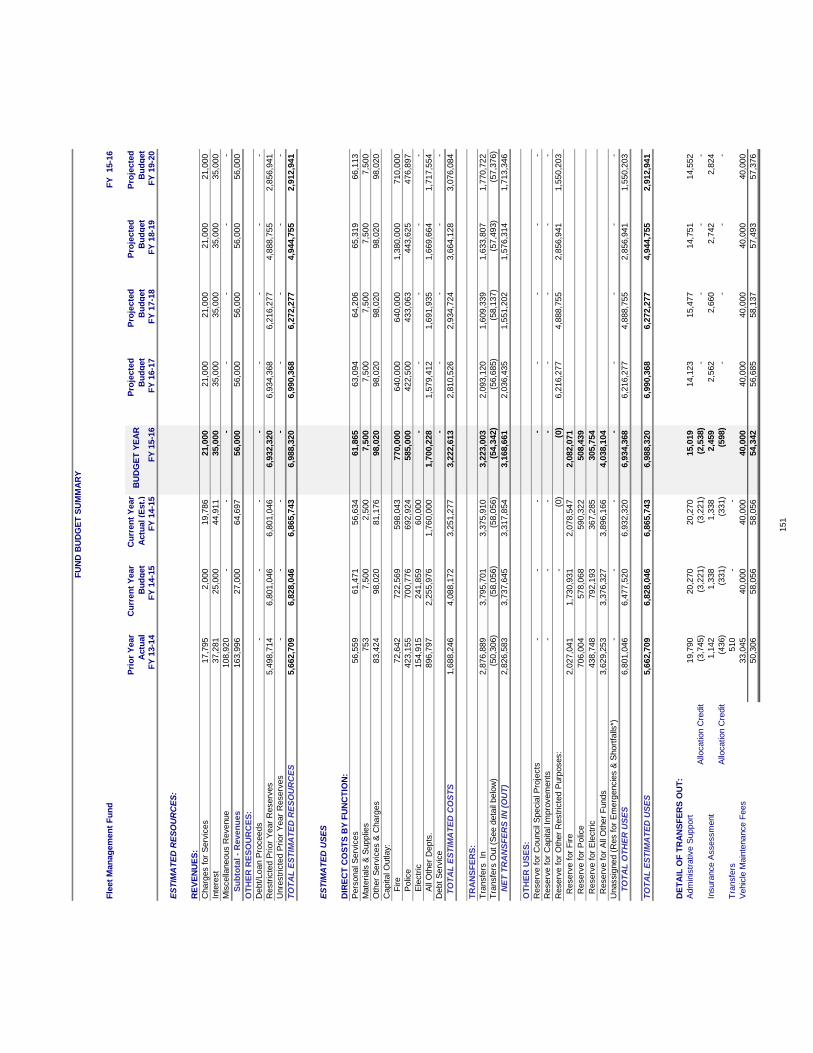
FU
ND
BU
DG
ET
SU
MM
AR
Y
Fle
et
Man
ag
em
en
t F
un
dF
Y
15-1
6
Pri
or
Year
Actu
al
Cu
rren
t Y
ear
Bu
dg
et
Cu
rren
t Y
ear
Actu
al
(Est.
)B
UD
GE
T Y
EA
RP
roje
cte
d
Bu
dg
et
Pro
jecte
d
Bu
dg
et
Pro
jecte
d
Bu
dg
et
Pro
jecte
d
Bu
dg
et
FY
13-1
4F
Y 1
4-1
5F
Y 1
4-1
5F
Y 1
5-1
6F
Y 1
6-1
7F
Y 1
7-1
8F
Y 1
8-1
9F
Y 1
9-2
0
ES
TIM
AT
ED
RE
SO
UR
CE
S:
RE
VE
NU
ES
:
Charg
es f
or
Serv
ices
17,7
95
2,0
00
19,7
86
21,0
00
21,0
00
21,0
00
21,0
00
21,0
00
Inte
rest
37,2
81
25,0
00
44,9
11
35,0
00
35,0
00
35,0
00
35,0
00
35,0
00
Mis
cella
neous R
evenue
108,9
20
-
-
-
-
-
-
-
S
ub
tota
l -
Reven
ues
163,9
96
27,0
00
64,6
97
56,0
00
56,0
00
56,0
00
56,0
00
56,0
00
OT
HE
R R
ES
OU
RC
ES
:
Debt/
Loan P
roceeds
-
-
-
-
-
-
-
-
Restr
icte
d P
rior
Year
Reserv
es
5,4
98,7
14
6,8
01,0
46
6,8
01,0
46
6,9
32,3
20
6,9
34,3
68
6,2
16,2
77
4,8
88,7
55
2,8
56,9
41
Unre
str
icte
d P
rior
Year
Reserv
es
-
-
-
-
-
-
-
-
TO
TA
L E
ST
IMA
TE
D R
ES
OU
RC
ES
5,6
62,7
09
6,8
28,0
46
6,8
65,7
43
6,9
88,3
20
6,9
90,3
68
6,2
72,2
77
4,9
44,7
55
2,9
12,9
41
ES
TIM
AT
ED
US
ES
DIR
EC
T C
OS
TS
BY
FU
NC
TIO
N:
Pers
onal S
erv
ices
56,5
59
61,4
71
56,6
34
61,8
65
63,0
94
64,2
06
65,3
19
66,1
13
Mate
rials
& S
upplie
s753
7,5
00
2,5
00
7,5
00
7,5
00
7,5
00
7,5
00
7,5
00
Oth
er
Serv
ices &
Charg
es
83,4
24
98,0
20
81,1
76
98,0
20
98,0
20
98,0
20
98,0
20
98,0
20
Capital O
utlay:
F
ire
72,6
42
722,5
69
598,0
43
770,0
00
640,0
00
640,0
00
1,3
80,0
00
710,0
00
P
olic
e423,1
55
700,7
76
692,9
24
585,0
00
422,5
00
433,0
63
443,6
25
476,8
97
E
lectr
ic154,9
15
241,8
59
60,0
00
-
-
-
-
-
A
ll O
ther
Depts
.896,7
97
2,2
55,9
76
1,7
60,0
00
1,7
00,2
28
1,5
79,4
12
1,6
91,9
35
1,6
69,6
64
1,7
17,5
54
Debt
Serv
ice
-
-
-
-
-
T
OT
AL
ES
TIM
AT
ED
CO
ST
S1,6
88,2
46
4,0
88,1
72
3,2
51,2
77
3,2
22,6
13
2,8
10,5
26
2,9
34,7
24
3,6
64,1
28
3,0
76,0
84
TR
AN
SF
ER
S:
Tra
nsfe
rs
In2,8
76,8
89
3,7
95,7
01
3,3
75,9
10
3,2
23,0
03
2,0
93,1
20
1,6
09,3
39
1,6
33,8
07
1,7
70,7
22
Tra
nsfe
rs O
ut
(See d
eta
il belo
w)
(50,3
06)
(5
8,0
56)
(5
8,0
56)
(5
4,3
42)
(5
6,6
85)
(5
8,1
37)
(5
7,4
93)
(5
7,3
76)
N
ET
TR
AN
SF
ER
S I
N (
OU
T)
2,8
26,5
83
3,7
37,6
45
3,3
17,8
54
3,1
68,6
61
2,0
36,4
35
1,5
51,2
02
1,5
76,3
14
1,7
13,3
46
OT
HE
R U
SE
S:
Reserv
e f
or
Council
Specia
l P
roje
cts
-
-
-
-
-
-
-
-
Reserv
e f
or
Capital Im
pro
vem
ents
-
-
-
-
-
-
-
-
Reserv
e f
or
Oth
er
Restr
icte
d P
urp
oses:
-
(0
)
(0)
6,2
16,2
77
4,8
88,7
55
2,8
56,9
41
1,5
50,2
03
R
eserv
e f
or
Fire
2,0
27,0
41
1,7
30,9
31
2,0
78,5
47
2,0
82,0
71
R
eserv
e f
or
Polic
e706,0
04
578,0
68
590,3
22
508,4
39
R
eserv
e f
or
Ele
ctr
ic438,7
48
792,1
93
367,2
85
305,7
54
R
eserv
e f
or
All
Oth
er
Funds
3,6
29,2
53
3,3
76,3
27
3,8
96,1
66
4,0
38,1
04
Unassig
ned (
Res f
or
Em
erg
encie
s &
Short
falls
*)-
-
-
-
-
-
-
-
T
OT
AL
OT
HE
R U
SE
S6,8
01,0
46
6,4
77,5
20
6,9
32,3
20
6,9
34,3
68
6,2
16,2
77
4,8
88,7
55
2,8
56,9
41
1,5
50,2
03
TO
TA
L E
ST
IMA
TE
D U
SE
S5,6
62,7
09
6,8
28,0
46
6,8
65,7
43
6,9
88,3
20
6,9
90,3
68
6,2
72,2
77
4,9
44,7
55
2,9
12,9
41
DE
TA
IL O
F T
RA
NS
FE
RS
OU
T:
Adm
inis
trative S
upport
19,7
90
20,2
70
20,2
70
15,0
19
14,1
23
15,4
77
14,7
51
14,5
52
Allo
cation C
redit
(3,7
45)
(3,2
21)
(3,2
21)
(2,5
38)
-
-
-
-
Insura
nce A
ssessm
ent
1,1
42
1,3
38
1,3
38
2,4
59
2,5
62
2,6
60
2,7
42
2,8
24
Allo
cation C
redit
(436)
(331)
(331)
(598)
-
-
-
-
Tra
nsfe
rs510
-
-
Vehic
le M
ain
tenance F
ees
33,0
45
40,0
00
40,0
00
40,0
00
40,0
00
40,0
00
40,0
00
40,0
00
50,3
06
58,0
56
58,0
56
54,3
42
56,6
85
58,1
37
57,4
93
57,3
76
151
152
Field Services
2015-2016
Departmental Summary
D E P A R T M E N T A L D E S C R I P T I O N
The Field Services Department has four primary areas of responsibility: streets, which
includes rights-of-ways and drainage, water distribution line maintenance, wastewater
collection line maintenance and traffic, which includes signals, signs, pavement markings and
roadway lighting. The department will accomplish a level of performance consistent with the
character and integrity of a professional organization. Although maintenance services
typically occur in a reactive environment, Field Services will continue to focus on proactive
planning and maintenance activities, and will actively seek out opportunities for continuous
improvement.
G O A L S
1. Field Services will proactively maintain Edmond’s over 1,300 lane miles of streets, over
128 miles of storm water infrastructure and applicable rights-of-ways, to a safe and
dependable condition, while responding to emergency situations such as snow and ice
events, flooding, high winds and other weather related events, in a timely and effective
manner.
2. Field Services will proactively maintain Edmond’s 99 signalized intersections, 38 school
zone flashers, over 8,000 traffic signs, pavement markings and over 6,000 street/security
lights, to ensure the safe travel of motorist on Edmond roads.
3. Field Services will proactively maintain Edmond’s over 449 miles of sanitary sewer
collection system, including over 10,000 manholes, to ensure safe collection and delivery
of wastewater to the Wastewater Treatment Plant, while minimizing sanitary sewer
overflows (SSOs).
4. Field Services will proactively maintain Edmond’s over 500 miles of water distribution
system, including over 4,000 hydrants, and over 27,000 service connections, to ensure the
safe delivery of quality drinking water, in a cost effective manner.
S T A F F I N G (FT-PT-S)
Current Level Year 1 Year 2 Year 3 Year 4 Year 5 67-1-0 68-1-0 68-1-0 68-1-0 68-1-0 68-1-0
*Includes Field Services Street, Traffic, Water Line, and Wastewater Line
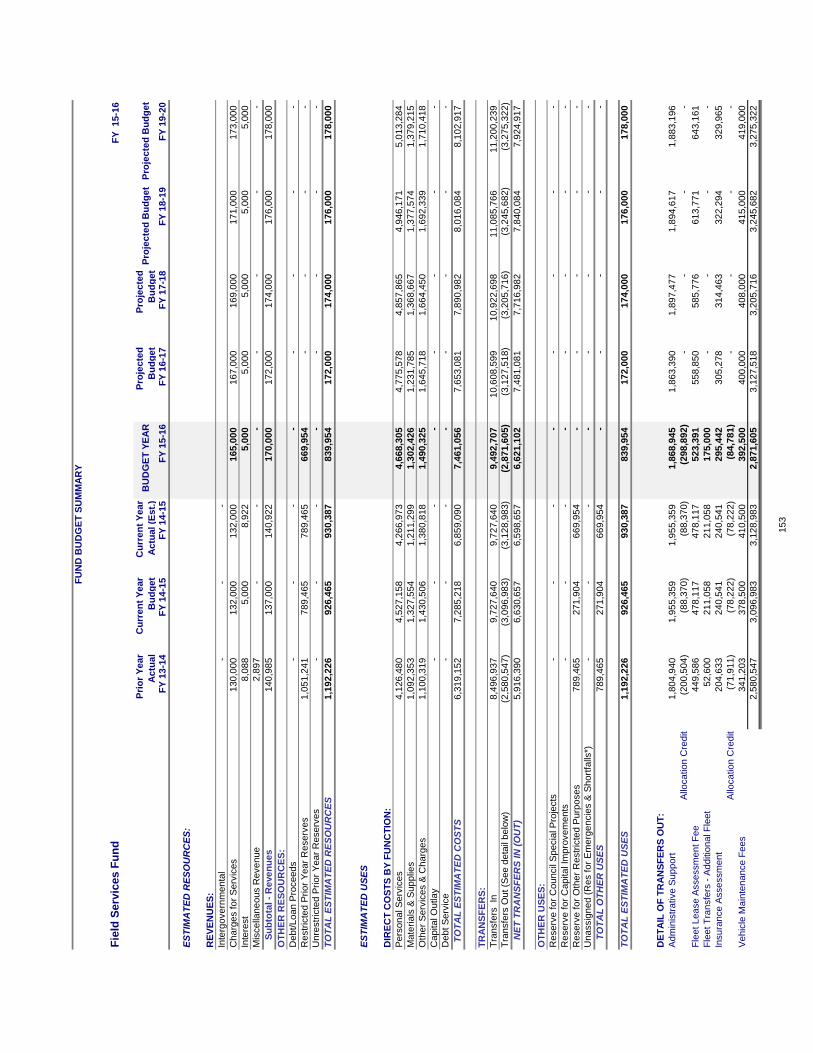
FU
ND
BU
DG
ET
SU
MM
AR
Y
Fie
ld S
erv
ices F
un
dF
Y 1
5-1
6
Pri
or
Ye
ar
Ac
tua
l
Cu
rre
nt
Ye
ar
Bu
dg
et
Cu
rre
nt
Ye
ar
Ac
tua
l (E
st.
)B
UD
GE
T Y
EA
RP
roje
cte
d
Bu
dg
et
Pro
jec
ted
Bu
dg
et
Pro
jec
ted
Bu
dg
et
Pro
jec
ted
Bu
dg
et
FY
13
-14
FY
14
-15
FY
14
-15
FY
15
-16
FY
16
-17
FY
17
-18
FY
18
-19
FY
19
-20
ES
TIM
AT
ED
RE
SO
UR
CE
S:
RE
VE
NU
ES
:
Inte
rgo
ve
rnm
en
tal
-
-
-
Ch
arg
es f
or
Se
rvic
es
13
0,0
00
13
2,0
00
13
2,0
00
16
5,0
00
16
7,0
00
16
9,0
00
17
1,0
00
17
3,0
00
Inte
rest
8,0
88
5,0
00
8,9
22
5,0
00
5,0
00
5,0
00
5,0
00
5,0
00
Mis
ce
llan
eo
us R
eve
nu
e2
,89
7
-
-
-
-
-
-
-
S
ub
tota
l -
Re
ve
nu
es
14
0,9
85
13
7,0
00
14
0,9
22
17
0,0
00
17
2,0
00
17
4,0
00
17
6,0
00
17
8,0
00
OT
HE
R R
ES
OU
RC
ES
:
De
bt/L
oa
n P
roce
ed
s-
-
-
-
-
-
-
-
Re
str
icte
d P
rio
r Y
ea
r R
ese
rve
s1
,05
1,2
41
78
9,4
65
78
9,4
65
66
9,9
54
-
-
-
-
Un
restr
icte
d P
rio
r Y
ea
r R
ese
rve
s-
-
-
-
-
-
-
-
TO
TA
L E
ST
IMA
TE
D R
ES
OU
RC
ES
1,1
92
,22
6
92
6,4
65
93
0,3
87
83
9,9
54
17
2,0
00
17
4,0
00
17
6,0
00
17
8,0
00
ES
TIM
AT
ED
US
ES
DIR
EC
T C
OS
TS
BY
FU
NC
TIO
N:
Pe
rso
na
l S
erv
ice
s4
,12
6,4
80
4,5
27
,15
8
4,2
66
,97
3
4,6
68
,30
5
4,7
75
,57
8
4,8
57
,86
5
4,9
46
,17
1
5,0
13
,28
4
Ma
teri
als
& S
up
plie
s1
,09
2,3
53
1,3
27
,55
4
1,2
11
,29
9
1,3
02
,42
6
1,2
31
,78
5
1,3
68
,66
7
1,3
77
,57
4
1,3
79
,21
5
Oth
er
Se
rvic
es &
Ch
arg
es
1,1
00
,31
9
1,4
30
,50
6
1,3
80
,81
8
1,4
90
,32
5
1,6
45
,71
8
1,6
64
,45
0
1,6
92
,33
9
1,7
10
,41
8
Ca
pita
l O
utla
y-
-
-
-
-
-
-
-
De
bt S
erv
ice
-
-
-
-
-
-
-
-
T
OT
AL
ES
TIM
AT
ED
CO
ST
S6
,31
9,1
52
7,2
85
,21
8
6,8
59
,09
0
7,4
61
,05
6
7,6
53
,08
1
7,8
90
,98
2
8,0
16
,08
4
8,1
02
,91
7
TR
AN
SF
ER
S:
Tra
nsfe
rs In
8,4
96
,93
7
9,7
27
,64
0
9,7
27
,64
0
9,4
92
,70
7
10
,60
8,5
99
10
,92
2,6
98
11
,08
5,7
66
11
,20
0,2
39
Tra
nsfe
rs O
ut (S
ee
de
tail
be
low
)(2
,58
0,5
47
)
(3,0
96
,98
3)
(3,1
28
,98
3)
(2,8
71
,60
5)
(3,1
27
,51
8)
(3,2
05
,71
6)
(3,2
45
,68
2)
(3,2
75
,32
2)
N
ET
TR
AN
SF
ER
S IN
(O
UT
)5
,91
6,3
90
6,6
30
,65
7
6,5
98
,65
7
6,6
21
,10
2
7,4
81
,08
1
7,7
16
,98
2
7,8
40
,08
4
7,9
24
,91
7
OT
HE
R U
SE
S:
Re
se
rve
fo
r C
ou
ncil
Sp
ecia
l P
roje
cts
-
-
-
-
-
-
-
-
Re
se
rve
fo
r C
ap
ita
l Im
pro
ve
me
nts
-
-
-
-
-
-
-
-
Re
se
rve
fo
r O
the
r R
estr
icte
d P
urp
ose
s7
89
,46
5
27
1,9
04
66
9,9
54
-
-
-
-
-
Un
assig
ne
d (
Re
s f
or
Em
erg
en
cie
s &
Sh
ort
falls
*)-
-
-
-
-
-
-
-
T
OT
AL
OT
HE
R U
SE
S7
89
,46
5
27
1,9
04
66
9,9
54
-
-
-
-
-
TO
TA
L E
ST
IMA
TE
D U
SE
S1
,19
2,2
26
92
6,4
65
93
0,3
87
83
9,9
54
17
2,0
00
17
4,0
00
17
6,0
00
17
8,0
00
DE
TA
IL O
F T
RA
NS
FE
RS
OU
T:
Ad
min
istr
ative
Su
pp
ort
1,8
04
,94
0
1,9
55
,35
9
1,9
55
,35
9
1,8
68
,94
5
1,8
63
,39
0
1,8
97
,47
7
1,8
94
,61
7
1,8
83
,19
6
Allo
ca
tio
n C
red
it(2
00
,50
4)
(88
,37
0)
(88
,37
0)
(29
8,8
92
)
-
-
-
-
Fle
et L
ea
se
Asse
ssm
en
t F
ee
44
9,5
86
47
8,1
17
47
8,1
17
52
3,3
91
55
8,8
50
58
5,7
76
61
3,7
71
64
3,1
61
Fle
et T
ran
sfe
rs -
Ad
ditio
na
l F
lee
t5
2,6
00
21
1,0
58
21
1,0
58
17
5,0
00
-
-
-
-
Insu
ran
ce
Asse
ssm
en
t2
04
,63
3
24
0,5
41
24
0,5
41
29
5,4
42
30
5,2
78
31
4,4
63
32
2,2
94
32
9,9
65
Allo
ca
tio
n C
red
it(7
1,9
11
)
(78
,22
2)
(78
,22
2)
(84
,78
1)
-
-
-
-
Ve
hic
le M
ain
ten
an
ce
Fe
es
34
1,2
03
37
8,5
00
41
0,5
00
39
2,5
00
40
0,0
00
40
8,0
00
41
5,0
00
41
9,0
00
2,5
80
,54
7
3,0
96
,98
3
3,1
28
,98
3
2,8
71
,60
5
3,1
27
,51
8
3,2
05
,71
6
3,2
45
,68
2
3,2
75
,32
2
15
3


Personnel Tab

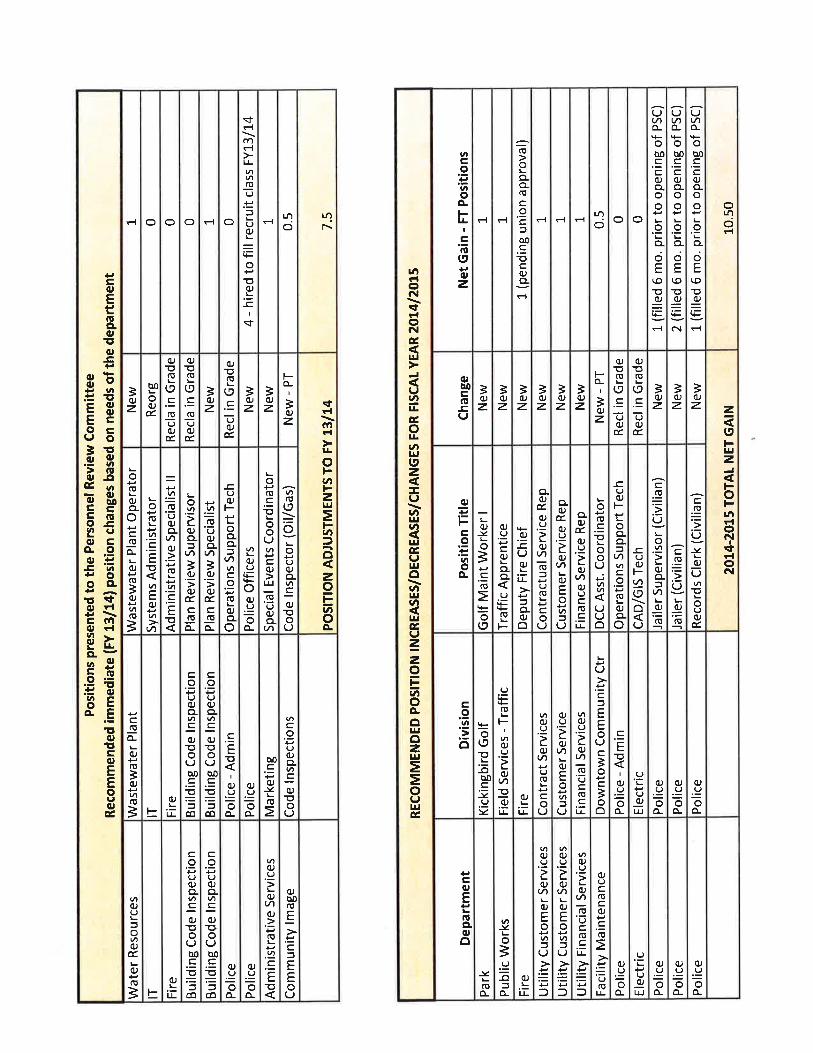
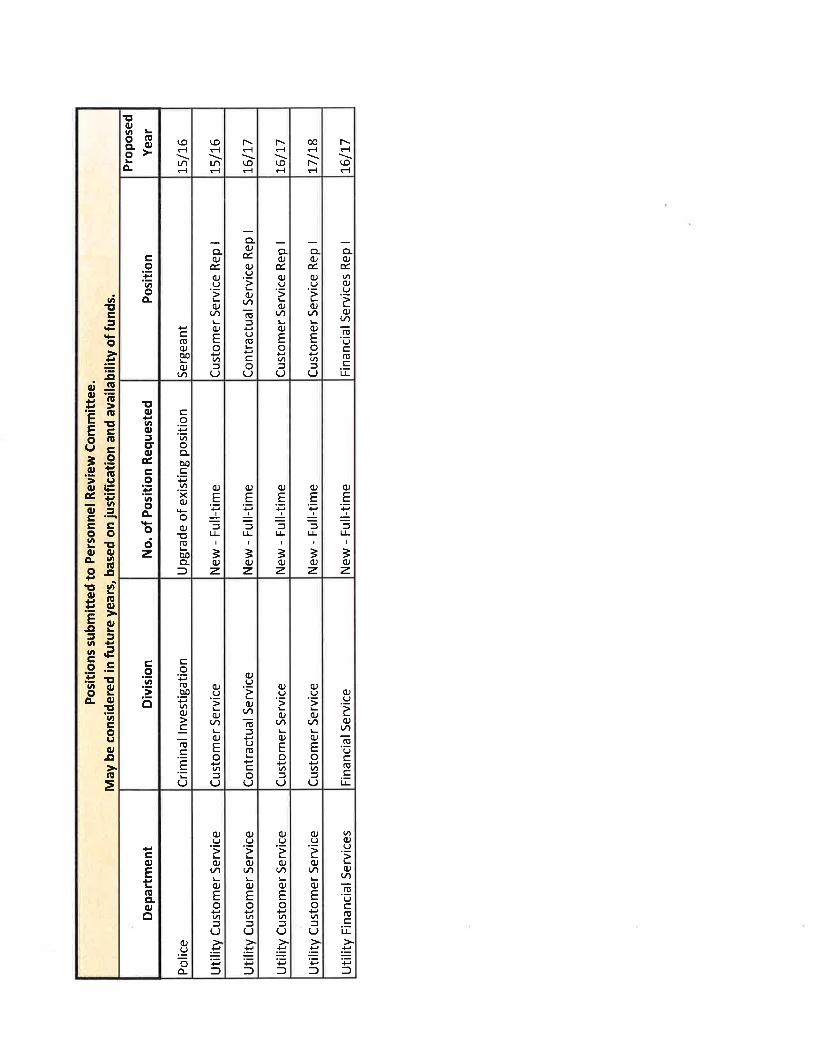


Capital Outlay Tab
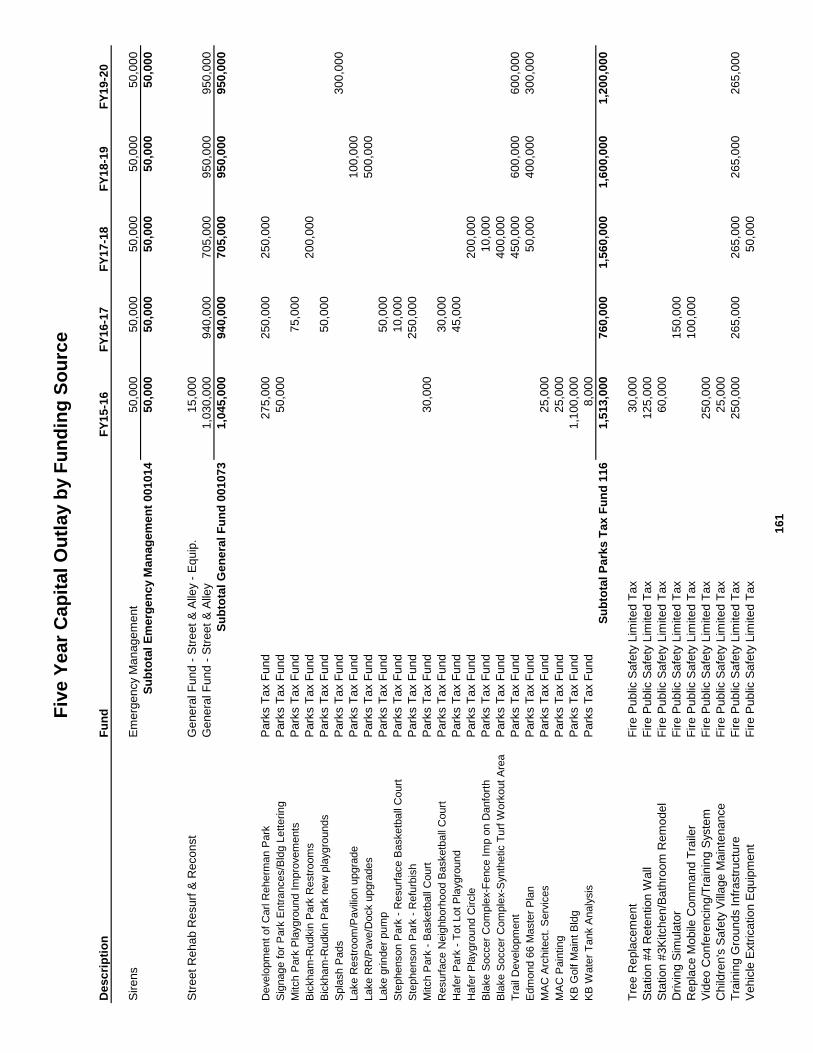
Fiv
e Y
ea
r C
ap
ita
l O
utl
ay b
y F
un
din
g S
ou
rce
De
sc
rip
tio
nF
un
dF
Y1
5-1
6F
Y1
6-1
7F
Y1
7-1
8F
Y1
8-1
9F
Y1
9-2
0
Sire
ns
Em
erg
en
cy M
ana
ge
me
nt
50,0
00
5
0,0
00
5
0,0
00
5
0,0
00
5
0,0
00
Su
bto
tal
Em
erg
en
cy M
an
ag
em
en
t 0
01
01
45
0,0
00
5
0,0
00
5
0,0
00
5
0,0
00
5
0,0
00
Str
eet
Re
ha
b R
esurf
& R
econ
st
Ge
ne
ral F
un
d -
Str
eet
& A
lley -
Eq
uip
.1
5,0
00
Ge
ne
ral F
un
d -
Str
eet
& A
lley
1,0
30
,000
940
,000
705
,000
950
,000
950
,000
Su
bto
tal
Ge
ne
ral
Fu
nd
001
07
31
,045
,000
940
,000
705
,000
950
,000
950
,000
Develo
pm
ent
of
Carl R
eherm
an P
ark
Pa
rks T
ax F
un
d2
75
,000
250
,000
250
,000
Sig
nage f
or
Park
Entr
ances/B
ldg L
ett
erin
gP
ark
s T
ax F
un
d5
0,0
00
Mitch P
ark
Pla
ygro
und I
mpro
vem
ents
Pa
rks T
ax F
un
d7
5,0
00
Bic
kham
-Rudkin
Park
Restr
oom
sP
ark
s T
ax F
un
d2
00
,000
Bic
kham
-Rudkin
Park
new
pla
ygro
unds
Pa
rks T
ax F
un
d5
0,0
00
Spla
sh P
ads
Pa
rks T
ax F
un
d3
00
,000
Lake R
estr
oom
/Pavili
on u
pgra
de
Pa
rks T
ax F
un
d1
00
,000
Lake R
R/P
ave/D
ock u
pgra
des
Pa
rks T
ax F
un
d5
00
,000
Lake g
rin
der
pum
pP
ark
s T
ax F
un
d5
0,0
00
Ste
phenson P
ark
- R
esurf
ace B
asketb
all
Court
Pa
rks T
ax F
un
d1
0,0
00
Ste
phenson P
ark
- R
efu
rbis
hP
ark
s T
ax F
un
d2
50
,000
Mitch P
ark
- B
asketb
all
Court
Pa
rks T
ax F
un
d3
0,0
00
Resurf
ace N
eig
hborh
ood B
asketb
all
Court
Pa
rks T
ax F
un
d3
0,0
00
Hafe
r P
ark
- T
ot
Lot
Pla
ygro
und
Pa
rks T
ax F
un
d4
5,0
00
Hafe
r P
laygro
und C
ircle
Pa
rks T
ax F
un
d2
00
,000
Bla
ke S
occer
Com
ple
x-F
ence I
mp o
n D
anfo
rth
Pa
rks T
ax F
un
d1
0,0
00
Bla
ke S
occer
Com
ple
x-S
ynth
etic T
urf
Work
out
Are
aP
ark
s T
ax F
un
d4
00
,000
Tra
il D
evelo
pm
ent
Pa
rks T
ax F
un
d4
50
,000
600
,000
600
,000
Edm
ond 6
6 M
aste
r P
lan
Pa
rks T
ax F
un
d5
0,0
00
4
00
,000
300
,000
MA
C A
rchitect.
Serv
ices
Pa
rks T
ax F
un
d2
5,0
00
MA
C P
ain
tin
gP
ark
s T
ax F
un
d2
5,0
00
KB
Golf M
ain
t B
ldg
Pa
rks T
ax F
un
d1
,100
,000
KB
Wate
r T
ank A
naly
sis
Pa
rks T
ax F
un
d8
,000
Su
bto
tal
Pa
rks
Ta
x F
un
d 1
16
1,5
13
,000
760
,000
1,5
60
,000
1
,600
,000
1
,200
,000
Tre
e R
epla
cem
ent
Fire
Pu
blic
Sa
fety
Lim
ite
d T
ax
30,0
00
Sta
tio
n #
4 R
ete
ntio
n W
all
Fire
Pu
blic
Sa
fety
Lim
ite
d T
ax
125
,000
Sta
tio
n #
3K
itch
en
/Ba
thro
om
Re
mo
de
lF
ire
Pu
blic
Sa
fety
Lim
ite
d T
ax
60,0
00
Drivin
g S
imu
lato
rF
ire
Pu
blic
Sa
fety
Lim
ite
d T
ax
150
,000
Re
pla
ce M
obile
Co
mm
and
Tra
iler
Fire
Pu
blic
Sa
fety
Lim
ite
d T
ax
100
,000
Vid
eo
Co
nfe
ren
cin
g/T
rain
ing S
yste
mF
ire
Pu
blic
Sa
fety
Lim
ite
d T
ax
250
,000
Ch
ildre
n's
Safe
ty V
illa
ge
Ma
inte
na
nce
Fire
Pu
blic
Sa
fety
Lim
ite
d T
ax
25,0
00
Tra
inin
g G
roun
ds I
nfr
astr
uctu
reF
ire
Pu
blic
Sa
fety
Lim
ite
d T
ax
250
,000
265
,000
265
,000
265
,000
265
,000
Ve
hic
le E
xtr
ica
tio
n E
quip
me
nt
Fire
Pu
blic
Sa
fety
Lim
ite
d T
ax
50,0
00
161
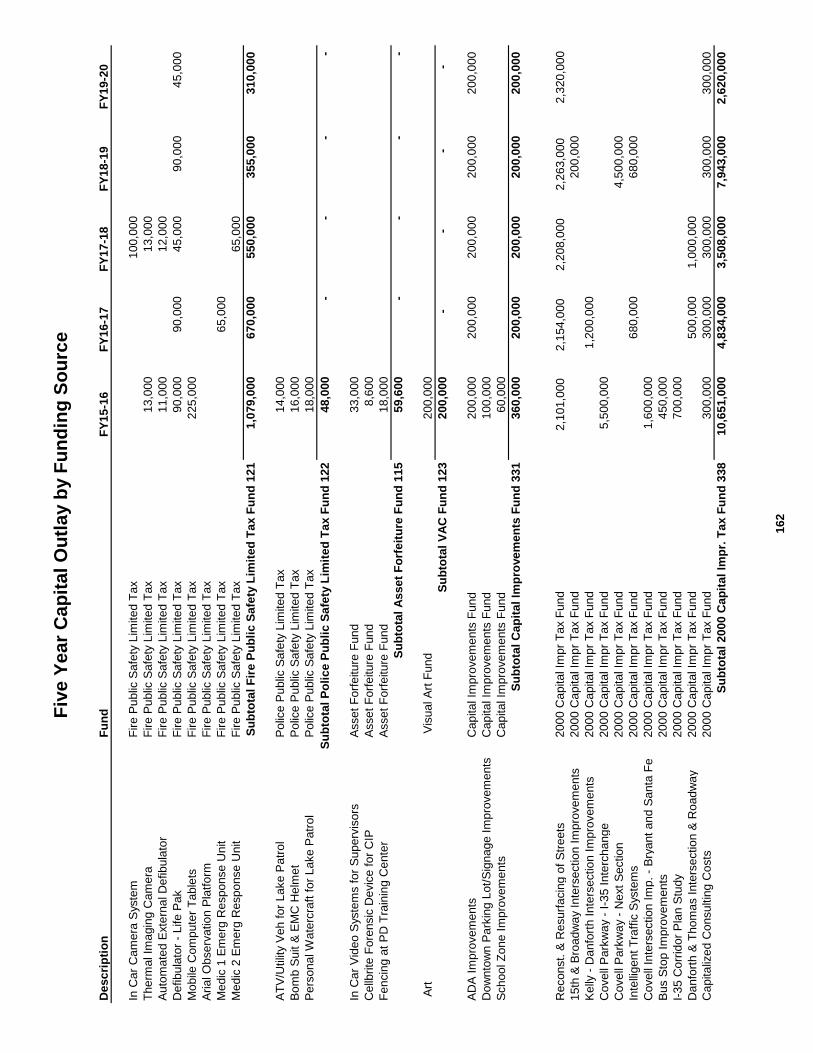
Fiv
e Y
ea
r C
ap
ita
l O
utl
ay b
y F
un
din
g S
ou
rce
De
sc
rip
tio
nF
un
dF
Y1
5-1
6F
Y1
6-1
7F
Y1
7-1
8F
Y1
8-1
9F
Y1
9-2
0
In C
ar
Ca
me
ra S
yste
mF
ire
Pu
blic
Sa
fety
Lim
ite
d T
ax
100
,000
The
rma
l Im
agin
g C
am
era
Fire
Pu
blic
Sa
fety
Lim
ite
d T
ax
13,0
00
1
3,0
00
Au
tom
ate
d E
xte
rna
l D
efib
ula
tor
Fire
Pu
blic
Sa
fety
Lim
ite
d T
ax
11,0
00
1
2,0
00
De
fib
ula
tor
- L
ife
Pa
kF
ire
Pu
blic
Sa
fety
Lim
ite
d T
ax
90,0
00
9
0,0
00
4
5,0
00
9
0,0
00
4
5,0
00
Mo
bile
Co
mp
ute
r T
ab
lets
Fire
Pu
blic
Sa
fety
Lim
ite
d T
ax
225
,000
Aria
l O
bserv
atio
n P
latf
orm
Fire
Pu
blic
Sa
fety
Lim
ite
d T
ax
Me
dic
1 E
me
rg R
espo
nse
Un
itF
ire
Pu
blic
Sa
fety
Lim
ite
d T
ax
65,0
00
Me
dic
2 E
me
rg R
espo
nse
Un
itF
ire
Pu
blic
Sa
fety
Lim
ite
d T
ax
65,0
00
Su
bto
tal
Fir
e P
ub
lic
Sa
fety
Lim
ite
d T
ax F
un
d 1
21
1,0
79
,000
670
,000
550
,000
355
,000
310
,000
AT
V/U
tilit
y V
eh f
or
Lake
Pa
tro
lP
olic
e P
ublic
Sa
fety
Lim
ite
d T
ax
14,0
00
Bo
mb
Su
it &
EM
C H
elm
et
Po
lice
Pu
blic
Sa
fety
Lim
ite
d T
ax
16,0
00
Pe
rso
na
l W
ate
rcra
ft f
or
Lake
Pa
tro
lP
olic
e P
ublic
Sa
fety
Lim
ite
d T
ax
18,0
00
Su
bto
tal
Po
lic
e P
ub
lic
Sa
fety
Lim
ite
d T
ax F
un
d 1
22
48,0
00
-
-
-
-
In C
ar
Vid
eo
Syste
ms f
or
Su
pe
rvis
ors
Asse
t F
orf
eitu
re F
un
d3
3,0
00
Ce
llbrite
Fore
nsic
De
vic
e f
or
CIP
Asse
t F
orf
eitu
re F
un
d8
,600
Fen
cin
g a
t P
D T
rain
ing C
ente
rA
sse
t F
orf
eitu
re F
un
d1
8,0
00
Su
bto
tal
As
se
t F
orf
eit
ure
Fu
nd
115
59,6
00
-
-
-
-
Art
Vis
ual A
rt F
un
d2
00
,000
Su
bto
tal
VA
C F
un
d 1
23
200
,000
-
-
-
-
AD
A I
mp
rove
me
nts
Ca
pita
l Im
pro
ve
me
nts
Fun
d2
00
,000
200
,000
200
,000
200
,000
200
,000
Do
wn
tow
n P
ark
ing L
ot/
Sig
na
ge
Im
pro
ve
me
nts
Ca
pita
l Im
pro
ve
me
nts
Fun
d1
00
,000
Sch
oo
l Z
on
e I
mp
rove
me
nts
Ca
pita
l Im
pro
ve
me
nts
Fun
d6
0,0
00
Su
bto
tal
Ca
pit
al
Imp
rove
me
nts
Fu
nd
331
360
,000
200
,000
200
,000
200
,000
200
,000
Re
con
st.
& R
esurf
acin
g o
f S
tre
ets
200
0 C
apita
l Im
pr
Tax F
un
d
2,1
01,0
00
2,1
54
,000
2
,208
,000
2
,263
,000
2,3
20,0
00
15th
& B
road
wa
y I
nte
rse
ctio
n I
mp
rove
me
nts
200
0 C
apita
l Im
pr
Tax F
un
d2
00
,000
Ke
lly -
Da
nfo
rth
In
ters
ectio
n I
mp
rove
me
nts
200
0 C
apita
l Im
pr
Tax F
un
d1
,200
,000
Co
vell
Pa
rkw
ay -
I-3
5 I
nte
rch
an
ge
200
0 C
apita
l Im
pr
Tax F
un
d5
,500
,000
Co
vell
Pa
rkw
ay -
Ne
xt
Se
ctio
n2
00
0 C
apita
l Im
pr
Tax F
un
d4
,500
,000
Inte
llig
en
t T
raff
ic S
yste
ms
200
0 C
apita
l Im
pr
Tax F
un
d6
80
,000
680
,000
Co
vell
Inte
rse
ctio
n I
mp
. -
Bry
ant
and
Sa
nta
Fe
200
0 C
apita
l Im
pr
Tax F
un
d1
,600
,000
Bu
s S
top I
mp
rove
me
nts
200
0 C
apita
l Im
pr
Tax F
un
d4
50
,000
I-3
5 C
orr
idor
Pla
n S
tudy
200
0 C
apita
l Im
pr
Tax F
un
d7
00
,000
Da
nfo
rth
& T
ho
ma
s I
nte
rse
ctio
n &
Ro
ad
wa
y2
00
0 C
apita
l Im
pr
Tax F
un
d5
00
,000
1,0
00
,000
Ca
pita
lize
d C
onsu
ltin
g C
osts
200
0 C
apita
l Im
pr
Tax F
un
d3
00
,000
300
,000
300
,000
300
,000
300
,000
Su
bto
tal
200
0 C
ap
ita
l Im
pr.
Ta
x F
un
d 3
38
10,6
51
,000
4
,834
,000
3
,508
,000
7
,943
,000
2
,620
,000
162
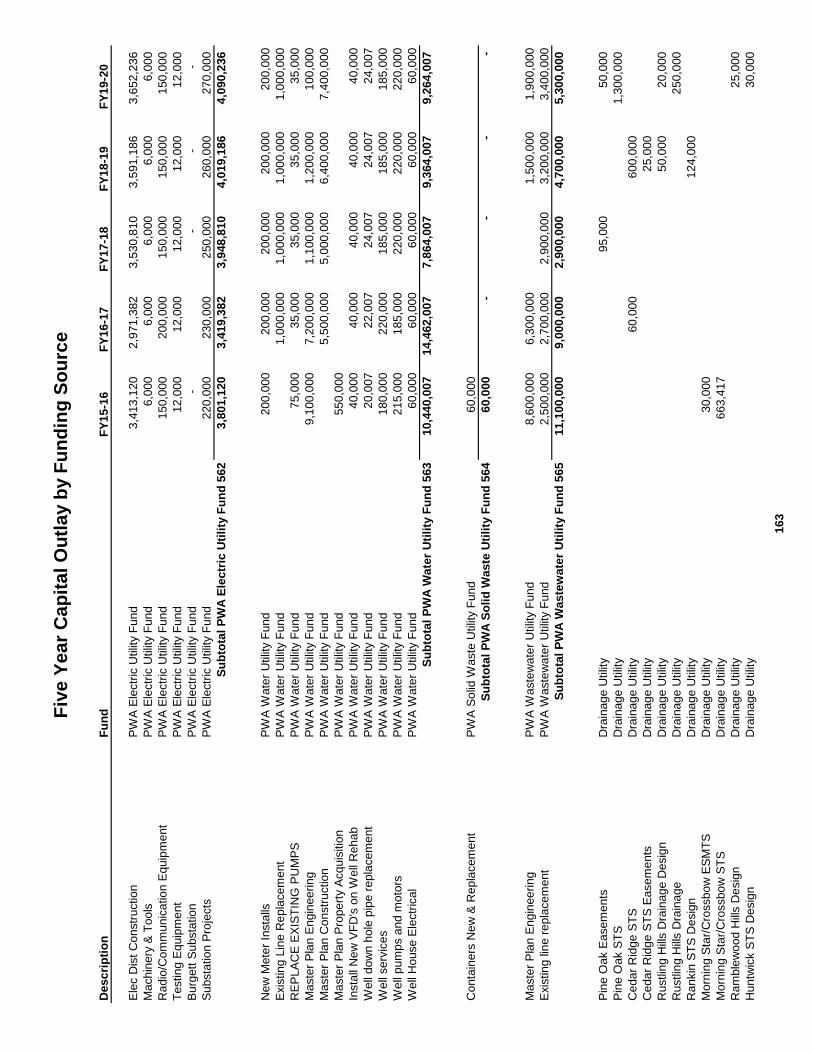
Fiv
e Y
ea
r C
ap
ita
l O
utl
ay b
y F
un
din
g S
ou
rce
De
sc
rip
tio
nF
un
dF
Y1
5-1
6F
Y1
6-1
7F
Y1
7-1
8F
Y1
8-1
9F
Y1
9-2
0
Ele
c D
ist
Co
nstr
uctio
nP
WA
Ele
ctr
ic U
tilit
y F
un
d3
,413
,120
2,9
71
,382
3
,530
,810
3
,591
,186
3
,652
,236
Ma
chin
ery
& T
oo
lsP
WA
Ele
ctr
ic U
tilit
y F
un
d6
,000
6,0
00
6,0
00
6,0
00
6,0
00
Ra
dio
/Co
mm
unic
atio
n E
quip
me
nt
PW
A E
lectr
ic U
tilit
y F
un
d1
50
,000
200
,000
150
,000
150
,000
150
,000
Testin
g E
quip
me
nt
PW
A E
lectr
ic U
tilit
y F
un
d1
2,0
00
1
2,0
00
1
2,0
00
1
2,0
00
1
2,0
00
Bu
rge
tt S
ubsta
tio
nP
WA
Ele
ctr
ic U
tilit
y F
un
d-
-
-
-
Su
bsta
tio
n P
roje
cts
PW
A E
lectr
ic U
tilit
y F
un
d2
20
,000
230
,000
250
,000
260
,000
270
,000
Su
bto
tal
PW
A E
lectr
ic U
tili
ty F
un
d 5
62
3,8
01
,120
3,4
19
,382
3
,948
,810
4
,019
,186
4
,090
,236
Ne
w M
ete
r In
sta
llsP
WA
Wa
ter
Utilit
y F
un
d2
00
,000
200
,000
200
,000
200
,000
200
,000
Exis
tin
g L
ine R
epla
cem
ent
PW
A W
ate
r U
tilit
y F
un
d1
,000
,000
1,0
00
,000
1,0
00
,000
1,0
00
,000
RE
PL
AC
E E
XIS
TIN
G P
UM
PS
P
WA
Wa
ter
Utilit
y F
un
d7
5,0
00
35,0
00
35,0
00
35,0
00
35,0
00
Ma
ste
r P
lan E
ngin
ee
ring
P
WA
Wa
ter
Utilit
y F
un
d9
,100
,000
7,2
00
,000
1,1
00
,000
1,2
00
,000
100
,000
Ma
ste
r P
lan C
onstr
uctio
nP
WA
Wa
ter
Utilit
y F
un
d5
,500
,000
5,0
00
,000
6,4
00
,000
7,4
00
,000
Ma
ste
r P
lan P
rope
rty A
cq
uis
itio
nP
WA
Wa
ter
Utilit
y F
un
d5
50
,000
Insta
ll N
ew
VF
D's
on W
ell
Re
ha
bP
WA
Wa
ter
Utilit
y F
un
d4
0,0
00
40,0
00
40,0
00
40,0
00
40,0
00
We
ll d
ow
n h
ole
pip
e r
epla
cem
ent
PW
A W
ate
r U
tilit
y F
un
d2
0,0
07
22,0
07
24,0
07
24,0
07
24,0
07
We
ll se
rvic
es
PW
A W
ate
r U
tilit
y F
un
d1
80
,000
220
,000
185
,000
185
,000
185
,000
We
ll p
um
ps a
nd
mo
tors
PW
A W
ate
r U
tilit
y F
un
d2
15
,000
185
,000
220
,000
220
,000
220
,000
We
ll H
ouse
Ele
ctr
ica
lP
WA
Wa
ter
Utilit
y F
un
d6
0,0
00
60,0
00
60,0
00
60,0
00
60,0
00
Su
bto
tal
PW
A W
ate
r U
tili
ty F
un
d 5
63
10,4
40
,007
1
4,4
62
,007
7,8
64
,007
9
,364
,007
9
,264
,007
Co
nta
iners
Ne
w &
Re
pla
cem
ent
PW
A S
olid
Wa
ste
Utilit
y F
un
d6
0,0
00
Su
bto
tal
PW
A S
oli
d W
aste
Uti
lity
Fu
nd
564
60,0
00
-
-
-
-
Ma
ste
r P
lan E
ngin
ee
ring
P
WA
Wa
ste
wa
ter
Utilit
y F
un
d8
,600
,000
6,3
00
,000
1,5
00
,000
1,9
00
,000
Exis
tin
g lin
e r
epla
cem
ent
PW
A W
aste
wa
ter
Utilit
y F
un
d2
,500
,000
2,7
00
,000
2,9
00
,000
3,2
00
,000
3,4
00
,000
Su
bto
tal
PW
A W
aste
wa
ter
Uti
lity
Fu
nd
565
11,1
00
,000
9
,000
,000
2
,900
,000
4
,700
,000
5
,300
,000
Pin
e O
ak E
asem
ents
Dra
inag
e U
tilit
y9
5,0
00
5
0,0
00
Pin
e O
ak S
TS
Dra
inag
e U
tilit
y1
,300
,000
Ce
da
r R
idge
ST
SD
rain
ag
e U
tilit
y6
0,0
00
6
00
,000
Ce
da
r R
idge
ST
S E
asem
ents
Dra
inag
e U
tilit
y2
5,0
00
Ru
stlin
g H
ills D
rain
ag
e D
esig
nD
rain
ag
e U
tilit
y5
0,0
00
2
0,0
00
Ru
stlin
g H
ills D
rain
ag
eD
rain
ag
e U
tilit
y2
50
,000
Ra
nkin
ST
S D
esig
nD
rain
ag
e U
tilit
y1
24
,000
Mo
rnin
g S
tar/
Cro
ssbo
w E
SM
TS
Dra
inag
e U
tilit
y3
0,0
00
Mo
rnin
g S
tar/
Cro
ssbo
w S
TS
Dra
inag
e U
tilit
y6
63
,417
Ra
mb
lew
ood
Hill
s D
esig
nD
rain
ag
e U
tilit
y2
5,0
00
Hu
ntw
ick S
TS
De
sig
nD
rain
ag
e U
tilit
y3
0,0
00
163
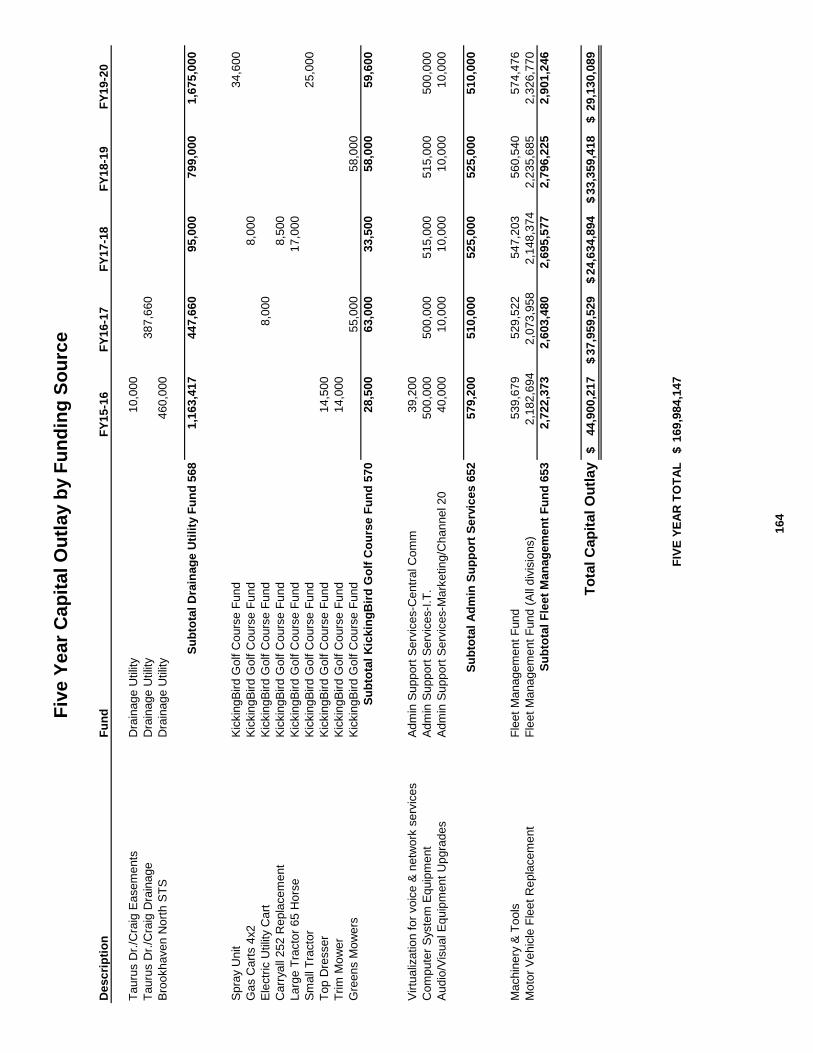
Fiv
e Y
ea
r C
ap
ita
l O
utl
ay b
y F
un
din
g S
ou
rce
De
sc
rip
tio
nF
un
dF
Y1
5-1
6F
Y1
6-1
7F
Y1
7-1
8F
Y1
8-1
9F
Y1
9-2
0
Tau
rus D
r./C
raig
Ea
sem
ents
Dra
inag
e U
tilit
y1
0,0
00
Tau
rus D
r./C
raig
Dra
inag
eD
rain
ag
e U
tilit
y3
87
,660
Bro
okh
ave
n N
ort
h S
TS
Dra
inag
e U
tilit
y4
60
,000
Su
bto
tal
Dra
inag
e U
tili
ty F
un
d 5
68
1,1
63
,417
447
,660
95,0
00
7
99
,000
1,6
75
,000
Sp
ray U
nit
Kic
kin
gB
ird
Go
lf C
ours
e F
un
d3
4,6
00
Ga
s C
art
s 4
x2
Kic
kin
gB
ird
Go
lf C
ours
e F
un
d8
,000
Ele
ctr
ic U
tilit
y C
art
Kic
kin
gB
ird
Go
lf C
ours
e F
un
d8
,000
Ca
rrya
ll 2
52
Re
pla
cem
ent
Kic
kin
gB
ird
Go
lf C
ours
e F
un
d8
,500
Larg
e T
racto
r 6
5 H
ors
eK
ickin
gB
ird
Go
lf C
ours
e F
un
d1
7,0
00
Sm
all
Tra
cto
rK
ickin
gB
ird
Go
lf C
ours
e F
un
d2
5,0
00
Top
Dre
sser
Kic
kin
gB
ird
Go
lf C
ours
e F
un
d1
4,5
00
Trim
Mo
we
rK
ickin
gB
ird
Go
lf C
ours
e F
un
d1
4,0
00
Gre
en
s M
ow
ers
Kic
kin
gB
ird
Go
lf C
ours
e F
un
d5
5,0
00
5
8,0
00
Su
bto
tal
Kic
kin
gB
ird
Go
lf C
ou
rse
Fu
nd
570
28,5
00
6
3,0
00
3
3,5
00
5
8,0
00
5
9,6
00
Virtu
aliz
atio
n f
or
vo
ice
& n
etw
ork
se
rvic
es
Ad
min
Su
pp
ort
Se
rvic
es-C
entr
al C
om
m3
9,2
00
Co
mp
ute
r S
yste
m E
quip
me
nt
Ad
min
Su
pp
ort
Se
rvic
es-I
.T.
500
,000
500
,000
515
,000
515
,000
500
,000
Au
dio
/Vis
ual E
quip
me
nt
Up
gra
de
sA
dm
in S
upp
ort
Se
rvic
es-M
ark
etin
g/C
han
ne
l 2
04
0,0
00
1
0,0
00
1
0,0
00
1
0,0
00
1
0,0
00
Su
bto
tal
Ad
min
Su
pp
ort
Se
rvic
es
652
579
,200
510
,000
525
,000
525
,000
510
,000
Ma
chin
ery
& T
oo
lsF
leet
Ma
na
ge
me
nt
Fun
d5
39
,679
529
,522
547
,203
560
,540
574
,476
Mo
tor
Ve
hic
le F
leet
Re
pla
cem
ent
Fle
et
Ma
na
ge
me
nt
Fun
d (
All
div
isio
ns)
2,1
82
,694
2,0
73
,958
2,1
48
,374
2,2
35
,685
2
,326
,770
Su
bto
tal
Fle
et
Ma
na
ge
me
nt
Fu
nd
653
2,7
22
,373
2,6
03
,480
2
,695
,577
2
,796
,225
2
,901
,246
To
tal
Cap
ital
Ou
tla
y4
4,9
00
,217
$
3
7,9
59
,529
$
24,6
34
,894
$
33,3
59
,418
$
29,1
30
,089
$
FIV
E Y
EA
R T
OT
AL
169
,984
,147
$
164