Embed Size (px)
Citation preview
1 101711160.ppt
Citizens Coordinating Council Meeting Silver Lake Pilot Study Results
December 5, 2007 December 5, 2007 Pittsfield, MassachusettsPittsfield, Massachusetts
2 101711160.ppt
Silver Lake CCC Meeting Summary
December 1, 2004: Pre-Design Investigation Results
March 30, 2006: Capping Bench-Scale Study Results
September 13, 2006: Capping Pilot Study Work Plan
Tonight: Capping Pilot Study Results
3 101711160.ppt
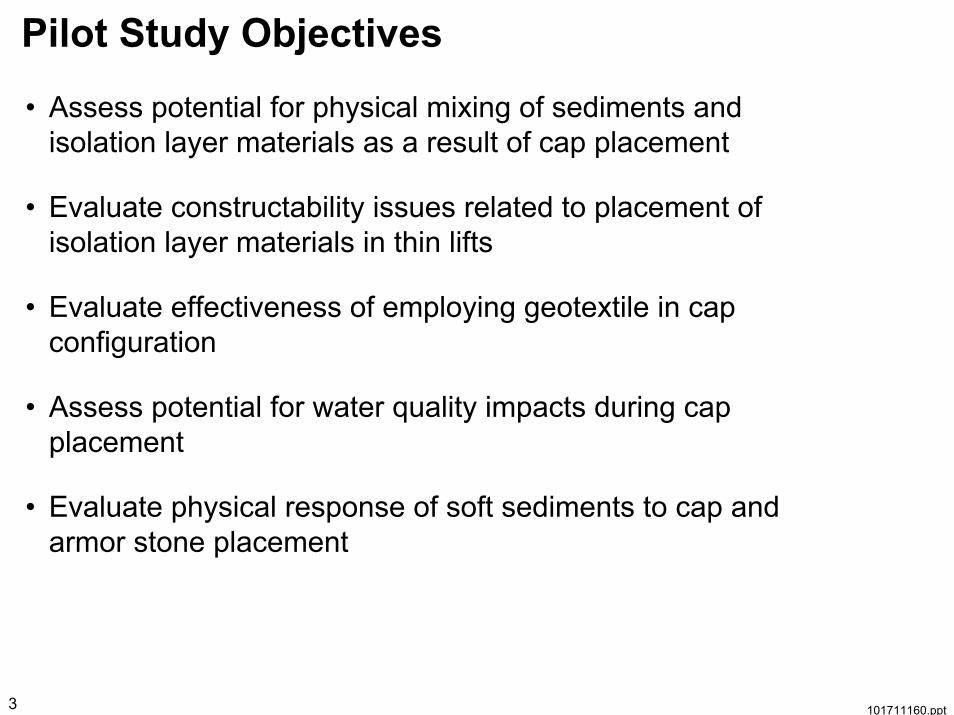
Pilot Study Objectives
• Assess potential for physical mixing of sediments and isolation layer materials as a result of cap placement
• Evaluate constructability issues related to placement of isolation layer materials in thin lifts
• Evaluate effectiveness of employing geotextile in cap configuration
• Assess potential for water quality impacts during cap placement
• Evaluate physical response of soft sediments to cap and armor stone placement
4 101711160.ppt
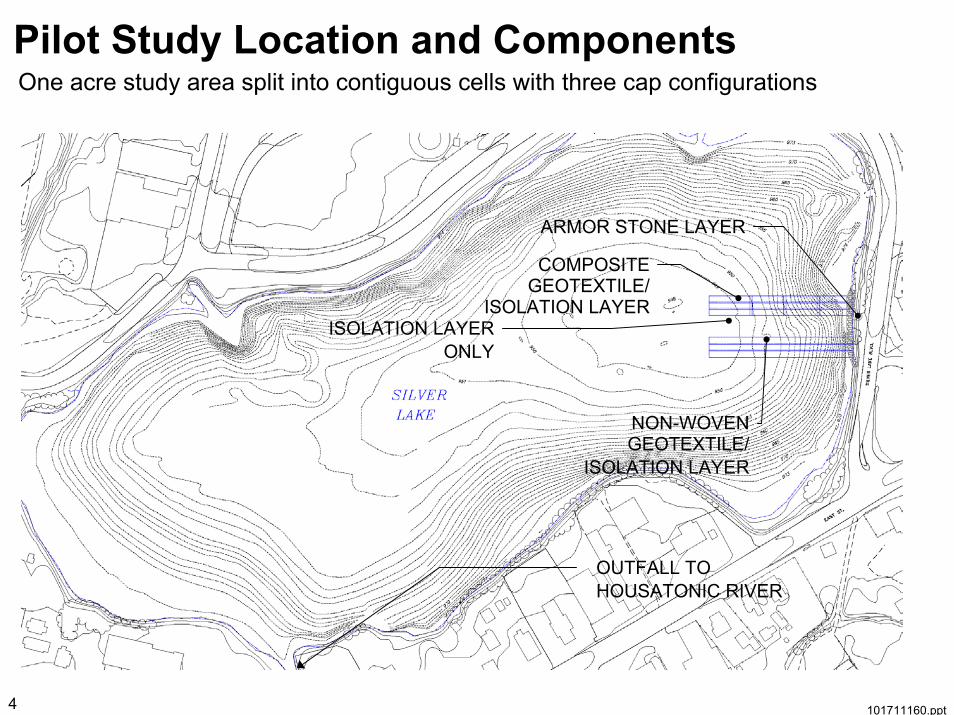
Pilot Study Location and ComponentsOne acre study area split into contiguous cells with three cap configurations
ISOLATION LAYERONLY
COMPOSITE GEOTEXTILE/
ISOLATION LAYER
NON-WOVEN GEOTEXTILE/
ISOLATION LAYER
ARMOR STONE LAYER
OUTFALL TO HOUSATONIC RIVER
5 101711160.ppt
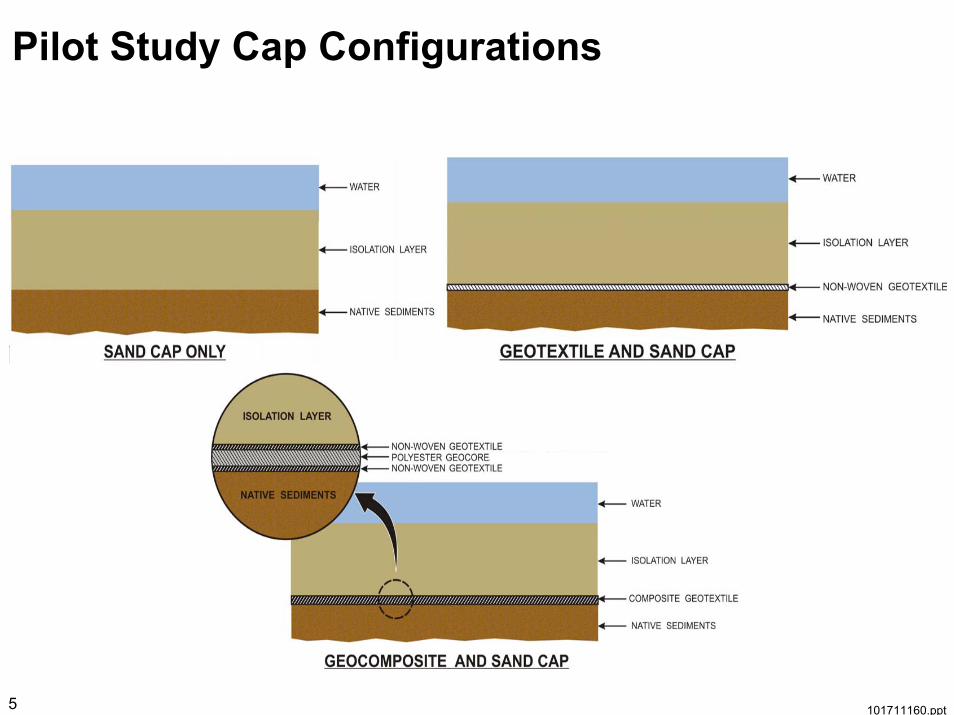
Pilot Study Cap Configurations
6 101711160.ppt
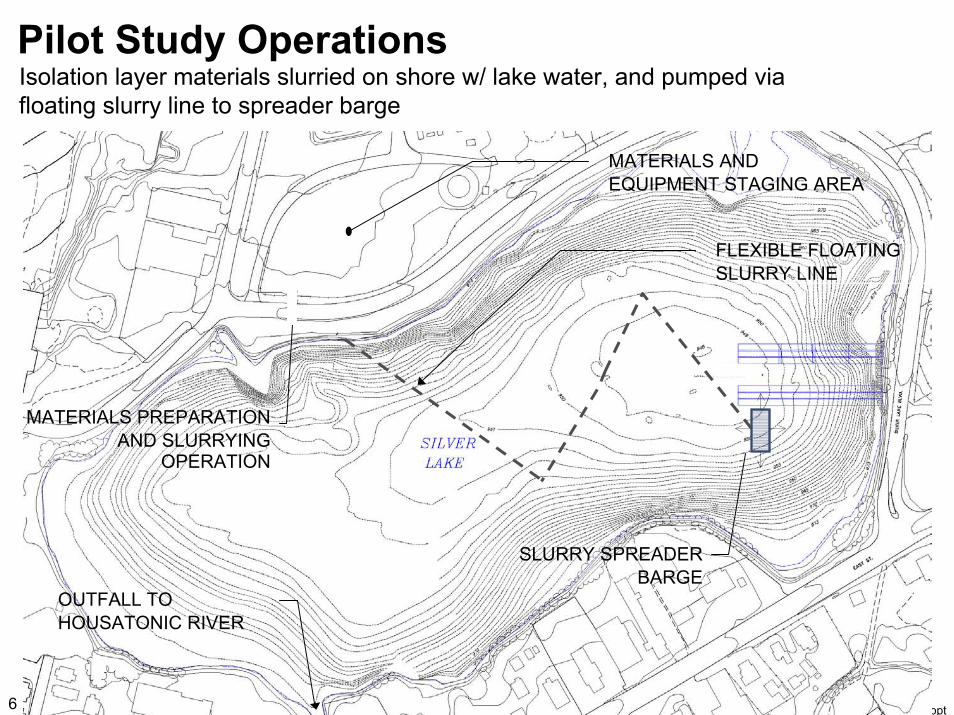
Pilot Study OperationsIsolation layer materials slurried on shore w/ lake water, and pumped via floating slurry line to spreader barge
FLEXIBLE FLOATINGSLURRY LINE
OUTFALL TO HOUSATONIC RIVER
SLURRY SPREADER BARGE
MATERIALS AND EQUIPMENT STAGING AREA
MATERIALS PREPARATIONAND SLURRYING
OPERATION

7 101711160.ppt
Geofabric Placement• Non-woven geotextile and
geocomposite fabrics installed from barge– adjacent full length rolls sewn
together and loaded onto barge mounted rollers
– anchored to shore and barge moved away from shore
– sand bags and rebar used to weight fabric and secure to lake bottom
8 101711160.ppt
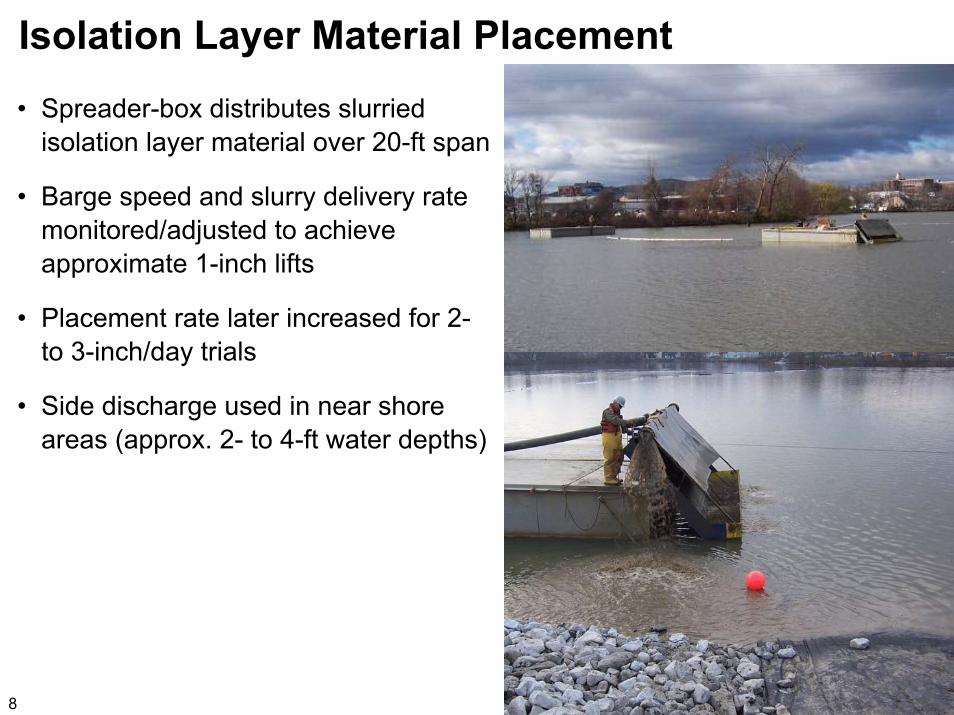
Isolation Layer Material Placement• Spreader-box distributes slurried
isolation layer material over 20-ft span
• Barge speed and slurry delivery rate monitored/adjusted to achieve approximate 1-inch lifts
• Placement rate later increased for 2-to 3-inch/day trials
• Side discharge used in near shore areas (approx. 2- to 4-ft water depths)
9 101711160.ppt
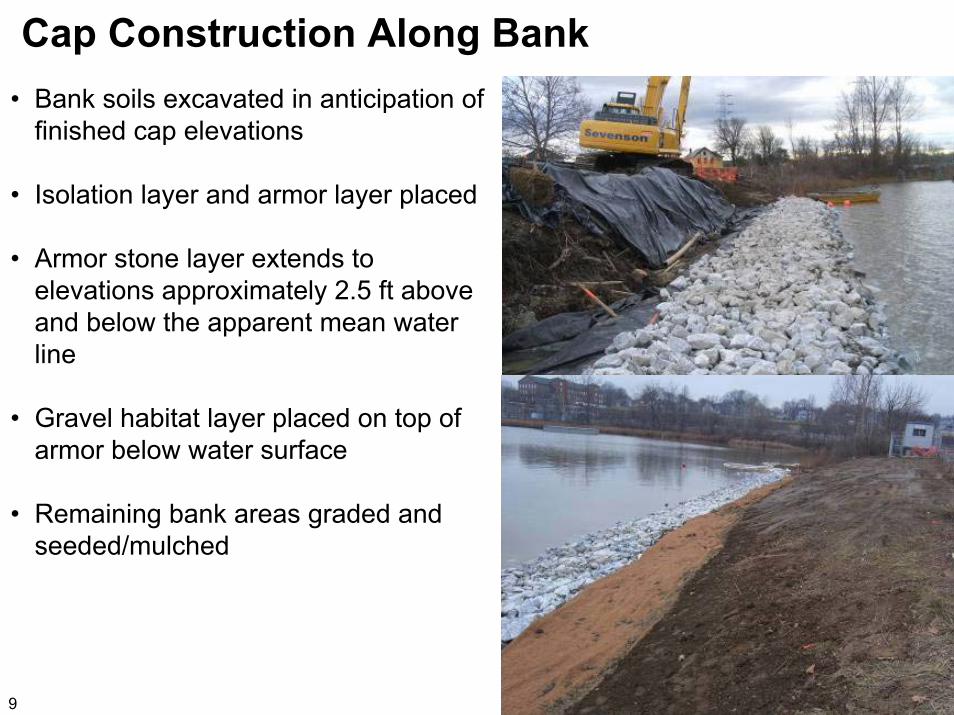
Cap Construction Along Bank• Bank soils excavated in anticipation of
finished cap elevations
• Isolation layer and armor layer placed
• Armor stone layer extends to elevations approximately 2.5 ft above and below the apparent mean water line
• Gravel habitat layer placed on top of armor below water surface
• Remaining bank areas graded and seeded/mulched
10 101711160.ppt
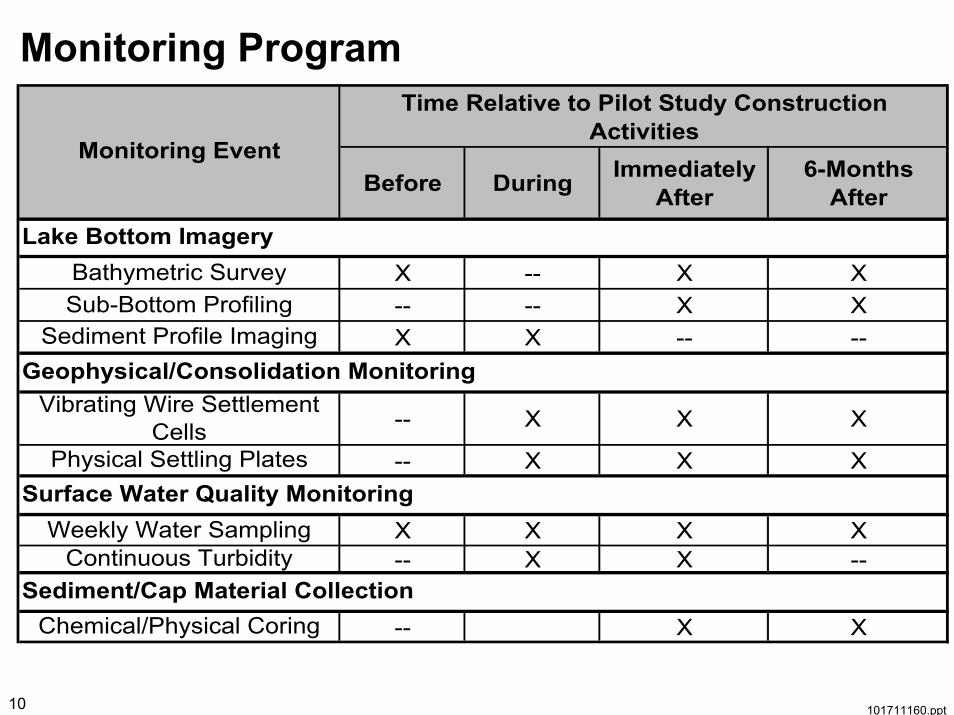
Monitoring Program
Before During Immediately After
6-Months After
X -- X X-- -- X XX X -- --
-- X X X
-- X X X
X X X X-- X X --
-- X X XSediment/Cap Material Collection
Chemical/Physical Coring
Physical Settling PlatesSurface Water Quality Monitoring
Weekly Water SamplingContinuous Turbidity
Sub-Bottom ProfilingSediment Profile Imaging
Geophysical/Consolidation MonitoringVibrating Wire Settlement
Cells
Monitoring Event
Time Relative to Pilot Study Construction Activities
Lake Bottom ImageryBathymetric Survey
11 101711160.ppt
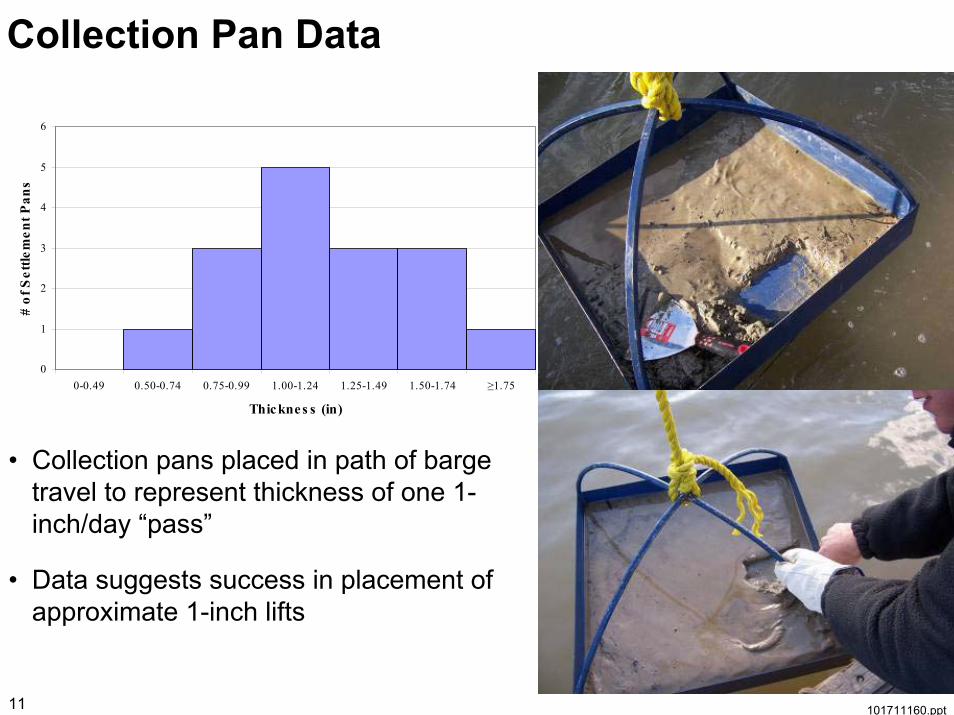
Collection Pan Data
0
1
2
3
4
5
6
0-0.49 0.50-0.74 0.75-0.99 1.00-1.24 1.25-1.49 1.50-1.74 ≥1.75
Thicknes s (in)
# of
Set
tlem
ent P
ans
• Collection pans placed in path of barge travel to represent thickness of one 1-inch/day “pass”
• Data suggests success in placement of approximate 1-inch lifts
12 101711160.ppt
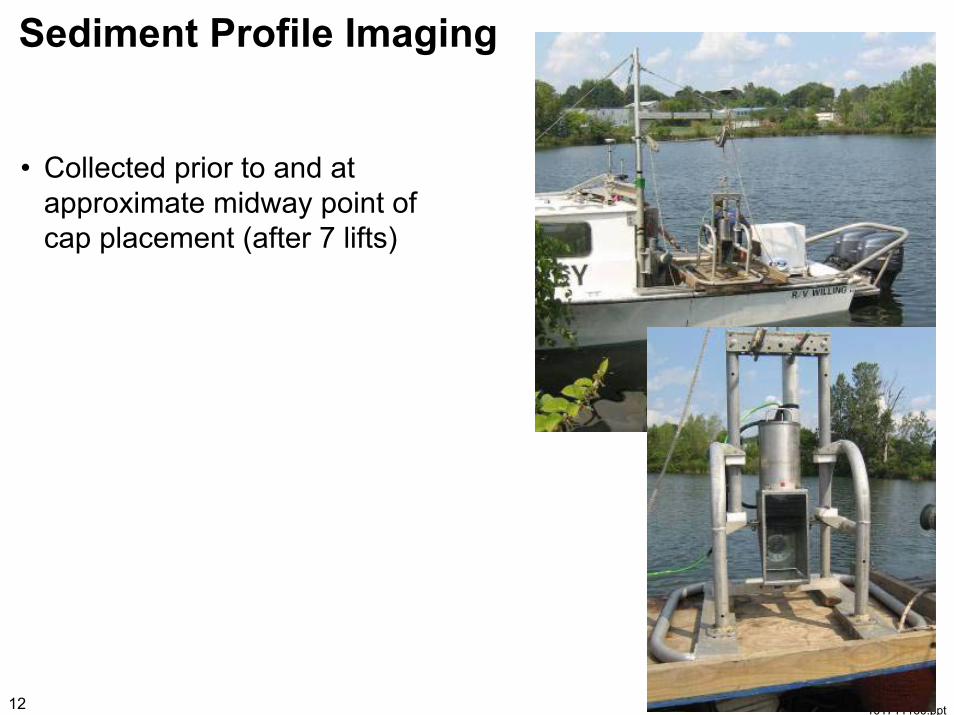
Sediment Profile Imaging
• Collected prior to and at approximate midway point of cap placement (after 7 lifts)
13 101711160.ppt
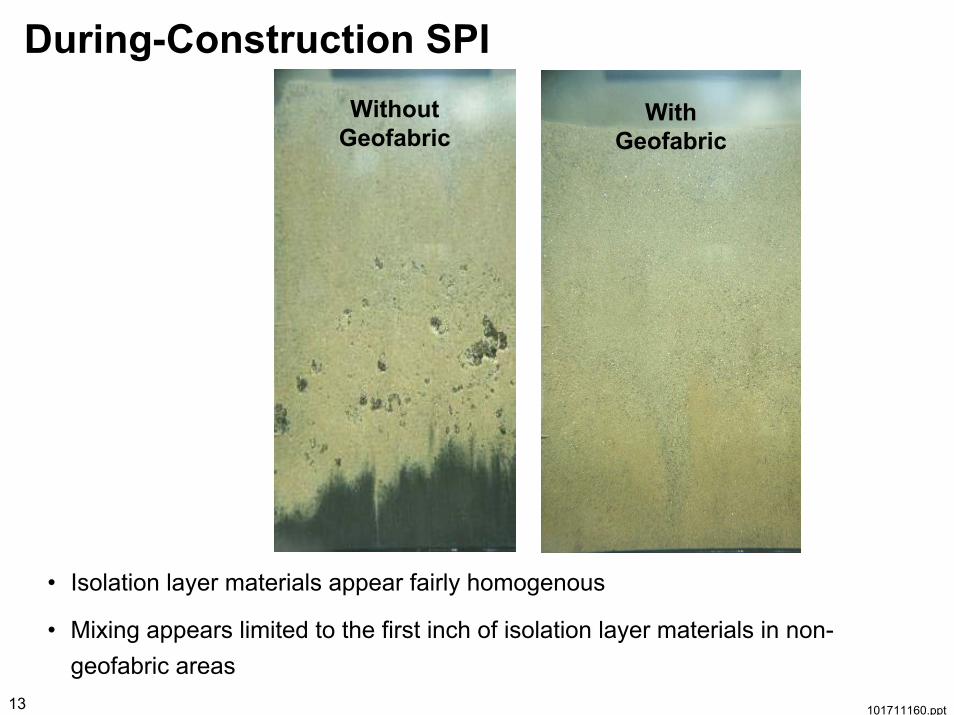
During-Construction SPI Without
GeofabricWith
Geofabric
• Isolation layer materials appear fairly homogenous
• Mixing appears limited to the first inch of isolation layer materials in non-geofabric areas
14 101711160.ppt
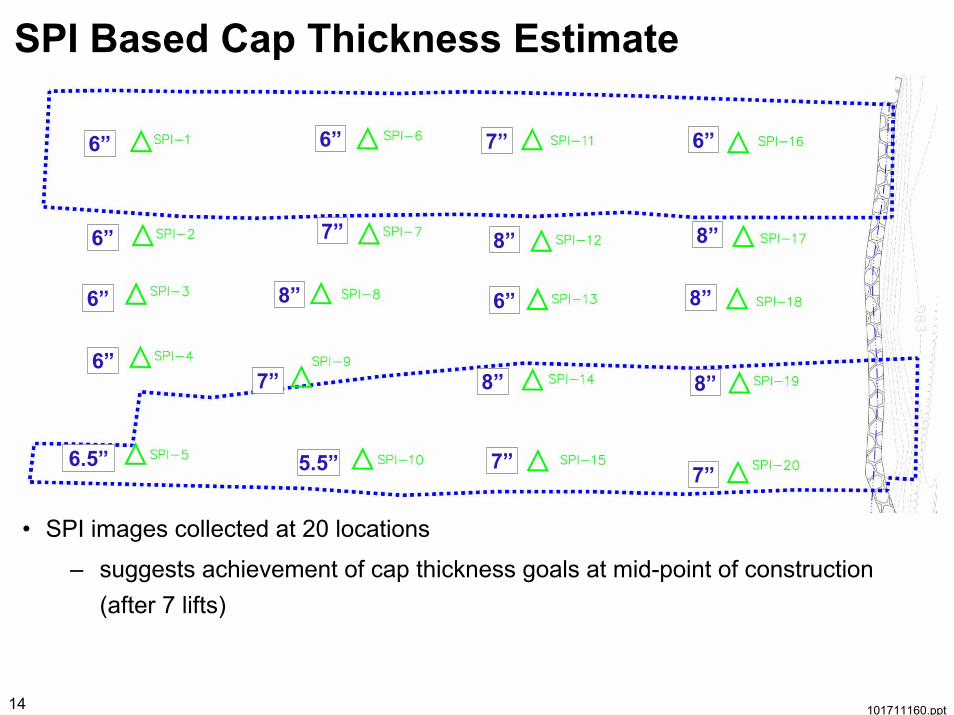
SPI Based Cap Thickness Estimate
• SPI images collected at 20 locations
– suggests achievement of cap thickness goals at mid-point of construction (after 7 lifts)
6”
6”
6”
6”
6.5”
6” 6”
6”
5.5”
7”
7”
7”
7” 7”
8”
8” 8”
8”
8”
8”
15 101711160.ppt
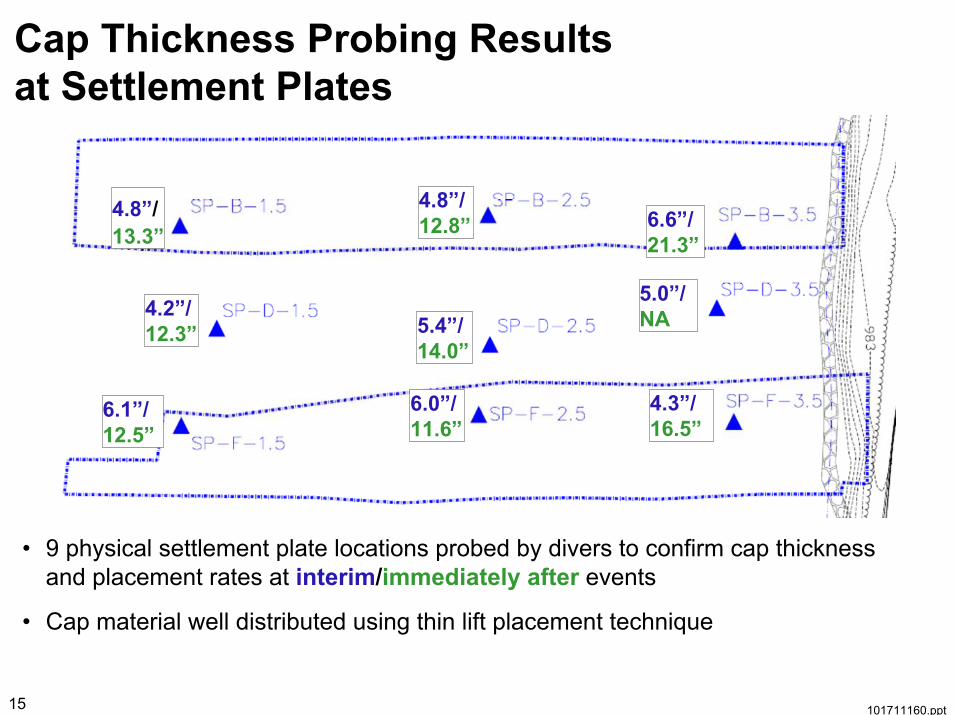
Cap Thickness Probing Results at Settlement Plates
4.8”/13.3”
5.4”/ 14.0”
6.6”/ 21.3”
5.0”/ NA4.2”/
12.3”
6.0”/ 11.6”
4.3”/ 16.5”
6.1”/ 12.5”
4.8”/ 12.8”
• 9 physical settlement plate locations probed by divers to confirm cap thickness and placement rates at interim/immediately after events
• Cap material well distributed using thin lift placement technique
16 101711160.ppt
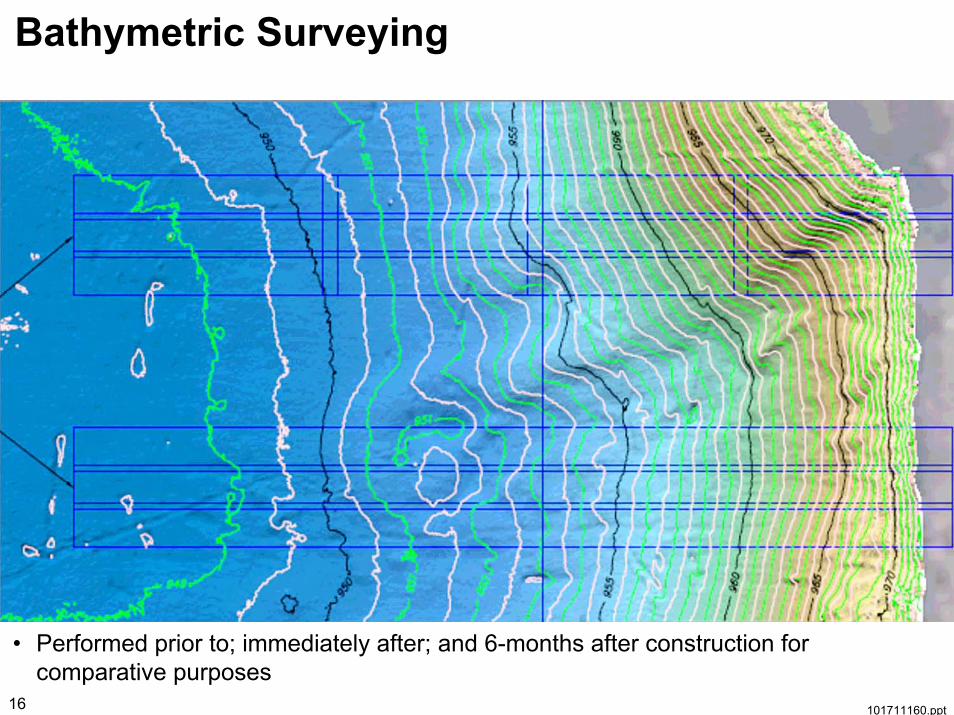
Bathymetric Surveying
• Performed prior to; immediately after; and 6-months after construction for comparative purposes
17 101711160.ppt
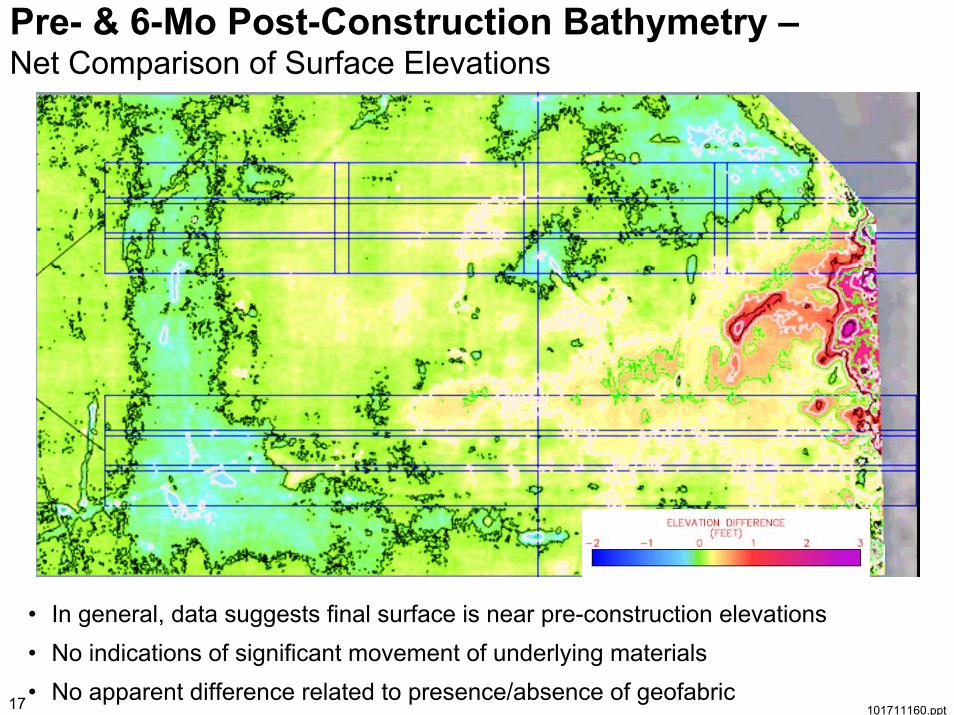
Pre- & 6-Mo Post-Construction Bathymetry –Net Comparison of Surface Elevations
• In general, data suggests final surface is near pre-construction elevations• No indications of significant movement of underlying materials• No apparent difference related to presence/absence of geofabric
18 101711160.ppt
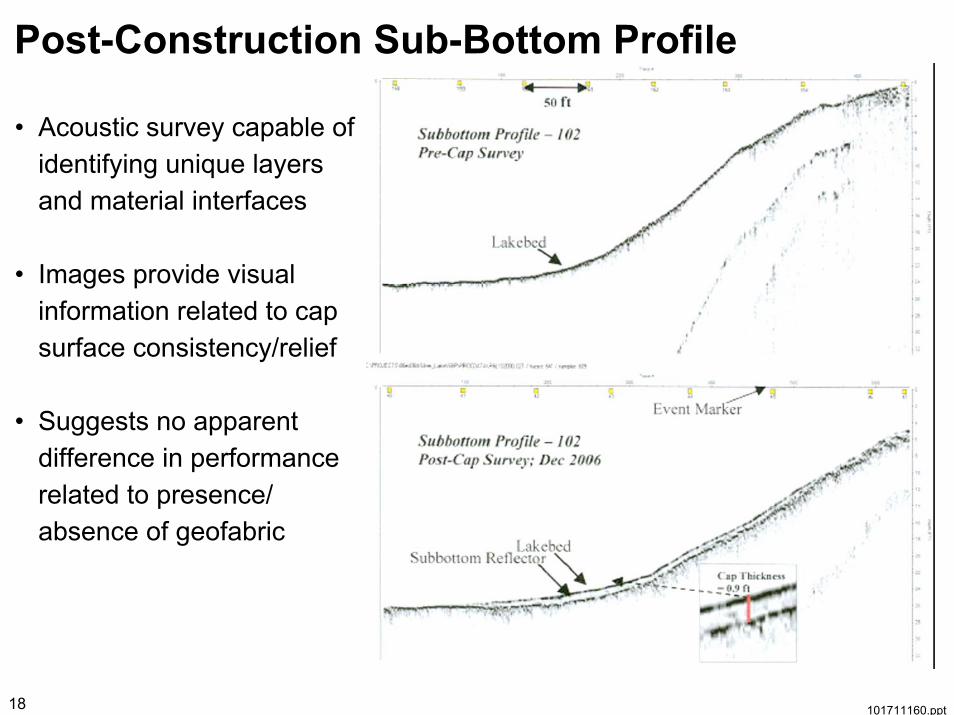
Post-Construction Sub-Bottom Profile
• Acoustic survey capable of identifying unique layers and material interfaces
• Images provide visual information related to cap surface consistency/relief
• Suggests no apparent difference in performance related to presence/ absence of geofabric
19 101711160.ppt
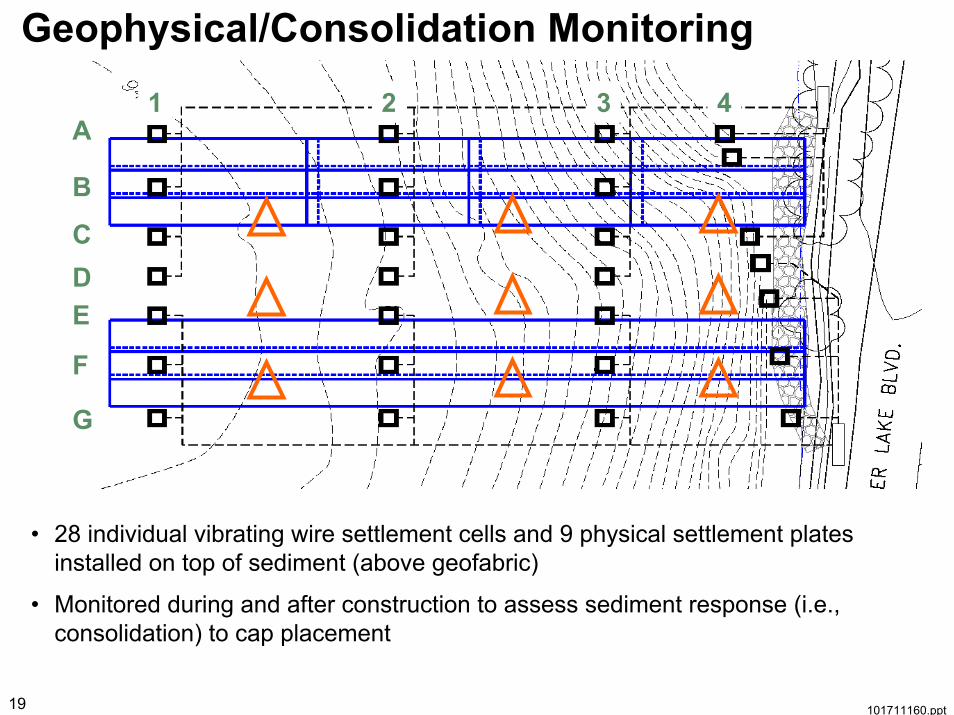
Geophysical/Consolidation Monitoring
1 2 3 4A
B
CDE
F
G
• 28 individual vibrating wire settlement cells and 9 physical settlement plates installed on top of sediment (above geofabric)
• Monitored during and after construction to assess sediment response (i.e., consolidation) to cap placement
20 101711160.ppt
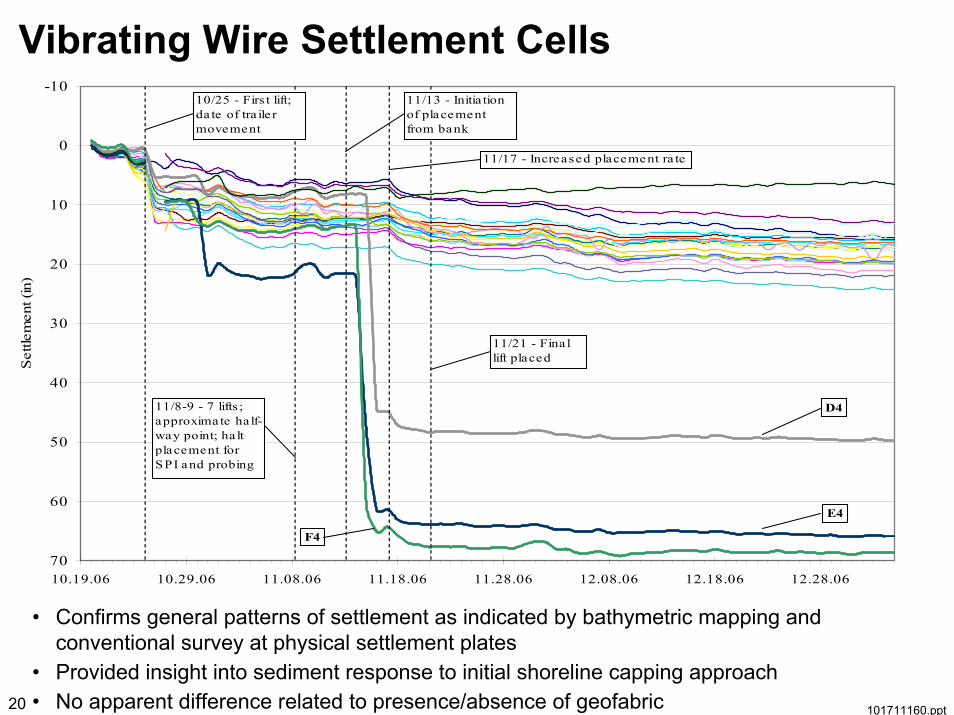
Vibrating Wire Settlement Cells-10
0
10
20
30
40
50
60
7010.19.06 10.29.06 11.08.06 11.18.06 11.28.06 12.08.06 12.18.06 12.28.06
Set
tlem
ent (
in)
D4
E4
F4
10/25 - Firs t lift; da te of tra ile r movement
11/8-9 - 7 lifts ; approximate ha lf-way point; ha lt placement for SPI and probing
11/13 - Initia tion of placement from bank
11/21 - Fina l lift placed
11/17 - Increased placement ra te
• Confirms general patterns of settlement as indicated by bathymetric mapping and conventional survey at physical settlement plates
• Provided insight into sediment response to initial shoreline capping approach• No apparent difference related to presence/absence of geofabric
21 101711160.ppt
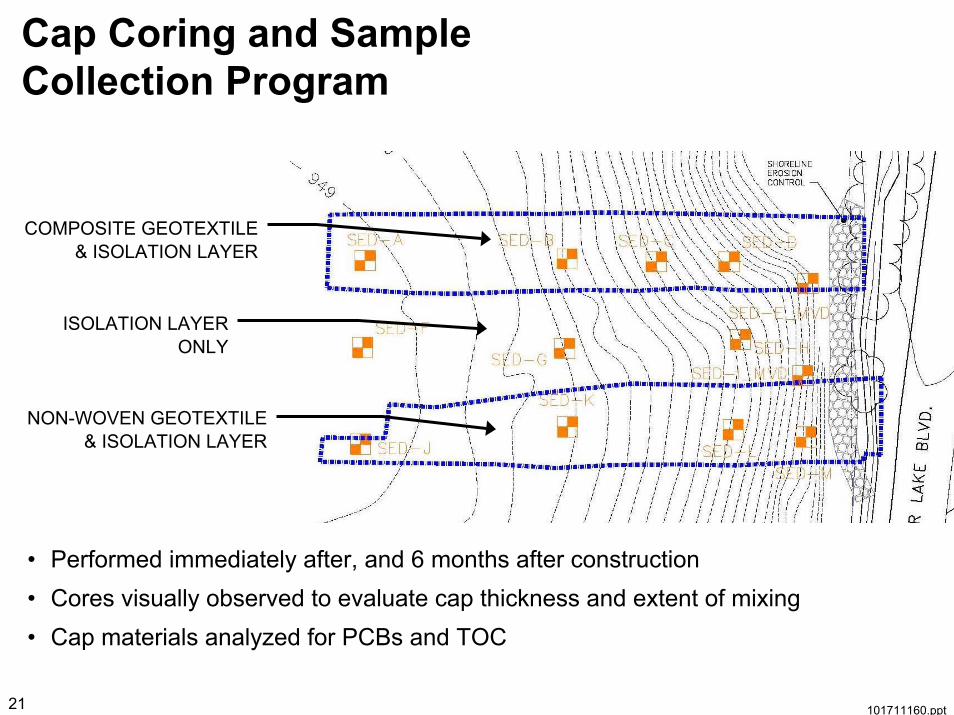
Cap Coring and Sample Collection Program
COMPOSITE GEOTEXTILE& ISOLATION LAYER
ISOLATION LAYERONLY
NON-WOVEN GEOTEXTILE& ISOLATION LAYER
• Performed immediately after, and 6 months after construction• Cores visually observed to evaluate cap thickness and extent of mixing• Cap materials analyzed for PCBs and TOC
22 101711160.ppt
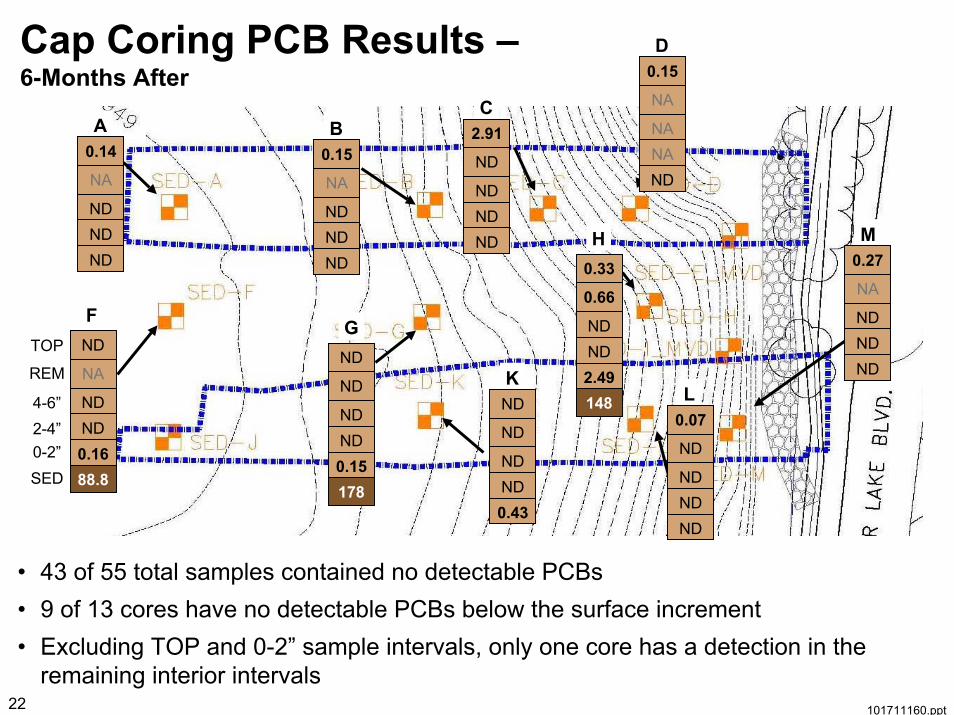
Cap Coring PCB Results –6-Months After
ND
A
NDND
NA
0.14
ND
B
NDND
NA
0.15
ND
C
NDND
ND
2.91
ND
D
NANA
NA
0.15
0.43
K
NDND
ND
ND
0.33
1482.49NDND
0.66
H
ND
1780.15NDND
ND
G
ND
L
NDND
ND
0.07
ND
M
NDND
NA
0.27
ND
88.80.16NDND
NA
FTOP
REM
4-6”2-4”0-2”SED
• 43 of 55 total samples contained no detectable PCBs• 9 of 13 cores have no detectable PCBs below the surface increment• Excluding TOP and 0-2” sample intervals, only one core has a detection in the
remaining interior intervals
23 101711160.ppt
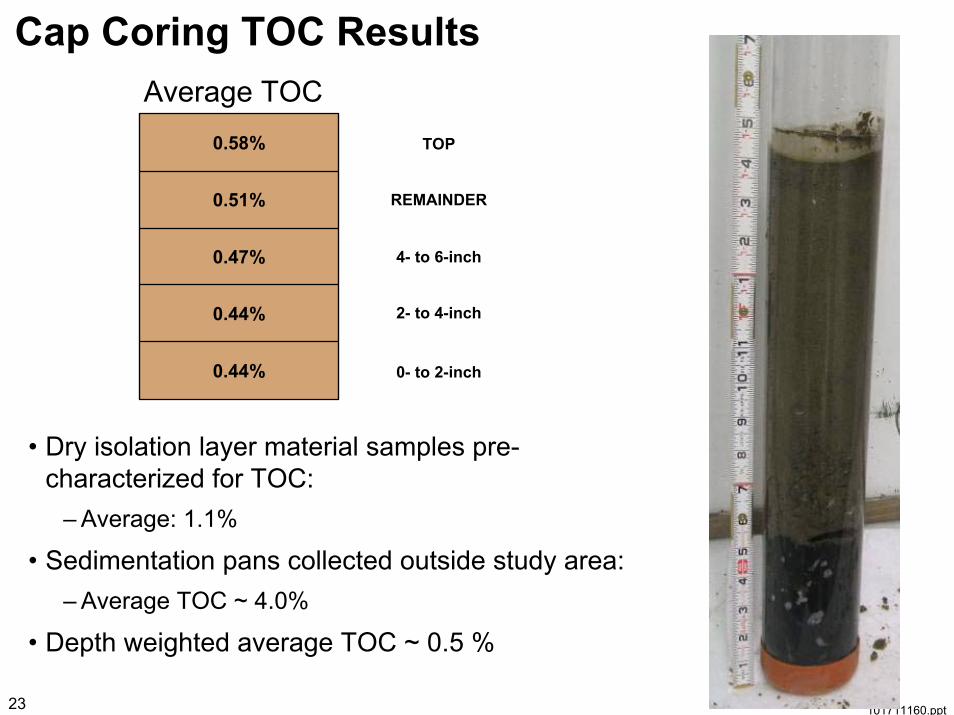
Cap Coring TOC Results
REMAINDER
2- to 4-inch
0- to 2-inch
4- to 6-inch
TOP
• Dry isolation layer material samples pre-characterized for TOC:
– Average: 1.1%
• Sedimentation pans collected outside study area:– Average TOC ~ 4.0%
• Depth weighted average TOC ~ 0.5 %
0.47%
0.51%
0.44%
0.44%
0.58%
Average TOC
24 101711160.ppt
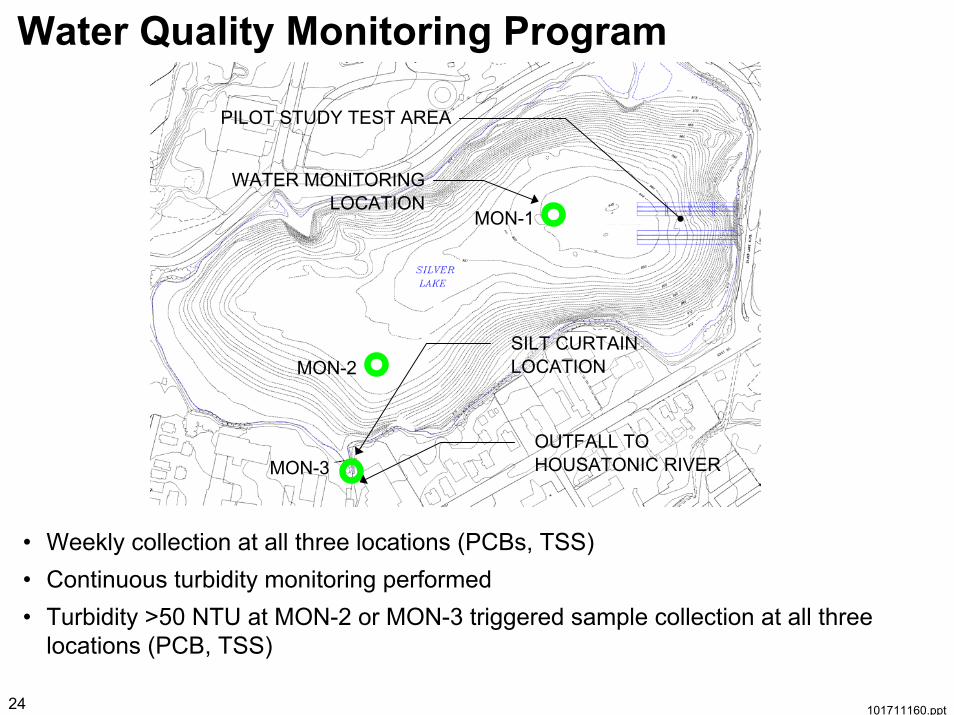
Water Quality Monitoring Program
PILOT STUDY TEST AREA
WATER MONITORINGLOCATION
SILT CURTAIN LOCATION
OUTFALL TO HOUSATONIC RIVER
MON-1
MON-2
MON-3
• Weekly collection at all three locations (PCBs, TSS)• Continuous turbidity monitoring performed• Turbidity >50 NTU at MON-2 or MON-3 triggered sample collection at all three
locations (PCB, TSS)
25 101711160.ppt
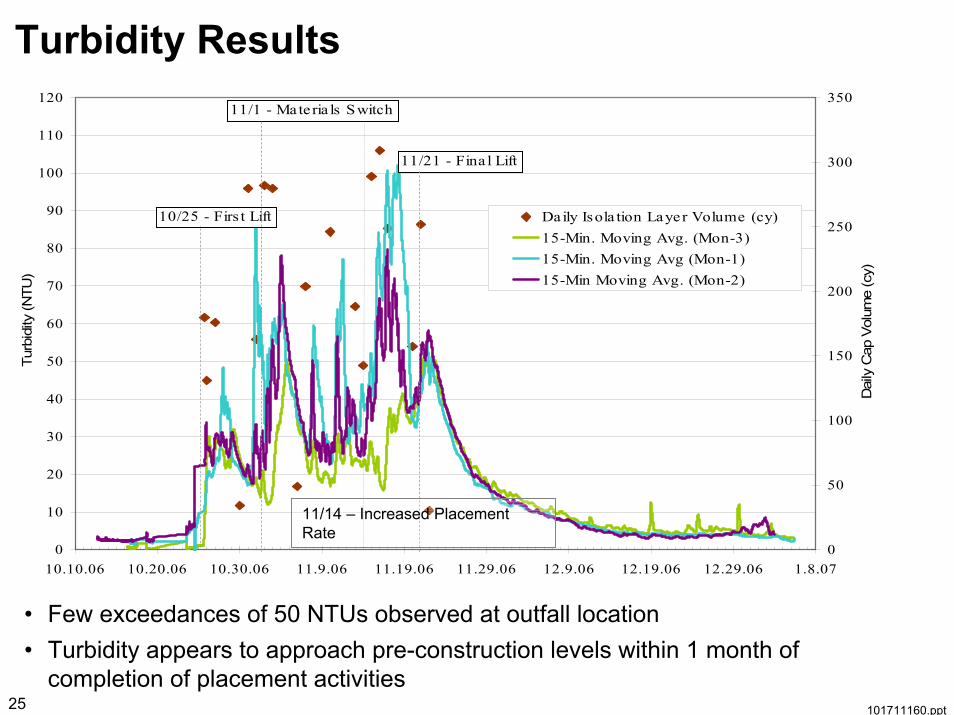
Turbidity Results
0
10
20
30
40
50
60
70
80
90
100
110
120
10.10.06 10.20.06 10.30.06 11.9.06 11.19.06 11.29.06 12.9.06 12.19.06 12.29.06 1.8.07
Turb
idity
(NTU
)
0
50
100
150
200
250
300
350
Dai
ly C
ap V
olum
e (c
y)
Daily Isola tion Layer Volume (cy)15-Min. Moving Avg. (Mon-3)15-Min. Moving Avg (Mon-1)15-Min Moving Avg. (Mon-2)
10/25 - Firs t Lift
11/21 - Fina l Lift
11/1 - Mate ria ls Switch
11/14 – Increased Placement Rate
• Few exceedances of 50 NTUs observed at outfall location • Turbidity appears to approach pre-construction levels within 1 month of
completion of placement activities
26 101711160.ppt
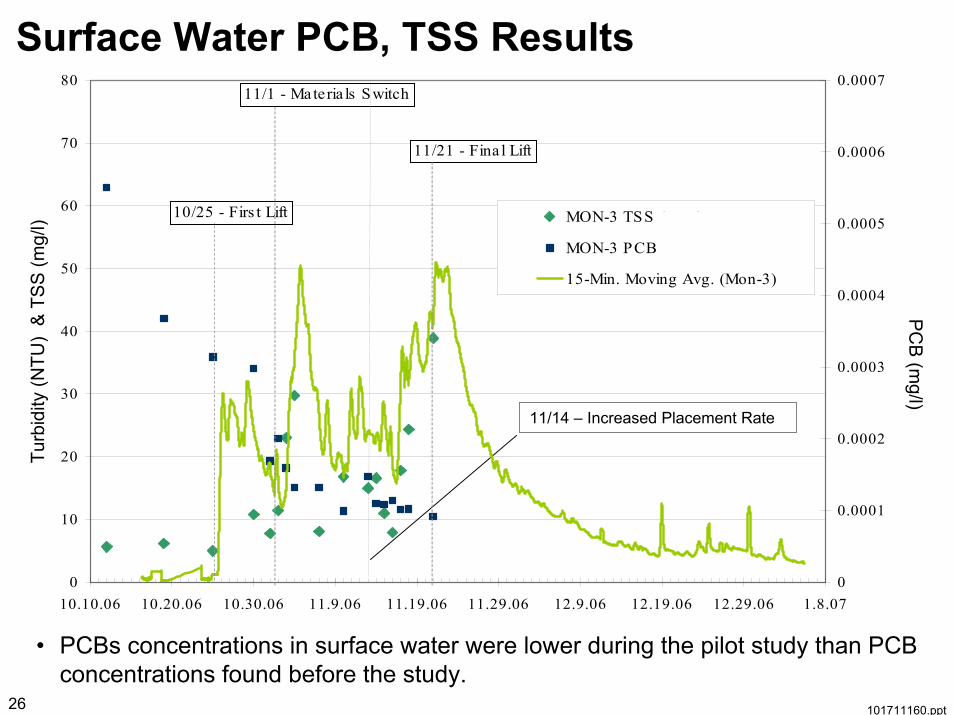
Surface Water PCB, TSS Results
11/14 – Increased Placement Rate
Turb
idity
(NTU
) &
TS
S (m
g/l)
PC
B (m
g/l)
0
10
20
30
40
50
60
70
80
10.10.06 10.20.06 10.30.06 11.9.06 11.19.06 11.29.06 12.9.06 12.19.06 12.29.06 1.8.070
0.0001
0.0002
0.0003
0.0004
0.0005
0.0006
0.0007
MON-3 TSS (ppm)
MON-3 PCB (ppm)
15-Min. Moving Avg. (Mon-3)
10/25 - Firs t Lift
11/21 - Fina l Lift
11/1 - Materia ls Switch
• PCBs concentrations in surface water were lower during the pilot study than PCB concentrations found before the study.

27 101711160.ppt
Pilot Study Objectives & Conclusions• Assess potential for physical mixing of sediments and
isolation layer materials as a result of cap placement
– Minimal mixing observed at the sediment/cap interface only• appears limited to the first 1- to 2-inches of isolation layer
material
• where detected, PCB concentrations 1 to 3 orders of magnitude below that of underlying sediment
• Evaluate effectiveness of employing geotextile in cap configuration
– No significant differences noted between geofabric and non-geofabric areas based on physical or analytical data
28 101711160.ppt
Pilot Study Objectives & Conclusions (cont’d)
• Evaluate constructability issues related to placement of isolation layer materials in thin lifts– Generally successful from barge with fabricated spreader-box
– Important to use appropriate near-shore placement methods
• Evaluate physical response of soft sediments to cap and armor stone placement– With exception of near-shore areas, settling observed to be fairly
uniform in time and space
– Majority of locations exhibited settlement within 1- to 2-ft range
29 101711160.ppt
Pilot Study Objectives & Conclusions (cont’d)
• Assess potential for water quality impacts during cap placement
– Short-term increased turbidity observations related to isolation layer placement
– No increase in surface water PCB concentrations observed
30 101711160.ppt
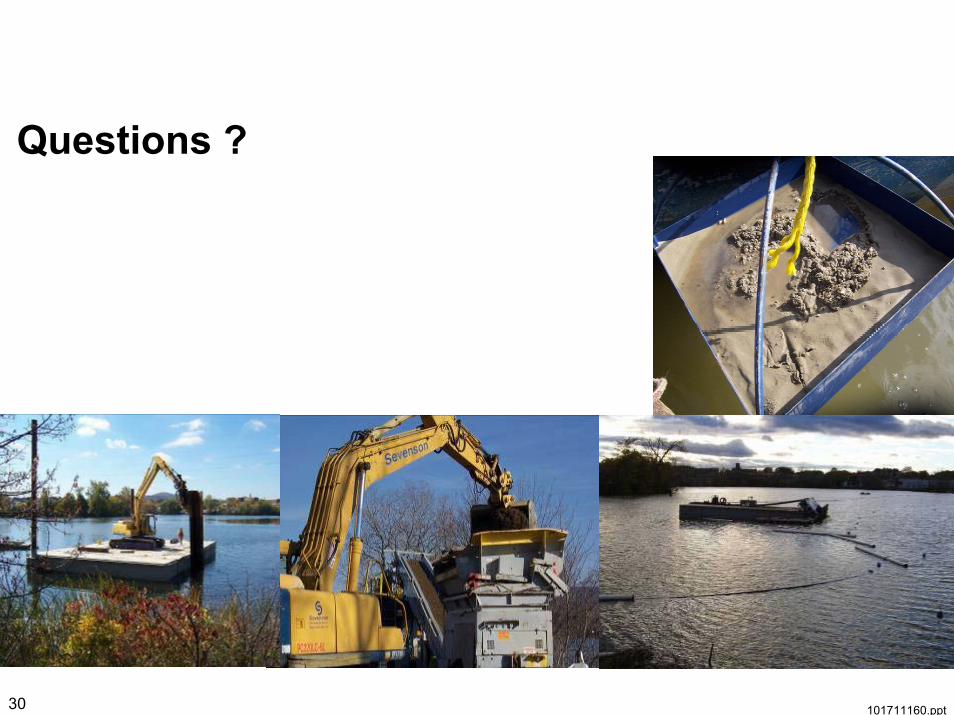
Questions ?