Embed Size (px)
DESCRIPTION
Cities in the Developing World. Ed Glaeser Harvard University. “I regard the growth of cities as an evil thing, unfortunate for mankind and the world. ”. Poor (under $1200 p.c.), Populous Countries that are one-third urban,. The Strength of Urban Poverty?. - PowerPoint PPT Presentation
Citation preview
Cities in the Developing World
Ed GlaeserHarvard University

“I regard the growth of cities as an evil thing, unfortunate for mankind and the world. ”
Congo, Dem. Rep.
Burundi
Liberia
NigerMalawi
Mozambique
Sierra LeoneCentral African Republic
Afghanistan
Uganda
Tanzania
Rwanda
Togo
Nepal
Gambia, The
ZimbabweMali
Haiti
Bangladesh
Benin
KenyaCambodia
Tajikistan
Kyrgyz Republic
Lesotho
Pakistan
SenegalMauritania
Cameroon
Lao PDR
Cote d'Ivoire
Vietnam
Zambia
Yemen, Rep.
Ghana
Papua New Guinea
India
Nicaragua
Sudan
Moldova
Bolivia
HondurasPhilippines
Mongolia
Sri Lanka
Iraq
Egypt, Arab Rep.
MoroccoParaguay
Guatemala
Syrian Arab Republic
Indonesia
Congo, Rep.
UkraineArmeniaEl Salvador
Swaziland
Albania
EcuadorTunisia
Jordan
China
Algeria
ThailandNamibia
Jamaica
Dominican Republic
PeruColombiaBulgaria
South AfricaBotswana
Mauritius
Panama
Romania
Costa Rica
Malaysia
Gabon
Kazakhstan
Argentina
Mexico
TurkeyRussian Federation
Latvia
Brazil
Lithuania
Uruguay
Poland
Chile
Hungary
Croatia
Venezuela, RB
Estonia
Trinidad and Tobago
Slovak Republic
Saudi Arabia
Bahrain
Czech Republic
Korea, Rep.
Portugal
Slovenia
Greece
Israel
Cyprus
Spain
Hong Kong SAR, China
New Zealand
Italy
United Kingdom
France United Arab Emirates
Germany
SingaporeBelgium
Japan
Finland
Austria
Kuwait
Ireland
CanadaUnited StatesNetherlandsSweden
AustraliaDenmark
Switzerland
Qatar
NorwayLibya
Iran, Islamic Rep.
Cuba
Myanmar
0.2
.4.6
.81
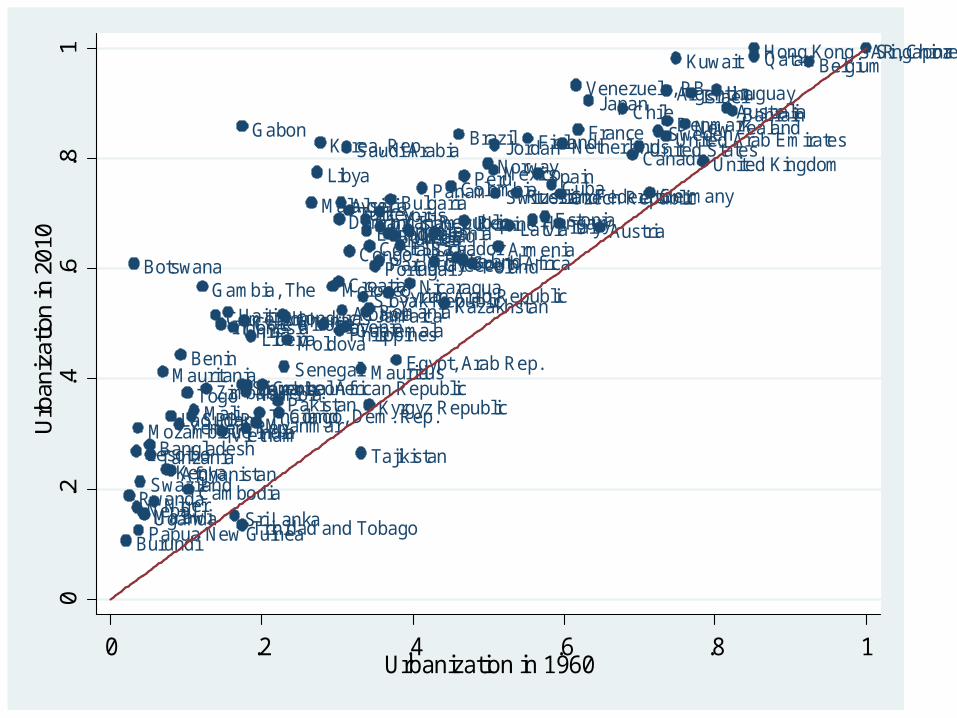
Urb
aniz
atio
n in
201
0
0 .2 .4 .6 .8 1Urbanization in 1960

0.2
.4.6
.81
Shar
e U
rban
ized
$0-1000 $1000-2000 $2000-3000 $3000-4000 $4000-5000
Source: World Bank
Share of Countries over 1/3 Urbanized, by GDP per Capita (2012 $)1960 and 2010
1960 2010

Country Largest City(Population)
Percent Urbanized
Percent in Million+ Agglomeration>
GDP P.C. 2010$(PPP Adjusted)
Congo(Dem. Rep)
Kinshasa(9 Million) .34 .17
210(330)
ZimbabweHarare(1.6-2.8 Million) .38 .12
625(missing)
MaliBamako(1.8 million) .34 .13
650(1100)
HaitiPort-au-Prince(1 – 2.4 Million) .52 .21
700(1000)
PakistanKarachi(23.5 Million) .36 .19
1100(2400)
SenegalDakar(1-2.5 Million) .42 .24
1100(1700)
Poor (under $1200 p.c.), Populous Countries that are one-third urban,
Congo, Dem. Rep.
MozambiqueAfghanistan
UgandaTanzania Nepal
Mali
BangladeshKenya
Cambodia
Pakistan
Cameroon Vietnam
Yemen, Rep.
Ghana
India
Sudan
Philippines
Sri Lanka
Iraq
Egypt, Arab Rep.
Morocco
IndonesiaChina
Algeria
Thailand
PeruColombia
Bulgaria
South Africa
Romania
Malaysia
Argentina
Mexico
Turkey
Brazil Poland
Chile
Hungary
Venezuela, RB
Korea, Rep.
Portugal
Greece
SpainItaly
United Kingdom
France
Germany
Belgium
JapanAustriaCanada United States
Netherlands
Sweden
Australia
Switzerland
Iran, Islamic Rep.
Cuba
Myanmar
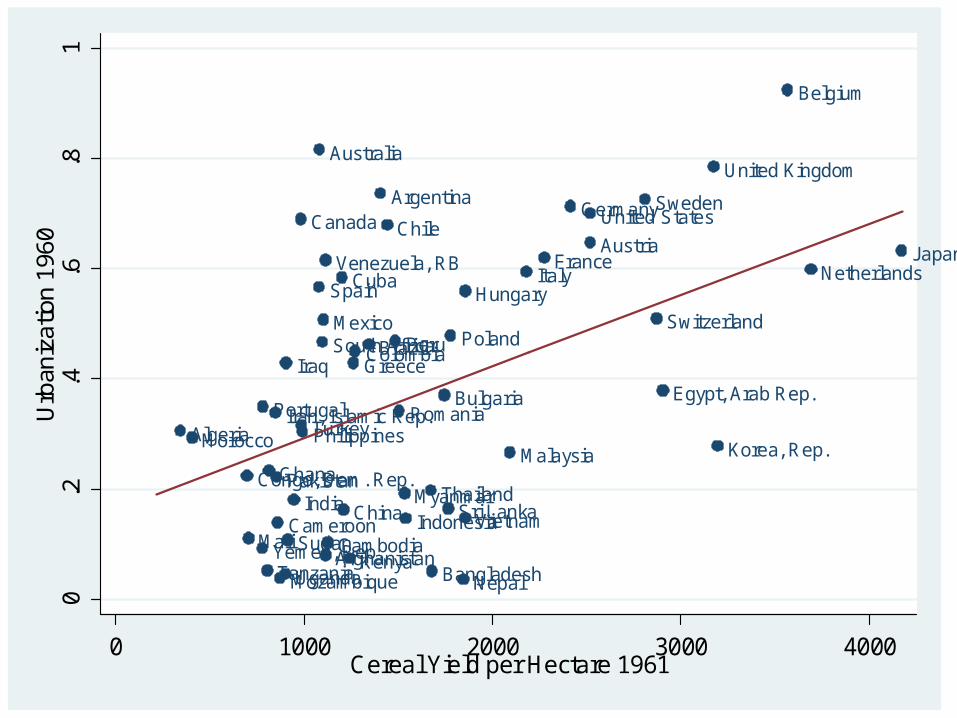
0.2
.4.6
.81
Urb
aniz
atio
n 19
60
0 1000 2000 3000 4000Cereal Yield per Hectare 1961
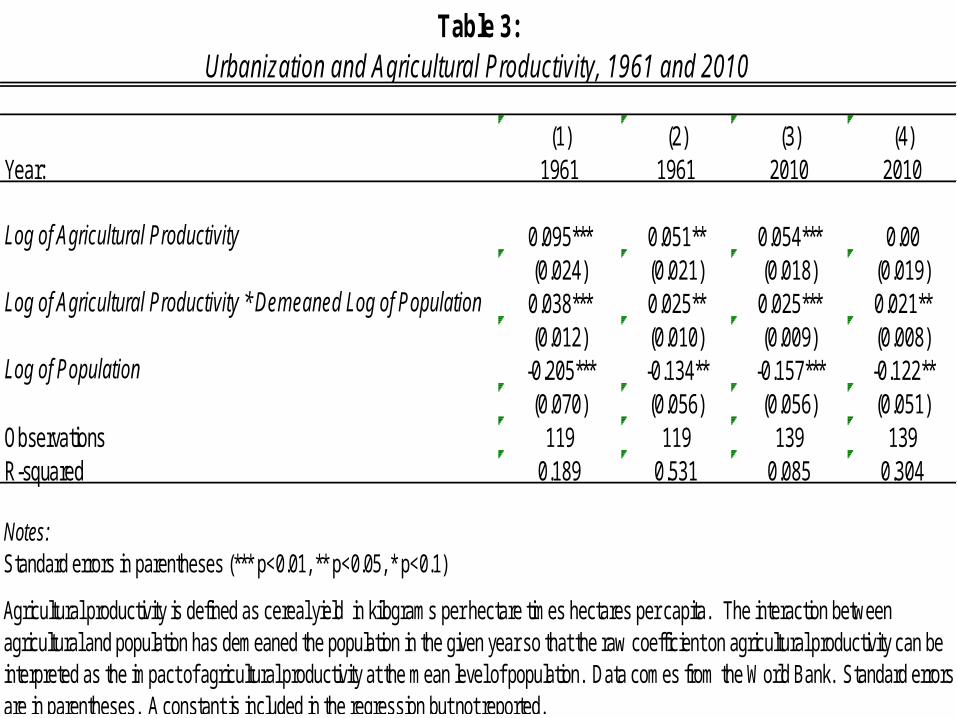
(1) (2) (3) (4)Year: 1961 1961 2010 2010
Log of Agricultural Productivity 0.095*** 0.051** 0.054*** 0.00(0.024) (0.021) (0.018) (0.019)
Log of Agricultural Productivity * Demeaned Log of Population 0.038*** 0.025** 0.025*** 0.021**(0.012) (0.010) (0.009) (0.008)
Log of Population -0.205*** -0.134** -0.157*** -0.122**(0.070) (0.056) (0.056) (0.051)
Observations 119 119 139 139R-squared 0.189 0.531 0.085 0.304
Notes:Standard errors in parentheses (*** p<0.01, ** p<0.05, * p<0.1)
Agricultural productivity is defined as cereal yield in kilograms per hectare times hectares per capita. The interaction between agricultural and population has demeaned the population in the given year so that the raw coefficient on agricultural productivity can be interpreted as the impact of agricultural productivity at the mean level of population. Data comes from the World Bank. Standard errors are in parentheses. A constant is included in the regression but not reported.
Table 3:Urbanization and Agricultural Productivity, 1961 and 2010

The Strength of Urban Poverty?

Rwanda
MaliGhana
India
Moldova
Iraq
Egypt, Arab Rep.Morocco
Guatemala
Indonesia
Ukraine
Thailand
Bulgaria
South Africa
RomaniaMalaysia
Argentina
Mexico
Russian FederationBrazil
Uruguay
Poland
Slovenia
CyprusSpain
New ZealandItaly
United KingdomFrance
Germany
Japan
Finland
CanadaUnited StatesNetherlands
Sweden
AustraliaNorway
-.1
0.1
.2U
rban
-Rur
al H
appi
ness
4 6 8 10 12Log of Per Capita GDP
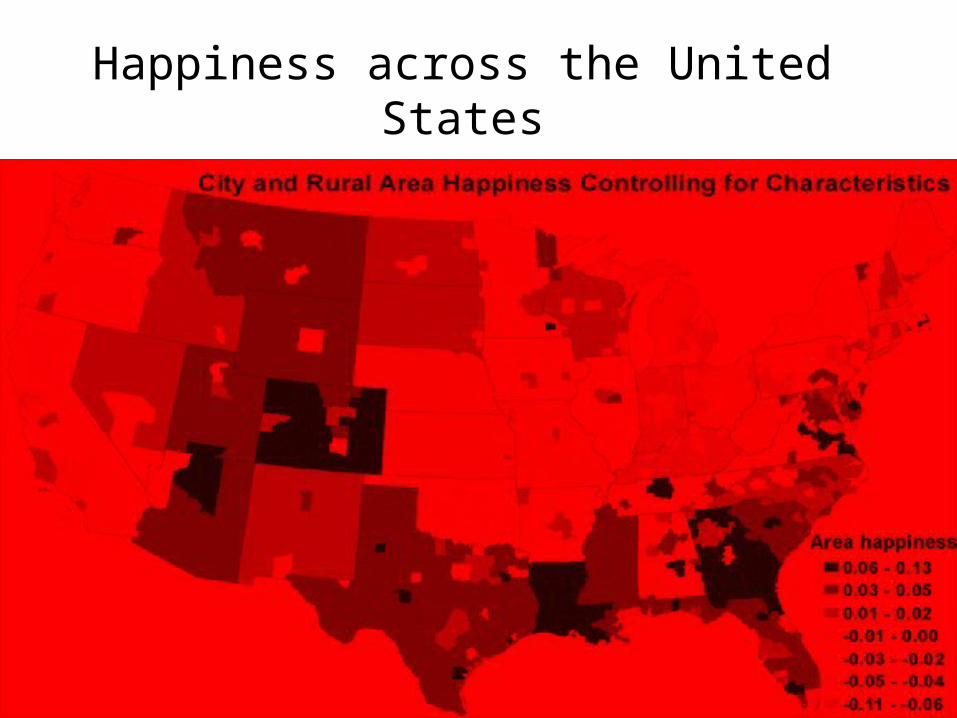
Happiness across the United States
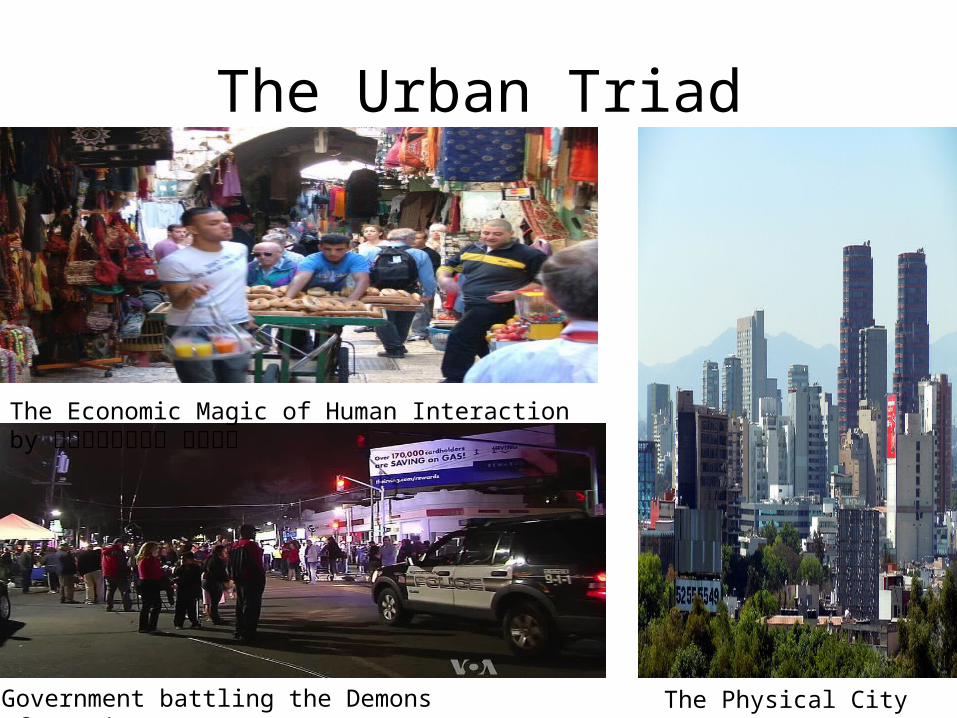
The Urban Triad
The Physical City by rultoGovernment battling the Demons of Density
The Economic Magic of Human Interaction by חדוה שנדרוביץ

67
89
1011
0 .2 .4 .6 .8 1% Urbanization, 2010
Log of P.C. GDP 2010 PPP Fitted values
1 2 3 4 50.9
0.95
1
1.05
1.1
1.15
1.2
1.25
1.3
1.35
1.4
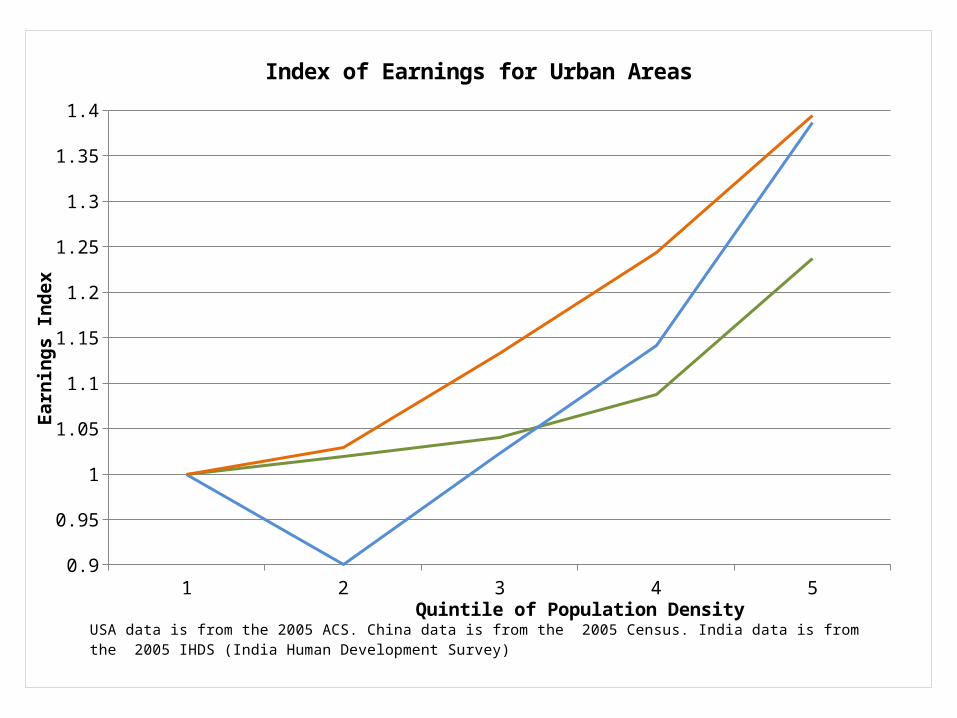
Index of Earnings for Urban Areas
US India China
Quintile of Population Density
Earn
ings
Inde
x
USA data is from the 2005 ACS. China data is from the 2005 Census. India data is from the 2005 IHDS (India Human De -velopment Survey)

Do Cities Increase Productivity?
• Random Shocks to Location for Individuals– Roots in the individual fixed effect literature– Similarities with Randomizing Across Peers– Doesn’t deal with omitted place level factors
• Random Shocks to the Density Level– If long term, these must be orthogonal to current productivity
(Combes et al. 2010)– Or taking advantage of high frequency variation (Greenstone,
Hornbeck, Moretti)• An alternative is to estimate the flow of ideas within a
network (Duflo and Saez, 2003)• Real estate prices as a sign of WTP for proximity
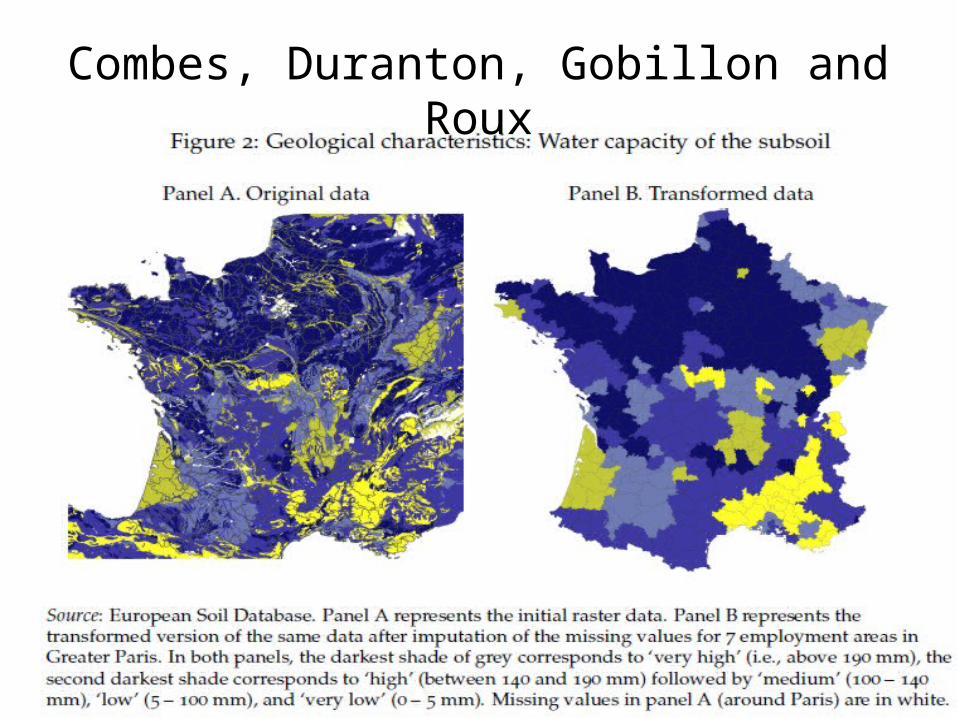
Combes, Duranton, Gobillon and Roux
0.0
5.1
.15
Avera
ge
Po
pu
lation
Gro
wth
by C
oun
ty, 2
000
-20
10
1 2 3 4 5
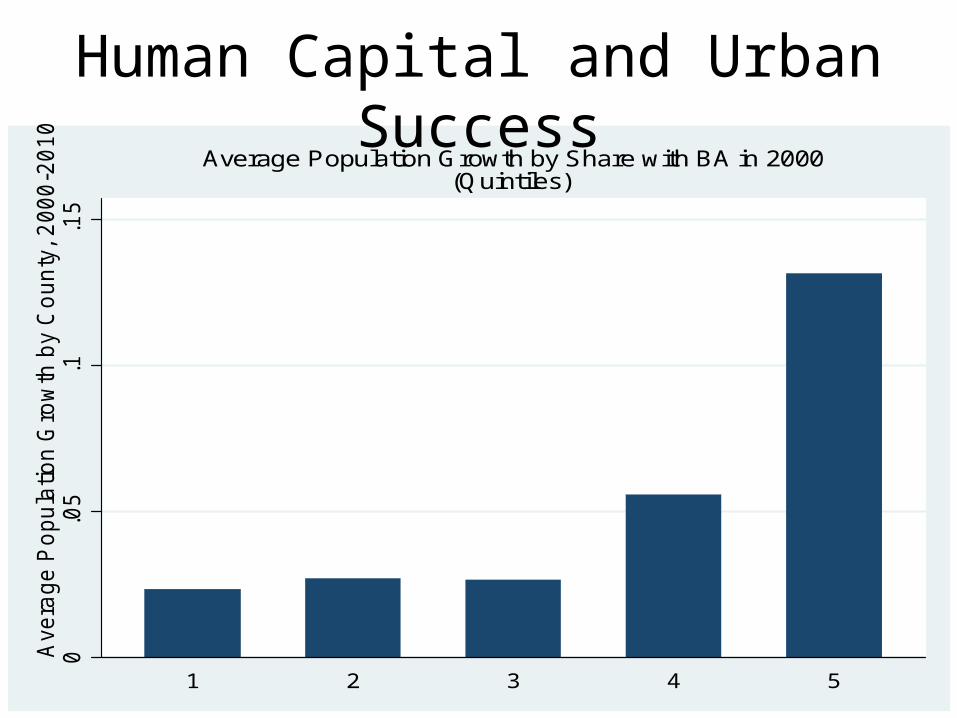
Average Population Growth by Share with BA in 2000(Quintiles)
Human Capital and Urban Success
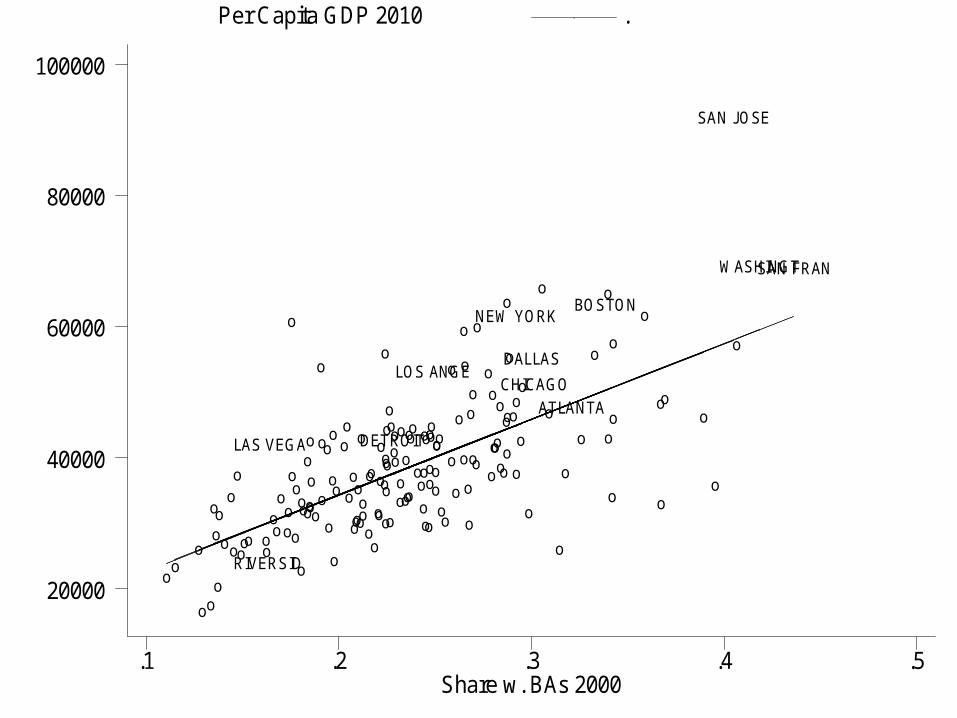
Share w. BAs 2000
Per Capita GDP 2010 .
.1 .2 .3 .4 .5
20000
40000
60000
80000
100000
o
o
o
oo
o
o
oo
o
o oo
oo
o
oo
o oo
o
ooo
o
o
o
o
o
o
oo
o
oo
o
o
o
o
o
o
o
o
o
o
o
o
o
o
o
o
o
o
o
o
DETROITo
o o
o
o o
oo
o
o
oo
o
o
o
o
o
o
o
oo
o
o
o
o
o
o
o
o
o
o
o o
o
o
o o
oATLANTA
oo
o oo
o
oo
o
o
o
o
o
o
o
o
o
o
o
o
o
CHICAGO
oo
o
BOSTON
o
oo
o
o
o
o
o
o
DALLAS
oo
o
o
o
o
oo
o
NEW YORK
RIVERSID
o
LAS VEGA o
o
o
oo
o
o
o
SAN FRAN
o
o
o
o
oo
LOS ANGE
o
o
o
o
o
o
o
SAN JOSE
o
o
o
WASHINGT
o
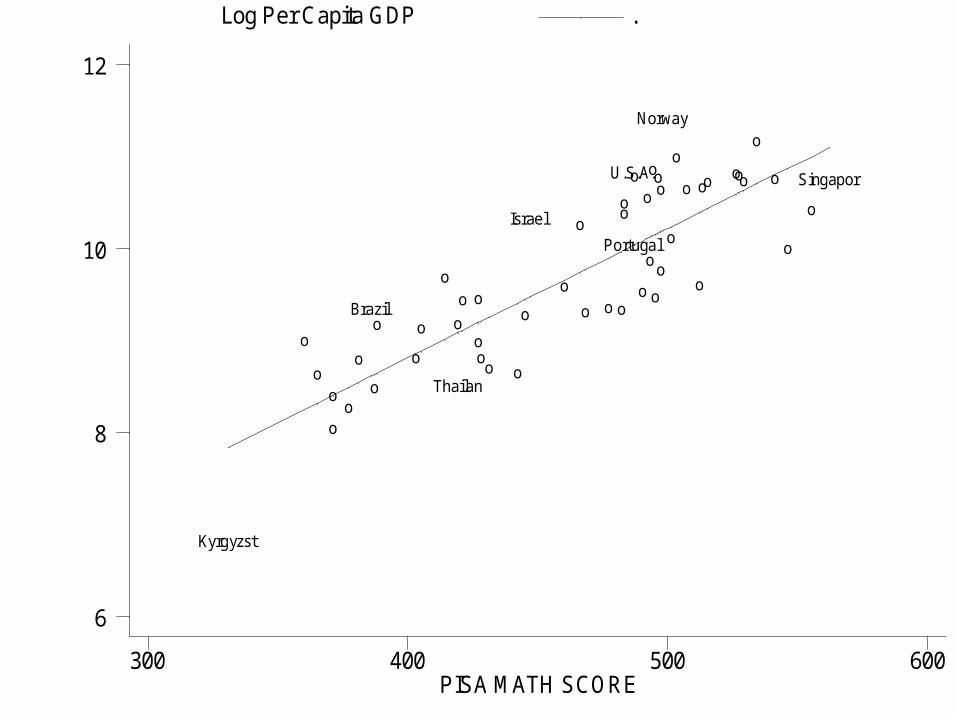
PISA MATH SCORE
Log Per Capita GDP .
300 400 500 600
6
8
10
12
Kyrgyzst
o
oo
oo
o
Brazil
o
o
o
o
o
o
Thailan
o
o
o
oo o
o
Israel
o
o
o o o
oo
oU.S.A.
Portugal
o
o
o
o
o
o
o
o
Norway
o
o
o
o
ooooo
o
o
o
o
Singapor

1 2 3 4 50.5
1
1.5
2
2.5
3
Index of Earnings for Urban Areas
China India USA
Quintile of Years of Education
Earn
ings
Inde
x
US data is from the 2000 IPUMS. India data is from the 2001 Census. Chinese data is from the Household Survey Income Project of 2002.

4
8
14
13131313131313
0
88888888
20
7
0
22
11
5
11
16
24
0
3
1717171717
0
00
8
2121
131313
9
29
10
0
0
14
2121212121212121212121
(20,29](13,20](8,13][0,8]No data
Relocation of Departments in the 50s(joint with Lu Ming)

Beijing
Tianjin
ShijiazhuangTangshan
Qinhuangdao
HandanXingtai Baoding
Zhangjiakou
Cangzhou
LangfangHengshuiTaiyuan
Datong
Yangquan
ChangzhiJincheng
Shuozhou
JinzhongYuncheng
Xinzhou
LinfenLvliang
Shanghai
Nanjing
Wuxi
Xuzhou
Changzhou
Suzhou
Nantong
Huaian
Yangzhou
Zhenjiang
TaizhouSuqian
Hangzhou Ningbo
Wenzhou
JiaxingHuzhou
ShaoxingJinhua
Quzhou
ZhoushanTaizhou
Lishui
Hefei
Wuhu
Bengbu
MaanshanTongling
Anqing
Huangshan
Chuzhou
Fuyang
SuzhouChaohu
Liuan
Chizhou
Xuancheng
Xiamen
Putian
Sanming
Quanzhou
Zhangzhou
Nanping
LongyanNingde
NanchangJingdezhen
PingxiangJiujiang
XinyuYingtan
Ganzhou
Jian
Yichun
Fuzhou
Shangrao
Jinan
Qingdao
Zibo
Zaozhuang
DongyingYantai
Weifang
JiningTaian
Weihai
Rizhao
LaiwuLinyi
DezhouLiaocheng
Binzhou
HezeZhengzhou
KaifengLuoyang
PingdingshanAnyang
Hebi
XinxiangJiaozuo
PuyangXuchang
Luohe
Sanmenxia
NanyangShangqiu
XinyangZhoukouZhumadian
WuhanHuangshiShiyan
YichangXiangfan
Jingmen
Xiaogan
JingzhouHuanggang
Xianning
Suizhou
ChangshaZhuzhou
Xiangtan
HengyangShaoyang
YueyangChangde
Zhangjiajie
Yiyang
ChenzhouYongzhouHuaihua
Loudi
GuangzhouShaoguan
ShenzhenShantou
Foshan
Jiangmen
Zhanjiang
Maoming
Zhaoqing
Huizhou
Meizhou
Heyuan
YangjiangQingyuan
Dongguan
ZhongShan
Chaozhou
JieyangYunfu
Nanning
Liuzhou
GuilinWuzhou
BeihaiGuigang
Yulin
Hezhou
Hechi
Laibin
Chongzuo
Haikou
Sanya
ChongqingChengdu
ZigongLuzhou
Deyang MianyangGuangyuan Suining
Leshan
Nanchong
Meishan
Yibin
Guangan
DazhouYaanBazhong
Ziyang Kunming
Qujing
YuxiBaoshan
XianTongchuanBaoji
Xianyang
WeinanYanan
HanzhongYulin
Ankang
Shangluo
LanzhouBaiyin
TianshuiPingliangQingyang
AnshunLongnan
Guyuan
02
46
8E
stim
ate
d P
opu
lation
Gro
wth
(M
ing--
201
0)
0 .5 1 1.5 2 2.5# of Jinshi in Ming/Bianhu
Joint with Yueran Ma

Chinitz: Contrasts in Agglomeration: New York and Pittsburgh
0.5
11.
52
Ave
rage
Pe
rcen
t Gro
wth
in E
mpl
oym
ent
, 197
7-2
010
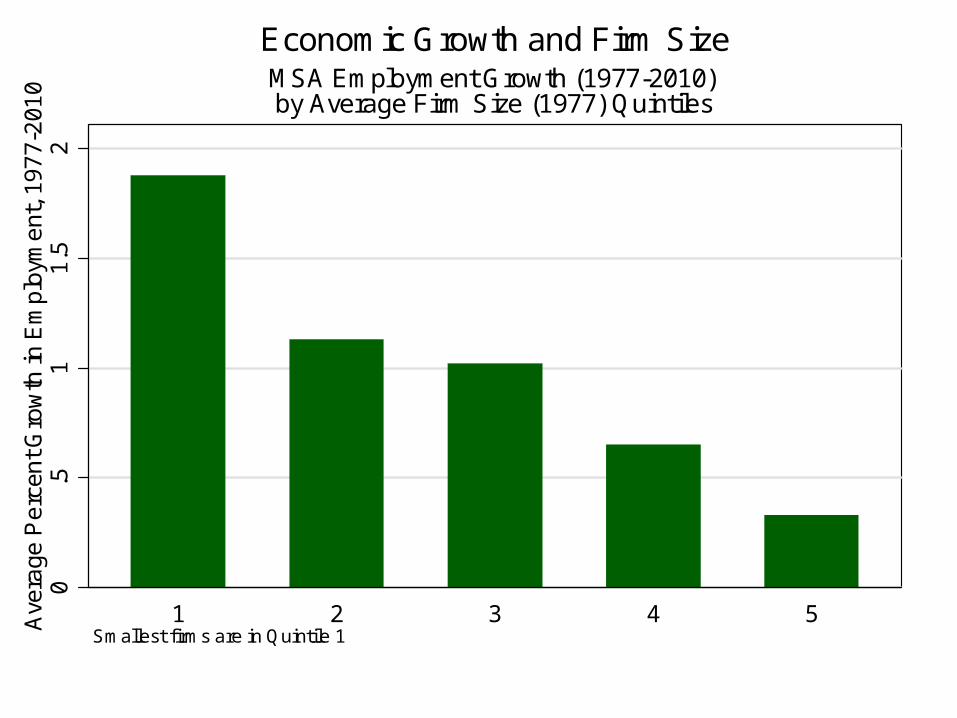
1 2 3 4 5Smallest firms are in Quintile 1
MSA Employment Growth (1977-2010)by Average Firm Size (1977) Quintiles
Economic Growth and Firm Size

Copper Mines and Entrepreneurship

South BostonWaterfront
Innovation District
Logan AirportDowntown

Policy Related Questions
• Explicit Spatial Policies– Should be city sizes be limited? Optimal city size?
• Investment in Infrastructure– Roads and railroads but endogeneity is difficult
• Education and human capital spillovers– Old questions remain (primary vs. secondary)– New crop of great experimental work.
• Regulation, credit market, labor market matching questions all relate to cities.
• Encouraging Entrepreneurship in Cities– One Stop Permitting

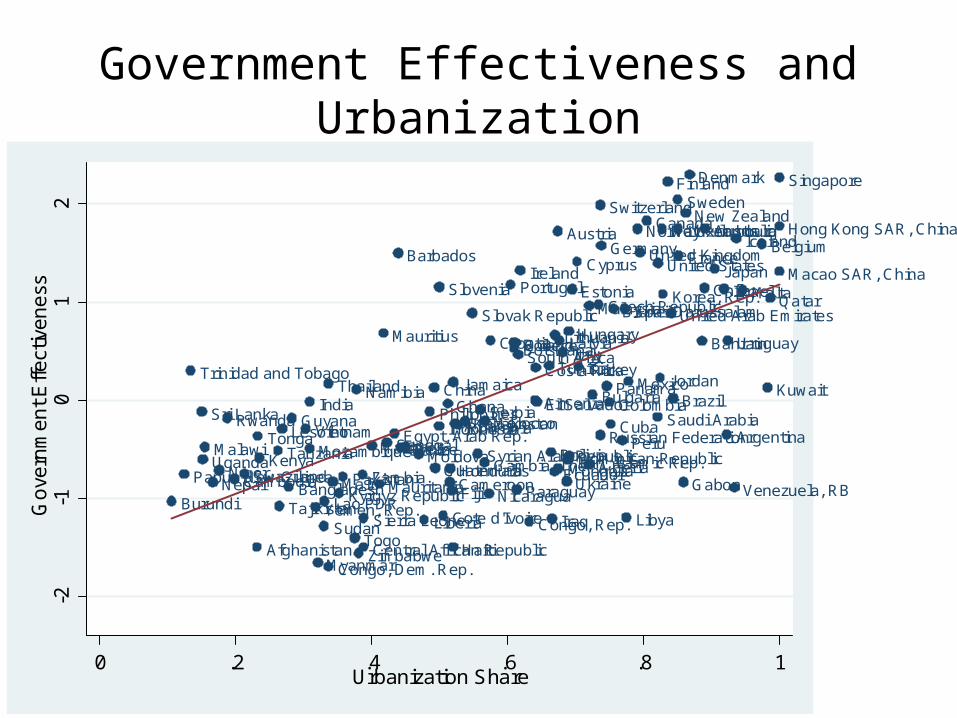
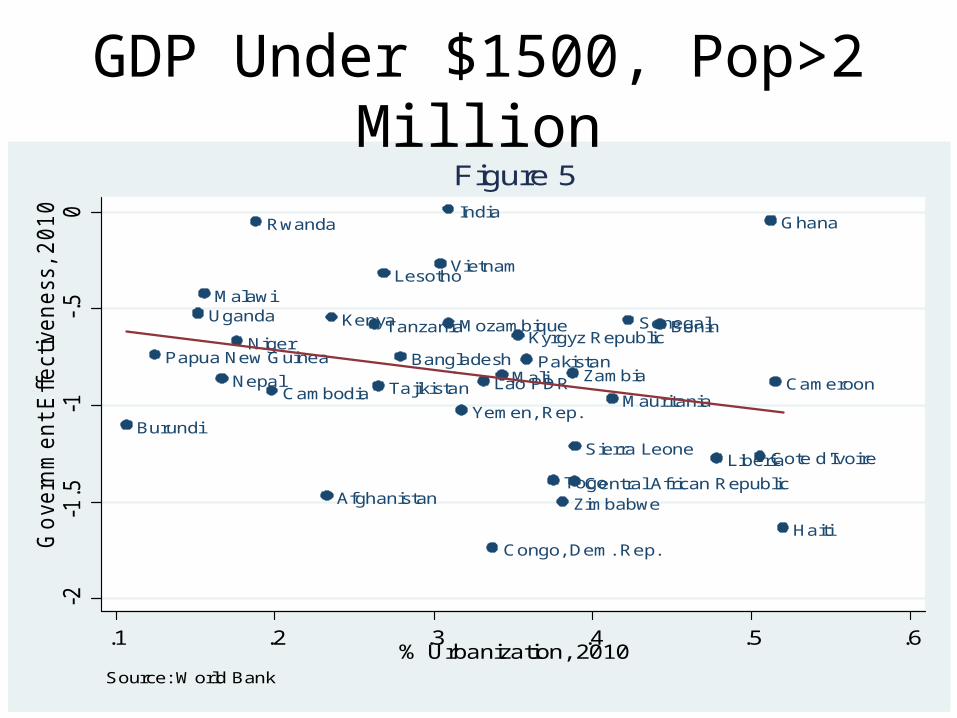
Government Effectiveness and Urbanization
Congo, Dem. Rep.
BurundiLiberia
Niger
Malawi Mozambique
Sierra Leone
Central African RepublicAfghanistan
UgandaTanzania
Rwanda
Togo
NepalGambia, The
Zimbabwe
Mali
Haiti
Bangladesh
BeninKenya
Cambodia
TajikistanKyrgyz Republic
Lesotho
Pakistan
Senegal
MauritaniaCameroonLao PDR
Cote d'Ivoire
Vietnam
Zambia
Yemen, Rep.
Ghana
Papua New Guinea
India
Nicaragua
Sudan
Moldova BoliviaHonduras
Philippines
Mongolia
Sri Lanka
Iraq
Egypt, Arab Rep.Morocco
ParaguayGuatemala
Syrian Arab Republic
Indonesia
Congo, Rep.
Ukraine
GuyanaArmeniaEl Salvador
Tonga
SwazilandFiji
Albania
Ecuador
Belize
TunisiaJordan
China
Algeria
ThailandNamibia Jamaica
Dominican Republic
Serbia
Peru
ColombiaBulgaria
Maldives
South AfricaBotswanaMauritius
Panama
Romania
Costa Rica
Malaysia
Gabon
KazakhstanArgentina
MexicoTurkey
Russian Federation
Latvia
Brazil
Lithuania UruguayPoland
Chile
HungaryCroatia
Venezuela, RB
Estonia
Barbados
Trinidad and Tobago
Slovak Republic
Saudi Arabia
Bahrain
Czech RepublicMaltaKorea, Rep.
PortugalSlovenia
Greece
Israel
Cyprus
SpainBrunei Darussalam
Hong Kong SAR, ChinaNew Zealand
Italy
United KingdomFranceIceland
United Arab Emirates
Germany
Singapore
Belgium
Japan
Finland
Austria
Kuwait
Ireland
Canada
United States
Netherlands
Sweden
Australia
Macao SAR, China
Denmark
Switzerland
Qatar
NorwayLuxembourg
Libya
Iran, Islamic Rep.
Cuba
Myanmar
-2-1
01
2G
ove
rnm
ent E
ffect
iven
ess
0 .2 .4 .6 .8 1Urbanization Share
Afghanistan
Bangladesh
Benin
Burundi
CambodiaCameroon
Central African Republic
Congo, Dem. Rep.
Cote d'Ivoire
Ghana
Haiti
India
KenyaKyrgyz Republic
Lao PDR
Lesotho
Liberia
Malawi
Mali
Mauritania
Mozambique
Nepal
NigerPakistanPapua New Guinea
Rwanda
Senegal
Sierra Leone
Tajikistan
Tanzania
Togo
Uganda
Vietnam
Yemen, Rep.
Zambia
Zimbabwe
-2-1
.5-1
-.5
0G
overn
men
t E
ffectiven
ess, 2
01
0
.1 .2 .3 .4 .5 .6% Urbanization, 2010
Source: World Bank
Figure 5
GDP Under $1500, Pop>2 Million

Waste and Fraud in Infrastructure:The Institutional Challenge


Engineering vs. Economics

Transportation and Congestion
• The traditional literature used engineering estimates and engaged in cost-benefit analysis– Fundamental conclusion is “bus good; train bad”
• A newer literature uses cross-metropolitan area estimates to determine the impact of new infrastructure projects. – Baum-Snow (military map) on suburbanization– Duranton-Turner on the fundamental law of highway traffic and
impact of roads on MSA gdp• A parallel literature in developing economies
– Banerjee, Duflo and Qian (2012). • Requires the exogenous location of infrastructure

Anarchy vs. Authority
Photo by SuSanA SecretariatRayKelly by David Shankbone

The Brazil Model: The Dentist and the Supermarket
Supermarket by Wonderlane
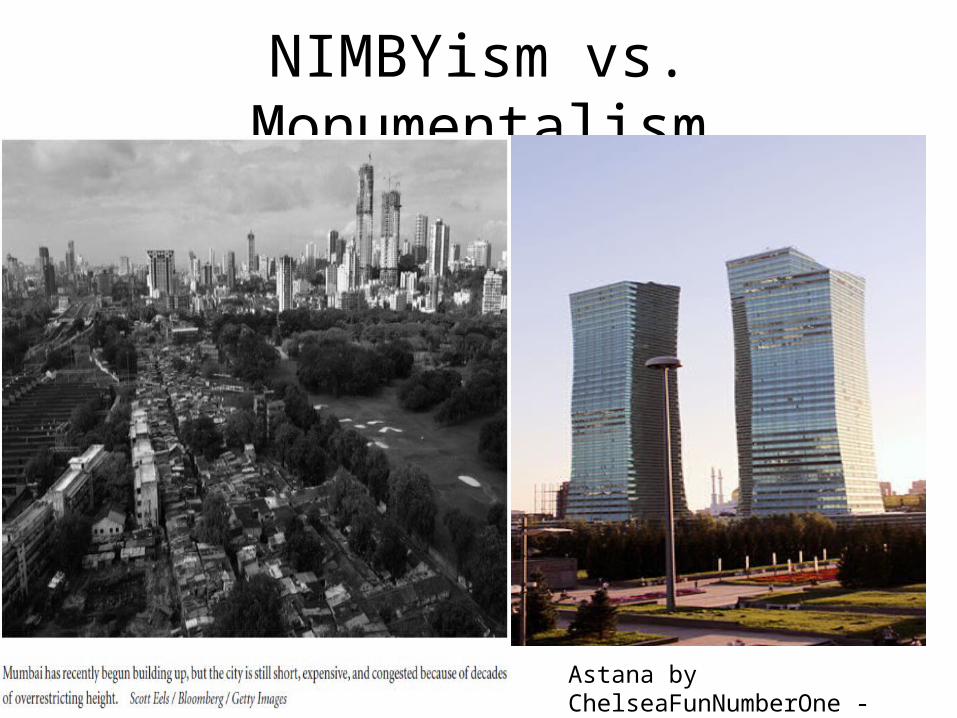
NIMBYism vs. Monumentalism
Astana by ChelseaFunNumberOne -

Housing Markets, Property Rights and Regulation
• Successful cities have high land costs which translates into high costs of living. – Housing costs are mediated by levels of regulation
• Impact of property ownership on outcomes (DeSoto, Erica Field) through self-protection or ability to finance new investment.
• Impact of structure on outcomes through health– the bore holes problem and the Tenements law.
• The Western pattern was that property rights were developed first (12th-18th centuries) but regulation followed. Not so in the developing world.
• Large unregulated communities with dimly defined property rights.

Marin County, CaliforniaSan Mateo County, California
Santa Clara County, California
Pitkin County, Colorado
Nantucket County, Massachusetts
New York County, New York0
2000
0040
0000
6000
0080
0000
1000
000
Med
ian
Hou
sing
Val
ue, 2
000
-.5 0 .5 1Population Growth, 2000-2010
Median Housing Value by Population Growth


Detroit
Houston
Las Vegas
New York
Phoenix
DC
-1-.
75-.
5-.
250
.25
Cha
nge
in F
HF
A P
rice,
200
6-20
11
0 .2 .4 .6 .8Change in FHFA Price, 2001-2006
Change in Housing Prices, 2001-2006 vs. 2006-2011

Fact 1 (obvious one): Price increases are spectacular
Source: Wharton/NUS/Tsinghua Chinese Residential Land Price Indexes

Fact 2 (relatively obvious): Prices are not cheap compared to income
A conservative estimate: In many of the 35 major cities by 2005, average annual disposable income is worth around 2-3 square meters (20-30 square feet) of housing . It is even worse now.
0.1
.2.3
.4D
ensi
ty
0 2 4 6 8Annual Disposable Income/Price per m^2 (2005)

Fact 3 (not so obvious): Prices are way higher than physical costs of construction
Beijing
Changchun
ChangshaChengdu
Chongqing
Guangzhou
Guiyang Haikou
Hangzhou
HefeiHohhot
JinanKunmingLanzhou
Nanchang
Nanjing
Nanning
Shanghai
Shenyang
ShijiazhuangTianjinUrumqi
Wuhan
XiAn
XiningYinchuan
Zhengzhou
24
68
10
Pri
ce/C
ost of C
on
str
uction
5000 10000 15000 20000Price (RMB/m2)

Fact 4: Real estate is the largest component of household wealth in China
Not an entirely fair comparison as real estate asset is perhaps the largest component of household wealth for US households outside of the highest income brackets. But in China, even rich households have a lot of their assets in real estate as well.

Fact 5: Even when things turn sour, prices don’t adjust immediately
Beijing
Changchun
Changsha
ChengduChongqing
Dalian
Fuzhou
Guangzhou
Guiyang HaikouHangzhouHarbin
Hefei
HohhotJinan
Kunming
Lanzhou
Nanchang
Nanjing
Nanning
Ningbo
Qingdao
Shanghai
Shenyang
ShenzhenShijiazhuang
Taiyuan
TianjinTotal
Urumqi
Wuhan
XiAn
Xiamen
Xining
Yinchuan
Zhengzhou
02
04
06
08
0
Pri
ce G
row
th in
Rece
nt 3
Ye
ars
(%
)
5 10 15 20 25Areas Not Sold/Recent 3Years Areas Completed (Res)
Some moderate correlation between area not sold and price declines as of 2012, but literally no correlation before 2011.

Image by QuarterCircleS


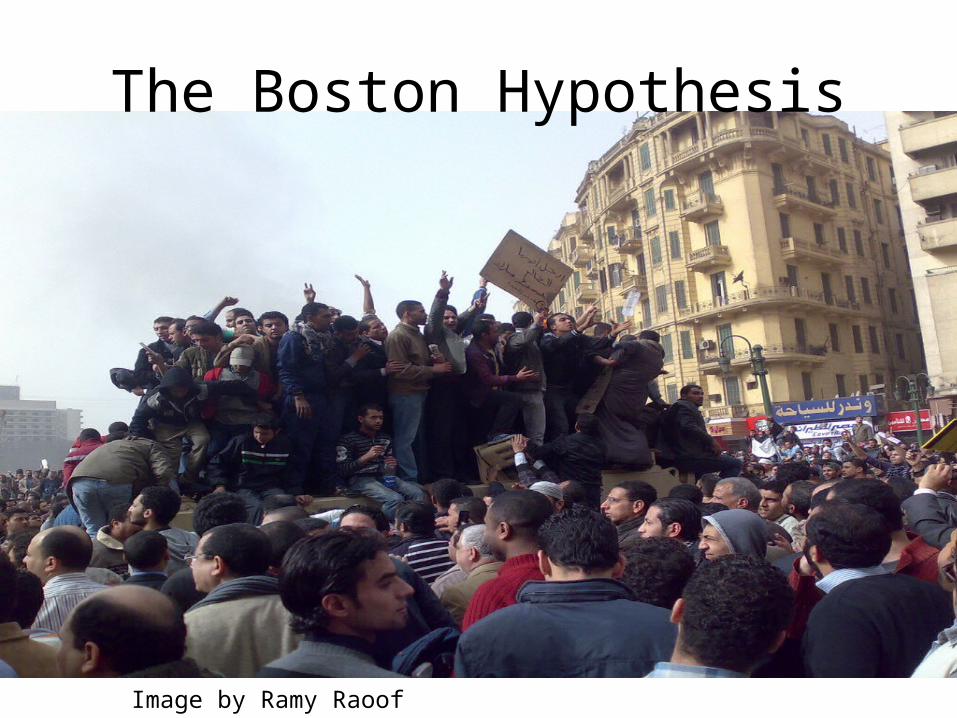
Image by Ramy Raoof
The Boston Hypothesis