Embed Size (px)
Citation preview

Citation: Ghimire, Binam, Gautam, Rishi, Karki, Dipesh and Sharma, Satish (2015) Banks, non-bank companies and stock exchange: do we know the relationship? Economics and Business Review, 1(15) (4). pp. 25-45. ISSN 2392-1641
Published by: Poznan University of Economics Press
URL: http://dx.doi.org/10.18559/ebr.2015.4.3 <http://dx.doi.org/10.18559/ebr.2015.4.3>
This version was downloaded from Northumbria Research Link: http://nrl.northumbria.ac.uk/25809/
Northumbria University has developed Northumbria Research Link (NRL) to enable users to access the University’s research output. Copyright © and moral rights for items on NRL are retained by the individual author(s) and/or other copyright owners. Single copies of full items can be reproduced, displayed or performed, and given to third parties in any format or medium for personal research or study, educational, or not-for-profit purposes without prior permission or charge, provided the authors, title and full bibliographic details are given, as well as a hyperlink and/or URL to the original metadata page. The content must not be changed in any way. Full items must not be sold commercially in any format or medium without formal permission of the copyright holder. The full policy is available online: http://nrl.northumbria.ac.uk/policies.html
This document may differ from the final, published version of the research and has been made available online in accordance with publisher policies. To read and/or cite from the published version of the research, please visit the publisher’s website (a subscription may be required.)
Volume 1 (15) Number 4 2015
Volume 1 (15)
Num
ber 4 2015
CONTENTS
ARTICLES
A turnpike theorem for non-stationary Gale economy with limit technology. A particular caseEmil Panek
Product market cooperation under e� cient bargaining with di� erent disagreement points: a resultDomenico Buccella
Banks, non-bank companies and stock exchange: do we know the relationship?Binam Ghimire, Rishi Gautam, Dipesh Karki, Satish Sharma
Measuring the usefulness of information publication time to proxy for returnsItai Blitzer
Business tendency survey data. Where do the respondents’ opinions come from?Sławomir Kalinowski, Małgorzata Kokocińska
Does outward FDI by Polish multinationals support existing theory? Findings from a quantitative studyMarian Gorynia, Jan Nowak, Piotr Trąpczyński, Radosław Wolniak
� e complex relationship between intrinsic and extrinsic rewardsOrni Gov
Improvement of the communication between teachers and students in the coaching programme and in a process of action researchMichal Lory
BOOK REVIEWS
Barney G. Glaser, Choosing Classic Grounded � eory: a Grounded � eory Reader of Expert Advice, CA: Sociology Press, Mill Valley 2014 (Gary Evans)
Volume 1 (15) Number 2 2015
Subscription
Economics and Business Review (E&BR) is published quarterly and is the successor to the Poznań University of Economics Review. � e E&BR is published by the Poznań University of Economics Press.
E&BR is listed in ProQuest, EBSCO, and BazEkon.
Subscription rates for the print version of the E&BR: institutions: 1 year – €50.00; individuals: 1 year – €25.00. Single copies: institutions – €15.00; individuals – €10.00. � e E&BR on-line edition is free of charge.
Correspondence with regard to subscriptions should be addressed to: Księgarnia Uniwersytetu Ekonomicznego w Poznaniu, ul. Powstańców Wielkopolskich 16, 61-895 Poznań, Poland, fax: +48 61 8543147; e-mail: [email protected].
Payments for subscriptions or single copies should be made in Euros to Księgarnia Uniwersytetu Ekonomicznego w Poznaniu by bank transfer to account No.: 96 1090 1476 0000 0000 4703 1245.
Poznań University of Economics Press
ISSN 2392-1641
Economicsand Business
Economics and B
usiness Review
Review
Editorial BoardRyszard BarczykWitold JurekCezary KochalskiTadeusz Kowalski (Editor-in-Chief)Henryk MrukIda MusiałkowskaJerzy SchroederJacek WalluschMaciej Żukowski
International Editorial Advisory BoardUdo Broll – School of International Studies (ZIS), Technische Universität, DresdenWojciech Florkowski – University of Georgia, Gri� nBinam Ghimire – Northumbria University, Newcastle upon TyneChristopher J. Green – Loughborough UniversityJohn Hogan – Georgia State University, AtlantaBruce E. Kaufman – Georgia State University, AtlantaSteve Letza – Corporate Governance Business School Bournemouth UniversityVictor Murinde – University of BirminghamHugh Scullion – National University of Ireland, GalwayYochanan Shachmurove – � e City College, City University of New YorkRichard Sweeney – � e McDonough School of Business, Georgetown University, Washington D.C.� omas Taylor – School of Business and Accountancy, Wake Forest University, Winston-SalemClas Wihlborg – Argyros School of Business and Economics, Chapman University, OrangeJan Winiecki – University of Information Technology and Management in RzeszówHabte G. Woldu – School of Management, � e University of Texas at Dallas
� ematic EditorsEconomics: Ryszard Barczyk, Tadeusz Kowalski, Ida Musiałkowska, Jacek Wallusch, Maciej Żukowski • Econometrics: Witold Jurek, Jacek Wallusch • Finance: Witold Jurek, Cezary Kochalski • Management and Marketing: Henryk Mruk, Cezary Kochalski, Ida Musiałkowska, Jerzy Schroeder • Statistics: Elżbieta Gołata, Krzysztof SzwarcLanguage Editor: Owen Easteal • IT Editor: Piotr Stolarski
© Copyright by Poznań University of Economics, Poznań 2015
Paper based publication
ISSN 2392-1641
POZNAŃ UNIVERSITY OF ECONOMICS PRESSul. Powstańców Wielkopolskich 16, 61-895 Poznań, Polandphone +48 61 854 31 54, +48 61 854 31 55, fax +48 61 854 31 59www.wydawnictwo-ue.pl, e-mail: [email protected] address: al. Niepodległości 10, 61-875 Poznań, Poland
Printed and bound in Poland by:Poznań University of Economics Print Shop
Circulation: 300 copies
Aims and Scope
Economics and Business Review is the successor to the Poznań University of Economics Review which was published by the Poznań University of Economics Press in 2001–2014. � e Economics and Business Review is a quarterly journal focusing on theoretical and applied research work in the � elds of economics, man-agement and � nance. � e Review welcomes the submission of articles for publication dealing with micro, mezzo and macro issues. All texts are double-blind assessed by independent reviewers prior to acceptance.
Notes for Contributors
1. Articles submitted for publication in the Economics and Business Review should contain original, unpublished work not submitted for publication elsewhere.
2. Manuscripts intended for publication should be written in English and edited in Word and sent to: [email protected]. Authors should upload two versions of their manuscript. One should be a com-plete text, while in the second all document information identifying the author(s) should be removed from � les to allow them to be sent to anonymous referees.
3. � e manuscripts are to be typewritten in 12’ font in A4 paper format and be le� -aligned. Pages should be numbered.
4. � e papers submitted should have an abstract of not more than 100 words, keywords and the Journal of Economic Literature classi� cation code.
5. Acknowledgements and references to grants, a� liation, postal and e-mail addresses, etc. should appear as a separate footnote to the author’s namea, b, etc and should not be included in the main list of footnotes.
6. Footnotes should be listed consecutively throughout the text in Arabic numerals. Cross-references should refer to particular section numbers: e.g.: See Section 1.4.
7. Quoted texts of more than 40 words should be separated from the main body by a four-spaced inden-tation of the margin as a block.
8. Mathematical notations should meet the following guidelines: – symbols representing variables should be italicized, – avoid symbols above letters and use acceptable alternatives (Y*) where possible, – where mathematical formulae are set out and numbered these numbers should be placed against the right margin as... (1),
– before submitting the � nal manuscript, check the layout of all mathematical formulae carefully ( including alignments, centring length of fraction lines and type, size and closure of brackets, etc.),
– where it would assist referees authors should provide supplementary mathematical notes on the derivation of equations.
9. References in the text should be indicated by the author’s name, date of publication and the page num-ber where appropriate, e.g. Acemoglu and Robinson [2012], Hicks [1965a, 1965b]. References should be listed at the end of the article in the style of the following examples:Acemoglu, D., Robinson, J.A., 2012, Why Nations Fail. � e Origins of Power, Prosperity and Poverty,
Pro� le Books, London.Kalecki, M., 1943, Political Aspects of Full Employment, � e Political Quarterly, vol. XIV, no. 4: 322–331.Simon, H.A., 1976, From Substantive to Procedural Rationality, in: Latsis, S.J. (ed.), Method and Appraisal
in Economics, Cambridge University Press, Cambridge: 15–30.10. Copyrights will be established in the name of the E&BR publisher, namely the Poznań University of
Economics Press.
More information and advice on the suitability and formats of manuscripts can be obtained from:Economics and Business Reviewal. Niepodległości 1061-875 PoznańPolande-mail: [email protected]
Economics and Business Review, Vol. 1 (15), No. 4, 2015: 25–45DOI: 10.18559/ebr.2015.4.3
Banks, non-bank companies and stock exchange: do we know the relationship1?
Binam Ghimire,2 Rishi Gautam,3 Dipesh Karki,4 Satish Sharma4
Abstract : This paper investigates the role played by the banking sector in founding, sustaining and developing stock exchange markets. The paper has constructed data on market capitalisation separately for banks and non-bank companies. We apply cointe-gration techniques developed by Engle and Granger [1987] and Johansen [1988] and we bootstrap the variables to examine the nature of relationship between the banks and stock markets. We found that banks have played an important role in the devel-opment of stock exchanges. Further, the empirical analysis made amongst ten devel-oped and developing exchanges suggests a listing of non-bank companies important for development of stock markets. These findings have also been verified by analysing the data of an exchange not included in the test.
Keywords : financial development, banks, stock exchanges, cointegration, bootstrap.
JEL codes : C22, C15, G10, G21.
Introduction
This paper provides evidence that in many countries the financial institutions, mainly the banks and stock markets, are closely related and banks play an impor-tant role in the establishment, management and daily trading of stock markets.
The motivation for this paper is the gap in the literature regarding the nature of the relationship between the two financial institutions. Many empirical pa-pers have provided evidence that both banks and stock markets are important for economic growth [Chakraborty and Ray 2006; Deidda and Fattouh 2008;
1 Article received 27 March 2015, accepted 15 September 2015.We thank Professor Jackie Harvey of Newcastle Business School for all her valuable advice
and guidance on this paper. 2 Newcastle Business School, Northumbria University, Newcastle upon Tyne, NE1 8ST,
U.K.; corresponding author: [email protected]. 3 Shaker Dev Campus, Tribhuvan University, Kathmandu, Nepal. 4 Newcastle Business School, Northumbria University, Newcastle upon Tyne, U.K.
26 Economics and Business Review, Vol. 1(15), No. 4, 2015
Levine 2002; Levine and Zervos 1998]. Studies have also shown the comple-mentary role between banks and stock markets [Demirgüç-Kunt and Levine 1996; Garcia and Liu 1999; Li 2007] whilst Deidda and Fattouh [2008] provide evidence of a diminishing impact of banks upon economic growth as stock markets develop. The literature as such is not clear and not explicit enough on the relationship between the two financial institutes. Moreover economic growth literature also includes variables capturing the effect of both banks and stock exchanges as independent variables. Given the substitute and comple-mentary nature of the relationship mentioned in literature, keeping them as independent variables can be empirically questionable which further enhances the scope of this paper.
The paper is organised as follows. Section two reviews the literature on banks and markets. The new variables and data constructed for this paper will be dis-cussed in section three. Section four describes the methodology used, discusses the results and also includes an analysis of a further case study: Nepal Stock Exchange. Finally, section five outlines the main conclusions.
1. Literature review
Atje and Jovanovic [1993] carried out the first cross-country growth analysis involving banks and stock markets and found a positive influence of stock mar-kets but a negative one for banks. The debate on the comparative advantages of bank based and market based economies became more intense in the subse-quent literature. Some of them included a comparison of financial systems in different countries, particularly developed countries, whilst others investigated the nature of the relationship between the banks and markets.
Allen [1993] recommends bank-based systems for traditional industries where there is consensus about policies, and market-based systems for dynamic industries where wide agreement is lacking. Allen and Gale [1995] while ex-panding over Allen [1993] provide a quantitative measure of the share of banks and markets for Germany and United States. For example, they show that the ownership of publicly listed banks during the period 1990–1991 was 8.9% in Germany compared to only 0.3% in the USA [Allen and Gale 1995: 188, Table 3].The authors continue to explore the bank and market based economies and in Allen and Gale [1995] they show the theoretical model in which they find that a bank based system may perform better than one which is market based. The authors suggest that the German financial system, with its reliance on finan-cial intermediary market, can minimize the risk (using the reserve held by the bank) better than the US financial system that relies more on financial mar-kets. Levine [1997] compares the close bond between banks and industrialists in bank-based economies such as Germany and Japan, and the greater liquidity and risk sharing opportunities in market-based countries such as the United
B. Ghimire, R. Gautam, D. Karki, S. Sharma, Banks, non-bank companies and stock exchange 27
Kingdom and the United States. The author finds the bank-based financial struc-ture of Japan superior to that of the United States but raises concern over the available quantitative measure that differentiates an economy into bank-based and market-based. The author doubts whether Japan is a bank-based economy since it has one of the best developed stock markets in the world. The author therefore suggests the need for further research with new quantitative meas-ures of financial structure and functioning of financial system [p. 719]. Allen and Gale [2000] provided a more comprehensive explanation of five developed economies (France, Germany and Japan as bank-based and United Kingdom and United States as market-based) and their effect in resource allocation and economic development. The authors find both banks and markets important for a good financial system. Nevertheless they stress the need for more research in the area to understand the advantages and disadvantages of the different types of financial institutions [Allen and Gale 2001].
Some empirical works have suggested a complementary role played by banks and markets. Boyd and Smith [1996] suggest that stock markets and banks may act as complements rather than as substitute sources of capital. Similar to Boyd and Smith [1996], Demirgüç-Kunt and Levine [1996] find that across countries the level of stock market development is positively correlated with development of financial intermediaries. Demirgüç-Kunt and Levine [1996] use data on 44 developed and emerging markets from 1986 to 1993 and find that large stock markets are more liquid, less volatile and more internationally integrated than smaller markets. The authors find developed markets having developed inter-mediaries. Thus they conclude that stock markets and financial intermediar-ies complement each other and therefore they grow together as they develop.
Boot and Thakor [1997] explain the interaction between banks and mar-kets. They make models of a financial system based on three types of informa-tional asymmetries. The first one is about imperfect knowledge on the quality of investment projects available to borrowers. This is better handled by finan-cial markets as markets are better at pricing the value of the firms. The second is the post-lending moral hazard and the third is uncertainty that a borrower would be prone to moral hazard. The second and third informational asym-metries are better handled by banks as banks continue to retain information about the borrowers. The authors therefore present an optimal combination of banks and markets as a better financial system. The authors also find that when the borrowers gain reputation (at the expense of the bank), the capital market expands.
Garcia and Liu [1999] use seven countries in Latin America, six countries in East Asia, and two developed industrial countries (United States and Japan) in their empirical analysis regarding the macroeconomic determinants of stock market surge in the period 1980–1995. They argue that the more developed banking sector in East Asian economies led to growth in the size of the mar-ket in the region. The authors use stock market capitalization as a measure of
28 Economics and Business Review, Vol. 1(15), No. 4, 2015
stock market development. They find the stock market as a complement rather than substitute for the banking sector. Similarly, Li [2007] finds development of financial intermediaries have a positive association with the size of equity markets. The author uses 33 developed and developing countries. The author finds the stock market of less developed countries growing much faster in size than the developed countries in the sample, whereas more developed coun-tries enjoyed faster growth in trading activity than the developing countries.
Levine [2002] could not find support for either a bank-based or a market-based financial system, instead favoured for overall financial development importantly influenced by legal system. Chakraborty and Rays’ [2006] find-ings are similar to Levine [2002] as they were also unable to find one type of system superior to another although they suggested bank-based system are more beneficial to industrial countries. Deidda and Fattouh [2008] find both banks and stock markets important for growth. However, in their study, the growth impact of bank development (measured by domestic credit to private sector to GDP) is lower when the level of stock market development (meas-ured by turnover ratio) is higher. Minier [2009] finds that opening a stock exchange is important for growth. The author finds that countries experience higher economic growth during the first 5 years of the existence of a stock exchange. However, the longer-term results, according to Minier, [2009] are more ambiguous.
Lee [2012] looked at the relative merits of bank-based and market-based financial systems. The author used a subsample analysis in which it is found that for all six countries in the sample, which includes both bank and market based economies, the banking sector played an important role in the early years of economic growth. A further analysis by the author shows that the banking sector and the stock market were complementary to each other in each coun-try in the process of economic growth except for the United States, where the two sectors were mildly substitutable.
Ghimire and Giorgioni [2013] apply the World Bank Enterprise survey data in their study of finance and growth relationship. They identify internal finance as an important variable which is omitted in the finance and growth lit-erature. Similar to some existing literature [Beck and Levine 2004; Loayza and Rancière 2006; Saci, Giorgioni, and Holden 2009], the authors provide evidence of a negative impact of banks’ development on economic growth in the short-term. However, they could not establish whether stock markets contribute to growth in a signifi cant manner when the effect of internal finance was included.
Vithessonthi [2014] examines how bank risk varies with changes in finan-cial market development in a broad data set of 52 publicly listed commercial banks in five South East Asian countries over a 23-year period between 1990 and 2012. The author finds that higher degrees of financial market development are associated with weaker bank capital positions and are positively related to higher degrees of bank revenue diversification.
B. Ghimire, R. Gautam, D. Karki, S. Sharma, Banks, non-bank companies and stock exchange 29
2. New variables and data
In the literature on finance and growth variables approximating the role of banks and stock markets are included in the models to be estimated and are considered as independent variables. In this paper we examine whether this assumption is correct.
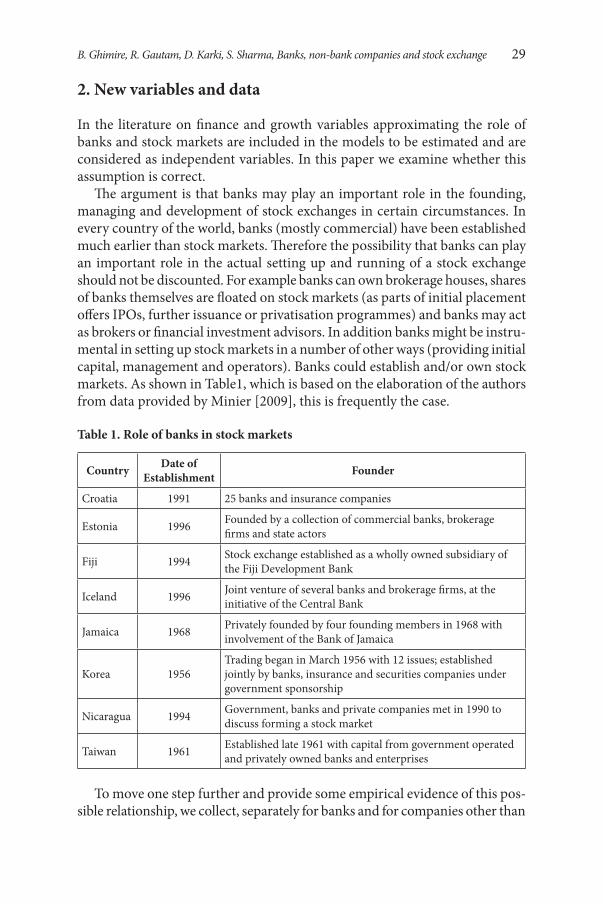
The argument is that banks may play an important role in the founding, managing and development of stock exchanges in certain circumstances. In every country of the world, banks (mostly commercial) have been established much earlier than stock markets. Therefore the possibility that banks can play an important role in the actual setting up and running of a stock exchange should not be discounted. For example banks can own brokerage houses, shares of banks themselves are floated on stock markets (as parts of initial placement offers IPOs, further issuance or privatisation programmes) and banks may act as brokers or financial investment advisors. In addition banks might be instru-mental in setting up stock markets in a number of other ways (providing initial capital, management and operators). Banks could establish and/or own stock markets. As shown in Table1, which is based on the elaboration of the authors from data provided by Minier [2009], this is frequently the case.
Table 1. Role of banks in stock markets
Country Date of Establishment Founder
Croatia 1991 25 banks and insurance companies
Estonia 1996 Founded by a collection of commercial banks, brokerage firms and state actors
Fiji 1994 Stock exchange established as a wholly owned subsidiary of the Fiji Development Bank
Iceland 1996 Joint venture of several banks and brokerage firms, at the initiative of the Central Bank
Jamaica 1968 Privately founded by four founding members in 1968 with involvement of the Bank of Jamaica
Korea 1956Trading began in March 1956 with 12 issues; established jointly by banks, insurance and securities companies under government sponsorship
Nicaragua 1994 Government, banks and private companies met in 1990 to discuss forming a stock market
Taiwan 1961 Established late 1961 with capital from government operated and privately owned banks and enterprises
To move one step further and provide some empirical evidence of this pos-sible relationship, we collect, separately for banks and for companies other than
30 Economics and Business Review, Vol. 1(15), No. 4, 2015
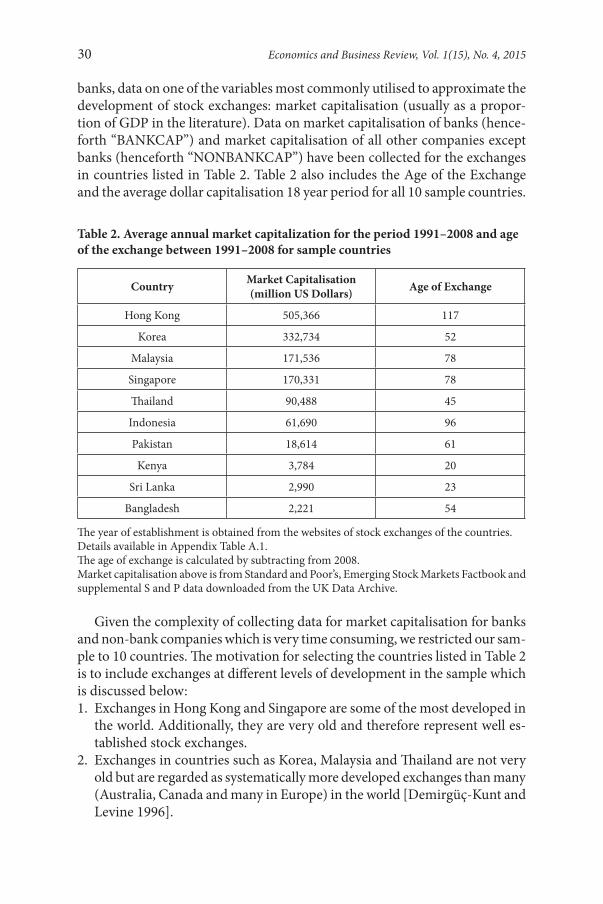
banks, data on one of the variables most commonly utilised to approximate the development of stock exchanges: market capitalisation (usually as a propor-tion of GDP in the literature). Data on market capitalisation of banks (hence-forth “BANKCAP”) and market capitalisation of all other companies except banks (henceforth “NONBANKCAP”) have been collected for the exchanges in countries listed in Table 2. Table 2 also includes the Age of the Exchange and the average dollar capitalisation 18 year period for all 10 sample countries.
Table 2. Average annual market capitalization for the period 1991–2008 and age of the exchange between 1991–2008 for sample countries
Country Market Capitalisation (million US Dollars) Age of Exchange
Hong Kong 505,366 117
Korea 332,734 52
Malaysia 171,536 78
Singapore 170,331 78
Thailand 90,488 45
Indonesia 61,690 96
Pakistan 18,614 61
Kenya 3,784 20
Sri Lanka 2,990 23
Bangladesh 2,221 54
The year of establishment is obtained from the websites of stock exchanges of the countries.Details available in Appendix Table A.1.The age of exchange is calculated by subtracting from 2008.Market capitalisation above is from Standard and Poor’s, Emerging Stock Markets Factbook and supplemental S and P data downloaded from the UK Data Archive.
Given the complexity of collecting data for market capitalisation for banks and non-bank companies which is very time consuming, we restricted our sam-ple to 10 countries. The motivation for selecting the countries listed in Table 2 is to include exchanges at different levels of development in the sample which is discussed below:1. Exchanges in Hong Kong and Singapore are some of the most developed in
the world. Additionally, they are very old and therefore represent well es-tablished stock exchanges.
2. Exchanges in countries such as Korea, Malaysia and Thailand are not very old but are regarded as systematically more developed exchanges than many (Australia, Canada and many in Europe) in the world [Demirgüç-Kunt and Levine 1996].
B. Ghimire, R. Gautam, D. Karki, S. Sharma, Banks, non-bank companies and stock exchange 31
3. Exchanges in Bangladesh, Pakistan, Sri Lanka are not very new (for ex-ample Dhaka Stock Exchange was established two years before the Korea Exchange and the stock exchange in Pakistan was established before the Korea Exchange) but they are not as developed as some others in the sample.
4. Finally, the exchange in Kenya is relatively new and has fewer listed com-panies and a low market capitalisation.It is important to emphasise that the variables BANKCAP and NONBANKCAP
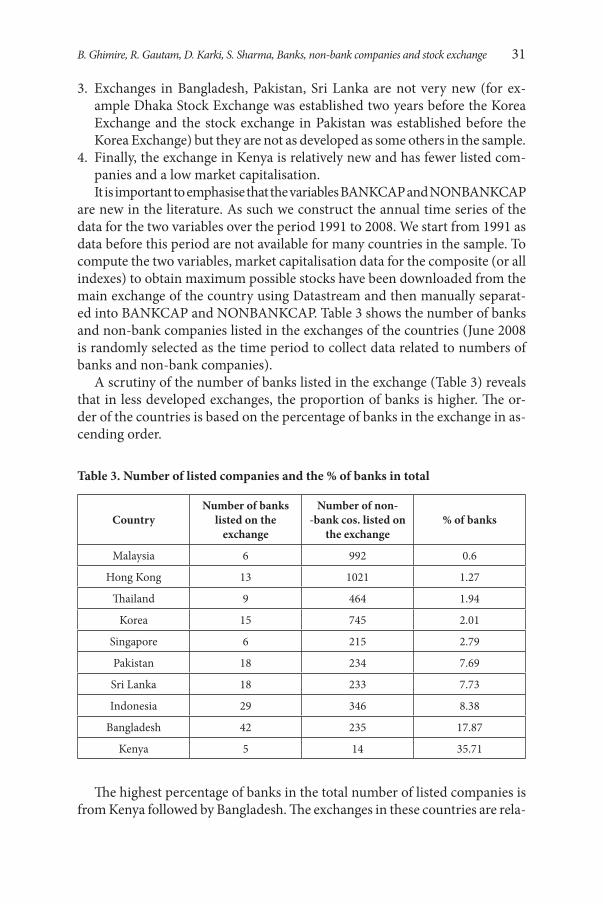
are new in the literature. As such we construct the annual time series of the data for the two variables over the period 1991 to 2008. We start from 1991 as data before this period are not available for many countries in the sample. To compute the two variables, market capitalisation data for the composite (or all indexes) to obtain maximum possible stocks have been downloaded from the main exchange of the country using Datastream and then manually separat-ed into BANKCAP and NONBANKCAP. Table 3 shows the number of banks and non-bank companies listed in the exchanges of the countries (June 2008 is randomly selected as the time period to collect data related to numbers of banks and non-bank companies).
A scrutiny of the number of banks listed in the exchange (Table 3) reveals that in less developed exchanges, the proportion of banks is higher. The or-der of the countries is based on the percentage of banks in the exchange in as-cending order.
Table 3. Number of listed companies and the % of banks in total
CountryNumber of banks
listed on the exchange
Number of non--bank cos. listed on
the exchange% of banks
Malaysia 6 992 0.6
Hong Kong 13 1021 1.27
Thailand 9 464 1.94
Korea 15 745 2.01
Singapore 6 215 2.79
Pakistan 18 234 7.69
Sri Lanka 18 233 7.73
Indonesia 29 346 8.38
Bangladesh 42 235 17.87
Kenya 5 14 35.71
The highest percentage of banks in the total number of listed companies is from Kenya followed by Bangladesh. The exchanges in these countries are rela-
32 Economics and Business Review, Vol. 1(15), No. 4, 2015
tively newer and less developed (according to total market capitalisation) than other exchanges in the sample. In countries with stock exchanges classified as the most developed and fastest growing such as Malaysia, Singapore, Hong Kong and Korea [Demirgüç-Kunt and Levine 1996], banks play a small role (less than 3%). In Sri Lanka, Pakistan and Indonesia the percentage of market capitalisation explained by banks ranges above 7 percent.
We first calculated the correlation coefficient between average capitalisation and age for the countries in Table 2 and found it to be 0.64, which is high i.e. older stock exchanges tend to be more developed. Therefore we identified and constructed a new variable “AGEXCHANGE” as a proxy representing the de-velopment of the exchange. This variable is admittedly less sophisticated than a variable capturing market capitalisation or a variable capturing the number of firms quoted on a market, although AGEXCHANGE is not immune from criticism.
The correlations between the variables BANKCAP and NONBANKCAP for the exchanges in the sample countries are presented in Table 4.
Table 4. Correlation coefficient between the variables BANKCAP and NONBANKCAP (annual data 1991–2008 17 observations)
Country Correlation
Bangladesh 0.94
Hong Kong 0.84
Indonesia 0.95
Kenya 0.97
Korea 0.97
Malaysia 0.81
Pakistan 0.89
Singapore 0.91
Sri Lanka 0.96
Thailand 0.80
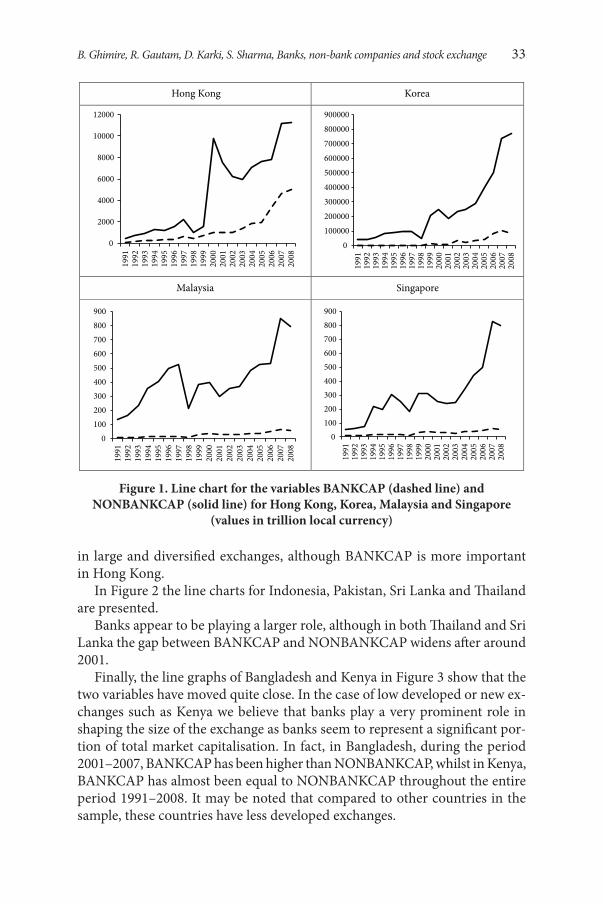
As noted in Table 4 the correlations are positive and very high for each coun-try in the sample. However in the case of established exchanges BANKCAP represents a very small portion of the total market capitalisation. For effective analysis we now present the line chart for both the variables.
Figure 1 presents the line chart for the variables BANKCAP and NONBANKCAP for the markets of Hong Kong, Korea, Malaysia, and Singapore. Banks do not seem to have a prominent role as one would expect
B. Ghimire, R. Gautam, D. Karki, S. Sharma, Banks, non-bank companies and stock exchange 33
in large and diversified exchanges, although BANKCAP is more important in Hong Kong.
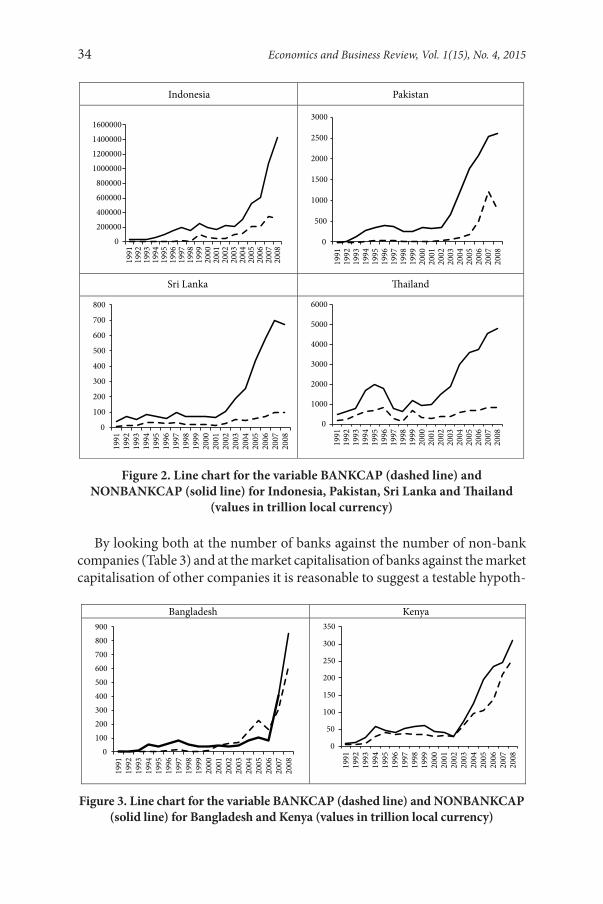
In Figure 2 the line charts for Indonesia, Pakistan, Sri Lanka and Thailand are presented.
Banks appear to be playing a larger role, although in both Thailand and Sri Lanka the gap between BANKCAP and NONBANKCAP widens after around 2001.
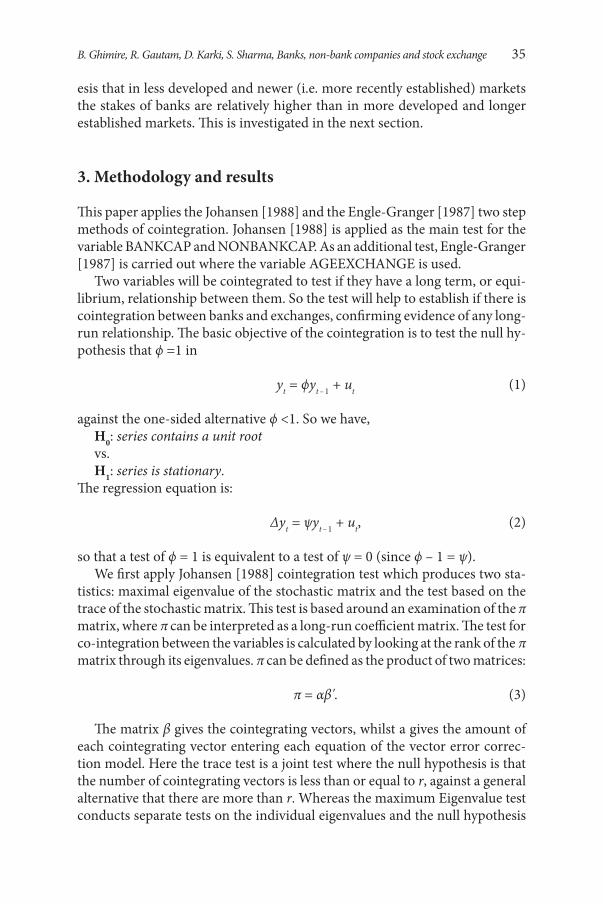
Finally, the line graphs of Bangladesh and Kenya in Figure 3 show that the two variables have moved quite close. In the case of low developed or new ex-changes such as Kenya we believe that banks play a very prominent role in shaping the size of the exchange as banks seem to represent a significant por-tion of total market capitalisation. In fact, in Bangladesh, during the period 2001–2007, BANKCAP has been higher than NONBANKCAP, whilst in Kenya, BANKCAP has almost been equal to NONBANKCAP throughout the entire period 1991–2008. It may be noted that compared to other countries in the sample, these countries have less developed exchanges.
Hong Kong Korea
0
2000
4000
6000
8000
10000
1200019
9119
9219
9319
9419
9519
9619
9719
9819
9920
0020
0120
0220
0320
0420
0520
0620
0720
08
0
100000
200000
300000
400000
500000
600000
700000
800000
900000
1991
1992
1993
1994
1995
1996
1997
1998
1999
2000
2001
2002
2003
2004
2005
2006
2007
2008
Malaysia Singapore
0100200300400500600700800900
1991
1992
1993
1994
1995
1996
1997
1998
1999
2000
2001
2002
2003
2004
2005
2006
2007
2008
0100200300400500600700800900
1991
1992
1993
1994
1995
1996
1997
1998
1999
2000
2001
2002
2003
2004
2005
2006
2007
2008
Figure 1. Line chart for the variables BANKCAP (dashed line) and NONBANKCAP (solid line) for Hong Kong, Korea, Malaysia and Singapore
(values in trillion local currency)
34 Economics and Business Review, Vol. 1(15), No. 4, 2015
By looking both at the number of banks against the number of non-bank companies (Table 3) and at the market capitalisation of banks against the market capitalisation of other companies it is reasonable to suggest a testable hypoth-
Figure 2. Line chart for the variable BANKCAP (dashed line) and NONBANKCAP (solid line) for Indonesia, Pakistan, Sri Lanka and Thailand
(values in trillion local currency)
Figure 3. Line chart for the variable BANKCAP (dashed line) and NONBANKCAP (solid line) for Bangladesh and Kenya (values in trillion local currency)
Indonesia Pakistan
0
200000
400000
600000
800000
1000000
1200000
1400000
160000019
9119
9219
9319
9419
9519
9619
9719
9819
9920
0020
0120
0220
0320
0420
0520
0620
0720
08
0
500
1000
1500
2000
2500
3000
1991
1992
1993
1994
1995
1996
1997
1998
1999
2000
2001
2002
2003
2004
2005
2006
2007
2008
Sri Lanka �ailand
0
100
200
300
400
500
600
700
800
1991
1992
1993
1994
1995
1996
1997
1998
1999
2000
2001
2002
2003
2004
2005
2006
2007
2008
0
1000
2000
3000
4000
5000
6000
1991
1992
1993
1994
1995
1996
1997
1998
1999
2000
2001
2002
2003
2004
2005
2006
2007
2008
Bangladesh Kenya
0100200300400500600700800900
1991
1992
1993
1994
1995
1996
1997
1998
1999
2000
2001
2002
2003
2004
2005
2006
2007
2008
0
50
100
150
200
250
300
350
1991
1992
1993
1994
1995
1996
1997
1998
1999
2000
2001
2002
2003
2004
2005
2006
2007
2008
B. Ghimire, R. Gautam, D. Karki, S. Sharma, Banks, non-bank companies and stock exchange 35
esis that in less developed and newer (i.e. more recently established) markets the stakes of banks are relatively higher than in more developed and longer established markets. This is investigated in the next section.
3. Methodology and results
This paper applies the Johansen [1988] and the Engle-Granger [1987] two step methods of cointegration. Johansen [1988] is applied as the main test for the variable BANKCAP and NONBANKCAP. As an additional test, Engle-Granger [1987] is carried out where the variable AGEEXCHANGE is used.
Two variables will be cointegrated to test if they have a long term, or equi-librium, relationship between them. So the test will help to establish if there is cointegration between banks and exchanges, confirming evidence of any long-run relationship. The basic objective of the cointegration is to test the null hy-pothesis that ϕ =1 in
yt = ϕyt – 1 + ut (1)
against the one-sided alternative ϕ <1. So we have,H0: series contains a unit rootvs. H1: series is stationary.
The regression equation is:
Δyt = ψyt – 1 + ut, (2)
so that a test of ϕ = 1 is equivalent to a test of ψ = 0 (since ϕ – 1 = ψ).We first apply Johansen [1988] cointegration test which produces two sta-
tistics: maximal eigenvalue of the stochastic matrix and the test based on the trace of the stochastic matrix. This test is based around an examination of the π matrix, where π can be interpreted as a long-run coefficient matrix. The test for co-integration between the variables is calculated by looking at the rank of the π matrix through its eigenvalues. π can be defined as the product of two matrices:
π = αβ'. (3)
The matrix β gives the cointegrating vectors, whilst a gives the amount of each cointegrating vector entering each equation of the vector error correc-tion model. Here the trace test is a joint test where the null hypothesis is that the number of cointegrating vectors is less than or equal to r, against a general alternative that there are more than r. Whereas the maximum Eigenvalue test conducts separate tests on the individual eigenvalues and the null hypothesis
36 Economics and Business Review, Vol. 1(15), No. 4, 2015
is that the number of cointegrating vectors is r, against an alternative of (r + 1). The two statistics are:
Trace1
ˆ( ) (1 )g
ii r
λ r T in λ= +
= − −∑ , (4)
Max 1ˆ( , 1) ln(1 )rλ r r T λ ++ = − − , (5)
where iλ is the estimated value for the ith ordered eigenvalue.Trace and Maximum Eigenvalue statistics are calculated for all countries
in the sample.In order to further support the Johansen test, the two step cointegration, us-
ing Engle and Granger’s [1987], procedure will also be performed. To achieve this, the residuals from the regression equation are calculated. On the residu-als, unit root tests (ADF5) are applied to find the t statistics. It is expected that if the t-statistics, are higher this will indicate a closer association between the variables and vice versa. If the hypothesis is true then t-statistics for less de-veloped stock exchanges will be higher. On the other hand, a developed stock exchange should have a lower t-statistics value i.e. associated to a lesser extent.
The correlation coefficient is calculated between t-statistics and variables representing stock exchange development (AGEXCHANGE). If the correla-tion is negative then it would imply that in countries with highly developed stock exchanges, the banks and stock market will have less cointegration as compared to countries with less developed exchanges.
As a further robustness check, bootstrapping6 of the variables (AGEX-CCHANGE and ADF t-statistics) can be done to find the level of confidence interval between the two7. Finally, if the difference is stationary (from the coin-tegration test), this should imply that banks are dominant for the stock mar-ket (and the country does not have a well developed exchange). Cointegration does not seek the causality. However in the exchange banks are only one out of many industries in a country. So it should not be the only element responsible for the growth of a stock market. In other words, if the difference between to-tal market capitalization and bank stock capitalization remains stationary, this practically means that bank stocks are the main element in the stock market contributing to its growth.
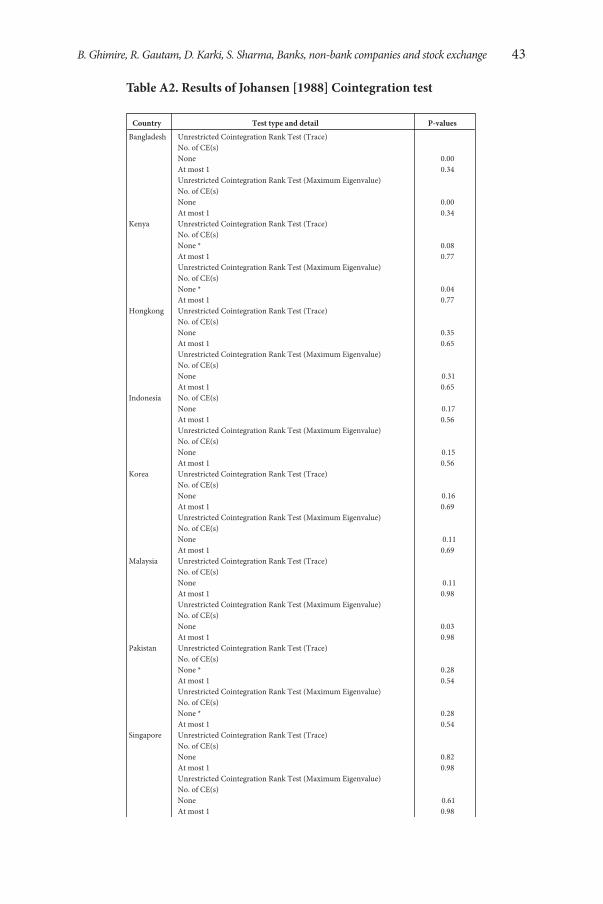
The Johansen cointegration results are reported in Appendix Table A2. The test shows that there is cointegration amongst BANKCAP and NONBANKCAP for countries namely Bangladesh, and Kenya (Trace test at 8%). The cointegra-
5 The unit root test is conducted for both intercept and trend. ADF is the augmented Dickey-Fuller test.
6 Bootstrapping with replacement. 7 Bootstrapping is done in MATLAB. MATLAB is a numerical computing environment
maintained by the MathWorks (http://www.mathworks.com/).
B. Ghimire, R. Gautam, D. Karki, S. Sharma, Banks, non-bank companies and stock exchange 37
tion for Thailand can be established at 9% from the Trace test and 8% from the Maximum Eigenvalue test. The countries that have no cointegration are Hong Kong, Indonesia, Korea, Malaysia, Pakistan, Singapore, and Sri Lanka. Both the Trace and Maximum Eigenvalue tests support the results. The results are similar to those predicted through the line graphs. This means stock exchanges that have a larger share of banks are cointegrated.
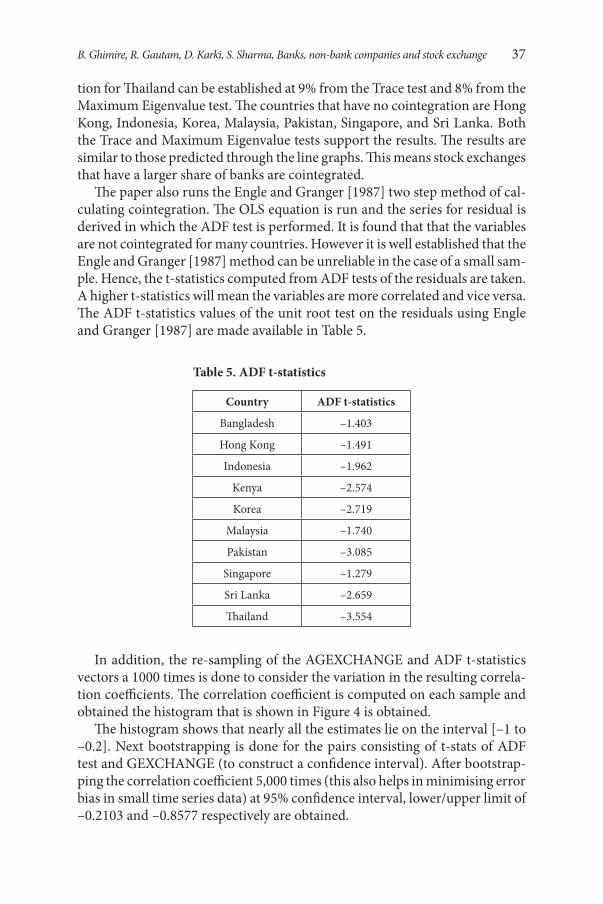
The paper also runs the Engle and Granger [1987] two step method of cal-culating cointegration. The OLS equation is run and the series for residual is derived in which the ADF test is performed. It is found that that the variables are not cointegrated for many countries. However it is well established that the Engle and Granger [1987] method can be unreliable in the case of a small sam-ple. Hence, the t-statistics computed from ADF tests of the residuals are taken. A higher t-statistics will mean the variables are more correlated and vice versa. The ADF t-statistics values of the unit root test on the residuals using Engle and Granger [1987] are made available in Table 5.
Table 5. ADF t-statistics
Country ADF t-statistics
Bangladesh –1.403
Hong Kong –1.491
Indonesia –1.962
Kenya –2.574
Korea –2.719
Malaysia –1.740
Pakistan –3.085
Singapore –1.279
Sri Lanka –2.659
Thailand –3.554
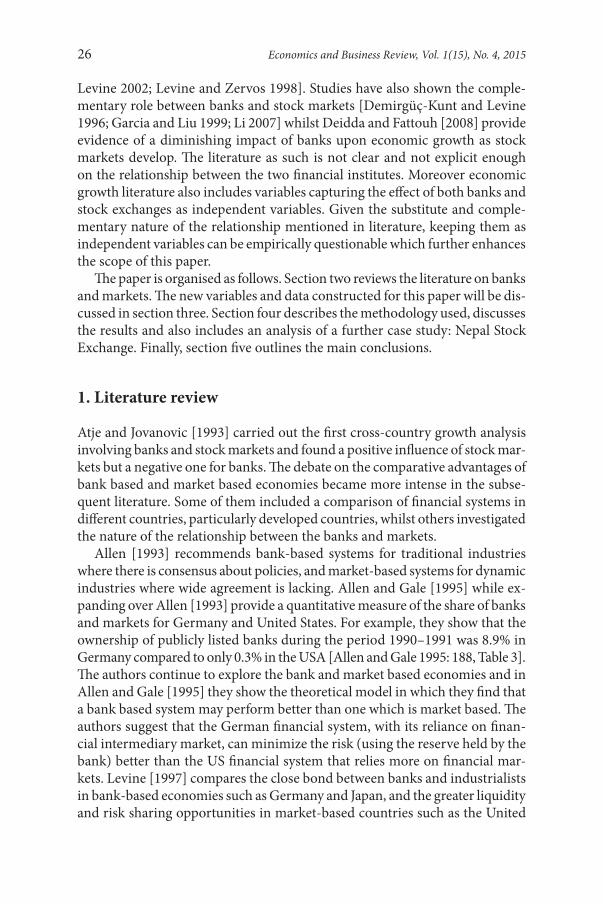
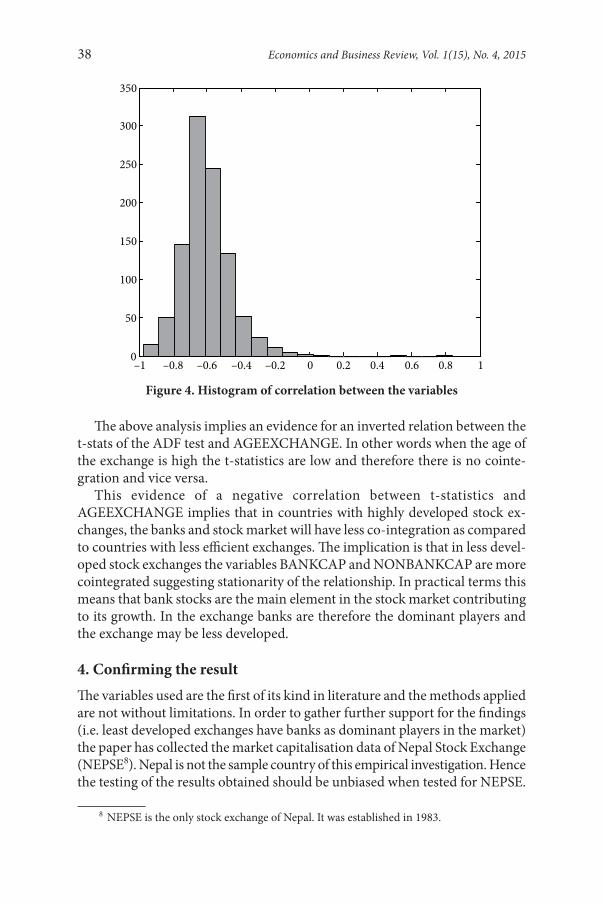
In addition, the re-sampling of the AGEXCHANGE and ADF t-statistics vectors a 1000 times is done to consider the variation in the resulting correla-tion coefficients. The correlation coefficient is computed on each sample and obtained the histogram that is shown in Figure 4 is obtained.
The histogram shows that nearly all the estimates lie on the interval [–1 to –0.2]. Next bootstrapping is done for the pairs consisting of t-stats of ADF test and GEXCHANGE (to construct a confidence interval). After bootstrap-ping the correlation coefficient 5,000 times (this also helps in minimising error bias in small time series data) at 95% confidence interval, lower/upper limit of –0.2103 and –0.8577 respectively are obtained.
38 Economics and Business Review, Vol. 1(15), No. 4, 2015
The above analysis implies an evidence for an inverted relation between the t-stats of the ADF test and AGEEXCHANGE. In other words when the age of the exchange is high the t-statistics are low and therefore there is no cointe-gration and vice versa.
This evidence of a negative correlation between t-statistics and AGEEXCHANGE implies that in countries with highly developed stock ex-changes, the banks and stock market will have less co-integration as compared to countries with less efficient exchanges. The implication is that in less devel-oped stock exchanges the variables BANKCAP and NONBANKCAP are more cointegrated suggesting stationarity of the relationship. In practical terms this means that bank stocks are the main element in the stock market contributing to its growth. In the exchange banks are therefore the dominant players and the exchange may be less developed.
4. Confirming the resultThe variables used are the first of its kind in literature and the methods applied are not without limitations. In order to gather further support for the findings (i.e. least developed exchanges have banks as dominant players in the market) the paper has collected the market capitalisation data of Nepal Stock Exchange (NEPSE8). Nepal is not the sample country of this empirical investigation. Hence the testing of the results obtained should be unbiased when tested for NEPSE.
8 NEPSE is the only stock exchange of Nepal. It was established in 1983.
Figure 4. Histogram of correlation between the variables
–1 –0.8 –0.6 –0.4 –0.2 0 0.2 0.4 0.6 0.8 10
50
100
150
200
250
300
350
B. Ghimire, R. Gautam, D. Karki, S. Sharma, Banks, non-bank companies and stock exchange 39
The numbers of listed companies in the exchange (as of July 2009) after sep-aration into financial and non-financial sectors are presented below.
The number of listed financial and non-financial companies in the exchange (as of July 2009) is presented below in Table 6.
Table 6. Number of listed companies in NEPSE
Types Total number of listed companies Category Number listed
Financial in-termediaries 133
Commercial banks 23
Finance companies 62
Development banks 32
Insurance companies 16
Non financial 31
Hotels 4
Manufacturing & processing 17
Others 2
HydroPower 4
Tradings 4
Source: NEPSE.
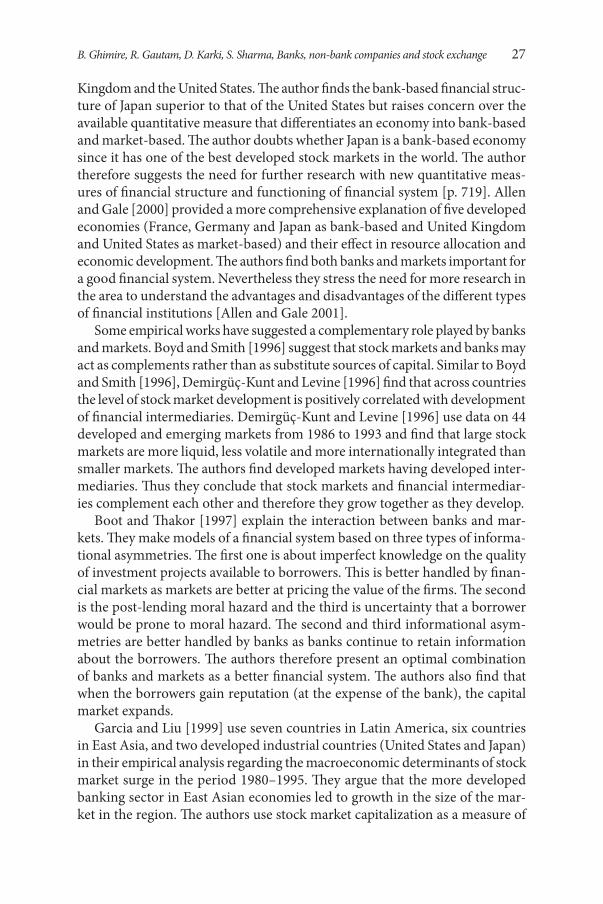
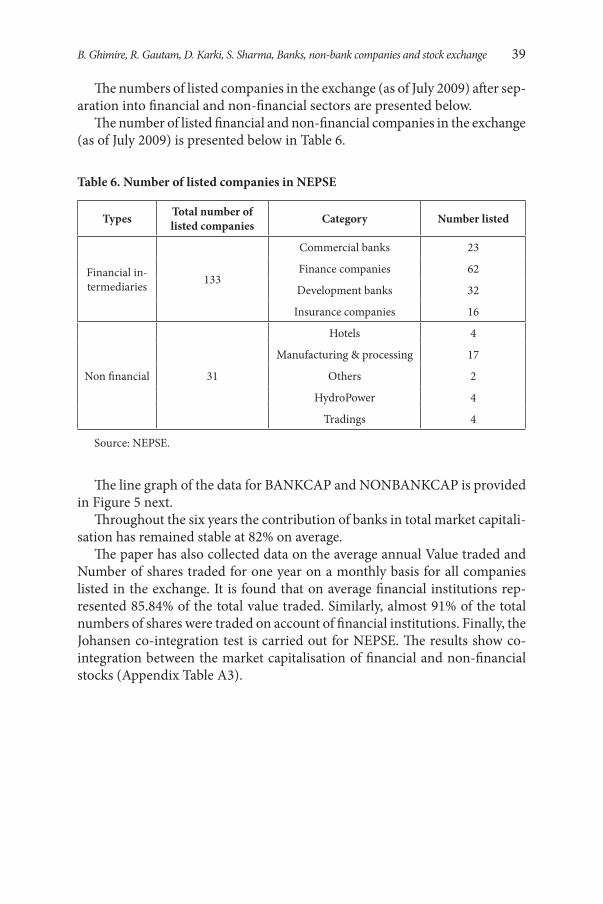
The line graph of the data for BANKCAP and NONBANKCAP is provided in Figure 5 next.
Throughout the six years the contribution of banks in total market capitali-sation has remained stable at 82% on average.
The paper has also collected data on the average annual Value traded and Number of shares traded for one year on a monthly basis for all companies listed in the exchange. It is found that on average financial institutions rep-resented 85.84% of the total value traded. Similarly, almost 91% of the total numbers of shares were traded on account of financial institutions. Finally, the Johansen co-integration test is carried out for NEPSE. The results show co-integration between the market capitalisation of financial and non-financial stocks (Appendix Table A3).
40 Economics and Business Review, Vol. 1(15), No. 4, 2015
Conclusions
To summarise, it is found that more developed exchanges have poor cointegra-tion with banks’ development. The hypothesis that under-developed exchanges will have a higher level of cointegration has been confirmed by the high 95% confidence interval of correlation coefficient. This implies that the less devel-oped exchanges are relying mainly upon banks and hence do not have a de-veloped stock exchange. Hence, our paper finds it important to list non-bank companies for the development of exchanges. It is however important to note that our results are the only tentative explanation of the relationship between the two institutes. The methods applied have limitations and given our lim-ited database a future research with extended time series will be beneficial to further confirm our results.
Figure 5. BANKCAP (Dashed line) and NONBANKCAP (Solid line) – NEPSE. Amount in million local currency
The sudden increase in the capitalization of non-bank companies in August 2008 is due to the listing of the telecommunication company (Nepal Doorsanchar Company Ltd.) into NEPSE.
Nepal Doorsanchar Company Ltd. was listed in the exchange on 25th August 2008 (The Himalayan Times, 26 August 2008, http://www.thehimalayantimes.com/)
0
50000
100000
150000
200000
250000
300000
350000
400000
450000
Aug-
03D
ec-0
3Ap
r-04
Aug-
04D
ec-0
4Ap
r-05
Aug-
05D
ec-0
5Ap
r-06
Aug-
06D
ec-0
6Ap
r-07
Aug-
07D
ec-0
7Ap
r-08
Aug-
08D
ec-0
8Ap
r-09
Month and year
B. Ghimire, R. Gautam, D. Karki, S. Sharma, Banks, non-bank companies and stock exchange 41
Appendix
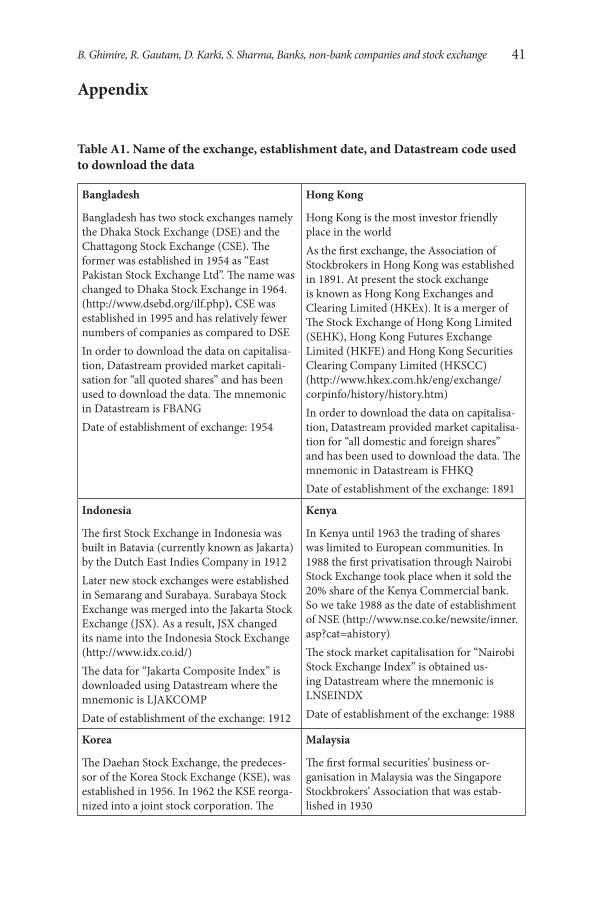
Table A1. Name of the exchange, establishment date, and Datastream code used to download the data
Bangladesh
Bangladesh has two stock exchanges namely the Dhaka Stock Exchange (DSE) and the Chattagong Stock Exchange (CSE). The former was established in 1954 as “East Pakistan Stock Exchange Ltd”. The name was changed to Dhaka Stock Exchange in 1964. (http://www.dsebd.org/ilf.php). CSE was established in 1995 and has relatively fewer numbers of companies as compared to DSEIn order to download the data on capitalisa-tion, Datastream provided market capitali-sation for “all quoted shares” and has been used to download the data. The mnemonic in Datastream is FBANGDate of establishment of exchange: 1954
Hong Kong
Hong Kong is the most investor friendly place in the worldAs the first exchange, the Association of Stockbrokers in Hong Kong was established in 1891. At present the stock exchange is known as Hong Kong Exchanges and Clearing Limited (HKEx). It is a merger of The Stock Exchange of Hong Kong Limited (SEHK), Hong Kong Futures Exchange Limited (HKFE) and Hong Kong Securities Clearing Company Limited (HKSCC) (http://www.hkex.com.hk/eng/exchange/corpinfo/history/history.htm)In order to download the data on capitalisa-tion, Datastream provided market capitalisa-tion for “all domestic and foreign shares” and has been used to download the data. The mnemonic in Datastream is FHKQDate of establishment of the exchange: 1891
Indonesia
The first Stock Exchange in Indonesia was built in Batavia (currently known as Jakarta) by the Dutch East Indies Company in 1912Later new stock exchanges were established in Semarang and Surabaya. Surabaya Stock Exchange was merged into the Jakarta Stock Exchange (JSX). As a result, JSX changed its name into the Indonesia Stock Exchange (http://www.idx.co.id/)The data for “Jakarta Composite Index” is downloaded using Datastream where the mnemonic is LJAKCOMPDate of establishment of the exchange: 1912
Kenya
In Kenya until 1963 the trading of shares was limited to European communities. In 1988 the first privatisation through Nairobi Stock Exchange took place when it sold the 20% share of the Kenya Commercial bank. So we take 1988 as the date of establishment of NSE (http://www.nse.co.ke/newsite/inner.asp?cat=ahistory)The stock market capitalisation for “Nairobi Stock Exchange Index” is obtained us-ing Datastream where the mnemonic is LNSEINDXDate of establishment of the exchange: 1988
Korea
The Daehan Stock Exchange, the predeces-sor of the Korea Stock Exchange (KSE), was established in 1956. In 1962 the KSE reorga-nized into a joint stock corporation. The
Malaysia
The first formal securities’ business or-ganisation in Malaysia was the Singapore Stockbrokers’ Association that was estab-lished in 1930
42 Economics and Business Review, Vol. 1(15), No. 4, 2015
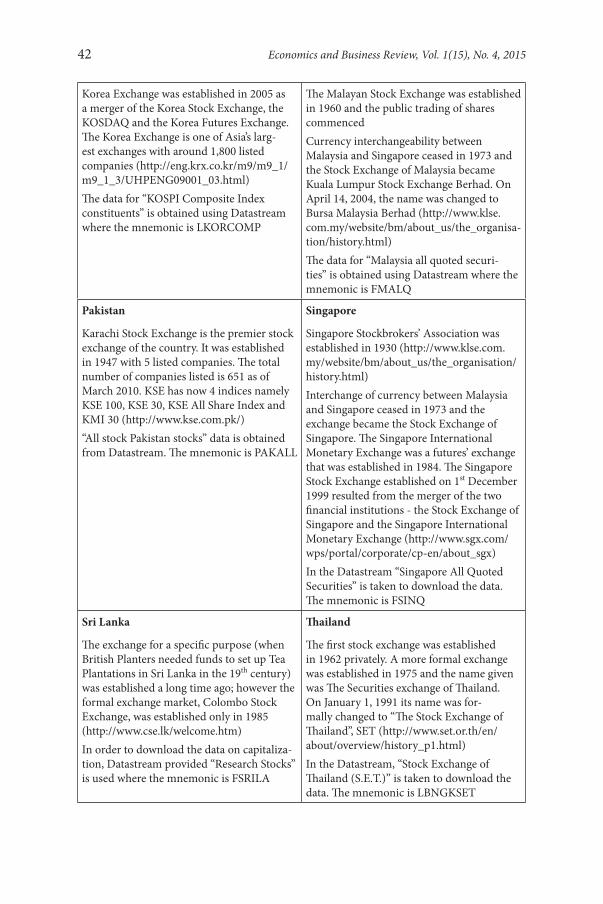
Korea Exchange was established in 2005 as a merger of the Korea Stock Exchange, the KOSDAQ and the Korea Futures Exchange. The Korea Exchange is one of Asia’s larg-est exchanges with around 1,800 listed companies (http://eng.krx.co.kr/m9/m9_1/m9_1_3/UHPENG09001_03.html)The data for “KOSPI Composite Index constituents” is obtained using Datastream where the mnemonic is LKORCOMP
The Malayan Stock Exchange was established in 1960 and the public trading of shares commencedCurrency interchangeability between Malaysia and Singapore ceased in 1973 and the Stock Exchange of Malaysia became Kuala Lumpur Stock Exchange Berhad. On April 14, 2004, the name was changed to Bursa Malaysia Berhad (http://www.klse.com.my/website/bm/about_us/the_organisa-tion/history.html)The data for “Malaysia all quoted securi-ties” is obtained using Datastream where the mnemonic is FMALQ
Pakistan
Karachi Stock Exchange is the premier stock exchange of the country. It was established in 1947 with 5 listed companies. The total number of companies listed is 651 as of March 2010. KSE has now 4 indices namely KSE 100, KSE 30, KSE All Share Index and KMI 30 (http://www.kse.com.pk/)“All stock Pakistan stocks” data is obtained from Datastream. The mnemonic is PAKALL
Singapore
Singapore Stockbrokers’ Association was established in 1930 (http://www.klse.com.my/website/bm/about_us/the_organisation/history.html)Interchange of currency between Malaysia and Singapore ceased in 1973 and the exchange became the Stock Exchange of Singapore. The Singapore International Monetary Exchange was a futures’ exchange that was established in 1984. The Singapore Stock Exchange established on 1st December 1999 resulted from the merger of the two financial institutions - the Stock Exchange of Singapore and the Singapore International Monetary Exchange (http://www.sgx.com/wps/portal/corporate/cp-en/about_sgx)In the Datastream “Singapore All Quoted Securities” is taken to download the data. The mnemonic is FSINQ
Sri Lanka
The exchange for a specific purpose (when British Planters needed funds to set up Tea Plantations in Sri Lanka in the 19th century) was established a long time ago; however the formal exchange market, Colombo Stock Exchange, was established only in 1985 (http://www.cse.lk/welcome.htm)In order to download the data on capitaliza-tion, Datastream provided “Research Stocks” is used where the mnemonic is FSRILA
Thailand
The first stock exchange was established in 1962 privately. A more formal exchange was established in 1975 and the name given was The Securities exchange of Thailand. On January 1, 1991 its name was for-mally changed to “The Stock Exchange of Thailand”, SET (http://www.set.or.th/en/about/overview/history_p1.html)In the Datastream, “Stock Exchange of Thailand (S.E.T.)” is taken to download the data. The mnemonic is LBNGKSET
B. Ghimire, R. Gautam, D. Karki, S. Sharma, Banks, non-bank companies and stock exchange 43
Country Test type and detail P-values
Bangladesh Unrestricted Cointegration Rank Test (Trace)No. of CE(s)None 0.00At most 1 0.34Unrestricted Cointegration Rank Test (Maximum Eigenvalue)No. of CE(s)None 0.00At most 1 0.34
Kenya Unrestricted Cointegration Rank Test (Trace)No. of CE(s)None * 0.08At most 1 0.77Unrestricted Cointegration Rank Test (Maximum Eigenvalue)No. of CE(s)None * 0.04At most 1 0.77
Hongkong Unrestricted Cointegration Rank Test (Trace)No. of CE(s)None 0.35At most 1 0.65Unrestricted Cointegration Rank Test (Maximum Eigenvalue)No. of CE(s)None 0.31At most 1 0.65
Indonesia No. of CE(s)None 0.17At most 1 0.56Unrestricted Cointegration Rank Test (Maximum Eigenvalue)No. of CE(s)None 0.15At most 1 0.56
Korea Unrestricted Cointegration Rank Test (Trace)No. of CE(s)None 0.16At most 1 0.69Unrestricted Cointegration Rank Test (Maximum Eigenvalue)No. of CE(s)None 0.11At most 1 0.69
Malaysia Unrestricted Cointegration Rank Test (Trace)No. of CE(s)None 0.11At most 1 0.98Unrestricted Cointegration Rank Test (Maximum Eigenvalue)No. of CE(s)None 0.03At most 1 0.98
Pakistan Unrestricted Cointegration Rank Test (Trace)No. of CE(s)None * 0.28At most 1 0.54Unrestricted Cointegration Rank Test (Maximum Eigenvalue)No. of CE(s)None * 0.28At most 1 0.54
Singapore Unrestricted Cointegration Rank Test (Trace)No. of CE(s)None 0.82At most 1 0.98Unrestricted Cointegration Rank Test (Maximum Eigenvalue)No. of CE(s)None 0.61At most 1 0.98
SriLanka Unrestricted Cointegration Rank Test (Trace)No. of CE(s)None * 0.42At most 1 0.33Unrestricted Cointegration Rank Test (Maximum Eigenvalue)No. of CE(s)None * 0.64At most 1 0.33
�ailand Unrestricted Cointegration Rank Test (Trace)No. of CE(s)None * 0.09At most 1 0.49Unrestricted Cointegration Rank Test (Maximum Eigenvalue)No. of CE(s)None * 0.08At most 1 0.49
Table A2. Results of Johansen [1988] Cointegration test
44 Economics and Business Review, Vol. 1(15), No. 4, 2015
References
Allen, F., 1993, Stock Markets and Resource Allocation, in: Mayer, C., Vives, X. (eds.) Capital Markets and Financial Intermediation, Cambridge University Press, Cambridge.
Allen, F., Gale, D., 1995, A Welfare Comparison of Intermediaries and Financial Markets in Germany and the US, European Economic Review, no. 39: 179–209.
Allen, F., Gale, D., 2000, Comparing Financial Systems, MIT Press, Cambridge, MA.Allen, F., Gale, D., 2001, Comparative Financial Systems: A Survey [online], Working
Papers, no. 15, Wharton School Center for Financial Institutions, http://fic.whar-ton.upenn.edu/fic/papers/01/0115.pdf [access: 9.05.2014].
Atje, R., Jovanovic, B., 1993, Stock Markets and Development, European Economic Review, no. 37: 632–640.
Beck, T., Levine, R., 2004, Stock Markets, Banks, and Growth: Panel Evidence, Journal of Banking & Finance, no. 28: 423–442.
Boot, A., Thakor, A., 1997, Financial System Architecture, Review of Financial Studies, no. 10: 693–733.
Boyd, J., Smith, B., 1996, The Coevolution of the Real and Financial Sectors in the Growth Process, The World Bank Economic Review, no. 10: 371–396.
Chakraborty, S., Ray, T., 2006, Bank-based versus Market-based Financial Systems: A Growth-theoretic Analysis, Journal of Monetary Economics, no. 53: 329–350.
Country Test type and detail P-values
Bangladesh Unrestricted Cointegration Rank Test (Trace)No. of CE(s)None 0.00At most 1 0.34Unrestricted Cointegration Rank Test (Maximum Eigenvalue)No. of CE(s)None 0.00At most 1 0.34
Kenya Unrestricted Cointegration Rank Test (Trace)No. of CE(s)None * 0.08At most 1 0.77Unrestricted Cointegration Rank Test (Maximum Eigenvalue)No. of CE(s)None * 0.04At most 1 0.77
Hongkong Unrestricted Cointegration Rank Test (Trace)No. of CE(s)None 0.35At most 1 0.65Unrestricted Cointegration Rank Test (Maximum Eigenvalue)No. of CE(s)None 0.31At most 1 0.65
Indonesia No. of CE(s)None 0.17At most 1 0.56Unrestricted Cointegration Rank Test (Maximum Eigenvalue)No. of CE(s)None 0.15At most 1 0.56
Korea Unrestricted Cointegration Rank Test (Trace)No. of CE(s)None 0.16At most 1 0.69Unrestricted Cointegration Rank Test (Maximum Eigenvalue)No. of CE(s)None 0.11At most 1 0.69
Malaysia Unrestricted Cointegration Rank Test (Trace)No. of CE(s)None 0.11At most 1 0.98Unrestricted Cointegration Rank Test (Maximum Eigenvalue)No. of CE(s)None 0.03At most 1 0.98
Pakistan Unrestricted Cointegration Rank Test (Trace)No. of CE(s)None * 0.28At most 1 0.54Unrestricted Cointegration Rank Test (Maximum Eigenvalue)No. of CE(s)None * 0.28At most 1 0.54
Singapore Unrestricted Cointegration Rank Test (Trace)No. of CE(s)None 0.82At most 1 0.98Unrestricted Cointegration Rank Test (Maximum Eigenvalue)No. of CE(s)None 0.61At most 1 0.98
SriLanka Unrestricted Cointegration Rank Test (Trace)No. of CE(s)None * 0.42At most 1 0.33Unrestricted Cointegration Rank Test (Maximum Eigenvalue)No. of CE(s)None * 0.64At most 1 0.33
�ailand Unrestricted Cointegration Rank Test (Trace)No. of CE(s)None * 0.09At most 1 0.49Unrestricted Cointegration Rank Test (Maximum Eigenvalue)No. of CE(s)None * 0.08At most 1 0.49
Table A3. Results of Johansen [1988] Cointegration Test: Nepal
Country Test type and detail P-values
Nepal Unrestricted Cointegration Rank Test (Trace)No. of CE(s)None 0.0671At most 1 0.6196Unrestricted Cointegration Rank Test (Maximum Eigenvalue)No. of CE(s)None* 0.0409At most 1 0.6196

B. Ghimire, R. Gautam, D. Karki, S. Sharma, Banks, non-bank companies and stock exchange 45
Deidda, L., Fattouh, B., 2008, Banks, Financial Markets and Growth, Journal of Financial Intermediation, no. 17: 6–36.
Demirgüç-Kunt, A., Levine, R., 1996, Stock Market Development and Financial Intermediaries: Stylized Facts, World Bank Economic Review, no. 10: 291–321.
Engle, R., Granger, C., 1987, Co-Integration and Error Correction: Representation, Estimation, and Testing, Econometrica, no. 55: 251–276.
Garcia, V., Liu, L., 1999, Macroeconomic Determinants of Stock Market Development, Journal of Applied Economics, no. 2: 29–59.
Ghimire, B., Giorgioni, G., 2013, Finance and Growth: An Investigation into the Role of Internal, Bank and Equity Finances, Poznań University of Economics Review, no. 14: 31–46.
Johansen, S., 1988, Statistical Analysis of Cointegration Vectors, Journal of Economic Dynamics and Control, no. 12: 231–254.
Lee, B., 2012, Bank Based and Market Based Financial Systems: Time-series Evidence, Pacific-Basin Financial Journal, no. 20: 179–197.
Levine, R., 1997, Financial Development and Economic Growth: Views and Agenda, Journal of Economic Literature, no. 35: 688–726.
Levine, R., 2002, Bank-based or Market-based Financial Systems: Which Is Better?, Journal of Financial Intermediation, no. 11: 398–428.
Levine, R., Zervos, S., 1998, Stock Markets, Banks, and Economic Growth, American Economic Review, no. 88: 537–558.
Li, K., 2007, The Growth in Equity Market Size and Trading Activity: An International Study, Journal of Empirical Finance, no. 14: 59–90.
Loayza, N., Rancière, R., 2006, Financial Development, Financial Fragility, and Growth, Journal of Money, Credit & Banking, no. 38: 1051–1076.
Minier, J., 2009, Opening a Stock Exchange, Journal of Development Economics, no. 90: 135–43.
Saci, K., Giorgioni, G., Holden, K., 2009, Does Financial Development Affect Growth?, Applied Economics, no. 41: 1701–1707.
Vithessonthi, C., 2014, The Effect of Financial Market Development on Bank Risk: Evidence from Southeast Asian Countries, International Review of Financial Analysis, no. 35: 249–260.
Editorial BoardRyszard BarczykWitold JurekCezary KochalskiTadeusz Kowalski (Editor-in-Chief)Henryk MrukIda MusiałkowskaJerzy SchroederJacek WalluschMaciej Żukowski
International Editorial Advisory BoardUdo Broll – School of International Studies (ZIS), Technische Universität, DresdenWojciech Florkowski – University of Georgia, Gri� nBinam Ghimire – Northumbria University, Newcastle upon TyneChristopher J. Green – Loughborough UniversityJohn Hogan – Georgia State University, AtlantaBruce E. Kaufman – Georgia State University, AtlantaSteve Letza – Corporate Governance Business School Bournemouth UniversityVictor Murinde – University of BirminghamHugh Scullion – National University of Ireland, GalwayYochanan Shachmurove – � e City College, City University of New YorkRichard Sweeney – � e McDonough School of Business, Georgetown University, Washington D.C.� omas Taylor – School of Business and Accountancy, Wake Forest University, Winston-SalemClas Wihlborg – Argyros School of Business and Economics, Chapman University, OrangeJan Winiecki – University of Information Technology and Management in RzeszówHabte G. Woldu – School of Management, � e University of Texas at Dallas
� ematic EditorsEconomics: Ryszard Barczyk, Tadeusz Kowalski, Ida Musiałkowska, Jacek Wallusch, Maciej Żukowski • Econometrics: Witold Jurek, Jacek Wallusch • Finance: Witold Jurek, Cezary Kochalski • Management and Marketing: Henryk Mruk, Cezary Kochalski, Ida Musiałkowska, Jerzy Schroeder • Statistics: Elżbieta Gołata, Krzysztof SzwarcLanguage Editor: Owen Easteal • IT Editor: Piotr Stolarski
© Copyright by Poznań University of Economics, Poznań 2015
Paper based publication
ISSN 2392-1641
POZNAŃ UNIVERSITY OF ECONOMICS PRESSul. Powstańców Wielkopolskich 16, 61-895 Poznań, Polandphone +48 61 854 31 54, +48 61 854 31 55, fax +48 61 854 31 59www.wydawnictwo-ue.pl, e-mail: [email protected] address: al. Niepodległości 10, 61-875 Poznań, Poland
Printed and bound in Poland by:Poznań University of Economics Print Shop
Circulation: 300 copies
Aims and Scope
Economics and Business Review is the successor to the Poznań University of Economics Review which was published by the Poznań University of Economics Press in 2001–2014. � e Economics and Business Review is a quarterly journal focusing on theoretical and applied research work in the � elds of economics, man-agement and � nance. � e Review welcomes the submission of articles for publication dealing with micro, mezzo and macro issues. All texts are double-blind assessed by independent reviewers prior to acceptance.
Notes for Contributors
1. Articles submitted for publication in the Economics and Business Review should contain original, unpublished work not submitted for publication elsewhere.
2. Manuscripts intended for publication should be written in English and edited in Word and sent to: [email protected]. Authors should upload two versions of their manuscript. One should be a com-plete text, while in the second all document information identifying the author(s) should be removed from � les to allow them to be sent to anonymous referees.
3. � e manuscripts are to be typewritten in 12’ font in A4 paper format and be le� -aligned. Pages should be numbered.
4. � e papers submitted should have an abstract of not more than 100 words, keywords and the Journal of Economic Literature classi� cation code.
5. Acknowledgements and references to grants, a� liation, postal and e-mail addresses, etc. should appear as a separate footnote to the author’s namea, b, etc and should not be included in the main list of footnotes.
6. Footnotes should be listed consecutively throughout the text in Arabic numerals. Cross-references should refer to particular section numbers: e.g.: See Section 1.4.
7. Quoted texts of more than 40 words should be separated from the main body by a four-spaced inden-tation of the margin as a block.
8. Mathematical notations should meet the following guidelines: – symbols representing variables should be italicized, – avoid symbols above letters and use acceptable alternatives (Y*) where possible, – where mathematical formulae are set out and numbered these numbers should be placed against the right margin as... (1),
– before submitting the � nal manuscript, check the layout of all mathematical formulae carefully ( including alignments, centring length of fraction lines and type, size and closure of brackets, etc.),
– where it would assist referees authors should provide supplementary mathematical notes on the derivation of equations.
9. References in the text should be indicated by the author’s name, date of publication and the page num-ber where appropriate, e.g. Acemoglu and Robinson [2012], Hicks [1965a, 1965b]. References should be listed at the end of the article in the style of the following examples:Acemoglu, D., Robinson, J.A., 2012, Why Nations Fail. � e Origins of Power, Prosperity and Poverty,
Pro� le Books, London.Kalecki, M., 1943, Political Aspects of Full Employment, � e Political Quarterly, vol. XIV, no. 4: 322–331.Simon, H.A., 1976, From Substantive to Procedural Rationality, in: Latsis, S.J. (ed.), Method and Appraisal
in Economics, Cambridge University Press, Cambridge: 15–30.10. Copyrights will be established in the name of the E&BR publisher, namely the Poznań University of
Economics Press.
More information and advice on the suitability and formats of manuscripts can be obtained from:Economics and Business Reviewal. Niepodległości 1061-875 PoznańPolande-mail: [email protected]
Volume 1 (15) Number 4 2015
Volume 1 (15)
Num
ber 4 2015
CONTENTS
ARTICLES
A turnpike theorem for non-stationary Gale economy with limit technology. A particular caseEmil Panek
Product market cooperation under e� cient bargaining with di� erent disagreement points: a resultDomenico Buccella
Banks, non-bank companies and stock exchange: do we know the relationship?Binam Ghimire, Rishi Gautam, Dipesh Karki, Satish Sharma
Measuring the usefulness of information publication time to proxy for returnsItai Blitzer
Business tendency survey data. Where do the respondents’ opinions come from?Sławomir Kalinowski, Małgorzata Kokocińska
Does outward FDI by Polish multinationals support existing theory? Findings from a quantitative studyMarian Gorynia, Jan Nowak, Piotr Trąpczyński, Radosław Wolniak
� e complex relationship between intrinsic and extrinsic rewardsOrni Gov
Improvement of the communication between teachers and students in the coaching programme and in a process of action researchMichal Lory
BOOK REVIEWS
Barney G. Glaser, Choosing Classic Grounded � eory: a Grounded � eory Reader of Expert Advice, CA: Sociology Press, Mill Valley 2014 (Gary Evans)
Volume 1 (15) Number 2 2015
Subscription
Economics and Business Review (E&BR) is published quarterly and is the successor to the Poznań University of Economics Review. � e E&BR is published by the Poznań University of Economics Press.
E&BR is listed in ProQuest, EBSCO, and BazEkon.
Subscription rates for the print version of the E&BR: institutions: 1 year – €50.00; individuals: 1 year – €25.00. Single copies: institutions – €15.00; individuals – €10.00. � e E&BR on-line edition is free of charge.
Correspondence with regard to subscriptions should be addressed to: Księgarnia Uniwersytetu Ekonomicznego w Poznaniu, ul. Powstańców Wielkopolskich 16, 61-895 Poznań, Poland, fax: +48 61 8543147; e-mail: [email protected].
Payments for subscriptions or single copies should be made in Euros to Księgarnia Uniwersytetu Ekonomicznego w Poznaniu by bank transfer to account No.: 96 1090 1476 0000 0000 4703 1245.
Poznań University of Economics Press
ISSN 2392-1641
Economicsand Business
Economics and B
usiness Review
Review
![[XLS] · Web viewBIKRANT KUMAR SINGH BIKY SINGH KUSHWAHA BIMAL BASHYAL BIMAL BHWEDYO BIMAL BUDHATHOKI BIMAL GAUTAM BIMAL KARKI BIMAL KHADKA BIMAL LUITEL BIMAL SUBEDI BIMALA GHIMIRE](https://img.dokumen.tips/doc/110x75/5abf7a797f8b9add5f8dc631/xls-viewbikrant-kumar-singh-biky-singh-kushwaha-bimal-bashyal-bimal-bhwedyo-bimal.jpg)