Embed Size (px)
Citation preview

Cisco Tidal Enterprise Scheduler 6.2.1 Performance and Tuning Guide
April 11, 2016
Americas HeadquartersCisco Systems, Inc.170 West Tasman DriveSan Jose, CA 95134-1706 USAhttp://www.cisco.comTel: 408 526-4000
800 553-NETS (6387)Fax: 408 527-0883
Text Part Number: OL-32249-01

THE SPECIFICATIONS AND INFORMATION REGARDING THE PRODUCTS IN THIS MANUAL ARE SUBJECT TO CHANGE WITHOUT NOTICE. ALL STATEMENTS, INFORMATION, AND RECOMMENDATIONS IN THIS MANUAL ARE BELIEVED TO BE ACCURATE BUT ARE PRESENTED WITHOUT WARRANTY OF ANY KIND, EXPRESS OR IMPLIED. USERS MUST TAKE FULL RESPONSIBILITY FOR THEIR APPLICATION OF ANY PRODUCTS.
THE SOFTWARE LICENSE AND LIMITED WARRANTY FOR THE ACCOMPANYING PRODUCT ARE SET FORTH IN THE INFORMATION PACKET THAT SHIPPED WITH THE PRODUCT AND ARE INCORPORATED HEREIN BY THIS REFERENCE. IF YOU ARE UNABLE TO LOCATE THE SOFTWARE LICENSE OR LIMITED WARRANTY, CONTACT YOUR CISCO REPRESENTATIVE FOR A COPY.
The Cisco implementation of TCP header compression is an adaptation of a program developed by the University of California, Berkeley (UCB) as part of UCB’s public domain version of the UNIX operating system. All rights reserved. Copyright © 1981, Regents of the University of California.
NOTWITHSTANDING ANY OTHER WARRANTY HEREIN, ALL DOCUMENT FILES AND SOFTWARE OF THESE SUPPLIERS ARE PROVIDED “AS IS” WITH ALL FAULTS. CISCO AND THE ABOVE-NAMED SUPPLIERS DISCLAIM ALL WARRANTIES, EXPRESSED OR IMPLIED, INCLUDING, WITHOUT LIMITATION, THOSE OF MERCHANTABILITY, FITNESS FOR A PARTICULAR PURPOSE AND NONINFRINGEMENT OR ARISING FROM A COURSE OF DEALING, USAGE, OR TRADE PRACTICE.
IN NO EVENT SHALL CISCO OR ITS SUPPLIERS BE LIABLE FOR ANY INDIRECT, SPECIAL, CONSEQUENTIAL, OR INCIDENTAL DAMAGES, INCLUDING, WITHOUT LIMITATION, LOST PROFITS OR LOSS OR DAMAGE TO DATA ARISING OUT OF THE USE OR INABILITY TO USE THIS MANUAL, EVEN IF CISCO OR ITS SUPPLIERS HAVE BEEN ADVISED OF THE POSSIBILITY OF SUCH DAMAGES.
Cisco and the Cisco logo are trademarks or registered trademarks of Cisco and/or its affiliates in the U.S. and other countries. To view a list of Cisco trademarks, go to this URL: www.cisco.com/go/trademarks. Third-party trademarks mentioned are the property of their respective owners. The use of the word partner does not imply a partnership relationship between Cisco and any other company. (1110R)
Any Internet Protocol (IP) addresses and phone numbers used in this document are not intended to be actual addresses and phone numbers. Any examples, command display output, network topology diagrams, and other figures included in the document are shown for illustrative purposes only. Any use of actual IP addresses or phone numbers in illustrative content is unintentional and coincidental.
Cisco Tidal Enterprise Scheduler 6.2.1 Performance and Tuning Guide© 2016 Cisco Systems, Inc. All rights reserved.
6.2.1 SP3
C O N T E N T S
Preface i
Audience i
Obtaining Documentation and Submitting a Service Request iRelated Documentation i
Document Change History ii
Optimizing TES Performance 1-3
TES 6.2.1 Hardware Requirements 1-3
Configuration Definition 1-3
Master Configuration 1-4
Client Manager Configuration 1-4
Master and Client Manager DB Configuration 1-4
Java Client Configuration 1-4
Adapter Configuration 1-5
Transporter Configuration 1-5
Performance Matrix 1-6
Monitoring TES 2-7
Overview 2-7
Monitoring with JConsole 2-7
Connecting JConsole 2-7
Viewing a System Overview 2-9
Viewing Memory Usage 2-10
Viewing Active Threads 2-11
Viewing a VM Summary 2-12
Monitoring Scheduling Activity 2-13
Viewing MBeans 2-13
Viewing Connected Users 2-14
Viewing Job Activity 2-15
Viewing Master Status 2-16
Viewing Queue Activity 2-17
Viewing Event Activity 2-18
Monitoring the Overall Message System 2-19
Monitoring a Message Queue 2-20
1Cisco Tidal Enterprise Scheduler Performance and Tuning Guide
Contents
Monitoring a Message Thread 2-21
Monitoring a Message Thread Pool 2-22
Monitoring Schedule Compiling 2-23
Master Status-Compile Status 2-23
Monitoring the Queue Manager Compiler 2-24
Monitoring the Message Queue Compiler 2-25
Monitoring Adapter/Agent Connections 2-26
Viewing All Connections and Statuses 2-26
Monitoring Adapter Connections via JConsole 2-27
Monitoring the TES Java Application Performance 2-28
Monitoring the Cache Sync 2-29
Viewing the Cache Sync Logging 2-29
Viewing the Client Manager Output Log 2-31
Tuning TES 3-33
Overview 3-33
Configuration and Tuning 3-33
Memory 3-33
CPU 3-33
JMS 3-34
Master Messaging 3-36
Size-Based Guidelines for Tuning Parameters 3-37
Small Configuration 3-37
Medium Configuration 3-38
Large Configuration 3-39
Transporter Performance 4-43
General Best Practices 4-43
Transporter Job Read Options 4-43
2Cisco Tidal Enterprise Scheduler Performance and Tuning Guide
6.2.1 SP3
Preface
The purpose of this document is to help you troubleshoot performance issues with Tidal Enterprise Scheduler.
AudienceThis guide is for administrators who install, configure, monitor, and tune the Tidal Enterprise Scheduler for better performance.
Obtaining Documentation and Submitting a Service RequestFor information on obtaining documentation, submitting a service request, and gathering additional information, see the monthly What's New in Cisco Product Documentation, which also lists all new and revised Cisco technical documentation, at:
http://www.cisco.com/en/US/docs/general/whatsnew/whatsnew.html
Subscribe to the What's New in Cisco Product Documentation as a Really Simple Syndication (RSS) feed and set content to be delivered directly to your desktop using a reader application. The RSS feeds are a free service and Cisco currently supports RSS Version 2.0.
Related DocumentationYou can access the following additional Cisco Tidal Enterprise Scheduler guides on the Cisco Tidal Enterprise Scheduler page on Cisco.com:
• Cisco Tidal Enterprise Scheduler Documentation Overview.
• Cisco Tidal Enterprise Scheduler Release Notes.
• Cisco Tidal Enterprise Scheduler Installation Guide.
• Cisco Tidal Enterprise Scheduler User Guide.
• Cisco Tidal Enterprise Scheduler Performance and Tuning Guide. (this document)
Cisco Tidal Enterprise Scheduler data sheets and other TES documents can be found at:
http://www.cisco.com/c/en/us/products/cloud-systems-management/tidal-enterprise-scheduler/literature.html.
iCisco Tidal Enterprise Scheduler Performance and Tuning Guide
6.2.1 SP3
Chapter
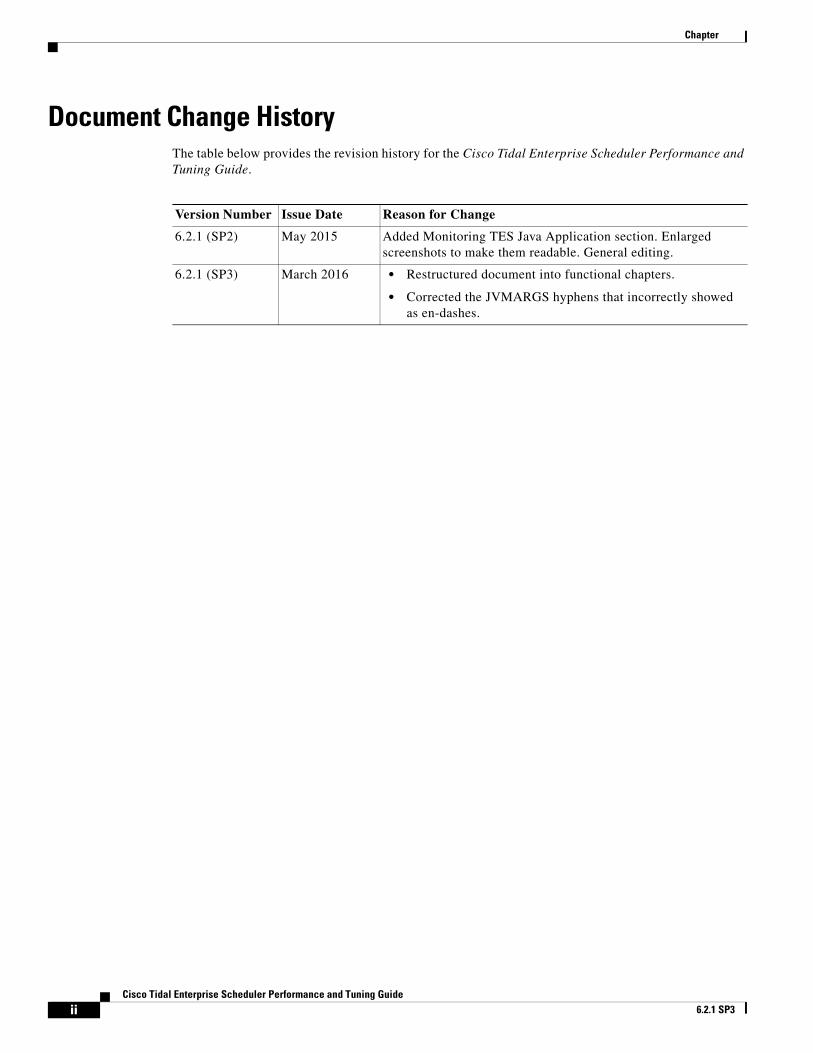
Document Change HistoryThe table below provides the revision history for the Cisco Tidal Enterprise Scheduler Performance and Tuning Guide.
Version Number Issue Date Reason for Change
6.2.1 (SP2) May 2015 Added Monitoring TES Java Application section. Enlarged screenshots to make them readable. General editing.
6.2.1 (SP3) March 2016 • Restructured document into functional chapters.
• Corrected the JVMARGS hyphens that incorrectly showed as en-dashes.
iiCisco Tidal Enterprise Scheduler Performance and Tuning Guide
6.2.1 SP3
Cisco Tidal E6.2.1 SP3
C H A P T E R 1
Optimizing TES PerformanceOptimization and tuning is an exact science which is why it is critical to be able to recognize which parts of the system are being stressed (monitoring) and then knowing what parameters should be adjusted to reduce that stress (tuning). This chapter describes:
• TES 6.2.1 Hardware Requirements
• Performance Matrix
Monitoring tasks are described in the Monitoring TES chapter.
Tuning tasks are described in the Tuning TES chapter.
See Transporter Performance for the best practices and configuration options for the Transporter.
TES 6.2.1 Hardware RequirementsHardware requirements are provided below for small, medium, and large systems as defined in “Configuration Definition” for these TES components:
• “Master Configuration”
• “Client Manager Configuration”
• “Master and Client Manager DB Configuration”
• “Java Client Configuration”
• “Adapter Configuration”
• “Transporter Configuration”
Note All memory, CPU, and disk requirements in this section are for TES-related components only, and do not take into account any additional OS/application requirements.
Configuration DefinitionWhen referring to configuration sizes in the following sections, we use these definitions:
Configuration Size Jobs Definition DB Size
Small Configuration 1 – 3000 < 4 GB
3nterprise Scheduler Performance and Tuning Guide
Chapter 1 Optimizing TES Performance TES 6.2.1 Hardware Requirements
Also see Size-Based Guidelines for Tuning Parameters.
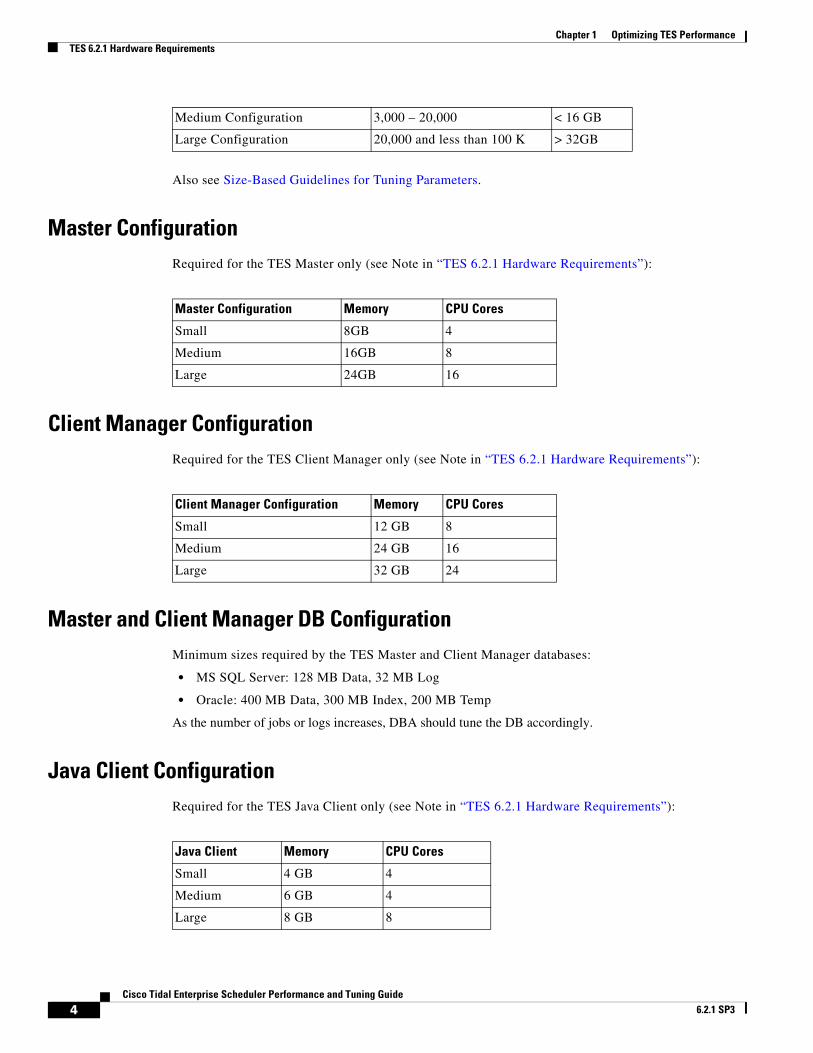
Master ConfigurationRequired for the TES Master only (see Note in “TES 6.2.1 Hardware Requirements”):
Client Manager ConfigurationRequired for the TES Client Manager only (see Note in “TES 6.2.1 Hardware Requirements”):
Master and Client Manager DB ConfigurationMinimum sizes required by the TES Master and Client Manager databases:
• MS SQL Server: 128 MB Data, 32 MB Log
• Oracle: 400 MB Data, 300 MB Index, 200 MB Temp
As the number of jobs or logs increases, DBA should tune the DB accordingly.
Java Client ConfigurationRequired for the TES Java Client only (see Note in “TES 6.2.1 Hardware Requirements”):
Medium Configuration 3,000 – 20,000 < 16 GB
Large Configuration 20,000 and less than 100 K > 32GB
Master Configuration Memory CPU Cores
Small 8GB 4
Medium 16GB 8
Large 24GB 16
Client Manager Configuration Memory CPU Cores
Small 12 GB 8
Medium 24 GB 16
Large 32 GB 24
Java Client Memory CPU Cores
Small 4 GB 4
Medium 6 GB 4
Large 8 GB 8
4Cisco Tidal Enterprise Scheduler Performance and Tuning Guide
6.2.1 SP3
Chapter 1 Optimizing TES PerformanceTES 6.2.1 Hardware Requirements
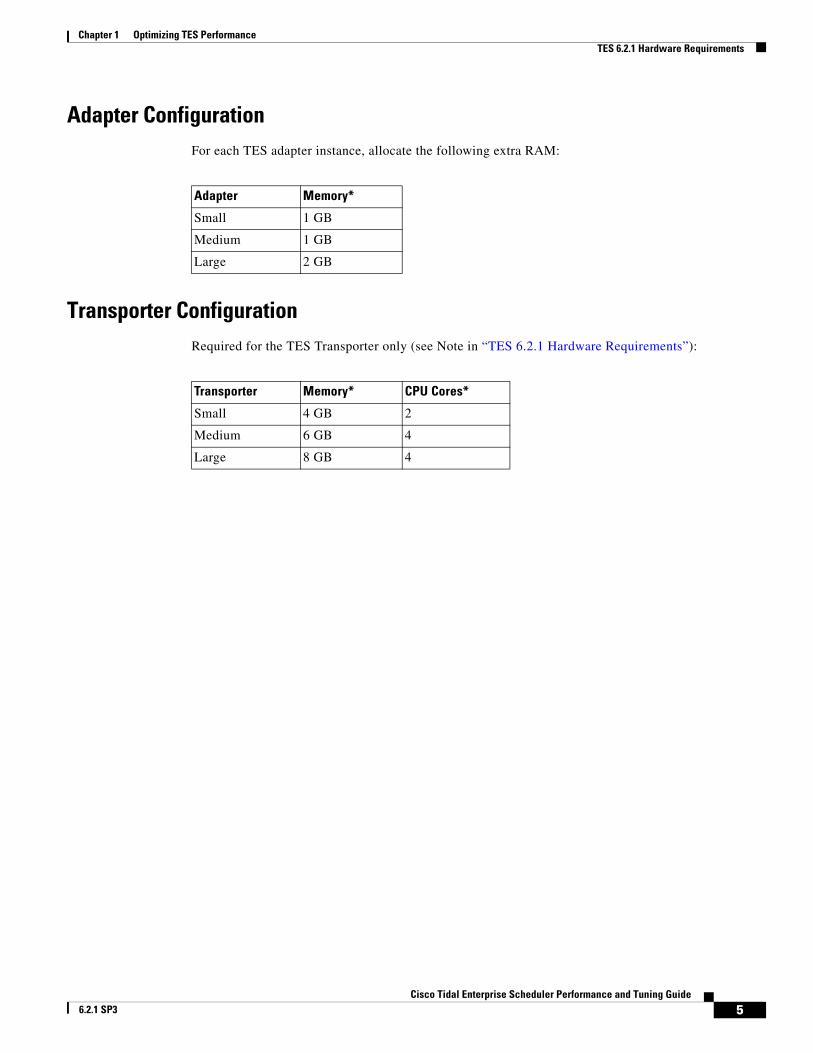
Adapter ConfigurationFor each TES adapter instance, allocate the following extra RAM:
Transporter ConfigurationRequired for the TES Transporter only (see Note in “TES 6.2.1 Hardware Requirements”):
Adapter Memory*
Small 1 GB
Medium 1 GB
Large 2 GB
Transporter Memory* CPU Cores*
Small 4 GB 2
Medium 6 GB 4
Large 8 GB 4
5Cisco Tidal Enterprise Scheduler Performance and Tuning Guide
6.2.1 SP3
Chapter 1 Optimizing TES Performance Performance Matrix
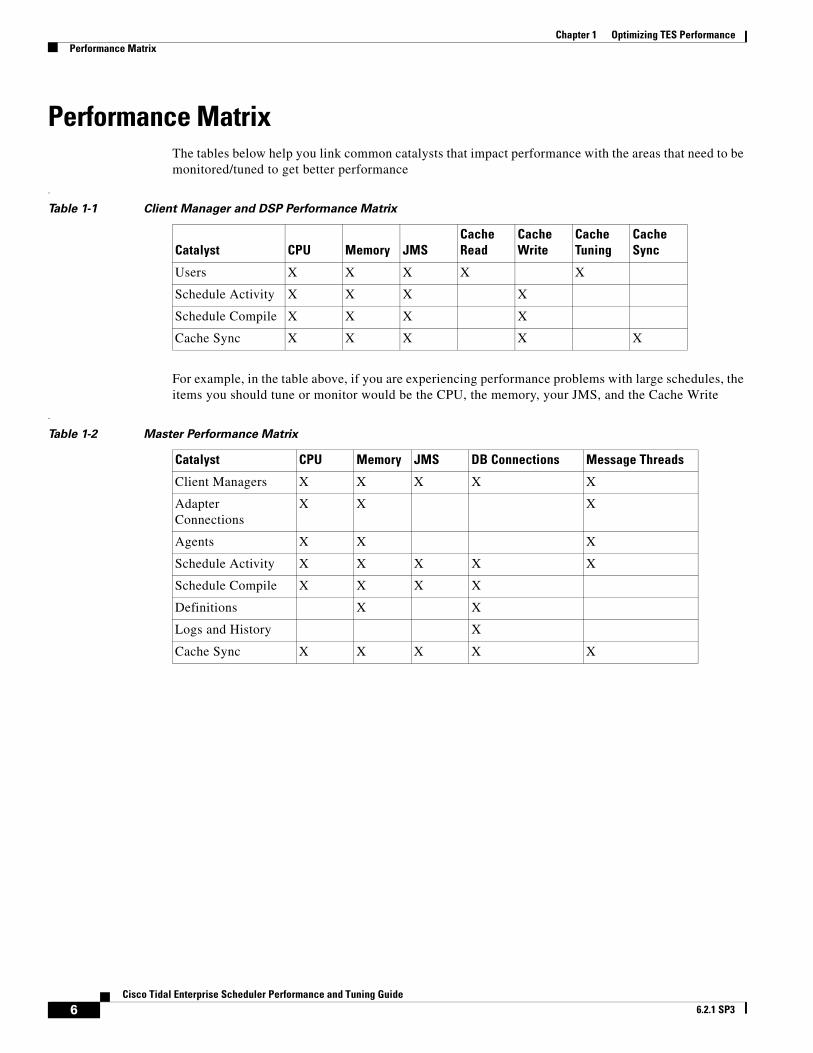
Performance MatrixThe tables below help you link common catalysts that impact performance with the areas that need to be monitored/tuned to get better performance
.
For example, in the table above, if you are experiencing performance problems with large schedules, the items you should tune or monitor would be the CPU, the memory, your JMS, and the Cache Write
.
Table 1-1 Client Manager and DSP Performance Matrix
Catalyst CPU Memory JMSCache Read
Cache Write
Cache Tuning
Cache Sync
Users X X X X X
Schedule Activity X X X X
Schedule Compile X X X X
Cache Sync X X X X X
Table 1-2 Master Performance Matrix
Catalyst CPU Memory JMS DB Connections Message Threads
Client Managers X X X X X
Adapter Connections
X X X
Agents X X X
Schedule Activity X X X X X
Schedule Compile X X X X
Definitions X X
Logs and History X
Cache Sync X X X X X
6Cisco Tidal Enterprise Scheduler Performance and Tuning Guide
6.2.1 SP3
Cisco Tidal E6.2.1 SP3
C H A P T E R 2
Monitoring TESOverviewThis chapter covers the tasks you can use to monitor TES performance:
• Monitoring with JConsole, page 2-7
• Monitoring Scheduling Activity, page 2-13
• Monitoring Schedule Compiling, page 2-23
• Monitoring Adapter/Agent Connections, page 2-26
• Monitoring the TES Java Application Performance, page 2-28
• Monitoring the Cache Sync, page 2-29
Monitoring with JConsoleJConsole is a diagnostic tool that comes with the standard JDK. It allows you to connect directly to a running JVM and monitor many performance metrics, including memory/CPU usage. JConsole can also be used to access diagnostic modules exposed by each individual application called MBeans. Both the Master and Client Manager expose MBeans.
Connecting JConsoleBefore connecting JConsole to either the Client Manager or Master, make sure the following property is set in clientmgr.props or master.props.
JmxOn=Y
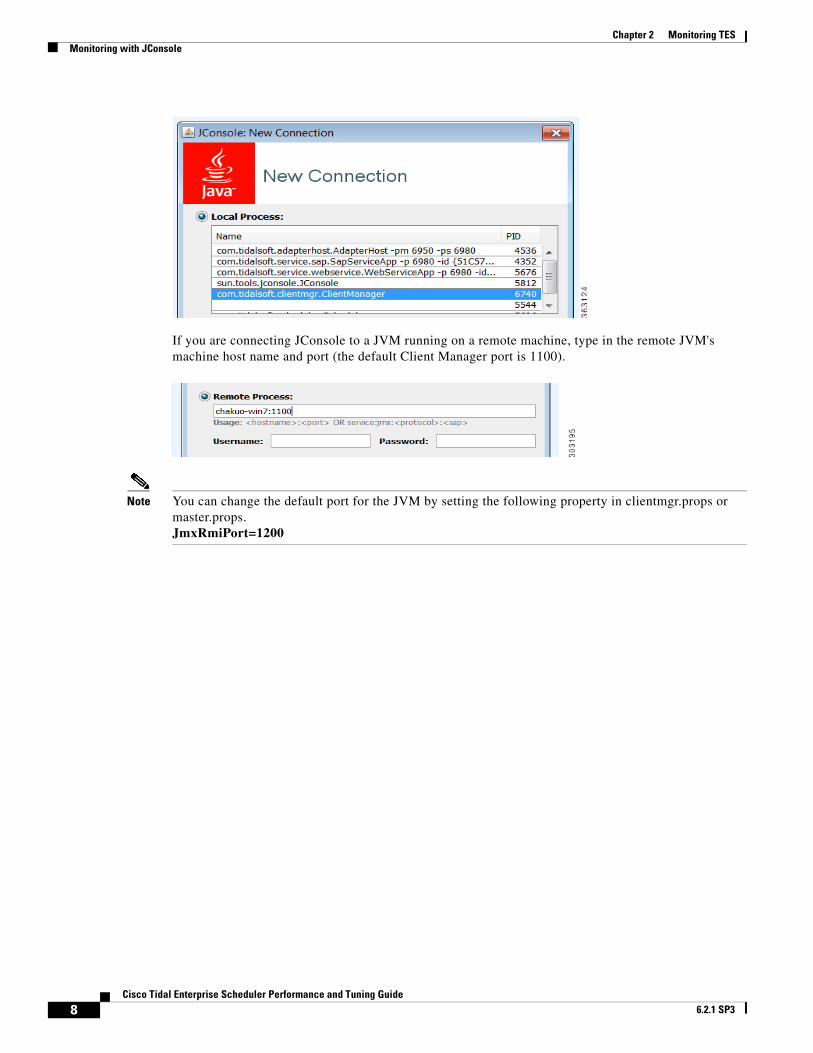
If you are running JConsole on the same machine as the JVM you are connecting to, the JVM will be listed in JConsole.
7nterprise Scheduler Performance and Tuning Guide
Chapter 2 Monitoring TES Monitoring with JConsole
If you are connecting JConsole to a JVM running on a remote machine, type in the remote JVM's machine host name and port (the default Client Manager port is 1100).
Note You can change the default port for the JVM by setting the following property in clientmgr.props or master.props.JmxRmiPort=1200
8Cisco Tidal Enterprise Scheduler Performance and Tuning Guide
6.2.1 SP3
Chapter 2 Monitoring TESMonitoring with JConsole
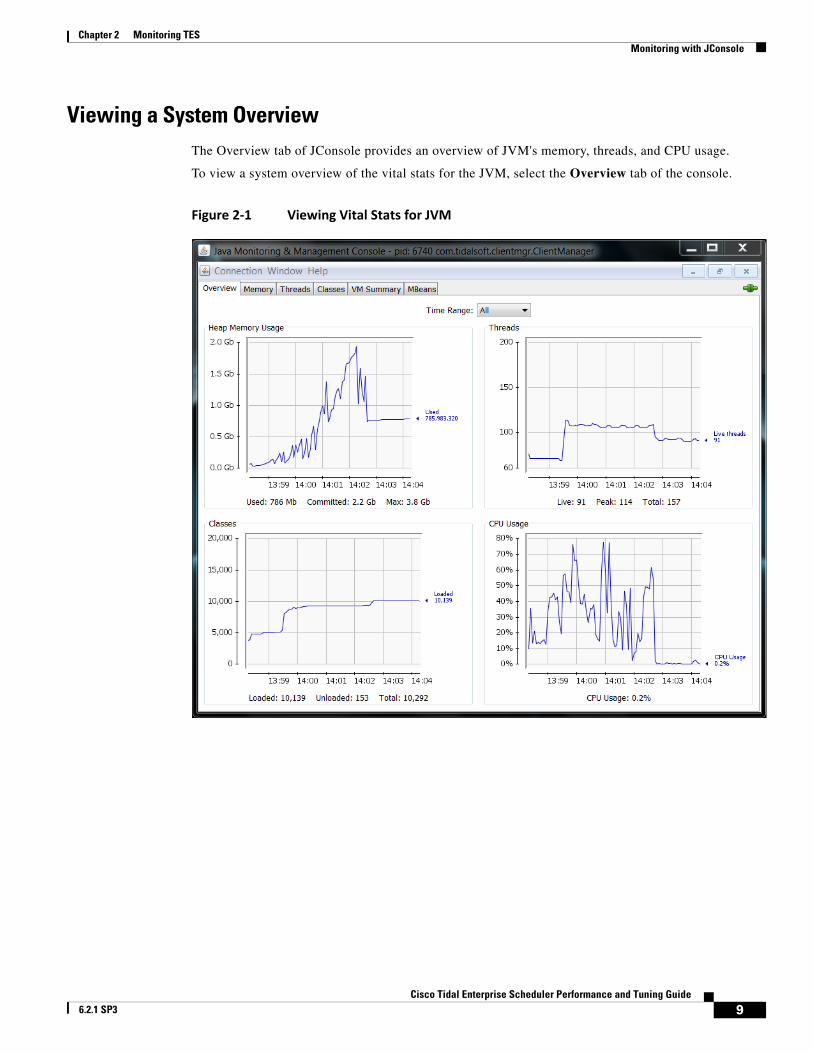
Viewing a System OverviewThe Overview tab of JConsole provides an overview of JVM's memory, threads, and CPU usage.
To view a system overview of the vital stats for the JVM, select the Overview tab of the console.
Figure 2‐1 Viewing Vital Stats for JVM
9Cisco Tidal Enterprise Scheduler Performance and Tuning Guide
6.2.1 SP3
Chapter 2 Monitoring TES Monitoring with JConsole
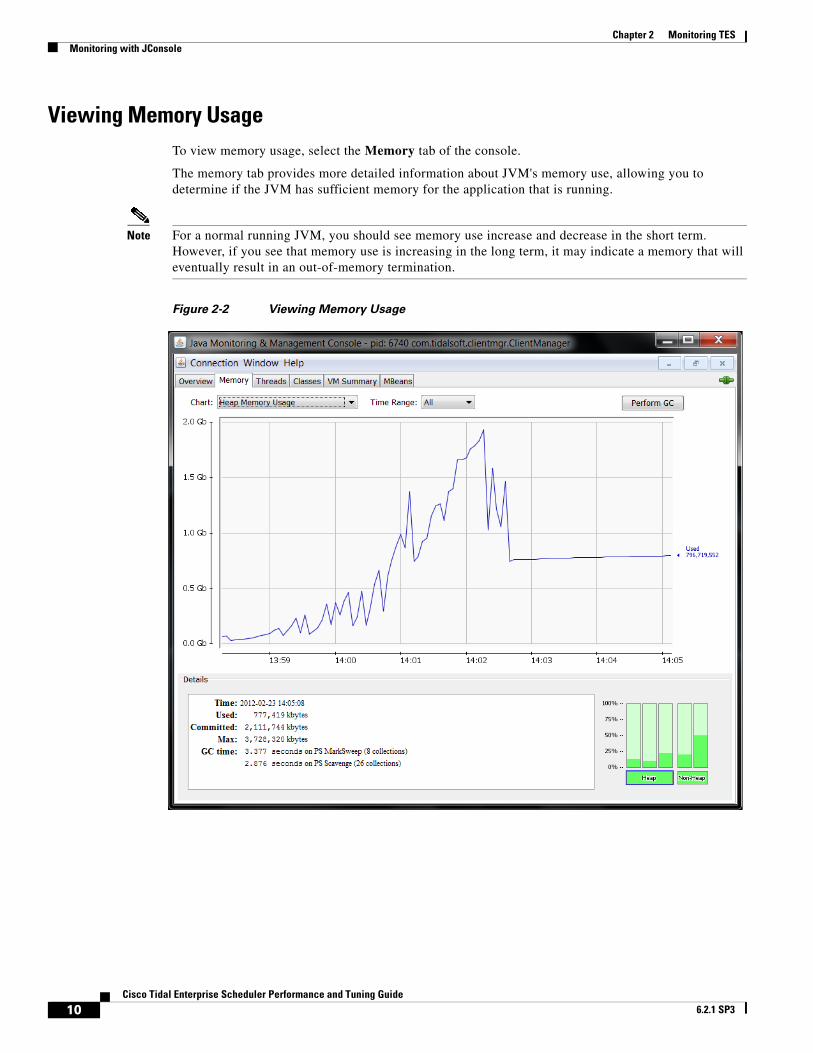
Viewing Memory UsageTo view memory usage, select the Memory tab of the console.
The memory tab provides more detailed information about JVM's memory use, allowing you to determine if the JVM has sufficient memory for the application that is running.
Note For a normal running JVM, you should see memory use increase and decrease in the short term. However, if you see that memory use is increasing in the long term, it may indicate a memory that will eventually result in an out-of-memory termination.
Figure 2-2 Viewing Memory Usage
10Cisco Tidal Enterprise Scheduler Performance and Tuning Guide
6.2.1 SP3
Chapter 2 Monitoring TESMonitoring with JConsole
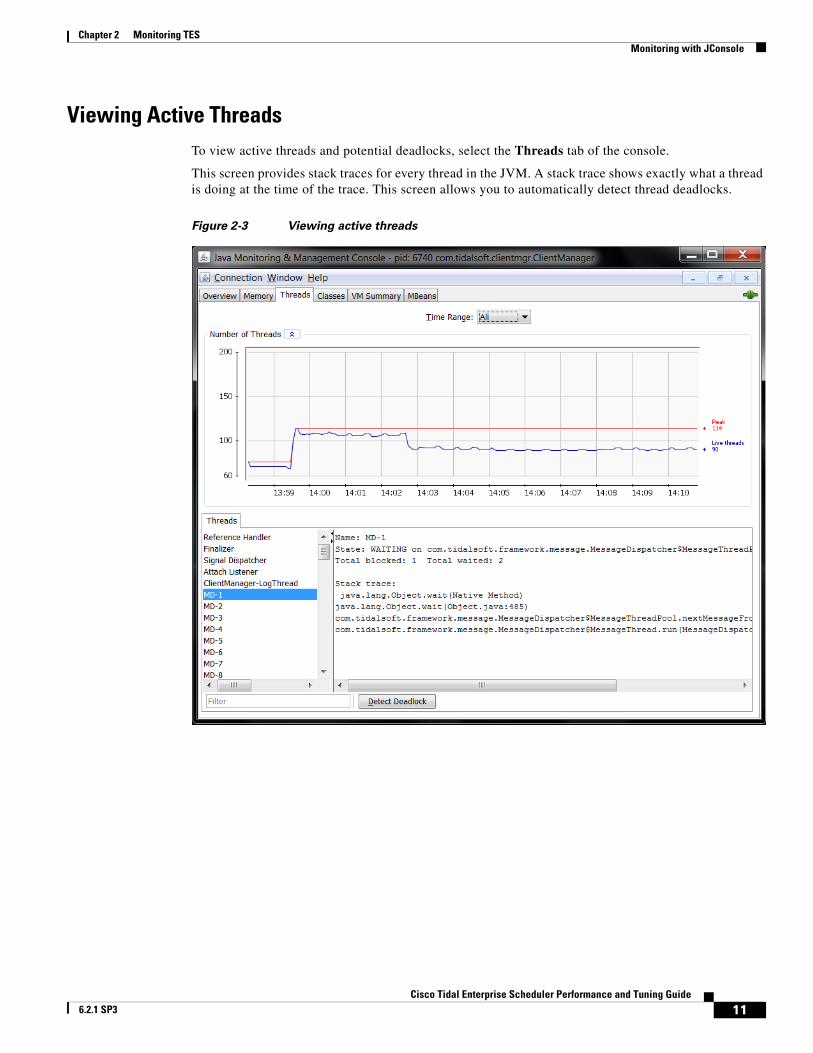
Viewing Active ThreadsTo view active threads and potential deadlocks, select the Threads tab of the console.
This screen provides stack traces for every thread in the JVM. A stack trace shows exactly what a thread is doing at the time of the trace. This screen allows you to automatically detect thread deadlocks.
Figure 2-3 Viewing active threads
11Cisco Tidal Enterprise Scheduler Performance and Tuning Guide
6.2.1 SP3
Chapter 2 Monitoring TES Monitoring with JConsole
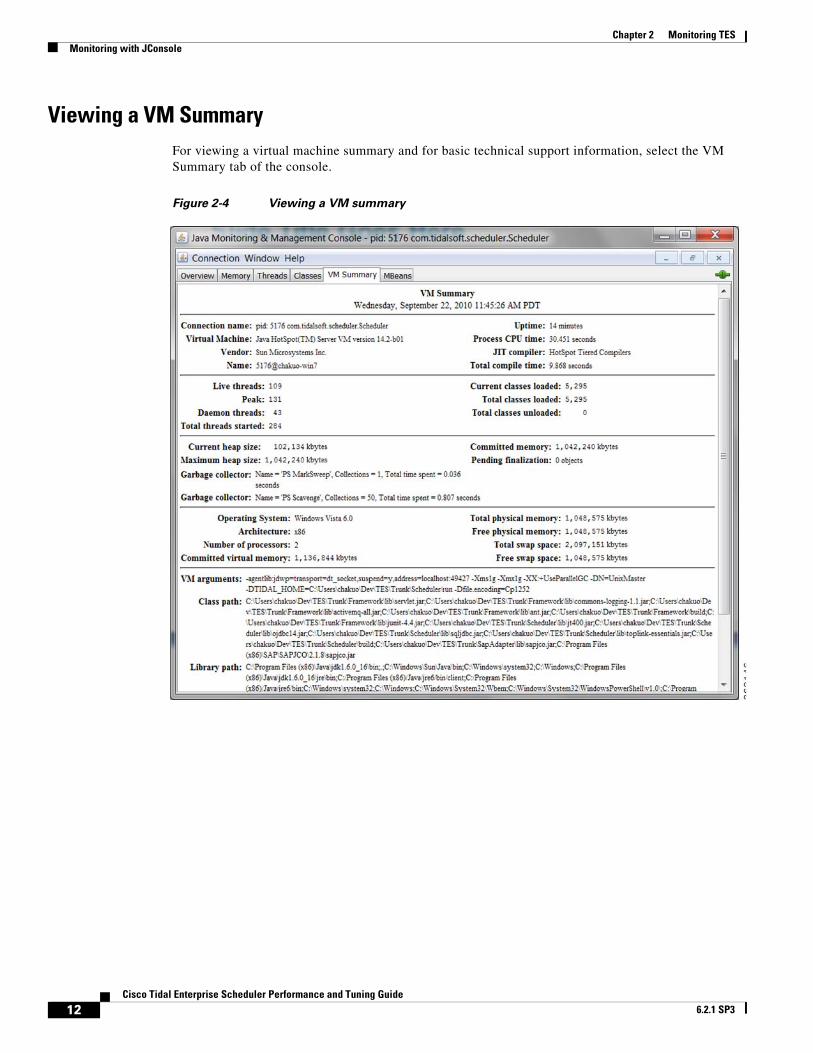
Viewing a VM SummaryFor viewing a virtual machine summary and for basic technical support information, select the VM Summary tab of the console.
Figure 2-4 Viewing a VM summary
12Cisco Tidal Enterprise Scheduler Performance and Tuning Guide
6.2.1 SP3
Chapter 2 Monitoring TESMonitoring Scheduling Activity
Monitoring Scheduling Activity
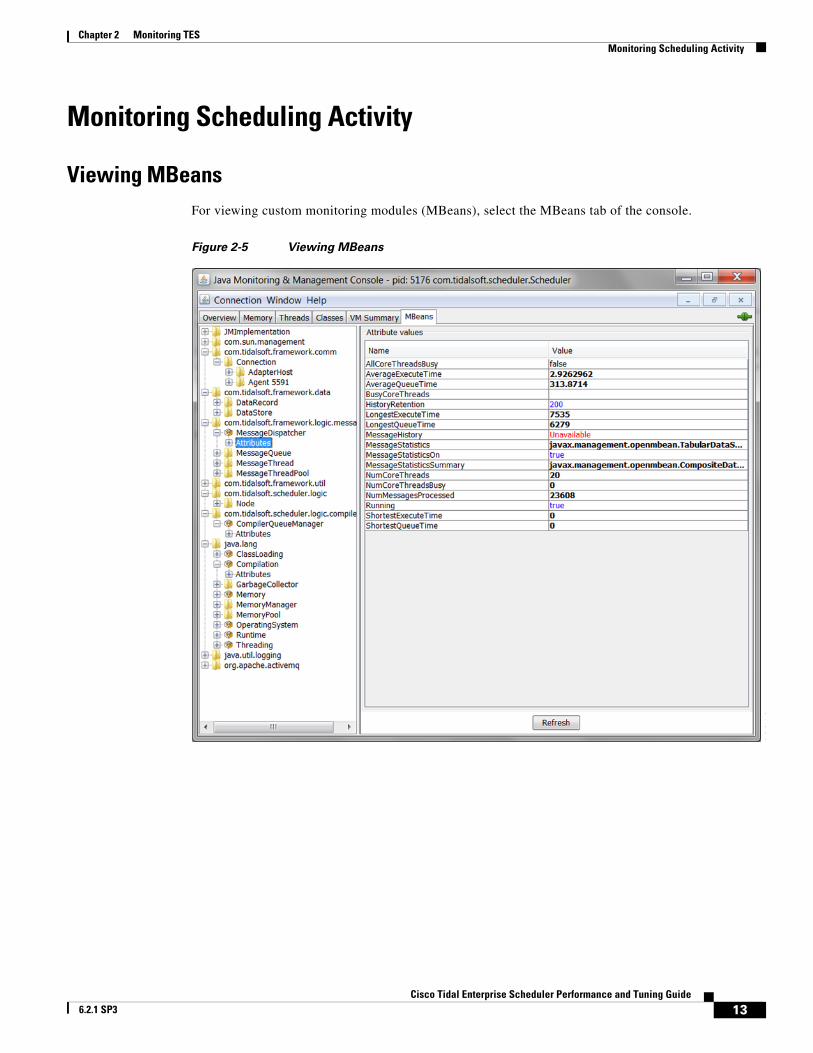
Viewing MBeansFor viewing custom monitoring modules (MBeans), select the MBeans tab of the console.
Figure 2-5 Viewing MBeans
13Cisco Tidal Enterprise Scheduler Performance and Tuning Guide
6.2.1 SP3
Chapter 2 Monitoring TES Monitoring Scheduling Activity
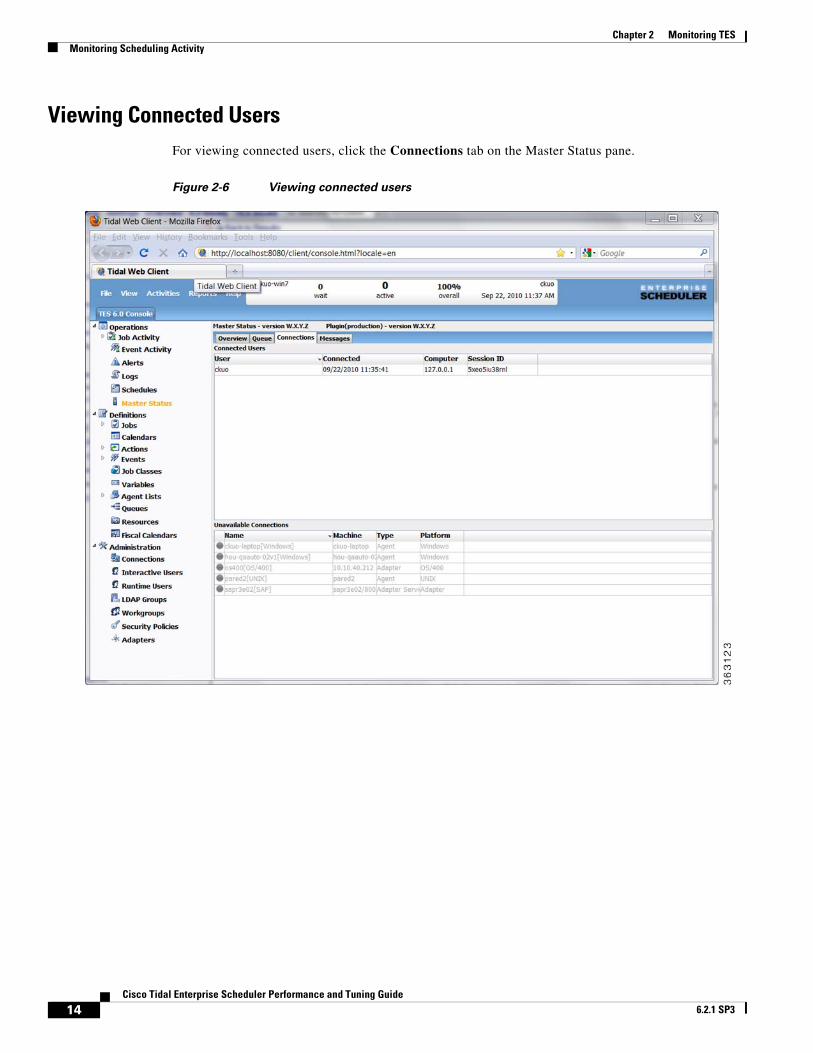
Viewing Connected UsersFor viewing connected users, click the Connections tab on the Master Status pane.
Figure 2-6 Viewing connected users
14Cisco Tidal Enterprise Scheduler Performance and Tuning Guide
6.2.1 SP3
Chapter 2 Monitoring TESMonitoring Scheduling Activity
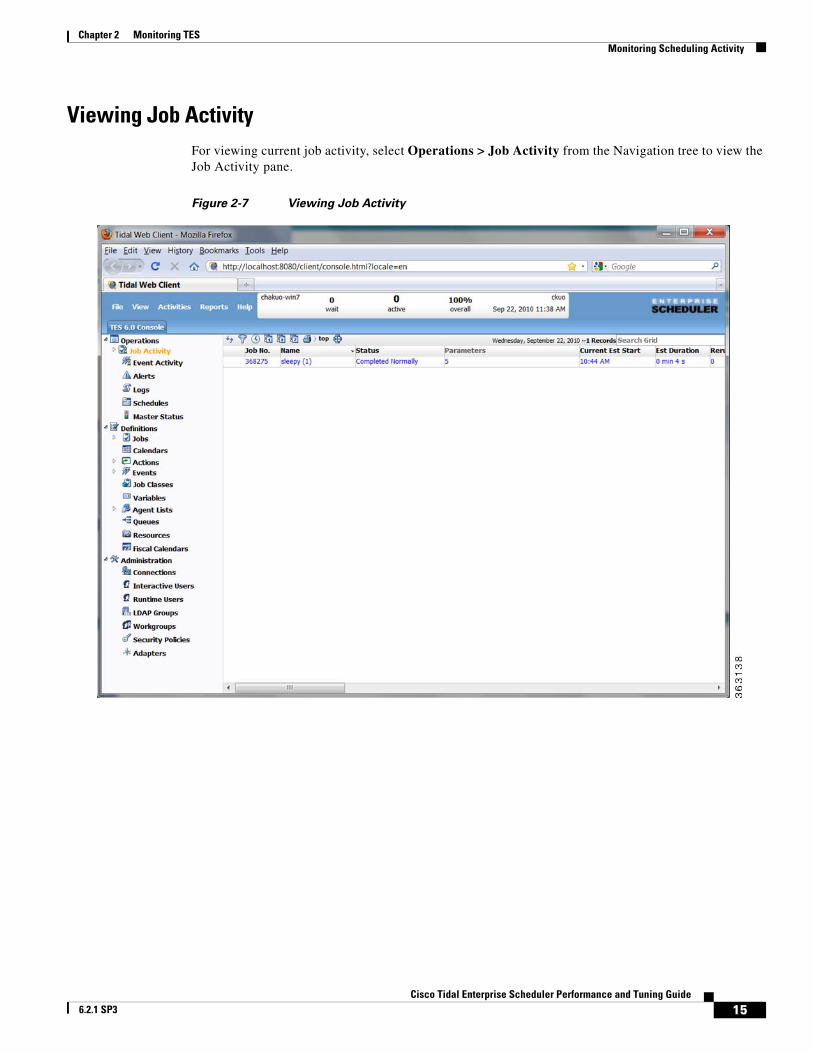
Viewing Job ActivityFor viewing current job activity, select Operations > Job Activity from the Navigation tree to view the Job Activity pane.
Figure 2-7 Viewing Job Activity
15Cisco Tidal Enterprise Scheduler Performance and Tuning Guide
6.2.1 SP3
Chapter 2 Monitoring TES Monitoring Scheduling Activity
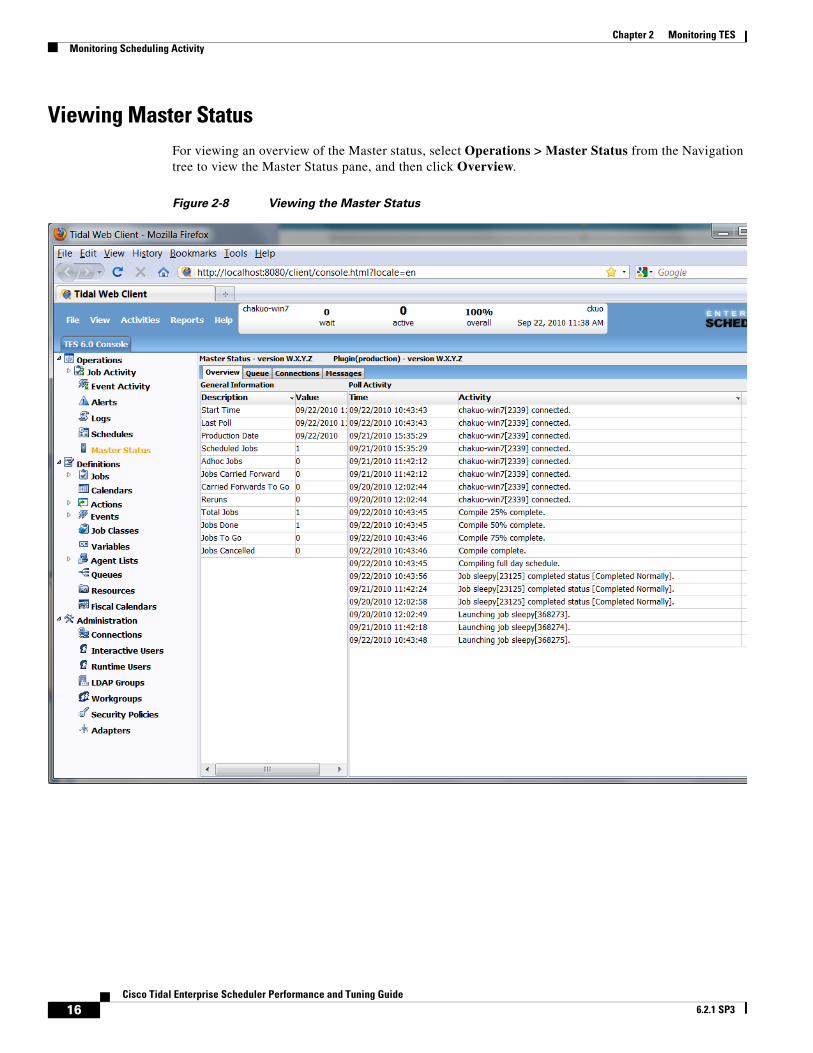
Viewing Master StatusFor viewing an overview of the Master status, select Operations > Master Status from the Navigation tree to view the Master Status pane, and then click Overview.
Figure 2-8 Viewing the Master Status
16Cisco Tidal Enterprise Scheduler Performance and Tuning Guide
6.2.1 SP3
Chapter 2 Monitoring TESMonitoring Scheduling Activity
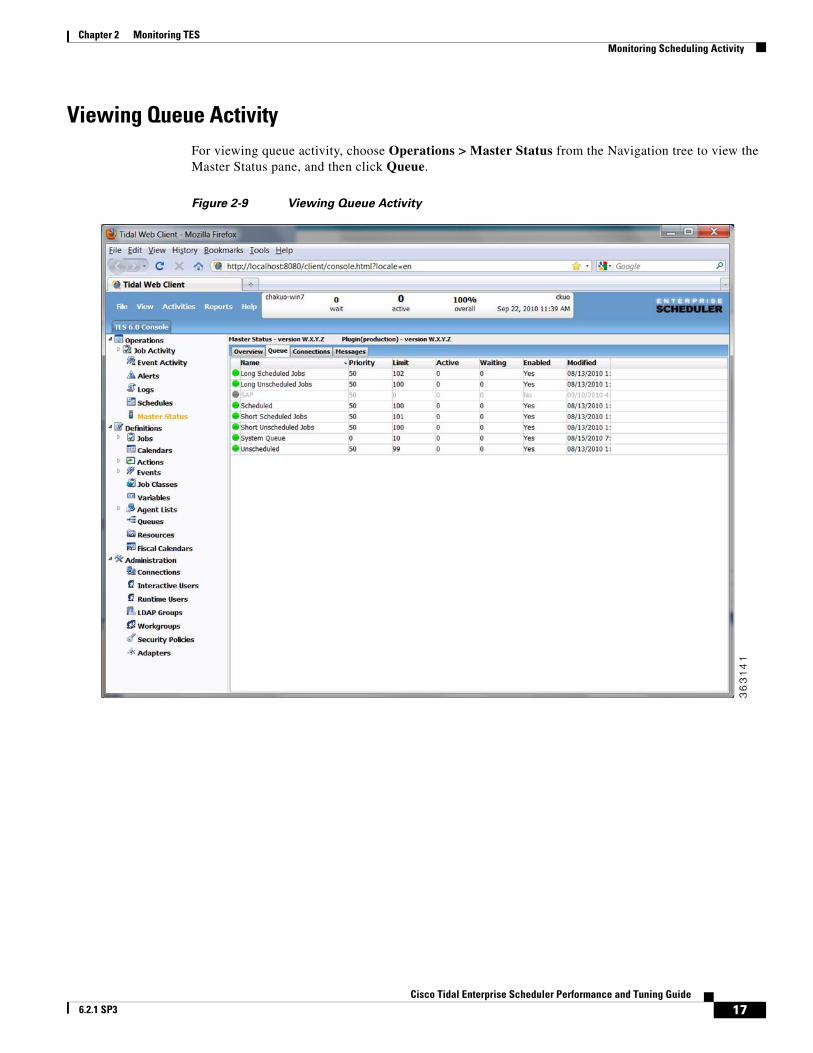
Viewing Queue ActivityFor viewing queue activity, choose Operations > Master Status from the Navigation tree to view the Master Status pane, and then click Queue.
Figure 2-9 Viewing Queue Activity
17Cisco Tidal Enterprise Scheduler Performance and Tuning Guide
6.2.1 SP3
Chapter 2 Monitoring TES Monitoring Scheduling Activity
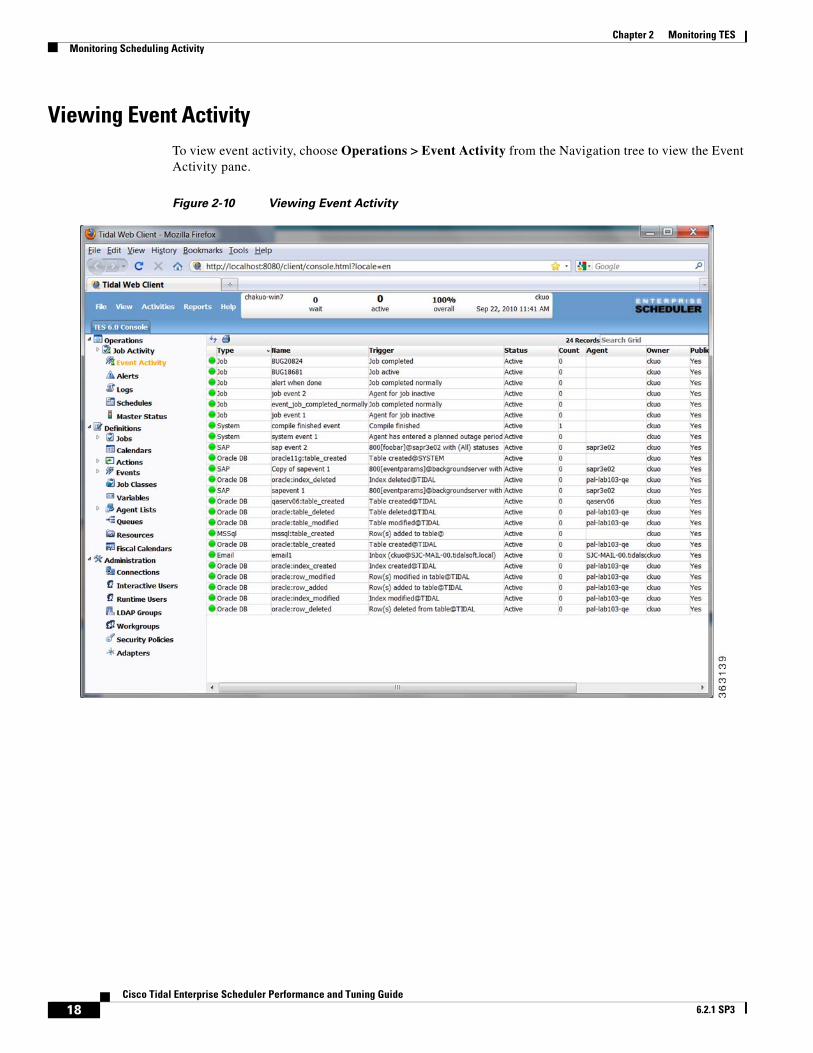
Viewing Event ActivityTo view event activity, choose Operations > Event Activity from the Navigation tree to view the Event Activity pane.
Figure 2-10 Viewing Event Activity
18Cisco Tidal Enterprise Scheduler Performance and Tuning Guide
6.2.1 SP3
Chapter 2 Monitoring TESMonitoring Scheduling Activity
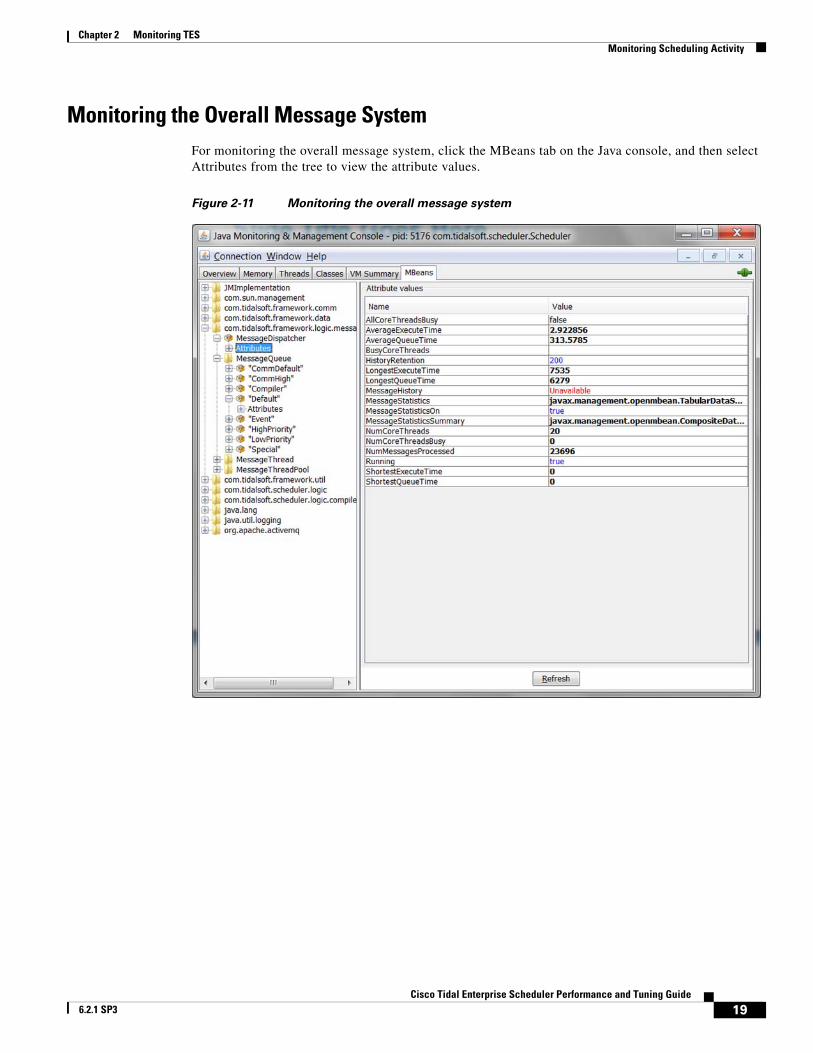
Monitoring the Overall Message SystemFor monitoring the overall message system, click the MBeans tab on the Java console, and then select Attributes from the tree to view the attribute values.
Figure 2-11 Monitoring the overall message system
19Cisco Tidal Enterprise Scheduler Performance and Tuning Guide
6.2.1 SP3
Chapter 2 Monitoring TES Monitoring Scheduling Activity
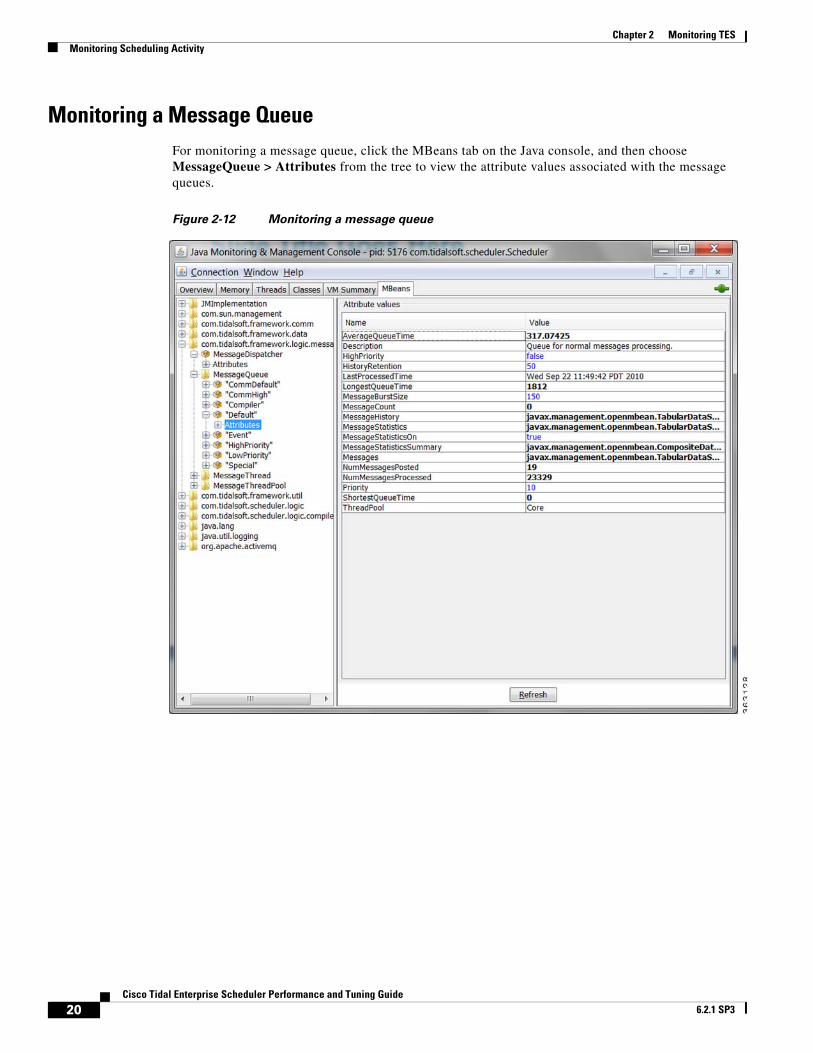
Monitoring a Message QueueFor monitoring a message queue, click the MBeans tab on the Java console, and then choose MessageQueue > Attributes from the tree to view the attribute values associated with the message queues.
Figure 2-12 Monitoring a message queue
20Cisco Tidal Enterprise Scheduler Performance and Tuning Guide
6.2.1 SP3
Chapter 2 Monitoring TESMonitoring Scheduling Activity
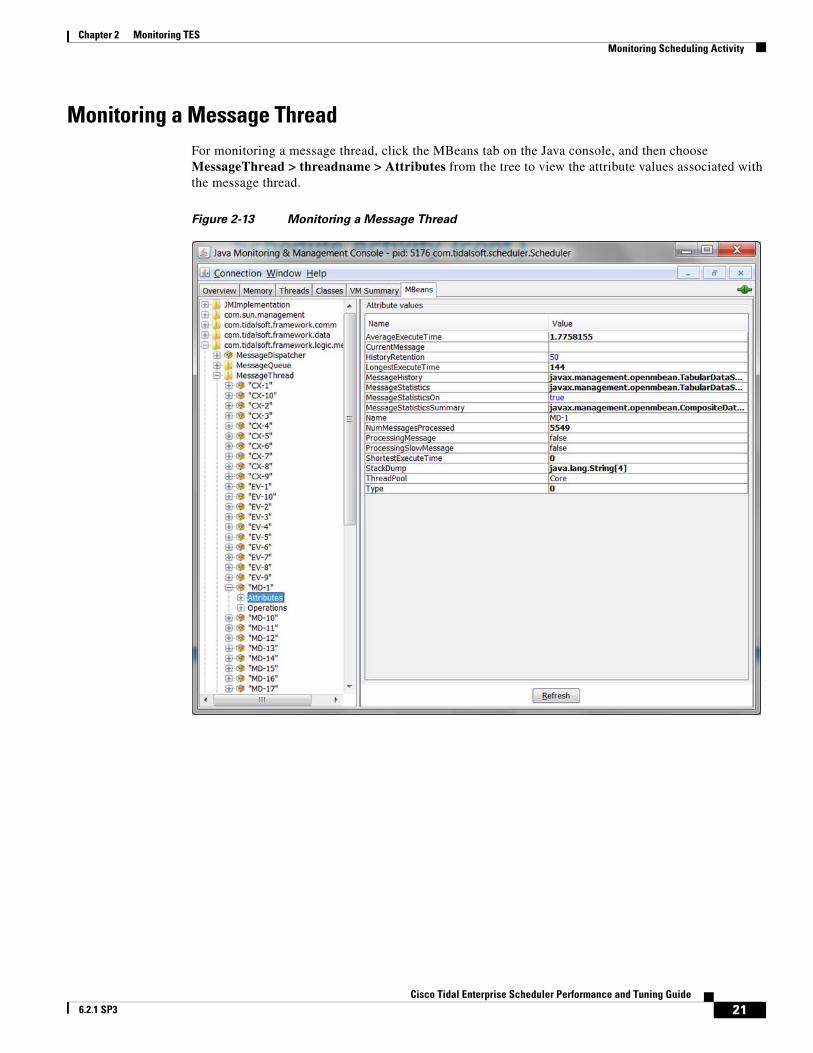
Monitoring a Message ThreadFor monitoring a message thread, click the MBeans tab on the Java console, and then choose MessageThread > threadname > Attributes from the tree to view the attribute values associated with the message thread.
Figure 2-13 Monitoring a Message Thread
21Cisco Tidal Enterprise Scheduler Performance and Tuning Guide
6.2.1 SP3
Chapter 2 Monitoring TES Monitoring Scheduling Activity
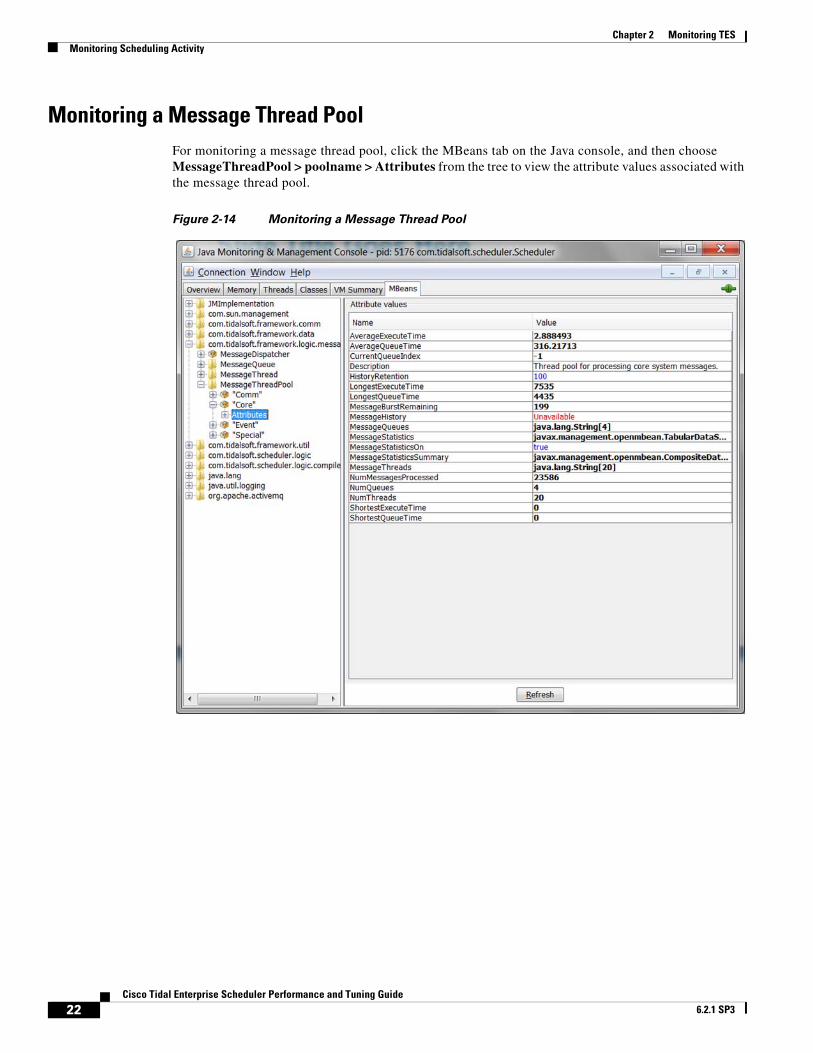
Monitoring a Message Thread PoolFor monitoring a message thread pool, click the MBeans tab on the Java console, and then choose MessageThreadPool > poolname > Attributes from the tree to view the attribute values associated with the message thread pool.
Figure 2-14 Monitoring a Message Thread Pool
22Cisco Tidal Enterprise Scheduler Performance and Tuning Guide
6.2.1 SP3
Chapter 2 Monitoring TESMonitoring Schedule Compiling
Monitoring Schedule Compiling
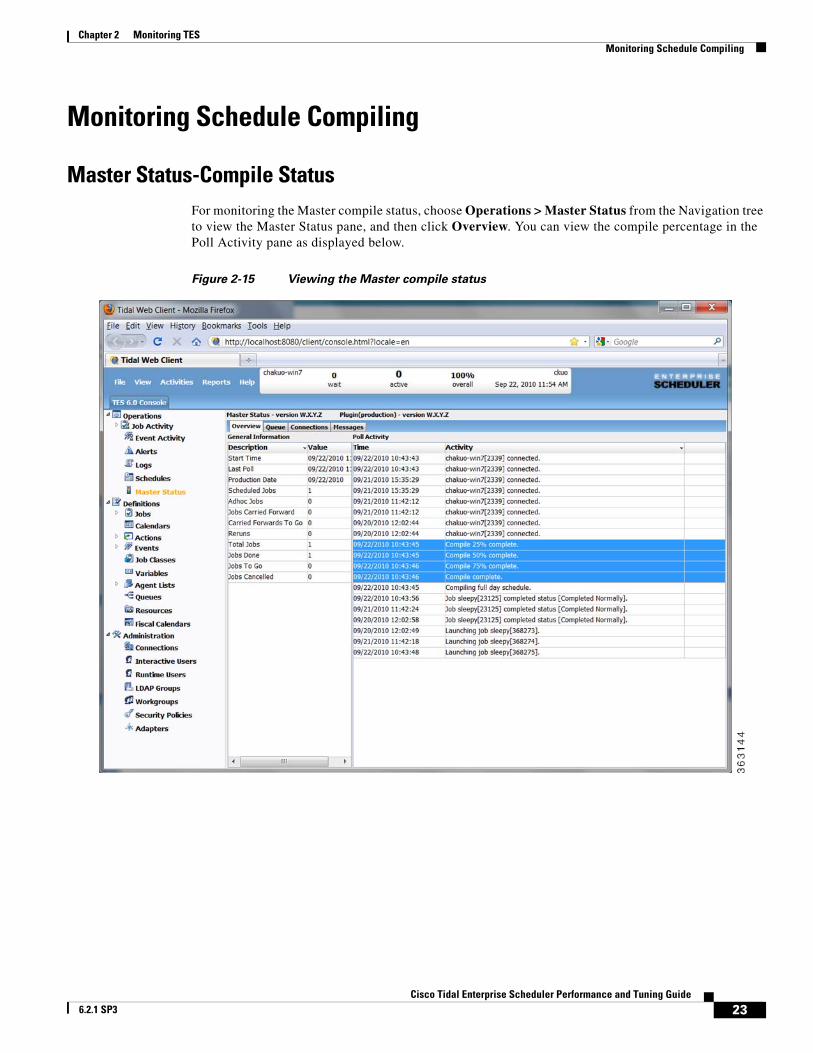
Master Status-Compile StatusFor monitoring the Master compile status, choose Operations > Master Status from the Navigation tree to view the Master Status pane, and then click Overview. You can view the compile percentage in the Poll Activity pane as displayed below.
Figure 2-15 Viewing the Master compile status
23Cisco Tidal Enterprise Scheduler Performance and Tuning Guide
6.2.1 SP3
Chapter 2 Monitoring TES Monitoring Schedule Compiling
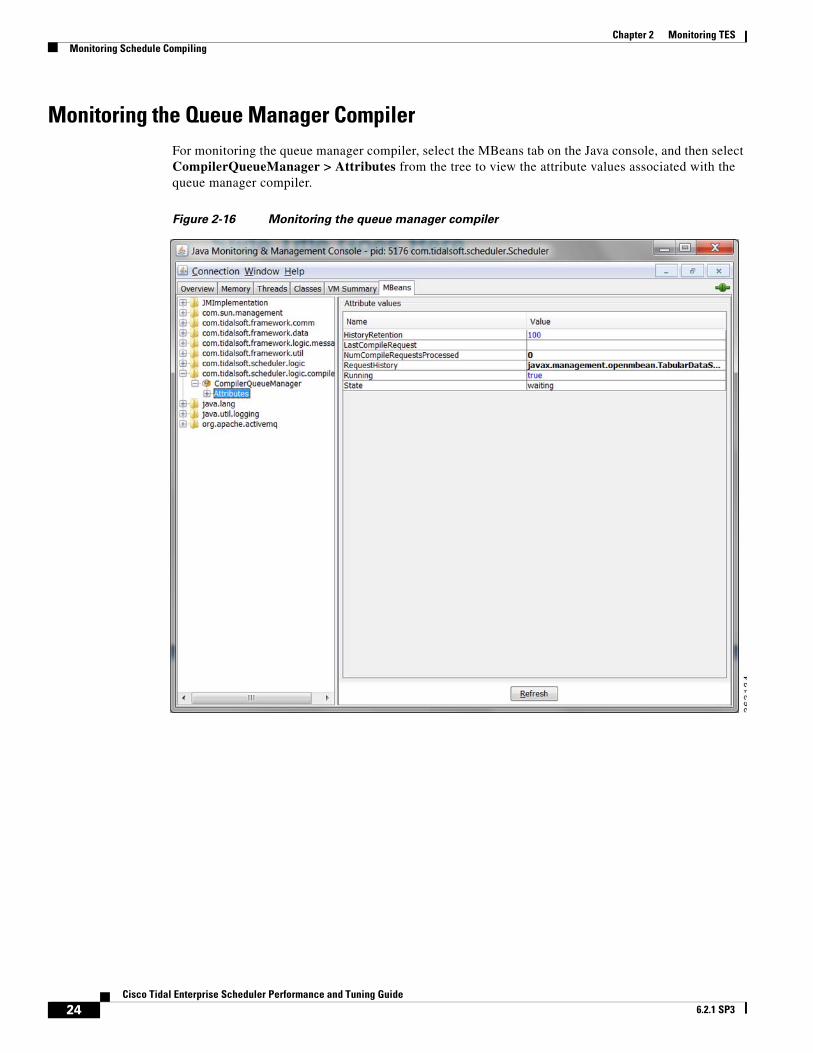
Monitoring the Queue Manager CompilerFor monitoring the queue manager compiler, select the MBeans tab on the Java console, and then select CompilerQueueManager > Attributes from the tree to view the attribute values associated with the queue manager compiler.
Figure 2-16 Monitoring the queue manager compiler
24Cisco Tidal Enterprise Scheduler Performance and Tuning Guide
6.2.1 SP3
Chapter 2 Monitoring TESMonitoring Schedule Compiling
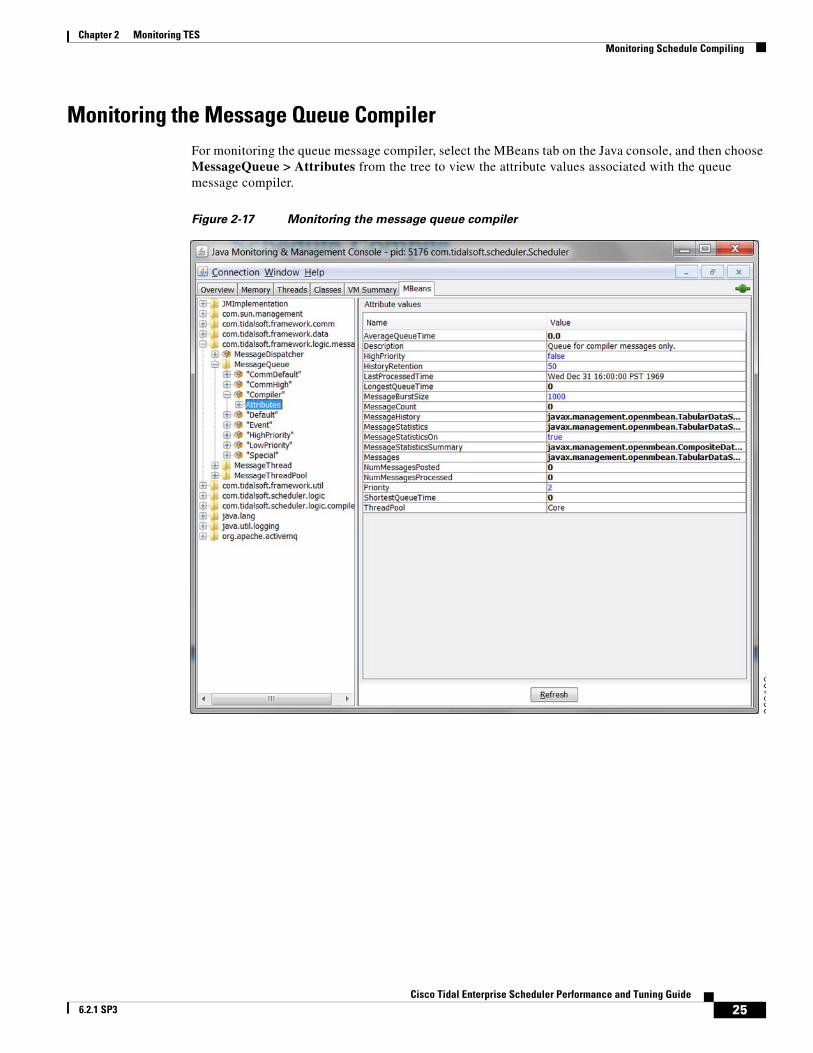
Monitoring the Message Queue CompilerFor monitoring the queue message compiler, select the MBeans tab on the Java console, and then choose MessageQueue > Attributes from the tree to view the attribute values associated with the queue message compiler.
Figure 2-17 Monitoring the message queue compiler
25Cisco Tidal Enterprise Scheduler Performance and Tuning Guide
6.2.1 SP3
Chapter 2 Monitoring TES Monitoring Adapter/Agent Connections
Monitoring Adapter/Agent Connections
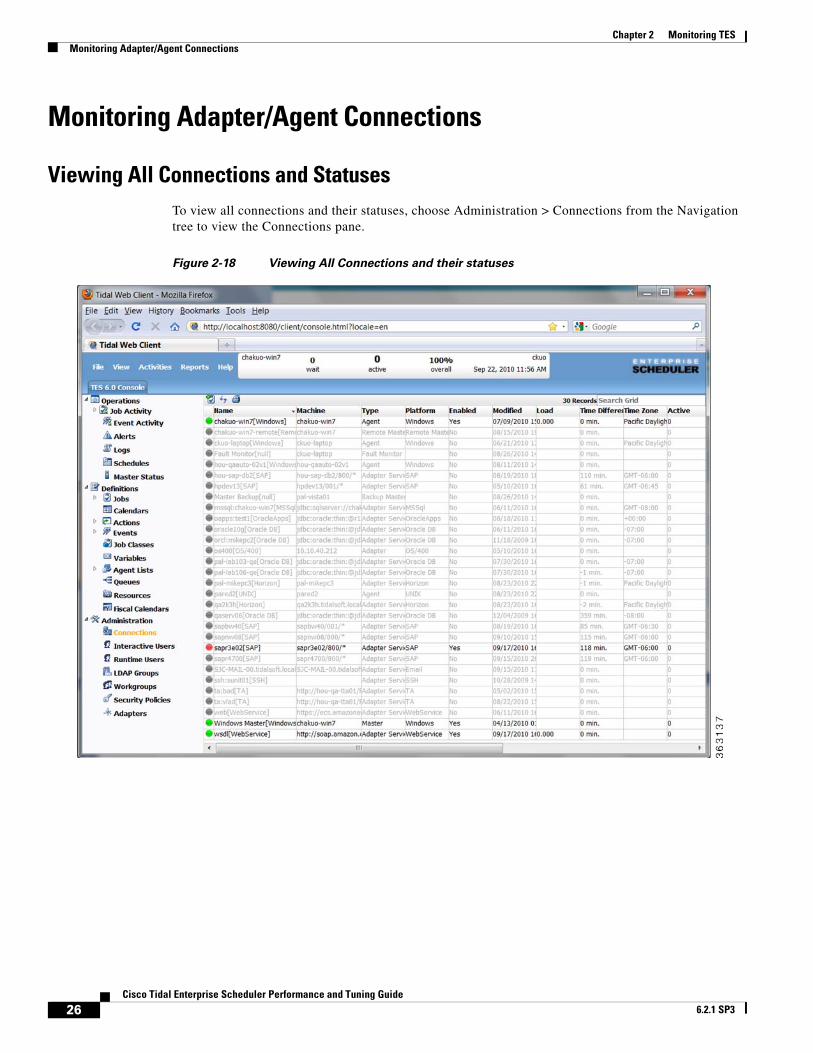
Viewing All Connections and StatusesTo view all connections and their statuses, choose Administration > Connections from the Navigation tree to view the Connections pane.
Figure 2-18 Viewing All Connections and their statuses
26Cisco Tidal Enterprise Scheduler Performance and Tuning Guide
6.2.1 SP3
Chapter 2 Monitoring TESMonitoring Adapter/Agent Connections
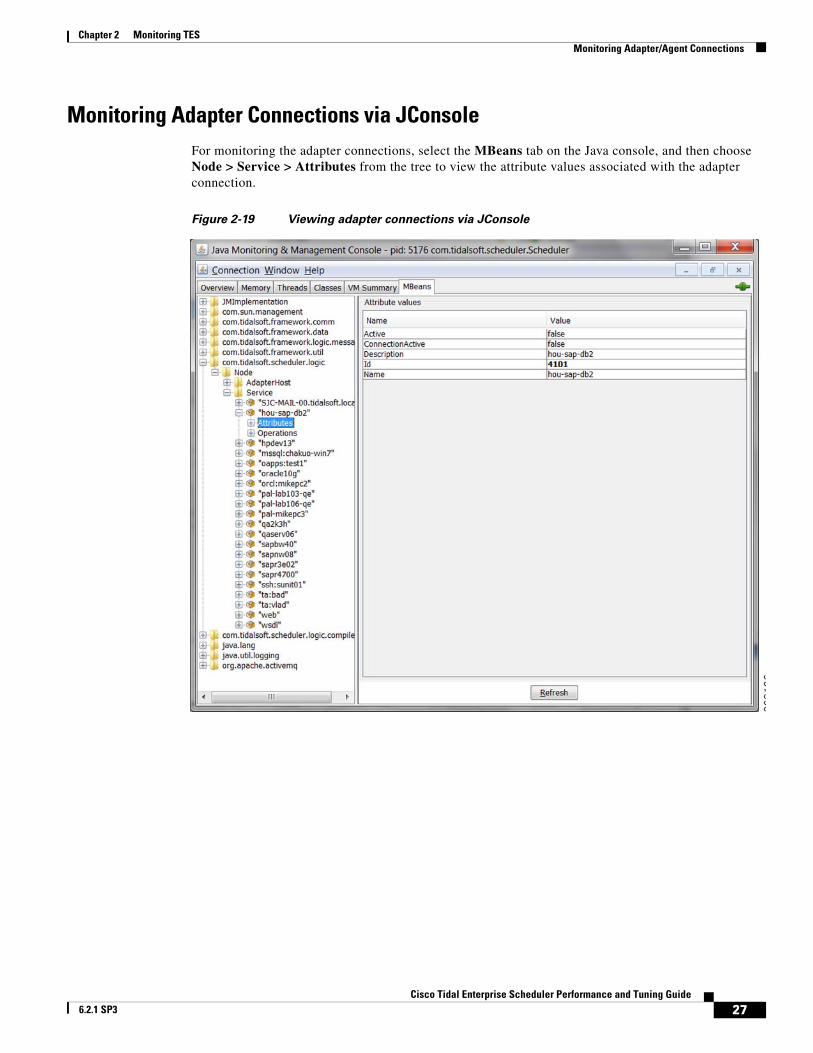
Monitoring Adapter Connections via JConsoleFor monitoring the adapter connections, select the MBeans tab on the Java console, and then choose Node > Service > Attributes from the tree to view the attribute values associated with the adapter connection.
Figure 2-19 Viewing adapter connections via JConsole
27Cisco Tidal Enterprise Scheduler Performance and Tuning Guide
6.2.1 SP3
Chapter 2 Monitoring TES Monitoring the TES Java Application Performance
Monitoring the TES Java Application PerformanceJConsole is recommended for capturing/monitoring any performance related issue with the Java Client application. JConsole, a GUI-based software, does not provided a way to capture performance data in a non-interactive way. To capture JMX MBean Attribute values as displayed below, for the purposes of generating alarms when the software exceeds thresholds, use the following command-line alternatives to the JConsole.
• Jmxterm (http://wiki.cyclopsgroup.org/jmxterm)
• cmdline-jmxclient (http://crawler.archive.org/cmdline-jmxclient)
jmxterm retrieves MBean Attribute values in an interactive shell, whereas cmdline-jmxclient retrieves it non-iteractiavely. The syntax of cmdline-jmxclient is as follows:
Z:\>java -jar cmdline-jmxclient-0.10.3.jarUsage: java -jar cmdline-jmxclient.jar USER:PASS HOST:PORT [BEAN] [COMMAND]Options: USER:PASS Username and password. Required. If none, pass '-'. E.g. 'controlRole:secret' HOST:PORT Hostname and port to connect to. Required. E.g. localhost:8081.
List registered beans if only USER:PASS and this argument.
BEANNAME Optional target bean name. If present we list available operations and attributes.
COMMAND Optional operation to run or attribute to fetch. If none supplied, all operations and attributes are listed. Attributes begin with a capital letter: e.g. 'Status' or 'Started'. Operations do not. Operations can take arguments by adding an '=' followed by comma-delimited params. Pass multiple attributes/operations to run more than one per invocation.
28Cisco Tidal Enterprise Scheduler Performance and Tuning Guide
6.2.1 SP3
Chapter 2 Monitoring TESMonitoring the Cache Sync
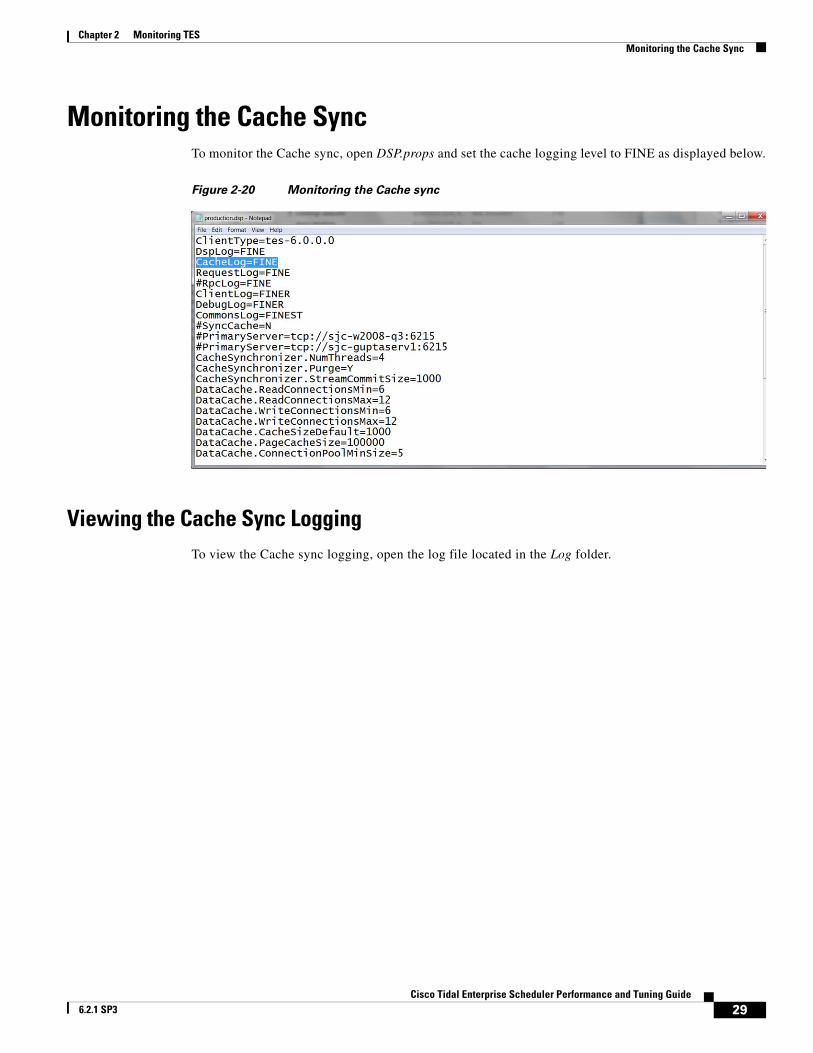
Monitoring the Cache SyncTo monitor the Cache sync, open DSP.props and set the cache logging level to FINE as displayed below.
Figure 2-20 Monitoring the Cache sync
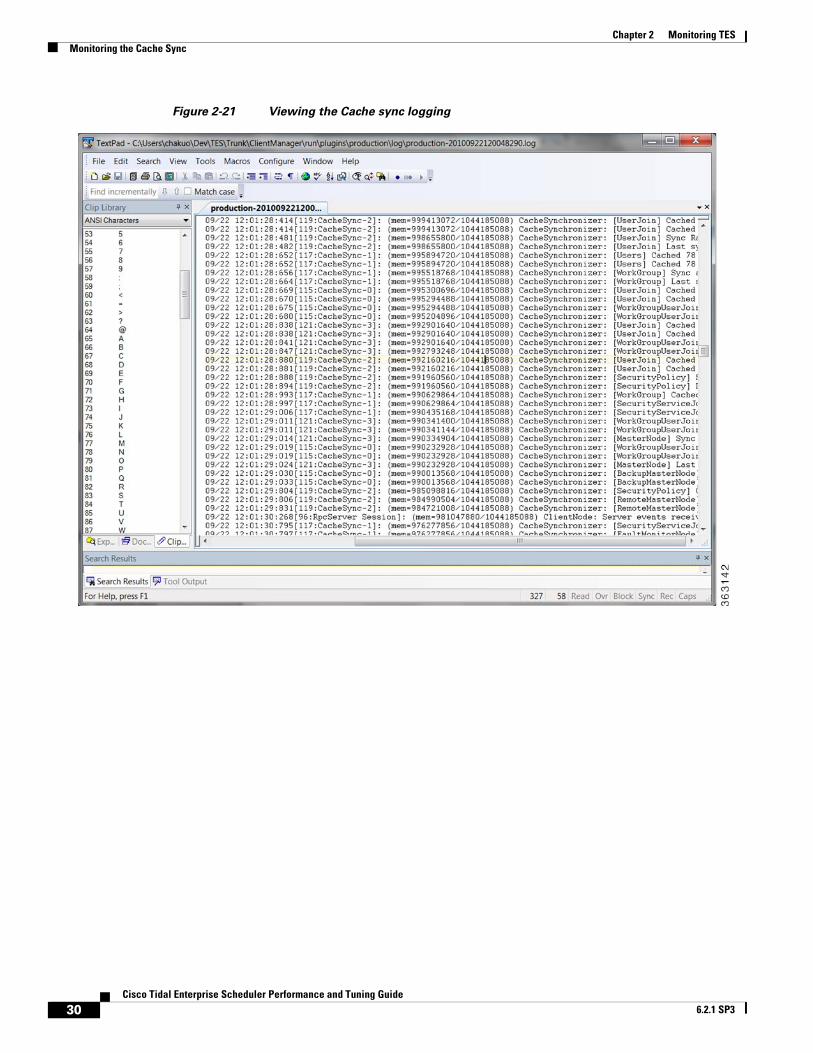
Viewing the Cache Sync LoggingTo view the Cache sync logging, open the log file located in the Log folder.
29Cisco Tidal Enterprise Scheduler Performance and Tuning Guide
6.2.1 SP3
Chapter 2 Monitoring TES Monitoring the Cache Sync
Figure 2-21 Viewing the Cache sync logging
30Cisco Tidal Enterprise Scheduler Performance and Tuning Guide
6.2.1 SP3
Chapter 2 Monitoring TESMonitoring the Cache Sync
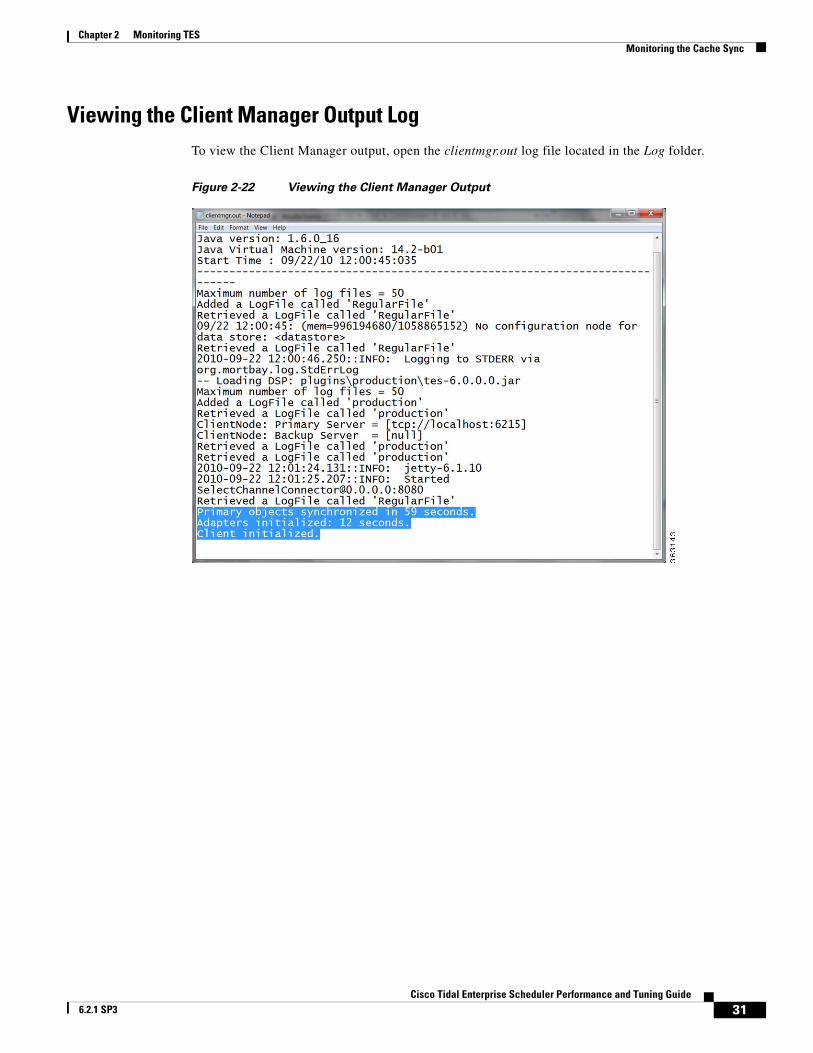
Viewing the Client Manager Output LogTo view the Client Manager output, open the clientmgr.out log file located in the Log folder.
Figure 2-22 Viewing the Client Manager Output
31Cisco Tidal Enterprise Scheduler Performance and Tuning Guide
6.2.1 SP3

Chapter 2 Monitoring TES Monitoring the Cache Sync
32Cisco Tidal Enterprise Scheduler Performance and Tuning Guide
6.2.1 SP3
Cisco Tidal E 6.2.1 SP3
C H A P T E R 3
Tuning TESOverviewThis chapter covers the tasks you can use to tune TES performance:
• Configuration and Tuning, page 3-33
• Size-Based Guidelines for Tuning Parameters, page 3-37
Configuration and TuningThis section will walk you through how to tune the application (either Master or Client Manager) to get better performance.
MemoryThese parameters tune the amount of memory the application has to use to get work done. If an application does not have enough memory to work with, it could have very poor performance or in the worst case get out of memory errors and fail.
The following parameters apply to all Java applications:
• -Xmn = size of young generation (1/4 size of heap)
• -Xmx = max heap size
• -Xms = initial heap size (guarantees JVM has that much memory)
• -Xss = thread stack size (increase if getting stack overflow exceptions)
• JVMARGS= -Xmn1024m -Xms28672m -Xmx28672m
CPUThe system CPU is not readily tunable from our application or the JVM itself, however, know that the CPU is an important resource that directly impacts performance. If a system does not have enough CPUs or CPU power, applications can run very slowly across the board. Upgrade your system to more CPUs or faster CPUs if the system monitor consistently shows the CPU meter very high.
33nterprise Scheduler Performance and Tuning Guide
Chapter 3 Tuning TES Configuration and Tuning
JMSBoth the Master and Client Manager rely on the Java Message Service (JMS) for internal and cross communication with each other. You can think of JMS as the communication link between the Master and Client Manager. That is why JMS can greatly impact performance, especially if there is a lot of data moving back and forth between the Master and Client Manager., such as the primary and secondary cache synchronization.
JMS sessions process all messages such as during the use of one worker thread per session. The following threads are affected:
• MinSessionPoolSize – minimum number of ActiveMQ sessions kept pooled. Having sessions available to handle requests reduces the cost of allocating sessions on demand.
• MaxSessionPoolSize – maximum number of ActiveMQ sessions kept pooled.
Note If more sessions are needed to process messages, the system will still allocate them. This setting only limits the number of sessions allowed to be pooled.
• MaxConcurrentMessage – maximum number of ActiveMQ messages allowed to be processed concurrently. This setting is important for increasing throughput and utilizing all the cores on a system when there are many messages waiting in the ActiveMQ queues.
The following Message Brokers handle all JMS traffic:
• MessageBroker.MemoryLimit – how much memory (in MB) to allocate to ActiveMQ for storing in-flight messages. If queues become full, ActiveMQ will page messages to disk, which is more expensive than keeping them in memory.
• MessageBroker.TempLimit – how much memory (in MB) to allocate to ActiveMQ for storing temporary messages. If queues become full, ActiveMQ will page messages to disk, which is more expensive than keeping them in memory.
• MessageBroker.StoreLimit – how much disk space (in MB) to allocate to ActiveMQ for storing in-flight messages when memory is full.
The following master.props properties are what you would tune for DSP to Master message traffic for all DSP connections:
• MinSessionPoolSize (5)
• MaxSessionPoolSize (10)
• MaxConcurrentMessages (10)
The following master.props properties are what you would tune for DSP to Master message traffic per DSP connections:
• ClientConnection.MinSessionPoolSize (2)
• ClientConnection.MaxSessionPoolSize (5)
• ClientConnection.MaxConcurrentMessages (5)
The following master.props properties are what you would tune for Remote Master to Master message traffic per Remote Master:
• RemoteMasterClient.MinSessionPoolSize (2)
• RemoteMasterClient.MaxSessionPoolSize (5)
• RemoteMasterClient.MaxConcurrentMessages (5)
34Cisco Tidal Enterprise Scheduler Performance and Tuning Guide
6.2.1 SP3

Chapter 3 Tuning TESConfiguration and Tuning
The following master.props properties are what you would tune for Master to Remote Master message traffic per Remote Master:
• RemoteMasterServer.MinSessionPoolSize (2)
• RemoteMasterServer.MaxSessionPoolSize (5)
• RemoteMasterServer.MaxConcurrentMessages (5)
The following tes-6.0.dsp properties are what you would tune for Master to DSP message traffic:
• ClientNode.MinSessionPoolSize (5)
• ClientNode.MaxSessionPoolSize (10)
• ClientNode.MaxConcurrentMessages (10)
The following tes-6.2.dsp properties are what you would tune for Fault Monitor to DSP message traffic:
• FTNode.MinSessionPoolSize (2)
• FTNode.MaxSessionPoolSize (5)
• FTNode.MaxConcurrentMessages (5)The following tes-6.2.dsp properties are what you would tune for Cache Read connections shared among all threads:
• DataCache.ReadConnectionsMin (2) – minimum number of JDBC connections kept pooled to read from the data cache. Having connections always available to handle read requests reduces the cost of allocating connections on demand.
• DataCache.ReadConnectionsMax (4) – maximum number of JDBC connections allowed to be allocated concurrently to read from the data cache. If this number is exceeded, read requests will be queued and blocked. Recommend increasing to handle more concurrent users.
The following tes-6.2.dsp properties are what you would tune for Cache Write connections shared among all threads:
• DataCache.WriteConnectionsMin (4) – minimum number of JDBC connections kept pooled to write to the data cache. Having connections always available to handle write requests reduces the cost of allocating connections on demand.
• DataCache.WriteConnectionsMax (8) – maximum number of JDBC connections allowed to be allocated concurrently to write to the data cache. If this number is exceeded, write request will be queued and blocked. Recommend increasing to handle more data update activity between the Master and DSP.
The following tes-6.2.dsp properties are what you would tune for Cache Tuning tradeoff between performance and memory/disk usage:
• DataCache.PageCacheSize (50000) – number of pages (of size DataCache.PageSize) in memory allocated to the data cache. The in-memory data cache allows for the fastest possible read/write access. Thus, for very large data caches, it is recommended that the data cache be given as much memory as possible.
• DataCache.PageSize (4096) – size (in bytes) of each page in the data cache. The data cache stores records in page-size chunks. Larger pages may improve read/write access when the data cache needs to fetch records from disk, with the added cost of a larger data cache in-memory and on disk. Another factor to keep in mind is the OS disk block size. Usually, it is recommended to keep the data cache page size the same as the OS disk block size.
• DataCache.CacheSizeDefault (1000) – number of objects each table in the data cache is allowed to keep in memory. More objects equals faster read/write access from and to the data cache.
The following tes-6.2.dsp properties are what you would tune for Cache Syncing, which affects the data sync between the Master database and Client Manager (DSP) cache.
35Cisco Tidal Enterprise Scheduler Performance and Tuning Guide
6.2.1 SP3
Chapter 3 Tuning TES Configuration and Tuning
• CacheSynchronizer.Purge (N) – Y to purge leftover deleted records during sync. Leftover records may exist in the cache if the Master deletes the records from its database when the Client Manager is not connected.
• CacheSynchronizer.NumThreads (4) – number of concurrent threads spawned to sync the cache. More threads increase throughput, but use more CPU and memory. Recommend to set at or below number of physical cores on machine.
• CacheSynchronizer.StreamCommitSize (1000) – number of records committed to the cache in a batch. Larger batches improve throughput, but use more memory.
The following master.props properties are what you would tune for the connections used to read/write to the Master database:
• Shared between normal Master operation PLUS cache sync (both can be high I/O).
• Each Client Manager can configure X number of sync threads = Master needs X number of DB connections.
• DatabaseConnections (20)
Master MessagingMaster messaging impacts only the Master, but it has a big impact on the performance of the Master and thus indirectly the Client Manager as well. The Master is designed to be a heavily multi-threaded application. By tuning the messaging parameters, the Master is bettter able to utilize the threading capabilities of the system.
All work in the Master is performed by the following message threads:
• Message Queues
Before a message is sent to an object, it is first posted to one of the application’s message queues. Each queue or set of queues is allocated for a specific type of message. For example, the default queues are for general messages, the compiler queue is for compile messages, and the communication queues are for communication messages. Each queue has a priority that determines how often its messages get processed. Higher priority queues have their messages processed more frequently than lower priority ones.
• Message Threads
Message threads are the workhorse of the application. They are responsible for pulling messages out of queues and then executing them. Depending on the application configuration, there may be anywhere from a dozen to a hundred threads running inside the application. Generally speaking, more threads equal better performance, since each CPU can execute a thread at the same time as another CPU. So, technically, a dual core system can process twice as many messages as a single core system. However, in reality, because each thread eats up a bit of memory and CPU, performance is expected to degrade when there are too many threads for the system to handle.
• Message Thread Pools
A message thread pool groups together a set of messages threads with a set of message queues. The intent is to force threads from a pool to only process messages for queues from the same pool. This guarantees if threads in one pool are busy, messages in another pool will still get processed by free threads in that pool.
To configure the Master messaging:
• MessageThreads = general workhorse threads
• SpecialMessageThreads = adapter-related threads
36Cisco Tidal Enterprise Scheduler Performance and Tuning Guide
6.2.1 SP3
Chapter 3 Tuning TESSize-Based Guidelines for Tuning Parameters
• EventMessageThreads = event-related threads
• CommThreads = communication threads
Note As a best practice, retain no more than 20 M message log records for better performance.
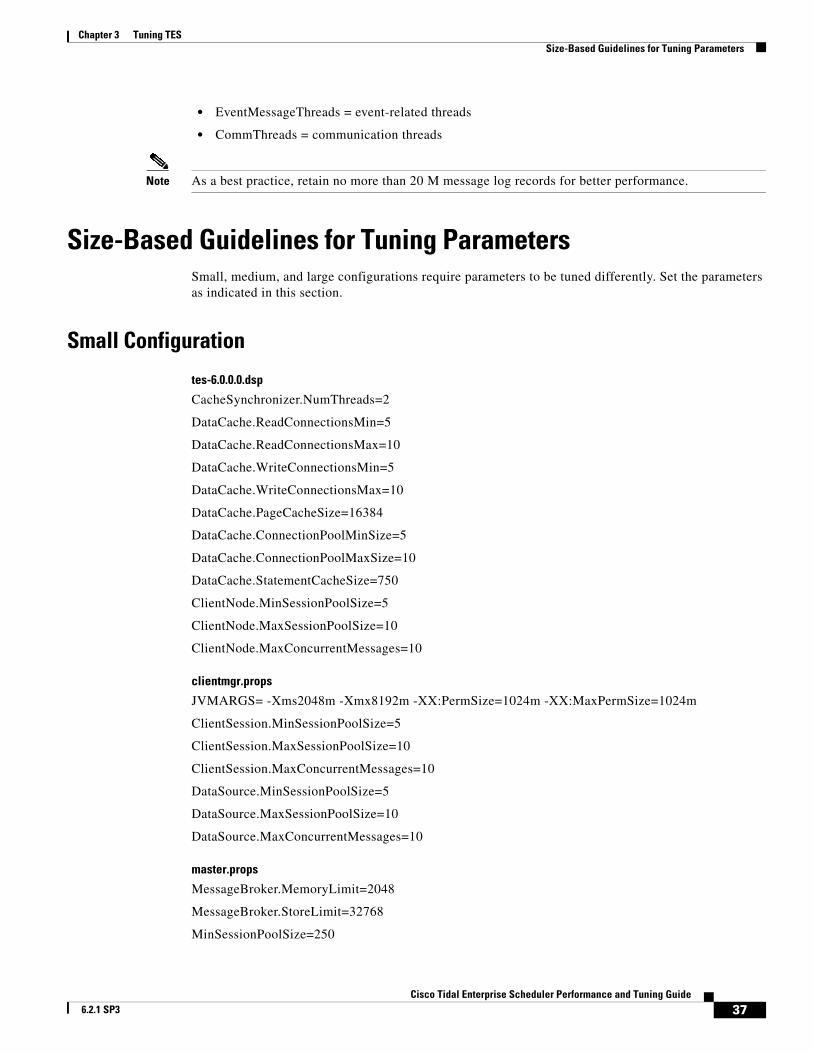
Size-Based Guidelines for Tuning ParametersSmall, medium, and large configurations require parameters to be tuned differently. Set the parameters as indicated in this section.
Small Configuration
tes-6.0.0.0.dsp
CacheSynchronizer.NumThreads=2
DataCache.ReadConnectionsMin=5
DataCache.ReadConnectionsMax=10
DataCache.WriteConnectionsMin=5
DataCache.WriteConnectionsMax=10
DataCache.PageCacheSize=16384
DataCache.ConnectionPoolMinSize=5
DataCache.ConnectionPoolMaxSize=10
DataCache.StatementCacheSize=750
ClientNode.MinSessionPoolSize=5
ClientNode.MaxSessionPoolSize=10
ClientNode.MaxConcurrentMessages=10
clientmgr.props
JVMARGS= -Xms2048m -Xmx8192m -XX:PermSize=1024m -XX:MaxPermSize=1024m
ClientSession.MinSessionPoolSize=5
ClientSession.MaxSessionPoolSize=10
ClientSession.MaxConcurrentMessages=10
DataSource.MinSessionPoolSize=5
DataSource.MaxSessionPoolSize=10
DataSource.MaxConcurrentMessages=10
master.props
MessageBroker.MemoryLimit=2048
MessageBroker.StoreLimit=32768
MinSessionPoolSize=250
37Cisco Tidal Enterprise Scheduler Performance and Tuning Guide
6.2.1 SP3
Chapter 3 Tuning TES Size-Based Guidelines for Tuning Parameters
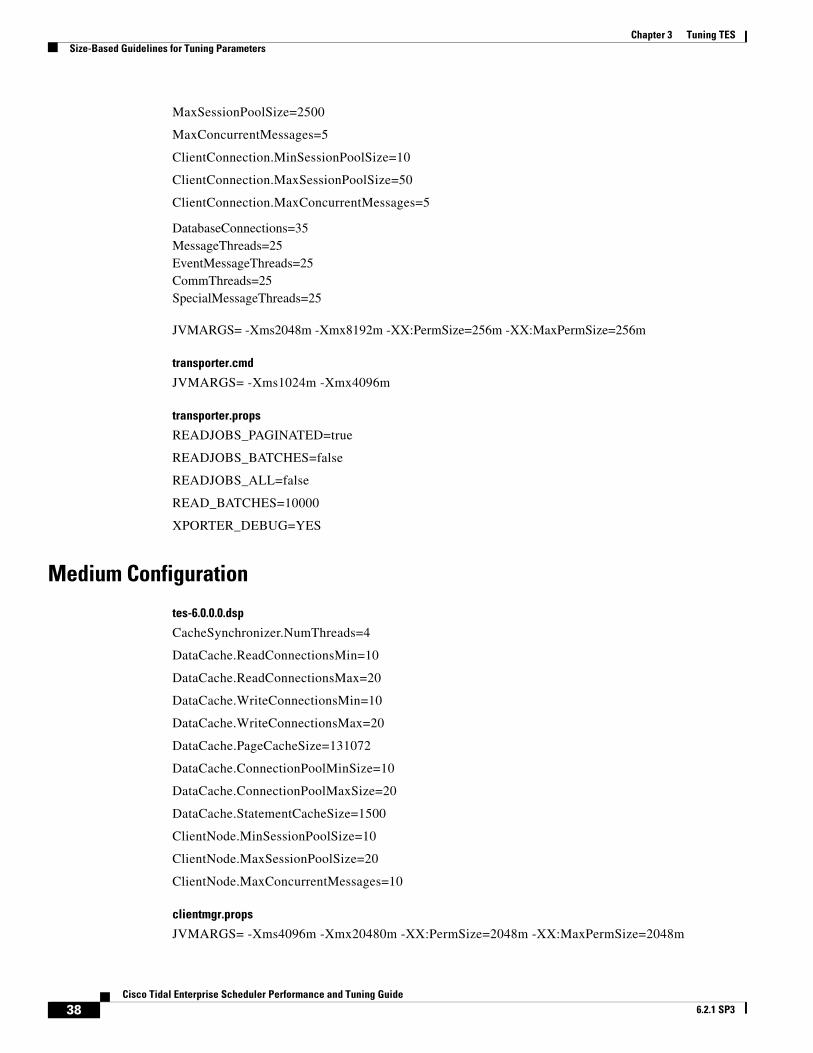
MaxSessionPoolSize=2500
MaxConcurrentMessages=5
ClientConnection.MinSessionPoolSize=10
ClientConnection.MaxSessionPoolSize=50
ClientConnection.MaxConcurrentMessages=5
DatabaseConnections=35MessageThreads=25EventMessageThreads=25CommThreads=25SpecialMessageThreads=25
JVMARGS= -Xms2048m -Xmx8192m -XX:PermSize=256m -XX:MaxPermSize=256m
transporter.cmd
JVMARGS= -Xms1024m -Xmx4096m
transporter.props
READJOBS_PAGINATED=true
READJOBS_BATCHES=false
READJOBS_ALL=false
READ_BATCHES=10000
XPORTER_DEBUG=YES
Medium Configuration
tes-6.0.0.0.dsp
CacheSynchronizer.NumThreads=4
DataCache.ReadConnectionsMin=10
DataCache.ReadConnectionsMax=20
DataCache.WriteConnectionsMin=10
DataCache.WriteConnectionsMax=20
DataCache.PageCacheSize=131072
DataCache.ConnectionPoolMinSize=10
DataCache.ConnectionPoolMaxSize=20
DataCache.StatementCacheSize=1500
ClientNode.MinSessionPoolSize=10
ClientNode.MaxSessionPoolSize=20
ClientNode.MaxConcurrentMessages=10
clientmgr.props
JVMARGS= -Xms4096m -Xmx20480m -XX:PermSize=2048m -XX:MaxPermSize=2048m
38Cisco Tidal Enterprise Scheduler Performance and Tuning Guide
6.2.1 SP3
Chapter 3 Tuning TESSize-Based Guidelines for Tuning Parameters
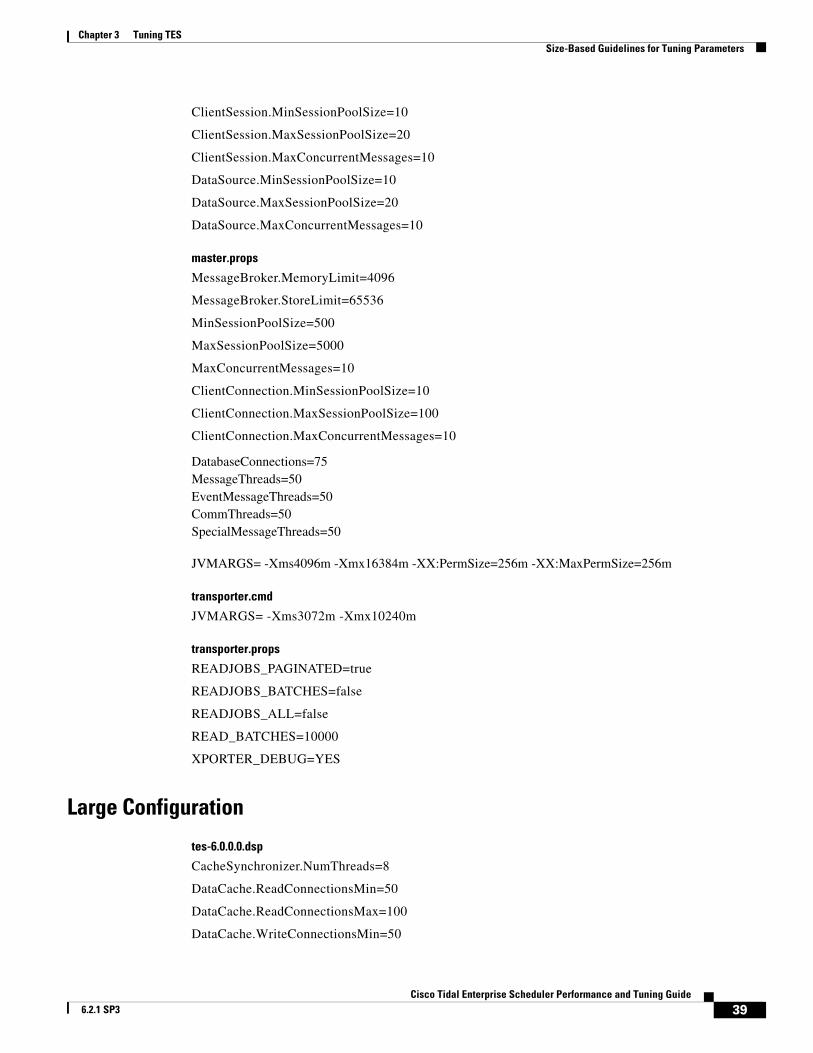
ClientSession.MinSessionPoolSize=10
ClientSession.MaxSessionPoolSize=20
ClientSession.MaxConcurrentMessages=10
DataSource.MinSessionPoolSize=10
DataSource.MaxSessionPoolSize=20
DataSource.MaxConcurrentMessages=10
master.props
MessageBroker.MemoryLimit=4096
MessageBroker.StoreLimit=65536
MinSessionPoolSize=500
MaxSessionPoolSize=5000
MaxConcurrentMessages=10
ClientConnection.MinSessionPoolSize=10
ClientConnection.MaxSessionPoolSize=100
ClientConnection.MaxConcurrentMessages=10
DatabaseConnections=75MessageThreads=50EventMessageThreads=50CommThreads=50SpecialMessageThreads=50
JVMARGS= -Xms4096m -Xmx16384m -XX:PermSize=256m -XX:MaxPermSize=256m
transporter.cmd
JVMARGS= -Xms3072m -Xmx10240m
transporter.props
READJOBS_PAGINATED=true
READJOBS_BATCHES=false
READJOBS_ALL=false
READ_BATCHES=10000
XPORTER_DEBUG=YES
Large Configuration
tes-6.0.0.0.dsp
CacheSynchronizer.NumThreads=8
DataCache.ReadConnectionsMin=50
DataCache.ReadConnectionsMax=100
DataCache.WriteConnectionsMin=50
39Cisco Tidal Enterprise Scheduler Performance and Tuning Guide
6.2.1 SP3
Chapter 3 Tuning TES Size-Based Guidelines for Tuning Parameters
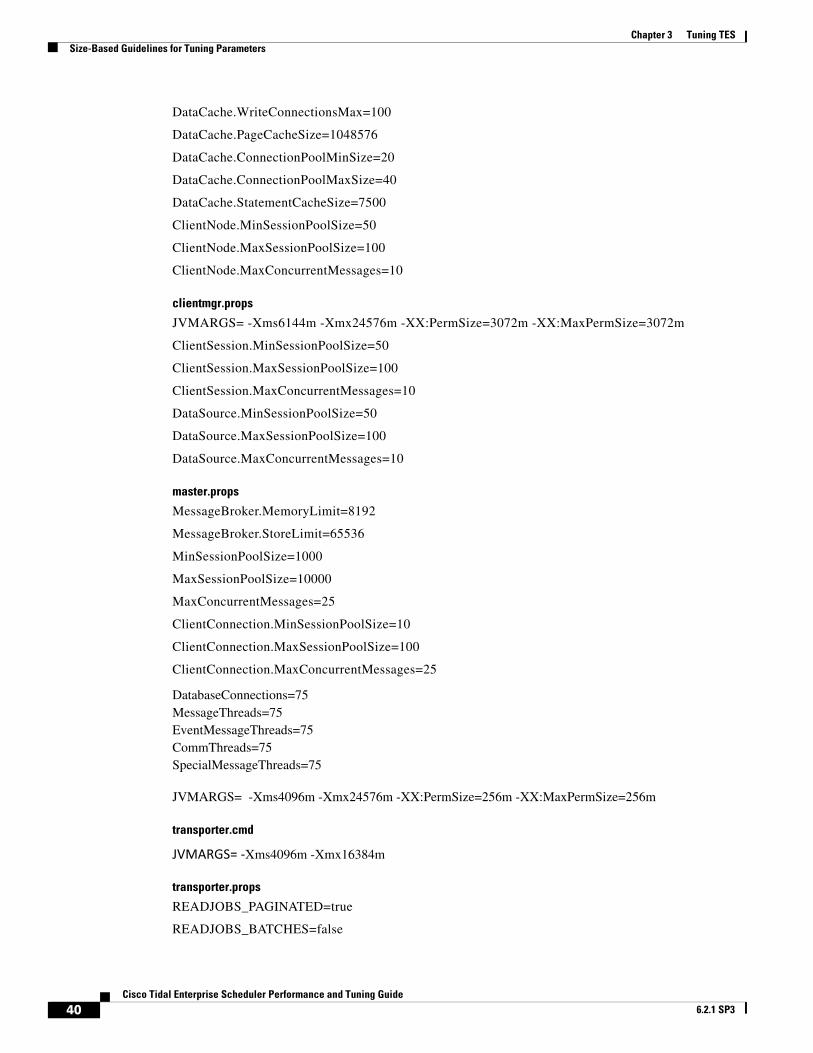
DataCache.WriteConnectionsMax=100
DataCache.PageCacheSize=1048576
DataCache.ConnectionPoolMinSize=20
DataCache.ConnectionPoolMaxSize=40
DataCache.StatementCacheSize=7500
ClientNode.MinSessionPoolSize=50
ClientNode.MaxSessionPoolSize=100
ClientNode.MaxConcurrentMessages=10
clientmgr.props
JVMARGS= -Xms6144m -Xmx24576m -XX:PermSize=3072m -XX:MaxPermSize=3072m
ClientSession.MinSessionPoolSize=50
ClientSession.MaxSessionPoolSize=100
ClientSession.MaxConcurrentMessages=10
DataSource.MinSessionPoolSize=50
DataSource.MaxSessionPoolSize=100
DataSource.MaxConcurrentMessages=10
master.props
MessageBroker.MemoryLimit=8192
MessageBroker.StoreLimit=65536
MinSessionPoolSize=1000
MaxSessionPoolSize=10000
MaxConcurrentMessages=25
ClientConnection.MinSessionPoolSize=10
ClientConnection.MaxSessionPoolSize=100
ClientConnection.MaxConcurrentMessages=25
DatabaseConnections=75MessageThreads=75EventMessageThreads=75CommThreads=75SpecialMessageThreads=75
JVMARGS= -Xms4096m -Xmx24576m -XX:PermSize=256m -XX:MaxPermSize=256m
transporter.cmd
JVMARGS= ‐Xms4096m -Xmx16384m
transporter.props
READJOBS_PAGINATED=true
READJOBS_BATCHES=false
40Cisco Tidal Enterprise Scheduler Performance and Tuning Guide
6.2.1 SP3

Chapter 3 Tuning TESSize-Based Guidelines for Tuning Parameters
READJOBS_ALL=false
READ_BATCHES=10000
XPORTER_DEBUG=YES
41Cisco Tidal Enterprise Scheduler Performance and Tuning Guide
6.2.1 SP3

Chapter 3 Tuning TES Size-Based Guidelines for Tuning Parameters
42Cisco Tidal Enterprise Scheduler Performance and Tuning Guide
6.2.1 SP3
Cisco Tidal E 6.2.1 SP3
C H A P T E R 4
Transporter PerformanceGeneral Best PracticesConsider the following best practices while using the Transporter:
• Use server-side filter to read specific jobs.
• Run only one instance of transporter at a time in a machine.
• Have small number of top level groups.
• Transport during off peak hours or when Client Manager usage is significantly less.
Transporter Job Read OptionsConfigurations have been made available to provide improved performance for unfiltered job reads. Multiple options are available for flexibility. Configuring these options may require tuning based on the customer environment. For tuning purpose, it would best to run the Transporter in debug mode with an open console so that you can view how the reads are performing.
To run the Transporter in debug mode, include XPORTER_DEBUG=YES in the Transporter.props file and run the transporter.cmd script located in bin.
The REST call job.getList has been replaced with the following options:
Parameters Configured via Transporter.props
Only one of the following parameters should be set to true at a time:
• READJOBS_PAGINATED
• READJOBS_ALL
• READJOBS_BATCHES
The READ_BATCHES parameter applies to READJOBS_PAGINATED or READJOBS_BATCHES.
If none of these parameters is set, the default configuration for read is (READ_BATCHES=500, READJOBS_BATCHES=true)
The READ_BATCHES parameter is used when reading paginated or batched reads.
43nterprise Scheduler Performance and Tuning Guide
Chapter 4 Transporter Performance
The READJOBS_PAGINATED parameter determines whether to read jobs in pages.
The READJOBS_BATCHES parameter determines whether to read jobs in batches.
The READJOBS_ALL parameter determines whether to read all, given the min and max job ID.
READJOBS_PAGINATED
READJOBS_PAGINATED configures the Client Manager to return job data in pages, with the batches based on the READ_BATCHES value.
For example, READ_BATCHES=1000 and READJOBS_PAGINATED=true, tells the Client Manager to return job data in batches of 1000. This approach reduces the overhead on the Client Manager as data is sent in smaller batches. Increasing the READ_BATCHES value will reduce the number of requests sent to the Client Manager since the jobs are returned in larger batches.
Note This approach may have less benefit given many jobs (i.e. 50K or more). The batching is done at the Client Manager level.
READJOBS_BATCHES
READJOBS_BATCHES reads jobs based on a given range of job IDs, where the range is specified via READ_BATCHES.
For example, if you have 50,000 job records whose job IDs start at 1 and ends at 50000, and you have set READ_BATCHES=1000 and READJOBS_BATCHES=true, requests will be sent to the Client Manager to query job records in ranges, until no more records are returned, as follows.
jobid >=1 and jobid <=1001jobid >=1002 and jobid <= 2002jobid >=2003 and jobid <= 3003…
If all the job IDs are sequential and start at 1, then each batch request will result in roughly 1000 records. However, if there are large gaps in the job IDs, due to mass job deletes for example, the request may return fewer results depending on where the job record ID falls in that range. While executing the read and running Transporter in the debug mode, if you find that very few or 0 records are returned given a READ_BATCHES configuration, then increasing this value will be necessary to reduce the number of requests that return 0 or few results.
Note This approach appears to be more beneficial when there are many job records (50K or more).
READJOBS_ALL
READJOBS_ALL reads all jobs based on the first and last job ID. The result is that all jobs will be read in a single request. This approach is different from the job.getList call in that while both return all jobs, this request adds a query condition to the request, which seems to produce better performance. However, because all records are returned in a single request, the Client Manager will need to process all the records to send to Transporter.
Note If there are many job records, the overhead on the Client Manager may be too high.
44Cisco Tidal Enterprise Scheduler Performance and Tuning Guide
6.2.1 SP3