Embed Size (px)
Citation preview
Cisco Nexus 9508:A New High-Water Mark
For 100G Performance
April 2016
Page 2
Cisco Nexus 9508 Performance Benchmarks
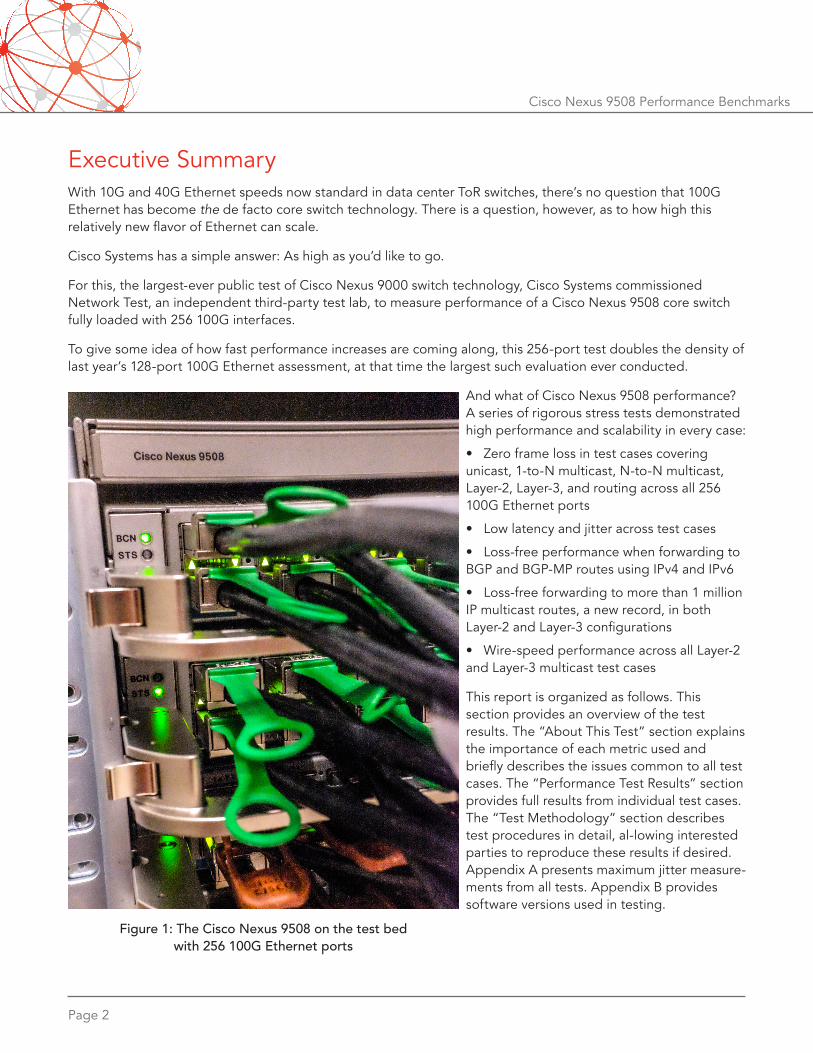
Figure 1: The Cisco Nexus 9508 on the test bedwith 256 100G Ethernet ports
Executive SummaryWith 10G and 40G Ethernet speeds now standard in data center ToR switches, there’s no question that 100G Ethernet has become the de facto core switch technology. There is a question, however, as to how high this relatively new flavor of Ethernet can scale.
Cisco Systems has a simple answer: As high as you’d like to go.
For this, the largest-ever public test of Cisco Nexus 9000 switch technology, Cisco Systems commissioned Network Test, an independent third-party test lab, to measure performance of a Cisco Nexus 9508 core switch fully loaded with 256 100G interfaces.
To give some idea of how fast performance increases are coming along, this 256-port test doubles the density of last year’s 128-port 100G Ethernet assessment, at that time the largest such evaluation ever conducted.
And what of Cisco Nexus 9508 performance? A series of rigorous stress tests demonstrated high performance and scalability in every case:
• Zero frame loss in test cases covering unicast, 1-to-N multicast, N-to-N multicast, Layer-2, Layer-3, and routing across all 256 100G Ethernet ports
• Low latency and jitter across test cases
• Loss-free performance when forwarding to BGP and BGP-MP routes using IPv4 and IPv6
• Loss-free forwarding to more than 1 million IP multicast routes, a new record, in both Layer-2 and Layer-3 configurations
• Wire-speed performance across all Layer-2 and Layer-3 multicast test cases
This report is organized as follows. This section provides an overview of the test results. The “About This Test” section explains the importance of each metric used and briefly describes the issues common to all test cases. The “Performance Test Results” section provides full results from individual test cases. The “Test Methodology” section describes test procedures in detail, al-lowing interested parties to reproduce these results if desired. Appendix A presents maximum jitter measure-ments from all tests. Appendix B provides software versions used in testing.

Page 3
Cisco Nexus 9508 Performance Benchmarks
About This TestThis project characterized Cisco Nexus 9508 performance with the switch in 10 configuration modes, most involving 256 100G Ethernet interfaces:
• Test bed infrastructure latency and jitter
• RFC 2889 Ethernet unicast performance
• RFC 2544 IPv4 unicast performance
• RFC 2544 IPv4 unicast performance with BGP routing
• RFC 5180 IPv6 unicast performance
• RFC 5180 IPv6 unicast performance with BGP-MP routing
• RFC 3918 Ethernet multicast performance
• Ethernet N-to-N multicast performance
• RFC 3918 IPv4 multicast performance
• Forward error correction (FEC) latency and jitter
Figure 1 shows the Cisco Nexus 9508 on the test bed, fully loaded with a Supervisor A engine and N9K-X9432C-S modules. The test bed also included with the Spirent TestCenter traffic generator/analyzer with dX2-100G-P4 modules. Spirent TestCenter is capable of offering traffic at wire speed on all ports with transmit timestamp resolution of 2.5 nanoseconds.
For all tests, the primary metrics were throughput, latency, and jitter.
RFC 2544, the industry-standard methodology for network device testing, determines throughput as the limit of system performance. In the context of lab benchmarking, throughput describes the maximum rate at which a device forwards all traffic with zero frame loss. Describing “real-world” performance is explicitly a non-goal of RFC 2544 throughput testing. Indeed, production networks load are typically far lower than the throughput rate.
Latency and jitter respectively describe the delay and delay variation introduced by a switch. Both are vital, and arguably even more important than throughput, especially for delay-sensitive applications such as video, voice, and some financial trading applications.
RFC 2544 requires latency be measured at, and only at, the throughput rate. Since average utilization in produc-tion networks is typically far lower than line rate, it can also be useful to characterize delay for traffic at lower rates.
All tests described here present latency and jitter not only at the throughput rate, but also at 10, 50, and 90 percent of line rate. These results should help network professionals understand Cisco Nexus 9508 in their networks, modeling their network utilizations.
In all tests, engineers configured the Cisco Nexus 9508 with N9K-X9432C-S modules in store-and-forward mode. As described in the “Test Methodology” section, the Cisco switch also supports cut-through mode, which produces lower latency with the tradeoff of a higher risk of low-level errors.
Page 4
Cisco Nexus 9508 Performance Benchmarks
Performance Test ResultsThis section describes results for each configuration mode. See the “Test Methodology” section for details on test procedures.
Test Bed Latency and Jitter
Copper and fiber Ethernet transceivers and cabling add small but significant amounts of latency and jitter even when no switch is present. Cisco deployed a combination of CFP2 copper and fiber transceivers and adapters as well as 1- and 3-meter lengths of cabling – each of which adds delay outside the Cisco Nexus switch (each meter of copper or fiber cabling adds about 5 ns of delay).
Further, the Cisco Nexus 9508 uses QSFP28 interfaces, while the Spirent TestCenter 100G Ethernet modules use CFP2 interfaces. This difference necessitated the use of CFP2-to-QSFP28 electrical adapters, introducing signifi-cant additional delay.
To characterize the latency and jitter of these external factors, test engineers took measurements between ports of the Spirent TestCenter traffic generator/analyzer with no switch present. Engineers ran the tests twice, once apiece with copper and fiber media.
Tables 1 and 2 present results of test bed latency and jitter characterization for copper and fiber infrastructure (transceivers plus cabling), respectively. It’s important to note that the rest of the latency and jitter measurements in this report include this extra delay and delay variation. These measurements cannot easily be subtracted from switch measurements due to the use of fully meshed traffic (including fiber ports exchanging traffic with copper ports), the combination of copper and fiber transceivers, and differing cable lengths. Still, these test-bed-only measurements offer guidelines for the additional latency and jitter present due to factors external to the Cisco Nexus 9508 switch.

Page 5
Cisco Nexus 9508 Performance Benchmarks
Throughput Latency Jitter
Frame size (bytes)
Frames/s
Tbit/s
% line rate
Min (usec)
Avg (usec)
Max (usec)
Avg (usec)
Max (usec)
64 297,619,047.62 0.152 100.0000% 0.340 0.351 0.380 0.005 0.020
128 168,918,918.92 0.173 100.0000% 0.340 0.351 0.380 0.003 0.020
256 90,579,710.15 0.186 100.0000% 0.340 0.352 0.380 0.004 0.020
512 46,992,481.21 0.192 100.0000% 0.340 0.351 0.380 0.005 0.030
1,024 23,946,360.16 0.196 100.0000% 0.340 0.350 0.380 0.006 0.030
1,280 19,230,769.23 0.197 100.0000% 0.340 0.351 0.380 0.006 0.030
1,518 16,254,876.47 0.197 100.0000% 0.340 0.351 0.380 0.005 0.030
9,216 2,706,799.48 0.200 100.0000% 0.340 0.352 0.380 0.005 0.030
Table 1: Copper test bed infrastructure performance results
Throughput Latency Jitter
Frame size (bytes)
Frames/s
Tbit/s
% line rate
Min (usec)
Avg (usec)
Max (usec)
Avg (usec)
Max (usec)
64 297,619,047.61 0.152 100.0000% 0.330 0.346 0.380 0.005 0.020
128 168,918,918.91 0.173 100.0000% 0.330 0.346 0.380 0.003 0.020
256 90,579,710.14 0.186 100.0000% 0.330 0.346 0.380 0.004 0.020
512 46,992,481.20 0.192 100.0000% 0.330 0.347 0.380 0.004 0.020
1,024 23,946,360.16 0.196 100.0000% 0.330 0.347 0.380 0.006 0.020
1,280 19,230,769.23 0.197 100.0000% 0.330 0.347 0.380 0.006 0.020
1,518 16,254,876.47 0.197 100.0000% 0.330 0.347 0.380 0.005 0.020
9,216 2,706,799.48 0.200 100.0000% 0.330 0.348 0.380 0.005 0.020
Table 2: Fiber test bed infrastructure performance results
Page 6
Cisco Nexus 9508 Performance Benchmarks
Throughput Latency Jitter
Frame size (bytes)
Frames/s
Tbit/s
% line rate
Min (usec)
Avg (usec)
Max (usec)
Avg (usec)
Max (usec)
64 26,547,619,750 13.592 69.6875% 0.840 2.325 4.460 0.141 1.820
128 21,620,325,055 22.139 99.9940% 0.880 2.755 5.010 0.071 1.850
256 11,593,507,613 23.744 99.9940% 0.890 3.032 6.430 0.086 2.450
512 6,014,676,869 24.636 99.9940% 0.860 3.548 8.890 0.083 3.620
1,024 3,064,950,262 25.108 99.9940% 0.840 4.651 14.470 0.106 5.940
1,280 2,461,390,810 25.205 99.9940% 0.820 5.176 16.970 0.133 7.120
1,518 2,080,499,381 25.266 99.9940% 0.810 5.664 18.000 0.140 8.060
9,216 346,449,518 25.543 99.9940% 0.770 23.046 96.150 0.499 46.320
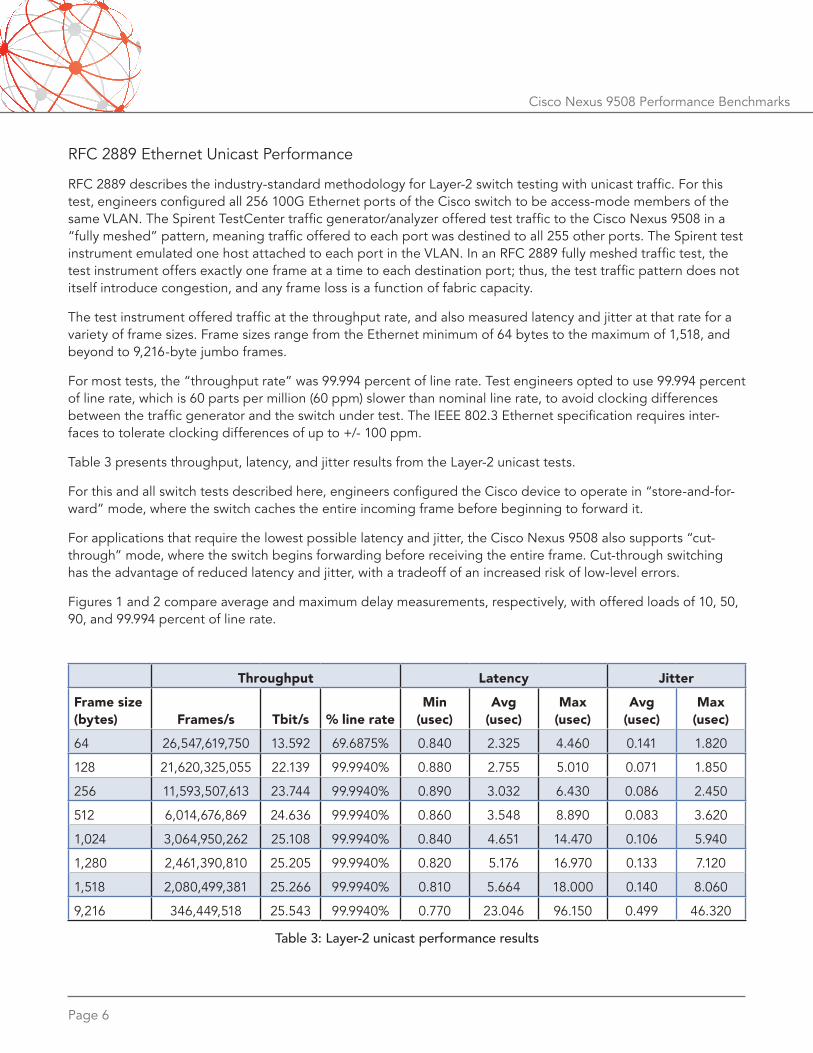
Table 3: Layer-2 unicast performance results
RFC 2889 Ethernet Unicast Performance
RFC 2889 describes the industry-standard methodology for Layer-2 switch testing with unicast traffic. For this test, engineers configured all 256 100G Ethernet ports of the Cisco switch to be access-mode members of the same VLAN. The Spirent TestCenter traffic generator/analyzer offered test traffic to the Cisco Nexus 9508 in a “fully meshed” pattern, meaning traffic offered to each port was destined to all 255 other ports. The Spirent test instrument emulated one host attached to each port in the VLAN. In an RFC 2889 fully meshed traffic test, the test instrument offers exactly one frame at a time to each destination port; thus, the test traffic pattern does not itself introduce congestion, and any frame loss is a function of fabric capacity.
The test instrument offered traffic at the throughput rate, and also measured latency and jitter at that rate for a variety of frame sizes. Frame sizes range from the Ethernet minimum of 64 bytes to the maximum of 1,518, and beyond to 9,216-byte jumbo frames.
For most tests, the “throughput rate” was 99.994 percent of line rate. Test engineers opted to use 99.994 percent of line rate, which is 60 parts per million (60 ppm) slower than nominal line rate, to avoid clocking differences between the traffic generator and the switch under test. The IEEE 802.3 Ethernet specification requires inter-faces to tolerate clocking differences of up to +/- 100 ppm.
Table 3 presents throughput, latency, and jitter results from the Layer-2 unicast tests.
For this and all switch tests described here, engineers configured the Cisco device to operate in “store-and-for-ward” mode, where the switch caches the entire incoming frame before beginning to forward it.
For applications that require the lowest possible latency and jitter, the Cisco Nexus 9508 also supports “cut-through” mode, where the switch begins forwarding before receiving the entire frame. Cut-through switching has the advantage of reduced latency and jitter, with a tradeoff of an increased risk of low-level errors.
Figures 1 and 2 compare average and maximum delay measurements, respectively, with offered loads of 10, 50, 90, and 99.994 percent of line rate.

Page 7
Cisco Nexus 9508 Performance Benchmarks
Figure 1: Layer-2 unicast average latency vs. load
Figure 2: Layer-2 unicast maximum latency vs. load
Page 8
Cisco Nexus 9508 Performance Benchmarks
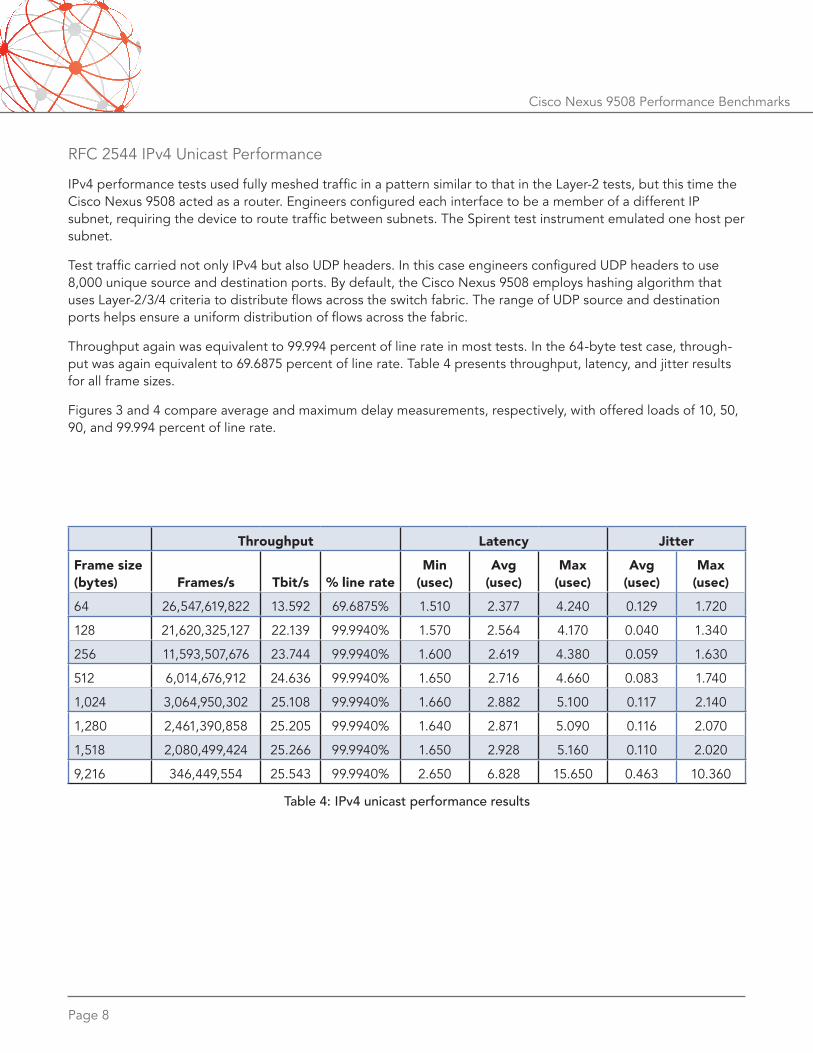
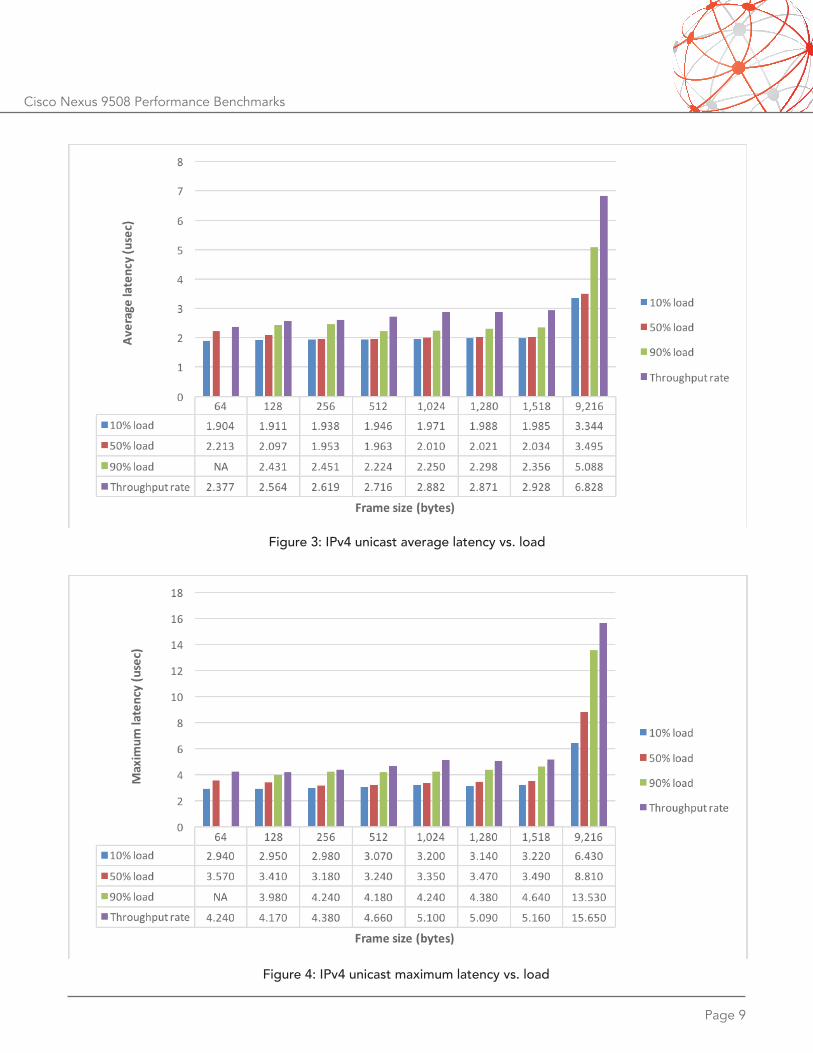
RFC 2544 IPv4 Unicast Performance
IPv4 performance tests used fully meshed traffic in a pattern similar to that in the Layer-2 tests, but this time the Cisco Nexus 9508 acted as a router. Engineers configured each interface to be a member of a different IP subnet, requiring the device to route traffic between subnets. The Spirent test instrument emulated one host per subnet.
Test traffic carried not only IPv4 but also UDP headers. In this case engineers configured UDP headers to use 8,000 unique source and destination ports. By default, the Cisco Nexus 9508 employs hashing algorithm that uses Layer-2/3/4 criteria to distribute flows across the switch fabric. The range of UDP source and destination ports helps ensure a uniform distribution of flows across the fabric.
Throughput again was equivalent to 99.994 percent of line rate in most tests. In the 64-byte test case, through-put was again equivalent to 69.6875 percent of line rate. Table 4 presents throughput, latency, and jitter results for all frame sizes.
Figures 3 and 4 compare average and maximum delay measurements, respectively, with offered loads of 10, 50, 90, and 99.994 percent of line rate.
Throughput Latency Jitter
Frame size (bytes)
Frames/s
Tbit/s
% line rate
Min (usec)
Avg (usec)
Max (usec)
Avg (usec)
Max (usec)
64 26,547,619,822 13.592 69.6875% 1.510 2.377 4.240 0.129 1.720
128 21,620,325,127 22.139 99.9940% 1.570 2.564 4.170 0.040 1.340
256 11,593,507,676 23.744 99.9940% 1.600 2.619 4.380 0.059 1.630
512 6,014,676,912 24.636 99.9940% 1.650 2.716 4.660 0.083 1.740
1,024 3,064,950,302 25.108 99.9940% 1.660 2.882 5.100 0.117 2.140
1,280 2,461,390,858 25.205 99.9940% 1.640 2.871 5.090 0.116 2.070
1,518 2,080,499,424 25.266 99.9940% 1.650 2.928 5.160 0.110 2.020
9,216 346,449,554 25.543 99.9940% 2.650 6.828 15.650 0.463 10.360
Table 4: IPv4 unicast performance results
Page 9
Cisco Nexus 9508 Performance Benchmarks
Figure 3: IPv4 unicast average latency vs. load
Figure 4: IPv4 unicast maximum latency vs. load
Page 10
Cisco Nexus 9508 Performance Benchmarks
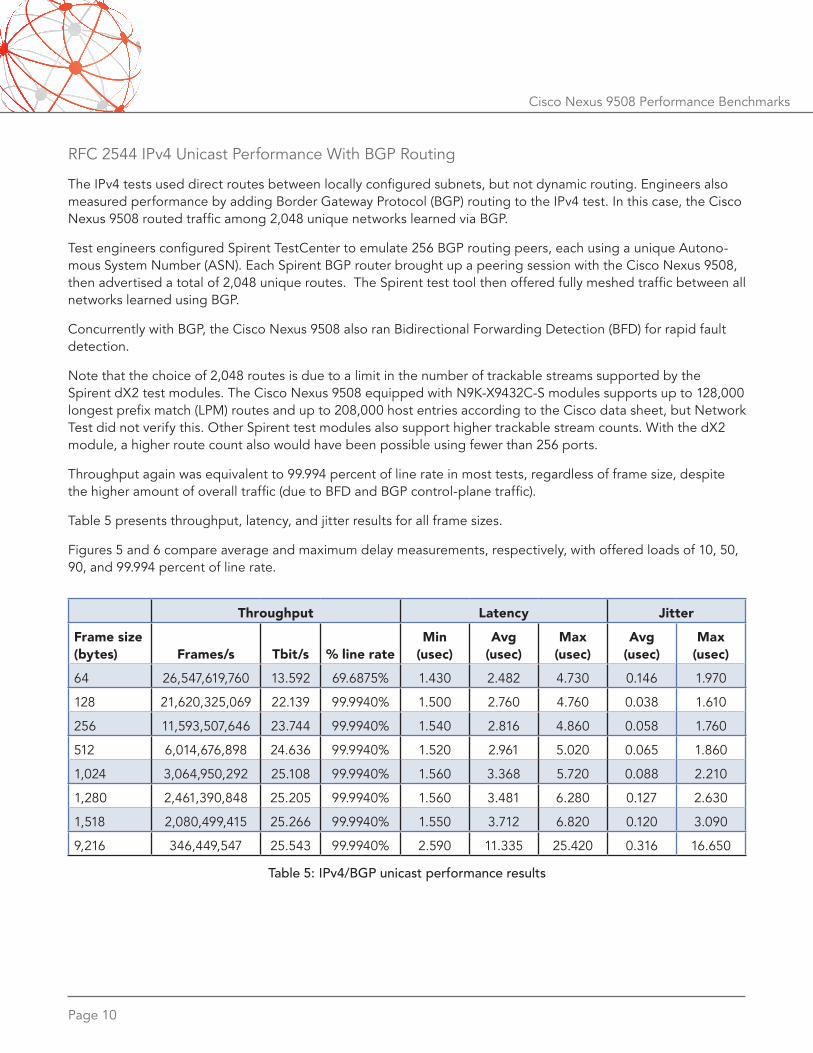
RFC 2544 IPv4 Unicast Performance With BGP Routing
The IPv4 tests used direct routes between locally configured subnets, but not dynamic routing. Engineers also measured performance by adding Border Gateway Protocol (BGP) routing to the IPv4 test. In this case, the Cisco Nexus 9508 routed traffic among 2,048 unique networks learned via BGP.
Test engineers configured Spirent TestCenter to emulate 256 BGP routing peers, each using a unique Autono-mous System Number (ASN). Each Spirent BGP router brought up a peering session with the Cisco Nexus 9508, then advertised a total of 2,048 unique routes. The Spirent test tool then offered fully meshed traffic between all networks learned using BGP.
Concurrently with BGP, the Cisco Nexus 9508 also ran Bidirectional Forwarding Detection (BFD) for rapid fault detection.
Note that the choice of 2,048 routes is due to a limit in the number of trackable streams supported by the Spirent dX2 test modules. The Cisco Nexus 9508 equipped with N9K-X9432C-S modules supports up to 128,000 longest prefix match (LPM) routes and up to 208,000 host entries according to the Cisco data sheet, but Network Test did not verify this. Other Spirent test modules also support higher trackable stream counts. With the dX2 module, a higher route count also would have been possible using fewer than 256 ports.
Throughput again was equivalent to 99.994 percent of line rate in most tests, regardless of frame size, despite the higher amount of overall traffic (due to BFD and BGP control-plane traffic).
Table 5 presents throughput, latency, and jitter results for all frame sizes.
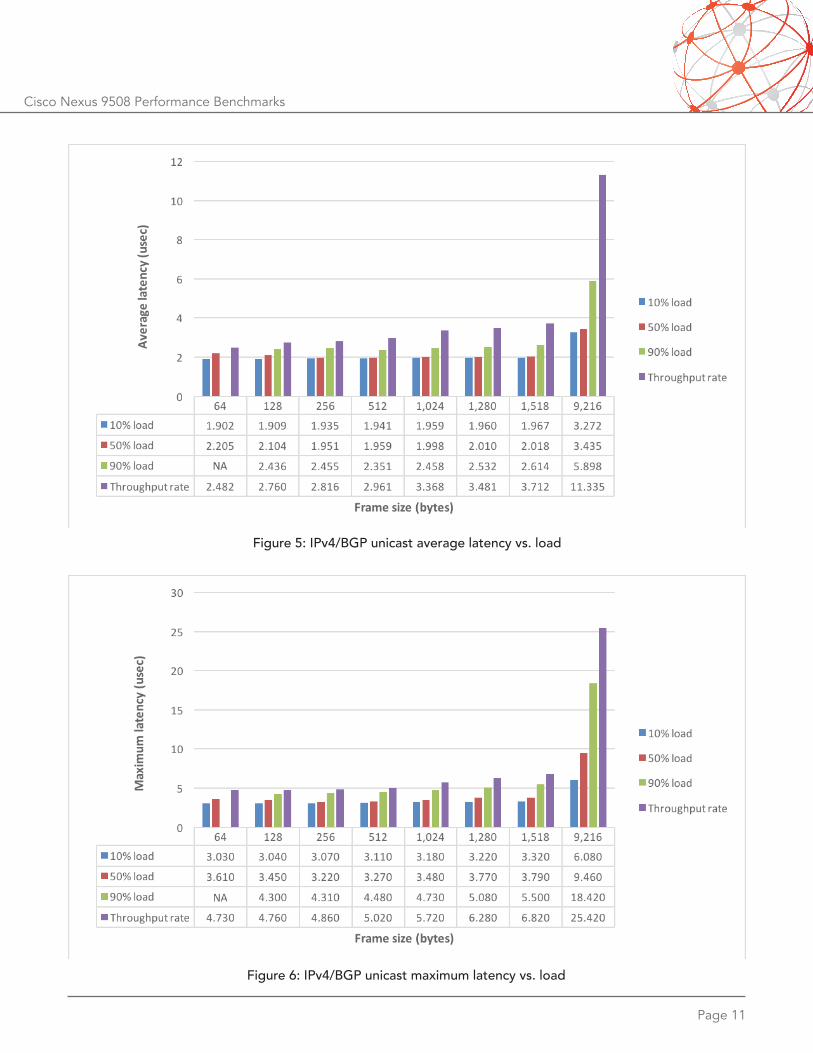
Figures 5 and 6 compare average and maximum delay measurements, respectively, with offered loads of 10, 50, 90, and 99.994 percent of line rate.
Throughput Latency Jitter
Frame size (bytes)
Frames/s
Tbit/s
% line rate
Min (usec)
Avg (usec)
Max (usec)
Avg (usec)
Max (usec)
64 26,547,619,760 13.592 69.6875% 1.430 2.482 4.730 0.146 1.970
128 21,620,325,069 22.139 99.9940% 1.500 2.760 4.760 0.038 1.610
256 11,593,507,646 23.744 99.9940% 1.540 2.816 4.860 0.058 1.760
512 6,014,676,898 24.636 99.9940% 1.520 2.961 5.020 0.065 1.860
1,024 3,064,950,292 25.108 99.9940% 1.560 3.368 5.720 0.088 2.210
1,280 2,461,390,848 25.205 99.9940% 1.560 3.481 6.280 0.127 2.630
1,518 2,080,499,415 25.266 99.9940% 1.550 3.712 6.820 0.120 3.090
9,216 346,449,547 25.543 99.9940% 2.590 11.335 25.420 0.316 16.650
Table 5: IPv4/BGP unicast performance results
Page 11
Cisco Nexus 9508 Performance Benchmarks
Figure 5: IPv4/BGP unicast average latency vs. load
Figure 6: IPv4/BGP unicast maximum latency vs. load
Page 12
Cisco Nexus 9508 Performance Benchmarks
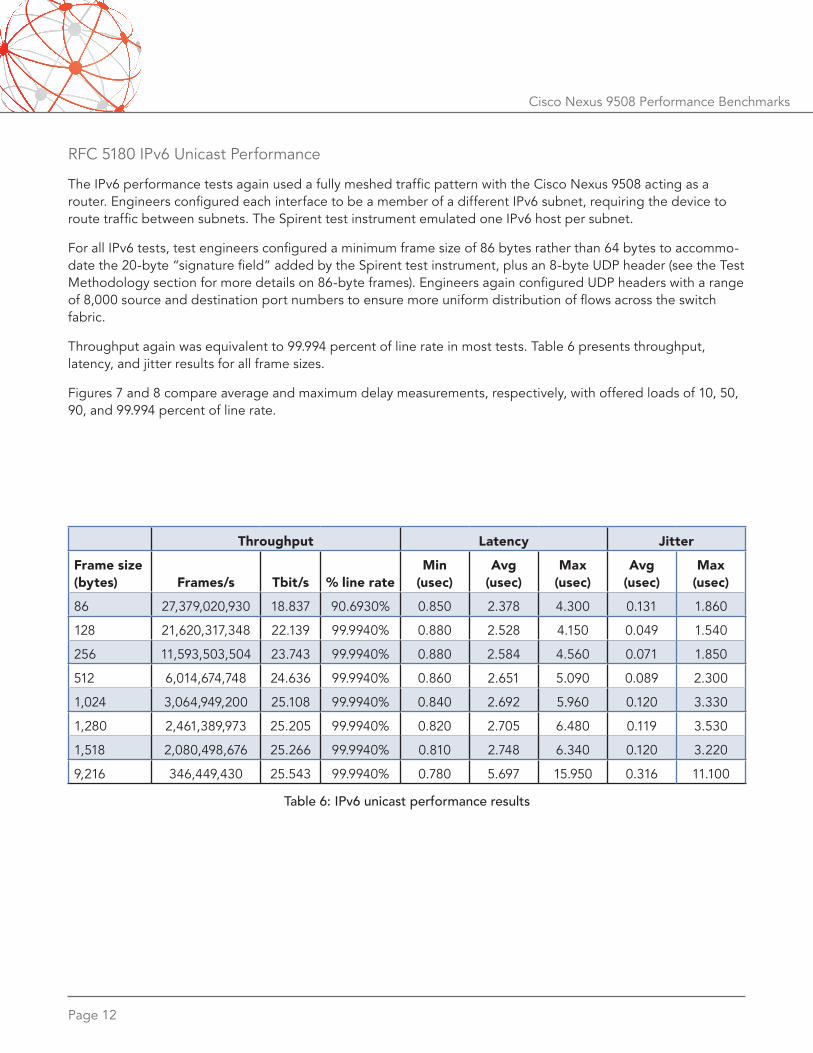
RFC 5180 IPv6 Unicast Performance
The IPv6 performance tests again used a fully meshed traffic pattern with the Cisco Nexus 9508 acting as a router. Engineers configured each interface to be a member of a different IPv6 subnet, requiring the device to route traffic between subnets. The Spirent test instrument emulated one IPv6 host per subnet.
For all IPv6 tests, test engineers configured a minimum frame size of 86 bytes rather than 64 bytes to accommo-date the 20-byte “signature field” added by the Spirent test instrument, plus an 8-byte UDP header (see the Test Methodology section for more details on 86-byte frames). Engineers again configured UDP headers with a range of 8,000 source and destination port numbers to ensure more uniform distribution of flows across the switch fabric.
Throughput again was equivalent to 99.994 percent of line rate in most tests. Table 6 presents throughput, latency, and jitter results for all frame sizes.
Figures 7 and 8 compare average and maximum delay measurements, respectively, with offered loads of 10, 50, 90, and 99.994 percent of line rate.
Throughput Latency Jitter
Frame size (bytes)
Frames/s
Tbit/s
% line rate
Min (usec)
Avg (usec)
Max (usec)
Avg (usec)
Max (usec)
86 27,379,020,930 18.837 90.6930% 0.850 2.378 4.300 0.131 1.860
128 21,620,317,348 22.139 99.9940% 0.880 2.528 4.150 0.049 1.540
256 11,593,503,504 23.743 99.9940% 0.880 2.584 4.560 0.071 1.850
512 6,014,674,748 24.636 99.9940% 0.860 2.651 5.090 0.089 2.300
1,024 3,064,949,200 25.108 99.9940% 0.840 2.692 5.960 0.120 3.330
1,280 2,461,389,973 25.205 99.9940% 0.820 2.705 6.480 0.119 3.530
1,518 2,080,498,676 25.266 99.9940% 0.810 2.748 6.340 0.120 3.220
9,216 346,449,430 25.543 99.9940% 0.780 5.697 15.950 0.316 11.100
Table 6: IPv6 unicast performance results

Page 13
Cisco Nexus 9508 Performance Benchmarks
Figure 7: IPv6 unicast average latency vs. load
Figure 8: IPv6 unicast maximum latency vs. load
Page 14
Cisco Nexus 9508 Performance Benchmarks
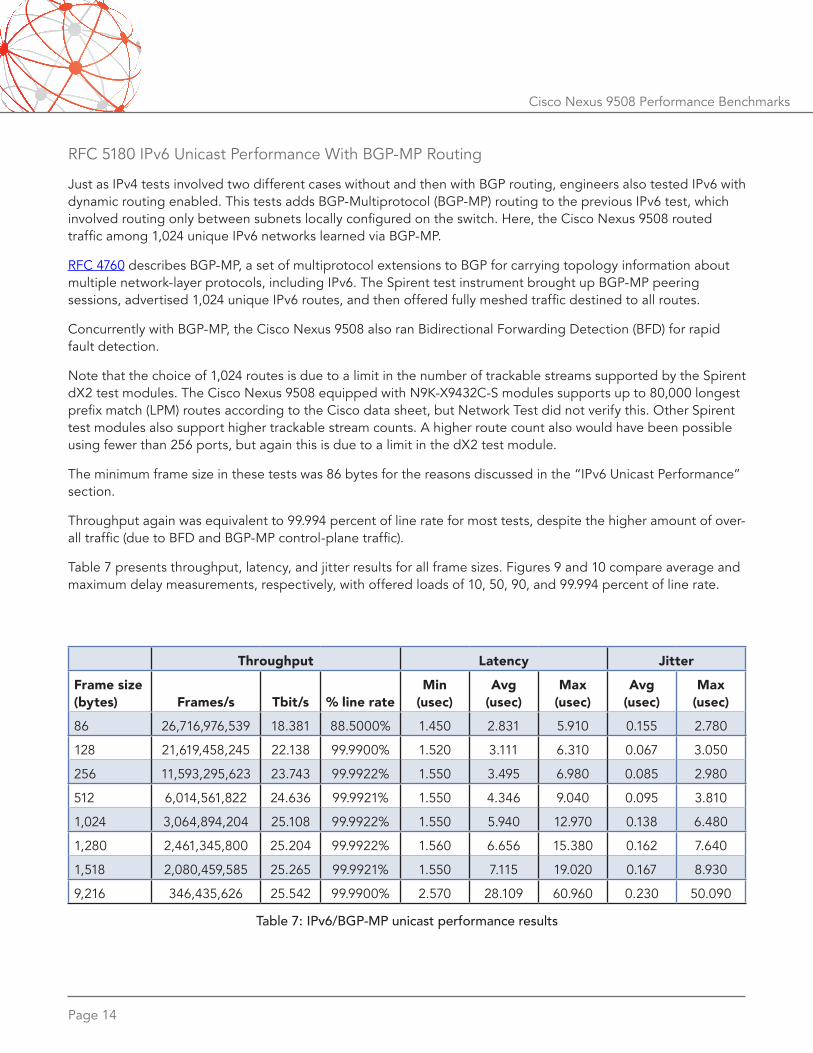
RFC 5180 IPv6 Unicast Performance With BGP-MP Routing
Just as IPv4 tests involved two different cases without and then with BGP routing, engineers also tested IPv6 with dynamic routing enabled. This tests adds BGP-Multiprotocol (BGP-MP) routing to the previous IPv6 test, which involved routing only between subnets locally configured on the switch. Here, the Cisco Nexus 9508 routed traffic among 1,024 unique IPv6 networks learned via BGP-MP.
RFC 4760 describes BGP-MP, a set of multiprotocol extensions to BGP for carrying topology information about multiple network-layer protocols, including IPv6. The Spirent test instrument brought up BGP-MP peering sessions, advertised 1,024 unique IPv6 routes, and then offered fully meshed traffic destined to all routes.
Concurrently with BGP-MP, the Cisco Nexus 9508 also ran Bidirectional Forwarding Detection (BFD) for rapid fault detection.
Note that the choice of 1,024 routes is due to a limit in the number of trackable streams supported by the Spirent dX2 test modules. The Cisco Nexus 9508 equipped with N9K-X9432C-S modules supports up to 80,000 longest prefix match (LPM) routes according to the Cisco data sheet, but Network Test did not verify this. Other Spirent test modules also support higher trackable stream counts. A higher route count also would have been possible using fewer than 256 ports, but again this is due to a limit in the dX2 test module.
The minimum frame size in these tests was 86 bytes for the reasons discussed in the “IPv6 Unicast Performance” section.
Throughput again was equivalent to 99.994 percent of line rate for most tests, despite the higher amount of over-all traffic (due to BFD and BGP-MP control-plane traffic).
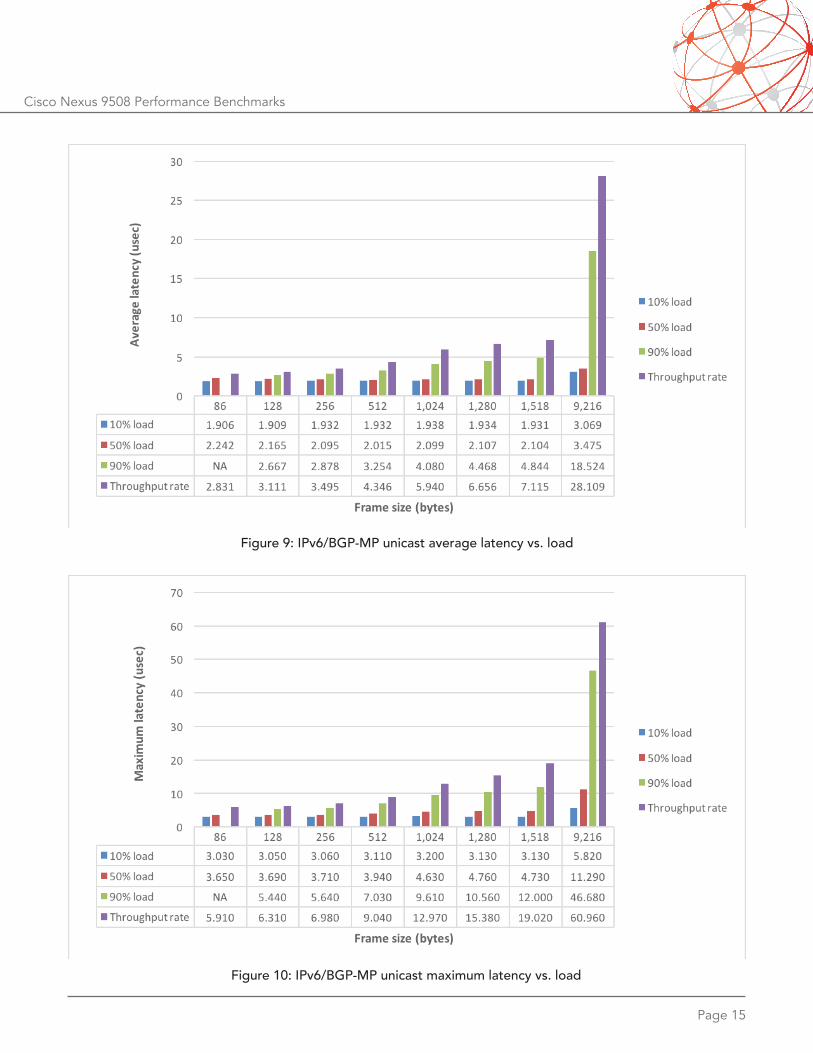
Table 7 presents throughput, latency, and jitter results for all frame sizes. Figures 9 and 10 compare average and maximum delay measurements, respectively, with offered loads of 10, 50, 90, and 99.994 percent of line rate.
Throughput Latency Jitter
Frame size (bytes)
Frames/s
Tbit/s
% line rate
Min (usec)
Avg (usec)
Max (usec)
Avg (usec)
Max (usec)
86 26,716,976,539 18.381 88.5000% 1.450 2.831 5.910 0.155 2.780
128 21,619,458,245 22.138 99.9900% 1.520 3.111 6.310 0.067 3.050
256 11,593,295,623 23.743 99.9922% 1.550 3.495 6.980 0.085 2.980
512 6,014,561,822 24.636 99.9921% 1.550 4.346 9.040 0.095 3.810
1,024 3,064,894,204 25.108 99.9922% 1.550 5.940 12.970 0.138 6.480
1,280 2,461,345,800 25.204 99.9922% 1.560 6.656 15.380 0.162 7.640
1,518 2,080,459,585 25.265 99.9921% 1.550 7.115 19.020 0.167 8.930
9,216 346,435,626 25.542 99.9900% 2.570 28.109 60.960 0.230 50.090
Table 7: IPv6/BGP-MP unicast performance results
Page 15
Cisco Nexus 9508 Performance Benchmarks
Figure 9: IPv6/BGP-MP unicast average latency vs. load
Figure 10: IPv6/BGP-MP unicast maximum latency vs. load
Page 16
Cisco Nexus 9508 Performance Benchmarks
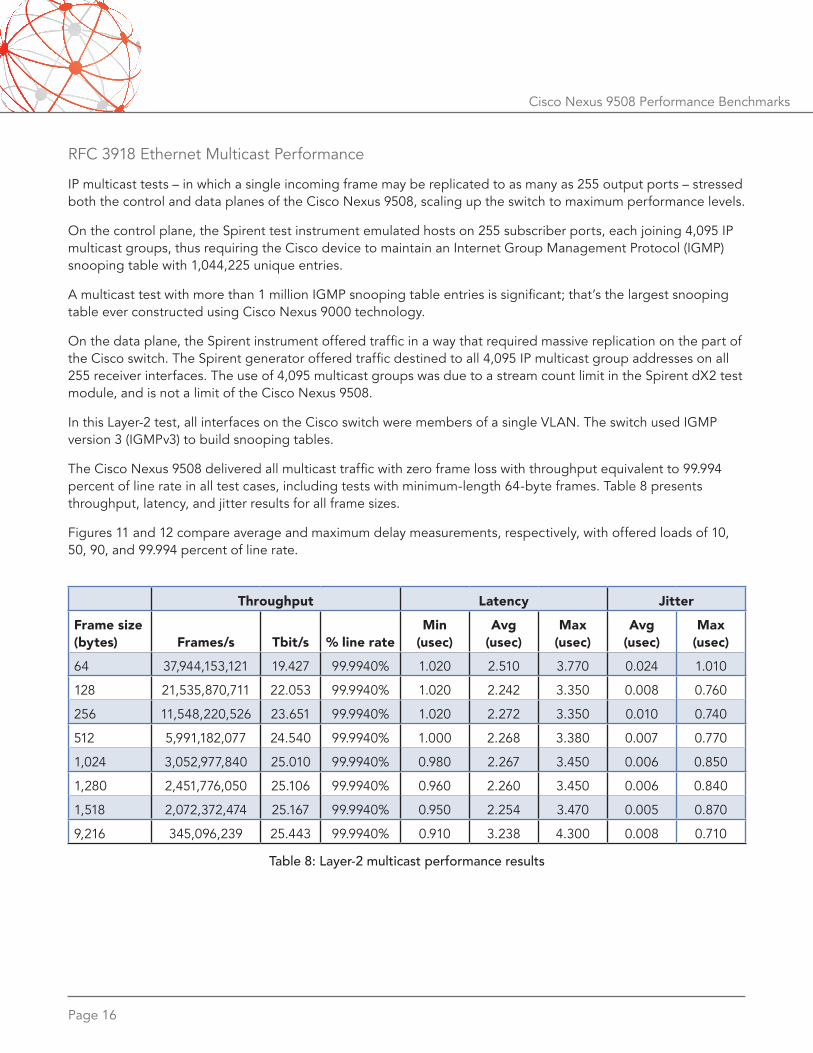
RFC 3918 Ethernet Multicast Performance
IP multicast tests – in which a single incoming frame may be replicated to as many as 255 output ports – stressed both the control and data planes of the Cisco Nexus 9508, scaling up the switch to maximum performance levels.
On the control plane, the Spirent test instrument emulated hosts on 255 subscriber ports, each joining 4,095 IP multicast groups, thus requiring the Cisco device to maintain an Internet Group Management Protocol (IGMP) snooping table with 1,044,225 unique entries.
A multicast test with more than 1 million IGMP snooping table entries is significant; that’s the largest snooping table ever constructed using Cisco Nexus 9000 technology.
On the data plane, the Spirent instrument offered traffic in a way that required massive replication on the part of the Cisco switch. The Spirent generator offered traffic destined to all 4,095 IP multicast group addresses on all 255 receiver interfaces. The use of 4,095 multicast groups was due to a stream count limit in the Spirent dX2 test module, and is not a limit of the Cisco Nexus 9508.
In this Layer-2 test, all interfaces on the Cisco switch were members of a single VLAN. The switch used IGMP version 3 (IGMPv3) to build snooping tables.
The Cisco Nexus 9508 delivered all multicast traffic with zero frame loss with throughput equivalent to 99.994 percent of line rate in all test cases, including tests with minimum-length 64-byte frames. Table 8 presents throughput, latency, and jitter results for all frame sizes.
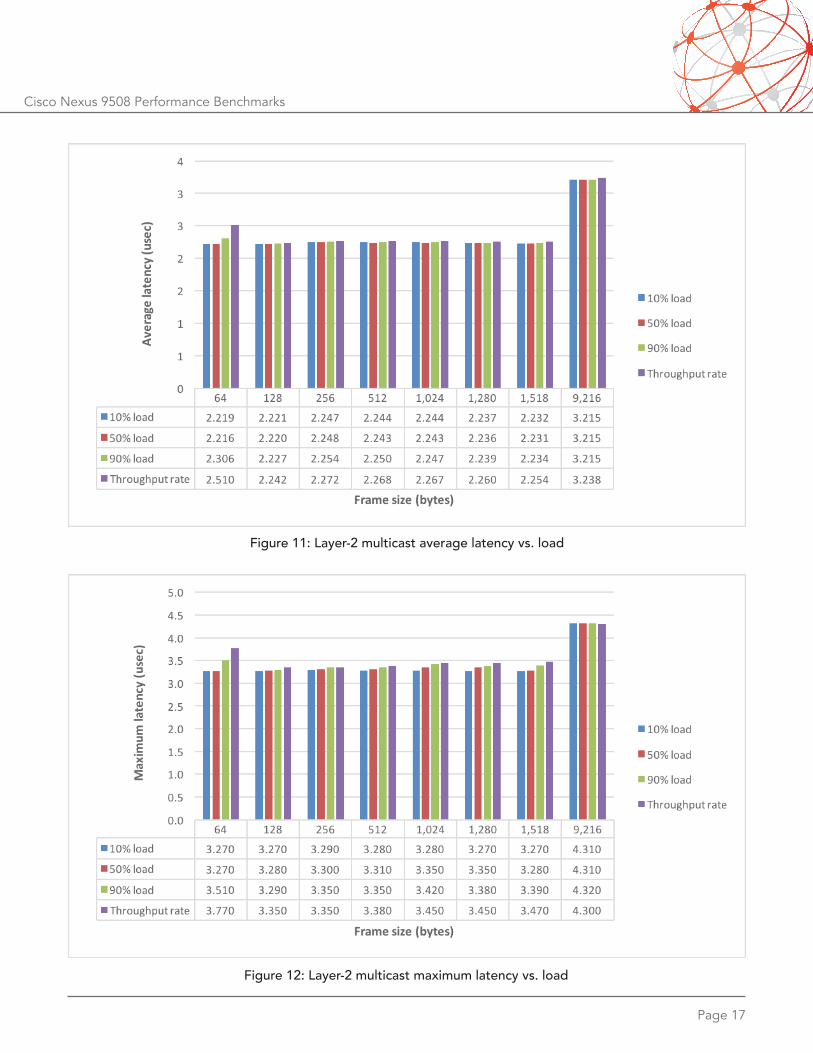
Figures 11 and 12 compare average and maximum delay measurements, respectively, with offered loads of 10, 50, 90, and 99.994 percent of line rate.
Throughput Latency Jitter
Frame size (bytes)
Frames/s
Tbit/s
% line rate
Min (usec)
Avg (usec)
Max (usec)
Avg (usec)
Max (usec)
64 37,944,153,121 19.427 99.9940% 1.020 2.510 3.770 0.024 1.010
128 21,535,870,711 22.053 99.9940% 1.020 2.242 3.350 0.008 0.760
256 11,548,220,526 23.651 99.9940% 1.020 2.272 3.350 0.010 0.740
512 5,991,182,077 24.540 99.9940% 1.000 2.268 3.380 0.007 0.770
1,024 3,052,977,840 25.010 99.9940% 0.980 2.267 3.450 0.006 0.850
1,280 2,451,776,050 25.106 99.9940% 0.960 2.260 3.450 0.006 0.840
1,518 2,072,372,474 25.167 99.9940% 0.950 2.254 3.470 0.005 0.870
9,216 345,096,239 25.443 99.9940% 0.910 3.238 4.300 0.008 0.710
Table 8: Layer-2 multicast performance results
Page 17
Cisco Nexus 9508 Performance Benchmarks
Figure 11: Layer-2 multicast average latency vs. load
Figure 12: Layer-2 multicast maximum latency vs. load
Page 18
Cisco Nexus 9508 Performance Benchmarks
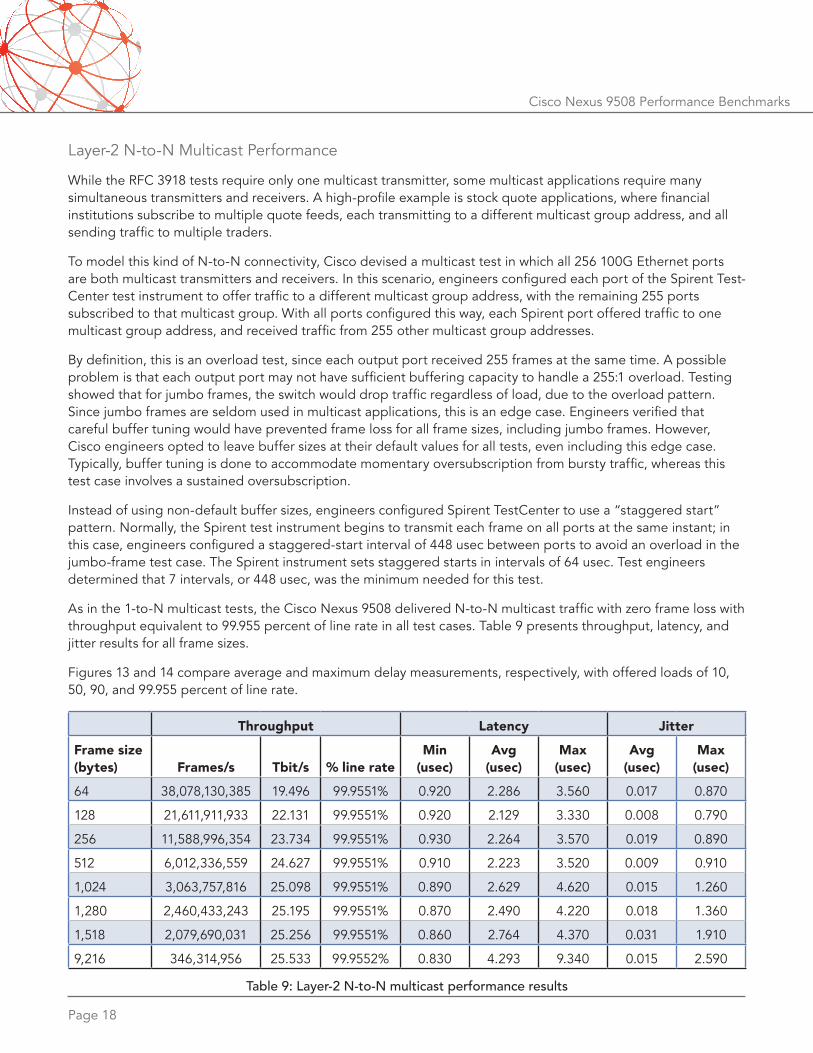
Layer-2 N-to-N Multicast Performance
While the RFC 3918 tests require only one multicast transmitter, some multicast applications require many simultaneous transmitters and receivers. A high-profile example is stock quote applications, where financial institutions subscribe to multiple quote feeds, each transmitting to a different multicast group address, and all sending traffic to multiple traders.
To model this kind of N-to-N connectivity, Cisco devised a multicast test in which all 256 100G Ethernet ports are both multicast transmitters and receivers. In this scenario, engineers configured each port of the Spirent Test-Center test instrument to offer traffic to a different multicast group address, with the remaining 255 ports subscribed to that multicast group. With all ports configured this way, each Spirent port offered traffic to one multicast group address, and received traffic from 255 other multicast group addresses.
By definition, this is an overload test, since each output port received 255 frames at the same time. A possible problem is that each output port may not have sufficient buffering capacity to handle a 255:1 overload. Testing showed that for jumbo frames, the switch would drop traffic regardless of load, due to the overload pattern.Since jumbo frames are seldom used in multicast applications, this is an edge case. Engineers verified that careful buffer tuning would have prevented frame loss for all frame sizes, including jumbo frames. However, Cisco engineers opted to leave buffer sizes at their default values for all tests, even including this edge case. Typically, buffer tuning is done to accommodate momentary oversubscription from bursty traffic, whereas this test case involves a sustained oversubscription.
Instead of using non-default buffer sizes, engineers configured Spirent TestCenter to use a “staggered start” pattern. Normally, the Spirent test instrument begins to transmit each frame on all ports at the same instant; in this case, engineers configured a staggered-start interval of 448 usec between ports to avoid an overload in the jumbo-frame test case. The Spirent instrument sets staggered starts in intervals of 64 usec. Test engineers determined that 7 intervals, or 448 usec, was the minimum needed for this test.
As in the 1-to-N multicast tests, the Cisco Nexus 9508 delivered N-to-N multicast traffic with zero frame loss with throughput equivalent to 99.955 percent of line rate in all test cases. Table 9 presents throughput, latency, and jitter results for all frame sizes.
Figures 13 and 14 compare average and maximum delay measurements, respectively, with offered loads of 10, 50, 90, and 99.955 percent of line rate.
Throughput Latency Jitter
Frame size (bytes)
Frames/s
Tbit/s
% line rate
Min (usec)
Avg (usec)
Max (usec)
Avg (usec)
Max (usec)
64 38,078,130,385 19.496 99.9551% 0.920 2.286 3.560 0.017 0.870
128 21,611,911,933 22.131 99.9551% 0.920 2.129 3.330 0.008 0.790
256 11,588,996,354 23.734 99.9551% 0.930 2.264 3.570 0.019 0.890
512 6,012,336,559 24.627 99.9551% 0.910 2.223 3.520 0.009 0.910
1,024 3,063,757,816 25.098 99.9551% 0.890 2.629 4.620 0.015 1.260
1,280 2,460,433,243 25.195 99.9551% 0.870 2.490 4.220 0.018 1.360
1,518 2,079,690,031 25.256 99.9551% 0.860 2.764 4.370 0.031 1.910
9,216 346,314,956 25.533 99.9552% 0.830 4.293 9.340 0.015 2.590
Table 9: Layer-2 N-to-N multicast performance results

Page 19
Cisco Nexus 9508 Performance Benchmarks
Figure 13: Layer-2 N-to-N multicast average latency vs. load
Figure 14: Layer-2 N-to-N multicast maximum latency vs. load

Page 20
Cisco Nexus 9508 Performance Benchmarks
RFC 3918 IPv4 Multicast Performance
IPv4 multicast tests used a traffic pattern similar to those in the Layer-2 multicast tests. This time, however, the Cisco Nexus 9508 moved traffic across subnet boundaries in a test involving more than 1 million unique multicast routes (mroutes). That’s not a typo; the use of more than 1 million mroutes is a record high level.
In this Layer-3 test, engineers configured each interface on the Cisco switch to reside in a different IPv4 subnet. For Layer-3 IP multicast support, the switch ran the Protocol Independent Multicast-Sparse Mode (PIM) routing protocol as well as IGMPv3 to maintain client snooping tables.
On the control plane, 255 subscriber ports each joined 4,095 IP multicast groups, requiring the Cisco device to maintain a routing table with more than 1 million unique mroutes. On the data plane, the Spirent traffic genera-tor offered traffic to all IP multicast groups on all 255 receiver interfaces. The use of 4,095 multicast groups was due to a stream count limit in the Spirent dX2 test modules, and is not a limit of the Cisco Nexus 9508.
The Cisco Nexus 9508 again delivered all traffic for all frame sizes with zero frame loss with throughput equiva-lent to 99.994 percent of line rate.
Table 10 presents throughput, latency, and jitter results for all frame sizes.
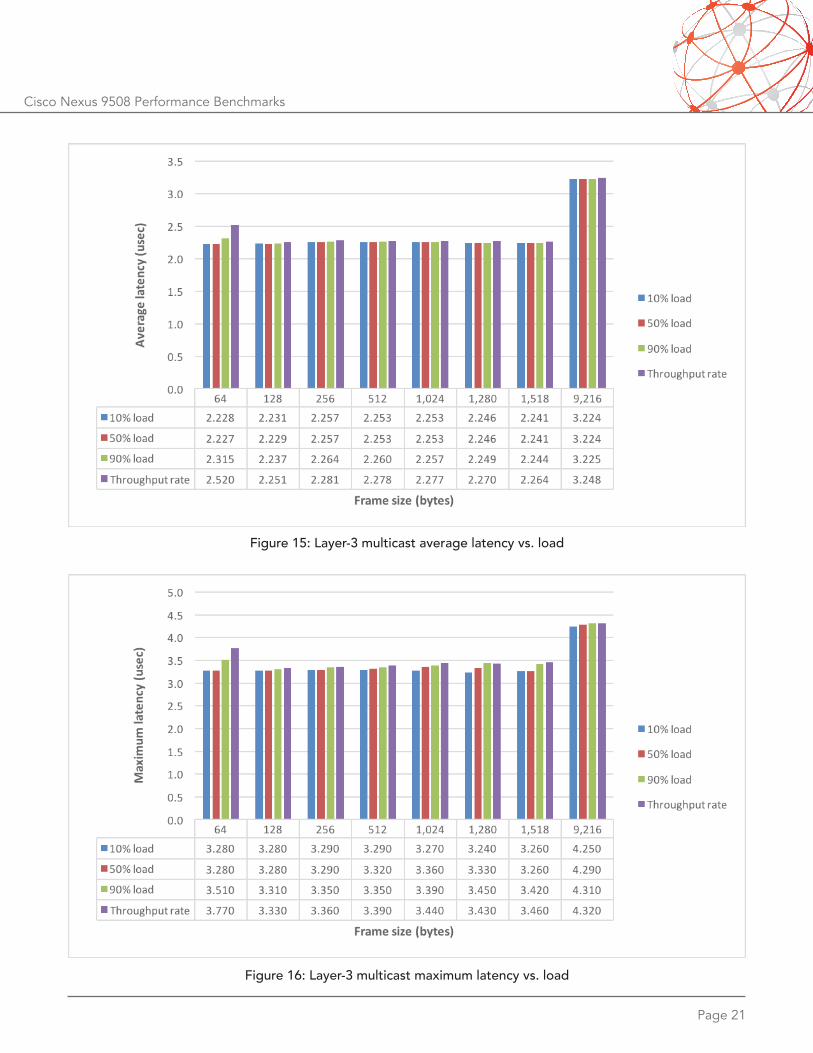
Figures 15 and 16 compare average and maximum delay measurements, respectively, with offered loads of 10, 50, 90, and 99.994 percent of line rate.
Throughput Latency Jitter
Frame size (bytes)
Frames/s
Tbit/s
% line rate
Min (usec)
Avg (usec)
Max (usec)
Avg (usec)
Max (usec)
64 37,944,153,121 19.427 99.9940% 1.020 2.520 3.770 0.027 1.090
128 21,535,870,712 22.053 99.9940% 1.020 2.251 3.330 0.010 0.730
256 11,548,220,526 23.651 99.9940% 1.030 2.281 3.360 0.008 0.710
512 5,991,182,077 24.540 99.9940% 1.010 2.278 3.390 0.004 0.720
1,024 3,052,977,840 25.010 99.9940% 0.990 2.277 3.440 0.004 0.690
1,280 2,451,776,050 25.106 99.9940% 0.970 2.270 3.430 0.004 0.740
1,518 2,072,372,474 25.167 99.9940% 0.960 2.264 3.460 0.004 0.740
9,216 345,096,239 25.443 99.9940% 0.920 3.248 4.320 0.004 0.700
Table 10: Layer-3 multicast performance results
Page 21
Cisco Nexus 9508 Performance Benchmarks
Figure 15: Layer-3 multicast average latency vs. load
Figure 16: Layer-3 multicast maximum latency vs. load

Page 22
Cisco Nexus 9508 Performance Benchmarks
Forward Error Correction (FEC) Latency and Jitter
Ethernet transceivers use a mechanism called Forward Error Correction (FEC) to detect and correct errors without the need for retransmission. Most Ethernet devices have FEC enabled by default, with users willing to trade off the small amount of added latency for protection against low-level errors.
However, some applications – particularly those in the financial industry – require the absolute lowest latency, and may disable FEC toward that end. Although Cisco recommends leaving FEC enabled, there are data-center applications, particularly where fiber-optic transceivers and cables of 3 meters or less are in use, where users may opt to disable FEC.
To determine the effect of FEC on latency, engineers measured fully meshed traffic across a single 32-port Cisco N9K-X9432C-S module with fiber transceivers, both with FEC enabled and disabled.
Table 11 presents the differences between latencies with FEC enabled and disabled. As the results show, disabling FEC can reduce latency by more than 300 nanoseconds for users willing to forgo forward error correction. Minimum latency is omitted here because the minimum delta was 0 in all cases. Also, sharp-eyed readers may notice that maximum values are less than average values for some frame sizes. Since the table presents differences in measurements rather than the measurements themselves, it is possible to have cases where maximum deltas (differences) exceed average deltas.
Latency
Frame size (bytes) Avg (usec) Max (usec)
64 0.319 0.280
128 0.509 0.540
256 0.316 0.300
512 0.319 0.080
1,024 0.309 0.090
1,280 0.322 -0.230
1,518 0.319 -0.190
9,216 0.372 -1.220
Table 11: Difference in latency with FEC enabled and disabled
Page 23
Cisco Nexus 9508 Performance Benchmarks
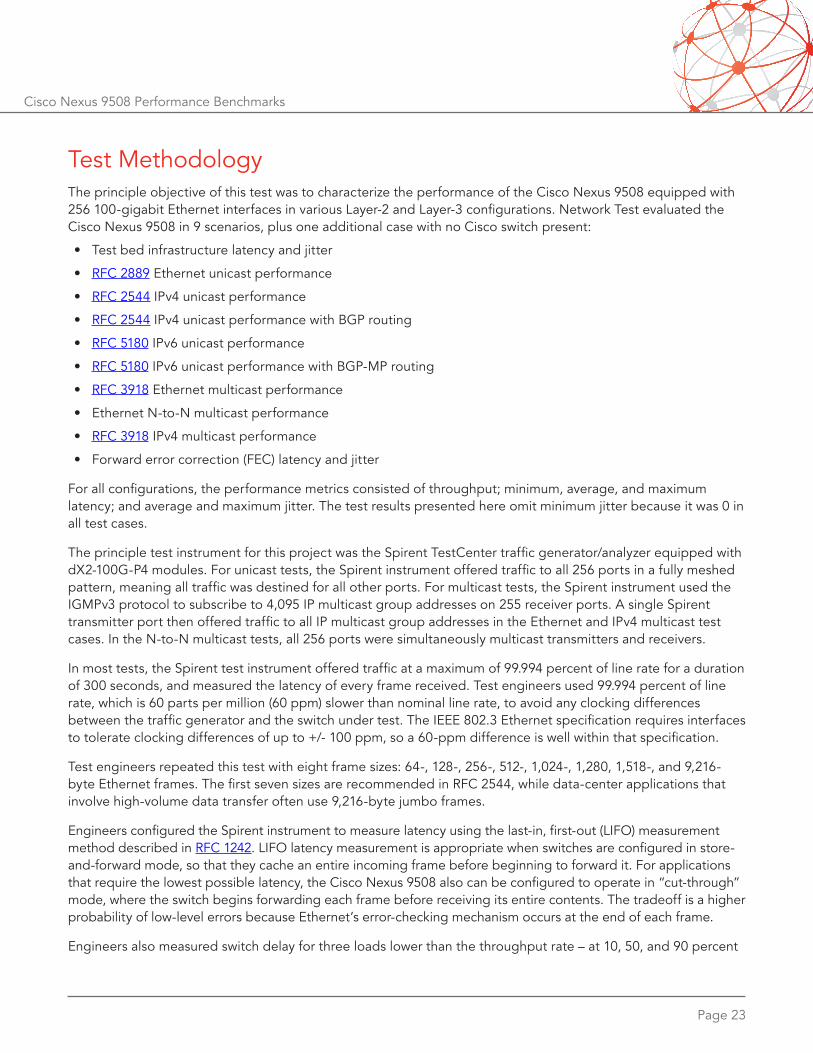
Test MethodologyThe principle objective of this test was to characterize the performance of the Cisco Nexus 9508 equipped with 256 100-gigabit Ethernet interfaces in various Layer-2 and Layer-3 configurations. Network Test evaluated the Cisco Nexus 9508 in 9 scenarios, plus one additional case with no Cisco switch present:
• Test bed infrastructure latency and jitter
• RFC 2889 Ethernet unicast performance
• RFC 2544 IPv4 unicast performance
• RFC 2544 IPv4 unicast performance with BGP routing
• RFC 5180 IPv6 unicast performance
• RFC 5180 IPv6 unicast performance with BGP-MP routing
• RFC 3918 Ethernet multicast performance
• Ethernet N-to-N multicast performance
• RFC 3918 IPv4 multicast performance
• Forward error correction (FEC) latency and jitter
For all configurations, the performance metrics consisted of throughput; minimum, average, and maximum latency; and average and maximum jitter. The test results presented here omit minimum jitter because it was 0 in all test cases.
The principle test instrument for this project was the Spirent TestCenter traffic generator/analyzer equipped with dX2-100G-P4 modules. For unicast tests, the Spirent instrument offered traffic to all 256 ports in a fully meshed pattern, meaning all traffic was destined for all other ports. For multicast tests, the Spirent instrument used the IGMPv3 protocol to subscribe to 4,095 IP multicast group addresses on 255 receiver ports. A single Spirent transmitter port then offered traffic to all IP multicast group addresses in the Ethernet and IPv4 multicast test cases. In the N-to-N multicast tests, all 256 ports were simultaneously multicast transmitters and receivers.
In most tests, the Spirent test instrument offered traffic at a maximum of 99.994 percent of line rate for a duration of 300 seconds, and measured the latency of every frame received. Test engineers used 99.994 percent of line rate, which is 60 parts per million (60 ppm) slower than nominal line rate, to avoid any clocking differences between the traffic generator and the switch under test. The IEEE 802.3 Ethernet specification requires interfaces to tolerate clocking differences of up to +/- 100 ppm, so a 60-ppm difference is well within that specification.
Test engineers repeated this test with eight frame sizes: 64-, 128-, 256-, 512-, 1,024-, 1,280, 1,518-, and 9,216-byte Ethernet frames. The first seven sizes are recommended in RFC 2544, while data-center applications that involve high-volume data transfer often use 9,216-byte jumbo frames.
Engineers configured the Spirent instrument to measure latency using the last-in, first-out (LIFO) measurement method described in RFC 1242. LIFO latency measurement is appropriate when switches are configured in store-and-forward mode, so that they cache an entire incoming frame before beginning to forward it. For applications that require the lowest possible latency, the Cisco Nexus 9508 also can be configured to operate in “cut-through” mode, where the switch begins forwarding each frame before receiving its entire contents. The tradeoff is a higher probability of low-level errors because Ethernet’s error-checking mechanism occurs at the end of each frame.
Engineers also measured switch delay for three loads lower than the throughput rate – at 10, 50, and 90 percent

Page 24
Cisco Nexus 9508 Performance Benchmarks
of line rate. RFC 2544 requires latency to be measured at, and only at, the throughput rate. Since production networks typically see far lower average utilization, Cisco requested additional tests to be run to characterize delay at lower offered loads.
IPv6 tests used 86-byte instead of 64-byte frames as the minimum frame length. This is due to two requirements. First, the Spirent test instrument embeds a 20-byte “signature field” in every test frame. Second, test engineers configured traffic to use an 8-byte UDP header to ensure optimal distribution of flows across the internal switch fabric. Adding up all the field lengths (18 bytes for Ethernet header and CRC; 40 bytes for IPv6 header; 8 bytes for UDP header; and 20 bytes for Spirent signature field) yields a minimum frame size of 86 bytes.
Some IPv4 and IPv6 unicast tests involved direct routes (1 per port), while others used Border Gateway Protocol (BGP). In the IPv4 tests, each Spirent test interface represented one BGP router advertising reachability to 16 networks, for a total of 2,048 unique IPv4 networks. In the IPv6 tests, each Spirent test interface used BGP-Multi-protocol Extensions (BGP-MP) to advertise 8 networks, for a total of 1,024 unique IPv6 networks. Both IPv4 and IPv6 network counts represent limits of the Spirent dX2 test modules and not of the Cisco Nexus 9508.
In IPv4 BGP and IPv6 BGP-MP tests, the Cisco Nexus 9508 also ran Bidirectional Forwarding Detection (BFD). As described in RFC 5880, BFD detects link or interface faults much faster than the “hello” mechanisms used in many routing protocols. Engineers configured the Cisco Nexus 9508 with minimum transmit and receive intervals of 150 milliseconds and a detect multiplier of 3.
The RFC 3918 Ethernet multicast traffic tests involved a traffic pattern with one transmitter port and 255 receiver (subscriber) ports. Here, all 255 receiver ports on the Spirent TestCenter instrument joined the same 4,095 multicast groups using IGMPv3 reports. After the switch’s IGMP snooping table was fully populated, the test instrument then offered traffic to the single transmit port, with destination addresses of all 4,095 multicast groups. As in the unicast tests, the instrument measured throughput and latency for eight frame sizes. This and all other multicast tests used group addresses beginning at 225.1.1.1/32 and incrementing by 1.
The N-to-N multicast tests also involved a single VLAN, but this time engineers configured all 256 ports to be multicast transmitters. In this scenario, engineers configured Spirent TestCenter to offer multicast traffic on each port destined to a different multicast group address. Thus, in all, there were 256 multicast transmitters, each sending to one unique multicast group address, and 255 ports receiving traffic from all group addresses other than that of their own transmitter.
The layer-3 multicast tests used the same traffic pattern as the layer-2 tests, with one transmitter port and 255 receiver (subscriber) ports. In this case, however, all switch ports also ran the protocol independent multicast-sparse mode (PIM-SM) routing protocol. All switch ports used PIM-SM to learn multicast routes. Then, all 255 receiver ports on the Spirent TestCenter instrument joined the same 4,095 multicast groups using IGMPv3 reports. The instrument measured throughput and latency for the same eight frame sizes as in the other perfor-mance tests.
The duration for all tests was 300 seconds. This is more stressful than conventional switch tests that use 30- or 60-second durations, in that switch buffers tend to fill over time. If anything, switch latency and jitter will be lower with shorter tests.
Notably, test engineers did not configure the Spirent test instrument with latency compensation or parts-per-million (PPM) clocking adjustments. These adjustments exist in test instruments to compensate for very specific use cases, but also can be abused. The misadjustment of time measurements in a test instrument for purposes of “improving” test results is generally considered to be an unscrupulous practice.
For reproducibility of these results, it’s important to note the contents of test traffic, especially with regard to

Page 25
Cisco Nexus 9508 Performance Benchmarks
MAC and IP addresses and UDP port numbers. In the Layer-2 unicast tests, all Spirent emulated hosts used pseudorandom MAC addresses as described in RFC 4814. The Spirent IP addresses began at 10.0.0.2/16, incre-menting by port number. All Cisco Nexus 9508 interfaces were members of the same VLAN, which was bound to an IPv4 address of 10.0.0.1/8 (though this was not used in this Layer-2 test). The UDP headers used 8,000 unique source and destination ports, each beginning at 20001 and incrementing by 1 up to 28,000. In tests involving BGP and BGP-MP, UDP headers used random source and destination port numbers. The Layer-2 multicast tests used Spirent default MAC addresses and IPv4 addresses starting at 10.0.0.2/16 and incrementing by port number.
In the Layer-3 tests, Spirent emulated hosts used Spirent TestCenter default MAC addresses. The Spirent IPv4 addresses were 10.0.x.2/24, where x was a value between 0 and 255, incrementing by port number, while the Cisco addresses were 10.0.x.1/24 in the same subnets. In IPv6 tests, the Spirent addresses were 200x::2/64, where x was a hexadecimal value between 0x0 and 0xff. The Cisco addresses were 200x::1/64, where x was a hexadecimal value between 0x0 and 0xff. In tests involving direct IPv4 or IPv6 unicast routes, the UDP headers used 8,000 unique source and destination ports, each beginning at 20001 and incrementing by 1 up to 28,000. In tests involving BGP or BGP-MP routing, UDP headers used random source and destination port numbers.
ConclusionThese results represent a new high-water mark in data-center switching, with the largest-ever 256-port 100G Ethernet test bed. In most tests, the Cisco Nexus 9508 never dropped a frame in rigorous benchmarks covering unicast, multicast, Ethernet, IPv4, IPv6, BGP traffic, all with traffic flowing at virtual line rate across its 256 100G Ethernet ports. Moreover, tests showed the Nexus 9508 to be a highly capable performer both in 1-to-N and N-to-N multicast scenarios.
Latency and jitter also remained low and constant across test cases, a critical finding for time-sensitive applica-tions. Average and maximum delay is lower still in test cases involving traffic at 10, 50, and 90 percent of wire speed, providing a complete picture of how the switch is likely to perform in production settings. And customers who require still lower latency and jitter for some applications can achieve reductions of more than 300 ns by disabling forward error correction.
For network professionals looking to build the very largest data centers, and for those just looking to ensure a pathway for future growth, the Cisco Nexus 9508 proved highly capable across all these rigorous tests.
Page 26
Cisco Nexus 9508 Performance Benchmarks
Average jitter (usec)
Frame size (bytes) 10% load 50% load 90% load Throughput rate
64 0.007 0.096 NA 0.141
128 0.007 0.045 0.070 0.071
256 0.008 0.011 0.081 0.086
512 0.009 0.013 0.090 0.083
1,024 0.014 0.018 0.107 0.106
1,280 0.016 0.021 0.122 0.133
1,518 0.016 0.023 0.126 0.140
9,216 0.076 0.093 0.337 0.499
Table 12: Layer-2 unicast average jitter
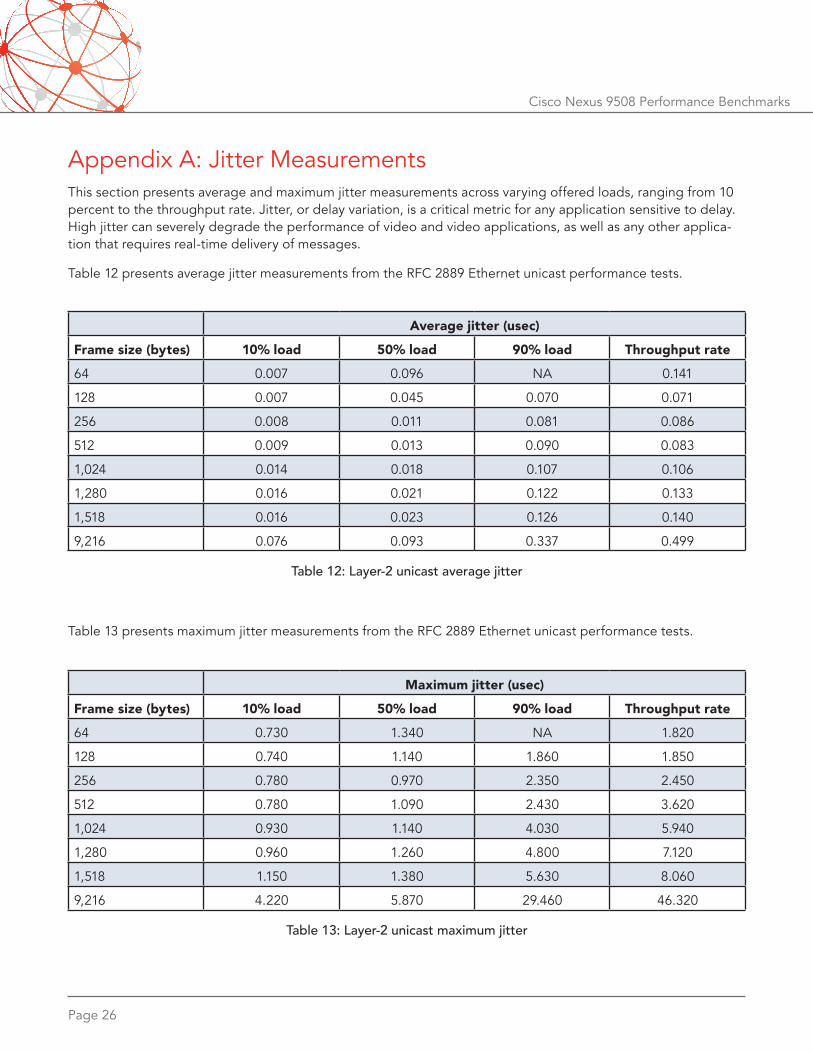
Appendix A: Jitter MeasurementsThis section presents average and maximum jitter measurements across varying offered loads, ranging from 10 percent to the throughput rate. Jitter, or delay variation, is a critical metric for any application sensitive to delay. High jitter can severely degrade the performance of video and video applications, as well as any other applica-tion that requires real-time delivery of messages.
Table 12 presents average jitter measurements from the RFC 2889 Ethernet unicast performance tests.
Maximum jitter (usec)
Frame size (bytes) 10% load 50% load 90% load Throughput rate
64 0.730 1.340 NA 1.820
128 0.740 1.140 1.860 1.850
256 0.780 0.970 2.350 2.450
512 0.780 1.090 2.430 3.620
1,024 0.930 1.140 4.030 5.940
1,280 0.960 1.260 4.800 7.120
1,518 1.150 1.380 5.630 8.060
9,216 4.220 5.870 29.460 46.320
Table 13: Layer-2 unicast maximum jitter
Table 13 presents maximum jitter measurements from the RFC 2889 Ethernet unicast performance tests.

Page 27
Cisco Nexus 9508 Performance Benchmarks
Table 14 presents average jitter measurements from the RFC 2544 IPv4 unicast performance tests.
Average jitter (usec)
Frame size (bytes) 10% load 50% load 90% load Throughput rate
64 0.010 0.097 NA 0.129
128 0.010 0.079 0.054 0.040
256 0.011 0.014 0.073 0.059
512 0.015 0.017 0.090 0.083
1,024 0.022 0.028 0.047 0.117
1,280 0.030 0.034 0.054 0.116
1,518 0.030 0.038 0.061 0.110
9,216 0.120 0.138 0.306 0.463
Table 14: IPv4 unicast average jitter
Table 15 presents maximum jitter measurements from the RFC 2544 IPv4 unicast performance tests.
Maximum jitter (usec)
Frame size (bytes) 10% load 50% load 90% load Throughput rate
64 0.750 1.200 NA 1.720
128 0.750 1.120 1.400 1.340
256 0.770 0.970 1.630 1.630
512 0.840 1.080 1.880 1.740
1,024 0.930 1.140 1.840 2.140
1,280 0.980 1.230 1.990 2.070
1,518 1.090 1.280 1.890 2.020
9,216 3.460 5.070 8.900 10.360
Table 15: Layer-3 unicast maximum jitter
Page 28
Cisco Nexus 9508 Performance Benchmarks
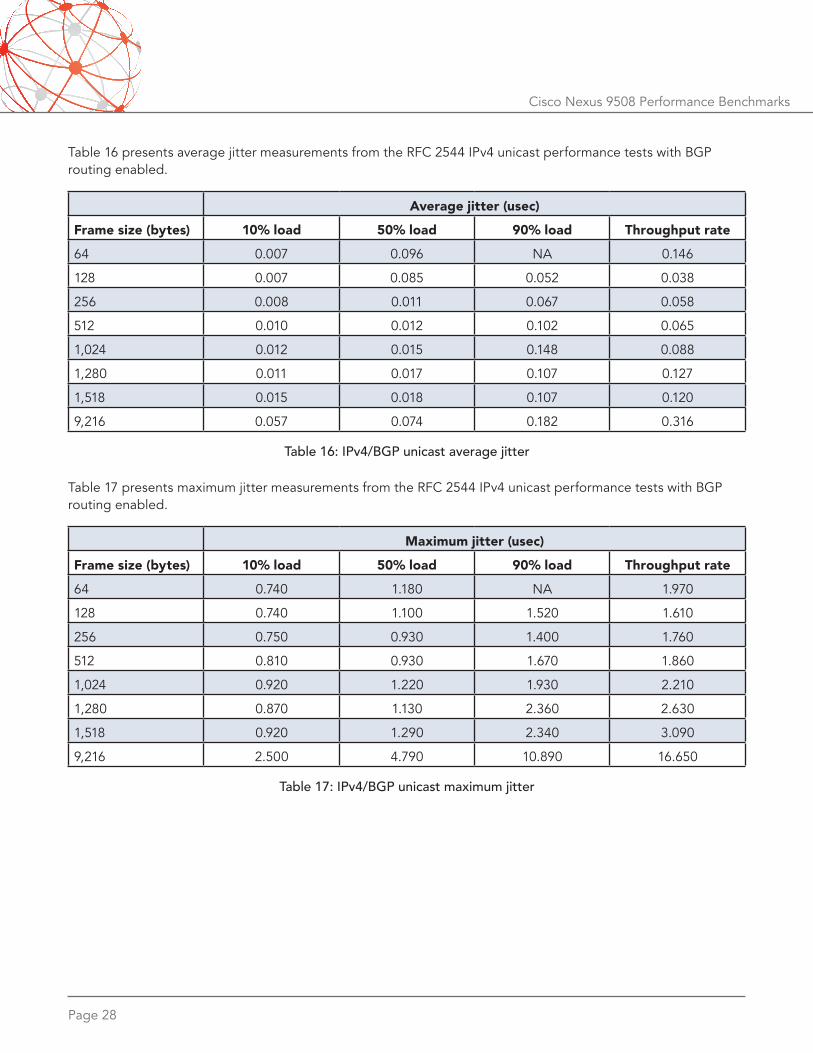
Table 16 presents average jitter measurements from the RFC 2544 IPv4 unicast performance tests with BGP routing enabled.
Average jitter (usec)
Frame size (bytes) 10% load 50% load 90% load Throughput rate
64 0.007 0.096 NA 0.146
128 0.007 0.085 0.052 0.038
256 0.008 0.011 0.067 0.058
512 0.010 0.012 0.102 0.065
1,024 0.012 0.015 0.148 0.088
1,280 0.011 0.017 0.107 0.127
1,518 0.015 0.018 0.107 0.120
9,216 0.057 0.074 0.182 0.316
Table 16: IPv4/BGP unicast average jitter
Maximum jitter (usec)
Frame size (bytes) 10% load 50% load 90% load Throughput rate
64 0.740 1.180 NA 1.970
128 0.740 1.100 1.520 1.610
256 0.750 0.930 1.400 1.760
512 0.810 0.930 1.670 1.860
1,024 0.920 1.220 1.930 2.210
1,280 0.870 1.130 2.360 2.630
1,518 0.920 1.290 2.340 3.090
9,216 2.500 4.790 10.890 16.650
Table 17: IPv4/BGP unicast maximum jitter
Table 17 presents maximum jitter measurements from the RFC 2544 IPv4 unicast performance tests with BGP routing enabled.

Page 29
Cisco Nexus 9508 Performance Benchmarks
Table 18 presents average jitter measurements from the RFC 5180 IPv6 unicast performance tests.
Average jitter (usec)
Frame size (bytes) 10% load 50% load 90% load Throughput rate
86 0.010 0.100 0.119 0.131
128 0.010 0.072 0.058 0.049
256 0.011 0.013 0.075 0.071
512 0.012 0.015 0.123 0.089
1,024 0.018 0.020 0.113 0.120
1,280 0.024 0.024 0.114 0.119
1,518 0.020 0.027 0.110 0.120
9,216 0.079 0.083 0.194 0.316
Table 18: IPv6 unicast average jitter
Maximum jitter (usec)
Frame size (bytes) 10% load 50% load 90% load Throughput rate
86 0.750 1.220 1.700 1.860
128 0.740 1.190 1.550 1.540
256 0.760 0.890 1.770 1.850
512 0.800 0.910 2.170 2.300
1,024 0.900 1.090 2.490 3.330
1,280 0.990 1.360 2.520 3.530
1,518 0.940 1.310 2.400 3.220
9,216 2.780 4.440 7.500 11.100
Table 19: IPv6 unicast maximum jitter
Table 19 presents maximum jitter measurements from the RFC 5180 IPv6 unicast performance tests.

Page 30
Cisco Nexus 9508 Performance Benchmarks
Table 20 presents average jitter measurements from the RFC 5180 IPv6 unicast performance tests with BGP-MP routing enabled.
Average jitter (usec)
Frame size (bytes) 10% load 50% load 90% load Throughput rate
86 0.007 0.087 NA 0.155
128 0.007 0.076 0.072 0.067
256 0.008 0.067 0.079 0.085
512 0.007 0.020 0.082 0.095
1,024 0.008 0.051 0.116 0.138
1,280 0.008 0.030 0.132 0.162
1,518 0.007 0.024 0.136 0.167
9,216 0.011 0.018 0.181 0.230
Table 20: IPv6/BGP unicast average jitter
Maximum jitter (usec)
Frame size (bytes) 10% load 50% load 90% load Throughput rate
86 0.740 1.210 NA 2.780
128 0.740 1.160 2.400 3.050
256 0.750 1.250 2.350 2.980
512 0.780 1.640 3.020 3.810
1,024 0.860 1.730 4.890 6.480
1,280 0.810 1.870 5.930 7.640
1,518 0.810 1.810 7.050 8.930
9,216 2.120 5.770 39.950 50.090
Table 21: IPv6/BGP unicast maximum jitter
Table 21 presents maximum jitter measurements from the RFC 5180 IPv6 unicast performance tests with BGP-MP routing enabled.

Page 31
Cisco Nexus 9508 Performance Benchmarks
Average jitter (usec)
Frame size (bytes) 10% load 50% load 90% load Throughput rate
64 0.006 0.007 0.018 0.024
128 0.006 0.008 0.007 0.008
256 0.007 0.007 0.009 0.010
512 0.007 0.007 0.006 0.007
1,024 0.007 0.007 0.007 0.006
1,280 0.006 0.006 0.006 0.006
1,518 0.006 0.007 0.006 0.005
9,216 0.006 0.007 0.007 0.008
Table 22: Ethernet multicast average jitter
Maximum jitter (usec)
Frame size (bytes) 10% load 50% load 90% load Throughput rate
64 0.720 0.740 0.960 1.010
128 0.720 0.730 0.760 0.760
256 0.720 0.730 0.770 0.740
512 0.710 0.730 0.770 0.770
1,024 0.700 0.770 0.860 0.850
1,280 0.710 0.790 0.810 0.840
1,518 0.700 0.710 0.830 0.870
9,216 0.690 0.710 0.710 0.710
Table 23: Ethernet multicast maximum jitter
Table 22 presents average jitter measurements from the RFC 3918 Ethernet multicast tests.
Table 23 presents maximum jitter measurements from the RFC 3918 Ethernet multicast tests.
Page 32
Cisco Nexus 9508 Performance Benchmarks
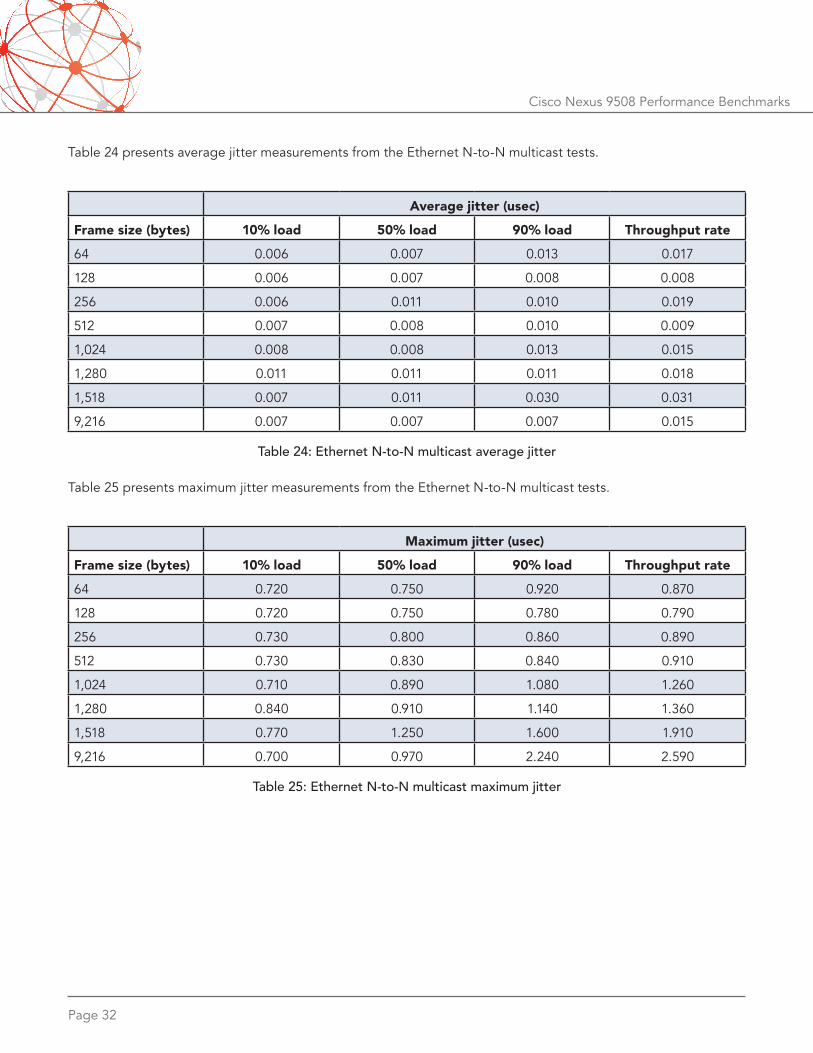
Table 24 presents average jitter measurements from the Ethernet N-to-N multicast tests.
Average jitter (usec)
Frame size (bytes) 10% load 50% load 90% load Throughput rate
64 0.006 0.007 0.013 0.017
128 0.006 0.007 0.008 0.008
256 0.006 0.011 0.010 0.019
512 0.007 0.008 0.010 0.009
1,024 0.008 0.008 0.013 0.015
1,280 0.011 0.011 0.011 0.018
1,518 0.007 0.011 0.030 0.031
9,216 0.007 0.007 0.007 0.015
Table 24: Ethernet N-to-N multicast average jitter
Maximum jitter (usec)
Frame size (bytes) 10% load 50% load 90% load Throughput rate
64 0.720 0.750 0.920 0.870
128 0.720 0.750 0.780 0.790
256 0.730 0.800 0.860 0.890
512 0.730 0.830 0.840 0.910
1,024 0.710 0.890 1.080 1.260
1,280 0.840 0.910 1.140 1.360
1,518 0.770 1.250 1.600 1.910
9,216 0.700 0.970 2.240 2.590
Table 25: Ethernet N-to-N multicast maximum jitter
Table 25 presents maximum jitter measurements from the Ethernet N-to-N multicast tests.
Page 33
Cisco Nexus 9508 Performance Benchmarks
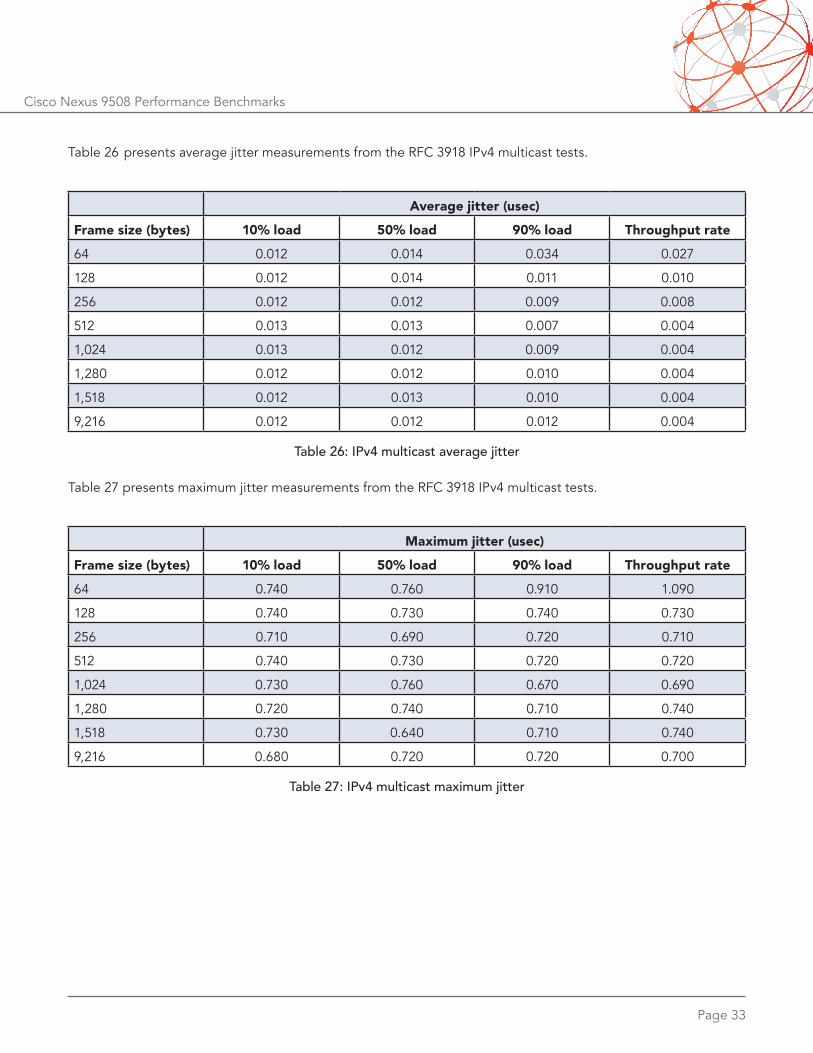
Table 26 presents average jitter measurements from the RFC 3918 IPv4 multicast tests.
Average jitter (usec)
Frame size (bytes) 10% load 50% load 90% load Throughput rate
64 0.012 0.014 0.034 0.027
128 0.012 0.014 0.011 0.010
256 0.012 0.012 0.009 0.008
512 0.013 0.013 0.007 0.004
1,024 0.013 0.012 0.009 0.004
1,280 0.012 0.012 0.010 0.004
1,518 0.012 0.013 0.010 0.004
9,216 0.012 0.012 0.012 0.004
Table 26: IPv4 multicast average jitter
Maximum jitter (usec)
Frame size (bytes) 10% load 50% load 90% load Throughput rate
64 0.740 0.760 0.910 1.090
128 0.740 0.730 0.740 0.730
256 0.710 0.690 0.720 0.710
512 0.740 0.730 0.720 0.720
1,024 0.730 0.760 0.670 0.690
1,280 0.720 0.740 0.710 0.740
1,518 0.730 0.640 0.710 0.740
9,216 0.680 0.720 0.720 0.700
Table 27: IPv4 multicast maximum jitter
Table 27 presents maximum jitter measurements from the RFC 3918 IPv4 multicast tests.
Network Test Inc.31324 Via Colinas, Suite 113 • Westlake Village, CA 91362-6761 • USA+1-818-889-0011 • http://networktest.com • [email protected]
Version 2016042600. Copyright © 2016 Network Test Inc. All rights reserved.
Cisco Nexus 9508 Performance Benchmarks
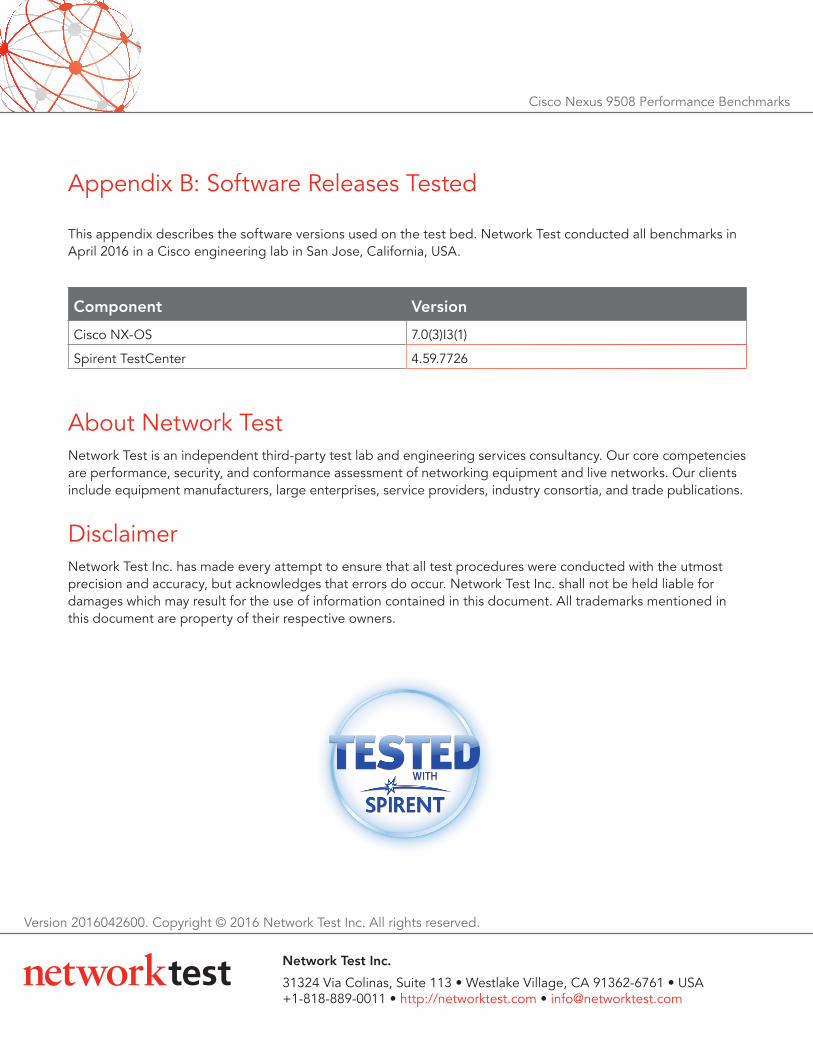
Appendix B: Software Releases Tested
This appendix describes the software versions used on the test bed. Network Test conducted all benchmarks in April 2016 in a Cisco engineering lab in San Jose, California, USA.
Component VersionCisco NX-OS 7.0(3)I3(1)
Spirent TestCenter 4.59.7726
About Network TestNetwork Test is an independent third-party test lab and engineering services consultancy. Our core competencies are performance, security, and conformance assessment of networking equipment and live networks. Our clients include equipment manufacturers, large enterprises, service providers, industry consortia, and trade publications.
DisclaimerNetwork Test Inc. has made every attempt to ensure that all test procedures were conducted with the utmost precision and accuracy, but acknowledges that errors do occur. Network Test Inc. shall not be held liable for damages which may result for the use of information contained in this document. All trademarks mentioned in this document are property of their respective owners.