Embed Size (px)
Citation preview
Investigating the different aspects of information sharing
and network barrier on Disaster Relief Operations using ArcGIS
and AIMMS
Ali Abdelmoniem Ahmed
Phd Student
Concordia Institutes for Information System Engineering

Presentation Breakdown
• Disaster Relief Operations
• Research Position
• Research Depth
• Barriers Variety and Information Sharing Obstacles
• Solution Approach
• Montreal Case Study
• Results realized at Solution Stages
• Conclusion and Future

MITIGATE
RECOVER
RESPONSE
PREPARE
PlanInitiate Process!
Prepare (Inventory of stocks and volunteers/experts)
Respond with material/people
prepared
Assesses needs
APPEAL (to local/
international community)
Recovery Phase
(Longterm)
Reverse Logistics (
material and knowledge)
Disaster Relief Operations
Disaster Relief Operations
Research Position
Emergency Operations Reserach
Civil Crime
House Fire
Disasters Operations Reserach
Man-made
Natural
Slow-onset
Sudden onset
Earthquake Flood
Thesis position within literature
Main Category Sub Category
Man-Made Epidemics, Large-Scale Medical Emergencies, Oil-Spill Recovery, Evacuation Planning, Military Operations
Natural Hurricane, Earthquake,Flood, Tsunami
Sudden Onset Disaster Table

Research DepthNo Barrier• Facilities can be located anywhere
• Demand nodes can exist anywhere
• Routes exist between all nodes
Barrier (Scaled-Cost)
• Facilities can only be located outside barrier
• Demand nodes can exist anywhere
• Routes exist between all nodes, with extra weights associated if traveling is in the barrier zone
Barrier (Forbidden-Zone)• Facilities can only be located outside barrier
• Demand nodes only exist outside of barrier
• Routes can not travel within barrier zone
Information Sharing
• Default Scenario
• Visibility and Synchronization of operations is given
No Information Sharing
• Demand Nodes Doubles with %50 of original forecast
• Warehouse Capacities Increase
• Route Capacities Increase by Minimum Amount
Information Sharing Scenarios Definition
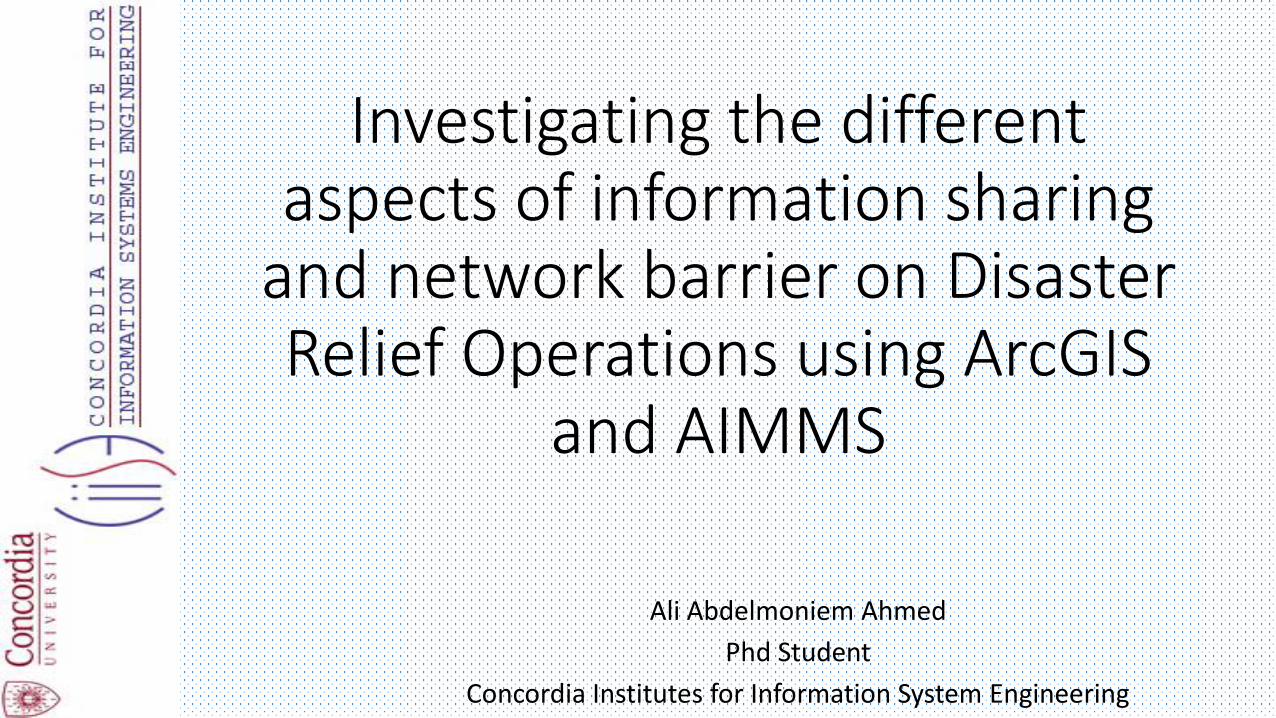
Barrier Scenarios Information Sharing Scenarios

(left) Forbidden-zone Barrier (right) Scaled Cost Barrier
Barrier Variety

Mission of four humanitarian organizations
Information Sharing Obstacle
Major Organizations Mission regarding Emergency such as earthquake
Red Cross/Crescent Emergency Response Unites (ERUs) provide health and water and sanitation
services and support major disaster operations with logistics, IT, and
telecommunications and relief using standardized equipment and pre-trained
personnel.
United Nations Shelter equipment, water purification, and distribution equipment, blankets,
tools, kitchen sets, electric generators, and other basic survival items. WHO-
provides medical needs; World Food Program- provides food items.
Oxfam Clean water, sanitation, shelter, seeds, and running cash for work programs,
support recovery and reconstruction.
Habitat for Humanity To develop innovative housing and shelter assistance models that generate
sustainable interventions for people vulnerable to or affected by disasters or
conflicts.

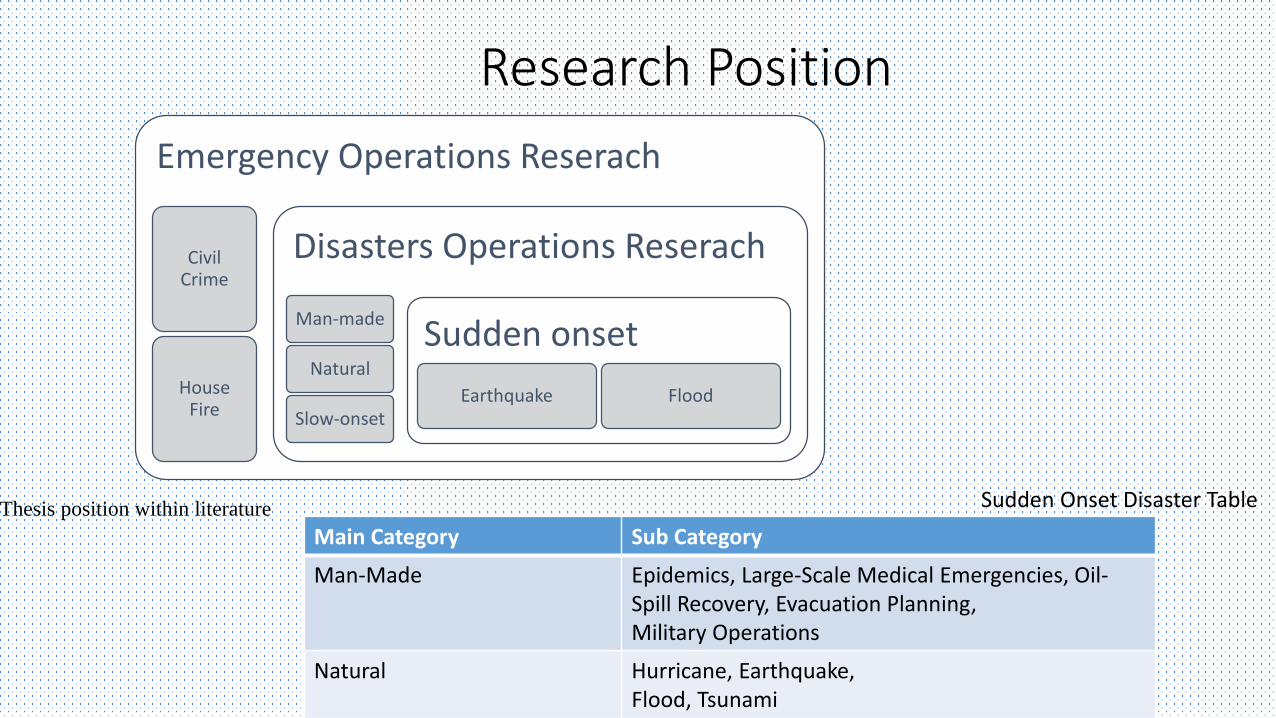
Solution ApproachSolution Approach Flow Chart

Solution Approach: Technological Implications
• Real Data
• From-scratch model -> Solution Software: AIMMS 3.13
• embedded Solution -> Software: ArcGIS 10.1
• District’s population
• Elevation map (a)
• Road network (b)
• Barrier (c)
(a) (b) (c)

Montreal Case Study
Information Sharing No Information Sharing
No Barrier Scenario 1:
Facilities, J = 474
Demand Nodes, I = 61
No Extra Distance
No Extra Demand
Scenario 2:
Facilities, J = 474
Demand Nodes, I = 122
No Extra Distance
Extra Demand
Barrier (Scaled-Cost) Scenario 3:
Facilities, J = 413
Demand Nodes, I = 61
Extra Scaled Distance
No Extra Demand
Scenario 4:
Facilities, J = 413
Demand Nodes, I = 122
Extra Scaled Distance
Extra Demand
Barrier (Forbidden-Zone) Scenario 5:
Facilities, J = 413
Demand Nodes, I = 47
No Extra Distance
No Extra Demand
Scenario 6:
Facilities, J = 413
Demand Nodes, I = 94
No Extra Distance
Extra Demand
47 Districts surrounding barrier region
413 Possible facility locations outside barrier
474 Possible facility locations
The 6 scenarios details

Case Study Results – Stage 1
High impact disaster 25%
Medium impact disaster 25%
Low impact disaster 50%
What are the average
damage probabilities
What is the damage
probabilities to
population
( 100%*50% + 50%*25% +
10%+25% )
( 100%*25% + 50%*50% +
10%+25% )
( 100%*25% + 50%*25% +
10%*50% )
( 65%*25% + 52.5%*25%
+ 42.5%*50% )
What is the
expected damage
percentage to
population?
Low damage (10%) 25%
High damage (100%) 25%
Moderate damage (50%) 50%
Low damage (10%) 25%
High damage (100%) 25%
Moderate damage (50%) 25%
Low damage (10%) 50%
High damage (100%) 50%
Moderate damage (50%) 25%
65.0%
52.5%
42.5%
50.625%

Case Study Results – Stage 2 1 Demand Coverage
183,365
183,394
183,365
122,235
122,247
122,235
0 20,000 40,000 60,000 80,000 100,000 120,000 140,000 160,000 180,000 200,000
Barrier (Scaled-Cost)
Barrier (Forbidden)
No Barrier
People
C - L A P R E S U LT S ( A R C G I S 1 0 . 1 )TOTA L A L LO C AT E D D E M A N D
Total Demand Information Sharing Total Demand No Information Sharing
183,365
183,394
183,365
122,235
122,247
122,235
0 20,000 40,000 60,000 80,000 100,000 120,000 140,000 160,000 180,000 200,000
Barrier (Scaled-Cost)
Barrier (Forbidden)
No Barrier
People
C - L A P R E S U LT S ( A I M M S 3 . 1 3 )TOTA L A L LO C AT E D D E M A N D
Total Demand Information Sharing Total Demand No Information Sharing

Case Study Results – Stage 2 2 Travel Distance
64
9,2
88
.88
10
3,8
22
.89
94
,69
9.6
9
75
9,1
23
.45
12
2,7
59
.92
12
0,2
02
.22
0.00
100,000.00
200,000.00
300,000.00
400,000.00
500,000.00
600,000.00
700,000.00
800,000.00
Barrier (Scaled-Cost) Barrier (Forbidden) No Barrier
Met
ers
Total Distance TraveledInformation Sharing Scenario
AIMMS ArcGIS 10.11,3
01
,46
8.9
3
29
5,0
43
.91
23
5,1
68
.32
1,5
08
,66
1.9
1
29
6,5
72
.06
25
8,8
98
.37
0
200,000
400,000
600,000
800,000
1,000,000
1,200,000
1,400,000
1,600,000
Barrier (Scaled-Cost) Barrier (Forbidden) No Barrier
Met
ers
No Information Sharing ScenarioTotal Distance Traveled
AIMMS ArcGIS 10.1

Technical Outliers Information Sharing No Information Sharing
No barrier 1 hours 40 minutes
29389 Variable
29451 Constraint
8 hours 35 minutes
58303 Variable
58426 Constraint
Scaled Cost Barrier 40 minutes
25607 Variable
25669 Constraint
2 hours 5 minutes
50800 Variable
50923 Constraint
Forbidden-zone Barrier 20 seconds
19825 Variable
19873 Constraint
12 hours 35 minutes
39236 Variable
39331 Constraint

Case Study Results – Stage 3Information Sharing Scenario
93
18
1.6
1
52
06
4.0
7
12
77
6.1
4
71
60
.79
14
38
8.0
0
11
09
4.3
8
11
95
08
.20
78
57
2.9
2
15
17
5.9
3
92
41
.16
16
15
1.6
9
12
70
4.7
6
0.00
20000.00
40000.00
60000.00
80000.00
100000.00
120000.00
140000.00
Barrier(Scaled-Cost)
Barrier(Forbidden)
No Barrier
Me
ters
Information Sharing - AIMMS
Information Sharing R1 Travel Distance Information Sharing R2 Travel Distance
15
19
74
.74
75
67
6.0
1
19
26
5.4
3
12
12
3.2
0
13
81
4.6
2
18
59
3.1
6
15
78
19
.02
83
12
6.0
4
22
95
9.1
5
13
28
4.9
0
16
62
6.7
9
18
90
2.7
7
0.00
20000.00
40000.00
60000.00
80000.00
100000.00
120000.00
140000.00
160000.00
180000.00
Barrier(Scaled-Cost)
Barrier(Forbidden)
No Barrier
Me
ters
Information Sharing - ArcGIS
Information Sharing R1 Travel Distance Information Sharing R2 Travel Distance

Case Study Results – Stage 3No Information Sharing Scenario
98
37
3.0
8
96
55
4.7
1
14
88
8.7
1
17
32
0.1
38
82
13
18
4.4
9
85
64
.25
11
04
80
.79
12
90
04
.79
15
47
2.0
3
23
37
7.2
49
5
16
29
4.3
3
96
65
.36
0.00
20000.00
40000.00
60000.00
80000.00
100000.00
120000.00
140000.00
Barrier (Scaled-Cost)
Barrier(Forbidden)
No Barrier
Met
ers
No Information Scenario - AIMMS
No Information Sharing R1 Travel Distance No Information Sharing R2 Travel Distance
34
90
2.6
1
22
65
3.2
8
16
14
66
.38
19
23
7.0
6
14
86
4.0
3
27
14
8.6
0
48
73
5.2
8
31
20
1.7
8
17
23
29
.82
21
39
8.9
8
22
85
3.2
4
27
45
8.2
0
0.00
20000.00
40000.00
60000.00
80000.00
100000.00
120000.00
140000.00
160000.00
180000.00
200000.00
Barrier (Scaled-Cost)
Barrier(Forbidden)
No Barrier
Met
ers
No Information Scenario - ArcGIS

Global Observations• Explore Options
• Validate Decisions
• Realize Significant Savings
• The decision makers can now be more confident about their strategic network design decisions, as the above model covers demand forecasting, facility location, allocation and routing options of resources.

Peculiar Observations
ArcGIS AIMMS
learning curve: longer time to reach a solution,More Consequential,Map-based friendly, Friendlier in the end
learning curve: faster times to reach a solution,more Algorithmic, Technical-based friendly,More complex towards the end
Out of the ordinary observations Optimal solutions
Few minutes to reach an outcome Hours to complete

Peculiar Observations
• It can be concluded from the study that in our disaster relief network design study
• no-barrier and forbidden-zone barrier had similar outputs when compared to scaled-cost barriers (especially in LAP)
• Information sharing optimizes operations regardless of the barrier’s type influence.

Future Conquests
Another observation from this research is that exact solutions, i.e., building a model from scratch is more trust-worthy better at conducting empirical research.
Enhancements of parameters
Multiple commodities
Complex information sharing scenarios
Cost parameters

References
• Bischoff, M., Fleischmann, T., Klamroth, K. 2009. The multi-facility location-allocation problem with polyhedral barriers. Computers & Operations Research. 36. Pp 1376 – 1392.
• Butt, S.E., Cavalier, T.M. 1996. An efficient algorithm for facility location in the presence of forbidden regions. European Journal of Operational Research. 90. pp 56-70.
• Canbolat, M.S., Wesolowsky, G.O. 2010. The rectilinear distance Weber problem in the presence of probabilistic line barrier. European Journal of Operational Research. 202, pp 114-121.
• For more concerns and inquries: [email protected](514) 618 3619

7. Questions?