Embed Size (px)
Citation preview
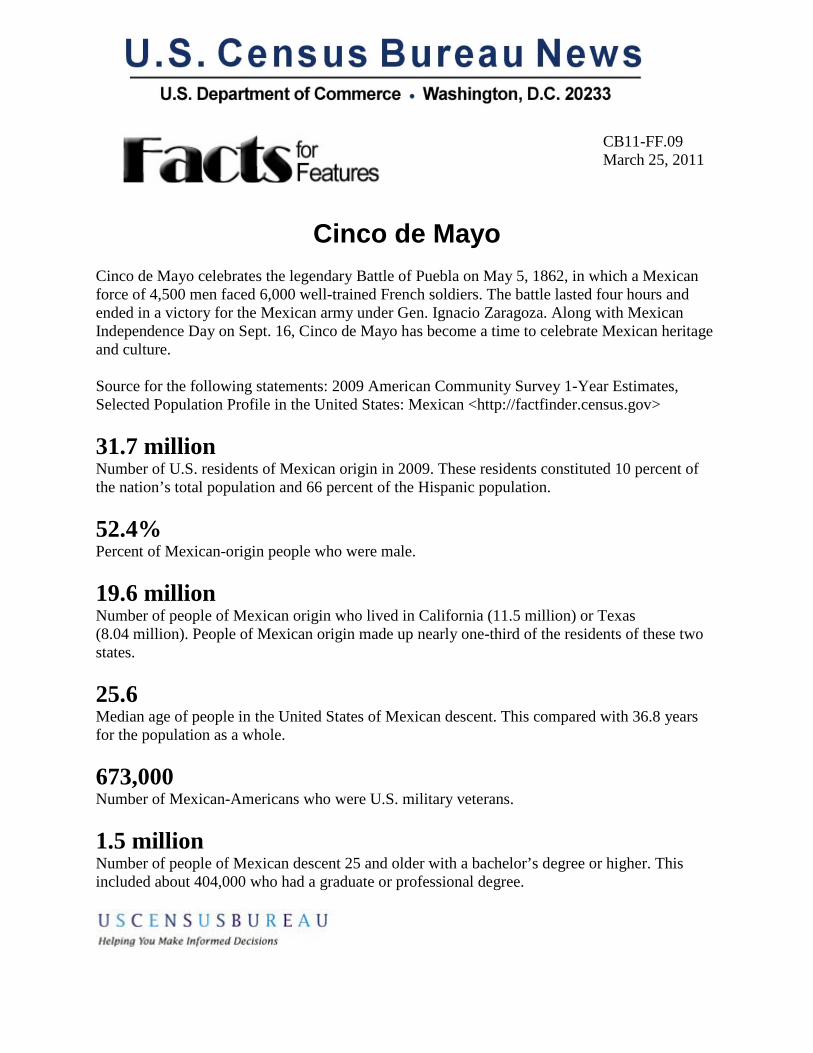
CB11-FF.09
March 25, 2011
Cinco de Mayo
Cinco de Mayo celebrates the legendary Battle of Puebla on May 5, 1862, in which a Mexican force of 4,500 men faced 6,000 well-trained French soldiers. The battle lasted four hours and ended in a victory for the Mexican army under Gen. Ignacio Zaragoza. Along with Mexican Independence Day on Sept. 16, Cinco de Mayo has become a time to celebrate Mexican heritage and culture. Source for the following statements: 2009 American Community Survey 1-Year Estimates, Selected Population Profile in the United States: Mexican <http://factfinder.census.gov> 31.7 million Number of U.S. residents of Mexican origin in 2009. These residents constituted 10 percent of the nation’s total population and 66 percent of the Hispanic population. 52.4% Percent of Mexican-origin people who were male. 19.6 million Number of people of Mexican origin who lived in California (11.5 million) or Texas (8.04 million). People of Mexican origin made up nearly one-third of the residents of these two states. 25.6 Median age of people in the United States of Mexican descent. This compared with 36.8 years for the population as a whole. 673,000 Number of Mexican-Americans who were U.S. military veterans. 1.5 million Number of people of Mexican descent 25 and older with a bachelor’s degree or higher. This included about 404,000 who had a graduate or professional degree.
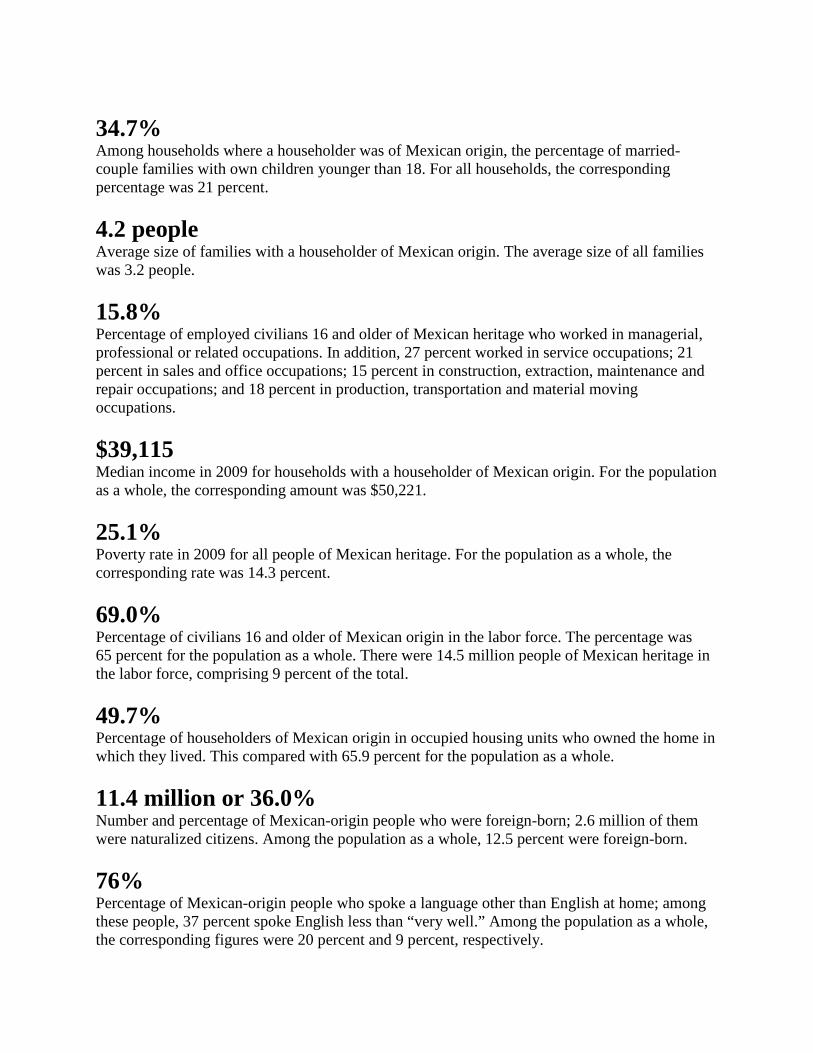
34.7% Among households where a householder was of Mexican origin, the percentage of married-couple families with own children younger than 18. For all households, the corresponding percentage was 21 percent. 4.2 people Average size of families with a householder of Mexican origin. The average size of all families was 3.2 people. 15.8% Percentage of employed civilians 16 and older of Mexican heritage who worked in managerial, professional or related occupations. In addition, 27 percent worked in service occupations; 21 percent in sales and office occupations; 15 percent in construction, extraction, maintenance and repair occupations; and 18 percent in production, transportation and material moving occupations. $39,115 Median income in 2009 for households with a householder of Mexican origin. For the population as a whole, the corresponding amount was $50,221. 25.1% Poverty rate in 2009 for all people of Mexican heritage. For the population as a whole, the corresponding rate was 14.3 percent. 69.0% Percentage of civilians 16 and older of Mexican origin in the labor force. The percentage was 65 percent for the population as a whole. There were 14.5 million people of Mexican heritage in the labor force, comprising 9 percent of the total. 49.7% Percentage of householders of Mexican origin in occupied housing units who owned the home in which they lived. This compared with 65.9 percent for the population as a whole. 11.4 million or 36.0% Number and percentage of Mexican-origin people who were foreign-born; 2.6 million of them were naturalized citizens. Among the population as a whole, 12.5 percent were foreign-born. 76% Percentage of Mexican-origin people who spoke a language other than English at home; among these people, 37 percent spoke English less than “very well.” Among the population as a whole, the corresponding figures were 20 percent and 9 percent, respectively.
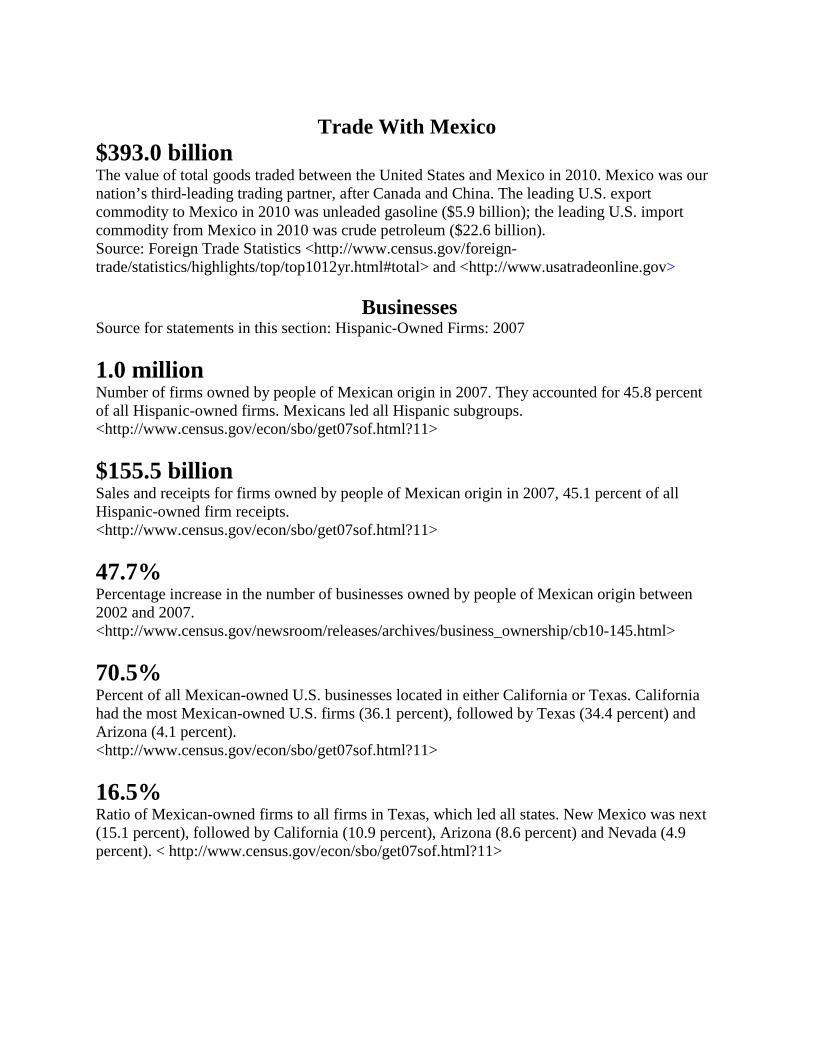
Trade With Mexico
$393.0 billion The value of total goods traded between the United States and Mexico in 2010. Mexico was our nation’s third-leading trading partner, after Canada and China. The leading U.S. export commodity to Mexico in 2010 was unleaded gasoline ($5.9 billion); the leading U.S. import commodity from Mexico in 2010 was crude petroleum ($22.6 billion). Source: Foreign Trade Statistics <http://www.census.gov/foreign-trade/statistics/highlights/top/top1012yr.html#total> and <http://www.usatradeonline.gov>
Businesses Source for statements in this section: Hispanic-Owned Firms: 2007 1.0 million Number of firms owned by people of Mexican origin in 2007. They accounted for 45.8 percent of all Hispanic-owned firms. Mexicans led all Hispanic subgroups. <http://www.census.gov/econ/sbo/get07sof.html?11> $155.5 billion Sales and receipts for firms owned by people of Mexican origin in 2007, 45.1 percent of all Hispanic-owned firm receipts. <http://www.census.gov/econ/sbo/get07sof.html?11> 47.7% Percentage increase in the number of businesses owned by people of Mexican origin between 2002 and 2007. <http://www.census.gov/newsroom/releases/archives/business_ownership/cb10-145.html> 70.5% Percent of all Mexican-owned U.S. businesses located in either California or Texas. California had the most Mexican-owned U.S. firms (36.1 percent), followed by Texas (34.4 percent) and Arizona (4.1 percent). <http://www.census.gov/econ/sbo/get07sof.html?11> 16.5% Ratio of Mexican-owned firms to all firms in Texas, which led all states. New Mexico was next (15.1 percent), followed by California (10.9 percent), Arizona (8.6 percent) and Nevada (4.9 percent). < http://www.census.gov/econ/sbo/get07sof.html?11>
32.3% Percentage of Mexican-owned U.S. firms in the construction and repair, maintenance, personal and laundry services sectors. Mexican-owned firms accounted for 5.1 percent of all U.S. businesses in these sectors. <http://www.census.gov/econ/sbo/get07sof.html?11>
Mexican Food
$100.4 million Product shipment value of tamales and other Mexican food specialties (not frozen or canned) produced in the United States in 2002. Source: 2002 Economic Census <http://www.census.gov/econ/census02/guide/INDRPT31.HTM> $48.9 million Product shipment value of frozen enchiladas produced in the United States in 2002. Frozen tortilla shipments were valued even higher, at $156 million. Source: 2002 Economic Census <http://www.census.gov/econ/census02/guide/INDRPT31.HTM> 374 Number of U.S. tortilla manufacturing establishments in 2008. The establishments that produce this unleavened flat bread employed 16,311 people. Tortillas, the principal food of the Aztecs, are known as the “bread of Mexico.” One in three of these establishments was in Texas. Source: County Business Patterns: 2008 <http://www.census.gov/econ/cbp/> Following is a list of observances typically covered by the Census Bureau’s Facts for Features series: Black History Month (February) Labor Day Super Bowl Grandparents Day Valentine’s Day (Feb. 14) Hispanic Heritage Month (Sept. 15-Oct. 15) Women’s History Month (March) Unmarried and Single Americans Week Irish-American Heritage Month (March)/ Halloween (Oct. 31) St. Patrick’s Day (March 17) American Indian/Alaska Native Heritage Month Asian/Pacific American Heritage Month (May) (November) Older Americans Month (May) Veterans Day (Nov. 11) Cinco de Mayo (May 5) Thanksgiving Day Mother’s Day The Holiday Season (December) Hurricane Season Begins (June 1) Father’s Day The Fourth of July (July 4) Anniversary of Americans with Disabilities Act (July 26) Back to School (August) Editor’s note: The preceding data were collected from a variety of sources and may be subject to sampling variability and other sources of error. Facts for Features are customarily released about two months before an observance in order to accommodate magazine production timelines. Questions or comments should be directed to the Census Bureau’s Public Information Office: telephone: 301-763-3030; fax: 301-763-3762; or e-mail: <[email protected]>.


![Cinco de mayo[1][1]](https://img.dokumen.tips/doc/110x75/5583e477d8b42a423f8b4f6c/cinco-de-mayo11.jpg)