Embed Size (px)
Citation preview
Chronic nitrogen enrichment affects the structure andfunction of the soil microbial community in
temperate hardwood and pine forests
Serita D. Freya,*, Melissa Knorra, Jeri L. Parrentb, Rodney T. Simpsona
aDepartment of Natural Resources, University of New Hampshire, Durham, NH 03824, USAbDepartment of Biology, Duke University, Durham, NC 27708, USA
Abstract
We examined how chronic nitrogen (N) enrichment of pine and hardwood forest stands has affected the relative abundance,
functional capacity, and activity of soil bacteria and fungi. During Fall 2002 we collected one soil core (5.6 cm diameter; organic
horizon plus 10 cm of mineral soil) from each of four 5 m � 5 m subplots within the control, low N (5 g N m�2 per year), and
high N (15 g N m�2 per year) plots in both the hardwood and pine stands at the Chronic Nitrogen Amendment Study at Harvard
Forest. The samples were analyzed for total and active bacterial and fungal biomass, microbial catabolic response profiles, the
activities of cellulolytic and ligninolytic enzymes, and total, labile and microbially derived organic carbon (C). Live, fine roots
were also collected from the control and low N pine plots and analyzed for ectomycorrhizal fungal community composition and
diversity. Active fungal biomass was 27–61% and 42–69% lower in the fertilized compared to control plots in the hardwood and
pine stands, respectively. Active bacterial biomass was not greatly affected by N additions, resulting in significantly lower
fungal:bacterial biomass ratios in the N-treated plots. This shift in microbial community composition was accompanied by a
significant reduction in the activity of phenol oxidase, a lignin-degrading enzyme produced by white-rot fungi. In the pine stand,
ectomycorrhizal fungal community diversity was lower in the low N-treated plot than in the control plot. Differences in
ectomycorrhizal community structure were also detected between control and fertilized pine plots, including a reduction in those
species with the highest relative frequencies in the control community. Finally, N enrichment altered the pattern of microbial
substrate use, with the relative response to the addition of carboxylic acids and carbohydrates being significantly lower in the N-
treated plots, even after the data were normalized to account for differences in microbial biomass. These patterns are consistent
with lower decomposition rates and altered N cycling observed previously at this site.
# 2004 Elsevier B.V. All rights reserved.
Keywords: Bacteria; Microbial enzyme activity; Ectomycorrhizal fungi; Microbial biomass; Nitrogen deposition; Saprotrophic fungi
1. Introduction
Global estimates indicate that inputs to the terres-
trial N cycle have doubled in the past century due to
anthropogenic activities, particularly fertilizer use and
fossil fuel combustion (Vitousek et al., 1997). One
consequence of this human-driven change in the N
cycle is the significant increase in wet or dry N
deposition in forest ecosystems. At the local and
regional scale, N deposition near industrialized and
agricultural areas can greatly exceed those in unpol-
luted areas of the world (Vitousek et al., 1997). Rates
of N deposition are particularly high in the Midwes-
tern and Northeastern US and in Europe.
Forest Ecology and Management 196 (2004) 159–171
* Corresponding author. Tel.: þ1-603-862-3880;
fax: þ1-603-862-4976.
E-mail address: [email protected] (S.D. Frey).
0378-1127/$ – see front matter # 2004 Elsevier B.V. All rights reserved.
doi:10.1016/j.foreco.2004.03.018
The soil biota in many terrestrial ecosystems evolved
under low N conditions and thus one anticipated con-
sequence of elevated N inputs is a change in microbial
community structure and function as ecosystems move
towards N saturation. Increases in N availability due to
atmospheric deposition have been linked to reduced
sporocarp production, root colonization, and species
richness of mycorrhizal fungi (Arnolds, 1991; Dighton
and Jansen, 1991; Egerton-Warburton and Allen, 2000;
Lilleskov et al., 2002a,b). Microbial enzyme activities
(Carreiro et al., 2000; Saiya-Cork et al., 2002; Michel
and Matzner, 2003), litter decay (Magill and Aber,
1998; Hobbie, 2000), and N dynamics (Aber, 1992;
Tietema, 1998; Gundersen et al., 1998) are also often
altered, with the direction of response depending on site
characteristics (e.g., litter quality, forest floor C:N
ratio). For example, cellulase activity of decaying dog-
wood, maple, and oak litter was stimulated by N
additions; whereas, lignin-degrading activity was sig-
nificantly reduced, but only for high lignin-containing
oak litter (Carreiro et al., 2000).
The Chronic Nitrogen Amendment Study at Har-
vard Forest was established to evaluate the impact of
long-term N additions on C and N dynamics in a pine
plantation and in a mixed hardwood forest. Nitrogen
enrichment has resulted in decreased tree growth,
increased foliar N concentrations, cation imbalances,
reduced litter decomposition rates, and altered N
cycling (Aber et al., 1993, 1998; Magill and Aber,
1998; Magill et al., this volume; McDowell et al., this
volume). Little work has been done to date to deter-
mine how the microbial community has responded to
increased N availability at this site or how shifts in the
community may be linked to the observed changes in
tree growth and nutrient dynamics. Our objective was
to examine how N enrichment has affected bacterial
and fungal biomass, microbial-derived organic C,
ectomycorrhizal fungal (EMF) community composi-
tion and diversity, microbial functional capacity, and
the activities of cellulolytic and ligninolytic enzymes.
2. Materials and methods
2.1. Sample collection
We collected soil samples from the Chronic Nitro-
gen Amendment Study at Harvard Forest in central
Massachusetts in October 2002. These plots, estab-
lished and maintained by the Forest Ecosystems Study
Group at the University of New Hampshire, were
established in 1988 in two adjacent forest stands to
examine the effects of N additions on the litter decay
process (Magill and Aber, 1998; Magill et al., this
volume). One stand is dominated by mature, even-
aged red pine (Pinus resinosa), the other by black
(Quercus velutina) and red (Q. rubra) oak mixed with
black birch (Betula lenta), red maple (Acer rubrum)
and American beech (Fagus grandifolia). Three plots,
measuring 30 m � 30 m and divided into thirty-six
5 m � 5 m subplots, were established in each stand
and have been treated annually with 0, 5, or
15 g N m�2 as NH4NO3. A fourth plot in each stand
has been treated with low N (5 g N m�2) plus sulfur as
Na2SO4. There is one 30 m � 30 m plot per treatment
in each stand for a total of eight plots. We collected
O-horizon material and 10 cm of mineral soil, using a
5.6 cm diameter corer, from each of four 5 m � 5 m
subplots within the control, low N, and high N plots in
both the hardwood and pine stands. We did not
collect samples from the nitrogen plus sulfur plot
for this study. Samples were sieved (2 mm), stored
field moist at 4 8C, and analyzed within 2 weeks of
collection.
For EMF community analysis we collected live, fine
roots from O-horizon soils in July 2002 from the
control and low N pine plots. Samples were not
collected from the high N pine plot due to the high
degree of host tree mortality in this plot; hardwood
plots were not sampled because of time and financial
constraints. The spatially heterogeneous distribution
of individuals in EMF communities requires that many
spatially separated samples be collected. In order to
maximize plot coverage while minimizing sampling
impact we did not use a core sampler to collect roots;
instead, live, fine roots, each 10 cm in length, were
located by hand and removed with forceps from the O-
horizon soil. Two root samples were taken approxi-
mately 0.5 m from—and at opposite sides of—the
bole of every live P. resinosa individual, for a total
of 150 root samples from the control pine plot, and 148
root samples from the low N pine plot. Samples were
stored at 4 8C and processed within 1 week of collec-
tion. Two live root tips were randomly chosen from
each root piece and stored in microcentrifuge tubes
containing 55 mM CTAB buffer solution until DNA
160 S.D. Frey et al. / Forest Ecology and Management 196 (2004) 159–171
extraction for molecular identification could be per-
formed.
2.2. Microbial analyses
Total bacterial and fungal biomass was deter-
mined by direct epifluorescent microscopy and com-
puter-assisted image analysis (Frey et al., 1999).
Total physiologically active microbial biomass and
the relative contributions of bacteria and fungi to the
active biomass were measured by substrate-induced
respiration (SIR) with selective inhibitors (Anderson
and Domsch, 1975; Beare et al., 1991). The activities
of the cellulolytic enzyme b-1,4-glucosidase and the
ligninolytic enzyme phenol oxidase were deter-
mined according to Carreiro et al. (2000) to assess
the functional response of the microbial community
to changes in N availability. b-1,4-Glucosidase is an
exocellulase that cleaves glucan units from the end
of the cellulose polymer, while phenol oxidase is one
of a suite of lignin-degrading enzymes. One gram of
sieved soil was suspended in 60 ml of 50 mM acetate
buffer, and the suspension was stirred constantly on a
stir plate for 90 s. While stirring, 2 ml subsamples
were pipetted from the slurry and mixed with 5 mM
solutions of the substrates p-nitrophenyl-b-D-gluco-
pyranoside and L-dihydroxyphenylalanine (L-
DOPA) to assess b-1,4-glucosidase and phenol oxi-
dase activity, respectively. The mixtures were incu-
bated for 1 h at 25 8C, after which the absorbance
was measured spectrophotometrically at 410 (for b-
1,4-glucosidase) or 460 nm (for phenol oxidase).
Enzyme activities are expressed as micromole sub-
strate converted per gram soil organic C to account
for differences among samples in organic matter
quantity.
Catabolic response profiles (CRPs) were obtained by
measuring the short-term respiration responses to 25
substrates following the method developed by Degens
and Harris (1997). This approach provides a fingerprint
of the functional potential of the microbial community.
CRPs have been found to differ between species of
microorganisms grown in the same soil (Degens, 1999)
and for soils exposed to different environmental con-
ditions (Degens, 1998; Degens et al., 2001). The sub-
strates consisted of two carbohydrates (glucose,
mannose), two amines (D-glucosamine, L-glutamine),
six amino acids (L-arginine, L-asparagine, L-glutamic
acid, L-histidine, L-lysine, L-serine), and 15 carboxylic
acids (L-ascorbic acid, citric acid, fumaric acid, glu-
conic acid, a-ketobutyric acid, a-ketoglutaric acid, a-
ketovaleric acid, DL-malic acid, malonic acid, pantothe-
nic acid, quinic acid, succinic acid, tartaric acid, uric
acid, urocanic acid). Substrate solution concentrations
were 75 mM for carbohydrates, 15 mM for amines and
amino acids, and 100 mM for carboxylic acids. Two
milliliter of each substrate were added to a 20 ml serum
vial containing 1 g field moist, sieved soil. After a
30 min equilibration period, the vials were sealed,
vortexed and incubated for 4 h at 25 8C. Evolved
CO2 was measured on 2 ml of headspace gas using a
Licor LI-6252 infrared gas analyzer. The respiration
response for each substrate was corrected for the
amount of CO2-C evolved from a control sample that
received deionized water only. The corrected CRP data
were used to calculate catabolic evenness, a measure of
the variability in substrate use by the heterotrophic
microbial community (Degens et al., 2001). Catabolic
evenness ðEÞ ¼ 1=P
p2i , where pi is summed for all
substrates and pi ¼ ri=P
ri defined as the respiration
response of each substrate (ri) as a proportion of total
respiration responses summed over all substratesPrið Þ. The maximum achievable evenness value is
25, the point at which all substrates are used equally.
The lower the evenness value, the more variable (i.e.,
less even) is the respiratory response among the 25
substrates. We focused on evenness in our study
because catabolic richness, the total number of sub-
strates used, did not differ between soils. That is, all
25 substrates were used to some degree in every
sample.
To accurately determine EMF species identity for
each root sample, we used a DNA sequence based
approach. DNA was extracted from each sample
according to the protocol of Zolan and Pukkila
(1986), and the internal transcribed spacers (ITS)
and 5.8S ribosomal RNA gene were amplified by
PCR and sequenced. For PCR amplification, the basi-
diomycete specific primer pair ITS 1F and ITS 4NA
was used (Gardes and Bruns, 1993; Walker and Par-
rent, in press). However, the universal fungal primer
pair, ITS 1F and ITS 4 (White et al., 1990), was used if
the first reaction failed to amplify. PCR products were
sequenced using the Big Dye kit and visualized on an
ABI3700 automated sequencer (Applied Biosystems).
Sequences were manually edited and queried against
S.D. Frey et al. / Forest Ecology and Management 196 (2004) 159–171 161
both the Genbank database (NCBI) and a large in-
house database of EMF ITS sequences (Duke mycol-
ogy database, http://152.3.12.243/dfmo/). Sequences
were classified as conspecific if they shared 98% or
greater sequence similarity across the entire gene
region. For sequences that could not be identified to
species, they were recognized as congeneric if they
shared 93–97% sequence similarity, though a more
conservative designation was given in several
instances where the phylogenetic classification of
the group (e.g., genera in the Boletales) is known to
be under revision.
2.3. Chemical analyses
The amino sugars N-acetylmuramic acid, N-acet-
ylgalactosamine and N-acetylglucosamine were
measured to quantify bacterial and fungal contribu-
tions to the production of microbially derived organic
matter (Zhang and Amelung, 1996; Guggenberger
et al., 1999; Simpson et al., in press). Muramic acid
derives exclusively from bacterial cell walls, while
glucosamine is present in fungal cell walls, bacterial
cell walls, and microarthropod exoskeletons. Bacter-
ial cell walls contain peptidoglycan, a molecule
composed of alternating monomers of N-acetylglu-
cosamine and N-acetylmuramic acid. We corrected
the soil glucosamine concentrations for the glucosa-
mine present in bacterial cell walls by assuming
that the ratio of glucosamine to muramic acid in
bacteria is 1:1 (Brock and Madigan, 1988). Thus
the glucosamine concentrations reported here repre-
sent fungal-derived glucosamine plus an unknown
contribution from microarthropods. The contribution
of microarthropods to the total soil glucosamine
concentration is likely minimal since microarthropod
biomass is typically less than 0.5% of fungal biomass
(Beare, 1997). We therefore assume that the gluco-
samine concentrations reported here derive primarily
from fungi. The source of galactosamine is less well
defined than for glucosamine and muramic acid, but
available evidence indicates a predominantly bacter-
ial origin (W. Amelung, pers. comm.). Amino sugar
analysis followed the procedure of Zhang and Ame-
lung (1996). Soil samples containing approximately
0.3 mg N were hydrolyzed with 6 M HCl. The hydro-
lysates were purified, freeze dried and the amino
sugars transformed to aldononitrile derivatives
before separation and quantification by gas liquid
chromatography.
Total organic C and N were determined on finely
ground subsamples by dry combustion on a Perkin-
Elmer 2400 series CHN analyzer. Labile soil C was
estimated by incubating 10 g of field moist, sieved soil
with 20 ml deionized water in sealed 250 ml Erlen-
meyer flasks. The soil slurries were incubated at 25 8Con a rotary shaker for 30 days. Evolved CO2 was
measured every 2–4 days using a Licor LI-6252 infra-
red gas analyzer, after which the flasks were flushed
with compressed air and resealed.
2.4. Statistical analyses
Two-way analysis of variance was performed using
rank analysis of variance (PROC RANK, PROC GLM,
SAS Institute, 1999) to determine the effect of N
treatment (control, low N, high N) and stand type
(hardwood versus pine) on microbial community
structure and function. A non-parametric procedure
was selected because the data violated the assump-
tions of normality and homogeneity of variance for
standard analysis of variance. The Ryan–Einot–Gab-
riel–Welsch multiple range test was used to determine
significant differences among means at P < 0:05.
Principle components analysis (PCA) was performed
on the catabolic response profile data to determine if
the CRP patterns differed among N treatments and
forest stands. Prior to PCA, the CRP patterns were
standardized by dividing by the average substrate
response for each soil to reduce bias associated with
differences in microbial biomass among soils
(Degens, 1998).
Simpson’s D D ¼ 1 �P
P2i
� �and Shannon’s H0
H0 ¼ �P
Pi ln Pið Þ diversity indices were calculated
for EMF samples to evaluate the influence of N
addition on EMF community diversity. To assess
precision of the D and H0 estimates calculated from
the observed data, and whether there were statistically
significant differences in diversity between unferti-
lized and fertilized (low N) pine plots, bootstrap
confidence intervals (95%) were estimated and ran-
domization tests were performed. To obtain the boot-
strap distribution for each plot, 1000 bootstrap
replicates were generated. For each replicate, samples
were drawn at random with replacement from the
observed community data to achieve a sample size
162 S.D. Frey et al. / Forest Ecology and Management 196 (2004) 159–171
equal to the number of actual samples generated for
that plot; D and H0 were then calculated. Confidence
intervals (95%) were calculated from the 1000 boot-
strap replicates for each plot and compared to the
diversity indices calculated from the actual data. For
randomization tests, samples were randomly assigned
to either the control or low N plot, keeping the sample
sizes the same as the actual sample size for each plot,
D and H0 were calculated for each plot, and the
difference between control and low N diversity indices
were determined. This was iterated for 1000 repli-
cates, yielding a distribution of differences in diversity
between plots. The 95% confidence intervals were
then determined, and if the observed difference in
diversity between plots was outside the 95% CI, it was
considered statistically significant. Fisher’s exact tests
were calculated to detect significant differences in the
relative frequencies of individual EMF species
between plots.
3. Results and discussion
3.1. Microbial biomass and C pools
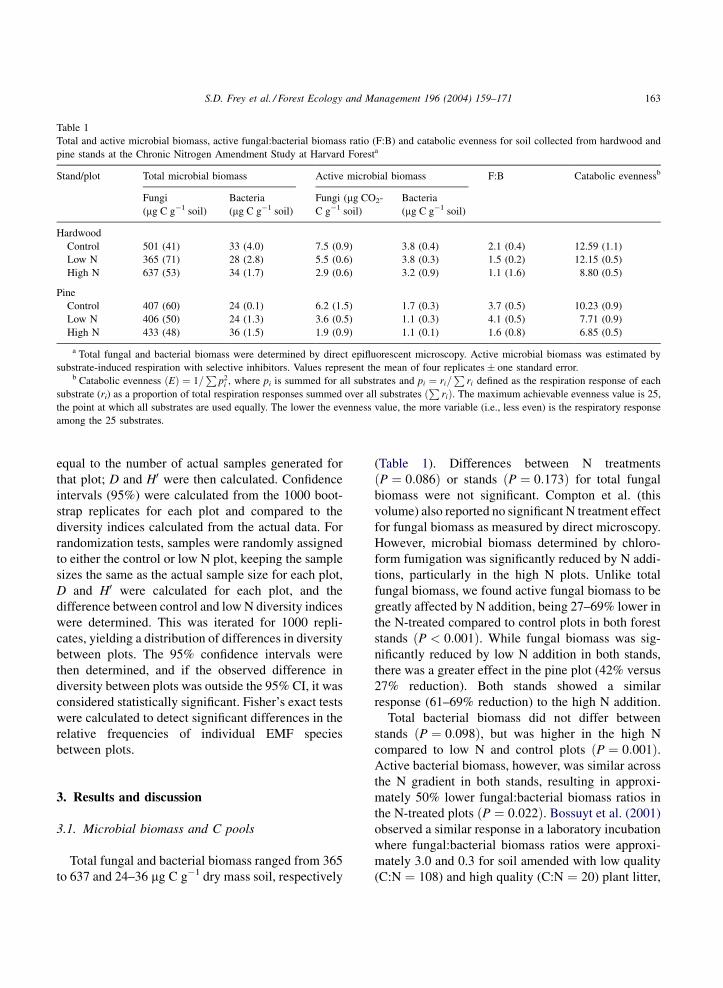
Total fungal and bacterial biomass ranged from 365
to 637 and 24–36 mg C g�1 dry mass soil, respectively
(Table 1). Differences between N treatments
ðP ¼ 0:086Þ or stands ðP ¼ 0:173Þ for total fungal
biomass were not significant. Compton et al. (this
volume) also reported no significant N treatment effect
for fungal biomass as measured by direct microscopy.
However, microbial biomass determined by chloro-
form fumigation was significantly reduced by N addi-
tions, particularly in the high N plots. Unlike total
fungal biomass, we found active fungal biomass to be
greatly affected by N addition, being 27–69% lower in
the N-treated compared to control plots in both forest
stands ðP < 0:001Þ. While fungal biomass was sig-
nificantly reduced by low N addition in both stands,
there was a greater effect in the pine plot (42% versus
27% reduction). Both stands showed a similar
response (61–69% reduction) to the high N addition.
Total bacterial biomass did not differ between
stands ðP ¼ 0:098Þ, but was higher in the high N
compared to low N and control plots ðP ¼ 0:001Þ.Active bacterial biomass, however, was similar across
the N gradient in both stands, resulting in approxi-
mately 50% lower fungal:bacterial biomass ratios in
the N-treated plots ðP ¼ 0:022Þ. Bossuyt et al. (2001)
observed a similar response in a laboratory incubation
where fungal:bacterial biomass ratios were approxi-
mately 3.0 and 0.3 for soil amended with low quality
(C:N ¼ 108) and high quality (C:N ¼ 20) plant litter,
Table 1
Total and active microbial biomass, active fungal:bacterial biomass ratio (F:B) and catabolic evenness for soil collected from hardwood and
pine stands at the Chronic Nitrogen Amendment Study at Harvard Foresta
Stand/plot Total microbial biomass Active microbial biomass F:B Catabolic evennessb
Fungi
(mg C g�1 soil)
Bacteria
(mg C g�1 soil)
Fungi (mg CO2-
C g�1 soil)
Bacteria
(mg C g�1 soil)
Hardwood
Control 501 (41) 33 (4.0) 7.5 (0.9) 3.8 (0.4) 2.1 (0.4) 12.59 (1.1)
Low N 365 (71) 28 (2.8) 5.5 (0.6) 3.8 (0.3) 1.5 (0.2) 12.15 (0.5)
High N 637 (53) 34 (1.7) 2.9 (0.6) 3.2 (0.9) 1.1 (1.6) 8.80 (0.5)
Pine
Control 407 (60) 24 (0.1) 6.2 (1.5) 1.7 (0.3) 3.7 (0.5) 10.23 (0.9)
Low N 406 (50) 24 (1.3) 3.6 (0.5) 1.1 (0.3) 4.1 (0.5) 7.71 (0.9)
High N 433 (48) 36 (1.5) 1.9 (0.9) 1.1 (0.1) 1.6 (0.8) 6.85 (0.5)
a Total fungal and bacterial biomass were determined by direct epifluorescent microscopy. Active microbial biomass was estimated by
substrate-induced respiration with selective inhibitors. Values represent the mean of four replicates � one standard error.b Catabolic evenness ðEÞ ¼ 1=
Pp2
i , where pi is summed for all substrates and pi ¼ ri=P
ri defined as the respiration response of each
substrate (ri) as a proportion of total respiration responses summed over all substratesP
rið Þ. The maximum achievable evenness value is 25,
the point at which all substrates are used equally. The lower the evenness value, the more variable (i.e., less even) is the respiratory response
among the 25 substrates.
S.D. Frey et al. / Forest Ecology and Management 196 (2004) 159–171 163
respectively. When mineral N was added to the soil
containing low quality material, fungal biomass was
significantly reduced while bacterial biomass was not.
Fungal:bacterial ratios have also been shown to
decrease in N-fertilized pastures (Bardgett et al.,
1996, 1999; Bardgett and McAlister, 1999). Thus,
fungi appear more sensitive than bacteria to soil N
enrichment.
The amino sugars glucosamine, galactosamine, and
muramic acid are components of microbial cell walls,
and have been used to assess the microbial contribu-
tion to soil organic matter accumulation and turnover
in soils (Zhang and Amelung, 1996; Chantigny et al.,
1997; Simpson et al., in press). Total soil amino sugar
concentrations are typically 1–2 orders of magnitude
higher than those estimated to be present in intact
microbial cells, because this organic matter pool
includes both cell wall components of living microbes
as well as decomposing microbial residues (Guggen-
berger et al., 1999). The size of the amino sugar C pool
is the balance between the production of new micro-
bial cells and the decomposition rate of dead microbial
material, the latter being dependent on both the che-
mical composition of the compounds and their degree
of physical and/or chemical protection within the soil
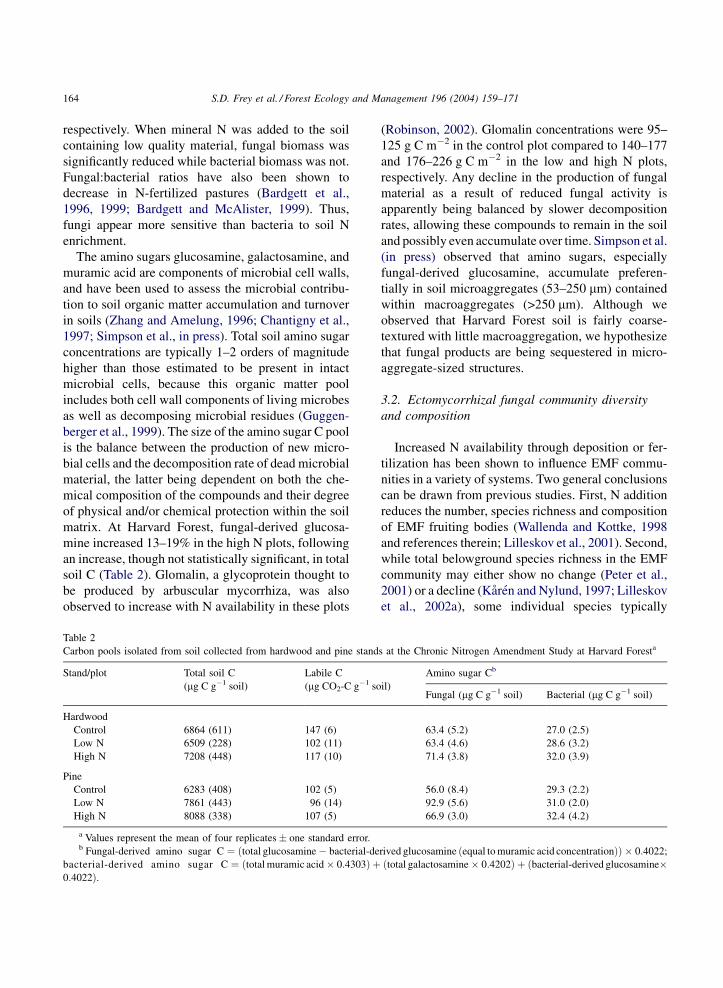
matrix. At Harvard Forest, fungal-derived glucosa-
mine increased 13–19% in the high N plots, following
an increase, though not statistically significant, in total
soil C (Table 2). Glomalin, a glycoprotein thought to
be produced by arbuscular mycorrhiza, was also
observed to increase with N availability in these plots
(Robinson, 2002). Glomalin concentrations were 95–
125 g C m�2 in the control plot compared to 140–177
and 176–226 g C m�2 in the low and high N plots,
respectively. Any decline in the production of fungal
material as a result of reduced fungal activity is
apparently being balanced by slower decomposition
rates, allowing these compounds to remain in the soil
and possibly even accumulate over time. Simpson et al.
(in press) observed that amino sugars, especially
fungal-derived glucosamine, accumulate preferen-
tially in soil microaggregates (53–250 mm) contained
within macroaggregates (>250 mm). Although we
observed that Harvard Forest soil is fairly coarse-
textured with little macroaggregation, we hypothesize
that fungal products are being sequestered in micro-
aggregate-sized structures.
3.2. Ectomycorrhizal fungal community diversity
and composition
Increased N availability through deposition or fer-
tilization has been shown to influence EMF commu-
nities in a variety of systems. Two general conclusions
can be drawn from previous studies. First, N addition
reduces the number, species richness and composition
of EMF fruiting bodies (Wallenda and Kottke, 1998
and references therein; Lilleskov et al., 2001). Second,
while total belowground species richness in the EMF
community may either show no change (Peter et al.,
2001) or a decline (Karen and Nylund, 1997; Lilleskov
et al., 2002a), some individual species typically
Table 2
Carbon pools isolated from soil collected from hardwood and pine stands at the Chronic Nitrogen Amendment Study at Harvard Foresta
Stand/plot Total soil C
(mg C g�1 soil)
Labile C
(mg CO2-C g�1 soil)
Amino sugar Cb
Fungal (mg C g�1 soil) Bacterial (mg C g�1 soil)
Hardwood
Control 6864 (611) 147 (6) 63.4 (5.2) 27.0 (2.5)
Low N 6509 (228) 102 (11) 63.4 (4.6) 28.6 (3.2)
High N 7208 (448) 117 (10) 71.4 (3.8) 32.0 (3.9)
Pine
Control 6283 (408) 102 (5) 56.0 (8.4) 29.3 (2.2)
Low N 7861 (443) 96 (14) 92.9 (5.6) 31.0 (2.0)
High N 8088 (338) 107 (5) 66.9 (3.0) 32.4 (4.2)
a Values represent the mean of four replicates � one standard error.b Fungal-derived amino sugar C ¼ ðtotal glucosamine � bacterial-derived glucosamine ðequal to muramic acid concentrationÞÞ � 0:4022;
bacterial-derived amino sugar C ¼ ðtotal muramic acid � 0:4303Þ þ ðtotal galactosamine � 0:4202Þ þ ðbacterial-derived glucosamine�0:4022Þ.
164 S.D. Frey et al. / Forest Ecology and Management 196 (2004) 159–171
decline in relative frequency on root tips, while others
increase.
We sampled root tips from the control and low N
pine plots to assess the effects of N addition on
belowground EMF community diversity and compo-
sition. DNA was extracted from 150 root tips in the
control pine plot and 148 root tips from the low N pine
plot. Of these 298 samples, we were able to success-
fully sequence and analyze 152 samples, 119 from the
control stand and 33 from the low N stand. From these
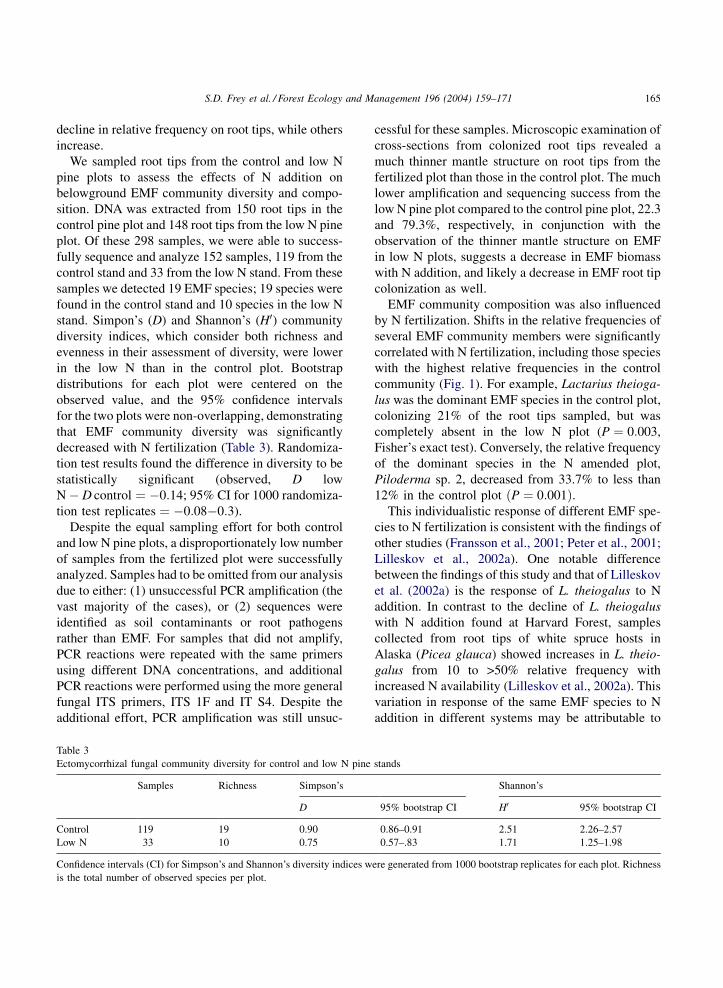
samples we detected 19 EMF species; 19 species were
found in the control stand and 10 species in the low N
stand. Simpon’s (D) and Shannon’s (H0) community
diversity indices, which consider both richness and
evenness in their assessment of diversity, were lower
in the low N than in the control plot. Bootstrap
distributions for each plot were centered on the
observed value, and the 95% confidence intervals
for the two plots were non-overlapping, demonstrating
that EMF community diversity was significantly
decreased with N fertilization (Table 3). Randomiza-
tion test results found the difference in diversity to be
statistically significant (observed, D low
N � D control ¼ �0:14; 95% CI for 1000 randomiza-
tion test replicates ¼ �0:08�0:3).
Despite the equal sampling effort for both control
and low N pine plots, a disproportionately low number
of samples from the fertilized plot were successfully
analyzed. Samples had to be omitted from our analysis
due to either: (1) unsuccessful PCR amplification (the
vast majority of the cases), or (2) sequences were
identified as soil contaminants or root pathogens
rather than EMF. For samples that did not amplify,
PCR reactions were repeated with the same primers
using different DNA concentrations, and additional
PCR reactions were performed using the more general
fungal ITS primers, ITS 1F and IT S4. Despite the
additional effort, PCR amplification was still unsuc-
cessful for these samples. Microscopic examination of
cross-sections from colonized root tips revealed a
much thinner mantle structure on root tips from the
fertilized plot than those in the control plot. The much
lower amplification and sequencing success from the
low N pine plot compared to the control pine plot, 22.3
and 79.3%, respectively, in conjunction with the
observation of the thinner mantle structure on EMF
in low N plots, suggests a decrease in EMF biomass
with N addition, and likely a decrease in EMF root tip
colonization as well.
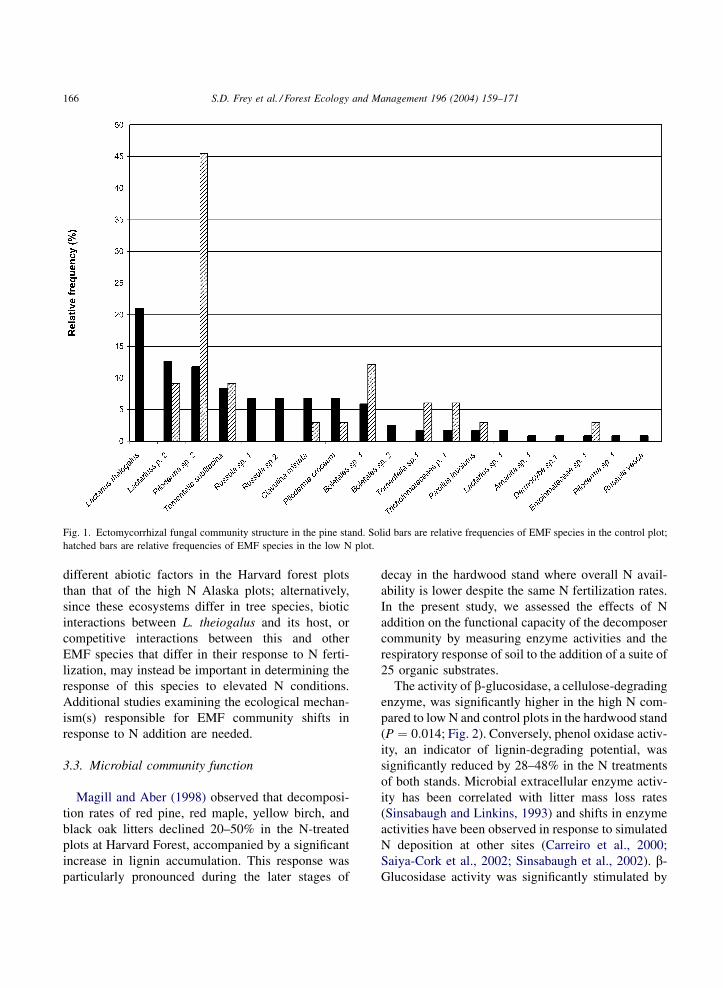
EMF community composition was also influenced
by N fertilization. Shifts in the relative frequencies of
several EMF community members were significantly
correlated with N fertilization, including those species
with the highest relative frequencies in the control
community (Fig. 1). For example, Lactarius theioga-
lus was the dominant EMF species in the control plot,
colonizing 21% of the root tips sampled, but was
completely absent in the low N plot (P ¼ 0:003,
Fisher’s exact test). Conversely, the relative frequency
of the dominant species in the N amended plot,
Piloderma sp. 2, decreased from 33.7% to less than
12% in the control plot ðP ¼ 0:001Þ.This individualistic response of different EMF spe-
cies to N fertilization is consistent with the findings of
other studies (Fransson et al., 2001; Peter et al., 2001;
Lilleskov et al., 2002a). One notable difference
between the findings of this study and that of Lilleskov
et al. (2002a) is the response of L. theiogalus to N
addition. In contrast to the decline of L. theiogalus
with N addition found at Harvard Forest, samples
collected from root tips of white spruce hosts in
Alaska (Picea glauca) showed increases in L. theio-
galus from 10 to >50% relative frequency with
increased N availability (Lilleskov et al., 2002a). This
variation in response of the same EMF species to N
addition in different systems may be attributable to
Table 3
Ectomycorrhizal fungal community diversity for control and low N pine stands
Samples Richness Simpson’s Shannon’s
D 95% bootstrap CI H0 95% bootstrap CI
Control 119 19 0.90 0.86–0.91 2.51 2.26–2.57
Low N 33 10 0.75 0.57–.83 1.71 1.25–1.98
Confidence intervals (CI) for Simpson’s and Shannon’s diversity indices were generated from 1000 bootstrap replicates for each plot. Richness
is the total number of observed species per plot.
S.D. Frey et al. / Forest Ecology and Management 196 (2004) 159–171 165
different abiotic factors in the Harvard forest plots
than that of the high N Alaska plots; alternatively,
since these ecosystems differ in tree species, biotic
interactions between L. theiogalus and its host, or
competitive interactions between this and other
EMF species that differ in their response to N ferti-
lization, may instead be important in determining the
response of this species to elevated N conditions.
Additional studies examining the ecological mechan-
ism(s) responsible for EMF community shifts in
response to N addition are needed.
3.3. Microbial community function
Magill and Aber (1998) observed that decomposi-
tion rates of red pine, red maple, yellow birch, and
black oak litters declined 20–50% in the N-treated
plots at Harvard Forest, accompanied by a significant
increase in lignin accumulation. This response was
particularly pronounced during the later stages of
decay in the hardwood stand where overall N avail-
ability is lower despite the same N fertilization rates.
In the present study, we assessed the effects of N
addition on the functional capacity of the decomposer
community by measuring enzyme activities and the
respiratory response of soil to the addition of a suite of
25 organic substrates.
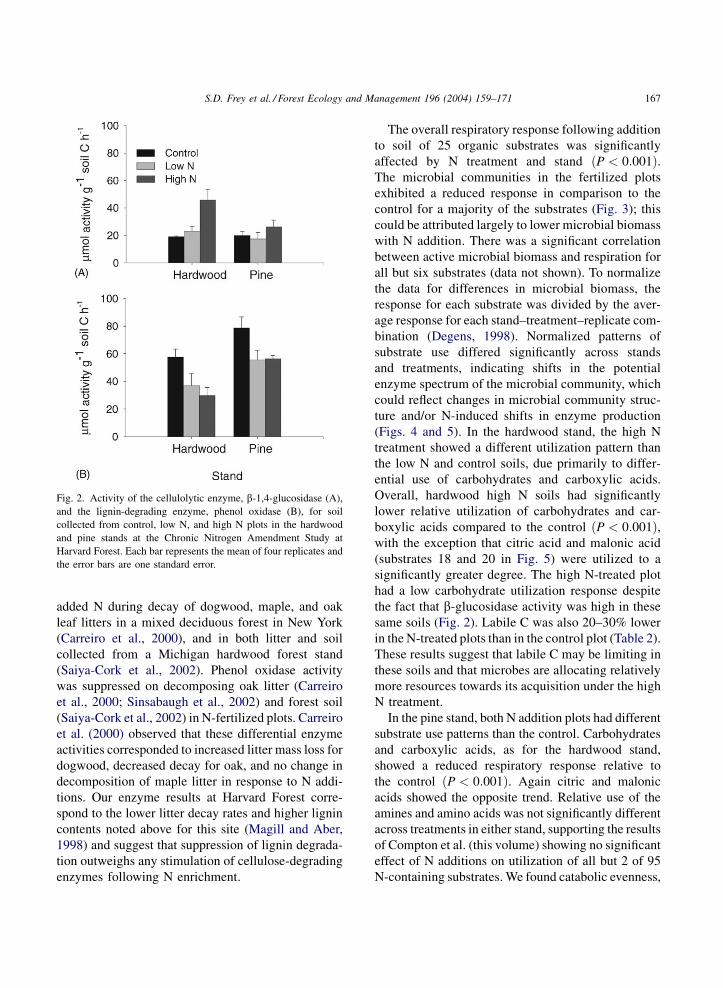
The activity of b-glucosidase, a cellulose-degrading
enzyme, was significantly higher in the high N com-
pared to low N and control plots in the hardwood stand
(P ¼ 0:014; Fig. 2). Conversely, phenol oxidase activ-
ity, an indicator of lignin-degrading potential, was
significantly reduced by 28–48% in the N treatments
of both stands. Microbial extracellular enzyme activ-
ity has been correlated with litter mass loss rates
(Sinsabaugh and Linkins, 1993) and shifts in enzyme
activities have been observed in response to simulated
N deposition at other sites (Carreiro et al., 2000;
Saiya-Cork et al., 2002; Sinsabaugh et al., 2002). b-
Glucosidase activity was significantly stimulated by
Fig. 1. Ectomycorrhizal fungal community structure in the pine stand. Solid bars are relative frequencies of EMF species in the control plot;
hatched bars are relative frequencies of EMF species in the low N plot.
166 S.D. Frey et al. / Forest Ecology and Management 196 (2004) 159–171
added N during decay of dogwood, maple, and oak
leaf litters in a mixed deciduous forest in New York
(Carreiro et al., 2000), and in both litter and soil
collected from a Michigan hardwood forest stand
(Saiya-Cork et al., 2002). Phenol oxidase activity
was suppressed on decomposing oak litter (Carreiro
et al., 2000; Sinsabaugh et al., 2002) and forest soil
(Saiya-Cork et al., 2002) in N-fertilized plots. Carreiro
et al. (2000) observed that these differential enzyme
activities corresponded to increased litter mass loss for
dogwood, decreased decay for oak, and no change in
decomposition of maple litter in response to N addi-
tions. Our enzyme results at Harvard Forest corre-
spond to the lower litter decay rates and higher lignin
contents noted above for this site (Magill and Aber,
1998) and suggest that suppression of lignin degrada-
tion outweighs any stimulation of cellulose-degrading
enzymes following N enrichment.
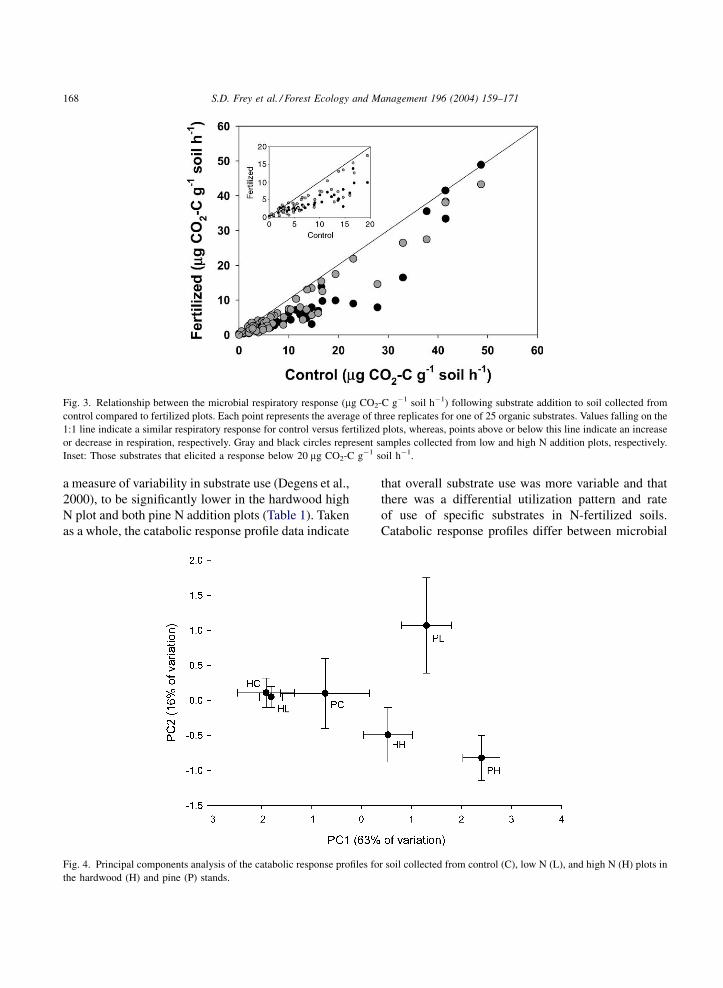
The overall respiratory response following addition
to soil of 25 organic substrates was significantly
affected by N treatment and stand ðP < 0:001Þ.The microbial communities in the fertilized plots
exhibited a reduced response in comparison to the
control for a majority of the substrates (Fig. 3); this
could be attributed largely to lower microbial biomass
with N addition. There was a significant correlation
between active microbial biomass and respiration for
all but six substrates (data not shown). To normalize
the data for differences in microbial biomass, the
response for each substrate was divided by the aver-
age response for each stand–treatment–replicate com-
bination (Degens, 1998). Normalized patterns of
substrate use differed significantly across stands
and treatments, indicating shifts in the potential
enzyme spectrum of the microbial community, which
could reflect changes in microbial community struc-
ture and/or N-induced shifts in enzyme production
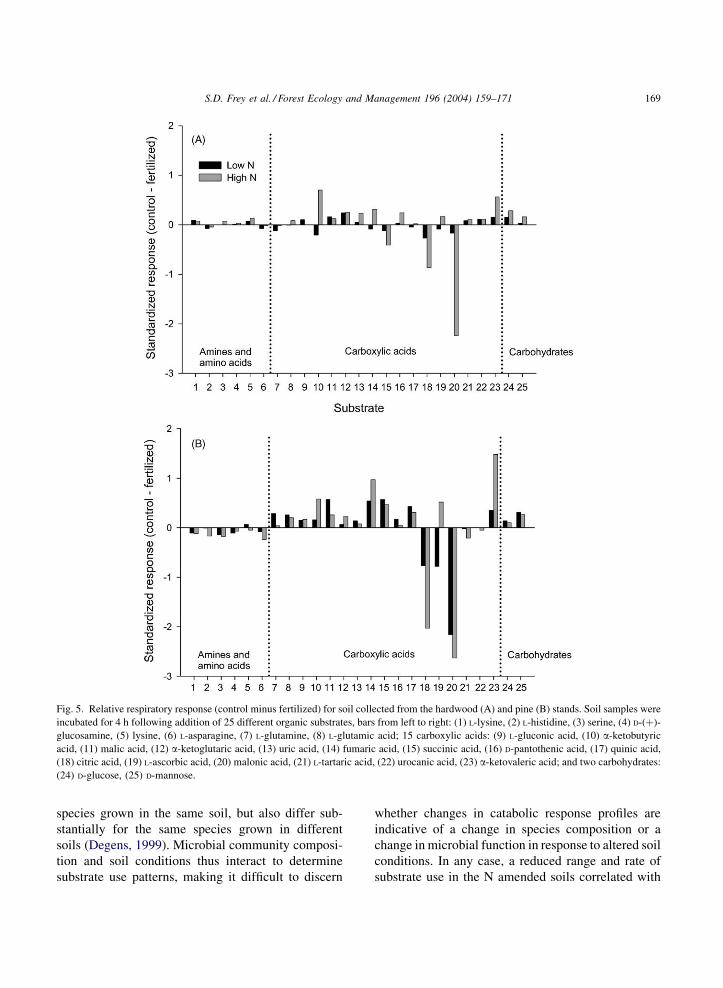
(Figs. 4 and 5). In the hardwood stand, the high N
treatment showed a different utilization pattern than
the low N and control soils, due primarily to differ-
ential use of carbohydrates and carboxylic acids.
Overall, hardwood high N soils had significantly
lower relative utilization of carbohydrates and car-
boxylic acids compared to the control ðP < 0:001Þ,with the exception that citric acid and malonic acid
(substrates 18 and 20 in Fig. 5) were utilized to a
significantly greater degree. The high N-treated plot
had a low carbohydrate utilization response despite
the fact that b-glucosidase activity was high in these
same soils (Fig. 2). Labile C was also 20–30% lower
in the N-treated plots than in the control plot (Table 2).
These results suggest that labile C may be limiting in
these soils and that microbes are allocating relatively
more resources towards its acquisition under the high
N treatment.
In the pine stand, both N addition plots had different
substrate use patterns than the control. Carbohydrates
and carboxylic acids, as for the hardwood stand,
showed a reduced respiratory response relative to
the control ðP < 0:001Þ. Again citric and malonic
acids showed the opposite trend. Relative use of the
amines and amino acids was not significantly different
across treatments in either stand, supporting the results
of Compton et al. (this volume) showing no significant
effect of N additions on utilization of all but 2 of 95
N-containing substrates. We found catabolic evenness,
Fig. 2. Activity of the cellulolytic enzyme, b-1,4-glucosidase (A),
and the lignin-degrading enzyme, phenol oxidase (B), for soil
collected from control, low N, and high N plots in the hardwood
and pine stands at the Chronic Nitrogen Amendment Study at
Harvard Forest. Each bar represents the mean of four replicates and
the error bars are one standard error.
S.D. Frey et al. / Forest Ecology and Management 196 (2004) 159–171 167
a measure of variability in substrate use (Degens et al.,
2000), to be significantly lower in the hardwood high
N plot and both pine N addition plots (Table 1). Taken
as a whole, the catabolic response profile data indicate
that overall substrate use was more variable and that
there was a differential utilization pattern and rate
of use of specific substrates in N-fertilized soils.
Catabolic response profiles differ between microbial
Fig. 3. Relationship between the microbial respiratory response (mg CO2-C g�1 soil h�1) following substrate addition to soil collected from
control compared to fertilized plots. Each point represents the average of three replicates for one of 25 organic substrates. Values falling on the
1:1 line indicate a similar respiratory response for control versus fertilized plots, whereas, points above or below this line indicate an increase
or decrease in respiration, respectively. Gray and black circles represent samples collected from low and high N addition plots, respectively.
Inset: Those substrates that elicited a response below 20 mg CO2-C g�1 soil h�1.
Fig. 4. Principal components analysis of the catabolic response profiles for soil collected from control (C), low N (L), and high N (H) plots in
the hardwood (H) and pine (P) stands.
168 S.D. Frey et al. / Forest Ecology and Management 196 (2004) 159–171
species grown in the same soil, but also differ sub-
stantially for the same species grown in different
soils (Degens, 1999). Microbial community composi-
tion and soil conditions thus interact to determine
substrate use patterns, making it difficult to discern
whether changes in catabolic response profiles are
indicative of a change in species composition or a
change in microbial function in response to altered soil
conditions. In any case, a reduced range and rate of
substrate use in the N amended soils correlated with
Fig. 5. Relative respiratory response (control minus fertilized) for soil collected from the hardwood (A) and pine (B) stands. Soil samples were
incubated for 4 h following addition of 25 different organic substrates, bars from left to right: (1) L-lysine, (2) L-histidine, (3) serine, (4) D-(þ)-
glucosamine, (5) lysine, (6) L-asparagine, (7) L-glutamine, (8) L-glutamic acid; 15 carboxylic acids: (9) L-gluconic acid, (10) a-ketobutyric
acid, (11) malic acid, (12) a-ketoglutaric acid, (13) uric acid, (14) fumaric acid, (15) succinic acid, (16) D-pantothenic acid, (17) quinic acid,
(18) citric acid, (19) L-ascorbic acid, (20) malonic acid, (21) L-tartaric acid, (22) urocanic acid, (23) a-ketovaleric acid; and two carbohydrates:
(24) D-glucose, (25) D-mannose.
S.D. Frey et al. / Forest Ecology and Management 196 (2004) 159–171 169
lower relative fungal biomass and phenol oxidase
activity.
In summary, long-term N additions have impacted
microbial community composition and function by
decreasing active fungal biomass, fungal:bacterial
biomass ratios, ectomycorrhizal fungal species diver-
sity, lignin-degrading activity, and catabolic evenness.
Mycorrhizal community composition and overall pat-
terns of substrate use have also been altered. Con-
comitant with these changes has been a trend toward
increasing accumulation of fungal-derived glucosa-
mine and glomalin. Most studies examining the effects
of N deposition on the microbial community have
focused on mycorrhizal fungi (e.g., Arnolds, 1991;
Dighton and Jansen, 1991; Egerton-Warburton and
Allen, 2000; Treseder and Allen, 2000; Lilleskov
et al., 2002a,b). Our results, together with several
recent studies (Carreiro et al., 2000; Saiya-Cork
et al., 2002; Sinsabaugh et al., 2002), indicate that
saprotrophic fungi may be as susceptible to N deposi-
tion as are mycorrhizal fungi.
Acknowledgements
We thank John Aber and Alison Magill for access to
the Chronic Nitrogen Amendment Plots at Harvard
Forest. Rachel Thiet, Kirsten Lloyd, Erica Cate, Tif-
fany Black, Lindsay Scott, and Mary Baillargeon
assisted with sample collection and analysis. William
Morris assisted with the statistical analysis of the EMF
community data. John Aber, Bill McDowell, Margaret
Carreiro, and Erik Hobbie provided helpful comments
that improved the quality of the manuscript. This work
was funded by grants from the National Science
Foundation (DEB-0224917; MCB-0084207), and
the University of New Hampshire Agricultural Experi-
ment Station (MS-48). This is scientific contribution
number 2220 from the New Hampshire Agricultural
Experiment Station.
References
Aber, J.D., 1992. Nitrogen cycling and nitrogen saturation in
temperate forest ecosystems. Trends Ecol. Evol. 7, 220–223.
Aber, J.D., Magill, A., Boone, R., Melillo, J.M., Steudler, P.,
Bowden, R., 1993. Plant and soil responses to chronic nitrogen
additions at the Harvard Forest. Massachusetts Ecol. Appl. 3,
156–166.
Aber, J., McDowell, W., Nadelhoffer, K., Magill, A., Berntson, G.,
Kamakea, M., McNulty, S., Currie, W., Rustad, L., Fernandez,
I., 1998. Nitrogen saturation in temperate forest ecosystems.
BioScience 48 (11), 921–934.
Anderson, J.P.E., Domsch, K.H., 1975. Measurement of bacterial
and fungal contributions to respiration of selected agricultural
and forest soils. Can. J. Microbiol. 21, 314–322.
Arnolds, E., 1991. Decline of ectomycorrhizal fungi in Europe.
Agric. Ecosyst. Environ. 35, 209–244.
Bardgett, R.D., Hobbs, P.J., Frostegard, A., 1996. Changes in soil
fungal:bacterial ratios following reductions in the intensity
of management of an upland grassland. Biol. Fert. Soils 22,
261–264.
Bardgett, R.D., Lovell, R.D., Hobbs, P.J., Jarvis, S.C., 1999.
Seasonal changes in soil microbial communities along a
fertility gradient of temperate grasslands. Soil Biol. Biochem.
31, 1021–1030.
Bardgett, R.D., McAlister, E., 1999. The measurement of soil
fungal:bacterial ratios as an indicator of ecosystem self-
regulation in temperate meadow grasslands. Biol. Fert. Soils
29, 282–290.
Beare, M.H., 1997. Fungal and bacterial pathways of organic
matter decomposition and nitrogen mineralization in arable
soil. In: Brussaard, L., Ferrera-Cerrato, R. (Eds.), Soil Ecology
in Sustainable Agricultural Systems. Lewis Publications, CRC
Press, Boca Raton, FL, pp. 37–70.
Beare, M.H., Neely, C.L., Coleman, D.C., Hargrove, W.L., 1991.
Characterization of a substrate-induced respiration method for
measuring fungal, bacterial and total microbial biomass on
plant residues. Agric. Ecosyst. Environ. 34, 65–73.
Bossuyt, H., Denef, K., Six, J., Frey, S.D., Merckx, R., Paustian, K.,
2001. Influence of microbial populations and residue quality on
aggregate stability. Appl. Soil Ecol. 16, 195–208.
Brock, T.D., Madigan, M.T., 1988. Biology of Microorganisms, 5th
ed. Prentice-Hall, Englewood Cliffs, NJ.
Carreiro, M.M., Sinsabaugh, R.L., Repert, D.A., Parkhurst,
D.F., 2000. Microbial enzyme shifts explain litter decay
responses to simulated nitrogen deposition. Ecology 81,
2359–2365.
Chantigny, M.H., Angers, D.A., Prevost, D., Vezina, L., Chalifour,
F., 1997. Soil aggregation and fungal and bacterial biomass
under annual and perennial cropping systems. Soil Sci. Soc.
Am. J. 61, 262–267.
Degens, B.P., 1998. Decreases in microbial functional diversity
do not result in corresponding changes in decomposition
under different moisture conditions. Soil Biol. Biochem. 30,
1989–2000.
Degens, B.P., 1999. Catabolic response profiles differ between
microorganisms grown in soils. Soil Biol. Biochem. 31,
475–477.
Degens, B.P., Harris, J.A., 1997. Development of a physiological
approach to measuring the catabolic diversity of soil microbial
communities. Soil Biol. Biochem. 29, 1309–1320.
Degens, B.P., Schipper, L.A., Sparling, G.P., Duncan, L.C., 2001. Is
the microbial community in a soil with reduced catabolic
170 S.D. Frey et al. / Forest Ecology and Management 196 (2004) 159–171
diversity less resistant to stress or disturbance? Soil Biol.
Biochem. 33, 1143–1153.
Dighton, J., Jansen, A., 1991. Atmospheric pollutants and
ectomycorrhizas: more questions than answers. Environ. Poll.
73, 179–204.
Egerton-Warburton, L.M., Allen, E.B., 2000. Shifts in arbuscular
mycorrhizal communities along an anthropogenic nitrogen
deposition gradient. Ecol. Monogr. 10, 484–496.
Fransson, P.M.A., Taylor, A.F.S., Finlay, R.D., 2001. Elevated
atmospheric CO2 alters root symbiont community structure in
forest trees. New Phytol. 152, 431–442.
Frey, S.D., Elliott, E.T., Paustian, K., 1999. Bacterial and fungal
abundance and biomass in conventional and no-tillage
agroecosystems along two climatic gradients. Soil Biol.
Biochem. 31, 573–585.
Gardes, M., Bruns, T.D., 1993. ITS primers with enhanced
specificity for basidiomycetes: application to the identification
of mycorrhizae and rusts. Molec. Ecol. 2, 113–118.
Guggenberger, G., Frey, S.D., Six, J., Paustian, K., Elliott, E.T.,
1999. Bacterial and fungal cell-wall residues in conventional
and no-tillage agroecosystems. Soil Sci. Soc. Am. J. 63, 1188–
1198.
Gundersen, P., Emmet, B.A., Kjonaas, O.J., Koopmans, C.J.,
Tietema, A., 1998. Impact of nitrogen deposition on nitrogen
cycling in forests: a synthesis of NITREX data. For. Ecol.
Manage. 101, 37–56.
Hobbie, S.E., 2000. Interactions between litter lignin and soil
nitrogen availability during leaf litter decomposition in a
Hawaiian montane forest. Ecosystem 3, 484–494.
Karen, O., Nylund, J.E., 1997. Effects of ammonium sulphate on
the community structure and biomass of ectomycorrhizal fungi
in a Norway spruce stand in southwestern. Sweden Can. J. Bot.
75, 1628–1642.
Lilleskov, E.A., Fahey, T.J., Lovett, G.M., 2001. Ectomycorrhizal
fungal aboveground community change over an atmospheric
nitrogen deposition gradient. Ecol. Appl. 11, 397–410.
Lilleskov, E.A., Fahey, T.J., Horton, T.R., Lovett, G.M., 2002a.
Belowground ectomycorrhizal fungal community change over a
nitrogen deposition gradient in Alaska. Ecology 83, 104–115.
Lilleskov, E.A., Hobbie, E.A., Fahey, T.J., 2002b. Ectomycorrhizal
fungal taxa differing in response to nitrogen deposition also
differ in pure culture organic nitrogen use and natural
abundance of nitrogen isotopes. New Phytol. 154, 219–231.
Magill, A.H., Aber, J.D., 1998. Long-term effects of experimental
nitrogen additions on foliar litter decay and humus formation in
forest ecosystems. Plant Soil 203, 301–311.
Michel, K., Matzner, E., 2003. Response of enzyme activities to
nitrogen addition in forest floors of different C-to-N ratios.
Biol. Fert. Soils 38, 102–109.
Peter, M., Ayer, F., Egli, S., 2001. Nitrogen addition in a Norway
spruce stand altered macromycete sporocarp production and
below-ground ectomycorrhizal species composition. New
Phytol. 149, 311–325.
Robinson, D.P., 2002. Glomalin: a potential sink for nitrogen and
possible contributor to dissolved organic carbon and nitrogen
within the organic soils of the Harvard Forest. MS Thesis,
University of New Hampshire, 62 pp.
Saiya-Cork, K.R., Sinsabaugh, R.L., Zak, D.R., 2002. The effects
of long term nitrogen deposition on extracellular enzyme
activity in an Acer saccharum forest soil. Soil Biol. Biochem.
34, 1309–1315.
Sinsabaugh, R.L., Carreiro, M.M., Repert, D.A., 2002. Allocation
of extracellular enzymatic activity in relation to litter
composition, N deposition, and mass loss. Biogeochemistry
60, 1–24.
Sinsabaugh, R.L., Linkins, A.E., 1993. Statistical modeling of litter
decomposition from integrated cellulase activity. Ecology 74,
1594–1597.
Simpson, R.T., Frey, S.D., Six, J., Thiet, R.K., in press. Preferential
stabilization of microbial-derived carbon in microaggregates
contained within macroaggregates of no-tillage soils. Soil Sci.
Soc. Am. J.
Tietema, A., 1998. Microbial carbon and nitrogen dynamics
in coniferous forest floor material collected along a European
nitrogen deposition gradient. For. Ecol. Manage. 101, 29–36.
Treseder, K.K., Allen, M.F., 2000. Mycorrhizal fungi have a
potential role in soil carbon storage under elevated CO2 and
nitrogen deposition. New Phytol. 147, 189–200.
Vitousek, P.M., Aber, J.D., Howarth, R.W., Likens, G.E., Matson,
P.A., Schindler, D.W., Schlesinger, W.H., Tilman, D.G., 1997.
Human alteration of the global nitrogen cycle: sources and
consequences. Ecol. Appl. 7, 737–750.
Walker, J.F., Parrent, J.L., in press. Molecular phylogenetic
evidence for the mycorrhizal status of Tremellodendron
(Sebacinaceae). Memoirs of the New York Botanical Garden.
Wallenda, T., Kottke, I., 1998. Nitrogen deposition and ectomycor-
rhizas. New Phytol. 139, 169–187.
White, T.J., Bruns, T.D., Lee, S., Taylor, J.W., 1990. Amplification
and direct sequencing of fungal ribosomal RNA genes
for phylogenetics. In: Innis, M.A., Gelfand, D.H., Sninsky,
J.J., White, T.J. (Eds.), PCR Protocols: A Guide to Methods
and Applications. Academic Press, NY, USA, pp. 315–322.
Zhang, X., Amelung, W., 1996. Gas chromatographic determina-
tion of muramic acid, glucosamine, mannosamine,
and galactosamine in soils. Soil Biol. Biochem. 28, 1201–
1206.
Zolan, M.E., Pukkila, P.J., 1986. Inheritance of DNA methylation
in Coprinus cinereus. Molec. Cell. Biol. 6, 195–200.
S.D. Frey et al. / Forest Ecology and Management 196 (2004) 159–171 171