Embed Size (px)
Citation preview
chronic kidney disease
1
Rainer Maria Rilke
Duino Elegies
O trees of life, when does your winter come?We are not in harmony, our blood does not forewarn uslike migratory birds’. Late, over taken,we force ourselves abruptly onto the windand fall to earth at some iced-over lake.Flowering and fading come to us both at once.And somewhere lions still roam and never know,in their majestic power, of any weakness.
1chronic kidney disease
50 | prevalence of CKD CKD rates || patients with CKD, diabetes, & HTN
52 | assessment of at-risk populations probability of testing
54 | assessment of at-risk, by industry & union status
56 | preventive healthcare monitoring || diabetic care || lipid monitoring || vaccinations
58 | preventive healthcare monitoring, by industry & union status
60 | hospitalization rates all-cause & cause-specific rates
62 | acute kidney failure hospitalization || outcomes
64 | adherence to prescription drug therapy
66 | summary
Figure 1.4 Nearly 6 percent of general
Medicare patients age 75 and older
carried a diagnosis of CKD in 2004.
Figure 1.35 In the Medicare CKD
population, hospitalization rates for
CHF have decreased by 27 percent
overall and by nearly 39 percent
in patients with both diabetes and
hypertension. Figure 1.44 The percent
of patients with a hospitalization for
acute kidney failure who develop
ESRD in the following year is 5–9
percent higher in patients with prior
CKD than in those without the diag-
nosis, and since 1993 has decreased
2.3 percent. Figures 1.46–51 Medication
adherence in CKD patients declines
over time, and tends to be worse in
patients younger than 65.
contents
highlights
hronic kidney disease (CKD), the precursor to ESRD, received little attention prior to the 2002 publication of the National Kidney Foun-dation’s Chronic Kidney Disease Guidelines. This document creat-
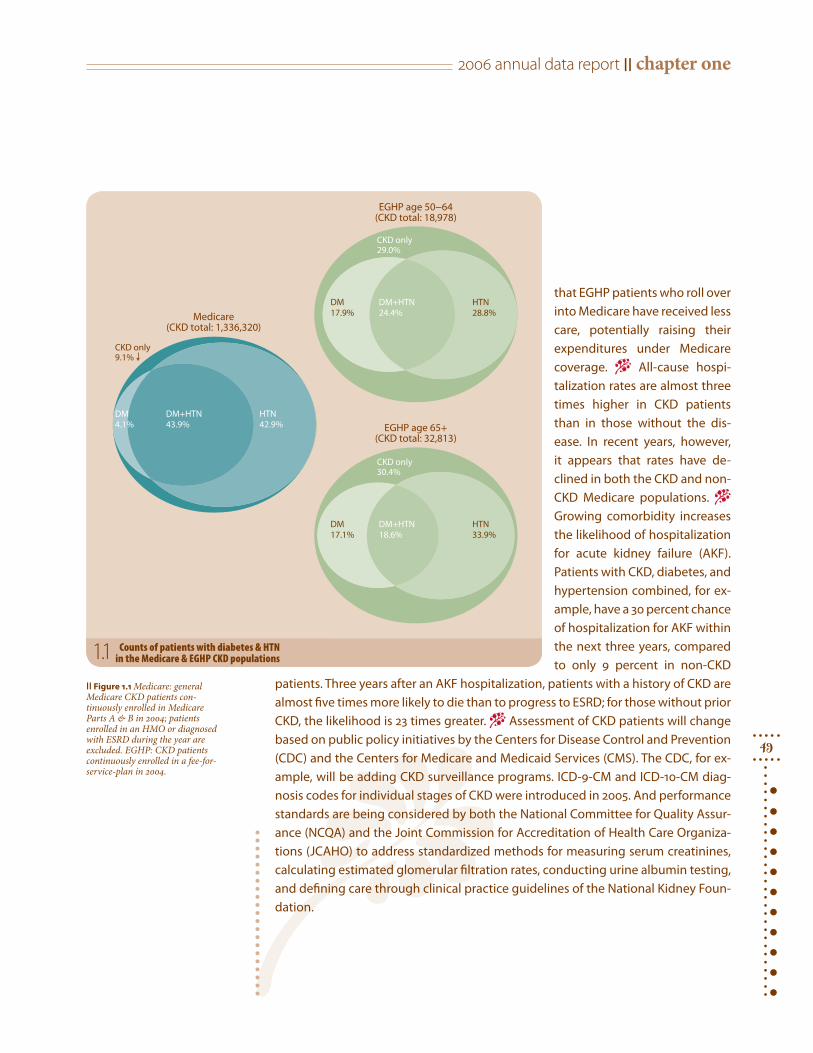
ed a CKD classification system, using five stages defined by increasing evidence of kidney damage, as shown by microalbuminuria and estimated glomerular fil-tration rates (eGFRs). − Applying this new classification system to data from the third National Health and Nutrition Examination Survey (NHANES III), Coresh and Levey et al. estimated that eight million people—4.3 percent of the U.S. popula-tion—had an eGFR less than 60 ml/min/1.73 m2, and another 12 million (6.5 per-cent) had evidence of microalbuminuria. − The USRDS uses diagnosis codes from hospital and outpatient encounters to determine the size of the CKD population, a method which utilizes only those codes identified by providers, and which thus underestimates the affected population. − Figure 1.1 shows that in more than 90 percent of Medicare patients with CKD—identified by diagnosis codes over a two-year period—the disease is accompanied by diabetes, hypertension, or both diag-noses. The numbers are lower in patients covered by employer group health plans (EGHPs), yet still sobering: 70–71 percent of CKD patients age 50 and older also carry a diagnosis of diabetes, hypertension, or both. − Figure 1.3 illustrates the preva-lence of CKD in the EGHP populations by type of industry, as reported in the Med-stat MarketScan database. In durable manufacturing there is a 2 percent prevalence of CKD, compared to only 0.4 percent in the retail trades, numbers reflecting differ-ent age, gender, and possibly racial mixes, not discernable from the supplied data. CKD prevalence among union-based employees is more than twice that of non-union workers. And the prevalence of CKD in the retired EGHP population is less than that of Medicare enrollees, but still sizable, at 2.8 percent of the population. − Access to standard risk factor assessments is lower in EGHP patients than in their Medicare counterparts. Microalbuminuria testing, for example, is given to only one in five diabetic EGHP patients, and in those with hypertension and CKD the testing rate is even lower, varying by industry. Testing for bone and mineral metabolism disorders in the employed EGHP population is less than 10 percent, also with con-siderable variation by industry type. Other care such as influenza vaccinations, gly-cemic control monitoring, and lipid testing reaches, at most, only 60 percent of the population—well below recommended levels. These data suggest that employers need to improve access to care for their populations. Equally important, they show
C
2006 annual data report || chapter one
49
that EGHP patients who roll over into Medicare have received less care, potentially raising their expenditures under Medicare coverage. − All-cause hospi-talization rates are almost three times higher in CKD patients than in those without the dis-ease. In recent years, however, it appears that rates have de-clined in both the CKD and non-CKD Medicare populations. − Growing comorbidity increases the likelihood of hospitalization for acute kidney failure (AKF). Patients with CKD, diabetes, and hypertension combined, for ex-ample, have a 30 percent chance of hospitalization for AKF within the next three years, compared to only 9 percent in non-CKD
patients. Three years after an AKF hospitalization, patients with a history of CKD are almost five times more likely to die than to progress to ESRD; for those without prior CKD, the likelihood is 23 times greater. − Assessment of CKD patients will change based on public policy initiatives by the Centers for Disease Control and Prevention (CDC) and the Centers for Medicare and Medicaid Services (CMS). The CDC, for ex-ample, will be adding CKD surveillance programs. ICD-9-CM and ICD-10-CM diag-nosis codes for individual stages of CKD were introduced in 2005. And performance standards are being considered by both the National Committee for Quality Assur-ance (NCQA) and the Joint Commission for Accreditation of Health Care Organiza-tions (JCAHO) to address standardized methods for measuring serum creatinines, calculating estimated glomerular filtration rates, conducting urine albumin testing, and defining care through clinical practice guidelines of the National Kidney Foun-dation.
DM4.1%
HTN42.9%
DM+HTN43.9%
CKD only9.1%
DM17.9%
HTN28.8%
DM+HTN24.4%
CKD only29.0%
DM17.1%
HTN33.9%
DM+HTN18.6%
CKD only30.4%
Medicare(CKD total: 1,336,320)
EGHP age 50−64(CKD total: 18,978)
EGHP age 65+(CKD total: 32,813)
|| Figure 1.1 Medicare: general Medicare CKD patients con-tinuously enrolled in Medicare Parts A & B in 2004; patients enrolled in an HMO or diagnosed with ESRD during the year are excluded. EGHP: CKD patients continuously enrolled in a fee-for-service-plan in 2004.
Counts of patients with diabetes & HTN in the Medicare & EGHP CKD populations1.1
chronic kidney disease1
50
prevalence of CKD
13.9 + (15.8)13.1 to <13.911.9 to <13.1
8.9 to <11.9below 8.9 (6.6)
38.7 + (44.2)35.7 to <38.733.0 to <35.728.8 to <33.0below 28.8 (23.2)
47.9 + (51.7)44.0 to <47.941.2 to <44.038.0 to <41.2below 38.0 (35.2)
69.8 + (75.6)62.8 to <69.857.3 to <62.851.3 to <57.3below 51.3 (47.2)
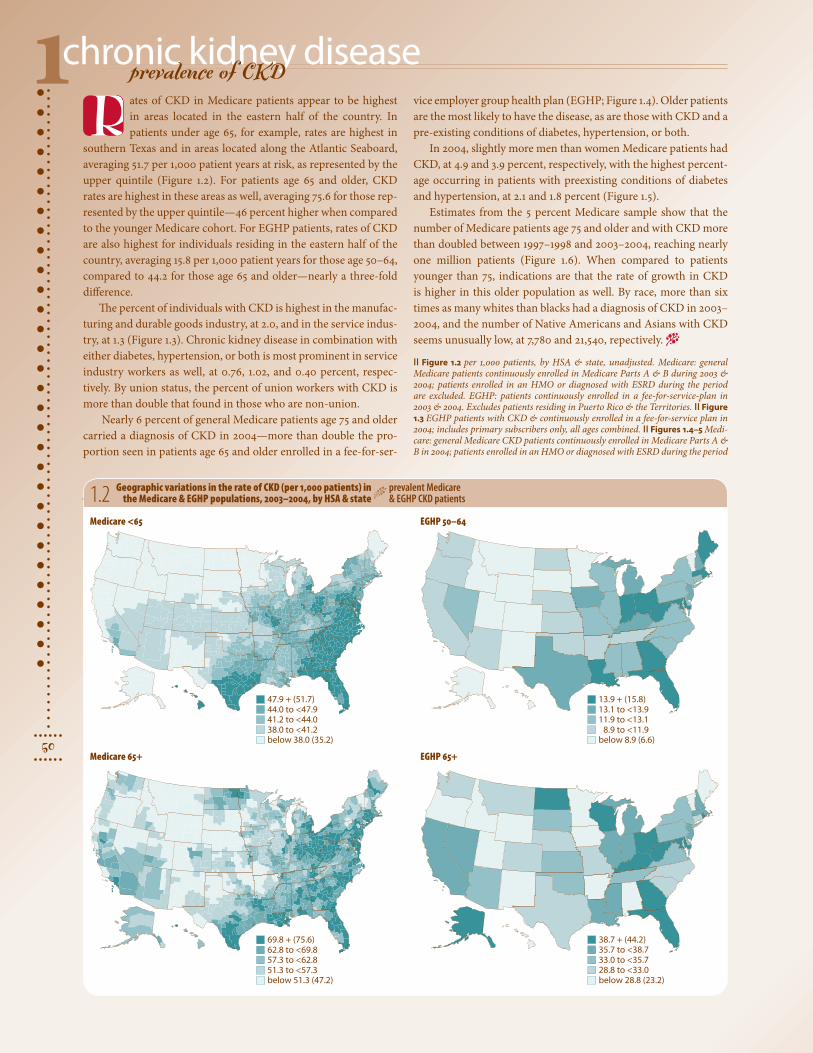
ates of CKD in Medicare patients appear to be highest in areas located in the eastern half of the country. In patients under age 65, for example, rates are highest in
southern Texas and in areas located along the Atlantic Seaboard, averaging 51.7 per 1,000 patient years at risk, as represented by the upper quintile (Figure 1.2). For patients age 65 and older, CKD rates are highest in these areas as well, averaging 75.6 for those rep-resented by the upper quintile—46 percent higher when compared to the younger Medicare cohort. For EGHP patients, rates of CKD are also highest for individuals residing in the eastern half of the country, averaging 15.8 per 1,000 patient years for those age 50–64, compared to 44.2 for those age 65 and older—nearly a three-fold difference.
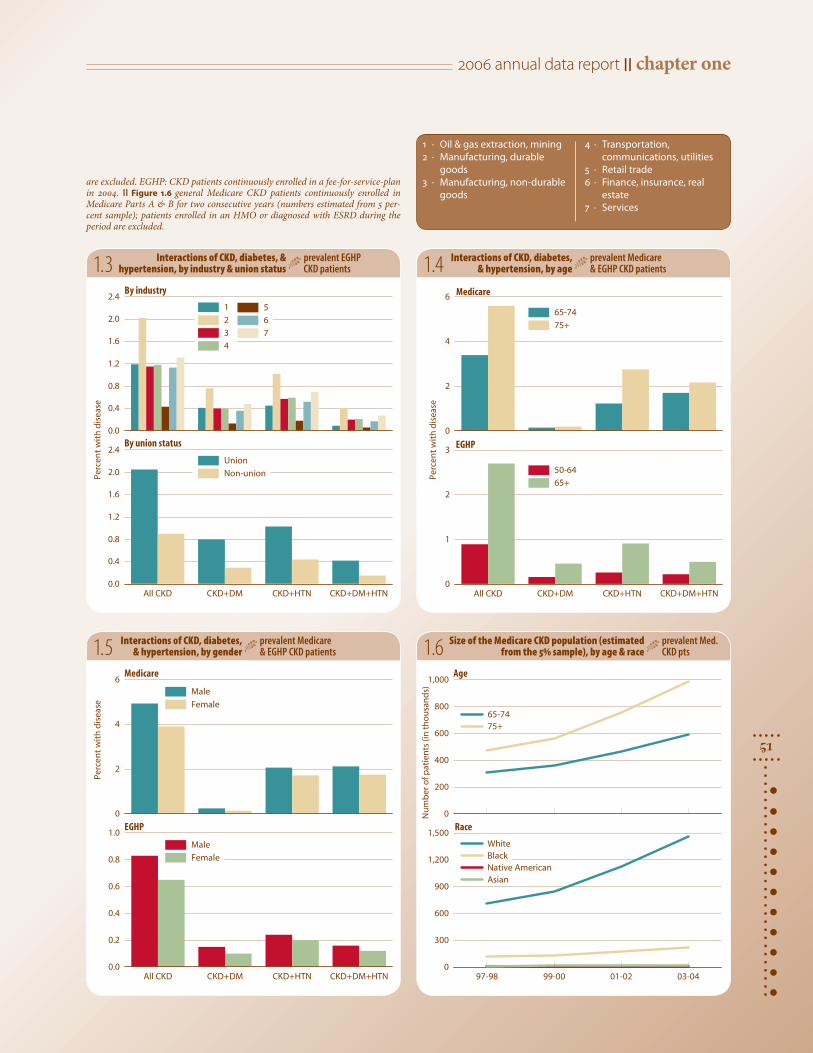
The percent of individuals with CKD is highest in the manufac-turing and durable goods industry, at 2.0, and in the service indus-try, at 1.3 (Figure 1.3). Chronic kidney disease in combination with either diabetes, hypertension, or both is most prominent in service industry workers as well, at 0.76, 1.02, and 0.40 percent, respec-tively. By union status, the percent of union workers with CKD is more than double that found in those who are non-union.
Nearly 6 percent of general Medicare patients age 75 and older carried a diagnosis of CKD in 2004—more than double the pro-portion seen in patients age 65 and older enrolled in a fee-for-ser-
1.2 Geographic variations in the rate of CKD (per 1,000 patients) in the Medicare & EGHP populations, 2003–2004, by HSA & state
prevalent Medicare & EGHP CKD patients
vice employer group health plan (EGHP; Figure 1.4). Older patients are the most likely to have the disease, as are those with CKD and a pre-existing conditions of diabetes, hypertension, or both.
In 2004, slightly more men than women Medicare patients had CKD, at 4.9 and 3.9 percent, respectively, with the highest percent-age occurring in patients with preexisting conditions of diabetes and hypertension, at 2.1 and 1.8 percent (Figure 1.5).
Estimates from the 5 percent Medicare sample show that the number of Medicare patients age 75 and older and with CKD more than doubled between 1997–1998 and 2003–2004, reaching nearly one million patients (Figure 1.6). When compared to patients younger than 75, indications are that the rate of growth in CKD is higher in this older population as well. By race, more than six times as many whites than blacks had a diagnosis of CKD in 2003–2004, and the number of Native Americans and Asians with CKD seems unusually low, at 7,780 and 21,540, repectively. −
|| Figure 1.2 per 1,000 patients, by HSA & state, unadjusted. Medicare: general Medicare patients continuously enrolled in Medicare Parts A & B during 2003 & 2004; patients enrolled in an HMO or diagnosed with ESRD during the period are excluded. EGHP: patients continuously enrolled in a fee-for-service-plan in 2003 & 2004. Excludes patients residing in Puerto Rico & the Territories. || Figure 1.3 EGHP patients with CKD & continuously enrolled in a fee-for-service plan in 2004; includes primary subscribers only, all ages combined. || Figures 1.4–5 Medi-care: general Medicare CKD patients continuously enrolled in Medicare Parts A & B in 2004; patients enrolled in an HMO or diagnosed with ESRD during the period
Medicare <65 EGHP 50–64
Medicare 65+ EGHP 65+
R
2006 annual data report || chapter one
51
esaes id
h tiw t
necre P
0
2
4
6Male
Female
All CKD CKD+DM CKD+HTN CKD+DM+HTN0.0
0.2
0.4
0.6
0.8
1.0Male
Female
Medicare
EGHP
esaesid
htiw t
necreP0
2
4
6
65-74
75+
All CKD CKD+DM CKD+HTN CKD+DM+HTN0
1
2
3
50-64
65+
Medicare
EGHP
es aesid
htiw t
nec reP
0.0
0.4
0.8
1.2
1.6
2.0
2.4
All CKD CKD+DM CKD+HTN CKD+DM+HTN0.0
0.4
0.8
1.2
1.6
2.0
2.4Union
Non-union
By industry
By union status
1
2
3
4
5
6
7
97-98 99-00 01-02 03-040
300
600
900
1,200
1,500White Black Native American Asian
0
200
400
600
800
1,000
65-7475+
Age
Race
)sd
nasu
oht
n i( s tneita
p fo re
bmu
N
1.3 Interactions of CKD, diabetes, & hypertension, by industry & union status
prevalent EGHP CKD patients 1.4 Interactions of CKD, diabetes,
& hypertension, by ageprevalent Medicare & EGHP CKD patients
1.6 Size of the Medicare CKD population (estimated from the 5% sample), by age & race
prevalent Med. CKD pts1.5 Interactions of CKD, diabetes,
& hypertension, by genderprevalent Medicare & EGHP CKD patients
1 · Oil & gas extraction, mining2 · Manufacturing, durable
goods3 · Manufacturing, non-durable
goods
4 · Transportation, communications, utilities
5 · Retail trade6 · Finance, insurance, real
estate7 · Services
are excluded. EGHP: CKD patients continuously enrolled in a fee-for-service-plan in 2004. || Figure 1.6 general Medicare CKD patients continuously enrolled in Medicare Parts A & B for two consecutive years (numbers estimated from 5 per-cent sample); patients enrolled in an HMO or diagnosed with ESRD during the period are excluded.
chronic kidney disease1
52
assessment of populations at risk for CKD
DM HTN DM+HTN
ytiliba
bor
P
0.0
0.1
0.2
0.3Medicare 65+
EGHP 50-64
0.265 + (0.371)0.191 to <0.2650.154 to <0.1910.120 to <0.154below 0.077 (0.061)
n this spread we examine medical assessments received by both Medicare and employer group health plan (EGHP) patients with pre-existing conditions of diabe-
tes and hypertension, both placing them at high risk for CKD.CKD is a precursor to ESRD. It is extremely important that indi-
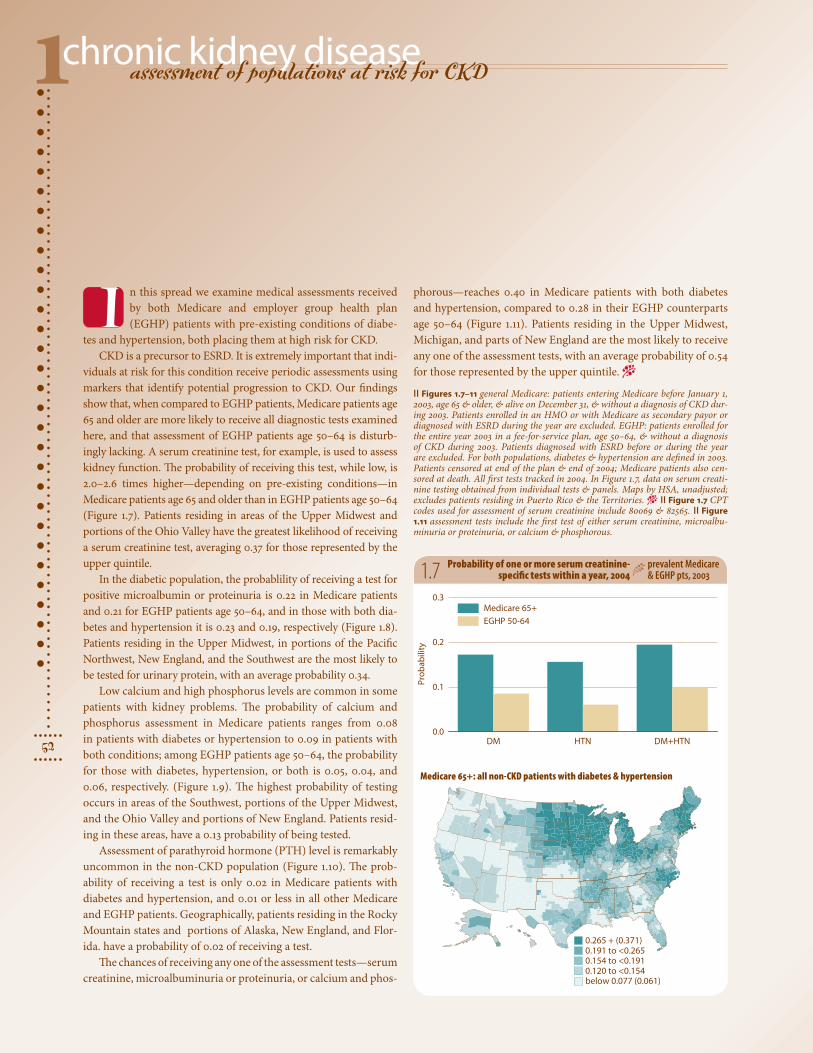
viduals at risk for this condition receive periodic assessments using markers that identify potential progression to CKD. Our findings show that, when compared to EGHP patients, Medicare patients age 65 and older are more likely to receive all diagnostic tests examined here, and that assessment of EGHP patients age 50–64 is disturb-ingly lacking. A serum creatinine test, for example, is used to assess kidney function. The probability of receiving this test, while low, is 2.0–2.6 times higher—depending on pre-existing conditions—in Medicare patients age 65 and older than in EGHP patients age 50–64 (Figure 1.7). Patients residing in areas of the Upper Midwest and portions of the Ohio Valley have the greatest likelihood of receiving a serum creatinine test, averaging 0.37 for those represented by the upper quintile.
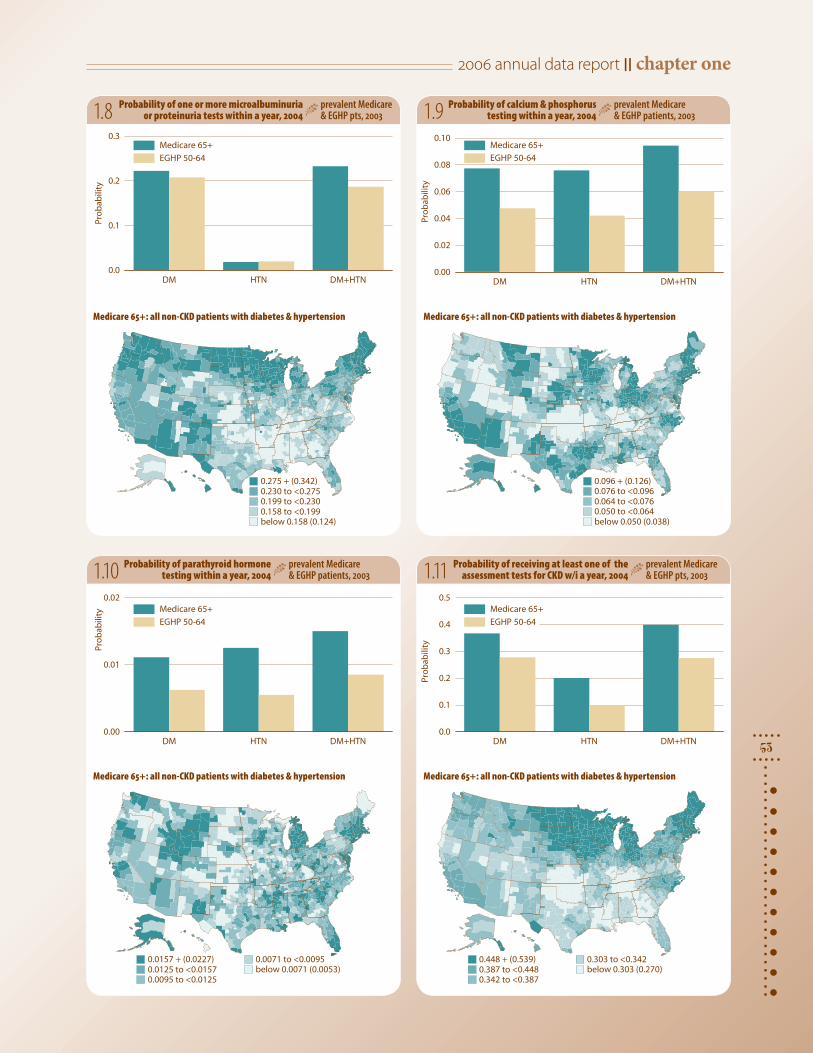
In the diabetic population, the probablility of receiving a test for positive microalbumin or proteinuria is 0.22 in Medicare patients and 0.21 for EGHP patients age 50–64, and in those with both dia-betes and hypertension it is 0.23 and 0.19, respectively (Figure 1.8). Patients residing in the Upper Midwest, in portions of the Pacific Northwest, New England, and the Southwest are the most likely to be tested for urinary protein, with an average probability 0.34.
Low calcium and high phosphorus levels are common in some patients with kidney problems. The probability of calcium and phosphorus assessment in Medicare patients ranges from 0.08 in patients with diabetes or hypertension to 0.09 in patients with both conditions; among EGHP patients age 50–64, the probability for those with diabetes, hypertension, or both is 0.05, 0.04, and 0.06, respectively. (Figure 1.9). The highest probability of testing occurs in areas of the Southwest, portions of the Upper Midwest, and the Ohio Valley and portions of New England. Patients resid-ing in these areas, have a 0.13 probability of being tested.
Assessment of parathyroid hormone (PTH) level is remarkably uncommon in the non-CKD population (Figure 1.10). The prob-ability of receiving a test is only 0.02 in Medicare patients with diabetes and hypertension, and 0.01 or less in all other Medicare and EGHP patients. Geographically, patients residing in the Rocky Mountain states and portions of Alaska, New England, and Flor-ida. have a probability of 0.02 of receiving a test.
The chances of receiving any one of the assessment tests—serum creatinine, microalbuminuria or proteinuria, or calcium and phos-
1.7 Probability of one or more serum creatinine-specific tests within a year, 2004
prevalent Medicare & EGHP pts, 2003
phorous—reaches 0.40 in Medicare patients with both diabetes and hypertension, compared to 0.28 in their EGHP counterparts age 50–64 (Figure 1.11). Patients residing in the Upper Midwest, Michigan, and parts of New England are the most likely to receive any one of the assessment tests, with an average probability of 0.54 for those represented by the upper quintile. −
|| Figures 1.7–11 general Medicare: patients entering Medicare before January 1, 2003, age 65 & older, & alive on December 31, & without a diagnosis of CKD dur-ing 2003. Patients enrolled in an HMO or with Medicare as secondary payor or diagnosed with ESRD during the year are excluded. EGHP: patients enrolled for the entire year 2003 in a fee-for-service plan, age 50–64, & without a diagnosis of CKD during 2003. Patients diagnosed with ESRD before or during the year are excluded. For both populations, diabetes & hypertension are defined in 2003. Patients censored at end of the plan & end of 2004; Medicare patients also cen-sored at death. All first tests tracked in 2004. In Figure 1.7, data on serum creati-nine testing obtained from individual tests & panels. Maps by HSA, unadjusted; excludes patients residing in Puerto Rico & the Territories. − || Figure 1.7 CPT codes used for assessment of serum creatinine include 80069 & 82565. || Figure 1.11 assessment tests include the first test of either serum creatinine, microalbu-minuria or proteinuria, or calcium & phosphorous.
Medicare 65+: all non-CKD patients with diabetes & hypertension
I
2006 annual data report || chapter one
53
DM HTN DM+HTN
ytiliba
borP
0.0
0.1
0.2
0.3Medicare 65+
EGHP 50-64
DM HTN DM+HTN
ytiliba
borP
0.00
0.02
0.04
0.06
0.08
0.10Medicare 65+
EGHP 50-64
DM HTN DM+HTN
ytiliba
borP
0.00
0.01
0.02Medicare 65+
EGHP 50-64
DM HTN DM+HTN
ytiliba
borP
0.0
0.1
0.2
0.3
0.4
0.5Medicare 65+
EGHP 50-64
0.275 + (0.342)0.230 to <0.2750.199 to <0.2300.158 to <0.199below 0.158 (0.124)
0.096 + (0.126)0.076 to <0.0960.064 to <0.0760.050 to <0.064below 0.050 (0.038)
0.0157 + (0.0227) 0.0125 to <0.01570.0095 to <0.0125
0.0071 to <0.0095below 0.0071 (0.0053)
0.448 + (0.539)0.387 to <0.4480.342 to <0.387
0.303 to <0.342below 0.303 (0.270)
1.8 1.9
1.111.10
Probability of one or more microalbuminuria or proteinuria tests within a year, 2004
prevalent Medicare & EGHP pts, 2003
Probability of calcium & phosphorus testing within a year, 2004
prevalent Medicare & EGHP patients, 2003
Probability of parathyroid hormone testing within a year, 2004
prevalent Medicare & EGHP patients, 2003
Probability of receiving at least one of the assessment tests for CKD w/i a year, 2004
prevalent Medicare & EGHP pts, 2003
Medicare 65+: all non-CKD patients with diabetes & hypertension Medicare 65+: all non-CKD patients with diabetes & hypertension
Medicare 65+: all non-CKD patients with diabetes & hypertension Medicare 65+: all non-CKD patients with diabetes & hypertension
chronic kidney disease1
54
assessment of populations at risk for CKD, by industry/union
1
2
3
4
5
6
7
ytiliba
bor P
0.00
0.05
0.10
0.15
DM HTN DM+HTN0.00
0.05
0.10
0.15Union
Non-union
By industry
By union status
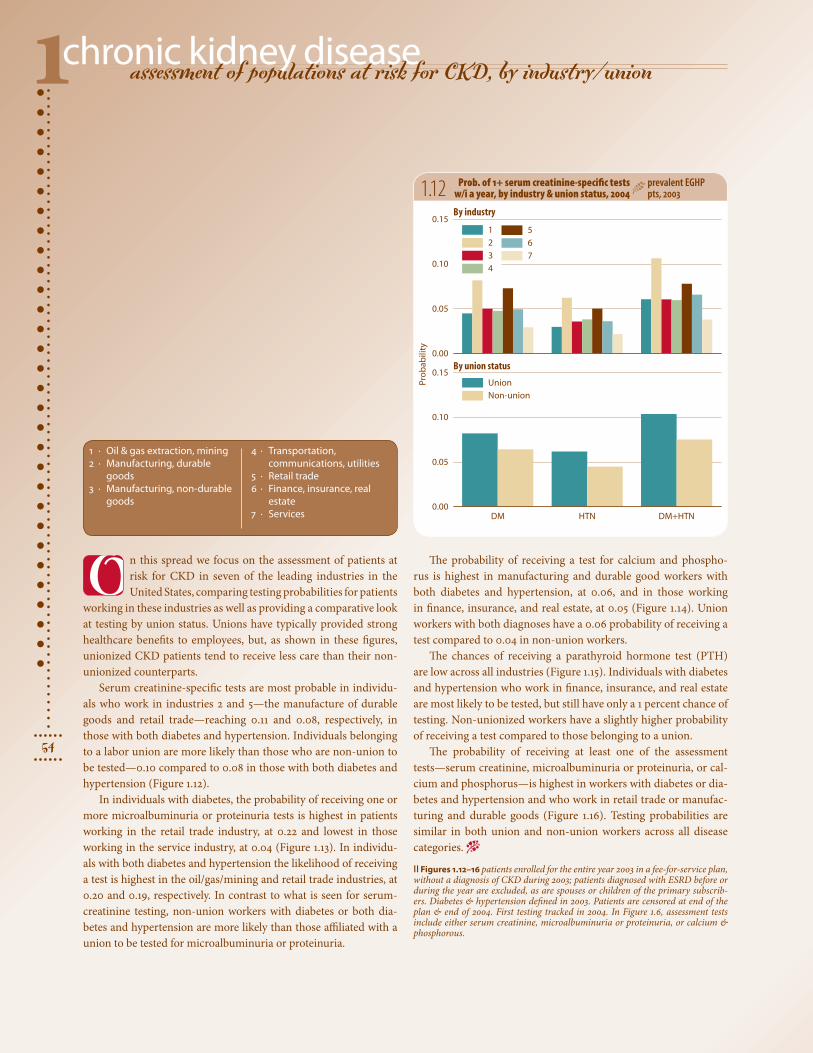
n this spread we focus on the assessment of patients at risk for CKD in seven of the leading industries in the United States, comparing testing probabilities for patients
working in these industries as well as providing a comparative look at testing by union status. Unions have typically provided strong healthcare benefits to employees, but, as shown in these figures, unionized CKD patients tend to receive less care than their non-unionized counterparts.
Serum creatinine-specific tests are most probable in individu-als who work in industries 2 and 5—the manufacture of durable goods and retail trade—reaching 0.11 and 0.08, respectively, in those with both diabetes and hypertension. Individuals belonging to a labor union are more likely than those who are non-union to be tested—0.10 compared to 0.08 in those with both diabetes and hypertension (Figure 1.12).
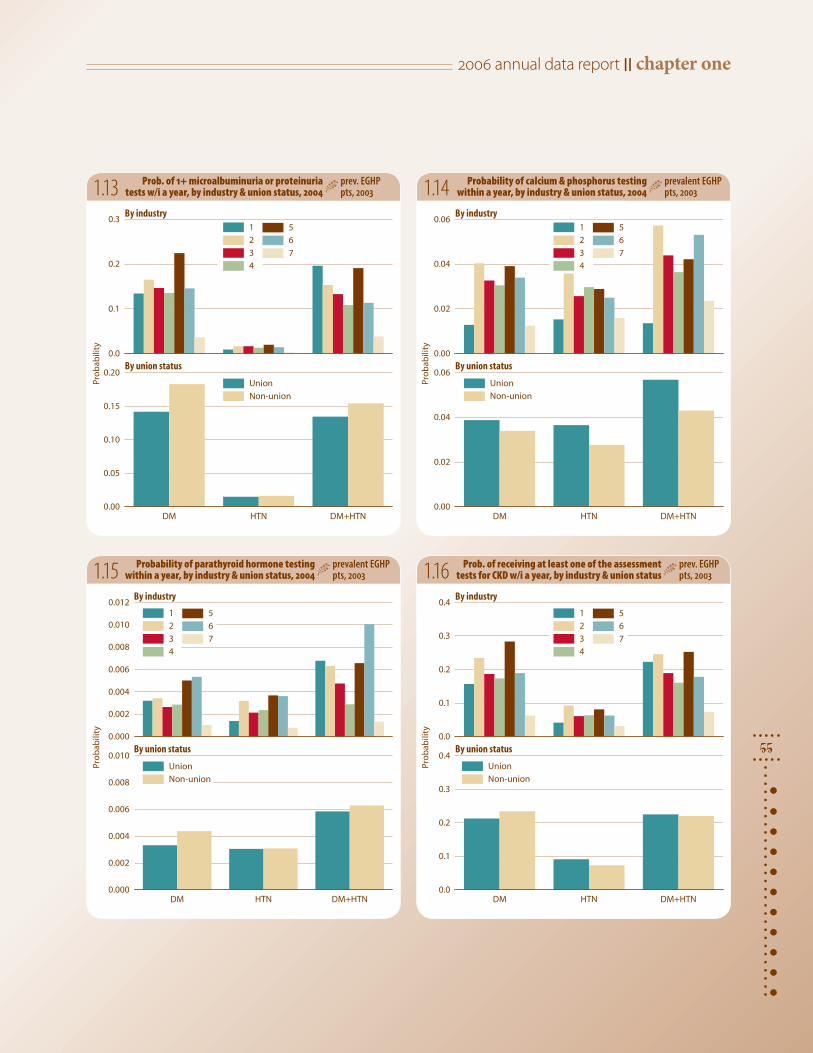
In individuals with diabetes, the probability of receiving one or more microalbuminuria or proteinuria tests is highest in patients working in the retail trade industry, at 0.22 and lowest in those working in the service industry, at 0.04 (Figure 1.13). In individu-als with both diabetes and hypertension the likelihood of receiving a test is highest in the oil/gas/mining and retail trade industries, at 0.20 and 0.19, respectively. In contrast to what is seen for serum-creatinine testing, non-union workers with diabetes or both dia-betes and hypertension are more likely than those affiliated with a union to be tested for microalbuminuria or proteinuria.
1.12 Prob. of 1+ serum creatinine-specific tests w/i a year, by industry & union status, 2004
prevalent EGHP pts, 2003
1 · Oil & gas extraction, mining2 · Manufacturing, durable
goods3 · Manufacturing, non-durable
goods
4 · Transportation, communications, utilities
5 · Retail trade6 · Finance, insurance, real
estate7 · Services
O The probability of receiving a test for calcium and phospho-rus is highest in manufacturing and durable good workers with both diabetes and hypertension, at 0.06, and in those working in finance, insurance, and real estate, at 0.05 (Figure 1.14). Union workers with both diagnoses have a 0.06 probability of receiving a test compared to 0.04 in non-union workers.
The chances of receiving a parathyroid hormone test (PTH) are low across all industries (Figure 1.15). Individuals with diabetes and hypertension who work in finance, insurance, and real estate are most likely to be tested, but still have only a 1 percent chance of testing. Non-unionized workers have a slightly higher probability of receiving a test compared to those belonging to a union.
The probability of receiving at least one of the assessment tests—serum creatinine, microalbuminuria or proteinuria, or cal-cium and phosphorus—is highest in workers with diabetes or dia-betes and hypertension and who work in retail trade or manufac-turing and durable goods (Figure 1.16). Testing probabilities are similar in both union and non-union workers across all disease categories. −
|| Figures 1.12–16 patients enrolled for the entire year 2003 in a fee-for-service plan, without a diagnosis of CKD during 2003; patients diagnosed with ESRD before or during the year are excluded, as are spouses or children of the primary subscrib-ers. Diabetes & hypertension defined in 2003. Patients are censored at end of the plan & end of 2004. First testing tracked in 2004. In Figure 1.6, assessment tests include either serum creatinine, microalbuminuria or proteinuria, or calcium & phosphorous.
2006 annual data report || chapter one
55
1
2
3
4
5
6
7
1
2
3
4
5
6
7
1
2
3
4
5
6
7
1
2
3
4
5
6
7
ytiliba
borP
0.0
0.1
0.2
0.3
DM HTN DM+HTN0.00
0.05
0.10
0.15
0.20Union
Non-union
By industry
By union status
ytiliba
borP
0.00
0.02
0.04
0.06
DM HTN DM+HTN0.00
0.02
0.04
0.06Union
Non-union
By industry
By union status
yti lib a
borP
0.000
0.002
0.004
0.006
0.008
0.010
0.012
DM HTN DM+HTN0.000
0.002
0.004
0.006
0.008
0.010Union
Non-union
By industry
By union status
yti lib a
borP
0.0
0.1
0.2
0.3
0.4
DM HTN DM+HTN0.0
0.1
0.2
0.3
0.4Union
Non-union
By industry
By union status
1.13 1.14
1.161.15
Prob. of 1+ microalbuminuria or proteinuria tests w/i a year, by industry & union status, 2004
prev. EGHP pts, 2003
Probability of calcium & phosphorus testing within a year, by industry & union status, 2004
prevalent EGHP pts, 2003
Probability of parathyroid hormone testing within a year, by industry & union status, 2004
prevalent EGHP pts, 2003
Prob. of receiving at least one of the assessment tests for CKD w/i a year, by industry & union status
prev. EGHPpts, 2003
chronic kidney disease1
56
preventive healthcare monitoring in CKD patients
All CKD CKD+DM CKD+HTN CKD+DM+HTN
All CKD CKD+DM CKD+HTN CKD+DM+HTN
ytiliba
borP
0.0
0.1
0.2
0.3
0.4Medicare 65+
EGHP 50-64
ytiliba
bo rP
0.00
0.05
0.10
0.15Medicare 65+
EGHP 50-64
0.295 + (0.327)0.272 to <0.2950.247 to <0.272
0.219 to <0.247below 0.219 (0.191)
0.107 + (0.129)0.091 to <0.1070.076 to <0.091
0.060 to <0.076below 0.060 (0.049)
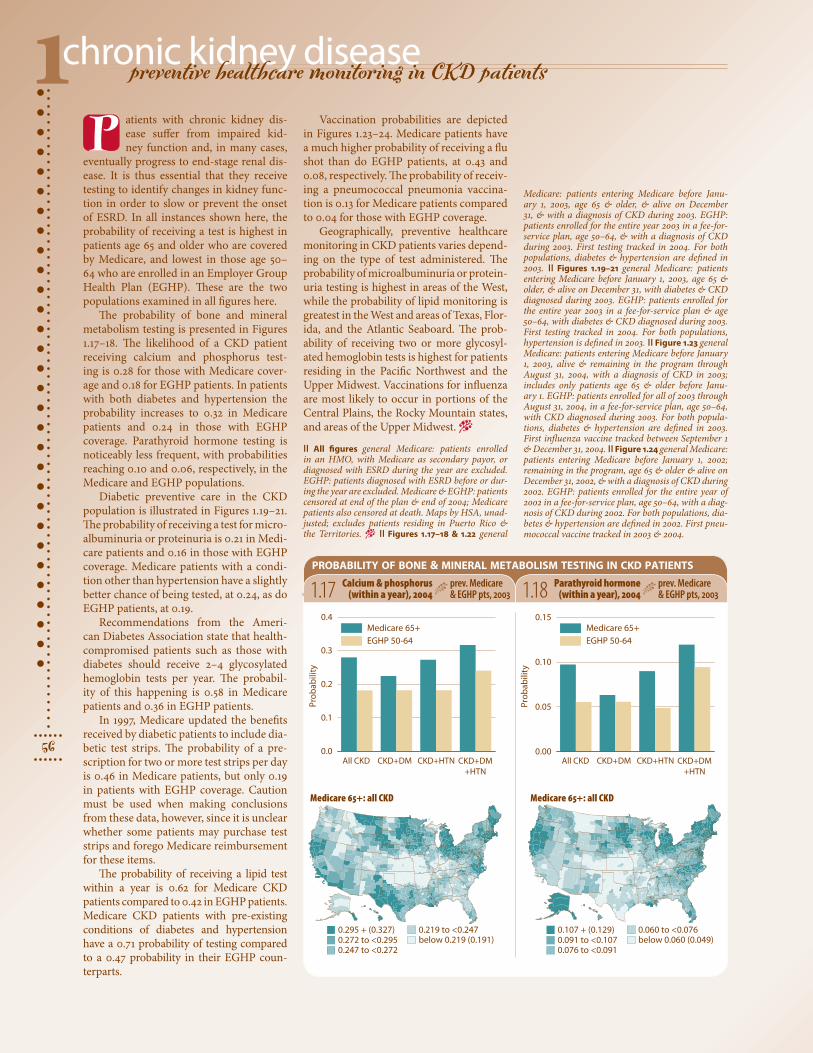
atients with chronic kidney dis-ease suffer from impaired kid-ney function and, in many cases,
eventually progress to end-stage renal dis-ease. It is thus essential that they receive testing to identify changes in kidney func-tion in order to slow or prevent the onset of ESRD. In all instances shown here, the probability of receiving a test is highest in patients age 65 and older who are covered by Medicare, and lowest in those age 50–64 who are enrolled in an Employer Group Health Plan (EGHP). These are the two populations examined in all figures here.
The probability of bone and mineral metabolism testing is presented in Figures 1.17–18. The likelihood of a CKD patient receiving calcium and phosphorus test-ing is 0.28 for those with Medicare cover-age and 0.18 for EGHP patients. In patients with both diabetes and hypertension the probability increases to 0.32 in Medicare patients and 0.24 in those with EGHP coverage. Parathyroid hormone testing is noticeably less frequent, with probabilities reaching 0.10 and 0.06, respectively, in the Medicare and EGHP populations.
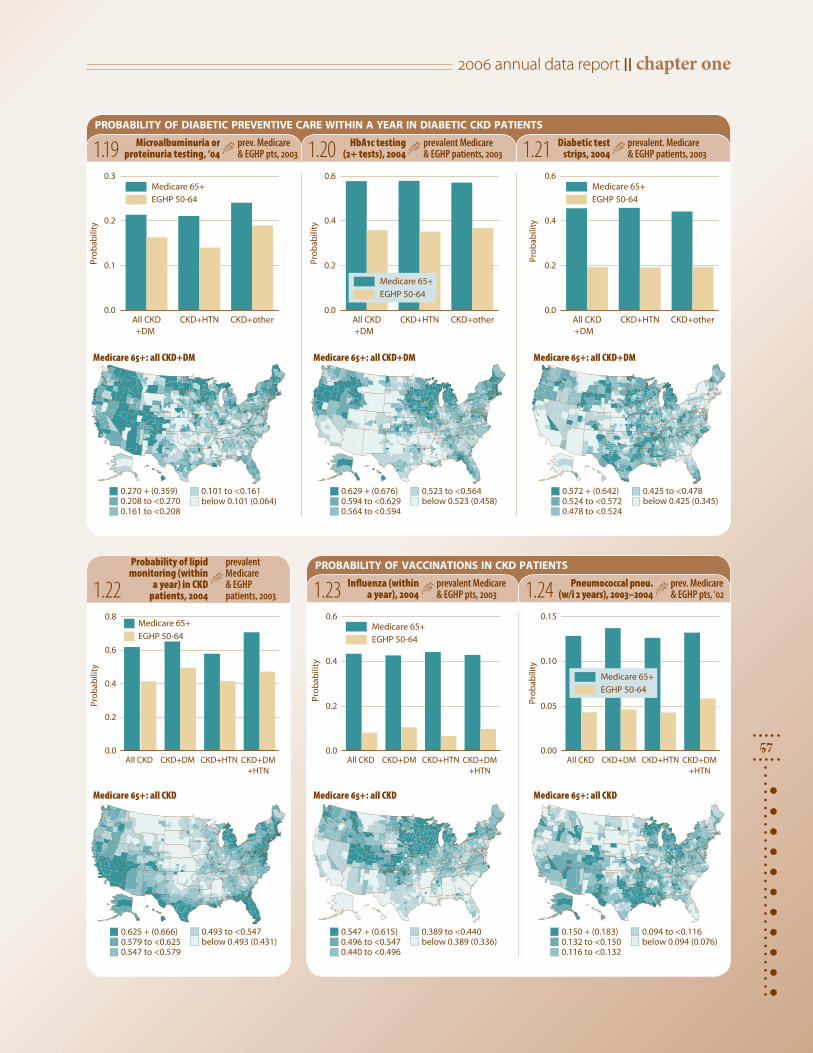
Diabetic preventive care in the CKD population is illustrated in Figures 1.19–21. The probability of receiving a test for micro-albuminuria or proteinuria is 0.21 in Medi-care patients and 0.16 in those with EGHP coverage. Medicare patients with a condi-tion other than hypertension have a slightly better chance of being tested, at 0.24, as do EGHP patients, at 0.19.
Recommendations from the Ameri-can Diabetes Association state that health-compromised patients such as those with diabetes should receive 2–4 glycosylated hemoglobin tests per year. The probabil-ity of this happening is 0.58 in Medicare patients and 0.36 in EGHP patients.
In 1997, Medicare updated the benefits received by diabetic patients to include dia-betic test strips. The probability of a pre-scription for two or more test strips per day is 0.46 in Medicare patients, but only 0.19 in patients with EGHP coverage. Caution must be used when making conclusions from these data, however, since it is unclear whether some patients may purchase test strips and forego Medicare reimbursement for these items.
The probability of receiving a lipid test within a year is 0.62 for Medicare CKD patients compared to 0.42 in EGHP patients. Medicare CKD patients with pre-existing conditions of diabetes and hypertension have a 0.71 probability of testing compared to a 0.47 probability in their EGHP coun-terparts.
probability of bone & mineral metabolism testing in ckd patients
1.17 Calcium & phosphorus (within a year), 2004
prev. Medicare & EGHP pts, 2003
Vaccination probabilities are depicted in Figures 1.23–24. Medicare patients have a much higher probability of receiving a flu shot than do EGHP patients, at 0.43 and 0.08, respectively. The probability of receiv-ing a pneumococcal pneumonia vaccina-tion is 0.13 for Medicare patients compared to 0.04 for those with EGHP coverage.
Geographically, preventive healthcare monitoring in CKD patients varies depend-ing on the type of test administered. The probability of microalbuminuria or protein-uria testing is highest in areas of the West, while the probability of lipid monitoring is greatest in the West and areas of Texas, Flor-ida, and the Atlantic Seaboard. The prob-ability of receiving two or more glycosyl-ated hemoglobin tests is highest for patients residing in the Pacific Northwest and the Upper Midwest. Vaccinations for influenza are most likely to occur in portions of the Central Plains, the Rocky Mountain states, and areas of the Upper Midwest. −
|| All figures general Medicare: patients enrolled in an HMO, with Medicare as secondary payor, or diagnosed with ESRD during the year are excluded. EGHP: patients diagnosed with ESRD before or dur-ing the year are excluded. Medicare & EGHP: patients censored at end of the plan & end of 2004; Medicare patients also censored at death. Maps by HSA, unad-justed; excludes patients residing in Puerto Rico & the Territories. − || Figures 1.17–18 & 1.22 general
Medicare: patients entering Medicare before Janu-ary 1, 2003, age 65 & older, & alive on December 31, & with a diagnosis of CKD during 2003. EGHP: patients enrolled for the entire year 2003 in a fee-for-service plan, age 50–64, & with a diagnosis of CKD during 2003. First testing tracked in 2004. For both populations, diabetes & hypertension are defined in 2003. || Figures 1.19–21 general Medicare: patients entering Medicare before January 1, 2003, age 65 & older, & alive on December 31, with diabetes & CKD diagnosed during 2003. EGHP: patients enrolled for the entire year 2003 in a fee-for-service plan & age 50–64, with diabetes & CKD diagnosed during 2003. First testing tracked in 2004. For both populations, hypertension is defined in 2003. || Figure 1.23 general Medicare: patients entering Medicare before January 1, 2003, alive & remaining in the program through August 31, 2004, with a diagnosis of CKD in 2003; includes only patients age 65 & older before Janu-ary 1. EGHP: patients enrolled for all of 2003 through August 31, 2004, in a fee-for-service plan, age 50–64, with CKD diagnosed during 2003. For both popula-tions, diabetes & hypertension are defined in 2003. First influenza vaccine tracked between September 1 & December 31, 2004. || Figure 1.24 general Medicare: patients entering Medicare before January 1, 2002; remaining in the program, age 65 & older & alive on December 31, 2002, & with a diagnosis of CKD during 2002. EGHP: patients enrolled for the entire year of 2002 in a fee-for-service plan, age 50–64, with a diag-nosis of CKD during 2002. For both populations, dia-betes & hypertension are defined in 2002. First pneu-mococcal vaccine tracked in 2003 & 2004.
1.18 Parathyroid hormone (within a year), 2004
prev. Medicare & EGHP pts, 2003
Medicare 65+: all CKD Medicare 65+: all CKD
P
2006 annual data report || chapter one
57
ytiliba
borP
0.0
0.2
0.4
0.6
0.8Medicare 65+
EGHP 50-64
ytiliba
borP
0.0
0.2
0.4
0.6Medicare 65+
EGHP 50-64
ytiliba
bor P
0.00
0.05
0.10
0.15
All CKD CKD+HTN CKD+other
ytiliba
bor
P
0.0
0.1
0.2
0.3Medicare 65+
+DM +DM +DM
EGHP 50-64
All CKD CKD+HTN CKD+otherytili
bab
orP0.0
0.2
0.4
0.6
All CKD CKD+HTN CKD+other
ytiliba
borP
0.0
0.2
0.4
0.6Medicare 65+
EGHP 50-64
0.270 + (0.359)0.208 to <0.2700.161 to <0.208
0.101 to <0.161below 0.101 (0.064)
0.629 + (0.676)0.594 to <0.6290.564 to <0.594
0.523 to <0.564below 0.523 (0.458)
0.572 + (0.642)0.524 to <0.5720.478 to <0.524
0.425 to <0.478below 0.425 (0.345)
0.625 + (0.666)0.579 to <0.6250.547 to <0.579
0.493 to <0.547below 0.493 (0.431)
0.547 + (0.615)0.496 to <0.5470.440 to <0.496
0.389 to <0.440below 0.389 (0.336)
0.150 + (0.183)0.132 to <0.1500.116 to <0.132
0.094 to <0.116below 0.094 (0.076)
All CKD CKD+DM CKD+HTN CKD+DM+HTN
All CKD CKD+DM CKD+HTN CKD+DM+HTN
All CKD CKD+DM CKD+HTN CKD+DM+HTN
Medicare 65+
EGHP 50-64
Medicare 65+
EGHP 50-64
probability of diabetic preventive care within a year in diabetic ckd patients
probability of vaccinations in ckd patients
1.19 Microalbuminuria or proteinuria testing, ‘04
prev. Medicare & EGHP pts, 2003 1.20 HbA1c testing
(2+ tests), 2004prevalent Medicare & EGHP patients, 2003 1.21 Diabetic test
strips, 2004prevalent. Medicare & EGHP patients, 2003
1.22Probability of lipid
monitoring (within a year) in CKD
patients, 2004
prevalent Medicare & EGHP patients, 2003 1.23 Influenza (within
a year), 2004prevalent Medicare & EGHP pts, 2003 1.24 Pneumococcal pneu.
(w/i 2 years), 2003–2004prev. Medicare & EGHP pts, ‘02
Medicare 65+: all CKD+DM Medicare 65+: all CKD+DM Medicare 65+: all CKD+DM
Medicare 65+: all CKD Medicare 65+: all CKD Medicare 65+: all CKD
chronic kidney disease1
58
preventive healthcare monitoring in CKD patients, by industry/union
y tiliba
bor P
0.0
0.1
0.2
0.3
0.4
0.00
0.05
0.10
0.15
0.20Union
Non-union
By industry
By union status
Por
ba
til ib
y
0.00
0.05
0.10
0.15
0.20
0.00
0.02
0.04
0.06Union
Non-union
By industry
By union status
1
2
3
4
5
6
7
1
2
3
4
5
6
7
All CKD CKD+DM CKD+HTN CKD+DM+HTN
All CKD CKD+DM CKD+HTN CKD+DM+HTN
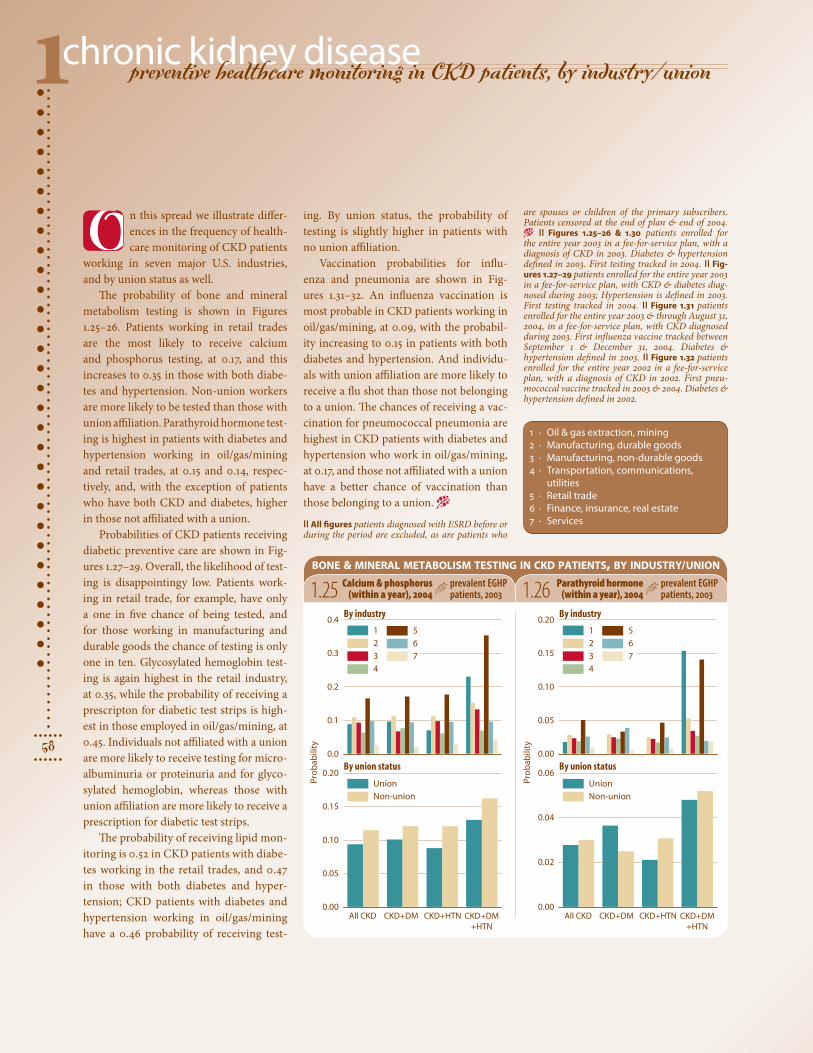
n this spread we illustrate differ-ences in the frequency of health-care monitoring of CKD patients
working in seven major U.S. industries, and by union status as well.
The probability of bone and mineral metabolism testing is shown in Figures 1.25–26. Patients working in retail trades are the most likely to receive calcium and phosphorus testing, at 0.17, and this increases to 0.35 in those with both diabe-tes and hypertension. Non-union workers are more likely to be tested than those with union affiliation. Parathyroid hormone test-ing is highest in patients with diabetes and hypertension working in oil/gas/mining and retail trades, at 0.15 and 0.14, respec-tively, and, with the exception of patients who have both CKD and diabetes, higher in those not affiliated with a union.
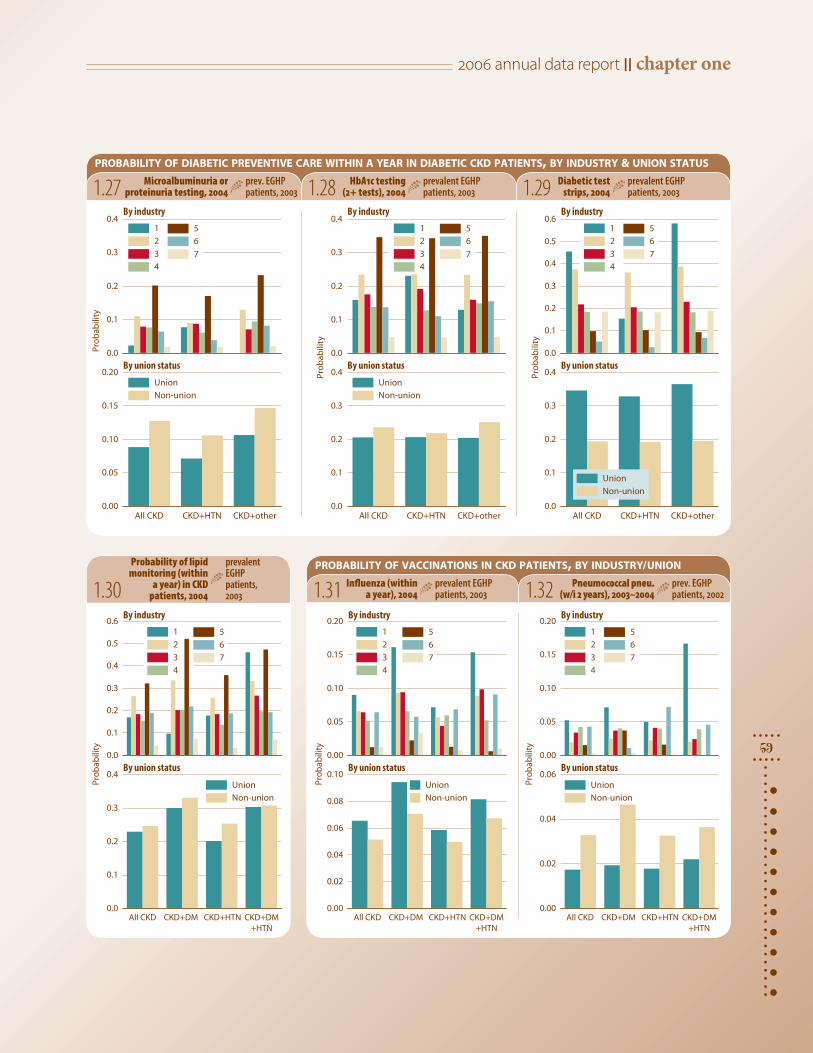
Probabilities of CKD patients receiving diabetic preventive care are shown in Fig-ures 1.27–29. Overall, the likelihood of test-ing is disappointingy low. Patients work-ing in retail trade, for example, have only a one in five chance of being tested, and for those working in manufacturing and durable goods the chance of testing is only one in ten. Glycosylated hemoglobin test-ing is again highest in the retail industry, at 0.35, while the probability of receiving a prescripton for diabetic test strips is high-est in those employed in oil/gas/mining, at 0.45. Individuals not affiliated with a union are more likely to receive testing for micro-albuminuria or proteinuria and for glyco-sylated hemoglobin, whereas those with union affiliation are more likely to receive a prescription for diabetic test strips.
The probability of receiving lipid mon-itoring is 0.52 in CKD patients with diabe-tes working in the retail trades, and 0.47 in those with both diabetes and hyper-tension; CKD patients with diabetes and hypertension working in oil/gas/mining have a 0.46 probability of receiving test-
bone & mineral metabolism testing in ckd patients, by industry/union
1.25 Calcium & phosphorus (within a year), 2004
prevalent EGHP patients, 2003 1.26 Parathyroid hormone
(within a year), 2004prevalent EGHP patients, 2003
ing. By union status, the probability of testing is slightly higher in patients with no union affiliation.
Vaccination probabilities for influ-enza and pneumonia are shown in Fig-ures 1.31–32. An influenza vaccination is most probable in CKD patients working in oil/gas/mining, at 0.09, with the probabil-ity increasing to 0.15 in patients with both diabetes and hypertension. And individu-als with union affiliation are more likely to receive a flu shot than those not belonging to a union. The chances of receiving a vac-cination for pneumococcal pneumonia are highest in CKD patients with diabetes and hypertension who work in oil/gas/mining, at 0.17, and those not affiliated with a union have a better chance of vaccination than those belonging to a union. −
|| All figures patients diagnosed with ESRD before or during the period are excluded, as are patients who
O
1 · Oil & gas extraction, mining2 · Manufacturing, durable goods3 · Manufacturing, non-durable goods4 · Transportation, communications,
utilities5 · Retail trade6 · Finance, insurance, real estate7 · Services
are spouses or children of the primary subscribers. Patients censored at the end of plan & end of 2004. − || Figures 1.25–26 & 1.30 patients enrolled for the entire year 2003 in a fee-for-service plan, with a diagnosis of CKD in 2003. Diabetes & hypertension defined in 2003. First testing tracked in 2004. || Fig-ures 1.27–29 patients enrolled for the entire year 2003 in a fee-for-service plan, with CKD & diabetes diag-nosed during 2003; Hypertension is defined in 2003. First testing tracked in 2004. || Figure 1.31 patients enrolled for the entire year 2003 & through August 31, 2004, in a fee-for-service plan, with CKD diagnosed during 2003. First influenza vaccine tracked between September 1 & December 31, 2004. Diabetes & hypertension defined in 2003. || Figure 1.32 patients enrolled for the entire year 2002 in a fee-for-service plan, with a diagnosis of CKD in 2002. First pneu-mococcal vaccine tracked in 2003 & 2004. Diabetes & hypertension defined in 2002.
2006 annual data report || chapter one
59ytil ib a
bo rP
0.0
0.1
0.2
0.3
0.4
0.5
0.6
0.0
0.1
0.2
0.3
0.4
By industry
By union status
ytiliba
borP
0.00
0.05
0.10
0.15
0.20
0.00
0.02
0.04
0.06
0.08
0.10
By industry
By union status
y til iba
bor P
0.00
0.05
0.10
0.15
0.20
0.00
0.02
0.04
0.06Union
Non-union
Union
Non-union
Union
Non-union
By industry
By union status
ytiliba
borP
0.0
0.1
0.2
0.3
0.4
All CKD CKD+HTN CKD+other0.0
0.1
0.2
0.3
0.4
By industry
By union status
ytiliba
bor
P
0.0
0.1
0.2
0.3
0.4
0.5
0.6
All CKD CKD+HTN CKD+other0.0
0.1
0.2
0.3
0.4
By industry
By union status
ytil ib a
borP 0.0
0.1
0.2
0.3
0.4
All CKD CKD+HTN CKD+other0.00
0.05
0.10
0.15
0.20Union
Non-union
Union
Non-union
By industry
By union status
1
2
3
4
5
6
7
1
2
3
4
5
6
7
1
2
3
4
5
6
7
1
2
3
4
5
6
7
1
2
3
4
5
6
7
1
2
3
4
5
6
7
All CKD CKD+DM CKD+HTN CKD+DM+HTN
All CKD CKD+DM CKD+HTN CKD+DM+HTN
All CKD CKD+DM CKD+HTN CKD+DM+HTN
Union
Non-union
probability of diabetic preventive care within a year in diabetic ckd patients, by industry & union status
1.30probability of vaccinations in ckd patients, by industry/union
1.27 Microalbuminuria or proteinuria testing, 2004
prev. EGHP patients, 2003 1.28 HbA1c testing
(2+ tests), 2004prevalent EGHP patients, 2003 1.29 Diabetic test
strips, 2004prevalent EGHP patients, 2003
1.31 Influenza (within a year), 2004
prevalent EGHP patients, 2003 1.32 Pneumococcal pneu.
(w/i 2 years), 2003–2004prev. EGHP patients, 2002
Probability of lipid monitoring (within
a year) in CKD patients, 2004
prevalent EGHP patients, 2003
chronic kidney disease1
60
adjusted hospitalization rates in CKD & non-CKD patients
94 96 98 00 02 040
200
400
600
800
All DMHTNDM+HTN
00 02 04
0
600
1,200
1,800CKD: Medicare 65+ EGHP 50-64
Non-CKD
k sir ta srae y tn eit a
p 000, 1 r ep et aR
EGHP 65+
00 02 04
118 + (138)105 to <118
95 to <105
85 to <95below 85 (76)
40.0 + (44.3)36.9 to <40.033.8 to <36.9
30.7 to <33.8below 30.7 (27.9)
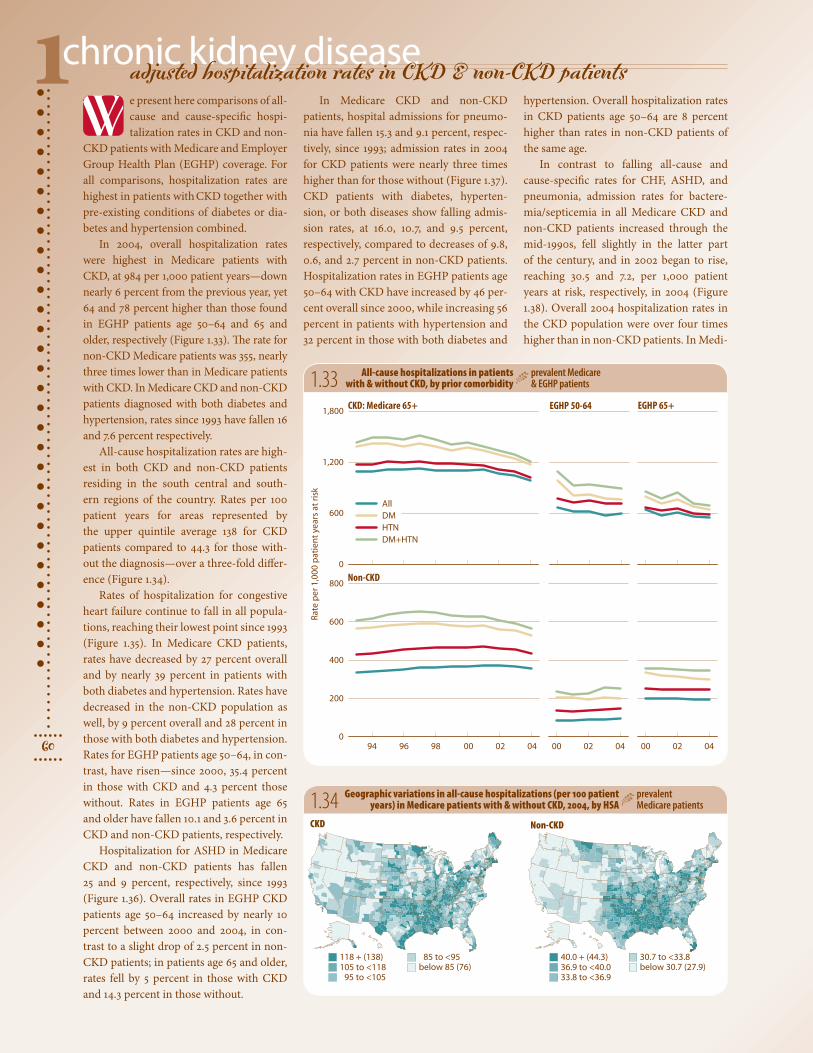
e present here comparisons of all-cause and cause-specific hospi-talization rates in CKD and non-
CKD patients with Medicare and Employer Group Health Plan (EGHP) coverage. For all comparisons, hospitalization rates are highest in patients with CKD together with pre-existing conditions of diabetes or dia-betes and hypertension combined.
In 2004, overall hospitalization rates were highest in Medicare patients with CKD, at 984 per 1,000 patient years—down nearly 6 percent from the previous year, yet 64 and 78 percent higher than those found in EGHP patients age 50–64 and 65 and older, respectively (Figure 1.33). The rate for non-CKD Medicare patients was 355, nearly three times lower than in Medicare patients with CKD. In Medicare CKD and non-CKD patients diagnosed with both diabetes and hypertension, rates since 1993 have fallen 16 and 7.6 percent respectively.
All-cause hospitalization rates are high-est in both CKD and non-CKD patients residing in the south central and south-ern regions of the country. Rates per 100 patient years for areas represented by the upper quintile average 138 for CKD patients compared to 44.3 for those with-out the diagnosis—over a three-fold differ-ence (Figure 1.34).
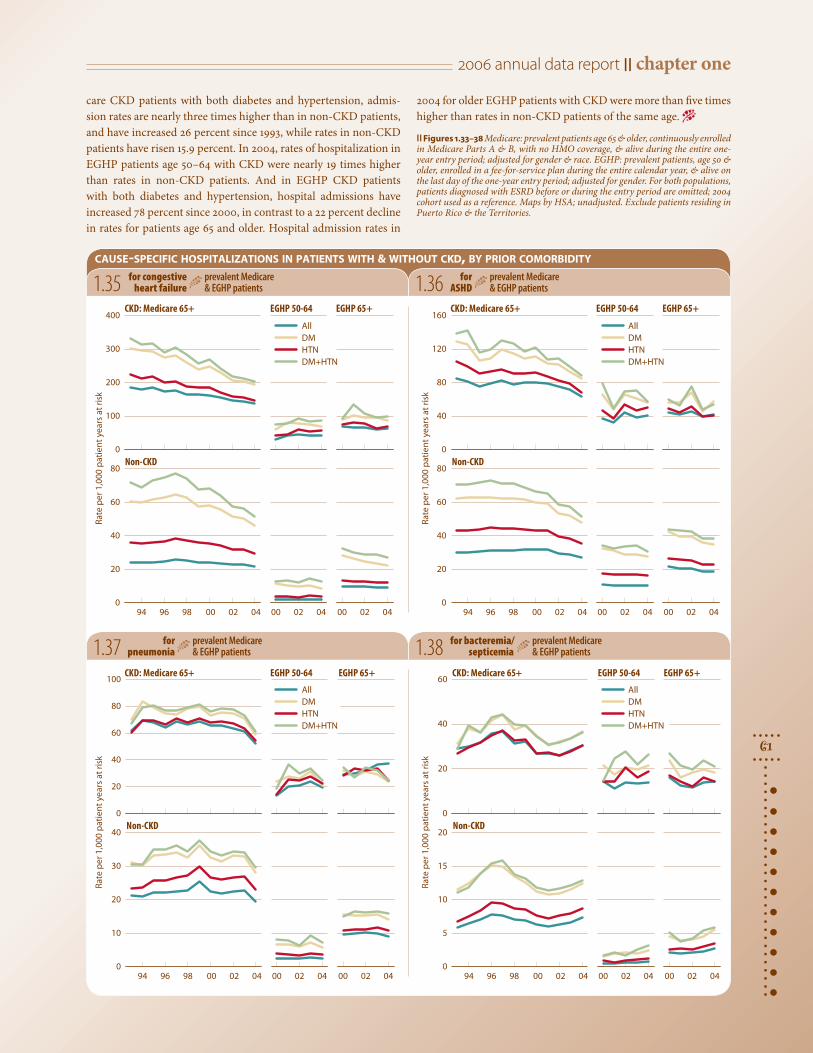
Rates of hospitalization for congestive heart failure continue to fall in all popula-tions, reaching their lowest point since 1993 (Figure 1.35). In Medicare CKD patients, rates have decreased by 27 percent overall and by nearly 39 percent in patients with both diabetes and hypertension. Rates have decreased in the non-CKD population as well, by 9 percent overall and 28 percent in those with both diabetes and hypertension. Rates for EGHP patients age 50–64, in con-trast, have risen—since 2000, 35.4 percent in those with CKD and 4.3 percent those without. Rates in EGHP patients age 65 and older have fallen 10.1 and 3.6 percent in CKD and non-CKD patients, respectively.
Hospitalization for ASHD in Medicare CKD and non-CKD patients has fallen 25 and 9 percent, respectively, since 1993 (Figure 1.36). Overall rates in EGHP CKD patients age 50–64 increased by nearly 10 percent between 2000 and 2004, in con-trast to a slight drop of 2.5 percent in non-CKD patients; in patients age 65 and older, rates fell by 5 percent in those with CKD and 14.3 percent in those without.
1.33 All-cause hospitalizations in patients with & without CKD, by prior comorbidity
prevalent Medicare & EGHP patients
1.34 Geographic variations in all-cause hospitalizations (per 100 patient years) in Medicare patients with & without CKD, 2004, by HSA
prevalent Medicare patients
In Medicare CKD and non-CKD patients, hospital admissions for pneumo-nia have fallen 15.3 and 9.1 percent, respec-tively, since 1993; admission rates in 2004 for CKD patients were nearly three times higher than for those without (Figure 1.37). CKD patients with diabetes, hyperten-sion, or both diseases show falling admis-sion rates, at 16.0, 10.7, and 9.5 percent, respectively, compared to decreases of 9.8, 0.6, and 2.7 percent in non-CKD patients. Hospitalization rates in EGHP patients age 50–64 with CKD have increased by 46 per-cent overall since 2000, while increasing 56 percent in patients with hypertension and 32 percent in those with both diabetes and
hypertension. Overall hospitalization rates in CKD patients age 50–64 are 8 percent higher than rates in non-CKD patients of the same age.
In contrast to falling all-cause and cause-specific rates for CHF, ASHD, and pneumonia, admission rates for bactere-mia/septicemia in all Medicare CKD and non-CKD patients increased through the mid-1990s, fell slightly in the latter part of the century, and in 2002 began to rise, reaching 30.5 and 7.2, per 1,000 patient years at risk, respectively, in 2004 (Figure 1.38). Overall 2004 hospitalization rates in the CKD population were over four times higher than in non-CKD patients. In Medi-
CKD Non-CKD
W
2006 annual data report || chapter one
61
94 96 98 00 02 040
20
40
60
80
00 02 04
0
100
200
300
400CKD: Medicare 65+ EGHP 50-64 CKD: Medicare 65+ EGHP 50-64
CKD: Medicare 65+ EGHP 50-64 CKD: Medicare 65+ EGHP 50-64
Non-CKD
ksi r ta sra ey tne ita
p 000,1 rep etaR
EGHP 65+
00 02 04 94 96 98 00 02 040
20
40
60
80
00 02 04
0
40
80
120
160
Non-CKD
ksir ta sraey tneita
p 000,1 rep etaR
EGHP 65+
00 02 04
94 96 98 00 02 040
10
20
30
40
00 02 04
0
20
40
60
80
100
Non-CKD
ksir ta srae y tn eita
p 000,1 rep et aR
EGHP 65+
00 02 04 94 96 98 00 02 040
5
10
15
20
00 02 04
0
20
40
60
Non-CKD
ksir ta srae y tn eita
p 000,1 rep et aR
EGHP 65+
00 02 04
All DMHTNDM+HTN
All DMHTNDM+HTN
All DMHTNDM+HTN
All DMHTNDM+HTN
1.35 for congestive heart failure
prevalent Medicare & EGHP patients
cause-specific hospitalizations in patients with & without ckd, by prior comorbidity
1.36 for ASHD
prevalent Medicare & EGHP patients
1.37 forpneumonia
prevalent Medicare & EGHP patients 1.38 for bacteremia/
septicemiaprevalent Medicare & EGHP patients
care CKD patients with both diabetes and hypertension, admis-sion rates are nearly three times higher than in non-CKD patients, and have increased 26 percent since 1993, while rates in non-CKD patients have risen 15.9 percent. In 2004, rates of hospitalization in EGHP patients age 50–64 with CKD were nearly 19 times higher than rates in non-CKD patients. And in EGHP CKD patients with both diabetes and hypertension, hospital admissions have increased 78 percent since 2000, in contrast to a 22 percent decline in rates for patients age 65 and older. Hospital admission rates in
2004 for older EGHP patients with CKD were more than five times higher than rates in non-CKD patients of the same age. −
|| Figures 1.33–38 Medicare: prevalent patients age 65 & older, continuously enrolled in Medicare Parts A & B, with no HMO coverage, & alive during the entire one-year entry period; adjusted for gender & race. EGHP: prevalent patients, age 50 & older, enrolled in a fee-for-service plan during the entire calendar year, & alive on the last day of the one-year entry period; adjusted for gender. For both populations, patients diagnosed with ESRD before or during the entry period are omitted; 2004 cohort used as a reference. Maps by HSA; unadjusted. Exclude patients residing in Puerto Rico & the Territories.
chronic kidney disease1
62
acute kidney failure: hospitalization & outcomes
0.00
0.01
0.02
0.03
All Diabetes HTN DM+HTN0.00
0.03
0.06
0.09
ytiliba
bo r
p e v it alu
mu
C
0.00
0.04
0.08
0.12
0.0
0.1
0.2
0.3
0.4 All patients: with prior CKD
Acute kidney failure as the 1° admitting diag.
Acute kidney failure as the 2° admitting diag.
0.0
0.1
0.2
0.3
All Diabetes HTN DM + HTN
19932002
1-ye
ar2-
year
3-ye
ar1-
year
2-ye
ar3-
year
1-ye
ar2-
year
3-ye
ar
0.00
0.03
0.06
0.09
0.12 Without prior CKD
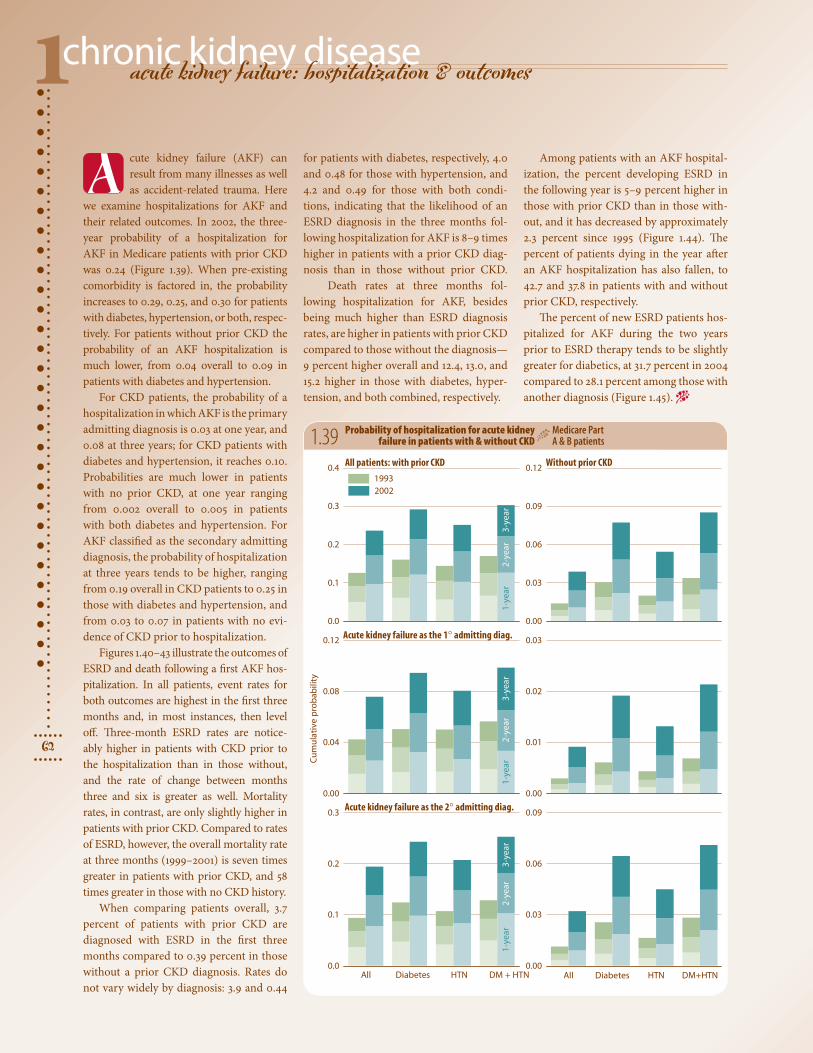
cute kidney failure (AKF) can result from many illnesses as well as accident-related trauma. Here
we examine hospitalizations for AKF and their related outcomes. In 2002, the three-year probability of a hospitalization for AKF in Medicare patients with prior CKD was 0.24 (Figure 1.39). When pre-existing comorbidity is factored in, the probability increases to 0.29, 0.25, and 0.30 for patients with diabetes, hypertension, or both, respec-tively. For patients without prior CKD the probability of an AKF hospitalization is much lower, from 0.04 overall to 0.09 in patients with diabetes and hypertension.
For CKD patients, the probability of a hospitalization in which AKF is the primary admitting diagnosis is 0.03 at one year, and 0.08 at three years; for CKD patients with diabetes and hypertension, it reaches 0.10. Probabilities are much lower in patients with no prior CKD, at one year ranging from 0.002 overall to 0.005 in patients with both diabetes and hypertension. For AKF classified as the secondary admitting diagnosis, the probability of hospitalization at three years tends to be higher, ranging from 0.19 overall in CKD patients to 0.25 in those with diabetes and hypertension, and from 0.03 to 0.07 in patients with no evi-dence of CKD prior to hospitalization.
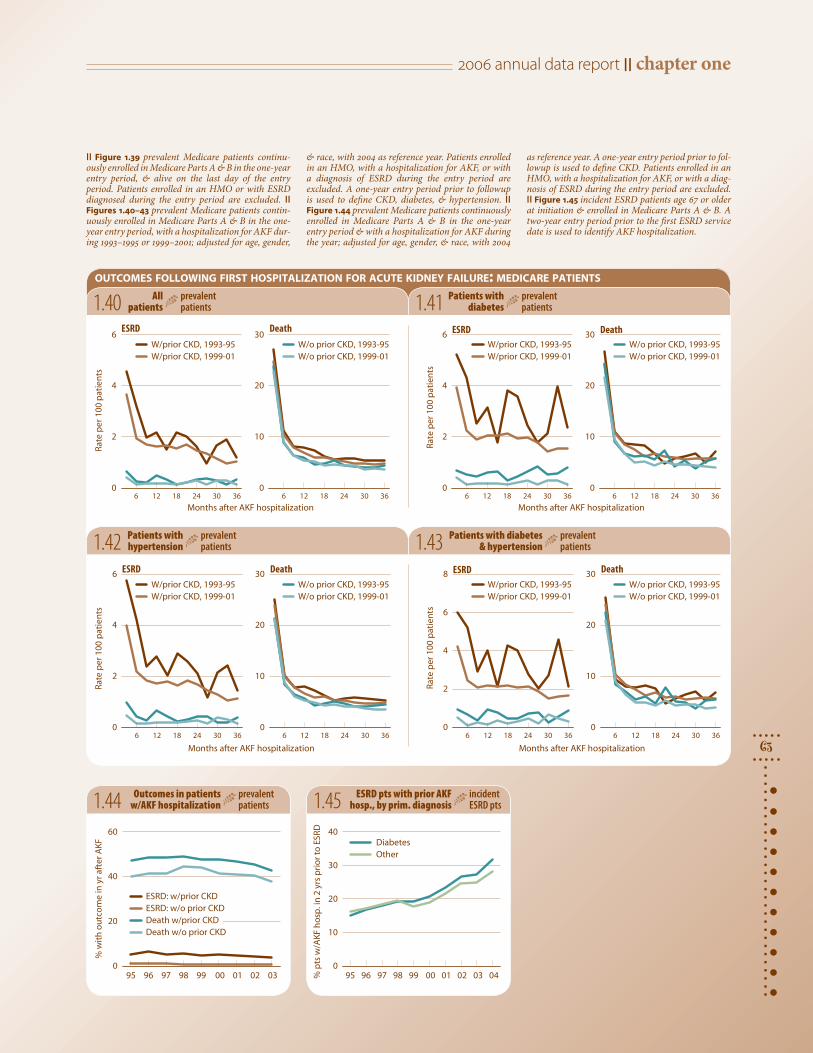
Figures 1.40–43 illustrate the outcomes of ESRD and death following a first AKF hos-pitalization. In all patients, event rates for both outcomes are highest in the first three months and, in most instances, then level off. Three-month ESRD rates are notice-ably higher in patients with CKD prior to the hospitalization than in those without, and the rate of change between months three and six is greater as well. Mortality rates, in contrast, are only slightly higher in patients with prior CKD. Compared to rates of ESRD, however, the overall mortality rate at three months (1999–2001) is seven times greater in patients with prior CKD, and 58 times greater in those with no CKD history.
When comparing patients overall, 3.7 percent of patients with prior CKD are diagnosed with ESRD in the first three months compared to 0.39 percent in those without a prior CKD diagnosis. Rates do not vary widely by diagnosis: 3.9 and 0.44
1.39 Probability of hospitalization for acute kidney failure in patients with & without CKD
Medicare Part A & B patients
for patients with diabetes, respectively, 4.0 and 0.48 for those with hypertension, and 4.2 and 0.49 for those with both condi-tions, indicating that the likelihood of an ESRD diagnosis in the three months fol-lowing hospitalization for AKF is 8–9 times higher in patients with a prior CKD diag-nosis than in those without prior CKD.
Death rates at three months fol-lowing hospitalization for AKF, besides being much higher than ESRD diagnosis rates, are higher in patients with prior CKD compared to those without the diagnosis—9 percent higher overall and 12.4, 13.0, and 15.2 higher in those with diabetes, hyper-tension, and both combined, respectively.
Among patients with an AKF hospital-ization, the percent developing ESRD in the following year is 5–9 percent higher in those with prior CKD than in those with-out, and it has decreased by approximately 2.3 percent since 1995 (Figure 1.44). The percent of patients dying in the year after an AKF hospitalization has also fallen, to 42.7 and 37.8 in patients with and without prior CKD, respectively.
The percent of new ESRD patients hos-pitalized for AKF during the two years prior to ESRD therapy tends to be slightly greater for diabetics, at 31.7 percent in 2004 compared to 28.1 percent among those with another diagnosis (Figure 1.45). −
A
2006 annual data report || chapter one
63
Months after AKF hospitalization6 12 18 24 30 36
0
2
4
6
6 12 18 24 30 360
10
20
30ESRD
stn eita
p 001 rep et aR
Death
6 12 18 24 30 360
10
20
30
Months after AKF hospitalization6 12 18 24 30 36
0
2
4
6 ESRD
stne ita
p 001 rep et aR
DeathW/prior CKD, 1993-95 W/prior CKD, 1999-01
W/o prior CKD, 1993-95W/o prior CKD, 1999-01
W/prior CKD, 1993-95 W/prior CKD, 1999-01
W/o prior CKD, 1993-95W/o prior CKD, 1999-01
6 12 18 24 30 360
10
20
30
Months after AKF hospitalization
6 12 18 24 30 360
2
4
6 ESRD
stn eita
p 001 rep et aR
Death
W/prior CKD, 1993-95 W/prior CKD, 1999-01
W/o prior CKD, 1993-95W/o prior CKD, 1999-01
Months after AKF hospitalization
stneita
p 001 rep etaR
6 12 18 24 30 360
2
4
6
8 ESRDW/prior CKD, 1993-95W/prior CKD, 1999-01
6 12 18 24 30 360
10
20
30 Death
W/o prior CKD, 1993-95W/o prior CKD, 1999-01
95 96 97 98 99 00 01 02 030
20
40
60
ESRD: w/prior CKD ESRD: w/o prior CKD Death w/prior CKD Death w/o prior CKD
FK
A retfa ry ni e
mo ct
uo
ht iw
%
95 96 97 98 99 00 01 02 03 040
10
20
30
40DiabetesOther
DRSE ot r
oirp sr y 2
ni .pso
h FKA/
w stp
%1.40 All
patientsprevalent patients
outcomes following first hospitalization for acute kidney failure: medicare patients
1.41 Patients with diabetes
prevalent patients
1.42 Patients with hypertension
prevalent patients 1.43 Patients with diabetes
& hypertensionprevalent patients
1.44 Outcomes in patients w/AKF hospitalization
prevalent patients 1.45 ESRD pts with prior AKF
hosp., by prim. diagnosisincident ESRD pts
|| Figure 1.39 prevalent Medicare patients continu-ously enrolled in Medicare Parts A & B in the one-year entry period, & alive on the last day of the entry period. Patients enrolled in an HMO or with ESRD diagnosed during the entry period are excluded. || Figures 1.40–43 prevalent Medicare patients contin-uously enrolled in Medicare Parts A & B in the one-year entry period, with a hospitalization for AKF dur-ing 1993–1995 or 1999–2001; adjusted for age, gender,
& race, with 2004 as reference year. Patients enrolled in an HMO, with a hospitalization for AKF, or with a diagnosis of ESRD during the entry period are excluded. A one-year entry period prior to followup is used to define CKD, diabetes, & hypertension. || Figure 1.44 prevalent Medicare patients continuously enrolled in Medicare Parts A & B in the one-year entry period & with a hospitalization for AKF during the year; adjusted for age, gender, & race, with 2004
as reference year. A one-year entry period prior to fol-lowup is used to define CKD. Patients enrolled in an HMO, with a hospitalization for AKF, or with a diag-nosis of ESRD during the entry period are excluded. || Figure 1.45 incident ESRD patients age 67 or older at initiation & enrolled in Medicare Parts A & B. A two-year entry period prior to the first ESRD service date is used to identify AKF hospitalization.
chronic kidney disease1
64
adherence to prescription drug therapy in CKD patients
Months6 12 18 24 12+ mo.
)%( RP
M
45
55
65
75
85
<65
65+
<65
65+
Months6 12 18 24 12+ mo.
)%( RP
M
45
55
65
75
85
Months6 12 18 24 12+ mo.
)%(
RPM
45
55
65
75
85Dihydropyridine Non-dihydropyridine
6 12 18 24 12+ mo.
<65
65+
<65
65+
Months6 12 18 24 12+ mo.
)%(
RPM
45
55
65
75
85Loop diuretic Thiazide-like diuretic
6 12 18 24 12+ mo.
he process of medication adher-ence includes a healthcare pro-vider issuing a prescription, the
patient taking it to a pharmacy and receiv-ing the medication, and, finally, consump-tion of the medication. To assess compli-ance or adherence there must be evidence that a medication was obtained and taken. A patient with insurance coverage for medications will have a prescription claim submitted by the pharmacy to the health-care plan. Pharmacy prescription and refill records, found in claims data, can thus pro-vide otherwise unobtainable information on patterns of drug prescribing and use.
CKD patients have multiple risk factors and comorbidities that make them vulner-able to progression of kidney disease, car-diovascular disease, and death. While there have been numerous studies in the general population assessing the relationship of medication adherence to various outcome measures, none have focused on CKD patients. Medications are often the most cost-effective interventions for preventing, treating, or managing a medical condition.
Here and in Chapters Three and Five we evaluate prescription claims data—from the Medstat MarketScan Research Data-base, with data on EGHP patients—for sev-eral key medication classes, using a widely adopted adherence measure called the medi-cation possession ratio (MPR). As described by Sikka et al., “The MPR is often defined as the sum of the days’ supply of medica-tion divided by the number of days between the first fill and the last refill plus the days’ supply of the last refill. This calculation usu-ally results in a ratio less than 1.0 if there are lapses in prescription refilling.” Only one type of adherence measure, the MPR pro-vides insight into medication availability,
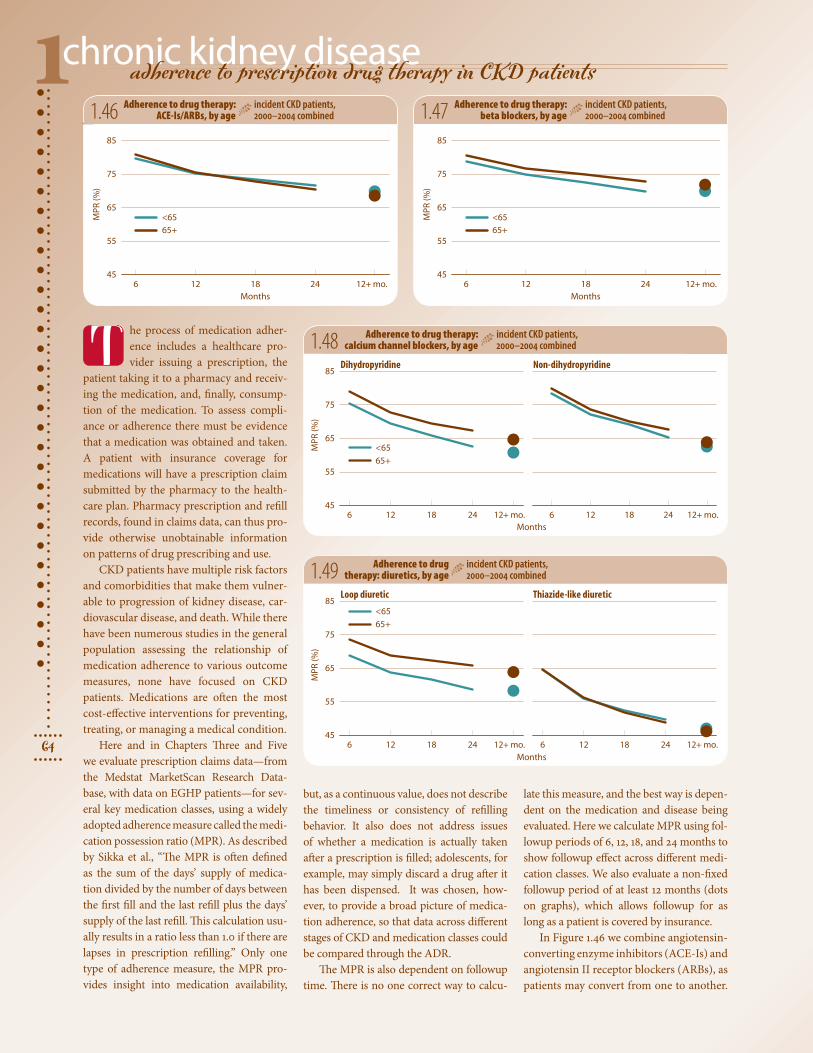
1.46 Adherence to drug therapy: ACE-Is/ARBs, by age
incident CKD patients, 2000–2004 combined 1.47
1.48
1.49
Adherence to drug therapy: beta blockers, by age
incident CKD patients, 2000–2004 combined
Adherence to drug therapy: calcium channel blockers, by age
incident CKD patients, 2000–2004 combined
Adherence to drug therapy: diuretics, by age
incident CKD patients, 2000–2004 combined
but, as a continuous value, does not describe the timeliness or consistency of refilling behavior. It also does not address issues of whether a medication is actually taken after a prescription is filled; adolescents, for example, may simply discard a drug after it has been dispensed. It was chosen, how-ever, to provide a broad picture of medica-tion adherence, so that data across different stages of CKD and medication classes could be compared through the ADR.
The MPR is also dependent on followup time. There is no one correct way to calcu-
late this measure, and the best way is depen-dent on the medication and disease being evaluated. Here we calculate MPR using fol-lowup periods of 6, 12, 18, and 24 months to show followup effect across different medi-cation classes. We also evaluate a non-fixed followup period of at least 12 months (dots on graphs), which allows followup for as long as a patient is covered by insurance.
In Figure 1.46 we combine angiotensin-converting enzyme inhibitors (ACE-Is) and angiotensin II receptor blockers (ARBs), as patients may convert from one to another.
T
2006 annual data report || chapter one
65
Months6 12 18 24 + 12 mo.
)%( RP
M45
55
65
75
85Statins Non-statins
6 12 18 24 12+ mo.
<65
65+
Months6 12 18 24 12+ mo.
)%( RP
M
45
55
65
75
85Thiazolidinedione Secretagogues
6 12 18 24 12+ mo.
<65
65+
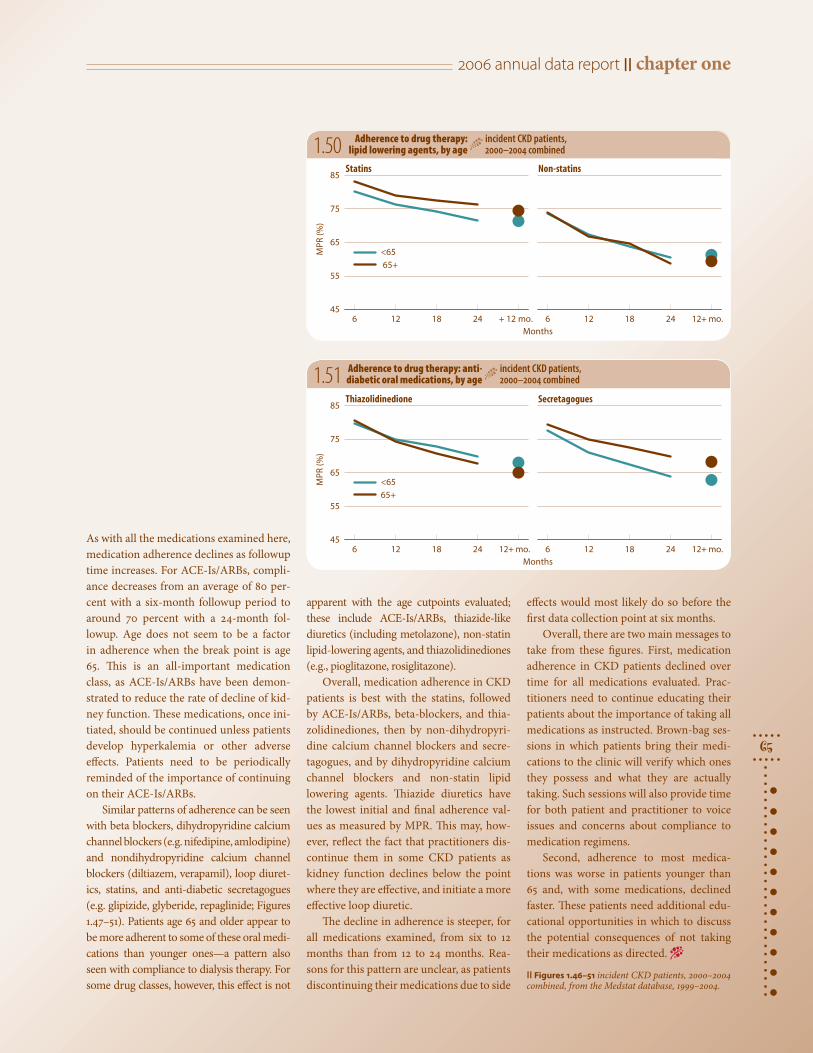
1.50
1.51
Adherence to drug therapy: lipid lowering agents, by age
incident CKD patients, 2000–2004 combined
Adherence to drug therapy: anti-diabetic oral medications, by age
incident CKD patients, 2000–2004 combined
As with all the medications examined here, medication adherence declines as followup time increases. For ACE-Is/ARBs, compli-ance decreases from an average of 80 per-cent with a six-month followup period to around 70 percent with a 24-month fol-lowup. Age does not seem to be a factor in adherence when the break point is age 65. This is an all-important medication class, as ACE-Is/ARBs have been demon-strated to reduce the rate of decline of kid-ney function. These medications, once ini-tiated, should be continued unless patients develop hyperkalemia or other adverse effects. Patients need to be periodically reminded of the importance of continuing on their ACE-Is/ARBs.
Similar patterns of adherence can be seen with beta blockers, dihydropyridine calcium channel blockers (e.g. nifedipine, amlodipine) and nondihydropyridine calcium channel blockers (diltiazem, verapamil), loop diuret-ics, statins, and anti-diabetic secretagogues (e.g. glipizide, glyberide, repaglinide; Figures 1.47–51). Patients age 65 and older appear to be more adherent to some of these oral medi-cations than younger ones—a pattern also seen with compliance to dialysis therapy. For some drug classes, however, this effect is not
apparent with the age cutpoints evaluated; these include ACE-Is/ARBs, thiazide-like diuretics (including metolazone), non-statin lipid-lowering agents, and thiazolidinediones (e.g., pioglitazone, rosiglitazone).
Overall, medication adherence in CKD patients is best with the statins, followed by ACE-Is/ARBs, beta-blockers, and thia-zolidinediones, then by non-dihydropyri-dine calcium channel blockers and secre-tagogues, and by dihydropyridine calcium channel blockers and non-statin lipid lowering agents. Thiazide diuretics have the lowest initial and final adherence val-ues as measured by MPR. This may, how-ever, reflect the fact that practitioners dis-continue them in some CKD patients as kidney function declines below the point where they are effective, and initiate a more effective loop diuretic.
The decline in adherence is steeper, for all medications examined, from six to 12 months than from 12 to 24 months. Rea-sons for this pattern are unclear, as patients discontinuing their medications due to side
effects would most likely do so before the first data collection point at six months.
Overall, there are two main messages to take from these figures. First, medication adherence in CKD patients declined over time for all medications evaluated. Prac-titioners need to continue educating their patients about the importance of taking all medications as instructed. Brown-bag ses-sions in which patients bring their medi-cations to the clinic will verify which ones they possess and what they are actually taking. Such sessions will also provide time for both patient and practitioner to voice issues and concerns about compliance to medication regimens.
Second, adherence to most medica-tions was worse in patients younger than 65 and, with some medications, declined faster. These patients need additional edu-cational opportunities in which to discuss the potential consequences of not taking their medications as directed. −
|| Figures 1.46–51 incident CKD patients, 2000–2004 combined, from the Medstat database, 1999–2004.
chronic kidney diseasechapter summary1
66
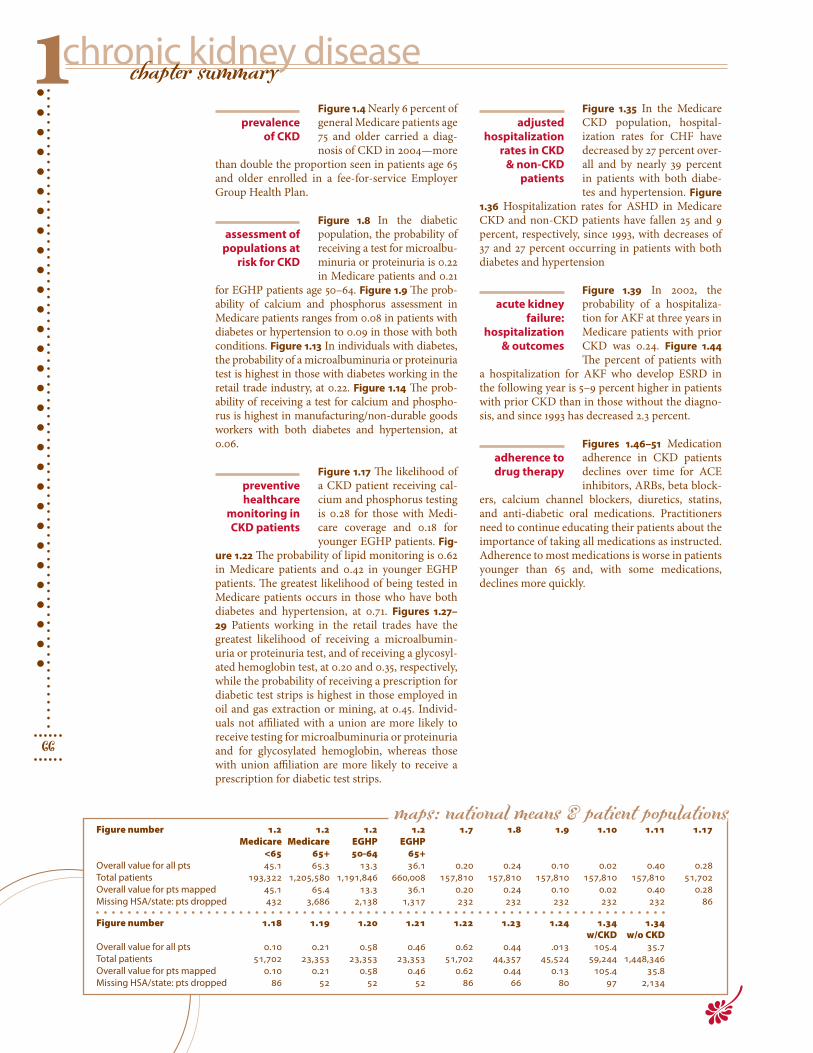
Figure 1.4 Nearly 6 percent of general Medicare patients age 75 and older carried a diag-nosis of CKD in 2004—more
than double the proportion seen in patients age 65 and older enrolled in a fee-for-service Employer Group Health Plan.
Figure 1.8 In the diabetic population, the probability of receiving a test for microalbu-minuria or proteinuria is 0.22 in Medicare patients and 0.21
for EGHP patients age 50–64. Figure 1.9 The prob-ability of calcium and phosphorus assessment in Medicare patients ranges from 0.08 in patients with diabetes or hypertension to 0.09 in those with both conditions. Figure 1.13 In individuals with diabetes, the probability of a microalbuminuria or proteinuria test is highest in those with diabetes working in the retail trade industry, at 0.22. Figure 1.14 The prob-ability of receiving a test for calcium and phospho-rus is highest in manufacturing/non-durable goods workers with both diabetes and hypertension, at 0.06.
Figure 1.17 The likelihood of a CKD patient receiving cal-cium and phosphorus testing is 0.28 for those with Medi-care coverage and 0.18 for younger EGHP patients. Fig-
ure 1.22 The probability of lipid monitoring is 0.62 in Medicare patients and 0.42 in younger EGHP patients. The greatest likelihood of being tested in Medicare patients occurs in those who have both diabetes and hypertension, at 0.71. Figures 1.27–29 Patients working in the retail trades have the greatest likelihood of receiving a microalbumin-uria or proteinuria test, and of receiving a glycosyl-ated hemoglobin test, at 0.20 and 0.35, respectively, while the probability of receiving a prescription for diabetic test strips is highest in those employed in oil and gas extraction or mining, at 0.45. Individ-uals not affiliated with a union are more likely to receive testing for microalbuminuria or proteinuria and for glycosylated hemoglobin, whereas those with union affiliation are more likely to receive a prescription for diabetic test strips.
Figure 1.35 In the Medicare CKD population, hospital-ization rates for CHF have decreased by 27 percent over-all and by nearly 39 percent in patients with both diabe-tes and hypertension. Figure
1.36 Hospitalization rates for ASHD in Medicare CKD and non-CKD patients have fallen 25 and 9 percent, respectively, since 1993, with decreases of 37 and 27 percent occurring in patients with both diabetes and hypertension
Figure 1.39 In 2002, the probability of a hospitaliza-tion for AKF at three years in Medicare patients with prior CKD was 0.24. Figure 1.44 The percent of patients with
a hospitalization for AKF who develop ESRD in the following year is 5–9 percent higher in patients with prior CKD than in those without the diagno-sis, and since 1993 has decreased 2.3 percent.
Figures 1.46–51 Medication adherence in CKD patients declines over time for ACE inhibitors, ARBs, beta block-
ers, calcium channel blockers, diuretics, statins, and anti-diabetic oral medications. Practitioners need to continue educating their patients about the importance of taking all medications as instructed. Adherence to most medications is worse in patients younger than 65 and, with some medications, declines more quickly.
prevalence of CKD
assessment of populations at
risk for CKD
adjusted hospitalization
rates in CKD & non-CKD
patients
preventive healthcare
monitoring in CKD patients
Figure number 1.2 1.2 1.2 1.2 1.7 1.8 1.9 1.10 1.11 1.17 Medicare Medicare EGHP EGHP <65 65+ 50-64 65+ Overall value for all pts 45.1 65.3 13.3 36.1 0.20 0.24 0.10 0.02 0.40 0.28Total patients 193,322 1,205,580 1,191,846 660,008 157,810 157,810 157,810 157,810 157,810 51,702Overall value for pts mapped 45.1 65.4 13.3 36.1 0.20 0.24 0.10 0.02 0.40 0.28Missing HSA/state: pts dropped 432 3,686 2,138 1,317 232 232 232 232 232 86
Figure number 1.18 1.19 1.20 1.21 1.22 1.23 1.24 1.34 1.34 w/CKD w/o CKDOverall value for all pts 0.10 0.21 0.58 0.46 0.62 0.44 .013 105.4 35.7 Total patients 51,702 23,353 23,353 23,353 51,702 44,357 45,524 59,244 1,448,346Overall value for pts mapped 0.10 0.21 0.58 0.46 0.62 0.44 0.13 105.4 35.8Missing HSA/state: pts dropped 86 52 52 52 86 66 80 97 2,134
maps: national means & patient populations
acute kidney failure:
hospitalization & outcomes
adherence to drug therapy