Embed Size (px)
Citation preview

1
Chronic kidney disease, cardiovascular risk markers and total mortality in older men:
cystatin C vs creatinine
Shahrzad Zonoozi1; Sheena Ramsay2; Olia Papacosta1; Lucy Lennon1; Elizabeth A Ellins3;
Julian P J Halcox3; Peter H Whincup4; S Goya Wannamethee1
1 UCL Department of Primary Care & Population Health, UCL Medical School, Rowland Hill
Street, London, NW3 2PF, UK
2 Institute of Health & Society, Newcastle University, Richardson Road, Newcastle upon Tyne,
NE2 4AX, UK
3 Institute of Life Sciences, Swansea University, Singleton Park, Swansea, SA2 8PP, UK
4 Population Health Research Institute, St George’s University of London, Cranmer Terrace,
London, SW17 0RE, UK
Corresponding author:
Shahrzad Zonoozi, UCL Department of Primary Care & Population Health, UCL Medical
School, Rowland Hill Street, London, NW3 2PF, UK. Email: [email protected]
Word count for abstract: 250
Word count for text: 3343 (excluding abstract, summary box, contributions, references and
tables)
Keywords: chronic kidney disease, creatinine, cystatin C, cardiovascular mortality, subclinical
atherosclerosis
We certify that this work is novel
2
Abstract
It remains uncertain whether cystatin C is a superior marker of renal function than creatinine
in older adults. We have investigated the association between estimated glomerular filtration
rate (eGFR) using the Chronic Kidney Disease Epidemiology (CKD-EPI) equations based on
creatinine (CKD-EPIcr) and cystatin C (CKD-EPIcys), and cardiovascular risk markers and
mortality in older adults.
Methods
Cross sectional and prospective study of 1639 British men aged 71-92 years, followed up for
an average 5 years for mortality. Cox’s survival model and receiving operating characteristic
(ROC) analysis were used to assess the associations.
Results
The prevalence of CKD was similar using the two CKD-EPI equation although cystatin C
reclassified 43.9% of those with stage 3a CKD (eGFR 45-59ml/min/1.732, moderate
damage) to no CKD. However, CKD stages assessed using both CKD-EPIcr and CKD-
EPIcys were significantly associated with vascular risk markers and with all-cause and CVD
mortality. In all men with CKD (eGFR < 60ml/min/1.732), the hazard ratio (HR) (95%
confidence interval) for all-cause mortality after adjustment for cardiovascular risk factors
compared to those with no CKD were 1.53 (1.20, 1.96) and 1.74 (1.35, 2.23) using CKD-
EPIcr and CKD-EPIcys respectively. Comparisons of the two CKD equations showed no
significant difference in their predictive ability for mortality (difference in AUC p = 0.46).
Conclusion
Despite reclassification of CKD stages, assessment of CKD using CKD-EPIcys did not
improve prediction of mortality in older British men >70 years. Our data does not support the
routine use of CKD-EPIcys for identifying CKD in the elderly British male population.
3
Summary Box
What is already known on this subject?
Chronic kidney disease (CKD) is a significant worldwide public health problem associated
with excess mortality and morbidity. CKD diagnosis relies on the estimated glomerular
filtration rate (eGFR), traditionally based on equations using serum creatinine levels. It
remains uncertain whether cystatin C is a superior marker of renal function than creatinine in
older adults. We therefore investigated the association between estimated glomerular
filtration rate (eGFR) calculated using the Chronic Kidney Disease Epidemiology (CKD-EPI)
equations based on creatinine (CKD-EPIcr) and cystatin C (CKD-EPIcys), and
cardiovascular risk markers and mortality in older adults.
What does this study add?
We found that the prevalence of CKD (eGFR < 60 ml/min/1.732) was similar irrespective of
CKD equation used although cystatin C reclassified a large proportion of men with stage 3
CKD (eGFR 30-59 ml/ min/1.732) based on creatinine to no CKD and these men did not
show increased mortality risk. However, CKD stages assessed using both equations were
significantly associated with vascular risk markers (inflammation, endothelial and cardiac
dysfunction) and with all-cause and cardiovascular mortality. Comparisons of the two CKD
equations showed no significant difference in their predictive ability for mortality. Despite
reclassification of CKD stages, assessment of CKD using CKD-EPIcys did not improve
prediction of mortality in white British men older than 70 years. Our data does not support
the routine use of CKD-EPIcys for identifying CKD in the elderly British white male
population.
4
Introduction
Chronic kidney disease (CKD) is a significant worldwide public health problem associated with
excess mortality and morbidity [1, 2]. CKD diagnosis relies on the estimated glomerular
filtration rate (eGFR), traditionally based on equations using serum creatinine levels. Whilst
the Modification of Diet in Renal Disease (MDRD) equation had been used for many years,
more recent evidence suggests the CKD Epidemiology Collaboration (CKD-EPI) creatinine
equation performs better in predicting mortality [3, 4].
Many population studies have shown the prevalence of CKD increases with increasing age
[5]. Using creatinine in the older population to calculate eGFR may lead to an overestimation
of the GFR as serum creatinine is influenced by muscle mass and dietary protein intake, both
of which reduce with increasing age [6]. In view of the high prevalence of CKD in older adults
and the growing ageing population, there is a need for measures of eGFR which can more
accurately predict death in this population. Cystatin C is an alternative GFR marker less
influenced by exogenous factors [6]. The National Institute for Health and Care Excellence
(NICE) guidelines for the diagnosis of CKD in those with CKD Stage 3a (eGFR 45-
59ml/min/1.73m2) and no proteinuria recommends the use of cystatin C based equations to
calculate eGFR [7].
There is conflicting evidence in the literature regarding the use of CKD-EPI cystatin C (CKD-
EPIcys) over CKD-EPI creatinine (CKD-EPIcr) based equations in the elderly population [8-
11]. Whilst a recent meta-analysis of sixteen studies has shown use of the CKD-EPIcys
equation strengthens the association between the eGFR and the risks of death and end-stage
renal disease, the majority of those included were younger individuals [12]. There is some
evidence to suggest that there is no benefit in using the CKD-EPIcys equation in the elderly
population [8, 9].
Moreover, advanced CKD is associated with excess cardiovascular morbidity and mortality [1,
2] and whether eGFR calculated using CKD-EPIcys equations are better indicators of CVD
risk than CKD-EPIcr has been less studied. Therefore, to address these issues we have 1)
5
compared the predictive value of CKD-EPIcr and the CKD-EPIcys equations for all-cause and
CVD mortality; 2) compared mortality by stages of CKD and 3) examined the association
between these CKD-EPI equations with cardiovascular risk markers including arterial stiffness
and cardiac markers in a cohort of older men in primary care.
Methods
The British Regional Heart Study is a prospective study which recruited a socioeconomically
and geographically representative cohort of 7735 men from 24 British towns between 1978
and 1980. This present study is an analysis of the data from the 2010-2012 re-examination
when all surviving men (n = 3137), aged between 71–92 years, were sent a postal
questionnaire and invited for a 30th year re-examination with the men being followed up until
June 2016. The population studied was socio-economically representative and comprised
predominantly white Europeans (>99%). 2137 (68%) men completed the postal questionnaire
and 1722 (55%) men attended the re-examination [13]. Blood samples were collected after
fasting for a minimum of six hours and were stored at −70°C. The National Research Ethics
Service (NRES) Committee London provided ethical approval for the data collection. All men
provided written informed consent to the investigations, which were carried out in accordance
with the Declaration of Helsinki. The presence of co-morbidity was based on the men self-
reporting a doctor made diagnosis.
CVD risk factors
Physical examination included blood pressure (BP), height and weight, from which body mass
index (BMI) was calculated [14]. Details of measurement and classification for smoking status
and physical activity in this cohort have been previously described [15]. The use of
antihypertensive medication was based on self-reported medication history. Measurements of
metabolic, inflammatory and endothelial markers were taken as described previously [14, 16,
6
17]. C-reactive protein (CRP) (marker of inflammation) was assayed by ultra sensitive
nephelometry (Dade Behring, Milton Keynes, UK). Interleukin-6 was assayed using a high-
sensitivity ELISA (R & D Systems, Oxford, UK). NT-pro brain natriuretic peptide (BNP) and
cardiac troponin T (cTnT) were measured using the Elecsys 2010 electrochemiluminescence
method (Roche Diagnostics, Burgess Hill, UK). Prevalent diabetes included men with doctor-
diagnosed diabetes and men with fasting blood glucose ≥7 mmol/L. Femoral PWV was
assessed by two vascular technicians as previously described [18, 19].
CKD assessment
1639 men had at least one renal function blood measurement (83 missing). Cystatin C was
measured using an automated method on a biochemistry analyser (c311, Roche Diagnostics,
Burgess Hill, UK) and was calibrated and quality controlled using the manufacturers reagents.
Creatinine was measured using an automated analyser and GFR was estimated using the
CKD-EPIcr [20] and CKD-EPIcys [21] equations:
CKD EPI creatinine = 141 × min (creatinine
0.9, 1)
−0.411
× max (creatinine
0.9, 1)
−1.209
× 0.993age
where “min” indicated the minimum of creatinine/0.9 or 1 and “max” indicates the maximum of
creatinine/0.9 or 1.
CKD EPI cystatin C = 133 × min (cystatin C
0.8, 1)
−0.499
× max (cystatin C
0.8, 1)
−1.328
× 0.996age
where “min” indicated the minimum of cystatin C/0.8 or 1 and “max” indicates the maximum of
cystatin C/0.8 or 1.
Estimated GFR is expressed in millilitres per min per 1.73 meters squared, weight in
kilograms, age in years, cystatin C and creatinine in milligrams per decilitre. The men were
initially classified into 6 CKD stages 1, 2, 3a, 3b, 4 and 5. Stage 1 and 2 indicates normal or
mild CKD. Patients with CKD stage 3 had moderate CKD, stage 4 represents severe CKD and
7
stage 5 indicates kidney failure. In subsequent analyses three categories were defined: those
with eGFR ≥ 60ml/min/1.732 (CKD stages 1 and 2), eGFR ≥ 30 and < 60ml/min/1.732 (CKD
stages 3a [eGFR 45-59ml/min/1.732] and 3b [eGFR 30-44ml/min/1.732]), eGFR <
30ml/min/1.732 (CKD stages 4 and 5). Of the 1639 men, 3 men had missing data on creatinine
and 35 men had missing data on cystatin C.
Mortality follow-up
All men were followed prospectively for CVD and all-cause mortality from re-examination
(2010-2012). In the present analyses, total mortality events are based on follow-up from re-
screening in 2010-2012 to 30th June 2016, a mean follow-up period of 5 years. Information
on death was collected through the established “tagging” procedures provided by the National
Health Service central registers. In order to obtain death notifications, details were supplied to
the centre which enabled them to identify and tag the relevant cases [22]. Cardiovascular
deaths included all those with International Classification of Diseases (ICD-9th Revision)
codes 390–459.
Statistical analysis
Distributions of HbA1c, glucose, insulin, C-reactive protein (CRP), interleukin 6 (IL-6), NT-pro
BNP and cTnT were highly skewed and log transformation was used. Comparisons of baseline
characteristics between the CKD groups were carried out using the chi squared test for
categorical variables and analysis of variance for continuous variables.
Cox proportional hazards models were used to assess hazard ratios (HRs) for the three CKD
definitions compared to subjects without CKD (i.e. stages 1 and 2) at baseline with respect to
cardiovascular and all-cause mortality during follow up. Receiving operating characteristic
(ROC) analysis was used to compare the predictive ability of the two equations. We also
evaluated how all-cause mortality for each eGFR category changed depending on the
8
equation used. The ability of the CKD-EPIcys equation to reclassify mortality risk was
assessed using methods suggested by Pencina et al. [23] by calculating the net
reclassification improvement (NRI). All analyses were performed using SAS version 9.3 (SAS,
Cary, North Carolina).
Results
This study was based on 1639 men aged 72-91 years who attended the 2010-2012 re-
examination and who had at least one renal blood measurement. Of these 1601 men had both
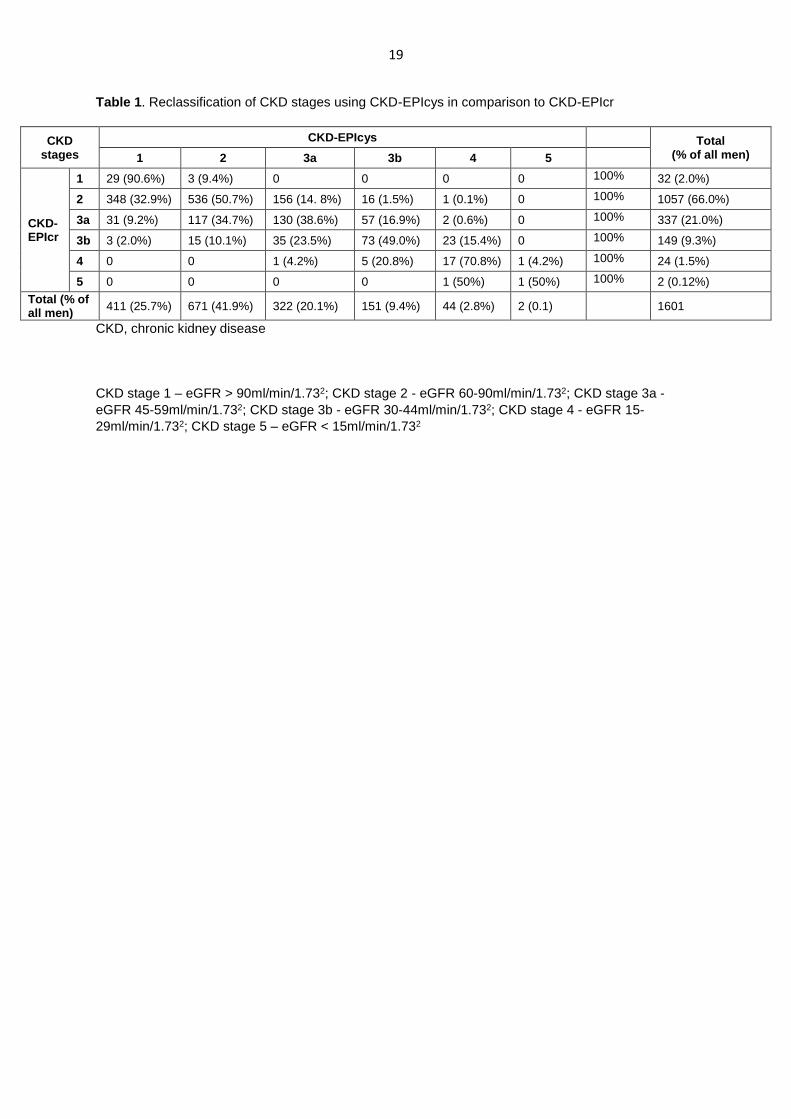
renal blood measurements. Table 1 shows the prevalence of CKD stages using the CKD-
EPIcr and the reclassification of CKD stages when using CKD-EPIcys in comparison to CKD-
EPIcr. 32% were classified as having CKD using the creatinine based equation compared to
32.4% using the cystatin C based equation. The CKD-EPIcys reclassified 15.9% of men with
no CKD (stages 1 and 2) using the CKD-EPIcr to having CKD and 32.4% of those with CKD
(eGFR < 60ml/min/1.732) to no CKD. The largest reclassification was seen in men with CKD
stage 3a; use of CKD-EPIcys resulted in the reclassification of 43.9% of those with CKD stage
3a to CKD stages 1 and 2 (i.e. no CKD) and 17.5% to a more advanced CKD stage.
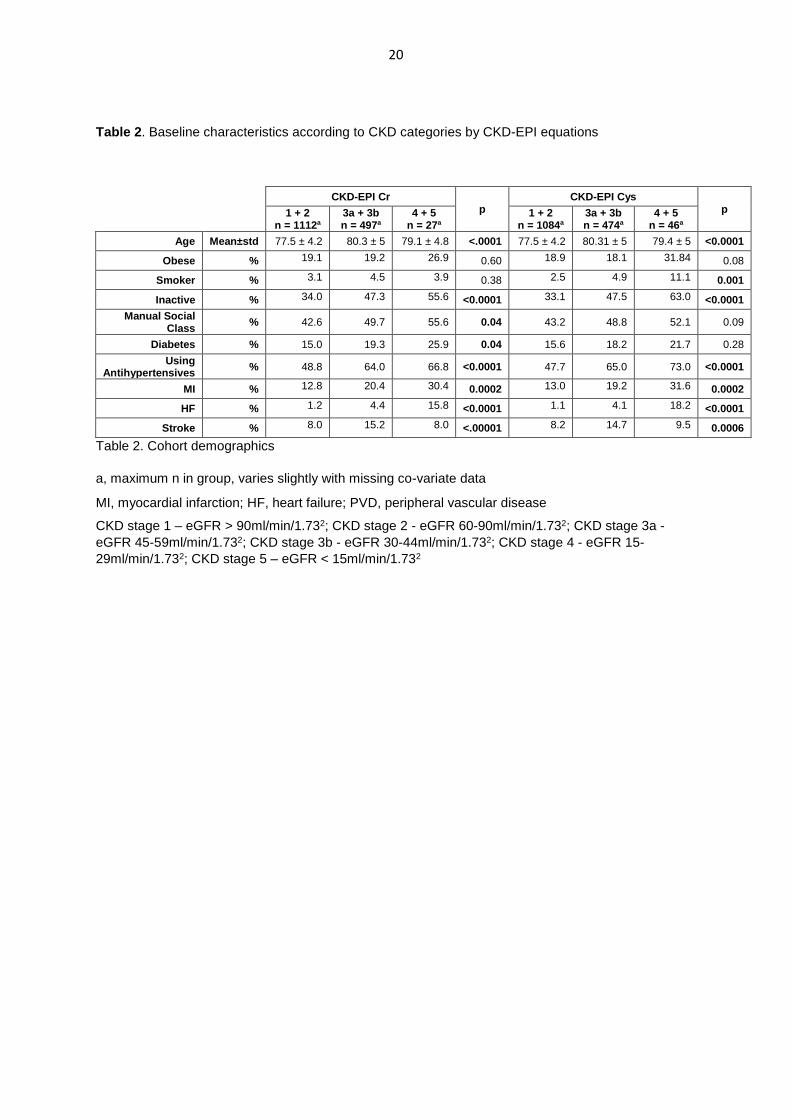
Cohort characteristics
Men with no CKD, regardless of which equation was used, were the youngest and had the
lowest prevalence of diabetes, inactivity, manual workers, use of anti-hypertensives,
myocardial infarction (MI), heart failure (HF), and stroke (Table 2).
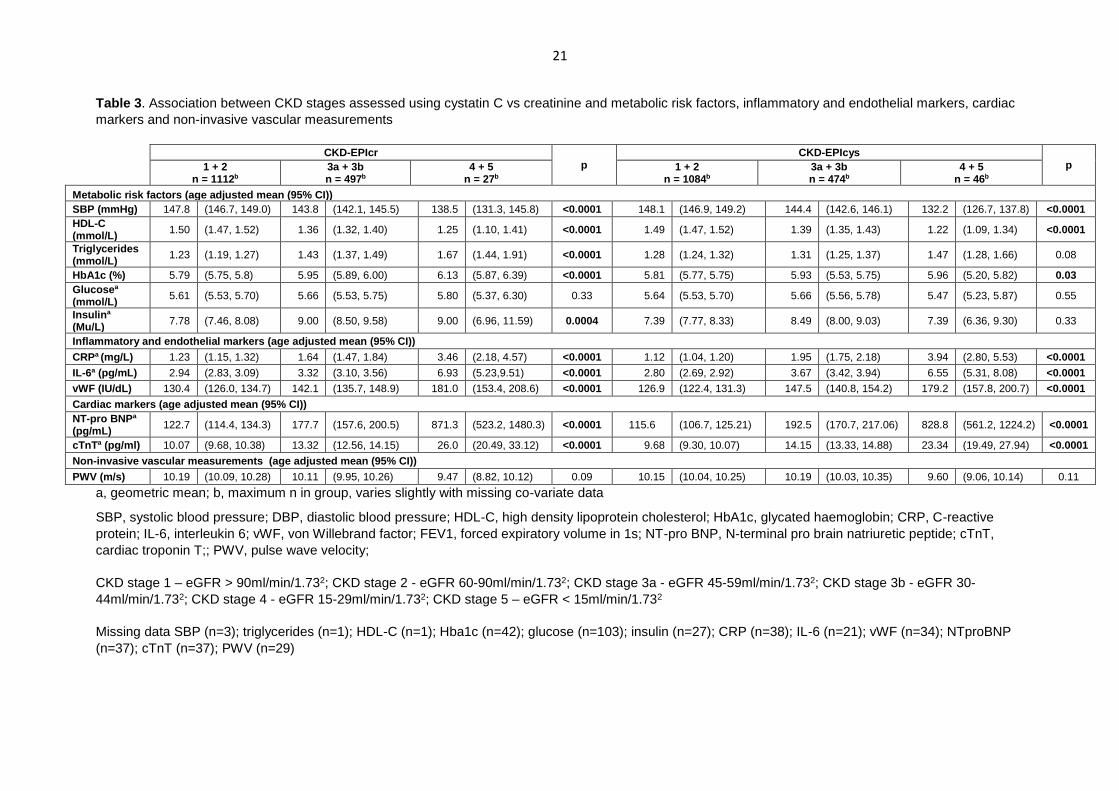
Vascular risk markers and subclinical atherosclerosis
Table 3 shows the association between CKD stages and age adjusted mean levels of
cardiovascular risk markers. Both CKD-EPIcr and CKD-EPIcys showed significant
associations with systolic blood pressure, HDL-C, inflammation, vWF, and cardiac markers
9
(NT-proBNP and cTnT). Only CKD-EPIcr was associated with mean levels of insulin and
triglycerides. No association was seen with arterial stiffness.
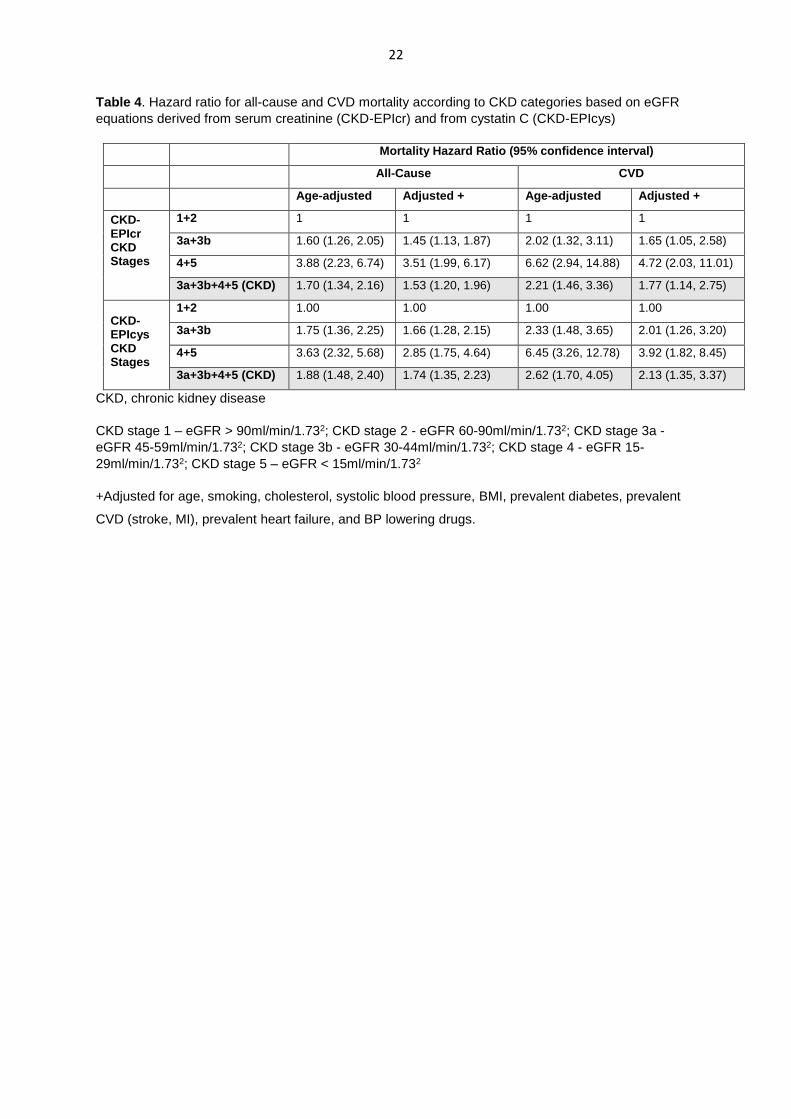
Mortality
During a median follow-up time of 5 years, 300 of the 1639 men died. Of these, 99 men
(33.0%) died of a cardiovascular cause. Table 4 shows the hazard ratio (HR) for all-cause and
CVD mortality for the three main CKD stages (stages 1+2, 3a+3b and 4+5). In the age adjusted
analysis, irrespective of CKD equations those with CKD stages 3, 4 and 5 showed significantly
higher risk of all-cause and CVD mortality. Adjustment for major CVD risk factors (Table 4)
slightly attenuated the association but the relationships with all-cause and CVD mortality
remained significant. In particular, those classified as stage 3 CKD irrespective of CKD
equations showed significantly higher risk of CVD and all-cause mortality even after
adjustment than those with no CKD. Comparisons of ROC-AUC for the two CKD equations
showed no significant difference in their predictive ability for mortality. In the multivariate
analysis the AUC for CKD-EPIcr vs CKD-EPIcys were 0.733 (0.029) vs 0.737 (0.029) (p =
0.46 for difference) for all-cause mortality and AUC = 0.746 (0.028) vs 0.754 (0.029) (p = 0.22
for difference) for CVD mortality.
We also examined the association between the two CKD equations and all-cause mortality
separately in men with and without prevalent CVD or diabetes adjusting for major CVD risk
factors. The associations were seen in both groups. In men with no prevalent CVD or diabetes
(n = 1080), compared to those with no CKD, those with any CKD (stages 3, 4 or 5) had an
adjusted HR (95% CI) of 1.39 (1.02, 1.89) and 1.50 (1.09, 2.05) using CKD-EPIcr and CKD-
EPIcys respectively. In the subset of participants with CVD or diabetes (n = 559), the
corresponding HRs were 1.81 (1.19, 2.75) and 1.99 (1.30, 3.04) respectively.
10
We also examined the all-cause mortality risk in those categorised as any CKD (stages
3a+3b+4+5) and no CKD based on the EPIcr and EPIcys equation and 4 groups were used:
No CKD (both equations; n = 916) (reference group), CKD (using CKD-EPIcr only; n = 166),
CKD (using CKD-EPIcys only; n = 173) and those classified as CKD for both equations (n =
346). In multivariate analyses those with CKD based on creatinine who were reclassified
downwards on the basis of cystatin C showed similar risk to those with no CKD. Those who
were reclassified as CKD on the basis of cystatin C showed higher risk than those with no
CKD but this difference was not significant. The HR for the four groups were 1.00, 1.03 (0.66,
1.59), 1.31 (0.89, 1.92) and 1.99 (1.48, 2.67) respectively.
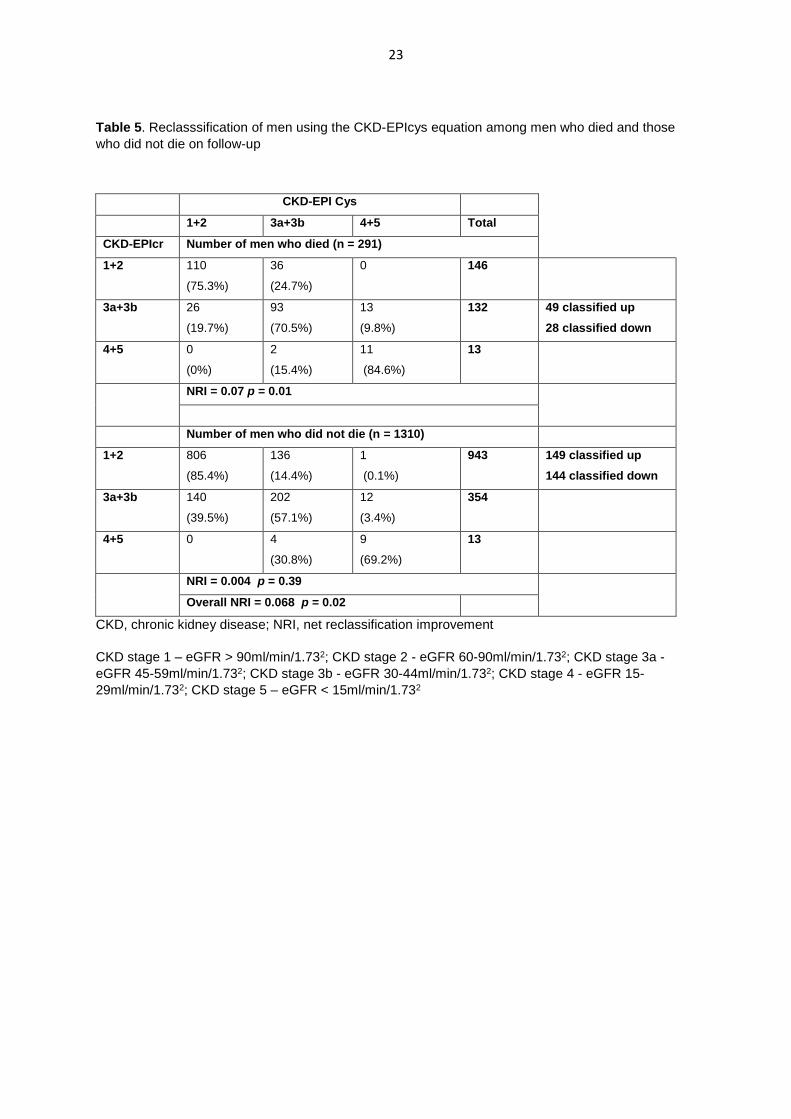
Finally, we assessed the NRI for all-cause mortality using the CKD-EPIcys equation for the
three CKD-EPIcr CKD categories (1+2, 3a+3b and 4+5). The reclassification of men who died
and who did not die is shown in Table 5. Among men who died 49 men (16.8%) were
reclassified to a higher CKD stage using the CKD-EPIcys equation and 28 men (9.6%) were
reclassified to a lower CKD stage with the CKD-EPIcys equation. The net gain in
reclassification in those who died was 0.087 (p < 0.01). Among men who did not die 77% were
classified as the same CKD stage (149 were reclassified up and 144 were reclassified down).
The net gain in those who did not die (NRI = 0.004) was not significant. The overall NRI was
0.07 (p = 0.02).
Discussion
Our study has shown that in a representative sample of British men aged 71–92 years drawn
from primary care, use of the CKD-EPIcys equation to calculate eGFR resulted in a similar
prevalence of CKD compared to the CKD-EPIcr equation. However, cystatin C reclassified, in
particular, a large proportion of those with CKD stage 3 to no CKD and these men showed
similar risk to those with no CKD. However, the majority of men classified as having no CKD
11
using the creatinine based equation were also classified as having no CKD using the cystatin
C based equation. Both equations predicted all-cause and CVD mortality and overall CKD-
EPIcys was not a significantly better predictor of all-cause or CVD mortality than CKD-EPIcr
as measured by the AUC. The overall net reclassification improvement for total mortality
although statistically significant was largely due to the events component. No improvement
was seen for the non-events component. A recent study reported that use of eGFR calculated
using CKD-EPIcys did not improve prediction of mortality in older men with CKD stage 3a in
primary care [8]. This study only looked at participants with CKD stage 3; however, they were
followed up, similar to our study, for 5 years. Survival models in this study were adjusted for
age, sex, previous CVD as well as urine albumin-to-creatinine ratio, haemoglobin, albumin
and bicarbonate which differed from our study. Our study extends the findings of Shardlow et
al. to a general older population with and without CKD in primary care. We also investigated
the association between CKD (assessed using the CKD-EPIcys and CKD-EPIcr equations)
and a wide range of metabolic, cardiac, inflammatory and non-invasive markers of arterial
disease not previously reported.
CKD and vascular risk
Our findings confirm the known association between CKD and vascular risk factors including
blood pressure, lipids, cardiac markers (NT-proBNP, cTnT) and inflammation [24-29]. With the
exception of insulin, glucose and triglycerides both measures of eGFR showed significant
associations with vascular risk markers. However, only, the CKD-EPIcr equation showed
significant association with insulin. In contrast we found no association between CKD and
arterial stiffness which is consistent with previous reports [30]. Overall both equations showed
significant associations with most of the major vascular risk markers.
CKD and mortality
12
In this study of older men, the use of CKD-EPIcys did not improve the prediction of mortality
in the general elderly male cohort overall as measured by the AUC. The findings indicate that
the use of CKD-EPIcr is sufficient as an initial screening tool. Only 16% of men were
reclassified as having CKD on the basis of cystatin C and these men showed a slightly higher
mortality risk than those with no CKD but the difference was not significant. The non-significant
findings may be due to the small numbers in the study and larger studies are needed to confirm
this. However, our findings that those classified as having CKD on the basis of creatinine but
not on cystatin C based equation did not show higher risk than those with no CKD supports
NICE guidelines in the use of cystatin C in those with CKD stage 3a to rule out CKD [7].
Few studies have compared the association between CKD-EPIcr and CKD-EPIcys based
equations with mortality in the general older adult population and the findings have been
inconsistent. Our findings confirm previous reports from a prospective cohort study of 1165
elderly women aged over 70 years in Western Australia followed up for 10 years which found
the CKD-EPIcys equation was not superior in predicting all-cause mortality or CVD events
compared to the CKD-EPIcr equation [9]. In this study, similarly to ours, the findings were
adjusted for age, BMI, smoking history, diabetes, systolic blood pressure, use of
antihypertensive medications, prevalent renal disease and CVD. Our adjustments also
included cholesterol and prevalent heart failure.
By contrast one study has found CKD-EPIcr is associated with a U-shaped increased HR of
mortality with both high and low eGFR being associated with increased mortality whilst using
the CKD-EPIcys equation showed a linear association between eGFR and all-cause mortality
[31]. Of note, participants in this study had a mean age of 85 years, which is older than our
cohort and had a shorter follow up of 2.6 years. A further study looking at 2994 community
dwelling men with a mean age of 76.4 years showed that the CKD-EPIcr equation was inferior
to the CKD-EPIcys equation in predicting all-cause mortality [10]. The reasons for the
differences in findings are not clear but this study included a multi-ethnic population who were
13
on average slightly younger and included men under 70 years of age and had a longer follow
up time of 7.3 years compared to 5 years in our study.
Strengths and limitations
The strengths of our study include the fact that it is a study of older men, a group who are at
high risk of CKD and vascular disease and a group in whom there has been limited evidence
for the validity of cystatin C based eGFR equations. However, the BRHS includes a
predominantly older white male population of European extraction. This limits generalisability
to women, middle-aged adults and ethnic minority groups. The response rate for the baseline
assessment in this study was 55%, and, therefore, the issue of survival bias cannot be
overlooked. Although men who participated in our re-examination study were healthier
(younger, more active, lower BMI, less disabled, lower prevalence of CVD and diabetes) at
the previous examination 10 years earlier than those who did not, there was little difference in
prevalence of CKD between responders and non-responders. Although healthy survival bias
may underestimate the prevalence of CKD in older adults and the incident mortality rates may
be lower than the total population, this should not bias the nature of the association between
CKD and mortality. Moreover, we have shown that the two equations showed broadly similar
significant associations with mortality in men with and without CVD or diabetes. Whilst we
have focused on CKD in this study, acute kidney injury (AKI, i.e. a rapid decline in GFR), is an
important clinical problem encountered on a day-to-day basis. Studies have shown that
compared to creatinine, cystatin C is an earlier marker of AKI which we have not discussed in
this paper [6]. In the elderly, using a cystatin C based equation has been shown to estimate
larger declines in kidney function than a creatinine based equation [32]. We have used single
measures of creatinine and cystatin C to calculate eGFR and we have not looked at changes
in eGFR or compared this to the gold standard measured GFR as these data were not
available. Another potential limitation was the lack of albuminuria measurement in this cohort.
14
Conclusion
Estimating GFR using CKD-EPIcys leads to a similar prevalence of CKD compared to CKD-
EPIcr although a large proportion of stage 3a CKD were reclassified as having no CKD.
Assessment of CKD using CKD-EPIcys does not significantly improve prediction of all-cause
and CVD mortality in older white British men when compared to CKD-EPIcr. Both CKD
equations showed similar associations with inflammatory and cardiac risk markers and
markers of subclinical atherosclerosis. Creatinine measurement is inexpensive and widely
available. Data from our study supports the use of CKD-EPIcr as an initial screening tool for
the assessment of eGFR at least in older white British men although the CKD-EPIcys equation
may be useful in reclassifying those with CKD stage 3a.
Contributions
SGW initiated the concept and design of the paper. SZ analysed the data with help from OP
and drafted the manuscript. SGW, JPJH, EAE, PHW contributed to the interpretation of
data. EAE, JPJH, LL, PHW and SGW contributed to the acquisition of the data. All authors
assessed the manuscript critically for important intellectual content and approved the final
version.
Funding
The British Regional Heart Study is a British Heart Foundation (BHF) research group. This
work was supported by a British Heart Foundation programme grant (RG/13/16/30528) and
project grant (PG/09/024).
Competing Interests
The authors report no conflicts of interest.

15
Exclusive Licence
The Corresponding Author has the right to grant on behalf of all authors and does grant on
behalf of all authors, an exclusive licence (or non-exclusive for government employees) on a
worldwide basis to the BMJ Publishing Group Ltd and its Licensees to permit this article (if
accepted) to be published in JECH editions and any other BMJPGL products to exploit all
subsidiary rights, as set out in our licence.
(http://group.bmj.com/products/journals/instructions-for-authors/licence-forms/).
Ethics statement
The National Research Ethics Service (NRES) Committee London provided ethical approval
for the data collection. All men provided written informed consent to the investigations, which
were carried out in accordance with the Declaration of Helsinki.
16
References
1. Gansevoort, R.T., Correa-Rotter, R., Hemmelgarn, B.R. et al., Chronic kidney
disease and cardiovascular risk: epidemiology, mechanisms, and prevention. Lancet,
2013. 382(9889): p. 339-52.
2. Go, A.S., Chertow, G.M., Fan, D., McCulloch, C.E., Hsu, C.Y. Chronic kidney
disease and the risks of death, cardiovascular events, and hospitalization. N Engl J
Med, 2004. 351(13): p. 1296-305.
3. Matsushita, K., Tonelli, M., Lloyd, A. et al., Clinical risk implications of the CKD
Epidemiology Collaboration (CKD-EPI) equation compared with the Modification of
Diet in Renal Disease (MDRD) Study equation for estimated GFR. Am J Kidney Dis,
2012. 60(2): p. 241-9.
4. Stevens, L.A., Li, S., Kurella Tamura, M. et al., Comparison of the CKD Epidemiology
Collaboration (CKD-EPI) and Modification of Diet in Renal Disease (MDRD) study
equations: risk factors for and complications of CKD and mortality in the Kidney Early
Evaluation Program (KEEP). Am J Kidney Dis, 2011. 57(3 Suppl 2): p. S9-16.
5. Coresh, J., Selvin, E., Stevens, L.A. et al., Prevalence of chronic kidney disease in
the United States. JAMA, 2007. 298(17): p. 2038-47.
6. Lassus, J. and V.-P. Harjola, Cystatin C: a step forward in assessing kidney function
and cardiovascular risk. Heart Failure Reviews, 2012. 17(2): p. 251-261.
7. National Institute for Clinical Excellence. Chronic kidney disease in adults:
assessment and management. 2015; Available from:
https://www.nice.org.uk/guidance/cg182/chapter/1-recommendations.
8. Shardlow, A., McIntyre, N.J., Fraser, S.D.S. et al., The clinical utility and cost impact
of cystatin C measurement in the diagnosis and management of chronic kidney
disease: A primary care cohort study. PLOS Medicine, 2017. 14(10): p. e1002400.
9. Lim, W.H., Lewis, J.R., Wong, G. et al., Comparison of estimated glomerular filtration
rate by the chronic kidney disease epidemiology collaboration (CKD-EPI) equations
with and without Cystatin C for predicting clinical outcomes in elderly women. PLoS
One, 2014. 9(9):p. e106734.
10. Canales, M.T., Blackwell, T., Ishani, A. et al., Estimated GFR and Mortality in Older
Men: Are All eGFR Formulae Equal? American journal of nephrology, 2016. 43(5): p.
325-333.
11. Zhu, Y., Ye, X., Zhu, B. et al., Comparisons between the 2012 new CKD-EPI
(Chronic Kidney Disease Epidemiology Collaboration) equations and other four
approved equations. PLoS One, 2014. 9(1): p. e84688.
12. Shlipak, M.G., Matsushita, K., Ärnlöv, J. et al., Cystatin C versus Creatinine in
Determining Risk Based on Kidney Function. New England Journal of Medicine,
2013. 369(10): p. 932-943.
13. Lennon, L.T., Ramsay, S.E., Papacosta, O., Shaper, A.G., Wannamethee, S.G.,
Whincup, P.H.. Cohort Profile Update: The British Regional Heart Study 1978-2014:
35 years follow-up of cardiovascular disease and ageing. Int J Epidemiol, 2015.
44(3): p. 826-826g.
14. Ramsay, S.E., Arianayagam, D.S., Whincup, P.H. et al., Cardiovascular risk profile
and frailty in a population-based study of older British men. Heart, 2015. 101(8): p.
616-22.
15. Wannamethee, S.G., Lowe, G.D., Whincup, P.H., Rumley, A., Walker, M., Lennon, L.
Physical activity and hemostatic and inflammatory variables in elderly men.
Circulation, 2002. 105(15): p. 1785-90.
17
16. Wannamethee, S.G., Whincup, P.H., Shaper, A.G., Rumley, A., Lennon, L., Lowe,
G.D. Circulating inflammatory and hemostatic biomarkers are associated with risk of
myocardial infarction and coronary death, but not angina pectoris, in older men.
Journal of Thrombosis and Haemostasis, 2009. 7(10): p. 1605-1611.
17. Wannamethee, G.S., Welsh, P., Whincup, P.H., Lennon, L., Papacosta, O., Sattar,
N. N-terminal pro brain natriuretic peptide but not copeptin improves prediction of
heart failure over other routine clinical risk parameters in older men with and without
cardiovascular disease: population-based study. European Journal of Heart Failure,
2014. 16(1): p. 25-32.
18. Parsons, T.J., Sartini, C., Ellins, E.A. et al., Objectively measured physical activity
and sedentary behaviour and ankle brachial index: Cross-sectional and longitudinal
associations in older men. Atherosclerosis, 2016. 247: p. 28-34.
19. Zonoozi, S., Ramsay, S.E., Papacosta, O. et al., Self-reported sleep duration and
napping, cardiac risk factors and markers of subclinical vascular disease: cross-
sectional study in older men. BMJ Open, 2017. 7(6).
20. Levey, A.S., Stevens, L.A., Schmid, C.H. et al., A new equation to estimate
glomerular filtration rate. Ann Intern Med, 2009. 150(9): p. 604-12.
21. Inker, L.A., Schmid, C.H., Tighiouart, H. et al., Estimating glomerular filtration rate
from serum creatinine and cystatin C. N Engl J Med, 2012. 367(1): p. 20-9.
22. Walker, M., Shaper, A.G., Lennon, L., Whincup, P. H. Twenty year follow-up of a
cohort based in general practices in 24 British towns. J Public health Medicine
2000;22:479-485.
23. Pencina, M.J., D'Agostino, R.B Sr., D'Agostino, R.B Jr., Vasan, R.S. Evaluating the
added predictive ability of a new marker: From area under the ROC curve to
reclassification and beyond. Statistics in Medicine, 2008. 27(2): p. 157-172.
24. Zheng, W., Qian, G., Hao, W. et al., Cardiovascular metabolic risk factors and
glomerular filtration rate: a rural Chinese population study. Lipids in Health and
Disease, 2016. 15: p. 180.
25. Kang, S.H., Jung, D.J., Choi, E.W., Cho, K.H., Park, J.W., Do, J.Y. HbA1c Levels Are
Associated with Chronic Kidney Disease in a Non-Diabetic Adult Population: A
Nationwide Survey (KNHANES 2011–2013). PLoS ONE, 2015. 10(12): p. e0145827.
26. Abbas, N.A., John, R.I., Webb, M.C., et al., Cardiac Troponins and Renal Function in
Nondialysis Patients with Chronic Kidney Disease. Clinical Chemistry, 2005. 51(11):
p. 2059-2066.
27. Chung, J.Z.Y. and G.R.D. Jones, Effect of renal function on serum cardiac troponin T
— Population and individual effects. Clinical Biochemistry, 2015. 48(12): p. 807-810.
28. Gupta, J., Mitra, N., Kanetsky, P.A. et al., Association between Albuminuria, Kidney
Function, and Inflammatory Biomarker Profile in CKD in CRIC. Clinical Journal of the
American Society of Nephrology: CJASN, 2012. 7(12): p. 1938-1946.
29. Shankar, A., Sun, L., Klein, B.E. et al., Markers of inflammation predict the long-term
risk of developing chronic kidney disease: a population-based cohort study. Kidney
International, 2011. 80(11): p. 1231-1238.
30. Sathi, S., Mahapatra, H., Sunder, S. et al., Nontraditional Cardiovascular Biomarkers
and Estimation of Cardiovascular Risk in Predialysis Chronic Kidney Disease
Patients and Their Correlations With Carotid Intima Media Thickness. Nephro-
urology Monthly, 2014. 6(6): p. e22112.
31. Shastri, S., Katz, R., Rifkin, D.E. et al., Kidney Function and Mortality in
Octogenarians: Cardiovascular Health Study All Stars. Journal of the American
Geriatrics Society, 2012. 60(7): p. 1201-1207.

18
32. Shlipak, M.G., Katz, R., Kestenbaum, B. et al., Rate of Kidney Function Decline in
Older Adults: A Comparison Using Creatinine and Cystatin C. American Journal of
Nephrology, 2009. 30(3): p. 171-178.
19
Table 1. Reclassification of CKD stages using CKD-EPIcys in comparison to CKD-EPIcr
CKD stages
CKD-EPIcys Total
(% of all men) 1 2 3a 3b 4 5
CKD-EPIcr
1 29 (90.6%) 3 (9.4%) 0 0 0 0 100% 32 (2.0%)
2 348 (32.9%) 536 (50.7%) 156 (14. 8%) 16 (1.5%) 1 (0.1%) 0 100% 1057 (66.0%)
3a 31 (9.2%) 117 (34.7%) 130 (38.6%) 57 (16.9%) 2 (0.6%) 0 100% 337 (21.0%)
3b 3 (2.0%) 15 (10.1%) 35 (23.5%) 73 (49.0%) 23 (15.4%) 0 100% 149 (9.3%)
4 0 0 1 (4.2%) 5 (20.8%) 17 (70.8%) 1 (4.2%) 100% 24 (1.5%)
5 0 0 0 0 1 (50%) 1 (50%) 100% 2 (0.12%)
Total (% of all men)
411 (25.7%) 671 (41.9%) 322 (20.1%) 151 (9.4%) 44 (2.8%) 2 (0.1)
1601
CKD, chronic kidney disease
CKD stage 1 – eGFR > 90ml/min/1.732; CKD stage 2 - eGFR 60-90ml/min/1.732; CKD stage 3a -
eGFR 45-59ml/min/1.732; CKD stage 3b - eGFR 30-44ml/min/1.732; CKD stage 4 - eGFR 15-
29ml/min/1.732; CKD stage 5 – eGFR < 15ml/min/1.732
20
Table 2. Baseline characteristics according to CKD categories by CKD-EPI equations
CKD-EPI Cr
p CKD-EPI Cys
p
1 + 2 n = 1112a
3a + 3b n = 497a
4 + 5 n = 27a
1 + 2 n = 1084a
3a + 3b n = 474a
4 + 5 n = 46a
Age Mean±std 77.5 ± 4.2 80.3 ± 5 79.1 ± 4.8 <.0001 77.5 ± 4.2 80.31 ± 5 79.4 ± 5 <0.0001
Obese % 19.1 19.2 26.9 0.60 18.9 18.1 31.84 0.08
Smoker % 3.1 4.5 3.9 0.38 2.5 4.9 11.1 0.001
Inactive % 34.0 47.3 55.6 <0.0001 33.1 47.5 63.0 <0.0001
Manual Social Class
% 42.6 49.7 55.6 0.04 43.2 48.8 52.1 0.09
Diabetes % 15.0 19.3 25.9 0.04 15.6 18.2 21.7 0.28
Using Antihypertensives
% 48.8 64.0 66.8 <0.0001 47.7 65.0 73.0 <0.0001
MI % 12.8 20.4 30.4 0.0002 13.0 19.2 31.6 0.0002
HF % 1.2 4.4 15.8 <0.0001 1.1 4.1 18.2 <0.0001
Stroke % 8.0 15.2 8.0 <.00001 8.2 14.7 9.5 0.0006
Table 2. Cohort demographics
a, maximum n in group, varies slightly with missing co-variate data
MI, myocardial infarction; HF, heart failure; PVD, peripheral vascular disease
CKD stage 1 – eGFR > 90ml/min/1.732; CKD stage 2 - eGFR 60-90ml/min/1.732; CKD stage 3a -
eGFR 45-59ml/min/1.732; CKD stage 3b - eGFR 30-44ml/min/1.732; CKD stage 4 - eGFR 15-
29ml/min/1.732; CKD stage 5 – eGFR < 15ml/min/1.732
21
Table 3. Association between CKD stages assessed using cystatin C vs creatinine and metabolic risk factors, inflammatory and endothelial markers, cardiac
markers and non-invasive vascular measurements
CKD-EPIcr p
CKD-EPIcys p
1 + 2
n = 1112b 3a + 3b n = 497b
4 + 5 n = 27b
1 + 2 n = 1084b
3a + 3b n = 474b
4 + 5 n = 46b
Metabolic risk factors (age adjusted mean (95% CI))
SBP (mmHg) 147.8 (146.7, 149.0) 143.8 (142.1, 145.5) 138.5 (131.3, 145.8) <0.0001 148.1 (146.9, 149.2) 144.4 (142.6, 146.1) 132.2 (126.7, 137.8) <0.0001
HDL-C (mmol/L)
1.50 (1.47, 1.52) 1.36 (1.32, 1.40) 1.25 (1.10, 1.41) <0.0001 1.49 (1.47, 1.52) 1.39 (1.35, 1.43) 1.22 (1.09, 1.34) <0.0001
Triglycerides (mmol/L)
1.23 (1.19, 1.27) 1.43 (1.37, 1.49) 1.67 (1.44, 1.91) <0.0001 1.28 (1.24, 1.32) 1.31 (1.25, 1.37) 1.47 (1.28, 1.66) 0.08
HbA1c (%) 5.79 (5.75, 5.8) 5.95 (5.89, 6.00) 6.13 (5.87, 6.39) <0.0001 5.81 (5.77, 5.75) 5.93 (5.53, 5.75) 5.96 (5.20, 5.82) 0.03
Glucosea (mmol/L)
5.61 (5.53, 5.70) 5.66 (5.53, 5.75) 5.80 (5.37, 6.30) 0.33 5.64 (5.53, 5.70) 5.66 (5.56, 5.78) 5.47 (5.23, 5.87) 0.55
Insulina (Mu/L)
7.78 (7.46, 8.08) 9.00 (8.50, 9.58) 9.00 (6.96, 11.59) 0.0004 7.39 (7.77, 8.33) 8.49 (8.00, 9.03) 7.39 (6.36, 9.30) 0.33
Inflammatory and endothelial markers (age adjusted mean (95% CI))
CRPa (mg/L) 1.23 (1.15, 1.32) 1.64 (1.47, 1.84) 3.46 (2.18, 4.57) <0.0001 1.12 (1.04, 1.20) 1.95 (1.75, 2.18) 3.94 (2.80, 5.53) <0.0001
IL-6a (pg/mL) 2.94 (2.83, 3.09) 3.32 (3.10, 3.56) 6.93 (5.23,9.51) <0.0001 2.80 (2.69, 2.92) 3.67 (3.42, 3.94) 6.55 (5.31, 8.08) <0.0001
vWF (IU/dL) 130.4 (126.0, 134.7) 142.1 (135.7, 148.9) 181.0 (153.4, 208.6) <0.0001 126.9 (122.4, 131.3) 147.5 (140.8, 154.2) 179.2 (157.8, 200.7) <0.0001
Cardiac markers (age adjusted mean (95% CI))
NT-pro BNPa
(pg/mL) 122.7 (114.4, 134.3) 177.7 (157.6, 200.5) 871.3 (523.2, 1480.3) <0.0001 115.6 (106.7, 125.21) 192.5 (170.7, 217.06) 828.8 (561.2, 1224.2) <0.0001
cTnTa (pg/ml) 10.07 (9.68, 10.38) 13.32 (12.56, 14.15) 26.0 (20.49, 33.12) <0.0001 9.68 (9.30, 10.07) 14.15 (13.33, 14.88) 23.34 (19.49, 27.94) <0.0001
Non-invasive vascular measurements (age adjusted mean (95% CI))
PWV (m/s) 10.19 (10.09, 10.28) 10.11 (9.95, 10.26) 9.47 (8.82, 10.12) 0.09 10.15 (10.04, 10.25) 10.19 (10.03, 10.35) 9.60 (9.06, 10.14) 0.11
a, geometric mean; b, maximum n in group, varies slightly with missing co-variate data
SBP, systolic blood pressure; DBP, diastolic blood pressure; HDL-C, high density lipoprotein cholesterol; HbA1c, glycated haemoglobin; CRP, C-reactive
protein; IL-6, interleukin 6; vWF, von Willebrand factor; FEV1, forced expiratory volume in 1s; NT-pro BNP, N-terminal pro brain natriuretic peptide; cTnT,
cardiac troponin T;; PWV, pulse wave velocity;
CKD stage 1 – eGFR > 90ml/min/1.732; CKD stage 2 - eGFR 60-90ml/min/1.732; CKD stage 3a - eGFR 45-59ml/min/1.732; CKD stage 3b - eGFR 30-
44ml/min/1.732; CKD stage 4 - eGFR 15-29ml/min/1.732; CKD stage 5 – eGFR < 15ml/min/1.732
Missing data SBP (n=3); triglycerides (n=1); HDL-C (n=1); Hba1c (n=42); glucose (n=103); insulin (n=27); CRP (n=38); IL-6 (n=21); vWF (n=34); NTproBNP
(n=37); cTnT (n=37); PWV (n=29)
22
Table 4. Hazard ratio for all-cause and CVD mortality according to CKD categories based on eGFR
equations derived from serum creatinine (CKD-EPIcr) and from cystatin C (CKD-EPIcys)
Mortality Hazard Ratio (95% confidence interval)
All-Cause CVD
Age-adjusted Adjusted + Age-adjusted Adjusted +
CKD-EPIcr CKD Stages
1+2 1 1 1 1
3a+3b 1.60 (1.26, 2.05) 1.45 (1.13, 1.87) 2.02 (1.32, 3.11) 1.65 (1.05, 2.58)
4+5 3.88 (2.23, 6.74) 3.51 (1.99, 6.17) 6.62 (2.94, 14.88) 4.72 (2.03, 11.01)
3a+3b+4+5 (CKD) 1.70 (1.34, 2.16) 1.53 (1.20, 1.96) 2.21 (1.46, 3.36) 1.77 (1.14, 2.75)
CKD-EPIcys CKD Stages
1+2 1.00 1.00 1.00 1.00
3a+3b 1.75 (1.36, 2.25) 1.66 (1.28, 2.15) 2.33 (1.48, 3.65) 2.01 (1.26, 3.20)
4+5 3.63 (2.32, 5.68) 2.85 (1.75, 4.64) 6.45 (3.26, 12.78) 3.92 (1.82, 8.45)
3a+3b+4+5 (CKD) 1.88 (1.48, 2.40) 1.74 (1.35, 2.23) 2.62 (1.70, 4.05) 2.13 (1.35, 3.37)
CKD, chronic kidney disease
CKD stage 1 – eGFR > 90ml/min/1.732; CKD stage 2 - eGFR 60-90ml/min/1.732; CKD stage 3a -
eGFR 45-59ml/min/1.732; CKD stage 3b - eGFR 30-44ml/min/1.732; CKD stage 4 - eGFR 15-
29ml/min/1.732; CKD stage 5 – eGFR < 15ml/min/1.732
+Adjusted for age, smoking, cholesterol, systolic blood pressure, BMI, prevalent diabetes, prevalent
CVD (stroke, MI), prevalent heart failure, and BP lowering drugs.
23
Table 5. Reclasssification of men using the CKD-EPIcys equation among men who died and those
who did not die on follow-up
CKD-EPI Cys
1+2 3a+3b 4+5 Total
CKD-EPIcr Number of men who died (n = 291)
1+2 110
(75.3%)
36
(24.7%)
0 146
3a+3b 26
(19.7%)
93
(70.5%)
13
(9.8%)
132 49 classified up
28 classified down
4+5 0
(0%)
2
(15.4%)
11
(84.6%)
13
NRI = 0.07 p = 0.01
Number of men who did not die (n = 1310)
1+2 806
(85.4%)
136
(14.4%)
1
(0.1%)
943 149 classified up
144 classified down
3a+3b 140
(39.5%)
202
(57.1%)
12
(3.4%)
354
4+5 0 4
(30.8%)
9
(69.2%)
13
NRI = 0.004 p = 0.39
Overall NRI = 0.068 p = 0.02
CKD, chronic kidney disease; NRI, net reclassification improvement
CKD stage 1 – eGFR > 90ml/min/1.732; CKD stage 2 - eGFR 60-90ml/min/1.732; CKD stage 3a -
eGFR 45-59ml/min/1.732; CKD stage 3b - eGFR 30-44ml/min/1.732; CKD stage 4 - eGFR 15-
29ml/min/1.732; CKD stage 5 – eGFR < 15ml/min/1.732