Embed Size (px)
Citation preview
CHRONIC ABSENTEEISM: A CLOSER LOOK AT CONNECTICUT DATA
Strategic Action Group on Chronic Absence January 24, 2014 Ajit Gopalakrishnan, Chief Bureau of Data Collection, Research & Evaluation Prepared by: Marquelle Middleton Francis Apaloo

Why focus on Chronic Absenteeism? • Commonly reported aggregate attendance measures for
districts/schools/subgroups (e.g., a district attendance rate) may not adequately highlight the extent of individual absenteeism. For example, a high school may have an attendance rate of 92% but as many as quarter of their students could be chronically absent.
• Tracking attendance and chronic absenteeism on a frequent basis can help districts and schools to identify students who need interventions and support services. It is the first step to helping children achieve success in school.
2

Attendance Rate and Chronic Absenteeism (Eight Alliance Districts with Network Schools), 2011-12
0%
5%
10%
15%
20%
25%
30%
0%
10%
20%
30%
40%
50%
60%
70%
80%
90%
100%
A B C D E F G H State
Chr
onic
Abs
ente
eism
Rat
e
Atte
ndan
ce R
ate
3

School Attendance Matters • Students need to attend school daily to succeed. If chronic early absence is not
addressed at the elementary level, then it may worsen in the higher grades. A report by John Hopkins University outlines various research findings that highlight the association of chronic absenteeism to student academic achievement and high school graduation.
• Factors that contribute to chronic absence may be situated in the family, school and/or the community. Some examples of such factors include inadequate healthcare, high family mobility, low maternal education, food insecurity, ineffective parent engagement, and high levels of community violence.
• Solutions to high levels of chronic absenteeism will require the collaborative efforts of schools, communities, and families.
• Chang & Romero, Present, Engaged & Accounted For: The Critical Importance of Addressing Chronic Absence in the Early Grades, National Center for Children in Poverty: September 2008.
• Balfanz, R., & Byrnes, V. (2012). Chronic Absenteeism: Summarizing What We Know From Nationally Available Data. Baltimore: Johns Hopkins University Center for Social Organization of Schools.
4

Chronic Absenteeism • Chronic absenteeism is defined as missing ten percent or greater of
the total number of days enrolled in the school year for any reason. It includes both excused and unexcused absences.
• SDE has recently begun to analyze chronic absenteeism at the state, district and school level.
• Student Attendance Rate* = Student’s Total Days of Attendance Student’s Total Days of Membership
• A student is classified as chronically absent if his/her attendance rate
is less than or equal to 90%. *Source: Public School Information System (PSIS) June Collection
5

What have we learned? • Over 11 percent of K-12 students (around 60,000
students) are chronically absent
• Great disparities exist in chronic absenteeism rates: • Students eligible for free lunch are three times as likely as their
peers who are not eligible for lunch subsidies to be chronically absent
• Black/African American students are about twice as likely and Hispanic students are more than two times as likely as White students to be chronically absent
• English Language Learners and Students with Disabilities also evidence substantially higher chronic absenteeism rates when compared to their general education peers.
• Chronic absenteeism rates are higher in the urban districts.
6
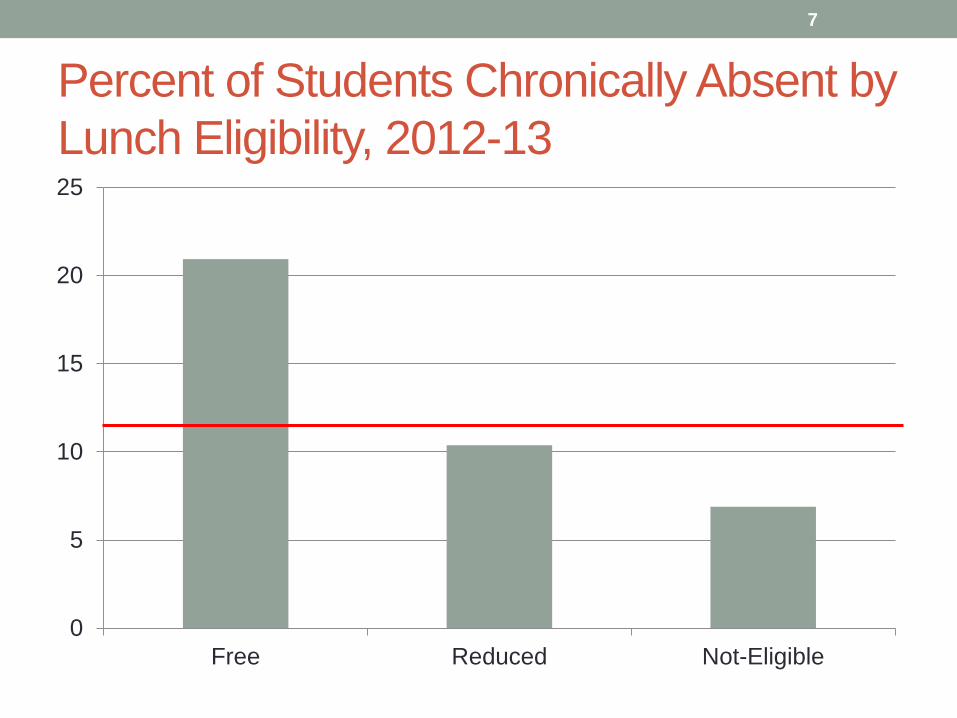
Percent of Students Chronically Absent by Lunch Eligibility, 2012-13
0
5
10
15
20
25
Free Reduced Not-Eligible
7
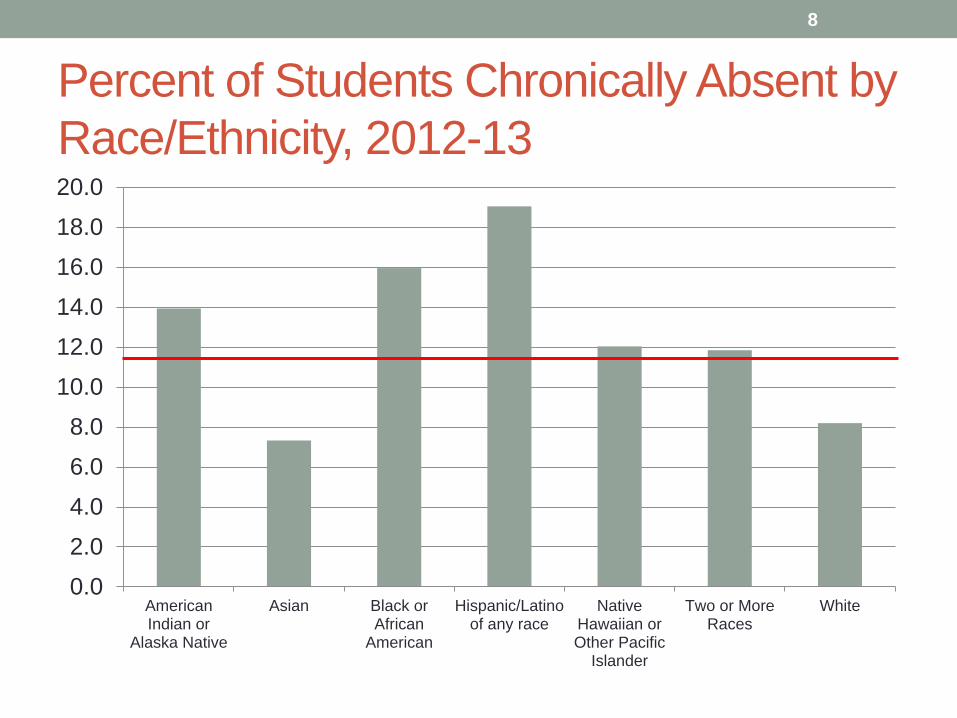
Percent of Students Chronically Absent by Race/Ethnicity, 2012-13
0.0
2.0
4.0
6.0
8.0
10.0
12.0
14.0
16.0
18.0
20.0
AmericanIndian or
Alaska Native
Asian Black orAfrican
American
Hispanic/Latinoof any race
NativeHawaiian orOther Pacific
Islander
Two or MoreRaces
White
8
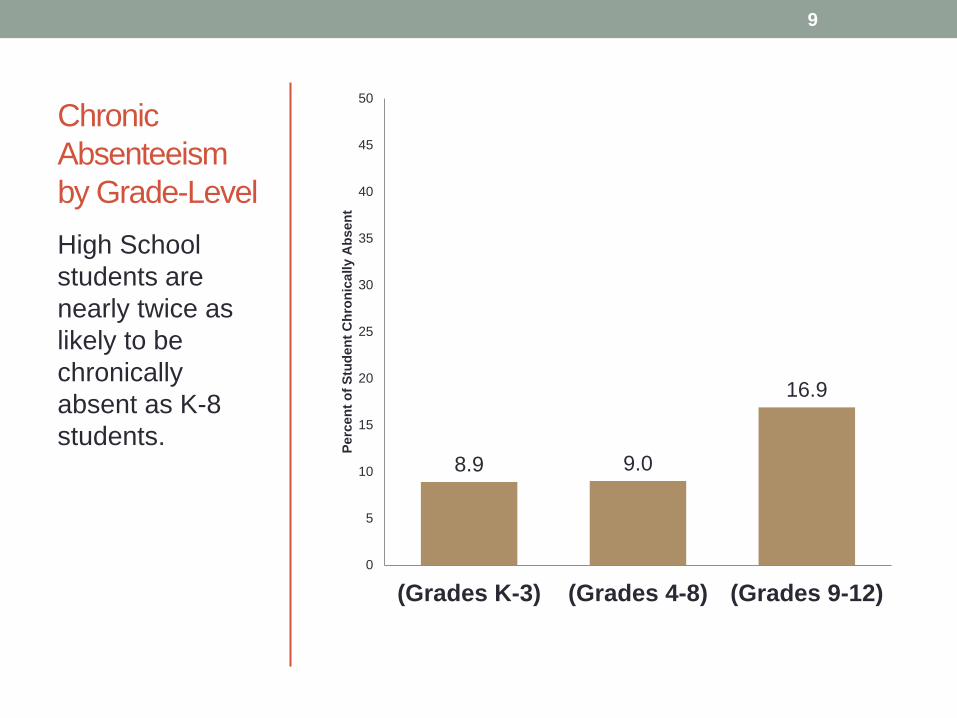
Chronic Absenteeism by Grade-Level High School students are nearly twice as likely to be chronically absent as K-8 students.
8.9 9.0
16.9
0
5
10
15
20
25
30
35
40
45
50
(Grades K-3) (Grades 4-8) (Grades 9-12)
Perc
ent o
f Stu
dent
Chr
onic
ally
Abs
ent
9
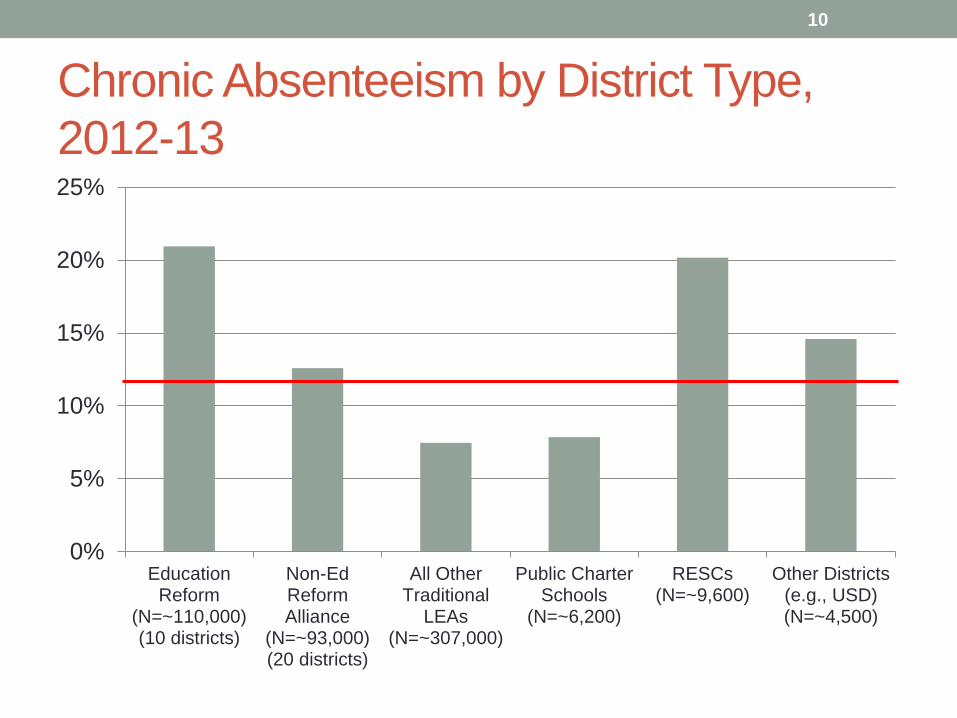
Chronic Absenteeism by District Type, 2012-13
0%
5%
10%
15%
20%
25%
EducationReform
(N=~110,000)(10 districts)
Non-EdReformAlliance
(N=~93,000)(20 districts)
All OtherTraditional
LEAs(N=~307,000)
Public CharterSchools
(N=~6,200)
RESCs(N=~9,600)
Other Districts(e.g., USD)(N=~4,500)
10
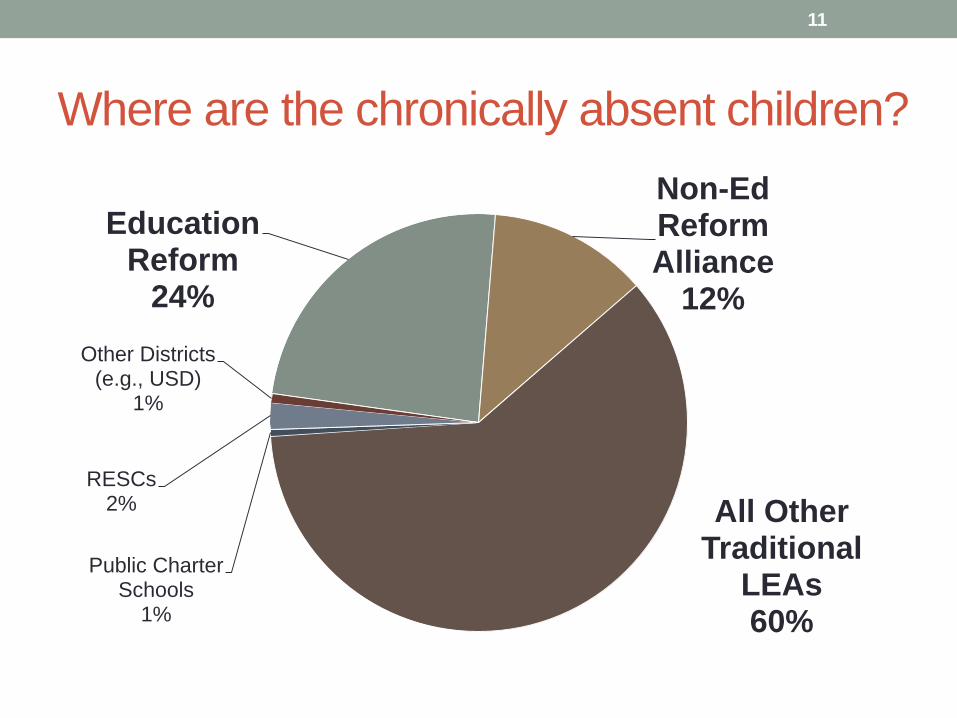
Where are the chronically absent children?
Education Reform
24%
Non-Ed Reform Alliance
12%
All Other Traditional
LEAs 60%
Public Charter Schools
1%
RESCs 2%
Other Districts (e.g., USD)
1%
11

Association of Student Attendance to Achievement and Graduation, 2011-12 • Students were grouped into the following attendance
categories to examine their association to student achievement on CMT (standard CMT only) and 4-year graduation
• In general, students with better attendance evidence higher achievement and graduation rates even among subgroups
Attendance Rate Level Definition
Satisfactory Student attendance rate greater than 95%
At Risk Student attendance rate between 90-95%
Chronically Absent Student attendance rate of less than or equal to 90%
12

Percent of Students by Attendance Category for CMT Analysis (Grades 3-8)
SATISFACTORY 70%
AT RISK 22%
CHRONIC 8%
13
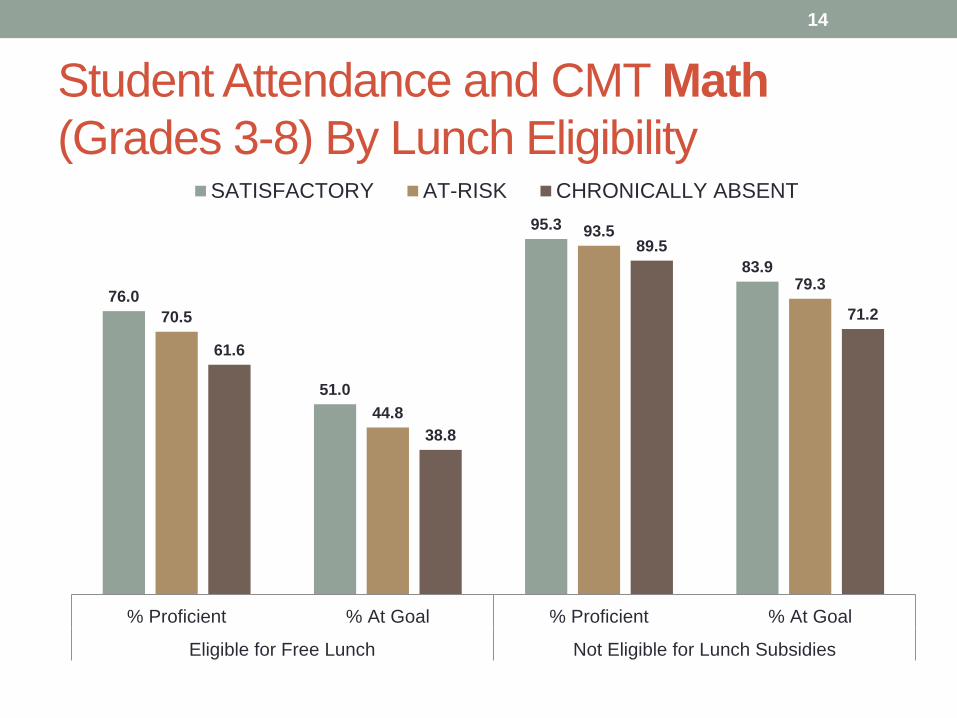
Student Attendance and CMT Math (Grades 3-8) By Lunch Eligibility
76.0
51.0
95.3
83.9
70.5
44.8
93.5
79.3
61.6
38.8
89.5
71.2
% Proficient % At Goal % Proficient % At Goal
Eligible for Free Lunch Not Eligible for Lunch Subsidies
SATISFACTORY AT-RISK CHRONICALLY ABSENT
14

Student Attendance and CMT Reading (Grades 3-8) by Lunch Eligibility
68.8
53.1
92.0
84.0
65.9
50.9
91.1
82.3
61.1
47.8
88.6
79.8
% Proficient % At Goal % Proficient % At Goal
Eligible for Free Lunch Not Eligible for Lunch Subsidies
SATISFACTORY AT-RISK CHRONICALLY ABSENT
15
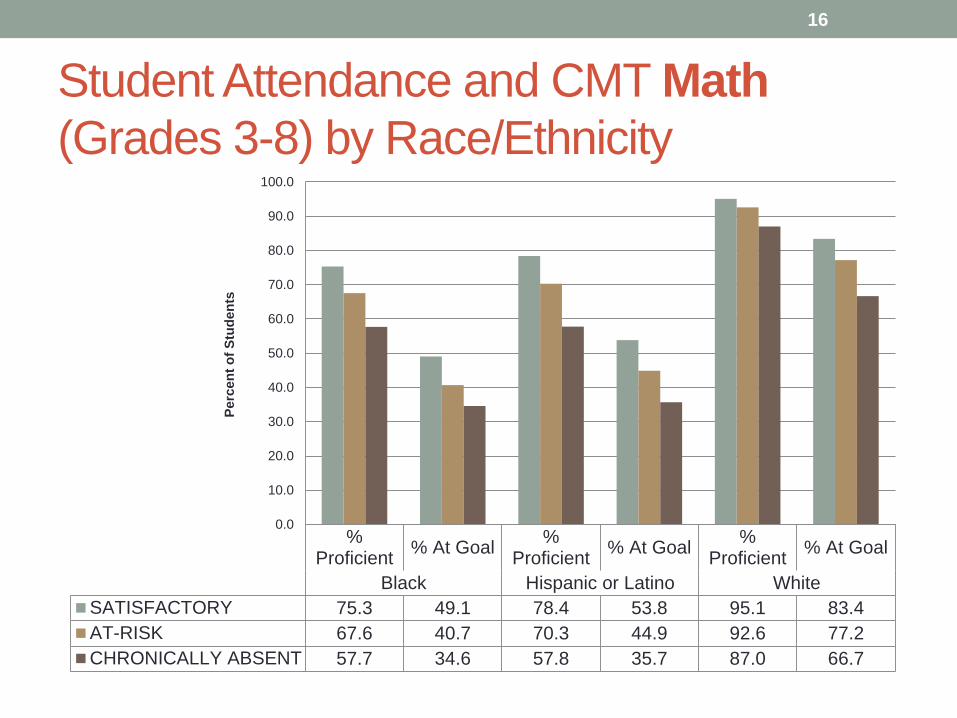
Student Attendance and CMT Math (Grades 3-8) by Race/Ethnicity
%Proficient % At Goal %
Proficient % At Goal %Proficient % At Goal
Black Hispanic or Latino WhiteSATISFACTORY 75.3 49.1 78.4 53.8 95.1 83.4AT-RISK 67.6 40.7 70.3 44.9 92.6 77.2CHRONICALLY ABSENT 57.7 34.6 57.8 35.7 87.0 66.7
0.0
10.0
20.0
30.0
40.0
50.0
60.0
70.0
80.0
90.0
100.0
Perc
ent o
f Stu
dent
s
16

Student Attendance and CMT Reading (Grades 3-8) by Race/Ethnicity
%Proficient
% AtGoal
%Proficient
% AtGoal
%Proficient
% AtGoal
Black Hispanic or Latino WhiteSATISFACTORY 70.9 54.7 70.2 55.3 91.5 83.2AT-RISK 65.1 49.4 65.5 50.6 89.7 80.4CHRONICALLY ABSENT 57.6 43.9 58.2 44.9 85.5 75.6
0.0
10.0
20.0
30.0
40.0
50.0
60.0
70.0
80.0
90.0
100.0Pe
rcen
t of S
tude
nts
17
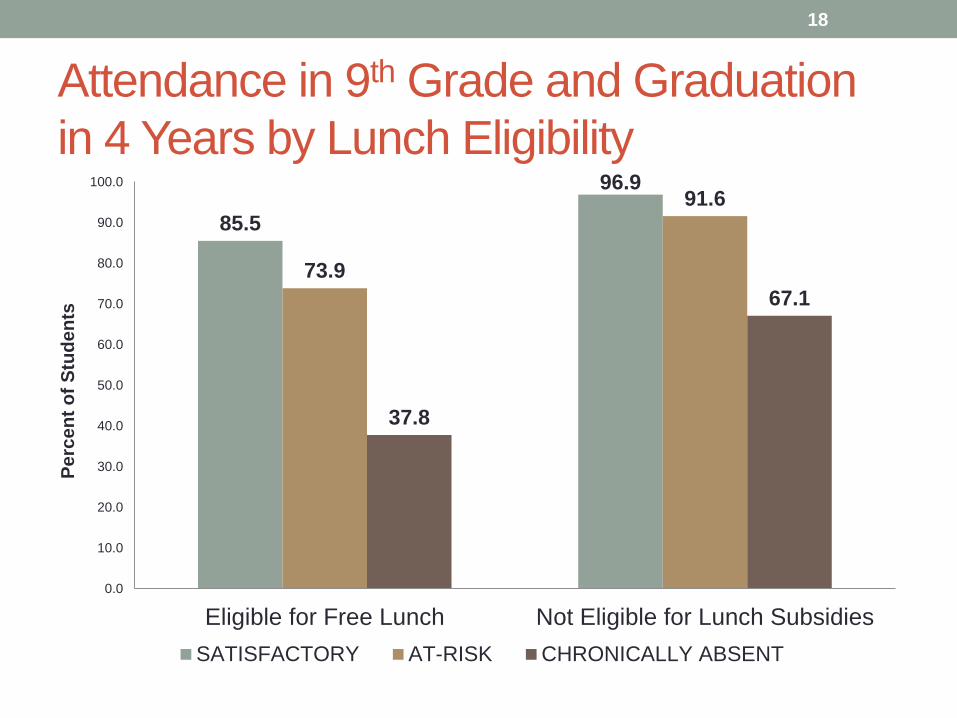
Attendance in 9th Grade and Graduation in 4 Years by Lunch Eligibility
85.5
96.9
73.9
91.6
37.8
67.1
0.0
10.0
20.0
30.0
40.0
50.0
60.0
70.0
80.0
90.0
100.0
Eligible for Free Lunch Not Eligible for Lunch Subsidies
Perc
ent o
f Stu
dent
s
SATISFACTORY AT-RISK CHRONICALLY ABSENT
18

Attendance in 9th Grade and Graduation in 4 years by Race/Ethnicity
87.8 88.3
96.4
76.5 74.6
89.7
39.7 35.2
61.9
0.0
10.0
20.0
30.0
40.0
50.0
60.0
70.0
80.0
90.0
100.0
Black Hispanic or Latino White
Perc
ent o
f Stu
dent
s
SATISFACTORY AT-RISK CHRONICALLY ABSENT
19

Chronic Absenteeism Reports in PSIS (June PSIS Collection ONLY)
Districts are encouraged to review all attendance related reports available in the June collection and make any necessary changes to a student’s reported membership and attendance days prior to the final certification process.

SAMPLE REPORTING: Chronic Absenteeism by District or School (Available in June 2013 PSIS collection Only)
• Chronic Absenteeism reports are available to districts in the June collection of PSIS upon PRE-CERTIFICATION of the data uploaded to CSDE.
• Both the District-Level and
School-level reports provide the true count and percentage of chronically absent students across the standard demographic subgroups.