Embed Size (px)
Citation preview

Chronic Absence: The Earliest Early Warning Sign of Academic Risk
October 21, 2011
Hedy ChangDirector, Attendance WorksCo-Chair, Chronic Absence & Attendance Partnership
1

2
Average Daily Attendance: The percentage of enrolled students who attend school each day.
Satisfactory Attendance: Missing 5% or less of school in an academic year.
Chronic Absence: Missing 10% or more of school in an academic year for any reason—excused or unexcused.
Severe Chronic Absence: Missing 20% or more days of school per year – approximately two months of school.
Truancy: Typically refers only to unexcused absences and is defined by each state. In CA, it is missing 3 days of school without a valid excuse, or being late to class 3 times without a valid excuse.
Defining Key Terms

3
Students Who Miss More Than 10% Of School Are At Grave Risk
When 90% Doesn’t Earn an “A”
Chronic Absence(=>10% absence)
Warning Signs(<10% but >5% absence)
Satisfactory Attendance(=<5% absence)
0-90%
91-94%
95 %+
Emergency: =>20% absence

4
Students Chronically Absent in Kindergarten & 1st Grade Much Less Likely to Read Proficiently in 3rd Grade
No risk Missed less than 5% of school in K & 1st tSmall risk Missed 5-9% of days in both K & 1st
Moderate risk 5-9% of days absent in 1 year &10 % in 1 year
High risk Missed 10% or more in K & 1st
Source: Applied Survey Research & Attendance Works (April 2011)

5
40
42
44
46
48
50
52
0-3.3% in K 3.3 - 6.6% in K 6.6-10.0% in K >=10.0% in K
Ave
rage
Aca
dem
ic P
erfo
rmanc
e
Absence Rate in Kindergarten
Reading
Math
The Long-term impact of Chronic Kindergarten Absence Is Most Troubling for Poor Children
Source: ECLS-K data analyzed by National Center for Children in Poverty (NCCP) Note: Average academic performance reflects results of direct cognitive assessments conducted for ECLS-K.
5th Grade Math and Reading Performance By K Attendance

6
Chronically Absent 6th Graders Have Lower Graduation Rates
Dropout Rates by Sixth Grade Attendance(Baltimore City Public Schools, 1990-2000 Sixth Grade Cohort)
Severely Chronically
Absent
ChronicallyAbsent
NotChronically
Absent
Source: Baltimore Education Research Consortium SY 2009-2010

7
9th Grade Attendance Predicts Graduation for Students of All Economic Backgrounds
Note: This Chicago study found attendance was a stronger graduation predictor than 8th grade test scores.
Source: Allensworth & Easton, What Matters for Staying On-Track and Graduating in Chicago Public Schools, Consortium on Chicago School Research at U of C, July 2007
Need to recolor chart
8
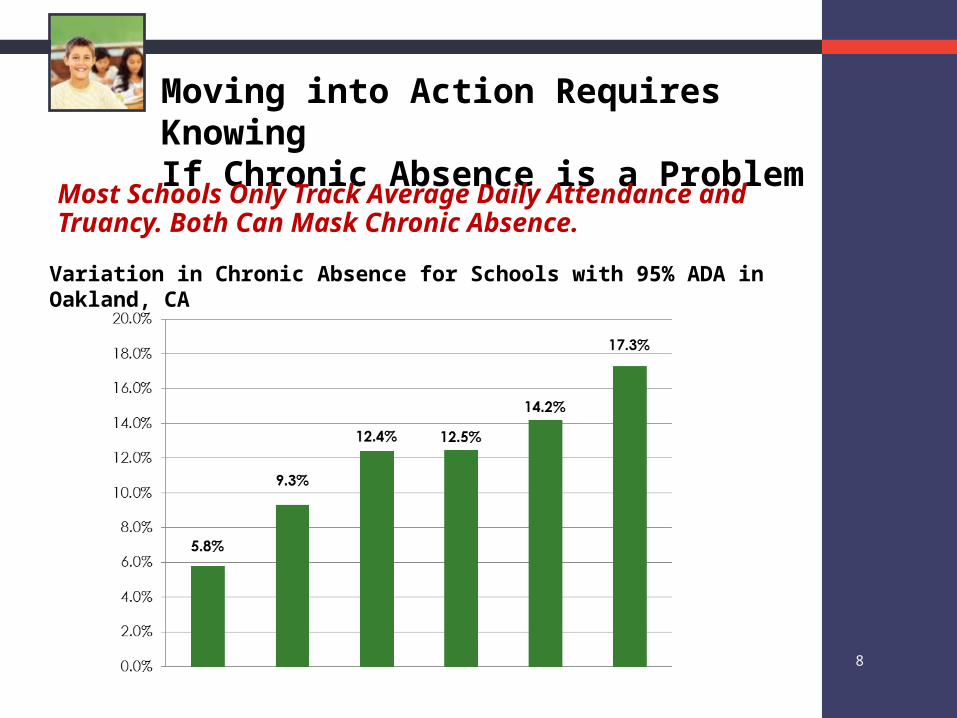
Moving into Action Requires KnowingIf Chronic Absence is a Problem
Most Schools Only Track Average Daily Attendance and Truancy. Both Can Mask Chronic Absence.
Variation in Chronic Absence for Schools with 95% ADA in Oakland, CA

9
Schools with 93% have significant levels of chronic absence
.

10
Emerging Data Shows High Levels
If the 5,421 students chronically absent in 09/10 had each attended 6 more days, OUSD would have received more than $1,147,000 in additional ADA.

11
Chronic Absence Found In Rural Not Just Urban Communities
1 out of 6 (16%) students were chronically absent.

12
Chronic absence data (as well as other attendance measures) should be examined by classroom, grade, school, neighborhood or sub-population.
If chronic absence is unusually high for a particular group of students, explore what might be common issues (unreliable transportation, community violence, asthma and other chronic diseases, poor access to health care, unnecessary suspension for non-violent offenses, lack of engaging curriculum, child care or afterschool programming, foreclosures, etc.)
If chronic absence is unusually low for a high risk population, find out what they are doing that works.
12
Data is Needed for Identifying Programmatic Solutions

13
Chronic Absence Disproportionately Affects Students of Color
Ethnicity # Students with 91% Attendance
or Below
% Students with 91%
Attendance or Below
AMERICAN INDIAN 467 22.6%
ASIAN 2,909 7.6%
BLACK 15,341 26.6%
HISPANIC 72,733 16.1%
WHITE 8,621 15.8%
PACIFIC ISLANDER 316 18.4%
FILIPINO 58 8.2%
Total 100,445 16.6%
Los Angeles Unified School District 2009-2010

14
Elementary Absenteeism Concentrated in W. Oakland

15
Middle School Absenteeism

16
Patterns Change Substantially By High School

17
Variation Helps Identify Good Practice and Need for Intervention
Chronic Absence Levels Among Oakland Public Schools

18
Schools + Communities CAN Make a Difference
Characteristics of Successful Attendance Initiatives
Partner with community agencies to help families carry out their responsibility to get children to school.
Make attendance a priority, set targets and monitor progress over time.
Engage parents and students in identifying and addressing school, family, and community issues that contribute to chronic absence.
Clearly communicate expectations for attendance to students and families.
Begin early, ideally in Pre-K.
Combine targeted interventions with universal strategies that nurture an engaged learning environment, build a culture of attendance and ensure physical health and safety at school.
Offer positive supports before punitive action.

19
Increased Attendance Involves a 3-Tiered Approach that Fits with Most Reform Efforts
5-15% of a school’s
students
Students who are chronically absent & habitually truant
15-20% of a school’s
students
Students at-risk for poor attendance and/or with rising absence rates
65-100% of a school’s
students
All students in the school
Recovery
Programs
Intervention
Programs
Universal/Preventative
Initiatives and Programs
High Cost
Low Cost

20
Improving Attendance Takes an Cross-Disciplinary Approach
Universal Attendance SupportsSafe and supportive school environmentInviting and engaging classroom environmentIntentional family involvement and participationOn-going attention to attendance data Rapid parent contact for unexplained absencesRecognition for good and improved attendance Collaboration with afterschool programs and early childhood programs to build a culture of attendanceIncreased access to school based health supportsA school plan and budget that reflects high attendance priorities
Individual Assessments and Intervention Refer chronically absent/ truant students for intervention including SART &SARBIdentify and remove barriers Provide on-going support
Recovery StrategiesInteragency StaffingCase management and wrap-around servicesReferral as last resort for court -based intervention
Baltimore Student Attendance WorkGroup adapted from Scott Perry, Attendance Audit, Oregon

21
Attendance is more heavily influenced by the youth although family still matters.
Older youth may miss school due to family responsibilities ( e.g. caring for siblings or ill parent, holding a job).
Mental health, teen pregnancy, chronic conditions, and dental disease are top health concerns that affect attendance
Safety issues (In-school and community) play even greater role. Students miss school due to suspensions for non-violent
behaviors. Students become discouraged as they fall behind in credits and
graduation feels increasingly unattainable. Direct and meaningful engagement of youth in the classroom
and activities on campus even more essential.
Considerations for Older Youth

Hedy Chang, Directorwww.Attendanceworks.org
22