Embed Size (px)
DESCRIPTION
chromatography
Citation preview
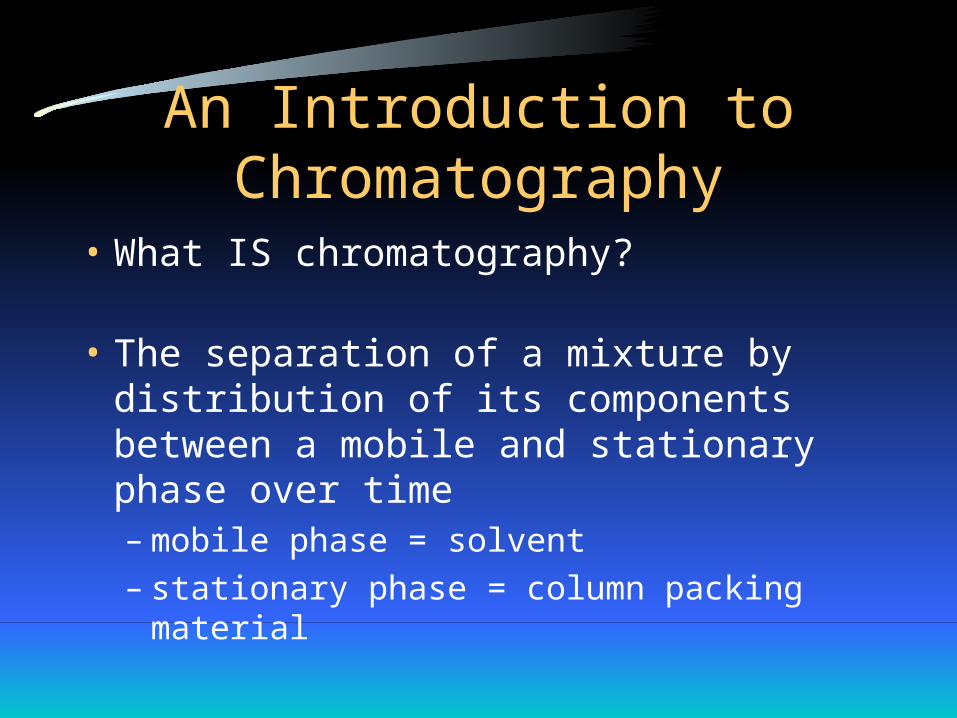
An Introduction to Chromatography
• What IS chromatography?
• The separation of a mixture by distribution of its components between a mobile and stationary phase over time– mobile phase = solvent– stationary phase = column packing material
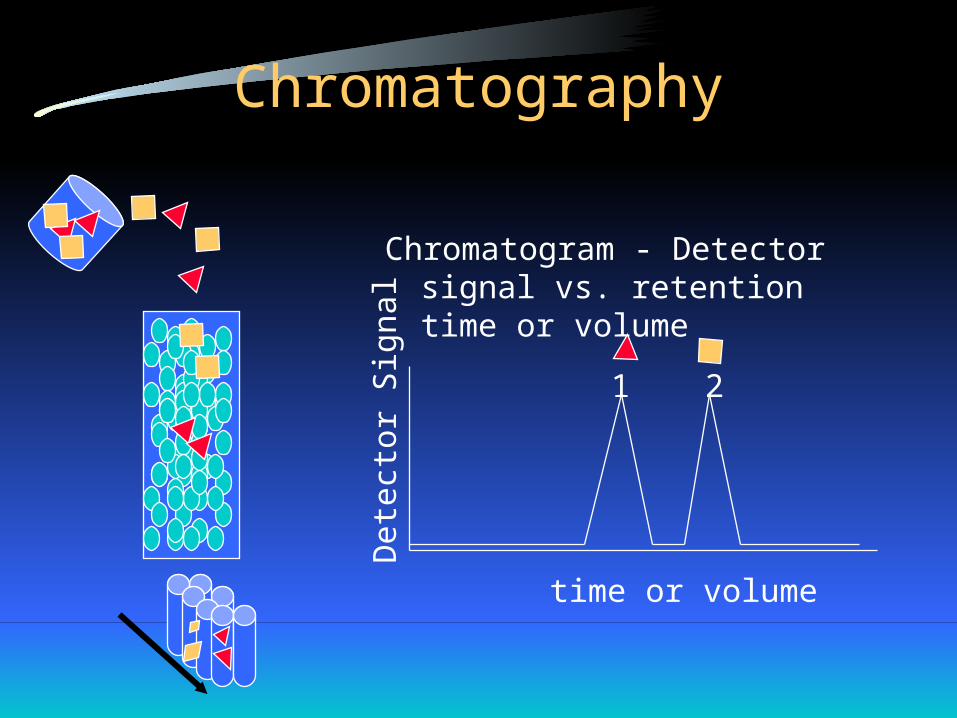
Chromatography
Chromatogram - Detector signal vs. retention time or volume
time or volume
Det
ecto
r S
igna
l1 2
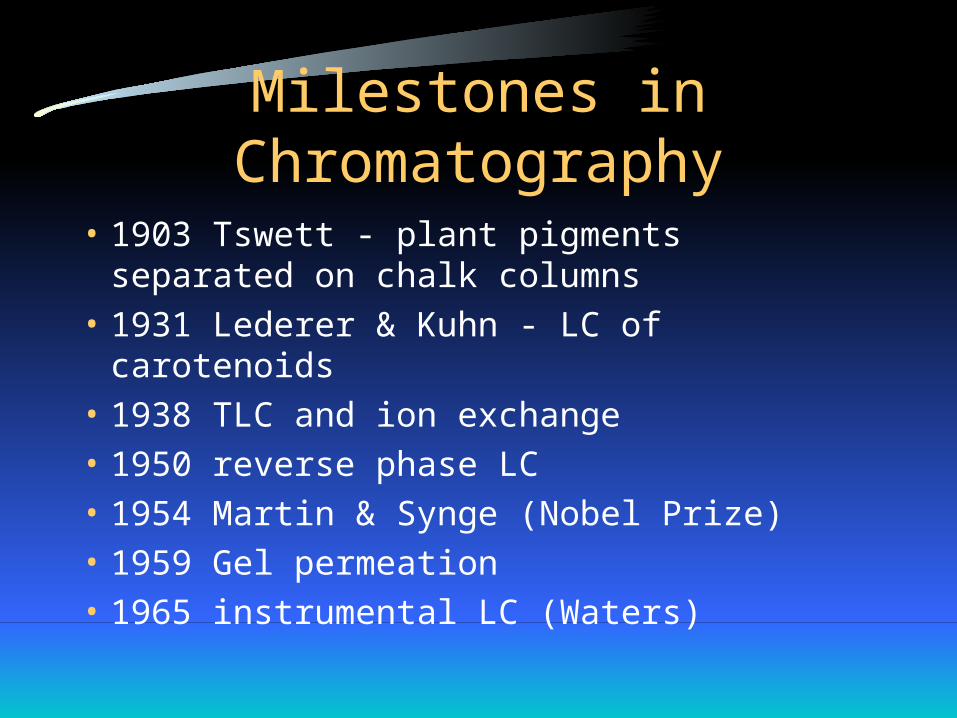
Milestones in Chromatography
• 1903 Tswett - plant pigments separated on chalk columns
• 1931 Lederer & Kuhn - LC of carotenoids
• 1938 TLC and ion exchange
• 1950 reverse phase LC
• 1954 Martin & Synge (Nobel Prize)
• 1959 Gel permeation
• 1965 instrumental LC (Waters)
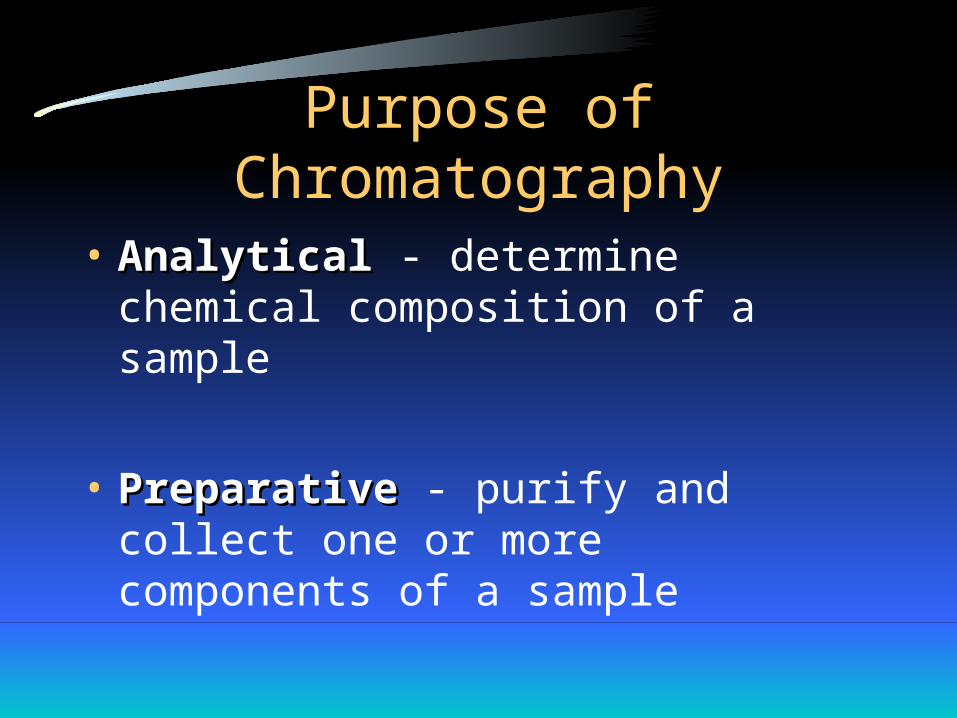
Purpose of Chromatography
• AnalyticalAnalytical - determine chemical composition of a sample
• PreparativePreparative - purify and collect one or more components of a sample
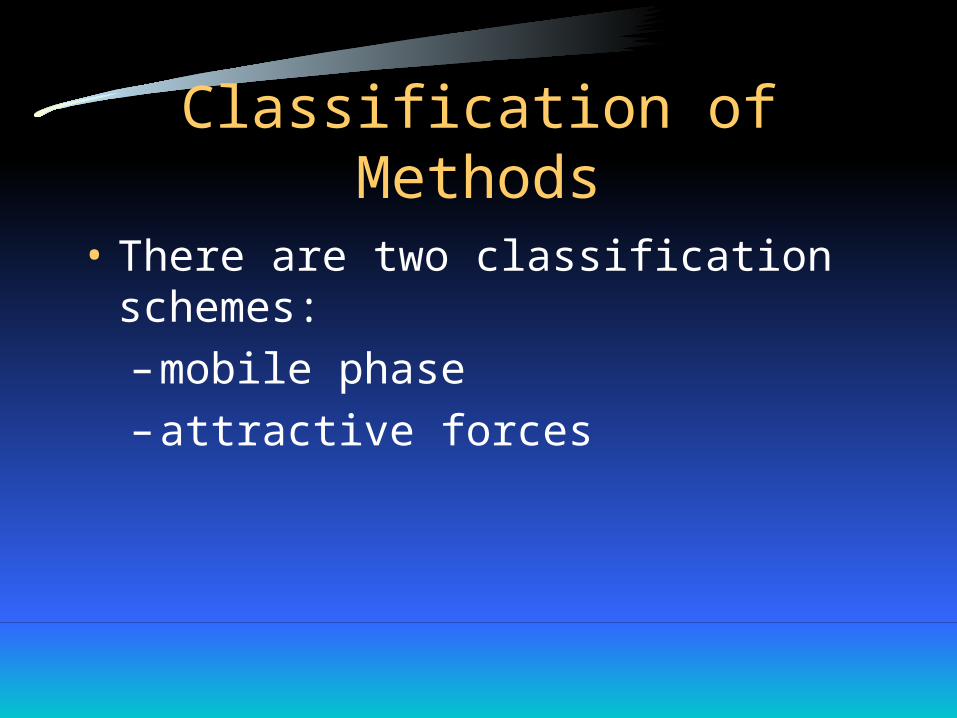
Classification of Methods
• There are two classification schemes:
– mobile phase
– attractive forces
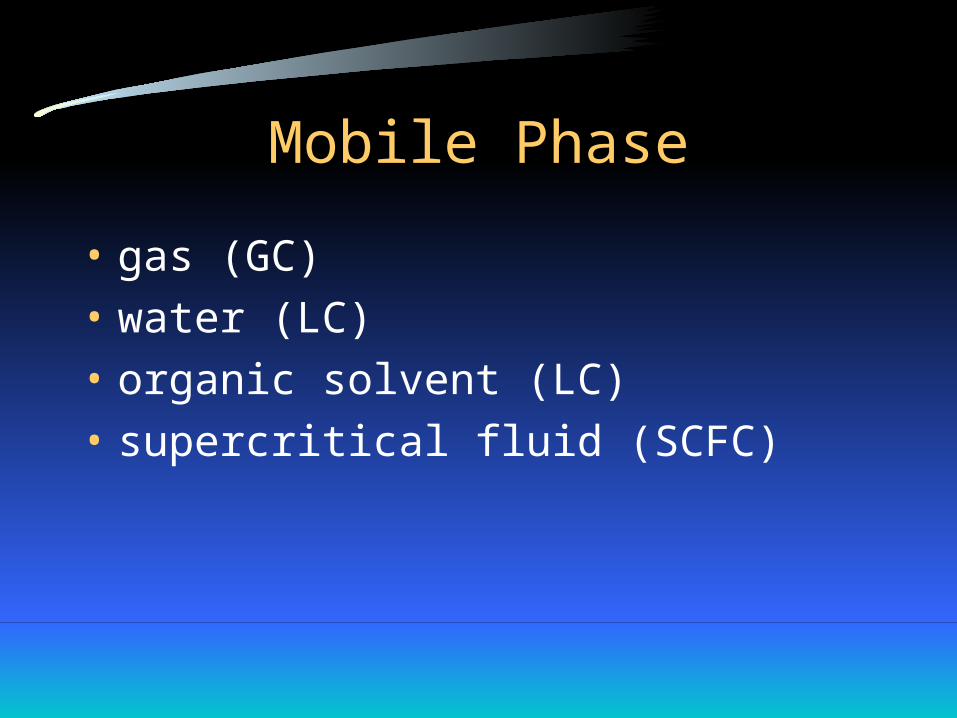
Mobile Phase
• gas (GC)
• water (LC)
• organic solvent (LC)
• supercritical fluid (SCFC)
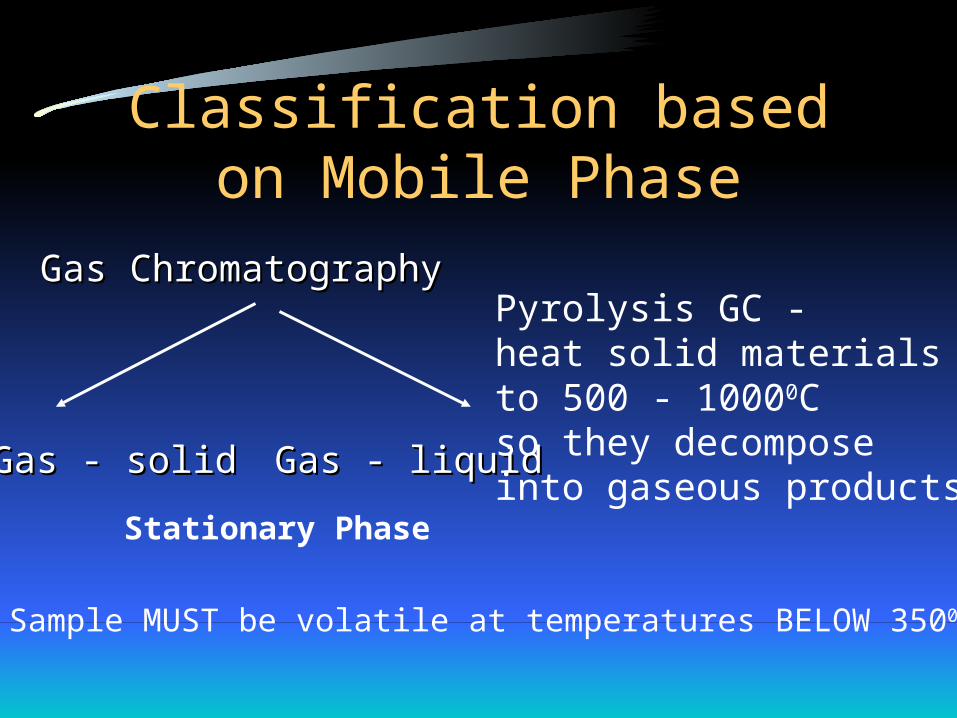
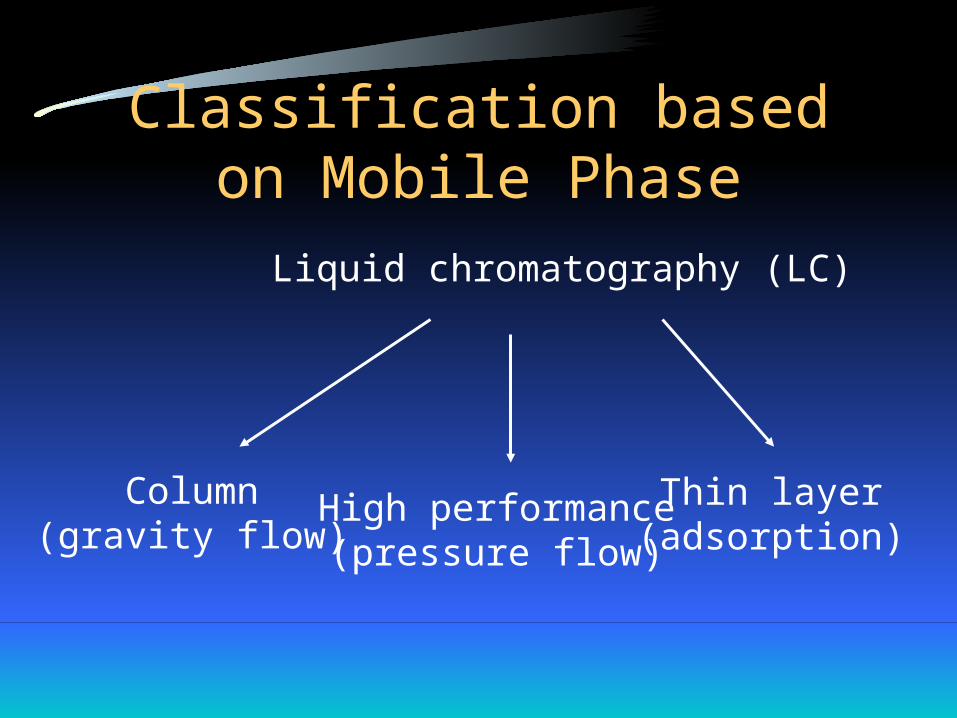
Classification based on Mobile Phase
Gas ChromatographyGas Chromatography
Gas - solidGas - solid Gas - liquidGas - liquid
Stationary Phase
Sample MUST be volatile at temperatures BELOW 3500C
Pyrolysis GC -heat solid materialsto 500 - 10000Cso they decomposeinto gaseous products
Classification based on Mobile Phase
Liquid chromatography (LC)
Column(gravity flow)
High performance(pressure flow)
Thin layer(adsorption)
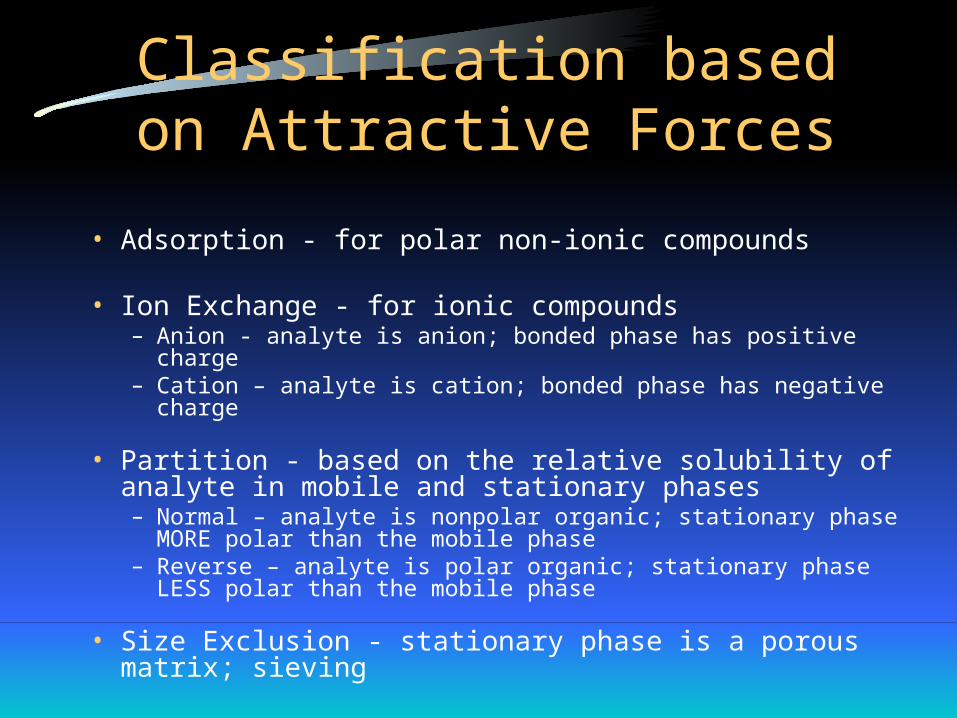
Classification based on Attractive Forces
• Adsorption - for polar non-ionic compounds
• Ion Exchange - for ionic compounds– Anion - analyte is anion; bonded phase has positive charge– Cation – analyte is cation; bonded phase has negative charge
• Partition - based on the relative solubility of analyte in mobile and stationary phases– Normal – analyte is nonpolar organic; stationary phase MORE polar
than the mobile phase – Reverse – analyte is polar organic; stationary phase LESS polar than
the mobile phase
• Size Exclusion - stationary phase is a porous matrix; sieving
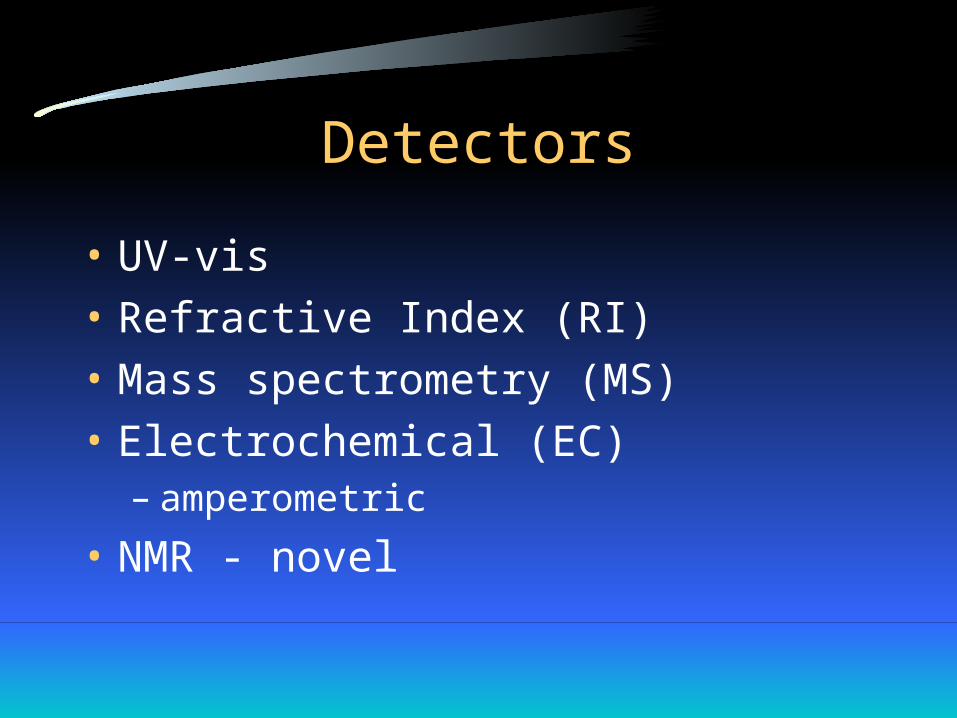
Detectors
• UV-vis
• Refractive Index (RI)
• Mass spectrometry (MS)
• Electrochemical (EC)– amperometric
• NMR - novel
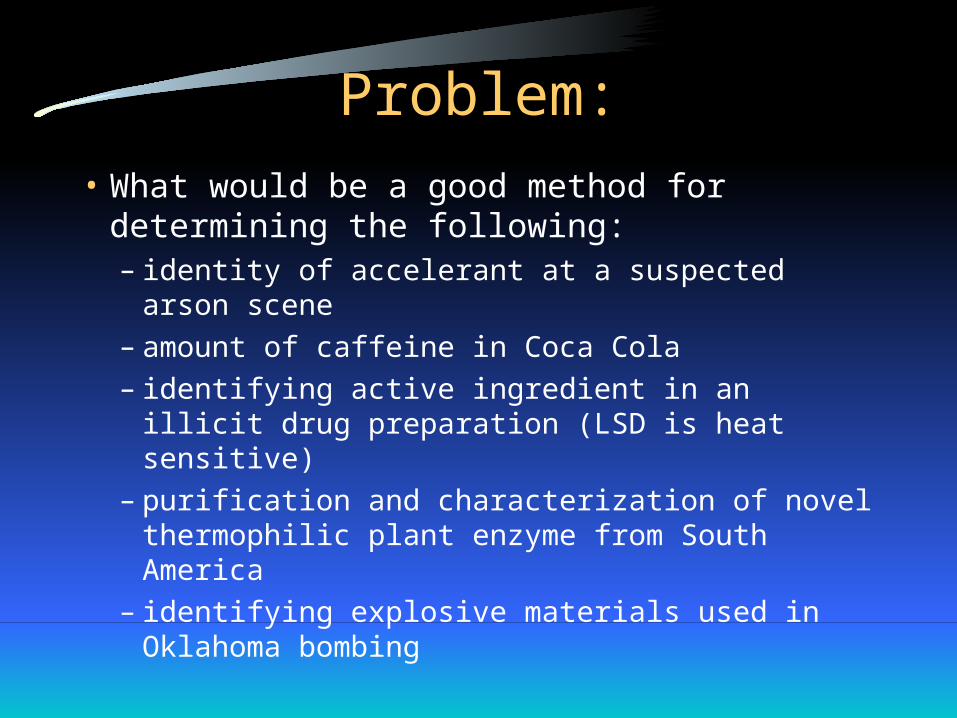
Problem:
• What would be a good method for determining the following:– identity of accelerant at a suspected arson scene– amount of caffeine in Coca Cola– identifying active ingredient in an illicit drug
preparation (LSD is heat sensitive)– purification and characterization of novel
thermophilic plant enzyme from South America– identifying explosive materials used in
Oklahoma bombing

The GC-MS Process
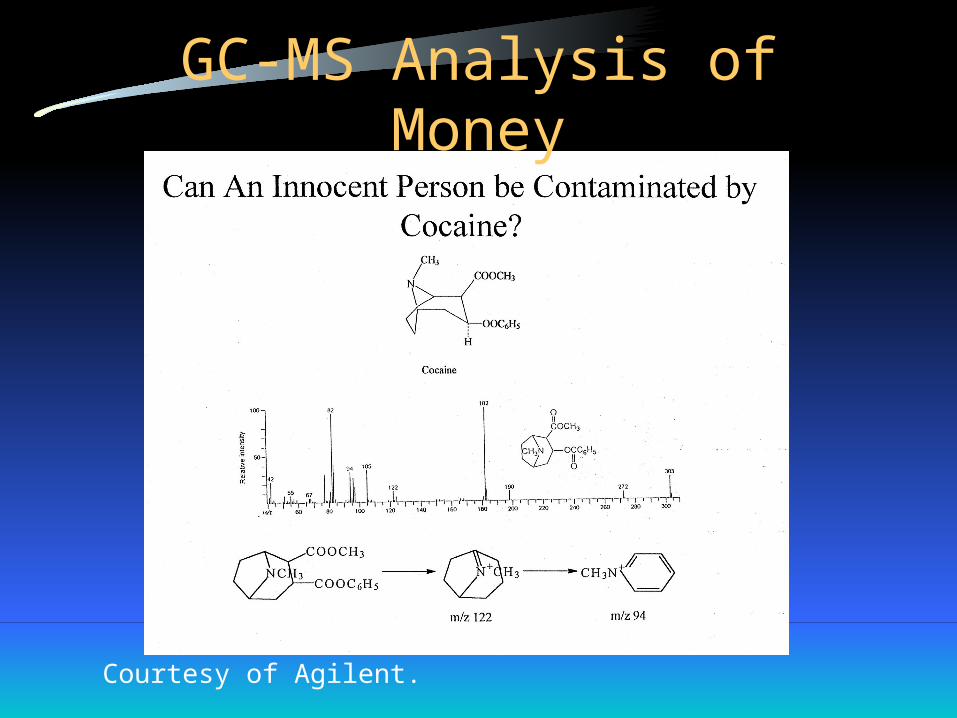
GC-MS Analysis of Money
Courtesy of Agilent.
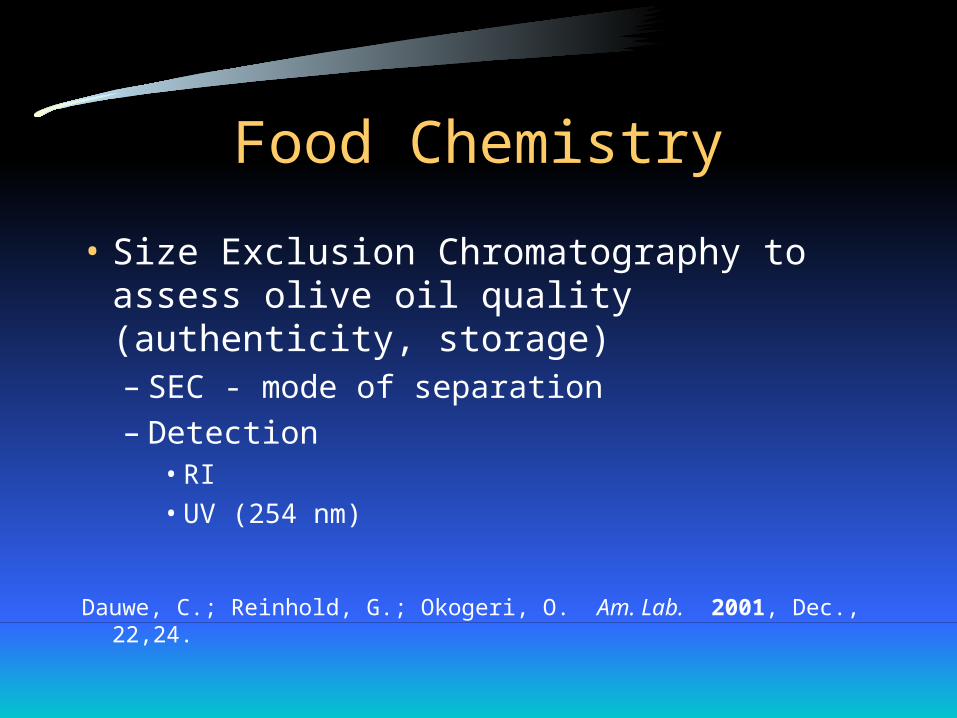
Food Chemistry
• Size Exclusion Chromatography to assess olive oil quality (authenticity, storage)– SEC - mode of separation– Detection
• RI
• UV (254 nm)
Dauwe, C.; Reinhold, G.; Okogeri, O. Am. Lab. 2001, Dec., 22,24.
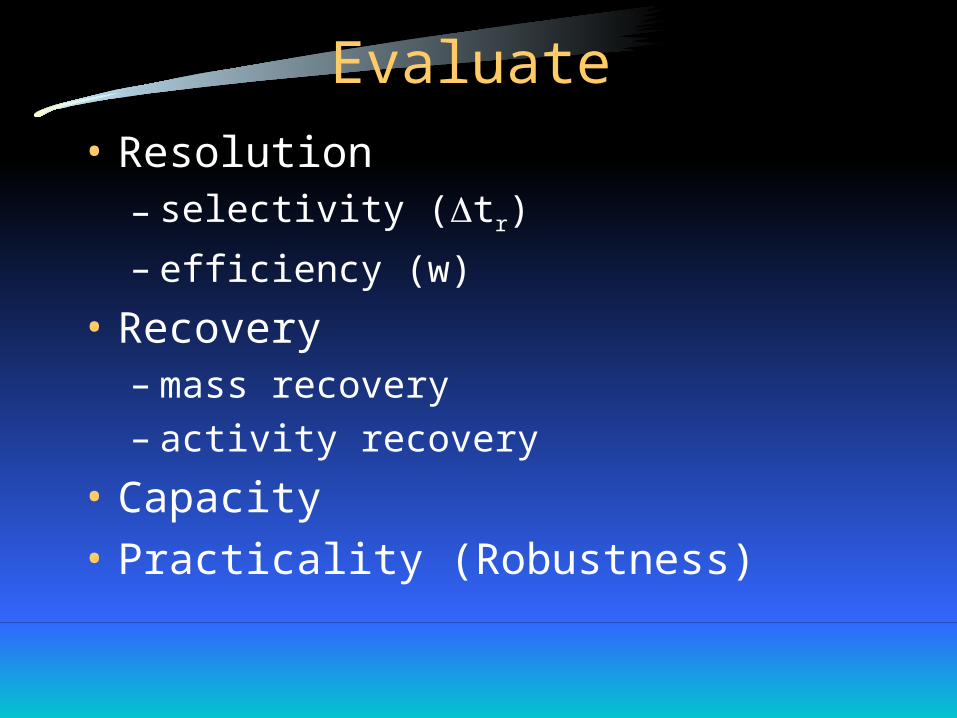
Evaluate
• Resolution– selectivity (tr)
– efficiency (w)
• Recovery– mass recovery– activity recovery
• Capacity
• Practicality (Robustness)

Instrumentation
Analytical Chemistry
Lecture #2
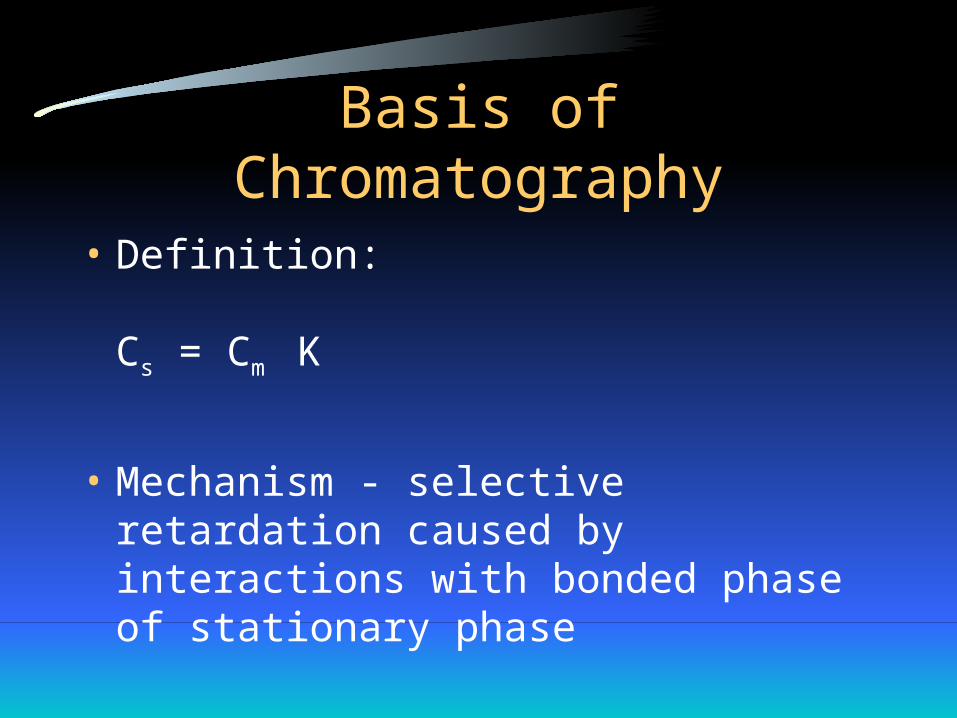
Basis of Chromatography
• Definition:
Cs = Cm K
• Mechanism - selective retardation caused by interactions with bonded phase of stationary phase
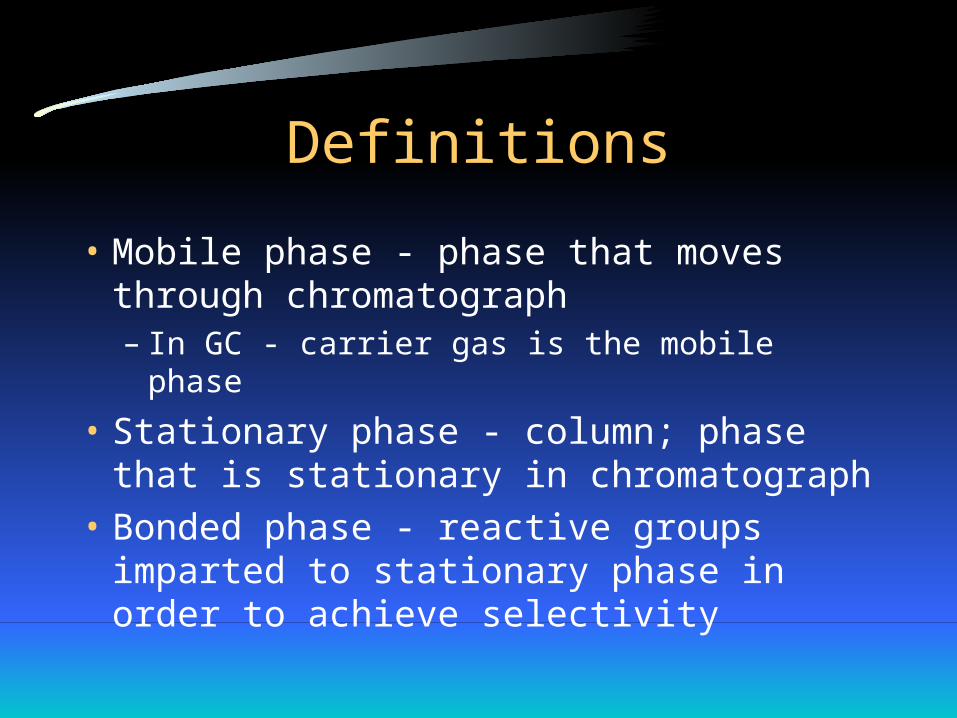
Definitions
• Mobile phase - phase that moves through chromatograph– In GC - carrier gas is the mobile phase
• Stationary phase - column; phase that is stationary in chromatograph
• Bonded phase - reactive groups imparted to stationary phase in order to achieve selectivity
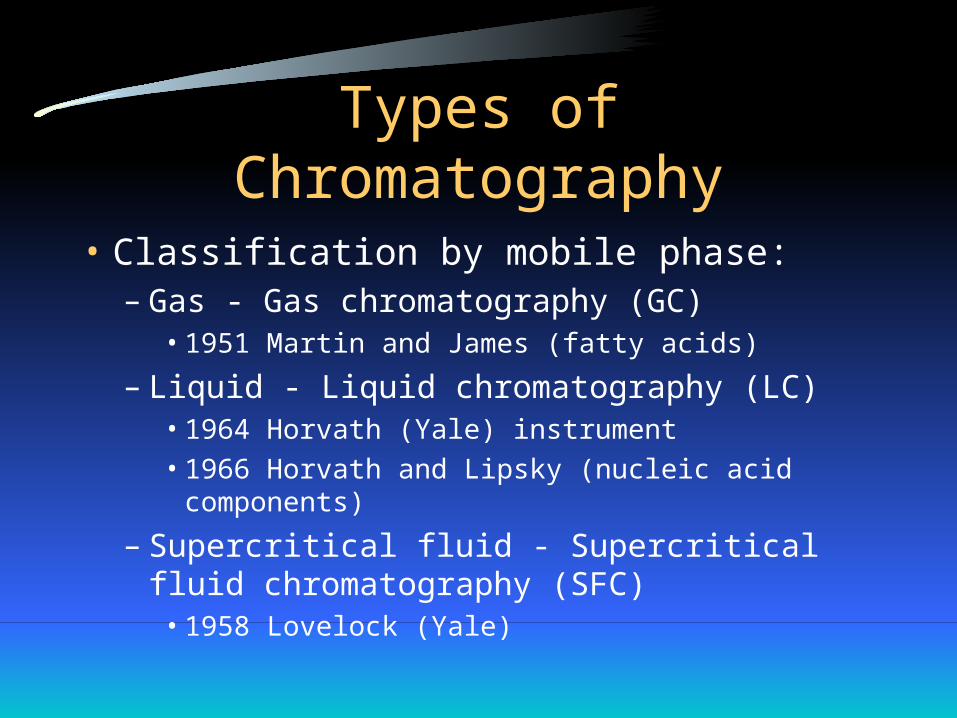
Types of Chromatography
• Classification by mobile phase:– Gas - Gas chromatography (GC)
• 1951 Martin and James (fatty acids)
– Liquid - Liquid chromatography (LC)• 1964 Horvath (Yale) instrument
• 1966 Horvath and Lipsky (nucleic acid components)
– Supercritical fluid - Supercritical fluid chromatography (SFC)
• 1958 Lovelock (Yale)
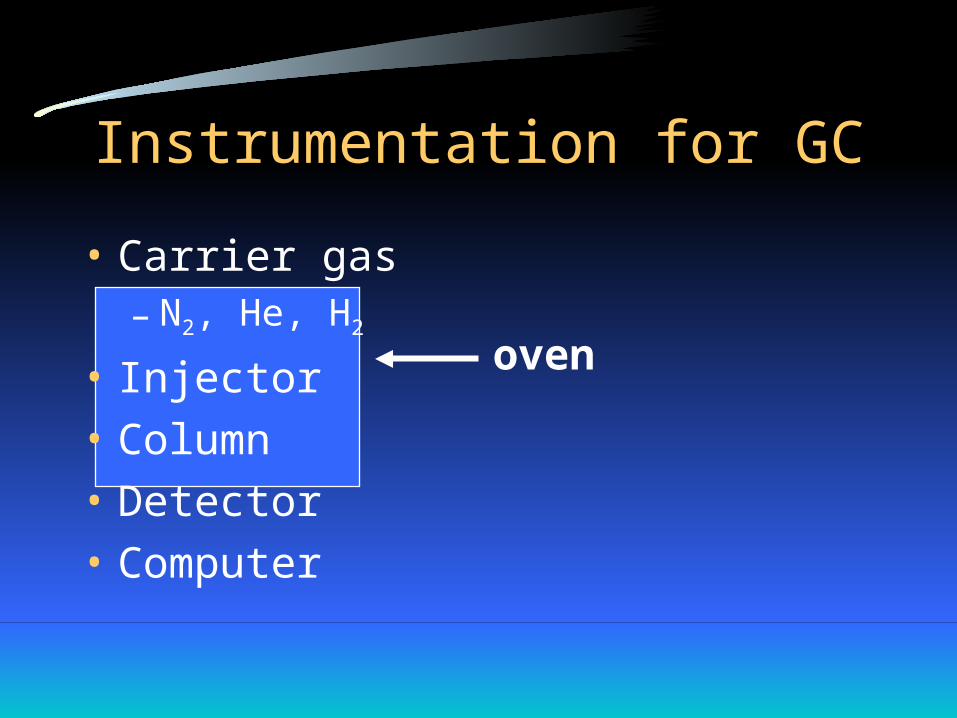
Instrumentation for GC
• Carrier gas– N2, He, H2
• Injector
• Column
• Detector
• Computer
oven
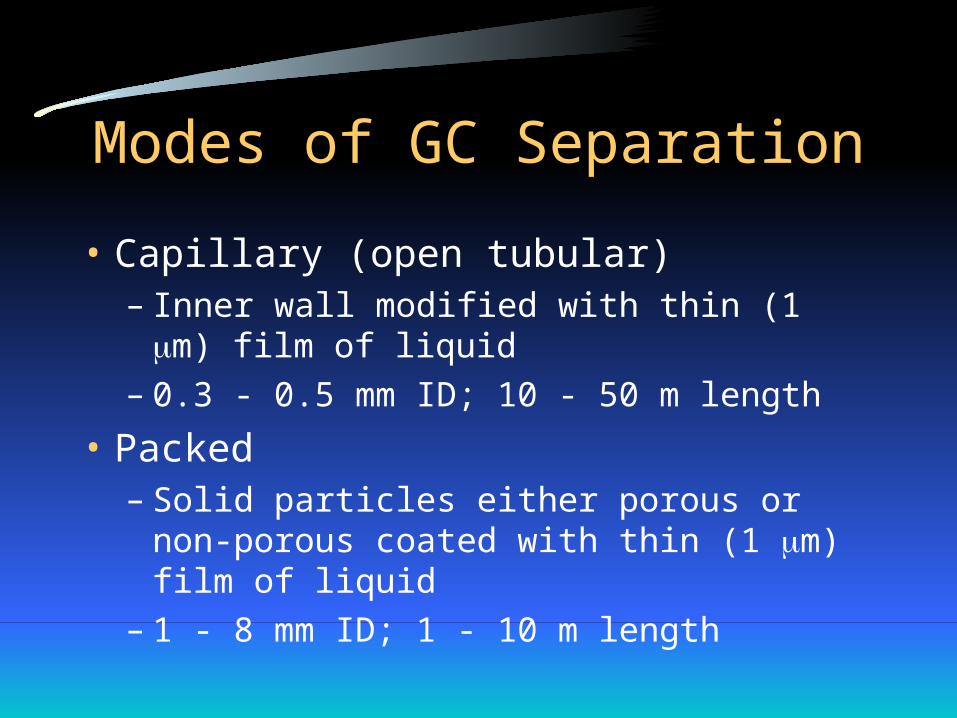
Modes of GC Separation
• Capillary (open tubular) – Inner wall modified with thin (1 m) film of
liquid– 0.3 - 0.5 mm ID; 10 - 50 m length
• Packed – Solid particles either porous or non-porous
coated with thin (1 m) film of liquid– 1 - 8 mm ID; 1 - 10 m length
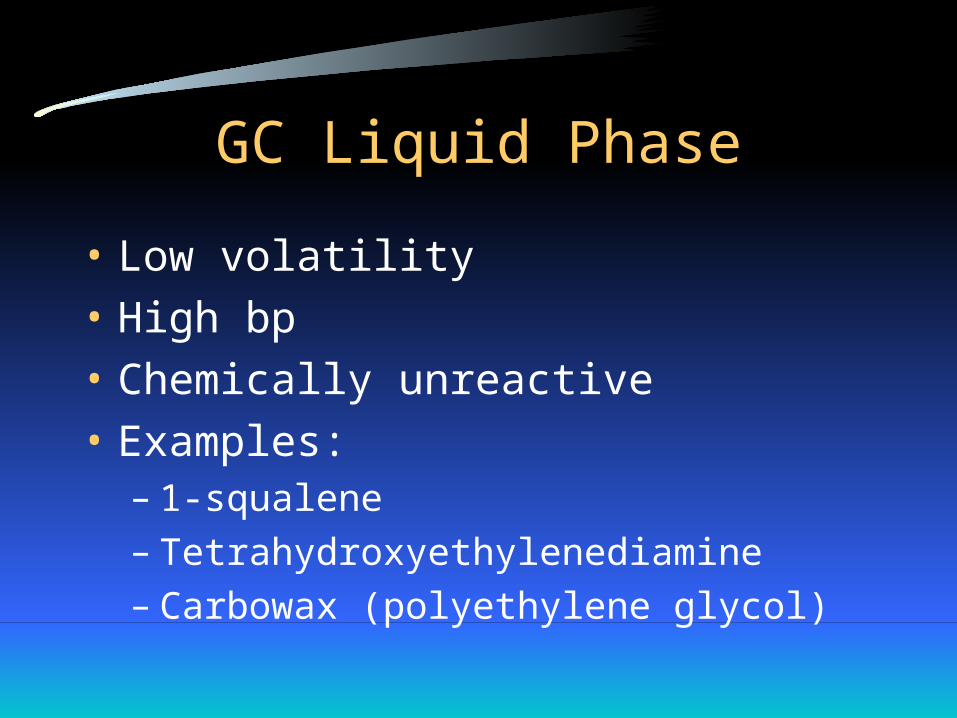
GC Liquid Phase
• Low volatility
• High bp
• Chemically unreactive
• Examples:– 1-squalene– Tetrahydroxyethylenediamine– Carbowax (polyethylene glycol)

GC - Modes of Separation
• Isothermal (GC)
• Programmed temperature (GC) – Raising column temperature (GC)
• Decreases retention time
• Sharpens peaks

Properties of a Good Detector
• High sensitivity - Response/ Conc’n• Universal or selective response
– selectivity - ability to distinguish between species
• Rapid response• Linearity - concentration range over which
signal proportional to concentration• Stability with respect to noise (baseline noise)
and time (drift)
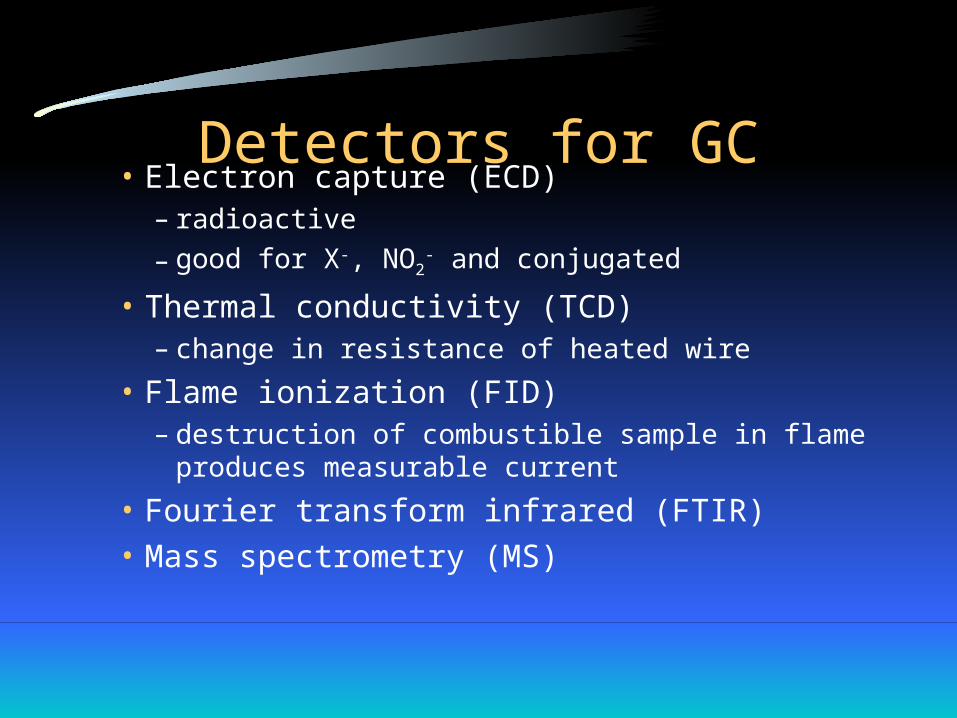
Detectors for GC• Electron capture (ECD)
– radioactive
– good for X-, NO2- and conjugated
• Thermal conductivity (TCD)– change in resistance of heated wire
• Flame ionization (FID)– destruction of combustible sample in flame produces
measurable current
• Fourier transform infrared (FTIR)• Mass spectrometry (MS)
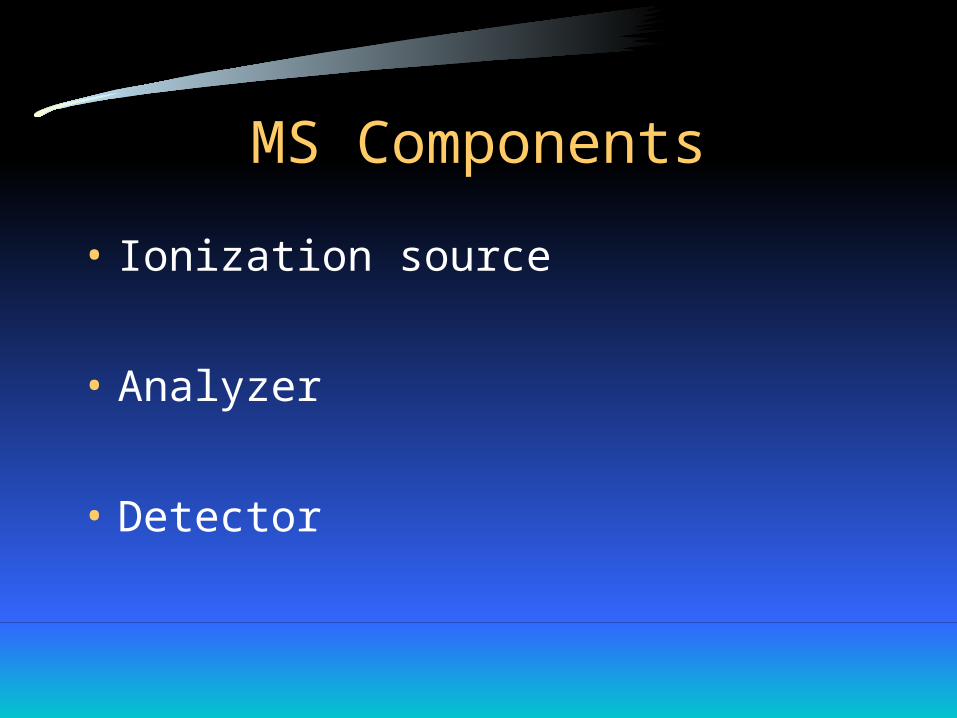
MS Components
• Ionization source
• Analyzer
• Detector
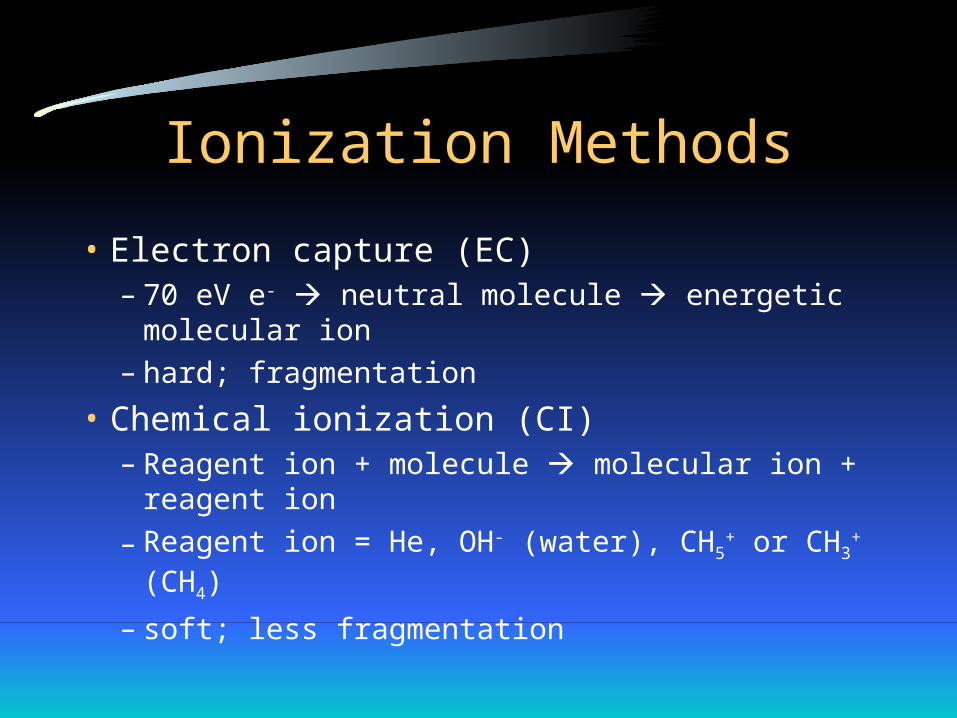
Ionization Methods
• Electron capture (EC)– 70 eV e- neutral molecule energetic molecular
ion– hard; fragmentation
• Chemical ionization (CI)– Reagent ion + molecule molecular ion + reagent
ion
– Reagent ion = He, OH- (water), CH5+ or CH3
+ (CH4)
– soft; less fragmentation
Ionization Methods
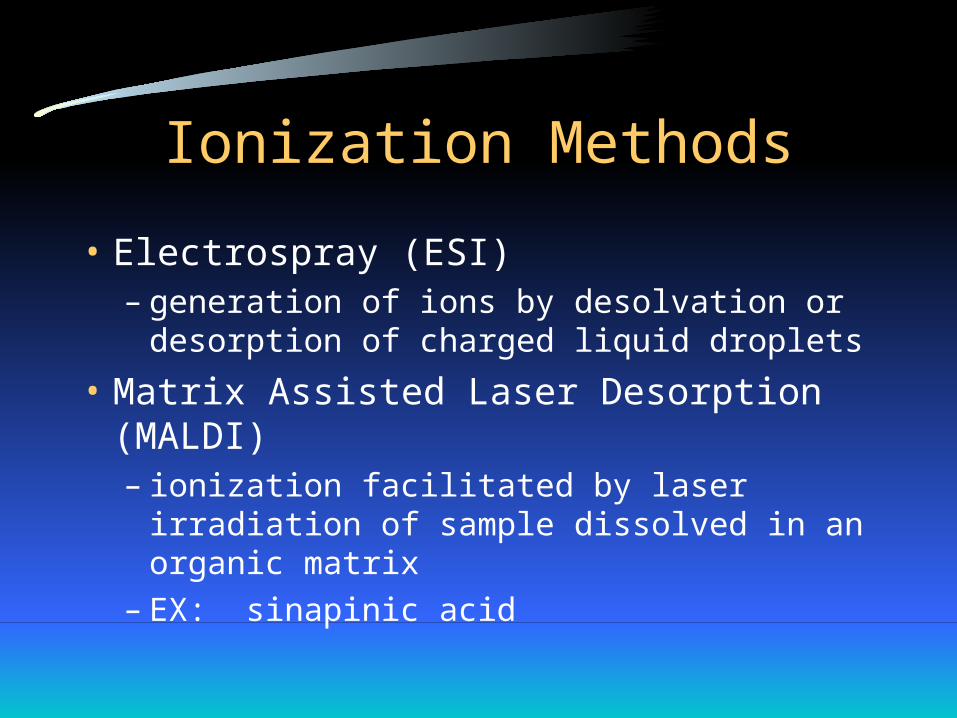
• Electrospray (ESI)– generation of ions by desolvation or desorption
of charged liquid droplets
• Matrix Assisted Laser Desorption (MALDI)– ionization facilitated by laser irradiation of
sample dissolved in an organic matrix– EX: sinapinic acid
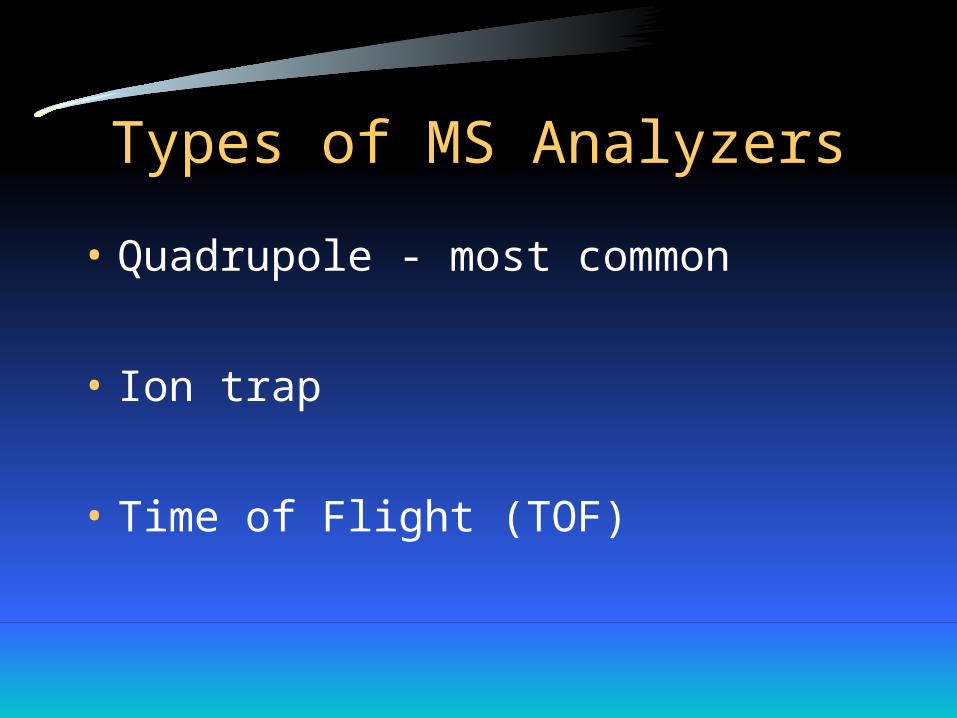
Types of MS Analyzers
• Quadrupole - most common
• Ion trap
• Time of Flight (TOF)
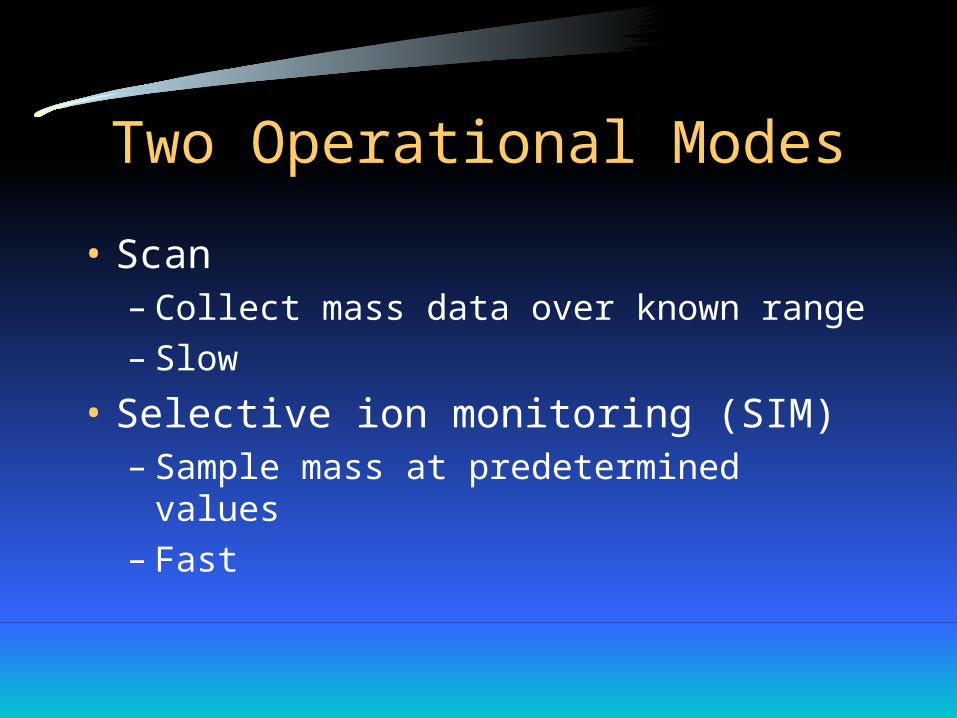
Two Operational Modes
• Scan– Collect mass data over known range– Slow
• Selective ion monitoring (SIM)– Sample mass at predetermined values– Fast
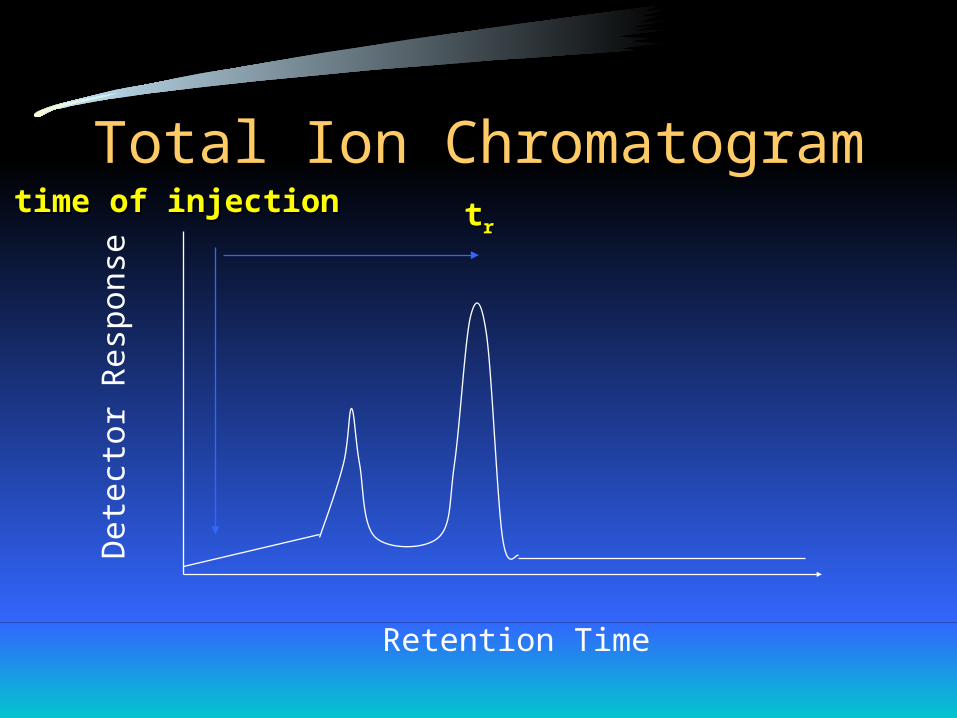
Total Ion Chromatogram
Retention Time
Det
ecto
r R
espo
nse
time of injectiontime of injection ttrr

Mass Spectrum - GC-MS
• x-axis – GC-MS - m/z– LC - retention time or volume
• y-axis - detector response– GC-MS - % abundance– LC - Abs

Analysis of Organic Mass Spectral Data
Analytical Chemistry
Lecture Topic #3
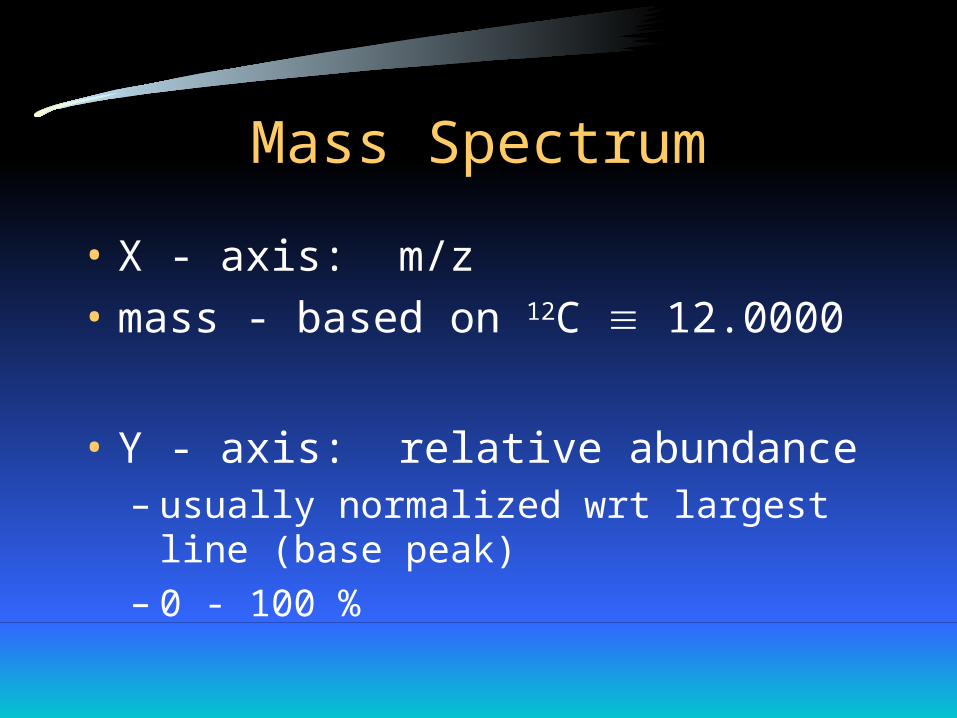
Mass Spectrum
• X - axis: m/z
• mass - based on 12C 12.0000
• Y - axis: relative abundance– usually normalized wrt largest line (base peak)– 0 - 100 %
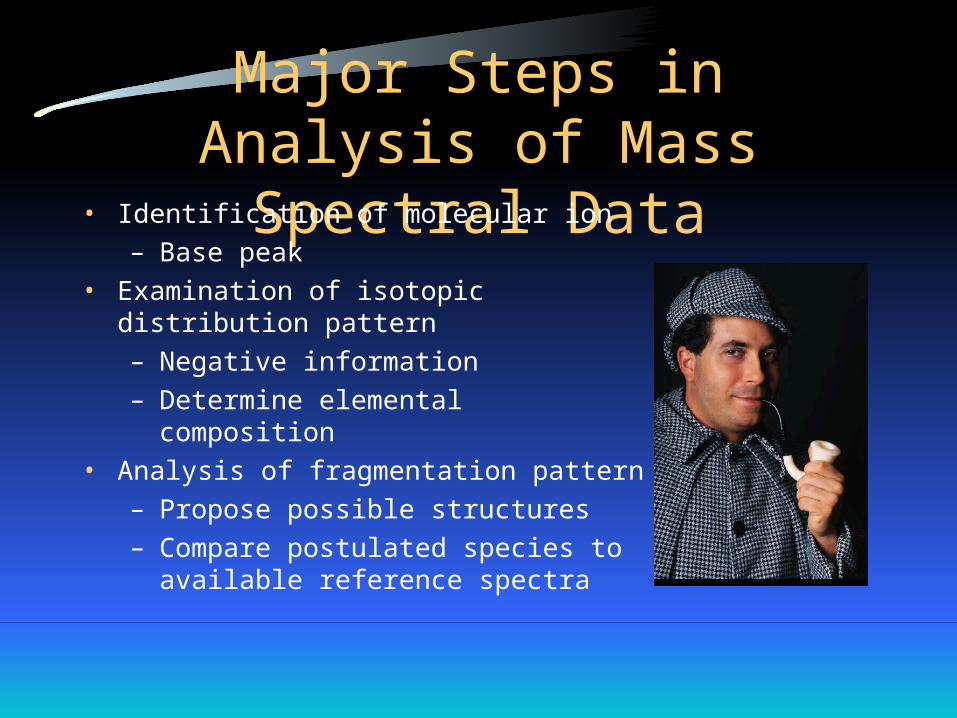
Major Steps in Analysis of Mass Spectral Data
• Identification of molecular ion
– Base peak
• Examination of isotopic distribution pattern
– Negative information
– Determine elemental composition
• Analysis of fragmentation pattern
– Propose possible structures
– Compare postulated species to available reference spectra
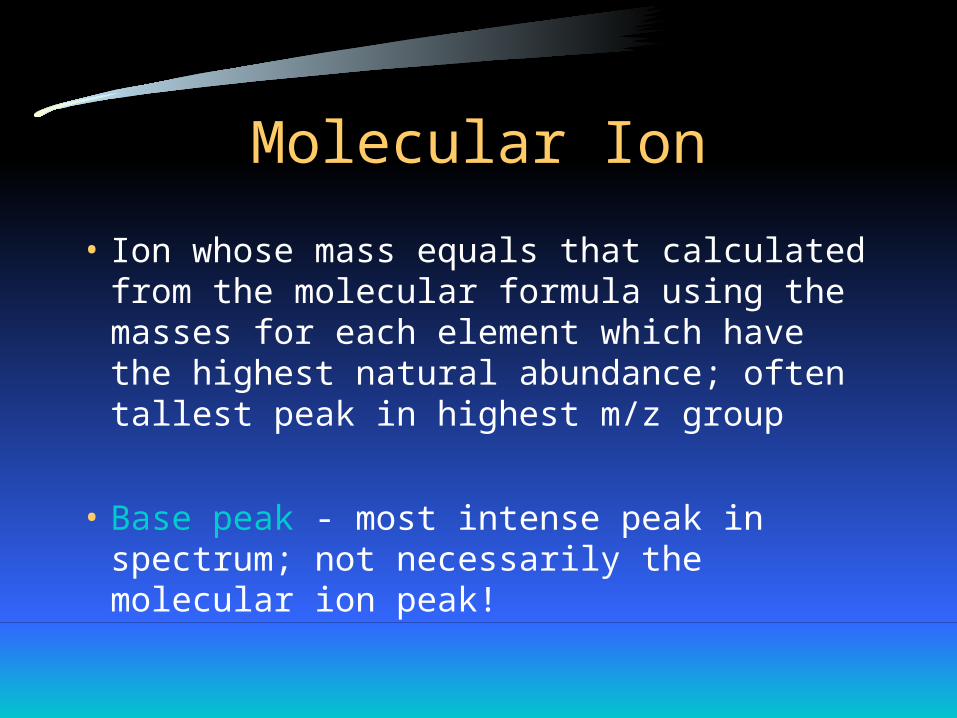
Molecular Ion
• Ion whose mass equals that calculated from the molecular formula using the masses for each element which have the highest natural abundance; often tallest peak in highest m/z group
• Base peak - most intense peak in spectrum; not necessarily the molecular ion peak!
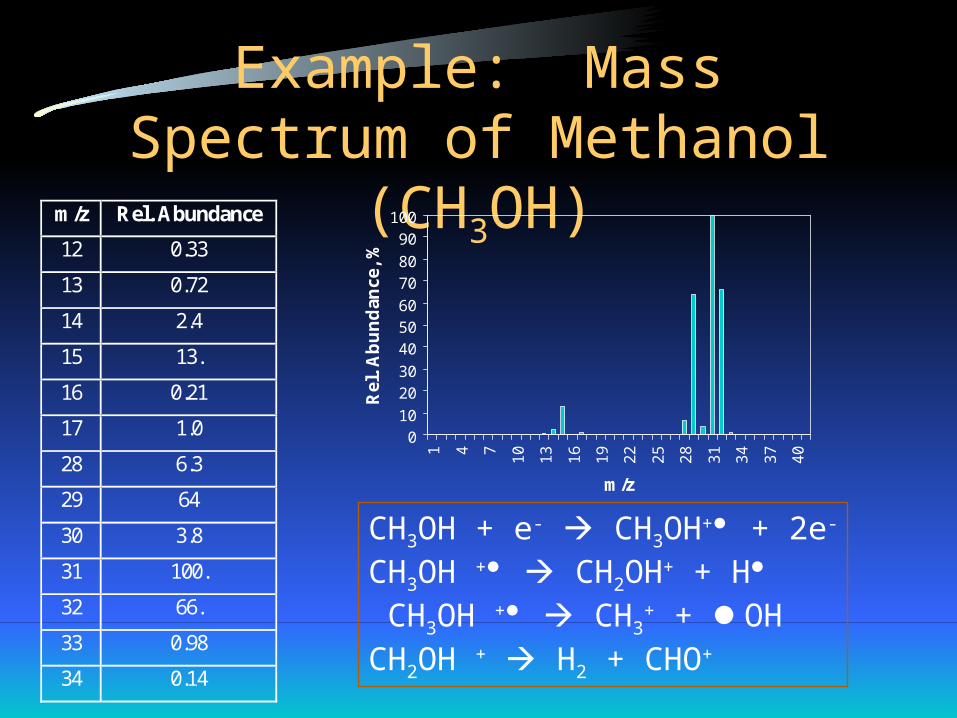
Example: Mass Spectrum of Methanol (CH3OH)
m/z Rel. Abundance
12 0.33
13 0.72
14 2.4
15 13.
16 0.21
17 1.0
28 6.3
29 64
30 3.8
31 100.
32 66.
33 0.98
34 0.14
010
2030
405060
7080
90100
1 4 7
10
13
16
19
22
25
28
31
34
37
40
m/z
Rel
. A
bu
nd
ance
, %
15
31
CH3OH + e- CH3OH+ + 2e-
CH3OH + CH2OH+ + H
CH3OH + CH3+ + OH
CH2OH + H2 + CHO+
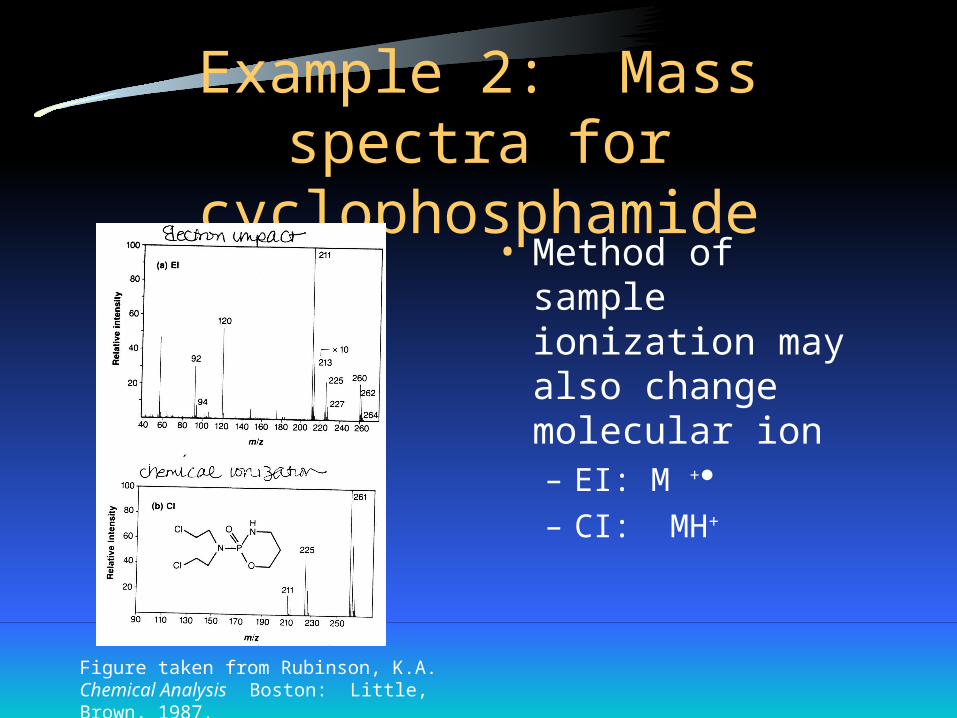
Example 2: Mass spectra for cyclophosphamide
Figure taken from Rubinson, K.A. Chemical Analysis Boston: Little, Brown, 1987.
• Method of sample ionization may also change molecular ion– EI: M +
– CI: MH+
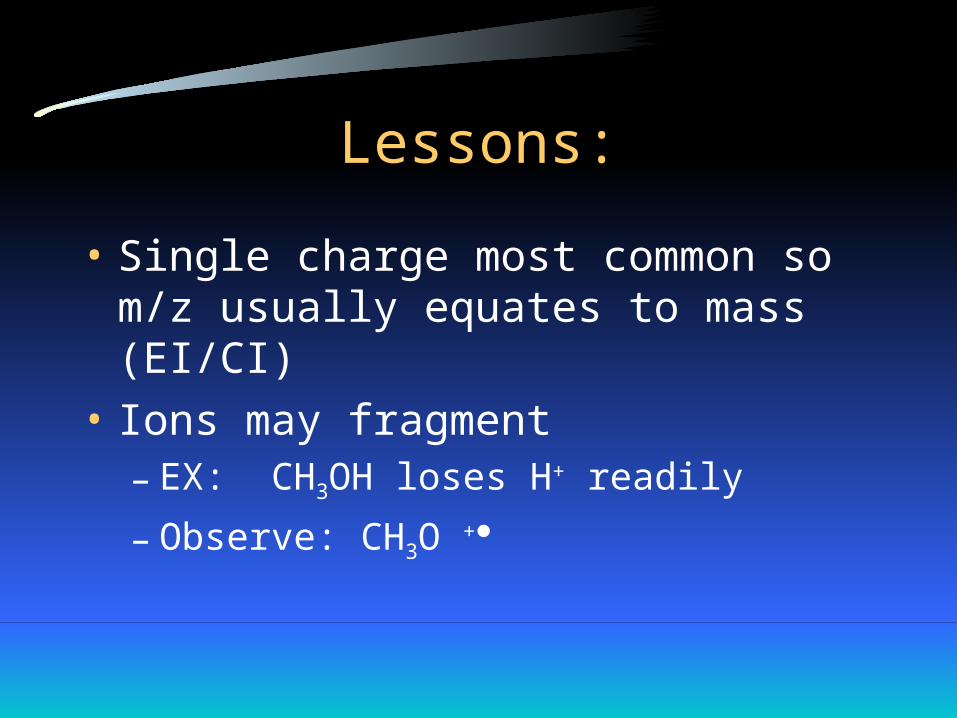
Lessons:
• Single charge most common so m/z usually equates to mass (EI/CI)
• Ions may fragment– EX: CH3OH loses H+ readily
– Observe: CH3O +
Isotopes
• Most abundant isotope of an element is set to 100%
• Abundance of other isotopes are normalized with respect to it
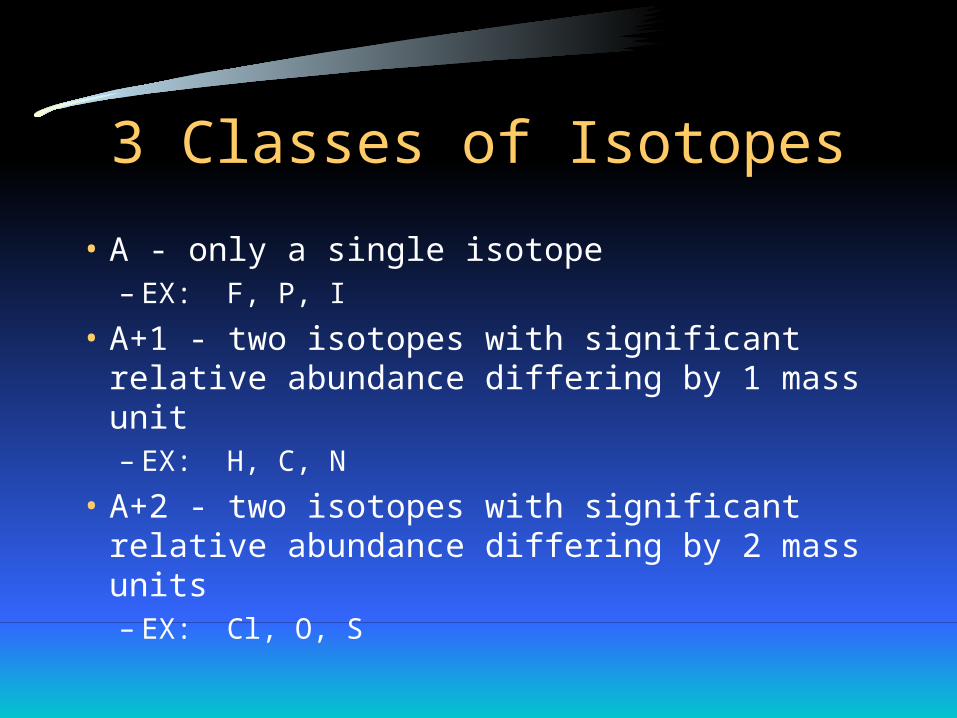
3 Classes of Isotopes
• A - only a single isotope– EX: F, P, I
• A+1 - two isotopes with significant relative abundance differing by 1 mass unit– EX: H, C, N
• A+2 - two isotopes with significant relative abundance differing by 2 mass units– EX: Cl, O, S
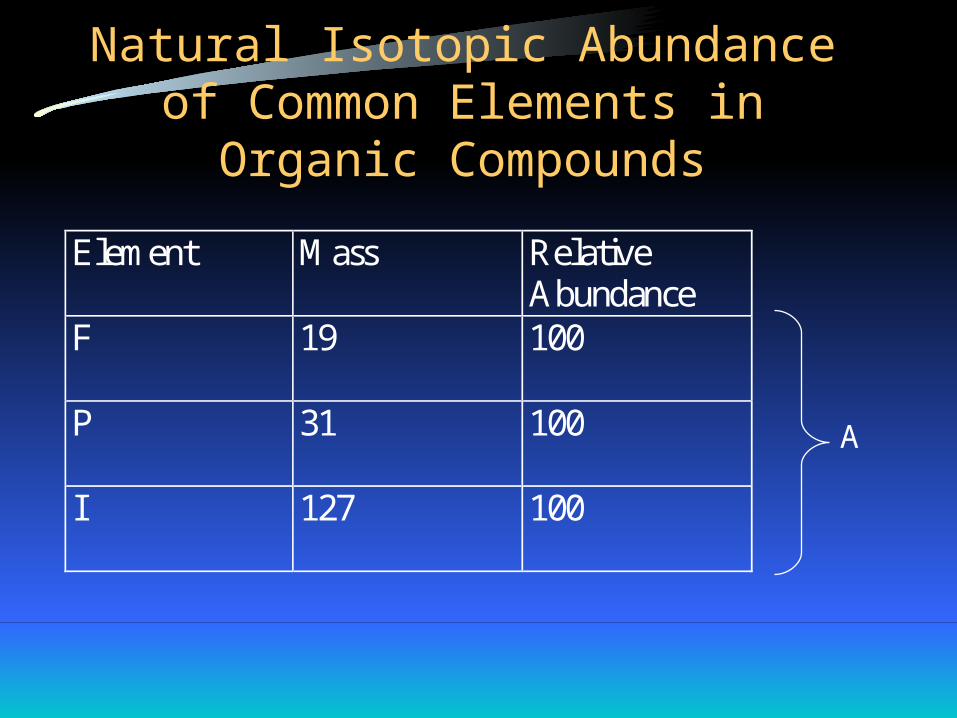
Natural Isotopic Abundance of Common Elements in Organic Compounds
Element Mass Relative Abundance
F 19 100
P 31 100
I 127 100
A
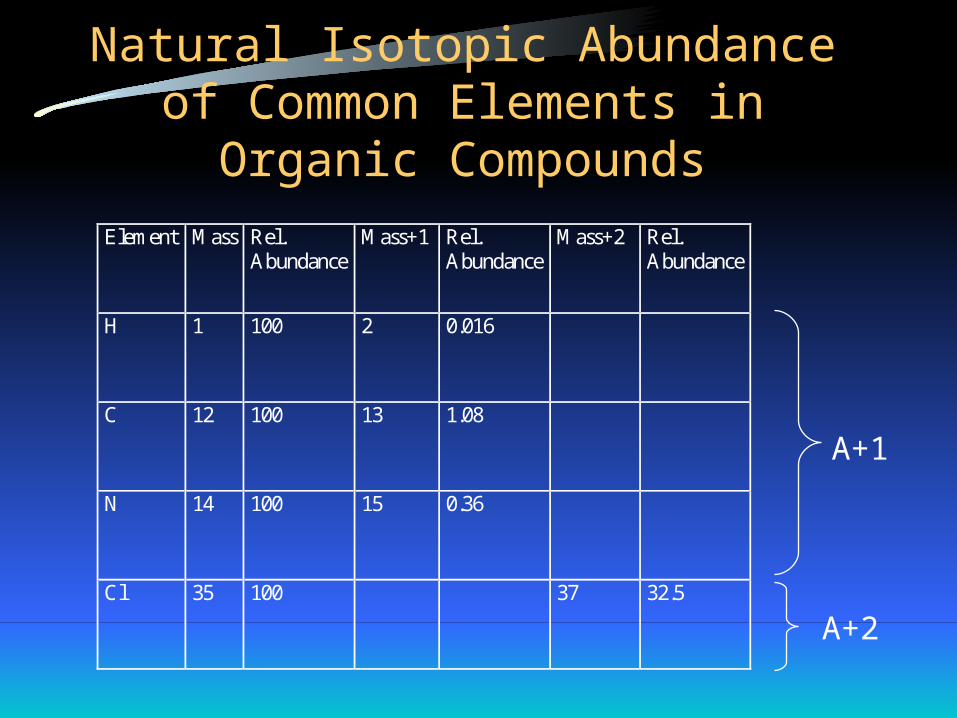
Natural Isotopic Abundance of Common Elements in Organic Compounds
Element Mass Rel. Abundance
Mass+1 Rel. Abundance
Mass+2 Rel. Abundance
H 1 100 2 0.016
C 12 100 13 1.08
N 14 100 15 0.36
Cl 35 100 37 32.5
A+1
A+2

Isotopic Distribution Patterns
• If Cl- present then two peaks with ratio 100:32.5
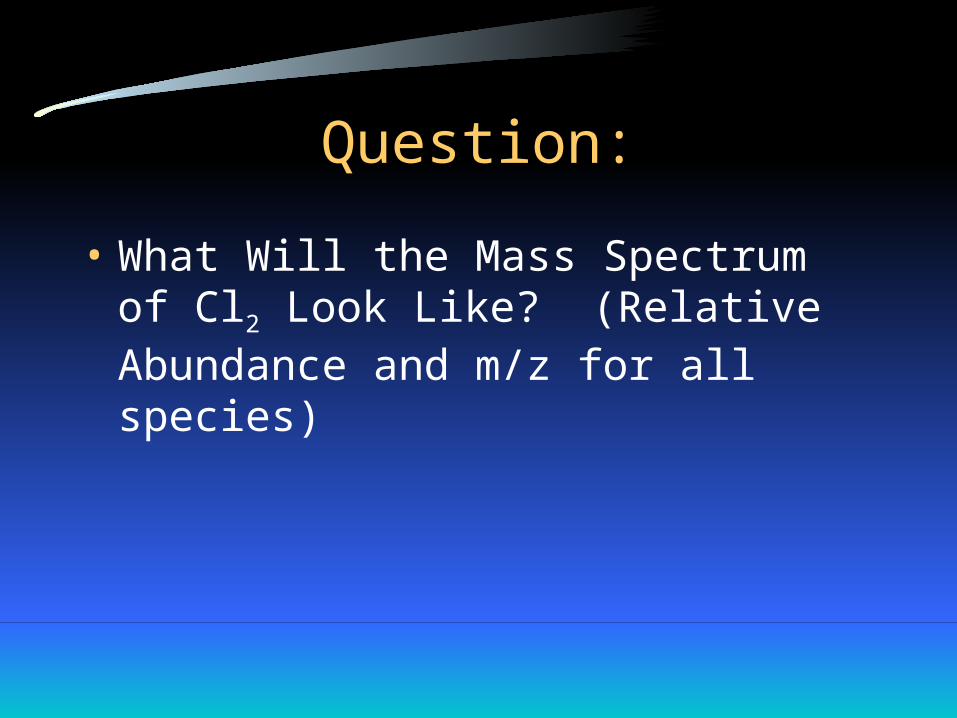
Question:
• What Will the Mass Spectrum of Cl2 Look Like? (Relative Abundance and m/z for all species)
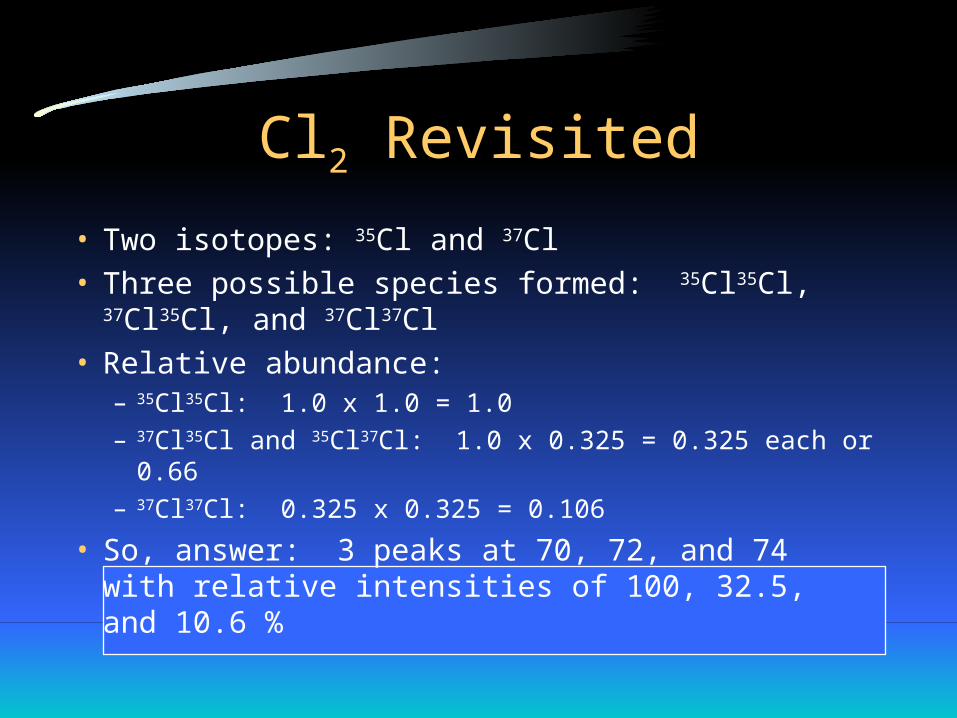
Cl2 Revisited
• Two isotopes: 35Cl and 37Cl• Three possible species formed: 35Cl35Cl, 37Cl35Cl,
and 37Cl37Cl• Relative abundance:
– 35Cl35Cl: 1.0 x 1.0 = 1.0
– 37Cl35Cl and 35Cl37Cl: 1.0 x 0.325 = 0.325 each or 0.66
– 37Cl37Cl: 0.325 x 0.325 = 0.106
• So, answer: 3 peaks at 70, 72, and 74 with relative intensities of 100, 32.5, and 10.6 %

Natural Isotopic Abundance of Common Elements in Organic Compounds
Element Mass Rel. Abundance
Mass+1 Rel. Abundance
Mass+2 Rel. Abundance
O 16 100 17 0.04 18 0.20
S 32 100 33 0.80 34 4.40
A+2
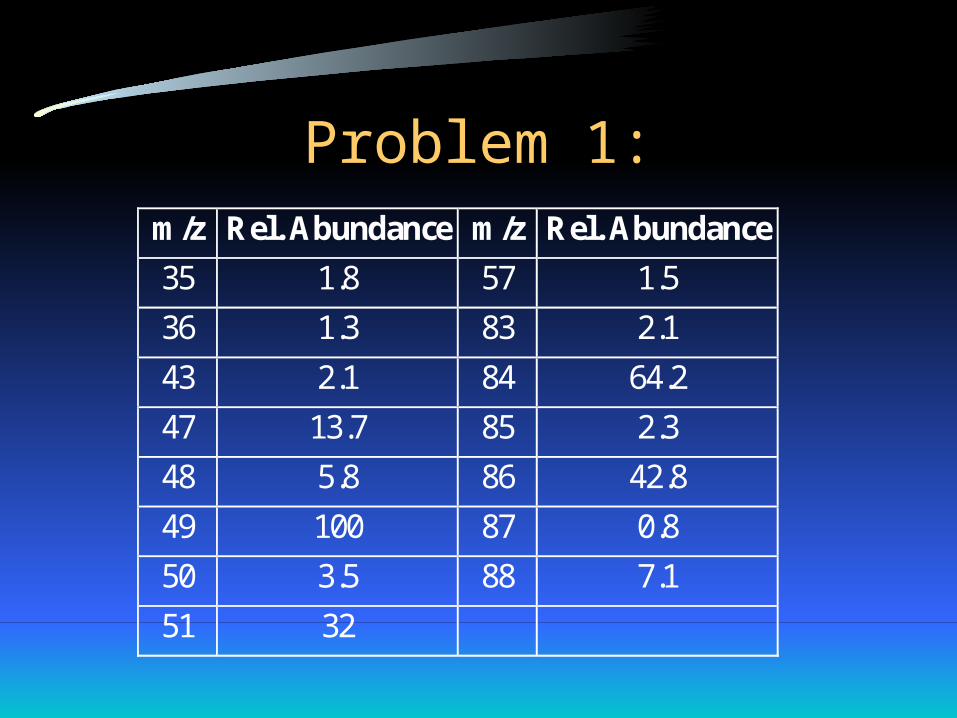
Problem 1:m/z Rel. Abundance m/z Rel. Abundance
35 1.8 57 1.5
36 1.3 83 2.1
43 2.1 84 64.2
47 13.7 85 2.3
48 5.8 86 42.8
49 100 87 0.8
50 3.5 88 7.1
51 32
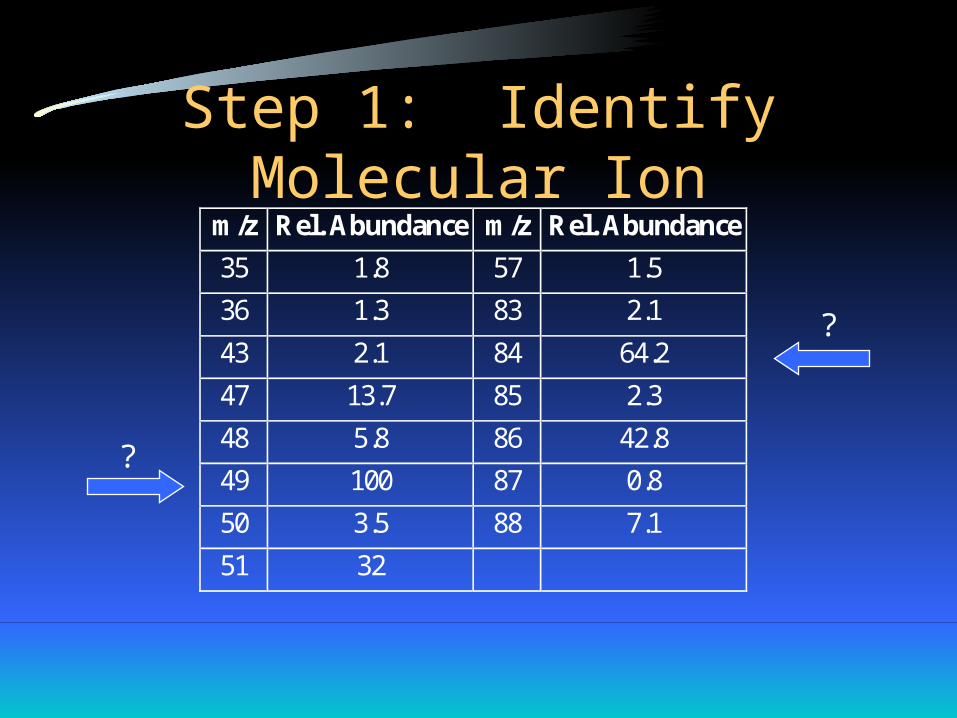
Step 1: Identify Molecular Ionm/z Rel. Abundance m/z Rel. Abundance
35 1.8 57 1.5
36 1.3 83 2.1
43 2.1 84 64.2
47 13.7 85 2.3
48 5.8 86 42.8
49 100 87 0.8
50 3.5 88 7.1
51 32
?
?
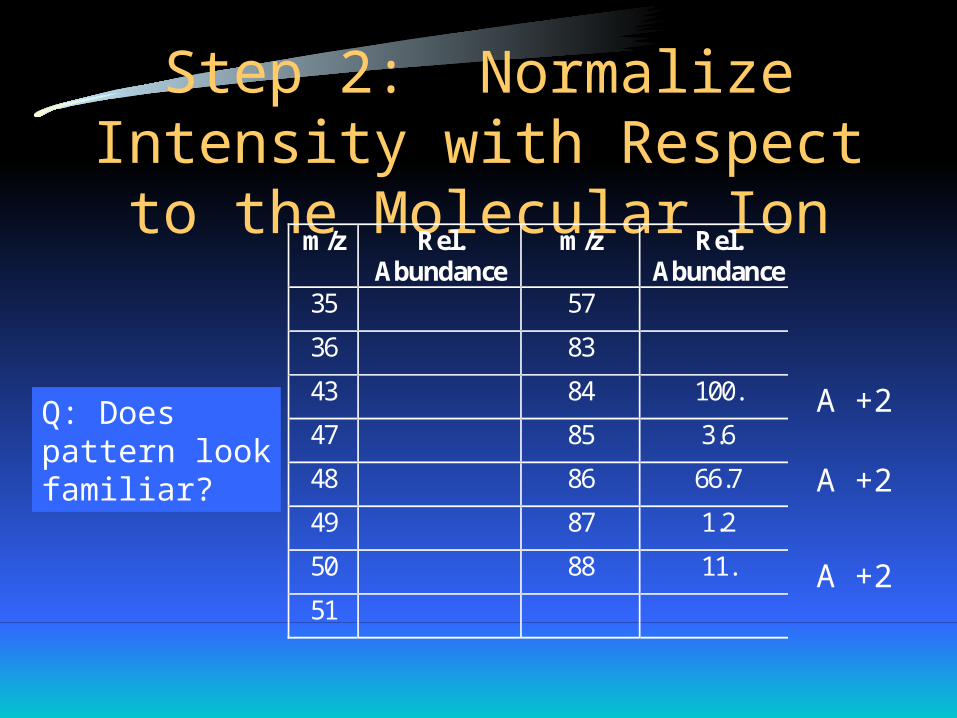
Step 2: Normalize Intensity with Respect to the Molecular Ion
m/z Rel. Abundance
m/z Rel. Abundance
35 57
36 83
43 84 100.
47 85 3.6
48 86 66.7
49 87 1.2
50 88 11.
51
A +2
A +2
A +2
Q: Doespattern lookfamiliar?

Step 3: Identify Possible Species
• 84 - 2*(35) = 14
• Remaining species must be A-type (C, H, etc)
• 14 - 12 = 2
• Suggests: 2H, 1 C, and 2 Cl CH2Cl2
Step 3: Identify Possible Species (cont’d)
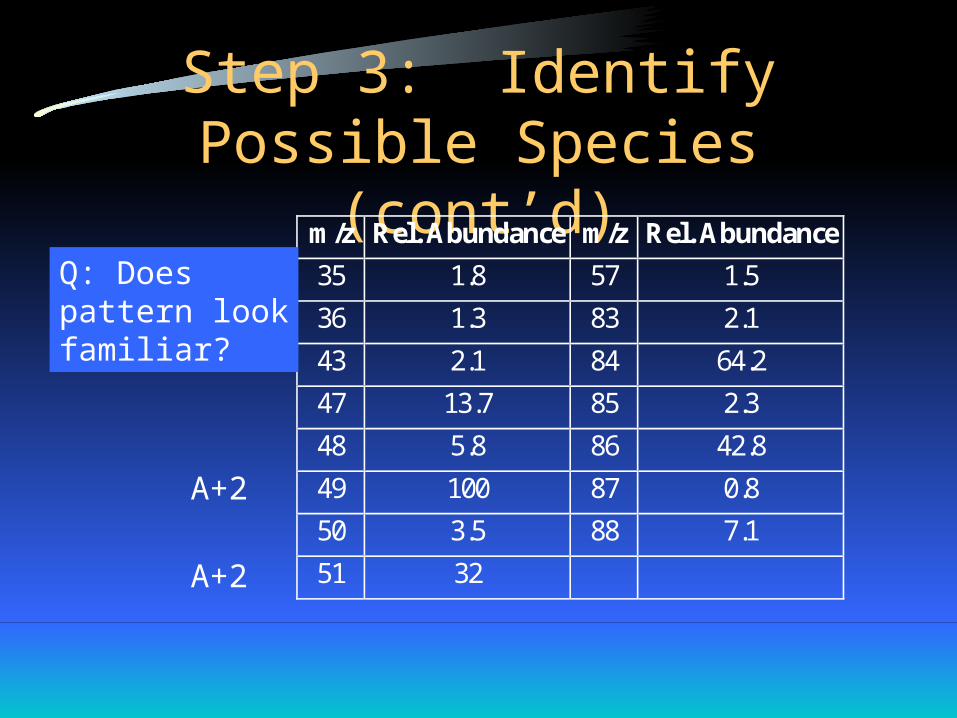
m/z Rel. Abundance m/z Rel. Abundance
35 1.8 57 1.5
36 1.3 83 2.1
43 2.1 84 64.2
47 13.7 85 2.3
48 5.8 86 42.8
49 100 87 0.8
50 3.5 88 7.1
51 32
A+2
A+2
Q: Doespattern lookfamiliar?
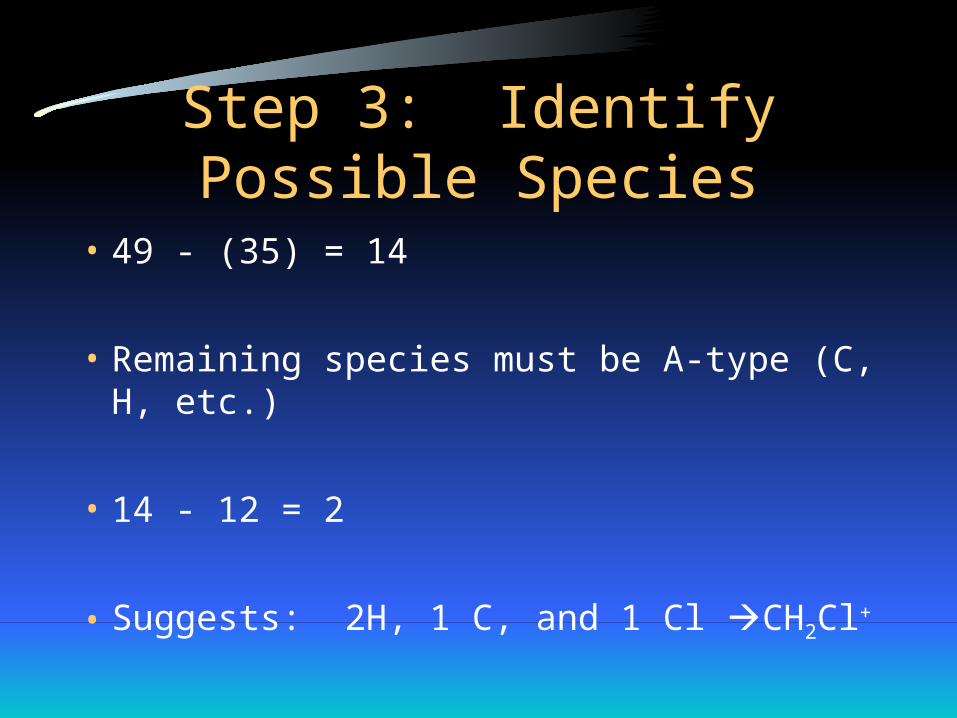
Step 3: Identify Possible Species
• 49 - (35) = 14
• Remaining species must be A-type (C, H, etc.)
• 14 - 12 = 2
• Suggests: 2H, 1 C, and 1 Cl CH2Cl+