Embed Size (px)
Citation preview


P1: KAE/UKS P2: KAEFM BLBK244-Afoakwa January 25, 2010 15:31 Printer Name: Yet to Come
Chocolate Science and Technology
Emmanuel Ohene AfoakwaUniversity of GhanaLegon – AccraGhana
and formerly
Nestle Product Technology CentreYorkUK
A John Wiley & Sons, Ltd., Publication

P1: KAE/UKS P2: KAEFM BLBK244-Afoakwa January 25, 2010 15:31 Printer Name: Yet to Come

P1: KAE/UKS P2: KAEFM BLBK244-Afoakwa January 25, 2010 15:31 Printer Name: Yet to Come
Chocolate Science and Technology

P1: KAE/UKS P2: KAEFM BLBK244-Afoakwa January 25, 2010 15:31 Printer Name: Yet to Come
Dedication
This book is dedicated to my dear wife Ellen and our three lovely children,Nana Afra, Maame Agyeiwaa and Kwabena Ohene-Afoakwa (Jnr), whose wisdom,prayers and support have helped me achieve great success in my life.

P1: KAE/UKS P2: KAEFM BLBK244-Afoakwa January 25, 2010 15:31 Printer Name: Yet to Come
Chocolate Science and Technology
Emmanuel Ohene AfoakwaUniversity of GhanaLegon – AccraGhana
and formerly
Nestle Product Technology CentreYorkUK
A John Wiley & Sons, Ltd., Publication

P1: KAE/UKS P2: KAEFM BLBK244-Afoakwa January 25, 2010 15:31 Printer Name: Yet to Come
This edition first published 2010C© 2010 Emmanuel Ohene Afoakwa
Blackwell Publishing was acquired by John Wiley & Sons in February 2007. Blackwell’s publishing programmehas been merged with Wiley’s global Scientific, Technical, and Medical business to form Wiley-Blackwell.
Registered officeJohn Wiley & Sons Ltd, The Atrium, Southern Gate, Chichester, West Sussex, PO19 8SQ, United Kingdom
Editorial offices9600 Garsington Road, Oxford, OX4 2DQ, United Kingdom2121 State Avenue, Ames, Iowa 50014-8300, USA
For details of our global editorial offices, for customer services and for information about how to apply forpermission to reuse the copyright material in this book please see our website at www.wiley.com/wiley-blackwell.
The right of the author to be identified as the author of this work has been asserted in accordance with the UKCopyright, Designs and Patents Act 1988.
All rights reserved. No part of this publication may be reproduced, stored in a retrieval system, or transmitted, inany form or by any means, electronic, mechanical, photocopying, recording or otherwise, except as permitted bythe UK Copyright, Designs and Patents Act 1988, without the prior permission of the publisher.
Wiley also publishes its books in a variety of electronic formats. Some content that appears in print may not beavailable in electronic books.
Designations used by companies to distinguish their products are often claimed as trademarks. All brand namesand product names used in this book are trade names, service marks, trademarks or registered trademarks of theirrespective owners. The publisher is not associated with any product or vendor mentioned in this book. Thispublication is designed to provide accurate and authoritative information in regard to the subject matter covered.It is sold on the understanding that the publisher is not engaged in rendering professional services. If professionaladvice or other expert assistance is required, the services of a competent professional should be sought.
Library of Congress Cataloging-in-Publication Data
Afoakwa, Emmanuel Ohene.Chocolate science and technology / Emmanuel Ohene Afoakwa.
p. cm.Includes bibliographical references and index.ISBN 978-1-4051-9906-3 (hardback : alk. paper) 1. Cocoa. 2. Chocolate. I. Title.TP640.A36 2010664′.5–dc22
2009046211
A catalogue record for this book is available from the British Library.
Set in 10/12 pt Times by Aptara R© Inc., New Delhi, IndiaPrinted in Singapore
1 2010

P1: KAE/UKS P2: KAEFM BLBK244-Afoakwa January 25, 2010 15:31 Printer Name: Yet to Come
Contents
Preface xiAcknowledgements xiiiAbout the author xv
1 Chocolate production and consumption patterns 1
1.1 History of cocoa and chocolate 11.2 World production and consumption of cocoa and chocolate products 2
1.2.1 World production and consumption of cocoa 21.2.2 World cocoa prices 41.2.3 World consumption of chocolate products 51.2.4 World consumption of premium chocolate products 6
1.3 Fairtrade cocoa and chocolate in modern confectionery industry 71.3.1 Future of Fairtrade cocoa and confectionery industry 9
1.4 The concept of this book 10
2 Cocoa cultivation, bean composition and chocolate flavour precursorformation and character 12
2.1 Introduction 122.2 Cocoa cultivation and practices 13
2.2.1 Cultivation of cocoa 132.2.2 Flowering and pod development 142.2.3 Harvesting and pod opening 162.2.4 Cocoa diseases and pests and their influence on chocolate
quality 182.2.4.1 Swollen shoot disease 192.2.4.2 Black pod disease 192.2.4.3 Witches broom disease 202.2.4.4 Pod borers (capsids, cocoa thrips and mealybugs) 20
2.3 Bean composition and flavour precursor formation 202.3.1 Chemical composition of the bean 202.3.2 Polyphenols and chocolate flavour quality 212.3.3 Effects of proteins and sugars on flavour precursor
formation 222.3.4 Microbial succession and enzymatic activities during
flavour precursor generation in cocoa fermentation 232.4 Effect of genotype on cocoa bean flavours 262.5 Flavour development during post-harvest treatments of cocoa 27
2.5.1 Fermentation processes 272.5.2 Drying 30
2.6 Conclusion 33
P1: KAE/UKS P2: KAEFM BLBK244-Afoakwa January 25, 2010 15:31 Printer Name: Yet to Come
vi Contents
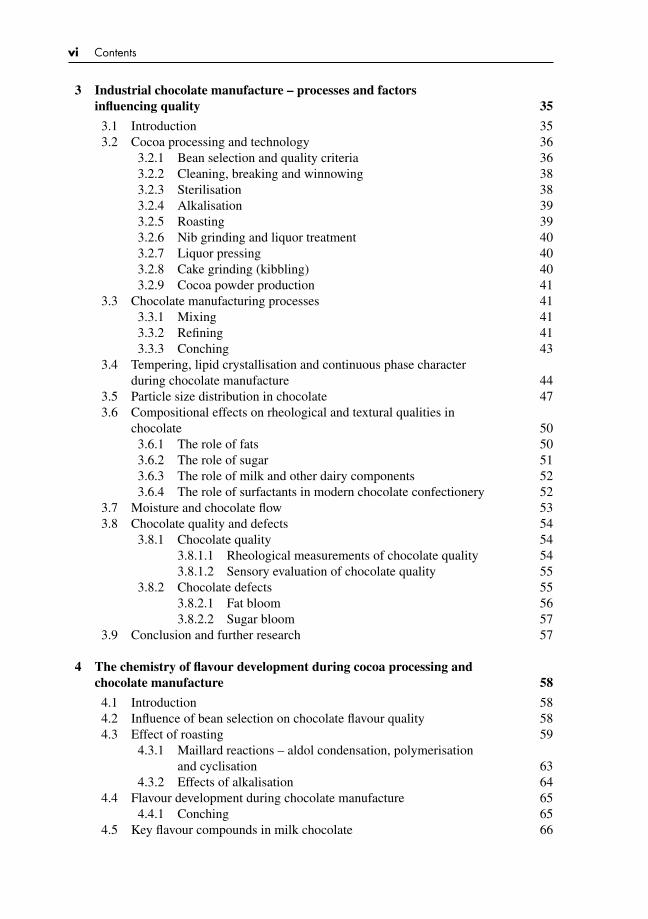
3 Industrial chocolate manufacture – processes and factorsinfluencing quality 35
3.1 Introduction 353.2 Cocoa processing and technology 36
3.2.1 Bean selection and quality criteria 363.2.2 Cleaning, breaking and winnowing 383.2.3 Sterilisation 383.2.4 Alkalisation 393.2.5 Roasting 393.2.6 Nib grinding and liquor treatment 403.2.7 Liquor pressing 403.2.8 Cake grinding (kibbling) 403.2.9 Cocoa powder production 41
3.3 Chocolate manufacturing processes 413.3.1 Mixing 413.3.2 Refining 413.3.3 Conching 43
3.4 Tempering, lipid crystallisation and continuous phase characterduring chocolate manufacture 44
3.5 Particle size distribution in chocolate 473.6 Compositional effects on rheological and textural qualities in
chocolate 503.6.1 The role of fats 503.6.2 The role of sugar 513.6.3 The role of milk and other dairy components 523.6.4 The role of surfactants in modern chocolate confectionery 52
3.7 Moisture and chocolate flow 533.8 Chocolate quality and defects 54
3.8.1 Chocolate quality 543.8.1.1 Rheological measurements of chocolate quality 543.8.1.2 Sensory evaluation of chocolate quality 55
3.8.2 Chocolate defects 553.8.2.1 Fat bloom 563.8.2.2 Sugar bloom 57
3.9 Conclusion and further research 57
4 The chemistry of flavour development during cocoa processing andchocolate manufacture 58
4.1 Introduction 584.2 Influence of bean selection on chocolate flavour quality 584.3 Effect of roasting 59
4.3.1 Maillard reactions – aldol condensation, polymerisationand cyclisation 63
4.3.2 Effects of alkalisation 644.4 Flavour development during chocolate manufacture 65
4.4.1 Conching 654.5 Key flavour compounds in milk chocolate 66

P1: KAE/UKS P2: KAEFM BLBK244-Afoakwa January 25, 2010 15:31 Printer Name: Yet to Come
Contents vii
4.6 Key flavour compounds in dark chocolate 684.7 Conclusion 71
5 Sensory character and flavour perception of chocolates 73
5.1 Summary and industrial relevance 735.2 Introduction 735.3 Sensory perception of quality in chocolates 74
5.3.1 Appearance 755.3.2 Texture 755.3.3 Taste 795.3.4 Flavour and aroma 80
5.4 Sensory assessment of chocolates 805.5 Factor influencing chocolate flavour 815.6 Flavour release and perception of sweetness in chocolate 825.7 Dynamism of flavour perception in chocolate 845.8 Retronasal flavour release and perception during chocolate
consumption 855.9 Measurement of flavour release and intensity in chocolates 87
5.10 Electronic noses and tongues as online sensors for sensoryassessment of chocolates 89
5.11 Conclusion 89
6 Nutritional and health benefits of cocoa and chocolate consumption 91
6.1 Summary and significance 916.2 Introduction 916.3 Chemistry and composition of cocoa flavonoids 926.4 Chocolate types and their major nutritional constituents 946.5 Antioxidant properties and their mechanism of action 956.6 Effects on endothelial function, blood pressure and
cardiovascular system 966.7 Effects on insulin sensitivity and carcinogenic properties 986.8 Cocoa, chocolate and aphrodisiac properties 996.9 Conclusion 100
7 Structure – properties (rheology, texture and melting) relationships inchocolate manufacture 101
7.1 Summary and industrial relevance 1017.2 Introduction 1027.3 Materials and methods 104
7.3.1 Materials 1047.3.2 Preparation of chocolate samples 1057.3.3 Determination of particle size distribution 1057.3.4 Rheological measurements 1057.3.5 Tempering procedure 1087.3.6 Texture measurements 1097.3.7 Colour measurements of solid dark chocolate 1117.3.8 Microstructure analysis 111
P1: KAE/UKS P2: KAEFM BLBK244-Afoakwa January 25, 2010 15:31 Printer Name: Yet to Come
viii Contents
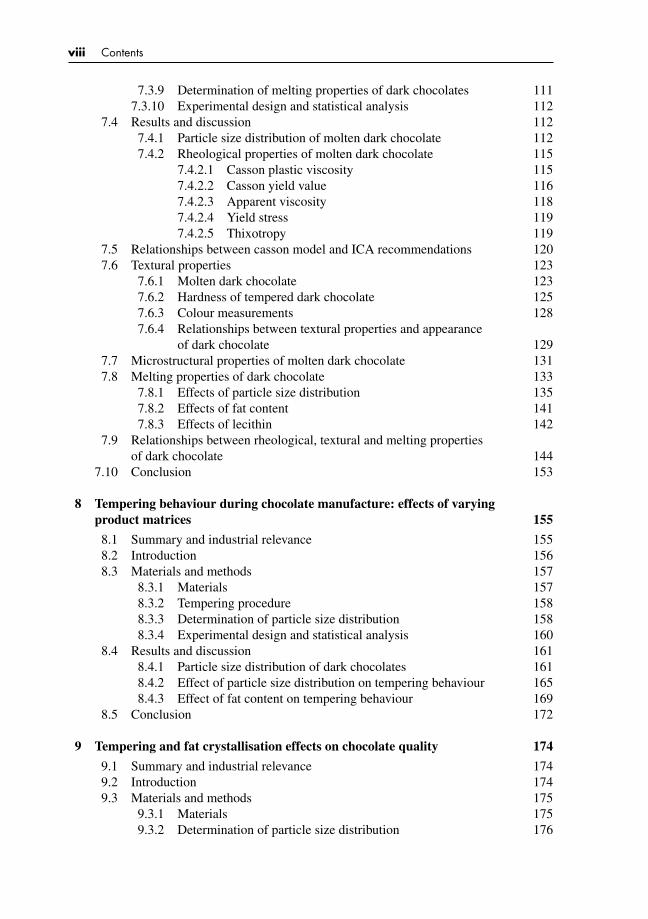
7.3.9 Determination of melting properties of dark chocolates 1117.3.10 Experimental design and statistical analysis 112
7.4 Results and discussion 1127.4.1 Particle size distribution of molten dark chocolate 1127.4.2 Rheological properties of molten dark chocolate 115
7.4.2.1 Casson plastic viscosity 1157.4.2.2 Casson yield value 1167.4.2.3 Apparent viscosity 1187.4.2.4 Yield stress 1197.4.2.5 Thixotropy 119
7.5 Relationships between casson model and ICA recommendations 1207.6 Textural properties 123
7.6.1 Molten dark chocolate 1237.6.2 Hardness of tempered dark chocolate 1257.6.3 Colour measurements 1287.6.4 Relationships between textural properties and appearance
of dark chocolate 1297.7 Microstructural properties of molten dark chocolate 1317.8 Melting properties of dark chocolate 133
7.8.1 Effects of particle size distribution 1357.8.2 Effects of fat content 1417.8.3 Effects of lecithin 142
7.9 Relationships between rheological, textural and melting propertiesof dark chocolate 144
7.10 Conclusion 153
8 Tempering behaviour during chocolate manufacture: effects of varyingproduct matrices 155
8.1 Summary and industrial relevance 1558.2 Introduction 1568.3 Materials and methods 157
8.3.1 Materials 1578.3.2 Tempering procedure 1588.3.3 Determination of particle size distribution 1588.3.4 Experimental design and statistical analysis 160
8.4 Results and discussion 1618.4.1 Particle size distribution of dark chocolates 1618.4.2 Effect of particle size distribution on tempering behaviour 1658.4.3 Effect of fat content on tempering behaviour 169
8.5 Conclusion 172
9 Tempering and fat crystallisation effects on chocolate quality 174
9.1 Summary and industrial relevance 1749.2 Introduction 1749.3 Materials and methods 175
9.3.1 Materials 1759.3.2 Determination of particle size distribution 176
P1: KAE/UKS P2: KAEFM BLBK244-Afoakwa January 25, 2010 15:31 Printer Name: Yet to Come
Contents ix
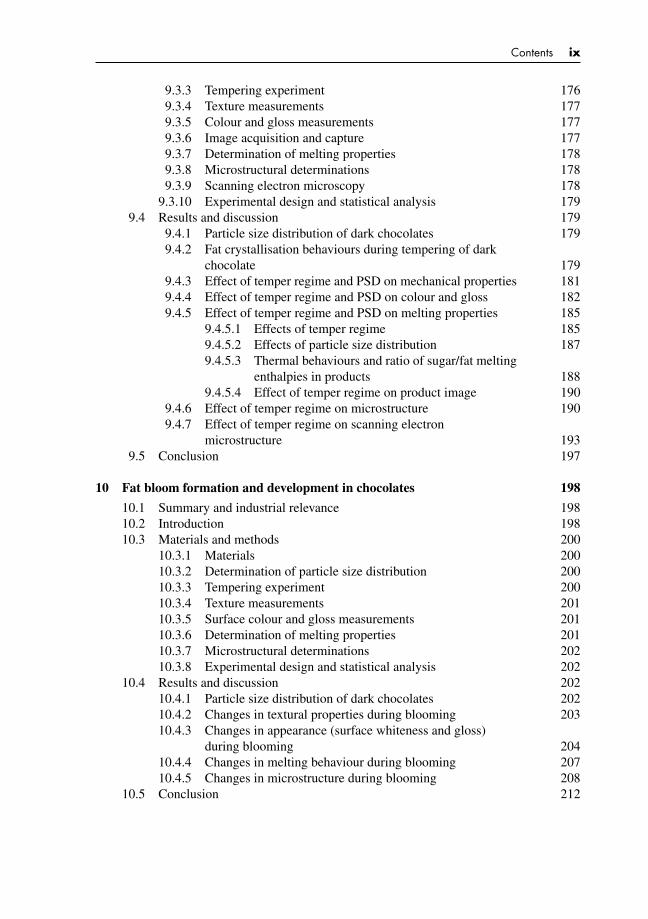
9.3.3 Tempering experiment 1769.3.4 Texture measurements 1779.3.5 Colour and gloss measurements 1779.3.6 Image acquisition and capture 1779.3.7 Determination of melting properties 1789.3.8 Microstructural determinations 1789.3.9 Scanning electron microscopy 178
9.3.10 Experimental design and statistical analysis 1799.4 Results and discussion 179
9.4.1 Particle size distribution of dark chocolates 1799.4.2 Fat crystallisation behaviours during tempering of dark
chocolate 1799.4.3 Effect of temper regime and PSD on mechanical properties 1819.4.4 Effect of temper regime and PSD on colour and gloss 1829.4.5 Effect of temper regime and PSD on melting properties 185
9.4.5.1 Effects of temper regime 1859.4.5.2 Effects of particle size distribution 1879.4.5.3 Thermal behaviours and ratio of sugar/fat melting
enthalpies in products 1889.4.5.4 Effect of temper regime on product image 190
9.4.6 Effect of temper regime on microstructure 1909.4.7 Effect of temper regime on scanning electron
microstructure 1939.5 Conclusion 197
10 Fat bloom formation and development in chocolates 198
10.1 Summary and industrial relevance 19810.2 Introduction 19810.3 Materials and methods 200
10.3.1 Materials 20010.3.2 Determination of particle size distribution 20010.3.3 Tempering experiment 20010.3.4 Texture measurements 20110.3.5 Surface colour and gloss measurements 20110.3.6 Determination of melting properties 20110.3.7 Microstructural determinations 20210.3.8 Experimental design and statistical analysis 202
10.4 Results and discussion 20210.4.1 Particle size distribution of dark chocolates 20210.4.2 Changes in textural properties during blooming 20310.4.3 Changes in appearance (surface whiteness and gloss)
during blooming 20410.4.4 Changes in melting behaviour during blooming 20710.4.5 Changes in microstructure during blooming 208
10.5 Conclusion 212
P1: KAE/UKS P2: KAEFM BLBK244-Afoakwa January 25, 2010 15:31 Printer Name: Yet to Come
x Contents
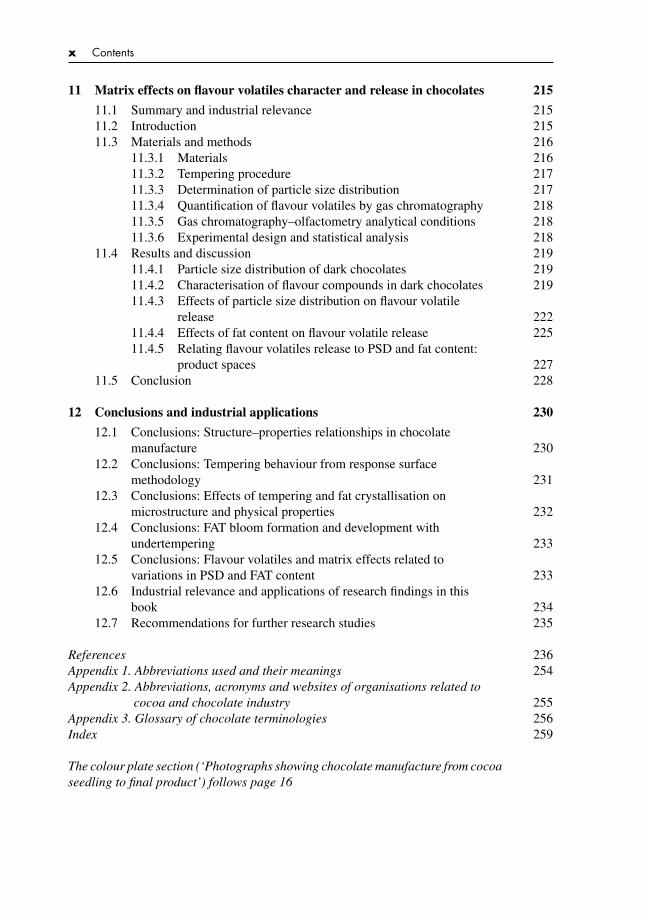
11 Matrix effects on flavour volatiles character and release in chocolates 215
11.1 Summary and industrial relevance 21511.2 Introduction 21511.3 Materials and methods 216
11.3.1 Materials 21611.3.2 Tempering procedure 21711.3.3 Determination of particle size distribution 21711.3.4 Quantification of flavour volatiles by gas chromatography 21811.3.5 Gas chromatography–olfactometry analytical conditions 21811.3.6 Experimental design and statistical analysis 218
11.4 Results and discussion 21911.4.1 Particle size distribution of dark chocolates 21911.4.2 Characterisation of flavour compounds in dark chocolates 21911.4.3 Effects of particle size distribution on flavour volatile
release 22211.4.4 Effects of fat content on flavour volatile release 22511.4.5 Relating flavour volatiles release to PSD and fat content:
product spaces 22711.5 Conclusion 228
12 Conclusions and industrial applications 230
12.1 Conclusions: Structure–properties relationships in chocolatemanufacture 230
12.2 Conclusions: Tempering behaviour from response surfacemethodology 231
12.3 Conclusions: Effects of tempering and fat crystallisation onmicrostructure and physical properties 232
12.4 Conclusions: FAT bloom formation and development withundertempering 233
12.5 Conclusions: Flavour volatiles and matrix effects related tovariations in PSD and FAT content 233
12.6 Industrial relevance and applications of research findings in thisbook 234
12.7 Recommendations for further research studies 235
References 236Appendix 1. Abbreviations used and their meanings 254Appendix 2. Abbreviations, acronyms and websites of organisations related to
cocoa and chocolate industry 255Appendix 3. Glossary of chocolate terminologies 256Index 259
The colour plate section (‘Photographs showing chocolate manufacture from cocoaseedling to final product’) follows page 16
P1: KAE/UKS P2: KAEFM BLBK244-Afoakwa January 25, 2010 15:31 Printer Name: Yet to Come
Preface
The character of chocolate not only originates in flavour precursors present in cocoa beans butare generated during post-harvest treatments and transformed into desirable odour notes in themanufacturing processes. Complex biochemical modifications of cocoa bean constituents arefurther altered by thermal reactions in roasting and conching, and in alkalisation. However,less well understood is the extent to which the inherent bean constituents from the cocoagenotype, environmental factors, and post-harvest treatments and processing technologiesaffect flavour formation and the final flavour quality. This book provides scientific andtechnological accounts of all these issues as well as for the various biological and geneticfactors that modulate variations in flavour formation in cocoa and chocolate. It explains thechemistry of Maillard reactions that leads to flavour development during cocoa processingand chocolate manufacture, using chemical equations and specific technical examples. Withthe increase of speciality niche products in the modern chocolate confectionery industry, abetter understanding of these factors could have significant commercial implications.
Chocolate as a complex emulsion is a luxury food that during consumption evokes a rangeof stimuli that activate pleasure centres of the human brain. Central to chocolate quality isan appropriate melting behaviour that ensures products are solid at ambient temperature butmelt on ingestion to undergo dissolution in oral saliva, with a final assessment of textureafter phase inversion. During manufacture, several factors play important roles in shapingchocolate’s rheological behaviour, textural properties, melting characteristics and sensoryperception, but the science and technologies involved are poorly understood. With opportu-nities for improvements in quality possible through improved and more transparent supplychain management, plant breeding strategies and new product development associated withFairtrade and the development of niche/premium quality products, there is a need for greaterunderstanding of the variables as well as the science and technologies employed.
This book provides detailed, reviewed explanation of the scientific and technologicalbasis of the various chocolate manufacturing processes used in the modern confectioneryindustry. Using the latest research, it also provides scientific answers to many of the fre-quently asked questions on process improvements, quality control, quality assurance, andthe production of low-fat chocolates and niche/premium products. The ideas and explana-tions provided in this book evolved from my doctorate research on chocolate technology, andcontain findings that impact on quality assurance processes and new product developmenttechniques with significance for cost reduction and improved product quality. The chapterscover the entirety of the science and technology of chocolate manufacture – from cocoaproduction through manufacturing processes to nutrition and health benefits of chocolateconsumption.
It is hoped that this book will be a valuable resource for academic and research institutionsaround the world, and as a training manual on cocoa processing, chocolate technology andthe science of chocolate manufacture. It is aimed at confectionery and chocolate scientists

P1: KAE/UKS P2: KAEFM BLBK244-Afoakwa January 25, 2010 15:31 Printer Name: Yet to Come
xii Preface
in industry and academia, general practicing food scientists and technologists, and foodengineers. The chapters on research developments are intended to help generate ideas for newresearch activities relating to process improvements, product quality control and assurance,as well as development of new niche/premium chocolate products.
It is my vision that this book will inspire African food industries in their quest for addingvalue to the many raw materials that are produced within the continent, especially cocoa.
P1: KAE/UKS P2: KAEFM BLBK244-Afoakwa January 25, 2010 15:31 Printer Name: Yet to Come
Acknowledgements
I wish to express my sincere gratitude and thanks to my parents – late Mr Joseph OheneAfoakwa (Esq.) and Mrs Margaret Afoakwa – for ensuring I obtained the best education inspite of the numerous challenges they faced in some periods of their lives. Their profoundlove, prayers, support and advice strengthened me from my childhood, giving birth to themany dreams and aspirations which have all become realities in my life today. I am alsograteful to the government of Ghana and to all cocoa farmers in Ghana whose toil and sweatfunded my education through the Ghana Cocoa Board Scholarship Scheme, which I earnedall throughout my secondary education, and without which I could not have remained inschool and secured a place at university. I am indeed indebted to you all.
My gratitude and appreciation also goes to the Management of Nestle Product Technol-ogy Centre (York, UK) for providing the funding and support for my training in chocolatetechnology at the Nestle Product Technology Centre, York, and also to Dr Alistair Pater-son, Centre for Food Quality, University of Strathclyde, Glasgow, UK, Mr Mark Fowler,Head of Applied Science Department of Nestle Product Technology Centre (York, UK) andDr Steve Beckett (retired confectionery expert) for their support, encouragement, patienceand friendliness during the period of my doctoral training in York. Many thanks also goto Joselio Vieira, Angela Ryan, John Rasburn, Peter Cooke, Philip Gonus, Angel Manez,Jan Kuendigar, Ramana Sundara and Sylvia Coquerel of Nestle Product Technology Cen-tre, York, and to Dr Jeremy Hargreaves (Nestle Head Office, Vevey, Switzerland) whoseadvice, guidance and support enhanced my understanding into the science and technologyof chocolates.
My sincere thanks also go to the many friends and colleagues around the world whohave mentored, encouraged and inspired me in various ways throughout my career includ-ing Professor Samuel Sefa-Dedeh, Professor George Sodah Ayernor, Professor EbenezerAsibey-Berko, Professor Anna Lartey, Dr Esther Sakyi-Dawson, Dr Kwaku Tano-Debrah,Dr Agnes Simpson Budu, Dr William Bruce Owusu and Dr George Annor, all of the Depart-ment of Nutrition and Food Science, University of Ghana, Legon – Accra, Ghana; ProfessorDemetre Labadarios (formerly of Stellenbosch University) and Executive Director of Knowl-edge Systems, Human Sciences Research Council in Cape Town, South Africa; ProfessorRuth Oniang’o, Founder and Editor-in-Chief of the African Journal of Food, Agriculture,Nutrition and Development (AJFAND), Nairobi, Kenya; Dr Linley Chiwona-Karltun of theSwedish University of Agricultural Sciences, Uppsala, Sweden; Mr George Ekow Hayford,Quality Assurance and Regulatory Affairs Manager for Nestle Central West African Region;Dr Gene White, Dr Janey Thornton, Mrs Barbara Belmont, Ms Penny McConnell, Mr PaulAlberghine and Mrs Mary Owens of the Global Child Nutrition Foundation, Washington, DC,USA.
Finally, my profound appreciation and love goes to my siblings Sammy, Juliana, andRegina for their prayers and support throughout my education, and again to my dear wife

P1: KAE/UKS P2: KAEFM BLBK244-Afoakwa January 25, 2010 15:31 Printer Name: Yet to Come
xiv Acknowledgements
Ellen and our lovely children Cita, Nana Afra, Maame Agyeiwaa and Kwabena Ohene-Afoakwa (Jnr) for supporting me and most importantly providing the much needed love,encouragement and affection that strengthened me throughout my career. We all have verygood memories of the beautiful cities of London, York and Glasgow, the Nestle RowntreeFactory and the Nestle Product Technology Centre in York, UK.

P1: KAE/UKS P2: KAEFM BLBK244-Afoakwa January 25, 2010 15:31 Printer Name: Yet to Come
About the author
Emmanuel Ohene Afoakwa, BSc (Hons), MPhil (Ghana), PhD (Strathclyde, UK) in FoodTechnology, holds Postgraduate Certificates in International Food Laws and Regulationsfrom the Michigan State University, East Lansing, Michigan, USA, and Food Quality Man-agement Systems from the Wageningen University, Wageningen, the Netherlands. He is amember of several professional bodies and has authored and co-authored 112 publications(including 52 peer-reviewed journal publications, 4 books and 56 conference presentationswith published abstracts) in food science and technology. As a technical consultant to manymultinational food industries in sub-Saharan Africa, he has vast experience in food tech-nology and translates his research findings through process and product development intoindustrial productions. He spent 3 years training and conducting active research into choco-late manufacture at the Nestle Product Technology Centre in York, UK, where he acquiredvarious skills and knowledge into the science and technology of chocolate. He has sev-eral research and review publications on chocolate science and technology in peer-reviewedjournals and has presented several papers on chocolate technology at international confer-ences around the world including the Annual Meeting of Food Technologists (IFT) in USA,World Congress of Food Science and Technology (IUFoST Bi-annual Congresses) in Franceand China, and the ZDS Chocolate Technology International Congress by ZDS Solingen inCologne, Germany. Presently, he is a Senior Lecturer at the Department of Nutrition andFood Science, University of Ghana, Legon – Accra, Ghana, where he has worked for over12 years, teaching and conducting research into the areas of beverage (chocolate and sugar)science and technology, food chemistry and thermal processing of foods.

P1: KAE/UKS P2: KAEFM BLBK244-Afoakwa January 25, 2010 15:31 Printer Name: Yet to Come
P1: KAE/UKS P2: KAEc01 BLBK244-Afoakwa January 25, 2010 15:19 Printer Name: Yet to Come
1 Chocolate production andconsumption patterns
1.1 HISTORY OF COCOA AND CHOCOLATE
The term ‘cocoa’ is a corruption of the word ‘cacao’ that is taken directly from Mayan andAztec languages. Chocolate is derived from cocoa beans, central to the fruit of cocoa tree,Theobroma cacao, which is indigenous to South America and believed to have originatedfrom the Amazon and Orinoco valleys. Theobroma (food of the gods) are of the familySterculiaceae with four principal types: Criollo, about 5% of world cocoa production; andthe more common Forastero, with smaller, flatter and purple beans; Nacional with fineflavour, grown in Ecuador. The fourth variety, Trinitario, a more disease-resistant hybridof Criollo and Forastero is regarded as a flavour bean (Fowler, 1999). Theobroma cacaogrows between tropics of Cancer and Capricorn, with varieties originating in forest areasof South America. Forastero – basic cocoa, grows mainly in Brazil and West Africa, whilstflavour cocoas are largely hybrids and are cultivated in Central and South America. Aztecsin Mexico cultivated cocoa from South America, via Caribbean islands, and HernandosCortes, a Spanish, took cocoa to Spain as a beverage and to Spanish Guinea as a crop. TheSpanish not only took cocoa to Europe but also introduced the crop into Fernando Po inthe seventeenth century, and thus laid the foundation of the future economies of many WestAfrican countries. Currently, West Africa produces more than 70% of world cocoa (Awua,2002; Amoye, 2006; International Cocoa Organisation, ICCO, 2008).
The use of cocoa beans dates back at least 1400 years (Rossner, 1997), when Aztecsand Incas used the beans as currency for trading or to produce the so-called chocolatl, adrink made by roasting and grinding cocoa nibs, mashing with water, often adding otheringredients such as vanilla, spices or honey. In the 1520s, the drink was introduced intoSpain (Minifie, 1989) although Coe and Coe (1996) emphasised that the European arrivals inthe new world, including Christopher Columbus and Herman Cortes, were unimpressedwith the Mayan beverage, sweetening it with honey. Nevertheless, the consquistadorsfamiliarised the chocolate beverage throughout Europe, and being expensive, it was ini-tially reserved for consumption by the highest social classes, and only in the seventeenthcentury that the consumption of chocolate spread through Europe.
As the consumption of chocolate became more and more widespread during the eighteenthcentury, the Spanish monopoly on the production of cocoa soon became untenable andplantations were soon established by the Italians, Dutch and Portuguese. At this point,chocolate was still consumed in liquid form and was mainly sold as pressed blocks of agrainy mass to be dissolved in water or milk to form a foamy chocolate drink. The massproduction of these chocolate blocks also began in the eighteenth century when the BritishFry family founded the first chocolate factory in 1728, using hydraulic equipment to grind
P1: KAE/UKS P2: KAEc01 BLBK244-Afoakwa January 25, 2010 15:19 Printer Name: Yet to Come
2 Chocolate Science and Technology
the cocoa beans. The first US factory was built by Dr James Baker outside Boston a fewdecades later, and in 1778 the Frenchman Doret built the first automated machine for grindingcocoa beans. The production of cocoa and chocolate was truly revolutionised by CoenraadVan Houten in 1828 by the invention of a cocoa press, which succeeded in separating cocoasolids from cocoa butter. The resulting defatted cocoa powder was much easier to dissolve inwater and other liquids and paved the way, in 1848, for the invention of the first real ‘eatingchocolate’, produced from the addition of cocoa butter and sugar to cocoa liquor (Dhoedt,2008).
In the UK in 1847, Joseph Fry was the first to produce a plain eating chocolate bar, madepossible by introduction of cocoa butter as an ingredient (Beckett, 2000 ). Demand for cocoathen sharply increased, and chocolate processing became mechanised with development ofcocoa presses for production of cocoa butter and cocoa powder by Van Houten in 1828,and milk chocolate in 1876 by Daniel Peters, who had the idea of adding milk powder –an invention of Henri Nestle, a decade earlier. This was followed by the invention of theconching machine in 1880 by Rudolphe Lindt, from where chocolate came to take on thefine taste and creamy texture we now associate with good-quality chocolate. It was stillvery much an exclusive product, however, and it was not until 1900 when the price ofchocolate’s two main ingredients, cocoa and sugar, dropped considerably that chocolatebecame accessible to the middle class. By the 1930s and 1940s, new and cheaper suppliesof raw materials and more efficient production processes had emerged at the cutting-edgeof innovation with fast-manufacturing technologies and new marketing techniques throughresearch and development by many companies in Europe and the United States, makingchocolate affordable for the wider populace. Chocolate confectionery is now ubiquitous withconsumption averaging 8.0 kg/person per annum in many European countries (Nuttall &Hart, 1999; Whitefield, 2005; ICCO, 2008).
1.2 WORLD PRODUCTION AND CONSUMPTION OFCOCOA AND CHOCOLATE PRODUCTS
1.2.1 World production and consumption of cocoa
Theobroma cacao originated in the Amazon Basin and optimal conditions for growth are20–30◦C (68–86◦F), 1500–2500 mm of annual rainfall and 2000 hours of sunshine peryear. Table 1.1 shows that density of production is centred within West Africa, accountingfor approximately 71% of world cocoa production in 2005–2006 growing season. WestAfrican countries are ideal in climatic terms for growing cocoa as a cash crop. However, asa consequence, natural or man-made problems have potentially a disproportionately largeimpact on cocoa trade. Small holders of West Africa have dominated world production sincethe 1930s. In 1980s, emergence of Malaysia and Indonesia gave more balanced geographicalspread of production.
However, a period of low prices wiped out Malaysia as a major producer and Brazil as amajor exporter, increasing share of production of West Africa. In 2005–2006, 71% of worldcocoa came from Africa: Cote d’Ivoire, 37.8%; Ghana, 19.9% (ICCO, 2008).
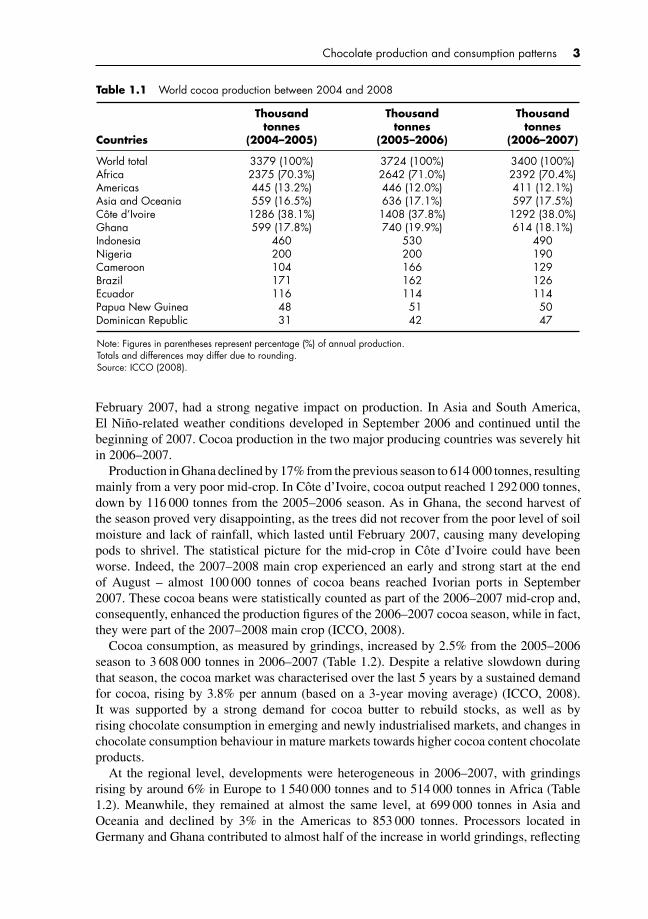
In 2006–2007, world production of cocoa beans dropped by almost 9% from the previousseason to 3.4 million tonnes, mainly as a consequence of unfavourable weather conditionsin many cocoa-producing areas. West Africa, the main cocoa-producing region, was hitby a severe harmattan and its inherent dry weather, which lasted from the end of 2006 to
P1: KAE/UKS P2: KAEc01 BLBK244-Afoakwa January 25, 2010 15:19 Printer Name: Yet to Come
Chocolate production and consumption patterns 3
Table 1.1 World cocoa production between 2004 and 2008
Countries
Thousandtonnes
(2004–2005)
Thousandtonnes
(2005–2006)
Thousandtonnes
(2006–2007)
World total 3379 (100%) 3724 (100%) 3400 (100%)Africa 2375 (70.3%) 2642 (71.0%) 2392 (70.4%)Americas 445 (13.2%) 446 (12.0%) 411 (12.1%)Asia and Oceania 559 (16.5%) 636 (17.1%) 597 (17.5%)Cote d’Ivoire 1286 (38.1%) 1408 (37.8%) 1292 (38.0%)Ghana 599 (17.8%) 740 (19.9%) 614 (18.1%)Indonesia 460 530 490Nigeria 200 200 190Cameroon 104 166 129Brazil 171 162 126Ecuador 116 114 114Papua New Guinea 48 51 50Dominican Republic 31 42 47
Note: Figures in parentheses represent percentage (%) of annual production.Totals and differences may differ due to rounding.Source: ICCO (2008).
February 2007, had a strong negative impact on production. In Asia and South America,El Nino-related weather conditions developed in September 2006 and continued until thebeginning of 2007. Cocoa production in the two major producing countries was severely hitin 2006–2007.
Production in Ghana declined by 17% from the previous season to 614 000 tonnes, resultingmainly from a very poor mid-crop. In Cote d’Ivoire, cocoa output reached 1 292 000 tonnes,down by 116 000 tonnes from the 2005–2006 season. As in Ghana, the second harvest ofthe season proved very disappointing, as the trees did not recover from the poor level of soilmoisture and lack of rainfall, which lasted until February 2007, causing many developingpods to shrivel. The statistical picture for the mid-crop in Cote d’Ivoire could have beenworse. Indeed, the 2007–2008 main crop experienced an early and strong start at the endof August – almost 100 000 tonnes of cocoa beans reached Ivorian ports in September2007. These cocoa beans were statistically counted as part of the 2006–2007 mid-crop and,consequently, enhanced the production figures of the 2006–2007 cocoa season, while in fact,they were part of the 2007–2008 main crop (ICCO, 2008).
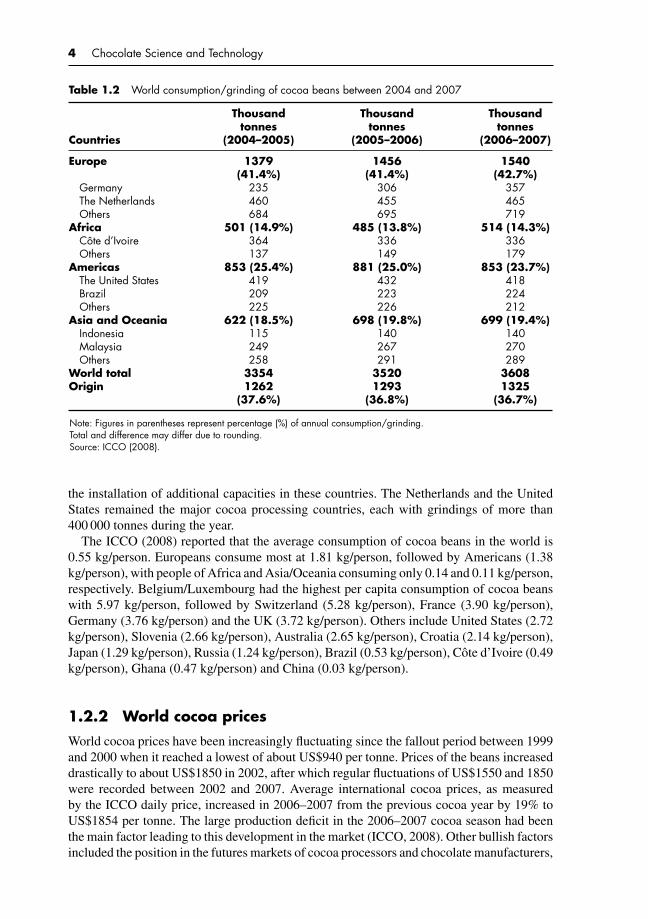
Cocoa consumption, as measured by grindings, increased by 2.5% from the 2005–2006season to 3 608 000 tonnes in 2006–2007 (Table 1.2). Despite a relative slowdown duringthat season, the cocoa market was characterised over the last 5 years by a sustained demandfor cocoa, rising by 3.8% per annum (based on a 3-year moving average) (ICCO, 2008).It was supported by a strong demand for cocoa butter to rebuild stocks, as well as byrising chocolate consumption in emerging and newly industrialised markets, and changes inchocolate consumption behaviour in mature markets towards higher cocoa content chocolateproducts.
At the regional level, developments were heterogeneous in 2006–2007, with grindingsrising by around 6% in Europe to 1 540 000 tonnes and to 514 000 tonnes in Africa (Table1.2). Meanwhile, they remained at almost the same level, at 699 000 tonnes in Asia andOceania and declined by 3% in the Americas to 853 000 tonnes. Processors located inGermany and Ghana contributed to almost half of the increase in world grindings, reflecting
P1: KAE/UKS P2: KAEc01 BLBK244-Afoakwa January 25, 2010 15:19 Printer Name: Yet to Come
4 Chocolate Science and Technology
Table 1.2 World consumption/grinding of cocoa beans between 2004 and 2007
Countries
Thousandtonnes
(2004–2005)
Thousandtonnes
(2005–2006)
Thousandtonnes
(2006–2007)
Europe 1379(41.4%)
1456(41.4%)
1540(42.7%)
Germany 235 306 357The Netherlands 460 455 465Others 684 695 719
Africa 501 (14.9%) 485 (13.8%) 514 (14.3%)Cote d’Ivoire 364 336 336Others 137 149 179
Americas 853 (25.4%) 881 (25.0%) 853 (23.7%)The United States 419 432 418Brazil 209 223 224Others 225 226 212
Asia and Oceania 622 (18.5%) 698 (19.8%) 699 (19.4%)Indonesia 115 140 140Malaysia 249 267 270Others 258 291 289
World total 3354 3520 3608Origin 1262
(37.6%)1293
(36.8%)1325
(36.7%)
Note: Figures in parentheses represent percentage (%) of annual consumption/grinding.Total and difference may differ due to rounding.Source: ICCO (2008).
the installation of additional capacities in these countries. The Netherlands and the UnitedStates remained the major cocoa processing countries, each with grindings of more than400 000 tonnes during the year.
The ICCO (2008) reported that the average consumption of cocoa beans in the world is0.55 kg/person. Europeans consume most at 1.81 kg/person, followed by Americans (1.38kg/person), with people of Africa and Asia/Oceania consuming only 0.14 and 0.11 kg/person,respectively. Belgium/Luxembourg had the highest per capita consumption of cocoa beanswith 5.97 kg/person, followed by Switzerland (5.28 kg/person), France (3.90 kg/person),Germany (3.76 kg/person) and the UK (3.72 kg/person). Others include United States (2.72kg/person), Slovenia (2.66 kg/person), Australia (2.65 kg/person), Croatia (2.14 kg/person),Japan (1.29 kg/person), Russia (1.24 kg/person), Brazil (0.53 kg/person), Cote d’Ivoire (0.49kg/person), Ghana (0.47 kg/person) and China (0.03 kg/person).
1.2.2 World cocoa prices
World cocoa prices have been increasingly fluctuating since the fallout period between 1999and 2000 when it reached a lowest of about US$940 per tonne. Prices of the beans increaseddrastically to about US$1850 in 2002, after which regular fluctuations of US$1550 and 1850were recorded between 2002 and 2007. Average international cocoa prices, as measuredby the ICCO daily price, increased in 2006–2007 from the previous cocoa year by 19% toUS$1854 per tonne. The large production deficit in the 2006–2007 cocoa season had beenthe main factor leading to this development in the market (ICCO, 2008). Other bullish factorsincluded the position in the futures markets of cocoa processors and chocolate manufacturers,
P1: KAE/UKS P2: KAEc01 BLBK244-Afoakwa January 25, 2010 15:19 Printer Name: Yet to Come
Chocolate production and consumption patterns 5
having below average forward fixed price coverage, and the weakening US dollar againstother major currencies.
The highest price level of the season was reached on 6 July 2007, when prices climbed to£1140 on the London terminal market and US$2144 in New York, their highest levels since2003. However, the strong increase in recorded prices induced some nervousness amongmarket participants and, at such relatively high prices, the markets were rendered vulnerableto profit-taking. In the second week of July, the cocoa futures markets witnessed a strongadjustment, and after a short-lived recovery, the markets again retreated until the fourth weekof August.
Notably, within the first quarter of 2009, cocoa prices were stabilised both in the Londonand New York markets, and the beans were sold around US$2300–2400 per tonne. However,in May–June 2009, prices were averaging between US$2500 and 2600 per tonne in the inter-national market. Surprisingly, between July and December 2009, prices of cocoa increasedsharply from US$2600 in July to US$3500 per tonne in December on both London andNew York terminal markets, and this trend in prices apparently will continue to rise in theensuing year. It is noteworthy that cocoa production continues to be the major agriculturalmainstay of the economies of Ghana and La Cote d’Ivoire, representing over 60% of theirrevenue generation from the agricultural sector; therefore, any price fluctuations would affectthe stabilities of these economies.
1.2.3 World consumption of chocolate products
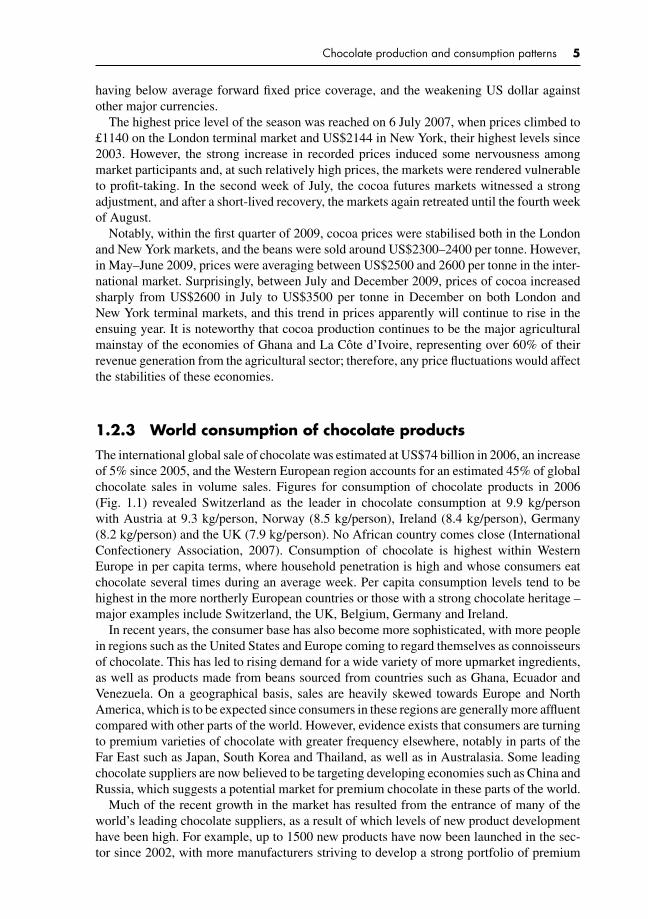
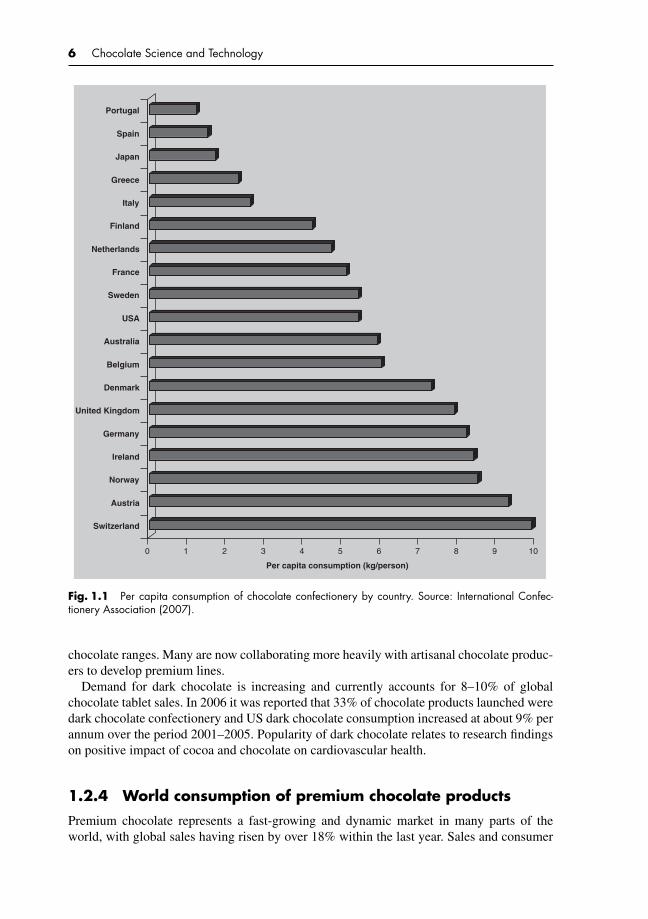
The international global sale of chocolate was estimated at US$74 billion in 2006, an increaseof 5% since 2005, and the Western European region accounts for an estimated 45% of globalchocolate sales in volume sales. Figures for consumption of chocolate products in 2006(Fig. 1.1) revealed Switzerland as the leader in chocolate consumption at 9.9 kg/personwith Austria at 9.3 kg/person, Norway (8.5 kg/person), Ireland (8.4 kg/person), Germany(8.2 kg/person) and the UK (7.9 kg/person). No African country comes close (InternationalConfectionery Association, 2007). Consumption of chocolate is highest within WesternEurope in per capita terms, where household penetration is high and whose consumers eatchocolate several times during an average week. Per capita consumption levels tend to behighest in the more northerly European countries or those with a strong chocolate heritage –major examples include Switzerland, the UK, Belgium, Germany and Ireland.
In recent years, the consumer base has also become more sophisticated, with more peoplein regions such as the United States and Europe coming to regard themselves as connoisseursof chocolate. This has led to rising demand for a wide variety of more upmarket ingredients,as well as products made from beans sourced from countries such as Ghana, Ecuador andVenezuela. On a geographical basis, sales are heavily skewed towards Europe and NorthAmerica, which is to be expected since consumers in these regions are generally more affluentcompared with other parts of the world. However, evidence exists that consumers are turningto premium varieties of chocolate with greater frequency elsewhere, notably in parts of theFar East such as Japan, South Korea and Thailand, as well as in Australasia. Some leadingchocolate suppliers are now believed to be targeting developing economies such as China andRussia, which suggests a potential market for premium chocolate in these parts of the world.
Much of the recent growth in the market has resulted from the entrance of many of theworld’s leading chocolate suppliers, as a result of which levels of new product developmenthave been high. For example, up to 1500 new products have now been launched in the sec-tor since 2002, with more manufacturers striving to develop a strong portfolio of premium
P1: KAE/UKS P2: KAEc01 BLBK244-Afoakwa January 25, 2010 15:19 Printer Name: Yet to Come
6 Chocolate Science and Technology
0 1 2 3 4 5 6 7 8 9 10
Switzerland
Austria
Norway
Ireland
Germany
United Kingdom
Denmark
Belgium
Australia
USA
Sweden
France
Netherlands
Finland
Italy
Greece
Japan
Spain
Portugal
Per capita consumption (kg/person)
Fig. 1.1 Per capita consumption of chocolate confectionery by country. Source: International Confec-tionery Association (2007).
chocolate ranges. Many are now collaborating more heavily with artisanal chocolate produc-ers to develop premium lines.
Demand for dark chocolate is increasing and currently accounts for 8–10% of globalchocolate tablet sales. In 2006 it was reported that 33% of chocolate products launched weredark chocolate confectionery and US dark chocolate consumption increased at about 9% perannum over the period 2001–2005. Popularity of dark chocolate relates to research findingson positive impact of cocoa and chocolate on cardiovascular health.
1.2.4 World consumption of premium chocolate products
Premium chocolate represents a fast-growing and dynamic market in many parts of theworld, with global sales having risen by over 18% within the last year. Sales and consumer

P1: KAE/UKS P2: KAEc01 BLBK244-Afoakwa January 25, 2010 15:19 Printer Name: Yet to Come
Chocolate production and consumption patterns 7
awareness are both growing for a variety of reasons – these include wider availability ofpremium chocolate at the retail level and high levels of new product activity. Additionally,more consumers are becoming attracted to dark chocolate on account of its health benefits,while ethical concerns have increased demand for organic and Fairtrade chocolate, all ofwhich tend to be positioned at the premium end of the market. At present, sales of premiumchocolate are heavily skewed towards the European and North American regions, whichtogether accounted for almost 98% of global value in 2007. This is mainly because consumersare generally more affluent in these parts of the world and purchasing power is thereforehigher, as well as many leading suppliers of premium chocolate are headquartered eitherin the United States or in Europe, the latter of which boasts of a long-standing chocolatemanufacturing heritage. However, sales of premium chocolate are now developing in otherparts of the world, with a more affluent urban consumer base emerging in countries such asRussia and China.
In spite of recent growth, premium varieties still account for less than 10% of the globalchocolate market. This figure rises to around 12% for Europe, and at 32%, it is especially highin Switzerland. The premium sector accounted for almost 18% of the US retail chocolatemarket in 2007, although this figure is forecast to increase to around a quarter by 2011.From a consumer’s standpoint, purchasers of premium chocolate are increasingly no longerconfined to the higher income groups, as a result of which the sector is encroaching on themainstream chocolate market. With the consumer base continuing to widen, the premiumchocolate sector is increasingly coming to mirror trends observed recently in markets such aswine and coffee. More people are now becoming more knowledgeable about specific cocoavarieties and their origins. As the premium chocolate market has grown, more of the leadingmultinational confectionery suppliers have been developing their products ranges in this area.This has mainly been done via acquisition or collaboration with specialist suppliers. Manycompanies have also increased levels of new product activity, launching new lines in sectorssuch as dark, single-origin, organic and Fairtrade chocolate.
1.3 FAIRTRADE COCOA AND CHOCOLATE IN MODERNCONFECTIONERY INDUSTRY
Fairtrade is a trading partnership that aims for sustainable development of excluded anddisadvantaged producers, seeking greater equity in international trade by offering bettertrading conditions, and securing the rights of marginalised producers and workers – especiallyin the South. Fairtrade Labelling Organizations (FLO) backed by consumers are activelyengaged in supporting producers, raising awareness and campaigning for changes in rulesand practices of conventional international trade, with regulated terms of trade that ensurethat farmers and workers in the poorest countries in the world are adequately protected andcan build a more sustainable future (Fairtrade Federation, 1999; EFTA, 2005; FLO, 2006).
The concept of ‘Fairtrade’ has existed since the early 1960s, founded by a group ofimporters and non-profit retailers in the wealthy, northern European countries and small-scale producers in developing countries. The aim was fighting against low market pricesand high dependence on brokers, a more direct type of trade with the European market.Conventional trading relations between the South and the North were believed unfair andunsustainable. Its goal is to tackle poverty in developing countries through trade, and itspragmatic approach is central to its success. However, diversity in the movement, its lack
P1: KAE/UKS P2: KAEc01 BLBK244-Afoakwa January 25, 2010 15:19 Printer Name: Yet to Come
8 Chocolate Science and Technology
of structure and economies of production scale were impediments to sustainability. Thus,since the early 1990s, the Fairtrade movement has become more organised and is nowgrowing rapidly with about US$200 million annually in sales (Brown, 1993; Kilian et al.,2006). Fairtrade models that use a broad definition of farmer benefits have been widelystudied (Dankers, 2003; Parrish et al., 2005; Shreck, 2005; Jaffee, 2007), and find Fairtradeapproaches beneficial to smallholder development. Other studies, which focus on the incomeeffects of higher prices to farmers (LeClair, 2002; Maseland & de Vaal, 2002; Lindsey,2003; Zehner, 2003), tend to conclude in favour of free trade approaches. Harmonisation ofdefinitions, increased professionalism and emphasis on quality assurance, direct marketingthrough multiple retailers and establishment of working relations with mainstream businessesto enable economies of scale, have secured steady growth of Fairtrade, coupled with consumerdemand for ethical products.
Viewed positively, globalisation of world trade, currently totalling £3.5 trillion per annum,has helped lift 400 million people out of poverty in tiger economies of East Asia and elsewhere(Geographical, 2004). However, although international trade is a powerful redistributor ofglobal wealth, it brings problems such as imbalance of economic power between producers,with wages at subsistence and below in developing countries, compared with retailers anddistributors making profits in the supply chain in the developed world (Denny & Elliott,2003). Fairtrade means better livelihoods for cocoa farmers by modernising farming withproductivity improvements, introduction of systems of good practices and improvements inliving and working conditions, guaranteeing a minimum price, perhaps more significantlyoften shortening the value chain in order to return greater revenue. Codes of good practices,containing guidelines for sustainable production, mean farmers benefit from better accessfor Fairtrade cocoa and chocolate products. This meets new requirements from consumersas demand for Fairtrade cocoa and chocolate products increases. Consumers of Fairtradecocoa and chocolate products have now value systems that demand products which providea decent living for farmers, are produced in a socially acceptable way, minimise harm to theenvironment and which are safe and healthy to enjoy (FLO, 2005). Delivering such productsis in the interest of farmers, cocoa processors, traders/exporters and chocolate manufacturers.Benefits resulting to farmers and other stakeholders in the chain delivering ‘Fairtrade cocoa’are enhanced livelihoods for farmers, improved market access and sustainable increases inproduction and consumption.
Currently in 2009, over 1.5 million people in developing countries benefit from sales ofFairtrade cocoa in 20 national markets across Europe, North America, Japan and Mexico. TheFairtrade mark appears on a range of cocoa and chocolate products including confectionery,sauces, hot drinks, snack bars and biscuits. This product range grows progressively andstandards for new categories are introduced on a regular basis. Since 1997, UK retail sales ofFairtrade cocoa-certified products have grown on average at 50% per annum and currentlyworth about €300 million. The current dilemmas of marketing Fairtrade goods in mainstreamdistribution channels can perhaps be best understood in the context of the ‘ethical consumer’movement (Carrigan & Attalla, 2001; Harrison et al., 2005). ‘Ethical consumerism’ is aseductive concept because it suggests the transformative power of individual choice andaction. It is also a message of inclusion – all consumers can, through the simple act ofchoosing one good in preference to another, create positive social and/or environmentalchange. A rise of ‘ethical consumerism’ has been documented, with systematic influences onglobal chocolate trade. Consumer values have shifted from pragmatic, price and value-drivenimperatives to a new focus on ethical values and stories behind products (Low & Davenport,2007; Poelman et al., 2007).
P1: KAE/UKS P2: KAEc01 BLBK244-Afoakwa January 25, 2010 15:19 Printer Name: Yet to Come
Chocolate production and consumption patterns 9
1.3.1 Future of Fairtrade cocoa and confectionery industry
Despite the unprecedented ‘mainstream’ respectability achieved by the Fairtrade cocoa mar-ket over the past decade, it is considered as counterhegemonic act of resistance (Shreck,2005), which seems to be struggling with its relationship to the larger global market. Al-though the Fairtrade concept is successfully moving from a marginal niche to the mainstreammarket, there are several factors that present limitations to the potential of this strategy forbringing about lasting social change. First, the structure of international trade (as governedby the World Trade Organization, WTO, and free trade agreements), within which Fairtradeinitiatives operate, is not necessarily favourable to the continuous growth of the Fairtrademarket. For instance, differentiation of commodities according to how they are producedis contradictory to the WTO’s mission of eliminating barriers to trade. Therefore, explicitcommitments to supporting Fairtrade efforts are likely to be found unacceptable by theWTO. Another barrier to market-based resistance stems from the very same enthusiasmthat contributes to the growth of alternative trade in the first place. Research suggests thatconsumers and retailers are beginning to suffer from ‘label fatigue’ as the multiplicationof competing certification schemes becomes overwhelming and the differentiation betweenlabels becomes confusing and even questionable (Watkins, 1998; Jaffee et al., 2004). A finallimitation of this form of resistance for fostering any transformative change is the producers’weak understanding of the Fairtrade market, the initiative more generally, and their role asFairtrade ‘partners’ (Shreck, 2005).
Most multinational ‘specialty’ chocolate processing companies produce premium brandsto provide increased incomes and opportunities for farmers, given the premium prices theypay for the special qualities of cocoa they buy. However, this makes the assumption thatthe value chain used by the multinationals to source their products returns the value to theproducers. As shareholder-driven organisations, it is questionable whether it would be intheir interest to adopt models that may lead to a perceived reduction in the free marketefficiency of their value chains. Despite the concerns expressed that paying premium pricesencourages more supply, they complain that the Fairtrade system is too small to supply theirneeds for high-quality beans. For instance, Nestle, ADM and Cargill alone directly processover 500 000 tonnes of cocoa beans annually, many times over the quantity accounted for byFLO-registered production. Therefore, even a significant increase in production by Fairtradegrowers would have little impact on the conventional cocoa markets, especially since Fair-trade cocoa does not attach any ‘improved quality’ criteria to its production. What wouldattract these multinational ‘specialty’ chocolate manufacturing companies to Fairtrade cocoawould be the adoption of ‘total quality’ practices, using improved harvesting, fermentationand drying methods to enhance both the physical and flavour quality characteristics, to caterfor their special or premium brands. Post-harvest processes such as fermentation and dryinghave been reported to have strong influence on final cocoa and chocolate flavour qualities(Kattenberg & Kemming, 1993; Clapperton et al., 1994; Afoakwa et al., 2007a; Beckett,2009).
Sustainability of the rapid growth of Fairtrade cocoa industry could be seen from abroader perspective than ‘fairness’ alone; indeed, it could be assumed to encompass both‘fairness’ and ‘total quality’. The adoption of sustainable Fairtrade cocoa supply chainwould be to provide a mechanism for traceability and efficiency in producing ‘total quality’produce that conforms to principles of sustainable development, delivered with emphasis onsocial, environmental, yield and quality factors, which would therefore continue to commandpremium prices.
P1: KAE/UKS P2: KAEc01 BLBK244-Afoakwa January 25, 2010 15:19 Printer Name: Yet to Come
10 Chocolate Science and Technology
1.4 THE CONCEPT OF THIS BOOK
The cocoa and chocolate industry is undergoing dynamic change in the nature of the demandfor chocolate. The trends towards niche or premium chocolate products have engendered notonly new challenges but also opportunities for all participants in the sector. Until recently, thegeneral perception was that consumption of chocolate in Europe and the United States wouldbegin to stagnate, as these major chocolate markets were reaching saturation. However,consumption behaviour across these mature markets has recently experienced major change,with the increasing appeal of premium chocolate, including organic, Fairtrade, single-origin,reduced sugar and dark and high cocoa content chocolate. Indeed, the confectionery markethas increasingly been characterised by consumer demand for taste, convenience and health,and products addressing ethical and environmental concerns.
New product developments and ‘functional foods’ with wholesome ingredients (foods thatprovide health benefits beyond basic nutrition) have played an important role in the upwardtrend of the confectionery market. In recent times, many research activities have increasinglybeen conducted on the health and nutritional benefits of cocoa and chocolate. The findingsindicate that flavanoids in cocoa may decrease low-density lipoprotein (‘bad’ cholesterol)oxidation, helping to prevent cardiovascular diseases. In addition, cocoa’s high content inantioxidants has been proved to reduce the risk of cancer. The demand for dark and highcocoa content chocolate, in particular, has surged in response to these positive findings.
The chocolate industry has demonstrated a strong ability to meet these challenges andto benefit from the new opportunities brought about through changing consumer demand.Companies traditionally known for milk chocolate products have been introducing newdark and high cocoa content chocolate products. The global dark chocolate market is nowestimated to represent between 5 and 10% of the total market for chocolate tablets (the othersbeing plain milk, plain white and filled chocolate tablets), with a higher share in continentalEurope than in the United States and the UK. Similarly, the certified organic and Fairtradechocolate markets have been booming, increasing at double-digit rates.
The advent of increased demand for chocolate has impacted significantly on the demand forcocoa beans in terms of both quantity and quality. While the chocolate industry has respondedproactively to this development, the need for cocoa producers to have further informationon this issue was brought to the fore. Such information would provide cocoa-producingcountries with a better basis for formulating and implementing policies and programmesregarding cocoa production. One of the main challenges facing producing countries, toenhance their revenues from cocoa, is to meet the changing face of consumer demand. As aresult of these increasing chocolate consumption trends, the cocoa processing and chocolatemanufacturing industry faces an enormous challenge of meeting the demand and qualitycriteria expected by the consuming populations. This has to be marched vigorously byincreasing production capacities of chocolate manufacturing industries, which also require agreat deal of understanding of the science and technology of chocolate.
As chocolate manufacturing is complex and requires numerous technological operationsand the addition of a range of ingredients to achieve products of suitable physical andchemical attributes, appearance and taste parameters with prespecified ranges, understandingthe science of its manufacturing and the technological processes that can result in the expectedproduct quality is paramount. Additionally, chocolate processing differs due to historicaldevelopment within a producing company and geographical locations in which products aresold and therefore requires the necessary expertise to achieve the required quality attributes,

P1: KAE/UKS P2: KAEc01 BLBK244-Afoakwa January 25, 2010 15:19 Printer Name: Yet to Come
Chocolate production and consumption patterns 11
rheological characteristics, flavour development and thus sensory perception that are neededto satisfy a specified consuming population.
This book is therefore a mediator in bringing modern scientific and technological knowl-edge and understanding of the processes involved in cocoa processing and chocolate manu-facturing to all who are engaged in the business of learning, making, consuming and usingcocoa and chocolate products.

P1: KAE/UKS P2: KAEc02 BLBK244-Afoakwa January 5, 2010 8:55 Printer Name: Yet to Come
2 Cocoa cultivation, bean compositionand chocolate flavour precursorformation and character
2.1 INTRODUCTION
The principal varieties of the cocoa tree Theobroma cacao (family Sterculiaceae) are Criollo,rarely grown because of disease susceptibility; Nacional with fine flavour, grown in Ecuador;Forastero from the Amazonas region; and Trinitario, a hybrid of Forastero and Criollo.Forastero varieties form most of the ‘bulk’ or ‘basic’ cocoa market. World annual cocoabean production is approximately 3.5 million metric tonnes and major producers are theIvory Coast, Ghana, Indonesia, Brazil, Nigeria, Cameroon and Ecuador. There are also anumber of smaller producers, particularly of ‘fine’ cocoa, which forms less than 5% of worldtrade (Coe & Coe, 1996; Awua, 2002; Schwan & Wheals, 2004; Amoye, 2006).
Cocoa consumption has possible health benefits with specific claims recently identified andstudied (Erdman et al., 2000; Wollgast & Anklam, 2000b; Weisburger, 2001; Tapiero et al.,2002; Steinburg et al., 2003; Gu et al., 2006; Miller et al., 2006). Cocoa beans and derivedproducts are rich in antioxidants – including catechins, epicatechin and procyanidins –polyphenols similar to those found in wine, vegetables and tea (Kim & Keeney, 1984;Yamagishi et al., 2001; Carnesecchia et al., 2002; Hatano et al., 2002; Kris-Etherton &Keen, 2002; Tapiero et al., 2002; Engler et al., 2004; Grassi et al., 2005; Lamuela-Raventoset al., 2005; Buijsse et al., 2006; Gu et al., 2006; Hermann et al., 2006; Afoakwa et al.,2007a). These contribute as precursors to flavour formation in cocoa and chocolate (Misnawiet al., 2003; Counet et al., 2004; Kyi et al., 2005).
Chocolate has a distinctive flavour character, with specific notes related to bean genotype,growing conditions and processing factors (Clapperton, 1994; Beckett, 2003; Whitefield,2005). Fermentation is a key processing stage that causes the death of the bean and facilitatesremoval of the pulp and subsequent drying. During this stage, there is initiation of flavourprecursor formation and colour development, and a significant reduction in bitterness.
The chemistry of cocoa beans in fermentations is still under study (Buyukpamukcu et al.,2001; Luna et al., 2002; Misnawi et al., 2003; Schwan & Wheals, 2004; Kyi et al., 2005)as are contributions from roasting and alkalisation (Gill et al., 1984; Jinap & Dimick, 1991;Oberparlaiter & Ziegleder, 1997; Dimick & Hoskin, 1999; Stark et al., 2005; Granvogl et al.,2006; Ramli et al., 2006; Reineccius, 2006; Stark et al., 2006a) and conching (Pontillon, 1995;Plumas et al., 1996; Beckett, 2000; Awua, 2002; Reineccius, 2006). Key flavour compoundsin chocolate have been identified (Cerny & Grosch, 1994; Cerny & Fay, 1995; Schnermann &Schieberle, 1997; Schieberle & Pfnuer, 1999; Counet et al., 2002; Taylor, 2002; Taylor &Roberts, 2004; Reineccius, 2006; Afoakwa et al., 2008a). However, the biochemical andchemical processes leading to chocolate flavour formation and development, and their rela-tionships to the final character and perceptions of quality are not fully understood.

P1: KAE/UKS P2: KAEc02 BLBK244-Afoakwa January 5, 2010 8:55 Printer Name: Yet to Come
Cocoa cultivation, bean composition and chocolate flavour precursor formation 13
This chapter discusses cocoa cultivation practices, bean composition and the biochemistryof flavour precursor formation and character in cocoa resulting from the inherent chemicalcomposition of the bean, genotypic variation in bean origin and fermentation processes, andsuggests the types of flavour precursors formed and their overall achieved characters.
2.2 COCOA CULTIVATION AND PRACTICES
2.2.1 Cultivation of cocoa
Cocoa cultivation requires an appropriate climate that is mostly found within the area boundedby the Tropics of Cancer and Capricorn. The majority of the world’s cocoa is grown as smallor large plantations within 10◦ North and South of the equator, and best suited for sea levelup to a maximum of about 1000 m, although most of the world’s cocoa grows at an altitude ofless than 300 m. Cultivation requires temperatures generally within 18–32◦C (65–90◦F) andrainfall well distributed across the year, with a range between 1000 and 4000 mm (40–160 in.)per year, but preferably between 1500 and 2500 mm (60 and 100 in.).
During cultivation, cocoa prefers high humidity, typically ranging between 70–80% duringthe day and 90–100% at night. Cocoa trees are usually planted to achieve a final density of600–1200 trees/ha (1500–3000 trees/acre) and intercropped with food crops (Fig. 2.1). Dueto the fragility of the cocoa trees during the early stages of growth, they are mostly protectedfrom strong winds using food crops; for instance, plantain tress are used as wind shield onplantations in Ghana. The trees grow well on most soil but preferably well-aerated soils withgood drainage and a pH of neutral to slightly acidic (5.0–7.5), and pest and diseases carefullycontrolled (Fowler, 1999). Cocoa trees used to grow to a height of approximately 10 m tallat maturity, preferably under the shades of other trees. However, modern breeding methodshave led to the development of trees to a standard of approximately 3 m tall to allow for easyharvesting.
Fig. 2.1 Cocoa plantation showing young trees intercropped with food crops (plantain). See ColourPlate No. 2.
P1: KAE/UKS P2: KAEc02 BLBK244-Afoakwa January 5, 2010 8:55 Printer Name: Yet to Come
14 Chocolate Science and Technology
2.2.2 Flowering and pod development
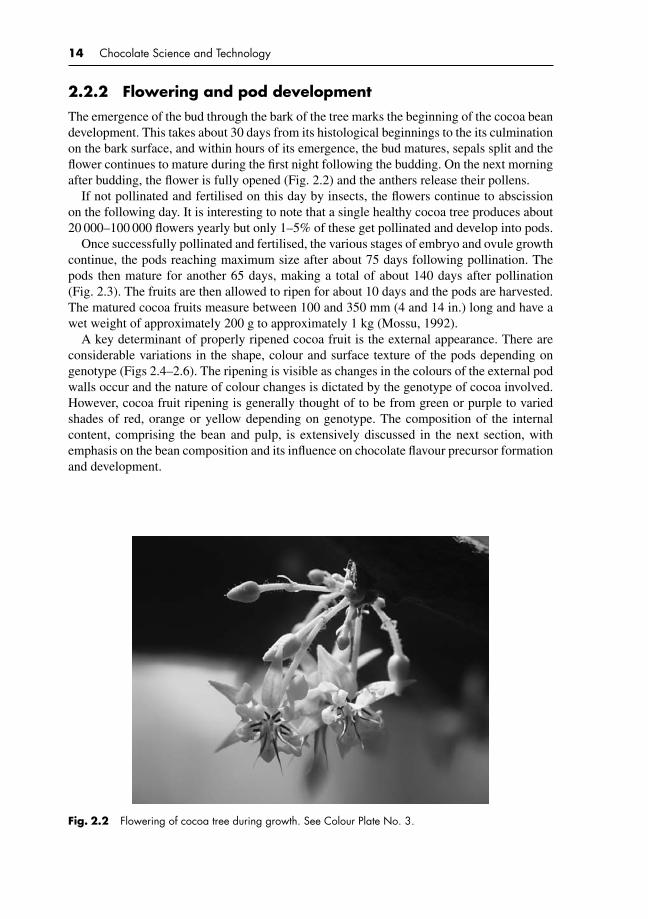
The emergence of the bud through the bark of the tree marks the beginning of the cocoa beandevelopment. This takes about 30 days from its histological beginnings to the its culminationon the bark surface, and within hours of its emergence, the bud matures, sepals split and theflower continues to mature during the first night following the budding. On the next morningafter budding, the flower is fully opened (Fig. 2.2) and the anthers release their pollens.
If not pollinated and fertilised on this day by insects, the flowers continue to abscissionon the following day. It is interesting to note that a single healthy cocoa tree produces about20 000–100 000 flowers yearly but only 1–5% of these get pollinated and develop into pods.
Once successfully pollinated and fertilised, the various stages of embryo and ovule growthcontinue, the pods reaching maximum size after about 75 days following pollination. Thepods then mature for another 65 days, making a total of about 140 days after pollination(Fig. 2.3). The fruits are then allowed to ripen for about 10 days and the pods are harvested.The matured cocoa fruits measure between 100 and 350 mm (4 and 14 in.) long and have awet weight of approximately 200 g to approximately 1 kg (Mossu, 1992).
A key determinant of properly ripened cocoa fruit is the external appearance. There areconsiderable variations in the shape, colour and surface texture of the pods depending ongenotype (Figs 2.4–2.6). The ripening is visible as changes in the colours of the external podwalls occur and the nature of colour changes is dictated by the genotype of cocoa involved.However, cocoa fruit ripening is generally thought of to be from green or purple to variedshades of red, orange or yellow depending on genotype. The composition of the internalcontent, comprising the bean and pulp, is extensively discussed in the next section, withemphasis on the bean composition and its influence on chocolate flavour precursor formationand development.
Fig. 2.2 Flowering of cocoa tree during growth. See Colour Plate No. 3.

P1: KAE/UKS P2: KAEc02 BLBK244-Afoakwa January 5, 2010 8:55 Printer Name: Yet to Come
Cocoa cultivation, bean composition and chocolate flavour precursor formation 15
Fig. 2.3 Mature Amelonado-type cocoa trees bearing unripe pods.
Fig. 2.4 Unharvested West African Forastero (Amelanodo) cocoa fruits.

P1: KAE/UKS P2: KAEc02 BLBK244-Afoakwa January 5, 2010 8:55 Printer Name: Yet to Come
16 Chocolate Science and Technology
Fig. 2.5 Unharvested ripe and unripe Venezuelan Trinatario cocoa fruits.
Fig. 2.6 Unharvested Ecuadorian Nacional (Arriba) cocoa fruits. See Colour Plate No. 9.
2.2.3 Harvesting and pod opening
Harvesting of cocoa fruits involves the removal of pods from the trees and the extraction ofthe beans and pulp from the interior of the pod. While the ripening process occurs in a 7- to10-day period, the pods can safely be left on the trees for up to 2 weeks before harvesting.Thus, a 3-week window exists during which the cocoa may be considered fit to harvest.There are two concerns that dictate how quickly the harvest is completed – potential for poddiseases and the possibility of bean germination in the pod, if delayed for too long.
P1: KAE/UKS P2: KAEc02 BLBK244-Afoakwa January 5, 2010 8:55 Printer Name: Yet to Come
Cocoa cultivation, bean composition and chocolate flavour precursor formation 17
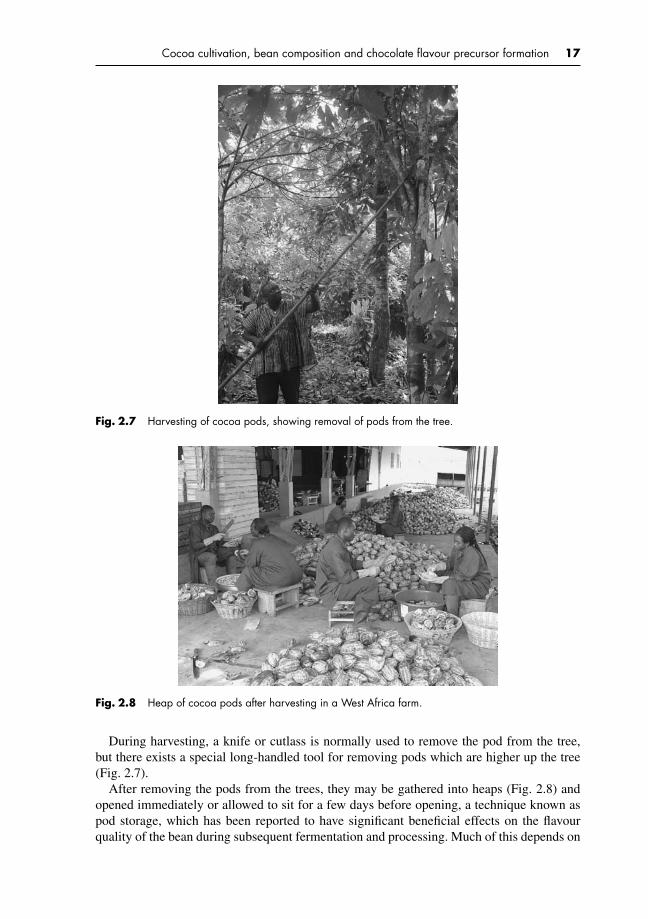
Fig. 2.7 Harvesting of cocoa pods, showing removal of pods from the tree.
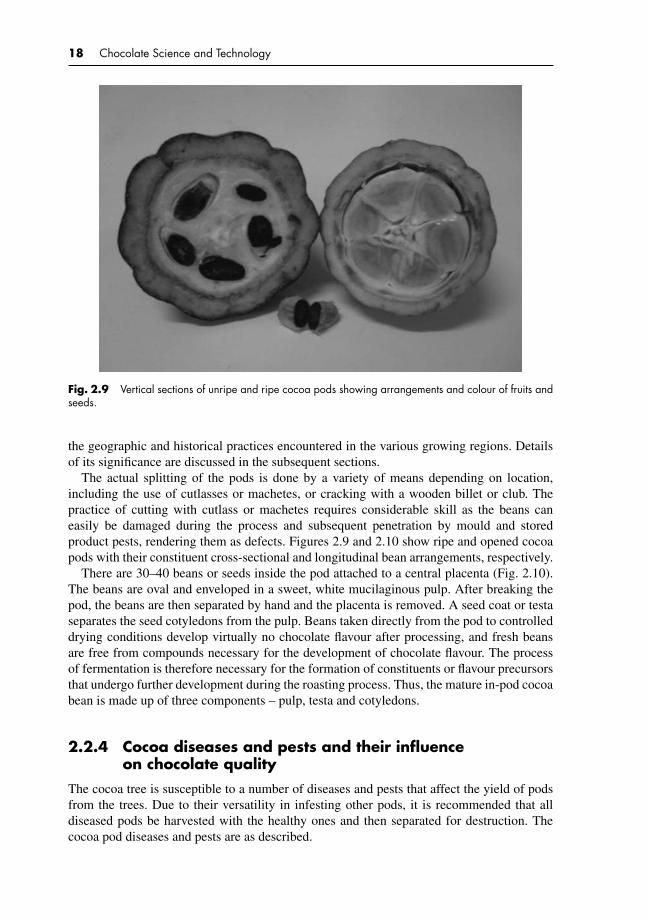
Fig. 2.8 Heap of cocoa pods after harvesting in a West Africa farm.
During harvesting, a knife or cutlass is normally used to remove the pod from the tree,but there exists a special long-handled tool for removing pods which are higher up the tree(Fig. 2.7).
After removing the pods from the trees, they may be gathered into heaps (Fig. 2.8) andopened immediately or allowed to sit for a few days before opening, a technique known aspod storage, which has been reported to have significant beneficial effects on the flavourquality of the bean during subsequent fermentation and processing. Much of this depends on
P1: KAE/UKS P2: KAEc02 BLBK244-Afoakwa January 5, 2010 8:55 Printer Name: Yet to Come
18 Chocolate Science and Technology
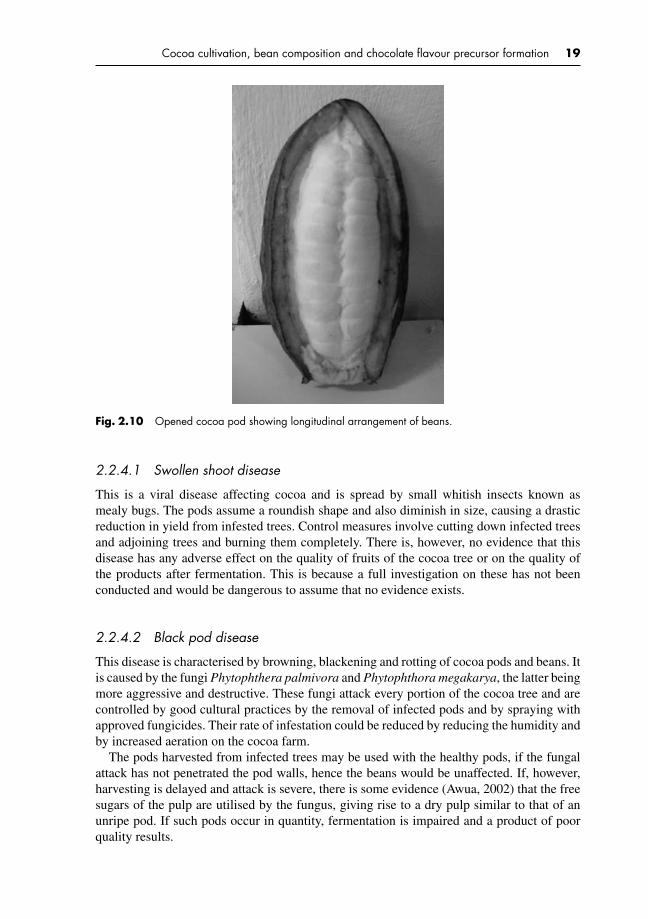
Fig. 2.9 Vertical sections of unripe and ripe cocoa pods showing arrangements and colour of fruits andseeds.
the geographic and historical practices encountered in the various growing regions. Detailsof its significance are discussed in the subsequent sections.
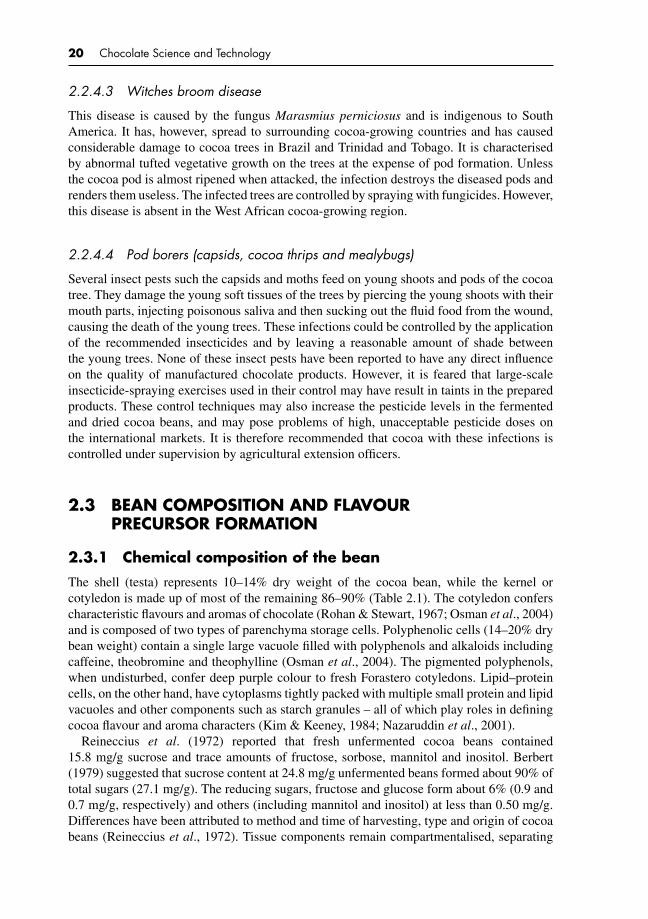
The actual splitting of the pods is done by a variety of means depending on location,including the use of cutlasses or machetes, or cracking with a wooden billet or club. Thepractice of cutting with cutlass or machetes requires considerable skill as the beans caneasily be damaged during the process and subsequent penetration by mould and storedproduct pests, rendering them as defects. Figures 2.9 and 2.10 show ripe and opened cocoapods with their constituent cross-sectional and longitudinal bean arrangements, respectively.
There are 30–40 beans or seeds inside the pod attached to a central placenta (Fig. 2.10).The beans are oval and enveloped in a sweet, white mucilaginous pulp. After breaking thepod, the beans are then separated by hand and the placenta is removed. A seed coat or testaseparates the seed cotyledons from the pulp. Beans taken directly from the pod to controlleddrying conditions develop virtually no chocolate flavour after processing, and fresh beansare free from compounds necessary for the development of chocolate flavour. The processof fermentation is therefore necessary for the formation of constituents or flavour precursorsthat undergo further development during the roasting process. Thus, the mature in-pod cocoabean is made up of three components – pulp, testa and cotyledons.
2.2.4 Cocoa diseases and pests and their influenceon chocolate quality
The cocoa tree is susceptible to a number of diseases and pests that affect the yield of podsfrom the trees. Due to their versatility in infesting other pods, it is recommended that alldiseased pods be harvested with the healthy ones and then separated for destruction. Thecocoa pod diseases and pests are as described.
P1: KAE/UKS P2: KAEc02 BLBK244-Afoakwa January 5, 2010 8:55 Printer Name: Yet to Come
Cocoa cultivation, bean composition and chocolate flavour precursor formation 19
Fig. 2.10 Opened cocoa pod showing longitudinal arrangement of beans.
2.2.4.1 Swollen shoot disease
This is a viral disease affecting cocoa and is spread by small whitish insects known asmealy bugs. The pods assume a roundish shape and also diminish in size, causing a drasticreduction in yield from infested trees. Control measures involve cutting down infected treesand adjoining trees and burning them completely. There is, however, no evidence that thisdisease has any adverse effect on the quality of fruits of the cocoa tree or on the quality ofthe products after fermentation. This is because a full investigation on these has not beenconducted and would be dangerous to assume that no evidence exists.
2.2.4.2 Black pod disease
This disease is characterised by browning, blackening and rotting of cocoa pods and beans. Itis caused by the fungi Phytophthera palmivora and Phytophthora megakarya, the latter beingmore aggressive and destructive. These fungi attack every portion of the cocoa tree and arecontrolled by good cultural practices by the removal of infected pods and by spraying withapproved fungicides. Their rate of infestation could be reduced by reducing the humidity andby increased aeration on the cocoa farm.
The pods harvested from infected trees may be used with the healthy pods, if the fungalattack has not penetrated the pod walls, hence the beans would be unaffected. If, however,harvesting is delayed and attack is severe, there is some evidence (Awua, 2002) that the freesugars of the pulp are utilised by the fungus, giving rise to a dry pulp similar to that of anunripe pod. If such pods occur in quantity, fermentation is impaired and a product of poorquality results.
P1: KAE/UKS P2: KAEc02 BLBK244-Afoakwa January 5, 2010 8:55 Printer Name: Yet to Come
20 Chocolate Science and Technology
2.2.4.3 Witches broom disease
This disease is caused by the fungus Marasmius perniciosus and is indigenous to SouthAmerica. It has, however, spread to surrounding cocoa-growing countries and has causedconsiderable damage to cocoa trees in Brazil and Trinidad and Tobago. It is characterisedby abnormal tufted vegetative growth on the trees at the expense of pod formation. Unlessthe cocoa pod is almost ripened when attacked, the infection destroys the diseased pods andrenders them useless. The infected trees are controlled by spraying with fungicides. However,this disease is absent in the West African cocoa-growing region.
2.2.4.4 Pod borers (capsids, cocoa thrips and mealybugs)
Several insect pests such the capsids and moths feed on young shoots and pods of the cocoatree. They damage the young soft tissues of the trees by piercing the young shoots with theirmouth parts, injecting poisonous saliva and then sucking out the fluid food from the wound,causing the death of the young trees. These infections could be controlled by the applicationof the recommended insecticides and by leaving a reasonable amount of shade betweenthe young trees. None of these insect pests have been reported to have any direct influenceon the quality of manufactured chocolate products. However, it is feared that large-scaleinsecticide-spraying exercises used in their control may have result in taints in the preparedproducts. These control techniques may also increase the pesticide levels in the fermentedand dried cocoa beans, and may pose problems of high, unacceptable pesticide doses onthe international markets. It is therefore recommended that cocoa with these infections iscontrolled under supervision by agricultural extension officers.
2.3 BEAN COMPOSITION AND FLAVOURPRECURSOR FORMATION
2.3.1 Chemical composition of the bean
The shell (testa) represents 10–14% dry weight of the cocoa bean, while the kernel orcotyledon is made up of most of the remaining 86–90% (Table 2.1). The cotyledon conferscharacteristic flavours and aromas of chocolate (Rohan & Stewart, 1967; Osman et al., 2004)and is composed of two types of parenchyma storage cells. Polyphenolic cells (14–20% drybean weight) contain a single large vacuole filled with polyphenols and alkaloids includingcaffeine, theobromine and theophylline (Osman et al., 2004). The pigmented polyphenols,when undisturbed, confer deep purple colour to fresh Forastero cotyledons. Lipid–proteincells, on the other hand, have cytoplasms tightly packed with multiple small protein and lipidvacuoles and other components such as starch granules – all of which play roles in definingcocoa flavour and aroma characters (Kim & Keeney, 1984; Nazaruddin et al., 2001).
Reineccius et al. (1972) reported that fresh unfermented cocoa beans contained15.8 mg/g sucrose and trace amounts of fructose, sorbose, mannitol and inositol. Berbert(1979) suggested that sucrose content at 24.8 mg/g unfermented beans formed about 90% oftotal sugars (27.1 mg/g). The reducing sugars, fructose and glucose form about 6% (0.9 and0.7 mg/g, respectively) and others (including mannitol and inositol) at less than 0.50 mg/g.Differences have been attributed to method and time of harvesting, type and origin of cocoabeans (Reineccius et al., 1972). Tissue components remain compartmentalised, separating

P1: KAE/UKS P2: KAEc02 BLBK244-Afoakwa January 5, 2010 8:55 Printer Name: Yet to Come
Cocoa cultivation, bean composition and chocolate flavour precursor formation 21
Table 2.1 Bean composition of unfermented West African (Forastero) cocoa
Constituents Dried beans (%) Fat-free materials (%)
Cotyledons 89.60 —Shell 9.63 —Germ 0.77 —Fat 53.05 —Water 3.65 —Ash (total) 2.63 6.07
NitrogenTotal nitrogen 2.28 5.27Protein nitrogen 1.50 3.46Theobromine 1.71 3.95Caffeine 0.085 0.196
CarbohydratesGlucose 0.30 0.69Sucrose 1.58 3.86Starch 6.10 14.09Pectins 2.25 5.20Fibre 2.09 4.83Pentosans 1.27 2.93Mucilage and gums 0.38 0.88
Polyphenols 7.54 17.43
AcidsAcetic (free) 0.014 0.032Oxalic 0.29 0.67
Sources: Rohan (1963) and Reineccius et al. (1972).
flavour constituents that may interact with cell membrane and wall breakdown during thesubsequent fermentation.
2.3.2 Polyphenols and chocolate flavour quality
Cocoa is rich in polyphenols, specifically catechins (flavan-3-ols) and procyanidins, stored incotyledon pigment cells and cocoa leaves (Osman et al., 2004). Depending on anthocyanincontent, pigmentation in polyphenol-storage cells ranges from white to deep purple. Polyphe-nol and alkaloids, approximately 14–20% bean weight, are central to bean flavour character(Kim & Keeney, 1983). Three groups of polyphenols can be differentiated: catechins orflavan-3-ols (∼37%), anthocyanins (∼4%) and proanthocyanidins (∼58%). The primarycatechin is (−)-epicatechin, up to 35% of total polyphenols and from 34.65 to 43.27 mg/gof defatted freshly harvested Criollo and Forastero beans (Kim & Keeney, 1984). Lessabundant is (+)-catechin with only traces of (+)-gallocatechin and (−)-epigallocatechin.Nazaruddin et al. (2001) reported total polyphenols ranged from 45 to 52 mg/g in cocoaliquor, 34 to 60 in beans and 20 to 62 in powder: (−)-epicatechin contents were 2.53, 4.61and 3.81 mg/g, respectively.
The anthocyanin fraction is dominated by cyanidin-3-α-l-arabinoside and cyanidin-3-β-d-galactoside. Procyanidins are mostly flavan-3,4-diols and are four to eight or four tosix bound to form dimers, trimers or oligomers with epicatechin as main extension subunit(Romanczyk et al., 1997). Fat-soluble polyphenols in dried fat-free fresh Forastero cocoaform 15–20%, which falls to approximately 5% after fermentation. Contents of 10% or

P1: KAE/UKS P2: KAEc02 BLBK244-Afoakwa January 5, 2010 8:55 Printer Name: Yet to Come
22 Chocolate Science and Technology
greater are considered a sign of poor fermentation. Higher concentrations of polyphenolslead to very astringent-tasting chocolate. Criollo cocoa beans have approximately two-thirdsof this content of polyphenols, and anthocyanins have not been found (Lange & Fincke,1970; Hansen et al., 2000). Polyphenol reactions with sugar and amino acids contributeflavour and colour to cocoa beans and alkaloids to the bitterness (Lehrian & Patterson,1983). During fermentation, protein breakdown occurs partly by hydrolysis to peptides andamino acids and partly by conversion to insoluble forms by the actions of polyphenols.Polyphenol oxidase promotes oxidative browning to give the characteristic chocolate browncolour of well-fermented Forastero beans.
2.3.3 Effects of proteins and sugars on flavourprecursor formation
Cocoa cotyledons contain as storage proteins single albumin and globulin species (Biehl et al.,1982a). The globulin, with two polypeptides of 47 and 31 kDa (Pettipher, 1990; Spencer &Hodge, 1992; Voigt et al., 1993), is degraded in fermentation, the albumin (21 kDa) isnot. Cocoa-specific aroma precursors can be generated in vitro from globulin in partiallypurified bean fractions by aspartic endoprotease and carboxypeptidase activities (Voigt et al.,1994a). Cotyledon protein degradation into peptides and free amino acids appears centralto flavour formation. The consensus is that the combined action of two proteases, namelyaspartic endopeptidase and serine carboxy-(exo)peptidase, on vicilin (7S)-class globulin(VCG) storage polypeptide yields cocoa-specific precursors. The aspartic endopeptidase(EC 3.4.23) hydrolyses peptide bonds in VCG at hydrophobic amino acid residues, forminghydrophobic oligopeptides – substrates for the serine exopeptidase (EC 3.4.16.1) that removecarboxyl terminal hydrophobic amino acid residues (Biehl et al., 1993; Voigt et al., 1994b;Biehl et al., 1996; Biehl & Voigt, 1999).
Kirchhoff et al. (1989) observed a correlation between free amino acid accumulation andgeneration of specific aroma precursors, with pH-dependent proteolytic processes. Activitiesin both key enzymes are pH dependent, near to pH 3.8 – optimum for aspartic endopeptidase –more hydrophobic oligopeptides and less free amino acids are produced. Whereas close to5.8 – the optimum for serine exopeptidase – there are increases in hydrophilic oligopeptidesand hydrophobic amino acids. Related storage proteins or alternative peptidases both failedto produce appropriate flavour precursors. With a rapid fall to low pH (<4.5), reductionin flavour precursors is observed and slow diffusion of organic acids through cotyledons,timing of initial entry, duration of optimum pH and final pH are crucial for final flavour(Biehl & Voigt, 1999). Thus, bean composition interacts with fermentation in formation ofcocoa flavour quality. Analysis of VCG proteins and proteolytic degradation products infive popular genotypes (Forastero, Criollo, Trinitario, SCA 12 and UIT1) concluded thatcharacter in chocolate may vary, but all genotypes had potential for abundant aroma contentin raw cocoa (Amin et al., 2002).
Electrophoretic (SDS-PAGE) analyses showed polypeptide species at 47, 31 and approx-imately 14.5 kDa, all derived from post-translational modification of a vicilin (7S) storageprotein precursor observed in vivo as a 139-kDa trimer (Biehl et al., 1982b; MacDonaldet al., 1994). Polypeptide and cDNA sequence data showed considerable homology to other7S class storage proteins, and specifically α-globulin in cotton seeds (McHenry & Fritz,1992; Spencer & Hodge, 1992). Specific cocoa aroma was obtained in vitro when this vicilinglobulin was successively degraded by an aspartic endoprotease and a carboxypeptidase and

P1: KAE/UKS P2: KAEc02 BLBK244-Afoakwa January 5, 2010 8:55 Printer Name: Yet to Come
Cocoa cultivation, bean composition and chocolate flavour precursor formation 23
products were roasted in the presence of reducing sugars (Voigt et al., 1994a, b). Acidificationduring fermentation is critical for final cocoa quality since the different pH optima of endo-protease and carboxypeptidase activities determine efficiency and products of proteolysis.The outcome is mixtures of hydrophobic and hydrophilic peptides, the latter more importantfor formation of typical aroma notes. In summary, it can be concluded that proteolysis ofglobulin is central to cocoa flavour formation.
Low-molecular-weight protein breakdown products and reducing sugars all contribute toMaillard reactions that produce cocoa flavour in roasting (Rohan & Stewart, 1967). Peptidesand hydrophobic free amino acids, specifically leucine, alanine, phenylalanine and tyrosine,released during fermentation by aspartic proteinase and carboxypeptidase activities (Voigtet al., 1993, 1994a) contribute to flavour (Mohr et al., 1976) by reacting with fructose andglucose (Lopez et al., 1978). Cocoa fermentation protein breakdown has been characterisedby Rohan and Stewart (1967), Lopez et al. (1978), Biehl and Passern (1982) and Biehl et al.(1985) and studied changes in sugars.
2.3.4 Microbial succession and enzymatic activities duringflavour precursor generation in cocoa fermentation
During fermentation, microbial activity on the cocoa pulp generates heat and producesethanol, acetic and lactic acids that kill the bean. Until the pods are split, the beans aremicrobiologically sterile. Once the pod is split, the beans and pulp are exposed to numeroussources of micro-organisms, including the farmer’s hands and implements, the pods exteriorand largely insect activity on the farms. The immediate effect of this exposure is the initiationof the microbiological attack of the sugar-rich acidic pulp. At the initial stages of fermentationprocess, also known as the anaerobic hydrolytic phase, the pulp condition is anaerobic andanaerobic yeasts flourish.
The yeasts quickly generate an alcoholic fermentation, and the sugars in the pulp areconverted to alcohol and carbon dioxide. The citric acid is used in the metabolism of theyeasts. This initiates a slow rise in the pH of the pulp material. The yeasts dominate thefirst 24–36 hours of the fermentation process, after which the rising pH creates a self-limiting factor on further proliferation. In addition, enzymes released by the yeasts attackthe pectin constituents of the cell walls of the pulp mass. The subsequent release of the fluidcell contents runs off the fermenting pulp as what is referred to as ‘sweatings’. Examples ofyeasts isolated during cocoa fermentation include Saccharomyces cerevisiae, Kluyveromycesmarxianus, Saccharomyces exiguous, Candida castelli, Candida saitoana, Candida guil-liermondii, Schizosaccharomyces pombe, Pichia farinosa and Torulopsis spp. (Schwan &Wheals, 2004).
The continuous breakdown of the pulp and its liquefaction result in the formation of voidsbetween the cells in the pulp. The loss of fluids through the sweating process increases therate of acid depletion as it is carried away in the run-off. These voids increase in size andallow air to percolate through the pulpy mass. The combination of this change from anaerobicto aerobic conditions in the substrate, the rise in pH as the citric acid is consumed and lossthrough sweating and increasing alcohol content being generated by the fermentation of thesugars leads to the eventual inhibition of yeast activity. This signals the end of the anaerobicphase of the process.
The second phase known as the oxidative condensation phase occurs under aerobicconditions and is initially dominated by lactic acid bacteria. Lactic acid bacteria increase
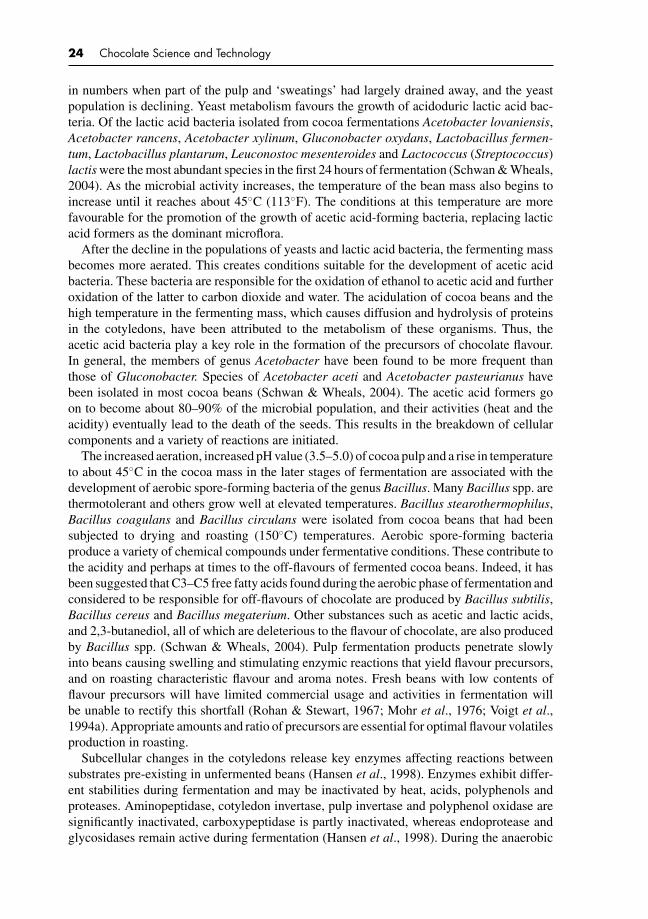
P1: KAE/UKS P2: KAEc02 BLBK244-Afoakwa January 5, 2010 8:55 Printer Name: Yet to Come
24 Chocolate Science and Technology
in numbers when part of the pulp and ‘sweatings’ had largely drained away, and the yeastpopulation is declining. Yeast metabolism favours the growth of acidoduric lactic acid bac-teria. Of the lactic acid bacteria isolated from cocoa fermentations Acetobacter lovaniensis,Acetobacter rancens, Acetobacter xylinum, Gluconobacter oxydans, Lactobacillus fermen-tum, Lactobacillus plantarum, Leuconostoc mesenteroides and Lactococcus (Streptococcus)lactis were the most abundant species in the first 24 hours of fermentation (Schwan & Wheals,2004). As the microbial activity increases, the temperature of the bean mass also begins toincrease until it reaches about 45◦C (113◦F). The conditions at this temperature are morefavourable for the promotion of the growth of acetic acid-forming bacteria, replacing lacticacid formers as the dominant microflora.
After the decline in the populations of yeasts and lactic acid bacteria, the fermenting massbecomes more aerated. This creates conditions suitable for the development of acetic acidbacteria. These bacteria are responsible for the oxidation of ethanol to acetic acid and furtheroxidation of the latter to carbon dioxide and water. The acidulation of cocoa beans and thehigh temperature in the fermenting mass, which causes diffusion and hydrolysis of proteinsin the cotyledons, have been attributed to the metabolism of these organisms. Thus, theacetic acid bacteria play a key role in the formation of the precursors of chocolate flavour.In general, the members of genus Acetobacter have been found to be more frequent thanthose of Gluconobacter. Species of Acetobacter aceti and Acetobacter pasteurianus havebeen isolated in most cocoa beans (Schwan & Wheals, 2004). The acetic acid formers goon to become about 80–90% of the microbial population, and their activities (heat and theacidity) eventually lead to the death of the seeds. This results in the breakdown of cellularcomponents and a variety of reactions are initiated.
The increased aeration, increased pH value (3.5–5.0) of cocoa pulp and a rise in temperatureto about 45◦C in the cocoa mass in the later stages of fermentation are associated with thedevelopment of aerobic spore-forming bacteria of the genus Bacillus. Many Bacillus spp. arethermotolerant and others grow well at elevated temperatures. Bacillus stearothermophilus,Bacillus coagulans and Bacillus circulans were isolated from cocoa beans that had beensubjected to drying and roasting (150◦C) temperatures. Aerobic spore-forming bacteriaproduce a variety of chemical compounds under fermentative conditions. These contribute tothe acidity and perhaps at times to the off-flavours of fermented cocoa beans. Indeed, it hasbeen suggested that C3–C5 free fatty acids found during the aerobic phase of fermentation andconsidered to be responsible for off-flavours of chocolate are produced by Bacillus subtilis,Bacillus cereus and Bacillus megaterium. Other substances such as acetic and lactic acids,and 2,3-butanediol, all of which are deleterious to the flavour of chocolate, are also producedby Bacillus spp. (Schwan & Wheals, 2004). Pulp fermentation products penetrate slowlyinto beans causing swelling and stimulating enzymic reactions that yield flavour precursors,and on roasting characteristic flavour and aroma notes. Fresh beans with low contents offlavour precursors will have limited commercial usage and activities in fermentation willbe unable to rectify this shortfall (Rohan & Stewart, 1967; Mohr et al., 1976; Voigt et al.,1994a). Appropriate amounts and ratio of precursors are essential for optimal flavour volatilesproduction in roasting.
Subcellular changes in the cotyledons release key enzymes affecting reactions betweensubstrates pre-existing in unfermented beans (Hansen et al., 1998). Enzymes exhibit differ-ent stabilities during fermentation and may be inactivated by heat, acids, polyphenols andproteases. Aminopeptidase, cotyledon invertase, pulp invertase and polyphenol oxidase aresignificantly inactivated, carboxypeptidase is partly inactivated, whereas endoprotease andglycosidases remain active during fermentation (Hansen et al., 1998). During the anaerobic

P1: KAE/UKS P2: KAEc02 BLBK244-Afoakwa January 5, 2010 8:55 Printer Name: Yet to Come
Cocoa cultivation, bean composition and chocolate flavour precursor formation 25
phase, the complex pigment components are attacked by glycosidases and are converted byhydrolysis to sugars and cyanidins. As well, sucrose is converted to glucose and fructoseby invertase, the conversion of proteins to peptides and amino acids by proteinase and theconversion of polyphenols to quinines by polyphenols oxidase. During these processes, thecolour of the cotyledons slowly changes, and in the case of Forastero varieties, the deep pur-ple tissue is converted to a red-brown colour. As the anaerobic phase nears its termination,the products of the enzymatic actions remain to be further converted in subsequent reactions.
In the aerobic phase, cyanidin and protein–phenolic complexes undergo oxidative reac-tions, which are eventually expressed as the final spread of brown colour across the cotyledonsurfaces as the repurple pigments react. Quinone, generated by the actions of the polyphenolsoxidase, now reacts with hydrogen-bearing compounds. These in turn, form complexes withamines, amino acids and sulphur-bearing compounds, leading to the lessening of astringencyand bitterness during subsequent roasting of the nibs. Clearly, the changes that occur withinthe bean during fermentation are very complicated and that the hydrolytic and subsequentoxidative reactions generate numerous biochemical complexes that serve as flavour precur-sors during the roasting process. The genetic make-up of the bean is also certainly crucial tothis process. Hansen et al. (2000) noted that differences in enzyme activities can be partlyexplained by pod variation and genotype, but in general, activities present in unfermentedbeans seem not a limiting factor for optimal flavour precursor formation in fermentation.Significant fermentation effects may relate to factors such as storage protein sequence andaccessibility, destruction of cell compartmentalisation, enzyme mobilisation and pulp andtesta changes.
Proteases affect multiple cellular processes in plants, such as protein maturation and degra-dations associated with tissue restructuring and cell maintenance (Callis, 1995). Key asparticproteinases (EC 3.4.23) have been characterised in a number of T. cacao gymnosperms(Mutlu & Gal, 1999), and activity in seeds of T. cacao has been extensively studied by Biehlet al. (1993). Partially purified aspartic proteinase had activity optima at 55◦C and pH 3.5.Subsequently, Voigt et al. (1995) purified T. cacao seed aspartic proteinase into a heterodimerof 29 and 13 kDa polypeptides that efficiently hydrolysed T. cacao seed vicilin and (lesseffectively) trypsin inhibitor into peptides (Voigt et al., 1994a).
Two cDNA species, TcAP1 and TcAP2, respectively, encoding different polypeptides ofthe plant aspartic proteinase gene family, have been cloned and characterised (Laloi et al.,2002). Both genes are induced early in seed development and show significantly decreasedexpression as the seeds reach maturity. However, TcAP2 expression is induced to higherlevels, suggesting the gene encodes the primary aspartic proteinase in the mature seed. Itshould also be noted that T. cacao seeds have unusually high levels of such aspartic proteinaseactivity (Voigt et al., 1994a). Guilloteau et al. (2005) noted that physical and biochemicalproperties of the active T. cacao seed TcAP2 aspartic proteinase complex are novel, suggest-ing the highly expressed gene product may represent a previously uncharacterised activity.Purified TcAP2 gene product efficiently degrades cocoa seed vicilin into low molecular prod-ucts including di- and tripeptides, implying that this gene product may play an importantrole during fermentation.
A processing sequence is required to produce cocoa beans with good flavour. Pulp sugarfermentation should yield high levels of acids, particularly acetic acid (Voigt et al., 1994a). Asseed pH decreases, cell structure is disrupted, which triggers mobilisation and/or activationof the primary aspartic proteinase activity with massive degradation of cellular protein (Biehlet al., 1982b, 1985). Fermentation proteinase and peptidase activities seem critical for goodflavour quality (Voigt & Biehl, 1995; Laloi et al., 2002).

P1: KAE/UKS P2: KAEc02 BLBK244-Afoakwa January 5, 2010 8:55 Printer Name: Yet to Come
26 Chocolate Science and Technology
Significant differences in enzyme activities exist between cocoa genotypes, but simple andgeneral relationships have not been established between genotype flavour potential and keyenzyme activities in unfermented beans. Therefore, how enzymatic processes are regulated,and substrates and products that relate to desirable flavours, and limiting factors for theenzymatic contribution to fermentation processes remain unclear.
2.4 EFFECT OF GENOTYPE ON COCOA BEAN FLAVOURS
Genotype influences both flavour quality and intensity in chocolate (Luna et al., 2002;Taylor, 2002; Counet et al., 2004; Taylor & Roberts, 2004), likely determining quantities ofprecursors and activity of enzymes, and thus contributions to flavour formation. Reineccius(2006) concluded that varietal differences were primarily due to quantitative (as opposed toqualitative) differences in flavour precursor and polyphenol contents. Contents of sugars andenzymic breakdown of polysaccharides form an important source of precursors. However,post-harvest processes (fermentation and drying) and roasting have a strong influence on finalflavours (Kattenberg & Kemming, 1993; Clapperton et al., 1994; Luna et al., 2002; Counet &Collin, 2003). Three primary cocoa types, Forastero (bulk grade), Criollo (fine grade) andhybrid, Trinatario (fine grade), show wide variations in final flavour (Beckett, 2000; Awua,2002; Amoye, 2006). Nacional cocoa is viewed as a third fine variety, producing the well-known Arriba beans with distinctive floral and spicy flavour notes (Despreaux, 1998; Lunaet al., 2002; Counet et al., 2004). These differences in flavour can be ascribed to beancomposition variation from botanical origin, location of growth and farming conditions.Bulk varieties dominate blends, while fine grades, used in lesser quantities, are selected tomake specific contributions to overall flavour profile.
Each bean variety has a unique potential flavour character. But growing conditions suchas climate, amount and time of sunshine and rainfall, soil conditions, ripening, time ofharvesting, and time between harvesting and bean fermentation – all contribute to variationsin final flavour formation. Table 2.2 summarises how differences in genetic origin, cocoavariety and duration of fermentation influence flavour profile but different conditions maylead to significant differences in flavour from a single cocoa variety. A good example is
Table 2.2 Origin, cocoa variety and fermentation duration effects on flavour character
Origin Cocoa type Duration (days) Special flavour character
Ecuador Nacional (Arriba) Short 2 Aromatic, floral, spicy, greenEcuador Criollo (CCN51) 2 Acidic, harsh, low cocoaSri Lanka Trinitario 1.5 Floral, fruity, acidicVenezuela Trinitario 2 Low cocoa, acidicVenezuela Criollo 2 Fruity, nuttyZanzibar Criollo Medium 6 Floral, fruityVenezuela Forastero 5 Fruity, raisin, caramelGhana Forastero 5 Strong basic cocoa, fruity notesMalaysia Forastero/Trinitario 6 Acidic, phenolicTrinidad Trinitario Long 7–8 Winy, raisin, molassesGrenada Trinitario 8–10 Acidic, fruity, molassesCongo Criollo/Forastero 7–10 Acidic, strong cocoaPapua New Guinea Trinitario 7–8 Fruity, acidic
Source: Afoakwa et al. (2008a).
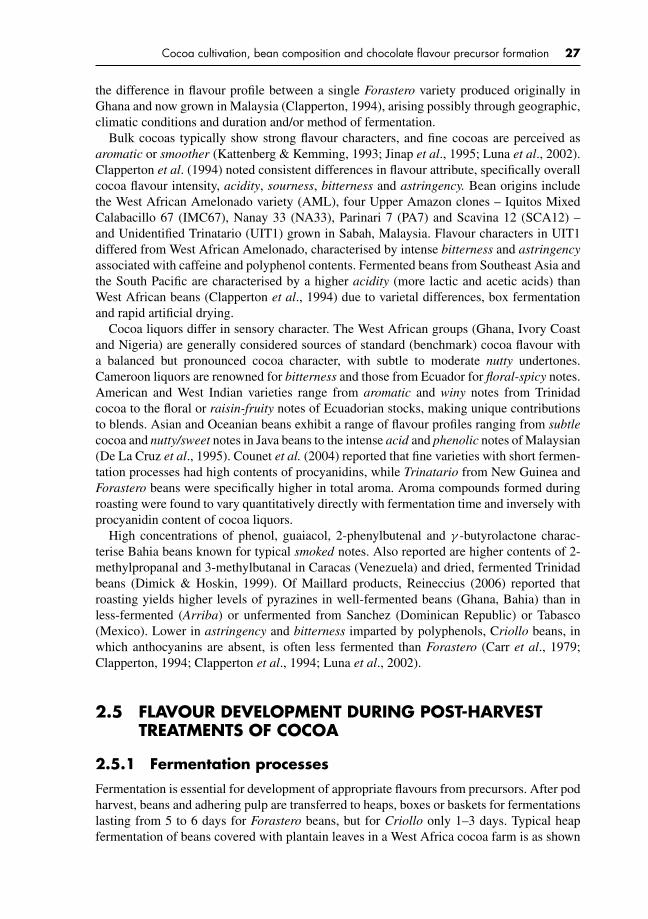
P1: KAE/UKS P2: KAEc02 BLBK244-Afoakwa January 5, 2010 8:55 Printer Name: Yet to Come
Cocoa cultivation, bean composition and chocolate flavour precursor formation 27
the difference in flavour profile between a single Forastero variety produced originally inGhana and now grown in Malaysia (Clapperton, 1994), arising possibly through geographic,climatic conditions and duration and/or method of fermentation.
Bulk cocoas typically show strong flavour characters, and fine cocoas are perceived asaromatic or smoother (Kattenberg & Kemming, 1993; Jinap et al., 1995; Luna et al., 2002).Clapperton et al. (1994) noted consistent differences in flavour attribute, specifically overallcocoa flavour intensity, acidity, sourness, bitterness and astringency. Bean origins includethe West African Amelonado variety (AML), four Upper Amazon clones – Iquitos MixedCalabacillo 67 (IMC67), Nanay 33 (NA33), Parinari 7 (PA7) and Scavina 12 (SCA12) –and Unidentified Trinatario (UIT1) grown in Sabah, Malaysia. Flavour characters in UIT1differed from West African Amelonado, characterised by intense bitterness and astringencyassociated with caffeine and polyphenol contents. Fermented beans from Southeast Asia andthe South Pacific are characterised by a higher acidity (more lactic and acetic acids) thanWest African beans (Clapperton et al., 1994) due to varietal differences, box fermentationand rapid artificial drying.
Cocoa liquors differ in sensory character. The West African groups (Ghana, Ivory Coastand Nigeria) are generally considered sources of standard (benchmark) cocoa flavour witha balanced but pronounced cocoa character, with subtle to moderate nutty undertones.Cameroon liquors are renowned for bitterness and those from Ecuador for floral-spicy notes.American and West Indian varieties range from aromatic and winy notes from Trinidadcocoa to the floral or raisin-fruity notes of Ecuadorian stocks, making unique contributionsto blends. Asian and Oceanian beans exhibit a range of flavour profiles ranging from subtlecocoa and nutty/sweet notes in Java beans to the intense acid and phenolic notes of Malaysian(De La Cruz et al., 1995). Counet et al. (2004) reported that fine varieties with short fermen-tation processes had high contents of procyanidins, while Trinatario from New Guinea andForastero beans were specifically higher in total aroma. Aroma compounds formed duringroasting were found to vary quantitatively directly with fermentation time and inversely withprocyanidin content of cocoa liquors.
High concentrations of phenol, guaiacol, 2-phenylbutenal and γ -butyrolactone charac-terise Bahia beans known for typical smoked notes. Also reported are higher contents of 2-methylpropanal and 3-methylbutanal in Caracas (Venezuela) and dried, fermented Trinidadbeans (Dimick & Hoskin, 1999). Of Maillard products, Reineccius (2006) reported thatroasting yields higher levels of pyrazines in well-fermented beans (Ghana, Bahia) than inless-fermented (Arriba) or unfermented from Sanchez (Dominican Republic) or Tabasco(Mexico). Lower in astringency and bitterness imparted by polyphenols, Criollo beans, inwhich anthocyanins are absent, is often less fermented than Forastero (Carr et al., 1979;Clapperton, 1994; Clapperton et al., 1994; Luna et al., 2002).
2.5 FLAVOUR DEVELOPMENT DURING POST-HARVESTTREATMENTS OF COCOA
2.5.1 Fermentation processes
Fermentation is essential for development of appropriate flavours from precursors. After podharvest, beans and adhering pulp are transferred to heaps, boxes or baskets for fermentationslasting from 5 to 6 days for Forastero beans, but for Criollo only 1–3 days. Typical heapfermentation of beans covered with plantain leaves in a West Africa cocoa farm is as shown
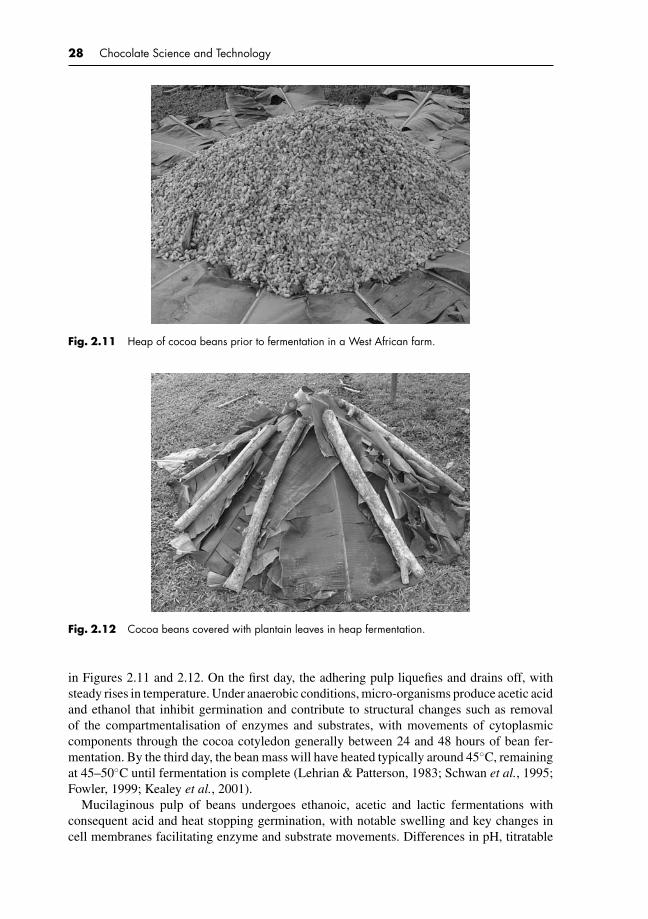
P1: KAE/UKS P2: KAEc02 BLBK244-Afoakwa January 5, 2010 8:55 Printer Name: Yet to Come
28 Chocolate Science and Technology
Fig. 2.11 Heap of cocoa beans prior to fermentation in a West African farm.
Fig. 2.12 Cocoa beans covered with plantain leaves in heap fermentation.
in Figures 2.11 and 2.12. On the first day, the adhering pulp liquefies and drains off, withsteady rises in temperature. Under anaerobic conditions, micro-organisms produce acetic acidand ethanol that inhibit germination and contribute to structural changes such as removalof the compartmentalisation of enzymes and substrates, with movements of cytoplasmiccomponents through the cocoa cotyledon generally between 24 and 48 hours of bean fer-mentation. By the third day, the bean mass will have heated typically around 45◦C, remainingat 45–50◦C until fermentation is complete (Lehrian & Patterson, 1983; Schwan et al., 1995;Fowler, 1999; Kealey et al., 2001).
Mucilaginous pulp of beans undergoes ethanoic, acetic and lactic fermentations withconsequent acid and heat stopping germination, with notable swelling and key changes incell membranes facilitating enzyme and substrate movements. Differences in pH, titratable

P1: KAE/UKS P2: KAEc02 BLBK244-Afoakwa January 5, 2010 8:55 Printer Name: Yet to Come
Cocoa cultivation, bean composition and chocolate flavour precursor formation 29
acidity, acetic and lactic acid concentrations, fermentation index and cut test scores for cocoabeans from different origins are reported (Jinap & Dimick, 1990; Luna et al., 2002; Misnawiet al., 2003). Chemistry of cocoa beans fermentation has been reviewed (Ziegleder, 1990;Lopez & Dimick, 1991; Buyukpamukcu et al., 2001; Luna et al., 2002; Misnawi et al., 2003;Schwan & Wheals, 2004; Kyi et al., 2005).
During fermentation, the rate of diffusion of organic acids into the cotyledons, timing of ini-tial entry, duration of the optimum pH and final pH are crucial for optimum flavour formation(Biehl & Voigt, 1999). Beans of higher pH (5.5–5.8) are considered unfermented – with lowfermentation index and cut test score – and those of lower pH (4.75–5.19), well fermented.Fermentation techniques can reduce acid notes and maximise chocolate flavours (Lopez,1979; Holm et al., 1993; Beckett, 1999; Whitefield, 2005). Ziegleder (1991) compared nat-ural acid (pH 5.5–6.5) and alkaline (pH 8.0) cocoa extracts obtained by direct extraction –the former possessed a more intense and chocolate aroma than the latter, attributed to highcontents of aromatic acids and sugar degradation products with persistent sweet aromaticand caramel notes. Cocoa beans of lower (4.75–5.19) and higher pH (5.50–5.80) were scoredlower for chocolate flavour and higher for off-flavour notes, respectively, and chocolate fromintermediate pH (5.20–5.49) beans was scored more highly for chocolate flavour (Jinapet al., 1995).
Sucrose and proteinaceous constituents are partially hydrolysed, phenolic compounds areoxidised and glucose is converted into alcohols, oxidised to acetic and lactic acids dur-ing fermentation. Beans subsequently undergo an anaerobic hydrolytic phase, followed byaerobic condensation. Timing, sequence of events and degree of hydrolysis and oxidationvary between fermentations. Concentration of flavour precursors is dependent on enzymaticmechanisms. Colour changes also occur with hydrolysis of phenolic components by gly-cosidases accompanied by bleaching, influencing final flavour character (Lopez & Quesnel,1973; Biehl et al., 1990; Lopez & Dimick, 1991, 1995).
Nitrogenous flavour precursors formed during anaerobic phases are dominated by theamino acids and peptides available for non-oxidative carbonyl–amino condensation reac-tions promoted in elevated temperature phases such as fermentation, drying, roasting andgrinding. Although degraded to flavour precursors, residual protein is also diminished byphenol–protein interactions. During aerobic phases, oxygen-mediated reactions occur, suchas oxidation of protein–polyphenol complexes formed anaerobically. Such processes reduceastringency and bitterness: oxidised polyphenols influence subsequent degradation reactions(Rohan, 1964; Dimick & Hoskin, 1999; Counet et al., 2004; Kyi et al., 2005).
Fermentation method determines the final quality of products produced, especially flavour.Previous studies on post-harvest pod storage and bean spreading had shown marked improve-ment in chocolate flavour and reductions in sourness, bitterness and astringency (Meyer et al.,1989; Biehl et al., 1990). In commercial production, similar effects were obtained throughcombinations of pod storage, pressing and air blasting (Said et al., 1990). Variations in suchfactors as pod storage and duration affect the pH, titratable acidity and temperature achievedduring fermentation, influencing enzyme activities and flavour development (Biehl et al.,1990).
Important flavour-active components produced during fermentation include ethyl-2-methylbutanoate, tetramethylpyrazine and certain pyrazines. Bitter notes are evoked by theo-bromine and caffeine, together with diketopiperazines formed from roasting through thermaldecompositions of proteins. Other flavour precursor compounds derived from amino acidsreleased during fermentations include 3-methylbutanal, phenylacetaldehyde, 2-methyl-3-(methyldithio)furan, 2-ethyl-3,5-dimethyl- and 2,3-diethyl-5-methylpyrazine (Taylor, 2002).
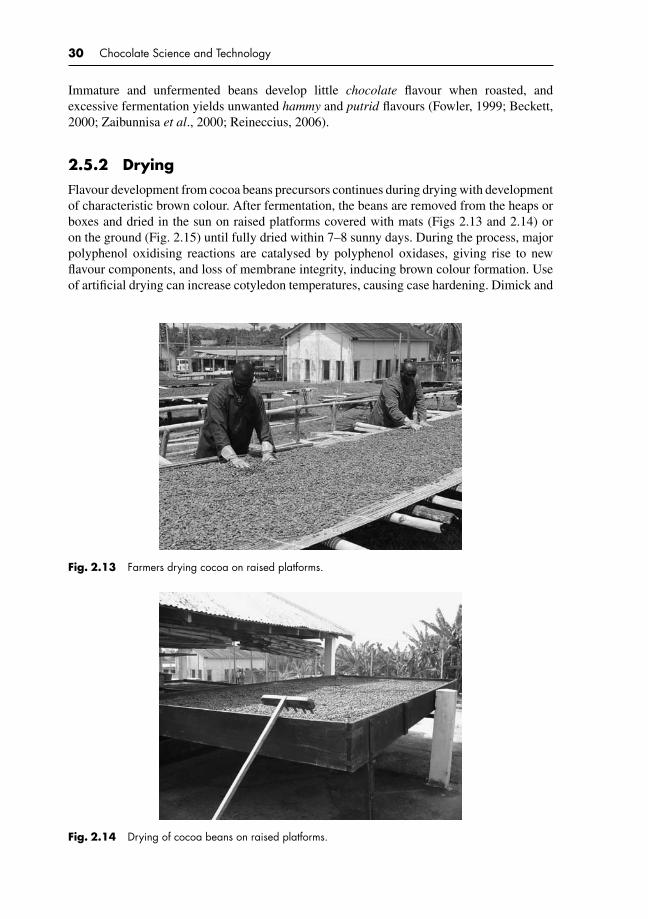
P1: KAE/UKS P2: KAEc02 BLBK244-Afoakwa January 5, 2010 8:55 Printer Name: Yet to Come
30 Chocolate Science and Technology
Immature and unfermented beans develop little chocolate flavour when roasted, andexcessive fermentation yields unwanted hammy and putrid flavours (Fowler, 1999; Beckett,2000; Zaibunnisa et al., 2000; Reineccius, 2006).
2.5.2 Drying
Flavour development from cocoa beans precursors continues during drying with developmentof characteristic brown colour. After fermentation, the beans are removed from the heaps orboxes and dried in the sun on raised platforms covered with mats (Figs 2.13 and 2.14) oron the ground (Fig. 2.15) until fully dried within 7–8 sunny days. During the process, majorpolyphenol oxidising reactions are catalysed by polyphenol oxidases, giving rise to newflavour components, and loss of membrane integrity, inducing brown colour formation. Useof artificial drying can increase cotyledon temperatures, causing case hardening. Dimick and
Fig. 2.13 Farmers drying cocoa on raised platforms.
Fig. 2.14 Drying of cocoa beans on raised platforms.
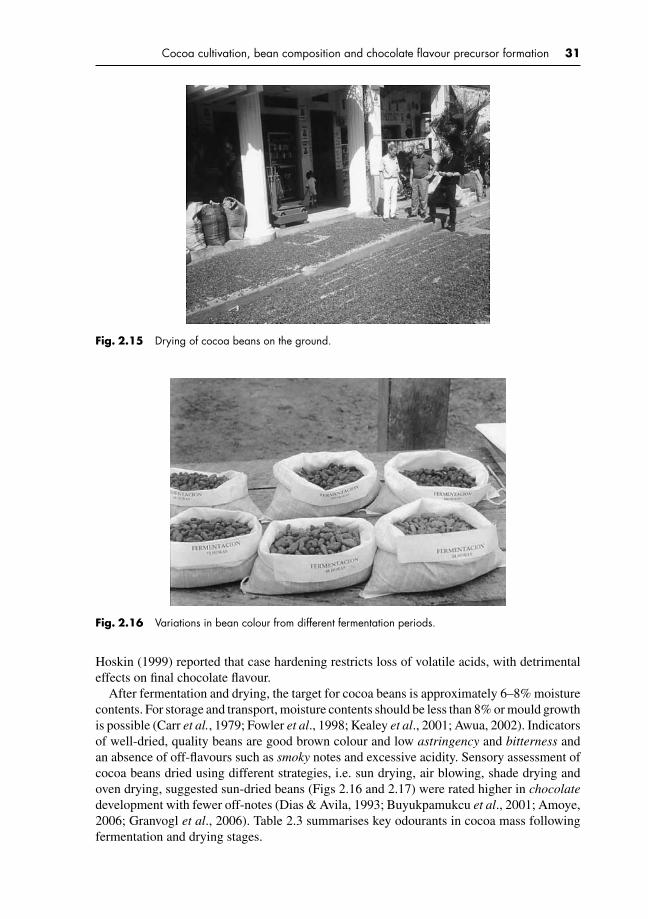
P1: KAE/UKS P2: KAEc02 BLBK244-Afoakwa January 5, 2010 8:55 Printer Name: Yet to Come
Cocoa cultivation, bean composition and chocolate flavour precursor formation 31
Fig. 2.15 Drying of cocoa beans on the ground.
Fig. 2.16 Variations in bean colour from different fermentation periods.
Hoskin (1999) reported that case hardening restricts loss of volatile acids, with detrimentaleffects on final chocolate flavour.
After fermentation and drying, the target for cocoa beans is approximately 6–8% moisturecontents. For storage and transport, moisture contents should be less than 8% or mould growthis possible (Carr et al., 1979; Fowler et al., 1998; Kealey et al., 2001; Awua, 2002). Indicatorsof well-dried, quality beans are good brown colour and low astringency and bitterness andan absence of off-flavours such as smoky notes and excessive acidity. Sensory assessment ofcocoa beans dried using different strategies, i.e. sun drying, air blowing, shade drying andoven drying, suggested sun-dried beans (Figs 2.16 and 2.17) were rated higher in chocolatedevelopment with fewer off-notes (Dias & Avila, 1993; Buyukpamukcu et al., 2001; Amoye,2006; Granvogl et al., 2006). Table 2.3 summarises key odourants in cocoa mass followingfermentation and drying stages.
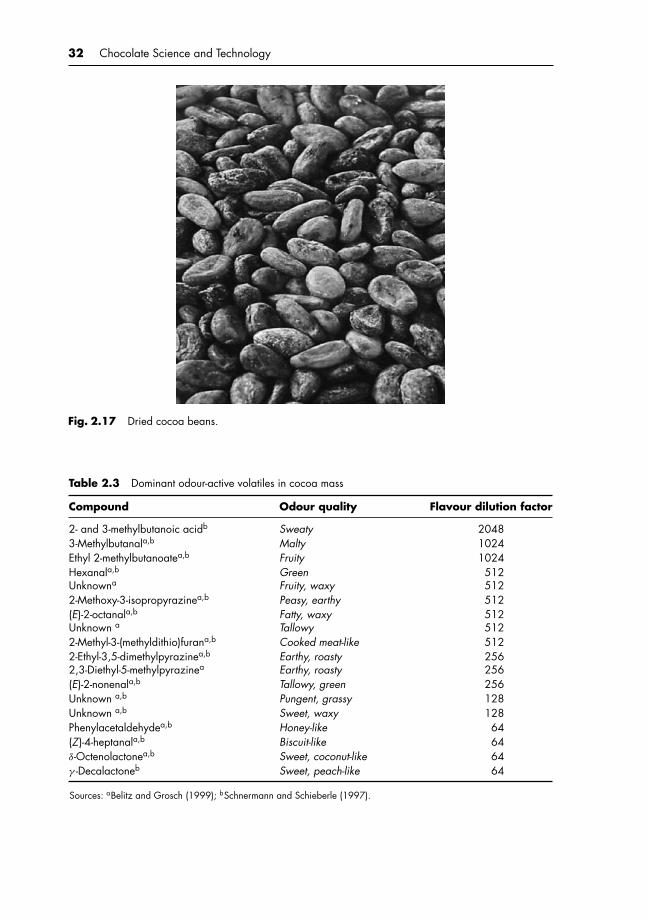
P1: KAE/UKS P2: KAEc02 BLBK244-Afoakwa January 5, 2010 8:55 Printer Name: Yet to Come
32 Chocolate Science and Technology
Fig. 2.17 Dried cocoa beans.
Table 2.3 Dominant odour-active volatiles in cocoa mass
Compound Odour quality Flavour dilution factor
2- and 3-methylbutanoic acidb Sweaty 20483-Methylbutanala,b Malty 1024Ethyl 2-methylbutanoatea,b Fruity 1024Hexanala,b Green 512Unknowna Fruity, waxy 5122-Methoxy-3-isopropyrazinea,b Peasy, earthy 512(E)-2-octanala,b Fatty, waxy 512Unknown a Tallowy 5122-Methyl-3-(methyldithio)furana,b Cooked meat-like 5122-Ethyl-3,5-dimethylpyrazinea,b Earthy, roasty 2562,3-Diethyl-5-methylpyrazinea Earthy, roasty 256(E)-2-nonenala,b Tallowy, green 256Unknown a,b Pungent, grassy 128Unknown a,b Sweet, waxy 128Phenylacetaldehydea,b Honey-like 64(Z)-4-heptanala,b Biscuit-like 64δ-Octenolactonea,b Sweet, coconut-like 64γ -Decalactoneb Sweet, peach-like 64
Sources: aBelitz and Grosch (1999); bSchnermann and Schieberle (1997).
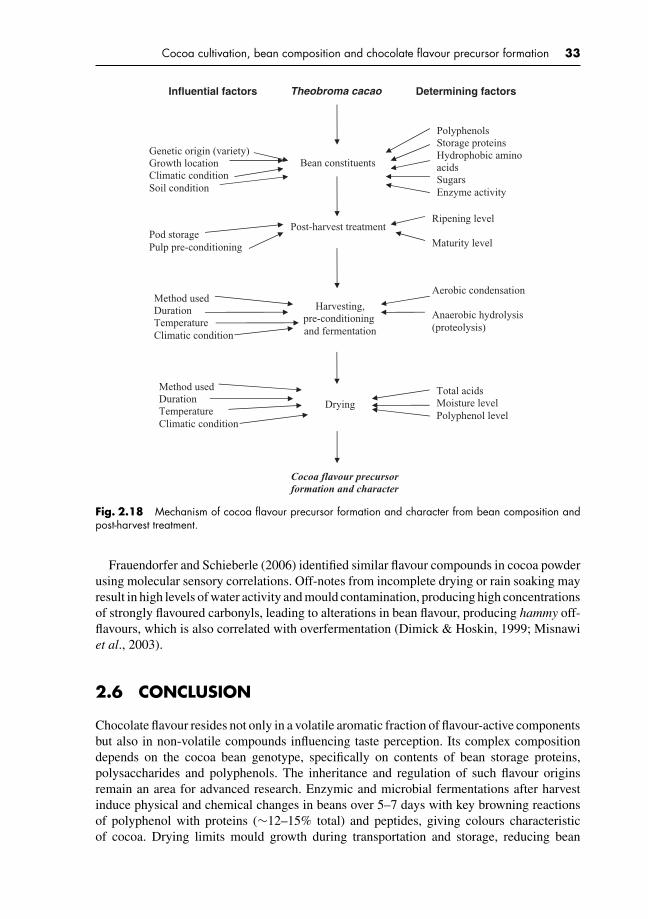
P1: KAE/UKS P2: KAEc02 BLBK244-Afoakwa January 5, 2010 8:55 Printer Name: Yet to Come
Cocoa cultivation, bean composition and chocolate flavour precursor formation 33
Theobroma cacao Influential factors Determining factors
Bean constituents
Polyphenols Storage proteins Hydrophobic amino acids Sugars Enzyme activity
Post-harvest treatment
Harvesting,pre-conditioning and fermentation
Drying
Genetic origin (variety) Growth location Climatic condition Soil condition
Pod storage Pulp pre-conditioning
Aerobic condensation
Anaerobic hydrolysis (proteolysis)
Method used Duration Temperature Climatic condition
Ripening level
Maturity level
Cocoa flavour precursor formation and character
Method used Duration Temperature Climatic condition
Total acids Moisture level Polyphenol level
Fig. 2.18 Mechanism of cocoa flavour precursor formation and character from bean composition andpost-harvest treatment.
Frauendorfer and Schieberle (2006) identified similar flavour compounds in cocoa powderusing molecular sensory correlations. Off-notes from incomplete drying or rain soaking mayresult in high levels of water activity and mould contamination, producing high concentrationsof strongly flavoured carbonyls, leading to alterations in bean flavour, producing hammy off-flavours, which is also correlated with overfermentation (Dimick & Hoskin, 1999; Misnawiet al., 2003).
2.6 CONCLUSION
Chocolate flavour resides not only in a volatile aromatic fraction of flavour-active componentsbut also in non-volatile compounds influencing taste perception. Its complex compositiondepends on the cocoa bean genotype, specifically on contents of bean storage proteins,polysaccharides and polyphenols. The inheritance and regulation of such flavour originsremain an area for advanced research. Enzymic and microbial fermentations after harvestinduce physical and chemical changes in beans over 5–7 days with key browning reactionsof polyphenol with proteins (∼12–15% total) and peptides, giving colours characteristicof cocoa. Drying limits mould growth during transportation and storage, reducing bean
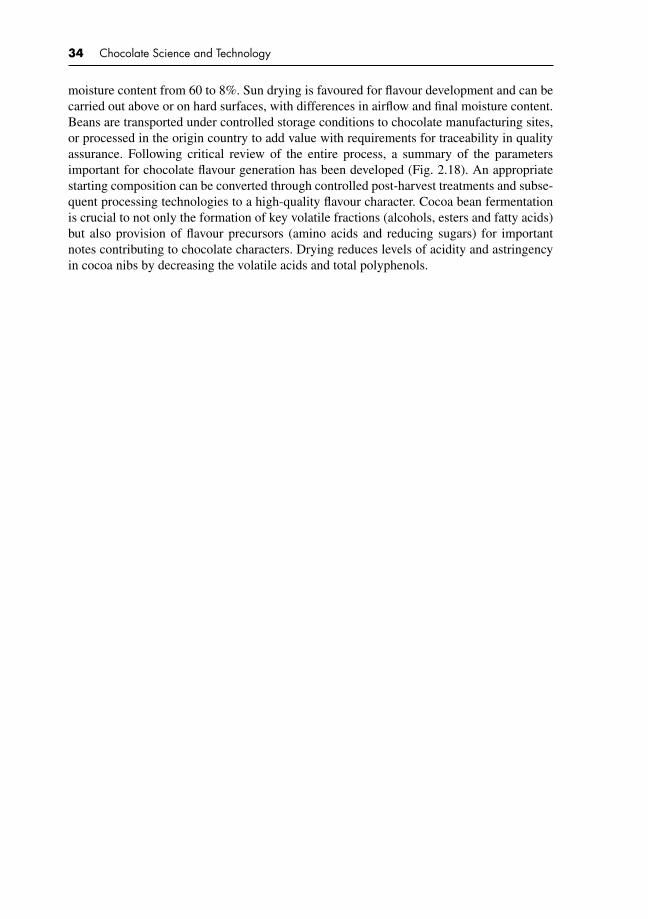
P1: KAE/UKS P2: KAEc02 BLBK244-Afoakwa January 5, 2010 8:55 Printer Name: Yet to Come
34 Chocolate Science and Technology
moisture content from 60 to 8%. Sun drying is favoured for flavour development and can becarried out above or on hard surfaces, with differences in airflow and final moisture content.Beans are transported under controlled storage conditions to chocolate manufacturing sites,or processed in the origin country to add value with requirements for traceability in qualityassurance. Following critical review of the entire process, a summary of the parametersimportant for chocolate flavour generation has been developed (Fig. 2.18). An appropriatestarting composition can be converted through controlled post-harvest treatments and subse-quent processing technologies to a high-quality flavour character. Cocoa bean fermentationis crucial to not only the formation of key volatile fractions (alcohols, esters and fatty acids)but also provision of flavour precursors (amino acids and reducing sugars) for importantnotes contributing to chocolate characters. Drying reduces levels of acidity and astringencyin cocoa nibs by decreasing the volatile acids and total polyphenols.
P1: KAE/UKS P2: KAEc03 BLBK244-Afoakwa January 5, 2010 7:39 Printer Name: Yet to Come
3 Industrial chocolate manufacture –processes and factorsinfluencing quality
3.1 INTRODUCTION
Chocolates are semisolid suspensions of fine solid particles from sugar and cocoa (and milk,depending on type), making about 70% in total, in a continuous fat phase. Cocoa solidsare derived from beans obtained from the fruit of Theobroma cacao, with world productiondominated by Forastero types, made up of small, flattish and purple beans. Another type,Criollo, is presently rare in production; Trinitario, a disease-resistant hybrid of Criollo andForastero, regarded as a flavour bean (Awua, 2002), is about 5% of world production. Growthof Forastero, in the trade name basic or bulk cocoa, occurs mainly in West Africa and Brazil.Criollo (flavour cocoa) is largely grown in Central and South America. West Africa nowproduces approximately 70% of world cocoa (ICCO, 2008). New demand for Fairtrade andpremium products has stimulated improvements in quality assurance that make possiblesingle variety and origin chocolates.
Primary chocolate categories are dark, milk and white that differ in content of cocoa solid,milk fat and cocoa butter. The outcome is varying proportions of carbohydrate, fat and protein(Table 3.1). Chocolate manufacturing processes (Beckett, 2000; Awua, 2002; Whitefield,2005) differ due to variation in national consumer preferences and company practices.
Central to chocolate character is continuous phase lipid composition, which influencesmouthfeel and melting properties. Chocolate triglycerides are dominated by saturated stearic(34%) and palmitic (27%) fatty acids and monounsaturated oleic acid (34%). Chocolatesare solid at ambient (20–25◦C) and melt at oral temperature (37◦C) during consumption,giving a smooth suspension of particulate solids in cocoa butter and milk fat (Beckett, 1999;Whitefield, 2005). This constrains lipid composition. The oral epithelia are also sensitive togradations of smoothness, which selects for desirable lipid crystal forms.
Despite high lipid and sugar contents, chocolate consumption makes a positive contributionto human nutrition through provision of antioxidants, principally polyphenols includingflavonoids such as epicatechin, catechin and notably the procyanidins. White chocolatesdiffer from milk and dark through the absence of cocoa nibs containing antioxidants, reducingthe product’s shelf-life (Beckett, 2000; Whitefield, 2005). Chocolates also contain minerals,specifically potassium, magnesium, copper and iron (Holland et al., 1991). Differences in thesensory characters of chocolate can be attributed to use of different cocoa types, variationsin ingredient proportions, use of milk crumb instead of milk powder, blending techniquesand processing methods. Specifications depend on type of chocolate and its intended use(Jackson, 1999).
As chocolates melt in the mouth, the continuous fat phase inverts into the oral continuousaqueous phase mixing with saliva that dissolves the sugar particles. Lipids and cocoa solidscoat oral epithelial surfaces. Oral particle dissolution influences perception of coarseness

P1: KAE/UKS P2: KAEc03 BLBK244-Afoakwa January 5, 2010 7:39 Printer Name: Yet to Come
36 Chocolate Science and Technology
Table 3.1 Dark, milk and white chocolate: major constituents
Product Carbohydrate (%) Fat (%) Protein (%)
Dark chocolate 63.5 28.0 5.0Milk chocolate 56.9 30.7 7.7White chocolate 58.3 30.9 8.0
Source: Afoakwa et al. (2007a).
and solvation at rates corresponding to size and work input such as mastication, tongue com-pression and swallowing (Lee & Pangborn, 1986). Particle size distribution and ingredientcomposition therefore influence perception of primary taste (gustation) and oral volatilesrelease with retronasal flavour characters in magnitude and temporal profile.
Rheological properties of chocolate are important in manufacturing process for obtaininghigh-quality products with well-defined texture (Servais et al., 2004). Chocolates with highviscosity have a pasty mouthfeel, persisting in the mouth (Beckett, 2000). Viscosity relates tocomposition, processing strategy and particle size distribution. Apparent viscosity in aque-ous solutions influences flavour ‘by mouth’ and taste intensity during consumption (Denkeret al., 2006), thus rheological measurements often give information related to sensory char-acter of chocolate.
This chapter assesses current information relating to cocoa processing technology andtechniques, bean roasting strategies and their effects on chocolate quality and chocolatemanufacturing operations. Factors influencing finished product quality such as particle sizedistribution and ingredient composition have also been discussed in relation to their effectson the rheological, textural and sensory qualities in chocolates.
3.2 COCOA PROCESSING AND TECHNOLOGY
3.2.1 Bean selection and quality criteria
Chocolate manufacturers must follow a set of guidelines and quality criteria if they are toproduce products that maintain the consumers’ loyalty to their products. Before processing,the quality of beans is evaluated using two different methods. With the first technique, thebeans are assessed for the following indicators:
1. Degree of fermentation2. Moisture content (maximum 6%)3. Number of defects4. Number of broken beans5. Bean count (number per 100 g)6. Degree of mouldiness7. Flavour profile8. Colour9. Fat content (minimum 52%)
10. Fat quality relating to percentage of free fatty acids (as oleic acid)11. Shell content (10–12%)12. Uniformity of bean size13. Insect and rodent infestation
P1: KAE/UKS P2: KAEc03 BLBK244-Afoakwa January 5, 2010 7:39 Printer Name: Yet to Come
Industrial chocolate manufacture – processes and factors influencing quality 37
The second technique is evaluated based on the size of the beans using either bean count(number of beans per 100 g) or the weight in grams of 100 beans. On the international cocoamarket, different bean sizes attract different prices. Beans with smaller sizes usually containproportionately lower amount of nibs, higher shell content, lower fat content and attractlesser prices. Typically, beans from Asian origin have higher shell content than beans fromWest Africa.
The bean cut test is used to assess defects and the degree of fermentation. In this process,a sample of 300 beans are randomly selected and split open longitudinally. The cut surfacesare then examined and assessed based on the following criteria:
1. Flat and shrunken beans2. Mouldy beans3. Slaty beans4. Germinated beans5. Degree of insect and rodent infestation
All these factors affect the flavour and taste of the finished products, for which the beanswould be used. Good cocoa beans should be well fermented, dry and free from insect androdent infestation, abnormal odours and contaminations/adulterations.
Another key criterion is the flavour quality. In this regard, considerations must be givento the desired quality of the finished chocolate and/or products upon which or in which thechocolate would be used. For instance, harsh cocoa and bitter notes are required to contrasta very sweet or heavily flavoured centre, using delicately flavoured beans such as Java beans(Urbanski, 1992). It is important to note that just because a bean comes from a flavour gradestock does not mean it will automatically improve a product’s profile. The overall impact aparticular stock has on its inclusion upon the blend has to be carefully assessed. Also note-worthy is the fact that while beans are characteristically typed, flavour quality may vary fromyear to year, crop to crop, etc., and therefore requires a continuous assessment of availabilityof the beans before using them in recipe formulations (Urbanski, 1992; Fowler, 1999).
The following are five examples of the varied selection of bean blends in assorted prod-ucts types and explanations of the reasoning involved in their selections. For the industrialproduction of:
1. Milk chocolate: The use of predominantly medium roast West African beans with Ecuado-rian beans is advised. This blend would deliver a good clean cocoa note with nutty andslightly fruity undertones. It is important to note that the addition of the highly acidicBrazilian and Malaysian beans would negatively contrast with the milky notes desired.
2. Light milk chocolate: This product could be made from lightly roasted Java beans that areknown for their light colour and very mild overall flavour with distinctive nutty overtones.This would help attain a good standard of identity for milk chocolate, as the coatingwould be several shades lighter than a 100% West African bean. It could be best used tocomplement very delicately flavoured centres.
3. High-quality semisweet chocolate: The use of predominantly West African stock is ad-vised for its cocoa character and slightly nutty undertones (light to medium roast) toheighten desirable notes and limit burnt/bitter notes. This blend when complemented byCaracas and Trinidad beans would contribute floral and slightly spicy notes to create abalanced yet unique profile.
P1: KAE/UKS P2: KAEc03 BLBK244-Afoakwa January 5, 2010 7:39 Printer Name: Yet to Come
38 Chocolate Science and Technology
4. Harsh bittersweet chocolate: This product is mainly designed for use on very sweet andhighly flavoured cream centres as it produces very harsh and bitter coatings. If eaten alone,this coating may be harsh enough to be objectionable to many consumers. However, in afinished piece as described, it complements and balances the product’s flavour. Delicateflavour grades would be wasted in such a product as they would be overridden fully bythe bitterness, astringency and acidity of the blend.
5. Semisweet cookie drop: The use the dominant West African beans is advised in thisproduct to provide a good cocoa impact. The strong profiles of the Brazilian and Sanchezcomponents complement and contrast the West African component. In this application,a robust flavour is desirable for contrast in the baked cookies (Minifie, 1989; Urbanski,1992).
3.2.2 Cleaning, breaking and winnowing
Before processing, cocoa beans are passed through the processes of cleaning, breakingand winnowing to obtain nibs of consistent quality. These processes also ensure that thenibs are cleaned (free from dirt and infestation), well broken and properly deshelled. Thekernels (nibs) obtained after the process must be of uniform size to achieve constant quality.The process involves, first, sieving the beans and removing all extraneous materials suchas stones, strings, coins, wood pieces, soil particles and nails. The cleaned beans are thenbroken to loosen the shells from the nibs using multiple steps to avoid an excess of fineparticles. The products obtained are then sieved into smaller number of fractions to obtainoptimal separation during subsequent winnowing. The fractions are then transported to thewinnowing cabinet where the lighter broken shells are removed by a stream of air. Thebreaking and winnowing steps are vital in separating the essential components of the bean,the nibs from the shells, and the shells are then discarded and sold for use as agriculturalmulch or as fertilisers. Strong magnets are then used to remove magnetic foreign materialsfrom the nibs, which are then stored, awaiting further processing.
3.2.3 Sterilisation
Sterilisation is the technique of exposing the cocoa beans or nibs to sufficiently higher tem-peratures for a sufficiently long times to destroy all micro-organisms in the beans. Dependingon the factory and equipment used, this process can either be done before or after the roastingprocess. The treatment can be done in a batch or continuous process by wetting or heating withsteam, all micro-organisms that might have contaminated the nibs during the post-harvestprocesses of fermentation, drying, bagging and transportation. The process ensures that theTotal Plate Count (TPC) is reduced to less than 500 per gram, and all pathogenic bacteriaare destroyed. After sterilisation, the nibs can then be roasted directly (natural process) orcan be alkalised first by the Dutch process before roasting. In situations where sterilisationis done after roasting, the heat treatment is used to ensure total destruction of heat-resistantbacteria and spores that might have survived the high temperatures of the roasting process.The procedure is to inject, over a period of about 20 seconds, a fine water spray of steaminto the roasting drum at the end of the roasting period (Awua, 2002). This guarantees aconsiderable reduction in microbial count in the roasted nibs.

P1: KAE/UKS P2: KAEc03 BLBK244-Afoakwa January 5, 2010 7:39 Printer Name: Yet to Come
Industrial chocolate manufacture – processes and factors influencing quality 39
3.2.4 Alkalisation
The technique of alkalisation was first introduced by a Dutchman known as van Houten in1928 and therefore named it as the Dutch process. All cocoa, beans, nibs or liquor that isso treated is described as ‘alkalised’ or ‘Dutched’ (ADM Cocoa, 2006). This consists oftreating the cocoa nibs with an alkali solution such as potassium or sodium carbonate. Thealkali is used to raise the pH of the beans or nibs from 5.2 to 5.6 to near neutrality at 6.8–7.5,depending on the alkali used, and the purposes are primarily to modify the colour and flavourof cocoa powder or cocoa liquor, and also improve dispersibility or suspension of the cocoasolids in water. During the process, the alkali solution is sprayed into the drum after it hasbeen charged with the nibs, which is then slowly dried at a temperature below 100◦C (212◦F)(Awua, 2002). The chemistry on effects of alkalisation on colour and flavour formation ofcocoa and chocolates have been described in Chapter 4.
3.2.5 Roasting
Cocoa beans are roasted to develop further the original cocoa flavour that exists in the formof precursors generated during the processes of fermentation and drying of the beans. Duringroasting of the dried fermented beans, several physical and chemical changes take place,which include the following:
1. Loosening of the shells.2. Moisture loss from the beans to about 2% final content.3. The nibs (cotyledons) become more friable and generally darken in colour.4. Additional reduction in the number of micro-organisms present in the beans. This helps
attain food-grade products, such as cocoa butter, cocoa powder and cocoa liquor, whichhave stringent microbiological specifications.
5. Degradation of amino acids takes place and proteins are partly denatured. The naturalreducing sugars are almost destroyed during degradation of amino acids.
6. Losses of volatile acids and other substances that contribute to acidity and bitterness.A large number of compounds have been detected in the volatile compounds includingaldehydes, ketones, pyrazines, alcohols and esters. The substances that undergo onlyminimal changes are the fats, polyphenols and alkaloids (Minifie, 1989).
Awua (2002) explained that the degree of changes is related to the time and temperature ofroasting and the rate of moisture loss during the process. The roasting temperature variesbetween 90 and 170◦C depending on the type of roasting adopted, being dry or moist roasting.
Three main methods of roasting are employed within the cocoa processing industry andthese include the following:
1. Whole bean roasting2. Nib roasting3. Liquor roasting
Whole bean roasting is usually the traditional way of producing cocoa liquor. By this process,the beans are roasted first before winnowing to facilitate removal of the shells which arebroken by high-speed impact against metal plates. During the process, the heat causes someof the fat to migrate into the shells, thus resulting in a loss of some cocoa butter. This is

P1: KAE/UKS P2: KAEc03 BLBK244-Afoakwa January 5, 2010 7:39 Printer Name: Yet to Come
40 Chocolate Science and Technology
particularly important in the case of broken or crushed beans. Nib roasting is done by firstremoving the shells before roasting, and by this many of the limitations of whole beanroasting are overcome. This also makes it possible to treat the nibs with alkaline or sugarsolution during roasting to help improve flavour development in certain types of cocoa. Inliquor roasting, thermal pre-treatment is often used before winnowing for liquor roasting.The nib is then ground to liquor before roasting. The major disadvantage of both nib andliquor roasting is that the shell must be removed before it has been loosened from the nibby heating, and this may result in poor separation, especially with some type of cocoa. Asa result, a variety of machines have been developed to thermally pre-treat the beans. Thesedevelop a high surface temperature and evaporate the internal moisture, which in turn buildsup a pressure within the bean, causing the shell to come away from the nib.
3.2.6 Nib grinding and liquor treatment
Nib grinding involves milling of cocoa nibs to form cocoa liquor. The purpose is to produceas low a viscosity as possible to obtain smooth cocoa powder and chocolate taste duringsubsequent use of the liquor. The nib has a cellular structure containing about 55% cocoabutter in solid form locked within the cells. Grinding of nib cells releases the cocoa butterinto liquor with particle size up to 30 µm, and for production of cocoa powder, fine grindingis particularly important. The viscosity of the liquor is related to the degree of roastingpreceding the grinding and to moisture content of the nib.
Many machines are used for reducing the nibs into liquor, and these include stone mills,disc mills, pin or hammer mills and bead or ball mills. The grinding is done in a multistageprocess, and the heat treatment generated during the grinding process causes the cocoa butterin the nib to melt, forming the cocoa liquor. The refined cocoa liquor is heated in storagetanks at a temperature of about 90–100◦C for aging and microbial destruction, after which theliquor is packaged for sale (Awua, 2002). Typically approximately 78–90% of cocoa butteris collected by pressing; residual lipids may be removed by supercritical fluid extraction(Beckett, 2000).
3.2.7 Liquor pressing
Cocoa butter constitutes about half the weight of the cocoa nib. This fat is partially re-moved from the cocoa liquor by means of hydraulic presses applying pressures as high as520 kg/cm2, and the larger presses take a charge of up to 113.4 kg per pressing cycle. De-pending on the pressing time and the settings of the press, the resulting cake may have a fatcontent of between 10 and 24%. Two kinds of cocoa cake can be obtained by the process:
1. High-fat cake containing between 22 and 24% residual fat in the pressed cake2. Low-fat cake containing between 10 and 12% residual fat in the pressed cake
The cocoa butter extracted is discharged into receptacles from which it is pumped into anintermediate tank for further processing.
3.2.8 Cake grinding (kibbling)
After pressing, the cakes released are quite big to handle and are therefore passed throughkibbling machines to be broken down into smaller pieces, known as kibbled cake. The kibbled

P1: KAE/UKS P2: KAEc03 BLBK244-Afoakwa January 5, 2010 7:39 Printer Name: Yet to Come
Industrial chocolate manufacture – processes and factors influencing quality 41
cake obtained is stored by fat content and degree of alkalisation, and may be blended beforepulverisation to obtain the desired type of cocoa powder.
3.2.9 Cocoa powder production
The powder grinding lines usually comprise hammer-and-disc or pin mills, which pulverisecocoa cake particles into the defined level of fineness of cocoa powder. The powder is thencooled after pulverisation so that the fat of the cocoa powder crystallises into its stable form.This prevents any discolouration (fat bloom) and the formation of lumps in the bags afterpacking, a phenomenon that is caused by insufficient crystallisation of the fat at the momentof filling (ADM Cocoa, 2006). The free flowing powder is then passed through sieves andover magnets prior to packing in bulk containers or four-ply multiwall paper bags lined withpolyethylene.
3.3 CHOCOLATE MANUFACTURING PROCESSES
Chocolate manufacturing processes generally share common features (Fig. 3.1) such as:
(1) Mixing(2) Refining(3) Conching of chocolate paste(4) Tempering and depositing(5) Moulding and demoulding
The outcome sought is smooth textures of products considered desirable in modern confec-tionery and elimination of oral perceptions of grittiness.
3.3.1 Mixing
Mixing of ingredients during chocolate manufacture is a fundamental operation employedusing time–temperature combinations in a continuous or batch mixers to obtain constantformulation consistency. In batch mixing, chocolate containing cocoa liquor, sugar, cocoabutter, milk fat and milk powder (depending on product category) is thoroughly mixednormally for 12–15 minutes at 40–50◦C. Continuous mixing is usually used by large chocolatemanufacturers such as Nestle and Cadbury using well-known automated kneaders, producingsomewhat tough texture and plastic consistency (Minifie, 1989; Beckett, 2000; Awua, 2002).
3.3.2 Refining
Refining of chocolate is important to the production of smooth texture that is desirablein modern chocolate confectionery. Mixtures of sugar and cocoa liquor (and milk solidsdepending on the type of chocolate) at an overall fat content of 8–24% are refined toparticle size of less than 30 µm normally using a combination of two- and five-roll refiners(Beckett, 1999, 2000). Final particle size critically influences the rheological and sensoryproperties. A five-roll refiner (Fig. 3.2) consists of a vertical array of four hollow cylinders,

P1: KAE/UKS P2: KAEc03 BLBK244-Afoakwa January 5, 2010 7:39 Printer Name: Yet to Come
42 Chocolate Science and Technology
Mixing
Refining
Conching
1st Stage: Dry conching
2nd Stage: Pasty phase
3rd Stage: Liquid conching
Tempering
Moulding Enrobing Panning (b)
Packaging
Agglomeration of ingredients in thick paste, continuously or with batch mixers
Size reduction of mix via two- three- or five-roll refiner
Final flavour development, final viscosity of the sample with conche rotations for 4–24 hours
Most stable form of cocoa butter crystals – Form V via heating/cooling systems (maintained at 35°C)
Sugar Cocoa liquor Cocoa butter Skimmed milk powder (SMP)(a)
Addition of the remaining ingredients: surfactants, cocoa butter
Note: (a) Skimmed milk powder is only used in milk chocolate manufacture; (b) Panning means that the chocolate is used as coating for hard centres such as nuts.
Fig. 3.1 Processing steps for chocolate manufacture (Afoakwa et al., 2007a).
temperature controlled by internal water flow, held together by hydraulic pressure. A thinfilm of chocolate is attracted to increasingly faster rollers, travelling up the refiner untilremoved by a knife blade. Roller shearing fragments solid particles, coating new surfaceswith lipid so that these become active, absorbing volatile flavour compounds from cocoacomponents.
Texture in milk chocolate appears improved by a bimodal distribution of particles witha small proportion having sizes up to 65 µm. Optimum particle size for dark chocolate islower at less than 35 µm although values are influenced by the product and composition(Awua, 2002). Refiners, in summary, not only affect particle size reduction and agglomeratebreakdown, but distribute particles through the continuous phase coating each with lipid.

P1: KAE/UKS P2: KAEc03 BLBK244-Afoakwa January 5, 2010 7:39 Printer Name: Yet to Come
Industrial chocolate manufacture – processes and factors influencing quality 43
Five-roll refiner
1. Roll stack pressure 2. Chocolate film 3. Chocolate feed 4. Feed roll pressure 5. Fixed roll 6. Chocolate from scraper 7. Motion of rollers
2
2
3
4
7
1
6
5
Fig. 3.2 A typical five-roll refiner.
3.3.3 Conching
Conching is regarded as the endpoint or final operation in the manufacture of bulk chocolate,whether milk or dark. It is an essential process that contributes to development of viscosity,final texture and flavour. Conching is normally carried out by agitating chocolate at more than50◦C for few hours (Beckett, 2000). In the early stages, moisture is reduced with removal ofcertain undesirable flavour-active volatiles such as acetic acid, and subsequently interactionsbetween disperse and continuous phase are promoted.
In addition to moisture and volatile acid removal, the conching processing promotesflavour development due to the prolonged mixing at elevated temperatures, giving a partlycaramelised flavour in non-milk crumb chocolate. The process also aids reduction in viscosityof refiner pastes throughout the process, and reduction in particle size and removal of particleedges (Minifie, 1989; Beckett, 2000; Awua, 2002).
The name of the equipment, the conche, is derived from the Latin word ‘shell’, as thetraditional conche used in chocolate manufacture resembled the shape of a shell. Figure 3.3is an illustration of a Frisse conche. The Frisse conche is a typical example of an overheadconche used in modern chocolate industry. It consists of a large tank with three powerfulintermeshing mixer blades, providing shearing and mixing action. The internal mechanicsof Frisse conche is as shown in Figure 3.3. Conching times and temperatures vary (Awua,2002) typically: for milk crumb 10–16 hours at 49–52◦C, with milk powder products 16–24hours at up to 60◦C, and with dark chocolates at 70◦C and continue up to 82◦C. Replacingfull-fat milk powder with skimmed milk powder and butter fat, temperatures up to 70◦C maybe used (Awua, 2002). To give chocolate a suitable viscosity, additional cocoa butter andlecithin can be added towards the end of conching to thin or liquefy the chocolate prior totempering (Beckett, 2000; Whitefield, 2005).

P1: KAE/UKS P2: KAEc03 BLBK244-Afoakwa January 5, 2010 7:39 Printer Name: Yet to Come
44 Chocolate Science and Technology
Fig. 3.3 Illustration of internal mechanics of the Frisse conche.
Table 3.2 Melting point and chain packing of the polymorphic forms of cocoa butter
Polymorphic formsof cocoa butter Melting point (oC) Chain packing
Form I β ′2 16–18 Double
Form II α 21–22 DoubleForm III Mixed 25.5 DoubleForm IV β1 27–29 DoubleForm V β2 32–34 TripleForm VI β ′
1 34–36 Triple
Sources: Talbot (1999) and Afoakwa et al. (2007a).
3.4 TEMPERING, LIPID CRYSTALLISATION ANDCONTINUOUS PHASE CHARACTER DURINGCHOCOLATE MANUFACTURE
Cocoa butter can crystallise in a number of polymorphic forms as a function of triglyceridecomposition, with fatty acid composition influencing how liquid fat solidifies (Awua, 2002).Cocoa butter has six polymorphic forms (I–VI), the principals being α, β and β ′ (Table 3.2).Form V, a β polymorph, is the most desirable form (in general) in well-tempered chocolate,giving a glossy appearance, good snap, contraction and resistance to bloom (Beckett, 2000).
If chocolate is poorly tempered, the outcome is the β Form IV, which rapidly transformsinto Form V. This influences colour as reflected light is disoriented by unstable, disorganisedcrystal growth (Hartel, 2001). Untempered chocolate is soft and not effectively demoulded.In cocoa butter Forms V and VI are the most stable forms. Form VI is difficult to generatealthough formed on lengthy storage of tempered chocolate accompanied by fat bloom. Inaddition, Form VI has a high melting temperature (36◦C) and crystals that are large and grittyon the tongue. The unstable Form I has a melting point of 17◦C and is rapidly convertedinto Form II that transforms more slowly into III and IV (Fig. 3.4). Polymorphic triglycerideforms differ in distance between fatty acid chains, angle of tilt relative to plane of chain-endmethyl group and manner in which triglycerides pack in crystallisation (Talbot, 1999).
Polymorphic form is determined by processing conditions. Fatty acids crystallise ina double- or triple-chain form depending on triglyceride composition and positional

P1: KAE/UKS P2: KAEc03 BLBK244-Afoakwa January 5, 2010 7:39 Printer Name: Yet to Come
Industrial chocolate manufacture – processes and factors influencing quality 45
Loosecompacting
Densecompacting
Stableform
Unstableform
16–18°Cγ
I
α
β '2
β '1
β 2
β1
II
III
IV
V
VI
22–24°C
24–26°C
26–28°C
32–34°C
34–36°C
Fig. 3.4 Temperature regimes and degree of stability in six polymorphic forms of cocoa butter (Beckett,2008).
distribution. Form IV crystallises in a double-chain form, Form V in a triple-chain systemthat enables closer packing and greater thermodynamic stability. Unstable lower polymor-phic forms (II and III) transform into higher melting, more stable forms, with closer packingand lower volume. These changes can be observed in terms of overall contraction of thechocolate, appearance or undesirable fat bloom formation at rates dependent on relative sta-bilities of the polymorphic forms and temperature (Talbot, 1999). For chocolate to be in anappropriate polymorphic form, tempering is crucial, influencing final quality characteristicssuch as colour, hardness, handling, finish and shelf-life characteristics.
Tempering involves pre-crystallisation of a small proportion of triglycerides, with crystalsforming nuclei (1–3% total) for remaining lipid to set in the correct form. Tempering hasfour key steps: melting to completion (at 50◦C), cooling to point of crystallisation (at 32◦C),crystallisation (at 27◦C) and conversion of any unstable crystals (at 29–31◦C) (Talbot, 1999)(Fig. 3.5). Tempering sequence is a function of recipe, equipment and the final purpose.Before the use of tempering machines, chocolate used to be hand-tempered, and this methodis still occasionally used by chocolatiers, who produce relatively small quantities of handmadeconfections. Current tempering machines (Fig. 3.6) consist of multistage heat exchangersthrough which chocolate passes at widely differing rates, making it difficult to identifyoptimum conditions.
Time–temperature combinations are of paramount importance in process design, and incontinuous tempering, molten chocolate is usually held at 45◦C and then gently cooledto initiate crystal growth. Working with the Buhler ‘Masterseeder’, Windhab (ETH Zurich,Switzerland) and Mehrle (Buhler AG, Uzwil, Switzerland) found that high shear seed temper-ing can be beneficial as the kinetics of fat crystal nucleation and polymorphic transformations(α → β2 → β ′
1) are strongly accelerated by shear forces acting in high-shear flow fields:overall quality of products was better, as fat bloom was reduced (Windhab et al., 2002). Dur-ing tempering, the temperatures are precisely controlled and the agitation provided enhancesnucleation rates. As the viscosity increases, the chocolate is reheated again in the third stageto prevent runway solidification. In the fourth stage, crystals are matured.
Chocolate can also be tempered by the use of high pressure (Yaseda & Mochizuki, 1992)with molten chocolate compressed to 150 bars. This increases chocolate melting point and
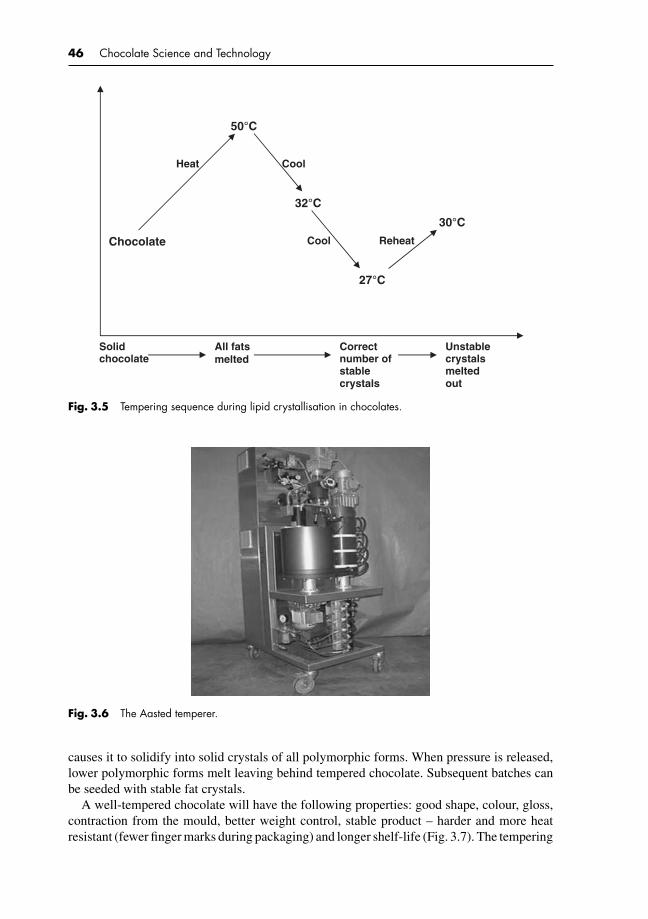
P1: KAE/UKS P2: KAEc03 BLBK244-Afoakwa January 5, 2010 7:39 Printer Name: Yet to Come
46 Chocolate Science and Technology
Chocolate
Heat
50°C
Cool
32°C
27°C
30°C
Reheat Cool
Solid chocolate
All fats melted
Correct number of stable crystals
Unstable crystals melted out
Fig. 3.5 Tempering sequence during lipid crystallisation in chocolates.
Fig. 3.6 The Aasted temperer.
causes it to solidify into solid crystals of all polymorphic forms. When pressure is released,lower polymorphic forms melt leaving behind tempered chocolate. Subsequent batches canbe seeded with stable fat crystals.
A well-tempered chocolate will have the following properties: good shape, colour, gloss,contraction from the mould, better weight control, stable product – harder and more heatresistant (fewer finger marks during packaging) and longer shelf-life (Fig. 3.7). The tempering
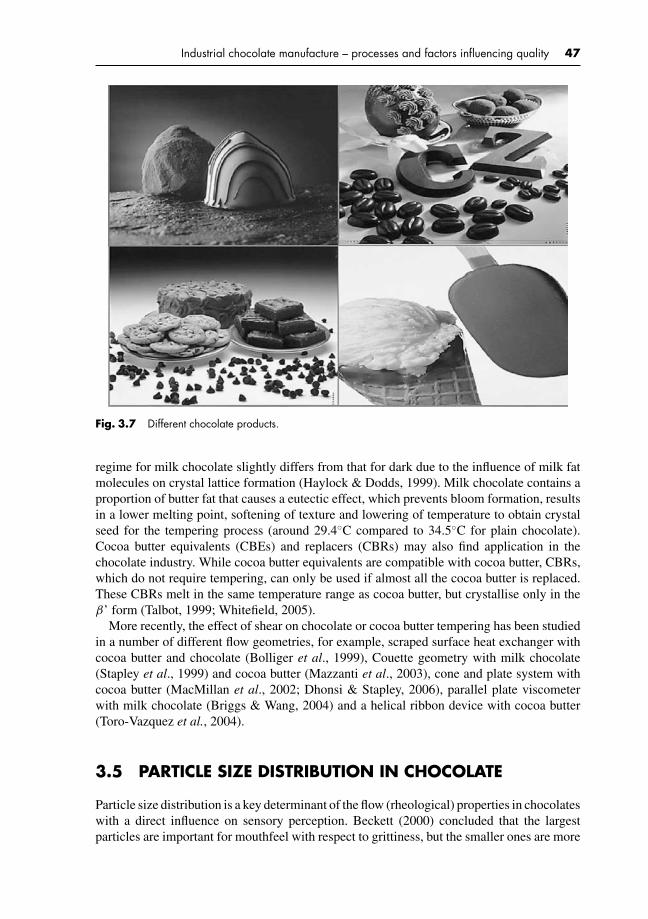
P1: KAE/UKS P2: KAEc03 BLBK244-Afoakwa January 5, 2010 7:39 Printer Name: Yet to Come
Industrial chocolate manufacture – processes and factors influencing quality 47
Fig. 3.7 Different chocolate products.
regime for milk chocolate slightly differs from that for dark due to the influence of milk fatmolecules on crystal lattice formation (Haylock & Dodds, 1999). Milk chocolate contains aproportion of butter fat that causes a eutectic effect, which prevents bloom formation, resultsin a lower melting point, softening of texture and lowering of temperature to obtain crystalseed for the tempering process (around 29.4◦C compared to 34.5◦C for plain chocolate).Cocoa butter equivalents (CBEs) and replacers (CBRs) may also find application in thechocolate industry. While cocoa butter equivalents are compatible with cocoa butter, CBRs,which do not require tempering, can only be used if almost all the cocoa butter is replaced.These CBRs melt in the same temperature range as cocoa butter, but crystallise only in theβ’ form (Talbot, 1999; Whitefield, 2005).
More recently, the effect of shear on chocolate or cocoa butter tempering has been studiedin a number of different flow geometries, for example, scraped surface heat exchanger withcocoa butter and chocolate (Bolliger et al., 1999), Couette geometry with milk chocolate(Stapley et al., 1999) and cocoa butter (Mazzanti et al., 2003), cone and plate system withcocoa butter (MacMillan et al., 2002; Dhonsi & Stapley, 2006), parallel plate viscometerwith milk chocolate (Briggs & Wang, 2004) and a helical ribbon device with cocoa butter(Toro-Vazquez et al., 2004).
3.5 PARTICLE SIZE DISTRIBUTION IN CHOCOLATE
Particle size distribution is a key determinant of the flow (rheological) properties in chocolateswith a direct influence on sensory perception. Beckett (2000) concluded that the largestparticles are important for mouthfeel with respect to grittiness, but the smaller ones are more

P1: KAE/UKS P2: KAEc03 BLBK244-Afoakwa January 5, 2010 7:39 Printer Name: Yet to Come
48 Chocolate Science and Technology
important with respect to chocolate flow properties. Traditionally, continental Europeanchocolate has been described as having a fineness of 15–22 µm particle diameter, and thatin North America 20–30 µm (Jackson, 1999). However, with increased globalisation of theindustry, traditional differences have begun to blur with specifications becoming much moreproduct specific.
Particle size distribution has been used as a tool to control consistency of solid–liquidmixtures to aid pumping and mixing of molten milk chocolate (Mongia & Ziegler, 2000),transportation, atomisation and grinding of foods of high solid content in milk suspensions(Saeseaw et al., 2005), and d-limonene (Soottitantawat et al., 2005). Malvern Instrumentsidentified applicability of their laser diffraction instrument for nearline chocolate process con-trol, indicating the importance of particle size distribution for fluidity control. Understandingand control of factors influencing fluid performance during high solid content processing arenecessary, with increasing competitiveness in modern chocolate manufacturing processing(Servais et al., 2002).
Measurement of particle size distribution in chocolate products done by using the laserdiffraction technique, also known as low-angle laser light scattering, is fast becoming thepreferred standard of analysis in many industries around the world for ranges between 0.1 and2000 µm for characterisation and quality control. The instrument used, Malvern Mastersizer(Fig. 3.8) produced by Malvern Instruments, offers greater flexibility in the measurement ofparticle sizes of various confectionery and many industrial materials. The technique relies onthe principle that diffraction angle is proportional to particle size. It uses laser as a source ofcoherent intense light of fixed wavelength, a suitable detector being a slice of photosensitivesilicon with a number of discrete detectors and some means of passing the sample through thelaser beam. The set-up used is as shown in Figure 3.9. The method used is non-destructive andnon-intrusive, hence samples can be recovered if they are valuable, and the result providedis highly reproducible.
Optimisation of particle size distribution in chocolate requires consideration of palatesensitivity. For example, there is a maximum particle size of 30 µm, or a product is perceivedas ‘gritty or coarse’ in the mouth. Particle size affects viscosity as well as texture, and a
Fig. 3.8 The Malvern particle size analyser (Malvern MasterSizer).

P1: KAE/UKS P2: KAEc03 BLBK244-Afoakwa January 5, 2010 7:39 Printer Name: Yet to Come
Industrial chocolate manufacture – processes and factors influencing quality 49
Detector measuresintegral scattering of allparticles simultaneously
Centraldetector
Radii
DetectorSmall particlesscatter at high angles
Large particlesscatter at low angles
Fig. 3.9 Illustration of the principle behind particle size distribution measurement by laser diffractiontechnique.
chocolate milled to a maximum particle size of 20 µm will have a creamier taste and texturethan that with 30 µm. Particle size distribution plays clear roles in process fluidity, but isgenerally restricted to experience-based empirical knowledge (Beckett, 2000). Several clearexamples of particle size distribution optimisation show improvement in process efficiencyand/or yield in food manufacture. In apple sauces (Missaire et al., 1990) and in mustard(Aguilar et al., 1991), bimodal particle size distribution promoted viscosity reduction andbetter mixing, yielding improvements in final product shear, time and temperature stability.Villagran et al. (1996) patented a process for reduced fat nut spreads. The process resultsin bimodal particle size distribution and reduction of spread viscosity, allowing the low-fatspread to display the ‘desirable fluidity, texture and flavour’.
A widely appreciated example of a solid suspension is chocolate, a polydisperse suspensionof sugar, cocoa and/or milk solids in a Newtonian fluid (fat phase), hence the applicabilityof Casson’s equation can model chocolate flow behaviour (Beckett, 2000; Afoakwa et al.,2008b) where solid content varies from 65 to 75%. Many chocolate products have bimodaland trimodal particle size distributions. A typical particle size distribution of commercialenrobing mass is given in Figure 3.10. In bimodal distributions, minima are generally locatedaround 15–25 µm.
Particle size distribution influences chocolate rheology (Chevalley, 1999), with specificsurface area and mean particle size influencing yield stress (Beckett, 2000). Bouzas andBrown (1995) noted that ‘a chocolate with particles sized according to the infinite modaldistribution may give the lowest plastic viscosity’. Aguilar and Ziegler (1995) employeda bimodal particle size distribution for a controlled reduction in viscosity. Servais et al.(2002) reported that in blends of chocolates of fine (d4,3 = 8.5 µm) and coarse (d4,3 =17.0 µm) particles, varying the blend ratio, influenced relationship between packing fractionand the shear viscosity with yield value closely related to mean particle diameter and particle-specific surface area but not packing fraction. A ratio of 60% coarse particles to 40% fineparticles gave the lowest viscosity. Generally, chocolate viscosity is controlled by addition ofcocoa butter and expensive viscosity modifiers (surface-active ingredients, such as soybeanlecithin). Smaller particle sizes in chocolate are known to improve sensory properties (Ziegleret al., 2001), but plastic viscosity and yield stress increase due to increased surface area of
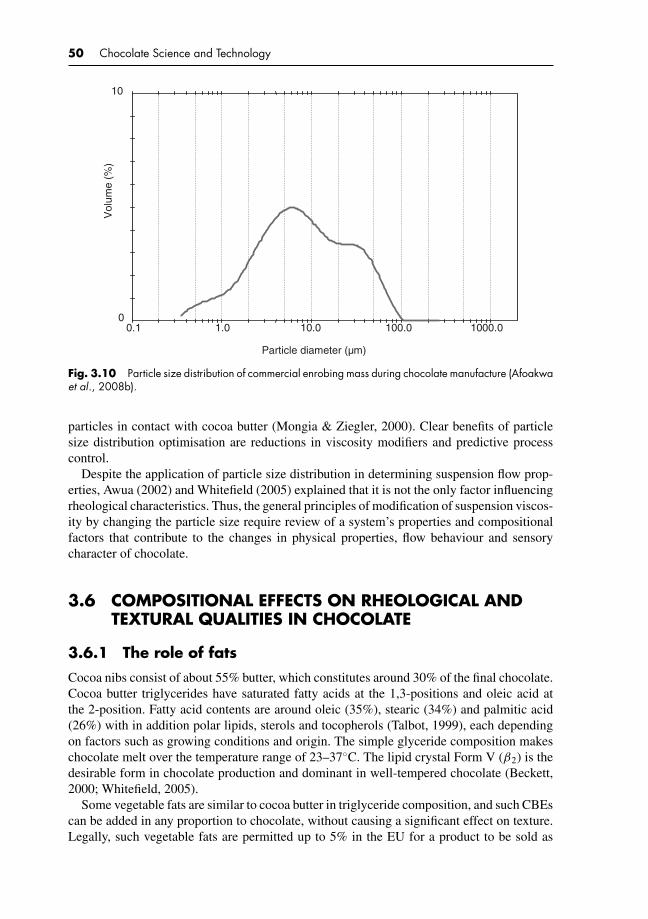
P1: KAE/UKS P2: KAEc03 BLBK244-Afoakwa January 5, 2010 7:39 Printer Name: Yet to Come
50 Chocolate Science and Technology
Particle diameter (µm)
0
10
0.1 1.0 10.0 100.0 1000.0
Vol
ume
(%)
Fig. 3.10 Particle size distribution of commercial enrobing mass during chocolate manufacture (Afoakwaet al., 2008b).
particles in contact with cocoa butter (Mongia & Ziegler, 2000). Clear benefits of particlesize distribution optimisation are reductions in viscosity modifiers and predictive processcontrol.
Despite the application of particle size distribution in determining suspension flow prop-erties, Awua (2002) and Whitefield (2005) explained that it is not the only factor influencingrheological characteristics. Thus, the general principles of modification of suspension viscos-ity by changing the particle size require review of a system’s properties and compositionalfactors that contribute to the changes in physical properties, flow behaviour and sensorycharacter of chocolate.
3.6 COMPOSITIONAL EFFECTS ON RHEOLOGICAL ANDTEXTURAL QUALITIES IN CHOCOLATE
3.6.1 The role of fats
Cocoa nibs consist of about 55% butter, which constitutes around 30% of the final chocolate.Cocoa butter triglycerides have saturated fatty acids at the 1,3-positions and oleic acid atthe 2-position. Fatty acid contents are around oleic (35%), stearic (34%) and palmitic acid(26%) with in addition polar lipids, sterols and tocopherols (Talbot, 1999), each dependingon factors such as growing conditions and origin. The simple glyceride composition makeschocolate melt over the temperature range of 23–37◦C. The lipid crystal Form V (β2) is thedesirable form in chocolate production and dominant in well-tempered chocolate (Beckett,2000; Whitefield, 2005).
Some vegetable fats are similar to cocoa butter in triglyceride composition, and such CBEscan be added in any proportion to chocolate, without causing a significant effect on texture.Legally, such vegetable fats are permitted up to 5% in the EU for a product to be sold as
P1: KAE/UKS P2: KAEc03 BLBK244-Afoakwa January 5, 2010 7:39 Printer Name: Yet to Come
Industrial chocolate manufacture – processes and factors influencing quality 51
chocolate (Cocoa and Chocolate Products Regulations, 2003). CBRs, such as the lauric fats,palm kernel or coconut oils, crystallise only in one crystal form, β ′, in a very different wayand are used to totally replace cocoa butter (Talbot, 1999). Low-calorie fats such as Caprenin,which contain fatty acids different from cocoa butter, and are poorly absorbed by the gut,also find application as CBRs. With non-lauric fats, some cocoa butter can be used (Babin,2005) and the mix can be tempered normally.
Most chocolates contain between 25 and 35% fat, although icecream coatings are muchhigher and some special products such as cooking chocolate and vermicelli pieces are lowerin fat. The actual level present will depend on the process being used and this affects thetexture of the finished chocolate, so a high-quality tablet of chocolate is likely to have a higherfat content and a lower particle size than a chocolate that is used to coat biscuit (Beckett,2000). The effect of an extra 1% of fat upon the viscosity depends on the amount alreadypresent and the viscosity parameters being considered. Above fat content of 32% there isvery little change in viscosity with any further additions. A 1% increase to a 28% fat contenthas a really dramatic effect especially on the plastic viscosity, which is almost halved. Thechange becomes more dramatic at even lower fat contents as ‘chocolates’ below 23% fat arenormally a paste rather than liquid (Beckett, 2000).
The effect of fat is proportionately much higher for the plastic viscosity than the yieldvalue. Beckett (2000) explained that this phenomenon is not surprising as the extra fat onlyadds to the free moving fat that aids particles when they flow past each other. The majorityof the fat is ‘wetting’ fat, which is partially tied to the particle surfaces. This free fat has alarge effect on lubricating the flow when it takes place, and so the plastic viscosity decreasesdramatically. The yield value is more pronounced with the forces between the solid particles,which in turn are connected with the absolute distance between them, hence their less effectwith fat additions.
3.6.2 The role of sugar
Sugar is considered an inert ingredient in chocolate with regard to subtleties of flavour,contributing ‘only’ to sweetness. A change of 1–2% in sugar content has a great effect oncosts and other economic factors, and at 5% change large flavour changes become apparent(Beckett, 1999). Fine crystalline sucrose is utilised at up to 50% in chocolate confectionery(Kruger, 1999). Lactose, in milk solids, is present at lower levels in an amorphous form andin its glassy state holds a proportion of milk fat (Beckett, 2000), influencing chocolate flavourand flow properties. Lactose enhances the browning by participating in Maillard reactions(Kruger, 1999; Bolenz et al., 2006). Monosaccharides, glucose and fructose are rarely usedin chocolate as they are difficult to dry. Consequently, the additional moisture present inchocolate would increase interactions between sugar particles, and increase viscosity. Dex-trose and lactose can successfully replace sucrose in milk chocolate (Muller, 2003; Bolenzet al., 2006).
In recent years, sucrose-free chocolates have become popular among consumers andmanufacturers because of reduced calorific values, and the fact that these are both non-cariogenic and suitable for diabetics (Zumbe & Grosso, 1993; Olinger, 1994; Olinger &Pepper, 2001; Sokmen & Gunes, 2006). Sugar alcohols, including xylitol, sorbitol, mannitol,erythritol, maltitol, maltitol syrup, isomalt and lactitol, are used for the manufacture oflower calorie or sugar-free products. Replacement of sucrose with sugar alcohols howeveraffects rheological properties and thus the processing conditions and quality of chocolates

P1: KAE/UKS P2: KAEc03 BLBK244-Afoakwa January 5, 2010 7:39 Printer Name: Yet to Come
52 Chocolate Science and Technology
(Zumbe & Grosso, 1993; Wijers, & Strater, 2001; Sokmen & Gunes, 2006; Kruger, 1999).Sokmen and Gunes (2006) noted that maltitol results in similar rheological properties ofchocolate to sucrose, and thus may be recommended as a good alternative to sucrose inchocolate formulations. These authors also observed that chocolate with isomalt results inhigher plastic viscosity while xylitol causes higher flow behaviour index. Polydextrose maybe added as an edible carbohydrate and intense sweeteners used. The EU limits consumptionof sugar alcohols to 20 g per day due to laxative effects (Kruger, 1999).
3.6.3 The role of milk and other dairy components
As water binds sugar particles, milk solids rather than liquid milk is added to chocolatecontributing about 12–25%. Milk contains about 5% lactose, 5% milk fat, 3.5% protein and0.7% minerals. Milk fat triglycerides, dominated by saturated fatty acids, exhibit a differentcrystalline structure although adequate amounts of palmitic, stearic and oleic acid are present,the main fatty acids found in cocoa butter (Haylock & Dodds, 1999). Milk fat is mainly liquid(15–20% solid) at ambient, and softens chocolate texture, slows setting, and is used at upto 30% of the total fat content (German & Dillard, 1998), inhibiting fat bloom. Milk fat isprone to oxidation and influences shelf-life (Haylock & Dodds, 1999).
Milk proteins add to the perceived creaminess of milk chocolate, and at 80% caseins and20% whey proteins, the casein fraction acts as surfactants and reduces viscosity of chocolate;whey proteins, in contrast, increase viscosity (Haylock & Dodds, 1999). Milk solids addedas spray-dried skimmed milk powder or full cream milk powder contribute to flavour, textureand liquid flow properties dependent on heat treatment and drying conditions. Milk fat isfree to react with the cocoa butter when mixed with skimmed milk powder but stronglybound in full cream milk powder. Skimmed milk powder softens cocoa butter to an extent(Haylock & Dodds, 1999), and addition of milk solids in the form of chocolate crumb ispreferred in certain European countries. Chocolate crumb, developed when cocoa liquor ismixed with sugar, milk mass and vacuum dried, is characterised by a brown colour andslightly cooked flavour. Crumb has a longer shelf-life than milk powder as the chocolateliquor provides natural antioxidants – flavonoids (Holland et al., 1991), stabilising it againstrancidity (Haylock & Dodds, 1999; Beckett, 2000). Chocolate flavours vary depending on thecrumb processing conditions. Whey and lactose powders can be used to reduce sweetness insome chocolate confectionery. Demineralised whey powder is preferred to avoid off-flavourgeneration (Haylock & Dodds, 1999).
3.6.4 The role of surfactants in modern chocolateconfectionery
Chocolate has a continuous fat phase in which sugar, being hydrophilic and lipophobic,will not dissolve, so surfaces have to be coated with fat. This does not occur readily and asurface-active agent is beneficial and allows the fat content of the chocolate to be reducedwhile maintaining desirable flow properties. Choice of natural surfactant – gums, lecithin,soluble polysaccharides or synthetic (carboxymethyl cellulose) – depends on the function inthe end product (Schantz & Rohm, 2005).
Lecithin, a byproduct of soya oil production is a mixture of natural phosphoglycerides(Minifie, 1989). In chocolate the most surface-active component of crude lecithin (mainlyoleic C18:1 and palmitic acid C16:0) is believed to be phosphatidylcholine (Vernier, 1998).
P1: KAE/UKS P2: KAEc03 BLBK244-Afoakwa January 5, 2010 7:39 Printer Name: Yet to Come
Industrial chocolate manufacture – processes and factors influencing quality 53
Lecithin addition dramatically changes yield value and plastic viscosity, and when addedat between 0.1 and 0.3% it reduces chocolate viscosity and enhances toleration of highermoisture levels. At more than 0.5%, yield value increases while plastic viscosity continuesto fall (Chevalley, 1999; Rector, 2000; Schantz & Rohm, 2005). Increase in yield value islinked to micelle formation in the continuous phase possibly as multilayers around sugar,which hinders flow. Alternatively, reverse micelles may form in the continuous phase andinteract with fully covered sugar particles, consequently increasing yield value (Vernier,1998). Thickening depends on the particle size distribution as smaller particles require morelecithin to coat sugar surfaces. Lecithin can only be added up to 1%, but will always bepresent in chocolate as traces from both cocoa and milk.
Polyglycerol polyricinoleate (PGPR), obtained by polycondensation of castor oil andglycerol, is a complex mixture with polyglycerol component dominated by di-, tri- andtetraglycerols (Vernier, 1998). Legally approved within the EU, PGPR can be used in cocoa-based confectionery at up to 0.5% (Rector, 2000). It does not have large effects on plasticviscosity but can reduce yield value by 50% at 0.2% or remove it at about 0.8% (Rector, 2000;Schantz & Rohm, 2005), turning chocolate into a Newtonian liquid, so that it flows morereadily and settles rapidly. A similar outcome can be achieved by adding more cocoa butterat greater cost as PGPR coats solid particles, displacing cocoa butter to the continuous phase,decreasing yield value. Rector (2000) reported that chocolate with 35% cocoa butter contenthas a similar yield value to that containing 32% cocoa butter and 0.1% PGPR. PGPR coatssolid particles and, with higher molecular weight, extends further into the lipid continuousphase, producing a better steric stabilisation (Vernier, 1998). In contrast to lecithin, PGPRin chocolate does not structure within the suspension, but increases the continuous phasevolume fraction and binds residual water in chocolate, making it unavailable to hydrate andswell the solid particles (Rector, 2000; Schantz & Rohm, 2005).
In recent developments, many chocolate manufacturers use PGPR and lecithin in com-bination for a desirable yield value and plastic viscosity – balancing out viscosity-reducingeffects (Vernier, 1998; Schantz & Rohm, 2005). Adding PGPR to chocolate, containing0.5% of lecithin, gives a further decrease in yield value and only slight increase in plasticviscosity (Rector, 2000). Increases in plastic viscosity at lecithin concentrations above 0.5%are uncontrolled, and effects on yield value reduction by adding PGPR have greater influenceon the flow properties of chocolate (Rector, 2000). PGPR seems less effective in inhibitingbloom formation (Walter & Cornillon, 2001).
Glycerol monostearates (GMS), widely used in confectionery industries, are formed bythe incomplete esterification of hydroxyl groups of glycerol using a single fatty acid (Heath,1982). Vernier (1998) reported that glycerol fatty acid esters were inefficient at reducingyield value and increased plastic viscosity through less efficient coverage of sugar particles,thus leading to greater friction. A mixture of sorbitan and glycerol esters of fatty acids givesyield values similar to lecithin but higher plastic viscosity (Vernier, 1998; Rousset et al.,2002).
3.7 MOISTURE AND CHOCOLATE FLOW
Molten chocolate typically has moisture contents of 0.5–1.5%, mainly in the cocoa solids,which does not affect chocolate flow. Greater moisture aggregates sugar particles to formgritty lumps, and moisture at sugar particle surfaces increases friction and apparent viscosity.
P1: KAE/UKS P2: KAEc03 BLBK244-Afoakwa January 5, 2010 7:39 Printer Name: Yet to Come
54 Chocolate Science and Technology
Beckett (2000) stated that for every 0.3% of extra moisture left within the chocolate at theend of conching, the manufacturer must add an extra 1% fat, and because fat is by far themost expensive major component in chocolate, it is important that as much ‘free’ wateris removed as possible. Water at 3–4% increases viscosity and yield value of chocolatemarkedly (Chevalley, 1999), and viscosity increases up to 20% moisture, after which anaqueous phase is formed (Beckett, 2000).
3.8 CHOCOLATE QUALITY AND DEFECTS
3.8.1 Chocolate quality
The International Organization for Standardization defines quality as ‘the totality of featuresand characteristics of a product that bear on its ability to satisfy stated or implied needs’.Quality may be judged as good or bad depending on the level of adherence to specificationsor standards for the products – with regards to raw material input and finished products –and how well it matches consumer preferences. Chocolate quality is often determined byrheological measurements and sensory evaluation for solid or more viscous food products.
3.8.1.1 Rheological measurements of chocolate quality
Chocolate behaves as a non-Newtonian liquid exhibiting non-ideal plastic behaviour, whereshear-thinning occurs once a yield value has been overcome. This is caused by the three-dimensional structure of the material collapsing and asymmetric particles, which align inthe stream lines as the shear rate increases, causing a decrease in viscosity until it becomesindependent of shear rate at high shear rates. The Herschel–Bulkley model and the Cassonmodel are both used as popular models to fit non-ideal plastic behaviour. The Casson modelwas adopted in 1973 as the standard rheological equation for chocolate by the InternationalOffice of Cocoa, Chocolate and Sugar Confectionery (IOCCC, 1973). The equation denotingthe Casson’s model has been outlined and explained in Chapter 7, in addition to variousexperiments on chocolate rheology and their influences on finished chocolate quality.
In 2000, another study by the International Confectionery Association, IOCCC (2000)showed that the mathematical models used to express the whole flow curve by a singleequation using only a small set of parameters are limited in accuracy as chocolate flowproperties do not exactly fit the Casson equation. It was therefore suggested that yield valuesbe measured at low shear rates and viscosities at high shear rates if measurements are to becompared between different laboratories. As a result, the IOCCC (2000) now recommendsthe measurement of stress and viscosity at shear rates between 2 and 50 s−1 in 7 minutes usingboth up and down curves in shear rate, this being preceded by a pre-shear at 5 s−1 lasting for5 minutes. Unfortunately, most factory grade viscometers are however not accurate at a shearrate of 2 s−1, hence the yield stress at a shear rate of 5 s−1 is taken to relate to the yield valueof chocolate. As the stress at 5 s−1 is however a completely different order of magnitude tothe shear stress calculated by the Casson model, a relationship can be established by dividingthe shear stress at 5 s−1 by 10. Further, shearing at 50 s−1 does not present results that arerepresentative of the actual chocolate structure and is not always achievable when testingvery viscous chocolate, using factory grade viscometers, hence a speed of 40 s−1 is chosen.In a paper by Servais et al. (2004), it was shown that the viscosity at 40 s−1 can be consideredas an accurate reference value for the plastic viscosity of chocolate. To relate this plastic

P1: KAE/UKS P2: KAEc03 BLBK244-Afoakwa January 5, 2010 7:39 Printer Name: Yet to Come
Industrial chocolate manufacture – processes and factors influencing quality 55
viscosity to the Casson plastic viscosity, it should be multiplied by a factor of 0.74. Thiscalculation does not mean that one could obtain the same values as using the Casson model,but that one could keep the same order of magnitude as before. Furthermore, chocolateexhibits time-dependent behaviour; in other words, a change of shear stress and viscosity ata given shear rate occurs with time, which can be related to the change in the structure ofthe material. This decrease of viscosity under shear stress with time of shearing, followed byrecovery of the structure when the stress is removed, is called thixotropy. A well-conchedchocolate should however not be thixotropic (Servais et al., 2004; Afoakwa et al., 2008b).
3.8.1.2 Sensory evaluation of chocolate quality
Chocolate quality may also be defined by consumer tasting which evaluates the eating qualityin terms of characteristics such as appearance, taste, mouthfeel, flavour and aftertaste. Thismay be done either subjectively or objectively. Subjective opinions may be based on likes anddislikes. Objective measures are scoring systems, which are independent of likes or dislikesand need to be determined by a trained panel. Objective measures can also be obtained byinstrumental analysis, such as shear measurements, rheology or textural studies. In all cases,the challenge is to relate the data of the instruments to the data obtained by the assessoror achieve a method by which the sensory attributes can be tested rheologically and bemeaningful.
Sensory analysis can be of two kinds, analytical and affective. Analytical involves theevaluation for differences or similarities between products and quality or quantity of sensoryattributes of products. It is based on an analytical tool and usually carried out by a trainedpanel of 10–20 assessors. The panel is used to provide objective evaluation, and shouldnot be used to evaluate preference. The affective analysis targets preference or acceptanceevaluation or getting opinions, to a product. It uses a large number of panellists, which shouldbe representative of the target population. To study the global perception of a food product,descriptive analytical methods in association with scaling may be used.
In descriptive analysis, various techniques can be used to describe the perceived sensorycharacteristics of a product, such as Flavour Profile
R©, Quantitative Descriptive Analysis
R©,
Texture Profile AnalysisR©
and Sensory SpectrumR©
(Lawless and Heymann, 1998). Descrip-tive analysis provides a complete description of a product’s sensory characteristics in theform of words (descriptors). The application of multisample tests is very efficient, rather thanevaluating single samples, first, by providing a much more complete picture of how productsdiffer one from the other, and, second, by providing information on more than a single prod-uct. Human beings achieve a high degree of accuracy and reliability when making relativejudgements, but are very poor at making absolute judgements. Therefore, the comparison ofmultiple samples is more precise. Detailed vocabulary used to evaluate the complete sensoryprofile of chocolate products and their descriptions have been provided in Chapter 5.
3.8.2 Chocolate defects
When a product has defect(s) in quality, it may either be rendered unwholesome due to foodsafety concerns or unacceptable in sensory character. In the case of the latter, it may besubjected to rework to meet expected or aspired sensory perceptions. Typically, two maintypes of defects occur in chocolates during post-processing handling, storage, warehousingand distribution. These include fat and sugar blooms.
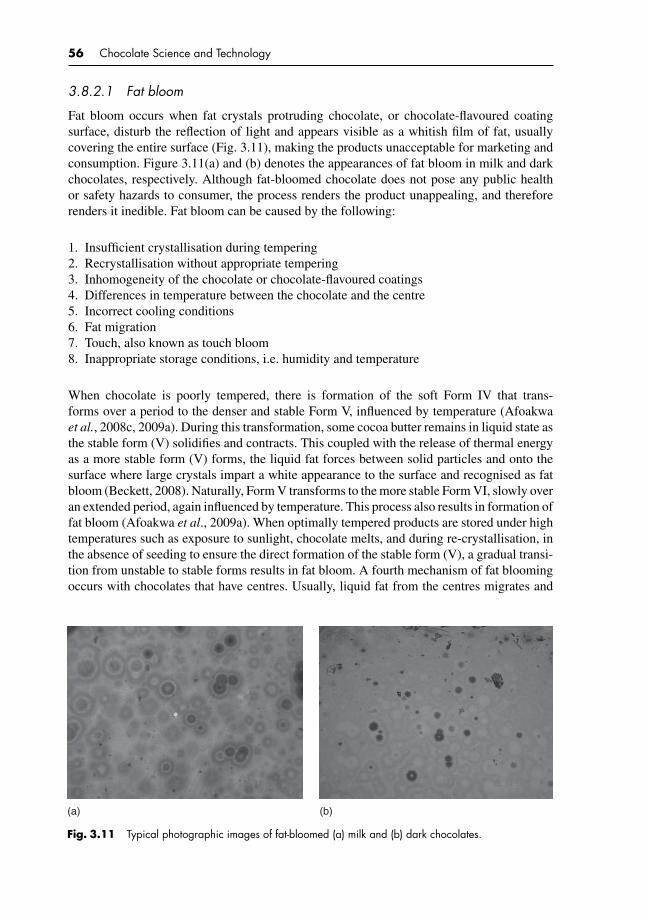
P1: KAE/UKS P2: KAEc03 BLBK244-Afoakwa January 5, 2010 7:39 Printer Name: Yet to Come
56 Chocolate Science and Technology
3.8.2.1 Fat bloom
Fat bloom occurs when fat crystals protruding chocolate, or chocolate-flavoured coatingsurface, disturb the reflection of light and appears visible as a whitish film of fat, usuallycovering the entire surface (Fig. 3.11), making the products unacceptable for marketing andconsumption. Figure 3.11(a) and (b) denotes the appearances of fat bloom in milk and darkchocolates, respectively. Although fat-bloomed chocolate does not pose any public healthor safety hazards to consumer, the process renders the product unappealing, and thereforerenders it inedible. Fat bloom can be caused by the following:
1. Insufficient crystallisation during tempering2. Recrystallisation without appropriate tempering3. Inhomogeneity of the chocolate or chocolate-flavoured coatings4. Differences in temperature between the chocolate and the centre5. Incorrect cooling conditions6. Fat migration7. Touch, also known as touch bloom8. Inappropriate storage conditions, i.e. humidity and temperature
When chocolate is poorly tempered, there is formation of the soft Form IV that trans-forms over a period to the denser and stable Form V, influenced by temperature (Afoakwaet al., 2008c, 2009a). During this transformation, some cocoa butter remains in liquid state asthe stable form (V) solidifies and contracts. This coupled with the release of thermal energyas a more stable form (V) forms, the liquid fat forces between solid particles and onto thesurface where large crystals impart a white appearance to the surface and recognised as fatbloom (Beckett, 2008). Naturally, Form V transforms to the more stable Form VI, slowly overan extended period, again influenced by temperature. This process also results in formation offat bloom (Afoakwa et al., 2009a). When optimally tempered products are stored under hightemperatures such as exposure to sunlight, chocolate melts, and during re-crystallisation, inthe absence of seeding to ensure the direct formation of the stable form (V), a gradual transi-tion from unstable to stable forms results in fat bloom. A fourth mechanism of fat bloomingoccurs with chocolates that have centres. Usually, liquid fat from the centres migrates and
(a) (b)
Fig. 3.11 Typical photographic images of fat-bloomed (a) milk and (b) dark chocolates.

P1: KAE/UKS P2: KAEc03 BLBK244-Afoakwa January 5, 2010 7:39 Printer Name: Yet to Come
Industrial chocolate manufacture – processes and factors influencing quality 57
consequently reaches surfaces along with some cocoa butter. Recrystallisation of this cocoabutter results in fat bloom. Chocolate with nut centres is mostly predisposed to this type ofbloom.
3.8.2.2 Sugar bloom
Sugar bloom occurs through either poor storage conditions (high humidity) or rapid transitionof products from an area of low to high temperature. Both conditions result in sweating ofthe chocolate, which consequently dissolves sugar. As the surface water evaporates, sugarcrystals remain on the surfaces, producing a white appearance.
This phenomenon is often confused with fat bloom but is completely different. The dif-ference can be established microscopically or whichever is simpler by heating the chocolateto 38◦C. Fat bloom disappears at this temperature, whereas sugar bloom remains visible.
3.9 CONCLUSION
Chocolate manufacturing is complex and requires several technological operations and pro-cesses to achieve the desired product quality. During processing, the physical properties,rheological behaviour and sensory perception of chocolate are influenced largely by itsprocessing techniques, particle size distribution and ingredient composition. To enhancechocolate quality in terms of appearance, texture, taste and flavour, solid particle size dis-tribution and ingredient composition can be manipulated to modify the physical properties,rheological behaviour and sensorial attributes. Several improvements have been made inrecent years on chocolate quality using varying processing strategies and ingredient compo-sition. However, the use of particle size distribution and ingredient composition as tools tomodify the rheological behaviour and sensory properties of chocolate still requires a greaterunderstanding of underlying principles and factors affecting changes in flow behaviour andother physical quality characteristics. These principles and their underlying processes andquality effects have been extensively studied and reported in Chapter 7.
P1: KAE/UKS P2: KAEc04 BLBK244-Afoakwa January 25, 2010 16:10 Printer Name: Yet to Come
4 The chemistry of flavour developmentduring cocoa processing andchocolate manufacture
4.1 INTRODUCTION
Chocolate characters not only originate in flavour precursors present in cocoa beans, butare generated during post-harvest treatments and transformed into desirable odour notes inthe manufacturing processes. Complex biochemical modifications of bean constituents arefurther altered by thermal reactions in roasting and conching and in alkalisation. However, thechemistry of flavour generation and development during the roasting and conching processes,and their relationships with final flavour quality, has not been clear. With increasing specialityniche products in chocolate confectionery, greater understanding of factors contributing tovariations in flavour character would have significant commercial implications.
This chapter describes the nature of chocolate flavour characters in cocoa from differentorigins and the chemistry of their transformations and development through the processes ofroasting and alkalisation during cocoa processing, and conching during industrial chocolatemanufacture. It also provides detailed descriptions of the different flavour compounds indark and milk chocolates and their contributions to the overall flavour/odour characteristicsin finished chocolates.
4.2 INFLUENCE OF BEAN SELECTION ON CHOCOLATEFLAVOUR QUALITY
The source of bean used during processing is widely known to have dramatic impact on theflavour of finished chocolate. The African varieties are thought to possess the best ‘cocoacharacter’ that manufacturers seek for their products. However, apart from the ‘cocoa charac-ter’, beans are known to contribute other major attributes to the overall profile of the product.Some of the characteristics considered positive contributions include bitterness, astringency,acidity, burnt and caramelised flavours. The skilled manufacturers therefore design theirchocolate recipe using bean blends to complement or to contrast these flavour properties.Minor, but yet important, contributions made by varied bean types include some traits aswoody, fruity, spicy, floral, winy, earthy and perfumery characters. Defects usually associ-ated with farm-level influences can include notes such as smoky, hummy, musty, metallic andother negative contributions (Urbanski, 1992).
Cocoa beans from West African origins – Ghana, Cote d’Ivoire and Nigeria – are generallythought of as the ideal or standard cocoa flavour. While there are distinguishable differencesbetween the origins, the group is thought to yield a balanced and pronounced cocoa characterwith subtle to moderate nutty undertones. Even though the Ivorian and Nigerian stocks
P1: KAE/UKS P2: KAEc04 BLBK244-Afoakwa January 25, 2010 16:10 Printer Name: Yet to Come
The chemistry of flavour development during cocoa processing and chocolate manufacture 59
are believed to show more variability from that of Ghana stock, which is known to be ofhigh cocoa quality and attracts a premium price on the international market, the degreeof variability in Ghana stock is relatively insignificant when compared to the degree ofvariabilities found in other origins. Typically, differences in flavour profiles of beans fromdifferent origins could be compared by roasting them under standardised conditions. Fromnumerous observations, beans from Cote d’Ivoire (Ivory Coast) yields a good cocoa impactwith low levels of acidity and bitterness. Other fair nutty characters could be noted. Brazilianbeans also deliver very little cocoa impact but can sometimes be quite acidic, bitter andastringent (Urbanski, 1992; Fowler, 1999). Desirable side notes such as nutty and fruity areabsent. There have been reports that there is little, if any, yeast activity in the early stages offermentation in Bahia beans. Instead, the initial phase of fermentation is dominated by lacticacid bacteria. The dominant role played by the lactic acid producers might be the reason forthe acidic properties in Brazilian cocoa. Ecuadorian beans deliver a more balanced flavourprofile but lacks the distinct chocolate note found in the Ghanaian beans, roasted under thesame conditions (140◦C for 30 minutes).
4.3 EFFECT OF ROASTING
Roasting of cocoa is an essential step to further develop chocolate flavour from the precursorsformed during fermentation and drying. Whole bean roasting loosens the shell, which is thenreadily removed in winnowing. Prior to roasting, cocoa beans have bitter, acidic, astringentand nutty flavours. Roasting further diminishes acidity-reducing concentrations of volatileacids such as acetic acid (Beckett, 2000; Granvogl et al., 2006; Ramli et al., 2006) but notnon-volatiles such as oxalic, citric, tartaric, succinic and lactic acids (Jinap et al., 1998; Awua,2002). Degree of cocoa roast shows a time–temperature-dependent relationship over periodsof 5–120 minutes and in the range 120–150◦C. Low-temperature roasts are employed formilk and certain dark chocolates. An alternative practice is nib roasting where whole beansare pre-heated, at just below 100◦C, to loosen the shells, which are then removed. The thermaloperations to loosen the shell include hot air shock, steam or infrared heating (Kim & Keeney,1984; Kealey et al., 2001; Awua, 2002). The nibs are then treated (e.g. alkalised) and roasted.
Maillard reactions, central to cocoa flavour development, are important in roasting, andfree amino acids, peptides and reducing sugars all participate (Rohan & Stewart, 1967). Voigtet al. (1993, 1994a) noted the hydrophobic amino acids – leucine, alanine, phenylalanine andtyrosine – released by proteinase activities in fermentation are important contributors (Mohret al., 1976; Voigt et al., 1993, 1994a), as are reducing sugars, fructose and glucose, derivedfrom sucrose hydrolysis (Lopez et al., 1978).
Maillard reactions (Fig. 4.1) require heating at pH values above 3, in the presence of water,a reducing sugar such as glucose, and an amino group, generally from protein. Reactionsto the left of Figure 4.1 yield flavours, and to the right, colour formation. The 1-DH, 3-DH and 4-DH intermediates are 1-, 3- and 4-deoxyhexosuloses, respectively, all dicarbonylcompounds. Initial amine-assisted degradation of a reducing sugar proceeds by a sugar–aminecondensation forming a Schiff base (Fig. 4.2), tautomerising to a 1,2-enaminol (Fig. 4.3).The link between glucose C-1 and fructose C-2 in sucrose prevents ring opening and Schiffbase formation, blocking participation in Maillard reactions. Reaction intermediates can actas catalysts or inhibitors for other reactions contributing to flavour (Beckett, 2000; Granvoglet al., 2006; Ramli et al., 2006).

P1: KAE/UKS P2: KAEc04 BLBK244-Afoakwa January 25, 2010 16:10 Printer Name: Yet to Come
60 Chocolate Science and Technology
3 DHStrecker
Aldehydes
3DH enol
Polymers
Pyrroles
1,2-Enaminol
Glucosylamine
Glucose + RNH2
C2 + C4
C3 + C3
C3 + C3
C2 + C4
C1 + C5
C1 + C5
Fructoseamine
Retro-aldol
2,3-Enediol
1DH
4DH
P
P
Retro-aldol
pH > 7pH < 5
Fig. 4.1 Model of Maillard reaction.
H
C
OH
HHO
OHH
OHH
CH2OH
H O
N
HR
H
..
Amine
Glucose
H
C
OH
HHO
OHH
OHH
CH2OH
H
OH
N
H
RH
C
OH
HHO
OHH
OHH
CH2OH
NH R
Schiff base
Fig. 4.2 Mechanism of sugar–amine condensation to form a Schiff base.
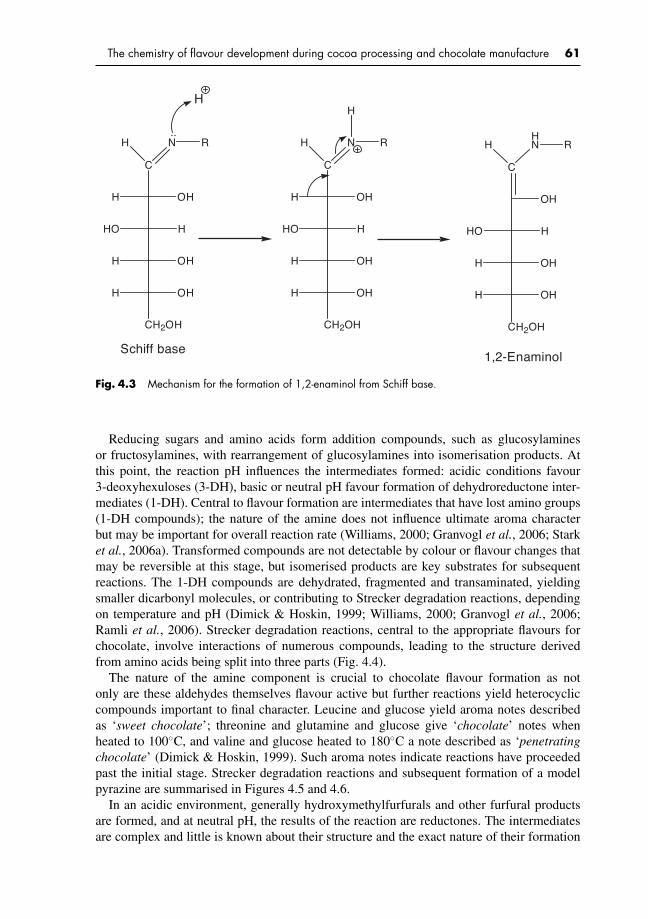
P1: KAE/UKS P2: KAEc04 BLBK244-Afoakwa January 25, 2010 16:10 Printer Name: Yet to Come
The chemistry of flavour development during cocoa processing and chocolate manufacture 61
H
C
OH
HHO
OHH
OHH
CH2OH
NH R
Schiff base
H
C
OH
HHO
OHH
OHH
CH2OH
NH R
C
OH
HHO
OHH
OHH
CH2OH
HNH R
..
HH
1,2-Enaminol
Fig. 4.3 Mechanism for the formation of 1,2-enaminol from Schiff base.
Reducing sugars and amino acids form addition compounds, such as glucosylaminesor fructosylamines, with rearrangement of glucosylamines into isomerisation products. Atthis point, the reaction pH influences the intermediates formed: acidic conditions favour3-deoxyhexuloses (3-DH), basic or neutral pH favour formation of dehydroreductone inter-mediates (1-DH). Central to flavour formation are intermediates that have lost amino groups(1-DH compounds); the nature of the amine does not influence ultimate aroma characterbut may be important for overall reaction rate (Williams, 2000; Granvogl et al., 2006; Starket al., 2006a). Transformed compounds are not detectable by colour or flavour changes thatmay be reversible at this stage, but isomerised products are key substrates for subsequentreactions. The 1-DH compounds are dehydrated, fragmented and transaminated, yieldingsmaller dicarbonyl molecules, or contributing to Strecker degradation reactions, dependingon temperature and pH (Dimick & Hoskin, 1999; Williams, 2000; Granvogl et al., 2006;Ramli et al., 2006). Strecker degradation reactions, central to the appropriate flavours forchocolate, involve interactions of numerous compounds, leading to the structure derivedfrom amino acids being split into three parts (Fig. 4.4).
The nature of the amine component is crucial to chocolate flavour formation as notonly are these aldehydes themselves flavour active but further reactions yield heterocycliccompounds important to final character. Leucine and glucose yield aroma notes describedas ‘sweet chocolate’; threonine and glutamine and glucose give ‘chocolate’ notes whenheated to 100◦C, and valine and glucose heated to 180◦C a note described as ‘penetratingchocolate’ (Dimick & Hoskin, 1999). Such aroma notes indicate reactions have proceededpast the initial stage. Strecker degradation reactions and subsequent formation of a modelpyrazine are summarised in Figures 4.5 and 4.6.
In an acidic environment, generally hydroxymethylfurfurals and other furfural productsare formed, and at neutral pH, the results of the reaction are reductones. The intermediatesare complex and little is known about their structure and the exact nature of their formation
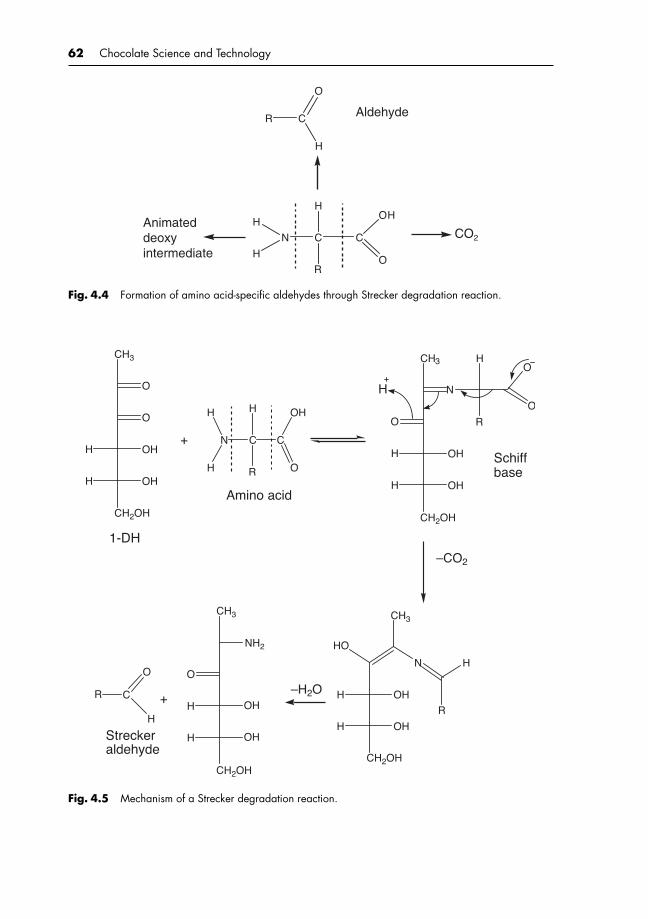
P1: KAE/UKS P2: KAEc04 BLBK244-Afoakwa January 25, 2010 16:10 Printer Name: Yet to Come
62 Chocolate Science and Technology
R C
O
H
Aldehyde
N C
H
C
R
OH
O
H
H
CO2
Animateddeoxyintermediate
Fig. 4.4 Formation of amino acid-specific aldehydes through Strecker degradation reaction.
CH3
CH3CH3
NH2
O
O
H OH
H OH
CH2OH CH2OH
CH2OHCH2OH
1-DH
N C
H
C
R
OH
O
H
H
+
Amino acid
CH3
N
H OH
H OH
O
H
R
O
O
H
–CO2
–H2O
N
H OH
H OH
HO
H
RH OH
H OH
O
+R C
O
H
Streckeraldehyde
Schiffbase
Fig. 4.5 Mechanism of a Strecker degradation reaction.
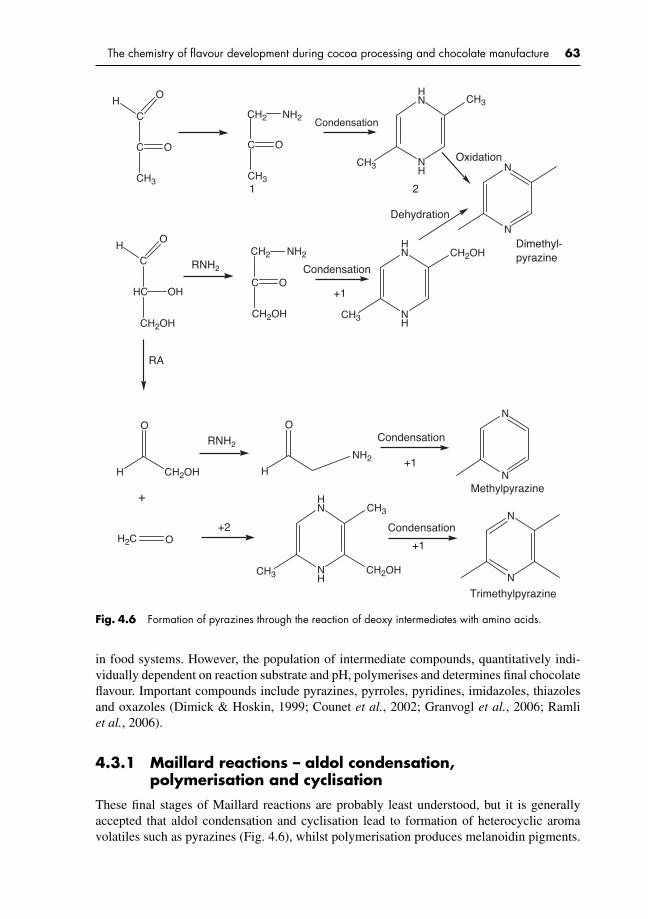
P1: KAE/UKS P2: KAEc04 BLBK244-Afoakwa January 25, 2010 16:10 Printer Name: Yet to Come
The chemistry of flavour development during cocoa processing and chocolate manufacture 63
C
C O
OH
CH3
CH2 NH2
NH2
CH3
CH3
CH3
CH3
CH3
CH3
CH2OH
CH2OHCH2OH
H2C
CH2OH
CH2OH
CH2 NH2
C O
Condensation
NH
HN
21
Oxidation
N
N
C
HC OH
OH
RNH2
RNH2
C O
NH
HN
Dehydration
Dimethyl-pyrazine
Condensation
Condensation
+1
+1
+1
RA
O
H
O
H N
N
Methylpyrazine+
O+2
NH
HN
Condensation
N
N
Trimethylpyrazine
Fig. 4.6 Formation of pyrazines through the reaction of deoxy intermediates with amino acids.
in food systems. However, the population of intermediate compounds, quantitatively indi-vidually dependent on reaction substrate and pH, polymerises and determines final chocolateflavour. Important compounds include pyrazines, pyrroles, pyridines, imidazoles, thiazolesand oxazoles (Dimick & Hoskin, 1999; Counet et al., 2002; Granvogl et al., 2006; Ramliet al., 2006).
4.3.1 Maillard reactions – aldol condensation,polymerisation and cyclisation
These final stages of Maillard reactions are probably least understood, but it is generallyaccepted that aldol condensation and cyclisation lead to formation of heterocyclic aromavolatiles such as pyrazines (Fig. 4.6), whilst polymerisation produces melanoidin pigments.
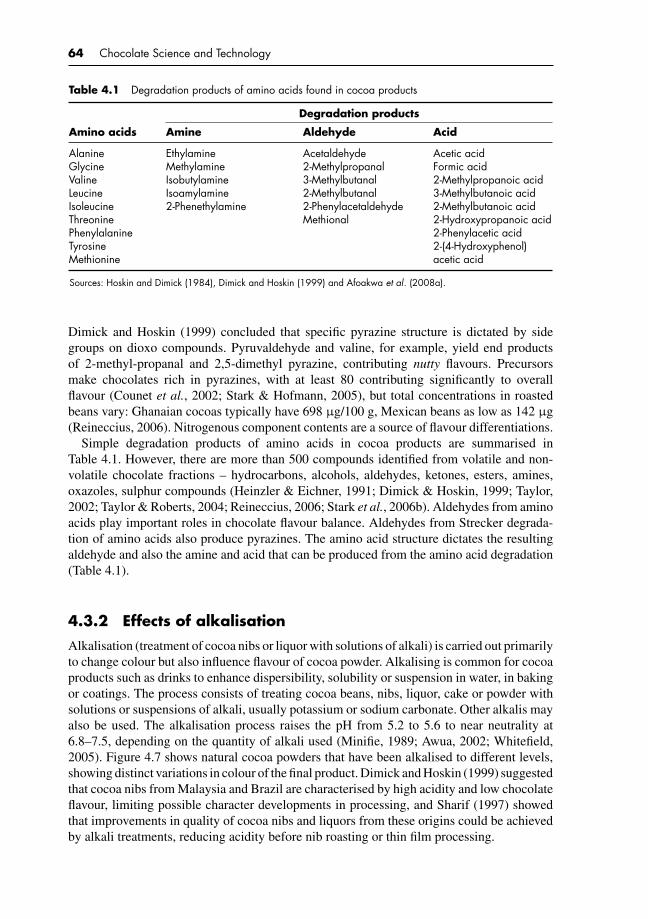
P1: KAE/UKS P2: KAEc04 BLBK244-Afoakwa January 25, 2010 16:10 Printer Name: Yet to Come
64 Chocolate Science and Technology
Table 4.1 Degradation products of amino acids found in cocoa products
Degradation products
Amino acids Amine Aldehyde Acid
AlanineGlycineValineLeucineIsoleucineThreoninePhenylalanineTyrosineMethionine
EthylamineMethylamineIsobutylamineIsoamylamine2-Phenethylamine
Acetaldehyde2-Methylpropanal3-Methylbutanal2-Methylbutanal2-PhenylacetaldehydeMethional
Acetic acidFormic acid2-Methylpropanoic acid3-Methylbutanoic acid2-Methylbutanoic acid2-Hydroxypropanoic acid2-Phenylacetic acid2-(4-Hydroxyphenol)acetic acid
Sources: Hoskin and Dimick (1984), Dimick and Hoskin (1999) and Afoakwa et al. (2008a).
Dimick and Hoskin (1999) concluded that specific pyrazine structure is dictated by sidegroups on dioxo compounds. Pyruvaldehyde and valine, for example, yield end productsof 2-methyl-propanal and 2,5-dimethyl pyrazine, contributing nutty flavours. Precursorsmake chocolates rich in pyrazines, with at least 80 contributing significantly to overallflavour (Counet et al., 2002; Stark & Hofmann, 2005), but total concentrations in roastedbeans vary: Ghanaian cocoas typically have 698 µg/100 g, Mexican beans as low as 142 µg(Reineccius, 2006). Nitrogenous component contents are a source of flavour differentiations.
Simple degradation products of amino acids in cocoa products are summarised inTable 4.1. However, there are more than 500 compounds identified from volatile and non-volatile chocolate fractions – hydrocarbons, alcohols, aldehydes, ketones, esters, amines,oxazoles, sulphur compounds (Heinzler & Eichner, 1991; Dimick & Hoskin, 1999; Taylor,2002; Taylor & Roberts, 2004; Reineccius, 2006; Stark et al., 2006b). Aldehydes from aminoacids play important roles in chocolate flavour balance. Aldehydes from Strecker degrada-tion of amino acids also produce pyrazines. The amino acid structure dictates the resultingaldehyde and also the amine and acid that can be produced from the amino acid degradation(Table 4.1).
4.3.2 Effects of alkalisation
Alkalisation (treatment of cocoa nibs or liquor with solutions of alkali) is carried out primarilyto change colour but also influence flavour of cocoa powder. Alkalising is common for cocoaproducts such as drinks to enhance dispersibility, solubility or suspension in water, in bakingor coatings. The process consists of treating cocoa beans, nibs, liquor, cake or powder withsolutions or suspensions of alkali, usually potassium or sodium carbonate. Other alkalis mayalso be used. The alkalisation process raises the pH from 5.2 to 5.6 to near neutrality at6.8–7.5, depending on the quantity of alkali used (Minifie, 1989; Awua, 2002; Whitefield,2005). Figure 4.7 shows natural cocoa powders that have been alkalised to different levels,showing distinct variations in colour of the final product. Dimick and Hoskin (1999) suggestedthat cocoa nibs from Malaysia and Brazil are characterised by high acidity and low chocolateflavour, limiting possible character developments in processing, and Sharif (1997) showedthat improvements in quality of cocoa nibs and liquors from these origins could be achievedby alkali treatments, reducing acidity before nib roasting or thin film processing.
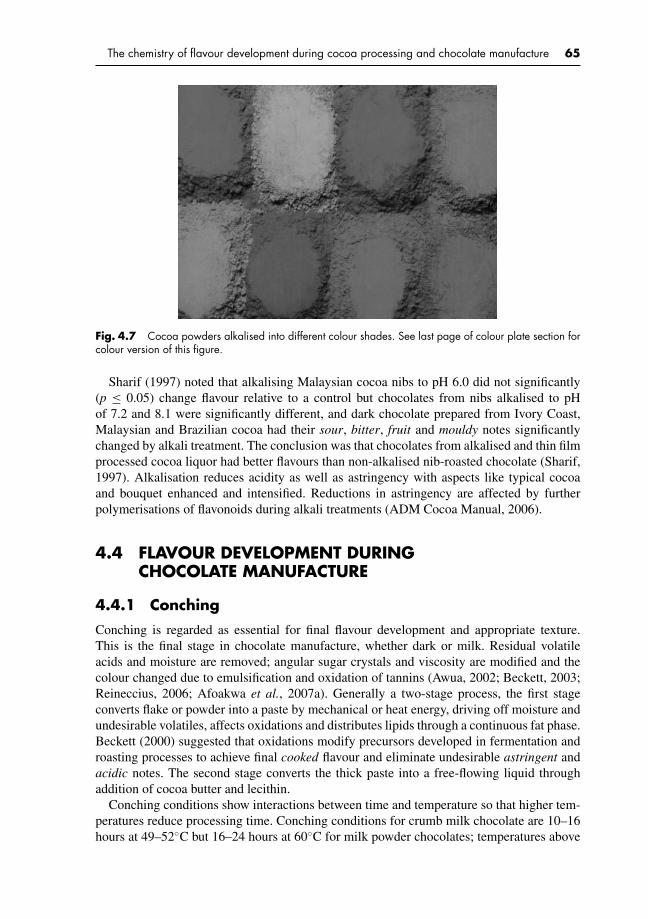
P1: KAE/UKS P2: KAEc04 BLBK244-Afoakwa January 25, 2010 16:10 Printer Name: Yet to Come
The chemistry of flavour development during cocoa processing and chocolate manufacture 65
Fig. 4.7 Cocoa powders alkalised into different colour shades. See last page of colour plate section forcolour version of this figure.
Sharif (1997) noted that alkalising Malaysian cocoa nibs to pH 6.0 did not significantly(p ≤ 0.05) change flavour relative to a control but chocolates from nibs alkalised to pHof 7.2 and 8.1 were significantly different, and dark chocolate prepared from Ivory Coast,Malaysian and Brazilian cocoa had their sour, bitter, fruit and mouldy notes significantlychanged by alkali treatment. The conclusion was that chocolates from alkalised and thin filmprocessed cocoa liquor had better flavours than non-alkalised nib-roasted chocolate (Sharif,1997). Alkalisation reduces acidity as well as astringency with aspects like typical cocoaand bouquet enhanced and intensified. Reductions in astringency are affected by furtherpolymerisations of flavonoids during alkali treatments (ADM Cocoa Manual, 2006).
4.4 FLAVOUR DEVELOPMENT DURINGCHOCOLATE MANUFACTURE
4.4.1 Conching
Conching is regarded as essential for final flavour development and appropriate texture.This is the final stage in chocolate manufacture, whether dark or milk. Residual volatileacids and moisture are removed; angular sugar crystals and viscosity are modified and thecolour changed due to emulsification and oxidation of tannins (Awua, 2002; Beckett, 2003;Reineccius, 2006; Afoakwa et al., 2007a). Generally a two-stage process, the first stageconverts flake or powder into a paste by mechanical or heat energy, driving off moisture andundesirable volatiles, affects oxidations and distributes lipids through a continuous fat phase.Beckett (2000) suggested that oxidations modify precursors developed in fermentation androasting processes to achieve final cooked flavour and eliminate undesirable astringent andacidic notes. The second stage converts the thick paste into a free-flowing liquid throughaddition of cocoa butter and lecithin.
Conching conditions show interactions between time and temperature so that higher tem-peratures reduce processing time. Conching conditions for crumb milk chocolate are 10–16hours at 49–52◦C but 16–24 hours at 60◦C for milk powder chocolates; temperatures above

P1: KAE/UKS P2: KAEc04 BLBK244-Afoakwa January 25, 2010 16:10 Printer Name: Yet to Come
66 Chocolate Science and Technology
70◦C lead to changes in cooked flavours (Beckett, 2000; Awua, 2002; Beckett, 2003; White-field, 2005). Dark chocolates are typically conched at higher temperatures, 70◦C or up to82◦C (Minifie, 1989; Awua, 2002). Conditions may be modified (generally shortened) bypre-treatment of chocolate liquors as thin films at temperatures more than 100◦C (Minifie,1989; Afoakwa et al., 2007a).
The air spaces surrounding a conche in operation have an odour of acetic acid, suggestingan initial loss of short-chained volatile fatty acids, such as acetic acid, the end products offermentation. This was confirmed by quantitative studies (Dimick & Hoskin, 1999; Beckett,2000). Volatile phenols show 80% reductions in headspace concentrations within a few hoursof conching (Beckett, 2000). Hoskin and Dimick (1984) reported that phenols decreased from21.3 µg/100 g to 10.9 µg/100 g after 44 hours in low roast chocolate, and 10.3 µg/100 g to6.0 µg/100 g after 24 hours in high roast in conching. In a later paper, Dimick and Hoskin(1999) concluded that polyphenols, through oxidation and enzymatic mechanisms, form com-plexes with amino acids, peptides and proteins. The outcome is withdrawal of flavour-activevolatiles from headspaces and reductions in perceptions of astringency through irreversiblephenol interactions, and more ‘mellow’ final flavours.
Hoskin and Dimick (1983) suggested that in conching of dark chocolate, amino acidconcentrations do not fall as temperature and/or the concentrations of amino acids andsugars are below thermal thresholds for Maillard reactions. Heinzler and Eichner (1991),however, reported that Amadori compounds formed in drying and roasting decrease duringconching, and Pontillon (1995) proposed caramelisations of lactose and Maillard reactionswith milk proteins (in milk chocolate). A consensus is that chocolates show marked decreasesin overall off-flavours after conching (Hoskin & Dimick, 1983; Pontillon, 1995; Plumaset al., 1996; Counet et al., 2002; Beckett, 2003).
Counet and his co-workers (Counet et al., 2002) concluded that key dark chocolateodourants were present prior to conching, during which Strecker aldehydes were partiallylost through evaporation and/or chemical reactions. On the other hand, 2-phenyl-5-methyl-2-hexenal content was increased through aldol condensation of phenylacetaldehyde and3-methylbutanal followed by dehydration (Counet et al., 2002). Schnermann and Schieberle(1997) noted Furaneol and maltol (Table 4.2) were also generated during conching. Ofheterocycles, only concentrations of the least volatile compounds were increased, notablypolysubstituted ethyl-, isobutyl- and isopentylpyrazines, tri- or tetramethylpyrazine, furansand acetylpyrrole (Table 4.2).
4.5 KEY FLAVOUR COMPOUNDS IN MILK CHOCOLATE
Analytical studies have identified more than 600 volatile compounds in cocoa andchocolate products (Schieberle & Pfnuer, 1999; Taylor, 2002; Taylor & Roberts, 2004;Reineccius, 2006), primarily pyrazines, esters, amines and amides, acids and hydrocar-bons. Schnermann and Schieberle (1997) identified as key neutral/basic flavour-activecomponents of milk chocolate: 3-methylbutanal, 2-ethyl-3,5-dimethylpyrazine, 1-octen-3-one, 2-ethyl-3,6-dimethyl pyrazine, 2,3-diethyl-5-methylpyrazine, (Z)-2-nonenal, 2-methyl-3-(methyldithio)furan, (E,E)-2,4-nononadienal, (E,E)-2,4-decadienal and R-δ-decalactone(Table 4.2).
In acidic volatiles, 14 components were identified as contributing to flavour (Table 4.2)with vanillin (vanilla), added also in manufacture, followed by 2- and 3-methylbutanoic acid
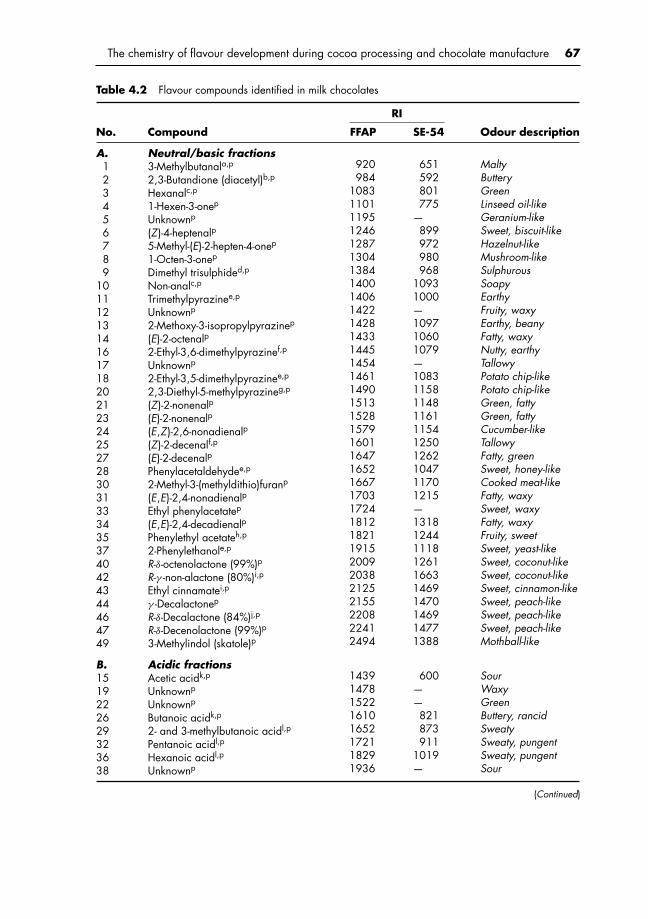
P1: KAE/UKS P2: KAEc04 BLBK244-Afoakwa January 25, 2010 16:10 Printer Name: Yet to Come
The chemistry of flavour development during cocoa processing and chocolate manufacture 67
Table 4.2 Flavour compounds identified in milk chocolates
RI
No. Compound FFAP SE-54 Odour description
A.123456789
10111213141617182021232425272830313334353740424344464749
B.1519222629323638
Neutral/basic fractions3-Methylbutanala,p
2,3-Butandione (diacetyl)b,p
Hexanalc,p
1-Hexen-3-onep
Unknownp
(Z)-4-heptenalp5-Methyl-(E)-2-hepten-4-onep
1-Octen-3-onep
Dimethyl trisulphided,p
Non-analc,p
Trimethylpyrazinee,p
Unknownp
2-Methoxy-3-isopropylpyrazinep
(E)-2-octenalp2-Ethyl-3,6-dimethylpyrazinef,p
Unknownp
2-Ethyl-3,5-dimethylpyrazinee,p
2,3-Diethyl-5-methylpyrazineg,p
(Z)-2-nonenalp(E)-2-nonenalp(E,Z)-2,6-nonadienalp(Z)-2-decenalf,p(E)-2-decenalpPhenylacetaldehydee,p
2-Methyl-3-(methyldithio)furanp
(E,E)-2,4-nonadienalpEthyl phenylacetatep
(E,E)-2,4-decadienalpPhenylethyl acetateh,p
2-Phenylethanole,p
R-δ-octenolactone (99%)pR-γ -non-alactone (80%)i,pEthyl cinnamatei,p
γ -Decalactonep
R-δ-Decalactone (84%)j,pR-δ-Decenolactone (99%)p3-Methylindol (skatole)p
Acidic fractionsAcetic acidk,p
Unknownp
Unknownp
Butanoic acidk,p
2- and 3-methylbutanoic acidl,p
Pentanoic acidl,p
Hexanoic acidl,p
Unknownp
920984
10831101119512461287130413841400140614221428143314451454146114901513152815791601164716521667170317241812182119152009203821252155220822412494
14391478152216101652172118291936
651592801775
—899972980968
10931000—109710601079—1083115811481161115412501262104711701215—1318124411181261166314691470146914771388
600——821873911
1019—
MaltyButteryGreenLinseed oil-likeGeranium-likeSweet, biscuit-likeHazelnut-likeMushroom-likeSulphurousSoapyEarthyFruity, waxyEarthy, beanyFatty, waxyNutty, earthyTallowyPotato chip-likePotato chip-likeGreen, fattyGreen, fattyCucumber-likeTallowyFatty, greenSweet, honey-likeCooked meat-likeFatty, waxySweet, waxyFatty, waxyFruity, sweetSweet, yeast-likeSweet, coconut-likeSweet, coconut-likeSweet, cinnamon-likeSweet, peach-likeSweet, peach-likeSweet, peach-likeMothball-like
SourWaxyGreenButtery, rancidSweatySweaty, pungentSweaty, pungentSour
(Continued)
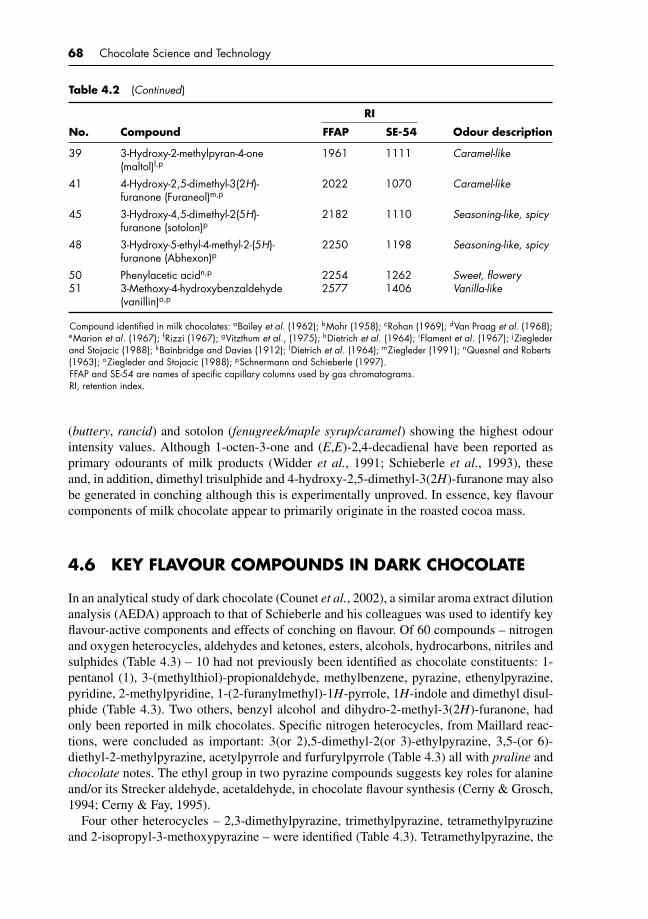
P1: KAE/UKS P2: KAEc04 BLBK244-Afoakwa January 25, 2010 16:10 Printer Name: Yet to Come
68 Chocolate Science and Technology
Table 4.2 (Continued)
RI
No. Compound FFAP SE-54 Odour description
39
41
45
48
5051
3-Hydroxy-2-methylpyran-4-one(maltol)l,p
4-Hydroxy-2,5-dimethyl-3(2H)-furanone (Furaneol)m,p
3-Hydroxy-4,5-dimethyl-2(5H)-furanone (sotolon)p
3-Hydroxy-5-ethyl-4-methyl-2-(5H)-furanone (Abhexon)p
Phenylacetic acidn,p
3-Methoxy-4-hydroxybenzaldehyde(vanillin)o,p
1961
2022
2182
2250
22542577
1111
1070
1110
1198
12621406
Caramel-like
Caramel-like
Seasoning-like, spicy
Seasoning-like, spicy
Sweet, floweryVanilla-like
Compound identified in milk chocolates: aBailey et al. (1962); bMohr (1958); cRohan (1969); dVan Praag et al. (1968);eMarion et al. (1967); fRizzi (1967); gVitzthum et al., (1975); hDietrich et al. (1964); iFlament et al. (1967); jZieglederand Stojacic (1988); kBainbridge and Davies (1912); lDietrich et al. (1964); mZiegleder (1991); nQuesnel and Roberts(1963); oZiegleder and Stojacic (1988); pSchnermann and Schieberle (1997).FFAP and SE-54 are names of specific capillary columns used by gas chromatograms.RI, retention index.
(buttery, rancid) and sotolon (fenugreek/maple syrup/caramel) showing the highest odourintensity values. Although 1-octen-3-one and (E,E)-2,4-decadienal have been reported asprimary odourants of milk products (Widder et al., 1991; Schieberle et al., 1993), theseand, in addition, dimethyl trisulphide and 4-hydroxy-2,5-dimethyl-3(2H)-furanone may alsobe generated in conching although this is experimentally unproved. In essence, key flavourcomponents of milk chocolate appear to primarily originate in the roasted cocoa mass.
4.6 KEY FLAVOUR COMPOUNDS IN DARK CHOCOLATE
In an analytical study of dark chocolate (Counet et al., 2002), a similar aroma extract dilutionanalysis (AEDA) approach to that of Schieberle and his colleagues was used to identify keyflavour-active components and effects of conching on flavour. Of 60 compounds – nitrogenand oxygen heterocycles, aldehydes and ketones, esters, alcohols, hydrocarbons, nitriles andsulphides (Table 4.3) – 10 had not previously been identified as chocolate constituents: 1-pentanol (1), 3-(methylthiol)-propionaldehyde, methylbenzene, pyrazine, ethenylpyrazine,pyridine, 2-methylpyridine, 1-(2-furanylmethyl)-1H-pyrrole, 1H-indole and dimethyl disul-phide (Table 4.3). Two others, benzyl alcohol and dihydro-2-methyl-3(2H)-furanone, hadonly been reported in milk chocolates. Specific nitrogen heterocycles, from Maillard reac-tions, were concluded as important: 3(or 2),5-dimethyl-2(or 3)-ethylpyrazine, 3,5-(or 6)-diethyl-2-methylpyrazine, acetylpyrrole and furfurylpyrrole (Table 4.3) all with praline andchocolate notes. The ethyl group in two pyrazine compounds suggests key roles for alanineand/or its Strecker aldehyde, acetaldehyde, in chocolate flavour synthesis (Cerny & Grosch,1994; Cerny & Fay, 1995).
Four other heterocycles – 2,3-dimethylpyrazine, trimethylpyrazine, tetramethylpyrazineand 2-isopropyl-3-methoxypyrazine – were identified (Table 4.3). Tetramethylpyrazine, the
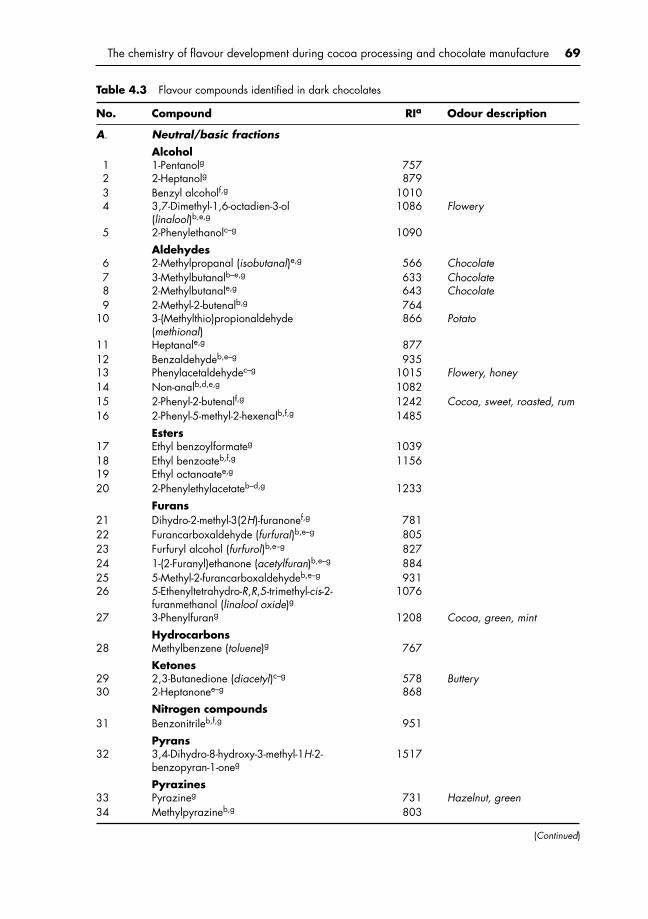
P1: KAE/UKS P2: KAEc04 BLBK244-Afoakwa January 25, 2010 16:10 Printer Name: Yet to Come
The chemistry of flavour development during cocoa processing and chocolate manufacture 69
Table 4.3 Flavour compounds identified in dark chocolates
No. Compound RIa Odour description
A. Neutral/basic fractionsAlcohol
1 1-Pentanolg 7572 2-Heptanolg 8793 Benzyl alcoholf,g 10104 3,7-Dimethyl-1,6-octadien-3-ol
(linalool)b,e,g1086 Flowery
5 2-Phenylethanolc–g 1090
Aldehydes6 2-Methylpropanal (isobutanal)e,g 566 Chocolate7 3-Methylbutanalb–e,g 633 Chocolate8 2-Methylbutanale,g 643 Chocolate9 2-Methyl-2-butenalb,g 764
10 3-(Methylthio)propionaldehyde(methional)
866 Potato
11 Heptanale,g 87712 Benzaldehydeb,e–g 93513 Phenylacetaldehydec–g 1015 Flowery, honey14 Non-analb,d,e,g 108215 2-Phenyl-2-butenalf,g 1242 Cocoa, sweet, roasted, rum16 2-Phenyl-5-methyl-2-hexenalb,f,g 1485
Esters17 Ethyl benzoylformateg 103918 Ethyl benzoateb,f,g 115619 Ethyl octanoatee,g
20 2-Phenylethylacetateb–d,g 1233
Furans21 Dihydro-2-methyl-3(2H)-furanonef,g 78122 Furancarboxaldehyde (furfural)b,e–g 80523 Furfuryl alcohol (furfurol)b,e–g 82724 1-(2-Furanyl)ethanone (acetylfuran)b,e–g 88425 5-Methyl-2-furancarboxaldehydeb,e–g 93126 5-Ethenyltetrahydro-R,R,5-trimethyl-cis-2-
furanmethanol (linalool oxide)g1076
27 3-Phenylfurang 1208 Cocoa, green, mintHydrocarbons
28 Methylbenzene (toluene)g 767
Ketones29 2,3-Butanedione (diacetyl)c–g 578 Buttery30 2-Heptanonee–g 868
Nitrogen compounds31 Benzonitrileb,f,g 951
Pyrans32 3,4-Dihydro-8-hydroxy-3-methyl-1H-2-
benzopyran-1-oneg1517
Pyrazines33 Pyrazineg 731 Hazelnut, green34 Methylpyrazineb,g 803
(Continued)

P1: KAE/UKS P2: KAEc04 BLBK244-Afoakwa January 25, 2010 16:10 Printer Name: Yet to Come
70 Chocolate Science and Technology
Table 4.3 (Continued)
No. Compound RIa Odour description
35 2,5-Dimethylpyrazineb,f,g 889 Green, ether, rum36 Ethylpyrazineb,g 895 Hazelnut, roasted37 2,3-Dimethylpyrazineb,g 89938 Ethenylpyrazine 90739 2-Ethyl-5(or 6)-methylpyrazineb,f,g 973 Cocoa, roasted, green40 Trimethylpyrazineb–d,f,g 98041 2-Ethyl-3-methylpyrazineb,g 983 Hazelnut, roasted42 2-Ethenyl-6-methylpyrazineg 992 Roasted, smoky, praline, rum43 3(or 2),5-Dimethyl-2(or
3)-ethylpyrazinec,d,f,g1057
44 Tetramethylpyrazineb,f,g 1065 Milk coffee, mocha, roasted,green
45 2-Isopropyl-3-methoxypyrazinec,d,g 1081 Garden peas, green,hazelnut
46 2,3-Diethyl-5-methylpyrazinec,d,g 113547 3,5(or 6)-Diethyl-2-methylpyrazinef,g 1137 Cocoa, chocolate, rum,
sweet, roasted48 3,5(or 6)-Diethyl-2-methylpyrazinef,g 113949 2,5(or 6)-Dimethyl-3-(2-methylpropyl)
pyrazineg1184 Hazelnut
50 2,5-Dimethyl-3-(3-methylbutyl)pyrazineg 1296 Roasted, sweet, greenPyridines
51 Pyridineg 72452 2-Methylpyridineg 80053 1-(2-Pyridinyl)-1-propanoneg 1114
Pyrroles54 2-Carboxaldehyde-1H-pyrroleg 98655 1-(1H-pyrrol-2-yl)ethanone
(acetylpyrrole)b,f,g1030 Cocoa, chocolate, hazelnut,
roasted56 3-Ethyl-2,5-dimethyl-1H-pyrroleg 1119 Cocoa, hazelnut, coffee,
roasted57 1-(2-Furanylmethyl)-1H-pyrrole
(furfurylpyrrole)g1166 Roasted, chocolate, green
58 1H-indoleg 1276
Sulphur compounds59 Dimethyl disulphideg 74360 Dimethyl trisulphidec,d,g 969 Onion, cabbage, sweaty
B. Acidic fractionsAlcohols
61 2,4-Hexadien-1-olg 831
Aldehydes7 3-Methylbutanalb–d,g 633 Chocolate (low intensity)8 2-Methylbutanalg 643 Chocolate (low intensity)
Furans23 Furfuryl alcohol (furfurol)b,e–g 82762 2,5-Dimethyl-4-hydroxy-3(2H)furanone
(Furaneol)c,d,g1023 Caramel-like, sweet
Hydrocarbons28 Methylbenzene (toluene)g 772
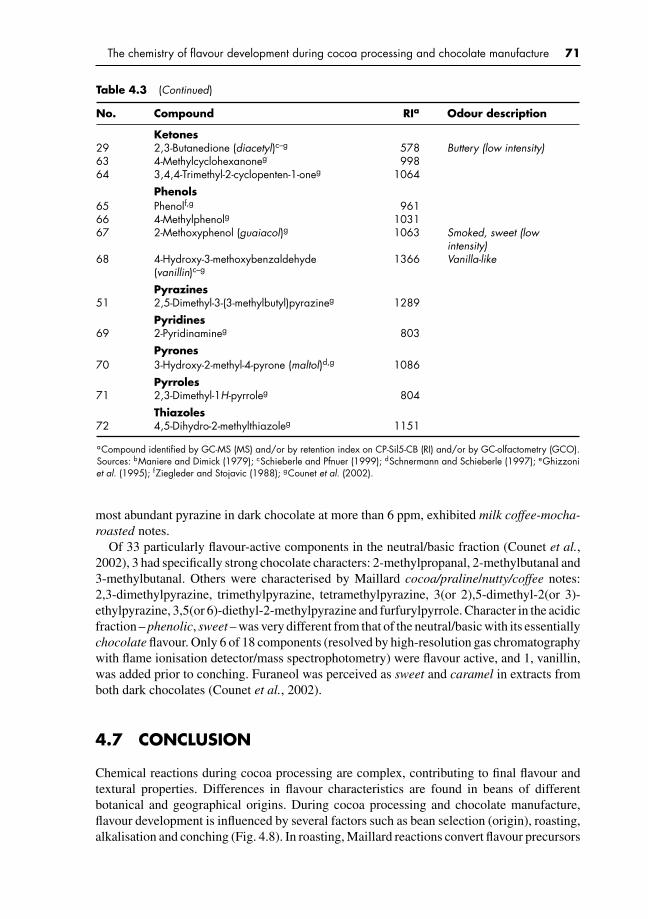
P1: KAE/UKS P2: KAEc04 BLBK244-Afoakwa January 25, 2010 16:10 Printer Name: Yet to Come
The chemistry of flavour development during cocoa processing and chocolate manufacture 71
Table 4.3 (Continued)
No. Compound RIa Odour description
Ketones29 2,3-Butanedione (diacetyl)c–g 578 Buttery (low intensity)63 4-Methylcyclohexanoneg 99864 3,4,4-Trimethyl-2-cyclopenten-1-oneg 1064
Phenols65 Phenolf,g 96166 4-Methylphenolg 103167 2-Methoxyphenol (guaiacol)g 1063 Smoked, sweet (low
intensity)68 4-Hydroxy-3-methoxybenzaldehyde
(vanillin)c–g1366 Vanilla-like
Pyrazines51 2,5-Dimethyl-3-(3-methylbutyl)pyrazineg 1289
Pyridines69 2-Pyridinamineg 803
Pyrones70 3-Hydroxy-2-methyl-4-pyrone (maltol)d,g 1086
Pyrroles71 2,3-Dimethyl-1H-pyrroleg 804
Thiazoles72 4,5-Dihydro-2-methylthiazoleg 1151
aCompound identified by GC-MS (MS) and/or by retention index on CP-Sil5-CB (RI) and/or by GC-olfactometry (GCO).Sources: bManiere and Dimick (1979); cSchieberle and Pfnuer (1999); dSchnermann and Schieberle (1997); eGhizzoniet al. (1995); fZiegleder and Stojavic (1988); gCounet et al. (2002).
most abundant pyrazine in dark chocolate at more than 6 ppm, exhibited milk coffee-mocha-roasted notes.
Of 33 particularly flavour-active components in the neutral/basic fraction (Counet et al.,2002), 3 had specifically strong chocolate characters: 2-methylpropanal, 2-methylbutanal and3-methylbutanal. Others were characterised by Maillard cocoa/praline/nutty/coffee notes:2,3-dimethylpyrazine, trimethylpyrazine, tetramethylpyrazine, 3(or 2),5-dimethyl-2(or 3)-ethylpyrazine, 3,5(or 6)-diethyl-2-methylpyrazine and furfurylpyrrole. Character in the acidicfraction – phenolic, sweet – was very different from that of the neutral/basic with its essentiallychocolate flavour. Only 6 of 18 components (resolved by high-resolution gas chromatographywith flame ionisation detector/mass spectrophotometry) were flavour active, and 1, vanillin,was added prior to conching. Furaneol was perceived as sweet and caramel in extracts fromboth dark chocolates (Counet et al., 2002).
4.7 CONCLUSION
Chemical reactions during cocoa processing are complex, contributing to final flavour andtextural properties. Differences in flavour characteristics are found in beans of differentbotanical and geographical origins. During cocoa processing and chocolate manufacture,flavour development is influenced by several factors such as bean selection (origin), roasting,alkalisation and conching (Fig. 4.8). In roasting, Maillard reactions convert flavour precursors
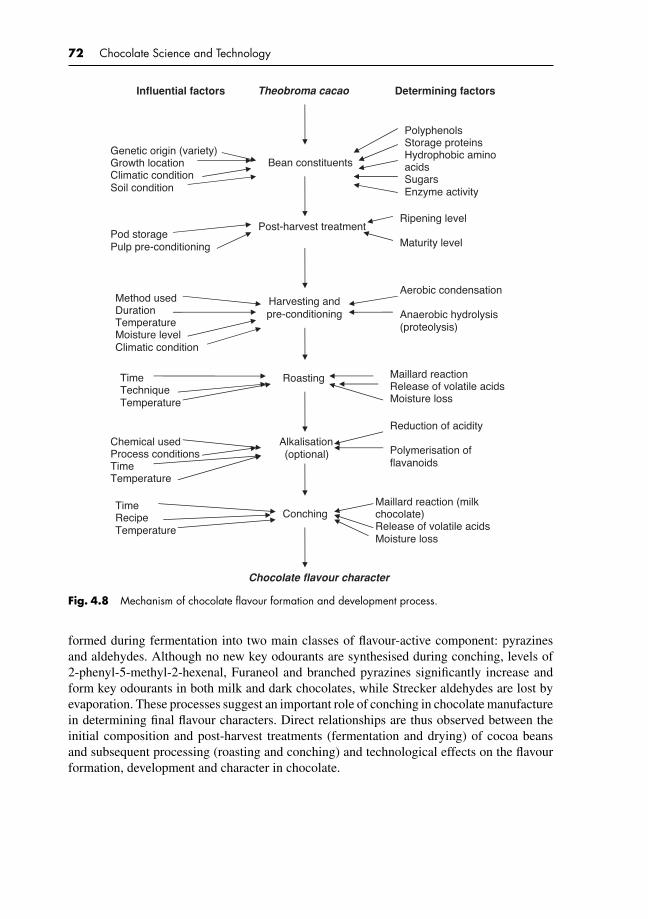
P1: KAE/UKS P2: KAEc04 BLBK244-Afoakwa January 25, 2010 16:10 Printer Name: Yet to Come
72 Chocolate Science and Technology
Theobroma cacao Influential factors Determining factors
Bean constituents
Polyphenols Storage proteins Hydrophobic amino acids Sugars Enzyme activity
Post-harvest treatment
Harvesting andpre-conditioning
Roasting
Alkalisation (optional)
Conching
Chocolate flavour character
Genetic origin (variety) Growth location Climatic condition Soil condition
Pod storage Pulp pre-conditioning
Aerobic condensation
Anaerobic hydrolysis (proteolysis)
Method used Duration Temperature Moisture level Climatic condition
Maillard reaction Release of volatile acids Moisture loss
Time Technique Temperature
Ripening level
Maturity level
Time Recipe Temperature
Maillard reaction (milk chocolate) Release of volatile acids Moisture loss
Chemical used Process conditions Time Temperature
Reduction of acidity
Polymerisation of flavanoids
Fig. 4.8 Mechanism of chocolate flavour formation and development process.
formed during fermentation into two main classes of flavour-active component: pyrazinesand aldehydes. Although no new key odourants are synthesised during conching, levels of2-phenyl-5-methyl-2-hexenal, Furaneol and branched pyrazines significantly increase andform key odourants in both milk and dark chocolates, while Strecker aldehydes are lost byevaporation. These processes suggest an important role of conching in chocolate manufacturein determining final flavour characters. Direct relationships are thus observed between theinitial composition and post-harvest treatments (fermentation and drying) of cocoa beansand subsequent processing (roasting and conching) and technological effects on the flavourformation, development and character in chocolate.
P1: KAE/UKS P2: KAEc05 BLBK244-Afoakwa January 5, 2010 7:43 Printer Name: Yet to Come
5 Sensory character and flavourperception of chocolates
5.1 SUMMARY AND INDUSTRIAL RELEVANCE
The perception of the sensory character of chocolate is related not only to its intrinsiccharacteristics but also to other parameters such as brand, origin, nutritional facts and price,and to factors connected with the consumer such as perceptive abilities, memory for foods andother psychological and social aspects. The mechanisms of sensory perception are not fullyelucidated and instrumental analysis cannot replace sensory for every purpose. Nevertheless,some interesting tools are continuously being developed that could be at least useful for foodcontrol and assessment of the specificity of chocolate products.
Chocolate flavour contains many distinct odourous compounds, which have been identifiedand quantified using orthonasal and retronasal techniques. The release of volatiles fromchocolate during consumption is influenced by several factors including mastication, mixingwith saliva and changes in temperature and pH. To gain an insight into the kinetics of volatilerelease, in vivo techniques have been developed, which are capable of monitoring real-timevolatile release. The mechanisms of flavour perception and release during mastication havebeen studied in many solid and semisolid food systems, and are becoming increasinglyunderstood. However, very little is known on the perceptions of sensory character andmechanisms of flavour release in chocolate systems. Furthermore, identification of newtechniques to track the release of flavour during chocolate consumption still remains a greatchallenge. Understanding the mechanisms by which the sensorial properties of chocolate areperceived during manufacture and consumption would help lead to product improvementwith enhanced palatability and healthier properties in chocolate confectionery, and will driveconsumer acceptance and preference.
5.2 INTRODUCTION
Chocolate has distinct set of sensory characteristics, which dictates its choice and accept-ability by consumers. It originates from flavour precursors present in cocoa beans, generatedduring post-harvest treatments and transformed into chocolate sensorial characters duringits manufacture. In addition to the inherent factors as mentioned, others including ingredientsused and the processing techniques also influence the sensory quality of finished chocolatessuch as appearance, taste, texture (hardness and mouthfeel) and flavour. However, flavour isthe most important sensory attribute of chocolates, as it is influenced by aroma, taste andtexture during consumption. In a more or less conscious way, chocolate consumers’ judge-ment is based on intrinsic quality attributes of products. Nowadays, chocolate is not a rare or
P1: KAE/UKS P2: KAEc05 BLBK244-Afoakwa January 5, 2010 7:43 Printer Name: Yet to Come
74 Chocolate Science and Technology
privileged product. Recognition of its values surely involves previous experience and futureexpectations carried by promotion or package. However, what makes it so desirable is theperception of its sensory quality.
Chocolate flavour is a complex combination of the olfactory, gustatory and trigeminalsensations perceived during consumption. Taylor and Roberts (2004) and Reineccius (2006)explained that the flavour of foods may be influenced by tactile, thermal, painful and/or ki-naesthetic effects. However, relating flavour release from foods to flavour release when eatingthese foods still remains a great challenge. Flavour perception in chocolate is not the simpleresult of taste and aroma stimuli, but it is essentially a multimodal phenomenon that includesperception of aroma, at the olfactory receptors and perception of taste at the taste buds onthe tongue. Other contributing factors include colour, appearance, sound, pain and heat at theinner surface of the mouth and mouthfeel (Taylor & Roberts, 2005). This perceptual dy-namism changes as the nature and the intensity of the stimuli change continuously duringchocolate consumption. Measurements of these changes with time are essential to the under-standing of the relationship between modalities and perception of chocolate flavour.
To elucidate this process, it is necessary to combine quantifications of the release ofvolatile compounds from the food matrix with sensory evaluation of the food product.As food is eaten, the release of the volatiles from the food is influenced by a numberof factors including mastication, mixing with saliva and changes in temperature and pH(Boland et al., 2006). Therefore, to gain an insight into the kinetics of volatile release, in vivotechniques have been developed, which are capable of monitoring real-time volatile release.Atmospheric pressure chemical ionisation mass spectrometry and proton transfer reactionmass spectrometry are most commonly used for this purpose. With these systems, part ofthe participant’s breath is continuously sampled, allowing for sensitive and fast monitoringof volatile release. Compounds responsible for flavour perception must be released from thefood matrix and then transported to the receptors. Flavour release from various food matricesincluding cheeses, yoghurts, gums, coffee, custard and cakes, and its subsequent delivery tothe olfactory and gustatory receptors has been the extensively researched using orthonasaland retronasal techniques (Delahunty et al., 1996; Buettner & Schieberle, 2000; Linforthet al., 2002; Decourcelle et al., 2004; de Wijk et al., 2006; Denker et al., 2006).
With the increasing advances in chocolate confectionery, many with low fat or lower sugarformulations than the traditional European or Continental recipes, it is becoming increasinglyimportant to understand the factors that affect the perception of sensory character in choco-lates, and how the flavour components are released from their matrices during consumption.Most detailed studies on flavour perception and release have been done on simple systems,and relatively very little is known on the perception and release of flavour from complexsystems such as chocolate. Hence, the mechanism of chocolate flavour perception and re-lease needs to be further elucidated. This chapter brings greater understanding of knowledgeregarding the sensory perception of character and quality in chocolates and explains themechanism of flavour release during consumption from different chocolate systems.
5.3 SENSORY PERCEPTION OF QUALITY IN CHOCOLATES
Chocolate quality is predominantly defined in terms of sensory characters, which is affectedby post-harvest treatment of cocoa (fermentation, drying), and manufacturing processes(roasting, refining, conching and tempering). In most cases, quality of chocolate is defined
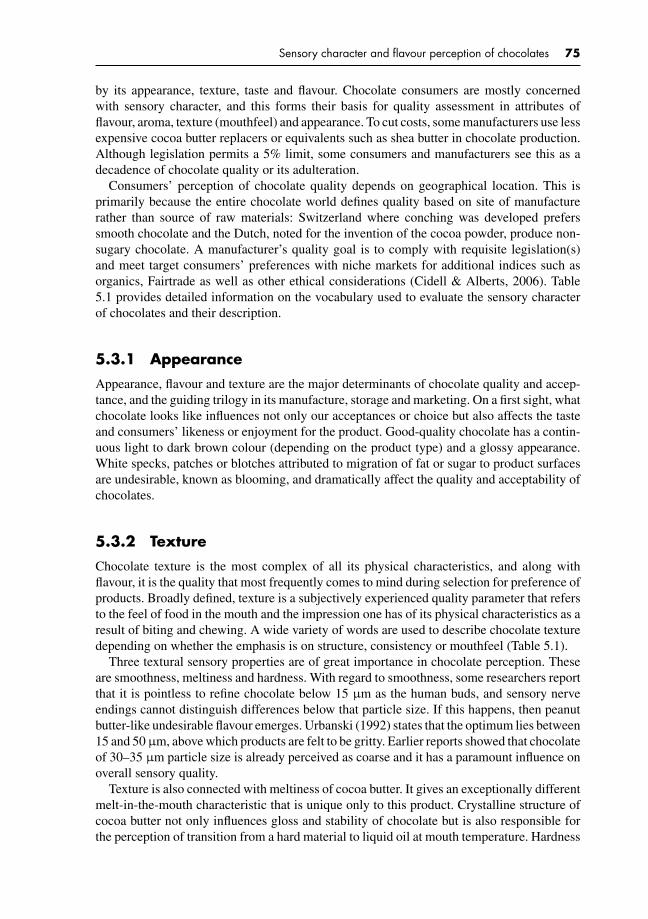
P1: KAE/UKS P2: KAEc05 BLBK244-Afoakwa January 5, 2010 7:43 Printer Name: Yet to Come
Sensory character and flavour perception of chocolates 75
by its appearance, texture, taste and flavour. Chocolate consumers are mostly concernedwith sensory character, and this forms their basis for quality assessment in attributes offlavour, aroma, texture (mouthfeel) and appearance. To cut costs, some manufacturers use lessexpensive cocoa butter replacers or equivalents such as shea butter in chocolate production.Although legislation permits a 5% limit, some consumers and manufacturers see this as adecadence of chocolate quality or its adulteration.
Consumers’ perception of chocolate quality depends on geographical location. This isprimarily because the entire chocolate world defines quality based on site of manufacturerather than source of raw materials: Switzerland where conching was developed preferssmooth chocolate and the Dutch, noted for the invention of the cocoa powder, produce non-sugary chocolate. A manufacturer’s quality goal is to comply with requisite legislation(s)and meet target consumers’ preferences with niche markets for additional indices such asorganics, Fairtrade as well as other ethical considerations (Cidell & Alberts, 2006). Table5.1 provides detailed information on the vocabulary used to evaluate the sensory characterof chocolates and their description.
5.3.1 Appearance
Appearance, flavour and texture are the major determinants of chocolate quality and accep-tance, and the guiding trilogy in its manufacture, storage and marketing. On a first sight, whatchocolate looks like influences not only our acceptances or choice but also affects the tasteand consumers’ likeness or enjoyment for the product. Good-quality chocolate has a contin-uous light to dark brown colour (depending on the product type) and a glossy appearance.White specks, patches or blotches attributed to migration of fat or sugar to product surfacesare undesirable, known as blooming, and dramatically affect the quality and acceptability ofchocolates.
5.3.2 Texture
Chocolate texture is the most complex of all its physical characteristics, and along withflavour, it is the quality that most frequently comes to mind during selection for preference ofproducts. Broadly defined, texture is a subjectively experienced quality parameter that refersto the feel of food in the mouth and the impression one has of its physical characteristics as aresult of biting and chewing. A wide variety of words are used to describe chocolate texturedepending on whether the emphasis is on structure, consistency or mouthfeel (Table 5.1).
Three textural sensory properties are of great importance in chocolate perception. Theseare smoothness, meltiness and hardness. With regard to smoothness, some researchers reportthat it is pointless to refine chocolate below 15 µm as the human buds, and sensory nerveendings cannot distinguish differences below that particle size. If this happens, then peanutbutter-like undesirable flavour emerges. Urbanski (1992) states that the optimum lies between15 and 50 µm, above which products are felt to be gritty. Earlier reports showed that chocolateof 30–35 µm particle size is already perceived as coarse and it has a paramount influence onoverall sensory quality.
Texture is also connected with meltiness of cocoa butter. It gives an exceptionally differentmelt-in-the-mouth characteristic that is unique only to this product. Crystalline structure ofcocoa butter not only influences gloss and stability of chocolate but is also responsible forthe perception of transition from a hard material to liquid oil at mouth temperature. Hardness

P1: KAE/UKS P2: KAEc05 BLBK244-Afoakwa January 5, 2010 7:43 Printer Name: Yet to Come
76 Chocolate Science and Technology
Table 5.1 The sensory vocabulary of chocolates and their descriptions
Word Description
AppearanceColour intensity This describes the intensity (tint) of typical chocolate colour with the use of
descriptions ranging from light brown to dark brown.
Colour brightness This is luminescence of colour, with descriptions ranging from dull to shiny.
Texture on surface Amount of regular cavities or holes on surface to bottom of chocolate, withdescriptions ranging from even to gritty.
Texture on snap Amount of irregular cavities or holes on the snap surface of chocolate, withdescriptions ranging from even to gritty.
Melting in hand The level of chocolate melting after 30 seconds of contact in the hand, withdescriptions from melted little to melted very much.
Flavour/aromaFruity/citrus/berry This is reminiscent of the odour and taste of fruits. The natural aroma of
berries is highly associated with this attribute. The perception of high acidityin some chocolates is correlated with citrus characteristic.
Floral/fragrant This is similar to the fragrance of flowers. It describes the flavour ofchocolates typical of Ecuadorian Arriba and attract premium prices on themarket. It is associated with the slight scent of different types of flowersincluding honeysuckle, jasmine, dandelion and nettles. It is mainly foundwhen an intense fruity or green aroma is perceived but rarely found havinga high intensity by itself in chocolates manufactured from West AfricanForastero cocoa.
Cereal/toasty/wheaty This describes flavour characteristic of cereal, malt and toast. It includesscents such as the aroma and flavour of uncooked or roasted grain(including roasted corn, barley or wheat), malt extract and the aroma andflavour of freshly baked bread and freshly made toast. This descriptor has acommon denominator, a grain-type flavour.
Malty An aromatic sensation created by a moderately volatile set of aldehydesand ketones that produce sensations, reminiscent of toasted grains. This issometimes noted in milk chocolates.
Green/grassy This flavour descriptor includes three terms, which are associated withodours, reminiscent of a freshly mowed lawn, fresh green grass or herbs,green foliage, green beans or unripe fruit.
Nutty/peanuts This flavour is reminiscent of the odour and flavour of fresh nuts (distinct fromrancid nuts) and not of bitter almonds. They are predominantly present inchocolates containing nuts (peanuts, almonds, etc.).
Almonds This flavour is reminiscent of the odour and flavour of fresh almond nuts witha sweet-scented undertone. It is sometimes noted in chocolates manufacturedusing almond nuts.
Caramel This flavour descriptor is reminiscent of the odour and flavour producedwhen caramelising sugar without burning it. It is present in most milkchocolates manufactured using the crumb process. Consumers arecautioned not to use this attribute to describe a burning note.
Chocolate/cocoa This descriptor is reminiscent of the aroma and flavour of cocoa powderand chocolate (including dark chocolate and milk chocolate). It is an aromathat is sometimes referred to as cocoa-like.
Sweet/candy An aromatic sensation created by a highly volatile set of aldehydes andesters that produce sweet fragrance sensations reminiscent of a flower. Theyare typically present in low-fat chocolates containing high sugar orsweetener levels.
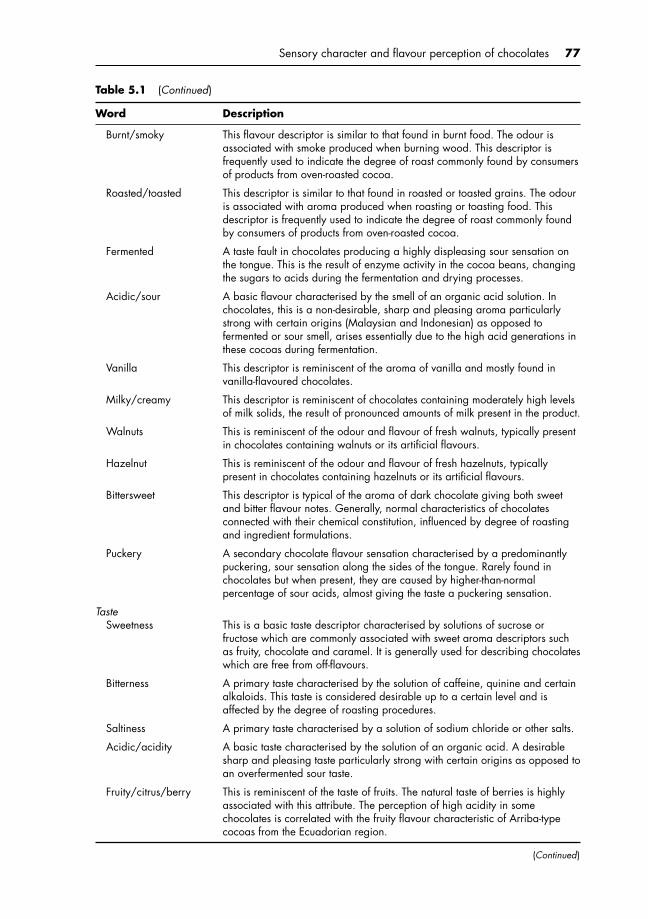
P1: KAE/UKS P2: KAEc05 BLBK244-Afoakwa January 5, 2010 7:43 Printer Name: Yet to Come
Sensory character and flavour perception of chocolates 77
Table 5.1 (Continued)
Word Description
Burnt/smoky This flavour descriptor is similar to that found in burnt food. The odour isassociated with smoke produced when burning wood. This descriptor isfrequently used to indicate the degree of roast commonly found by consumersof products from oven-roasted cocoa.
Roasted/toasted This descriptor is similar to that found in roasted or toasted grains. The odouris associated with aroma produced when roasting or toasting food. Thisdescriptor is frequently used to indicate the degree of roast commonly foundby consumers of products from oven-roasted cocoa.
Fermented A taste fault in chocolates producing a highly displeasing sour sensation onthe tongue. This is the result of enzyme activity in the cocoa beans, changingthe sugars to acids during the fermentation and drying processes.
Acidic/sour A basic flavour characterised by the smell of an organic acid solution. Inchocolates, this is a non-desirable, sharp and pleasing aroma particularlystrong with certain origins (Malaysian and Indonesian) as opposed tofermented or sour smell, arises essentially due to the high acid generations inthese cocoas during fermentation.
Vanilla This descriptor is reminiscent of the aroma of vanilla and mostly found invanilla-flavoured chocolates.
Milky/creamy This descriptor is reminiscent of chocolates containing moderately high levelsof milk solids, the result of pronounced amounts of milk present in the product.
Walnuts This is reminiscent of the odour and flavour of fresh walnuts, typically presentin chocolates containing walnuts or its artificial flavours.
Hazelnut This is reminiscent of the odour and flavour of fresh hazelnuts, typicallypresent in chocolates containing hazelnuts or its artificial flavours.
Bittersweet This descriptor is typical of the aroma of dark chocolate giving both sweetand bitter flavour notes. Generally, normal characteristics of chocolatesconnected with their chemical constitution, influenced by degree of roastingand ingredient formulations.
Puckery A secondary chocolate flavour sensation characterised by a predominantlypuckering, sour sensation along the sides of the tongue. Rarely found inchocolates but when present, they are caused by higher-than-normalpercentage of sour acids, almost giving the taste a puckering sensation.
TasteSweetness This is a basic taste descriptor characterised by solutions of sucrose or
fructose which are commonly associated with sweet aroma descriptors suchas fruity, chocolate and caramel. It is generally used for describing chocolateswhich are free from off-flavours.
Bitterness A primary taste characterised by the solution of caffeine, quinine and certainalkaloids. This taste is considered desirable up to a certain level and isaffected by the degree of roasting procedures.
Saltiness A primary taste characterised by a solution of sodium chloride or other salts.
Acidic/acidity A basic taste characterised by the solution of an organic acid. A desirablesharp and pleasing taste particularly strong with certain origins as opposed toan overfermented sour taste.
Fruity/citrus/berry This is reminiscent of the taste of fruits. The natural taste of berries is highlyassociated with this attribute. The perception of high acidity in somechocolates is correlated with the fruity flavour characteristic of Arriba-typecocoas from the Ecuadorian region.
(Continued)

P1: KAE/UKS P2: KAEc05 BLBK244-Afoakwa January 5, 2010 7:43 Printer Name: Yet to Come
78 Chocolate Science and Technology
Table 5.1 (Continued)
Word Description
MouthfeelSmooth This is the perception of fineness or consistency of chocolate during
mastication, and it is detected by rolling the sample between the tongue andthe palate. Descriptions used vary from very smooth to very gritty.
Gritty This is the perception of roughness of chocolate matrix due to detection ofsolid particles of sizes >35 µm by the tongue during mastication. Grittiness isnormally detected by rolling the sample between the tongue and the palate.Descriptions used vary from very gritty to very smooth.
Harsh/acrid Sensation at the same time bitter and astringent, raspy and disagreeable,particularly found in some poor-quality cocoa beans, often due to imperfectfermentation.
Astringency/acidic A basic taste characterised by the solution of an organic acid. A desirablesharp and pleasing taste particularly strong with certain origins as opposed toan overfermented sour taste.
AftertasteSweet This is a basic taste descriptor characterised by solutions of sucrose or
fructose which are commonly associated with sweet aroma descriptors suchas excessive sugary or fruity. Sweetness as aftertaste could often be detectedin low-sugar chocolates manufactured with sweeteners.
Bitter A primary taste characterised by the solution of caffeine, quinine and certainalkaloids. This taste is considered desirable up to a certain level and isaffected by the degree of roasting procedures.
Acidic/sour A basic taste characterised by the solution of an organic acid. A desirablesharp and pleasing taste particularly strong with certain cocoa origins asopposed to an overfermented sour taste.
Acrid A secondary chocolate taste sensation characterised by a predominantlypiercing sour sensation on the posterior sides of the tongue, caused byhigher-than-normal percentage of sour acids developed in the cocoa beansduring fermentation.
Burnt/smoky This taste descriptor is similar to that found in burnt food. It is associated withsmoke produced when burning wood. This descriptor is frequently used toindicate the degree of roast commonly found by consumers of overroastedchocolates.
Nutty A taste sensation created by a moderately volatile set of aldehydes andketones that produce sensations, reminiscent of roasted nuts. Characteristic ofchocolate products manufactured with additions of some nut to enhance theflavour.
Puckery A secondary sensation characterised by predominantly souring along thesides of the tongue, caused by higher-than-normal percentage of sour acids,giving the taste a puckering sensation.
Astringent A secondary taste descriptor characterised by predominantly searing, saltysensation on the anterior sides of the tongue. In chocolates, astringency isidentified with undesirable acidity generation during cocoa fermentation anddrying.
Bittersweet This taste descriptor is typical of the flavour of dark chocolate, giving bothsweet and bitter flavour notes. Generally, normal characteristics of chocolateconnected with their chemical constitution, influenced by degree of roastingand the method of processing.
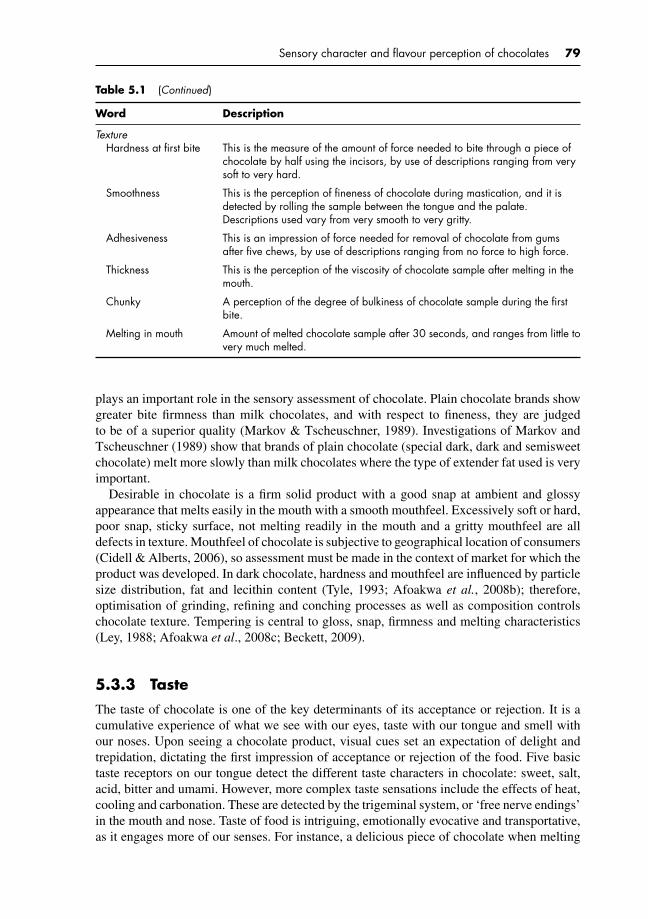
P1: KAE/UKS P2: KAEc05 BLBK244-Afoakwa January 5, 2010 7:43 Printer Name: Yet to Come
Sensory character and flavour perception of chocolates 79
Table 5.1 (Continued)
Word Description
TextureHardness at first bite This is the measure of the amount of force needed to bite through a piece of
chocolate by half using the incisors, by use of descriptions ranging from verysoft to very hard.
Smoothness This is the perception of fineness of chocolate during mastication, and it isdetected by rolling the sample between the tongue and the palate.Descriptions used vary from very smooth to very gritty.
Adhesiveness This is an impression of force needed for removal of chocolate from gumsafter five chews, by use of descriptions ranging from no force to high force.
Thickness This is the perception of the viscosity of chocolate sample after melting in themouth.
Chunky A perception of the degree of bulkiness of chocolate sample during the firstbite.
Melting in mouth Amount of melted chocolate sample after 30 seconds, and ranges from little tovery much melted.
plays an important role in the sensory assessment of chocolate. Plain chocolate brands showgreater bite firmness than milk chocolates, and with respect to fineness, they are judgedto be of a superior quality (Markov & Tscheuschner, 1989). Investigations of Markov andTscheuschner (1989) show that brands of plain chocolate (special dark, dark and semisweetchocolate) melt more slowly than milk chocolates where the type of extender fat used is veryimportant.
Desirable in chocolate is a firm solid product with a good snap at ambient and glossyappearance that melts easily in the mouth with a smooth mouthfeel. Excessively soft or hard,poor snap, sticky surface, not melting readily in the mouth and a gritty mouthfeel are alldefects in texture. Mouthfeel of chocolate is subjective to geographical location of consumers(Cidell & Alberts, 2006), so assessment must be made in the context of market for which theproduct was developed. In dark chocolate, hardness and mouthfeel are influenced by particlesize distribution, fat and lecithin content (Tyle, 1993; Afoakwa et al., 2008b); therefore,optimisation of grinding, refining and conching processes as well as composition controlschocolate texture. Tempering is central to gloss, snap, firmness and melting characteristics(Ley, 1988; Afoakwa et al., 2008c; Beckett, 2009).
5.3.3 Taste
The taste of chocolate is one of the key determinants of its acceptance or rejection. It is acumulative experience of what we see with our eyes, taste with our tongue and smell withour noses. Upon seeing a chocolate product, visual cues set an expectation of delight andtrepidation, dictating the first impression of acceptance or rejection of the food. Five basictaste receptors on our tongue detect the different taste characters in chocolate: sweet, salt,acid, bitter and umami. However, more complex taste sensations include the effects of heat,cooling and carbonation. These are detected by the trigeminal system, or ‘free nerve endings’in the mouth and nose. Taste of food is intriguing, emotionally evocative and transportative,as it engages more of our senses. For instance, a delicious piece of chocolate when melting
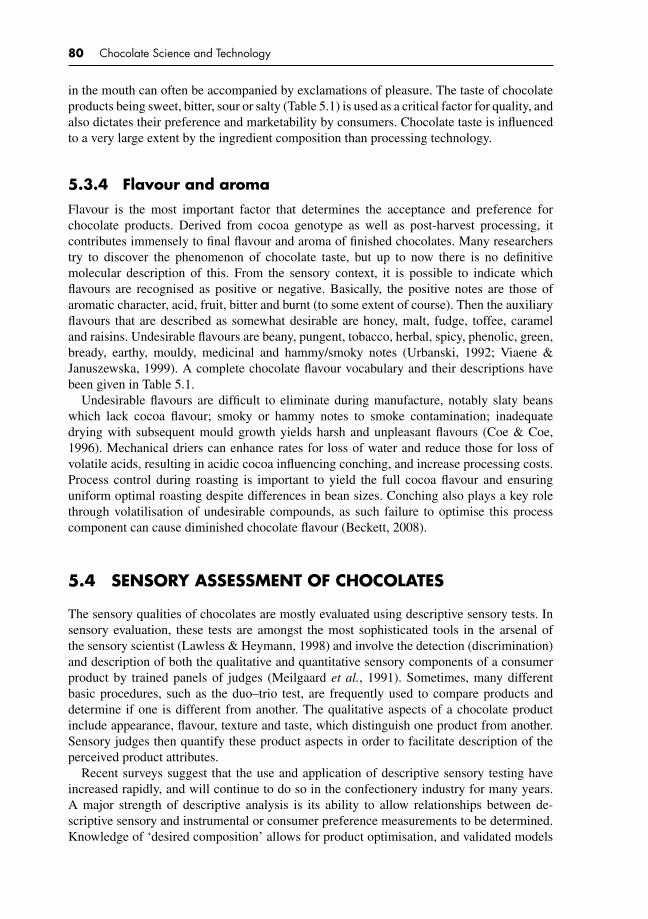
P1: KAE/UKS P2: KAEc05 BLBK244-Afoakwa January 5, 2010 7:43 Printer Name: Yet to Come
80 Chocolate Science and Technology
in the mouth can often be accompanied by exclamations of pleasure. The taste of chocolateproducts being sweet, bitter, sour or salty (Table 5.1) is used as a critical factor for quality, andalso dictates their preference and marketability by consumers. Chocolate taste is influencedto a very large extent by the ingredient composition than processing technology.
5.3.4 Flavour and aroma
Flavour is the most important factor that determines the acceptance and preference forchocolate products. Derived from cocoa genotype as well as post-harvest processing, itcontributes immensely to final flavour and aroma of finished chocolates. Many researcherstry to discover the phenomenon of chocolate taste, but up to now there is no definitivemolecular description of this. From the sensory context, it is possible to indicate whichflavours are recognised as positive or negative. Basically, the positive notes are those ofaromatic character, acid, fruit, bitter and burnt (to some extent of course). Then the auxiliaryflavours that are described as somewhat desirable are honey, malt, fudge, toffee, carameland raisins. Undesirable flavours are beany, pungent, tobacco, herbal, spicy, phenolic, green,bready, earthy, mouldy, medicinal and hammy/smoky notes (Urbanski, 1992; Viaene &Januszewska, 1999). A complete chocolate flavour vocabulary and their descriptions havebeen given in Table 5.1.
Undesirable flavours are difficult to eliminate during manufacture, notably slaty beanswhich lack cocoa flavour; smoky or hammy notes to smoke contamination; inadequatedrying with subsequent mould growth yields harsh and unpleasant flavours (Coe & Coe,1996). Mechanical driers can enhance rates for loss of water and reduce those for loss ofvolatile acids, resulting in acidic cocoa influencing conching, and increase processing costs.Process control during roasting is important to yield the full cocoa flavour and ensuringuniform optimal roasting despite differences in bean sizes. Conching also plays a key rolethrough volatilisation of undesirable compounds, as such failure to optimise this processcomponent can cause diminished chocolate flavour (Beckett, 2008).
5.4 SENSORY ASSESSMENT OF CHOCOLATES
The sensory qualities of chocolates are mostly evaluated using descriptive sensory tests. Insensory evaluation, these tests are amongst the most sophisticated tools in the arsenal ofthe sensory scientist (Lawless & Heymann, 1998) and involve the detection (discrimination)and description of both the qualitative and quantitative sensory components of a consumerproduct by trained panels of judges (Meilgaard et al., 1991). Sometimes, many differentbasic procedures, such as the duo–trio test, are frequently used to compare products anddetermine if one is different from another. The qualitative aspects of a chocolate productinclude appearance, flavour, texture and taste, which distinguish one product from another.Sensory judges then quantify these product aspects in order to facilitate description of theperceived product attributes.
Recent surveys suggest that the use and application of descriptive sensory testing haveincreased rapidly, and will continue to do so in the confectionery industry for many years.A major strength of descriptive analysis is its ability to allow relationships between de-scriptive sensory and instrumental or consumer preference measurements to be determined.Knowledge of ‘desired composition’ allows for product optimisation, and validated models

P1: KAE/UKS P2: KAEc05 BLBK244-Afoakwa January 5, 2010 7:43 Printer Name: Yet to Come
Sensory character and flavour perception of chocolates 81
between descriptive sensory and the relevant instrumental and/or preference measures arehighly desirable and are increasingly being utilised within the confectionery industry.
Descriptive sensory analyses are also used for quality control, for the comparison of productprototypes to understand consumer responses in relation to products’ sensory attributes, andfor sensory mapping and product matching (Gacula, 1997). It may also be used to trackproduct changes over time with respect to understanding shelf-life and packaging effects, toinvestigate the effects of ingredients or processing variables on the final sensory quality of aproduct, and to investigate consumers’ perceptions of products (e.g. free-choice profiling).
There are several different methods of descriptive analysis that could be used to evaluatevarious sensory qualities of chocolate, including the flavour profile method, texture profilemethod, descriptive analysis, the spectrum method, quantitative flavour profiling, free-choiceprofiling and generic descriptive analysis. The specific methods reflect various sensoryphilosophies and approaches (Lawless & Heymann, 1998); however, generic descriptiveanalysis, which can combine different approaches from all these methods, is frequentlyemployed during practical applications in order to meet specific project objectives.
Free-choice profiling might be an alternative because it is more rapid (assessors use theirown descriptors), but direct comparisons of products are sometimes difficult.
5.5 FACTOR INFLUENCING CHOCOLATE FLAVOUR
The flavour of chocolate is made up of many odorous compounds – at least 800 of these havebeen identified chemically and probably many remain to be discovered (Counet et al., 2004;Taylor, 2004; Reineccius, 2006; Afoakwa et al., 2009b). In sensory terms, there are severalqualities which are required in a good chocolate and which can be affected by processing.There is no accepted international list of terms for describing the taste of chocolate, but someof the more common ones, together with the processes which control them, are given in Figure5.1. The flavour of a chocolate will obviously depend on the ingredients from which it is made.
Plain chocolate containing more of the same cocoa will have a richer cocoa taste; however,by changing the roast and/or the particle size distribution, it is possible to obtain a strongercocoa flavour with less cocoa present (Voltz & Beckett, 1997). Particle size distribution issuspected to play a large role in determining chocolate flavour release. This hypothesis hasbeen studied and would be discussed in detail in Chapter 11. The changing matrix fromvarying particle size distribution can be illustrated by grinding the same chocolate to adifferent fineness and carrying out taste tests. This is probably because the grinding changedthe surface area of the different components; for example, initially the cocoa will have amuch bigger surface area than the sugar (because the sugar has been pre-ground), but as thechocolate becomes finer the two will become more nearly equal. In addition, the viscosity isaffected, which changes the residence time of the particles in the mouth. Both these factorswill alter the probability of a particle touching one of the flavour receptors and hence wouldaffect the flavour release.
In most chocolates, there is a balance between the cocoa and milk flavours. A harsh cocoahides the milky creamy flavours, but once the cocoa intensity is reduced, the creaminess comesto the fore. Thus, milkiness depends strongly on the non-fat milk solids and the form in whichthey are incorporated into the chocolate. As well as noting the similarity in composition ofthe chocolate, Jackson (1999) noted the wide diversity of chocolate flavours in the market.Perhaps the most distinctive ‘house’ flavours are those of Hershey and Cadbury. In both cases
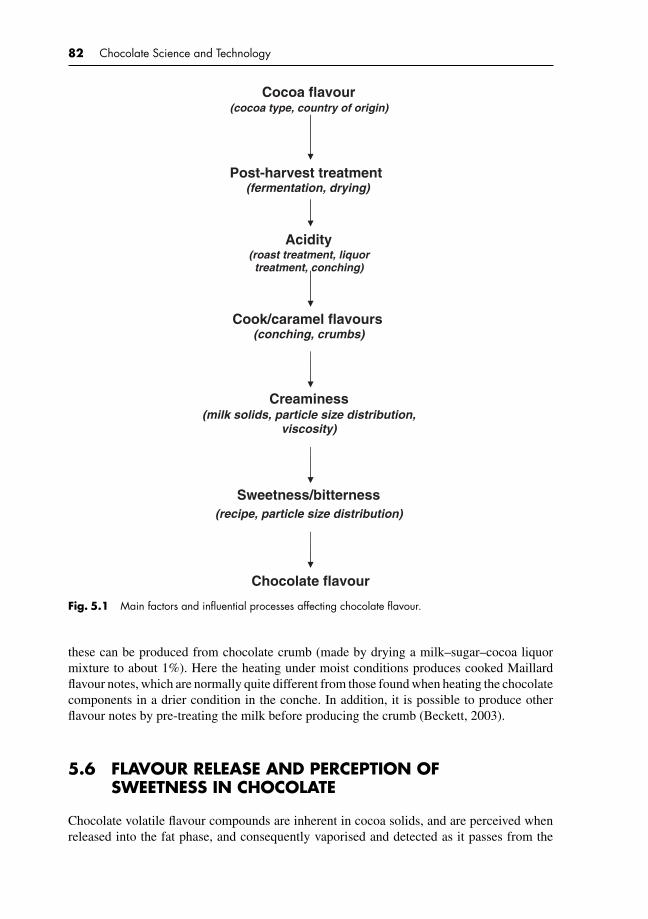
P1: KAE/UKS P2: KAEc05 BLBK244-Afoakwa January 5, 2010 7:43 Printer Name: Yet to Come
82 Chocolate Science and Technology
Cocoa flavour
Cook/caramel flavours
Sweetness/bitterness
Chocolate flavour
(cocoa type, country of origin)
(conching, crumbs)
(milk solids, particle size distribution, viscosity)
(recipe, particle size distribution)
(roast treatment, liquor treatment, conching)
Post-harvest treatment (fermentation, drying)
Acidity
Creaminess
Fig. 5.1 Main factors and influential processes affecting chocolate flavour.
these can be produced from chocolate crumb (made by drying a milk–sugar–cocoa liquormixture to about 1%). Here the heating under moist conditions produces cooked Maillardflavour notes, which are normally quite different from those found when heating the chocolatecomponents in a drier condition in the conche. In addition, it is possible to produce otherflavour notes by pre-treating the milk before producing the crumb (Beckett, 2003).
5.6 FLAVOUR RELEASE AND PERCEPTION OFSWEETNESS IN CHOCOLATE
Chocolate volatile flavour compounds are inherent in cocoa solids, and are perceived whenreleased into the fat phase, and consequently vaporised and detected as it passes from the

P1: KAE/UKS P2: KAEc05 BLBK244-Afoakwa January 5, 2010 7:43 Printer Name: Yet to Come
Sensory character and flavour perception of chocolates 83
Diffusion
Cocoa solids
Fat phase
Buccal cavity
Gustatory–olfactory space
Receptors
Particle size effect
Fat content effect
Mastication andSwallowing
Gradient at perception interface
Diffusion
Diffusion
Airflow
Fig. 5.2 A model for volatile flavour release and perception in chocolate.
gustatory to the olfactory space during mastication. Its rate of release and concentration is thusmodulated by its concentration in cocoa solids and the particle’s surface area. Additionally,the release of chocolate flavour depends on the speed with which the flavour componentsreach the different receptors in the mouth and nose, which in turn depends on the viscosityof the chocolate and how it melts. This means that the flavour of chocolates with the samecomposition can vary if they flow differently. The perceived flavour characteristics are due toa combination of the taste, imparted by the non-volatile components, and the smell, impartedby the volatile components during consumption (Beckett, 2003).
The concentration of volatile compounds in the gustatory–olfactory space possibly affectsthe rapidity of saturation of mucosal fluids (that bathe the olfactory sensors) due to the highconcentration gradient between the gaseous and liquid phases at perception, consequentlyeliciting a strong intensity for the perceived flavour/aroma. Thus, flavour volatiles that arereleased saturate the gustatory–olfactory space faster, eliciting a response of higher intensity,than volatiles that slowly saturate the space. This concept explains the effect of particle sizevariations on volatile flavour release and perception (Fig. 5.2).
Similar explanation can be made for non-volatile flavour aspects in cocoa solids such asbitterness, except that they are detected on the surface of the tongue after direct diffusioninto saliva during mastication, as opposed to the volatiles that undergo a two-phase transitiondriven by increasing concentration gradient till it diffuses into fluid surrounding the olfactoryreceptors where it is detected.
Sweetness relates to solubilisation of the entire sugar crystal unlike bitterness, a componentof cocoa solid amongst other volatile and non-volatiles. As such, large sugar crystals witha greater number of sugar molecules (high concentration) will elicit greater intensity ofsweetness per unit area of the tongue than smaller crystal with lower number of sugar
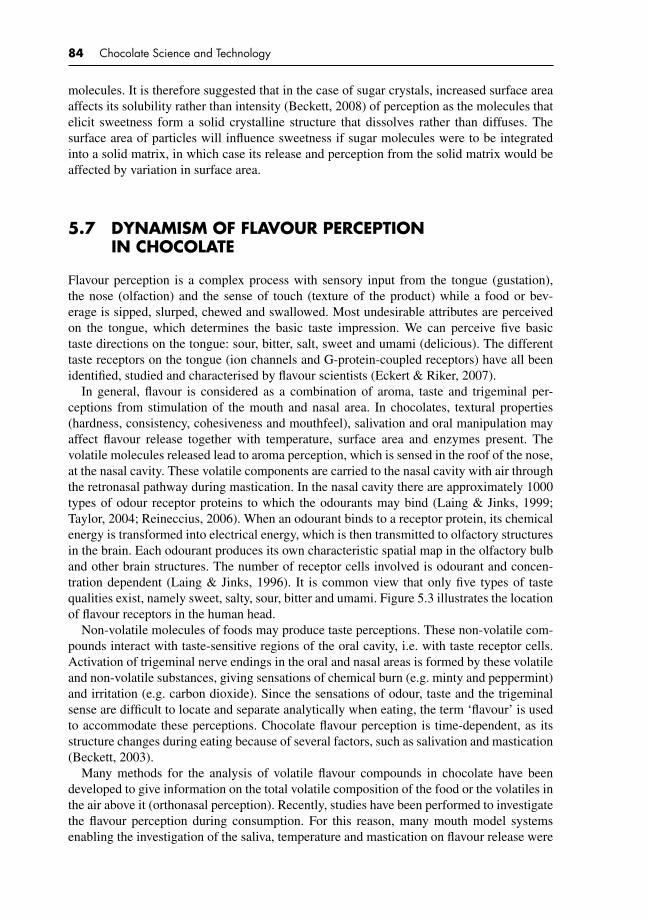
P1: KAE/UKS P2: KAEc05 BLBK244-Afoakwa January 5, 2010 7:43 Printer Name: Yet to Come
84 Chocolate Science and Technology
molecules. It is therefore suggested that in the case of sugar crystals, increased surface areaaffects its solubility rather than intensity (Beckett, 2008) of perception as the molecules thatelicit sweetness form a solid crystalline structure that dissolves rather than diffuses. Thesurface area of particles will influence sweetness if sugar molecules were to be integratedinto a solid matrix, in which case its release and perception from the solid matrix would beaffected by variation in surface area.
5.7 DYNAMISM OF FLAVOUR PERCEPTIONIN CHOCOLATE
Flavour perception is a complex process with sensory input from the tongue (gustation),the nose (olfaction) and the sense of touch (texture of the product) while a food or bev-erage is sipped, slurped, chewed and swallowed. Most undesirable attributes are perceivedon the tongue, which determines the basic taste impression. We can perceive five basictaste directions on the tongue: sour, bitter, salt, sweet and umami (delicious). The differenttaste receptors on the tongue (ion channels and G-protein-coupled receptors) have all beenidentified, studied and characterised by flavour scientists (Eckert & Riker, 2007).
In general, flavour is considered as a combination of aroma, taste and trigeminal per-ceptions from stimulation of the mouth and nasal area. In chocolates, textural properties(hardness, consistency, cohesiveness and mouthfeel), salivation and oral manipulation mayaffect flavour release together with temperature, surface area and enzymes present. Thevolatile molecules released lead to aroma perception, which is sensed in the roof of the nose,at the nasal cavity. These volatile components are carried to the nasal cavity with air throughthe retronasal pathway during mastication. In the nasal cavity there are approximately 1000types of odour receptor proteins to which the odourants may bind (Laing & Jinks, 1999;Taylor, 2004; Reineccius, 2006). When an odourant binds to a receptor protein, its chemicalenergy is transformed into electrical energy, which is then transmitted to olfactory structuresin the brain. Each odourant produces its own characteristic spatial map in the olfactory bulband other brain structures. The number of receptor cells involved is odourant and concen-tration dependent (Laing & Jinks, 1996). It is common view that only five types of tastequalities exist, namely sweet, salty, sour, bitter and umami. Figure 5.3 illustrates the locationof flavour receptors in the human head.
Non-volatile molecules of foods may produce taste perceptions. These non-volatile com-pounds interact with taste-sensitive regions of the oral cavity, i.e. with taste receptor cells.Activation of trigeminal nerve endings in the oral and nasal areas is formed by these volatileand non-volatile substances, giving sensations of chemical burn (e.g. minty and peppermint)and irritation (e.g. carbon dioxide). Since the sensations of odour, taste and the trigeminalsense are difficult to locate and separate analytically when eating, the term ‘flavour’ is usedto accommodate these perceptions. Chocolate flavour perception is time-dependent, as itsstructure changes during eating because of several factors, such as salivation and mastication(Beckett, 2003).
Many methods for the analysis of volatile flavour compounds in chocolate have beendeveloped to give information on the total volatile composition of the food or the volatiles inthe air above it (orthonasal perception). Recently, studies have been performed to investigatethe flavour perception during consumption. For this reason, many mouth model systemsenabling the investigation of the saliva, temperature and mastication on flavour release were
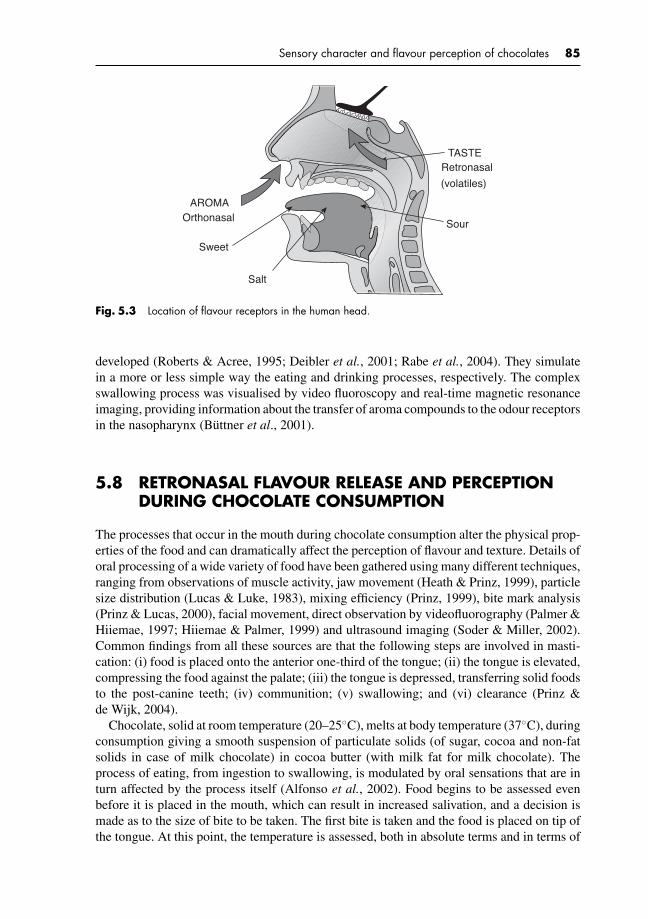
P1: KAE/UKS P2: KAEc05 BLBK244-Afoakwa January 5, 2010 7:43 Printer Name: Yet to Come
Sensory character and flavour perception of chocolates 85
Sour
(volatiles)
AROMAOrthonasal
Sweet
Salt
TASTERetronasal
Fig. 5.3 Location of flavour receptors in the human head.
developed (Roberts & Acree, 1995; Deibler et al., 2001; Rabe et al., 2004). They simulatein a more or less simple way the eating and drinking processes, respectively. The complexswallowing process was visualised by video fluoroscopy and real-time magnetic resonanceimaging, providing information about the transfer of aroma compounds to the odour receptorsin the nasopharynx (Buttner et al., 2001).
5.8 RETRONASAL FLAVOUR RELEASE AND PERCEPTIONDURING CHOCOLATE CONSUMPTION
The processes that occur in the mouth during chocolate consumption alter the physical prop-erties of the food and can dramatically affect the perception of flavour and texture. Details oforal processing of a wide variety of food have been gathered using many different techniques,ranging from observations of muscle activity, jaw movement (Heath & Prinz, 1999), particlesize distribution (Lucas & Luke, 1983), mixing efficiency (Prinz, 1999), bite mark analysis(Prinz & Lucas, 2000), facial movement, direct observation by videofluorography (Palmer &Hiiemae, 1997; Hiiemae & Palmer, 1999) and ultrasound imaging (Soder & Miller, 2002).Common findings from all these sources are that the following steps are involved in masti-cation: (i) food is placed onto the anterior one-third of the tongue; (ii) the tongue is elevated,compressing the food against the palate; (iii) the tongue is depressed, transferring solid foodsto the post-canine teeth; (iv) communition; (v) swallowing; and (vi) clearance (Prinz &de Wijk, 2004).
Chocolate, solid at room temperature (20–25◦C), melts at body temperature (37◦C), duringconsumption giving a smooth suspension of particulate solids (of sugar, cocoa and non-fatsolids in case of milk chocolate) in cocoa butter (with milk fat for milk chocolate). Theprocess of eating, from ingestion to swallowing, is modulated by oral sensations that are inturn affected by the process itself (Alfonso et al., 2002). Food begins to be assessed evenbefore it is placed in the mouth, which can result in increased salivation, and a decision ismade as to the size of bite to be taken. The first bite is taken and the food is placed on tip ofthe tongue. At this point, the temperature is assessed, both in absolute terms and in terms of

P1: KAE/UKS P2: KAEc05 BLBK244-Afoakwa January 5, 2010 7:43 Printer Name: Yet to Come
86 Chocolate Science and Technology
its rate of heating or cooling, which in turn allows the fat content of the food to be assessed(Prinz & de Wijk, 2004).
In the interval between the chocolate entering the mouth and being swallowed, its tem-perature equilibrates to mouth temperature, it is mixed with saliva allowing the varioussalivary enzymes to exert their effects, and the solids are melted into semiliquids, which maythen undergo shear-thinning. As the chocolate melts, the continuous fat phase goes throughan inversion to a continuous water phase and mixes with saliva, which acts as solvent forthe sugar particles and coats all particle surfaces to facilitate swallowing. Suspended par-ticles, with the exception of cocoa, are dissolved in the mouth at a rate corresponding totheir size and work input in the form of mastication, tongue compression and swallowing(Lee & Pangborn, 1986), and the rate of dissolution of particles can influence the perceptionof flavour (Martin, 1987). Fragmentation of the solid particles during melting increases thesurface area that is exposed to the saliva, thus increasing the rate at which taste compoundscan dissolve into the saliva and from there be transported to the taste receptors. The in-crease in surface area and the warming of the particulate components facilitate the releaseof volatiles, giving rise to enhanced flavour sensations (Engelen et al., 2003). Furthermore,aerosols may form as the tongue is removed from the palate, again intensifying flavourrelease.
While the tongue is in contact with the palate, the food is subjected to high shear forces,which not only lead to shear-thinning of the stimulus but can also result in coalescence of fatdroplets, wetting the mucosal surface with oil, increasing the surface area available for volatil-isation and allowing more intimate contact between the oil and the taste receptors (Prinz &de Wijk, 2004). All these effects combine to enhance the flavour perception and releaseduring chocolate consumption. Changes in particle size distribution are therefore expectedto affect the rate and magnitude of taste and flavour attributes associated with the particulatecomponents. Prinz and de Wijk (2004) noted that in solid foods, the particle size distributionresulting from fragmentation through chewing and the resulting production of new surfacearea can be quantified (Liedberg & Owall, 1995; Prinz & Lucas, 1997). In the same way thatthe oral behaviours described above can increase the intensity of oral sensations, the intensityof orthonasal olfaction can be increased by sniffing. This increases the volume of air passingover the olfactory epithelium and induces turbulence in the airflow, which facilitates masstransfer (Laing, 1983). Holding the head downwards can further enhance retronasal olfactionby allowing the ovula to come forwards, facilitating the flow of aromas from the mouth tothe nose (Zafar et al., 2000; Matsubara et al., 2002; Prinz & de Wijk, 2004). The temporalaspects of flavour release and its effect on perception have been studied in chewing gum(Neyraud et al., 2003).
The ease with which chocolate can be melted and manipulated in the mouth dependson the properties of the suspension. Chocolates with high viscosity are known to havea pasty mouthfeel and persist for a longer time in the mouth (Afoakwa et al., 2008d).Viscosity of chocolates can vary for the same composition due to differences in their particlesize distribution. The modification of apparent viscosity in aqueous solutions is known toaffect the perception of aroma, flavour by mouth and taste intensity during consumption(Denker et al., 2006). Viscosity, in itself, is an important descriptive sensory attribute of fluidand semisolid foods. Procedures for the determination of chocolate viscosity emphasise itsinherent nature. The dynamic behaviour of perceived sensory attributes in combination withthe effect of melting on taste and flavour in chocolates has been investigated using retronasalflavour release and time–intensity (TI) methods (Daget & Vallis, 1994; Janestad et al., 2000;Ziegler et al., 2001).
P1: KAE/UKS P2: KAEc05 BLBK244-Afoakwa January 5, 2010 7:43 Printer Name: Yet to Come
Sensory character and flavour perception of chocolates 87
5.9 MEASUREMENT OF FLAVOUR RELEASE ANDINTENSITY IN CHOCOLATES
Chocolate exhibits the unique property of melting from a solid state at room temperature to asmooth dense suspension in the mouth at body temperature. The melting of chocolate in themouth is defined by the characteristics of the lipid phase (Beckett, 2003) and facilitates theperception of its characteristic taste, flavour and textural attributes. The intensity of perceivedflavour changes dynamically over time as the chocolate is melted, manipulated and mixedwith saliva for swallowing (Lee & Pangborn, 1986).
Traditionally, the sensory attributes of milk chocolate have been measured as single-pointvalues using quantitative descriptive methods (Burger, 1992). Attributes that are typical ofand contribute to the flavour of milk chocolate have been measured using trained panelists toassess the changes in chocolate quality due to process and composition (Aguilar & Ziegler,1995). These methods, however, provide only a single facet of information about the sample.Information such as the rate at which an attribute is perceived to its maximum intensity orthe duration for which an attribute is perceived can be equally important in forming a basisof differentiation between samples. Such information can be obtained through the use of TIanalysis (Noble et al., 1991).
Time–intensity techniques provide a visual relationship between the perceived strength ofa single attribute and the duration of its perception (Burger, 1992). In addition to providinginformation regarding the intensity perception of the attribute, this technique allows forcomparison of samples on the basis of rate parameters and it can be used to differentiatebetween samples that might show similar responses on a descriptive scale (Lundahl, 1992;Guinard et al., 2002; Ovejero-Lopez et al., 2005). Time–intensity measurements allow forestablishing a pattern of development and decline of a particular sensory characteristic understudy. The methodology offers dynamic, time-related data, which is consistent with thecontinuous changes in the sensory perception. The dynamic response to the stimulus by thejudges results in TI curves. A TI curve is shown in Figure 5.4. Time–intensity curvesare interpreted in terms of a number of parameters. These parameters can be representativeof the time (e.g. time to maximum intensity), intensity (e.g. maximum intensity of theattribute), rate (e.g. rate of increase to maximum intensity) or the magnitude of perceivedstimulation (e.g. area under the curve).
Regarding the analysis of TI data, important progress was made in 1986, when Over-bosch and others introduced a method to average curves creating a common intensity rangefor the TI curves (Overbosch et al., 1986). They focused on three main parameters: themaximum perceived intensity (Imax), the time of maximum perceived intensity (Tmax) andthe time after which the flavour is no longer perceived. Later, MacFie and Liu (1992) de-veloped a method based on a different order of averaging variables in two-dimensionalcurves. They basically normalised in the intensity and time dimensions to yield improvementin the precision of the average curves, using the same set of data (Ovejero-Lopez et al.,2005).
A number of parameters can be extracted from TI curves (Lee & Pangborn, 1986). Ap-plications of computers in sensory science now allow for as many as 13 parameters fromone such curve (Noble et al., 1991). The parameters have usually been calculated froma curve obtained by averaging the curves of individual panellists. Simple averaging ofthe curves, however, does not always represent the data accurately (Dijksterhuis & Eilers,1997).
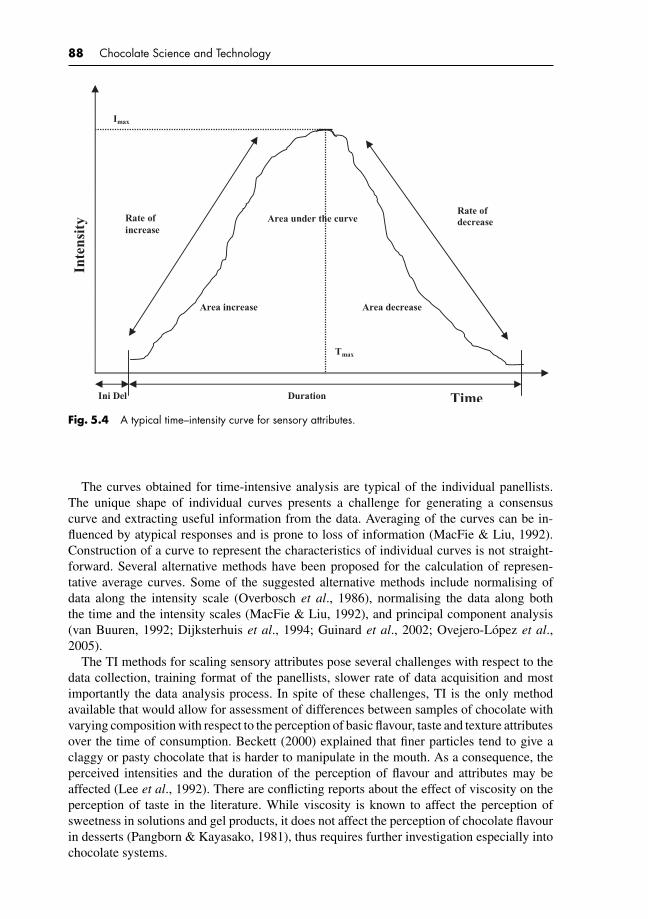
P1: KAE/UKS P2: KAEc05 BLBK244-Afoakwa January 5, 2010 7:43 Printer Name: Yet to Come
88 Chocolate Science and Technology
Inte
nsit
y
Rate of decrease Rate of
increase
Tmax
Area under the curve
Area decrease Area increase
Duration TimeIni Del
Imax
Fig. 5.4 A typical time–intensity curve for sensory attributes.
The curves obtained for time-intensive analysis are typical of the individual panellists.The unique shape of individual curves presents a challenge for generating a consensuscurve and extracting useful information from the data. Averaging of the curves can be in-fluenced by atypical responses and is prone to loss of information (MacFie & Liu, 1992).Construction of a curve to represent the characteristics of individual curves is not straight-forward. Several alternative methods have been proposed for the calculation of represen-tative average curves. Some of the suggested alternative methods include normalising ofdata along the intensity scale (Overbosch et al., 1986), normalising the data along boththe time and the intensity scales (MacFie & Liu, 1992), and principal component analysis(van Buuren, 1992; Dijksterhuis et al., 1994; Guinard et al., 2002; Ovejero-Lopez et al.,2005).
The TI methods for scaling sensory attributes pose several challenges with respect to thedata collection, training format of the panellists, slower rate of data acquisition and mostimportantly the data analysis process. In spite of these challenges, TI is the only methodavailable that would allow for assessment of differences between samples of chocolate withvarying composition with respect to the perception of basic flavour, taste and texture attributesover the time of consumption. Beckett (2000) explained that finer particles tend to give aclaggy or pasty chocolate that is harder to manipulate in the mouth. As a consequence, theperceived intensities and the duration of the perception of flavour and attributes may beaffected (Lee et al., 1992). There are conflicting reports about the effect of viscosity on theperception of taste in the literature. While viscosity is known to affect the perception ofsweetness in solutions and gel products, it does not affect the perception of chocolate flavourin desserts (Pangborn & Kayasako, 1981), thus requires further investigation especially intochocolate systems.

P1: KAE/UKS P2: KAEc05 BLBK244-Afoakwa January 5, 2010 7:43 Printer Name: Yet to Come
Sensory character and flavour perception of chocolates 89
5.10 ELECTRONIC NOSES AND TONGUES ASONLINE SENSORS FOR SENSORY ASSESSMENTOF CHOCOLATES
Electronic noses and tongues are relatively young and modern technologies that could beemployed to assess the flavour/odour quality of chocolates. The processes use chemical arraysensor systems for flavour, odour and taste classifications. Electronic noses perform odourassessment on a continuous basis at a low cost based on the concept of mammalian olfactorysystem. Once the volatile compounds reach the olfactory epithelium, the interactions ofodourants with the appropriate chemosensory receptors, olfactory neurons, produce electricalstimuli transmitted to the brain. It was evidenced that a single olfactory neuron responded toseveral odourants and each odourant was sensed by multiple olfactory neurons.
The e-nose uses ultra-high-speed gas chromatography and a solid-state chemical sensorto quickly analyse the chemistry of flavours, aromas, odours or vapours with parts per tril-lion sensitivity. It mimics the way the systems of interconnected receptors and neurons inthe incomparable and irreplaceable human nose interact and respond to vapour moleculesbased on analysis of the cross-reactivity of an array of semiselective sensors. The signals areprocessed via a pattern recognition program. During its operation, an array of sensors, com-posed of polymers, for example, expands like a sponge when it comes in contact with volatilecompounds in the headspace of a sample, increasing the resistance of the composite. The nor-malised change in resistance is then transmitted to a processor to identify the types, quantityand quality of the odours based on the pattern change in the sensor array (Leake, 2009).
An electronic nose works with the gas phase of a volatile compound, while an electronictongue works in the liquid phase of a non-volatile compound. Both instruments can be used toidentify flavour varieties and geographical origin, composition, aroma intensity and degree offreshness. Electronic noses are also suitable for measuring release of gases and odours frompackaging materials. However, its application requires appropriate sampling steps and thetraining of electronic noses based on sensory panel classifications to obtain odour-meaningfulclassifications. Moreover, the biological sensitivity can go down to parts per trillion levelswith a response time of milliseconds, whereas instruments barely go under parts per billionlevels with a response time of seconds. E-noses could be used for quality control applicationsin the confectionery industry to detect conformity control of raw materials, processed or end-product quality, batch-to-batch consistency, certification of origin and clean-in-place processmonitoring.
On the other hand, electronic tongue (e-tongue) measures dissolved compounds responsi-ble for taste in liquids. It can be used to detect major tastes such as sweet, sour, bitter, saltyand umami, which resembles effects of subtaste attributes such as spicy and metallic. Thiscould as well be used in diverse applications in the confectionery industry to do a completebitterness/sweetness assessment of new products. They could also be used to measure thetaste-masking abilities of some confectionery products with new or different ingredients.These capacities could speed up research activities where variations in the sensory qualitiesof the end products are desired.
5.11 CONCLUSION
The sensory character of chocolate plays vital roles in dictating the preference, palatabil-ity and acceptability of finished products. During manufacture, several factors combine to
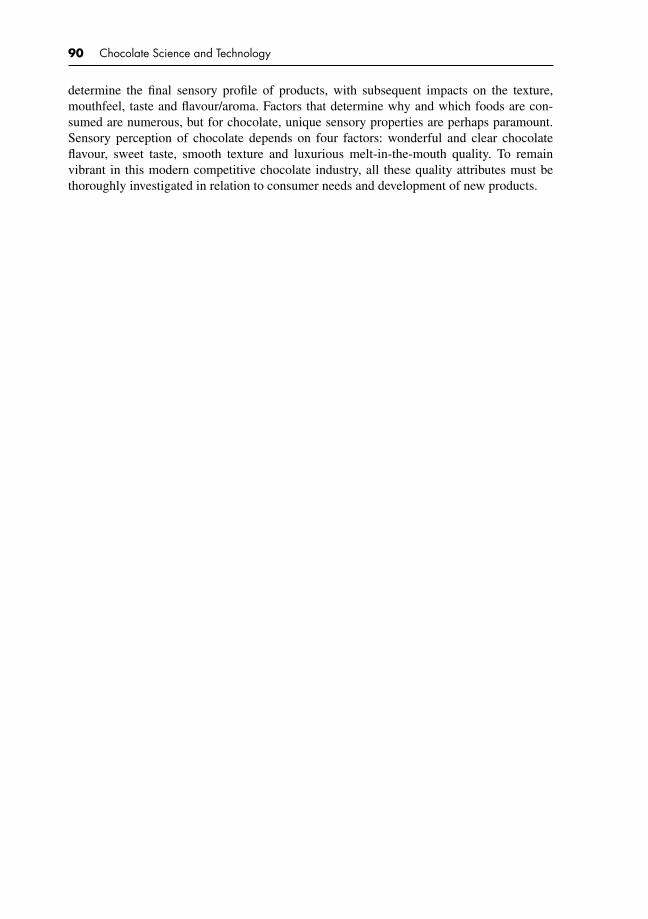
P1: KAE/UKS P2: KAEc05 BLBK244-Afoakwa January 5, 2010 7:43 Printer Name: Yet to Come
90 Chocolate Science and Technology
determine the final sensory profile of products, with subsequent impacts on the texture,mouthfeel, taste and flavour/aroma. Factors that determine why and which foods are con-sumed are numerous, but for chocolate, unique sensory properties are perhaps paramount.Sensory perception of chocolate depends on four factors: wonderful and clear chocolateflavour, sweet taste, smooth texture and luxurious melt-in-the-mouth quality. To remainvibrant in this modern competitive chocolate industry, all these quality attributes must bethoroughly investigated in relation to consumer needs and development of new products.

P1: KAE/UKS P2: KAEc06 BLBK244-Afoakwa January 5, 2010 7:45 Printer Name: Yet to Come
6 Nutritional and health benefits ofcocoa and chocolate consumption
6.1 SUMMARY AND SIGNIFICANCE
Cocoa and chocolate have been acclaimed for several years for their possible medicinal/healthbenefits, but it is only recently that some of these claims are being more clearly identified andstudied. Recent epidemiological and clinical studies have shown that dietary supplementationwith flavonoid-rich cocoa and chocolate may exert suppressive effects on low-density lipopro-tein (LDL) oxidation and the associated development of atherosclerosis with cardioprotectiveimplications because of their interference in many pathophysiological mechanisms. Someof the identified beneficial effects include antioxidant properties, blood pressure loweringvia the induction of nitric oxide (NO)-dependent vasodilation in men, improvement in en-dothelial function, increased insulin sensitivity, decreased platelet activation and function, aswell as modulation of immune function and inflammation. Furthermore, chocolate has beenreported to release phenylethylamine and seratonin into the human system, when consumed,producing some aphrodisiac and mood-lifting effects. Since these claims may possibly haveimplications on consumption levels of cocoa and chocolate products in the global market,understanding the critical factors involved and their potential beneficial effects would be ofgreat importance to consumers.
6.2 INTRODUCTION
Cocoa and chocolate products have recently attracted the attention of many investigators andthe general consuming public because of their potential nutritional, medicinal and mysticalproperties. Chocolate is a very complex food and scientists continue to investigate it in order tounlock its potential benefits and secrets. When consumed, it has been observed to have effectson human behaviour and health. Over the past decade, several studies have reported that theirconsumption can contribute to the attainment of optimal health and development as well asplay an important role in reducing the risk or delaying the development of chronic diseases,such as cardiovascular disease (CVD), cancer and other age-related diseases (Adamson et al.,1999; Hammerstone et al., 2000; Afoakwa, 2008; Cooper et al., 2008).
Recently, chocolate has gained a reputation as being an aphrodisiac in common with lob-ster, crab legs, pine nuts, walnuts, alcohol and Viagra. In most parts of the world, chocolateis associated with romance, and not without good reason, as it was viewed as an aphrodisiacby the Mayan and Aztec cultures who thought it invigorated men and made women lessinhibited (Doughty, 2002). The reputed aphrodisiac qualities of chocolate are most often as-sociated with the simple sensual pleasure of its consumption. Additionally, chocolate’s sweet

P1: KAE/UKS P2: KAEc06 BLBK244-Afoakwa January 5, 2010 7:45 Printer Name: Yet to Come
92 Chocolate Science and Technology
and fatty nature is reported to stimulate the hypothalamus, inducing pleasurable sensations aswell as affecting the levels of serotonin in the brain, hence enhancing sexual drive (Kenneth,1996; di Tomaso et al., 1996). Finally, chocolate has been shown to contain unsaturatedN-acylethanolamines, which might activate cannabinoid receptors in humans or increasetheir endocannabinoid levels resulting in heightened sensitivity and euphoria (di Tomasoet al., 1996).
Over the past decade, biochemical and physiological associations among hypertension,diabetes, sexual weakness and CVD have grown steadily, supported by basic, clinical andepidemiological research. As possibilities exist for treating these pathologies through phar-macologic approaches, lifestyle adjustment and diet modification, identification of foods thathave aphrodisiac qualities and cardiovascular health benefits and understanding how thesefood components influence normal human physiology would help improve public health.This chapter discusses current information relating to the acclaimed aphrodisiac and otherbeneficial health implications of cocoa and chocolate consumption, based on epidemiologi-cal, pre-clinical and clinical studies conducted over the past decade.
6.3 CHEMISTRY AND COMPOSITION OFCOCOA FLAVONOIDS
Cocoa and its derived products – chocolate and cocoa powder – are rich in flavonoids, char-acterised as flavan-3-ols or flavanols and include the monomeric forms, (−)-epicatechinand (−)-catechin, and the oligomeric form of the monomeric units, the procyanidins(Fig. 6.1) (Wollgast & Anklam, 2000a; Engler & Engler, 2006; Cooper et al., 2008).
These flavonoids are stored in the cotyledon pigment cells of cocoa bean, the fruit ofthe cocoa tree (Theobroma cacao), and are differentiated in three main groups: catechins orflavan-3-ols (∼37%), anthocyanins (∼4%) and proanthocyanidins (∼58%). Less abundantis (+)-catechin with only traces of (+)-gallocatechin and (−)-epigallocatechin. The antho-cyanin fraction is dominated by cyanidin-3-α-l-arabinoside and cyanidin-3-β-d-galactoside.Procyanidins are mostly flavan-3,4-diols, 4–8 or 4–6 bound to form dimers, trimers oroligomers with epicatechin as main extension subunit (Romanczyk et al., 1997; Gu et al.,2006).
The flavonoids represent a ubiquitous and abundant group of polyphenols consumed in thediet, primarily from fruits and vegetables, derived from plants and act as antioxidants due totheir free radical scavenging properties, their ability to reduce the formation of free radicalsand their ability to stabilise membranes by decreasing membrane fluidity (Arora et al.,2000; Kromhout et al., 2002). These antioxidant properties may contribute to the mountingevidence that a diet rich in fruits and vegetables reduces the risk of CVD. Metabolic andepidemiological studies indicate that regular intake of such products increases the plasmalevel of antioxidants, a desirable attribute as a defence against reactive oxygen species. Aswell, the antioxidants in cocoa can prevent the oxidation of LDL cholesterol, related to themechanism of protection in heart disease. A few studies have shown that reactive oxygenspecies associated with carcinogenic processes is also inhibited (Krawczyk, 2000; Pietta,2000; Engler & Engler, 2006). More so, the fats from cocoa (cocoa butter) are mainly stearictriglycerides (C18:0) that are less well absorbed than other fats and tend to be excreted inthe faeces. They are thus less bioavailable and have minimal effect on serum cholesterol(Wollgast & Anklam, 2000b; Cooper et al., 2008).

P1: KAE/UKS P2: KAEc06 BLBK244-Afoakwa January 5, 2010 7:45 Printer Name: Yet to Come
Nutritional and health benefits of cocoa and chocolate consumption 93
OHO
OHOH
OHOHH
OHO
OHOH
HOHOH
(–)-Epicatechin
(+)-Catechin
Procyanidin (4β->6)dimers
O
O
HO
OH
R2R1
OH
OH
OH
HO
R2R1
OH
OH
Fig. 6.1 Chemical structure of the major cocoa flavanols: (−)-epicatechin and (+)-catechin andprocyanidin.
Many investigators have identified the common classes and food sources of flavonoidsto include flavanol [quercetin, kaempferol, myricetin (in onions, apples, tea and red wine)],isoflavones [daidzein, genistein (in soy)], flavan-3-ols or flavanols [catechin, epicatechin (intea, chocolate, red wine)], flavanones [naringenin, hesperitin (in citrus fruits)], flavones [api-genin (in celery), luteolin (in red pepper)] and anthocyanins (in pigments of red fruits suchas berries and red grapes) (Engler & Engler, 2006). These different classes of flavonoidsare based on their level of oxidation in the basic flavonoid structure (C6–C3–C6), a 15-carbon atom structure arranged in three rings (two aromatic rings on the ends with anoxygenated heterocycle in the middle). Evidence from epidemiological studies suggeststhat a high intake of dietary flavonoids may reduce the risk of coronary heart disease(Vinson et al., 1999; Wollgast & Anklam, 2000b; Kraus et al., 2001). Flavonoids havealso been reported to have a beneficial influence on oxidative stress, vascular function,platelet function and immune response, which may collectively be involved in the process ofatherogenesis.
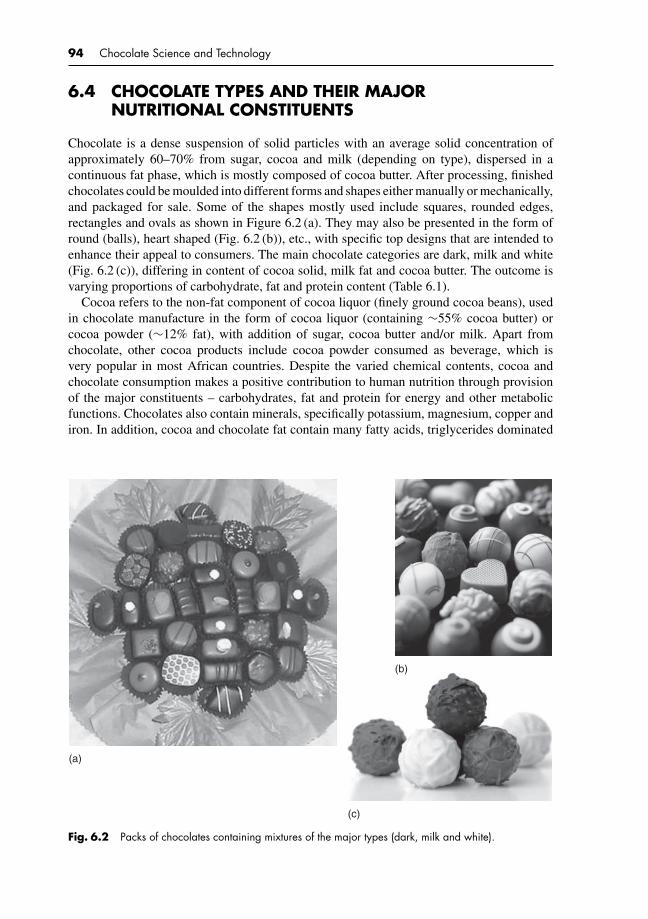
P1: KAE/UKS P2: KAEc06 BLBK244-Afoakwa January 5, 2010 7:45 Printer Name: Yet to Come
94 Chocolate Science and Technology
6.4 CHOCOLATE TYPES AND THEIR MAJORNUTRITIONAL CONSTITUENTS
Chocolate is a dense suspension of solid particles with an average solid concentration ofapproximately 60–70% from sugar, cocoa and milk (depending on type), dispersed in acontinuous fat phase, which is mostly composed of cocoa butter. After processing, finishedchocolates could be moulded into different forms and shapes either manually or mechanically,and packaged for sale. Some of the shapes mostly used include squares, rounded edges,rectangles and ovals as shown in Figure 6.2 (a). They may also be presented in the form ofround (balls), heart shaped (Fig. 6.2 (b)), etc., with specific top designs that are intended toenhance their appeal to consumers. The main chocolate categories are dark, milk and white(Fig. 6.2 (c)), differing in content of cocoa solid, milk fat and cocoa butter. The outcome isvarying proportions of carbohydrate, fat and protein content (Table 6.1).
Cocoa refers to the non-fat component of cocoa liquor (finely ground cocoa beans), usedin chocolate manufacture in the form of cocoa liquor (containing ∼55% cocoa butter) orcocoa powder (∼12% fat), with addition of sugar, cocoa butter and/or milk. Apart fromchocolate, other cocoa products include cocoa powder consumed as beverage, which isvery popular in most African countries. Despite the varied chemical contents, cocoa andchocolate consumption makes a positive contribution to human nutrition through provisionof the major constituents – carbohydrates, fat and protein for energy and other metabolicfunctions. Chocolates also contain minerals, specifically potassium, magnesium, copper andiron. In addition, cocoa and chocolate fat contain many fatty acids, triglycerides dominated
(a)
(b)
(c)
Fig. 6.2 Packs of chocolates containing mixtures of the major types (dark, milk and white).
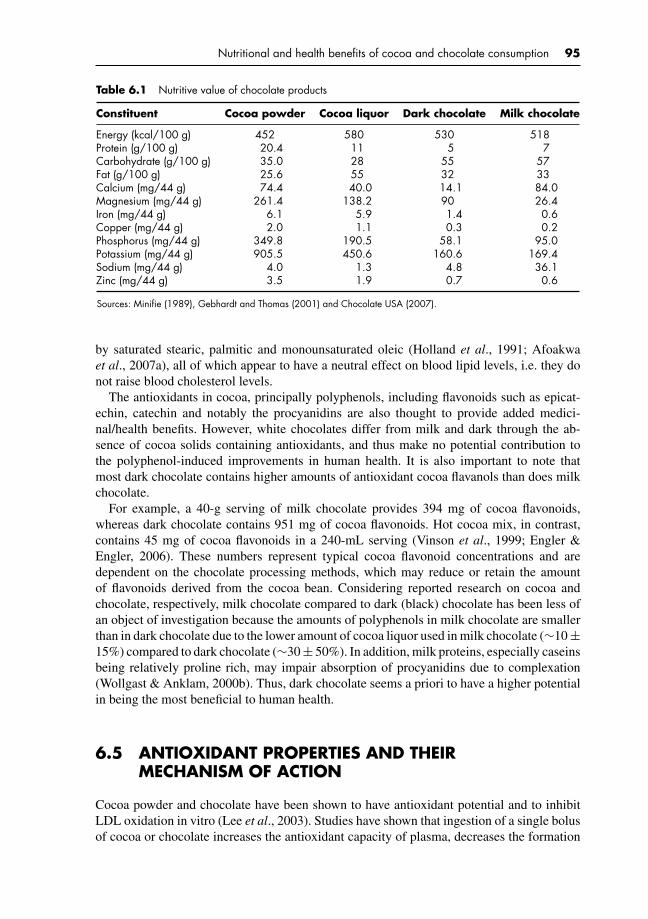
P1: KAE/UKS P2: KAEc06 BLBK244-Afoakwa January 5, 2010 7:45 Printer Name: Yet to Come
Nutritional and health benefits of cocoa and chocolate consumption 95
Table 6.1 Nutritive value of chocolate products
Constituent Cocoa powder Cocoa liquor Dark chocolate Milk chocolate
Energy (kcal/100 g) 452 580 530 518Protein (g/100 g) 20.4 11 5 7Carbohydrate (g/100 g) 35.0 28 55 57Fat (g/100 g) 25.6 55 32 33Calcium (mg/44 g) 74.4 40.0 14.1 84.0Magnesium (mg/44 g) 261.4 138.2 90 26.4Iron (mg/44 g) 6.1 5.9 1.4 0.6Copper (mg/44 g) 2.0 1.1 0.3 0.2Phosphorus (mg/44 g) 349.8 190.5 58.1 95.0Potassium (mg/44 g) 905.5 450.6 160.6 169.4Sodium (mg/44 g) 4.0 1.3 4.8 36.1Zinc (mg/44 g) 3.5 1.9 0.7 0.6
Sources: Minifie (1989), Gebhardt and Thomas (2001) and Chocolate USA (2007).
by saturated stearic, palmitic and monounsaturated oleic (Holland et al., 1991; Afoakwaet al., 2007a), all of which appear to have a neutral effect on blood lipid levels, i.e. they donot raise blood cholesterol levels.
The antioxidants in cocoa, principally polyphenols, including flavonoids such as epicat-echin, catechin and notably the procyanidins are also thought to provide added medici-nal/health benefits. However, white chocolates differ from milk and dark through the ab-sence of cocoa solids containing antioxidants, and thus make no potential contribution tothe polyphenol-induced improvements in human health. It is also important to note thatmost dark chocolate contains higher amounts of antioxidant cocoa flavanols than does milkchocolate.
For example, a 40-g serving of milk chocolate provides 394 mg of cocoa flavonoids,whereas dark chocolate contains 951 mg of cocoa flavonoids. Hot cocoa mix, in contrast,contains 45 mg of cocoa flavonoids in a 240-mL serving (Vinson et al., 1999; Engler &Engler, 2006). These numbers represent typical cocoa flavonoid concentrations and aredependent on the chocolate processing methods, which may reduce or retain the amountof flavonoids derived from the cocoa bean. Considering reported research on cocoa andchocolate, respectively, milk chocolate compared to dark (black) chocolate has been less ofan object of investigation because the amounts of polyphenols in milk chocolate are smallerthan in dark chocolate due to the lower amount of cocoa liquor used in milk chocolate (∼10 ±15%) compared to dark chocolate (∼30 ± 50%). In addition, milk proteins, especially caseinsbeing relatively proline rich, may impair absorption of procyanidins due to complexation(Wollgast & Anklam, 2000b). Thus, dark chocolate seems a priori to have a higher potentialin being the most beneficial to human health.
6.5 ANTIOXIDANT PROPERTIES AND THEIRMECHANISM OF ACTION
Cocoa powder and chocolate have been shown to have antioxidant potential and to inhibitLDL oxidation in vitro (Lee et al., 2003). Studies have shown that ingestion of a single bolusof cocoa or chocolate increases the antioxidant capacity of plasma, decreases the formation
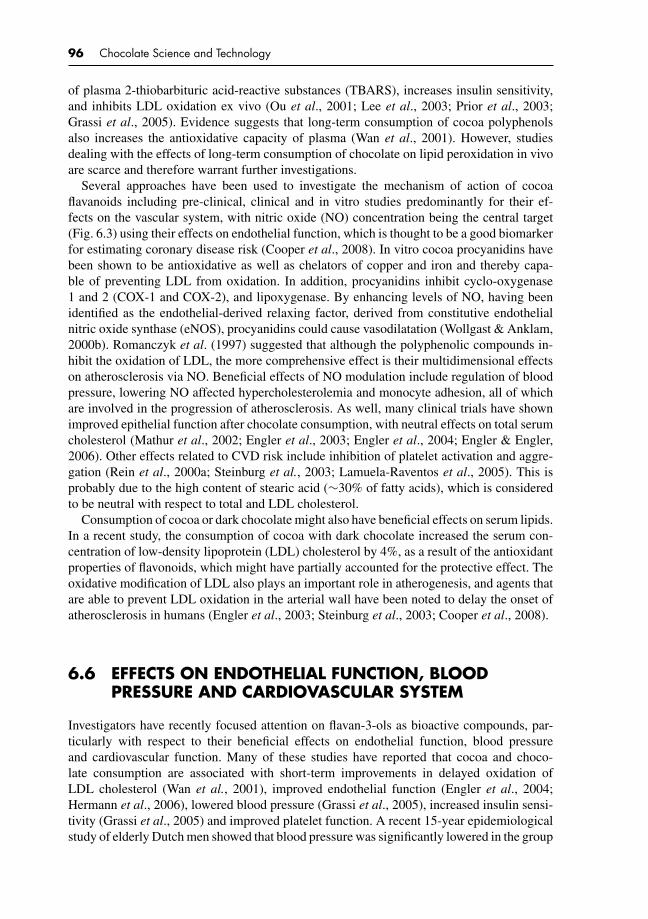
P1: KAE/UKS P2: KAEc06 BLBK244-Afoakwa January 5, 2010 7:45 Printer Name: Yet to Come
96 Chocolate Science and Technology
of plasma 2-thiobarbituric acid-reactive substances (TBARS), increases insulin sensitivity,and inhibits LDL oxidation ex vivo (Ou et al., 2001; Lee et al., 2003; Prior et al., 2003;Grassi et al., 2005). Evidence suggests that long-term consumption of cocoa polyphenolsalso increases the antioxidative capacity of plasma (Wan et al., 2001). However, studiesdealing with the effects of long-term consumption of chocolate on lipid peroxidation in vivoare scarce and therefore warrant further investigations.
Several approaches have been used to investigate the mechanism of action of cocoaflavanoids including pre-clinical, clinical and in vitro studies predominantly for their ef-fects on the vascular system, with nitric oxide (NO) concentration being the central target(Fig. 6.3) using their effects on endothelial function, which is thought to be a good biomarkerfor estimating coronary disease risk (Cooper et al., 2008). In vitro cocoa procyanidins havebeen shown to be antioxidative as well as chelators of copper and iron and thereby capa-ble of preventing LDL from oxidation. In addition, procyanidins inhibit cyclo-oxygenase1 and 2 (COX-1 and COX-2), and lipoxygenase. By enhancing levels of NO, having beenidentified as the endothelial-derived relaxing factor, derived from constitutive endothelialnitric oxide synthase (eNOS), procyanidins could cause vasodilatation (Wollgast & Anklam,2000b). Romanczyk et al. (1997) suggested that although the polyphenolic compounds in-hibit the oxidation of LDL, the more comprehensive effect is their multidimensional effectson atherosclerosis via NO. Beneficial effects of NO modulation include regulation of bloodpressure, lowering NO affected hypercholesterolemia and monocyte adhesion, all of whichare involved in the progression of atherosclerosis. As well, many clinical trials have shownimproved epithelial function after chocolate consumption, with neutral effects on total serumcholesterol (Mathur et al., 2002; Engler et al., 2003; Engler et al., 2004; Engler & Engler,2006). Other effects related to CVD risk include inhibition of platelet activation and aggre-gation (Rein et al., 2000a; Steinburg et al., 2003; Lamuela-Raventos et al., 2005). This isprobably due to the high content of stearic acid (∼30% of fatty acids), which is consideredto be neutral with respect to total and LDL cholesterol.
Consumption of cocoa or dark chocolate might also have beneficial effects on serum lipids.In a recent study, the consumption of cocoa with dark chocolate increased the serum con-centration of low-density lipoprotein (LDL) cholesterol by 4%, as a result of the antioxidantproperties of flavonoids, which might have partially accounted for the protective effect. Theoxidative modification of LDL also plays an important role in atherogenesis, and agents thatare able to prevent LDL oxidation in the arterial wall have been noted to delay the onset ofatherosclerosis in humans (Engler et al., 2003; Steinburg et al., 2003; Cooper et al., 2008).
6.6 EFFECTS ON ENDOTHELIAL FUNCTION, BLOODPRESSURE AND CARDIOVASCULAR SYSTEM
Investigators have recently focused attention on flavan-3-ols as bioactive compounds, par-ticularly with respect to their beneficial effects on endothelial function, blood pressureand cardiovascular function. Many of these studies have reported that cocoa and choco-late consumption are associated with short-term improvements in delayed oxidation ofLDL cholesterol (Wan et al., 2001), improved endothelial function (Engler et al., 2004;Hermann et al., 2006), lowered blood pressure (Grassi et al., 2005), increased insulin sensi-tivity (Grassi et al., 2005) and improved platelet function. A recent 15-year epidemiologicalstudy of elderly Dutch men showed that blood pressure was significantly lowered in the group
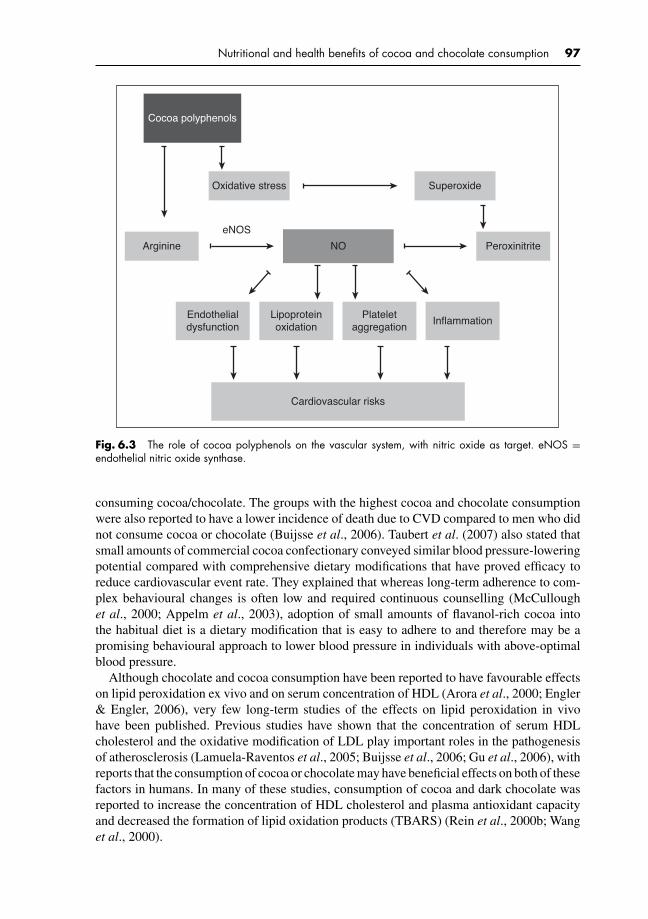
P1: KAE/UKS P2: KAEc06 BLBK244-Afoakwa January 5, 2010 7:45 Printer Name: Yet to Come
Nutritional and health benefits of cocoa and chocolate consumption 97
Cocoa polyphenols
Oxidative stress
Arginine
Endothelialdysfunction
Lipoproteinoxidation
Plateletaggregation
Inflammation
Cardiovascular risks
NO
eNOS
Peroxinitrite
Superoxide
Fig. 6.3 The role of cocoa polyphenols on the vascular system, with nitric oxide as target. eNOS =endothelial nitric oxide synthase.
consuming cocoa/chocolate. The groups with the highest cocoa and chocolate consumptionwere also reported to have a lower incidence of death due to CVD compared to men who didnot consume cocoa or chocolate (Buijsse et al., 2006). Taubert et al. (2007) also stated thatsmall amounts of commercial cocoa confectionary conveyed similar blood pressure-loweringpotential compared with comprehensive dietary modifications that have proved efficacy toreduce cardiovascular event rate. They explained that whereas long-term adherence to com-plex behavioural changes is often low and required continuous counselling (McCulloughet al., 2000; Appelm et al., 2003), adoption of small amounts of flavanol-rich cocoa intothe habitual diet is a dietary modification that is easy to adhere to and therefore may be apromising behavioural approach to lower blood pressure in individuals with above-optimalblood pressure.
Although chocolate and cocoa consumption have been reported to have favourable effectson lipid peroxidation ex vivo and on serum concentration of HDL (Arora et al., 2000; Engler& Engler, 2006), very few long-term studies of the effects on lipid peroxidation in vivohave been published. Previous studies have shown that the concentration of serum HDLcholesterol and the oxidative modification of LDL play important roles in the pathogenesisof atherosclerosis (Lamuela-Raventos et al., 2005; Buijsse et al., 2006; Gu et al., 2006), withreports that the consumption of cocoa or chocolate may have beneficial effects on both of thesefactors in humans. In many of these studies, consumption of cocoa and dark chocolate wasreported to increase the concentration of HDL cholesterol and plasma antioxidant capacityand decreased the formation of lipid oxidation products (TBARS) (Rein et al., 2000b; Wanget al., 2000).
P1: KAE/UKS P2: KAEc06 BLBK244-Afoakwa January 5, 2010 7:45 Printer Name: Yet to Come
98 Chocolate Science and Technology
In another study, Mursu et al. (2004) found that the concentration of HDL cholesterolincreased in healthy humans receiving chocolate that contained cocoa mass. The increase inHDL cholesterol was 11% after the consumption of dark chocolate and 14% after the con-sumption of dark chocolate enriched with cocoa polyphenols, whereas no effect was observedafter the consumption of white chocolate. The ratio of LDL/HDL also changed in a similarmanner, suggesting that because the fatty acid content in the study chocolates was identical,the compounds in the cocoa mass were responsible for the increase in HDL cholesterol.
Data documenting a beneficial effect on HDL concentration are supported by a reported,long-term, crossover study. Wan et al. (2001) found that after daily consumption of 22 g ofcocoa powder and 16 g of dark chocolate for 4 weeks, the concentration of HDL cholesterolwas 4% higher compared to the control diet (average American diet). The higher amountof chocolate ingested (75 g or the equivalent of two candy bars) might explain the greaterincrease in the HDL cholesterol (11–14%) reported by Mursu and colleagues (2004). A highconcentration of HDL cholesterol has been shown to decrease the risk of CVDs (Castelliet al., 1986). As well, concentration of HDL cholesterol can usually be increased by 10–15%by changing lifestyle behaviour, but this strategy is not suitable for everyone, since it can onlybe meaningfully achieved by vigorous exercise or moderate alcohol consumption (Safeer &Cornell, 2000).
The consumption of chocolate also inhibited significantly the oxidation of LDL in vivo,as measured in the formation of conjugated dienes. The decrease in LDL peroxidation inthese study groups indicated the likelihood of this effect due to the fatty acids in chocolate.It has previously been reported that, compared to polyunsaturated fatty acids, monounsat-urated fatty acids inhibit lipid peroxidation (Reaven et al., 1991; Bonanome et al., 1992;Gutteridge and Halliwell, 1994; Eritsland, 2000). Thus, a high consumption of saturated ormonounsaturated fat in the form of chocolate may modify the lipid content of LDL to makeit more resistant to oxidation by increasing the amount of monounsaturated and saturatedfats, and by decreasing the amount of polyunsaturated fatty acids.
6.7 EFFECTS ON INSULIN SENSITIVITY ANDCARCINOGENIC PROPERTIES
Cocoa and dark chocolate consumption has been claimed to protect the vascular endotheliumby augmenting NO availability and thereby improving endothelium-dependent vasorelax-ation (Karim et al., 2000; Ross & Kasum, 2002; Fisher et al., 2003; Engler et al., 2004). Inattempt to expand on these findings, Grassi et al. (2005) studied the effects of consumingeither dark or white chocolate on the homeostasis model assessment of insulin resistanceand the quantitative insulin sensitivity check index in 15 healthy young adults with typicalItalian diets that were supplemented daily with 100 g dark chocolate or 90 g white chocolate,each of which provided 480 kcal. The polyphenol contents of the dark and white chocolatewere assumed to be 500 and 0 mg, respectively. Dark chocolate ingestion not only decreasedblood pressure but also improved glucose metabolism and insulin sensitivity in the subjects.They explained that polyphenol-rich dark chocolate, but not white chocolate (which containsmainly sugar and cocoa butter), decreased their blood pressure and improved their insulinsensitivity.
In another study, Romanczyk et al. (1997) examined anticarcinogenic properties of cocoaextracts, using several human cancer cell lines. Interestingly, the effects were seen only with

P1: KAE/UKS P2: KAEc06 BLBK244-Afoakwa January 5, 2010 7:45 Printer Name: Yet to Come
Nutritional and health benefits of cocoa and chocolate consumption 99
oligomeric procyanidins and of these in particular oligomers of 5 ± 12 subunits, with themost effective being the pentamer. It was suggested that the mechanisms by which procyani-dins exert anticarcinogenic activity include inhibition of DNA strand breaks, DNA–proteincross-links and free radical oxidation of nucleotides due to their antioxidative activity as wellas inhibition of enzyme activities of cyclo-oxygenase 2 (COX-2) and DNA topoisomerase II.Moreover, procyanidins modulate NO production by macrophages, possessing an induciblenitric oxide synthase (iNOS), and thereby affecting ribonuclease reductase, the enzyme thatconverts ribonucleotides to deoxyribonucleotides necessary for DNA synthesis. Inhibition ofDNA synthesis may be an important way in which macrophages and other tissues possessingiNOS can inhibit the growth of rapidly dividing tumour cells or infectious bacteria. Thesefindings indicate that cocoa and dark chocolate consumption may exert anticarcinogenicactivity in human cells, and offer protective action on the vascular endothelium, by improv-ing insulin sensitivity, thereby exerting favourable metabolic effects in humans with furtherprotection against CVDs. Obviously, since these findings cannot be generalised for all popu-lations, large-scale trials are needed to confirm these protective actions of dark chocolate orother flavanol-containing foods in populations affected by insulin-resistant conditions suchas essential hypertension and obesity.
6.8 COCOA, CHOCOLATE AND APHRODISIACPROPERTIES
Cocoa and chocolate have been reported to exert several effects on human sexuality, mainlyacting as an effective aphrodisiac, increasing sexual desire and improving sexual pleasure(Salonia et al., 2006). They have been claimed to contain a chemical substance known asphenylethylamine, which has been reported to stimulate the hypothalamus, inducing pleasur-able sensations as well as affecting the levels of two neurotransmitters – 5-hydroxytrytamine(serotonin) and endorphins in the brain, hence enhancing mood lifting and sexual drive(Kenneth, 1996). These chemicals occur naturally and are released by the brain into thenervous system during situations of happiness, feelings of love, passion and/or lust. Thiscauses a rapid mood change, a rise in blood pressure, increasing the heart rate and inducingthose feelings of well-being, bordering on euphoria usually associated with being in love.
In other studies, the cocoa in chocolate was reported to contain several potentially psy-choactive chemicals, for instance the sympathomimetic biogenic amines, tyramine andphenylethylamine, and the methylxanthines, theobromine and caffeine (Hurst & Toomey,1981; Hurst et al., 1982; Max, 1989). Spampinato (2007) noted that each 100 g of chocolatecontains 660 mg of phenylethylamine (C6H5(CH2)2NH2), a stimulant similar to the body’sown dopamine and adrenaline. Phenylethylamine was noted to raise blood pressure andheart rate, heightening sensations and blood glucose levels (Spampinato, 2007). Since eatingchocolate gives an instant energy boost, increasing stamina, it is no wonder why its effectshave given it a reputation as an aphrodisiac. In addition, both compounds can be mildlyaddictive, explaining the drive of chocoholics. However, women are more susceptible to theeffects of phenylethylamine and seratonin than men (Salonia et al., 2006), explaining whywomen tend to be chocoholics more than men.
Chocolate has also been shown to contain unsaturated N-acylethanolamines, which mightactivate cannabinoid receptors or increase endocannabinoid levels, resulting in heightenedsensitivity and euphoria. Researchers believe that chocolate contains pharmacologically
P1: KAE/UKS P2: KAEc06 BLBK244-Afoakwa January 5, 2010 7:45 Printer Name: Yet to Come
100 Chocolate Science and Technology
active substances that have the same effect on the brain as marijuana, and that these chemi-cals may be responsible for certain drug-induced psychoses associated with chocolate craving(Rozin, 1991). Although marijuana’s active ingredient that allows a person to feel ‘high’ istetrahydrocannabinol, a different chemical neurotransmitter produced naturally in the braincalled anandamide has been isolated in chocolate (di Tomaso et al., 1996). Because theamounts of anandamide found in chocolate is so minuscule, eating chocolate will not get aperson high, but rather that there are compounds such as unsaturated N-acylethanolamines inchocolate that have been associated with the good and ‘high’ feeling that chocolate consump-tion provides. In the body, anandamide is broken down rapidly into two inactive sectionsafter production by the enzyme hydrolase found in our bodies (di Tomaso et al., 1996). Inchocolate, however, there are other chemicals that may inhibit this natural breakdown ofanandamide. Therefore, natural anandamide may remain extensively, making people feelgood longer when they eat chocolate. Although chocolate contains chemicals associatedwith feelings of happiness, love, passion, lust, endurance, stamina and mood lifting, scien-tists continue to debate whether it should be classified as an aphrodisiac. It is therefore verychallenging to say that there is a firm proof that chocolate is indeed an aphrodisiac, but it doescontain substances that increase energy, stamina, mood lifting and feelings of well-being.The reality is that a gift of chocolate is a familiar courtship ritual that makes you feel goodand induces feelings of being in love.
6.9 CONCLUSION
Cocoa and chocolate flavonoids are compounds that are vital in human health, as evidencedby their influence on a number of findings relating to their biochemical and physiologicalfunctions in the body, with identified potent antioxidant effects under in vitro conditions andin vivo after consumption. These antioxidant properties have been related to increases inplasma epicatechin concentrations, endothelial-dependent vascular relaxation as promotedby cocoa flavonoids in part due to increased bioavailability of NO and prostacyclin, andantiatherosclerotic properties of NO combined with a favourable shift towards vasodilationconferring vasculoprotective effect. Blood pressure lowering has also been found after short-term dark chocolate intervention in the presence of mild isolated systolic hypertension. Otherknown effects from cocoa flavonoids include their suppressive effect on platelet reactivityand platelet-related primary hemostasis, modulation of immune function and inflammation aspotential cardioprotective effects. Finally, some aphrodisiac effects, mood liftings and height-ened sensitivity have also been reported due to phenylethylamine and N-acylethanolaminescompounds in cocoa and chocolates. As consumers become more aware of the potentialaphrodisiac effects and health benefits associated with cocoa and chocolate consumption,they would require more information as to whether the intake of these functional compoundsand/or their sources is related to measurable effects on human sexual lives, health and/orthe development of diseases. As well, it may provide relevant information on their specificsources and products commonly available in the marketplace as a guide to their selection offoods. Consumption of cocoa and chocolate flavonoids therefore still presents an excitingarea of further nutritional/clinical/epidemiological research with significant implications forsexual sensitivities and cardiovascular protection in humans.

P1: KAE/UKS P2: KAEc07 BLBK244-Afoakwa January 25, 2010 21:43 Printer Name: Yet to Come
7 Structure – properties (rheology,texture and melting) relationships inchocolate manufacture
7.1 SUMMARY AND INDUSTRIAL RELEVANCE
Chocolate manufacturing is complex and requires a combination of several ingredients andtechnological operations to achieve the desired rheological, textural and melting qualities.However, the extent to which the formulated ingredients and the applied processing oper-ations, such as refining and conching, influence these quality characteristics remains quiteunclear to processors and therefore requires in-depth investigations to elucidate their effects.This study investigated effects of particle size distribution (PSD) and composition on rhe-ological, textural and melting properties of dark chocolates, and used multivariate statisticsto explore their interrelationships. The levels studied were as follows: PSD, D90 (90% finerthan this size) – 18, 25, 35 and 50 µm; fat – 25, 30 and 35%; and lecithin – 0.3 and 0.5%.Instruments utilised included a shear rate-controlled rheometer, TA-HD Plus Texture An-alyzer and differential scanning calorimeter (DSC). Surface colour was evaluated in termsof CIELAB parameters L*, C* and h◦ using a HunterLab Miniscan Colorimeter and mi-crostructure of products determined using light microscopy. Levels of PSD, fat and lecithincontent significantly affected all rheological parameters, with significant interaction amongfactors. Increasing particle size (PS) gave significant reductions in all rheological and texturalproperties with greatest effect noted at 25% fat and 0.3% lecithin, then inversely related tofat and lecithin contents. PSD and fat concentration also influenced melting characteristicsand colour (L*, C* and h◦). Micrographs revealed PSD and fat level induced wide variationsin sugar crystalline network structure and interparticle interaction: 25% fat yielded morecrystal agglomerates, well flocculated with greater particle-to-particle interaction strengthsthan those with higher (30 and 35%) fat contents. Increasing PSD to 35–50 µm resulted inparticles becoming coarser at all fat levels. Fat showed the greatest effect on the variabil-ity in each property followed by PSD and lecithin. Analyses showed high correlation (r =0.89–1.00) and regression coefficients (R2 = 0.84–1.00). The newer International Confec-tionery Association (ICA) technique gave higher correlation and regression coefficients thanthe Casson model but was highly related and either could effectively quantify dark chocolateviscosity parameters. High correlation (r = 0.78–0.99) and regression coefficients (R2 =0.59–0.99) were observed among rheological, textural and melting index. As PSD, fat andlecithin could be manipulated to control dark chocolate rheology, texture, appearance andmelting character, it would be possible to influence quality whilst reducing production cost.

P1: KAE/UKS P2: KAEc07 BLBK244-Afoakwa January 25, 2010 21:43 Printer Name: Yet to Come
102 Chocolate Science and Technology
7.2 INTRODUCTION
Chocolate is a dense suspension of solid particles, on average 60–70% sugar and non-fatcocoa solids and milk solids (depending on type) dispersed in a fat continuous phase, mostlyof cocoa butter. During manufacture, refining and conching determine PS and suspensionconsistency and viscosity to yield specific textural and sensory qualities (Beckett, 2000;Afoakwa et al., 2007).
Rheologically, molten chocolates behave as non-Newtonian liquids with yield stress (min-imum amount of energy to initiate fluid flow) and plastic viscosity (energy to keep fluidin motion), dependent on processing. Quality in finished chocolates is highly dependent oninherent size distribution of solid particles from sugar, milk and cocoa, composition of fatphase and emulsifiers (Ziegleder, 1992; Beckett, 2003). Rheological properties determineefficiency of mixing, pumping and transportation of finished products during processing.Servais et al. (2004) concluded that the control of chocolate rheology is important for qualityand exact weight control during enrobing, shell making and moulding processes. Process-ing parameters such as conching, PSD, fat content, emulsifiers (lecithin and polyglycerolpolyricinoleate, PGPR), temper, vibrations and temperature – all influence rheological prop-erties and production cost (Tscheuschner & Wunsche, 1979; Beckett, 1999; Vavreck, 2004;Schantz & Rohm, 2005; Afoakwa et al., 2008e).
Of techniques for characterising rheological properties, the ICA (previously IOCCC)suggests the use of rotational viscometers with concentric cylinders (bob and cup geometry)and the Casson equation (IOCCC, 1973; Bouzas & Brown, 1995; ICA, 2000; Sokmen &Gunes, 2006; Afoakwa et al., 2008b), with measurement of stress and viscosity at shear ratesbetween 2 and 50 s−1 using up and down curves, preceded by a pre-shear at 5 s−1 of more than5 minutes (Servais et al., 2004). Important are the rheological models of Herschel–Bulkley,Casson and Bingham (Chevalley, 1999; Beckett, 2000; Sokmen & Gunes, 2006), followingthe equations:
Herschel–Bulkley : τ = τ 0 + ηpl. (γ )n (7.1)
Casson :√
τ = √τCA + √
ηCA.√
γ (7.2)
Bingham : τ = τ0 + ηpl. γ (7.3)
where τ denotes shear stress; τ 0, yield stress; ηpl, plastic viscosity; τCA, Casson yield value;ηCA, Casson plastic viscosity; γ , shear rate; η, viscosity of the suspension; n, flow viscosityindex. Since 1973, the ICA has accepted rheological measurement of molten chocolateusing rotational viscometers with concentric cylinders (bob and cup geometry) and Cassonequation calculation of the parameters (IOCCC, 1973; Bouzas & Brown, 1995). In 2000,ICA recommended measurement of stress and viscosity at shear rates between 2 and 50 s−1
using up and down curves in shear rate, preceded by a pre-shear at 5 s−1 lasting 5 or moreminutes (ICA, 2000).
The basis for change in 2000 was results from an interlaboratory study (Aeschlimann &Beckett, 2000), which concluded that the Casson’s mathematical model employing only asmall set of parameters was limited in accuracy as, at lower shear rates, rheology data do notfit the Casson equation well. The outcome was a low degree of repeatability in interlaboratoryanalyses, and ICA thus recommended use of interpolation data for chocolate viscosity.Servais et al. (2004) noted that this strategy was simple, accurate and readily applicableto different systems, given a basis of relevant information. In the United States, the current
P1: KAE/UKS P2: KAEc07 BLBK244-Afoakwa January 25, 2010 21:43 Printer Name: Yet to Come
Structure – properties (rheology, texture and melting) relationships in chocolate manufacture 103
National Confectioners Association/Chocolate Manufacturers Association (NCA/CMA)method for chocolate rheological properties is to extrapolate concentric cylinder flow datausing the Casson equation (Baker et al., 2006) with a correction factor of a gap ratio betweenthe cup and the bob used during rheological measurement. This technique is different fromthe ICA quantification strategy (ICA, 2000) and therefore requires an understanding of theirinterrelationships.
PSD, central to rheological properties, has a direct influence on sensory character. Thelargest particles (D90) are important for mouthfeel notably grittiness, but smaller particlesinfluence flow properties (Beckett, 2000, 2003; Mongia & Ziegler, 2000; Ziegler et al., 2001).A small proportion of particles up to 65 µm give an improved texture for milk chocolate.Good dark chocolate requires a maximum PS of 35 µm (Awua, 2002), and at solids more61% by volume and PSD more than 35 µm, the quality becomes unacceptable due tohigh viscosity and poor texture (Beckett, 1999). Limit values are determined by targets forcharacter and product composition. Generally, chocolate viscosity is controlled by additionof cocoa butter and expensive viscosity modifiers (surface-active ingredients, e.g. soy lecithinand PGPR). The optimum for average sugar PS is cultural, in the United States 25–30 µmwith a maximum of 50 µm and in Europe 20–23 and 35–40 µm, respectively (Jeffery, 1993).Benefits of PSD optimisation include reductions in viscosity modifiers. There is no generalagreement on the central role of PSD in suspension flow properties, with Awua (2002) andWhitefield (2005) arguing that other factors influence rheology. Modification of suspensionviscosity by changing PSD merits further investigation together with compositional factorsthat contribute to rheological properties during manufacture.
Chocolate texture and appearance are key attributes in consumer choice and acceptabilityeven though flavour is frequently judged important in product identification (Beckett, 2003;Whitefield, 2005). Although texture perception is a dynamic oral process before and duringmastication, individuals also perceive texture through vision, touch and hearing (Heath &Prinz, 1999; Kilcast, 1999; Wilkinson et al., 2000). Chocolate texture can also be evaluatedby instrumental measurements often rationalised as cheap, efficient and objective replace-ments or complements for sensory evaluations (Lawless & Heymann, 1998) with statisticallysignificant correlations (Mohamed et al., 1982; Christensen, 1984; Meullenet et al., 1997;Rosenthal, 1999; Bourne, 2002). Visual information characterising objects, including gloss,colour, shape, roughness, surface texture, shininess and translucency, is summarised intoappearance attributes. Briones et al. (2006) concluded that these emerge from complexinteractions of incident light, optical characteristics and human perception. Relevant infor-mation can be acquired from modern technologies such as computer vision and calibratedcolour imaging analysis, HunterLAB and CIELAB models (Lawless & Heymann, 1998;Jahns et al., 2001; Hatcher et al., 2004; Briones & Aguilera, 2005). Such lab-based mod-els provide close descriptions of colour attributes (Lawless & Heymann, 1998; Taylor &Hort, 2004) although Thai and Shewfelt (1991) found that L (lightness), C (chroma) and H(hue angle) from HunterLAB data were better correlated. Given that chocolates should meetprior acquired consumer expectations, appearance attributes can have significant commercialimplications.
Microstructure is a fundamental variable influencing transport phenomenon and physicalproperties of foods determining perceived quality in terms of mechanical and sensorial at-tributes (Kulozik et al., 2003). Consequently, microstructure is important for manipulation orregulation of texture and related to composition and physical forces influencing mechanicalproperties (van Marle et al., 1997; Afoakwa & Sefa-Dedeh, 2002). Varela et al. (2007) notedthat successful delivery in new product development requires understanding of factors that
P1: KAE/UKS P2: KAEc07 BLBK244-Afoakwa January 25, 2010 21:43 Printer Name: Yet to Come
104 Chocolate Science and Technology
influence texture. Improvement in the quality of existing foods and new product formulationsrequires interventions at microscopic level. Most elements that critically participate in trans-port properties, physical and rheological behaviours, textural and sensorial characters are lessthan 100 µm in diameter (Aguilera, 2005). Bourne (2002) concluded that texture is derivedfrom food structure and relationship between microstructure, and rheological and texturalproperties have been studied (Kulozik et al., 2003; Pereira et al., 2003; Remeuf et al., 2003;Braipson-Danthine & Deroanne, 2004; Sandoval-Castilla et al., 2004; Christiansen et al.,2006; Baixauli et al., 2007). However, there is limited information on relationship betweenmicrostructure and mechanical properties of finished dark chocolates specifically on howPSD and composition affect the microstructure and mechanical properties.
During chocolate manufacture, the crystalline state and the proportion of solid fat presentare important in determining the melting character in finished products. DSC has been used tocharacterise changes in chocolate melting profiles and measures the relative amounts of eachcrystalline state (Tabouret, 1987; Ziegleder & Schwingshandl, 1998; Walter & Cornillon,2001, 2002), and peaks corresponding to latent heat are observed in temperature rangesrelated to melting of specific polymorphs (McFarlane, 1999). Such information is relevantto sensory character and impacts on mechanical and rheological properties of chocolate andconfectionery shelf-life (Hartel, 2001).
As demand for dark chocolate products is increasing in global markets, understandingthe factors influencing the rheological, textural and melting properties as well as appearancewould be of value in predicting changes in quality. The acquired information would impacton process improvement and new product development in dark chocolate manufacture. Theobjectives of this work were to:
1. investigate effects of PSD and composition (fat and lecithin) on rheological behaviour ofmolten dark chocolate characterised, using steady shear measurements;
2. study the relationship between the two models (Casson’s model and the new ICA recom-mendations) for estimating dark chocolate rheological parameters;
3. evaluate effects of PSD and compositional variations on textural properties and appearanceof dark chocolates;
4. determine the influence of PSD and fat content on dark chocolate microstructure and howit relates to the rheological and mechanical properties of dark chocolates;
5. characterise the effects of PSD, fat and lecithin content on the crystallinity and meltingprofiles of finished dark chocolates;
6. explore relationships between rheological, textural and melting properties of dark choco-late as influenced by PSD of solids and composition during processing.
7.3 MATERIALS AND METHODS
7.3.1 Materials
Cocoa liquor of Central West African origin was obtained from Cargill Cocoa ProcessingCompany (York, UK); sucrose (pure fine granulated) from British Sugar Company (Peter-borough, UK); pure prime-pressed cocoa butter and soy lecithin from ADM Cocoa Limited(Koog aan de Zaan, the Netherlands) and Unitechem Company Ltd (Tianjin, China), respec-tively.
P1: KAE/UKS P2: KAEc07 BLBK244-Afoakwa January 25, 2010 21:43 Printer Name: Yet to Come
Structure – properties (rheology, texture and melting) relationships in chocolate manufacture 105
Table 7.1 Recipes used for the formulation of the dark chocolate
Ingredient25% fat(% w/w)
30% fat(% w/w)
35% fat(% w/w)
Sucrose 58.8 59.0 49.7 49.9 40.7 40.8Cocoa liquor 35.9 35.5 45.0 44.6 54.0 53.7Cocoa butter 5.0 5.0 5.0 5.0 5.0 5.0Lecithin 0.3 0.5 0.3 0.5 0.3 0.5
7.3.2 Preparation of chocolate samples
Dark chocolate formulations (Table 7.1) from sucrose, cocoa liquor, cocoa butter and emulsi-fier (lecithin) used total fat contents between 25 and 35% (w/w) (from cocoa liquor and cocoabutter) and a minimum of 35% total cocoa solids, to ensure conformation with standard ofidentity for dark chocolate of the Codex Revised Standard (2003) on chocolate and chocolateproducts, and European Commission Directive 2000/36/EC on cocoa products and chocolate(European Commission Directive, 2000).
Experimental samples (5 kg batch for each formulation) were produced by mixing sucroseand cocoa liquor in a Crypto Peerless mixer (Model K175, Crypto Peerless Ltd, Birmingham,UK) at low speed for 2 minutes and then at high speed for 3 minutes, refining using a three-roll refiner (Model SDX 600, Buhler Ltd, CH-9240 Uzwil, Switzerland), to predeterminedPSs (D90: 18 ± 1, 25 ± 1, 35 ± 1 and 50 ± 1 µm) confirmed by PS analysis.
Refined chocolates were stored in plastic containers and conditioned at ambient tempera-ture (20–22◦C) for 24 hours prior to conching in a Lipp Conche (Model IMC-E10, Boveristr40-42, D-68309, Mannhein, Germany) at low speed for 3.5 hours at 60◦C. Lecithin and co-coa butter were then added and mixtures were conched at high speed for further 30 minutesfor mixing and liquefaction. Samples were stored in sealed plastic containers at ambienttemperature (20 ± 2◦C), and moisture and fat contents were determined using Karl Fischerand Soxhlet methods (ICA, 1988, 1990), respectively.
7.3.3 Determination of particle size distribution
A MasterSizer R© Laser Diffraction Particle Size Analyzer equipped with MS 15 samplepresentation unit (refractive index 1.590) (Malvern Instrument Ltd, Malvern, England) wasused. About 0.2 g of refined dark chocolate was dispersed in vegetable oil (refractive index1.450) at ambient temperature (20 ± 2◦C) until an obscuration of 0.2 was obtained. Ultrasonicdispersion for 2 minutes to ensure particles were independently dispersed was maintainedby stirring. Size distribution was quantified as relative volume of particles in size bandspresented as size distribution curves (Malvern MasterSizer Micro Software v 2.19). PSDparameters obtained included specific surface area, largest PS (D90), mean particle volume(D50), smallest PS (D10), Sauter mean diameter (D[3,2]) and mean particle diameter (D[4,3]).The four PSDs used for the study are shown (Table 7.2).
7.3.4 Rheological measurements
The rheological behaviour of molten dark chocolate was characterised using steady shearmeasurements. All measurements were carried out in shear rate-controlled rheometer(Thermo Haake ViscoTester 550 (VT 550), Thermo Electron Corp., Karlsruhe, Germany)

P1: KAE/UKS P2: KAEc07 BLBK244-Afoakwa January 25, 2010 21:43 Printer Name: Yet to Come
106 Chocolate Science and Technology
Table
7.2
Parti
cle
size
distr
ibut
ion
ofth
eda
rkch
ocol
ates
Part
icle
size
dis
trib
ution
Part
icle
size
(D9
0)a
(µm
)Fa
tco
nte
nt
(%)
Spec
ific
surf
ace
are
a(m
2g
−1)
D(v
,0.1
)a(µ
m)
D(v
,0.5
)a(µ
m)
D[3
,2]a
(µm
)D
[4,3
]a(µ
m)
D(v
,0.9
)a(µ
m)
18±
1.0
251.
97±
0.04
1.09
±0.
034.
72±
0.05
2.61
±0.
047.
80±
0.06
18.7
1±
0.19
301.
89±
0.03
1.04
±0.
034.
89±
0.05
2.63
±0.
048.
02±
0.05
18.7
2±
0.46
351.
54±
0.03
1.39
±0.
046.
03±
0.06
3.17
±0.
058.
44±
0.03
18.6
0±
0.24
25±
1.0
251.
65±
0.06
1.22
±0.
045.
62±
0.04
2.92
±0.
0410
.28
±0.
0725
.60
±0.
0430
1.58
±0.
021.
24±
0.02
5.79
±0.
063.
02±
0.03
10.3
2±
0.14
25.5
3±
0.65
351.
45±
0.02
1.45
±0.
056.
63±
0.06
3.43
±0.
0610
.39
±0.
0825
.06
±0.
3235
±1.
025
1.46
±0.
041.
40±
0.04
6.59
±0.
073.
36±
0.03
13.3
5±
0.08
35.5
3±
0.14
301.
42±
0.02
1.46
±0.
036.
70±
0.02
3.49
±0.
0213
.36
±0.
0735
.59
±0.
2735
1.28
±0.
051.
68±
0.06
7.54
±0.
063.
85±
0.05
13.5
5±
0.09
35.3
9±
1.14
50±
1.0
251.
30±
0.01
1.59
±0.
037.
69±
0.03
3.74
±0.
0517
.46
±0.
0550
.16
±0.
6530
1.26
±0.
041.
68±
0.03
7.97
±0.
053.
80±
0.06
17.5
8±
0.06
50.4
1±
0.79
351.
10±
0.04
2.04
±0.
049.
08±
0.09
4.47
±0.
0617
.90
±0.
0550
.08
±0.
48
Mea
nva
lues
±sta
ndar
dde
viat
ions
from
tripl
icat
ean
alys
is.
aD
(v,0
.1),
D(v
,0.5
),D
[3,2
],D
[4,3
]and
D(v
,0.9
),re
spec
tivel
y,re
pres
ent1
0%,5
0%,S
aute
rmea
ndi
amet
er,m
ean
parti
cle
diam
eter
and
90%
ofal
lpar
ticle
sfin
erth
anth
issi
ze.

P1: KAE/UKS P2: KAEc07 BLBK244-Afoakwa January 25, 2010 21:43 Printer Name: Yet to Come
Structure – properties (rheology, texture and melting) relationships in chocolate manufacture 107
using bob and cup (recessed end) geometry (sensor SVI and SVII), as for IOCCC method(Aeschlimann & Beckett, 2000) with a ratio of inner to outer radius of 0.92 in the concentriccylinder system. Samples were incubated at 50◦C for 75 minutes for melting and transferred,pre-sheared at 5 s−1 rate for 15 minutes at 40◦C, before measurement cycles. Shear stress wasmeasured at 40◦C as function of increasing shear rate from 5 to 50 s−1 (ramp up) within 120seconds, and then decreasing from 50 to 5 s−1 (ramp down), within each ramp 50 measure-ments were taken. Viscosity was also measured as a function of increasing shear rate from5 to 50 s−1 (ramp down) within 120 seconds, and then decreasing from 50 to 5 s−1 (rampup), within each ramp 50 measurements were taken. Temperature of the chocolate sampleswas controlled during the experiment using Haake K20 Thermo-regulator (Thermo ElectronCorp., Karlsruhe, Germany). Mean value and standard deviation of triplicate readings wererecorded. Casson plastic viscosity and Casson yield values were calculated using Cassonmodel (Eq. 7.2) and interpolation data from the viscosity and shear stress graphs (Fig. 7.1),respectively, using ThermoHaake RheoWin Pro 297 Software by the least square method.
0 10 20 30 40 50
(a)
Á [1/s]
0
50
100
150
200
‚ [
Pa]
2
4
6
8
10
12
14
16
18
ƒ
[Pas
]
Thermo Electron (Karlsruhe) RheoWin Pro 2.97
‚ = f (Á)ƒ = f (Á)
Shear rate (s−1)
Visco
sity (Pa·s) S
hea
r st
ress
(P
a)
Shear stress curve
Viscosity curve
Apparent viscosity value (Pa·s)
Yieldstress value
(Pa)
Sample 24 (1) - PSD 50 µm - fat 35% - lecithin 0.5%
Fig. 7.1 Typical rheology graph illustrating measurement of (a) apparent viscosity and yield stressand (b) thixotropy from two dark chocolates containing (a) 50 µm PS, 35% fat and 0.5% lecithin, and(b) 50 µm PS, 25% fat and 0.5%. lecithin.
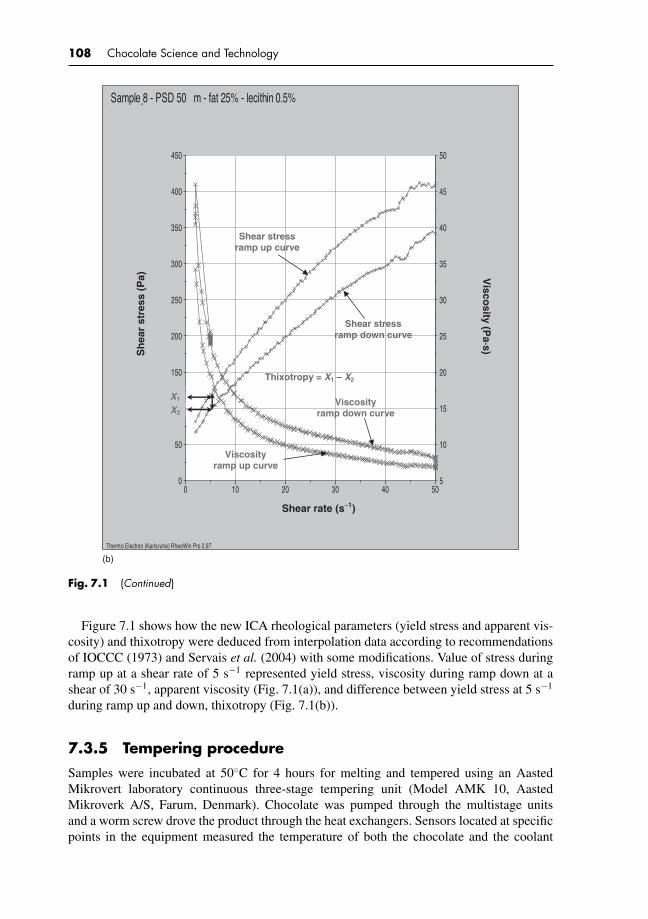
P1: KAE/UKS P2: KAEc07 BLBK244-Afoakwa January 25, 2010 21:43 Printer Name: Yet to Come
108 Chocolate Science and Technology
0 10 20 30 40 50
Á [1/s]
0
50
100
150
200
250
300
350
400
450
‚ [P
a]
5
10
15
20
25
30
35
40
45
50
ƒ [
Pa
s]
Thermo Electron (Karlsruhe) RheoWin Pro 2.97
Sample 8 - PSD 50 µm - fat 25% - lecithin 0.5%‚ = f (Á)
ƒ = f (Á)
Shear rate (s−1)
Visco
sity (Pa·s) S
hea
r st
ress
(P
a)
X1
X2
Thixotropy = X1 – X2
Shear stress ramp up curve
Shear stressramp down curve
Viscosityramp up curve
Viscosityramp down curve
(b)
Fig. 7.1 (Continued)
Figure 7.1 shows how the new ICA rheological parameters (yield stress and apparent vis-cosity) and thixotropy were deduced from interpolation data according to recommendationsof IOCCC (1973) and Servais et al. (2004) with some modifications. Value of stress duringramp up at a shear rate of 5 s−1 represented yield stress, viscosity during ramp down at ashear of 30 s−1, apparent viscosity (Fig. 7.1(a)), and difference between yield stress at 5 s−1
during ramp up and down, thixotropy (Fig. 7.1(b)).
7.3.5 Tempering procedure
Samples were incubated at 50◦C for 4 hours for melting and tempered using an AastedMikrovert laboratory continuous three-stage tempering unit (Model AMK 10, AastedMikroverk A/S, Farum, Denmark). Chocolate was pumped through the multistage unitsand a worm screw drove the product through the heat exchangers. Sensors located at specificpoints in the equipment measured the temperature of both the chocolate and the coolant

P1: KAE/UKS P2: KAEc07 BLBK244-Afoakwa January 25, 2010 21:43 Printer Name: Yet to Come
Structure – properties (rheology, texture and melting) relationships in chocolate manufacture 109
fluid at each stage. The temperatures of each of the three stages were thus set and con-trolled independently of each other to obtain a final chocolate temperature of approximately27◦C to promote crystal growth of the desired triacylglyceride fractions. Pre-crystallisationwas measured using a computerised tempermeter (Exotherm 7400, Systech Analytics, SA,Switzerland). A built-in algorithm was used to ensure an optimal temper regime of slope0 ± 0.3 (5.0 ± 1.0 chocolate temper unit). The principle of this method has been described byNelson (1999). The tempered chocolate was moulded using plastic moulds – 80 mm length,20 mm breadth and 8 mm height – allowed to cool in a refrigerator (12◦C) for 2 hours beforedemoulding onto plastic trays and conditioned at 20 ± 2◦C for 14 days before analysis.
7.3.6 Texture measurements
Texture of molten chocolates was evaluated using a TA-HD Plus Texture Analyzer (StableMicro Systems, Godalming, Surrey, England) with back extrusion rig and a 35 mm diametercompression disk attached to an extension bar using 50 kg load cell (Fig. 7.2(a)). Samplesmelted at 50◦C for 75 minutes were quickly transferred to a standard back extrusion container(50 mm diameter) and work was done in back, extruding 100 mL chocolate determined bymeasuring force in compression. Eight replications were made at a pre-test 1.0 mm/second,test of 0.5 mm/second and post-test 10.0 mm/second at 50 mm above sample surface,penetrating 30 mm for 60 seconds, then returning to the start position. Mean values wereused to obtain a force–time graph (XT.RA Dimension, Exponent 32 software; Stable MicroSystems) as shown in Figure 7.3(a) by calculating as texture parameters:
1. Firmness = maximum compression force in extrusion thrust into sample (g).2. Consistency = area within curve during extrusion thrust (g.s).
(a)
Machine base Machine base
Locating base plate
Back extrusion pot
Compression disc
Probe
Upper jaw(attached to load cell carrier)
Sample
Top plate
SpringSpring
Base plate
Load cell carrier
(b)
Fig. 7.2 Back extrusion rig (a) and puncture test rig (b) used for texture measurements of molten andsolid chocolates, respectively. With kind permission from Springer Science and Business Media, Afoakwaet al. (2008b).

P1: KAE/UKS P2: KAEc07 BLBK244-Afoakwa January 25, 2010 21:43 Printer Name: Yet to Come
110 Chocolate Science and Technology
Firmness
Index of viscosity
Cohesiveness
Consistency
Hardness
Stickiness
(a)
(b)
5000
0.20
0.15
0.10
0.05
0.00
−0.05
−0.10
−0.20
−0.25
−0.15
0 10 20 30 40
2F1
3
60
Force (g) None
Force (kg) None
4000
3000
2000
1000
0
−1000
0 1 2 3 4 6 7Time (second)
Time (second)
85
Fig. 7.3 Typical (a) back extrusion curve and (b) penetration probe curve used for the measurement ofmolten and solid dark chocolates, respectively. With kind permission from Springer Science and BusinessMedia, Afoakwa et al. (2008b).
P1: KAE/UKS P2: KAEc07 BLBK244-Afoakwa January 25, 2010 21:43 Printer Name: Yet to Come
Structure – properties (rheology, texture and melting) relationships in chocolate manufacture 111
3. Cohesiveness = maximum compression force during withdrawal of probe from sample(g).
4. Index of viscosity = area within negative region of curve during probe withdrawal (g.s).
Hardness of solid tempered chocolate was measured using TA-HD Plus Texture Analyzerwith a penetration probe (needle P/2) attached to an extension bar and a 50-kg load celland a platform (Fig. 7.2(b)). Maximum penetration force through a sample (80 × 20 mm,depth 8 mm) was determined with eight replications at a pre-speed of 1.0 mm/second, testof 2.0 mm/second, post-speed of 1.0 mm/second, penetrating 6 mm for 3 seconds at 20◦C,converting mean values into hardness data on a force–time graph using XT.RA Dimension,Exponent 32 software (Stable Micro Systems, Godalming, Surrey, UK) as shown in Figure7.3(b).
7.3.7 Colour measurements of solid dark chocolate
HunterLab MiniscanTM XE Colorimeter Model 45/0 LAV (Hunter Associates Inc., Reston,VA, USA) calibrated with white ceramic reference standard was used. Colour images ofchocolate surfaces were converted into XYZ tristimulus values, which were further convertedto CIELAB system: L*, luminance ranging from 0 (black) to 100 (white); and a* (green tored) and b* (blue to yellow) with values from −120 to +120. Information was obtainedusing a software algorithm (Matlab v. 6.5; The Math-Works, Inc., Natick, MA, USA): hueangle (h◦) = arctan (b*/a*); chroma (C*) = [(a*)2 + (b*)2]
12 . Mean values from five replicate
measurements and standard deviations were calculated.
7.3.8 Microstructure analysis
Microstructures were observed using a high resolution polarised light microscope (OlympusOptical U-PMTVC, Tokyo, Japan). One drop (10 µL) of molten chocolate (previously heatedat 55◦C to destroy crystal memory) was placed on a pre-heated (55◦C) glass slide. A cover slipwas carefully placed over the sample, parallel to the plane of the slide and centred to ensuresample thickness was uniform. Specimens were observed immediately at ×20 magnification,and micrographs (black and white images) were captured using a digital camera (Model 2.1Rev 1, Polaroid Corporation, NY, USA) and observed using Adobe Photoshop (version CS2,Adobe Systems Inc., NJ, USA).
7.3.9 Determination of melting properties of dark chocolates
The differential scanning calorimeter (DSC Series 7, Perkin Elmer Pyris, Norwalk, CT, USA)equipped with a thermal analysis data station was calibrated using indium and octadecaneat a scan rate of 5◦C/minute using an aluminium pan as reference. Samples (∼5 mg) wereloaded into 40 µL capacity pans with holes and sealed with lids using a sample press. Panswere heated at 5◦C/minute from 15 to 55◦C in an N2 stream. Onset temperature (Tonset),peak temperature (Tpeak), end temperature (Tend) and enthalpy of melting (�Hmelt) werecalculated automatically by the software. Melting index (T index) was computed as Tend–Tonset,as described by Vasanthan and Bhatty (1996). Each sample was analysed in triplicate andmean values and standard deviations were reported.
P1: KAE/UKS P2: KAEc07 BLBK244-Afoakwa January 25, 2010 21:43 Printer Name: Yet to Come
112 Chocolate Science and Technology
7.3.10 Experimental design and statistical analysis
Three key experimental variables were PSD, fat and lecithin contents with other variablesincluding refiner temperature and pressure, conching time and temperature, and cocoa butter(5% (w/w)) held constant. A 4 × 3 × 2 factorial experimental design was used with principalfactors: PSD (D90) 18, 25, 35 and 50 µm; fat content 25, 30 and 35% (w/w); lecithin content0.3 and 0.5% (w/w).
Statgraphics Plus 4.1 (Graphics Software System, STCC, Inc., Rockville, MD, USA)was used to examine the rheological properties (Casson plastic viscosity and yield values,apparent viscosity, yield stress and thixotropy), textural properties (firmness, consistency,cohesiveness, index of viscosity of molten chocolate and hardness of tempered chocolate),colour – lightness (L*), chromaticity (C*) and hue angle (h◦) – and melting properties –melting onset (Tonset), melting end (Tend), melting index (T index) and peak melting (Tpeak)and melting enthalpy (�Hmelt) – using two-way analysis of variance (ANOVA) and multiplerange tests to determine effects of PSD, fat and lecithin contents and their interactions. Tukeymultiple comparisons at 95% significance level were conducted to determine differences be-tween factor levels. Multivariate statistical techniques comprising regression, correlation andprincipal component analyses were used to evaluate the relationships between the rheologi-cal, textural and melting parameters. All process treatments and analysis were conducted inthree replicates and the mean values reported.
7.4 RESULTS AND DISCUSSION
7.4.1 Particle size distribution of molten dark chocolate
The PSD parameters from the four PSs are presented in Table 7.2. Wide variations inPSD were produced with intervals ranging between 18, 25, 35 and 50 µm, using D90
(90% finer than this size). The D90 value was used as it has been reported to correlatefairly on sensory character with micrometer measurements made of the biggest particles(Beckett, 2000). Figure 7.4(a–d) shows volume histograms of samples with size distributionsof narrow bimodal distribution for 18 µm PS (Fig. 7.4(a)), wide bimodal distribution for25 µm PS (Fig. 7.4(b)), narrow multimodal distribution for 35 µm PS (Fig. 7.4(c)) and awide multimodal distribution for 50 µm (Fig. 7.4(d)). Such PSD, ranging from fine (18 µm)to coarse particles (50 µm), covers optimal minima and maxima (Ziegler & Hogg, 1999;Beckett, 2000, 2003).
Data from the PSD parameters (Table 7.2) showed variations in specific surface area,mean particle volume D(v,50), Sauter mean diameter (D[3,2]) and mean particle diameter(D[4,3]) with increasing D90 PSs. Increasing D90 from 18 to 50 µm led to significant (p ≤0.05) reduction in specific surface area, with increases in Sauter mean and mean particlediameter (Table 7.2) that indicate that the largest PS (D90) is directly proportional to theD10, D50, Sauter mean diameter (D[3,2]) and mean particle diameter (D[4,3]), and inverselyproportional to specific particle surface area.
Similarly, increasing fat content from 25 to 35% led to significant (p < 0.05) reductionin specific surface area, with increases in other PSD parameters (Table 7.3), suggesting fatcontent at refining had a direct influence on PSD. Reduction in sugar levels, with increasedfat content, influences PSD.

P1: KAE/UKS P2: KAEc07 BLBK244-Afoakwa January 25, 2010 21:43 Printer Name: Yet to Come
Structure – properties (rheology, texture and melting) relationships in chocolate manufacture 113
Beckett (1999) concluded that the largest PS and specific surface area of solids are the twokey parameters: the largest particle diameter impacting on coarseness, and surface area withrequirement of fat to obtain desirable flow properties. As size increases, particles becomemore spherical, leading to broadening of PSD with consequential reduction in solid loadingas fat content increases. Reduction in specific surface area with increasing PSs of componentPSD has been reported (Beckett, 1999; Ziegler & Hogg, 1999; Sokmen & Gunes, 2006).Analyses showed that total fat values were within the stipulated ranges of 25% ± 1% (w/w),30% ± 1% (w/w) and 35% ± 1% (w/w), respectively, and moisture contents were within therange 0.8–0.98%.
(a)
(b)
Particle diameter (µm)
Vol
ume
(%)
0
10
0.1 1.0 10.0 100.0 1000.0
Particle diameter (µm)
Vol
ume
(%)
0
10
0.1 1.0 10.0 100.0 1000.0
Fig. 7.4 Particle size distribution of dark chocolate with D90 of (a) 18, (b) 25, (c) 35 and (d) 50 µm.With kind permission from Springer Science and Business Media, Afoakwa et al. (2008b).
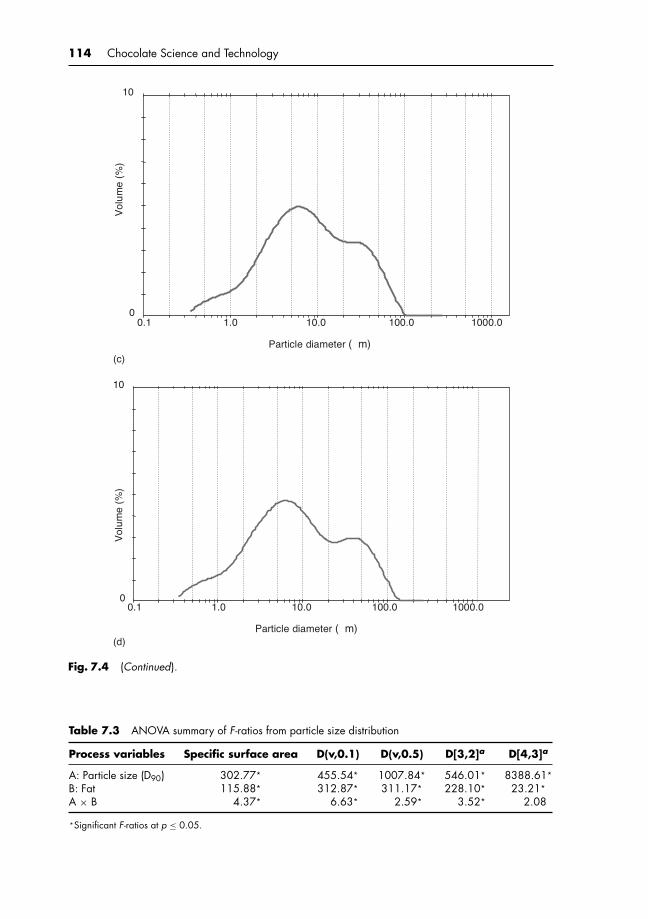
P1: KAE/UKS P2: KAEc07 BLBK244-Afoakwa January 25, 2010 21:43 Printer Name: Yet to Come
114 Chocolate Science and Technology
Particle diameter (µm)
0
10
0.1 1.0 10.0 100.0 1000.0
Vol
ume
(%)
Particle diameter (µm)
0
10
0.1 1.0 10.0 100.0 1000.0
Vol
ume
(%)
(c)
(d)
Fig. 7.4 (Continued).
Table 7.3 ANOVA summary of F-ratios from particle size distribution
Process variables Specific surface area D(v,0.1) D(v,0.5) D[3,2]a D[4,3]a
A: Particle size (D90) 302.77* 455.54* 1007.84* 546.01* 8388.61*
B: Fat 115.88* 312.87* 311.17* 228.10* 23.21*
A × B 4.37* 6.63* 2.59* 3.52* 2.08
*Significant F-ratios at p ≤ 0.05.

P1: KAE/UKS P2: KAEc07 BLBK244-Afoakwa January 25, 2010 21:43 Printer Name: Yet to Come
Structure – properties (rheology, texture and melting) relationships in chocolate manufacture 115
7.4.2 Rheological properties of molten dark chocolate
7.4.2.1 Casson plastic viscosity
Plastic viscosity relates to pumping characteristics, filling of rough surfaces, coating prop-erties and sensory character of body (Seguine, 1988). Increasing PS drastically decreasedplastic viscosity with 25% fat and 0.3% lecithin samples; while only slight decreases werenoted with 30 and 35% fat at all lecithin levels (Fig. 7.5). Plastic viscosity with 25% fatand 0.3% lecithin was reduced from 20.42 to 9.46 Pa·s, respectively, for 18 and 50 µm PSsamples representing over 50% reduction but not with 0.5% lecithin at 25% fat. Likewise,changes in PS and lecithin content had no significant effect on plastic viscosity with 30 and35% fat samples. Higher plastic viscosities in low-fat chocolate can be explained as whendistribution of PSs becomes wider with a large specific surface area – the smaller particles fillspaces between larger, reducing viscosity of suspension for any given solid concentration.Increasing fat content reduces specific surface area (Table 7.2), restricting solids, packingability with no apparent change in plastic viscosity. In addition, as the particles become finer,their number increases with parallel increase in points of contact between particles, thusincreasing their plastic viscosities. Servais et al. (2002) reported that viscosity can doublewith solid content increases of a few percentage for high solid content suspensions.
Increasing fat content from 25 to 30% led to reduced plastic viscosities at all PSs andlecithin concentrations. At 18 µm, 5% increase in fat gave up to tenfold reduction in plasticviscosity, indicating that fat had effects on plastic viscosity especially at lower PS (18–25µm) and lower lecithin levels. However, at and above 30% fat, differences in plastic viscosity
2530
35 18
25
3550
0
2
4
6
8
10
12
14
16
18
20
Cas
son
pla
stic
vis
cosi
ty (
Pa·
s)
Fat (%)Particle size (D90, m)
18 25 35 500.5%Lec
0.3%Lec
0.3%Lec
0.5%Lec
0.3%Lec
0.5%Lec
0.3%Lec
0.5%Lec
Legend: Particle size (D90, m) & Lecithin (%)
Fig. 7.5 Effect of PSD, fat and lecithin content on Casson plastic viscosity of dark chocolate. With kindpermission from Springer Science and Business Media, Afoakwa et al. (2008b).
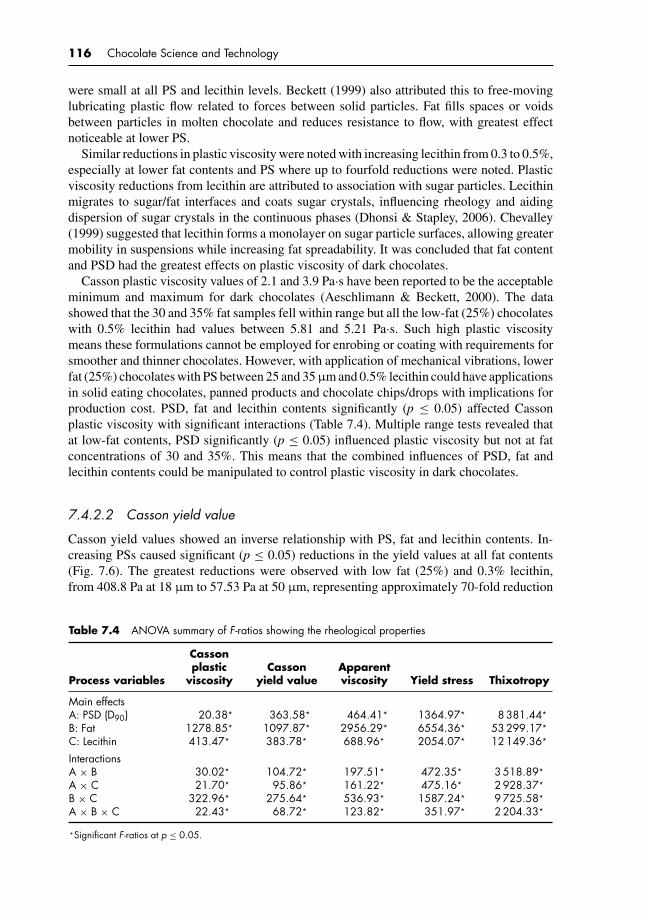
P1: KAE/UKS P2: KAEc07 BLBK244-Afoakwa January 25, 2010 21:43 Printer Name: Yet to Come
116 Chocolate Science and Technology
were small at all PS and lecithin levels. Beckett (1999) also attributed this to free-movinglubricating plastic flow related to forces between solid particles. Fat fills spaces or voidsbetween particles in molten chocolate and reduces resistance to flow, with greatest effectnoticeable at lower PS.
Similar reductions in plastic viscosity were noted with increasing lecithin from 0.3 to 0.5%,especially at lower fat contents and PS where up to fourfold reductions were noted. Plasticviscosity reductions from lecithin are attributed to association with sugar particles. Lecithinmigrates to sugar/fat interfaces and coats sugar crystals, influencing rheology and aidingdispersion of sugar crystals in the continuous phases (Dhonsi & Stapley, 2006). Chevalley(1999) suggested that lecithin forms a monolayer on sugar particle surfaces, allowing greatermobility in suspensions while increasing fat spreadability. It was concluded that fat contentand PSD had the greatest effects on plastic viscosity of dark chocolates.
Casson plastic viscosity values of 2.1 and 3.9 Pa·s have been reported to be the acceptableminimum and maximum for dark chocolates (Aeschlimann & Beckett, 2000). The datashowed that the 30 and 35% fat samples fell within range but all the low-fat (25%) chocolateswith 0.5% lecithin had values between 5.81 and 5.21 Pa·s. Such high plastic viscositymeans these formulations cannot be employed for enrobing or coating with requirements forsmoother and thinner chocolates. However, with application of mechanical vibrations, lowerfat (25%) chocolates with PS between 25 and 35 µm and 0.5% lecithin could have applicationsin solid eating chocolates, panned products and chocolate chips/drops with implications forproduction cost. PSD, fat and lecithin contents significantly (p ≤ 0.05) affected Cassonplastic viscosity with significant interactions (Table 7.4). Multiple range tests revealed thatat low-fat contents, PSD significantly (p ≤ 0.05) influenced plastic viscosity but not at fatconcentrations of 30 and 35%. This means that the combined influences of PSD, fat andlecithin contents could be manipulated to control plastic viscosity in dark chocolates.
7.4.2.2 Casson yield value
Casson yield values showed an inverse relationship with PS, fat and lecithin contents. In-creasing PSs caused significant (p ≤ 0.05) reductions in the yield values at all fat contents(Fig. 7.6). The greatest reductions were observed with low fat (25%) and 0.3% lecithin,from 408.8 Pa at 18 µm to 57.53 Pa at 50 µm, representing approximately 70-fold reduction
Table 7.4 ANOVA summary of F-ratios showing the rheological properties
Process variables
Cassonplastic
viscosityCasson
yield valueApparentviscosity Yield stress Thixotropy
Main effectsA: PSD (D90) 20.38* 363.58* 464.41* 1364.97* 8 381.44*
B: Fat 1278.85* 1097.87* 2956.29* 6554.36* 53 299.17*
C: Lecithin 413.47* 383.78* 688.96* 2054.07* 12 149.36*
InteractionsA × B 30.02* 104.72* 197.51* 472.35* 3 518.89*
A × C 21.70* 95.86* 161.22* 475.16* 2 928.37*
B × C 322.96* 275.64* 536.93* 1587.24* 9 725.58*
A × B × C 22.43* 68.72* 123.82* 351.97* 2 204.33*
*Significant F-ratios at p ≤ 0.05.
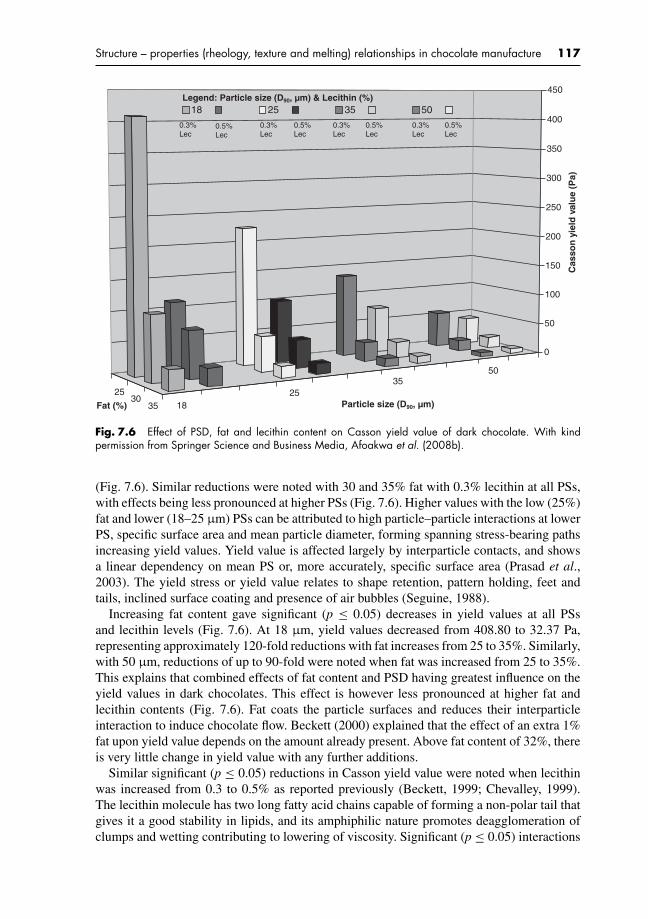
P1: KAE/UKS P2: KAEc07 BLBK244-Afoakwa January 25, 2010 21:43 Printer Name: Yet to Come
Structure – properties (rheology, texture and melting) relationships in chocolate manufacture 117
2530
35 1825
3550
0
50
100
150
200
250
300
350
400
450
Cas
son
yie
ld v
alu
e (P
a)
Fat (%) Particle size (D90, m)
18 25 35 50
0.3%Lec
0.3%Lec
0.3%Lec
0.3%Lec
0.5%Lec
0.5%Lec
0.5%Lec
0.5%Lec
Legend: Particle size (D90, m) & Lecithin (%)
Fig. 7.6 Effect of PSD, fat and lecithin content on Casson yield value of dark chocolate. With kindpermission from Springer Science and Business Media, Afoakwa et al. (2008b).
(Fig. 7.6). Similar reductions were noted with 30 and 35% fat with 0.3% lecithin at all PSs,with effects being less pronounced at higher PSs (Fig. 7.6). Higher values with the low (25%)fat and lower (18–25 µm) PSs can be attributed to high particle–particle interactions at lowerPS, specific surface area and mean particle diameter, forming spanning stress-bearing pathsincreasing yield values. Yield value is affected largely by interparticle contacts, and showsa linear dependency on mean PS or, more accurately, specific surface area (Prasad et al.,2003). The yield stress or yield value relates to shape retention, pattern holding, feet andtails, inclined surface coating and presence of air bubbles (Seguine, 1988).
Increasing fat content gave significant (p ≤ 0.05) decreases in yield values at all PSsand lecithin levels (Fig. 7.6). At 18 µm, yield values decreased from 408.80 to 32.37 Pa,representing approximately 120-fold reductions with fat increases from 25 to 35%. Similarly,with 50 µm, reductions of up to 90-fold were noted when fat was increased from 25 to 35%.This explains that combined effects of fat content and PSD having greatest influence on theyield values in dark chocolates. This effect is however less pronounced at higher fat andlecithin contents (Fig. 7.6). Fat coats the particle surfaces and reduces their interparticleinteraction to induce chocolate flow. Beckett (2000) explained that the effect of an extra 1%fat upon yield value depends on the amount already present. Above fat content of 32%, thereis very little change in yield value with any further additions.
Similar significant (p ≤ 0.05) reductions in Casson yield value were noted when lecithinwas increased from 0.3 to 0.5% as reported previously (Beckett, 1999; Chevalley, 1999).The lecithin molecule has two long fatty acid chains capable of forming a non-polar tail thatgives it a good stability in lipids, and its amphiphilic nature promotes deagglomeration ofclumps and wetting contributing to lowering of viscosity. Significant (p ≤ 0.05) interactions
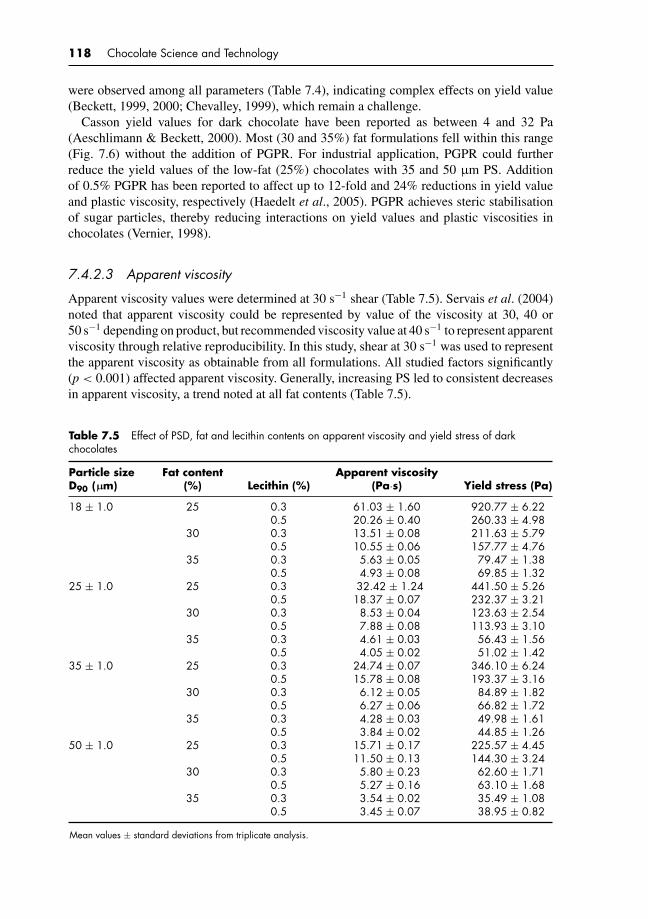
P1: KAE/UKS P2: KAEc07 BLBK244-Afoakwa January 25, 2010 21:43 Printer Name: Yet to Come
118 Chocolate Science and Technology
were observed among all parameters (Table 7.4), indicating complex effects on yield value(Beckett, 1999, 2000; Chevalley, 1999), which remain a challenge.
Casson yield values for dark chocolate have been reported as between 4 and 32 Pa(Aeschlimann & Beckett, 2000). Most (30 and 35%) fat formulations fell within this range(Fig. 7.6) without the addition of PGPR. For industrial application, PGPR could furtherreduce the yield values of the low-fat (25%) chocolates with 35 and 50 µm PS. Additionof 0.5% PGPR has been reported to affect up to 12-fold and 24% reductions in yield valueand plastic viscosity, respectively (Haedelt et al., 2005). PGPR achieves steric stabilisationof sugar particles, thereby reducing interactions on yield values and plastic viscosities inchocolates (Vernier, 1998).
7.4.2.3 Apparent viscosity
Apparent viscosity values were determined at 30 s−1 shear (Table 7.5). Servais et al. (2004)noted that apparent viscosity could be represented by value of the viscosity at 30, 40 or50 s−1 depending on product, but recommended viscosity value at 40 s−1 to represent apparentviscosity through relative reproducibility. In this study, shear at 30 s−1 was used to representthe apparent viscosity as obtainable from all formulations. All studied factors significantly(p < 0.001) affected apparent viscosity. Generally, increasing PS led to consistent decreasesin apparent viscosity, a trend noted at all fat contents (Table 7.5).
Table 7.5 Effect of PSD, fat and lecithin contents on apparent viscosity and yield stress of darkchocolates
Particle sizeD90 (µm)
Fat content(%) Lecithin (%)
Apparent viscosity(Pa·s) Yield stress (Pa)
18 ± 1.0 25 0.3 61.03 ± 1.60 920.77 ± 6.220.5 20.26 ± 0.40 260.33 ± 4.98
30 0.3 13.51 ± 0.08 211.63 ± 5.790.5 10.55 ± 0.06 157.77 ± 4.76
35 0.3 5.63 ± 0.05 79.47 ± 1.380.5 4.93 ± 0.08 69.85 ± 1.32
25 ± 1.0 25 0.3 32.42 ± 1.24 441.50 ± 5.260.5 18.37 ± 0.07 232.37 ± 3.21
30 0.3 8.53 ± 0.04 123.63 ± 2.540.5 7.88 ± 0.08 113.93 ± 3.10
35 0.3 4.61 ± 0.03 56.43 ± 1.560.5 4.05 ± 0.02 51.02 ± 1.42
35 ± 1.0 25 0.3 24.74 ± 0.07 346.10 ± 6.240.5 15.78 ± 0.08 193.37 ± 3.16
30 0.3 6.12 ± 0.05 84.89 ± 1.820.5 6.27 ± 0.06 66.82 ± 1.72
35 0.3 4.28 ± 0.03 49.98 ± 1.610.5 3.84 ± 0.02 44.85 ± 1.26
50 ± 1.0 25 0.3 15.71 ± 0.17 225.57 ± 4.450.5 11.50 ± 0.13 144.30 ± 3.24
30 0.3 5.80 ± 0.23 62.60 ± 1.710.5 5.27 ± 0.16 63.10 ± 1.68
35 0.3 3.54 ± 0.02 35.49 ± 1.080.5 3.45 ± 0.07 38.95 ± 0.82
Mean values ± standard deviations from triplicate analysis.

P1: KAE/UKS P2: KAEc07 BLBK244-Afoakwa January 25, 2010 21:43 Printer Name: Yet to Come
Structure – properties (rheology, texture and melting) relationships in chocolate manufacture 119
The trends with apparent viscosity were similar with Casson plastic viscosity; increasingPSs from 18 to 50 µm led to significant decreases in apparent viscosity, more pronounced atlow fat (25%). Increasing fat content had similar inverse relationship with apparent viscositybut less effect at both 30 and 35% fat at all PSs, and finally, lecithin increase from 0.3 to0.5% caused further reductions in apparent viscosity for all PSs and fat contents (Table 7.5).Influence on apparent viscosity of dark chocolates was more dependent on fat and lecithincontent. ANOVA showed that PSD, fat and lecithin contents significantly (p ≤ 0.05) affecteddark chocolate’s apparent viscosity with significant interactions among factors (Table 7.4).
7.4.2.4 Yield stress
Yield stress relates to energy required to initiate chocolate flow and is important in keepingsmall solid particles in suspension and in coating of solid surfaces (Yoo & Rao, 1995). Valueswere significantly (p ≤ 0.05) influenced by PSD, fat and lecithin contents as for Casson yieldvalue. Increases in PSs from 18 to 50 µm caused significant (p ≤ 0.05) reductions at all fatcontents with the greatest reductions with low-fat (25%) chocolates containing 0.3% lecithin,from 920.77 Pa for 18 µm to 225.57 Pa in the 50 µm (Table 7.5). Trends were similar for30 and 35% fat and 0.3% lecithin with increasing PSs but less pronounced with 30 and 35%fat contents. Higher yield stress with lower PSs and lower fat levels could result from higherspecific surface area with lower PS, showing an inverse relationship. Servais et al. (2004)suggested that yield stress depends on proportion of small particles (specific surface area)and on their interactions, originating in mechanical (friction) and chemical effects.
Fat and lecithin content effects on yield stress were comparable to trends noted with theCasson yield values. Increasing fat led to significant (p ≤ 0.05) decreases in yield stress at allPS and lecithin levels (Table 7.5), with higher yield stress values noted at 18 µm and lower fatcontent (25%), decreasing from 25 to 35% fat at all PSs, which could be attributed to coatingof fat on particle surfaces, reducing interparticle interaction and inducing flow in a directrelationship with fat content. Similarly, significant (p ≤ 0.05) reductions in yield stress werenoted when lecithin was increased from 0.3 to 0.5%, at all PSs and fat contents. Significant(p ≤ 0.05) interactions were observed among all the processing parameters (Table 7.4). Fatcontent had the greatest influence in reducing yield stress in dark chocolates followed bylecithin content and then PSD.
7.4.2.5 Thixotropy
Thixotropy is when apparent viscosity or shear stress decreases with time of shear at a constantrate (Chhabra, 2007). During shearing, the continuous decrease in apparent viscosity andsubsequent recovery of shear stress or apparent viscosity when flow is discontinued createsa hysteresis loop. Thixotropy is quantified from the area of loop or specific point on rampcurves of shear stress or apparent viscosity at a specific shear rate, usually 5 or 40 s−1.A certified method has still to be denoted (ICA, 2000; Cheng, 2003; Servais et al., 2004),but a well-conched chocolate should not be thixotropic. Difference between yield stressesmeasured at a shear of 5 s−1 during ramp up and down in shear was used to representthixotropy.
PSD, fat and lecithin content – all had significant effects on thixotropy although thisobservation was only made on the low fat (25%). The samples containing 30 and 35% fat

P1: KAE/UKS P2: KAEc07 BLBK244-Afoakwa January 25, 2010 21:43 Printer Name: Yet to Come
120 Chocolate Science and Technology
0
100
200
300
400
500
600
700
Th
ixo
tro
py
(Pa·
s−1)
25 30 35
Fat (%)
18 25 35 50
Legend: Particle size (D90, m) & Lecithin (%)
0.3%Lec
0.3%Lec
0.3%Lec
0.3%Lec
0.5%Lec
0.5%Lec
0.5%Lec
0.5%Lec
Fig. 7.7 Effect of PSD, fat and lecithin content on thixotropy of dark chocolate. With kind permissionfrom Springer Science and Business Media, Afoakwa et al. (2008b).
contents exhibited little thixotropy, implying that irrespective of PSD, fat and lecithin content,chocolates of 30% or more fat were not thixotropic (Fig. 7.7).
With the exception of 50 µm, which had reduced thixotropy values, all 25% fat samplesexhibited high thixotropic behaviour, suggesting that thixotropy is dependent on PS and fatcontent (Fig. 7.7), which could be attributed to the crowding of the particulate system duringshearing with formation of sample spanning aggregates due to low interaction energy at lowfat levels. Prasad et al. (2003) noted that the rates of formation and disruption of aggregates arefunctions of the flow-induced shear stresses, particle volume fraction and interaction energy.Chevalley (1999) suggested that thixotropy is especially important for thick chocolates, andin this study PSD and lecithin were key factors that could be manipulated to reduce thixotropyin low fat and/or thick chocolates
7.5 RELATIONSHIPS BETWEEN CASSON MODEL ANDICA RECOMMENDATIONS
Multivariate correlation, regression and principal component analyses evaluated relationshipsbetween Casson plastic viscosity and Casson yield value and the newer yield stress, apparentviscosity and thixotropy (ICA, 2000; Servais et al., 2004). Effects of PSD and compositionon dark chocolate rheology using both models have been reported in Section 7.4.
Correlation and regression analyses conducted on the data revealed high regression andcorrelation coefficients among all rheological parameters (Table 7.6). Relationships were

P1: KAE/UKS P2: KAEc07 BLBK244-Afoakwa January 25, 2010 21:43 Printer Name: Yet to Come
Structure – properties (rheology, texture and melting) relationships in chocolate manufacture 121
Table 7.6 Regression and correlation analyses between rheological parameters
Parameter Analysis
Cassonplastic
viscosity
Cassonyieldvalue
Apparentviscosity
Yieldstress
Thixotropy(YS)
Casson plastic Regression 1.0000 0.8368* 0.9053* 0.8919* 0.9021*
viscosity Correlation 1.0000 0.8903* 0.9467* 0.9349* 0.9447*
Casson yield Regression — 1.0000 0.9582* 0.9694* 0.9665*
value Correlation — 1.0000 0.9786* 0.9844* 0.9823*
Apparent Regression — — 1.0000 0.9898* 0.9955*
viscosity Correlation — — 1.0000 0.9941* 0.9977*
Yield stress Regression — — — 1.0000 0.9939*
Correlation — — — 1.0000 0.9957*
Thixotropy (AP) Regression — — — — 0.9527Correlation — — — — 0.9761
*Significant at p < 0.001.
calculated using correlation analysis between Casson plastic viscosity and Casson yieldvalue, and the apparent viscosity and (apparent) yield stress, the ICA-recommended values.High correlation coefficients (r = 0.95; p < 0.001) were observed between the Cassonplastic viscosity and apparent viscosity and Casson yield value and yield stress (r = 0.98;p < 0.001).
Regression analyses (Fig. 7.8(a and b)) showed Casson plastic viscosity and apparentviscosity, and Casson yield value and yield stress were closely related. Contrary to thefindings of Servais et al. (2004), Casson plastic viscosity and Casson yield value were highlycorrelated (r = 0.89; p < 0.001), with a high and significant regression coefficient, R2 = 0.84(Table 7.6). The regression model is as shown in Figure 7.8(c). Similarly, yield stress andapparent viscosity were highly correlated (r = 0.99; p < 0.001), with regression coefficient,R2 = 0.99 (Table 7.3). Figure 7.8(d) shows the regression model for yield stress and apparentviscosity.
Thixotropy is exhibited in chocolates if its apparent viscosity or shear stress decreaseswith time when sheared at a constant rate, and relates to degree of conching – well-conched chocolate should not be thixotropic. Interpolation and extrapolation data couldbe used to characterise thixotropy, but no certified method has been denoted (ICA, 2000;Cheng, 2003; Chhabra, 2007). Servais et al. (2004) suggested that practically thixotropycan be obtained by (i) area differences between ramp up and ramp down in flow curves;(ii) calculating analytically area differences in Casson models between 2 and 50 s−1; (iii)stress differences at 5 s−1 from ramps up and down; (iv) viscosity differences at 40 s−1
from ramps up and down. Using data from four Swiss dark chocolates, viscosity differ-ences at 40 s−1 from ramps up and down in shear rates multiplied by 1600 [s−2] rep-resented thixotropy. However, provided there are sufficient data points, interpolation datagive more robust information and extrapolation should be avoided as giving erroneousresults.
Correlation and regression analyses (Fig. 7.8(e)) determined relationships betweenthixotropy from yield stress differences at 5 s−1 and from calculating the difference be-tween apparent viscosities at 40 s−1, in each case comparing ramps up and down. Significantcorrelation coefficients of r = 0.98 (p < 0.001), and regression coefficient of determinationof R2 = 0.95 (p < 0.001), among the two methods (Table 7.6), suggested that both yield stress
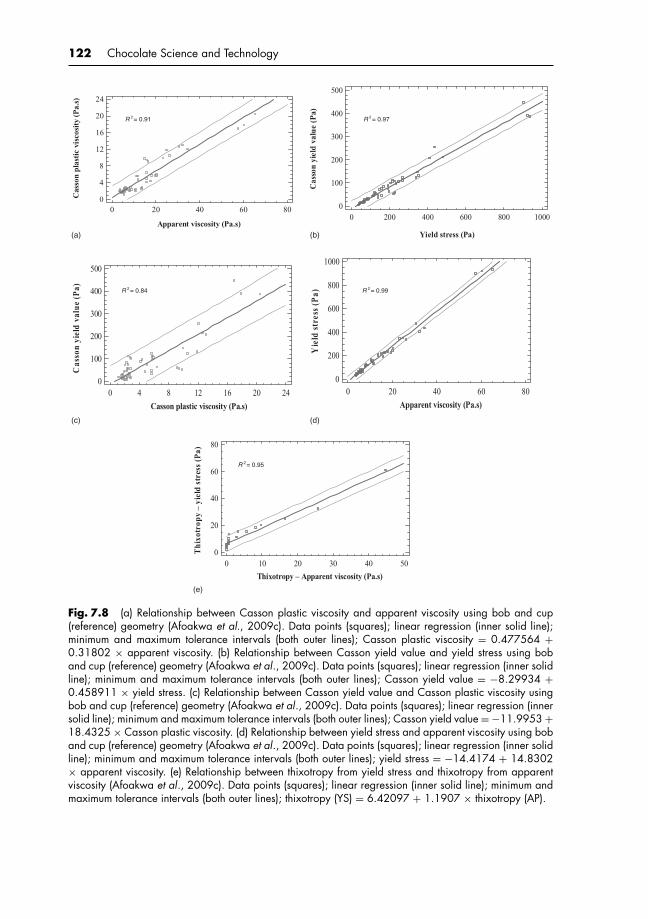
P1: KAE/UKS P2: KAEc07 BLBK244-Afoakwa January 25, 2010 21:43 Printer Name: Yet to Come
122 Chocolate Science and Technology
Yield stress (Pa)
Cas
son
yie
ld v
alu
e (P
a)
0 200 400 600 800 10000
100
200
300
400
500
R = 0.97 R = 0.91
R = 0.84
R = 0.95
R = 0.99
(b)(a)
(d)
(e)
(c)
Apparent viscosity (Pa.s)
Cas
son
pla
stic
vis
cosi
ty (
Pa.
s)
0 20 40 60 800
4
8
12
16
20
24
Casson plastic viscosity (Pa.s)
Cas
son
yie
ld v
alu
e (P
a)
0 4 8 12 16 20 240
100
200
300
400
500
Apparent viscosity (Pa.s)
Yie
ld s
tres
s (P
a)
0 20 40 60 800
200
400
600
800
1000
Thixotropy – Apparent viscosity (Pa.s)
Th
ixo
tro
py
– y
ield
str
ess
(Pa
)
0 10 20 30 40 500
20
40
60
80
Fig. 7.8 (a) Relationship between Casson plastic viscosity and apparent viscosity using bob and cup(reference) geometry (Afoakwa et al., 2009c). Data points (squares); linear regression (inner solid line);minimum and maximum tolerance intervals (both outer lines); Casson plastic viscosity = 0.477564 +0.31802 × apparent viscosity. (b) Relationship between Casson yield value and yield stress using boband cup (reference) geometry (Afoakwa et al., 2009c). Data points (squares); linear regression (inner solidline); minimum and maximum tolerance intervals (both outer lines); Casson yield value = −8.29934 +0.458911 × yield stress. (c) Relationship between Casson yield value and Casson plastic viscosity usingbob and cup (reference) geometry (Afoakwa et al., 2009c). Data points (squares); linear regression (innersolid line); minimum and maximum tolerance intervals (both outer lines); Casson yield value = −11.9953 +18.4325 × Casson plastic viscosity. (d) Relationship between yield stress and apparent viscosity using boband cup (reference) geometry (Afoakwa et al., 2009c). Data points (squares); linear regression (inner solidline); minimum and maximum tolerance intervals (both outer lines); yield stress = −14.4174 + 14.8302× apparent viscosity. (e) Relationship between thixotropy from yield stress and thixotropy from apparentviscosity (Afoakwa et al., 2009c). Data points (squares); linear regression (inner solid line); minimum andmaximum tolerance intervals (both outer lines); thixotropy (YS) = 6.42097 + 1.1907 × thixotropy (AP).
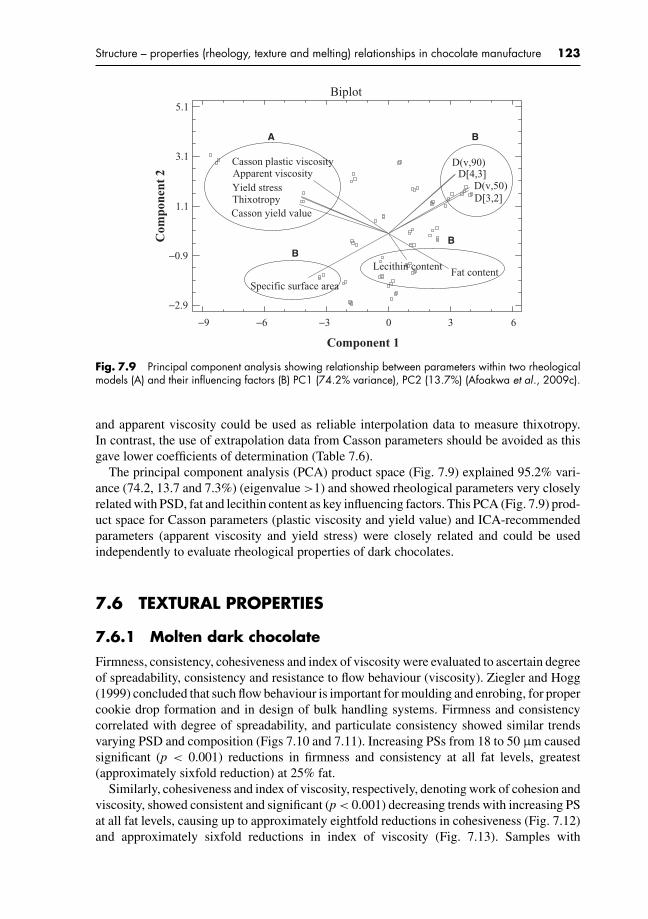
P1: KAE/UKS P2: KAEc07 BLBK244-Afoakwa January 25, 2010 21:43 Printer Name: Yet to Come
Structure – properties (rheology, texture and melting) relationships in chocolate manufacture 123
Biplot
Component 1
Com
pone
nt 2
Fat contentLecithin content
D(v,90)
Specific surface area
D[3,2]
D[4,3]D(v,50)
Casson plastic viscosity
Casson yield value
Yield stressApparent viscosity
Thixotropy
−9 −6 −3 0 3 6
−2.9
−0.9
1.1
3.1
5.1
B A
BB
Fig. 7.9 Principal component analysis showing relationship between parameters within two rheologicalmodels (A) and their influencing factors (B) PC1 (74.2% variance), PC2 (13.7%) (Afoakwa et al., 2009c).
and apparent viscosity could be used as reliable interpolation data to measure thixotropy.In contrast, the use of extrapolation data from Casson parameters should be avoided as thisgave lower coefficients of determination (Table 7.6).
The principal component analysis (PCA) product space (Fig. 7.9) explained 95.2% vari-ance (74.2, 13.7 and 7.3%) (eigenvalue >1) and showed rheological parameters very closelyrelated with PSD, fat and lecithin content as key influencing factors. This PCA (Fig. 7.9) prod-uct space for Casson parameters (plastic viscosity and yield value) and ICA-recommendedparameters (apparent viscosity and yield stress) were closely related and could be usedindependently to evaluate rheological properties of dark chocolates.
7.6 TEXTURAL PROPERTIES
7.6.1 Molten dark chocolate
Firmness, consistency, cohesiveness and index of viscosity were evaluated to ascertain degreeof spreadability, consistency and resistance to flow behaviour (viscosity). Ziegler and Hogg(1999) concluded that such flow behaviour is important for moulding and enrobing, for propercookie drop formation and in design of bulk handling systems. Firmness and consistencycorrelated with degree of spreadability, and particulate consistency showed similar trendsvarying PSD and composition (Figs 7.10 and 7.11). Increasing PSs from 18 to 50 µm causedsignificant (p < 0.001) reductions in firmness and consistency at all fat levels, greatest(approximately sixfold reduction) at 25% fat.
Similarly, cohesiveness and index of viscosity, respectively, denoting work of cohesion andviscosity, showed consistent and significant (p < 0.001) decreasing trends with increasing PSat all fat levels, causing up to approximately eightfold reductions in cohesiveness (Fig. 7.12)and approximately sixfold reductions in index of viscosity (Fig. 7.13). Samples with

P1: KAE/UKS P2: KAEc07 BLBK244-Afoakwa January 25, 2010 21:43 Printer Name: Yet to Come
124 Chocolate Science and Technology
2530
35 18
25
35
50
0
200
400
600
800
1000
1200
1400
Fir
mn
ess
(g)
Fat (%)
Particle size (D90, m)
18 µm, 0.3% Lec
25 µm, 0.3% Lec
35 µm, 0.3% Lec
50 µm, 0.3% Lec
0.5% Lec
0.5% Lec
0.5% Lec
0.5% Lec
Fig. 7.10 Effect of PSD and composition on firmness of molten dark chocolate. Reprinted from Afoakwaet al. (2008e), copyright 2008, with permission from Elsevier.
18 µm particles were firmer, more consistent, cohesive and viscous than those with 50 µm:with reduced mean diameter, particle number increases in parallel with specific surface area(Table 7.2), enhancing particle surface–surface contacts yielding higher values for firmness,consistency and cohesiveness, restricting spreadability and viscosity for a specific solidconcentration.
The high degree of reductions noticeable with low-fat (25%) chocolate, with increasingPS might be because, as the distribution of PSs becomes more spread out with a largespecific surface area, the smaller particles fill the spaces between the larger particles, result-ing in drastic reduction in the firmness, consistency, cohesiveness and viscosity. Likewise,increasing the fat content of the chocolates from 25 to 30% led to drastic reductions inall textural parameters at all PSs and lecithin concentrations. At low PS (18 µm), 5% in-crease in fat content caused up to fivefold reduction, indicating that fat has a marginallygreater effect on firmness, consistency, cohesiveness and viscosity of dark chocolates es-pecially at lower PS (18–25 µm) and lower lecithin levels. At 35% fat content, very littledifferences were observed at all PS and lecithin levels, attributable to fat inducing free-moving lubricating flow, which is more connected with the forces between the solid parti-cles. Beckett (2000) explained that fat fills the spaces or voids between the solid particles inmolten chocolate and reduces their resistance to flow, with the greatest effect noticeable atlower PS.
Increasing lecithin from 0.3 to 0.5% significantly decreased firmness, consistency, cohe-siveness and index of viscosity especially at lower fat content and lower PS, where up to
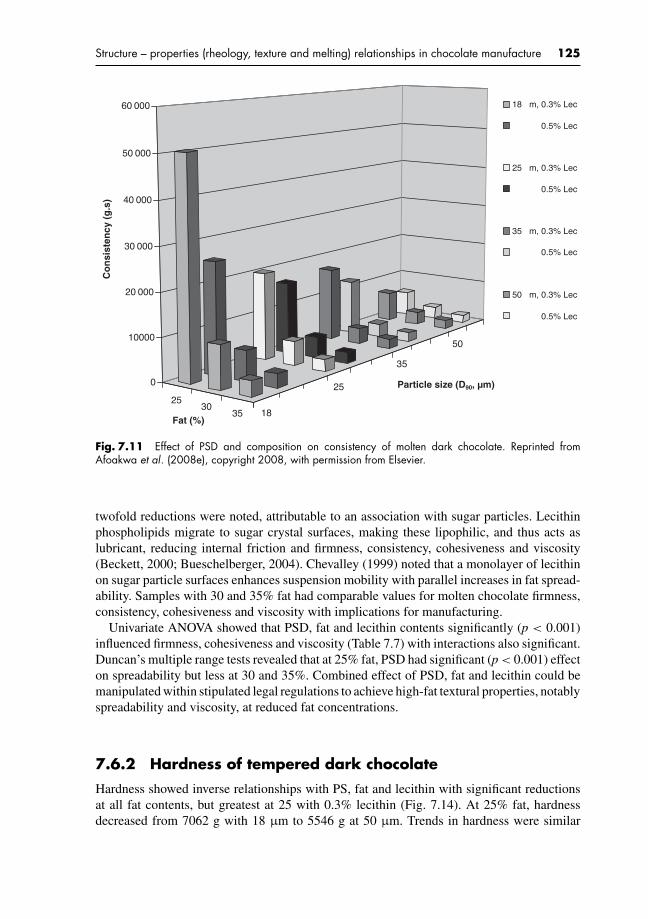
P1: KAE/UKS P2: KAEc07 BLBK244-Afoakwa January 25, 2010 21:43 Printer Name: Yet to Come
Structure – properties (rheology, texture and melting) relationships in chocolate manufacture 125
2530
35 18
25
35
50
0
10000
20 000
30 000
40 000
50 000
60 000C
on
sist
ency
(g
.s)
Fat (%)
Particle size (D90, m)
18 µm, 0.3% Lec
25 µm, 0.3% Lec
35 µm, 0.3% Lec
50 µm, 0.3% Lec
0.5% Lec
0.5% Lec
0.5% Lec
0.5% Lec
Fig. 7.11 Effect of PSD and composition on consistency of molten dark chocolate. Reprinted fromAfoakwa et al. (2008e), copyright 2008, with permission from Elsevier.
twofold reductions were noted, attributable to an association with sugar particles. Lecithinphospholipids migrate to sugar crystal surfaces, making these lipophilic, and thus acts aslubricant, reducing internal friction and firmness, consistency, cohesiveness and viscosity(Beckett, 2000; Bueschelberger, 2004). Chevalley (1999) noted that a monolayer of lecithinon sugar particle surfaces enhances suspension mobility with parallel increases in fat spread-ability. Samples with 30 and 35% fat had comparable values for molten chocolate firmness,consistency, cohesiveness and viscosity with implications for manufacturing.
Univariate ANOVA showed that PSD, fat and lecithin contents significantly (p < 0.001)influenced firmness, cohesiveness and viscosity (Table 7.7) with interactions also significant.Duncan’s multiple range tests revealed that at 25% fat, PSD had significant (p < 0.001) effecton spreadability but less at 30 and 35%. Combined effect of PSD, fat and lecithin could bemanipulated within stipulated legal regulations to achieve high-fat textural properties, notablyspreadability and viscosity, at reduced fat concentrations.
7.6.2 Hardness of tempered dark chocolate
Hardness showed inverse relationships with PS, fat and lecithin with significant reductionsat all fat contents, but greatest at 25 with 0.3% lecithin (Fig. 7.14). At 25% fat, hardnessdecreased from 7062 g with 18 µm to 5546 g at 50 µm. Trends in hardness were similar

P1: KAE/UKS P2: KAEc07 BLBK244-Afoakwa January 25, 2010 21:43 Printer Name: Yet to Come
126 Chocolate Science and Technology
2530
35 18
25
35
50
0
200
400
600
800
1000
1200
1400
1600
Co
hes
iven
ess
(g.s
)
Fat (%)
Particle size (D90, m)
18 µm, 0.3% Lec
25 µm, 0.3% Lec
35 µm, 0.3% Lec
50 µm, 0.3% Lec
0.5% Lec
0.5% Lec
0.5% Lec
0.5% Lec
Fig. 7.12 Effect of PSD and composition on cohesiveness of molten dark chocolate. Reprinted fromAfoakwa et al. (2008e), copyright 2008, with permission from Elsevier.
0
1000
2000
3000
4000
5000
6000
Ind
ex o
f vi
sco
sity
(g
.s)
25 30 35
Fat content (%)
18 µm, 0.3% Lec
25 µm, 0.3% Lec
35 µm, 0.3% Lec
50 µm, 0.3% Lec
0.5% Lec
0.5% Lec
0.5% Lec
0.5% Lec
Fig. 7.13 Effect of PSD and composition on index of viscosity of molten dark chocolate. Reprinted fromAfoakwa et al. (2008e), copyright 2008, with permission from Elsevier.

P1: KAE/UKS P2: KAEc07 BLBK244-Afoakwa January 25, 2010 21:43 Printer Name: Yet to Come
Structure – properties (rheology, texture and melting) relationships in chocolate manufacture 127
Table 7.7 ANOVA summary of F-values of the textural properties
Processvariables Firmness Consistency Cohesiveness
Index ofviscosity Hardness
A: Particlesize (D90)
1595.40* 2340.25* 2 027.61* 1018.71* 978.94*
B: Fat 5971.02* 8583.65* 10 547.21* 5919.75* 6921.18*
C: Lecithin 578.48* 815.85* 988.35* 518.83* 166.74*
A × B 841.85* 1221.89* 1083.29* 502.72* 160.94*
A × C 224.58* 317.98* 279.52* 127.12* 7.48*
B × C 392.59* 534.14* 698.08* 354.23* 17.74*
A × B × C 156.79* 219.63* 186.26* 81.83* 32.48*
*Significant F-ratios at p ≤ 0.05.
at 30 and 35% fat with 0.3% lecithin but less pronounced at higher PSs (Fig. 7.14). Thegreater hardness levels noted with 25% fat and 18–25 µm PSs suggest more particle–particleinteractions and spanning of stress-bearing paths. Hardness from particle contacts was afunction of mean PS and diameter and specific surface area.
Fat content was inversely related (p < 0.001) to hardness at all PSs and lecithin levels(Fig. 7.14). Combined effects of fat content and PSD thus have greatest influences but areless pronounced at higher fat and lecithin contents (Fig. 7.14) where fat coating of parti-cles reduces interparticle interactions, inducing product softening. Significant (p < 0.001)reductions were noted when lecithin content was increased from 0.3 to 0.5%. Lecithin has
2530
35 1825
3550
4000
4500
5000
5500
6000
6500
7000
7500
Har
dn
ess
(g)
Fat (%) Particle size (D90, m)
18 µm, 0.3% Lec
25 µm, 0.3% Lec
35 µm, 0.3% Lec
50 µm, 0.3% Lec
0.5% Lec
0.5% Lec
0.5% Lec
0.5% Lec
Fig. 7.14 Effect of PSD and composition on hardness of tempered dark chocolate. Reprinted fromAfoakwa et al. (2008e), copyright 2008, with permission from Elsevier.

P1: KAE/UKS P2: KAEc07 BLBK244-Afoakwa January 25, 2010 21:43 Printer Name: Yet to Come
128 Chocolate Science and Technology
amphiphilic (both hydrophilic and lipophilic) properties, making the molecule an effectivedispersant, promoting deagglomeration and wetting of clumps inducing chocolate softening.Significant (p < 0.001) interactions (Table 7.7) showed that the combined effects of PSD,fat and lecithin could be manipulated to control softness and/or hardness of tempered darkchocolate, with implications for quality control and production cost.
7.6.3 Colour measurements
Lightness (L*), chroma (C*) and hue (h◦) followed similar trends with changes in PSD, fat andlecithin contents (Table 7.8). Significant (p < 0.001) and linear effects on L* were recordedwith increasing particles from 18 to 50 µm, with consequential decreases in L*, noticeablebut dependent on fat contents (Table 7.8). Similar decreases were noted in C* and h◦ withincreasing PSD and fat. Thus, dark chocolate became lighter as D90 decreased from 50 to18 µm and as PS increased (18–50 µm); C* and h◦ were significantly decreased, pronouncedat 25% fat. Increasing fat content reduced C* and h◦, but the effects were less marked at 35%fat than at 30%. As lecithin had no noticeable effect on L*, C* and h◦ (Table 7.9), appearancedata were primarily dependent on PSD and fat content.
Table 7.8 Effects of particle size distribution and composition on colour measurements
Colour measurements
Particle size(D90) (µm)
Fat content(%) Lecithin (%) L* C* h◦
18 ± 1.0 25 0.3 43.49 ± 0.40 14.36 ± 0.40 43.9 ± 0.240.5 43.52 ± 0.87 14.24 ± 0.46 43.7 ± 0.87
30 0.3 40.39 ± 1.16 13.15 ± 0.08 42.6 ± 0.490.5 37.43 ± 0.67 13.04 ± 0.52 42.4 ± 0.35
35 0.3 35.19 ± 0.56 11.60 ± 0.07 40.4 ± 0.150.5 34.73 ± 0.38 11.82 ± 0.34 41.4 ± 0.61
25 ± 1.0 25 0.3 42.16 ± 0.36 14.11 ± 0.48 42.9 ± 0.870.5 41.72 ± 1.82 14.17 ± 0.57 42.8 ± 0.72
30 0.3 35.96 ± 0.33 12.70 ± 0.28 42.5 ± 0.770.5 36.43 ± 0.67 12.90 ± 0.75 42.5 ± 0.78
35 0.3 34.01 ± 0.14 11.51 ± 0.19 40.5 ± 0.800.5 34.61 ± 0.50 11.65 ± 0.33 40.6 ± 0.60
35 ± 1.0 25 0.3 40.94 ± 0.33 13.79 ± 0.38 42.9 ± 0.310.5 40.38 ± 0.80 13.94 ± 0.15 42.6 ± 0.50
30 0.3 34.85 ± 0.18 12.38 ± 0.22 42.5 ± 0.100.5 35.27 ± 0.52 12.58 ± 0.27 42.0 ± 0.21
35 0.3 33.50 ± 0.42 11.50 ± 0.07 39.7 ± 0.400.5 33.86 ± 0.23 11.51 ± 0.06 40.1 ± 0.26
50 ± 1.0 25 0.3 38.64 ± 0.53 13.42 ± 0.28 42.5 ± 0.390.5 36.93 ± 0.26 13.93 ± 0.16 42.7 ± 0.15
30 0.3 34.22 ± 1.17 12.24 ± 0.46 41.6 ± 0.950.5 34.90 ± 0.35 12.14 ± 0.26 41.2 ± 0.21
35 0.3 33.25 ± 1.16 11.27 ± 0.42 39.5 ± 0.830.5 33.42 ± 0.59 11.04 ± 0.15 38.9 ± 0.34
Means ± standard deviation from triplicate analysis.

P1: KAE/UKS P2: KAEc07 BLBK244-Afoakwa January 25, 2010 21:43 Printer Name: Yet to Come
Structure – properties (rheology, texture and melting) relationships in chocolate manufacture 129
Table 7.9 ANOVA summary of F-values of colour measurements
Process variables L* C* h◦
A: Particle size (D90) 88.19* 13.08* 13.41*
B: Fat 546.34* 317.49* 182.94*
C: Lecithin 2.01 1.05 10.97
A × B 12.87* 0.50 2.00A × C 2.38 0.22 1.69B × C 1.55 0.28 2.95A × B × C 4.40 0.85 1.05
*Significant F-ratios at p ≤ 0.05.
Hutchings (1994) stated that L*, C* and h◦, respectively, represent food diffuse reflectanceof light, degree of saturation and hue luminance, which are dependent on particulate dis-tribution, absorptivity and scattering factors or coefficients. In a densely packed medium,scattering factor is inversely related to particle diameter (Saguy & Graf, 1991). Chocolateswith varying PSs differ in structural and particulate arrangements (Table 7.2), influencinglight-scattering coefficients and thus appearance. Chocolates with finer particles (18–25 µm)have larger specific surface areas, lower particle diameters and more interparticle interac-tions, thus tend to be denser, scatter more light, appear lighter and more saturated than thosewith coarser (35–50 µm) particles. Such changes result in higher scattering coefficients,with subsequent paleness – higher L* values. Consequently, increases in saturation effectswithin suspensions yield higher C* and h◦ values. On the other hand, cocoa fat is an inherentcrystalline network, which scatters light, reducing luminance and saturation indices in higherfat products.
From ANOVA, PSD and fat content significantly (p < 0.001) influenced L*, C* and h◦,but lecithin had no significant effect on appearance (Table 7.9). No significant (p ≤ 0.05)interactions were observed among processing parameters (Table 7.8), with the exceptionof interaction between PSD and fat content. Fat content had the greatest influence on darkchocolate appearance followed by PSD.
7.6.4 Relationships between textural properties andappearance of dark chocolate
Correlation and principal component analyses established the extent that PSD, fat and lecithincontents influence textural properties and appearance with clear correlations. The correlationmatrix (Table 7.10) for textural properties (firmness, consistency, cohesiveness, index ofviscosity and hardness) and colour (L*, C* and h◦) showed that these were directly correlatedwith a highly significant correlation (r = 0.99–1.00; p < 0.001) among textural properties,with high direct correlation (r = 0.71–0.96; p < 0.001) between colour measurements. Thus,changes in textural properties in molten and solid tempered dark chocolates could predictfinished product appearance although L* exhibited higher correlation (r = 0.87–0.96; p <
0.001) than C* and h◦, suggesting a better prediction.The multivariate PCA product space (Fig. 7.15) explained more than 81% variance in
the first two factors and showed that texture and colour parameters were closely relatedwith loadings for PSD, fat and lecithin content influencing factors. Fat content and PSD hadpolar influences on principal component 2 (PC2) (16.4% variance) score. Further examination
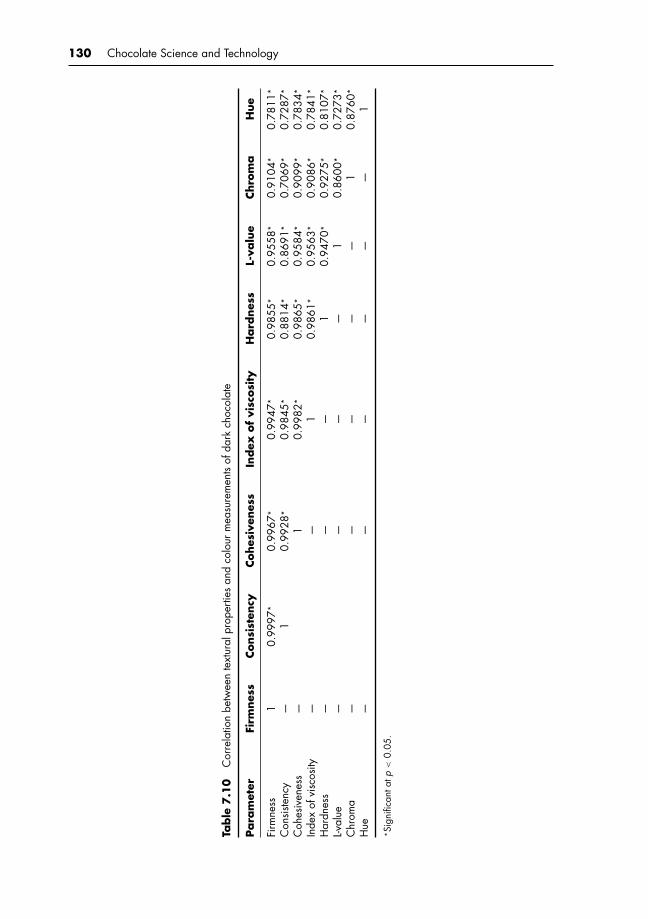
P1: KAE/UKS P2: KAEc07 BLBK244-Afoakwa January 25, 2010 21:43 Printer Name: Yet to Come
130 Chocolate Science and Technology
Table
7.1
0C
orre
latio
nbe
twee
nte
xtur
alpr
oper
ties
and
colo
urm
easu
rem
ents
ofda
rkch
ocol
ate
Para
met
erFi
rmnes
sConsi
sten
cyCohes
iven
ess
Index
of
visc
osi
tyH
ard
nes
sL-
valu
eChro
ma
Hue
Firm
ness
10.
9997
*0.
9967
*0.
9947
*0.
9855
*0.
9558
*0.
9104
*0.
7811
*
Con
siste
ncy
—1
0.99
28*
0.98
45*
0.88
14*
0.86
91*
0.70
69*
0.72
87*
Coh
esiv
enes
s—
10.
9982
*0.
9865
*0.
9584
*0.
9099
*0.
7834
*
Inde
xof
visc
osity
——
10.
9861
*0.
9563
*0.
9086
*0.
7841
*
Har
dnes
s—
——
10.
9470
*0.
9275
*0.
8107
*
L-val
ue—
——
—1
0.86
00*
0.72
73*
Chr
oma
——
——
—1
0.87
60*
Hue
——
——
——
1
*Si
gnifi
cant
atp
<0.
05.

P1: KAE/UKS P2: KAEc07 BLBK244-Afoakwa January 25, 2010 21:43 Printer Name: Yet to Come
Structure – properties (rheology, texture and melting) relationships in chocolate manufacture 131
Component 1 (65.07% of variability)
Com
pon
ent
2 (1
6.43
%)
D50
D90
SSA
D[3,2]
D10
Fat
Lecithin
Index of viscosity
Hardness
L-value
ChromaHue
Firmness
ConsistencyCohesiveness
-9 -6 -3 0 3 6-2.8
-1.8
-0.8
0.2
1.2
2.2
3.2
A
BC
B
Fig. 7.15 Principal component analysis of textural properties and appearance of dark chocolates (A) asaffected by PSD (B) and composition (C). Reprinted from Afoakwa et al. (2008e), copyright 2008, withpermission from Elsevier.
suggested that PSD had multiple discrete components (specific surface area, largest PS (D90),smallest PS (D10), mean PS (D50) and Sauter mean diameter (D[3,2])), together influencingtexture and appearance.
7.7 MICROSTRUCTURAL PROPERTIES OF MOLTENDARK CHOCOLATE
Light microscopy was used to characterise the variations in sugar crystalline network,particle–particle interaction strengths and particle-fat phase behaviour from molten darkchocolate with varying PSD and fat concentration. Micrographs (Figs 7.16–7.18) showedclear variations in microstructure among samples from different PSD (Table 7.2) and fatcontents.
Samples containing 25% fat showed high solids packing intensity with extensiveparticle–particle interaction strengths at all PSs (Fig. 7.16(a–d)) so that the crystalline net-work was dispersed with large specific surface area (Table 7.2), and with smaller particlesfilling the spaces between the larger, the result was a high bed density. At lower PS (18 µm),particle numbers increased in parallel with points of contact, particle–particle interactionsand greater packing ability. The increased particle–particle interactions, amount of and spe-cific surface area and mean particle diameter, resulted in flocculation and agglomeration,forming spanning stress-bearing paths, restricting mobility and compartmentalisation of thematrix (Fig. 7.16(a and b)).
With PS ranges between 35 and 50 µm, particles were coarser, leading to PSD broad-ening into multimodal distributions (Fig. 7.4(c and d)), which reduced solid loading, andspecific surface area (Table 7.2). As PSs were increased, the packing ability of solids becamerestricted, leading to fewer particle–particle interactions (Fig. 7.16(c and d)). Prasad et al.(2003) also noted that rates of formation and disruption of aggregates were functions offlow-induced shear stresses, particle volume fraction and interaction energy. The observedgreater flocculation and agglomeration of sugar crystals network and high interparticle in-teraction with 25% fat explained higher rheological (Beckett, 1999; Chevalley, 1999) andmechanical properties (firmness and hardness) observed with low-fat chocolates. Servaiset al. (2004) noted that yield stress depended on amount of small particles (specific
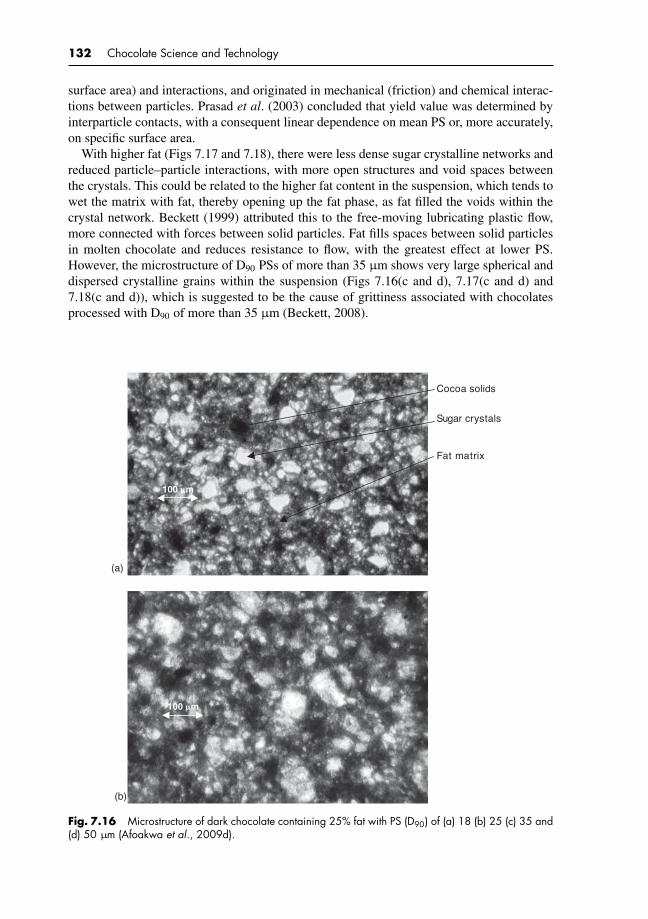
P1: KAE/UKS P2: KAEc07 BLBK244-Afoakwa January 25, 2010 21:43 Printer Name: Yet to Come
132 Chocolate Science and Technology
surface area) and interactions, and originated in mechanical (friction) and chemical interac-tions between particles. Prasad et al. (2003) concluded that yield value was determined byinterparticle contacts, with a consequent linear dependence on mean PS or, more accurately,on specific surface area.
With higher fat (Figs 7.17 and 7.18), there were less dense sugar crystalline networks andreduced particle–particle interactions, with more open structures and void spaces betweenthe crystals. This could be related to the higher fat content in the suspension, which tends towet the matrix with fat, thereby opening up the fat phase, as fat filled the voids within thecrystal network. Beckett (1999) attributed this to the free-moving lubricating plastic flow,more connected with forces between solid particles. Fat fills spaces between solid particlesin molten chocolate and reduces resistance to flow, with the greatest effect at lower PS.However, the microstructure of D90 PSs of more than 35 µm shows very large spherical anddispersed crystalline grains within the suspension (Figs 7.16(c and d), 7.17(c and d) and7.18(c and d)), which is suggested to be the cause of grittiness associated with chocolatesprocessed with D90 of more than 35 µm (Beckett, 2008).
Cocoa solids
Sugar crystals
Fat matrix
100 m
100 m
(a)
(b)
Fig. 7.16 Microstructure of dark chocolate containing 25% fat with PS (D90) of (a) 18 (b) 25 (c) 35 and(d) 50 µm (Afoakwa et al., 2009d).

P1: KAE/UKS P2: KAEc07 BLBK244-Afoakwa January 25, 2010 21:43 Printer Name: Yet to Come
Structure – properties (rheology, texture and melting) relationships in chocolate manufacture 133
100 m
100 m
(c)
(d)
Fig. 7.16 (Continued).
The qualitative structural information illustrated by the micrographs thus provides a mech-anistic explanation for quantitative differences in rheological, textural and sensory characterin dark chocolates with varying PSD and fat content. This knowledge can improve thequality of models developed to optimise PSD influences on the flow, textural and sen-sory character in chocolate. Release of structural mobility and compartmentalisation canbe achieved by controlling microstructure during processing. Aguilera (2005) explainedthat structure has the largest effect on sound and food behaviour in biting. Structuring ofparticles within the multiphase chocolate systems during processing could be optimisedto enhance resistance to flow, reduce grittiness perceived in chocolate with particle D90
of more than 35 µ, with consequential effects on the quality characteristics of finishedchocolates.
7.8 MELTING PROPERTIES OF DARK CHOCOLATE
Peak onset corresponds to the temperature at which a specific crystal form starts to melt;peak maximum, that at which melting rate is greatest; and end of melting, completion of
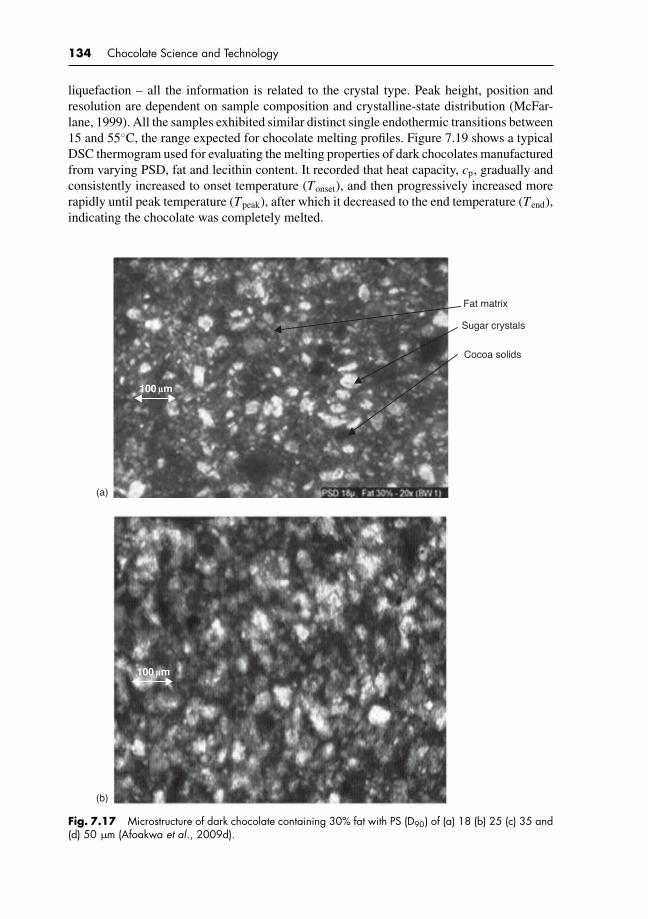
P1: KAE/UKS P2: KAEc07 BLBK244-Afoakwa January 25, 2010 21:43 Printer Name: Yet to Come
134 Chocolate Science and Technology
liquefaction – all the information is related to the crystal type. Peak height, position andresolution are dependent on sample composition and crystalline-state distribution (McFar-lane, 1999). All the samples exhibited similar distinct single endothermic transitions between15 and 55◦C, the range expected for chocolate melting profiles. Figure 7.19 shows a typicalDSC thermogram used for evaluating the melting properties of dark chocolates manufacturedfrom varying PSD, fat and lecithin content. It recorded that heat capacity, cp, gradually andconsistently increased to onset temperature (Tonset), and then progressively increased morerapidly until peak temperature (Tpeak), after which it decreased to the end temperature (Tend),indicating the chocolate was completely melted.
100 m
Sugar crystals
Cocoa solids
(a)
(b)
Fat matrix
100 m
Fig. 7.17 Microstructure of dark chocolate containing 30% fat with PS (D90) of (a) 18 (b) 25 (c) 35 and(d) 50 µm (Afoakwa et al., 2009d).
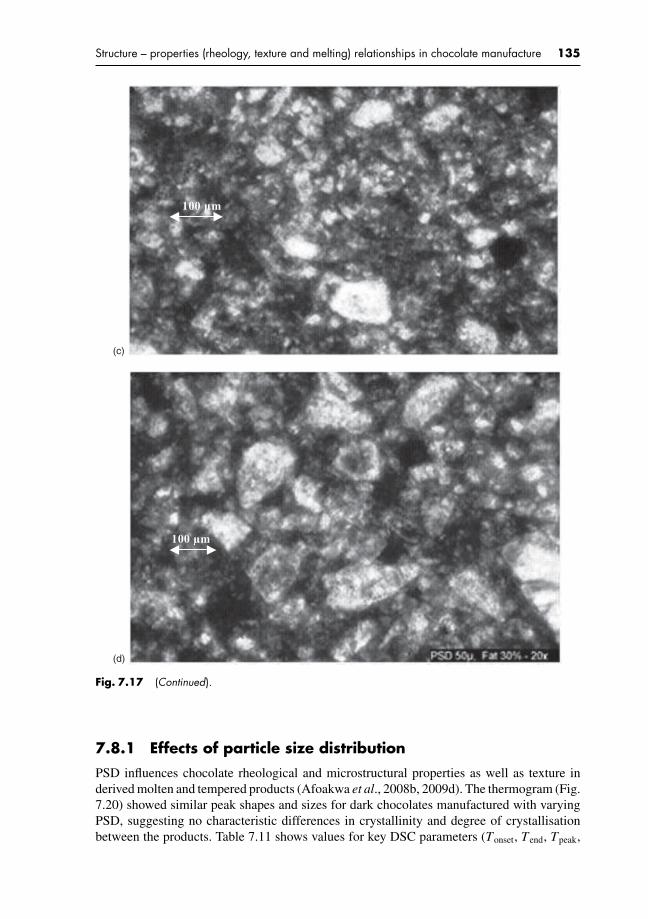
P1: KAE/UKS P2: KAEc07 BLBK244-Afoakwa January 25, 2010 21:43 Printer Name: Yet to Come
Structure – properties (rheology, texture and melting) relationships in chocolate manufacture 135
100 m
100 m
(c)
(d)
Fig. 7.17 (Continued).
7.8.1 Effects of particle size distribution
PSD influences chocolate rheological and microstructural properties as well as texture inderived molten and tempered products (Afoakwa et al., 2008b, 2009d). The thermogram (Fig.7.20) showed similar peak shapes and sizes for dark chocolates manufactured with varyingPSD, suggesting no characteristic differences in crystallinity and degree of crystallisationbetween the products. Table 7.11 shows values for key DSC parameters (Tonset, Tend, Tpeak,
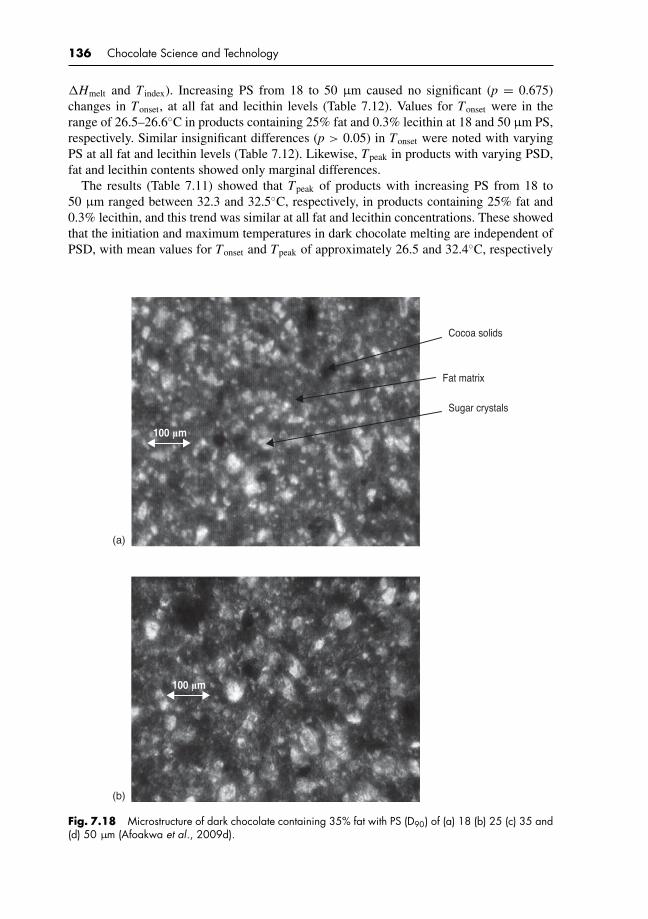
P1: KAE/UKS P2: KAEc07 BLBK244-Afoakwa January 25, 2010 21:43 Printer Name: Yet to Come
136 Chocolate Science and Technology
�Hmelt and T index). Increasing PS from 18 to 50 µm caused no significant (p = 0.675)changes in Tonset, at all fat and lecithin levels (Table 7.12). Values for Tonset were in therange of 26.5–26.6◦C in products containing 25% fat and 0.3% lecithin at 18 and 50 µm PS,respectively. Similar insignificant differences (p > 0.05) in Tonset were noted with varyingPS at all fat and lecithin levels (Table 7.12). Likewise, Tpeak in products with varying PSD,fat and lecithin contents showed only marginal differences.
The results (Table 7.11) showed that Tpeak of products with increasing PS from 18 to50 µm ranged between 32.3 and 32.5◦C, respectively, in products containing 25% fat and0.3% lecithin, and this trend was similar at all fat and lecithin concentrations. These showedthat the initiation and maximum temperatures in dark chocolate melting are independent ofPSD, with mean values for Tonset and Tpeak of approximately 26.5 and 32.4◦C, respectively
Cocoa solids
Fat matrix
Sugar crystals
100 m
100 m
(a)
(b)
Fig. 7.18 Microstructure of dark chocolate containing 35% fat with PS (D90) of (a) 18 (b) 25 (c) 35 and(d) 50 µm (Afoakwa et al., 2009d).
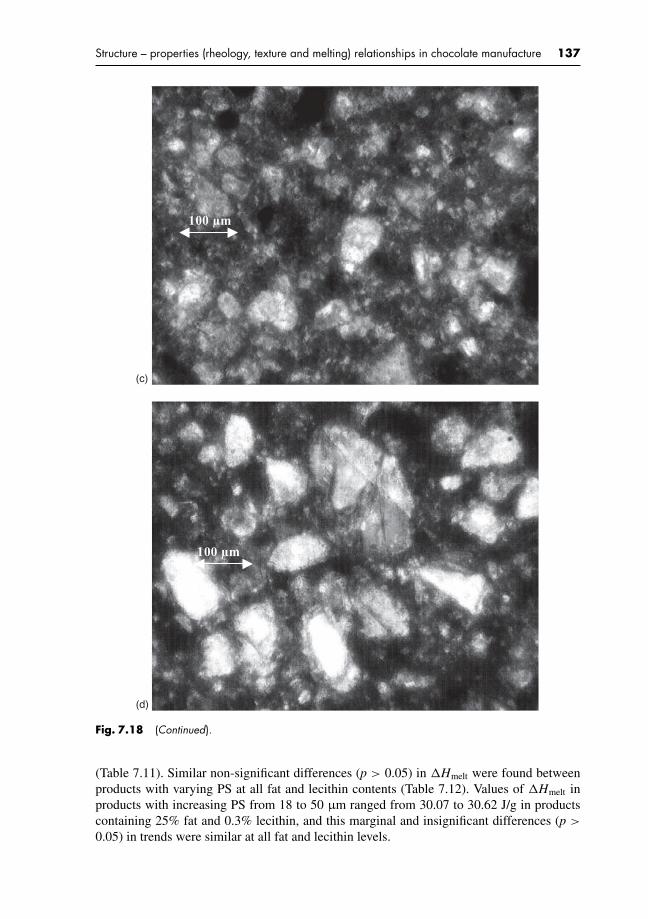
P1: KAE/UKS P2: KAEc07 BLBK244-Afoakwa January 25, 2010 21:43 Printer Name: Yet to Come
Structure – properties (rheology, texture and melting) relationships in chocolate manufacture 137
100 m
100 m
(c)
(d)
Fig. 7.18 (Continued).
(Table 7.11). Similar non-significant differences (p > 0.05) in �Hmelt were found betweenproducts with varying PS at all fat and lecithin contents (Table 7.12). Values of �Hmelt inproducts with increasing PS from 18 to 50 µm ranged from 30.07 to 30.62 J/g in productscontaining 25% fat and 0.3% lecithin, and this marginal and insignificant differences (p >
0.05) in trends were similar at all fat and lecithin levels.
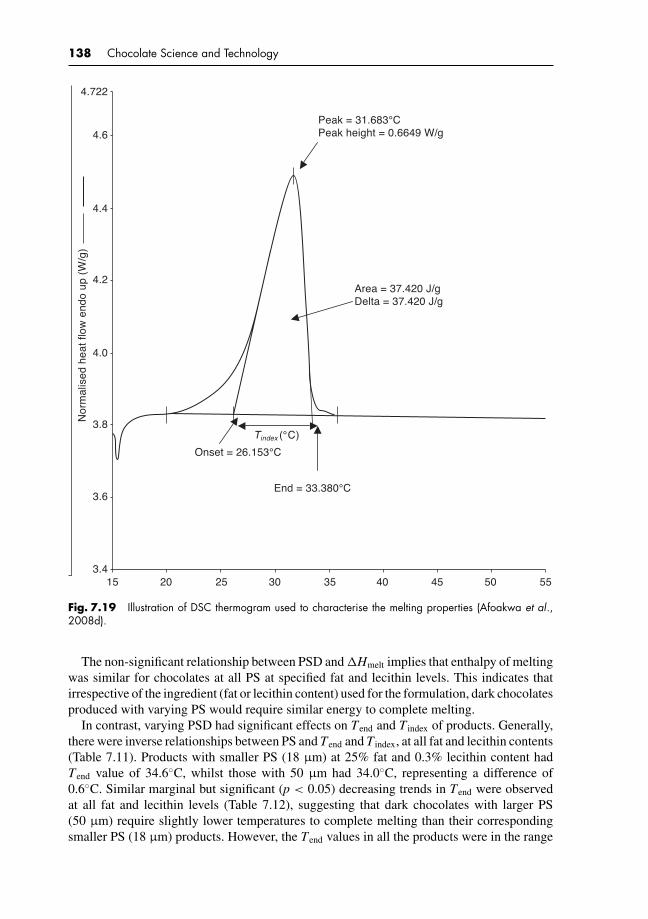
P1: KAE/UKS P2: KAEc07 BLBK244-Afoakwa January 25, 2010 21:43 Printer Name: Yet to Come
138 Chocolate Science and Technology
Tindex (°C)
15 20 25
Onset = 26.153°C
Area = 37.420 J/gDelta = 37.420 J/g
Peak = 31.683°CPeak height = 0.6649 W/g
End = 33.380°C
30 35 40 45 50 55
4.722
4.6
4.4
4.2
Nor
mal
ised
hea
t flo
w e
ndo
up (
W/g
)
4.0
3.8
3.6
3.4
Fig. 7.19 Illustration of DSC thermogram used to characterise the melting properties (Afoakwa et al.,2008d).
The non-significant relationship between PSD and �Hmelt implies that enthalpy of meltingwas similar for chocolates at all PS at specified fat and lecithin levels. This indicates thatirrespective of the ingredient (fat or lecithin content) used for the formulation, dark chocolatesproduced with varying PS would require similar energy to complete melting.
In contrast, varying PSD had significant effects on Tend and T index of products. Generally,there were inverse relationships between PS and Tend and T index, at all fat and lecithin contents(Table 7.11). Products with smaller PS (18 µm) at 25% fat and 0.3% lecithin content hadTend value of 34.6◦C, whilst those with 50 µm had 34.0◦C, representing a difference of0.6◦C. Similar marginal but significant (p < 0.05) decreasing trends in Tend were observedat all fat and lecithin levels (Table 7.12), suggesting that dark chocolates with larger PS(50 µm) require slightly lower temperatures to complete melting than their correspondingsmaller PS (18 µm) products. However, the Tend values in all the products were in the range

P1: KAE/UKS P2: KAEc07 BLBK244-Afoakwa January 25, 2010 21:43 Printer Name: Yet to Come
Structure – properties (rheology, texture and melting) relationships in chocolate manufacture 139
15 20 25 30 35
a
b
c
d
40 45 50 55
6.0
Nor
mal
ised
hea
t flo
w e
ndo
up (
W/g
)
3.0
5.5
5.0
4.5
4.0
3.5
Fig. 7.20 Typical DSC thermograms for dark chocolate at constant fat and lecithin content with varyingPSD: (a) 18, (b) 25, (c) 35 and (d) 50 µm (Afoakwa et al., 2008d). Reprinted from Afoakwa et al.(2008d), copyright 2008, with permission from Elsevier.
33.0–34.6◦C, indicating all samples had similar Form V (β2) polymorphic stability. A similarinverse relationship was observed between T index and PSD. The data (Table 7.11) showedthat increasing PS for 18–50 µm in chocolates containing 25% fat and 0.3% lecithin causedsignificant (p ≤ 0.05) reductions in T index from 8.4 to 7.4◦C, respectively. ANOVA showedsignificant (p < 0.05) influence of PSD on Tend and T index with significant interactions forfat and lecithin contents (Table 7.12).
Multiple range test revealed significant differences (p = 0.001) between Tend of productscontaining 18, 35 and 50 µm, indicating that chocolates with finer particles would take rela-tively longer time to melt than their corresponding products with larger particles, suggestingtheir possible relationships with the relative strengths of the interparticle aggregations andflocculation in the different products.
Chocolates with smaller PSD (D90, 18 µm) have been found to contain higher particle-to-particle strengths with resultant increases in hardness (texture) than their correspondinglarger PSD (D90, 50 µm) (Do et al., 2007; Afoakwa et al., 2009d). Do et al. (2007) also

P1: KAE/UKS P2: KAEc07 BLBK244-Afoakwa January 25, 2010 21:43 Printer Name: Yet to Come
140 Chocolate Science and Technology
Table
7.1
1M
eltin
gpr
oper
ties
ofda
rkch
ocol
ate
from
vary
ing
PSD
,fat
and
leci
thin
cont
ent
Mel
ting
pro
per
ties
Part
icle
size
(Dv,
0.9
)(µ
m)
Fat
(%)
Leci
thin
(%)
T onse
t(◦
C)
T end
(◦C)
T index
(◦C)
T pea
k(◦
C)
�H
mel
t(J
/g)
18±
1.0
250.
326
.2±
0.2
34.6
±0.
38.
4±
0.2
32.5
±0.
230
.07
±0.
380.
526
.0±
0.1
34.2
±0.
48.
2±
0.4
32.0
±0.
328
.20
±0.
1230
0.3
26.5
±0.
334
.4±
0.4
7.9
±0.
232
.5±
0.4
36.5
2±
1.05
0.5
26.3
±0.
233
.9±
0.2
7.5
±0.
332
.4±
0.3
30.0
2±
0.42
350.
326
.4±
0.1
33.8
±0.
27.
4±
0.1
32.4
±0.
244
.59
±0.
620.
526
.5±
0.2
33.7
±0.
37.
2±
0.3
32.5
±0.
243
.10
±1.
2325
±1.
025
0.3
26.3
±0.
134
.4±
0.2
8.1
±0.
232
.4±
0.3
30.5
2±
0.73
0.5
26.3
±0.
234
.1±
0.2
7.8
±0.
332
.4±
0.3
29.0
8±
0.46
300.
326
.6±
0.2
33.9
±0.
37.
3±
0.4
32.2
±0.
137
.09
±1.
240.
526
.5±
0.1
33.5
±0.
27.
0±
0.3
32.5
±0.
332
.46
±0.
6635
0.3
26.6
±0.
333
.7±
0.2
7.1
±0.
332
.2±
0.1
45.0
1±
1.42
0.5
26.5
±0.
233
.5±
0.3
7.0
±0.
132
.2±
0.1
43.4
1±
1.28
35±
1.0
250.
326
.3±
0.1
34.2
±0.
57.
9±
0.2
32.6
±0.
330
.68
±0.
280.
526
.4±
0.1
34.0
±0.
47.
6±
0.3
32.4
±0.
328
.60
±0.
3430
0.3
26.6
±0.
333
.8±
0.2
7.2
±0.
232
.4±
0.2
37.1
9±
0.94
0.5
26.7
±0.
333
.7±
0.1
7.0
±0.
132
.6±
0.2
34.0
1±
0.63
350.
326
.8±
0.4
33.6
±0.
36.
8±
0.3
32.8
±0.
345
.15
±1.
050.
526
.9±
0.4
33.4
±0.
26.
5±
0.1
32.2
±0.
342
.79
±0.
8450
±1.
025
0.3
26.6
±0.
234
.0±
0.4
7.4
±0.
532
.3±
0.2
30.6
2±
0.53
0.5
26.7
±0.
133
.9±
0.2
7.2
±0.
332
.4±
0.2
28.6
2±
0.23
300.
326
.8±
0.3
33.5
±0.
36.
7±
0.3
32.9
±0.
437
.29
±0.
150.
526
.7±
0.3
33.3
±0.
36.
6±
0.2
32.2
±0.
233
.25
±1.
0535
0.3
26.8
±0.
433
.2±
0.1
6.4
±0.
132
.7±
0.3
45.4
0±
0.87
0.5
26.8
±0.
333
.0±
0.4
6.2
±0.
432
.4±
0.1
43.4
3±
0.46
Mea
nva
lues
from
tripl
icat
ean
alys
is±
stand
ard
devi
atio
n.
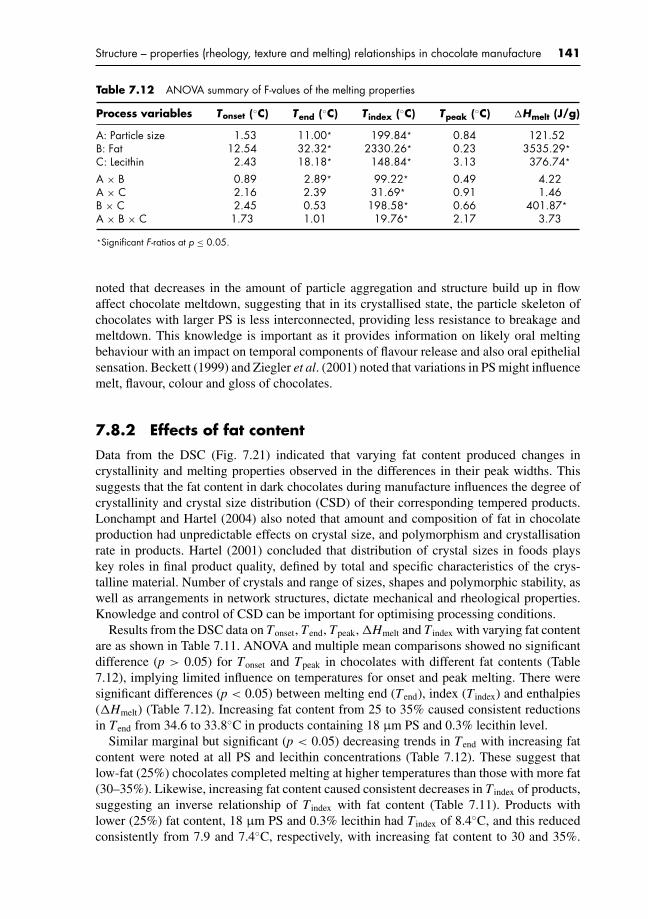
P1: KAE/UKS P2: KAEc07 BLBK244-Afoakwa January 25, 2010 21:43 Printer Name: Yet to Come
Structure – properties (rheology, texture and melting) relationships in chocolate manufacture 141
Table 7.12 ANOVA summary of F-values of the melting properties
Process variables Tonset (◦C) Tend (◦C) Tindex (◦C) Tpeak (◦C) �Hmelt (J/g)
A: Particle size 1.53 11.00* 199.84* 0.84 121.52B: Fat 12.54 32.32* 2330.26* 0.23 3535.29*
C: Lecithin 2.43 18.18* 148.84* 3.13 376.74*
A × B 0.89 2.89* 99.22* 0.49 4.22A × C 2.16 2.39 31.69* 0.91 1.46B × C 2.45 0.53 198.58* 0.66 401.87*
A × B × C 1.73 1.01 19.76* 2.17 3.73
*Significant F-ratios at p ≤ 0.05.
noted that decreases in the amount of particle aggregation and structure build up in flowaffect chocolate meltdown, suggesting that in its crystallised state, the particle skeleton ofchocolates with larger PS is less interconnected, providing less resistance to breakage andmeltdown. This knowledge is important as it provides information on likely oral meltingbehaviour with an impact on temporal components of flavour release and also oral epithelialsensation. Beckett (1999) and Ziegler et al. (2001) noted that variations in PS might influencemelt, flavour, colour and gloss of chocolates.
7.8.2 Effects of fat content
Data from the DSC (Fig. 7.21) indicated that varying fat content produced changes incrystallinity and melting properties observed in the differences in their peak widths. Thissuggests that the fat content in dark chocolates during manufacture influences the degree ofcrystallinity and crystal size distribution (CSD) of their corresponding tempered products.Lonchampt and Hartel (2004) also noted that amount and composition of fat in chocolateproduction had unpredictable effects on crystal size, and polymorphism and crystallisationrate in products. Hartel (2001) concluded that distribution of crystal sizes in foods playskey roles in final product quality, defined by total and specific characteristics of the crys-talline material. Number of crystals and range of sizes, shapes and polymorphic stability, aswell as arrangements in network structures, dictate mechanical and rheological properties.Knowledge and control of CSD can be important for optimising processing conditions.
Results from the DSC data on Tonset, Tend, Tpeak, �Hmelt and T index with varying fat contentare as shown in Table 7.11. ANOVA and multiple mean comparisons showed no significantdifference (p > 0.05) for Tonset and Tpeak in chocolates with different fat contents (Table7.12), implying limited influence on temperatures for onset and peak melting. There weresignificant differences (p < 0.05) between melting end (Tend), index (T index) and enthalpies(�Hmelt) (Table 7.12). Increasing fat content from 25 to 35% caused consistent reductionsin Tend from 34.6 to 33.8◦C in products containing 18 µm PS and 0.3% lecithin level.
Similar marginal but significant (p < 0.05) decreasing trends in Tend with increasing fatcontent were noted at all PS and lecithin concentrations (Table 7.12). These suggest thatlow-fat (25%) chocolates completed melting at higher temperatures than those with more fat(30–35%). Likewise, increasing fat content caused consistent decreases in T index of products,suggesting an inverse relationship of T index with fat content (Table 7.11). Products withlower (25%) fat content, 18 µm PS and 0.3% lecithin had T index of 8.4◦C, and this reducedconsistently from 7.9 and 7.4◦C, respectively, with increasing fat content to 30 and 35%.
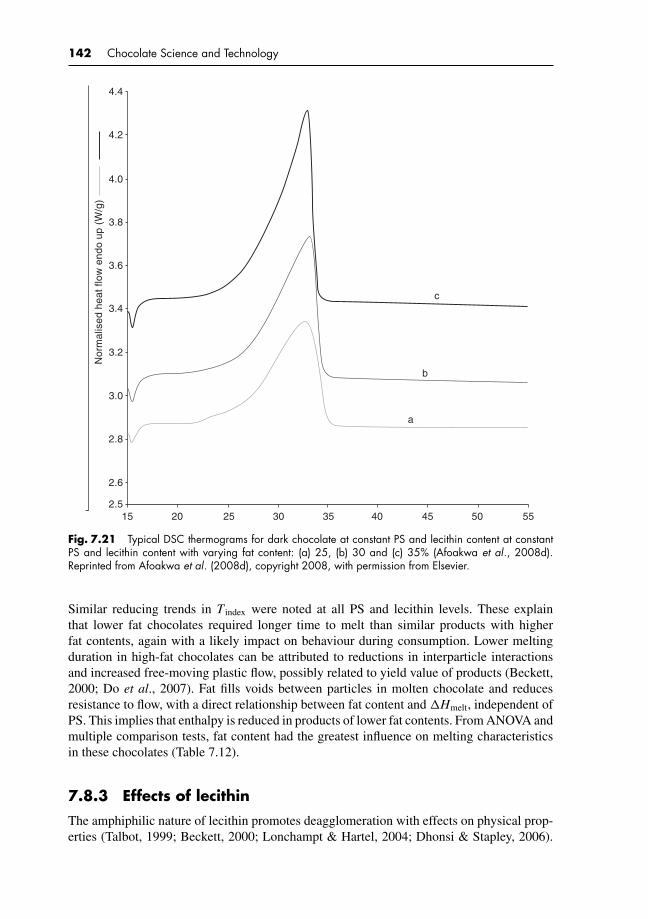
P1: KAE/UKS P2: KAEc07 BLBK244-Afoakwa January 25, 2010 21:43 Printer Name: Yet to Come
142 Chocolate Science and Technology
a
b
c
15 20 25 30 35 40 45 50 55
4.4N
orm
alis
ed h
eat f
low
end
o up
(W
/g)
2.5
4.2
4.0
3.8
3.6
3.4
3.2
3.0
2.8
2.6
Fig. 7.21 Typical DSC thermograms for dark chocolate at constant PS and lecithin content at constantPS and lecithin content with varying fat content: (a) 25, (b) 30 and (c) 35% (Afoakwa et al., 2008d).Reprinted from Afoakwa et al. (2008d), copyright 2008, with permission from Elsevier.
Similar reducing trends in T index were noted at all PS and lecithin levels. These explainthat lower fat chocolates required longer time to melt than similar products with higherfat contents, again with a likely impact on behaviour during consumption. Lower meltingduration in high-fat chocolates can be attributed to reductions in interparticle interactionsand increased free-moving plastic flow, possibly related to yield value of products (Beckett,2000; Do et al., 2007). Fat fills voids between particles in molten chocolate and reducesresistance to flow, with a direct relationship between fat content and �Hmelt, independent ofPS. This implies that enthalpy is reduced in products of lower fat contents. From ANOVA andmultiple comparison tests, fat content had the greatest influence on melting characteristicsin these chocolates (Table 7.12).
7.8.3 Effects of lecithin
The amphiphilic nature of lecithin promotes deagglomeration with effects on physical prop-erties (Talbot, 1999; Beckett, 2000; Lonchampt & Hartel, 2004; Dhonsi & Stapley, 2006).
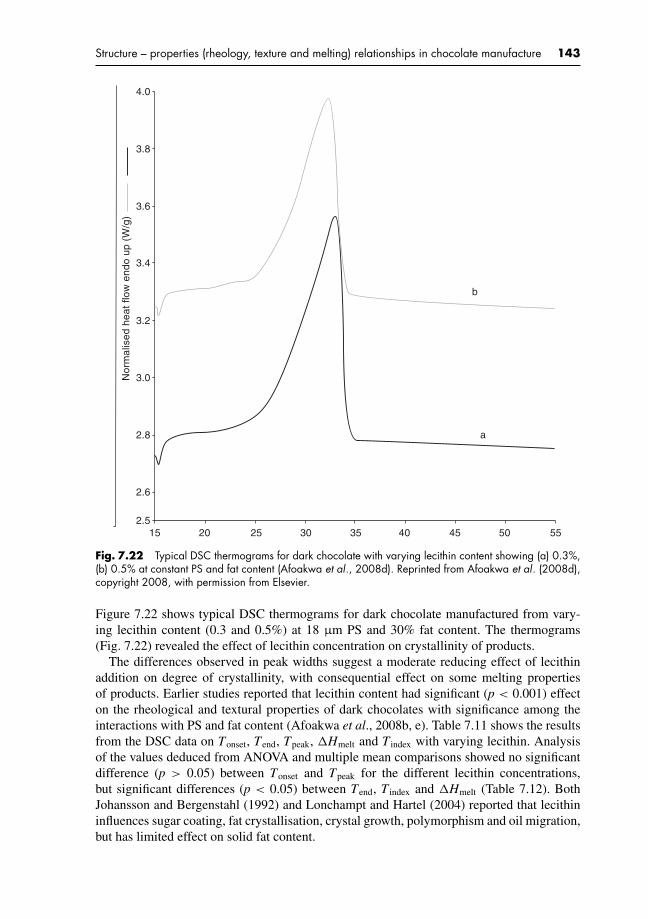
P1: KAE/UKS P2: KAEc07 BLBK244-Afoakwa January 25, 2010 21:43 Printer Name: Yet to Come
Structure – properties (rheology, texture and melting) relationships in chocolate manufacture 143
a
b
15 20 25 30 35 40 45 50 55
4.0
Nor
mal
ised
hea
t flo
w e
ndo
up (
W/g
)
2.5
3.8
3.6
3.4
3.2
3.0
2.8
2.6
Fig. 7.22 Typical DSC thermograms for dark chocolate with varying lecithin content showing (a) 0.3%,(b) 0.5% at constant PS and fat content (Afoakwa et al., 2008d). Reprinted from Afoakwa et al. (2008d),copyright 2008, with permission from Elsevier.
Figure 7.22 shows typical DSC thermograms for dark chocolate manufactured from vary-ing lecithin content (0.3 and 0.5%) at 18 µm PS and 30% fat content. The thermograms(Fig. 7.22) revealed the effect of lecithin concentration on crystallinity of products.
The differences observed in peak widths suggest a moderate reducing effect of lecithinaddition on degree of crystallinity, with consequential effect on some melting propertiesof products. Earlier studies reported that lecithin content had significant (p < 0.001) effecton the rheological and textural properties of dark chocolates with significance among theinteractions with PS and fat content (Afoakwa et al., 2008b, e). Table 7.11 shows the resultsfrom the DSC data on Tonset, Tend, Tpeak, �Hmelt and T index with varying lecithin. Analysisof the values deduced from ANOVA and multiple mean comparisons showed no significantdifference (p > 0.05) between Tonset and Tpeak for the different lecithin concentrations,but significant differences (p < 0.05) between Tend, T index and �Hmelt (Table 7.12). BothJohansson and Bergenstahl (1992) and Lonchampt and Hartel (2004) reported that lecithininfluences sugar coating, fat crystallisation, crystal growth, polymorphism and oil migration,but has limited effect on solid fat content.

P1: KAE/UKS P2: KAEc07 BLBK244-Afoakwa January 25, 2010 21:43 Printer Name: Yet to Come
144 Chocolate Science and Technology
Generally, there were inverse relationships between Tend and T index, independent of PS andfat content (Table 7.11). Thermograms (Fig. 7.22) showed that increasing lecithin contentinfluenced crystal dimensions and melting character in products. Increasing lecithin contentof products from 0.3 to 0.5% caused marginal but significant differences in Tend of products,noticeable at all PS and fat concentrations (Table 7.11). The Tend values were between 33 and34◦C, an indication that the crystallisations were in βV polymorph, imply limited influenceunder normal tempering conditions.
On the other hand, T index decreased consistently with increasing lecithin content, sug-gesting that products containing lower lecithin levels (0.3%) might require relatively longerresidence time to melt than those of their corresponding products with higher lecithin levels(0.5%), with likely impact on the melting residence time of products during consumption.The lower melting index (duration) observed with products containing higher lecithin levelsmight be attributed to sugar-coating ability of lecithin during processing, and thus reducingtheir interparticle interaction to induce chocolate melting properties. Dhonsi and Stapley(2006) reported that lecithin migrates to sugar/fat interfaces and coats sugar crystals, influ-encing rheology and aiding dispersion of sugar crystals in the continuous phases. Chevalley(1999) suggested that lecithin forms a monolayer on sugar particle surfaces, allowing greatermobility in suspensions while increasing fat spreadability. Increasing lecithin content causedsignificant and consistent decreases in �Hmelt, trends noted at all PS and fat content (Table7.11). This implies that products with relatively higher lecithin content would require lowerenthalpies to melt than those of their corresponding products with lower lecithin levels. Sig-nificant (p < 0.05) interactions were observed among all the processing parameters. Multiplecomparison tests revealed that fat content had the greatest effect on T index and �Hmelt of darkchocolates, followed by lecithin content and then PSD (Table 7.12).
7.9 RELATIONSHIPS BETWEEN RHEOLOGICAL, TEXTURALAND MELTING PROPERTIES OF DARK CHOCOLATE
The rheological properties (yield stress and apparent viscosity) of chocolate are of crucialimportance to the properties of materials and their efficiency of manufacture (Chevalley, 1999;Afoakwa et al., 2007). On the other hand, textural properties (firmness and index of viscosity)determine the degree of consistency and spreadability, and resistance to flow (viscosity) ofmolten chocolate (Beckett, 2000). Ziegler and Hogg (1999) concluded that knowledge ofsuch flow behaviour is important for moulding and enrobing, for quality control of moltenchocolate products, for proper cookie drop formation and in design of bulk handling systems.Hardness determines the physical rigidity (texture) of products and relates directly to sensoryproperties during consumption. Assessment of both molten and solid tempered chocolateusing texture analyser with various probes and procedures has been reported previously (Fullet al., 1996; Beckett, 2000; Pereira et al., 2003; Liang & Hartel, 2004).
Multivariate statistical techniques were employed to evaluate relationships between therheological properties (apparent viscosity and yield stress), textural properties (firmness,index of viscosity and hardness) and melting index of dark chocolate systems. Correlationand regression analyses conducted on the data revealed very high and significant (p < 0.05)regression and correlation coefficients among all rheological and textural parameters (Table7.13). Relationships were calculated using correlation analysis between yield stress and ap-parent viscosity. As previously discussed, high correlation coefficients (r = 0.99; p = 0.001)

P1: KAE/UKS P2: KAEc07 BLBK244-Afoakwa January 25, 2010 21:43 Printer Name: Yet to Come
Structure – properties (rheology, texture and melting) relationships in chocolate manufacture 145
Table
7.1
3Re
gres
sion
and
corr
elat
ion
anal
yses
betw
een
dark
choc
olat
erh
eolo
gica
l,te
xtur
alan
dm
eltin
gpa
ram
eter
s
Para
met
erA
naly
sis
Appare
nt
visc
osi
tyY
ield
stre
ssFi
rmnes
sIn
dex
of
visc
osi
tyH
ard
nes
sM
elting
index
App
aren
tvis
cosi
tyRe
gres
sion
1.00
000.
9898
**0.
9321
**0.
9333
**0.
7640
*60
.38*
Cor
rela
tion
1.00
000.
9941
**0.
9654
**0.
9661
**0.
8567
**77
.70*
Yiel
dstr
ess
Regr
essi
on—
1.00
000.
9211
**0.
9121
**0.
7314
*58
.80*
Cor
rela
tion
—1.
0000
0.95
98**
0.95
50**
0.83
14*
76.6
8*Fi
rmne
ssRe
gres
sion
——
1.00
000.
9896
**0.
9764
**62
.48*
Cor
rela
tion
——
1.00
000.
9947
**0.
9855
**79
.05*
Inde
xof
visc
osity
Regr
essi
on—
——
1.00
000.
9742
**67
.92*
Cor
rela
tion
——
—1.
0000
0.98
61**
82.4
1**
Har
dnes
sRe
gres
sion
——
——
1.00
0082
.74*
*
Cor
rela
tion
——
——
1.00
0090
.96*
*
Mel
ting
inde
xRe
gres
sion
——
——
—1.
0000
Cor
rela
tion
——
——
—1.
0000
*Si
gnifi
cant
atp
<0.
05;*
*si
gnifi
cant
atp
<0.
001.

P1: KAE/UKS P2: KAEc07 BLBK244-Afoakwa January 25, 2010 21:43 Printer Name: Yet to Come
146 Chocolate Science and Technology
were observed between the yield stress and apparent viscosity. The rheological measurementsindicated that yield stress and apparent viscosity follow the same trend and have a stronglinear correlation and regression model (Fig. 7.7(d)) with a highly significant (p = 0.001)regression coefficient, R2 = 0.99, indicating the two rheological parameters were highlyrelated and could individually be used to predict rheological behaviour of dark chocolateduring manufacture. This confirms observations by Servais et al. (2004) that yield stress andapparent viscosity of chocolates are related, suggesting either of the two rheological param-eters could be effectively used to predict chocolate viscosity during processing. Contrary tothis observation, Mongia and Ziegler (2000) did not find any relationship between yield stressand apparent viscosity. They interpreted their data based on regression to the Casson model,thus, Casson yield stress and the Casson plastic viscosity. Servais et al. (2004) observed thatfor the same products a linear correlation could be found between yield stress and apparentviscosity using the new ICA (2000) recommendation, but not between Casson yield valueand Casson plastic viscosity using the Casson model.
High correlation coefficients (r = 0.96; p = 0.001) were noted between both yield stressand index of viscosity, and yield stress and firmness (Table 7.13), suggesting their highinterrelationships. The regression models developed (Figs 7.23 and 7.24) showed highlysignificant (p = 0.001) regression coefficient, R2 = 0.92 and 0.91, respectively, for yield stressand firmness, and yield stress and index of viscosity. Servais et al. (2004) noted that yieldstress depends on proportion of small particles (specific surface area) and on interactions,originating in mechanical (friction) and chemical effects. As yield stress corresponds tothe energy needed for chocolate to start moving and relates to the strength of interparticleaggregates at rest, the observed high interrelationship suggests that both firmness and indexof viscosity could be related to strengths of the aggregated particle-to-particle networksystem of chocolate mass during manufacture (Beckett, 2000; Servais et al., 2004), withthe distribution and arrangement of PSs, fat and lecithin contents as the main influentialfactors dictating their flow behaviour (Afoakwa et al., 2007, 2008b). This knowledge wouldbe useful for engineering purposes such as pumping, mixing, storage and transportation ofmolten chocolate. Contrary to the high regression coefficients noted between yield stress
Firmness (g force)
Yie
ld s
tres
s (P
a)
0 300 600 900 1200 1500
0
200
400
600
800
1000
R 2 = 0.92
Fig. 7.23 Relationship between yield stress and firmness in molten chocolate (Afoakwa et al., 2008f).Data points (squares); linear regression (inner solid line); 95% minimum and maximum tolerance intervals(both outer lines); yield stress = 18.2498 + 0.683086 × firmness. With kind permission from SpringerScience and Business Media, Afoakwa et al. (2008f).

P1: KAE/UKS P2: KAEc07 BLBK244-Afoakwa January 25, 2010 21:43 Printer Name: Yet to Come
Structure – properties (rheology, texture and melting) relationships in chocolate manufacture 147
R 2 = 0.91
Index of viscosity (g force.second)
Yie
ld s
tres
s (P
a)
0 1000 2000 3000 4000 5000 6000
0
200
400
600
800
1000
Fig. 7.24 Relationship between yield stress and index of viscosity in molten chocolate (Afoakwa et al.,2008f). Data points (squares); linear regression (inner solid line); 95% minimum and maximum toleranceintervals (both outer lines); yield stress = 9.70711 + 0.13679 × index of viscosity. With kind permissionfrom Springer Science and Business Media, Afoakwa et al. (2008f).
and firmness and that of index of viscosity (Table 7.13), yield stress and hardness yieldedhigh and significant, but relatively lower correlation (r = 0.83; p = 0.001) and regressioncoefficient, R2 = 0.73 (Table 7.13), suggesting other processing factors play significant rolein defining the texture (hardness) of solid tempered dark chocolate. Afoakwa et al. (2007)and Beckett (1999) noted that several factors including recipe, manufacturing techniques,temper, polymorphism (stability of fat crystals) and cooling temperature controls influencefinal texture (hardness) of solid tempered chocolate. Keogh et al. (2002) also concludedthat hardness is a useful indicator of good tempering, or degree to which a stable fat crystalnetwork has been formed. The regression model forms Figure 7.25.
Apparent viscosity and firmness, and apparent viscosity and index of viscosity were highlypositively correlated (r = 0.97; p = 0.001), with regression coefficient, R2 = 0.93 (Table 7.13),
Hardness (g force)
Yie
ld s
tres
s (P
a)
4100 4600 5100 5600 6100 6600 7100
0
200
400
600
800
1000
R 2 = 0.73
Fig. 7.25 Relationship between yield stress and hardness in chocolate (Afoakwa et al., 2008f). Datapoints (squares); linear regression (Inner solid line); 95% minimum and maximum tolerance intervals (bothouter lines); yield stress = −784.281 + 0.184538 × hardness. With kind permission from SpringerScience and Business Media, Afoakwa et al. (2008f).
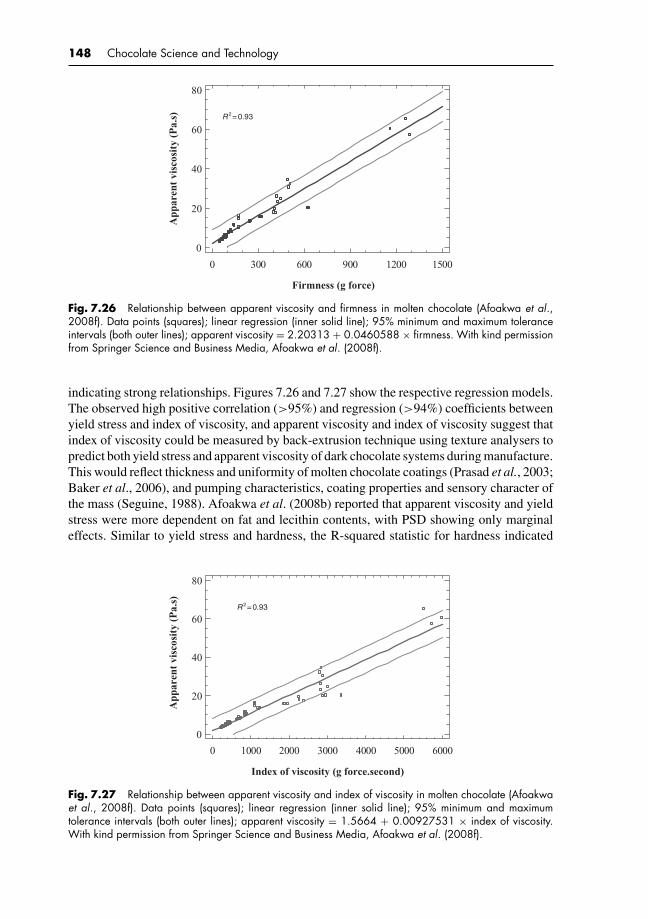
P1: KAE/UKS P2: KAEc07 BLBK244-Afoakwa January 25, 2010 21:43 Printer Name: Yet to Come
148 Chocolate Science and Technology
Firmness (g force)
App
aren
t vi
scos
ity
(Pa.
s)
0 300 600 900 1200 1500
0
20
40
60
80
R 2 = 0.93
Fig. 7.26 Relationship between apparent viscosity and firmness in molten chocolate (Afoakwa et al.,2008f). Data points (squares); linear regression (inner solid line); 95% minimum and maximum toleranceintervals (both outer lines); apparent viscosity = 2.20313 + 0.0460588 × firmness. With kind permissionfrom Springer Science and Business Media, Afoakwa et al. (2008f).
indicating strong relationships. Figures 7.26 and 7.27 show the respective regression models.The observed high positive correlation (>95%) and regression (>94%) coefficients betweenyield stress and index of viscosity, and apparent viscosity and index of viscosity suggest thatindex of viscosity could be measured by back-extrusion technique using texture analysers topredict both yield stress and apparent viscosity of dark chocolate systems during manufacture.This would reflect thickness and uniformity of molten chocolate coatings (Prasad et al., 2003;Baker et al., 2006), and pumping characteristics, coating properties and sensory character ofthe mass (Seguine, 1988). Afoakwa et al. (2008b) reported that apparent viscosity and yieldstress were more dependent on fat and lecithin contents, with PSD showing only marginaleffects. Similar to yield stress and hardness, the R-squared statistic for hardness indicated
Index of viscosity (g force.second)
App
aren
t vi
scos
ity
(Pa.
s)
0 1000 2000 3000 4000 5000 6000
0
20
40
60
80
R 2 = 0.93
Fig. 7.27 Relationship between apparent viscosity and index of viscosity in molten chocolate (Afoakwaet al., 2008f). Data points (squares); linear regression (inner solid line); 95% minimum and maximumtolerance intervals (both outer lines); apparent viscosity = 1.5664 + 0.00927531 × index of viscosity.With kind permission from Springer Science and Business Media, Afoakwa et al. (2008f).
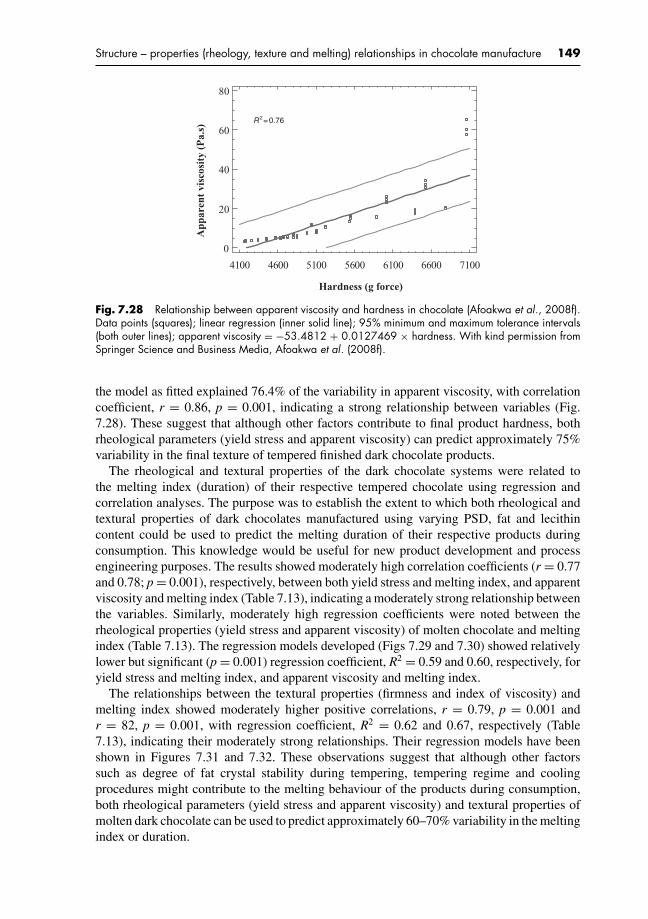
P1: KAE/UKS P2: KAEc07 BLBK244-Afoakwa January 25, 2010 21:43 Printer Name: Yet to Come
Structure – properties (rheology, texture and melting) relationships in chocolate manufacture 149
Hardness (g force)
App
aren
t vi
scos
ity
(Pa.
s)
4100 4600 5100 5600 6100 6600 7100
0
20
40
60
80
R 2 = 0.76
Fig. 7.28 Relationship between apparent viscosity and hardness in chocolate (Afoakwa et al., 2008f).Data points (squares); linear regression (inner solid line); 95% minimum and maximum tolerance intervals(both outer lines); apparent viscosity = −53.4812 + 0.0127469 × hardness. With kind permission fromSpringer Science and Business Media, Afoakwa et al. (2008f).
the model as fitted explained 76.4% of the variability in apparent viscosity, with correlationcoefficient, r = 0.86, p = 0.001, indicating a strong relationship between variables (Fig.7.28). These suggest that although other factors contribute to final product hardness, bothrheological parameters (yield stress and apparent viscosity) can predict approximately 75%variability in the final texture of tempered finished dark chocolate products.
The rheological and textural properties of the dark chocolate systems were related tothe melting index (duration) of their respective tempered chocolate using regression andcorrelation analyses. The purpose was to establish the extent to which both rheological andtextural properties of dark chocolates manufactured using varying PSD, fat and lecithincontent could be used to predict the melting duration of their respective products duringconsumption. This knowledge would be useful for new product development and processengineering purposes. The results showed moderately high correlation coefficients (r = 0.77and 0.78; p = 0.001), respectively, between both yield stress and melting index, and apparentviscosity and melting index (Table 7.13), indicating a moderately strong relationship betweenthe variables. Similarly, moderately high regression coefficients were noted between therheological properties (yield stress and apparent viscosity) of molten chocolate and meltingindex (Table 7.13). The regression models developed (Figs 7.29 and 7.30) showed relativelylower but significant (p = 0.001) regression coefficient, R2 = 0.59 and 0.60, respectively, foryield stress and melting index, and apparent viscosity and melting index.
The relationships between the textural properties (firmness and index of viscosity) andmelting index showed moderately higher positive correlations, r = 0.79, p = 0.001 andr = 82, p = 0.001, with regression coefficient, R2 = 0.62 and 0.67, respectively (Table7.13), indicating their moderately strong relationships. Their regression models have beenshown in Figures 7.31 and 7.32. These observations suggest that although other factorssuch as degree of fat crystal stability during tempering, tempering regime and coolingprocedures might contribute to the melting behaviour of the products during consumption,both rheological parameters (yield stress and apparent viscosity) and textural properties ofmolten dark chocolate can be used to predict approximately 60–70% variability in the meltingindex or duration.

P1: KAE/UKS P2: KAEc07 BLBK244-Afoakwa January 25, 2010 21:43 Printer Name: Yet to Come
150 Chocolate Science and Technology
Melting index
Yie
ld s
tres
s (P
a)
6.1 6.5 6.9 7.3 7.7 8.1 8.5 8.9
0
200
400
600
800
1000
R 2 = 58.8
Fig. 7.29 Relationship between yield stress and melting index in chocolate (Afoakwa et al., 2008f).Data points (squares); linear regression (inner solid line); 95% minimum and maximum tolerance intervals(both outer lines); yield stress = −1620.41 + 246.64 × melting index. With kind permission from SpringerScience and Business Media, Afoakwa et al. (2008f).
The relationship between hardness of the finished chocolate and melting index showedrelatively higher coefficients of regression (Fig. 7.33) and correlation (Table 7.13). Multi-variate analyses on the data showed fitting of a linear model to describe the relationshipbetween hardness and melting index. The R-squared statistic indicated that the model asfitted explained 82.74% of the variability in hardness, with correlation coefficient, r = 0.91,p = 0.001, indicating a relatively strong relationship between the variables. This explainsthat tempering, a fat crystallisation process, which is used to convert molten chocolate intofinished product, plays a very significant role in defining the melting time or duration ofthe products. Beckett (1999) explained that melting of chocolate in the mouth is defined by
Melting index
App
aren
t vi
scos
ity
(Pa.
s)
6.1 6.5 6.9 7.3 7.7 8.1 8.5 8.9
0
20
40
60
80
R 2 = 60.38
Fig. 7.30 Relationship between apparent viscosity and melting index in chocolate (Afoakwa et al.,2008f). Data points (squares); linear regression (inner solid line); 95% minimum and maximum toleranceintervals (both outer lines); apparent viscosity = −109.182 + 16.7535 × melting index. With kindpermission from Springer Science and Business Media, Afoakwa et al. (2008f).

P1: KAE/UKS P2: KAEc07 BLBK244-Afoakwa January 25, 2010 21:43 Printer Name: Yet to Come
Structure – properties (rheology, texture and melting) relationships in chocolate manufacture 151
Melting index
Fir
mne
ss (
g.fo
rce)
6.1 6.5 6.9 7.3 7.7 8.1 8.5
0
300
600
900
1200
1500
R 2 = 62.48
Fig. 7.31 Relationship between firmness and melting index in chocolate (Afoakwa et al., 2008f). Datapoints (squares); linear regression (inner solid line); 95% minimum and maximum tolerance intervals (bothouter lines); firmness = −2371.11 + 357.237 × melting index. With kind permission from SpringerScience and Business Media, Afoakwa et al. (2008f).
the characteristics of the fat phase, and facilitates the perception of its characteristic taste,flavour and textural attributes. The intensity of perceived flavour changes dynamically overtime as the chocolate is melted, manipulated and mixed with saliva for swallowing. Ziegleret al. (2001) also noted that PS and rheology significantly influenced the melting time andsweetness intensity of milk chocolate using time–intensity methodology.
Multivariate PCA evaluated the extent to which PSD, fat and lecithin contents influencerheological, textural and melting properties of dark chocolates. Group A is composed ofrheological, textural and melting parameters and B influencing factors comprising PS, fatand lecithin content (Fig. 7.34). The PCA product space (Fig. 7.34) explained more than82% variance in the first two factors and showed that the rheological and texture parameters
Melting index
Inde
x of
vis
cosi
ty (
g fo
rce.
seco
nd)
6.1 6.5 6.9 7.3 7.7 8.1 8.5 8.9
0
1000
2000
3000
4000
5000
6000
R 2 = 67.92
Fig. 7.32 Relationship between index of viscosity and melting index in chocolate (Afoakwa et al.,2008f). Data points (squares); linear regression (inner solid line); 95% minimum and maximum toleranceintervals (both outer lines); index of viscosity = −12263.5 + 1850.79 × melting index. With kindpermission from Springer Science and Business Media, Afoakwa et al. (2008f).

P1: KAE/UKS P2: KAEc07 BLBK244-Afoakwa January 25, 2010 21:43 Printer Name: Yet to Come
152 Chocolate Science and Technology
Melting index
Har
dnes
s (g
.for
ce)
6.1 6.5 6.9 7.3 7.7 8.1 8.5 8.9
4100
4600
5100
5600
6100
6600
7100
R 2 = 82.74
Fig. 7.33 Relationship between hardness and melting index in chocolate (Afoakwa et al., 2008f). Datapoints (squares); linear regression (inner solid line); 95% minimum and maximum tolerance intervals (bothouter lines); hardness = −4396.97 + 1318.07 × melting index. With kind permission from SpringerScience and Business Media, Afoakwa et al. (2008f).
were closely related with loadings for PSD, fat and lecithin content as influencing factors.Fat and lecithin content had polar influences on principal component 1 (PC1) (69.67%variance) score, while PS had marginal influence on PC2 (12.71% variance) score. Afoakwaet al. (2008a) established that PSD had multiple discrete components – specific surface area,largest PS (D90), smallest PS (D10), mean PS (D50) and Sauter mean diameter (D[3,2]) –together influencing rheological properties of dark chocolates. A small number of linearcombinations of the nine variables accounted for most of variability (98.7%). In this case,three components were extracted, since 1888 components had eigenvalues 1 or more. ThePCA (Fig. 7.34) product space for rheological properties (apparent viscosity and yield stress),
Component 1 (69.67%)
Com
pone
nt 2
(12
.71%
)
Particle size
Fat
Lecithin
Index of viscosity
HardnessFirmness
Yield stressApparent viscosity
Melting index
-9 -6 -3 0 3 6
-3.4
-2.4
-1.4
-0.4
0.6
1.6
2.6
A
B
Fig. 7.34 Principal component analysis of rheological, textural and melting properties of dark chocolates(A) as affected by PSD, fat and lecithin content (B) (Afoakwa et al., 2008f). With kind permission fromSpringer Science and Business Media, Afoakwa et al. (2008f).

P1: KAE/UKS P2: KAEc07 BLBK244-Afoakwa January 25, 2010 21:43 Printer Name: Yet to Come
Structure – properties (rheology, texture and melting) relationships in chocolate manufacture 153
textural properties (firmness, index of viscosity and hardness) and melting index were veryclosely related and could be used to predict the relative processing behaviours during darkchocolate manufacture.
7.10 CONCLUSION
Increasing PSs resulted in decreases in Casson plastic viscosity, Casson yield value, yieldstress and apparent viscosity, which were more pronounced at lower fat and lecithin levels.Increasing the fat and lecithin levels enhanced the reducing effects of PSD on the rheologicalproperties of the dark chocolates, with the exception of plastic viscosity and thixotropy,where no significant effects were noticed at fat levels at and above 30%. The effectivenessof fat and lecithin in reducing the plastic viscosity and thixotropy of dark chocolate dependson the level of fat already present. Fat content exerts the greatest effect on the variability inthe rheological properties, followed by lecithin content and then PSD. The Casson referenceparameters (yield value and plastic viscosity) and newer ICA recommendations (yield stressand apparent viscosity) for evaluating chocolate viscosity are very closely related, and couldbe used independently. The ICA method is relatively more efficient than the Casson model,which has limitations with chocolates with wide variations in viscosity. Both rheologicalmodels are dependent on PSD, fat and lecithin as key factors under controlled processingconditions.
Increase in PS resulted in linear decreases in textural properties of both molten andsolid tempered dark chocolates, higher at lower fat and lecithin contents. At low (25%) fatcontents, 5 and 2% increases in fat and lecithin levels, respectively, enhanced PSD effectson texture, with no significant effects at 30% or more fat. Effects on texture of changes infat and lecithin depended on base fat content. Increasing PSD and fat inversely influencedappearance parameters (L*, C* and h◦). Fat content exerted greatest effect on texture andappearance, followed by PSD and then lecithin content with the last having no significanteffect on appearance.
PSD and ingredient content were significant factors determining microstructural propertiesof dark chocolates. Microstructural analysis revealed that the smaller particles (D10, D50),largest particles (D90) and specific surface area had direct influence on packing ability andinterparticle interactions. At low (25%) fat concentrations, interparticle interaction of crystalsled to flocculation, with an impact on microstructure and behaviour of molten and temperedproducts. Increasing fat reduced the crystalline network density, created more open andvoid spaces which fill with fat, reducing resistance to flow, and enhancing spreadability andsoftening.
Variations in PSD, fat and lecithin content during dark chocolate manufacture influenceto varying levels, the degree of crystallinity and melting properties (Tend, T index and �Hmelt)of their derived products. Changes in PSD had no effect on the crystallinity of products.Increasing fat content resulted in consistent increases in crystallinity of products formedduring tempering. Products containing 25% fat had the smallest crystal size, followed bythose with 30%, with the 35% fat having the largest crystal size, causing significant changesin Tend, T index and �Hmelt of products. Similarly, increasing lecithin content from 0.3 to 0.5%moderately reduced the crystallinity of products with significant variations in Tend, T index
and �Hmelt of products. Neither PSD, fat nor lecithin content influenced initiation (Tonset)and maximum (Tpeak) melting temperatures. Chocolates with finer particles, higher fat and

P1: KAE/UKS P2: KAEc07 BLBK244-Afoakwa January 25, 2010 21:43 Printer Name: Yet to Come
154 Chocolate Science and Technology
lower lecithin contents, took longer and higher temperatures to complete melting than theircorresponding products with larger PS, lower fat and higher lecithin content. This suggeststhat for chocolate of the same composition, processed under identical conditions, the PSDof the suspended non-fat solid, fat and lecithin contents plays important roles in determiningtheir melting behaviour. These findings would have application in defining chocolate qualityas the nature of crystalline material; dimensions of crystals and polymorphic stability dictatethe mechanical and rheological properties of chocolate products.
Rheological parameters (apparent viscosity and yield stress), textural parameters (firmness,index of viscosity and hardness) and melting index (duration or time) were highly positivelycorrelated, suggesting effective prediction. Except for hardness which showed relativelylower correlation and regression coefficients with both apparent viscosity and yield stress, allother rheological and textural parameters had high correlation and regression coefficients ofmore than 90%, suggesting that the rheological parameters and textural properties of moltendark chocolate were very highly related and predictive of character. Similarly, the rheologicaland textural properties of the molten dark chocolate showed relatively lower correlation andregression coefficients with melting index, while relatively higher correlation and regressioncoefficients were noted with hardness. PCA revealed that with the exception of meltingindex, which showed a moderate shift in space, the rheological properties (apparent viscosityand yield stress) and textural properties (firmness, index of viscosity and hardness) wereclosely related. PSD, fat and lecithin contents – all interact to determine rheological andtextural properties, and melting index (duration) of dark chocolates, with significance formanufacturing improvements and quality control.

P1: KAE/UKS P2: KAEc08 BLBK244-Afoakwa January 5, 2010 9:25 Printer Name: Yet to Come
8 Tempering behaviour duringchocolate manufacture: effectsof varying product matrices
8.1 SUMMARY AND INDUSTRIAL RELEVANCE
Tempering consists of shearing chocolate mass at controlled temperatures to promote cocoabutter crystallisation in a stable polymorphic form. During industrial processing, multi-stage heat exchangers are used to control temperature adjustments to promote formationof appropriate stable polymorphic crystals to obtain products with good snap, colour, con-traction, gloss and shelf-life characteristics. The process employs varying time–temperaturethroughputs of the multistage units, making it difficult to obtain standard tempering condi-tions for products with variable particle sizes and fat content, thus prolonging equipmentstandardisation periods with consequential effects on processing times and product qual-ity characteristics. Modelling the tempering behaviour of chocolates from varying particlesize distribution (PSD) and fat content would enhance our knowledge and understanding onthe optimal temperature conditions for obtaining good tempered products during industrialmanufacture, with significance for reducing processing (tempering) times and assurances inquality and shelf characteristics.
Central composite rotatable design (CCRD) for K = 2 was used to study the combinedeffects of multistage heat exchangers for Stages 1 (14–30◦C) and 2 (12–28◦C) coolanttemperatures at constant Stage 3 coolant and holding temperatures during tempering of darkchocolates using laboratory-scale mini temperer. Quantitative data on chocolate temper index(slope) were obtained for products with varying PSD (D90 of 18, 25, 35 and 50 µm) andfat (30 and 35%) content. Regression models generated using stepwise regression analyseswere used to plot response surface curves, to study the tempering behaviour of products.The results showed that both Stage 1 and Stage 2 coolant temperatures had significant linearand quadratic effects on the crystallisation behaviour, causing wide variations in chocolatetemper slope during tempering of products with variable PSD and fat content. Differencesin fat content exerted the greatest variability in temperature settings of the different zonesfor attaining well-tempered products. At 35% fat content, changes in PSD caused only slightand insignificant effect on tempering behaviour. No unique set of conditions was foundto achieve good temper in dark chocolate with a specified tempering unit. Thus, differentcombinations of temperatures could be employed between the multistage heat exchangers toinduce nucleation and growth of stable fat crystal polymorphs during tempering. Variationsin tempering outcomes of the dark chocolates were dependent more on the fat content thanon PSD.
P1: KAE/UKS P2: KAEc08 BLBK244-Afoakwa January 5, 2010 9:25 Printer Name: Yet to Come
156 Chocolate Science and Technology
8.2 INTRODUCTION
Tempering is a directed pre-crystallisation that consists of shearing chocolate mass at con-trolled temperatures to promote cocoa butter crystallisation in a thermodynamically stablepolymorphic form. During chocolate manufacture, tempering is used to obtain the stableForm V (or β2) of cocoa butter having a melting temperature of 32–34◦C, which givesthe desired glossy appearance, good snap, contraction and enhanced shelf-life character-istics (Seguine, 1991; Beckett, 1999; Talbot, 1999; Timms, 2003; Lonchampt & Hartel,2006; Afoakwa et al., 2007a). The process involves pre-crystallisation of a small pro-portion of triglycerides (TAGs), with crystals forming nuclei (1–3% total) for the re-maining lipid to set in the correct form. The final crystal form depends critically on theshear–temperature–time process which the material has undergone. The tempered choco-late is then deposited in moulds and cooled so that subsequent crystal growth occurs uponthe existing seed crystals (Stapley et al., 1999; Hartel, 2001). Tempering has four keysteps: melting to completion (at 50◦C), cooling to the point of crystallisation (at 32◦C),crystallisation (at 27◦C) and conversion of any unstable crystals (at 29–31◦C) (Talbot,1999). Thereby, the tempering sequence is a function of recipe, equipment and the finalpurpose.
Current industrial tempering machines consist of multistage heat exchangers (Fig. 8.1)through which chocolate passes at widely differing rates and are used to control temperatureadjustments to promote formation of appropriate stable crystals. Time–temperature combi-nations are of paramount importance in process design and in continuous tempering (Beckett,1999; Nelson, 1999; Tewkesbury et al., 2000; Hartel, 2001). The varying time–temperaturethroughputs of these units make it difficult to obtain standard tempering conditions for prod-ucts with variable particle sizes and fat composition, thus prolonging equipment standardis-ation periods with consequential effects on process times and product quality characteristics.Poorly tempered chocolates result in unstable crystal growth and poor setting characteristics,making products more susceptible to fat bloom, a physical imperfection that often manifestsitself as a white or greyish white layer on the surface of the chocolate product during storage.The occurrence of fat bloom is associated with the polymorphic transformation from a lowerand unstable crystal Form IV to a higher and more stable Form VI (Bricknell & Hartel,1998; Beckett, 2000; Lonchampt & Hartel, 2004; Lonchampt & Hartel, 2006). PSD andfat composition during dark chocolate manufacture affect their rheological (Afoakwa et al.,2008b) as well as microstructural and mechanical properties (Afoakwa et al., 2009d), es-tablishing relationships between the rheology and structural character of products; however,their influence on pre-crystallisation and nucleation still remains unclear.
Response surface methodology (RSM) is a collection of statistical and mathematicaltechniques useful for developing, improving and optimising processes in which a response ofinterest is influenced by several variables, and the objective is to optimise the response. Basand Boyacı (2007) noted that RSM has important applications in the design, developmentand formulation of new products, as well as in the improvement of existing product designs.It defines the effect of the independent variables, alone or in combination, on the processes. Inaddition to analysing the effects of the independent variables, this experimental methodologygenerates a mathematical model, which describes the chemical, biochemical or physicalprocesses involved (Myers & Montgomery, 1995; Anjum et al., 1997; Senanayake &Shahidi, 2002; Vohra & Satyanarayana, 2002; Afoakwa et al., 2007b). The objective of thiswork was to study tempering behaviour of dark chocolates varying in PSD and fat contentusing RSM.

P1: KAE/UKS P2: KAEc08 BLBK244-Afoakwa January 5, 2010 9:25 Printer Name: Yet to Come
Tempering behaviour during chocolate manufacture: effects of varying product matrices 157
Stage (Zone) 1
Stage (Zone) 2
Stage (Zone) 3
Holding tank
Fig. 8.1 Typical Aasted Mikrovert multistage tempering unit (temperers) used for this experiment.Reprinted from Afoakwa et al. (2008g), copyright 2008, with permission from Elsevier.
8.3 MATERIALS AND METHODS
8.3.1 Materials
Cocoa liquor of Central West African Origin was obtained from Cargill Cocoa ProcessingCompany (York, UK); sucrose (pure extra-fine granulated) from British Sugar Company(Peterborough, UK); pure prime pressed cocoa butter and soy lecithin from ADM CocoaLimited (Koog aan de Zaan, the Netherlands) and Unitechem Company Ltd (Tianjin, China),respectively.
The recipe, formulation and production of samples have been given in Table 8.1, but withonly 0.5% lecithin content. Chocolates were formulated with total fat of 25–35% (w/w) fromcocoa liquor and cocoa butter with more than 34% total cocoa: composition as specifiedfor dark chocolate by relevant directives (European Commission Directive, 2000; CodexRevised Standard, 2003). Experimental samples (5 kg batch for each formulation) wereproduced by mixing sucrose and cocoa liquor in a Crypto Peerless mixer (Model K175,Crypto Peerless Ltd, Birmingham, UK) at low speed for 2 minutes and then at high for3 minutes, then refined using a three-roll refiner (Model SDX 600, Buhler Ltd, CH-9240
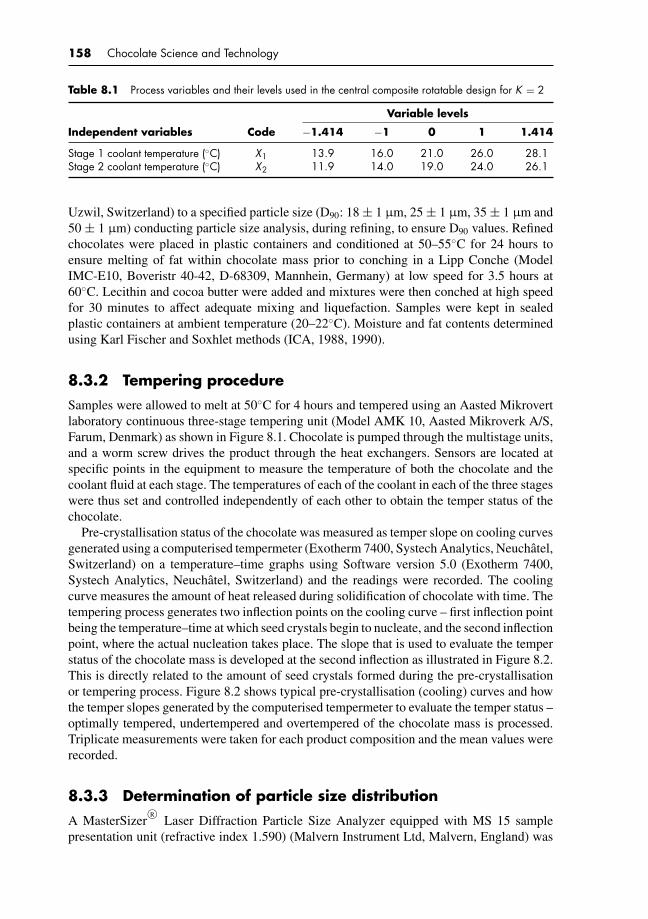
P1: KAE/UKS P2: KAEc08 BLBK244-Afoakwa January 5, 2010 9:25 Printer Name: Yet to Come
158 Chocolate Science and Technology
Table 8.1 Process variables and their levels used in the central composite rotatable design for K = 2
Variable levels
Independent variables Code −1.414 −1 0 1 1.414
Stage 1 coolant temperature (◦C) X1 13.9 16.0 21.0 26.0 28.1Stage 2 coolant temperature (◦C) X2 11.9 14.0 19.0 24.0 26.1
Uzwil, Switzerland) to a specified particle size (D90: 18 ± 1 µm, 25 ± 1 µm, 35 ± 1 µm and50 ± 1 µm) conducting particle size analysis, during refining, to ensure D90 values. Refinedchocolates were placed in plastic containers and conditioned at 50–55◦C for 24 hours toensure melting of fat within chocolate mass prior to conching in a Lipp Conche (ModelIMC-E10, Boveristr 40-42, D-68309, Mannhein, Germany) at low speed for 3.5 hours at60◦C. Lecithin and cocoa butter were added and mixtures were then conched at high speedfor 30 minutes to affect adequate mixing and liquefaction. Samples were kept in sealedplastic containers at ambient temperature (20–22◦C). Moisture and fat contents determinedusing Karl Fischer and Soxhlet methods (ICA, 1988, 1990).
8.3.2 Tempering procedure
Samples were allowed to melt at 50◦C for 4 hours and tempered using an Aasted Mikrovertlaboratory continuous three-stage tempering unit (Model AMK 10, Aasted Mikroverk A/S,Farum, Denmark) as shown in Figure 8.1. Chocolate is pumped through the multistage units,and a worm screw drives the product through the heat exchangers. Sensors are located atspecific points in the equipment to measure the temperature of both the chocolate and thecoolant fluid at each stage. The temperatures of each of the coolant in each of the three stageswere thus set and controlled independently of each other to obtain the temper status of thechocolate.
Pre-crystallisation status of the chocolate was measured as temper slope on cooling curvesgenerated using a computerised tempermeter (Exotherm 7400, Systech Analytics, Neuchatel,Switzerland) on a temperature–time graphs using Software version 5.0 (Exotherm 7400,Systech Analytics, Neuchatel, Switzerland) and the readings were recorded. The coolingcurve measures the amount of heat released during solidification of chocolate with time. Thetempering process generates two inflection points on the cooling curve – first inflection pointbeing the temperature–time at which seed crystals begin to nucleate, and the second inflectionpoint, where the actual nucleation takes place. The slope that is used to evaluate the temperstatus of the chocolate mass is developed at the second inflection as illustrated in Figure 8.2.This is directly related to the amount of seed crystals formed during the pre-crystallisationor tempering process. Figure 8.2 shows typical pre-crystallisation (cooling) curves and howthe temper slopes generated by the computerised tempermeter to evaluate the temper status –optimally tempered, undertempered and overtempered of the chocolate mass is processed.Triplicate measurements were taken for each product composition and the mean values wererecorded.
8.3.3 Determination of particle size distribution
A MasterSizerR©
Laser Diffraction Particle Size Analyzer equipped with MS 15 samplepresentation unit (refractive index 1.590) (Malvern Instrument Ltd, Malvern, England) was
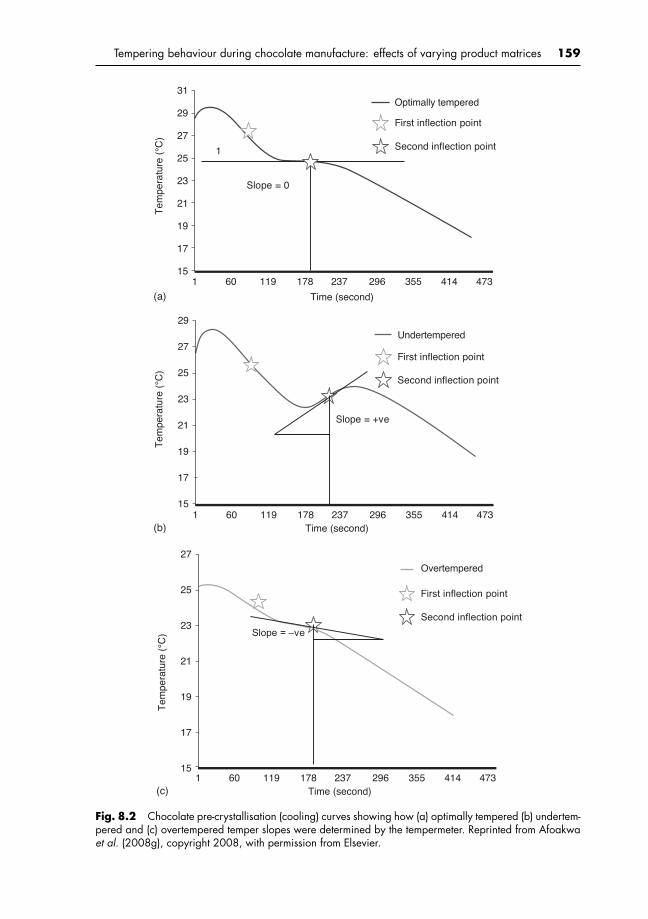
P1: KAE/UKS P2: KAEc08 BLBK244-Afoakwa January 5, 2010 9:25 Printer Name: Yet to Come
Tempering behaviour during chocolate manufacture: effects of varying product matrices 159
(a)
(b)
First inflection point
Optimally tempered
Second inflection point
Slope = 0
31
29
27
25
23
21
19
17
15
1
1 60 119 178 237 296
Time (second)
Time (second)
355 414 473
Tem
pera
ture
(°C
)
First inflection point
Undertempered
Second inflection point
Slope = +ve
29
27
25
23
21
19
17
151 60 119 178 237 296 355 414 473
Tem
pera
ture
(°C
)
(c) Time (second)
27
25
23
21
19
17
151 60 119 178 237 296 355 414 473
Tem
pera
ture
(°C
)
First inflection point
Overtempered
Second inflection point
Slope = –ve
Fig. 8.2 Chocolate pre-crystallisation (cooling) curves showing how (a) optimally tempered (b) undertem-pered and (c) overtempered temper slopes were determined by the tempermeter. Reprinted from Afoakwaet al. (2008g), copyright 2008, with permission from Elsevier.
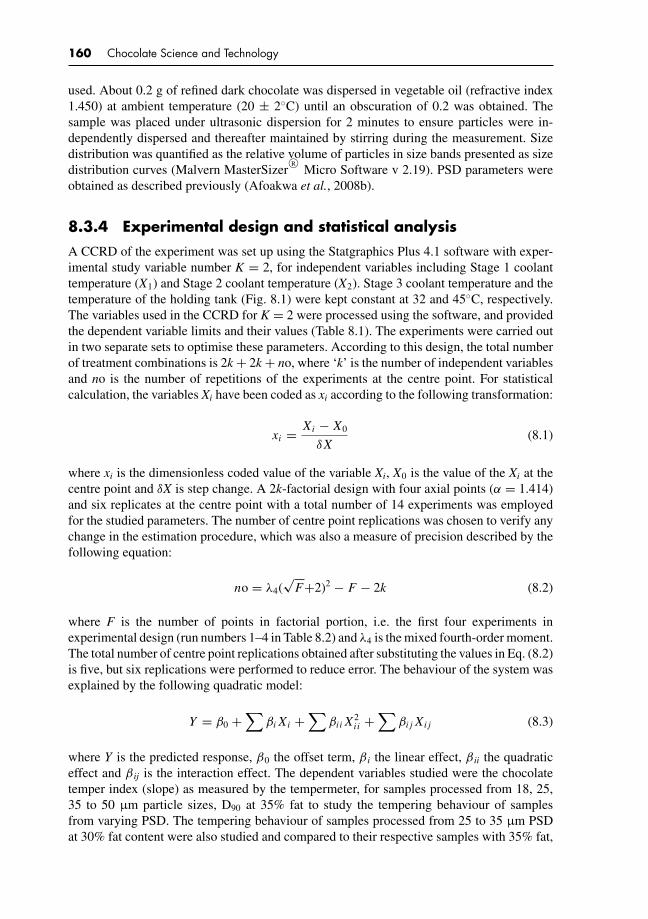
P1: KAE/UKS P2: KAEc08 BLBK244-Afoakwa January 5, 2010 9:25 Printer Name: Yet to Come
160 Chocolate Science and Technology
used. About 0.2 g of refined dark chocolate was dispersed in vegetable oil (refractive index1.450) at ambient temperature (20 ± 2◦C) until an obscuration of 0.2 was obtained. Thesample was placed under ultrasonic dispersion for 2 minutes to ensure particles were in-dependently dispersed and thereafter maintained by stirring during the measurement. Sizedistribution was quantified as the relative volume of particles in size bands presented as sizedistribution curves (Malvern MasterSizer
R©Micro Software v 2.19). PSD parameters were
obtained as described previously (Afoakwa et al., 2008b).
8.3.4 Experimental design and statistical analysis
A CCRD of the experiment was set up using the Statgraphics Plus 4.1 software with exper-imental study variable number K = 2, for independent variables including Stage 1 coolanttemperature (X1) and Stage 2 coolant temperature (X2). Stage 3 coolant temperature and thetemperature of the holding tank (Fig. 8.1) were kept constant at 32 and 45◦C, respectively.The variables used in the CCRD for K = 2 were processed using the software, and providedthe dependent variable limits and their values (Table 8.1). The experiments were carried outin two separate sets to optimise these parameters. According to this design, the total numberof treatment combinations is 2k + 2k + no, where ‘k’ is the number of independent variablesand no is the number of repetitions of the experiments at the centre point. For statisticalcalculation, the variables Xi have been coded as xi according to the following transformation:
xi = Xi − X0
δX(8.1)
where xi is the dimensionless coded value of the variable Xi, X0 is the value of the Xi at thecentre point and δX is step change. A 2k-factorial design with four axial points (α = 1.414)and six replicates at the centre point with a total number of 14 experiments was employedfor the studied parameters. The number of centre point replications was chosen to verify anychange in the estimation procedure, which was also a measure of precision described by thefollowing equation:
no = λ4(√
F+2)2 − F − 2k (8.2)
where F is the number of points in factorial portion, i.e. the first four experiments inexperimental design (run numbers 1–4 in Table 8.2) and λ4 is the mixed fourth-order moment.The total number of centre point replications obtained after substituting the values in Eq. (8.2)is five, but six replications were performed to reduce error. The behaviour of the system wasexplained by the following quadratic model:
Y = β0 +∑
βi Xi +∑
βi i X2i i +
∑βi j Xi j (8.3)
where Y is the predicted response, β0 the offset term, β i the linear effect, β ii the quadraticeffect and β ij is the interaction effect. The dependent variables studied were the chocolatetemper index (slope) as measured by the tempermeter, for samples processed from 18, 25,35 to 50 µm particle sizes, D90 at 35% fat to study the tempering behaviour of samplesfrom varying PSD. The tempering behaviour of samples processed from 25 to 35 µm PSDat 30% fat content were also studied and compared to their respective samples with 35% fat,

P1: KAE/UKS P2: KAEc08 BLBK244-Afoakwa January 5, 2010 9:25 Printer Name: Yet to Come
Tempering behaviour during chocolate manufacture: effects of varying product matrices 161
Table 8.2 Design matrix and variable combinations in experimental runs
Variable codes Levels
Stage 1 coolant Stage 2 coolantRuns Block X1 X2 temperature (◦C) temperature (◦C)
1 1 1.0 1.0 26.1 24.02 1 −1.0 −1.0 16.0 14.03 1 1.0 −1.0 26.0 14.04 1 −1.0 1.0 16.0 24.05 1 0.0 0.0 21.0 19.06 1 0.0 0.0 21.0 19.07 1 0.0 0.0 21.0 19.08 2 −1.414 0.0 13.9 19.09 2 1.414 0.0 28.1 19.0
10 2 0.0 1.414 21.0 26.111 2 0.0 −1.414 21.0 11.912 2 0.0 0.0 21.0 19.013 2 0.0 0.0 21.0 19.014 2 0.0 0.0 21.0 19.0
X1, Stage 1 coolant temperature (◦C); X2, Stage 2 coolant temperature (◦C).
to determine the effect of varying fat content. These samples were selected following trendsin rheological properties observed from earlier studies (Afoakwa et al., 2008b). The designmatrix and variable combinations in experimental runs are as shown in Tables 8.1 and 8.2.
The experiments conducted on the various combinations and the results (temper slopes)obtained are as shown in Tables 8.3 and 8.4. These were analysed using stepwise regressionanalysis. Analysis of variance tables were generated and the effect and regression coefficientsof individual linear, quadratic and interaction terms were determined. The significance of allterms in the polynomial was judged statistically by computing the F-value at a probability(p) of 0.001, 0.01 or 0.05. The regression coefficients were then used to make statisticalcalculation to generate response plots from the regression models. Table 8.5 shows thecoefficients of the variables in the models and their contribution to the model’s variation. Atest for the lack of fit and the R2 values were used to judge the adequacy of the models.
The R2 of a model refers to the proportion of variation in the response attributed tothe model rather than random error. For a good fit of a model, an R2 of 0.80% was used.Malcolmson et al. (1993) commented that R2 of 0.80% is perfect for a good model study andbut recommended that an R2 of 0.60% can be used for a preliminary study.
8.4 RESULTS AND DISCUSSION
8.4.1 Particle size distribution of dark chocolates
Variations in PSD were observed for 18, 25, 35 and 50 µm (Fig. 8.3) using D90 values(>90% finer) that relate to chocolate character (Beckett, 2000). Data from the PSD showedvariations in specific surface area, mean particle volume D(v,50), Sauter mean (D[3,2]) andmean particle diameter (D[4,3]) with increasing D90 particle sizes. These findings have beenpreviously reported (Afoakwa et al., 2008b). Increasing fat from 25 to 35% led to significant(p < 0.001) reductions in specific surface area and to an increase in all other PSD parameters,

P1: KAE/UKS P2: KAEc08 BLBK244-Afoakwa January 5, 2010 9:25 Printer Name: Yet to Come
162 Chocolate Science and Technology
Table
8.3
Des
ign
mat
rix,v
aria
ble
com
bina
tions
tem
pers
lope
sob
tain
edfro
mex
perim
enta
lrun
sfo
rdar
kch
ocol
ates
cont
aini
ng35
%fa
twith
vary
ing
PSD
Vari
able
codes
Leve
lsD
epen
den
tva
riable
s
Runs
X1
X2
Stage
1te
mper
atu
re(◦
C)
Stage
2te
mper
atu
re(◦
C)
Tem
per
slope
for
18
µm
Tem
per
slope
for
25
µm
Tem
per
slope
for
35
µm
Tem
per
slope
for
50
µm
11.
01.
026
.124
.00.
62−0
.03
0.75
0.41
2−1
.0−1
.016
.014
.0−1
.72
−1.7
1−1
.74
−1.7
33
1.0
−1.0
26.0
14.0
0.20
0.01
−0.0
40.
004
−1.0
1.0
16.0
24.0
1.22
0.48
0.59
0.54
50.
00.
021
.019
.0−0
.01
0.01
0.06
0.53
60.
00.
021
.019
.0−0
.01
0.01
0.06
0.53
70.
00.
021
.019
.0−0
.01
0.01
0.06
0.53
8−1
.414
0.0
13.9
19.0
−0.1
3−1
.76
−0.0
9−0
.01
91.
414
0.0
28.1
19.0
1.17
1.36
1.73
2.40
100.
01.
414
21.0
26.1
1.35
2.15
2.06
1.97
110.
0−1
.414
21.0
11.9
−1.8
5−1
.73
−1.8
0−1
.70
120.
00.
021
.019
.0−0
.01
0.01
0.06
0.53
130.
00.
021
.019
.0−0
.01
0.01
0.06
0.53
140.
00.
021
.019
.0−0
.01
0.01
0.06
0.53
X 1,S
tage
1co
olan
ttem
pera
ture
(◦C
);X 2
,Sta
ge2
cool
antt
empe
ratu
re(◦
C).

P1: KAE/UKS P2: KAEc08 BLBK244-Afoakwa January 5, 2010 9:25 Printer Name: Yet to Come
Tempering behaviour during chocolate manufacture: effects of varying product matrices 163
Table
8.4
Des
ign
mat
rix,v
aria
ble
com
bina
tions
tem
pers
lope
sob
tain
edfro
mex
perim
enta
lrun
sfo
rdar
kch
ocol
ates
vary
ing
infa
tcon
tent
(30
and
35%
)and
PSD
(25
and
35µ
m)
Vari
able
codes
Leve
lsD
epen
den
tva
riable
s
Runs
X1
X2
Stage
1te
mper
atu
re(◦
C)
Stage
2te
mper
atu
re(◦
C)
Tem
per
slope
for
PS
35
µm
,fa
t30%
Tem
per
slope
for
PS
50
µm
,fa
t30%
Tem
per
slope
for
PS
35
µm
,fa
t35
%Te
mper
slope
for
PS
50
µm
,fa
t35
%
11.
01.
026
.124
.00.
050.
570.
750.
412
−1.0
−1.0
16.0
14.0
−1.8
9−2
.00
−1.7
4−1
.73
31.
0−1
.026
.014
.0−0
.26
−0.2
0−0
.04
0.00
4−1
.01.
016
.024
.0−0
.06
0.15
0.59
0.54
50.
00.
021
.019
.0−0
.27
−0.0
20.
060.
536
0.0
0.0
21.0
19.0
−0.2
7−0
.02
0.06
0.53
70.
00.
021
.019
.0−0
.27
−0.0
20.
060.
538
−1.4
140.
013
.919
.0−0
.35
−0.3
3−0
.09
−0.0
19
1.41
40.
028
.119
.00.
561.
301.
732.
4010
0.0
1.41
421
.026
.11.
671.
822.
061.
9711
0.0
−1.4
1421
.011
.9−0
.31
−0.3
5−1
.80
−1.7
012
0.0
0.0
21.0
19.0
−0.2
7−0
.02
0.06
0.53
130.
00.
021
.019
.0−0
.27
−0.0
20.
060.
5314
0.0
0.0
21.0
19.0
−0.2
7−0
.02
0.06
0.53
X 1,S
tage
1co
olan
ttem
pera
ture
(◦C
);X 2
,Sta
ge2
cool
antt
empe
ratu
re(◦
C).

P1: KAE/UKS P2: KAEc08 BLBK244-Afoakwa January 5, 2010 9:25 Printer Name: Yet to Come
164 Chocolate Science and Technology
Table
8.5
Regr
essi
onco
effic
ient
sfro
mth
ese
cond
-ord
erpo
lyno
mia
lsus
edfo
rthe
resp
onse
plot
s
Coef
fici
ents
Slope
(18
µm
PS,
35
%fa
t)Sl
ope
(25
µm
PS,
35
%fa
t)Sl
ope
(35
µm
PS,
35
%fa
t)Sl
ope
(50
µm
PS,
35
%fa
t)Sl
ope
(25
µm
PS,
30%
fat)
Slope
(35
µm
PS,
30%
fat)
Con
stant
−5.6
339
−10.
7366
−6.3
643
−9.7
863
−4.8
394
−4.0
873
X 10.
1860
44**
0.47
4608
**0.
0281
05*
0.16
9025
**0.
0277
62*
0.18
1715
**
X 20.
2287
53**
*0.
3593
11**
0.40
447*
**0.
6597
22**
*0.
2518
4**
0.04
1558
5*X 1
20.
0027
29*
−0.0
0376
3*0.
0047
70*
0.00
2397
9*0.
0028
06*
−0.0
0017
9*X 1
X 2−0
.012
857*
−0.0
1137
8*−0
.007
857*
−0.0
0948
98*
−0.0
0530
6*−0
.006
480*
X 22
0.00
3647
*0.
0004
209*
−0.0
0227
0*−0
.008
4183
*−0
.003
571*
0.00
4975
*
R20.
9073
0.87
590.
8992
0.88
110.
9280
0.86
36F
a0.
4220
0.20
280.
5140
0.31
890.
8658
0.32
65Pr
obab
ility
ofF
p≤
0.00
1p
≤0.
01p
≤0.
001
p≤
0.00
1p
≤0.
001
p≤
0.01
*p
≤0.
05;*
*p
≤0.
01;*
**p
≤0.
001.
aM
odel
sha
veno
n-si
gnifi
cant
lack
offit
(p>
0.05
).
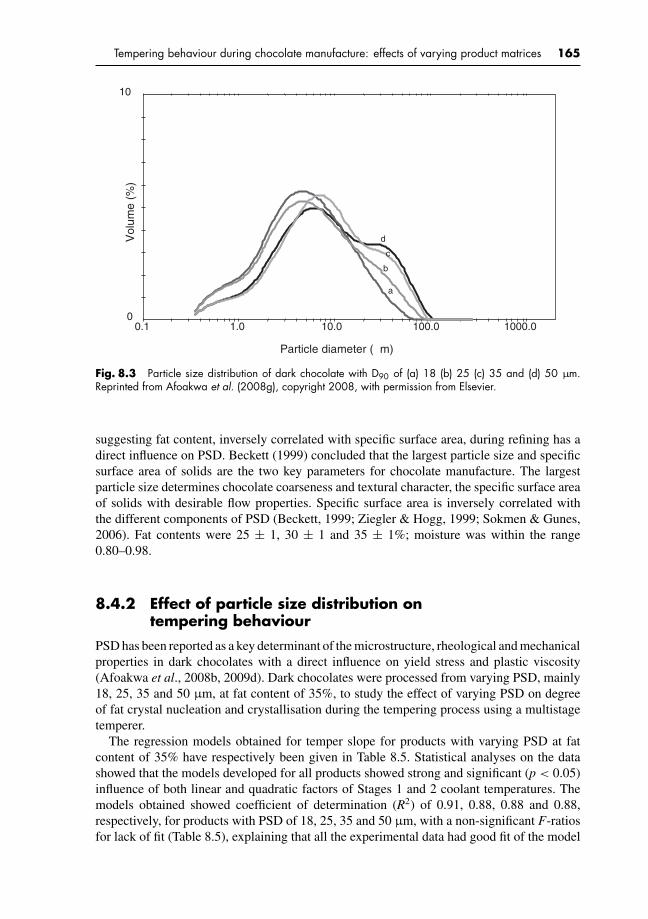
P1: KAE/UKS P2: KAEc08 BLBK244-Afoakwa January 5, 2010 9:25 Printer Name: Yet to Come
Tempering behaviour during chocolate manufacture: effects of varying product matrices 165
Particle diameter (µm)
Vol
ume
(%)
0
10
0.1 1.0 10.0 100.0 1000.0
a
b
c
d
Fig. 8.3 Particle size distribution of dark chocolate with D90 of (a) 18 (b) 25 (c) 35 and (d) 50 µm.Reprinted from Afoakwa et al. (2008g), copyright 2008, with permission from Elsevier.
suggesting fat content, inversely correlated with specific surface area, during refining has adirect influence on PSD. Beckett (1999) concluded that the largest particle size and specificsurface area of solids are the two key parameters for chocolate manufacture. The largestparticle size determines chocolate coarseness and textural character, the specific surface areaof solids with desirable flow properties. Specific surface area is inversely correlated withthe different components of PSD (Beckett, 1999; Ziegler & Hogg, 1999; Sokmen & Gunes,2006). Fat contents were 25 ± 1, 30 ± 1 and 35 ± 1%; moisture was within the range0.80–0.98.
8.4.2 Effect of particle size distribution ontempering behaviour
PSD has been reported as a key determinant of the microstructure, rheological and mechanicalproperties in dark chocolates with a direct influence on yield stress and plastic viscosity(Afoakwa et al., 2008b, 2009d). Dark chocolates were processed from varying PSD, mainly18, 25, 35 and 50 µm, at fat content of 35%, to study the effect of varying PSD on degreeof fat crystal nucleation and crystallisation during the tempering process using a multistagetemperer.
The regression models obtained for temper slope for products with varying PSD at fatcontent of 35% have respectively been given in Table 8.5. Statistical analyses on the datashowed that the models developed for all products showed strong and significant (p < 0.05)influence of both linear and quadratic factors of Stages 1 and 2 coolant temperatures. Themodels obtained showed coefficient of determination (R2) of 0.91, 0.88, 0.88 and 0.88,respectively, for products with PSD of 18, 25, 35 and 50 µm, with a non-significant F-ratiosfor lack of fit (Table 8.5), explaining that all the experimental data had good fit of the model
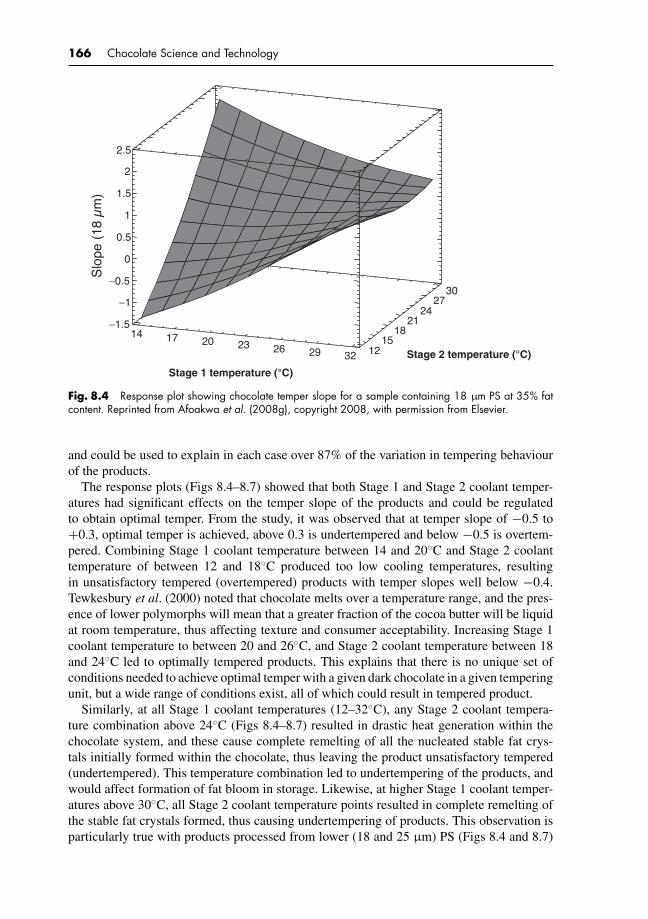
P1: KAE/UKS P2: KAEc08 BLBK244-Afoakwa January 5, 2010 9:25 Printer Name: Yet to Come
166 Chocolate Science and Technology
Stage 1 temperature (°C)
Stage 2 temperature (°C)
Slo
pe (
18 µ
m)
14 17 20 23 26 29 32 1215
1821
2427
30
−1.5
−1
−0.5
0
0.5
1
1.5
2
2.5
Fig. 8.4 Response plot showing chocolate temper slope for a sample containing 18 µm PS at 35% fatcontent. Reprinted from Afoakwa et al. (2008g), copyright 2008, with permission from Elsevier.
and could be used to explain in each case over 87% of the variation in tempering behaviourof the products.
The response plots (Figs 8.4–8.7) showed that both Stage 1 and Stage 2 coolant temper-atures had significant effects on the temper slope of the products and could be regulatedto obtain optimal temper. From the study, it was observed that at temper slope of −0.5 to+0.3, optimal temper is achieved, above 0.3 is undertempered and below −0.5 is overtem-pered. Combining Stage 1 coolant temperature between 14 and 20◦C and Stage 2 coolanttemperature of between 12 and 18◦C produced too low cooling temperatures, resultingin unsatisfactory tempered (overtempered) products with temper slopes well below −0.4.Tewkesbury et al. (2000) noted that chocolate melts over a temperature range, and the pres-ence of lower polymorphs will mean that a greater fraction of the cocoa butter will be liquidat room temperature, thus affecting texture and consumer acceptability. Increasing Stage 1coolant temperature to between 20 and 26◦C, and Stage 2 coolant temperature between 18and 24◦C led to optimally tempered products. This explains that there is no unique set ofconditions needed to achieve optimal temper with a given dark chocolate in a given temperingunit, but a wide range of conditions exist, all of which could result in tempered product.
Similarly, at all Stage 1 coolant temperatures (12–32◦C), any Stage 2 coolant tempera-ture combination above 24◦C (Figs 8.4–8.7) resulted in drastic heat generation within thechocolate system, and these cause complete remelting of all the nucleated stable fat crys-tals initially formed within the chocolate, thus leaving the product unsatisfactory tempered(undertempered). This temperature combination led to undertempering of the products, andwould affect formation of fat bloom in storage. Likewise, at higher Stage 1 coolant temper-atures above 30◦C, all Stage 2 coolant temperature points resulted in complete remelting ofthe stable fat crystals formed, thus causing undertempering of products. This observation isparticularly true with products processed from lower (18 and 25 µm) PS (Figs 8.4 and 8.7)
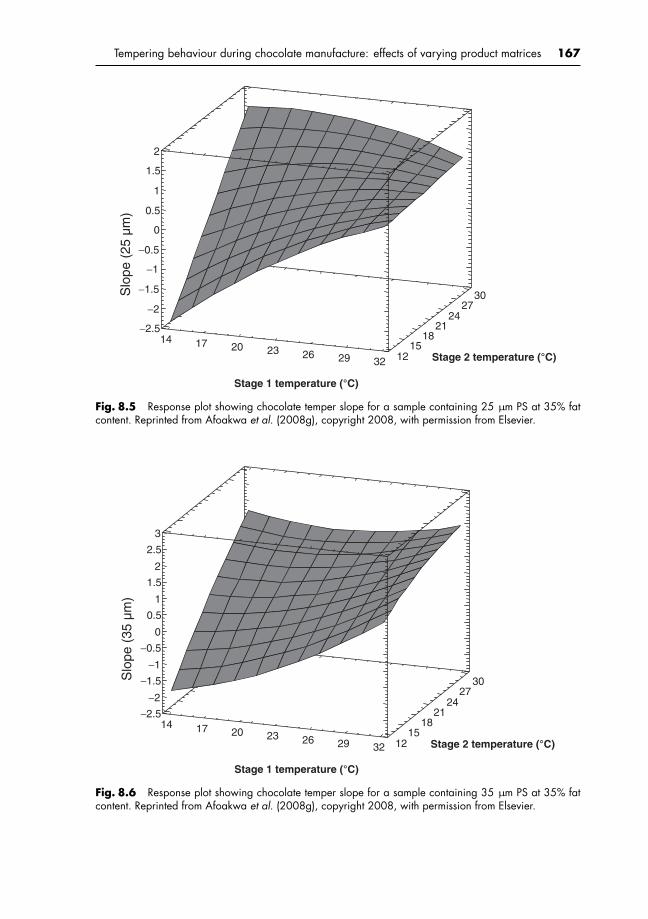
P1: KAE/UKS P2: KAEc08 BLBK244-Afoakwa January 5, 2010 9:25 Printer Name: Yet to Come
Tempering behaviour during chocolate manufacture: effects of varying product matrices 167
Stage 1 temperature (°C)
Stage 2 temperature (°C)
Slo
pe (
25 µ
m)
14 17 20 23 26 29 32 1215
1821
2427
30
−2.5
−2
−1.5
−1
−0.5
0
0.5
1
1.5
2
Fig. 8.5 Response plot showing chocolate temper slope for a sample containing 25 µm PS at 35% fatcontent. Reprinted from Afoakwa et al. (2008g), copyright 2008, with permission from Elsevier.
Stage 1 temperature (°C)
Stage 2 temperature (°C)
Slo
pe (
35 µ
m)
14 17 20 23 26 29 32 1215
1821
2427
30
−2.5
−2
−1.5
−1
−0.5
0
0.5
1
1.5
2
2.5
3
Fig. 8.6 Response plot showing chocolate temper slope for a sample containing 35 µm PS at 35% fatcontent. Reprinted from Afoakwa et al. (2008g), copyright 2008, with permission from Elsevier.
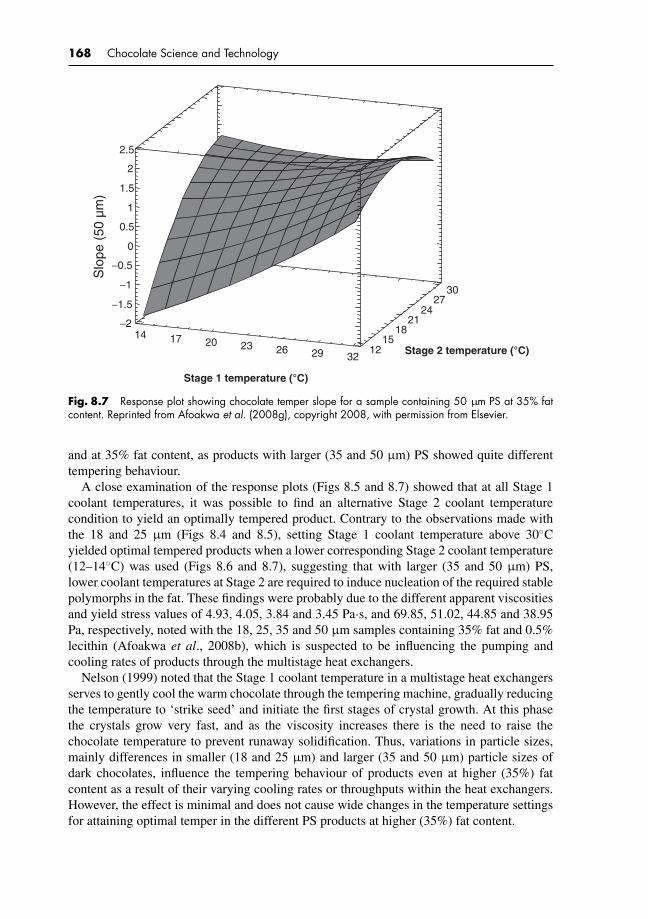
P1: KAE/UKS P2: KAEc08 BLBK244-Afoakwa January 5, 2010 9:25 Printer Name: Yet to Come
168 Chocolate Science and Technology
Stage 1 temperature (°C)
Stage 2 temperature (°C)
Slo
pe (
50 µ
m)
14 17 20 23 26 29 3212
1518
2124
2730
−2
−1.5
−1
−0.5
0
0.5
1
1.5
2
2.5
Fig. 8.7 Response plot showing chocolate temper slope for a sample containing 50 µm PS at 35% fatcontent. Reprinted from Afoakwa et al. (2008g), copyright 2008, with permission from Elsevier.
and at 35% fat content, as products with larger (35 and 50 µm) PS showed quite differenttempering behaviour.
A close examination of the response plots (Figs 8.5 and 8.7) showed that at all Stage 1coolant temperatures, it was possible to find an alternative Stage 2 coolant temperaturecondition to yield an optimally tempered product. Contrary to the observations made withthe 18 and 25 µm (Figs 8.4 and 8.5), setting Stage 1 coolant temperature above 30◦Cyielded optimal tempered products when a lower corresponding Stage 2 coolant temperature(12–14◦C) was used (Figs 8.6 and 8.7), suggesting that with larger (35 and 50 µm) PS,lower coolant temperatures at Stage 2 are required to induce nucleation of the required stablepolymorphs in the fat. These findings were probably due to the different apparent viscositiesand yield stress values of 4.93, 4.05, 3.84 and 3.45 Pa·s, and 69.85, 51.02, 44.85 and 38.95Pa, respectively, noted with the 18, 25, 35 and 50 µm samples containing 35% fat and 0.5%lecithin (Afoakwa et al., 2008b), which is suspected to be influencing the pumping andcooling rates of products through the multistage heat exchangers.
Nelson (1999) noted that the Stage 1 coolant temperature in a multistage heat exchangersserves to gently cool the warm chocolate through the tempering machine, gradually reducingthe temperature to ‘strike seed’ and initiate the first stages of crystal growth. At this phasethe crystals grow very fast, and as the viscosity increases there is the need to raise thechocolate temperature to prevent runaway solidification. Thus, variations in particle sizes,mainly differences in smaller (18 and 25 µm) and larger (35 and 50 µm) particle sizes ofdark chocolates, influence the tempering behaviour of products even at higher (35%) fatcontent as a result of their varying cooling rates or throughputs within the heat exchangers.However, the effect is minimal and does not cause wide changes in the temperature settingsfor attaining optimal temper in the different PS products at higher (35%) fat content.

P1: KAE/UKS P2: KAEc08 BLBK244-Afoakwa January 5, 2010 9:25 Printer Name: Yet to Come
Tempering behaviour during chocolate manufacture: effects of varying product matrices 169
8.4.3 Effect of fat content on tempering behaviour
The continuous phase of molten chocolate consists of fat (mainly cocoa butter). Duringchocolate manufacture, a minimum level of fat is required to maintain its flow propertiesdepending on the solid component PSD, being the void fractions between the packed bed andthe specific surface area of the particles (Chevalley, 1999). To study the tempering behaviourof products with varying fat content, dark chocolate containing 30% fat at 25 and 35 µmPS was further tempered using the multistage temperer and the models developed werecompared with those processed with 35% fat at 25 and 35 µm PS.
The multiple regression models developed for products containing 30% fat at 25 and 35 µmPS have, respectively, been given in Table 8.5. Statistical analyses revealed that the modelsdeveloped for products with different fat content (30 and 35%) showed strong and significant(p < 0.05) influence of both linear and quadratic factors of Stages 1 and 2 coolant tempera-tures. The models obtained for products containing 30% fat content at 25 and 35 µm showedcoefficient of determination (R2) of 0.93 and 0.86, respectively, with a non-significant F-ratios for lack of fit (Table 8.5), explaining that the experimental data had good fit of the modeland could be used to explain in each case over 86% of the variation in tempering behaviourof the products at 30% fat content. This was very similar to coefficient of determinationsof 0.88 and 0.90% noted for products containing 35% fat at 25 and 35 µm PS (Table 8.5),meaning the all four models have good fit for effective comparative study of their temperingbehaviours.
Variations in fat content had the greatest influence in dictating the tempering behaviourof products. The response plots (Figs 8.8 and 8.9) showed that both Stages 1 and 2 coolanttemperatures had significant effects on the temper slope. Contrary to observations made withmodels developed for products containing 35% fat at 25 µm PS where combined coolanttemperatures for Stage 1 (14 and 20◦C) and Stage 2 (12 and 18◦C) resulted in too low coolingtemperatures effecting overtempering of products, reducing the fat content of products to30% showed a different tempering behaviour. The response plots developed for productscontaining 30% fat at 25 µm PS (Fig. 8.8) showed that at all Stage 1 coolant temperaturesthere was a corresponding Stage 2 coolant temperature that gave an optimal temper. Themodel showed that at lower Stage 1 coolant temperature between 17 and 23◦C, a corre-sponding Stage 2 coolant temperature between 18 and 21◦C yielded an optimal temper,whereas reducing Stage 2 temperature (12–18◦C) caused too low chocolate temperature,resisting nucleation of fat crystals within the system with resultant overtempered products.Similarly, increasing Stage 2 temperature to between 24 and 30◦C caused too high chocolatetemperature, resulting in remelting of all the initial nucleated fat crystals, thereby renderingthe product undertempered. This explains that at all Stage 1 coolant temperatures, a corre-sponding Stage 2 temperature could be found to achieve successful nucleation and growthof fat crystals, yielding an optimal temper (Fig. 8.8). It could be observed that at low Stage1 coolant temperature (14–20◦C), a corresponding intermediate Stage 2 coolant temperaturebetween 18 and 21◦C was ideal to affect nucleation of the fat crystals and growth; extendingthe temperature beyond this range would raise the nucleated fat crystal growth temperaturebeyond the required limit, affecting remelting of the nucleated crystals to unstable poly-morphic state causing undertempering of products. Alternatively, at higher Stage 1 coolanttemperature between 21 and 32◦C, a corresponding lower Stage 2 coolant temperature be-tween 12 and 21◦C was required for an optimal temper, beyond which the products wereundertempering.
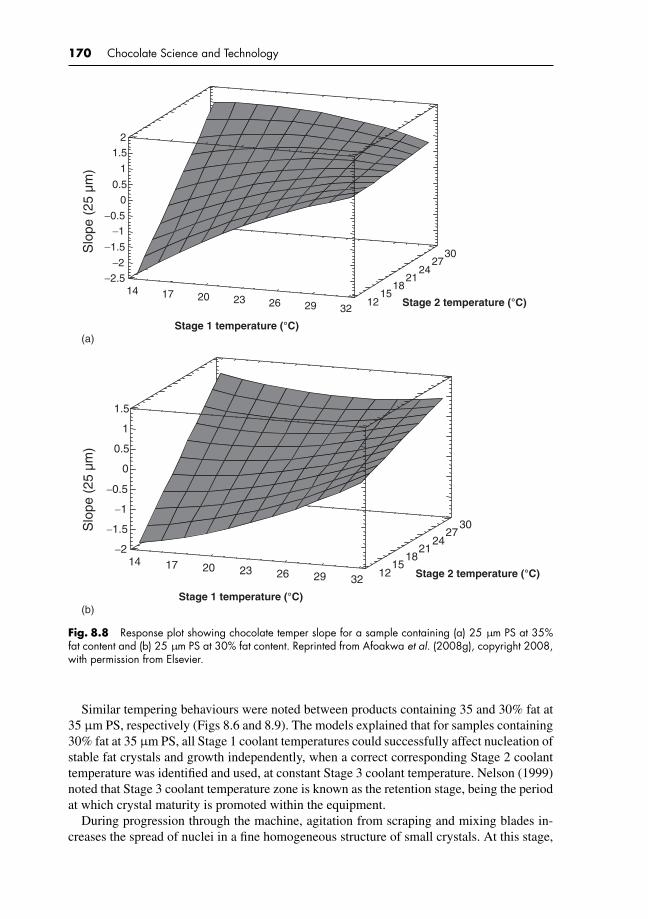
P1: KAE/UKS P2: KAEc08 BLBK244-Afoakwa January 5, 2010 9:25 Printer Name: Yet to Come
170 Chocolate Science and Technology
Stage 1 temperature (°C)
Stage 2 temperature (°C)
Slo
pe (
25 µ
m)
14
(a)
(b)
17 20 23 26 29 3212
1518
2124
2730
−2.5
−2
−1.5
−1
−0.5
0
0.5
1
1.52
Stage 1 temperature (°C)
Stage 2 temperature (°C)
Slo
pe (
25 µ
m)
14 17 20 23 26 29 3212
1518
2124
2730
−2
−1.5
−1
−0.5
0
0.5
1
1.5
Fig. 8.8 Response plot showing chocolate temper slope for a sample containing (a) 25 µm PS at 35%fat content and (b) 25 µm PS at 30% fat content. Reprinted from Afoakwa et al. (2008g), copyright 2008,with permission from Elsevier.
Similar tempering behaviours were noted between products containing 35 and 30% fat at35 µm PS, respectively (Figs 8.6 and 8.9). The models explained that for samples containing30% fat at 35 µm PS, all Stage 1 coolant temperatures could successfully affect nucleation ofstable fat crystals and growth independently, when a correct corresponding Stage 2 coolanttemperature was identified and used, at constant Stage 3 coolant temperature. Nelson (1999)noted that Stage 3 coolant temperature zone is known as the retention stage, being the periodat which crystal maturity is promoted within the equipment.
During progression through the machine, agitation from scraping and mixing blades in-creases the spread of nuclei in a fine homogeneous structure of small crystals. At this stage,
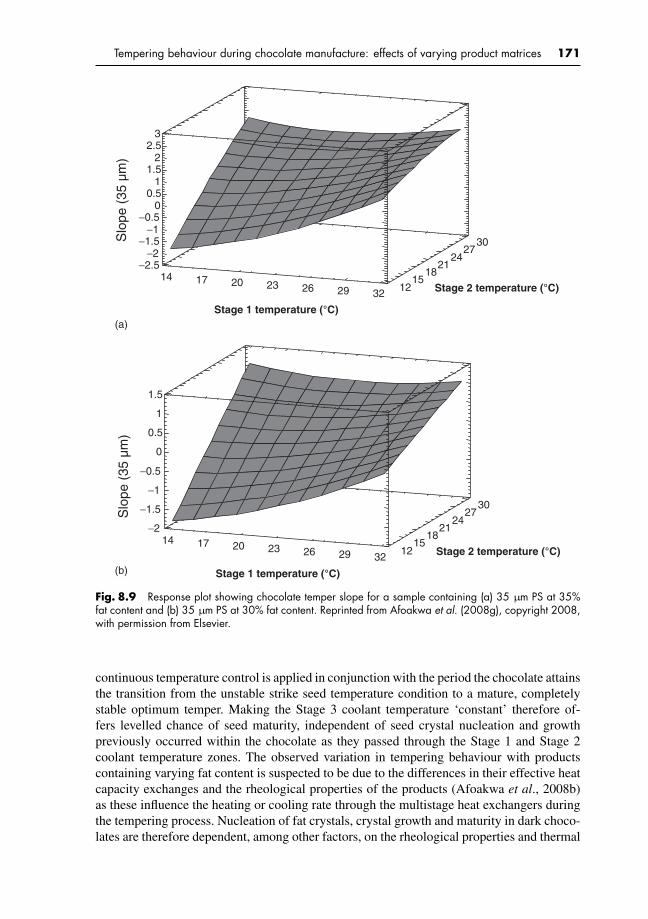
P1: KAE/UKS P2: KAEc08 BLBK244-Afoakwa January 5, 2010 9:25 Printer Name: Yet to Come
Tempering behaviour during chocolate manufacture: effects of varying product matrices 171
Stage 1 temperature (°C)
Stage 2 temperature (°C)
Slo
pe (
35 µ
m)
14 17
(a)
(b)
20 23 26 29 32 1215
1821
2427
30
−2.5−2
−1.5−1
−0.50
0.51
1.52
2.53
Stage 1 temperature (°C)
Stage 2 temperature (°C)
Slo
pe (
35 µ
m)
14 17 20 23 26 29 3212
1518
2124
2730
−2
−1.5
−1
−0.5
0
0.5
1
1.5
Fig. 8.9 Response plot showing chocolate temper slope for a sample containing (a) 35 µm PS at 35%fat content and (b) 35 µm PS at 30% fat content. Reprinted from Afoakwa et al. (2008g), copyright 2008,with permission from Elsevier.
continuous temperature control is applied in conjunction with the period the chocolate attainsthe transition from the unstable strike seed temperature condition to a mature, completelystable optimum temper. Making the Stage 3 coolant temperature ‘constant’ therefore of-fers levelled chance of seed maturity, independent of seed crystal nucleation and growthpreviously occurred within the chocolate as they passed through the Stage 1 and Stage 2coolant temperature zones. The observed variation in tempering behaviour with productscontaining varying fat content is suspected to be due to the differences in their effective heatcapacity exchanges and the rheological properties of the products (Afoakwa et al., 2008b)as these influence the heating or cooling rate through the multistage heat exchangers duringthe tempering process. Nucleation of fat crystals, crystal growth and maturity in dark choco-lates are therefore dependent, among other factors, on the rheological properties and thermal
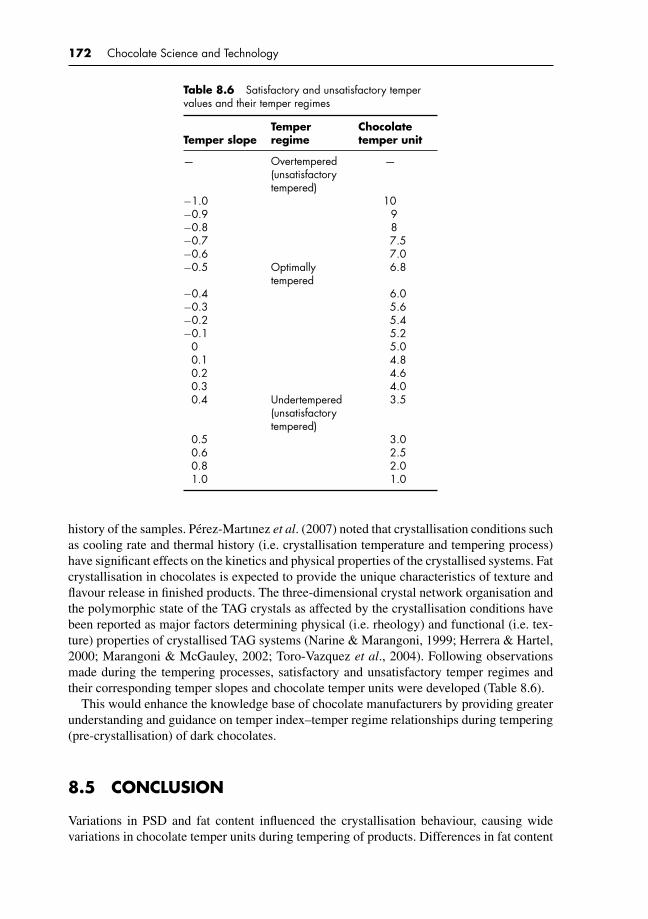
P1: KAE/UKS P2: KAEc08 BLBK244-Afoakwa January 5, 2010 9:25 Printer Name: Yet to Come
172 Chocolate Science and Technology
Table 8.6 Satisfactory and unsatisfactory tempervalues and their temper regimes
Temper slopeTemperregime
Chocolatetemper unit
— Overtempered(unsatisfactorytempered)
—
−1.0 10−0.9 9−0.8 8−0.7 7.5−0.6 7.0−0.5 Optimally
tempered6.8
−0.4 6.0−0.3 5.6−0.2 5.4−0.1 5.2
0 5.00.1 4.80.2 4.60.3 4.00.4 Undertempered
(unsatisfactorytempered)
3.5
0.5 3.00.6 2.50.8 2.01.0 1.0
history of the samples. Perez-Martınez et al. (2007) noted that crystallisation conditions suchas cooling rate and thermal history (i.e. crystallisation temperature and tempering process)have significant effects on the kinetics and physical properties of the crystallised systems. Fatcrystallisation in chocolates is expected to provide the unique characteristics of texture andflavour release in finished products. The three-dimensional crystal network organisation andthe polymorphic state of the TAG crystals as affected by the crystallisation conditions havebeen reported as major factors determining physical (i.e. rheology) and functional (i.e. tex-ture) properties of crystallised TAG systems (Narine & Marangoni, 1999; Herrera & Hartel,2000; Marangoni & McGauley, 2002; Toro-Vazquez et al., 2004). Following observationsmade during the tempering processes, satisfactory and unsatisfactory temper regimes andtheir corresponding temper slopes and chocolate temper units were developed (Table 8.6).
This would enhance the knowledge base of chocolate manufacturers by providing greaterunderstanding and guidance on temper index–temper regime relationships during tempering(pre-crystallisation) of dark chocolates.
8.5 CONCLUSION
Variations in PSD and fat content influenced the crystallisation behaviour, causing widevariations in chocolate temper units during tempering of products. Differences in fat content

P1: KAE/UKS P2: KAEc08 BLBK244-Afoakwa January 5, 2010 9:25 Printer Name: Yet to Come
Tempering behaviour during chocolate manufacture: effects of varying product matrices 173
exerted the greatest variability in temperature settings of the different zones for attainingwell-tempered products. At 35% fat content, changes in PSD caused only minimal andnon-significant effects on tempering behaviour. However, at 30% fat content, the effect ofPSD was pronounced. No unique set of conditions was found to achieve good temper witha given chocolate in a specified tempering unit. The models developed showed that a widerange of optimal conditions exist, depending on the attainment of the appropriate temperaturesettings, all of which would result in tempered chocolate. Thus, different combinations oftempering temperatures could be employed to induce stable fat polymorph formation and aredependent greatly on fat content and partly PSD during dark chocolate manufacture. Optimalsatisfactory and unsatisfactory temper regimes and their corresponding temper slopes andchocolate temper units have been provided. These would have great industrial significance forreducing processing (tempering) times during tempering of dark chocolates with assurancein quality control and shelf characteristics.
P1: KAE/UKS P2: KAEc09 BLBK244-Afoakwa January 23, 2010 7:37 Printer Name: Yet to Come
9 Tempering and fat crystallisation effectson chocolate quality
9.1 SUMMARY AND INDUSTRIAL RELEVANCE
Fat crystallisation behaviours in dark chocolates varying in particle size distribution (PSD)(D90 of 18, 25, 35 and 50 µm) were studied, examining influence of temper regimes (optimal,over- and undertemper), and evaluating mechanical properties, appearance, microstructureand melting characteristics. Wide variations in mechanical properties and appearance werenoted. Particle size (PS) was inversely related with texture and colour, with greatest ef-fects noted in hardness, stickiness and lightness for all tempers. Overtempering increasedproduct hardness and stickiness but reduced gloss and darkening of surfaces. Undertemper-ing induced fat bloom, yielding defects in texture, colour and surface gloss. The PSD hadno influence on crystallinity at all tempers but limited effects on Tonset, Tpeak and �Hmelt
independent of temper but significantly influenced Tend and T index. On the contrary, tem-per influenced crystallinity and melting properties (Tend, T index and �Hmelt). Undertempershowed as widened crystal size distribution (CSD) with significant changes in Tend, T index and�Hmelt with whitening of both surface and internal structures, with other effects on appear-ance and texture. Overtempering caused moderate increases in CSD and melting properties,with significant effects on Tend, T index and �Hmelt but not on Tonset, or Tpeak. Fat–sugar melt-ing profiles were similar for all formulations and tempers. Micrographs revealed variationsin surface and internal crystal network structures and interparticle interactions related totemper. From scanning electron micrography, undertemper resulted in rearrangements withrecrystallisation of unstable fat crystals to smaller numbers of larger agglomerates with for-mation of solid bridges between the crystalline network structures. Thus, optimising temperregime is central to achievement of premium quality to avoid defects, affecting mechanicalproperties, appearance and melting characteristics.
9.2 INTRODUCTION
Tempering is a technique of controlled pre-crystallisation employed to induce the most stablesolid form of cocoa butter, a polymorphic fat in finished chocolates. The process consists ofshearing chocolate mass at controlled temperatures to promote crystallisation of triacylglyc-erols (TAGs) in cocoa butter to effect good setting characteristics, foam stability, demouldingproperties, product snap, contraction, gloss and shelf-life characteristics. Time–temperatureprotocols and shearing are employed to induce nucleation of stable polymorphs with theformation of three-dimensional crystal network structure influencing the microstructure, me-chanical properties and appearance of products. The crystal network organisation and the

P1: KAE/UKS P2: KAEc09 BLBK244-Afoakwa January 23, 2010 7:37 Printer Name: Yet to Come
Tempering and fat crystallisation effects on chocolate quality 175
polymorphic state of the TAG crystals as affected by the crystallisation conditions are majorfactors determining rheological and textural properties of crystallised TAG systems (Narine &Marangoni, 1999; Herrera & Hartel, 2000; Toro-Vazquez et al., 2004; Altimiras et al., 2007;Perez-Martınez et al., 2007).
Cocoa butter, the only continuous fat phase in dark chocolates, consists of a mixtureof approximately 40–50 different TAGs dominated by 2-oleyl glycerides of palmitic andstearic acids, mainly 1-palmitoyl-2-oleoyl-3-stearoylglycerol (POS) 35%, 1,3-distearoyl-2-oleoylglycerol (SOS) 23% and 1,3-disaturated-2-oleoylglycerol-type, 1,3-dipalmitoyl-2-oleoylglycerol (POP) 15% (Lipp & Anklam, 1998; Segall et al., 2005). These occur as sym-metric triacylglycerols that contain a central monounsaturated fatty acid, with saturated fattyacids in the 1 and 3 positions, which dominate the crystallisation, polymorphism and phasetransformations, thus provide chocolate with its unusual textural and other sensory properties.
PSD influences rheological and textural properties of both molten and tempered darkchocolates, with effects on microstructure, product spread, tempering and pre-crystallisationbehaviour, hardness and sensorial qualities (Chevalley, 1999; Beckett, 2000; Do et al., 2007;Afoakwa et al., 2008b, c, e). Smaller particles improve sensory properties (Ziegler et al.,2001), but plastic viscosity and yield stress increase due to changes in surface area of particlesin contact with fat phase. Chocolate production processes, such as refining, conching, temper-ing and crystallisation mechanisms result in physical and compositional attributes, influenc-ing product quality and stability through the supply chain occurring during production, stor-age, distribution and ultimately sensory character in consumption and product identification.
Instrumental measurements can act as complements for sensory evaluations (Lawless &Heymann, 1998) with statistically significant correlations (Mohamed et al., 1982; Meullenetet al., 1997; Rosenthal, 1999; Ali et al., 2001; Bourne, 2002). Appropriate strategies canobjectively assess features of texture and appearance such as gloss, colour, shape, roughness,surface texture, shininess and translucency (Leemans et al., 1998; Jahns et al., 2001; Hatcheret al., 2004; Briones & Aguilera, 2005; Briones et al., 2006; Altimiras et al., 2007). Hartel(2001) noted that the control of crystallisation is critical for texture, melting properties andother quality characteristics. Melting profiles of chocolates have been studied using pulsednuclear magnetic resonance (pNMR) and differential scanning calorimeter (DSC) (Tabouret,1987; Walter & Cornillon, 2001, 2002; Smith et al., 2007). Knowledge of tempering effectson product texture and appearance attributes can have significant commercial implications.
With recent innovations and growth in chocolate confectionery industry, understandingthe factors influencing chocolate microstructure, texture and appearance would be of valuein predicting changes in quality. As well, information on cocoa butter isothermal phasebehaviour is important for optimising production processes that maintain product quality.This study was therefore aimed at investigating effects of tempering and fat crystallisationbehaviours on mechanical properties, appearance, melting characteristics and crystallisednetwork microstructure in dark chocolates varying in PSD.
9.3 MATERIALS AND METHODS
9.3.1 Materials
Cocoa liquor of Central West African origin was obtained from Cargill Cocoa ProcessingCompany (York, UK); sucrose (pure extra-fine granulated) from British Sugar Company(Peterborough, UK); pure prime-pressed cocoa butter and soy lecithin from ADM Cocoa
P1: KAE/UKS P2: KAEc09 BLBK244-Afoakwa January 23, 2010 7:37 Printer Name: Yet to Come
176 Chocolate Science and Technology
Limited (Koog aan de Zaan, the Netherlands) and Unitechem Company Ltd (Tianjin, China),respectively.
The recipe, formulation and production of samples have been described in Section 8.3.1.Chocolates were formulated with total fat of 35% (w/w) from sucrose, cocoa liquor, cocoabutter and lecithin. Experimental samples (5 kg batch for each formulation) were producedby mixing sucrose (40.8%) and cocoa liquor (53.7%) in a Crypto Peerless mixer (ModelK175, Crypto Peerless Ltd, Birmingham, UK) at low speed for 2 minutes and then at highfor 3 minutes, then refined using a three-roll refiner (Model SDX 600, Buhler Ltd, CH-9240Uzwil, Switzerland) to a specified PS (D90: 18 ± 1 µm, 25 ± 1 µm, 35 ± 1 µm and 50 ±1 µm) conducting PS analysis, during refining, to ensure D90 values. The refined chocolateswere melted at 50–55◦C for 24 hours and the chocolate mass was conched in a Lipp Conche(Model IMC-E10, Boveristr 40-42, D-68309, Mannhein, Germany) at low speed for 3.5hours at 60◦C. Lecithin (0.5%) and cocoa butter (5%) were added and then conched athigh speed for 30 minutes to effect adequate mixing and liquefaction. Samples were kept insealed plastic containers at ambient temperature (20–22◦C) and moisture, and fat contentswere determined using Karl Fischer and Soxhlet methods (ICA, 1988, 1990).
9.3.2 Determination of particle size distribution
A MasterSizerR©
Laser Diffraction Particle Size Analyzer equipped with MS 15 sample pre-sentation unit (refractive index 1.590) (Malvern Instrument Ltd, Malvern, England) was used.About 0.2 g of refined dark chocolate was dispersed in vegetable oil (refractive index 1.450)at ambient temperature (20 ± 2◦C) until an obscuration of 0.2 was obtained. The samplewas placed under ultrasonic dispersion for 2 minutes to ensure particles were independentlydispersed and thereafter maintained by stirring during the measurement. Size distributionwas quantified as the relative volume of particles in size bands presented as size distributioncurves (Malvern MasterSizer
R©Micro Software v 2.19). PSD parameters obtained included
specific surface area, largest PS (D90), mean particle volume (D50), smallest PS (D10) andSauter mean diameter (D[3,2]).
9.3.3 Tempering experiment
Samples were incubated at 50◦C for 4 hours for melting and tempered using Aasted Mikrovertlaboratory continuous three-stage tempering unit (Model AMK 10, Aasted Mikroverk A/S,Farum, Denmark). Chocolate was pumped through the multistage units and a worm screwdrove the product through the heat exchangers. Sensors located at specific points in theequipment measured the temperature of both the chocolate and the coolant fluid at eachstage. Based on our earlier work on modelling temperature controls to study temperingbehaviour (Afoakwa et al., 2008g), the temperature of each of the coolant fluids (Zones 1, 2and 3) was thus set as 26, 24 and 32◦C; 21, 19 and 32◦C; and 18, 16 and 32◦C, respectively,for attaining the undertempered, optimally tempered and overtempered regimes. The degreeof pre-crystallisation was measured using a computerised tempermeter (Exotherm 7400,Systech Analytics, Neuchatel, Switzerland), and a built-in algorithm provided the temperingcurves and temper readings in chocolate temper index (slope), corresponding to optimaltemper (slope 0), undertemper (slope 1.0) and overtemper regimes (slope −1.0). The principleof this method has been described by Nelson (1999). Chocolates from three regimes weremoulded using plastic moulds, 80 mm length, 20 mm breadth and 8 mm height. The finalproducts were allowed to cool in a refrigerator (12◦C) for 2 hours before de-moulding onto
P1: KAE/UKS P2: KAEc09 BLBK244-Afoakwa January 23, 2010 7:37 Printer Name: Yet to Come
Tempering and fat crystallisation effects on chocolate quality 177
plastic trays and conditioned at 20 ± 2◦C for 14 days before analysis. Triplicate measurementswere taken for each product composition and the mean values were recorded.
9.3.4 Texture measurements
Mechanical properties of chocolates (hardness and stickiness) were measured using TA-HD Plus Texture Analyzer with a penetration probe (needle P/2) attached to an extensionbar and a 50-kg load cell and a platform reported by Afoakwa et al. (2008e). Maximumpenetration and withdrawal forces through a sample (80 × 20 mm, depth 8 mm) were de-termined with eight replications at a pre-speed of 1.0 mm/second, test of 2.0 mm/second,post-speed of 10.0 mm/second, penetrating 6 mm at 20◦C, converting mean values of thepenetration force exerted by the 50 kg load cell into hardness (g force) and the with-drawal force with time into stickiness (g force · s) data, respectively, using XT.RA Dimen-sion, Exponent 32 software (Stable Micro Systems, Godalming, Surrey, UK) as shown inFigure 7.3(b).
9.3.5 Colour and gloss measurements
HunterLab MiniscanTM XE Colorimeter Model 45/0 LAV (Hunter Associates Inc., Reston,VA, USA) calibrated with white ceramic reference standard was used. Colour images ofchocolate surfaces were converted into XYZ tristimulus values, which were further convertedto CIELAB system: L*, luminance ranging from 0 (black) to 100 (white); and a* (green tored) and b* (blue to yellow) with values from −120 to +120. Information was obtainedusing a software algorithm (Matlab v. 6.5; The Math-Works, Inc., Natick, MA, USA): hueangle (h◦) = arctan (b*/a*); chroma (C*) = [(a*)2 + (b*)2]
12 . Mean values from five replicate
measurements and standard deviations were calculated.Gloss of chocolate surface was measured using the multiple angle Tricor Gloss meter
(805A/806H Gloss System, Elgin, IL, USA). Reflectance was measured at an incidence lightangle of 85◦ from the normal to the chocolate surface, in accordance with ASTM methodD523. A polished black glass plate with a refractive index of 1.567 was used as standardsurface (ASTM, 1995) and given a gloss value of 200. Gloss was reported as gloss units(GU) based on determinations (in triplicate) at six positions along a chocolate sample. Asa reference, a surface with a gloss value less than 10 GU is considered a low-gloss surface(BYK, 1997; Briones et al., 2006).
9.3.6 Image acquisition and capture
A colour digital camera (Canon Powershot, Model A70, MA, USA) was mounted on a standinside a large box with internal black surface impervious to light. Images of the optimallytempered, undertempered and overtempered samples were captured before storage and after14 days in storage. The iris was operated in manual mode, with the lens aperture at f =8 and speed 1/20 second (no zoom, no flash) to achieve high uniformity and repeatability.The camera was grey-balanced before each imaging session. Uniform diffuse lighting wasused to illuminate the samples. The lighting system consisted of four CIE source D65 lamps(60 cm length and 18 W; Model TLD/965, Philips, Singapore) was placed above the sampleat a 45◦ angle to maximise diffuse reflection responsible for colour. The angle betweenthe camera lens axis and the sample was around 90◦ to reduce gloss. A Kodak grey card

P1: KAE/UKS P2: KAEc09 BLBK244-Afoakwa January 23, 2010 7:37 Printer Name: Yet to Come
178 Chocolate Science and Technology
with 18% reflectance was used as a white reference to standardise the illumination level.The grey-level image (1600 × 1200 pixels) of this card was divided into 192 blocks, eachone of 100 × 100 pixels. After calibration, samples were placed in the field of view ofthe camera and an image of 1600 × 1200 pixels (approximately covering the whole areaof the tablet) was acquired and stored in JPEG (Joint Photographic Experts Group, a stan-dard for compressing digital photographic images) format of high resolution and superfinequality.
9.3.7 Determination of melting properties
The differential scanning calorimeter (DSC Series 7, Perkin Elmer Pyris, Norwalk, CT, USA)equipped with a thermal analysis data station was calibrated using indium and octadecaneat a scan rate of 5◦C/minute using an aluminium pan as reference. Samples (∼5 mg) wereloaded into 40 µL capacity pans with holes, which were sealed with lids using a sample press.Pans were heated at 5◦C/minute from 15 to 55◦C in an N2 stream. Onset temperature (Tonset),peak temperature (Tpeak), end temperature (Tend) and enthalpy of melting (�Hmelt) werecalculated automatically by the software. Melting index (T index) was computed (Tend–Tonset),as described by Vasanthan and Bhatty (1996). Each sample was analysed in triplicate, andmean values and standard deviations were reported.
Thermal behaviour of fat and sugar components in samples from the different temperregimes was analysed using DSC. Pans containing approximately 5 mg samples were heatedat 10◦C/minute from 15 to 200◦C in an N2 stream, and melting profiles of the fat and sugarwere calculated by the software. To calculate the �Hmelt Sugar/ �Hmelt Fat ratio, the meltingenthalpy of the sugar was divided by the melting enthalpy of the fat peak, technique reportedto provide information on the possible structural changes in the fat and/or sugar componentsin bloomed chocolates (Lonchampt & Hartel, 2006). Triplicate analyses were conducted,and mean value and standard deviation were reported.
9.3.8 Microstructural determinations
Chocolate samples were characterised using stereoscopic binocular microscope (Nikon,SMZ-2T, Tokyo, Japan) equipped with a variable removable lens. Micrographs (colouredimages) were captured using a digital camera (Model 2.1 Rev 1, Polaroid Corporation, NY,USA) and observed using Adobe Photoshop (Version CS2, Adobe Systems Inc., NJ, USA).Triplicate experiments were conducted capturing six images per sample, and micrographsrepresenting the surface of each temper regime were captured and presented. Samples werethen sectioned (cut) into two pieces using a knife, and the internal microstructures wereobserved.
9.3.9 Scanning electron microscopy
Microstructural studies were carried out on optimally, under- and overtempered chocolatesafter 14 days in storage using a 1200 EX JEM scanning electron microscopy (SEM; Joel Ltd,Akishima, Japan). Sectioned samples (20 × 20 mm) were lyophilised (Heto Model DW3,Allerød, Denmark), then transferred and separately placed on grids with the help of double-sided tape, sputter-coated with gold (2 minutes, 2 mbar). Microstructures were observed at
P1: KAE/UKS P2: KAEc09 BLBK244-Afoakwa January 23, 2010 7:37 Printer Name: Yet to Come
Tempering and fat crystallisation effects on chocolate quality 179
5 kV and 9.75 × 10⁻⁵ torr vacuum taking 12 micrographs for each section (500×, 1,500×and 5000×) showing typical micrographs for each temper regime.
9.3.10 Experimental design and statistical analysis
Two experimental variables comprising temper regime and PSD were used. Other vari-ables including refiner temperature and pressure, conching time and temperature were heldconstant. A 3 × 4 factorial experimental design was used comprising:
1. Temper regime: optimal temper, undertemper and overtemper2. PSD (D90): 18, 25, 35 and 50 µm
Statgraphics Plus 4.1 (Graphics Software System, STCC, Inc., Rockville, USA) examinedmechanical properties (hardness and stickiness), appearance (colour [L, C*, h◦] and gloss)and melting properties (Tonset, Tend, T index, Tpeak, �Hmelt) using two-way analysis of variance(ANOVA) and multiple comparison tests to determine effects of factors and their interactions.Tukey multiple comparisons (95% significance level) determined differences between levels.All experiments were conducted in triplicates and the mean values were reported.
9.4 RESULTS AND DISCUSSION
9.4.1 Particle size distribution of dark chocolates
These findings (Fig. 7.1), previously reported (Afoakwa et al., 2008b), show volume his-tograms consisting of narrow (18 µm PS) and wide (25 µm PS) bimodal, and narrow (35 µmPS) and wide (50 µm PS) multimodal size distributions. This PSD range 18–50 µm usingD90 values (>90% finer) covers optimum minimum and maximum sizes with direct effectson texture and sensory character in manufacture (Ziegler & Hogg, 1999; Beckett, 2000).Data from the PSD as previously described (Afoakwa et al., 2008b) showed variations inspecific surface area, mean particle volume D(v,50), Sauter mean (D[3,2]) and mean particlediameter (D[4,3]) with increasing D90 PSs. Specific surface area was inversely correlatedwith the different component of PSD. Similar inverse relationships of specific surface areawith all the other components of PSD have been reported (Beckett, 1999; Ziegler & Hogg,1999; Sokmen & Gunes, 2006). Beckett (1999) concluded that largest PS and specific surfacearea of solids are the two key parameters for chocolate manufacture. The former determineschocolate coarseness and textural character, the latter with desirable flow properties. Fatcontents of the products were 35 ± 1% and moisture within the range of 0.90–0.98%.
9.4.2 Fat crystallisation behaviours during tempering ofdark chocolate
Four different temper regimes (untempering, undertempering, overtempering and optimaltempering) were characterised (Fig. 9.1) each with its unique characteristic crystallisationbehaviour. In optimal tempering, the temperature of the chocolate remained constant forsometime during cooling to initiate formation of stable fat crystals. The crystallisation heatreleased was then balanced by an equal amount of cooling energy causing the growth ofstable crystal nuclei in adequate amounts, which during post-tempering conditioning mature

P1: KAE/UKS P2: KAEc09 BLBK244-Afoakwa January 23, 2010 7:37 Printer Name: Yet to Come
180 Chocolate Science and Technology
15
17
19
21
23
25
27
29
31
1 60 119 178 237 296 355 414 473
Time (second)
Tem
per
atu
re (
°C)
Optimally temperedOvertemperedUndertemperedUntempered
Fig. 9.1 Pre-crystallisation (cooling) curves of different temper regimes from dark chocolate (18 µm PS).Reprinted from Afoakwa et al. (2008c), copyright 2008, with permission from Elsevier.
to affect shelf-stability of the product. The temperature of the chocolate dropped furtherwhen the liquid cocoa butter was transformed into solid crystals, resulting in solidificationof the products (Fig. 9.1). Beckett (2000) reported that properly tempered chocolate showsformation of Form V, the most desirable polymorphic form, which confers appropriateproduct snap, contraction, gloss and shelf-life characteristics.
Undertempering (insufficient tempering) was caused by the relatively higher temperaturesreleased between the multistage heat exchangers during tempering. The process causeddevelopment of more crystallisation heat within the product during solidification, effectingquick cooling, as more liquid fat was transformed quickly into solid form, resulting in theformation of very few stable fat crystal nuclei (Fig. 9.1). Distinct increase in temperature wasobserved during the crystallisation period, which declined again after reaching a maximumpoint where most of the stable crystals formed were remelted prior to cooling. Untemperedchocolate produced no stable fat crystals as the heat exchange system generated highercrystallisation heat during cooling, resulting in quick cooling of the completely meltedproduct, with no inflexion point for stable fat crystal formation (Fig. 9.1).
Beckett (2000) explained that the crystallisation processes in both untempered and un-dertempered chocolates lead to the formation of unstable crystal polymorph, which latertransforms into more stable Form VI polymorph during storage. Preliminary studies showedthat untempering and undertempering regimes exhibit different crystallisation behaviours butresult in similar unstable fat crystal nucleation and growth, with similar associated storagepolymorphic transformations and defects in products. Storage of the undertempered prod-ucts under ambient temperature (20–22◦C) for 14 days of conditioning induced blooming insamples, affecting various quality changes in the products as reported in this study. Productsfrom undertempering regime were used in this study.

P1: KAE/UKS P2: KAEc09 BLBK244-Afoakwa January 23, 2010 7:37 Printer Name: Yet to Come
Tempering and fat crystallisation effects on chocolate quality 181
Overtempering occurred when relatively lower temperatures were exchanged betweenthe multistage heat exchangers of the tempering equipment, causing significant part of theliquid fat to withdraw from the continuous phase of the chocolate, and transformed into solidform leaving less liquid fat available for pumping of the product. The process released littlecrystallisation heat during cooling, rendering a rather flat and slow cooling curve (Fig. 9.1).This crystallisation process results in too many small stable seed crystal formation, leading toreduced strengths in the polymorphic stabilities of the fat crystals formed during the process(Talbot 1999). As a substantial part of the phase transition (from liquid to solid) took placebefore the chocolate reached the mould, less contraction occurred in the mould, leading todemoulding problems with defects in final product quality and storage characteristics (Hartel,2001; Lonchampt & Hartel, 2004).
9.4.3 Effect of temper regime and PSD onmechanical properties
Hardness showed an inverse relationship with PSs, with significant reductions at all temperregimes, and greatest in the undertempered (bloomed) products (Fig. 9.2). Hardness of theoptimally tempered products decreased from 5318 g with 18 µm PS to 4259 g at 50 µm.Similar trends in hardness were noted with the overtempered samples, decreasing from 6064g with 18 µm PS to 4651 g at 50 µm, and from 6533 g with 18 µm PS to 5459 g at 50 µm
4000
4500
5000
5500
6000
6500
7000
Optimally tempered Overtempered Undertempered(bloomed)
Har
dn
ess
(g f
orc
e)
18 μm
25 μm
35 μm
50 μm
Fig. 9.2 Effect of temper regime and PSD on hardness of dark chocolates. Reprinted from Afoakwa et al.(2008c), copyright 2008, with permission from Elsevier.
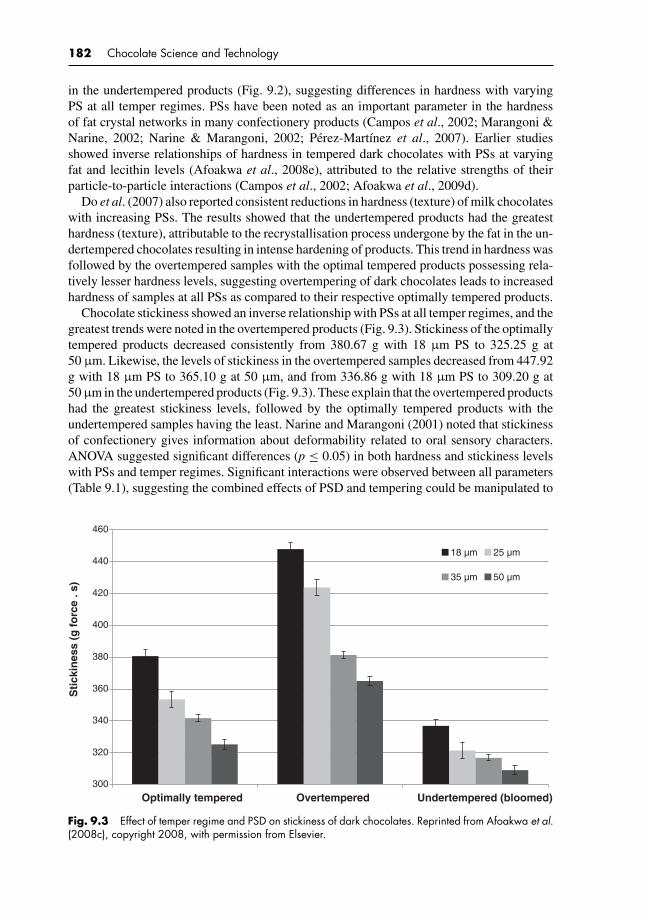
P1: KAE/UKS P2: KAEc09 BLBK244-Afoakwa January 23, 2010 7:37 Printer Name: Yet to Come
182 Chocolate Science and Technology
in the undertempered products (Fig. 9.2), suggesting differences in hardness with varyingPS at all temper regimes. PSs have been noted as an important parameter in the hardnessof fat crystal networks in many confectionery products (Campos et al., 2002; Marangoni &Narine, 2002; Narine & Marangoni, 2002; Perez-Martınez et al., 2007). Earlier studiesshowed inverse relationships of hardness in tempered dark chocolates with PSs at varyingfat and lecithin levels (Afoakwa et al., 2008e), attributed to the relative strengths of theirparticle-to-particle interactions (Campos et al., 2002; Afoakwa et al., 2009d).
Do et al. (2007) also reported consistent reductions in hardness (texture) of milk chocolateswith increasing PSs. The results showed that the undertempered products had the greatesthardness (texture), attributable to the recrystallisation process undergone by the fat in the un-dertempered chocolates resulting in intense hardening of products. This trend in hardness wasfollowed by the overtempered samples with the optimal tempered products possessing rela-tively lesser hardness levels, suggesting overtempering of dark chocolates leads to increasedhardness of samples at all PSs as compared to their respective optimally tempered products.
Chocolate stickiness showed an inverse relationship with PSs at all temper regimes, and thegreatest trends were noted in the overtempered products (Fig. 9.3). Stickiness of the optimallytempered products decreased consistently from 380.67 g with 18 µm PS to 325.25 g at50 µm. Likewise, the levels of stickiness in the overtempered samples decreased from 447.92g with 18 µm PS to 365.10 g at 50 µm, and from 336.86 g with 18 µm PS to 309.20 g at50 µm in the undertempered products (Fig. 9.3). These explain that the overtempered productshad the greatest stickiness levels, followed by the optimally tempered products with theundertempered samples having the least. Narine and Marangoni (2001) noted that stickinessof confectionery gives information about deformability related to oral sensory characters.ANOVA suggested significant differences (p ≤ 0.05) in both hardness and stickiness levelswith PSs and temper regimes. Significant interactions were observed between all parameters(Table 9.1), suggesting the combined effects of PSD and tempering could be manipulated to
300
320
340
360
380
400
420
440
460
Optimally tempered Overtempered Undertempered (bloomed)
Sti
ckin
ess
(g f
orc
e . s
)
18 µm 25 µm
35 µm 50 µm
Fig. 9.3 Effect of temper regime and PSD on stickiness of dark chocolates. Reprinted from Afoakwa et al.(2008c), copyright 2008, with permission from Elsevier.
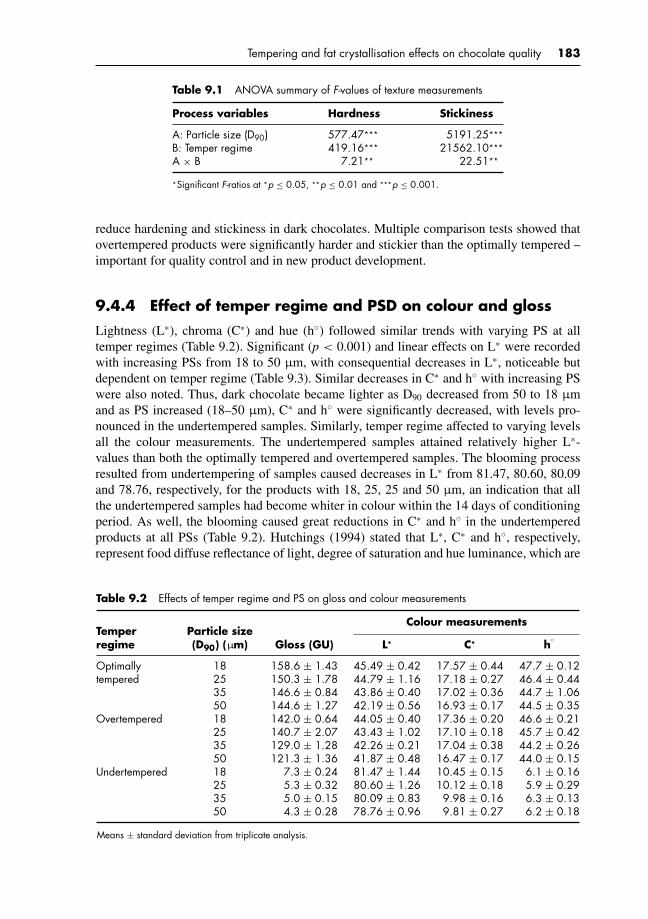
P1: KAE/UKS P2: KAEc09 BLBK244-Afoakwa January 23, 2010 7:37 Printer Name: Yet to Come
Tempering and fat crystallisation effects on chocolate quality 183
Table 9.1 ANOVA summary of F-values of texture measurements
Process variables Hardness Stickiness
A: Particle size (D90) 577.47*** 5191.25***
B: Temper regime 419.16*** 21562.10***
A × B 7.21** 22.51**
*Significant F-ratios at *p ≤ 0.05, **p ≤ 0.01 and ***p ≤ 0.001.
reduce hardening and stickiness in dark chocolates. Multiple comparison tests showed thatovertempered products were significantly harder and stickier than the optimally tempered –important for quality control and in new product development.
9.4.4 Effect of temper regime and PSD on colour and gloss
Lightness (L*), chroma (C*) and hue (h◦) followed similar trends with varying PS at alltemper regimes (Table 9.2). Significant (p < 0.001) and linear effects on L* were recordedwith increasing PSs from 18 to 50 µm, with consequential decreases in L*, noticeable butdependent on temper regime (Table 9.3). Similar decreases in C* and h◦ with increasing PSwere also noted. Thus, dark chocolate became lighter as D90 decreased from 50 to 18 µmand as PS increased (18–50 µm), C* and h◦ were significantly decreased, with levels pro-nounced in the undertempered samples. Similarly, temper regime affected to varying levelsall the colour measurements. The undertempered samples attained relatively higher L*-values than both the optimally tempered and overtempered samples. The blooming processresulted from undertempering of samples caused decreases in L* from 81.47, 80.60, 80.09and 78.76, respectively, for the products with 18, 25, 25 and 50 µm, an indication that allthe undertempered samples had become whiter in colour within the 14 days of conditioningperiod. As well, the blooming caused great reductions in C* and h◦ in the undertemperedproducts at all PSs (Table 9.2). Hutchings (1994) stated that L*, C* and h◦, respectively,represent food diffuse reflectance of light, degree of saturation and hue luminance, which are
Table 9.2 Effects of temper regime and PS on gloss and colour measurements
Colour measurementsTemper Particle sizeregime (D90) (µm) Gloss (GU) L* C* h◦
Optimallytempered
18 158.6 ± 1.43 45.49 ± 0.42 17.57 ± 0.44 47.7 ± 0.1225 150.3 ± 1.78 44.79 ± 1.16 17.18 ± 0.27 46.4 ± 0.4435 146.6 ± 0.84 43.86 ± 0.40 17.02 ± 0.36 44.7 ± 1.0650 144.6 ± 1.27 42.19 ± 0.56 16.93 ± 0.17 44.5 ± 0.35
Overtempered 18 142.0 ± 0.64 44.05 ± 0.40 17.36 ± 0.20 46.6 ± 0.2125 140.7 ± 2.07 43.43 ± 1.02 17.10 ± 0.18 45.7 ± 0.4235 129.0 ± 1.28 42.26 ± 0.21 17.04 ± 0.38 44.2 ± 0.2650 121.3 ± 1.36 41.87 ± 0.48 16.47 ± 0.17 44.0 ± 0.15
Undertempered 18 7.3 ± 0.24 81.47 ± 1.44 10.45 ± 0.15 6.1 ± 0.1625 5.3 ± 0.32 80.60 ± 1.26 10.12 ± 0.18 5.9 ± 0.2935 5.0 ± 0.15 80.09 ± 0.83 9.98 ± 0.16 6.3 ± 0.1350 4.3 ± 0.28 78.76 ± 0.96 9.81 ± 0.27 6.2 ± 0.18
Means ± standard deviation from triplicate analysis.
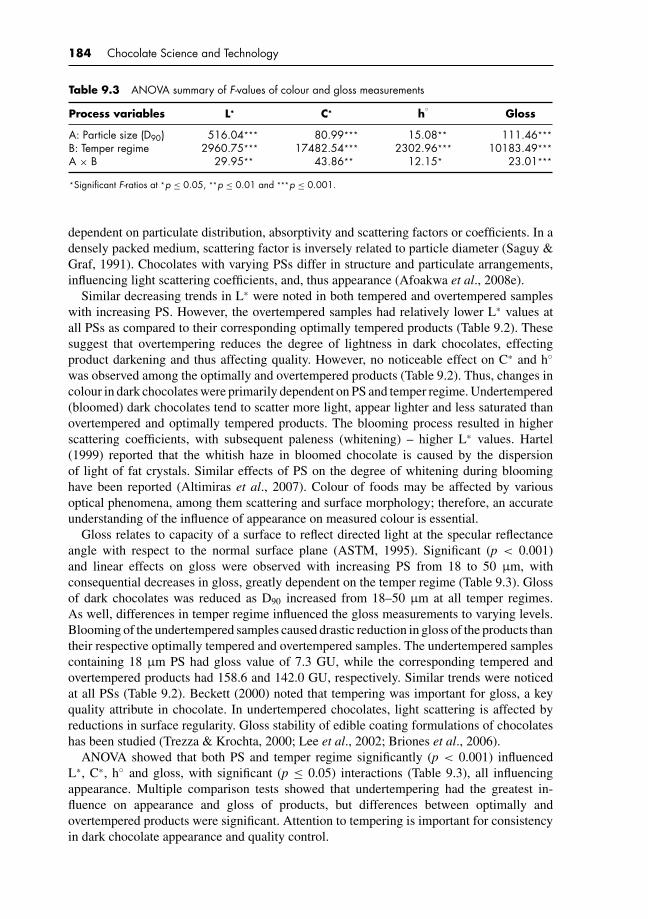
P1: KAE/UKS P2: KAEc09 BLBK244-Afoakwa January 23, 2010 7:37 Printer Name: Yet to Come
184 Chocolate Science and Technology
Table 9.3 ANOVA summary of F-values of colour and gloss measurements
Process variables L* C* h◦ Gloss
A: Particle size (D90) 516.04*** 80.99*** 15.08** 111.46***
B: Temper regime 2960.75*** 17482.54*** 2302.96*** 10183.49***
A × B 29.95** 43.86** 12.15* 23.01***
*Significant F-ratios at *p ≤ 0.05, **p ≤ 0.01 and ***p ≤ 0.001.
dependent on particulate distribution, absorptivity and scattering factors or coefficients. In adensely packed medium, scattering factor is inversely related to particle diameter (Saguy &Graf, 1991). Chocolates with varying PSs differ in structure and particulate arrangements,influencing light scattering coefficients, and, thus appearance (Afoakwa et al., 2008e).
Similar decreasing trends in L* were noted in both tempered and overtempered sampleswith increasing PS. However, the overtempered samples had relatively lower L* values atall PSs as compared to their corresponding optimally tempered products (Table 9.2). Thesesuggest that overtempering reduces the degree of lightness in dark chocolates, effectingproduct darkening and thus affecting quality. However, no noticeable effect on C* and h◦
was observed among the optimally and overtempered products (Table 9.2). Thus, changes incolour in dark chocolates were primarily dependent on PS and temper regime. Undertempered(bloomed) dark chocolates tend to scatter more light, appear lighter and less saturated thanovertempered and optimally tempered products. The blooming process resulted in higherscattering coefficients, with subsequent paleness (whitening) – higher L* values. Hartel(1999) reported that the whitish haze in bloomed chocolate is caused by the dispersionof light of fat crystals. Similar effects of PS on the degree of whitening during bloominghave been reported (Altimiras et al., 2007). Colour of foods may be affected by variousoptical phenomena, among them scattering and surface morphology; therefore, an accurateunderstanding of the influence of appearance on measured colour is essential.
Gloss relates to capacity of a surface to reflect directed light at the specular reflectanceangle with respect to the normal surface plane (ASTM, 1995). Significant (p < 0.001)and linear effects on gloss were observed with increasing PS from 18 to 50 µm, withconsequential decreases in gloss, greatly dependent on the temper regime (Table 9.3). Glossof dark chocolates was reduced as D90 increased from 18–50 µm at all temper regimes.As well, differences in temper regime influenced the gloss measurements to varying levels.Blooming of the undertempered samples caused drastic reduction in gloss of the products thantheir respective optimally tempered and overtempered samples. The undertempered samplescontaining 18 µm PS had gloss value of 7.3 GU, while the corresponding tempered andovertempered products had 158.6 and 142.0 GU, respectively. Similar trends were noticedat all PSs (Table 9.2). Beckett (2000) noted that tempering was important for gloss, a keyquality attribute in chocolate. In undertempered chocolates, light scattering is affected byreductions in surface regularity. Gloss stability of edible coating formulations of chocolateshas been studied (Trezza & Krochta, 2000; Lee et al., 2002; Briones et al., 2006).
ANOVA showed that both PS and temper regime significantly (p < 0.001) influencedL*, C*, h◦ and gloss, with significant (p ≤ 0.05) interactions (Table 9.3), all influencingappearance. Multiple comparison tests showed that undertempering had the greatest in-fluence on appearance and gloss of products, but differences between optimally andovertempered products were significant. Attention to tempering is important for consistencyin dark chocolate appearance and quality control.

P1: KAE/UKS P2: KAEc09 BLBK244-Afoakwa January 23, 2010 7:37 Printer Name: Yet to Come
Tempering and fat crystallisation effects on chocolate quality 185
9.4.5 Effect of temper regime and PSD on melting properties
9.4.5.1 Effects of temper regime
Figure 9.4 shows typical DSC thermograms used for evaluating the melting properties of darkchocolates manufactured from the optimally tempered, overtempered and undertemperedregimes. All the samples exhibited similar distinct single endothermic transitions between15 and 55◦C, the range expected for chocolate melting profiles. McFarlane (1999) explainedthat peak onset corresponds to the temperature at which a specific crystal form starts to melt;peak maximum, that at which melting rate is greatest; and end of melting, completion ofliquefaction – all the information is related to the crystal type. Peak height, position andresolution are dependent on sample composition and crystalline state distribution.
Data from the DSC (Fig. 9.4) showed that differences in temper regime produced changesin crystallinity and melting properties, observed in the differences in their peaks, suggestingthat variations in crystallisation behaviour in dark chocolates during tempering influencethe degree of crystallinity and CSD of their derived products. Undertempered (bloomed)chocolates showed the greatest peak width, followed by the overtempered samples havingslightly wider CSD than the optimally tempered products with resultant variation in theirmelting profiles (Fig. 9.4).
Hartel (2001) concluded that distribution of crystal sizes in foods plays key roles in finalproduct quality, defined by the total and specific characteristics of their crystalline material.Number of crystals and range of sizes, shapes and polymorphic stability, as well as arrange-ments in network structures, dictate mechanical and rheological properties. Knowledge andcontrol of CSD can be important for optimising processing conditions.
3.2
3.4
3.6
3.8
4
4.2
4.4
4.6
15 16.6 19.516 22.433 25.35 28.266 31.183 34.1 37.016 39.933 42.85 45.766 48.683 51.6 54.516
Temperature (°C)
No
rmal
ised
hea
t fl
ow
(W
/g)
Optimally tempered
Overtempered
Undertempered
Fig. 9.4 Typical DSC thermograms of fat melting profile showing optimally tempered, overtempered andundertempered (bloomed) dark chocolates. Reprinted from Afoakwa et al. (2009a), copyright 2009, withpermission from Elsevier.

P1: KAE/UKS P2: KAEc09 BLBK244-Afoakwa January 23, 2010 7:37 Printer Name: Yet to Come
186 Chocolate Science and Technology
Table 9.4 Effects of temper regime and particle size distribution on melting properties
Melting propertiesTemper Particle sizeregime size (D90) (µm) Tonset (◦C) Tend (◦C) Tindex (◦C) Tpeak (◦C) �Hmelt (J/g)
Optimallytempered
18 26.5 ± 0.4 33.6 ± 0.3 7.1 ± 0.2 31.9 ± 0.1 37.73 ± 0.6525 26.4 ± 0.3 33.3 ± 0.4 6.7 ± 0.4 31.7 ± 0.2 37.56 ± 0.9235 26.6 ± 0.2 32.7 ± 0.3 6.1 ± 0.2 31.7 ± 0.1 36.87 ± 0.5850 26.5 ± 0.4 32.5 ± 0.4 6.0 ± 0.4 31.8 ± 0.2 36.76 ± 0.72
Overtempered 18 26.6 ± 0.2 34.2 ± 0.3 7.6 ± 0.2 32.6 ± 0.2 41.26 ± 0.6125 26.5 ± 0.4 33.8 ± 0.4 7.3 ± 0.4 32.7 ± 0.1 40.42 ± 0.8835 26.7 ± 0.2 33.5 ± 0.2 6.8 ± 0.2 32.5 ± 0.2 40.47 ± 0.5750 26.6 ± 0.3 33.2 ± 0.4 6.6 ± 0.4 32.6 ± 0.2 40.36 ± 0.52
Undertempered 18 27.4 ± 0.2 36.2 ± 0.3 8.8 ± 0.2 33.8 ± 0.2 44.45 ± 0.8825 27.3 ± 0.4 36.0 ± 0.4 8.7 ± 0.4 33.7 ± 0.1 44.10 ± 0.5135 27.2 ± 0.2 35.7 ± 0.3 8.5 ± 0.2 33.6 ± 0.2 43.87 ± 0.8650 27.4 ± 0.3 35.6 ± 0.4 8.2 ± 0.4 33.6 ± 0.1 43.80 ± 0.58
Means ± standard deviation from triplicate analysis.
Data from the DSC on Tonset, Tend, Tpeak, �Hmelt and T index in relation to temper regime(Table 9.4) analysed by ANOVA and multiple comparison tests showed significant (p < 0.05)differences for Tonset and Tpeak differing in temper regime (Table 9.4) and highly significantdifferences (p < 0.001) among Tend, T index and �Hmelt (Table 9.5). The differences in temperyielded mean Tend values of 33.0, 33.7 and 35.9◦C, respectively, for the optimally, over- andundertempered chocolates. There was a significant (p < 0.05) inverse relationship betweenTend and PSD (Table 9.5). Such observations suggest that undertempered chocolate completedmelting at higher temperatures than optimally and overtempered products. The changing Tend
values of the samples revealed that the crystallites in optimally and overtempered were withinβV polymorphic status (32–34◦C) while that of undertempered had undergone polymorphictransformation into βVI polymorphic status (34–36◦C). Similarly, undertempered (bloomed)chocolate had higher T index values of 8.8, 8.7, 8.5 and 8.2◦C, inversely related to PS from 18to 50 µm, while the optimal and overtempered products had T index ranges of 7.1–6.0◦C, andfrom 7.6 to 6.6◦C, respectively, suggesting that the undertempered chocolate took longer tomelt than the optimally and overtempered products. Multiple comparison tests showed thatthe overtempered samples took longer to melt than the optimally tempered. It is predicted thatthese would have likely impact on their behaviour during consumption, attributable to therelative strengths of their mechanical properties (hardness and stickiness). Similarly, under-tempered chocolate had higher �Hmelt values at all PSs than the optimally and overtemperedproducts (Table 9.4), with significant (p < 0.05) interactions with PS. Multiple compari-son test revealed that overtempered chocolates showed higher T index and �Hmelt than theoptimally tempered, a significant finding for process quality control.
Table 9.5 ANOVA summary of F-values of melting properties
Process variables Tonset (◦C) Tend (◦C) Tpeak (◦C) Tindex (◦C) �Hmelt (J/g)
A: Particle size (D90) 1.78 12.17* 3.74 34.73** 6.96B: Temper regime 198.75*** 261.19*** 22.57** 1107.80*** 462.78***
A × B 1.18 2.45* 7.26*** 160.33*** 3.67**
Significant F-ratios at *p ≤ 0.05, **p ≤ 0.01 and ***p ≤ 0.001.
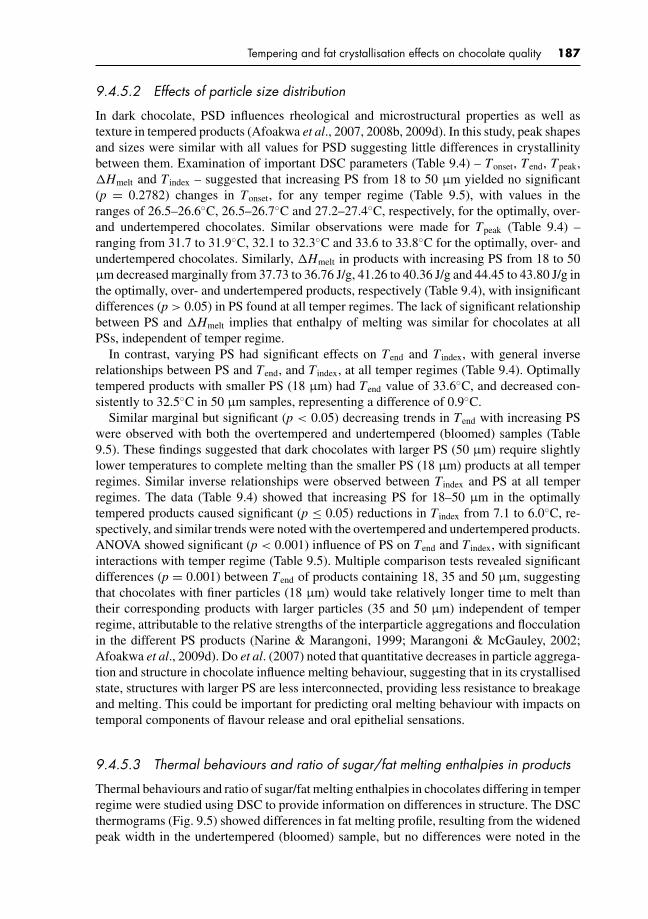
P1: KAE/UKS P2: KAEc09 BLBK244-Afoakwa January 23, 2010 7:37 Printer Name: Yet to Come
Tempering and fat crystallisation effects on chocolate quality 187
9.4.5.2 Effects of particle size distribution
In dark chocolate, PSD influences rheological and microstructural properties as well astexture in tempered products (Afoakwa et al., 2007, 2008b, 2009d). In this study, peak shapesand sizes were similar with all values for PSD suggesting little differences in crystallinitybetween them. Examination of important DSC parameters (Table 9.4) – Tonset, Tend, Tpeak,�Hmelt and T index – suggested that increasing PS from 18 to 50 µm yielded no significant(p = 0.2782) changes in Tonset, for any temper regime (Table 9.5), with values in theranges of 26.5–26.6◦C, 26.5–26.7◦C and 27.2–27.4◦C, respectively, for the optimally, over-and undertempered chocolates. Similar observations were made for Tpeak (Table 9.4) –ranging from 31.7 to 31.9◦C, 32.1 to 32.3◦C and 33.6 to 33.8◦C for the optimally, over- andundertempered chocolates. Similarly, �Hmelt in products with increasing PS from 18 to 50µm decreased marginally from 37.73 to 36.76 J/g, 41.26 to 40.36 J/g and 44.45 to 43.80 J/g inthe optimally, over- and undertempered products, respectively (Table 9.4), with insignificantdifferences (p > 0.05) in PS found at all temper regimes. The lack of significant relationshipbetween PS and �Hmelt implies that enthalpy of melting was similar for chocolates at allPSs, independent of temper regime.
In contrast, varying PS had significant effects on Tend and T index, with general inverserelationships between PS and Tend, and T index, at all temper regimes (Table 9.4). Optimallytempered products with smaller PS (18 µm) had Tend value of 33.6◦C, and decreased con-sistently to 32.5◦C in 50 µm samples, representing a difference of 0.9◦C.
Similar marginal but significant (p < 0.05) decreasing trends in Tend with increasing PSwere observed with both the overtempered and undertempered (bloomed) samples (Table9.5). These findings suggested that dark chocolates with larger PS (50 µm) require slightlylower temperatures to complete melting than the smaller PS (18 µm) products at all temperregimes. Similar inverse relationships were observed between T index and PS at all temperregimes. The data (Table 9.4) showed that increasing PS for 18–50 µm in the optimallytempered products caused significant (p ≤ 0.05) reductions in T index from 7.1 to 6.0◦C, re-spectively, and similar trends were noted with the overtempered and undertempered products.ANOVA showed significant (p < 0.001) influence of PS on Tend and T index, with significantinteractions with temper regime (Table 9.5). Multiple comparison tests revealed significantdifferences (p = 0.001) between Tend of products containing 18, 35 and 50 µm, suggestingthat chocolates with finer particles (18 µm) would take relatively longer time to melt thantheir corresponding products with larger particles (35 and 50 µm) independent of temperregime, attributable to the relative strengths of the interparticle aggregations and flocculationin the different PS products (Narine & Marangoni, 1999; Marangoni & McGauley, 2002;Afoakwa et al., 2009d). Do et al. (2007) noted that quantitative decreases in particle aggrega-tion and structure in chocolate influence melting behaviour, suggesting that in its crystallisedstate, structures with larger PS are less interconnected, providing less resistance to breakageand melting. This could be important for predicting oral melting behaviour with impacts ontemporal components of flavour release and oral epithelial sensations.
9.4.5.3 Thermal behaviours and ratio of sugar/fat melting enthalpies in products
Thermal behaviours and ratio of sugar/fat melting enthalpies in chocolates differing in temperregime were studied using DSC to provide information on differences in structure. The DSCthermograms (Fig. 9.5) showed differences in fat melting profile, resulting from the widenedpeak width in the undertempered (bloomed) sample, but no differences were noted in the
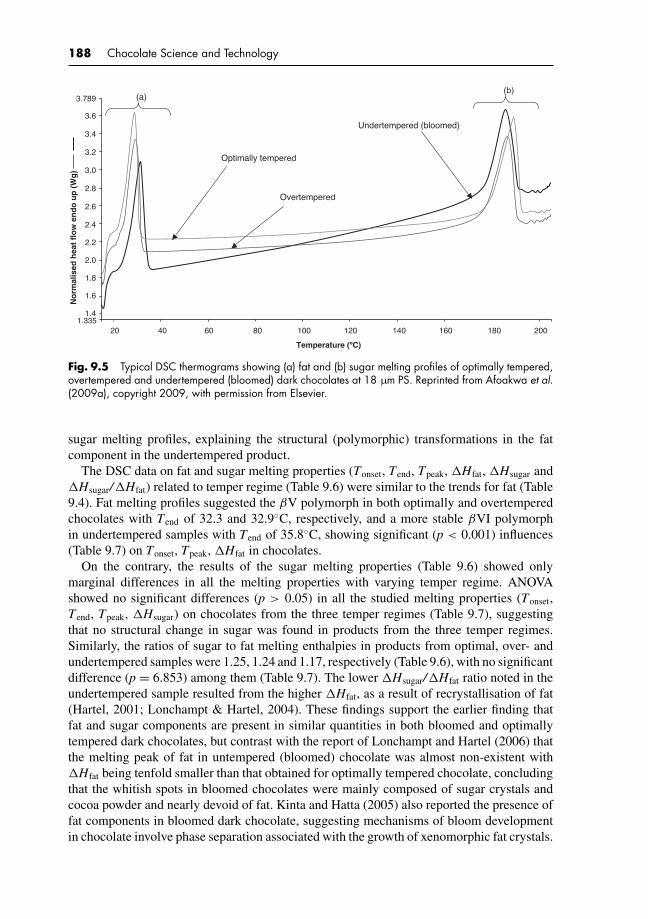
P1: KAE/UKS P2: KAEc09 BLBK244-Afoakwa January 23, 2010 7:37 Printer Name: Yet to Come
188 Chocolate Science and Technology
201.335
3.789
3.6
3.4
3.2
3.0
2.8
2.6
2.4
2.2
2.0
1.8
1.6
1.4
No
rmal
ised
hea
t fl
ow
en
do
up
(W
g)
40 60 80 100 120 140 160 180 200
Temperature (ºC)
Optimally tempered
Overtempered
Undertempered (bloomed)
(a)(b)
Fig. 9.5 Typical DSC thermograms showing (a) fat and (b) sugar melting profiles of optimally tempered,overtempered and undertempered (bloomed) dark chocolates at 18 µm PS. Reprinted from Afoakwa et al.(2009a), copyright 2009, with permission from Elsevier.
sugar melting profiles, explaining the structural (polymorphic) transformations in the fatcomponent in the undertempered product.
The DSC data on fat and sugar melting properties (Tonset, Tend, Tpeak, �Hfat, �Hsugar and�Hsugar/�Hfat) related to temper regime (Table 9.6) were similar to the trends for fat (Table9.4). Fat melting profiles suggested the βV polymorph in both optimally and overtemperedchocolates with Tend of 32.3 and 32.9◦C, respectively, and a more stable βVI polymorphin undertempered samples with Tend of 35.8◦C, showing significant (p < 0.001) influences(Table 9.7) on Tonset, Tpeak, �Hfat in chocolates.
On the contrary, the results of the sugar melting properties (Table 9.6) showed onlymarginal differences in all the melting properties with varying temper regime. ANOVAshowed no significant differences (p > 0.05) in all the studied melting properties (Tonset,Tend, Tpeak, �Hsugar) on chocolates from the three temper regimes (Table 9.7), suggestingthat no structural change in sugar was found in products from the three temper regimes.Similarly, the ratios of sugar to fat melting enthalpies in products from optimal, over- andundertempered samples were 1.25, 1.24 and 1.17, respectively (Table 9.6), with no significantdifference (p = 6.853) among them (Table 9.7). The lower �Hsugar/�Hfat ratio noted in theundertempered sample resulted from the higher �Hfat, as a result of recrystallisation of fat(Hartel, 2001; Lonchampt & Hartel, 2004). These findings support the earlier finding thatfat and sugar components are present in similar quantities in both bloomed and optimallytempered dark chocolates, but contrast with the report of Lonchampt and Hartel (2006) thatthe melting peak of fat in untempered (bloomed) chocolate was almost non-existent with�Hfat being tenfold smaller than that obtained for optimally tempered chocolate, concludingthat the whitish spots in bloomed chocolates were mainly composed of sugar crystals andcocoa powder and nearly devoid of fat. Kinta and Hatta (2005) also reported the presence offat components in bloomed dark chocolate, suggesting mechanisms of bloom developmentin chocolate involve phase separation associated with the growth of xenomorphic fat crystals.

P1: KAE/UKS P2: KAEc09 BLBK244-Afoakwa January 23, 2010 7:37 Printer Name: Yet to Come
Tempering and fat crystallisation effects on chocolate quality 189
Table
9.6
Ther
mal
prop
ertie
sof
fata
ndsu
garc
ompo
nent
sin
dark
choc
olat
esfro
mdi
ffere
ntte
mpe
rreg
imes
Fat
mel
ting
pro
per
ties
Sugar
mel
ting
pro
per
ties
Sugar/
fat
Tem
per
rela
tions
regim
eT o
nse
t(◦
C)
T end
(◦C)
T pea
k(◦
C)
�H
mel
t(J
/g)
T onse
t(◦
C)
T end
(◦C)
T pea
k(◦
C)
�H
mel
t(J
/g)
�H
sugar/
�H
fat
Opt
imal
lyte
mpe
red
26.2
±0.
2432
.3±
0.44
30.8
±1.
0437
.60
±0.
6617
9.43
±0.
4319
1.98
±0.
3918
8.83
±0.
5250
.64
±0.
641.
25±
0.21
Ove
rtem
pere
d26
.4±
0.18
32.9
±0.
2831
.4±
0.83
39.5
8±
0.42
178.
85±
0.18
191.
34±
0.83
187.
37±
0.74
49.1
3±
0.47
1.24
±0.
34U
nder
tem
pere
d27
.3±
0.53
35.8
±0.
1933
.5±
0.71
42.0
7±
0.73
178.
21±
0.47
190.
82±
0.50
186.
87±
0.58
49.1
6±
0.76
1.17
±0.
28
Mea
ns±
stand
ard
devi
atio
nfro
mtri
plic
ate
anal
ysis
.
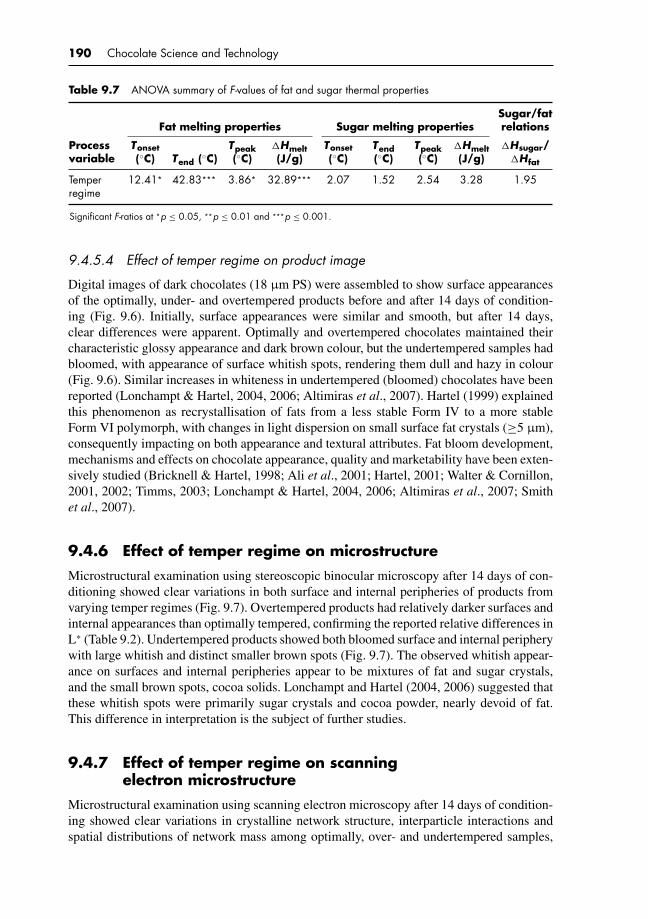
P1: KAE/UKS P2: KAEc09 BLBK244-Afoakwa January 23, 2010 7:37 Printer Name: Yet to Come
190 Chocolate Science and Technology
Table 9.7 ANOVA summary of F-values of fat and sugar thermal properties
Fat melting properties Sugar melting propertiesSugar/fatrelations
Processvariable
Tonset(◦C) Tend (◦C)
Tpeak(◦C)
�Hmelt(J/g)
Tonset(◦C)
Tend(◦C)
Tpeak(◦C)
�Hmelt(J/g)
�Hsugar/�Hfat
Temperregime
12.41* 42.83*** 3.86* 32.89*** 2.07 1.52 2.54 3.28 1.95
Significant F-ratios at *p ≤ 0.05, **p ≤ 0.01 and ***p ≤ 0.001.
9.4.5.4 Effect of temper regime on product image
Digital images of dark chocolates (18 µm PS) were assembled to show surface appearancesof the optimally, under- and overtempered products before and after 14 days of condition-ing (Fig. 9.6). Initially, surface appearances were similar and smooth, but after 14 days,clear differences were apparent. Optimally and overtempered chocolates maintained theircharacteristic glossy appearance and dark brown colour, but the undertempered samples hadbloomed, with appearance of surface whitish spots, rendering them dull and hazy in colour(Fig. 9.6). Similar increases in whiteness in undertempered (bloomed) chocolates have beenreported (Lonchampt & Hartel, 2004, 2006; Altimiras et al., 2007). Hartel (1999) explainedthis phenomenon as recrystallisation of fats from a less stable Form IV to a more stableForm VI polymorph, with changes in light dispersion on small surface fat crystals (≥5 µm),consequently impacting on both appearance and textural attributes. Fat bloom development,mechanisms and effects on chocolate appearance, quality and marketability have been exten-sively studied (Bricknell & Hartel, 1998; Ali et al., 2001; Hartel, 2001; Walter & Cornillon,2001, 2002; Timms, 2003; Lonchampt & Hartel, 2004, 2006; Altimiras et al., 2007; Smithet al., 2007).
9.4.6 Effect of temper regime on microstructure
Microstructural examination using stereoscopic binocular microscopy after 14 days of con-ditioning showed clear variations in both surface and internal peripheries of products fromvarying temper regimes (Fig. 9.7). Overtempered products had relatively darker surfaces andinternal appearances than optimally tempered, confirming the reported relative differences inL* (Table 9.2). Undertempered products showed both bloomed surface and internal peripherywith large whitish and distinct smaller brown spots (Fig. 9.7). The observed whitish appear-ance on surfaces and internal peripheries appear to be mixtures of fat and sugar crystals,and the small brown spots, cocoa solids. Lonchampt and Hartel (2004, 2006) suggested thatthese whitish spots were primarily sugar crystals and cocoa powder, nearly devoid of fat.This difference in interpretation is the subject of further studies.
9.4.7 Effect of temper regime on scanningelectron microstructure
Microstructural examination using scanning electron microscopy after 14 days of condition-ing showed clear variations in crystalline network structure, interparticle interactions andspatial distributions of network mass among optimally, over- and undertempered samples,
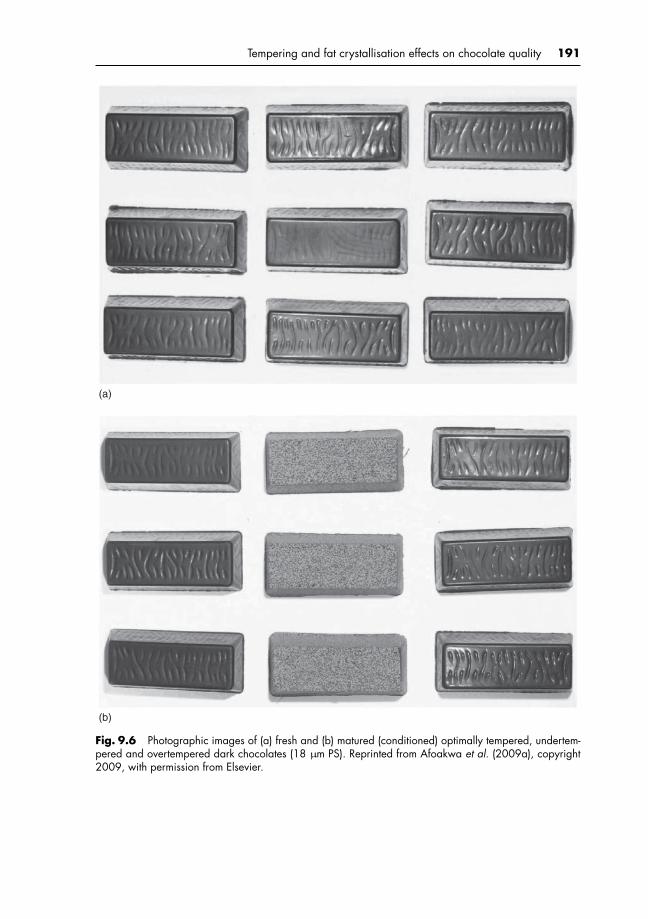
P1: KAE/UKS P2: KAEc09 BLBK244-Afoakwa January 23, 2010 7:37 Printer Name: Yet to Come
Tempering and fat crystallisation effects on chocolate quality 191
(a)
(b)
Fig. 9.6 Photographic images of (a) fresh and (b) matured (conditioned) optimally tempered, undertem-pered and overtempered dark chocolates (18 µm PS). Reprinted from Afoakwa et al. (2009a), copyright2009, with permission from Elsevier.

P1: KAE/UKS P2: KAEc09 BLBK244-Afoakwa January 23, 2010 7:37 Printer Name: Yet to Come
192 Chocolate Science and Technology
X 100 X 100
1(a) 1(b)
X 100 X 100
2(a) 2(b)
X 100 X 100
3(a) 3(b)
Fig. 9.7 Micrographs of surface (a) and internal (b) structures, respectively, of (1) optimally tempered,(2) undertempered and (3) overtempered dark chocolates (18 µm PS). Reprinted from Afoakwa et al.(2009a), copyright 2009, with permission from Elsevier.
P1: KAE/UKS P2: KAEc09 BLBK244-Afoakwa January 23, 2010 7:37 Printer Name: Yet to Come
Tempering and fat crystallisation effects on chocolate quality 193
becoming well defined with increasing magnification from (i) ×800 (ii) ×1500 to (iii) ×2500(Fig. 9.8(a–c)). Microscopy of the optimally tempered chocolate showed an even spatial dis-tribution of small number of dense crystalline networks with well-defined interparticle con-nections among crystals, suggesting the stable β-polymorph (Fig. 9.8(a)). Similarly, micro-graphs of the overtempered chocolate showed a spatial distribution of a dense mass of smallercrystals (relative to those of the optimally tempered) within a network structure of well-defined particle-to-particle crystal connections, suggesting their β-polymorph stability (Fig.9.8(b)). These larger numbers of small crystalline networks noted in the overtempered sam-ples are suspected to result from early nucleation and growth of seed crystals due to the slowcooling (Fig. 9.1), leading to the formation of submicron primary crystallites from the melt,with the resulting fat crystal network stabilised by van der Waals forces, possibly with stericand Coulombic forces (deMan, 1999; Narine & Marangoni, 2002; Tang & Marangoni, 2008).
Undertempered (bloomed) chocolate showed dissolution, rearrangement and recrystalli-sation of the numerous small crystals noted in the over- and optimally tempered productsto a smaller number of larger (lumps) fat crystals (Ostwald ripening), and polymorphictransformation, nucleation and growth of new large crystals in a more stable polymorphicform, inducing formation of solid bridges with weak and less intercrystal connections withinthe crystalline structures (Fig. 9.8(c)). Hartel (2001) suggested that this phenomenon isbrought about by thermodynamic differences in equilibrium between large and small crys-tals within a network structure leading to recrystallisation of unstable fat polymorphs. Inanother study, surface imperfections – pores and pits – in filled chocolates were reported onthe microstructure of bloomed chocolate (Rousseau & Smith, 2008). Both reports explainedthat morphological changes on the surface of the chocolate were dominated by the growthof needle-like crystals and spherulites on the chocolate with large crystals approximately100 µm in length, and concluded that from a microstructural perspective, both diffusion andcapillarity appear to be involved in fat bloom formation and development, though tempera-ture, PSD of the product and the presence of a filling fat strongly dictate the rate and type ofmechanism that dominate the process.
These hypotheses suggest that differences in crystallisation behaviour during temperinglead to formation of different microstructural organisations of crystal network structure,with associated physical changes in chocolates. Characterising the nature of crystals inconfectionery is an important step in quantifying the physical and sensory properties, asthe resulting three-dimensional fat crystal network along with the phase behaviour andstructural arrangements impacts on mechanical, rheological and melting properties and shelf-life (Hartel, 2001; Campos et al., 2002; Perez-Martınez et al., 2007). Parameters such ascooling rate and thermal history (i.e. crystallisation temperature and tempering) influencekinetics and ultimate physical properties of the crystallised fat systems.
9.5 CONCLUSION
Fat crystallisation behaviour during tempering of dark chocolate plays vital roles in defin-ing the structure, mechanical properties and appearance of products. Wide variations inmechanical properties and appearance occurred in products from different PS and tem-per regimes. PS was inversely related with texture and colour, with the greatest effectsnoted in hardness, stickiness and lightness at all temper regimes. Overtempering caused in-creases in product hardness, stickiness with reduced gloss and darkening of product surfaces.
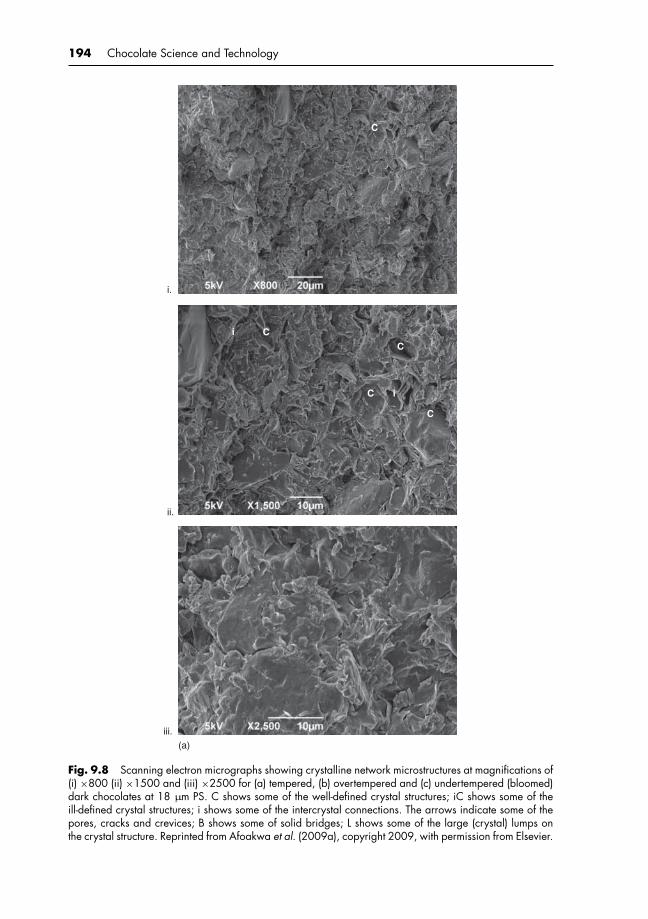
P1: KAE/UKS P2: KAEc09 BLBK244-Afoakwa January 23, 2010 7:37 Printer Name: Yet to Come
194 Chocolate Science and Technology
i.
ii.
iii.
(a)
C
C
C
i
C
Ci
Fig. 9.8 Scanning electron micrographs showing crystalline network microstructures at magnifications of(i) ×800 (ii) ×1500 and (iii) ×2500 for (a) tempered, (b) overtempered and (c) undertempered (bloomed)dark chocolates at 18 µm PS. C shows some of the well-defined crystal structures; iC shows some of theill-defined crystal structures; i shows some of the intercrystal connections. The arrows indicate some of thepores, cracks and crevices; B shows some of solid bridges; L shows some of the large (crystal) lumps onthe crystal structure. Reprinted from Afoakwa et al. (2009a), copyright 2009, with permission from Elsevier.
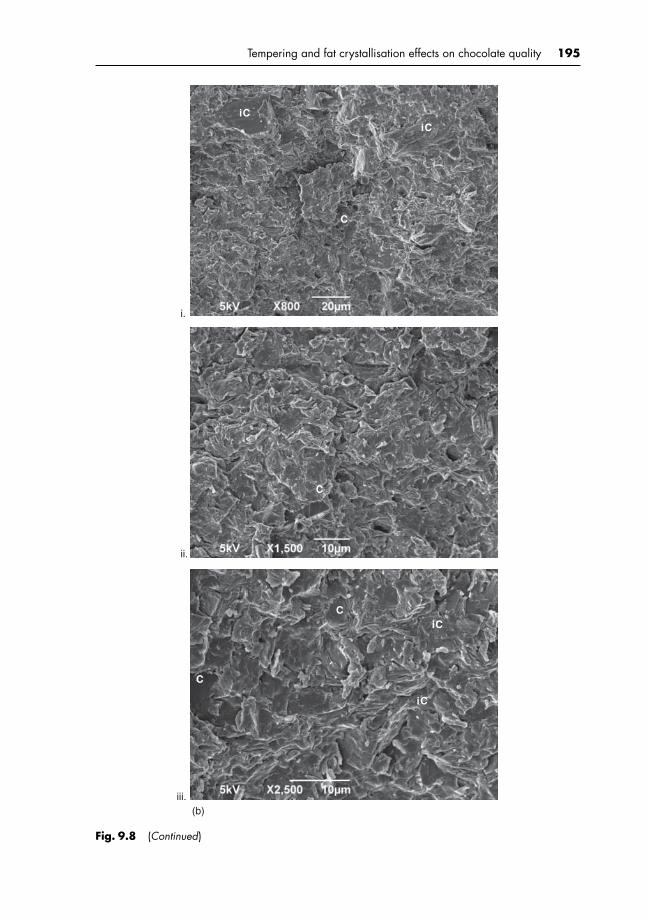
P1: KAE/UKS P2: KAEc09 BLBK244-Afoakwa January 23, 2010 7:37 Printer Name: Yet to Come
Tempering and fat crystallisation effects on chocolate quality 195
C
C
iCiC
C
C
iC
iC
i.
ii.
iii.(b)
Fig. 9.8 (Continued)

P1: KAE/UKS P2: KAEc09 BLBK244-Afoakwa January 23, 2010 7:37 Printer Name: Yet to Come
196 Chocolate Science and Technology
L
L
BB
B
L
L
i.
ii.
iii.(c)
Fig. 9.8 (Continued)

P1: KAE/UKS P2: KAEc09 BLBK244-Afoakwa January 23, 2010 7:37 Printer Name: Yet to Come
Tempering and fat crystallisation effects on chocolate quality 197
Undertempering induced fat bloom in products with consequential quality defects in texture,colour and surface gloss. Variations in PSD had no influence on crystallinity of chocolates,whether optimally, over- or undertempered. PS had a limited but significant direct relation-ship with certain melting parameters – Tonset, Tpeak and �Hmelt – independent of temper butsignificant inverse relationship with others – Tend and T index. Contrariwise, varying temperinfluenced crystallinity and chocolate melting properties (Tend, T index and �Hmelt). Under-tempering of chocolate resulted in widened CSD with significant changes in Tend, T index and�Hmelt. Overtempering caused moderate increases in CSD, with significant effects on Tend,T index and �Hmelt, but no changes were noted in Tonset, or Tpeak. Fat–sugar melting profileswere similar in all chocolates independent of PS and temper regime.
Stereoscopic binocular micrographs revealed clear variations in surface and internal crys-tal network structure and interparticle interactions among optimally tempered, overtemperedand undertempered (bloomed) samples. Blooming caused whitening of both surface andinternal periphery of products with consequential effects on texture and appearance. Elec-tron micrographs showed an even spatial distribution of numerous small stable β-polymorphcrystals in a network with well-defined interparticle connections in optimally temperedchocolate. With overtempered chocolate there were large numbers of very small crystals in anetwork with similar well-defined particle-to-particle connections resulting from formationof a stable β-polymorph with early nucleation: the outcome was growth of seed crystals fromthe melt into submicron primary crystallites and a fat crystal network stabilised by van derWaals forces. Undertempering resulted in dissolution of a large number of small crystals, re-arrangement and recrystallisation into a small number of larger (lumps) fat crystals (Ostwaldripening). In this process, there were polymorphic transformation, nucleation and growthof new large crystals in a more stable polymorphic form with formation of solid bridges,with weak and fewer intercrystal connections within the chocolate structure. Attainment ofoptimal temper regime during tempering of dark chocolate is necessary for the achievementof premium-quality products and avoidance of defects in mechanical properties, appearanceand melting character.
P1: KAE/UKS P2: KAEc10 BLBK244-Afoakwa January 5, 2010 9:33 Printer Name: Yet to Come
10 Fat bloom formation and developmentin chocolates
10.1 SUMMARY AND INDUSTRIAL RELEVANCE
Fat bloom development and associated changes in microstructure, texture, appearance andmelting properties were studied. Dark chocolates varying in particle size (PS) (D90 of 18,25, 35 and 50 µm) were processed and pre-crystallised to undertemper regime. Bloomwas induced by storing products under ambient conditions (18 ± 2◦C, relative humidity50%), and changes in texture, surface whiteness, gloss and melting properties were eval-uated on cooling and after every 24 hours in storage until reaching asymptotic values.Microstructure of products was characterised during blooming using stereoscopic binocularmicroscopy. Measurements on texture and surface whiteness showed initial rapid increaseswith consequential reductions in gloss within the first 96 hours, followed by gradually de-creasing gradient until reaching asymptotic levels. Storage influenced melting properties(Tonset, Tend, Tpeak and �Hmelt) in products causing polymorphic transformation from βIVto βVI within 72 hours. Micrographs showed similar surface crystalline network struc-ture and interparticle interactions among products from different PS after tempering, andbloom initiation occurred within 24 hours in storage, resulting in appearance of both liq-uid and unstable fat on the surface of products. The unstable fat then recrystallised duringstorage into more stable polymorphs and crystal growth was promoted by Ostwald ripen-ing (larger crystals growing at the expense of smaller ones), with the appearance of whitecrystalline structure, which spread gradually throughout the chocolate mass after 96 hours.Products containing the largest PS (50 µm) showed the fastest fat bloom rate, with thesmallest PS (18 µm) the least, attributed mainly to hydrodynamic forces by capillary ac-tion. It was hypothesised that fat bloom development was initiated by capillarity, followedby growth of recrystallised fat by diffusion across the entire chocolate mass until fullybloomed.
10.2 INTRODUCTION
Fat crystallisation in chocolates is a complex process induced by tempering (pre-crystallisation) during manufacture. The process promotes crystallisation of triacylglycerols(TAGs) in cocoa butter to effect formation of a large number of small crystals of the βVpolymorph (2–3% of the initial fat content) that act as seeds for further crystal growth. Thebulk of the TAGs are deposited on the seeds during cooling, forming crystals and eventuallyan interconnected fat crystal network. The crystal network organisation and the polymor-phic state of the TAG crystals as affected by the crystallisation conditions are major factors
P1: KAE/UKS P2: KAEc10 BLBK244-Afoakwa January 5, 2010 9:33 Printer Name: Yet to Come
Fat bloom formation and development in chocolates 199
determining the microstructure, rheological and textural properties of the crystallised TAGsystems (Narine & Marangoni, 1999; Herrera & Hartel, 2000; Toro-Vazquez et al., 2004;Perez-Martınez et al., 2007), the stability of which depends on the temper regime attainedby the crystals during pre-crystallisation.
Cocoa butter, the only fat phase in dark chocolates, is composed mainly of TAGs of the1,3-disaturated-2-oleoylglycerol-type with three fatty acids accounting for almost 95% of theattachments to the glycerol backbone. These fatty acids and their approximate proportions areoleic acid (C 18:1, 35%), stearic acid (C 18:0, 34%) and palmitic acid (C 16:0, 26%) (Beckett,2008). Main TAGs in cocoa butter are palmitoyl-oleoyl-palmitoyl (POP), palmitoyl-oleoyl-stearoyl (POS) and stearoyl-oleoyl-stearoyl (SOS), according to the esterification positionof fatty acids in the glycerol molecule. Cocoa butter can exist in six polymorphic forms ofwhich the β Forms V and VI are the most stable. Form V predominates in well-temperedchocolate and slowly transforms into Form VI, during prolonged storage of overtemperedchocolate with the physical appearance of fat bloom (Lipp & Anklam, 1998; Talbot, 1999;Aguilera et al., 2004; Segall et al., 2005).
Fat bloom in chocolate products is a major quality defect in modern confectionery industry.This physical phenomenon is manifested by the appearance of whitish haze on the surfaceof chocolates due to recrystallisation of cocoa butter when chocolate is either insufficientlytempered or exposed to high temperatures during storage and/or distribution in supply chain,depriving it from its smooth appearance, bright colour and gloss (Hartel, 1999; Beckett,2008). Several studies have attributed this to fat migration, mainly induced by insufficientformation of stable polymorphs (Form V) in cocoa butter during tempering, polymorphiccrystalline transition from Form V to VI during prolonged storage of products, meltingand recrystallisation of low-melting-point crystals without retempering during fluctuatingstorage temperatures, and in composite structures such as chocolates with nut-based filings,consequently impacting on microstructure, visual appearance and textural properties (Hartel,1999; Talbot, 1999; Briones & Aguilera, 2005; Lonchampt & Hartel, 2006; Afoakwa et al.,2008e; Beckett, 2008).
Many hypotheses and mechanisms have been published to explain the kinetics of fat mi-gration in different chocolate and confectionery products, most of which have been attributedto diffusion and capillary rise due to the particulate nature of chocolate structure (Zieglederet al., 1996; Miquel et al., 2001; Ghosh et al., 2002; Aguilera et al., 2004; Quevedo et al.,2005). Ghosh et al. (2002) explained that the driving force for diffusion was assumed to beaffected by the difference in liquid fat content, but recently diffusion has been attributed to agradient in TAG concentration within some domains of the product, with the explanation thatdifferences in TAGs are less likely to occur in chocolate made with a homogeneous liquidphase of cocoa butter but may occur in composite structures. Although the physical changesassociated with fat bloom is well known, available information on the mechanism of thecrystallisation phenomenon is confusing, and on the actual complex crystal structures thatare formed and the rate of bloom development with products from different PSs as occurs inundertempered dark chocolate systems remain unclear.
To enhance understanding of the mechanism of fat bloom development in dark chocolatesystems, it is important to evaluate the structure–appearance relationships leading to theformation and development of fat bloom in products during post-processing handling andstorage. Thus, the objectives of this work were to investigate changes in microstructure,appearance, texture and melting characteristics during blooming in undertempered darkchocolates varying in PS distribution and to explain the possible mechanism leading to fatbloom development in products.

P1: KAE/UKS P2: KAEc10 BLBK244-Afoakwa January 5, 2010 9:33 Printer Name: Yet to Come
200 Chocolate Science and Technology
10.3 MATERIALS AND METHODS
10.3.1 Materials
Cocoa liquor of Central West African origin was obtained from Cargill Cocoa ProcessingCompany (York, UK); sucrose (pure extra-fine granulated) from British Sugar Company(Peterborough, UK); pure prime-pressed cocoa butter and soy lecithin from ADM CocoaLimited (Koog aan de Zaan, the Netherlands) and Unitechem Company Ltd (Tianjin, China),respectively.
The recipe, formulation and production of samples have been described previously inChapter 7, Section 7.3.1, but limited only to products containing 35% fat and 0.5% lecithin.Chocolates were formulated with total fat of 35% (w/w) from sucrose, cocoa liquor, cocoabutter and lecithin. Experimental samples (5 kg batch for each formulation) were produced bymixing sucrose (40.8%) and cocoa liquor (53.7%) in a Crypto Peerless mixer (Model K175,Crypto Peerless Ltd, Birmingham, UK) at low speed for 2 minutes and then at high speedfor 3 minutes, then refined using a three-roll refiner (Model SDX 600, Buhler Ltd, CH-9240Uzwil, Switzerland) to a specified PS (D90: 18 ± 1 µm, 25 ± 1 µm, 35 ± 1 µm and 50 ±1 µm) conducting PS analysis, during refining, to ensure D90 values. The refined chocolateswere melted at 50–55◦C for 24 hours and the chocolate mass was conched in a Lipp Conche(Model IMC-E10, Boveristr 40-42, D-68309, Mannhein, Germany) at low speed for 3.5 hoursat 60◦C. Lecithin (0.5%) and cocoa butter (5%) were added and then conched at high speedfor 30 minutes to affect adequate mixing and liquefaction. Samples were kept in sealedplastic containers at ambient temperature (20–22◦C), and moisture and fat contents weredetermined using Karl Fischer and Soxhlet methods (ICA, 1988, 1990).
10.3.2 Determination of particle size distribution
A MasterSizerR©
Laser Diffraction Particle Size Analyzer equipped with MS 15 sample pre-sentation unit (refractive index 1.590) (Malvern Instrument Ltd, Malvern, England) was used.About 0.2 g of refined dark chocolate was dispersed in vegetable oil (refractive index 1.450)at ambient temperature (20 ± 2◦C) until an obscuration of 0.2 was obtained. The samplewas placed under ultrasonic dispersion for 2 minutes to ensure that particles were inde-pendently dispersed and thereafter maintained by stirring during the measurement. Sizedistribution was quantified as the relative volume of particles in size bands presented as sizedistribution curves (Malvern MasterSizer
R©Micro Software v 2.19). particle size distribution
(PSD) parameters obtained included specific surface area, largest PS (D90), mean particlevolume (D50), smallest PS (D10) and Sauter mean diameter (D[3,2]).
10.3.3 Tempering experiment
Samples were incubated at 50◦C for 4 hours for melting and tempered using Aasted Mikrovertlaboratory continuous three-stage tempering unit (Model AMK 10, Aasted Mikroverk A/S,Farum, Denmark). Chocolate was pumped through the multistage units and a worm screwdrove the product through the heat exchangers. Sensors located at specific points in theequipment measured the temperature of both the chocolate and the coolant fluid at each stage.Based on our earlier work on modelling temperature controls to study tempering behaviour(Afoakwa et al., 2008g), the temperature of each of the coolant fluids (Zones 1, 2, 3)were thus set as 26, 24, 32◦C, respectively, for attaining the undertempered regime. The
P1: KAE/UKS P2: KAEc10 BLBK244-Afoakwa January 5, 2010 9:33 Printer Name: Yet to Come
Fat bloom formation and development in chocolates 201
degree of pre-crystallisation was measured using a computerised tempermeter (Exotherm7400, Systech Analytics, Neuchatel, Switzerland) and a built-in algorithm provided thetempering curves and temper readings in chocolate temper index (slope), corresponding toundertemper (slope 1.0). The principle of this method has been described by Nelson (1999).Chocolates were moulded using plastic moulds – 80 mm length, 20 mm breadth and 8 mmheight – allowed to cool in a refrigerator (12◦C) for 2 hours before demoulding onto plastictrays. Bloom was induced by storing the products under ambient condition (18 ± 2◦C, relativehumidity 50%), and samples evaluated on cooling and after every 24 hours in storage untilreaching asymptotic values. Triplicate measurements were conducted and the mean valueswere recorded.
10.3.4 Texture measurements
Hardness of products was measured using TA-HD Plus Texture Analyzer with a penetrationprobe (needle P/2) attached to an extension bar and a 50-kg load cell and a platform asreported by Afoakwa et al. (2008e). Maximum penetration forces through a sample (80 × 20mm, depth 8 mm) were determined with eight replications at a pre-speed of 1.0 mm/second,test of 2.0 mm/second, post-speed of 10.0 mm/second, penetrating 6 mm at 20◦C, convertingmean values of the penetration force exerted by the 50 kg load cell into hardness (g) usingXT.RA Dimension, Exponent 32 software (Stable Micro Systems, Godalming, Surrey, UK)as shown in Figure 7.3(b).
10.3.5 Surface colour and gloss measurements
HunterLab MiniscanTM XE Colorimeter Model 45/0 LAV (Hunter Associates Inc., Reston,VA, USA) calibrated with white ceramic reference standard was used. Colour images ofchocolate surfaces were converted into XYZ tristimulus values, which were further convertedto CIELAB system: L*, luminance ranging from 0 (black) to 100 (white), and a* (green tored) and b* (blue to yellow) with values from −120 to +120. Mean surface whiteness (L*
values) from five replicate measurements and standard deviations were reported.Gloss of chocolate surface was measured using the multiple angle Tricor Gloss meter
(805A/806H Gloss System, Elgin, IL, USA). Reflectance was measured at an incidencelight angle of 85◦ from the normal to the chocolate surface, in accordance with AmericanSociety for Testing and Materials (ASTM) method D523. A polished black glass plate with arefractive index of 1.567 was used as standard surface and given a gloss value of 200 (ASTM,1995). Gloss was reported as gloss units (GU) based on determinations (in triplicate) at sixpositions along a chocolate sample. As a reference, a surface with a gloss value less than10 GU is considered a low-gloss surface (BYK, 1997; Briones et al., 2006).
10.3.6 Determination of melting properties
Differential scanning calorimeter (DSC Series 7, Perkin Elmer Pyris, Norwalk, CT, USA)equipped with a thermal analysis data station was calibrated using indium and octadecane ata scan rate of 5◦C/minute using an aluminium pan as reference. Samples (∼5 mg) wereloaded into 40 µL capacity pans with holes, which were sealed with lids using a sample press.Pans were heated at 5◦C/minute from 15 to 55◦C in an N2 stream. Onset temperature (Tonset),peak temperature (Tpeak), end temperature (Tend) and enthalpy of melting (�Hmelt) were
P1: KAE/UKS P2: KAEc10 BLBK244-Afoakwa January 5, 2010 9:33 Printer Name: Yet to Come
202 Chocolate Science and Technology
calculated automatically by the software. Each sample was analysed in triplicate, and meanvalues and standard deviations were reported.
10.3.7 Microstructural determinations
Chocolate samples were characterised using stereoscopic binocular microscope (Nikon,SMZ-2T, Tokyo, Japan) equipped with a variable removable lens. Micrographs (colouredimages) were captured using a digital camera (Model 2.1 Rev 1, Polaroid Corporation, NY,USA) and observed using Adobe Photoshop (Version CS2, Adobe Systems Inc., NJ, USA).Triplicate experiments were conducted capturing six images per sample, and micrographsrepresenting the surface of samples during storage were captured and presented in JPEG(Joint Photographic Experts Group, a standard for compressing digital photographic images)format of high-resolution and superfine quality. Samples of products containing 50 µm werealso sectioned (cut) into two pieces after every 24 hours during blooming using a knife, andthe internal microstructures were observed.
10.3.8 Experimental design and statistical analysis
Two experimental variables comprising storage time (on cooling until reaching asymptoticlevels) and PSD (D90) 18, 25, 35 and 50 µm were used. Other variables including refinertemperature and pressure, conching time and temperature, were held constant. StatgraphicsPlus 4.1 (Graphics Software System, STCC, Inc., Rockville, MD, USA) examined texturalproperties (hardness) and appearance (L* and gloss) and melting properties (Tonset, Tend,�Hmelt) using the two-way analysis of variance (ANOVA), and multiple comparison teststo determine effects of factors and their interactions. Tukey multiple comparisons (95%significance level) determined differences between levels. All experiments were conductedin triplicates and the mean values were reported.
10.4 RESULTS AND DISCUSSION
10.4.1 Particle size distribution of dark chocolates
These findings (Fig. 7.1), previously reported in Section 7.4.1, show volume histogramsconsisting of narrow (18 µm PS) and wide (25 µm PS) bimodal, and narrow (35 µm PS) andwide (50 µm PS) multimodal size distributions. This PSD range, 18–50 µm, using D90 values(>90% finer) covers optimum minimum and maximum sizes with direct effects on textureand sensory character in chocolate manufacture (Ziegler & Hogg, 1999; Beckett, 2008). Datafrom the PSD as previously described (Afoakwa et al., 2008b) showed variations in specificsurface area, mean particle volume D(v,50), Sauter mean (D[3,2]) and mean particle diameter(D[4,3]) with increasing D90 PSs. Specific surface area (SSA) was inversely correlated withthe different components of PSD. Similar inverse relationships of specific surface area withall the other components of PSD have been reported (Ziegler & Hogg, 1999). Beckett (1999)concluded that the largest PS and specific surface area of solids are the two key parameters forchocolate manufacture. The former determines chocolate coarseness and textural character,the latter with desirable flow properties. Fat contents of the products were 35 ± 1% andmoisture within the range of 0.90–0.98%.
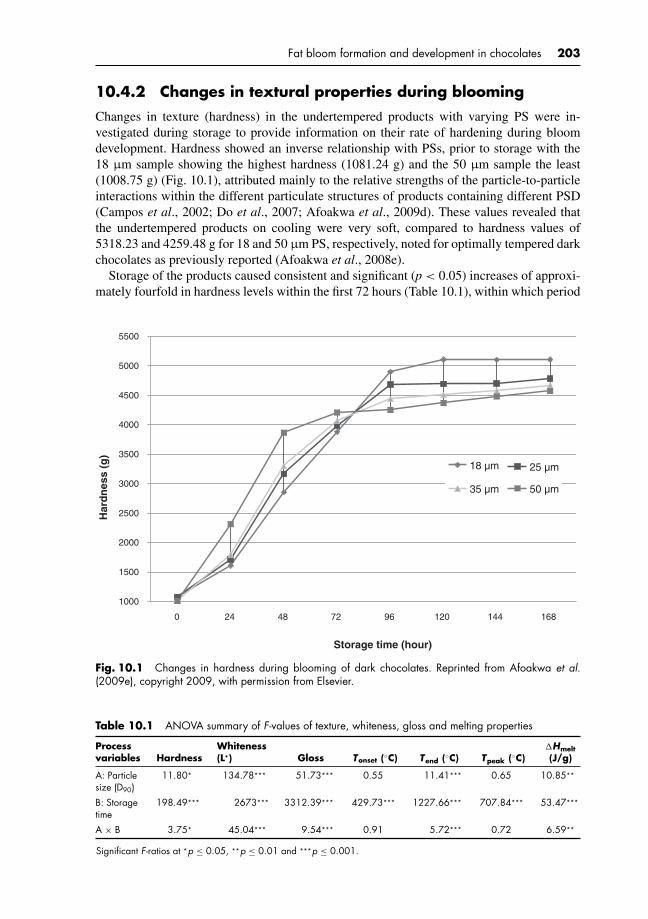
P1: KAE/UKS P2: KAEc10 BLBK244-Afoakwa January 5, 2010 9:33 Printer Name: Yet to Come
Fat bloom formation and development in chocolates 203
10.4.2 Changes in textural properties during blooming
Changes in texture (hardness) in the undertempered products with varying PS were in-vestigated during storage to provide information on their rate of hardening during bloomdevelopment. Hardness showed an inverse relationship with PSs, prior to storage with the18 µm sample showing the highest hardness (1081.24 g) and the 50 µm sample the least(1008.75 g) (Fig. 10.1), attributed mainly to the relative strengths of the particle-to-particleinteractions within the different particulate structures of products containing different PSD(Campos et al., 2002; Do et al., 2007; Afoakwa et al., 2009d). These values revealed thatthe undertempered products on cooling were very soft, compared to hardness values of5318.23 and 4259.48 g for 18 and 50 µm PS, respectively, noted for optimally tempered darkchocolates as previously reported (Afoakwa et al., 2008e).
Storage of the products caused consistent and significant (p < 0.05) increases of approxi-mately fourfold in hardness levels within the first 72 hours (Table 10.1), within which period
1000
1500
2000
2500
3000
3500
4000
4500
5000
5500
0 24 48 72 96 120 144 168
Storage time (hour)
Har
dn
ess
(g)
18 µm 25 µm
35 µm 50 µm
Fig. 10.1 Changes in hardness during blooming of dark chocolates. Reprinted from Afoakwa et al.(2009e), copyright 2009, with permission from Elsevier.
Table 10.1 ANOVA summary of F-values of texture, whiteness, gloss and melting properties
Processvariables Hardness
Whiteness(L*) Gloss Tonset (◦C) Tend (◦C) Tpeak (◦C)
�Hmelt(J/g)
A: Particlesize (D90)
11.80* 134.78*** 51.73*** 0.55 11.41*** 0.65 10.85**
B: Storagetime
198.49*** 2673*** 3312.39*** 429.73*** 1227.66*** 707.84*** 53.47***
A × B 3.75* 45.04*** 9.54*** 0.91 5.72*** 0.72 6.59**
Significant F-ratios at *p ≤ 0.05, **p ≤ 0.01 and ***p ≤ 0.001.
P1: KAE/UKS P2: KAEc10 BLBK244-Afoakwa January 5, 2010 9:33 Printer Name: Yet to Come
204 Chocolate Science and Technology
over 90% of the textural changes that occurred during the bloom development of the productswere noted at all PSs, before attaining asymptotic levels where only gradual increases werenoted. Products with the largest PS (50 µm) showed the fastest increase in hardness levelswithin 72 hours of storage, followed by the 35 µm PS, and then 25 µm PS, with thosecontaining 18 µm PS showing the least increases (Fig. 10.1), an indication that the rate ofstructural changes during blooming is directly related to the magnitude of product PSs (D90).
However, this hardening trend was reversed between 72 and 96 hours in storage with the18 µm PS sample attaining the highest hardness values and the 50 µm PS the least after96 hours, remaining unchanged at the end of the storage period where asymptotic values werenoted. The observed textural changes were suspected to be caused by the restructuring andrecrystallisation of unstable fat crystals in the undertempered chocolates inducing bloomingin products, and thus increasing their hardness levels.
Variations in microstructure regarding the structural arrangements of particles and inter-particle network in products from different PSD accounted for the varying textural changesduring bloom development. Previous work on microstructure of molten dark chocolate(Afoakwa et al., 2009d) showed that at higher (35%) fat content, products with larger PS(50 µm) were less flocculated and contained larger pores and crevices between particles filledwith fat, relative to those with smaller PS (18 µm), which tended to be more flocculated andaggregated with higher interparticle network interaction. The presence of these larger poresand crevices in products with 50 µm PS was suspected to facilitate movement of recrys-tallised fat through them onto the surface of the product, suspected to be by capillary action.Aguilera et al. (2004) noted that capillary penetration into pores is a spontaneous processdriven by an interfacial pressure gradient, and may occur at two pore scales in chocolates:that of the interparticle channels when the migrating mass is the total fat phase (liquid andcrystals) and that of capillaries between the fat crystals for the liquid fat. The flocculatednetwork provided by the higher inter-particle interaction in the 18 µm PS product might haveinterfered with the migration of recrystallised fat onto the product surface and consequentlyreducing their rate of bloom development.
10.4.3 Changes in appearance (surface whiteness and gloss)during blooming
Significant (p < 0.001) and linear effects on surface whiteness (L*) were recorded withincreasing storage time, noticeable at all PSs (Table 10.1). Prior to storage, whiteness ofproducts varied between 42.26 for 50 µm PS and 45.54 for the 18 µm PS, suggesting thatproducts with smaller PS (18 µm) appear lighter, decreasing consistently with increasingPS. This confirmed previous findings that chocolates with varying PSs differ in structureand particulate arrangements, influencing light scattering coefficients and thus appearance(Afoakwa et al., 2008e). Generally, storage induced blooming in products causing initialrapid increases in whiteness until reaching asymptotic levels after 96 hours, trends observedin all PSs (Fig. 10.2). Increases in whiteness from 45.54 to 82.46 and 42.26 to 87.62 werenoted in the 18 and 50 µm PS products, respectively, showing that over 95% of the change inwhiteness occurring during blooming of products took place within 96 hours after processing,rendering the products surface whitish in appearance. Similar increases in whiteness in fatbloomed chocolates have been reported (Lonchampt & Hartel, 2004, Altimiras et al., 2007).Hartel (1999) attributed this phenomenon to recrystallisation of fats, causing changes inlight scattering and dispersion effects on small surface fat crystals (≥5 µm), consequentlyimpacting on their appearance attributes.
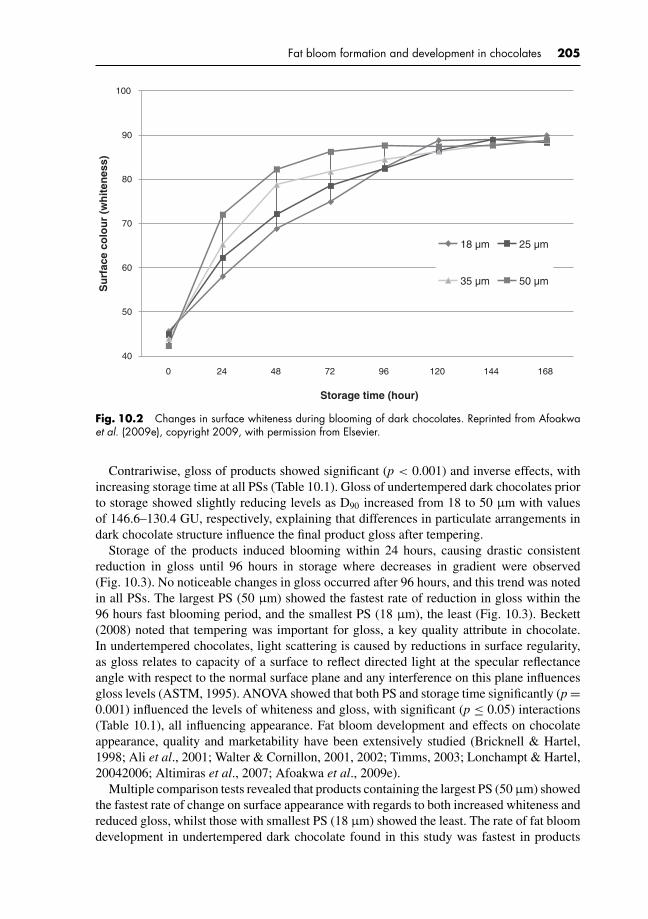
P1: KAE/UKS P2: KAEc10 BLBK244-Afoakwa January 5, 2010 9:33 Printer Name: Yet to Come
Fat bloom formation and development in chocolates 205
40
50
60
70
80
90
100
0 24 48 72 96 120 144 168
Storage time (hour)
Su
rfac
e co
lou
r (w
hit
enes
s)
18 µm 25 µm
35 µm 50 µm
Fig. 10.2 Changes in surface whiteness during blooming of dark chocolates. Reprinted from Afoakwaet al. (2009e), copyright 2009, with permission from Elsevier.
Contrariwise, gloss of products showed significant (p < 0.001) and inverse effects, withincreasing storage time at all PSs (Table 10.1). Gloss of undertempered dark chocolates priorto storage showed slightly reducing levels as D90 increased from 18 to 50 µm with valuesof 146.6–130.4 GU, respectively, explaining that differences in particulate arrangements indark chocolate structure influence the final product gloss after tempering.
Storage of the products induced blooming within 24 hours, causing drastic consistentreduction in gloss until 96 hours in storage where decreases in gradient were observed(Fig. 10.3). No noticeable changes in gloss occurred after 96 hours, and this trend was notedin all PSs. The largest PS (50 µm) showed the fastest rate of reduction in gloss within the96 hours fast blooming period, and the smallest PS (18 µm), the least (Fig. 10.3). Beckett(2008) noted that tempering was important for gloss, a key quality attribute in chocolate.In undertempered chocolates, light scattering is caused by reductions in surface regularity,as gloss relates to capacity of a surface to reflect directed light at the specular reflectanceangle with respect to the normal surface plane and any interference on this plane influencesgloss levels (ASTM, 1995). ANOVA showed that both PS and storage time significantly (p =0.001) influenced the levels of whiteness and gloss, with significant (p ≤ 0.05) interactions(Table 10.1), all influencing appearance. Fat bloom development and effects on chocolateappearance, quality and marketability have been extensively studied (Bricknell & Hartel,1998; Ali et al., 2001; Walter & Cornillon, 2001, 2002; Timms, 2003; Lonchampt & Hartel,20042006; Altimiras et al., 2007; Afoakwa et al., 2009e).
Multiple comparison tests revealed that products containing the largest PS (50 µm) showedthe fastest rate of change on surface appearance with regards to both increased whiteness andreduced gloss, whilst those with smallest PS (18 µm) showed the least. The rate of fat bloomdevelopment in undertempered dark chocolate found in this study was fastest in products
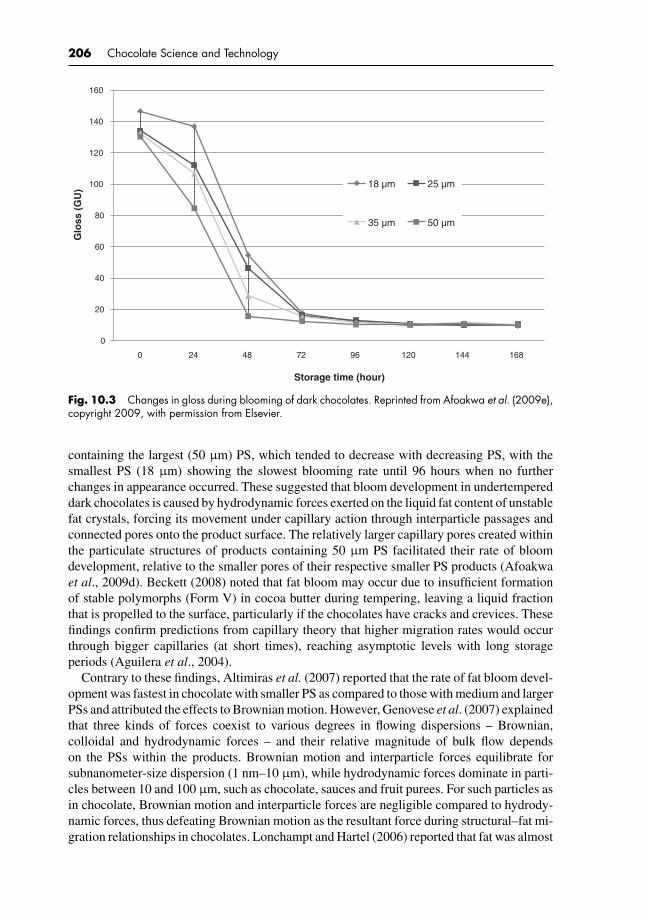
P1: KAE/UKS P2: KAEc10 BLBK244-Afoakwa January 5, 2010 9:33 Printer Name: Yet to Come
206 Chocolate Science and Technology
0
20
40
60
80
100
120
140
160
0 24 48 72 96 120 144 168
Storage time (hour)
Glo
ss (
GU
) 18 µm 25 µm
35 µm 50 µm
Fig. 10.3 Changes in gloss during blooming of dark chocolates. Reprinted from Afoakwa et al. (2009e),copyright 2009, with permission from Elsevier.
containing the largest (50 µm) PS, which tended to decrease with decreasing PS, with thesmallest PS (18 µm) showing the slowest blooming rate until 96 hours when no furtherchanges in appearance occurred. These suggested that bloom development in undertempereddark chocolates is caused by hydrodynamic forces exerted on the liquid fat content of unstablefat crystals, forcing its movement under capillary action through interparticle passages andconnected pores onto the product surface. The relatively larger capillary pores created withinthe particulate structures of products containing 50 µm PS facilitated their rate of bloomdevelopment, relative to the smaller pores of their respective smaller PS products (Afoakwaet al., 2009d). Beckett (2008) noted that fat bloom may occur due to insufficient formationof stable polymorphs (Form V) in cocoa butter during tempering, leaving a liquid fractionthat is propelled to the surface, particularly if the chocolates have cracks and crevices. Thesefindings confirm predictions from capillary theory that higher migration rates would occurthrough bigger capillaries (at short times), reaching asymptotic levels with long storageperiods (Aguilera et al., 2004).
Contrary to these findings, Altimiras et al. (2007) reported that the rate of fat bloom devel-opment was fastest in chocolate with smaller PS as compared to those with medium and largerPSs and attributed the effects to Brownian motion. However, Genovese et al. (2007) explainedthat three kinds of forces coexist to various degrees in flowing dispersions – Brownian,colloidal and hydrodynamic forces – and their relative magnitude of bulk flow dependson the PSs within the products. Brownian motion and interparticle forces equilibrate forsubnanometer-size dispersion (1 nm–10 µm), while hydrodynamic forces dominate in parti-cles between 10 and 100 µm, such as chocolate, sauces and fruit purees. For such particles asin chocolate, Brownian motion and interparticle forces are negligible compared to hydrody-namic forces, thus defeating Brownian motion as the resultant force during structural–fat mi-gration relationships in chocolates. Lonchampt and Hartel (2006) reported that fat was almost

P1: KAE/UKS P2: KAEc10 BLBK244-Afoakwa January 5, 2010 9:33 Printer Name: Yet to Come
Fat bloom formation and development in chocolates 207
non-existence in untempered (bloomed) chocolate, possessing melting enthalpy (�Hfat) be-ing about tenfold smaller than that obtained for optimally tempered chocolate, concludingthat the whitish spots in improperly tempered (bloomed) chocolates were mainly composedof sugar crystals and cocoa powder, and nearly devoid of fat. Kinta and Hatta (2005) alsoreported that the presence of fat components in untempered (bloomed) dark chocolate isminimal and suggested that the mechanism of bloom development in bloomed chocolateinvolves phase separation associated with the growth of xenomorphic fat crystals. Thesereported structural changes in components in bloomed chocolate require further studies intotheir microstructure to clarify the changes during bloom formation, blooming rates and theirassociated mechanisms.
Multivariate regression and correlation analyses were conducted between changes in tex-ture, surface whiteness and gloss to help establish the structural–appearance relationshipsduring blooming of undertempered dark chocolates. The output showed the results of fittinglinear models to describe the relationship between surface whiteness and hardness, and glossand hardness during blooming are as follows:
Whiteness = 38.9304 + 0.0104 × Hardness (10.1)
Gloss = 166.534 − 0.0342 × Hardness (10.2)
Good fit of the models was confirmed graphically by scatter plots, in which high re-gression coefficient of determination, R2 = 94.0% (p = 0.001), for whiteness and hard-ness with very high correlation coefficient, R = 0.96 (p = 0.001), and also R2 = 92.5%(p = 0.001) for gloss and hardness with very high correlation coefficient, R = −0.97(p = 0.001), were found between the predicted and experimental values (Fig. 10.4). Theseexplained that during bloom development in undertempered dark chocolates, changes intextural properties (hardness) could be used to predict the rate of change in surface whitenessand gloss reduction (blooming) in products. These developments are important in bringinggreater understanding on structure–appearance relationships during blooming of dark choco-lates and would be useful for further studies on the prevention of fat bloom in chocolates.
10.4.4 Changes in melting behaviour during blooming
Typical DSC thermograms used for characterising the melting properties of the undertem-pered dark chocolates during blooming are as shown in Figure 10.5. All the samples exhibitedsimilar distinct single endothermic transitions between 15 and 55◦C, the range expected forchocolate melting profiles. Data from the DSC on Tonset, Tend, Tpeak and �Hmelt in relationto storage time and PSD (Table 10.2) analysed by ANOVA and multiple comparison testsshowed highly significant differences (p < 0.001) of Tonset, Tpeak, Tend and �Hmelt for dif-fering storage time (Table 10.2). The differences in storage time yielded mean Tend values ofapproximately 28.7, 32.4, 33.0, 35.3 and 35.7◦C, respectively, after 0, 24, 48, 72 and 96 hoursin storage. These observations suggest that bloom development in undertempered chocolatesignificantly influences their melting temperatures as a result of polymorphic transformationsof fat crystals within the products. The changing Tend values of the samples revealed that thecrystallites in the undertempered products were in βIV polymorph (∼28.7◦C) on cooling,and transformed to βV (∼32.4◦C) within 24 hours in storage, with further transformationto the more stable βVI polymorph (∼35.5◦C) after 72 hours in storage, stabilising at thatpolymorphic status until fully bloomed. This finding is very significant as it reveals that
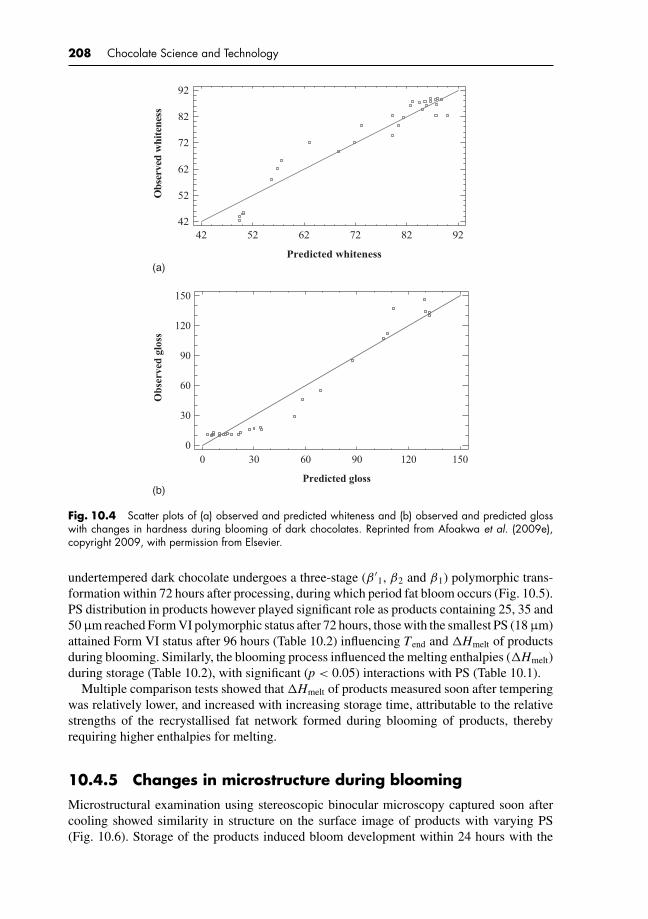
P1: KAE/UKS P2: KAEc10 BLBK244-Afoakwa January 5, 2010 9:33 Printer Name: Yet to Come
208 Chocolate Science and Technology
Predicted whiteness
Ob
serv
ed w
hit
enes
s
42 52 62 72 82 92
(a)
(b)
42
52
62
72
82
92
Predicted gloss
Ob
serv
ed g
loss
0 30 60 90 120 1500
30
60
90
120
150
Fig. 10.4 Scatter plots of (a) observed and predicted whiteness and (b) observed and predicted glosswith changes in hardness during blooming of dark chocolates. Reprinted from Afoakwa et al. (2009e),copyright 2009, with permission from Elsevier.
undertempered dark chocolate undergoes a three-stage (β ′1, β2 and β1) polymorphic trans-
formation within 72 hours after processing, during which period fat bloom occurs (Fig. 10.5).PS distribution in products however played significant role as products containing 25, 35 and50 µm reached Form VI polymorphic status after 72 hours, those with the smallest PS (18 µm)attained Form VI status after 96 hours (Table 10.2) influencing Tend and �Hmelt of productsduring blooming. Similarly, the blooming process influenced the melting enthalpies (�Hmelt)during storage (Table 10.2), with significant (p < 0.05) interactions with PS (Table 10.1).
Multiple comparison tests showed that �Hmelt of products measured soon after temperingwas relatively lower, and increased with increasing storage time, attributable to the relativestrengths of the recrystallised fat network formed during blooming of products, therebyrequiring higher enthalpies for melting.
10.4.5 Changes in microstructure during blooming
Microstructural examination using stereoscopic binocular microscopy captured soon aftercooling showed similarity in structure on the surface image of products with varying PS(Fig. 10.6). Storage of the products induced bloom development within 24 hours with the

P1: KAE/UKS P2: KAEc10 BLBK244-Afoakwa January 5, 2010 9:33 Printer Name: Yet to Come
Fat bloom formation and development in chocolates 209
3
3.5
4
4.5
5
5.5
6
15 20 25 30 35 40 45 50 55Temperature (°C)
No
rmal
ised
hea
t fl
ow
en
do
up
(W
/g)
Fig. 10.5 Typical DSC thermograms showing changes in fat melting profile during blooming of darkchocolates with 25 µm PS. Reprinted from Afoakwa et al. (2009e), copyright 2009, with permission fromElsevier.
Table 10.2 Changes in melting properties during storage
Melting properties
Storagetime (hour)
Particle size(D90) (µm) Tonset (◦C) Tend (◦C) Tpeak (◦C) �Hmelt (J/g)
0 18 22.8 ± 0.3 28.9 ± 0.3 27.2 ± 0.2 35.66 ± 0.4225 22.9 ± 0.3 28.7 ± 0.2 27.4 ± 0.1 34.74 ± 0.3935 22.9 ± 0.4 28.6 ± 0.2 27.6 ± 0.2 34.56 ± 0.2550 22.8 ± 0.4 28.6 ± 0.4 27.4 ± 0.2 34.72 ± 0.63
24 18 25.1 ± 0.4 32.3 ± 0.3 31.7 ± 0.1 36.76 ± 0.6825 25.4 ± 0.3 32.4 ± 0.2 31.8 ± 0.2 37.17 ± 0.7135 25.3 ± 0.2 32.5 ± 0.4 31.8 ± 0.1 37.09 ± 0.4350 25.5 ± 0.4 32.4 ± 0.3 31.9 ± 0.2 38.26 ± 0.78
48 18 26.1 ± 0.2 32.3 ± 0.3 31.6 ± 0.1 37.72 ± 0.4225 26.2 ± 0.3 32.5 ± 0.2 31.4 ± 0.2 37.23 ± 0.3835 26.4 ± 0.4 33.2 ± 0.3 31.9 ± 0.1 38.31 ± 0.4550 26.5 ± 0.3 33.8 ± 0.4 32.3 ± 0.2 38.82 ± 0.48
72 18 27.7 ± 0.4 33.6 ± 0.3 32.1 ± 0.2 38.36 ± 0.2725 27.3 ± 0.2 35.5 ± 0.4 33.2 ± 0.1 39.27 ± 0.5435 27.6 ± 0.2 35.8 ± 0.3 33.6 ± 0.2 40.41 ± 0.0450 27.8 ± 0.2 36.4 ± 0.4 33.8 ± 0.1 40.37 ± 0.47
96 18 27.4 ± 0.2 35.2 ± 0.3 33.8 ± 0.2 40.63 ± 0.5225 27.7 ± 0.4 35.7 ± 0.2 33.7 ± 0.1 40.36 ± 0.4335 27.7 ± 0.2 35.8 ± 0.4 33.6 ± 0.2 41.07 ± 0.2650 27.9 ± 0.3 36.3 ± 0.3 33.7 ± 0.1 41.82 ± 0.75
Means ± standard deviation from triplicate analysis.
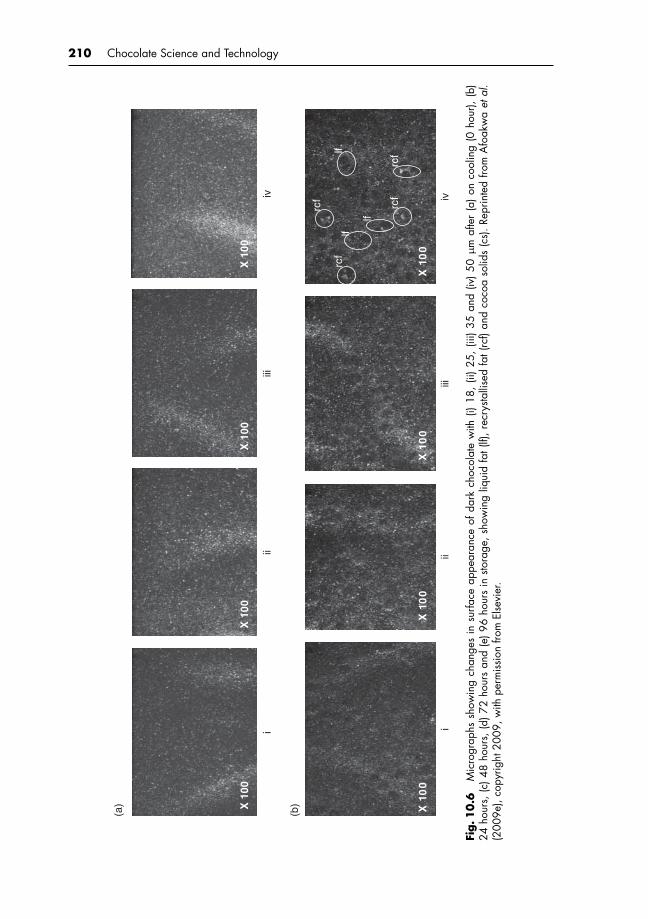
P1: KAE/UKS P2: KAEc10 BLBK244-Afoakwa January 5, 2010 9:33 Printer Name: Yet to Come
210 Chocolate Science and Technology
(a)
(b)
iii
iiiiv
X10
0X
100
X10
0X
100
lf
lf
rcf
rcf
rcf
rcf
lf
iii
iiiiv
X10
0X
100
X10
0X
100
Fig.1
0.6
Mic
rogr
aphs
show
ing
chan
ges
insu
rface
appe
aran
ceof
dark
choc
olat
ew
ith(i)
18,
(ii)
25,
(iii)
35an
d(iv
)50
µm
afte
r(a
)on
cool
ing
(0ho
ur),
(b)
24ho
urs,
(c)4
8ho
urs,
(d)7
2ho
urs
and
(e)9
6ho
urs
insto
rage
,sho
win
gliq
uid
fat(
lf),r
ecry
stalli
sed
fat(
rcf)
and
coco
aso
lids
(cs)
.Rep
rinte
dfro
mA
foak
wa
etal
.(2
009e
),co
pyrig
ht20
09,w
ithpe
rmis
sion
from
Else
vier
.
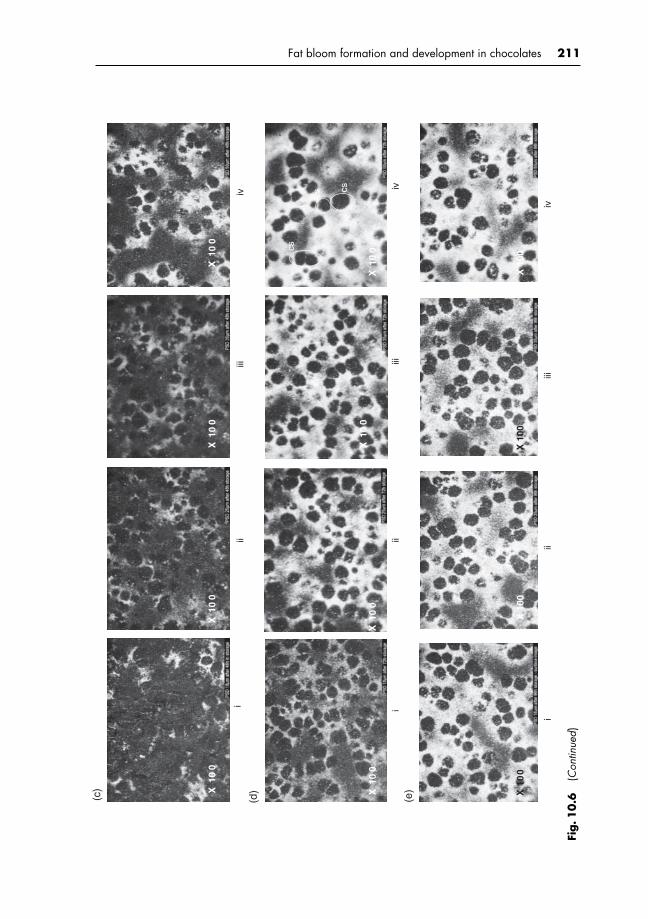
P1: KAE/UKS P2: KAEc10 BLBK244-Afoakwa January 5, 2010 9:33 Printer Name: Yet to Come
Fat bloom formation and development in chocolates 211
cs
cs
cs
(c)
(d)
iii
iiiiv
iii
iiiiv
X10
0X
1 00
X10
0X
100
X10
0X
100
X10
0X
100
(e)
i
X10
0
ii
X 1
00
iv
X 1
00
iii
X 1
00
Fig.1
0.6
(Con
tinue
d)
P1: KAE/UKS P2: KAEc10 BLBK244-Afoakwa January 5, 2010 9:33 Printer Name: Yet to Come
212 Chocolate Science and Technology
release and appearance of a colourless fluid and small spots of whitish haze suspected to beliquid and recrystallised fat, respectively, onto the product surfaces. These were more obviouson products containing 50 µm, with the 35, 25 and 18 µm showing only little apparent surfacechanges (Fig. 10.6(b)). Bomba (1993) and Beckett (2008) stated that liquid fat originated fromless stable crystals with lower melting points is likely to melt at fairly modest temperaturesduring chocolate blooming and is separated from the crystal structure migrating to theproduct surfaces. After 48 hours in storage, blooming was physically induced in all productswith the appearance of whitish crystal structures on their surfaces, growing across high–lowconcentration gradients with storage time and eventually spreading throughout the productsurface until 96 hours where no further changes on surface appearances were noticeable inall products, hence the conclusion that the products were fully bloomed. Microscopic imagescaptured after 120–168 hours in storage on products were not shown as they were similar tothose presented for 96 hours (Fig. 10.6).
The micrographs showed that the fastest rate of bloom was noticeable in samples containing50 µm PS, followed by the 35 and 25 µm PS, with those with 18 µm PS showing the least rateof bloom development, confirming the reported relative rates of changes in texture, whitenessand gloss during storage (Figs 10.1–10.3). The relatively larger capillary pores created withinthe particulate structures of products containing 50 µm PS were suspected to be the key factor,facilitating their rate of bloom development, relative to the smaller pores with decreasing PSin products. These differences were attributed to the variations in amounts of hydrodynamicforces exerted on the liquid fat content of the unstable fat crystals in the undertemperedchocolate, forcing them to move under capillary action through the interparticle passages andconnected pores onto the product surface. The unstable fat portion then recrystallised duringstorage into more stable polymorphs initiating the physical appearance of bloom (whitishhaze) in products and crystal growth was promoted by Ostwald ripening (recrystallisationand redistribution of larger crystals growing at the expense of smaller ones). Microstructuresshowing the internal periphery of the 50 µm samples revealed that during bloom developmentcrystal growth was noted to be facilitated by mass movement of recrystallised fat throughhigh–low concentration gradient by diffusion as the recrystallised fat redistributes itselfacross the entire chocolate mass during storage. The surface and internal periphery of thefully bloomed products showed whitish crystals which appear to be mixtures of fat andsugar components of the product, and distinct smaller brown spots made up of cocoa solids(Figs 10.6 and 10.7).
10.5 CONCLUSION
The rate of bloom development in undertempered dark chocolate was dependent on solids, PSdistribution and storage time. Hardness and surface whiteness showed initial rapid increaseswith parallel reductions in gloss in the first 96 hours, with subsequent decreases in rate untilasymptotic values were reached. Blooming was initiated in products within 24 hours andessentially complete by 96 hours. Changes during blooming were attributed primarily togrowth of new fat crystals within the structural network with changes in light reflections,yielding increases in surface whiteness and in hardness. From differential scanning calorime-try on melting properties values for Tonset, Tend, Tpeak and �Hmelt suggested polymorphictransformation from βIV to βV within 24 hours and further to βVI after 72 hours. Micro-graphs showed similar crystal network structure and interparticle interactions in chocolates of
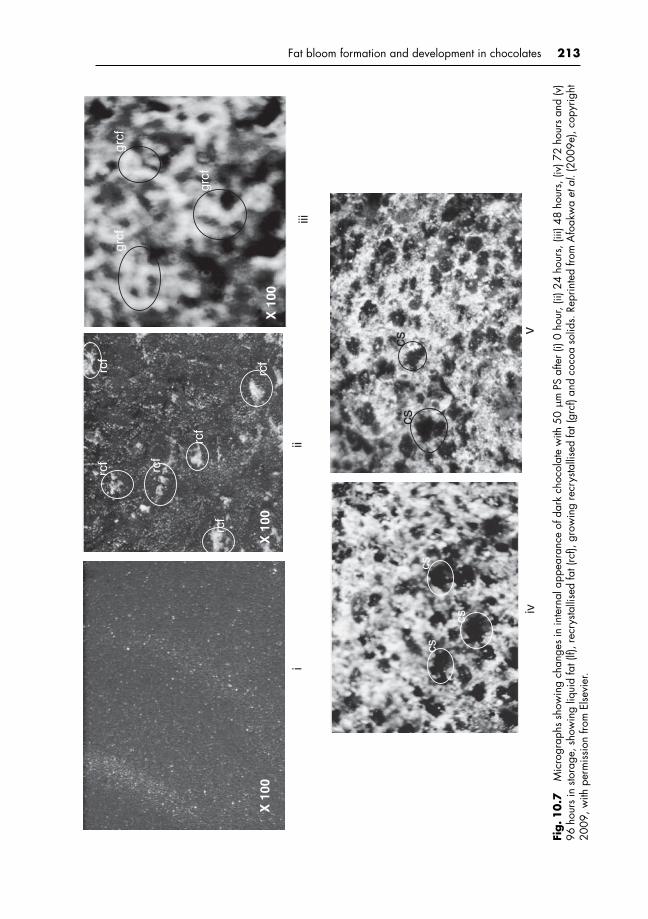
P1: KAE/UKS P2: KAEc10 BLBK244-Afoakwa January 5, 2010 9:33 Printer Name: Yet to Come
Fat bloom formation and development in chocolates 213
iii
iii
X 1
00X
100
X 1
00
rcf
rcf
rcf
rcf
rcf
rcf
grcf
grcf
grcf
iv
cscs
cs
v
cscs
Fig.1
0.7
Mic
rogr
aphs
show
ing
chan
ges
inin
tern
alap
pear
ance
ofda
rkch
ocol
ate
with
50µ
mPS
afte
r(i)
0ho
ur,(
ii)24
hour
s,(ii
i)48
hour
s,(iv
)72
hour
san
d(v
)96
hour
sin
stora
ge,s
how
ing
liqui
dfa
t(lf)
,rec
rysta
llise
dfa
t(rc
f),gr
owin
gre
crys
talli
sed
fat(
grcf
)and
coco
aso
lids.
Repr
inte
dfro
mA
foak
wa
etal
.(20
09e)
,cop
yrig
ht20
09,w
ithpe
rmis
sion
from
Else
vier
.

P1: KAE/UKS P2: KAEc10 BLBK244-Afoakwa January 5, 2010 9:33 Printer Name: Yet to Come
214 Chocolate Science and Technology
different PS immediately after tempering. Within 24 hours, liquid and unstable recrystallisedfat had appeared on surfaces with initiation of bloom. Unstable fat recrystallised duringstorage into more stable polymorphs and crystal growth was promoted by Ostwald ripening,with the appearance of white crystalline structure that had spread gradually throughout entirechocolate masses after 96 hours. Chocolate of largest PS (50 µm) showed most rapid fatbloom, smallest PS (18 µm) slowest, attributed mainly to hydrodynamic forces of capil-lary action. It was concluded that bloom development was initiated by movement of liquidand unstable fat onto product surfaces through capillarity created by hydrodynamic forceswithin the interparticle pores and crevices, followed by growth of new fat crystals promotedby diffusion gradients across the mass until chocolate was fully bloomed. Understandingfat bloom formation and development in dark chocolate has potential applications in newproduct development.
P1: KAE/UKS P2: KAEc11 BLBK244-Afoakwa January 5, 2010 8:12 Printer Name: Yet to Come
11 Matrix effects on flavour volatilescharacter and release in chocolates
11.1 SUMMARY AND INDUSTRIAL RELEVANCE
Influences of matrix particle size distribution (PSD) (18, 25, 35, 50 µm) and fat content(25, 30, 35%) on flavour release of dark chocolate volatiles were quantified by staticheadspace gas chromatography using gas chromatography–mass spectrometry (GC-MS).Sixty-eight flavour compounds were identified comprising alcohols, aldehydes, esters,ketones, furans, pyrans, pyrazines, pyridines, pyrroles, phenols, pyrones and thiozoles.From gas chromatography–olfactometry (GC-O) 2-methylpropanal, 2-methylbutanal and3-methylbutanal had chocolate notes. With cocoa/roasted/nutty notes were trimethyl-,tetramethyl-, 2,3-dimethyl-, 2,5-dimethyl-, 3(or 2),5-dimethyl-2(or 3)-ethyl- and 3,5(or 6)-diethyl-2-methylpyrazine and furfuryl pyrrole. Compounds with fruity/floral notes included3,7-dimethyl-1,6-octadien-3-ol, 5-ethenyltetrahydro-R,R,5-trimethyl-cis-2-furanmethanol.Caramel-like, sweet and honey notes were conferred by 2-phenylethanol, phenylacetalde-hyde, 2-phenylethylacetate, 2,3,5-trimethyl-6-ethylpyrazine, 2-carboxaldehyde-1H-pyrrole,furancarboxaldehyde, furfuryl alcohol and 2,5-dimethyl-4-hydroxy-3(2H)-furanone. Therewere direct relationships between fat content and 3-methylbutanal and branched pyrazinesbut inverse with 2-phenylethanol, furfuryl alcohol, methylpyrazine, phenylacetaldehyde,2,3,5-trimethyl-6-ethylpyrazine and 2-carboxaldehyde-1-H-pyrrole. Particle size influencedhigher alcohols, aldehydes, esters, ketones and pyrazines concentrations at all fat contents. Amultivariate product space suggested flavour effects of the interacting factors. This knowledgeon how variations in PSD and continuous phase fat content affects flavour character and theirrelease would be useful for product development during industrial chocolate manufacture.
11.2 INTRODUCTION
Flavour is central to acceptability in chocolate and is influenced not only by volatile aromacompounds but also by non-volatiles and behaviour of the continuous fat phase, influencingrelease of volatiles into the mouth headspace and taste perception. Precursor compositiondepends on bean genotype and environmental effects particularly on contents of storageproteins and polyphenols (Kim & Keeney, 1984; Schwan & Wheals, 2004). Cocoa beansare rich in antioxidants – including catechins, epicatechin and procyanidins – polyphenolssimilar to those found in wine and tea (Carnesecchia et al., 2002; Hatano et al., 2002; Grassiet al., 2005; Lamuela-Raventos et al., 2005; Hermann et al., 2006). Chocolate manufactureinvolves complex physical and chemical processes, determining rheological characteristics,flavour development, melting properties and ultimately sensory perceptions of character

P1: KAE/UKS P2: KAEc11 BLBK244-Afoakwa January 5, 2010 8:12 Printer Name: Yet to Come
216 Chocolate Science and Technology
(Ziegler & Hogg, 1999; Ziegler et al., 2001; Afoakwa et al., 2007, 2008b; Do et al., 2007).There are a number of studies of precursors for flavour formation in cocoa and chocolate(Misnawi et al., 2003; Counet et al., 2004; Kyi et al., 2005).
An appropriate cocoa bean composition can be converted through controlled post-harvesttreatments and subsequent processing technologies to a high-quality chocolate flavour char-acter (Clapperton, 1994). Fermentation is crucial to not only the formation of key volatilefractions (alcohols, esters and fatty acids) but also provision of Maillard flavour precursors(amino acids and reducing sugars) (Buyukpamukcu et al., 2001; Luna et al., 2002; Kyi et al.,2005). Drying reduces levels of acidity and astringency in cocoa nibs, decreasing volatileacids and total polyphenols. Maillard reactions during roasting convert these flavour precur-sors into two main classes of flavour-active component – pyrazines and aldehydes (Gill et al.,1984; Oberparlaiter & Ziegleder, 1997; Dimick & Hoskin, 1999; Stark et al., 2005; Granvoglet al., 2006; Ramli et al., 2006). Flavour development continues during conching follow-ing the elimination of volatile acids, and moisture with associated viscosity changes due toemulsification and tannin oxidation (Mermet et al., 1992; Plumas et al., 1996; Reineccius,2006). Afoakwa et al. (2008a) reviewed relationships between initial composition and post-harvest treatments of cocoa beans and subsequent processing (roasting and conching) andtechnological effects on final flavour character in chocolate.
PSD influences dark chocolate structure – specifically interparticle interactions and net-work microstructure, rheology and texture – with specific surface area and mean particlesize influencing yield stress, plastic viscosity, product spread and hardness (Chevalley, 1999;Beckett, 2008; Afoakwa et al., 2008b, 2008e, 2009d). Genovese et al. (2007) suggestedthat non-hydrodynamic parameters such as particle shape, particle size and size distribution,particle deformability and liquid polarity influence food structure and flow behaviours. Suchfactors dictate the space dimension of a suspension, whether strongly or weakly flocculated,with influence on yield stress and plastic viscosity. Although key flavour compounds of milkand dark chocolates have been reported (Cerny & Fay, 1995; Schnermann & Schieberle,1997; Schieberle & Pfnuer, 1999; Counet et al., 2002; Taylor, 2002; Taylor & Roberts, 2004;Reineccius, 2006), their abundancy, release and contribution to product character and matrixeffects remain unclear.
Modern healthier foods – less fat and low sugar products – require modifications iningredients and recipe formulation, with impacts on flavour release and product rheology,structure and texture. Knowledge of how variations in PSD and continuous phase fat contentinfluence flavour would be useful for product development and manufacture. The objectivesof this study were to characterise and quantify volatile flavour constituents in dark chocolates,and to evaluate matrix effects from varying PSD and fat content on release of flavour volatilesusing headspace high-resolution gas chromatography (HRGC), identifying components withGC-MS and flavour notes by GC-O.
11.3 MATERIALS AND METHODS
11.3.1 Materials
Cocoa liquor of Central West African origin was obtained from Cargill Cocoa ProcessingCompany (York, UK); sucrose (pure extra-fine) from British Sugar Company (Peterborough,UK); pure prime-pressed cocoa butter and soy lecithin from ADM Cocoa Limited (Koog aande Zaan, the Netherlands) and Unitechem Company Ltd (Tianjin, China), respectively.

P1: KAE/UKS P2: KAEc11 BLBK244-Afoakwa January 5, 2010 8:12 Printer Name: Yet to Come
Matrix effects on flavour volatiles character and release in chocolates 217
Table 11.1 Recipes used for the formulation of the dark chocolate
Ingredient 25% fat (% w/w) 30% fat (% w/w) 35% fat (% w/w)
Sucrose (%) 59.0 49.9 40.8Cocoa liquor (%) 35.5 44.6 53.7Cocoa butter (%) 5.0 5.0 5.0Lecithin (%) 0.5 0.5 0.5
Recipe (Table 11.1) and sample formulations have been described previously (Afoakwaet al., 2008b). Chocolates were formulated with total fat of 25–35% (w/w) from cocoaliquor and cocoa butter with more than 34% total cocoa, composition as specified for darkchocolate (European Commission Directive, 2000; Codex Revised Standard, 2003). Sucroseand cocoa liquor (5 kg per formulation) were mixed in a Crypto Peerless mixer (ModelK175, Crypto Peerless Ltd, Birmingham, UK) at low speed for 2 minutes and then at highfor 3 minutes, then refined using a three-roll refiner (Model SDX 600, Buhler Ltd, CH-9240Uzwil, Switzerland) to a specified particle size (D90: 18 ± 1 µm, 25 ± 1 µm, 35 ± 1 µm and50 ± 1 µm) conducting particle size analysis, during refining, to ensure D90 values. Refinedchocolate flakes were placed in plastic containers and conditioned at 50–55◦C for 24 hours toensure melting of fat prior to conching in a Lipp Conche (Model IMC-E10, Boveristr 40-42,D-68309, Mannhein, Germany) at low speed for 3.5 hours at 60◦C.
Lecithin and cocoa butter were added and mixtures were conched at high speed for30 minutes to effect adequate mixing and liquefaction. Samples were stored in sealed plasticcontainers at ambient temperature (20–22◦C) and moisture, and fat contents were determinedusing Karl Fischer and Soxhlet methods (ICA, 1988, 1990), respectively.
11.3.2 Tempering procedure
Samples were melted at 50◦C for 4 hours and tempered using a continuous three-stage tem-pering unit (Model AMK 10, Aasted Mikroverk A/S, Farum, Denmark) pumping chocolatethrough multistage units, with a worm screw driving product through heat exchangers. Sen-sors in equipment measured temperature of both chocolate and coolant fluid at each stage.Based on our previous work on modelling temperature controls to study tempering behaviour(Afoakwa et al., 2008g), the temperature of each of the coolant fluids was thus set and con-trolled independently to obtain a final chocolate at approximately 27◦C to promote crystalgrowth of the desired triacylglyceride fractions. Pre-crystallisation was measured using acomputerised tempermeter (Exotherm 7400, Systech Analytics, SA, Switzerland) using abuilt-in algorithm to ensure an optimal temper regime of slope 0 ± 0.3 (Nelson, 1999).Tempered chocolate was formed using plastic moulds, 80-by-20-by-8 mm, allowed to coolat 12◦C for 2 hours before demoulding onto plastic trays and conditioned at 20 ± 2◦C for14 days before analysis.
11.3.3 Determination of particle size distribution
A MasterSizerR©
Laser Diffraction Particle Size Analyzer equipped with MS 15 samplepresentation unit (refractive index 1.590) (Malvern Instrument Ltd, Malvern, England) wasused. About 0.2 g of refined dark chocolate was dispersed in vegetable oil (refractive index1.450) at ambient temperature (20 ± 2◦C) until an obscuration of 0.2 was obtained. Samples
P1: KAE/UKS P2: KAEc11 BLBK244-Afoakwa January 5, 2010 8:12 Printer Name: Yet to Come
218 Chocolate Science and Technology
were placed under ultrasonic dispersion for 2 minutes to ensure particles were independentlydispersed and suspensions thereafter were maintained by stirring. Size distribution wasquantified as the relative volume of particles in size bands presented as size distributioncurves (Malvern MasterSizer
R©Micro Software v 2.19). PSD parameters obtained included
specific surface area, the largest particle size (D90), mean particle volume (D50), the smallestparticle size (D10) and Sauter mean diameter (D[3,2]).
11.3.4 Quantification of flavour volatilesby gas chromatography
Static headspace isolation of volatile compounds was performed using solid phase microextraction (SPME) for 30 minutes at 55◦C onto a polydimethylsiloxane-divinylbenzene,65 µm fibre (Supelco, Bellafonte, PA, USA). Chocolate (∼4 g) was previously heated to55◦C and intermittently stirred for 60 minutes for headspace equilibration. Each experimenthad a system control sample, made by stirring an empty vial under the same conditions.Volatile compounds were desorbed (5 minutes) into the splitless injector (220◦C) of AgilentTechnologies 6890N-5793 Network GC-MS system (Agilent Technologies, Santa Clara, CA,USA) and separated on a J&W 60 m DB-Wax capillary column (0.22 mm inner diameterand 0.25 µm film thickness). The temperature program was 5 minutes at 40◦C, 3◦C/minuteto 230◦C, finally 15 minutes at 230◦C. Compounds were fragmented using electron-impactionisation (70 eV), with a source temperature of 200◦C, a scan range of 30–300 amu and ascan rate of 5 s−1. Components were identified based on comparison of mass spectra withthose of spectral libraries NIST 05 and Wiley 7N Registry of GC Mass Spectral Data (JohnWiley, NY, USA).
11.3.5 Gas chromatography–olfactometryanalytical conditions
The GC-O analyses were conducted using Agilent Technologies (6890N Network Systems,CA, USA) with analyses as before, diverting the effluent to a humidified sniffing port. Twochromatographic runs were assessed by two trained assessors (alternating for 20 minutesperiods). Only matching descriptors for an aroma attribute were retained.
11.3.6 Experimental design and statistical analysis
Two experimental variables comprising PSD and fat contents were used with other variablesincluding refiner temperature and pressure, conching time and temperature held constant. A4×3-factorial experimental design was used with PSD (D90) 18, 25, 35 and 50 µm; fat 25, 30and 35% (w/w). Statgraphics Plus 4.1 (Graphics Software System, STCC, Inc., Rockville,USA) examined quantitative data using the two-way analysis of variance (ANOVA) andmultiple range tests to determine effects of factors and interactions. Multivariate techniquescomprising PCA and multiple regression analysis were used to evaluate relationships be-tween selected flavour volatiles obtained by quantification of GC-MS data and influentialfactors. Tukey multiple comparisons at 95% significance level were conducted to determinedifferences between factor levels. All process treatments and analysis were conducted induplicates and the mean values were reported.
P1: KAE/UKS P2: KAEc11 BLBK244-Afoakwa January 5, 2010 8:12 Printer Name: Yet to Come
Matrix effects on flavour volatiles character and release in chocolates 219
11.4 RESULTS AND DISCUSSION
11.4.1 Particle size distribution of dark chocolates
PSDs (Fig. 7.1), previously reported, show volume histograms consisting of narrow (18 µmPS) and wide (25 µm PS) bimodal, and narrow (35 µm PS) and wide (50 µm PS) multi-modal size distributions. This PSD range, 18–50 µm, using D90 values (>90% finer) coversoptimum minimum and maximum sizes with direct effects on texture and sensory characterin manufacture (Ziegler & Hogg, 1999; Beckett, 2008). Data from PSD showed variationsin specific surface area, mean particle volume D(v,50), Sauter mean (D[3,2]) and mean par-ticle diameter (D[4,3]) with increasing D90 particle sizes. Beckett (2009) concluded that thelargest particle size and specific surface area of solids were two key parameters in manufac-ture. The former determines chocolate coarseness and textural character; the latter, desirableflow properties. Specific surface area was inversely correlated with the different componentof PSD (Ziegler & Hogg, 1999; Sokmen & Gunes, 2006; Beckett, 2009). Fat contents were25, 30 and 35 ± 1% (each) and moisture in the range 0.90–0.98%.
11.4.2 Characterisation of flavour compoundsin dark chocolates
Criteria for selection of the key volatiles were (presence in headspaces at >106 abundantunits) quantified by GC-MS and also detection and intensities by the GC-O techniques. In all,68 flavour compounds (Table 11.2) comprising nitrogen and oxygen heterocycles, aldehydesand ketones, esters, alcohols, hydrocarbons, nitriles and sulphides were identified by GC-MSin dark chocolates. A typical chromatogram is as shown in Figure 11.1.
Compounds quantified included 1-pentanol (1), 3-(methylthiol)-propionaldehyde (12),methylbenzene (38), methylpyrazine (41), ethenylpyrazine (47), pyridine (55), 2-methylpyridine (56), 1-(2-furanylmethyl)-1H-pyrrole (62), 1H-indole (63) and dimethyldisulphide (67) (Table 11.2). Two others, benzyl alcohol (5) and dihydro-2-methyl-3(2H)-furanone (30), were only reported in dark chocolates (Counet et al., 2002).
Specific nitrogen heterocycles from Maillard reactions included 3(or 2),5-dimethyl-2(or 3)-ethylpyrazine (50), 3,5-(or 6)-diethyl-2-methylpyrazine (53), 2,3-dimethyl-1H-pyrrole (59), 3-ethyl-2,5-dimethyl-1H-pyrrole (61) and 10(2-furanylmethyl)-1H-pyrrole (fur-furylpyrrole) (62) (Table 11.2). All had cocoa, praline, chocolate and roasted notes identifiedas important. The ethyl group in two pyrazine compounds suggests key roles for alanineand/or its Strecker aldehyde, acetaldehyde, in dark chocolate flavour (Cerny & Fay, 1995).
Flavour-active compounds identified as having strong chocolate characters included 2-methylpropanal (8), 2-methylbutanal (9) and 3-methylbutanal (10). Compounds derivedfrom Maillard reactions were 2,3-dimethylpyrazine (45), 2,5-dimethylpyrazine (42), 2,6-dimethylpyrazine (43), trimethylpyrazine (47), tetramethylpyrazine (51), 3(or 2),5-dimethyl-2(or 3)-ethylpyrazine (50), 3,5(or 6)-diethyl-2-methylpyrazine (53) and furfurylpyrrole (60)exhibiting cocoa/roasted/nutty/cooked notes. Counet et al. (2002) identified such flavourvolatiles in dark chocolates after conching, suggesting these are formed during cocoaprocessing.
Volatiles such as 2-phenylethanol (7), phenylacetaldehyde (15) and 2-phenylethylacetate(22), 2,3,5-trimethyl-6-ethylpyrazine (54), 2-carboxaldehyde-1H-pyrrole (60) were charac-terised by sweet, candy and honey flavours. Furancarboxaldehyde (furfural) (31), furfurylalcohol (furfurol) (32), 2,5-dimethyl-4-hydroxy-3(2H)furanone (Furaneol) (35) were also
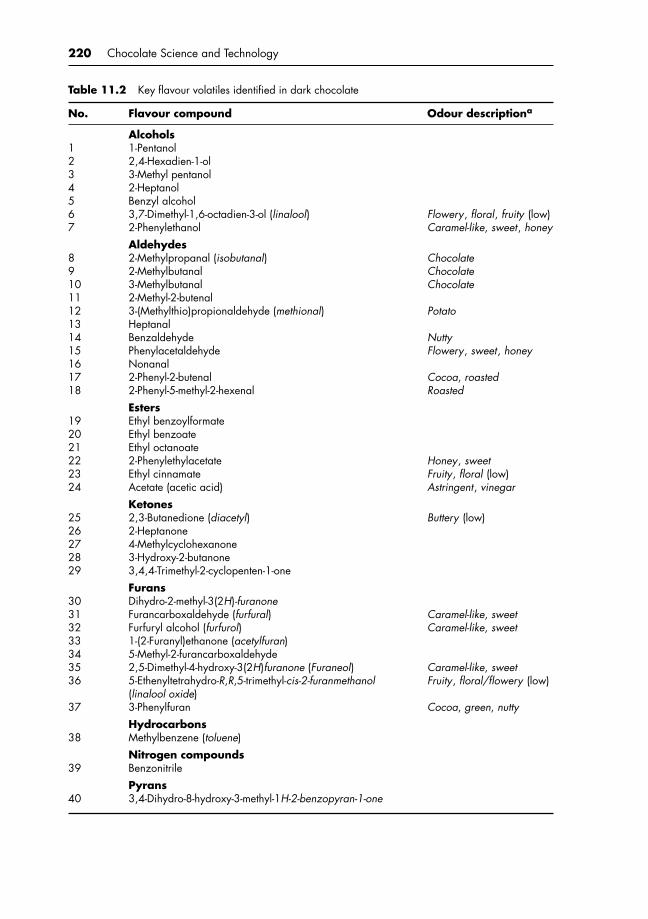
P1: KAE/UKS P2: KAEc11 BLBK244-Afoakwa January 5, 2010 8:12 Printer Name: Yet to Come
220 Chocolate Science and Technology
Table 11.2 Key flavour volatiles identified in dark chocolate
No. Flavour compound Odour descriptiona
Alcohols1 1-Pentanol2 2,4-Hexadien-1-ol3 3-Methyl pentanol4 2-Heptanol5 Benzyl alcohol6 3,7-Dimethyl-1,6-octadien-3-ol (linalool) Flowery, floral, fruity (low)7 2-Phenylethanol Caramel-like, sweet, honey
Aldehydes8 2-Methylpropanal (isobutanal) Chocolate9 2-Methylbutanal Chocolate10 3-Methylbutanal Chocolate11 2-Methyl-2-butenal12 3-(Methylthio)propionaldehyde (methional) Potato13 Heptanal14 Benzaldehyde Nutty15 Phenylacetaldehyde Flowery, sweet, honey16 Nonanal17 2-Phenyl-2-butenal Cocoa, roasted18 2-Phenyl-5-methyl-2-hexenal Roasted
Esters19 Ethyl benzoylformate20 Ethyl benzoate21 Ethyl octanoate22 2-Phenylethylacetate Honey, sweet23 Ethyl cinnamate Fruity, floral (low)24 Acetate (acetic acid) Astringent, vinegar
Ketones25 2,3-Butanedione (diacetyl) Buttery (low)26 2-Heptanone27 4-Methylcyclohexanone28 3-Hydroxy-2-butanone29 3,4,4-Trimethyl-2-cyclopenten-1-one
Furans30 Dihydro-2-methyl-3(2H)-furanone31 Furancarboxaldehyde (furfural) Caramel-like, sweet32 Furfuryl alcohol (furfurol) Caramel-like, sweet33 1-(2-Furanyl)ethanone (acetylfuran)34 5-Methyl-2-furancarboxaldehyde35 2,5-Dimethyl-4-hydroxy-3(2H)furanone (Furaneol) Caramel-like, sweet36 5-Ethenyltetrahydro-R,R,5-trimethyl-cis-2-furanmethanol
(linalool oxide)Fruity, floral/flowery (low)
37 3-Phenylfuran Cocoa, green, nuttyHydrocarbons
38 Methylbenzene (toluene)
Nitrogen compounds39 Benzonitrile
Pyrans40 3,4-Dihydro-8-hydroxy-3-methyl-1H-2-benzopyran-1-one
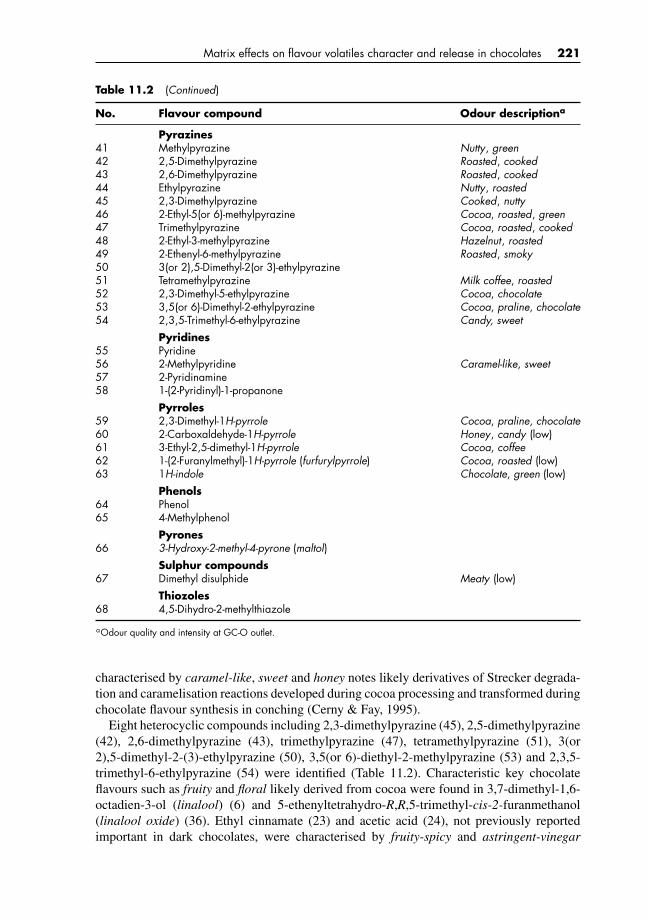
P1: KAE/UKS P2: KAEc11 BLBK244-Afoakwa January 5, 2010 8:12 Printer Name: Yet to Come
Matrix effects on flavour volatiles character and release in chocolates 221
Table 11.2 (Continued)
No. Flavour compound Odour descriptiona
Pyrazines41 Methylpyrazine Nutty, green42 2,5-Dimethylpyrazine Roasted, cooked43 2,6-Dimethylpyrazine Roasted, cooked44 Ethylpyrazine Nutty, roasted45 2,3-Dimethylpyrazine Cooked, nutty46 2-Ethyl-5(or 6)-methylpyrazine Cocoa, roasted, green47 Trimethylpyrazine Cocoa, roasted, cooked48 2-Ethyl-3-methylpyrazine Hazelnut, roasted49 2-Ethenyl-6-methylpyrazine Roasted, smoky50 3(or 2),5-Dimethyl-2(or 3)-ethylpyrazine51 Tetramethylpyrazine Milk coffee, roasted52 2,3-Dimethyl-5-ethylpyrazine Cocoa, chocolate53 3,5(or 6)-Dimethyl-2-ethylpyrazine Cocoa, praline, chocolate54 2,3,5-Trimethyl-6-ethylpyrazine Candy, sweet
Pyridines55 Pyridine56 2-Methylpyridine Caramel-like, sweet57 2-Pyridinamine58 1-(2-Pyridinyl)-1-propanone
Pyrroles59 2,3-Dimethyl-1H-pyrrole Cocoa, praline, chocolate60 2-Carboxaldehyde-1H-pyrrole Honey, candy (low)61 3-Ethyl-2,5-dimethyl-1H-pyrrole Cocoa, coffee62 1-(2-Furanylmethyl)-1H-pyrrole (furfurylpyrrole) Cocoa, roasted (low)63 1H-indole Chocolate, green (low)
Phenols64 Phenol65 4-Methylphenol
Pyrones66 3-Hydroxy-2-methyl-4-pyrone (maltol)
Sulphur compounds67 Dimethyl disulphide Meaty (low)
Thiozoles68 4,5-Dihydro-2-methylthiazole
aOdour quality and intensity at GC-O outlet.
characterised by caramel-like, sweet and honey notes likely derivatives of Strecker degrada-tion and caramelisation reactions developed during cocoa processing and transformed duringchocolate flavour synthesis in conching (Cerny & Fay, 1995).
Eight heterocyclic compounds including 2,3-dimethylpyrazine (45), 2,5-dimethylpyrazine(42), 2,6-dimethylpyrazine (43), trimethylpyrazine (47), tetramethylpyrazine (51), 3(or2),5-dimethyl-2-(3)-ethylpyrazine (50), 3,5(or 6)-diethyl-2-methylpyrazine (53) and 2,3,5-trimethyl-6-ethylpyrazine (54) were identified (Table 11.2). Characteristic key chocolateflavours such as fruity and floral likely derived from cocoa were found in 3,7-dimethyl-1,6-octadien-3-ol (linalool) (6) and 5-ethenyltetrahydro-R,R,5-trimethyl-cis-2-furanmethanol(linalool oxide) (36). Ethyl cinnamate (23) and acetic acid (24), not previously reportedimportant in dark chocolates, were characterised by fruity-spicy and astringent-vinegar
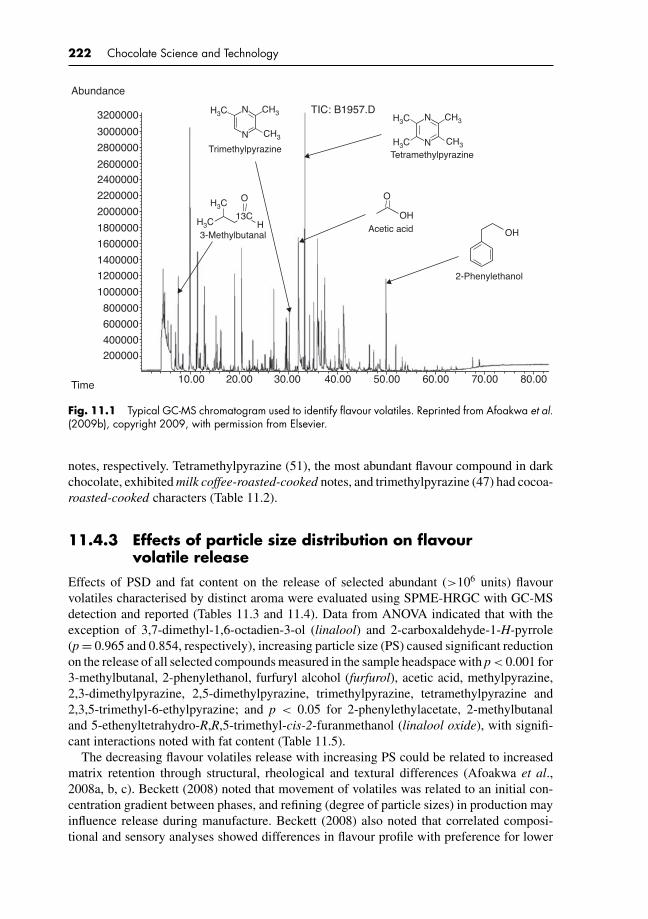
P1: KAE/UKS P2: KAEc11 BLBK244-Afoakwa January 5, 2010 8:12 Printer Name: Yet to Come
222 Chocolate Science and Technology
3200000
3000000
H3C
H3C O
Trimethylpyrazine
3-Methylbutanal
Tetramethylpyrazine
Acetic acid
2-Phenylethanol
CH3
CH3N
N
H3C13C
H
O
OH
OH
H3C
H3C
CH3
CH3N
N
2800000
26000002400000
2200000
2000000
1800000
1600000
1400000
1200000
1000000
800000
600000
400000
200000
10.00 20.00 30.00 40.00 50.00 60.00 70.00 80.00Time
Abundance
TIC: B1957.D
Fig. 11.1 Typical GC-MS chromatogram used to identify flavour volatiles. Reprinted from Afoakwa et al.(2009b), copyright 2009, with permission from Elsevier.
notes, respectively. Tetramethylpyrazine (51), the most abundant flavour compound in darkchocolate, exhibited milk coffee-roasted-cooked notes, and trimethylpyrazine (47) had cocoa-roasted-cooked characters (Table 11.2).
11.4.3 Effects of particle size distribution on flavourvolatile release
Effects of PSD and fat content on the release of selected abundant (>106 units) flavourvolatiles characterised by distinct aroma were evaluated using SPME-HRGC with GC-MSdetection and reported (Tables 11.3 and 11.4). Data from ANOVA indicated that with theexception of 3,7-dimethyl-1,6-octadien-3-ol (linalool) and 2-carboxaldehyde-1-H-pyrrole(p = 0.965 and 0.854, respectively), increasing particle size (PS) caused significant reductionon the release of all selected compounds measured in the sample headspace with p < 0.001 for3-methylbutanal, 2-phenylethanol, furfuryl alcohol (furfurol), acetic acid, methylpyrazine,2,3-dimethylpyrazine, 2,5-dimethylpyrazine, trimethylpyrazine, tetramethylpyrazine and2,3,5-trimethyl-6-ethylpyrazine; and p < 0.05 for 2-phenylethylacetate, 2-methylbutanaland 5-ethenyltetrahydro-R,R,5-trimethyl-cis-2-furanmethanol (linalool oxide), with signifi-cant interactions noted with fat content (Table 11.5).
The decreasing flavour volatiles release with increasing PS could be related to increasedmatrix retention through structural, rheological and textural differences (Afoakwa et al.,2008a, b, c). Beckett (2008) noted that movement of volatiles was related to an initial con-centration gradient between phases, and refining (degree of particle sizes) in production mayinfluence release during manufacture. Beckett (2008) also noted that correlated composi-tional and sensory analyses showed differences in flavour profile with preference for lower
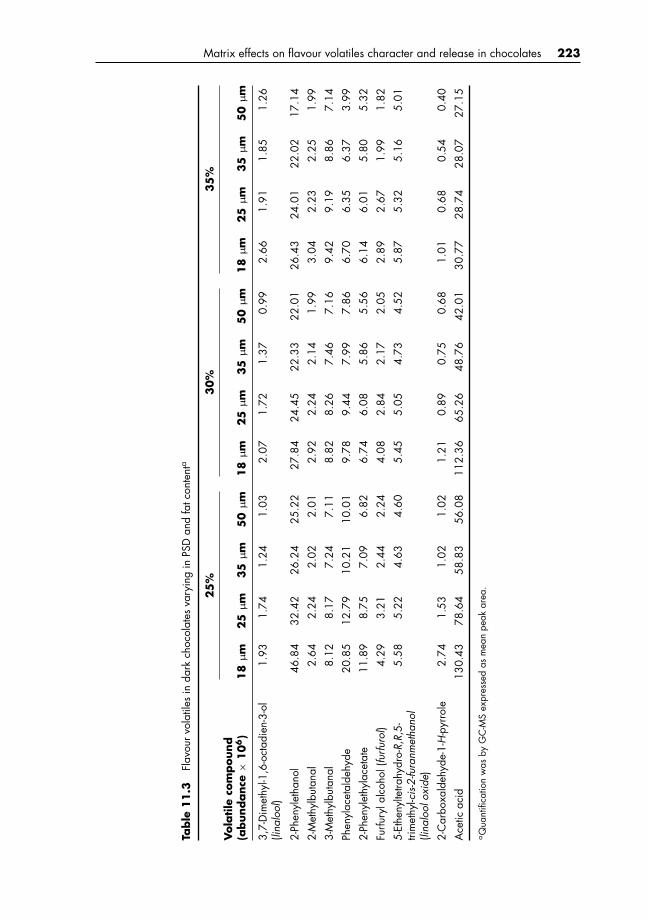
P1: KAE/UKS P2: KAEc11 BLBK244-Afoakwa January 5, 2010 8:12 Printer Name: Yet to Come
Matrix effects on flavour volatiles character and release in chocolates 223
Table
11.3
Flav
ourv
olat
iles
inda
rkch
ocol
ates
vary
ing
inPS
Dan
dfa
tcon
tent
a
25
%30%
35
%
Vola
tile
com
pound
(abundance
×10
6)
18
µm
25
µm
35
µm
50
µm
18
µm
25
µm
35
µm
50
µm
18
µm
25
µm
35
µm
50
µm
3,7-
Dim
ethy
l-1,6
-oct
adie
n-3-
ol( li
nalo
ol)
1.93
1.74
1.24
1.03
2.07
1.72
1.37
0.99
2.66
1.91
1.85
1.26
2-Ph
enyl
etha
nol
46.8
432
.42
26.2
425
.22
27.8
424
.45
22.3
322
.01
26.4
324
.01
22.0
217
.14
2-M
ethy
lbut
anal
2.64
2.24
2.02
2.01
2.92
2.24
2.14
1.99
3.04
2.23
2.25
1.99
3-M
ethy
lbut
anal
8.12
8.17
7.24
7.11
8.82
8.26
7.46
7.16
9.42
9.19
8.86
7.14
Phen
ylac
etal
dehy
de20
.85
12.7
910
.21
10.0
19.
789.
447.
997.
866.
706.
356.
373.
99
2-Ph
enyl
ethy
lace
tate
11.8
98.
757.
096.
826.
746.
085.
865.
566.
146.
015.
805.
32
Furfu
ryla
lcoh
ol( fu
rfuro
l)4.
293.
212.
442.
244.
082.
842.
172.
052.
892.
671.
991.
82
5-Et
heny
ltetra
hydr
o-R,
R,5-
trim
ethy
l- cis
-2-fu
ranm
etha
nol
5.58
5.22
4.63
4.60
5.45
5.05
4.73
4.52
5.87
5.32
5.16
5.01
(lina
lool
oxid
e)2-
Car
boxa
ldeh
yde-
1-H
-pyr
role
2.74
1.53
1.02
1.02
1.21
0.89
0.75
0.68
1.01
0.68
0.54
0.40
Ace
ticac
id13
0.43
78.6
458
.83
56.0
811
2.36
65.2
648
.76
42.0
130
.77
28.7
428
.07
27.1
5
aQ
uant
ifica
tion
was
byG
C-M
Sex
pres
sed
asm
ean
peak
area
.
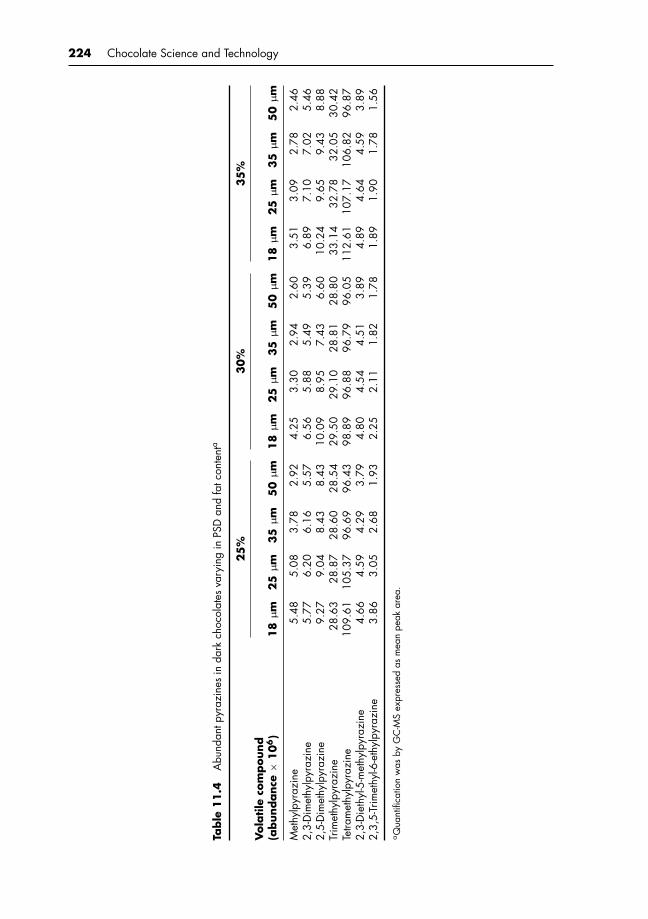
P1: KAE/UKS P2: KAEc11 BLBK244-Afoakwa January 5, 2010 8:12 Printer Name: Yet to Come
224 Chocolate Science and Technology
Table
11.4
Abu
ndan
tpyr
azin
esin
dark
choc
olat
esva
ryin
gin
PSD
and
fatc
onte
nta
25
%30%
35
%
Vola
tile
com
pound
(abundance
×10
6)
18
µm
25
µm
35
µm
50
µm
18
µm
25
µm
35
µm
50
µm
18
µm
25
µm
35
µm
50
µm
Met
hylp
yraz
ine
5.48
5.08
3.78
2.92
4.25
3.30
2.94
2.60
3.51
3.09
2.78
2.46
2,3-
Dim
ethy
lpyr
azin
e5.
776.
206.
165.
576.
565.
885.
495.
396.
897.
107.
025.
462,
5-D
imet
hylp
yraz
ine
9.27
9.04
8.43
8.43
10.0
98.
957.
436.
6010
.24
9.65
9.43
8.88
Trim
ethy
lpyr
azin
e28
.63
28.8
728
.60
28.5
429
.50
29.1
028
.81
28.8
033
.14
32.7
832
.05
30.4
2Te
tram
ethy
lpyr
azin
e10
9.61
105.
3796
.69
96.4
398
.89
96.8
896
.79
96.0
511
2.61
107.
1710
6.82
96.8
72,
3-D
ieth
yl-5
-met
hylp
yraz
ine
4.66
4.59
4.29
3.79
4.80
4.54
4.51
3.89
4.89
4.64
4.59
3.89
2,3,
5-Tr
imet
hyl-6
-eth
ylpy
razi
ne3.
863.
052.
681.
932.
252.
111.
821.
781.
891.
901.
781.
56
aQ
uant
ifica
tion
was
byG
C-M
Sex
pres
sed
asm
ean
peak
area
.

P1: KAE/UKS P2: KAEc11 BLBK244-Afoakwa January 5, 2010 8:12 Printer Name: Yet to Come
Matrix effects on flavour volatiles character and release in chocolates 225
Table 11.5 ANOVA summary showing F-values and regression coefficients of flavour compoundsidentified in dark chocolates with varying PSD and fat content
Volatile compound PSD (D90): A Fat: B Interactions: A × B R2a
3,7-Dimethyl-1,6-octadien-3-ol(linalool)
1.81 2.64 1.03 7.11
2-Phenylethanol 1305.56*** 1906.11*** 265.68*** 75.21***
2-Methylbutanal 5.83* 0.48 4.76* 21.2
3-Methylbutanal 32.36*** 20.79*** 27.92*** 84.3***
Phenylacetaldehyde 8.62*** 29.46 *** 10.28** 81.8***
2-Phenylethylacetate 3.23* 1.67 3.28* 9.47
Furfuryl alcohol (furfurol) 70.57*** 19.16*** 27.82*** 87.7***
5-Ethenyltetrahydro-R,R,5- 4.89* 5.34* 5.71* 7.86trimethyl-cis-2-furanmethanol(linalool oxide)
2-Carboxaldehyde-1-H-pyrrole 1.15 1.77 0.95 17.9
Acetic acid 13.67*** 26.31 *** 12.62*** 75.0***
Methylpyrazine 30.15*** 34.81 *** 28.63*** 86.4***
2,3-Dimethylpyrazine 8.93 *** 11.26 *** 10.56** 51.6*
2,5-Dimethylpyrazine 15.62 *** 12.32 *** 18.63*** 61.4*
Trimethylpyrazine 13.01*** 795.09 *** 18.52*** 81.9***
Tetramethylpyrazine 13.68*** 17.20 *** 12.29*** 51.0*
2,3-Diethyl-5-methylpyrazine 312.88*** 19.24*** 48.78** 86.9***
2,3,5-Trimethyl-6-ethylpyrazine 9.67*** 29.59*** 13.36** 76.6***
Significant F-ratios at *p ≤ 0.05, **p ≤ 0.01, ***p ≤ 0.001; aR from multiple regression.
PS (thick and pasty) chocolates, rather than the higher PS (thin and runny). These suggest thatdark chocolates with finer PS (18 and 25 µm) would release more cocoa-chocolate-pralineand caramel-like-sweet-honey notes than those with larger PS (35 and 50 µm), predictingperceived differences in flavour with varying PS. The increase in surface area with decreasingPS (D90) would be predicted to facilitate volatiles release. The lack of significant effects of3,7-dimethyl-1,6-octadien-3-ol (linalool) and 2-carboxaldehyde-1-H-pyrrole (p = 0.965 and0.854, respectively) would not be predicted to influence flavour character from headspacecontents and odour intensities (Tables 11.3 and 11.4). Voltz and Beckett (1997) and Ziegleret al. (2001) reported that finer (smaller PS) chocolate tend to be sweeter in taste than coarser(larger PS) ones, attributed to relative crystals sizes and melting behaviour. Particle sizeinfluences perceptions of creaminess and flavour release in soft model systems (Kilcast &Clegg, 2002; Engelen et al., 2005; Engelen et al., 2008). Concentration of flavour volatilesin headspaces has been reported as a function of diffusion in the solid phase (Guinard &Marty, 1995; Carr et al., 1996; Engelen et al., 2003; Kersiene et al., 2008).
11.4.4 Effects of fat content on flavour volatile release
Fat content influenced headspace concentration of volatiles independent of PSD (Table 11.3).Data from ANOVA showed that 3,7-dimethyl-1,6-octadien-3-ol (linalool), 2-methylbutanal,

P1: KAE/UKS P2: KAEc11 BLBK244-Afoakwa January 5, 2010 8:12 Printer Name: Yet to Come
226 Chocolate Science and Technology
2-phenylethylacetate and 2-carboxaldehyde-1-H-pyrrole lacked significant effects (p > 0.05).Fat content significantly influenced headspace concentrations of all other quantified volatiles(p < 0.001) at all PSD with significant interactions among factors studied (Table 11.5).Volatiles characterised by cocoa, chocolate, praline, fruity and roasted notes includedtrimethylpyrazine, 3-methylbutanal, 2,3-dimethylpyrazine, 2,5-dimethylpyrazine, tetram-ethylpyrazine, linalool oxide and 2,3,5-triethyl-5-methylpyrazine. All showed a direct re-lationship with fat content at all PS (Tables 11.3 and 11.4). Volatile release data suggestedthat chocolates of higher fat content would exhibit greater release of components with cocoa-chocolate-praline notes than those with lower fat. This decreased matrix retention could berelated to differences in (micro)structure as interparticle flocculation and aggregates arereduced with higher fat contents (Afoakwa et al., 2008b), releasing more Strecker degra-dation compounds with cocoa-chocolate notes. Concentrations of less volatile heterocycliccompounds were increased, notably polysubstituted ethyl- and isobutyl pyrazines, tri- andtetramethylpyrazine, and furans (linalool oxide), suggesting structural and rheological effectsas major determinants of chocolate character (Do et al., 2007; Afoakwa et al., 2008b, 2009d).
Contrariwise, volatiles with caramel-like, sweet, honey and candy notes included 2-phenylethanol, furfuryl alcohol (furfurol), methylpyrazine, phenylacetaldehyde, 2,3,5-trimethyl-6-ethylpyrazine and 2-carboxaldehyde-1-H-pyrrole. All showed an inverse re-lationship with fat content at all PS (Tables 11.3 and 11.4), primarily due to lipophilicmatrix–flavour interactions. The major influence of fat content was observed with the mostlipophilic compounds (Tables 11.3 and 11.4), particularly with fat contents above 25%.These results are consistent with earlier reports (Jo & Ahn, 1999; Doyen et al., 2001), andare also consistent with the suggestion that the more lipophilic the volatile, the less lipid isneeded to reduce its headspace concentration (Roberts et al., 2003). More lipids generallyreduce volatility of lipophilic components such as long-chain aldehydes and esters (Kersieneet al., 2008). Lack of a significant effect on overall flavour character from 3,7-dimethyl-1,6-octadien-3-ol (linalool), 2-methylbutanal, 2-phenylethylacetate and 2-carboxaldehyde-1-H-pyrrole would be predicted (Tables 11.2 and 11.3). Studies from emulsions showed thatrelease of lipophilic compounds is decreased with limited amounts of lipid (Carey et al.,2002; Roberts et al., 2003). Factors such as lipophilicity or hydrophobicity of compoundscould modulate the effect of fat content on release, specifically in confectionery (Barylko-Pikielna & Szczesniak, 1994; Hyvonen et al., 2003), as well as mouth-feel (De Wijk et al.,2006) and thermal perceptions (Engelen et al., 2002).
A further key finding was related to headspace acetic acid contents in the products. Thedata showed very high values in dark chocolates, containing 25 and 30% fat at lower (18 and25 µm) PS, and inversely related to fat content. Greatest reduction in acetic acid (approxi-mately fourfold) was noted with 35% fat at all PS, relative to similar products with 25 and 30%fat (Table 11.3). Similarly, increasing PS from 25–50 µm reduced contents by approximatelytwo- to threefold with 25 and 30% fat, whereas only minimal (5%) reduction was notedwith 35% fat. From ANOVA there were highly significant effects of PSD and fat content(p = 0.001) on acetic acid release with significant interactions (Table 11.5).
Acetic acid in 25 and 30% fat chocolate headspaces may be related to higher plasticviscosity and yield values (Afoakwa et al., 2008b), and greater flocculation and aggregation ofinterparticle network structure (Afoakwa et al., 2009d), influencing release and volatilisationin conching. High acetic acid levels in low-fat (25%) chocolates may reduce acceptabilityscores: effective elimination of volatile free fatty acids (e.g. acetic acid) and moisture duringconching is crucial for development of final flavour character and texture in chocolates(Mermet et al., 1992; Pontillon, 1995; Plumas et al., 1996; Kealey et al., 2001; Beckett,
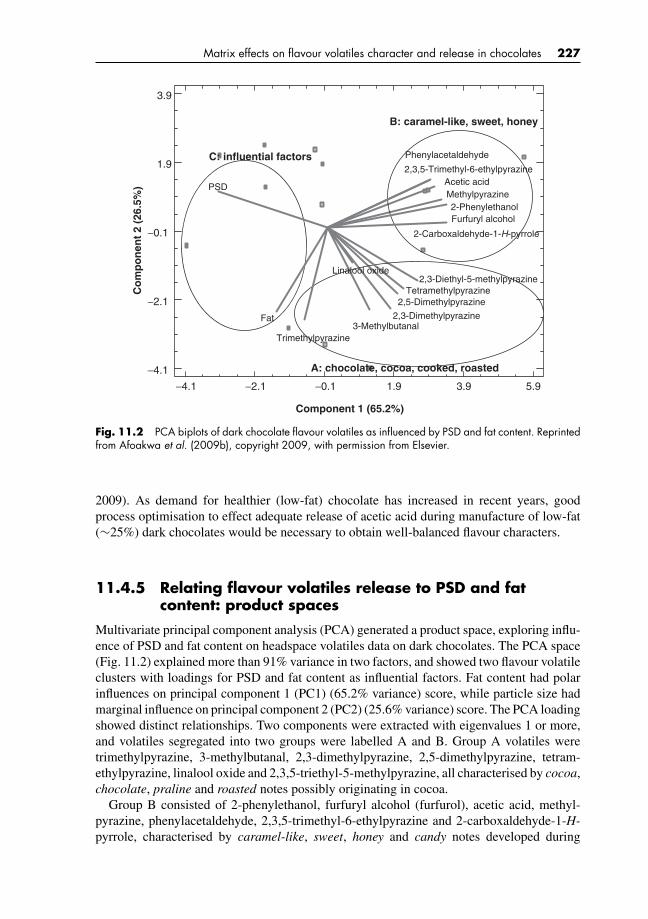
P1: KAE/UKS P2: KAEc11 BLBK244-Afoakwa January 5, 2010 8:12 Printer Name: Yet to Come
Matrix effects on flavour volatiles character and release in chocolates 227
Component 1 (65.2%)
Co
mp
on
ent
2 (2
6.5%
)
Linalool oxide2,3-Diethyl-5-methylpyrazine
2,3,5-Trimethyl-6-ethylpyrazine
2,3-Dimethylpyrazine
2,5-Dimethylpyrazine
2-Carboxaldehyde-1-H-pyrrole
2-Phenylethanol
3-Methylbutanal
Acetic acid
Furfuryl alcohol
Methylpyrazine
Phenylacetaldehyde
Tetramethylpyrazine
Trimethylpyrazine
Fat
PSD
5.93.91.9−0.1−2.1−4.1
−4.1
−2.1
−0.1
1.9
3.9
A: chocolate, cocoa, cooked, roasted
B: caramel-like, sweet, honey
C: influential factors
Fig. 11.2 PCA biplots of dark chocolate flavour volatiles as influenced by PSD and fat content. Reprintedfrom Afoakwa et al. (2009b), copyright 2009, with permission from Elsevier.
2009). As demand for healthier (low-fat) chocolate has increased in recent years, goodprocess optimisation to effect adequate release of acetic acid during manufacture of low-fat(∼25%) dark chocolates would be necessary to obtain well-balanced flavour characters.
11.4.5 Relating flavour volatiles release to PSD and fatcontent: product spaces
Multivariate principal component analysis (PCA) generated a product space, exploring influ-ence of PSD and fat content on headspace volatiles data on dark chocolates. The PCA space(Fig. 11.2) explained more than 91% variance in two factors, and showed two flavour volatileclusters with loadings for PSD and fat content as influential factors. Fat content had polarinfluences on principal component 1 (PC1) (65.2% variance) score, while particle size hadmarginal influence on principal component 2 (PC2) (25.6% variance) score. The PCA loadingshowed distinct relationships. Two components were extracted with eigenvalues 1 or more,and volatiles segregated into two groups were labelled A and B. Group A volatiles weretrimethylpyrazine, 3-methylbutanal, 2,3-dimethylpyrazine, 2,5-dimethylpyrazine, tetram-ethylpyrazine, linalool oxide and 2,3,5-triethyl-5-methylpyrazine, all characterised by cocoa,chocolate, praline and roasted notes possibly originating in cocoa.
Group B consisted of 2-phenylethanol, furfuryl alcohol (furfurol), acetic acid, methyl-pyrazine, phenylacetaldehyde, 2,3,5-trimethyl-6-ethylpyrazine and 2-carboxaldehyde-1-H-pyrrole, characterised by caramel-like, sweet, honey and candy notes developed during
P1: KAE/UKS P2: KAEc11 BLBK244-Afoakwa January 5, 2010 8:12 Printer Name: Yet to Come
228 Chocolate Science and Technology
chocolate manufacture. Both PC1 and to some extent PC2 differentiated chocolate sampleswith clear groupings characterised by specific flavour notes from GC-O (Table 11.2).
The PCA loadings on PC1 showed that flavour volatiles within Group A characterised bycocoa, chocolate, praline and roasted notes were highly related in abundancy to fat content.The working hypothesis is that Group A flavour volatiles are primary origins of cocoa andchocolate notes in dark chocolates, with trimethylpyrazine and 3-methylbutanal central tothese characters (Fig. 11.2). Contrariwise, the PCA loading showed a polar relationshipof fat content with Group B observed to have caramel-like, sweet, honey and candy notes(Table 11.2), suggesting that increasing fat content reduces influence of such notes on flavourcharacter in dark chocolates.
Regression models were developed to predict contribution of specific flavour volatiles tooverall flavour character. One Strecker aldehyde and two nitrogen heterocycles derived fromMaillard reactions had high regression coefficient, respectively: 3-methylbutanal, R2 = 0.843,P = 0.001; trimethylpyrazine, R2 = 0.819, p = 0.001; 2,3-diethyl-5-methylpyrazines, R2 =0.869, p = 0.001 (Table 11.5). These emerged as probably the most interesting compounds indark chocolates providing cocoa, praline-chocolate and nutty flavours. Three other heterocy-cles – 2,3-dimethylpyrazine, 2,5-dimethylpyrazine and tetramethylpyrazine – showed less butstill significant effects with R2 = 0.516, 0.614 and 0.510 (p < 0.05), respectively, contribut-ing cocoa-chocolate notes. Others, 2-methylbutanal, 5-ethenyltetrahydro-R,R,5-trimethyl-cis-2-furanmethanol (linalool oxide) and 3,7-dimethyl-1,6-octadien-3-ol (linalool), had nosignificant influence (p > 0.05) (Table 11.5), possibly due to their low contents in CentralWest African cocoa (Tables 11.3 and 11.4).
On the other hand, the regression models developed showed high and significant re-gression coefficients (R2 = 0.75–0.88; p = 0.001) for Group B compounds. These pre-dicted likely contributions of 2-phenylethanol, furfuryl alcohol (furfurol), methylpyrazine,phenylacetaldehyde and 2,3,5-trimethyl-6-ethylpyrazine of caramel-like, sweet, honey andcandy notes. Acetic acid had high regression coefficient (R2 = 0.75; p = 0.001), and likelycontribute astringent-sour characters to dark chocolates. Others, 2-phenylacetate and 2-carboxaldehyde-1-H-pyrrole, showed no significant effect (R2 = 0.095 and 0.179; p > 0.05,respectively), predicting their minimal impacts on flavour character in dark chocolate. Thisproduct space from PCA (Fig. 11.2) demonstrated the importance and relationships of thedifferent flavour volatiles and likely effect on flavour character and furthermore the influenceof solids PSD and continuous phase matrix fat content on the overall volatiles release intothe headspace in dark chocolates.
11.5 CONCLUSION
Variations in flavour volatile release in dark chocolate matrices varying in PSD and fatcontent were noted, suggesting the potential effects of matrix structure and lipophilic–flavour interactions. Increasing PS significantly reduced the release of 3-methylbutanal, 2-phenylethanol, furfuryl alcohol (furfurol), acetic acid, methylpyrazine, 2,3-dimethylpyrazine,2,5-dimethylpyrazine, trimethylpyrazine, tetramethylpyrazine and 2,3,5-trimethyl-6-ethylpyrazine, 2-phenylethylacetate, 2-methylbutanal and 5-ethenyltetrahydro-R,R,5-trimethyl-cis-2-furanmethanol (linalool oxide). Fat content was directly related to headspaceconcentrations of compounds characterised by cocoa, chocolate, praline, fruity and roastednotes: trimethylpyrazine, 3-methylbutanal, 2,3-dimethylpyrazine, 2,5-dimethylpyrazine,
P1: KAE/UKS P2: KAEc11 BLBK244-Afoakwa January 5, 2010 8:12 Printer Name: Yet to Come
Matrix effects on flavour volatiles character and release in chocolates 229
tetramethylpyrazine, linalool oxide and 2,3,5-triethyl-5-methylpyrazine at all PSDs. Con-trariwise, there was an inverse relationship between matrix fat content and headspace concen-tration of 2-phenylethanol, furfuryl alcohol (furfurol), methylpyrazine, phenylacetaldehyde,2,3,5-trimethyl-6-ethylpyrazine and 2-carboxaldehyde-1-H-pyrrole likely due to lipophilicmatrix–flavour interactions.
The PCA and regression models predicted contribution of volatiles to overall flavourcharacter. One Strecker aldehyde, 3-methylbutanal, and two nitrogen heterocycles de-rived from Maillard reactions, trimethylpyrazine and 2,3-diethyl-5-methylpyrazine, pro-vided cocoa, praline-chocolate and nutty notes, with three others, 2,3-dimethylpyrazine,2,5-dimethylpyrazine and tetramethylpyrazine, likely making little contribution to show-ing only minimal effect to cocoa-chocolate flavour. Ethyl groups in pyrazine compoundssuggest key role of alanine and its Strecker aldehyde and acetaldehyde in dark choco-late flavour formation. Others, 2-methylbutanal, 5-ethenyltetrahydro-R,R,5-trimethyl-cis-2-furanmethanol (linalool oxide) and 3,7-dimethyl-1,6-octadien-3-ol (linalool), had likely noeffect on dark chocolate flavour character. Likewise, 2-phenylethanol, furfuryl alcohol (fur-furol), methylpyrazine, phenylacetaldehyde and 2,3,5-trimethyl-6-ethylpyrazine emerged ascompounds contributing caramel-like, sweet, honey and candy notes, with acetic acid con-tributing to acid-sour sensations. Matrix effects on flavour release in dark chocolate meritattention as new product development and consumers demand a wider range of origins anddefined products, and their influence on sensory effects with PSD and fat content remainsunclear.

P1: KAE/UKS P2: KAEc12 BLBK244-Afoakwa January 5, 2010 8:13 Printer Name: Yet to Come
12 Conclusions and industrialapplications
12.1 CONCLUSIONS: STRUCTURE–PROPERTIESRELATIONSHIPS IN CHOCOLATE MANUFACTURE
Modifications in particle size distribution (PSD) of suspended solids in chocolates couldbe employed to influence flow behaviour during industrial manufacture. This potential hasnot been fully realised due to a lack of pertinent information on the role of PSD in defin-ing rheological behaviour. This study has enhanced understanding on effects of PSD andcompositional variations on rheological (flow) properties and related quality characteristics.Research revealed that PSD parameters consist of many discrete components comprisingspecific surface area, largest particle size (PS) D(v,0.9), Sauter mean diameter (D[3,2]) andmean particle diameter (D[4,3]), all of which exert significant effects on chocolate viscosity.This was confirmed by examination of crystalline network microstructures in molten choco-lates varying in PSD and fat content. It was therefore concluded that PSD was a significantfactor, but not the only determinant controlling chocolate rheology. Fat content exerted great-est effect on the variability in the rheological properties of molten chocolate, followed bylecithin content and then PSD.
Multivariate procedures were used to explain relationships between the two models(Casson’s and the new International Confectionery Association, ICA, recommendations)used to determine dark chocolate viscosity. From this, it was found that the Casson referenceparameters (yield value and plastic viscosity) and new ICA recommendations (yield stressand apparent viscosity) for evaluating chocolate viscosity are very closely related, and couldbe used independently. However, the ICA method proved to be relatively more efficient thanthe Casson model, which has limitations with chocolates with wide variations in viscosity.It was therefore recommended that for routine quality control purposes, the calculation ofCasson’s reference parameters where the product history is known could be justified whilethe ICA would be better suited for research purposes with wide variations in componentviscosity.
Textural properties of both molten and solid tempered chocolates were noted to decreaselinearly with increasing PS, fat and lecithin contents. At low (25%) fat contents, 5 and 2%increases in fat and lecithin, respectively, enhanced PSD effects on texture, with no significanteffects at 30% or more fat. Effects on texture of changes in fat and lecithin depended onbase fat content. Increasing PSD and fat inversely influenced appearance parameters (L*,C* and h◦). Fat content exerted greatest effect on texture and appearance, followed by PSDand then lecithin content, with the last having no significant effect on appearance. Texturalparameters (firmness, consistency, cohesiveness, index of viscosity and hardness) and colourmeasurements (L*, C* and h◦) were highly correlated, suggesting prediction. The conclusion
P1: KAE/UKS P2: KAEc12 BLBK244-Afoakwa January 5, 2010 8:13 Printer Name: Yet to Come
Conclusions and industrial applications 231
was that PSD, fat and lecithin content all interact to determine texture and appearance indark chocolates, with significance for new product development and process improvements.
Microstructural analysis revealed that the smaller particles (D10, D50), the largest parti-cles (D90) and specific surface area had direct influence on packing ability and interpar-ticle interactions. At low (25%) fat concentrations, interparticle interaction of crystals ledto flocculation, with an impact on microstructure and behaviour of molten and temperedproducts. Increasing fat reduced the crystalline network density, created more open andvoid spaces which were filled with fat, reducing resistance to flow, and enhancing spread-ability and softening in products. Thus, application of PSD with fat and lecithin couldbe manipulated to control rheological and mechanical properties of molten and tempered(solid) chocolates, respectively, with importance for new product development and costs ofmanufacture.
Further work on melting properties using differential scanning calorimetry showed thatvariations in PSD, fat and lecithin content during dark chocolate manufacture influenced tovarying extents, the degree of crystallinity and melting properties (Tend, T index and �Hmelt) ofderived products. It was found that chocolates with finer particles, higher fat and lower lecithincontents, took longer and higher temperatures to complete melting than their correspondingproducts with larger PS, lower fat and higher lecithin content, suggesting that for chocolateof the same composition, processed under identical conditions, the PSD of the suspendednon-fat solid, fat and lecithin contents play important roles in determining their meltingbehaviour. These findings have applications in defining chocolate quality in terms of nature ofcrystalline material, dimensions of crystals and polymorphic stability that dictate mechanicaland rheological properties of chocolate products.
Rheological parameters (apparent viscosity and yield stress), textural parameters (firm-ness, index of viscosity and hardness) and melting index (duration or time) were highlypositively correlated, suggesting effective prediction. These explain that hardness (texture)could be effectively used to predict melting time (or duration) of finished dark chocolatesduring consumption. Other processing factors such as temper, polymorphism and coolingtemperature controls could contribute to the variability in hardness and melting index ofproducts. Principal component analysis revealed that with the exception of melting index,which showed a moderate shift in space, the rheological properties (apparent viscosity andyield stress) and textural properties (firmness, index of viscosity and hardness) were closelyrelated. PSD, fat and lecithin contents – all interact to determine rheological and textural prop-erties, and melting index (duration) of dark chocolates, with significance for manufacturingimprovements and quality control.
12.2 CONCLUSIONS: TEMPERING BEHAVIOUR FROMRESPONSE SURFACE METHODOLOGY
Tempering behaviours of dark chocolates varying in PSD and fat content were studiedusing models developed by response surface methodology. The models revealed that vari-ations in PSD and fat content of products influenced optimal temperature settings of tem-perers during pre-crystallisation of products, causing wide variations in chocolate tem-per units. Differences in fat content exerted greatest variability in temperature settings ofthe different zones of multistage temperers used, for attaining optimal tempered products.From this work, satisfactory and unsatisfactory temper regimes and corresponding temper
P1: KAE/UKS P2: KAEc12 BLBK244-Afoakwa January 5, 2010 8:13 Printer Name: Yet to Come
232 Chocolate Science and Technology
slopes and chocolate temper units were generated to enhance understanding of the dif-ferent temper regimes and boundaries of identification. Thus, different combinations oftempering temperatures could be employed to induce stable fat polymorph formationand are greatly dependent on fat content and partly PSD of the dark chocolate duringmanufacture.
12.3 CONCLUSIONS: EFFECTS OF TEMPERING ANDFAT CRYSTALLISATION ON MICROSTRUCTUREAND PHYSICAL PROPERTIES
Fat crystallisation behaviour during tempering of dark chocolate plays vital roles in defin-ing structure, mechanical properties and appearance of final products. Wide variations inmechanical properties and appearance were noted in products of differing PS and temperregime. PS was inversely related with texture and colour, with the greatest effects notedwith hardness, stickiness and visual lightness at all temper regimes. Overtempering causedincreases in product hardness, stickiness with reduced gloss and darkening of product sur-faces. Undertempering induced fat bloom in products with consequential quality defects intexture, colour and surface gloss. Also, it was noted that variations in PS had no influenceon crystallinity of dark chocolates whether optimally-, over- or undertempered. PS had alimited but significant direct relationship with certain melting parameters – Tonset, Tpeak and�Hmelt – independent of temper but significant inverse relationship with Tend and T index.Contrariwise, varying temper influenced crystallinity and chocolate melting properties (Tend,T index and �Hmelt). Undertempering of dark chocolate resulted in widened crystal size distri-bution with significant changes in Tend, T index and �Hmelt. Overtempering caused moderateincreases in crystal size distribution, with significant effects on Tend, T index and �Hmelt, butno changes were noted in Tonset, or Tpeak. Fat–sugar melting profiles were similar in allchocolates independent of PS and temper regime.
Examination using a stereoscopic binocular microscope revealed clear variations in sur-face and internal crystal network structures and interparticle interactions among optimallytempered, overtempered and undertempered (bloomed) samples. Blooming caused whiteningof both surface and internal peripheries with consequential effects on texture and appear-ance. Scanning electron micrography showed an even spatial distribution of numerous small,stable β-polymorph crystals in a network with well-defined interparticle connections in op-timally tempered chocolate. With overtempered chocolate there were large numbers of verysmall crystals in network with similar well-defined particle-to-particle connections resultingfrom formation of stable β-polymorphs with early nucleation: the outcome was growth ofseed crystals from melt into submicron primary crystallites and a fat crystal network sta-bilised by van der Waal forces. Undertempering resulted in dissolution of a large number ofsmall crystals, rearrangement and recrystallisation into a small number of larger (lumps) fatcrystals (Ostwald ripening). In this process there was polymorphic transformation, nucle-ation and growth of new large crystals in a more stable polymorphic form, with formationof solid bridges with weak and fewer intercrystal connections within chocolate structures.Thus, attainment of optimal temper regime during tempering of dark chocolate is necessaryfor achievement of premium quality products and avoidance of defects in microstructure,affecting mechanical properties, appearance and melting character.

P1: KAE/UKS P2: KAEc12 BLBK244-Afoakwa January 5, 2010 8:13 Printer Name: Yet to Come
Conclusions and industrial applications 233
12.4 CONCLUSIONS: FAT BLOOM FORMATION ANDDEVELOPMENT WITH UNDERTEMPERING
The rate of bloom development in undertempered dark chocolate was dependent on solids,PSD and storage time. Blooming was initiated in chocolates within 24 hours and essentiallycomplete by 96 hours. Changes during blooming were attributed primarily to growth of newfat crystals within the structural network with changes in light reflection, yielding increasesin surface whiteness and in hardness. From differential scanning calorimetry on meltingproperties, values for Tonset, Tend, Tpeak and �Hmelt suggested polymorphic transformationfrom βIV to βV within 24 hours and further to βVI after 72 hours. Micrographs showedsimilar crystal network structure and interparticle interactions in chocolates of different PSimmediately after tempering. Within 24 hours, liquid and unstable recrystallised fat hadappeared on surfaces with initiation of bloom. Unstable fat recrystallised during storage intomore stable polymorphs and crystal growth was promoted by Ostwald ripening with the ap-pearance of white crystalline structure that had spread gradually throughout entire chocolatemasses after 96 hours. Chocolate of the largest PS (50 µm) showed most rapid fat bloom,the smallest PS (18 µm) the slowest, attributed mainly to hydrodynamic forces of capillaryaction. It was concluded that bloom development was initiated by movement of liquid andunstable fat onto product surfaces through capillarity created by hydrodynamic forces withinthe interparticle pores and crevices, followed by growth of new fat crystals promoted bydiffusion gradients across the mass until the chocolate was fully bloomed. Understandingfat bloom formation and development in dark chocolate has potential applications in newproduct development.
12.5 CONCLUSIONS: FLAVOUR VOLATILES ANDMATRIX EFFECTS RELATED TO VARIATIONS IN PSDAND FAT CONTENT
Variations in flavour volatile release in chocolate matrices, varying in PSD andfat content, suggested potential effects of matrix structure and lipophilic–flavourinteractions. Increasing PS significantly reduced release of 3-methylbutanal, 2-phenylethanol, furfuryl alcohol (furfurol), acetic acid, methylpyrazine, 2,3-dimethylpyrazine,2,5-dimethylpyrazine, trimethylpyrazine, tetramethylpyrazine and 2,3,5-trimethyl-6-ethylpyrazine, 2-phenylethylacetate, 2-methylbutanal and 5-ethenyltetrahydro-R,R,5-trimethyl-cis-2-furanmethanol (linalool oxide). Fat content was directly related to headspaceconcentrations of compounds characterised by cocoa, chocolate, praline, fruity and roastednotes: trimethylpyrazine, 3-methylbutanal, 2,3-dimethylpyrazine, 2,5-dimethylpyrazine,tetramethylpyrazine, linalool oxide and 2,3,5-triethyl-5-methylpyrazine at all PSDs. Con-trariwise, there was an inverse relationship between matrix fat content and headspace concen-tration of 2-phenylethanol, furfuryl alcohol (furfurol), methylpyrazine, phenylacetaldehyde,2,3,5-trimethyl-6-ethylpyrazine and 2-carboxaldehyde-1-H-pyrrole likely due to lipophilicmatrix–flavour interactions.
The principal component analysis and regression models predicted contribution of volatilesto overall flavour character. One Strecker aldehyde, 3-methylbutanal, and two nitrogen hetero-cycles derived from Maillard reactions, trimethylpyrazine and 2,3-diethyl-5-methylpyrazine,provided cocoa, praline-chocolate and nutty notes, with three others, 2,3-dimethylpyrazine,
P1: KAE/UKS P2: KAEc12 BLBK244-Afoakwa January 5, 2010 8:13 Printer Name: Yet to Come
234 Chocolate Science and Technology
2,5-dimethylpyrazine and tetramethylpyrazine, likely making little contribution and show-ing only minimal effects on cocoa-chocolate flavours. Ethyl groups in pyrazine compoundssuggest a key role of alanine and its Strecker aldehyde and acetaldehyde in dark choco-late flavour formation. Others, 2-methylbutanal, 5-ethenyltetrahydro-R,R,5-trimethyl-cis-2-furanmethanol (linalool oxide) and 3,7-dimethyl-1,6-octadien-3-ol (linalool), had likely noeffect on dark chocolate flavour characters. Likewise, 2-phenylethanol, furfuryl alcohol (fur-furol), methylpyrazine, phenylacetaldehyde and 2,3,5-trimethyl-6-ethylpyrazine emerged ascompounds contributing caramel-like, sweet, honey and candy notes, with acetic acid con-tributing to acid-sour sensations. Matrix effects on flavour release in chocolate merit attentionfor new product development with consumer demand for a wider range of origins and definedproducts: sensory influences of PSD and fat content remain unclear.
12.6 INDUSTRIAL RELEVANCE AND APPLICATIONS OFRESEARCH FINDINGS IN THIS BOOK
The research findings in this book would be valuable to the chocolate confectionery industryas it brings greater understanding on the applicability of PSD and ingredient compositionto optimise flow behaviour and consequently textural and melting properties of finishedchocolates. PSD could be manipulated with the combined action of fat and lecithin to controlrheological properties of chocolates, with significance for quality control and reductions inproduction costs. This understanding would allow manufacturers to lower the viscosity ofchocolates without changing the composition or cost, or to lower fat content without affectingviscosity and quality.
In addition, findings on crystalline network microstructure of the molten chocolate ex-plained the defining role of PSD and fat content on the rheological, textural and meltingproperties of chocolates. These revealed that for chocolate of the same composition andprocessed under identical conditions, the PSD of the suspended non-fat solid, fat and lecithincontents play important roles in determining their melting behaviour. These findings wouldhave application in defining chocolate quality during manufacture in terms of nature of crys-talline material, dimensions of crystals and polymorphic stability that dictate mechanical andmelting properties.
Results from models developed to study tempering behaviour revealed that PSD andfat content of products influenced crystallisation behaviour during tempering of products,causing wide variations in chocolate temper units. From these, satisfactory and unsatisfactorytemper regimes and their corresponding temper slopes and chocolate temper units have beenprovided. These would limit the trial and errors currently used to identify appropriate temperregimes for chocolates, with industrial significance for reducing processing (tempering) timeswith assurance in quality control and shelf characteristics.
Finally, findings from the tempering and fat crystallisation behavioural studies showedthat attaining optimally tempering during pre-crystallisation of chocolate is necessary andplays vital roles in defining the structure, mechanical properties and appearance of finishedproducts. As well, information from the flavour studies showed that differences in productmatrices varying in PSD and fat content result in variations in flavour volatile release inchocolate systems, suggesting potential effects of matrix structure and lipophilic–flavourinteractions. These findings would help processors predict contribution of individual flavourvolatiles and suggest how these can be regulated to attain defined flavour characters during

P1: KAE/UKS P2: KAEc12 BLBK244-Afoakwa January 5, 2010 8:13 Printer Name: Yet to Come
Conclusions and industrial applications 235
manufacture. This knowledge is necessary for the achievement of premium quality products,manufacturing improvements, new product development and quality control.
12.7 RECOMMENDATIONS FOR FURTHERRESEARCH STUDIES
A number of points have been noted throughout this book that suggest the need for furtherin-depth investigations in chocolate research. These could include the following:
1. Further studies are required to integrate sensory and instrumental analyses of texture andflavour release from chocolate products varying in PSD and fat content, and establishrelationships using multivariate analyses.
2. Time–intensity procedures could be employed to characterise the effects of optimal temperand overtemper regimes on the melting behaviour of products during consumption. It couldalso be deployed to study effects of varying PSD and fat content on reported variations inmelting character of derived chocolates.
3. Some scientific findings from this book have revealed that the finer the chocolate, thesweeter the taste, since small crystals dissolve more rapidly than larger ones. However,there is no published systematic research on the effect of particle fineness on the flavourof chocolate. Further studies are required to elucidate the relationship between ingredientcomposition, PSD and its textural effects on the release of chocolate flavour volatiles andtheir perceived intensity during consumption.
4. Comparison of flavour characters in chocolate is complicated by variations caused bydifferent genotypes, geographical origin, pod differences, fermentation and drying meth-ods, and subsequent processing (roasting, alkalisation and conching). Although somemajor steps have been made to identify the causes of these variations, it is still prema-ture to conclude that this is fully understood. To fully understand variations in chocolatecharacter, further research is required to optimise post-harvest treatments (pod storage,pulp pre-conditioning, depulping, fermentation and drying) of cocoa beans differing ingenotype, subsequent manufacturing processes (roasting, alkalisation and conching) dur-ing chocolate manufacture as well the sensory evaluation of final flavour character inchocolate.
5. Milk chocolate solids comprise particles from sugar, non-fat milk components and cocoa.This study investigated PSD of solids from only sugar and cocoa, which cannot be relateddirectly to milk chocolate products. Changes in the sizes of particles from the other twoparticulate ingredients should also be investigated for effects on the physical and sensorycharacter in milk chocolates.
6. The effectiveness of conching could be studied using response surface methodology tooptimise conching efficiency in terms of time and temperature that are best suited for thedifferent types of chocolate products (white, milk and dark) during industrial manufacture.This will help reduce the inconsistencies in conching conditions.
P1: KAE/UKS P2: SFKref BLBK244-Afoakwa January 2, 2010 12:13 Printer Name: Yet to Come
References
Adamson, G. E., Lazarus, S. A., Mitchell, A. E., Prior, R. L., Cao, G., Jacobs, P. H., Kremers, B. G., Ham-merstone, J. F., Rucker, R. B., Ritter, K. A. & Schmitz, H. H. (1999). HPLC method for the quantificationof procyanidins in cocoa and chocolate samples and correlation to total antioxidant capacity. Journal ofAgricultural and Food Chemistry, 47, 4184–4188.
ADM Cocoa (2006). The De Zaan R© Cocoa Manual. The Netherlands: Archer Daniels Midland CompanyBV.
Aeschlimann, J. M. & Beckett, S. T. (2000). International inter-laboratory trials to determine the factorsaffecting the measurement of chocolate viscosity. Journal of Texture Studies, 31, 541–576.
Afoakwa, E. O. (2008). Cocoa and chocolate consumption – are there aphrodisiac and other benefits forhuman health? South African Journal of Clinical Nutrition, 21(3), 107–113.
Afoakwa, E. O., Paterson, A. & Fowler, M. (2007a). Factors influencing rheological and textural qualities inchocolate – a review. Trends in Food Science and Technology, 18(2007), 290–298.
Afoakwa, E. O., Budu, A. S. & Merson, B. A. (2007b). Response surface methodology for studying the effectof processing conditions on some nutritional and textural properties of bambara groundnuts (Voandzeisubterranea) during canning. International Journal of Food Sciences and Nutrition, 58(4), 270–281.
Afoakwa, E. O., Paterson, A. & Fowler, M. (2008b). Effects of particle size distribution and compositionon rheological properties of dark chocolate. European Food Research and Technology, 226, 1259–1268[doi.10.1007/s00217-007-0652-6].
Afoakwa, E. O., Paterson, A., Fowler, M. & Ryan, A. (2008a). Flavor formation and character in cocoaand chocolate: a critical review. Critical Reviews in Food Science and Nutrition, 48(9), 840–857 [doi:10.1080/10408390701719272].
Afoakwa, E. O., Paterson, A., Fowler, M. & Ryan, A. (2009b). Matrix effects of flavour volatiles releasein dark chocolates varying in particle size distribution and fat content. Food Chemistry, 113(1), 208–215.
Afoakwa, E. O., Paterson, A., Fowler, M. & Vieira, J. (2008c). Effects of tempering and fat crystallisationbehaviours on microstructure, mechanical properties and appearance in dark chocolate systems. Journalof Food Engineering, 89(2), 128–136.
Afoakwa, E. O., Paterson, A., Fowler, M. & Vieira, J. (2008d). Characterization of melting properties in darkchocolate from varying particle size distribution and composition using Differential scanning calorimetry.Food Research International, 41(7), 751–757 [doi:10.1016/j.foodres.2008.05.009].
Afoakwa, E. O., Paterson, A., Fowler, M. & Vieira, J. (2008e). Particle size distribution and compositionaleffects on textural properties and appearance of dark chocolates. Journal of Food Engineering, 87(2),181–190 [doi:10.1016/ j.jfoodeng.2007.11.025].
Afoakwa, E. O., Paterson, A., Fowler, M. & Vieira, J. (2008f). Relationships between rheological, texturaland melting properties of dark chocolates as influenced by particle size distribution and composition.European Food Research and Technology, 227, 1215–1223 [doi. 10.1007/s00217-008-0839-5].
Afoakwa, E. O., Paterson, A., Fowler, M. & Vieira, J. (2008g) Modelling tempering behaviour of darkchocolates from varying particle size distribution and fat content using response surface methodology.Innovative Food Science and Emerging Technologies, 9(4), 527–533 [doi:10.1016/j.ifset.2008.02.002].
Afoakwa, E. O., Paterson, A., Fowler, M. & Vieira, J. (2009a). Influence of tempering and fat crystallisationon microstructural and melting properties in dark chocolates. Submitted to the Food Research International,42(1), 200–209.
Afoakwa, E. O., Paterson, A., Fowler, M. & Vieira, J. (2009c). Comparative evaluation of rheological modelsused for evaluating dark chocolate viscosity. International Journal of Food Science and Technology, 44,162–167 [doi:10.1111/j.1365-2621.2008.01710.x].
P1: KAE/UKS P2: SFKref BLBK244-Afoakwa January 2, 2010 12:13 Printer Name: Yet to Come
References 237
Afoakwa, E. O., Paterson, A., Fowler, M. & Vieira, J. (2009d). Microstructure and mechanical propertiesrelated to particle size distribution and composition in dark chocolate. International Journal of FoodScience and Technology, 2009, 44, 111–119 [doi:10.1111/j.1365-2621.2007.01677.x].
Afoakwa, E. O., Paterson, A., Fowler, M. & Vieira, J. (2009e). Fat bloom development and structure-appearance relationships during storage of under-tempered dark chocolates. Journal of Food Engineering,91(4), 571–581 [doi:10.1016/j.jfoodeng.2008.10.011].
Afoakwa, E. O. & Sefa-Dedeh, S. (2002). Textural and microstructural changes associated with post-harvest hardening of trifoliate yam (Dioscorea dumetorum) pax tubers. Food Chemistry, 77, 279–284.
Aguilar, C., Rizvi, S. S. H., Ramirez, J. F. & Inda, A. (1991). Rheological behaviour of processed mustard I:effect of milling treatment. Journal of Texture Studies, 22, 59–84.
Aguilar, C. & Ziegler, G. R. (1995). Viscosity of molten milk chocolate with lactose from spray-dried-milkpowders. Journal of Food Science, 60(1), 120–124.
Aguilera, J. M. (2005). Why food microstructure? Journal of Food Engineering, 67, 3–11.Aguilera, J. M., Michel, M. & Mayor, G. (2004). Fat migration in chocolate: diffusion or capillary flow in a
particulate solid? Hypothesis paper. Journal of Food Science, 69(7), R167–R174.Alfonso, M., Neyraud, E., Blanc, O., Peyron, M. A. & Dransfield, E. (2002). Relationship between taste and
chewing patterns of visco-elastic model foods. Journal of Sensory Studies, 17, 193–206.Ali, A., Selamat, J., CheMan, Y. B. & Suria, A. M. (2001). Effect of storage temperature on texture,
polymorphic structure, bloom formation and sensory attributes of filled dark chocolate. Food Chemistry,72, 491–497.
Altimiras, P., Pyle, L. and Bouchon, P. (2007). Structure–fat migration relationships during storage ofcocoa butter model bars: bloom development and possible mechanisms. Journal of Food Engineering, 80,600–610.
Amin, I., Jinap, S., Jamilah, B., Harikrisna, K. & Biehl, B. (2002). Analysis of vicilin (7S)-class globulinin cocoa cotyledons from various genetic origins. Journal of the Science of Food and Agriculture, 82,728–732.
Amoye, S. (2006). Cocoa sourcing, world economics and supply. The Manufacturing Confectioner, 86(1),81–85.
Anjum, M. F., Tasadduq, I. & Al-Sultan, K. (1997). Response surface methodology: a neural networkapproach. European Journal of Operational Research, 101, 65–73.
Appelm, L. J., Champagne, C. M., Harsha, D. W. (2003). Effects of comprehensive lifestyle modification onblood pressure control: main results of the PREMIER clinical trial. JAMA. 289(16), 2083–2093.
Arora, A., Byrem, T. M., Nair, M. G. & Stasburg, G. M. (2000). Modulation of liposomal membrane fluidityby flavonoids and isoflavonoids. Archives of Biochemistry and Biophysics, 373, 102–109.
ASTM (1995). Standard test method for specular gloss. Designation D 523. In 1995 Annual Book ofASTM Standards. Volume 6.01: Paint-tests for Chemical, Physical and Optical Properties; Appearance;Durability of Non-metallic Materials. Philadelphia, PA: American Society for Testing and Materials.
Awua, P. K. (2002). Cocoa Processing and Chocolate Manufacture in Ghana. Essex, UK: David Jamiesonand Associates Press Inc.
Babin, H. (2005). Colloidal Properties of Sugar Particle Dispersions in Food Oils with Relevance to ChocolateProcessing. PhD. Thesis, Procter Department of Food Science, University of Leeds.
Bailey, S. D., Mitchell, D. G., Bazinet, M. L. & Weurman, C. (1962). Studies on the volatile components ofdifferent varieties of cocoa beans. Journal of Food Science, 27, 165–170.
Bainbridge, J. S. & Davies, S. H. (1912). The essential oil of cocoa. Journal of Chemical Society, 10,2209–2221.
Baixauli, R., Sanz, T., Salvador, A. & Fiszman, S. M. (2007). Influence of the dosing process on therheological and microstructural properties of a bakery product. Food Hydrocolloids, 21, 230–236.
Baker, B. S., Brown, B. D. & Anantheswaran, R. C. (2006). Measurement of yield stress in dark chocolateusing controlled stress vane method. Journal of Texture Studies, 37, 655–667.
Barylko-Pikielna, N. and Szczesniak, A. S. (1994). Taste and flavour perception in mayonnaise-type emulsionof various fat levels. Poland Journal of Food and Nutritional Sciences, 3, 57–70.
Bas, D. & Boyacı, I. H. (2007). Modeling and optimization I: usability of response surface methodology.Journal of Food Engineering, 78(3), 836–845.
P1: KAE/UKS P2: SFKref BLBK244-Afoakwa January 2, 2010 12:13 Printer Name: Yet to Come
238 References
Beckett, S. T. (1999). Industrial Chocolate Manufacture and Use, 3rd edn. Oxford: Blackwell PublishersInc., pp. 153–181, 201–230, 405–428, 460–465.
Beckett, S. T. (2000). The Science of Chocolate. London: Royal Society of Chemistry Paperbacks.Beckett, S. T. (2003). Is the taste of British milk chocolate different? International Journal of Dairy Tech-
nology, 56(3), 139–142.Beckett, S. T. (2008). The Science of Chocolate, 2nd edn. London: Royal Society of Chemistry Paperbacks.Beckett, S. T. (2009). Industrial Chocolate Manufacture and Use, 4th edn. Oxford: Blackwell Publishers
Inc., pp. 238–240, 277.Belitz, H. D. & Grosch, W. (1999). Food Chemistry, 2nd edn. Berlin: Springer-Verlag.Berbert, P. R. F. (1979). Contribuicao para o conhecimento dos acucares componentes da amendoa e do mel
de cacao. Revista Theobroma (Brasil), 9, 55–61.Biehl, B., Brunner, E., Passern, D., Quesnel, V. C. & Adomako, D. (1985). Acidification, proteolysis and
flavour potential in fermenting cocoa beans. Journal of Agriculture and Food Chemistry, 36, 583–598.Biehl, B., Heinrichs, H., Ziegler-Berghausen, H., Srivastava, S., Xiong, Q., Passern, D., Senyuk, V. I. &
Hammoor, M. (1993). The proteases of ungerminated cocoa seeds and their role in the fermentationprocess. Angew Botanica, 67, 59–65.
Biehl, B., Heinrichs, J., Voigt, G., Bytof, G. & Serrano, P. (1996). Nature of proteases and their actionon storage proteins in cocoa seeds during germination as compared with fermentation. In 12th CocoaResearch Conference, Salvador. Lagos, Nigeria: Cocoa Producers Alliance, pp. 18–23.
Biehl, B., Meyer, B., Said, M. & Samarakoddy, R. J. (1990). Bean spreading: a method for pulp precondi-tioning to impair strong nib acidification during cocoa fermentation in Malaysia. Journal of Agricultureand Food Chemistry, 51, 35–45.
Biehl, B. & Passern, D. (1982). Proteolysis during fermentation-like incubation of cocoa seeds. Journal ofAgriculture and Food Chemistry, 33, 1280–1290.
Biehl, B., Passern, D. & Sagemann, W. (1982b). Effect of acetic acid on subcellular structures of cocoa beancotyleydons. Journal of Agriculture and Food Chemistry, 33, 1101–1109.
Biehl, B. & Voigt, J. (1999). Biochemistry of cocoa flavour precursors. In Proceedings of the 12th Inter-national Cocoa Research Conference, Salvador, Brazil, 1996. Lagos, Nigeria: Cocoa Producers Alliance,pp. 929–938.
Biehl, B., Wewetzer, C. & Passern, D. (1982a). Vacuolar (storage) proteins of cocoa seeds and their degra-dation during germination and fermentation. Journal of Agriculture and Food Chemistry, 33, 1291–1304.
Boland, A. B., Delahunty, C. M. & van Ruth, S. M. (2006). Influence of the texture of gelatin gels and pectingels on strawberry flavour release and perception. Food Chemistry, 96, 452–460.
Bolenz, S., Amtsberg, K. & Schape, R. (2006). The broader usage of sugars and fillers in milk chocolatemade possible by the new EC cocoa directive. International Journal of Food Science and Technology, 41,45–55.
Bolliger, S., Zeng, Y. & Windhab, E. J. (1999). In-line measurement of tempered cocoa butter and chocolateby means of near-infrared spectroscopy. Journal of the American Oil Chemists Society, 76(6), 659–667.
Bomba, P. C. (1993). Shelf life of chocolate confectionery products. In Shelf Life Studies of Foods andBeverages. Charalambous, G. (Ed.). Amsterdam: Elsevier Science Publishers BV, pp. 341–351.
Bonanome, A., Pagnan, A., Biffanti, S., Opportuno, A., Sorgato, F., Dorella, M., Maiorino, M. & Ursini, F.(1992). Effect of dietary monounsaturated and polyunsaturated fatty acids on the susceptibility of plasmalow density lipoproteins to oxidative modification. Arteriosclerosis and Thrombosis, 12, 529–533.
Bourne, M. (2002). Food Texture and Viscosity: Concepts and Measurements. San Diego: Academic Press.Bouzas, J. & Brown, B. D. (1995). Interacting affecting microstructure, texture and rheology of chocolate
confectionery products. In Ingredient Interactions: Effects on Food Quality. Gaonkar, A. G. (Ed.). Marceland Dekker, New York, NY, pp. 451–528.
Braipson-Danthine, S. & Deroanne, C. (2004). Influence of SFC, microstructure and polymorphism on texture(hardness) of binary blends of fats involved in the preparation of industrial shortenings. Food ResearchInternational, 37, 941–948.
Bricknell, J. & Hartel, R. W. (1998). Relation of fat bloom in chocolate to polymorphic transition of cocoabutter. Journal of the American Oil Chemists’ Society, 75, 1609–1615.
Briggs, J. L. & Wang, T. (2004). Influence of shearing and time on the rheological properties of milk chocolateduring tempering. Journal of the American Oil Chemists Society, 81(2), 117–121.

P1: KAE/UKS P2: SFKref BLBK244-Afoakwa January 2, 2010 12:13 Printer Name: Yet to Come
References 239
Briones, V. & Aguilera, J. M. (2005). Image analysis of changes in surface color of chocolate. Food ResearchInternational, 38, 87–94.
Briones, V., Aguilera, J. M. & Brown, C. (2006). Effect of surface topography on color and gloss of chocolatesamples. Journal of Food Engineering, 77, 776–783.
Brown, M. B. (1993). Fairtrade: Reform and Realities in the International Trading System. London: ZedBooks.
Bueschelberger, H.-G. (2004). Lecithins. In Emulsifiers in Food Technology. Whitehurst, R. J. (Ed.). Oxford:Blackwell Publishing.
Buettner, A. & Schieberle, P. (2000). Influence of mastication on the concentrations of aroma volatiles insome aspects of flavour release and flavour perception. Food Chemistry, 71, 347–354.
Buijsse, B., Feskens, E. J. M., Kok, F. J. & Kromhout, D. (2006). Cocoa intake, blood pressure, andcardiovascular mortality. Archives of Internal Medicine, 166, 411–417.
Burger, J. (1992). Sensory evaluation techniques. Manufacturing Confectioner, 72(10), 56–60.Buttner, A., Beer, A., Hanning, C. & Settles, M. (2001). Observation of the swallowing process by application
of videoflouroscopy and real-time magnetic resonance imaging – consequences for retronasal aromastimulation. Chemical Senses, 26, 1211–1219.
Buyukpamukcu, E., Goodall, D. M., Hansen, C. E., Keely, B. J., Kochhar, S. & Wille, H. (2001). Char-acterization of peptides formed during fermentation of cocoa bean. Journal of the Science of Food andAgriculture, 49, 5822–5827.
BYK (1997). Haze-gloss. Application note. Accompanying handout to color and appearance. In SeminarGiven by BYK-Garden USA. Foster City, California.
Callis, J. (1995). Regulation of protein degradation. Plant Cell, 7, 845–857.Campos, R., Narine, S. S. & Marangoni, A. G. (2002). Effect of cooling rate on the structure and mechanical
properties of milk fat and lard. Food Research International, 35, 971–981.Carey, M. E., Asquith, T., Linforth, R. S. T. & Taylor, A. J. (2002). Modeling the partition of volatile
aroma compounds from a cloud emulsion. Journal of Agricultural and Food Chemistry, 50, 1985–1990.
Carnesecchia, S., Schneidera, Y., Lazarusb, S. A., Coehloc, D., Gossea, F. & Raul, F. (2002). Flavanols andprocyanidins of cocoa and chocolate inhibit growth and polyamine biosynthesis of human colonic cancercells. Cancer Letters, 175, 147–155.
Carr, J., Baloga, C., Guinard, X., Lawter, L., Marty, C. & Squire, C. (1996). The effect of gelling agent typeand concentration on flavour release in model systems. In Flavor–Food Interactions. McGorrin, R. J. &Leland, J. V. (Eds). Washington, DC: American Chemical Society, pp. 98–108.
Carr, J. G., Davies, P. A. & Dougan, J. (1979). Cocoa Fermentation in Ghana and Malaysia II. London:University of Bristol Research Station, Long Ashton, Bristol and Tropical Products Institute, Gray’s InnRoad.
Carrigan, M. & Attalla, A. (2001). The myth of the ethical consumer – do ethics matter in purchase behaviour?Journal of Consumer Marketing, 18, 560–578.
Castelli, W. P., Garrison, R. J., Wilson, P. W., Abbott, R. D., Kalousdian, W. B. and Kannel, R. (1986).Incidence of coronary heart disease and lipoprotein cholesterol levels. The Framingham Study. JAMA,256, 2835–2838.
Cerny, C. & Fay, L. B. (1995). Mechanism of formation of alkylpyrazine in the Maillard reaction. Journalof Agriculture and Food Chemistry, 43, 2818–2822.
Cerny, C. & Grosch, W. (1994). Precursors of ethylpyrazine isomers and 2,3-diethyl-5-methylpyrazineformed in roasted beef. Zeitschrift fur Lebensmittel-Untersuchung und Forschung A, 198, 210–214.
Cheng, D. C.-H. (2003). Characterization of thixotropy revisited. Rheology Acta, 42, 372–382.Chevalley, J. (1999). Chocolate flow properties. In Industrial Chocolate Manufacture and Use, 3rd edn.
Beckett, S. T. (Ed.). Oxford: Blackwell Science, pp. 182–200.Chhabra, R. P. (2007). Bubbles, Drops and Particles in Non-Newtonian Fluids, 2nd edn. Boca Raton, FL:
CRS Press.Christensen, C. M. (1984). Food texture perception. Advances in Food Research, 29, 159–199.Christiansen, K. F., Krekling, T., Kohler, A., Vegarud, G., Langsrud, T. & Egelandsdal, B. (2006). Microstruc-
ture and sensory properties of high pressure processed dressings stabilized by different whey proteins.Food Hydrocolloids, 20, 650–662.

P1: KAE/UKS P2: SFKref BLBK244-Afoakwa January 2, 2010 12:13 Printer Name: Yet to Come
240 References
Cidell, J. L. & Alberts, H. C. (2006). Constructing quality: the multinational histories of chocolate. Geoforum,37, 999–1007.
Clapperton, J., Lockwood, R., Romanczyk, L. & Hammerstone, J. F. (1994). Contribution of genotype tococoa (Theobroma cacao L.) flavour. Tropical Agriculture (Trinidad), 71, 303–308.
Clapperton, J. F. (1994). A review of research to identify the origins of cocoa flavour characteristics. CocoaGrowers’ Bulletin, 48, 7–16.
Cocoa and Chocolate Products Regulations (2003). Regulations for Cocoa and Chocolate Products. London,UK: Food Standard Agency.
Codex Revised Standard (2003). Codex Alimentarius Commission Revised Standard on Cocoa Products andChocolate. Report of the Nineteenth Session of the Codex Committee on Cocoa Products and Chocolate.Alinorm 03/14, pp. 1–37.
Coe, S. D. & Coe, M. D. (1996). The True History of Chocolate. London: Thames and Hudson.Cooper, A. K., Donovan, J. L., Waterhouse, A. L. & Williamson, G. (2008). Cocoa and health: a decade of
research. British Journal of Nutrition, 99, 1–11.Counet, C., Callemien, D., Ouwerx, C. & Collin, S. (2002). Use of gas chromatography-olfactometry to
identify key odorant compounds in dark chocolate. Comparison of samples before and after conching.Journal of Agriculture and Food Chemistry, 50, 2385–2391.
Counet, C. & Collin, S. (2003). Effect of the number of flavanol units on the antioxidant activity of procyanidinfractions isolated from chocolate. Journal of Agriculture and Food Chemistry, 51, 6816–6822.
Counet, C., Ouwerx, C., Rosoux, D. & Collin, S. (2004). Relationship between procyanidin and flavorcontents of cocoa liquors from different origins. Journal of Agriculture and Food Chemistry, 52, 6243–6249.
Daget, N. M. T. & Vallis, L. (1994). Release of flavour from chocolates differing in fat composition andconcentration. In Developments in Food Science, Vol. 35: Trends in Flavour Research. Maarse, H. & vander Heij, D. G. (Eds). The Netherlands: Noordwijkerhout.
Dankers, C. (2003). Environmental and social standards, certification and labelling for cash crops. TechnicalPaper No. 2, Commodities and Trade Division. Rome: Food and Agriculture Organization of the UnitedNations.
De La Cruz, M., Whitkus, R., Gomez-Pompa, A. & Mota-Bravo, L. (1995). Origins of cacao cultivation.Science, 375, 542–543.
De Wijk, R. A., Terpstra, M. E. J., Janssen, A. M. & Prinz, J. F. (2006). Perceived creaminess of semi-solidfoods. Trends in Food Science and Technology, 17, 412–422.
Decourcelle, N., Lubbers, S., Vallet, N., Rondeau, P. & Guichard, E. (2004). Effect of thickeners andsweeteners on the release of blended aroma compounds in fat-free stirred yoghurt during shear conditions.International Dairy Journal, 14, 783–789.
Deibler, K. T., Lavin, E. H., Linforth, R. S. T., Taylor, A. & Acree, T. E. (2001). Verification of a mouthsimulator by in vivo measurements. Journal of Agricultural and Food Chemistry, 49, 1388–1393.
Delahunty, C. M., Piggott, J. R., Conner, J. M. & Paterson, A. (1996). Comparison of dynamic flavourrelease from hard cheese and analysis of headspace volatiles from the mouth with flavour perceptionduring consumption. Journal of the Science of Food and Agriculture, 71, 273–281.
deMan, J. M. (1999). Relationship among chemical, physical, and textural properties of fats. In PhysicalProperties of Fats, Oils and Emulsions. Widlak, N. (Ed.). Champaign, IL: AOCS Press, pp. 79–95.
Denker, M., Parat-Wilhelms, M., Drichelt, G., Paucke, J., Luger, A., Borcherding, K., Hoffmann, W. &Steinhart, H. (2006). Investigations of the retronasal flavour release during the consumption of coffee withadditions of milk constituents by ‘Oral Breath Sampling’. Food Chemistry, 98, 201–208.
Denny, C. & Elliott, L. (2003). Agriculture: farming’s double standards, trade supplement. The Guardian.September 2003.
Despreaux, D. (1998). Le cacaoyer et la cacaoculture. In Cacao et Chocolates Production, Utilisation,Caracteristiques. Pontillon, J. (Ed.). Paris, France: Technique & Documentation Lavoisier, pp. 44–93.
Dhoedt, A. (2008). Food of the Gods – the rich history of chocolates. Agro-Foods Industry Hi-Tech Journal,19(3), 4–6.
Dhonsi, D. & Stapley, A. G. F. (2006). The effect of shear rate, temperature, sugar and emulsifier on thetempering of cocoa butter. Journal of Food Engineering, 77, 936–942.
di Tomaso, E., Beltramo, M. & Piomelli, D. (1996). Brain cannabinoids in chocolate. Nature, 382, 677–678.

P1: KAE/UKS P2: SFKref BLBK244-Afoakwa January 2, 2010 12:13 Printer Name: Yet to Come
References 241
Dias, J. C. & Avila, M. G. M. (1993). Influence of the drying process on the acidity of cocoa beans.Agrotropica, 5, 19–24.
Dietrich, P., Lederer, E., Winter, M. & Stoll, M. (1964). Recherches sur les aromes. Sur l’arome du cacao.Helvetica Chimica Acta, 47, 1581–1590.
Dijksterhuis, G. B. & Eilers, P. (1997). Modelling time-intensity curves using prototype curves. Food Qualityand Preference, 8, 131–140.
Dijksterhuis, G. B., Flipsen, M. & Punter, P. (1994). Principal component analysis of time-intensity curves:three methods compared. Food Quality and Preference, 5, 121–127.
Dimick, P. S. & Hoskin, J. C. (1999). The chemistry of flavour development in chocolate. In IndustrialChocolate Manufacture and Use, 3rd edn. Beckett, S. T. (Ed.). Oxford: Blackwell Science, pp. 137–152.
Do, T.-A. L., Hargreaves, J. M., Wolf, B., Hort, J. & Mitchell, J. R. (2007). Impact of particle size distributionon rheological and textural properties of chocolate models with reduced fat content. Journal of FoodScience, 72(9), E541–E552.
Doughty, M. (2002). Chocolate: Aphrodisiac or Euphamism? Available online: http://serendip.brynmawr.edu/biology/b103/f02/web2/mdoughty.html (accessed 12 October 2007).
Doyen, K., Carey, M., Linforth, R. S., Marin, M. & Taylor, A. J. (2001). Volatile release from an emulsion:headspace and in-mouth studies. Journal of Agricultural and Food Chemistry, 49, 804–810.
Eckert, M. & Riker, P. (2007). Overcoming challenges in functional beverages. Food Technology, April,20–25.
EFTA (2005). Fairtrade in Europe 2005 – Facts and Figures on the Fairtrade Sector in 25 EuropeanCountries. Brussels: European Fair Trade Association.
Engelen, L., de Wijk, R. A., Prinz, J. F., Janssen, A. M., Van Der Bilt, A., Weenen, H. & Bosman, F. (2003).A comparison of the effect of added saliva, alpha-amylase and water on texture and flavor perception insemisolid foods. Physiology and Behaviour, 78, 805–811.
Engelen, L., De Wijk, R. A., Prinz, J. F., Van Der Bilt, A., Janssen, A. M. & Bosman, F. (2002). The effect oforal temperature on the temperature perception of liquids and semisolids in the mouth. European Journalof Oral Science, 110, 412–416.
Engelen, L., De Wijk, R. A., Van Der Bilt, A. Prinz, J. F., Janssen, A. M. & Bosman, F. (2005). Relatingparticles and texture perception. Physiology and Behaviour, 86, 111–117.
Engelen, L., Van Der Bilt, A. & Prinz, J. F. (2008). Oral physiology and texture perception of semisolids.Journal of Texture Studies, 39, 83–113.
Engler, M. B. & Engler, M. M. (2006). The emerging role of flavonoid-rich cocoa and chocolate in cardio-vascular health and disease. Nutrition Review, 64, 109–118.
Engler, M. B., Engler, M. M., Chen, C. Y., Malloy, M. J., Browne, A., Chiu, E., Kwak, H. K., Milbury,P. M., Blumberg, J. & Mietus-Snyder, M. L. (2003). Effects of flavonoid-rich chocolate consumption onendothelial function and oxidative stress. FASEB Journal, 17, A1110–A1116.
Engler, M. B., Engler, M. M., Chen, C. Y., Malloy, M. J., Browne, A., Chiu, E. Y., Kwak, H. K., Milbury,P., Paul, S. M., Blumberg, J. & Mietus-Snyder, M. L. (2004). Flavonoid-rich dark chocolate improvesendothelial function and increases plasma epicatechin concentrations in healthy adults. Journal of AmericanCollege of Nutrition, 23, 197–204.
Erdman, J. W., Wills, J. & Finley, D. A. (2000). Chocolate: modern science investigates an ancient medicine.Journal of Nutrition, 130(Supplement 8S).
Eritsland, J. (2000). Safety considerations of polyunsaturated fatty acids. American Journal of ClinicalNutrition, 71, 197–201.
European Commission Directive (2000). European Commission Directive 2000/36/EC on Cocoa and CocoaProducts. Official Journal of the European Communities, L 197, 19–25.
Fairtrade Federation (1999). What does Fairtrade Really Mean. Available online: http://www.fairtradefederation.com (accessed 21 August 2007).
Fisher, N. D., Hughes, M., Gerhard-Herman, M. & Hollenberg, N. K. (2003). Flavanol-rich cocoa in-duces nitric-oxide-dependent vasodilation in healthy humans. Journal of Hypertension, 21, 2281–2286.
Flament, J., Willhalm, B. & Stoll, M. (1967). Recherches sur les aromes. Sur l’arome du cacao. HelveticaChimica Acta, 50, 2233–2243.
P1: KAE/UKS P2: SFKref BLBK244-Afoakwa January 2, 2010 12:13 Printer Name: Yet to Come
242 References
FLO (2005). Fairtrade Cocoa Standards for Small Farmer Organisations. Fairtrade Labelling OrganisationInternational Report. December 2005. Available online: http://www.fairtrade.org.uk (accessed 19 August2007).
FLO (2006). Fairtrade 2006 Annual Report. Fairtrade Labelling Organisation International, December 2006.Available online: http://www.fairtrade.org.uk (accessed 21 August 2007).
Fowler, M. S. (1999). Cocoa beans: from tree to factory. In Industrial Chocolate Manufacture and Use, 3rdedn. Beckett, S. T. (Ed.). Oxford: Blackwell Science, pp. 8–35.
Fowler, M. S., Leheup, P. & Cordier, J.-L. (1998). Cocoa, coffee and tea. In Microbiology of FermentedFoods. Wood, B. J. B. (Ed.). London: Blackie Academic and Professional, Vol. 1, pp. 128–147.
Frauendorfer, F. & Schieberle, P. (2006). Identification of the key aroma compounds in cocoa powder basedon molecular sensory correlations. Journal of Agriculture and Food Chemistry, 54, 5521–5529.
Full, N. A., Reddy, Y. S., Dimick, P. S. & Ziegler, G. R. (1996). Physical and sensory properties of milkchocolate formulated with anhydrous milk fat fractions. Journal of Food Science, 61, 1066–1084.
Gacula, M. C. (1997). Descriptive Sensory Analysis in Practice. Trumbull, CT: Food and Nutrition Press.Gebhardt, S. E. & Thomas, R. G. (2001). Changes in the USDA nutrient database for standard reference in
response to the new dietary reference intakes. Journal of the American Dietetic Association, 101(9), 1–12.Genovese, D. B., Lozano, J. E. & Rao, M. A. (2007). The rheology of colloidal and noncolloidal food
dispersions. Journal of Food Science, 72(2) R11–R20.Geographical (2004). The Trouble with Global Trade. London: Royal Geographical Society.German, J. B. & Dillard, C. J. (1998). Fractionated milkfat. Food Technology, 52, 33–37.Ghizzoni, C., Del Popolo, F., Colombo, E. & Porretta, S. (1995). Composition of volatile fraction of industrial
chocolate. Italian Food and Beverage Technology, 5, 3–13.Ghosh, V., Ziegler, G. R. & Anantheswaran, R. C. (2002). Fat, moisture, and ethanol migration through
chocolates and confectionary coatings. Critical Reviews in Food Science and Nutrition, 42(6), 583–626.
Gill, M. S., MacLeod, A. J. & Moreau, M. (1984). Volatile components of cocoa with particular reference toglucosinolate products. Phytochemistry, 23(9), 1937–1942.
Granvogl, M., Bugan, S. & Schieberle, P. (2006). Formation of amines and aldehydes from parent aminoacids during thermal processing of cocoa and model systems: new insights into pathways of the Streckerreaction. Journal of Agriculture and Food Chemistry, 54, 1730–1739.
Grassi, D., Lippi, C., Necozione, S., Desideri, G. & Ferri, C. (2005). Short-term administration of darkchocolate is followed by a significant increase in insulin sensitivity and a decrease in blood pressure inhealthy persons. American Journal of Clinical Nutrition, 81, 611–614.
Gu, L., House, S. E., Wu, X., Ou, B. & Prior, R. L. (2006). Procyanidin and catechin contents and antioxidantcapacity of cocoa and chocolate products. Journal of Agriculture and Food Chemistry, 54, 4057–4061.
Guilloteau, M., Laloi, M., Michaux, S., Bucheli, P. & McCarthy, J. (2005). Identification and characterisationof the major aspartic proteinase activity in Theobroma cacao seeds. Journal of the Science of Food andAgriculture, 85, 549–562.
Guinard, J.-X. & Marty, C. (1995). Time-intensity measurement of flavor release from a model gel system:effect of gelling agent type and concentration. Journal of Food Science, 60(4), 727–730.
Guinard, J.-X., Wee, C., McSunas, A. & Fritter, D. (2002). Flavor release from salad dressing varying in fatand garlic flavour. Food Quality and Preference, 13, 129–137.
Gutteridge, J. M. C. & Halliwell, B. (1994). Antioxidants in Nutrition, Health, and Disease. New York:Oxford University Press.
Haedelt, J., Pyle, D. L., Beckett, S. T. & Niranjan, K. (2005). Vacuum-induced bubble formation in liquid-tempered chocolate. Journal of Food Science, 70(2), 159–164.
Hammerstone, J. F., Lazarus, S. A. & Schmitz, H. H. (2000). Procyanidin content and variation in somecommonly consumed foods. Journal of Nutrition, 130, 2086S–2092S.
Hansen, C. E., del Olmo, M. & Burri, C. (1998). Enzyme activities in cocoa beans during fermentation.Journal of the Science of Food and Agriculture, 77, 273–281.
Hansen, C. E., Manez, A., Burri, C. & Bousbaine, A. (2000). Comparison of enzyme activities involved inflavour precursor formation in unfermented beans of different cocoa genotypes. Journal of the Science ofFood and Agriculture, 80, 1193–1198.
Harrison, R., Newholm, T. & Shaw, D. (2005). The Ethical Consumer. London: Sage.
P1: KAE/UKS P2: SFKref BLBK244-Afoakwa January 2, 2010 12:13 Printer Name: Yet to Come
References 243
Hartel, R. W. (1999). Chocolate: fat bloom during storage. The influence of structural elements. The Manu-facturing Confectioner, 79(5), 89–99.
Hartel, R. W. (2001). Crystallization in Food. Gaithersburg, MD: Aspen Publishers Inc.Hatano, T., Miyatake, H., Natsume, M., Osakabe, N., Takizawa, T., Ito, H. & Yoshida, T. (2002). Proantho-
cyanidin glycosides and related polyphenols from cacao liquor and their antioxidant effects. Phytochem-istry, 59, 749–758.
Hatcher, D. W., Symons, S. J. & Manivannan, U. (2004). Developments in the use of image analysis for theassessment of oriental noodle appearance and colour. Journal of Food Engineering, 61, 109–117.
Haylock, S. J. & Dodds, T. M. (1999). Ingredients from milk. In Industrial Chocolate Manufacture and Use,3rd edn. Beckett, S. T. (Ed.). Oxford: Blackwell Science, pp. 137–152.
Heath, H. B. (1982). Emulsifiers and stabilizers in food processing. Food Flavouring Ingredients Packagingand Processing, 4(9), 24–27.
Heath, R. M. & Prinz, J. F. (1999). Oral processing of foods and the sensory evaluation of texture. In FoodTexture: Measurement and Perception. Rosenthal, A. J. (Ed.). Gaithersburg, MD: Aspen, pp. 19–19.
Heinzler, M. & Eichner, K. (1991). Verhalten von Amadori-verbindungen wahrend der kakaoverarbeitung.1. Bildung und abbau von Amadori-verbindungen. Zeitschrjft Lebensmittel Untersuchung und ForschungA, 192, 24–29.
Hermann, F., Spieker, L. E., Ruschitzka, R., Sudano, I., Hermann, M., Binggeli, C., Luscher, T. F., Riesen,W., Noll, G. & Corti, R. (2006). Dark chocolate improves endothelial and platelet function. Heart, 92,19–120.
Herrera, M. L. & Hartel, R. W. (2000). Effect of processing conditions on the crystallization kinetics of milkfat model systems. Journal of the American Oil Chemists Society, 77, 1177–1187.
Hiiemae, K. M. & Palmer, J. B. (1999). Food transport and bolus formation during complete sequences onfoods of different initial consistency. Dysphagia, 14, 31–42.
Holland, B., Welch, A. A., Unwin, J. D. Buss, D. H. & Paul, A. A. (1991). McCance and Widdowson’s theComposition of Foods. London: RSC/MAFF.
Holm, C. S., Aston, J. W. & Douglas, K. (1993). The effects of the organic acids in cocoa on flavour ofchocolate. Journal of the Science of Food and Agriculture, 61, 65–71.
Hoskin, J. & Dimick, P. (1983). Role of nonenzymatic browning during the processing of chocolates – areview. Process Biochemistry, 11, 92–104.
Hoskin, J. & Dimick, P. (1984). Role of sulfur compounds in the development of chocolate flavours – areview. Process Biochemistry, 19, 150–156.
Hurst, W. J., Martin, R. A., Zoumas, B. L. & Tarka, S. M. (1982). Biogenic amines in chocolate – a review.Nutrition Reports International, 26, 1081–1086.
Hurst, W. J. & Toomey, P. B. (1981). High-performance liquid chromatographic determination of fourbiogenic amines in chocolate. Analyst, 106, 394–402.
Hutchings, J. B. (1994). Food Colour and Appearance. Glasgow, UK: Blackie A & P.Hyvonen, L., Linna, M., Tuorila, H. & Dijksterhius, G. B. (2003). Perception of melting and flavour re-
lease of ice cream containing different types and contents of fat. Journal of Dairy Science, 86, 1130–1138.
International Cocoa Organisation (ICCO) (2008). International Cocoa Organisation Report of Cocoa Statis-tics. The Manufacturing Confectioner, 88(3), 39–40.
International Confectionery Association (ICA) (1988). Determination of moisture content of cocoa andchocolate products. Analytical Method 26. Available from CAOBISCO, rue Defacqz 1, B-1000 Bruxelles,Belgium.
International Confectionery Association (ICA) (1990). Determination of fat content of cocoa and chocolateproducts. Analytical Method 37. Available from CAOBISCO, rue Defacqz 1, B-1000 Bruxelles, Belgium.
International Confectionery Association (ICA) (2000). Viscosity of cocoa and chocolate products. AnalyticalMethod 46. Available from CAOBISCO, rue Defacqz 1, B-1000 Bruxelles, Belgium.
International Confectionery Association (ICA) (2007). Statistical Review, 2007.International Office of Cocoa, Chocolate and Confectionery (IOCCC) (1973). Viscosity of chocolate. Deter-
mination of Casson Yield Value and Casson. Plastic Viscosity. London: OICC, p. 10.Jackson, K. (1999). Recipes. In Industrial Chocolate Manufacture and Use, 3rd edn. Beckett, S. T. (Ed.).
Oxford: Blackwell Science, pp. 323–346.

P1: KAE/UKS P2: SFKref BLBK244-Afoakwa January 2, 2010 12:13 Printer Name: Yet to Come
244 References
Jaffee, D. (2007). Brewing Justice – Fairtrade Coffee, Sustainability and Survival. Berkeley, CA: Universityof California Press.
Jaffee, D., Kloppenburg, J. R. & Monroy, M. B. (2004). Bringing the ‘moral charge’ home: Fairtrade withinthe North and within the South. Rural Sociology, 69, 169–196.
Jahns, G., Nielsen, H. M. & Paul, W. (2001). Measuring image analysis attributes and modelling fuzzyconsumer aspects for tomato quality grading. Computers and Electronics in Agriculture, 31, 17–29.
Janestad, H, Wendin, K, Ruhe, A. & Hall, G. (2000). Modelling of dynamic flavour properties with ordinarydifferential equations. Food Quality and Preference, 11, 323–329.
Jeffery, M. S. (1993). Key functional properties of sucrose in chocolate and sugar confectionery. FoodTechnology, 47(1), 141–144.
Jinap, S. & Dimick, P. S. (1990). Acidic characteristics of fermented and dried cocoa beans from differentcountries of origin. Journal of Food Science, 55(2), 547–550.
Jinap, S. & Dimick, P. S. (1991). Effect of roasting on acidic characteristics of cocoa beans. Journal of theScience of Food and Agriculture, 54, 317–321.
Jinap, S., Dimick, P. S. & Hollender, R. (1995). Flavour evaluation of chocolate formulated from cocoa beansfrom different countries. Food Control, 6(2), 105–110.
Jinap, S., Wan Rosli, W. I., Russly, A. R. & Nordin, L. M. (1998). Effect of roasting time and temperature onvolatile component profiles during nib roasting of cocoa beans (Theobroma cacao). Journal of the Scienceof Food and Agriculture, 77, 441–448.
Jo, C. & Ahn, D. U. (1999). Fat reduces volatiles production in oil emulsion system analyzed by purge-and-trap dynamic headspace/gas chromatography. Journal of Food Science, 64, 641–643.
Johansson, D. & Bergenstahl, B. (1992). The influence of food emulsifiers on fat and sugar dispersions inoils. I. Adsorption, sedimentation. Journal of American Oil Chemist Society, 69, 705–717.
Karim, M., McCormick, K. & Kappagoda, C. T. (2000). Effects of cocoa extracts on endothelium-dependentrelaxation. Journal of Nutrition, 130, 2105S–2108S.
Kattenberg, H. & Kemming, A. (1993). The flavor of cocoa in relation to the origin and processing of thecocoa beans. In Food Flavors, Ingredients and Composition. Charalambous, G. (Ed.). Amsterdam: ElsevierScience, pp. 1–22.
Kealey, K. S., Snyder, R. M., Romanczyk, L. J., Geyer, H. M., Myers, M. E., Withcare, E. J., Hammerstone, J.F. & Schmitz, H. H. (2001). Cocoa Components, Edible Products Having Enhanced Polyphenol Content,Methods of Making Same and Medical Uses. Patent Cooperation Treaty (PCT) WO 98/09533, USA: MarsIncorporated.
Kenneth, M. (1996). A Sexual Odyssey: From Forbidden Fruit to Cybersex. New York: Plenum, pp. 38–40.Keogh, K., Twomey, M., O’Kennedy, B. & Mulvihill, D. (2002). Effect of milk composition on spray-dried
high-fat milk powders and their use in chocolate. Lait, 82, 531–539.Kersiene, M., Adams, A., Dubra, A., De Kimpe, N. & Leskauskaite, D. (2008). Interactions between flavour
release and rheological properties in model custard desserts: effect of starch concentration and milk fat.Food Chemistry, 108, 1183–1191.
Kilcast, D. (1999). Sensory techniques to study food texture. In Food Texture Measurement and Perception.Rosenthal, A. J. (Ed.). USA: Chapman & Hall, Aspen, pp. 30–64.
Kilcast, D. & Clegg, S. (2002). Sensory perception of creaminess and its relationship with food structure.Food Quality and Preference, 13, 609–623.
Kilian, B., Pratt, L., Jones, C. & Villalobos, A. (2006). Is sustainable agriculture a viable strategy to improvefarm income in Central America? A case study on coffee. Journal of Business Research, 59, 322–330.
Kim, H. & Keeney, P. G. (1983). Method of analysis for (−)epicatechin content in cocoa beans by highperformance liquid chromatography. Journal of Food Science, 48, 548–551.
Kim, H. & Keeney, P. G. (1984). Epicatechin content in fermented and unfermented cocoa beans. Journal ofFood Science, 49, 1090–1092.
Kinta, Y. & Hatta, T. (2005). Composition and structure of fat bloom in untempered chocolate. Journal ofFood Science, 70, S450–S452.
Kirchhoff, P.-M., Biehl, B. & Crone, G. (1989). Peculiarity of the accumulation of free amino acids duringcocoa fermentation. Food Chemistry, 31, 295–311.
Krauss, R. M., Eckel, R. H., Howard, B., Appel, L. J., Daniels, S. R., Deckelbaum, R. J., Erdman, J. W., Jr,Kris-Etherton, P., Goldberg, I. J., Kotchen, T. A., Lichtenstein, A. H., Mitch, W. E., Mullis, R., Robinson,

P1: KAE/UKS P2: SFKref BLBK244-Afoakwa January 2, 2010 12:13 Printer Name: Yet to Come
References 245
K., Wylie-Rosett, J., St. Jeor, S., Suttie, J., Tribble, D. L. & Bazzarre, T. L. (2001). AHA ScientificStatement: AHA Dietary Guidelines: Revision 2000: a statement for healthcare professionals from theNutrition Committee of the American Heart Association. Journal of Nutrition, 131, 132–146.
Krawczyk, T. (2000). Chocolate’s hidden treasure. Inform, 11, 1264–1272.Kris-Etherton, P. M. & Keen, C. L. (2002). Evidence that the antioxidant flavonoids in tea and cocoa are
beneficial for cardiovascular health. Current Opinion in Lipodology, 13, 41–49.Kromhout, D., Menotti, A., Kesteloot, H. & Sans, S. (2002). Prevention of coronary heart disease by diet
and lifestyle: evidence from prospective cross-cultural, cohort, and intervention studies. Circulation, 105,893–898.
Kruger, C. (1999). Sugar and bulk sweetener. In Industrial Chocolate Manufacture and Use, 3rd edn. Beckett,S. T. (Ed.). Oxford: Blackwell Science, pp. 36–56.
Kulozik, U., Tolkach, A., Bulca, S. & Hinrichs, J. (2003). The role of processing and matrix design indevelopment and control of microstructures in dairy food production – a survey. International DairyJournal, 13, 621–630.
Kyi, T. M., Daud, W. R. W., Mohammad, A. B., Samsudin, M. W., Kadhum, A. A. H. & Talib, M. Z. M.(2005). The kinetics of polyphenol degradation during the drying of Malaysian cocoa beans. InternationalJournal of Food Science and Technology, 40, 323–331.
Laing, D. G. (1983). Natural sniffing gives optimum odour perception for humans. Perception, 12, 99–117.Laing, D. G. & Jinks, A. (1999). Temporal processing reveals a mechanism for limiting the capacity of
humans to analyze odor mixtures. Cognitive Brain Research, 8(3), 311–325.Laloi, M., McCarthy, J., Morandi, O., Gysler, C. & Bucheli, P. (2002). Molecular and biochemical charac-
terization of two proteinases TcAP1 and TcAP2 from Theobroma cacao seeds. Planta, 215, 754–762.Lamuela-Raventos, R. M., Romero-Perez, A. I., Andres-Lacueva, C. & Tornero, A. (2005). Review: health
effects of cocoa flavonoids. Food Science and Technology International, 11, 159–176.Lange, H. & Fincke, A. (1970). Kakao und schokolade. In Handbuch der Lebensmittel Band VI: Alkaloid-
haltige Genussmittel, GewuErze, Kochsalz. Acker, L., Bergner, K.-G. & Diemair. W. (Eds). Heidelberg,Germany: Springer-Verlag, pp. 210–309.
Lawless, H. T. & Heymann, H. (1998). Sensory Evaluation of Food: Principles and Practices. New York:Chapman & Hall.
Leake, L. L. (2009). Electronic noses and tongues. Food Technology, 6, 96–102.LeClair, M. S. (2002). Fighting the tide: alternative trade organizations in the era of global free trade. World
Development, 30(6), 949–958.Lee, K. W., Kim, Y. J., Lee, H. J. & Lee, C. Y. (2003). Cocoa has more phenolic phytochemicals and a higher
antioxidant capacity than teas and red wine. Journal of Agricultural and Food Chemistry, 51, 7292–7295.Lee, S. Y., Dangaran, K. L. & Krochta, J. M. (2002). Gloss stability of whey-protein/plasticizer coating
formulations on chocolate surface. Journal of Food Science, 67, 1121–1125.Lee, W. E. & Pangborn, R. M. (1986). Time-intensity: the temporal aspects of sensory perception. Food
Technology, 40(11), 71–82.Lee, W. E. III, Takahashi, K. & Pruitt, J. S. (1992). Temporal aspects of oral processing of viscous solutions.
Food Technology, 46(11), 106–112.Leemans, V., Magein, H. & Destain, M. (1998). Defects segmentation on Golden Delicious apples by using
colour machine vision. Computer and Electronics in Agriculture, 20, 117–130.Lehrian, D. W. & Patterson, G. R. (1983). Cocoa fermentation. In Biotechnology: A Comprehensive Treatise,
Vol. 5. Reed, G. (Ed.). Basel: Verlag Chemie, pp. 529–575.Ley, D. (1988). Conching. In Industrial Chocolate Manufacture and Use. Beckett, S. (Ed.). London: Blackie
& Son Limited.Liang, B. & Hartel, W. (2004). Effects of milk powders in milk chocolate. Journal of Dairy Science, 87,
30–31.Liedberg, B. & Owall, B. (1995). Oral bolus kneading and shaping measured with chewing gum. Dysphagia,
10, 101–105.Lindsey, B. (2003). Grounds for complaint? Understanding the ‘coffee crisis’. Trade Briefing Paper No. 16.
Washington, DC: Cato Institute.Linforth, R., Martin, F., Carey, M., Davidson, J. & Taylor, A. J. (2002). Retronasal transport of aroma
compounds. Journal of Agricultural and Food Chemistry, 50, 1111–1117.

P1: KAE/UKS P2: SFKref BLBK244-Afoakwa January 2, 2010 12:13 Printer Name: Yet to Come
246 References
Lipp, M. & Anklam, E. (1998). Review of cocoa butter and alternative fats for use in chocolate. Part A.Compositional data. Food Chemistry, 62, 73–97.
Lonchampt, P. & Hartel, R. W. (2004). Fat bloom in chocolate and compound coatings. European Journal ofLipid Science and Technology, 106, 241–274.
Lonchampt, P. & Hartel, R. W. (2006). Surface bloom on improperly tempered chocolate. European Journalof Lipid Science and Technology, 108, 159–168.
Lopez, A. (1979). Fermentation and organoleptic quality of cacao as affected by partial removal of pulpjuices from the beans prior to curing. Reviews Theobroma, 9, 25–37.
Lopez, A. & Quesnel, V. C. (1973). Volatile fatty acid production in cacao fermentation and the effect onchocolate flavour. Journal of the Science of Food and Agriculture, 24, 319–326.
Lopez, A. S. & Dimick, P. S. (1991). Enzymes involved in cocoa curing. In Food Enzymology, Vol. 2. Fox,P. F. (Ed.). Amsterdam: Elsevier, pp. 211–236.
Lopez, A. S. & Dimick, P. S. (1995). Cocoa fermentation. In Biotechnology: A Comprehensive Treatise, 2ndedn, Vol. 9. Reed, G. & Nagodawithana, T. W. (Eds). Enzymes, Food and Feed. Weinheim, Germany:VCH, pp. 563–577.
Lopez, A. S., Lehrian, D. W. & Lehrian, L. V. (1978). Optimum temperature and pH of invertase of the seedsof Theobroma cacao L. Reviews Theobroma, 8, 105–112.
Low, W. & Davenport, E. (2007). To boldly go. . .exploring ethical spaces to re-politicise ethical consumptionand fair trade. Journal of Consumer Behaviour, 6, 336–348.
Lucas, P. W. & Luke, D. A. (1983). Methods for analysing the breakdown of food in human mastication.Archives of Oral Biology, 28, 813–819.
Luna, F., Crouzillat, D., Cirou, L. & Bucheli, P. (2002). Chemical composition and flavor of Ecuadoriancocoa liquor. Journal of Agricultural and Food Chemistry, 50, 3527–3532.
MacDonald, H. M., Master, K. E. & Pettipher, G. L. (1994). Partial purification of cocoa seed proteins andstudies into the degradation of cocoa storage protein. Cafe, Cacao, The, 38(119), 124.
MacFie, H. J. H. & Liu, Y. H. (1992). Developments in the analysis of time-intensity curves. Food Technology,46(11), 92–97.
MacMillan, S. D., Roberts, K. J., Rossi, A., Wells, M. A., Polgreen, M. C. & Smith, I. H. (2002). In situsmall angle X-ray scattering (SAXS) studies of polymorphism with the associated crystallization of cocoabutter fat using shearing conditions. Crystal Growth and Design, 2(3), 221–226.
Malcolmson, L. J., Matsuo, P. R. & Balshaw, R. (1993). Textural optimization of spaghetti using response sur-face methodology: effects of drying temperature and durum protein level. Cereal Chemistry, 70, 417–423.
Maniere, F. Y. & Dimick, P. S. (1979). Effect of conching on the flavour and volatile components of darksemi-sweet chocolate. Lebensmittel-Wissenschaft u.-Technologie, 12, 102–107.
Marangoni, A. G. & McGauley, S. E. (2002). Relationship between crystallization behavior and structure incocoa butter. Crystal Growth Design, 3, 95–108.
Marangoni, A. G. & Narine, S. S. (2002). Identifying key structural indicators of mechanical strength innetworks of fat crystals. Food Research International, 35, 957–969.
Marion, J. P., Muggler-Chavan, F., Viani, R., Bricout, J., Reymond, D. & Egli, R. H. (1967). Sur la compositionde l’arome de cacao. Helvetica Chimica Acta, 50, 1509–1516.
Markov, E. & Tscheuschner, H. D. (1989). Instrumental texture studies on chocolate IV: comparison betweeninstrumental and sensory texture studies. Journal of Texture Studies, 20, 151–160.
Martin, R. A., Jr (1987). Chocolate. In Advances in Food Research, Vol. 31. Chicester, C. O. (Ed.). NewYork: Academic Press, pp. 211–342.
Maseland, R. & de Vaal, A. (2002). How fair is Fairtrade? De Economist, 150(3), 251–272.Mathur, S., Devaraj, S., Grundy, S. M. & Jialal, I. (2002). Cocoa products decrease low-density lipoprotein
oxidative susceptibility but do not affect biomarkers of inflammation in humans. Journal of Nutrition, 132,3663–3667.
Matsubara, N., Masataka, H. & Minakuchi, S. & Soma, K. (2002). Head movement in the occlusal phase ofmastication. Journal of Medical and Dental Sciences, 49, 37–42.
Max, B. (1989). This and that: chocolate addiction, the dual pharmacogenetics of asparagus eaters, and thearithmetic of freedom. Trends in Pharmacological Sciences, 10, 390–393.
Mazzanti, G., Guthrie, S. E., Sirota, E. B., Marangoni, A. G. & Idziak, S. H. J. (2003). Orientation and phasetransitions of fat crystals under shear. Crystal Growth and Design, 3(5), 721–725.

P1: KAE/UKS P2: SFKref BLBK244-Afoakwa January 2, 2010 12:13 Printer Name: Yet to Come
References 247
McCullough, M. L., Feskanich, D., Rimm, E. B. (2000). Adherence to the Dietary Guidelines for Americansand risk of major chronic disease in men. American Journal of Clinical Nutrition, 72(5), 1223–1231.
McFarlane, I. (1999). Instrumentation. In Industrial Chocolate Manufacture and Use. Beckett, S. T. (Ed.).New York: Chapman & Hall, pp. 347–376.
McHenry, L. & Fritz, P. J. (1992). Comparison of the structure and nucleotide sequences of vicilin genes ofcocoa and cotton raise questions about vicilin evolution. Plant Molecular Biology, 18, 1173–1176.
Meilgaard, M. C., Civille, G. V. & Carr, B. T. (1991). Sensory Evaluation Techniques, 2nd edn. Boca Raton,FL: CRC Press.
Mermet, G., Cros, E. & Georges, G. (1992). Etude preliminaire de l’optimisation des parametres de torrefac-tion du cacao. Consommation des precurseurs d’arome, development des pyrazines, qualite organoleptique.Cafe, Cacao, The, 36, 285–290.
Meullenet, J.-F., Carpenter, J. A., Lyon, B. G. & Lyon, C. E. (1997). Bi-cyclical instrument for assessingtexture profile parameters and their relationship to sensory evaluation of texture. Journal of Texture Studies,28, 101–118.
Meyer, B., Biehl, B., Said, M. B. & Samarakoddy, R. J. (1989). Post-harvest pod storage: a method of pulppreconditioning to impair strong nib acidification during cocoa fermentation in Malaysia. Journal of theScience of Food and Agriculture, 48, 285–304.
Miller, K. B., Stuart, D. A., Smith, N. L., Lee, C. Y., Mchale, N. L. Flanagan, J. A., Ou, B. & Hurst, W. J.(2006). Antioxidant activity and polyphenol and procyanidin contents of selected commercially availablecocoa-containing and chocolate products in the United States. Journal of Agriculture and Food Chemistry,54, 4062–4068.
Minifie, B. W. (1989). Chocolate, Cocoa and Confectionery – Science and Technology. London: Chapman& Hall.
Miquel, M. E., Carli, S., Couzens, P. J., Wille, H.-J. & Hall, L. D. (2001). Kinetics of the migration oflipids in composite chocolate measured by magnetic resonance imaging. Food Research International, 34,773–781.
Misnawi, S., Jinap, B., Jamilah, N. & Nazamid, S. (2003). Effects of incubation and polyphenol oxidase en-richment on colour, fermentation index, procyanidins and astringency of unfermented and partly fermentedcocoa beans. International Journal of Food Science and Technology, 38, 285–295.
Missaire, F., Qiu, G. & Rao, M. A. (1990). Research note yield stress of structured and unstructured foodsuspensions. Journal of Texture Studies, 21, 479–490.
Mohamed, A. A. A., Jowitt, R. & Brennan, J. G. (1982). Instrumental and sensory evaluation of crispness:I – in friable foods. Journal of Food Engineering, 1, 55–75.
Mohr, W. (1958). Studies on cocoa aroma with special emphasis on the conching of chocolate masse. FetteSeifen Anstrichmittel, 60, 661–660.
Mohr, W., Landschreiber, E. and Severin, T. (1976). On the specificity of cocoa aroma. Fette Seifen Anstrich-mittel, 78, 88–95.
Mongia, G. & Ziegler, G. R. (2000). Role of particle size distribution of suspended solids in defining flowproperties of milk chocolate. International Journal of Food Properties, 3, 137–147.
Mossu, G. (1992). Cocoa. London, UK: Macmillan.Muller, T. (2003). Schokolade – Neue Wege gehen. Susswaren, 11, 13–15.Mursu, J., Voutilainen, S., Nurmi, T., Rissanen, T. H., Virtanen, Y. J. K., Kaikkonen, J., Nen, Z. K. & Salonen,
J. T. (2004). Dark chocolate consumption increases HDL cholesterol Concentration and chocolate fattyacids may inhibit lipid peroxidation in healthy humans. Free Radical Biology and Medicine, 37(9),1351–1359.
Mutlu, A. & Gal, S. (1999). Plant aspartic proteinases: enzymes on the way to function. Physiology Plantarum,105, 569–576.
Myers, R. H. & Montgomery, D. C. (1995). Response Surface Methodology: Process and Product Optimiza-tion Using Designed Experiments. New York: John Wiley & Sons.
Narine, S. S. & Marangoni, A. G. (1999). Fractal nature of fat crystal networks. Physical Reviews E, 59,1908–1920.
Narine, S. S. & Marangoni, A. G. (2001). Elastic modulus as an indicator of macroscopic hardness of fatcrystal networks. LWT – Food Science and Technology, 34, 33–40.
Narine, S. S. & Marangoni, A. G. (2002). Structure and mechanical properties of fat crystal networks.Advances in Food and Nutrition Research, 44, 33–145.
P1: KAE/UKS P2: SFKref BLBK244-Afoakwa January 2, 2010 12:13 Printer Name: Yet to Come
248 References
Nazaruddin, R., Ayub, M. Y., Mamot, S. and Heng, C. H. (2001). HPLC determination of methylxanthinesand polyphenols levels in cocoa and chocolate products, Malaysian Journal Analytical Science, 7, 377–386.
Nelson, B. (1999). Tempering. In Industrial Chocolate Manufacture and Use. Beckett, S. T. (Ed.). New York:Chapman & Hall, pp. 231–258.
Neyraud, E., Prinz, J. F. & Dransfield, E. (2003). NaCl and sugar release, salivation and taste duringmastication of salted chewing gum. Physiology and Behaviour, 34, 426–430.
Noble, A. C., Matysiak, N. L. & Bonans, S. (1991). Factors affecting time-intensive parameters of sweetness.Food Technology, 45, 121–126.
Nuttall, C. & Hart, W. A. (1999). Chocolate marketing and other aspects of the confectionery industryworldwide. In: Industrial Chocolate Manufacture and Use, 3rd edn. Beckett, S. T. (Ed.). Oxford: Blackwell,pp. 439–459.
Oberparlaiter, S. & Ziegleder, G. (1997). Amyl alcohols as compounds indicative of raw cocoa bean quality.Zeitschrjft Lebensmittel Untersuchung und Forschung A, 204(2), 156–160.
Olinger, P. M. (1994). New options for sucrose-free chocolate. The Manufacturing Confectioner, 74(5),77–84.
Olinger, P. M. & Pepper, T. (2001). Xylitol. In Alternative Sweeteners. Nabors, O. L. (Ed.). New York:Marcel Dekker, pp. 335–365.
Osman, H., Nazaruddin, R. & Lee, S. L. (2004). Extracts of cocoa (Theobroma cacao L.) leaves and theirantioxidation potential. Food Chemistry, 86, 41–45.
Ou, B., Hampsch-Woodill, M. & Prior, R. L. (2001). Development and validation of an improved oxygenradical absorbance capacity assay using fluorescein as the fluorescent probe. Journal of Agricultural andFood Chemistry, 49, 4619–4626.
Ovejero-Lopez, I., Bro, R. & Bredie, W. L. P. (2005). Univariate and multivariate modelling of flavourrelease in chewing gum using time-intensity: a comparison of data analytical methods. Food Quality andPreference, 16, 327–343.
Overbosch, O., Van Den Enden, J. C. & Keur, B. M. (1986). An improved method for measuring perceivedintensity/time relationships in human taste and smell. Chemical Senses, 11, 331–338.
Palmer, J. B. & Hiiemae, K. M. (1997). Tongue jaw linkages in human feeding: a preliminary videofluoro-graphic study. Archives of Oral Biology, 42, 429–441.
Pangborn, R. M. & Kayasako, A. (1981). Time-course of viscosity, sweetness and flavour in chocolatedesserts. Journal of Texture Studies, 12, 141–150.
Parrish, B. D., Luzadis, V. A. & Bentley, W. R. (2005). What Tanzania’s coffee farmers can teach the world:a performance-based look at the fair trade–free trade debate. Sustainable Development, 13, 177–189.
Pereira, R. B., Singh, H., Munro, P. A. & Luckman, M. S. (2003). Sensory and instrumental texturalcharacteristics of acid milk gels. International Dairy Journal, 13, 655–667.
Perez-Martınez, D., Alvarez-Salas, C., Charo-Alonso, M., Dibildox-Alvarado, E. & Toro-Vazquez, J. F.(2007). The cooling rate effect on the microstructure and rheological properties of blends of cocoa butterwith vegetable oils. Food Research International, 40, 47–62.
Pettipher, G. L. (1990). The extraction and partial puriucation of cocoa storage proteins. Cafe, Cacao, The,34, 23–26.
Pietta, P. G. (2000). Flavonoids as antioxidants. Journal of Natural Products, 63, 1035–1042.Plumas, B., Hashim, L. & Chaveron, H. (1996). Measurement of the olfactive intensity of chocolate by
differential olfactometry. Food Control, 7, 117–120.Poelman, A., Mojet, J., Lyon, D. & Sefa-Dedeh, S. (2007). The influence of information about organic
production and fairtrade on preferences for and perception of pineapple. Food Quality and Preference,19(1), 114–121.
Pontillon, J. (1995). La fabrication du chocolat. In Pour la Science. Paris: Editions Belin, pp. 118–126.Prasad, V., Trappe, V., Dinsmore, A. D., Segre, P. N., Cipelletti, L. & Weitz, D. A. (2003). Universal features
of the fluid to solid transition for attractive colloidal particles. Rideal Lecture, Faraday Discuss, 123,1–12.
Prinz, J. F. (1999). Quantitative evaluation of bolus size and number of chewing strokes on the intra-oralmixing of a two-colour chewing gum. Journal of Oral Rehabilitation, 26, 243–247.
Prinz, J. F. & de Wijk, R. (2004). The role of oral processing in flavour perception. In Flavour Perception.Taylor, A. J. & Roberts, D. D. (Eds). Oxford: Blackwell Publishing.

P1: KAE/UKS P2: SFKref BLBK244-Afoakwa January 2, 2010 12:13 Printer Name: Yet to Come
References 249
Prinz, J. F. & Lucas, P. W. (1997). An optimization model for mastication and swallowing in mammals.Proceedings of the Royal Society of London. Series B, Biological Sciences, 264, 1715–1721.
Prinz, J. F. & Lucas, P. W. (2000). Saliva tannin interactions. Journal of Oral Rehabilitation, 27, 991–994.Prior, R. L., Hoang, H., Gu, L., Wu, X., Bacchiocca, M., Howard, L., Hampsch-Woodill, M., Huang, D.,
Ou, B. & Jacob, R. (2003). Assays for hydrophilic and lipophilic antioxidant capacity (oxygen radicalabsorbance capacity (ORAC) of plasma and other biological and food samples. Journal of Agriculturaland Food Chemistry, 51, 3273–3279.
Quesnel, V. C. & Roberts, J. A. (1963). Aromatic acids of fermented cocoa. Nature (London), 199, 605–606.Quevedo, R., Brown, C., Bouchon, P. & Aguilera, J. M. (2005). Surface roughness during storage of chocolate:
fractal analysis and possible mechanisms. Journal of The American Oil Chemists’ Society, 82, 457–462.
Rabe, S., Krings, U. & Berger, R. G. (2004). In vitro study of the influence physiological parameters ondynamic in-mouth flavour release from lipids. Chemical Senses, 29, 153–162.
Ramli, N., Hassan, O., Said, M., Samsudin, W. & Idris, N. A. (2006). Influence of roasting condition onvolatile flavour of roasted Malaysian cocoa beans. Journal of Food Processing and Preservation, 30(3),280–298.
Reaven, P., Parthasarathy, S., Grasse, B. J., Miller, E., Steinberg, D. & Witztum, J. L. (1991). Feasibility ofusing an oleate-rich diet to reduce the susceptibility of low-density lipoprotein to oxidative modificationin humans. American Journal of Clinical Nutrition, 54, 701–706.
Rector, D. (2000). Chocolate – controlling the flow. Benefits of polyglycerol polyricinoleic acid. The Manu-facturing Confectioner, 80(5), 63–70.
Rein, D., Paglieroni, T. G., Wun, T., Pearson, D. A., Schmitz, H. H., Gosselin, R. & Keen, C. L. (2000a).Cocoa inhibits platelet activation and function. American Journal of Clinical Nutrition, 72, 30–35.
Rein, D., Lotito, S., Holt, R. R., Keen, C. L., Schmitz, H. H. & Fraga, C. G. (2000b). Epicatechin in humanplasma: in vivo determination and effect of chocolate consumption on plasma oxidation status. Journal ofNutrition, 130, 2109S–2114S.
Reineccius, G. (2006). Flavour Chemistry and Technology, 2nd edn. Boca Raton, FL: CRC Press.Reineccius, G. A., Andersen, D. A., Kavanagh, T. E. & Keeney, P. G. (1972). Identification and quantification
of the free sugars in cocoa beans. Journal of Agriculture and Food Chemistry, 20, 199–202.Remeuf, F., Mohammed, S., Sodini, I. & Tissier, J. P. (2003). Preliminary observations on the effects of milk
fortification and heating on microstructure and physical properties of stirred yoghurt. International DairyJournal, 13, 773–782.
Rizzi, G. P. (1967). The occurrence of simple alkylpyrazines in cocoa butter. Journal of Agricultural andFood Chemistry, 15, 549–551.
Roberts, D. D. & Acree, T. E. (1995). Simulation of retronasal aroma using a modified headspace technique:investigating the effects of saliva, temperature, shearing and oil on flavour release. Journal of Agriculturaland Food Chemistry, 43, 2179–2186.
Roberts, D. D., Pollien, P. & Watzke, B. (2003). Experimental and modeling studies showing the effect oflipid type and level on flavour release from milk-based liquid emulsions. Journal of Agricultural and FoodChemistry, 51, 189–195.
Rohan, T. A. (1963). Processing of raw cocoa for the market. FAO Agricultural Studies Report, Number 60.Rome, Italy: FAO Press.
Rohan, T. A. (1964). The precursors of chocolate aroma: a comparative study of fermented and unfermentedbeans. Journal of the Science of Food and Agriculture, 29, 456–459.
Rohan, T. A. (1969). The flavor of chocolate. Food Processing and Marketing, 38, 12–17.Rohan, T. A. & Stewart, T. (1967). The precursors of chocolate aroma: production of free amino acids during
fermentation of cocoa beans. Journal of Food Science, 32, 395–398.Romanczyk, L. J., Hammerstone, J. F., Buck, M. M., Post, L. S., Cipolla, G. G., Micceland, C. A., Mundt,
J. A. & Schmitz, H. H. (1997). Cocoa Extract Compounds and Methods for Making and Using the Same.Patent Cooperation Treaty (PCT) WO 97/36497, USA: Mars Incorporated.
Rosenthal, A. J. (1999). Relation between instrumental and sensory measurement of food texture. In FoodTexture, Measurement and Perception. Rosenthal, A. J. (Ed.). USA: Chapman & Hall, Aspen, pp. 1–17.
Rossner, S. (1997). Chocolate – divine food, fattening junk or nutritious supplementation? European Journalof Clinical Nutrition, 51, 341–345.
P1: KAE/UKS P2: SFKref BLBK244-Afoakwa January 2, 2010 12:13 Printer Name: Yet to Come
250 References
Ross, J. A. & Kasum, C. M. (2002). Dietary flavonoids: bioavailability, metabolic effects, and safety. AnnualReview of Nutrition, 22, 19–34.
Rousseau, D. & Smith, P. (2008). Microstructure of fat bloom development in plain and filled chocolateconfections. Soft Matter, 4, 1706–1712.
Rousset, P., Sellappan, P. & Daoud, P. (2002). Effect of emulsifiers on surface properties of sucrose by inversegas chromatography. Journal of Chromatography A, 969, 97–101.
Rozin, P. (1991). Chocolate craving and liking. Appetite, 17, 199–212.Saeseaw, S., Shiowatana, J. & Siripinyanond, A. (2005). Sedimentation field-flow fractionation: size charac-
terization of food materials. Food Research International, 38(7), 777–786.Safeer, R. S. & Cornell, M. O. (2000). The emerging role of HDL cholesterol. Is it time to focus more energy
on raising high-density lipoprotein levels? Postgraduate Medicine, 108, 87–90, 93–98.Saguy, I. S. & Graf, E. (1991). Particle size effects on the diffuse reflectance of a sucrose-caramel mixture.
Journal of Food Science, 56, 1117–1120.Said, M. B., Jayawardena, M. P. G. S., Samarakoddy, R. J. & Perera, W. T. (1990). Preconditioning of fresh
cocoa beans prior to fermentation to improve quality: a commercial approach. The Planter, 66, 332–345.Salonia, A., Fabbri, F., Zanni, G., Scavini, M., Fantini, G. V., Briganti, A., Naspro, R., Parazzini, F., Gori, E.,
Rigatti, P. & Montorsi, F. (2006). Chocolate and women’s sexual health: an intriguing correlation. Journalof Sexual Medicine, 3(3), 476–482.
Sandoval-Castilla, O., Lobato-Calleros, C., Aguirre-Mandujano, E. & Vernon-Carter, E. J. (2004). Mi-crostructure and texture of yoghurt as influenced by fat replacers. International Dairy Journal, 14, 151–159.
Schantz, B. & Rohm, H. (2005). Influence of lecithin – PGPR blends on the rheological properties ofchocolate. European Journal of Food Research and Technology, 38, 41–45.
Schieberle, P., Gassenmeier, K., Sen, A., Guth, H. & Grosch, W. (1993). Character impact odor compoundsof different kinds of butter. Lebensmittel-Wissenschaft and Technologie, 26, 347–352.
Schieberle, P. & Pfnuer, P. (1999). Characterization of key odorants in chocolate. In Flavor Chemistry: 30Years of Progress. Teranishi, R., Wick, L. & Hornstein, I. (Eds). New York: Kluwer Academic/Plenum,pp. 147–153.
Schnermann, P. & Schieberle, P. (1997). Evaluation of key odorants in milk chocolate and cocoa mass byaroma extract dilution analyses. Journal of Agricultural and Food Chemistry, 45, 867–872.
Schwan, R. F., Rose, A. H. & Board, R. G. (1995). Microbial fermentation of cocoa beans, with emphasison enzymatic degradation of the pulp. Journal of Applied Bacteriology Symposium, Supplement, 79,96S–107S.
Schwan, R. F. & Wheals, A. E. (2004). The microbiology of cocoa fermentation and its role in chocolatequality. Critical Reviews in Food Science and Nutrition, 44, 205–221.
Segall, S. D., Artz, W. E., Raslan, D. S., Ferraz, V. P. & Takahashi, J. A. (2005). Analysis of triacylglycerolisomers in Malaysian cocoa butter using HPLC–mass spectrometry. Food Research Internationa, 38,167–174.
Seguine, E. S. (1988). Casson plastic viscosity and yield value: what they are and what they mean to theconfectioner. The Manufacturing Confectioner, 11, 57–63.
Seguine, E. S. (1991). Tempering – the inside story. Manufacturing Confectioner, 71, 118–125.Senanayake, S. P. J. N. & Shahidi, F. (2002). Lipase-catalyzed incorporation of docosahexaenoic acid (DHA)
into borage oil: optimization using response surface methodology. Food Chemistry, 77, 115–123.Servais, C., Jones, R. & Roberts, I. (2002). The influence of particle size distribution on the processing of
food. Journal of Food Engineering, 51, 201–208.Servais, C., Ranc, H. & Roberts, I. D. (2004). Determination of chocolate viscosity. Journal of Texture
Studies, 34, 467–497.Sharif, S. (1997). Effect of Alkalization and Quality of Cocoa Liquor from Different Origins. MSc thesis,
Pennsylvania State University.Shreck, A. (2005). Resistance, redistribution, and power in the Fairtrade banana initiative. Agriculture and
Human Values, 22, 17–29.Smith, K. W, Cain, F. W. & Talbot, G. (2007). Effect of nut oil migration on polymorphic transformation in
a model system. Food Chemistry, 102, 656–663.Soder, N. & Miller, N. (2002). Using ultrasound to investigate intrapersonal variability in durational aspects
of tongue movement during swallowing. Dysphagia, 17, 288–297.
P1: KAE/UKS P2: SFKref BLBK244-Afoakwa January 2, 2010 12:13 Printer Name: Yet to Come
References 251
Sokmen, A. & Gunes, G. (2006). Influence of some bulk sweeteners on rheological properties of chocolate.LWT- Food Science and Technology, 39, 1053–1058.
Soottitantawat, A., Bigeard, F., Yoshii, H., Furuta, T., Ohkawara, M. & Linko, P. (2005). Influence of emulsionand powder size on the stability of encapsulated D-limonene by spray drying. Innovative Food Scienceand Emerging Technologies, 6, 107–114.
Spampinato, C. (2007). Chocolate: Food of the Gods. Available online: http://www.carnegiemuseums.org/cmag/bk issue/1997/janfeb/dept6.htm (accessed 12 February 2007).
Spencer, M. E. & Hodge, R. (1992). Cloning and sequencing of a cDNA encoding the major storage proteinsof Theobroma cacao. Identification of the proteins as members of the vicilin class of storage proteins.Planta, 186, 567–576.
Stapley, A. G. F., Tewkesbury, H. & Fryer, P. J. (1999). The effects of shear and temperature history on thecrystallization of chocolate. Journal of the American Oil Chemists Society, 76(6), 677–685.
Stark, T., Bareuther, S. & Hofmann, T. (2005). Sensory-guided decomposition of roasted cocoa nibs (Theo-broma cacao) and structure determination of taste-active polyphenols. Journal of Agricultural and FoodChemistry, 53, 5407–5418.
Stark, T., Bareuther, S. & Hofmann, T. (2006a). Molecular definition of the taste of roasted cocoa nibs(Theobroma cacao) by means of quantitative studies and sensory experiments. Journal of Agricultural andFood Chemistry, 54, 5530–5539.
Stark, T. & Hofmann, T. (2005). Structures, sensory activity, and dose/response functions of 2,5-diketopiperazines in roasted cocoa nibs (Theobroma cacao). Journal of Agricultural and Food Chemistry,53, 7222–7231.
Stark, T., Justus, H. & Hofmann, T. (2006b). A stable isotope dilution analysis (SIDA) for the quantitativedetermination of N-phenylpropenoyl-L-amino acids in coffee beverage and cocoa. Journal of Agriculturaland Food Chemistry, 54, 2819–2867.
Steinburg, F. M., Bearden, M. M. & Keen, C. L. (2003). Cocoa and chocolate flavonoids: implications forcardiovascular health. Journal of American Dietetians Association, 103, 2125–2223.
Tabouret, T. (1987). Detection of fat migration in a confectionery product. International Journal of FoodScience and Technology, 22, 163–167.
Talbot, G. (1999). Chocolate temper. In Industrial Chocolate Manufacture and Use, 3rd edn. Beckett, S. T.(Ed.). Oxford: Blackwell Science, pp. 218–230.
Tang, D. & Marangoni, A. G. (2008). Modified fractal model and rheological properties of colloidal networks.Journal of Colloid and Interface Science, 318, 202–209.
Tapiero, H., Tew, K. D., Nguyen Ba1, G. & Mathe, G. (2002). Polyphenols: do they play a role in theprevention of human pathologies? Biomedical Pharmacotherapy, 56, 200–207.
Taubert, D., Roesen, R., Lehmann, C., Jung, N. & Schomig, E. (2007). Effects of low habitual cocoa intakeon blood pressure and bioactive nitric oxide. JAMA, 298(1), 49–60.
Taylor, A. J. (2002). Food Flavour Technology. Sheffield, UK: Sheffield Academic Press.Taylor, A. J. & Hort, J. (2004). Measuring proximal stimuli involved in flavour perception. In Flavour
Perception. Taylor, A. J. & Roberts, D. D. (Eds). Oxford: Blackwell Publishing.Taylor, A. J. & Roberts, D. D. (2004). Flavour Perception. Oxford: Blackwell Publishing.Taylor, A. J. & Roberts, D. D. (2005). Flavour perception – a review. Trends in Food Science and Technology,
16, 475–478.Tewkesbury, H., Stapley, A. G. F. & Fryer, P. J. (2000). Modelling temperature distributions in cooling
chocolate moulds. Chemical Engineering Science, 55, 3123–3132.Thai, C. N. & Shewfelt, R. L. (1991). Modeling sensory color quality of tomato and peach: neural networks
and statistical regression. Transactions of the American Association of Agricultural Engineers, 34, 950–955.
Timms, R. E. (2003). Interactions between fats, bloom and rancidity. In Confectionery Fats Handbook.Properties, Production and Applications. Timms, R. E. (Ed.). Bridgwater, UK: The Oily Press, pp. 255–294.
Toro-Vazquez, J. F., Perez-Martinez, D., Dibildox-Alvarado, E., Charo-Alonso, M. & Reyes-Hernandez,J. (2004). Rheometry and polymorphism of cocoa butter during crystallization under static and stirringconditions. Journal of the American Oil Chemists Society, 73(6), 195–202.
Trezza, T. A. & Krochta, J. M. (2000). The gloss of edible coatings as affected by surfactants, lipids, relativehumidity and time. Journal of Food Science, 65, 658–662.
P1: KAE/UKS P2: SFKref BLBK244-Afoakwa January 2, 2010 12:13 Printer Name: Yet to Come
252 References
Tscheuschner, H. D. & Wunsche, D. (1979). Rheological properties of chocolate masses and the influence ofsome factors. In Food Texture and Rheology. Sherman, P. (Ed.). New York: Academic Press, pp. 355–368.
Tyle, P. (1993). Effect of size, shape and hardness of particles in suspension on oral texture and palatability.Acta Psychologica, 84, 111–118.
Urbanski, J. J. (1992). Chocolate flavor/origins and descriptions on the effects of process and bean source.The Manufacturing Confectioner, 11, 69–82.
van Buuren, S. (1992). Analyzing time-intensity responses in sensory evaluation. Food Technology, 46(2),101–104.
van Marle, J. T., Stolle-Smitts, T., Donkers, J., van Dijk, C., Voragen, A. G. J. & Recourt, K. (1997).Chemical and microscopic characterization of potato cell wall during cooking. Journal of Agriculture andFood Chemistry, 45, 50–58.
Van Praag, M., Stein, H. S. & Tibetts, M. S. (1968). Steam volatile aroma constituents of roasted cocoa beans.Journal of Agricultural and Food Chemistry, 16, 1005–1008.
Varela, P., Salvador, A. & Fiszman, S. (2007). Changes in apple tissue with storage time: rheological, texturaland microstructural analyses. Journal of Food Engineering, 78, 622–629.
Vasanthan, T. & Bhatty, R. S. (1996). Physicochemical properties of small and large granule starches ofwaxy, regular, and high amylose barleys. Cereal Chemistry, 73, 199–207.
Vavreck, A. N. (2004). Flow of molten milk chocolate from an efflux viscometer under vibration at variousfrequencies and displacements. International Journal of Food Science and Technology, 39, 465–468.
Vernier, F. C. (1998). Influence of Emulsifiers on the Rheology of Chocolate and Suspensions of Cocoa orSugar Particles in Oil. PhD Thesis, Department of Chemistry, University of Reading.
Viaene, J. & Januszewska, R. (1999). Quality function deployment in the chocolate industry. Food Qualityand Preference, 10, 377–385.
Villagran, F. V., McCabe, G. M. & Wong, V. Y. L. (1996). Process for Making Reduced Fat Nut Spreads. USPatent 5490999. Cincinnati, OH: Procter & Gamble Co.
Vinson, J. A., Proch, J. & Zubik, L. (1999). Phenol antioxidant quantity and quality in foods: cocoa, darkchocolate, and milk chocolate. Journal of Agricultural and Food Chemistry, 47, 4821–4824.
Vitzthum, O. G., Werkhoff, P. & Hubert, P. (1975). Volatile components of roasted cocoa: basic fraction.Journal of Food Science, 40, 911–916.
Vohra, A. & Satyanarayana, T. (2002). Statistical optimization of the medium components by response surfacemethodology to enhance phytase production by Pichia anomala. Process Biochemistry, 37, 999–1004.
Voigt, J. & Biehl, B. (1995). Precursors of the cocoa specific aroma components are derived from thevicilin-class (7S) globulin of the cocoa seeds by proteolytic processing. Botanica Acta, 108, 283–289.
Voigt, J., Biehl, B., Heinrich, H., Kamaruddin, S., Gaim, Marsoner, G. & Hugi, A. (1994a). In vitro formationof cocoa-specific aroma precursors: aroma-related peptides generated from cocoaseed protein by co-operation of an aspartic endoprotease and a carboxypeptidase. Food Chemistry, 49, 173–180.
Voigt, J., Biehl, B. & Kamaruddin, S. (1993). The major seed proteins of Theobroma cacao L. Food Chemistry,47, 145–171.
Voigt, J., Heinrichs, H., Voigt, G. & Biehl, B. (1994b). Cocoa-specific aroma precursors are generated byproteolytic digestion of the vicilin-like globulin of cocoa seeds. Food Chemistry, 50, 177–184.
Voigt, J., Kamaruddin, S., Heinrichs, H., Wrann, D., Senyuk, V. & Biehl, B. (1995). Developmental stage-dependent variation of the levels of globular storage protein and aspartic endoproteinase during ripeningand germination of Theobroma cacao seeds. Journal of Plant Physiology, 145, 299–307.
Voltz, M. & Beckett, S. T. (1997). Sensory of chocolate. The Manufacturing Confectioner, 77, 49–53.Walter, P. & Cornillon, P. (2001). Influence of thermal conditions and presence of additives on fat bloom in
chocolate. Journal of the American Oil and Chemists Society, 78, 927–932.Walter, P. & Cornillon, P. (2002). Lipid migration in two-phase chocolate systems investigated by NMR and
DSC. Food Research International, 35, 761–767.Wan, Y., Vinson, J. A., Etherton, T. D., Proch, J., Lazarus, S. A. & Kris-Etherton, P. M. (2001). Effects of
cocoa powder and dark chocolate on LDL oxidative susceptibility and prostaglandin concentrations inhumans. American Journal of Clinical Nutrition, 74, 596–602.
Wang, J. F, Schramm, D. D., Holt, R. R., Ensunsa, J. L, Fraga, C. G, Schmitz, H. H. & Keen, C. L. (2000). Adose-response effect from chocolate consumption on plasma epicatechin and oxidative damage. Journalof Nutrition, 130, 2115S–2119S.
P1: KAE/UKS P2: SFKref BLBK244-Afoakwa January 2, 2010 12:13 Printer Name: Yet to Come
References 253
Watkins, K. (1998). Green dream turns turtle. The Guardian, September 9, 1998, 4.Weisburger, J. H. (2001). Chemopreventive effects of cocoa polyphenols on chronic diseases. Experimental
Biology and Medicine, 226, 891–897.Whitefield, R. (2005). Making Chocolates in the Factory. London: Kennedy’s Publications.Widder, S., Sen, A. & Grosch, W. (1991). Changes in the flavour of butter oil during storage. Zeitschrjft
Lebensmittel Untersuchung und Forschung A, 193, 32–35.Wijers, M. C. & Strater, P. J. (2001). Isomalt. In Alternative Sweeteners. Nabors, O. L. (Ed.). New York:
Marcel Dekker, pp. 265–281.Wilkinson, C., Dijksterhuis, G. B. & Minekus, M. (2000). From food structure to texture. Trends in Food
Science and Technology, 11, 442–450.Williams, J. S. E. (2000). Flavour Formation during the Drying of Chocolate Crumb. PhD Thesis, University
of Leeds, Proctor Department of Food Science.Windhab, E. J., Mehrle, Y., Stierli, F., Zeng, Y., Braun, P. & Boller, E. (2002). Verbesserung der Fettreifre-
sistenz durch neuartiges Temperieren – Kontinuierliche Impfkristallisation. Koln: Schoko-Technik.Wollgast, J. & Anklam, E. (2000a). Review of polyphenols in Theobroma cacao: changes in composition
during the manufacture of chocolate and methodology for identification and quantification. Food ResearchInternational, 33, 42–447.
Wollgast, J. & Anklam, E. (2000b). Polyphenols in chocolate: is there a contribution to human health? FoodResearch International, 33, 449–459.
Yamagishi, M., Osakabe, N., Natsume, M., Adachi, T., Takizawa, T., Kumon, H. & Osawa, T. (2001).Anticlastogenic activity of cacao: inhibitory effect of cacao liquor polyphenols against mitomycin C-induced DNA damage. Food Chemistry and Toxicology, 39, 1279–1283.
Yaseda, A. & Mochizuki, K. (1992). Behaviour of triglycerides under high pressure. In High Pressure andBiotechnology. Balny, C., Hayashi, R., Heremans, K. & Masson, P. (Eds). Japan: Meiji Seika Kaisha Ltd,pp. 255–259.
Yoo, B. & Rao, M. A. (1995). Yield stress of food dispersions with the vane method at controlled shear rateand shear stress. Journal of Texture Studies, 26, 1–10.
Zafar, H., Nordh, E. & Eriksson, P. O. (2000). Temporal coordination between mandibular and head-neckmovements during jaw opening-closing tasks in man. Archives of Oral Biology, 45, 675–682.
Zaibunnisa, A. H., Russly, A. R., Jinap, S., Jamilah, B. & Wahyudi, T. (2000). Quality characteristics ofcocoa beans from mechanical fermentation. Abstracts of 13th International cocoa Research Conference,Kota Kinabalu, Malaysia, p. 131.
Zehner, D. (2003). Response to Paul Rice’s rebuttal of ‘An economic assessment of “fair trade” in coffee’.In Chazen Web Journal of International Business. New York: Columbia University.
Ziegleder, G. (1990). Linalool contents as characteristic of some flavour grade cocoas. Zeitschrjft LebensmittelUntersuchung und Forschung A, 191, 306–309.
Ziegleder, G. (1991). Composition of flavor extracts of raw and roasted cocoas. Zeitschrjft LebensmittelUntersuchung und Forschung A, 193, 32–35.
Ziegleder, G. (1992). Grundlagen der Vorkristallisation. In Schoko-Technic 92. Solingen, Germany: Interna-tional ZDS-Fachtagung, sic-12.
Ziegleder, G., Moser, C. & Geier-Greguska, J. (1996). Kinetik der fettmigration in schokoladenprodukten.Teil I. Grundlagen und analytik. Fett/Lipid, 98, 196–199.
Ziegleder, G. & Schwingshandl, I. (1998). Kinetik der Fetmigration in Schokoladenprodukten. Teil III:Fettreif. Fett - Lipid, 100, 411–415.
Ziegleder, G. & Stojavic, E. (1988). Lagerungsbedingte veranderungen im aroma von milchschokoladen.Zeitschrjft Lebensmittel Untersuchung und Forschung A, 186, 134–138.
Ziegler, G. & Hogg, R. (1999). Particle size reduction. In Industrial Chocolate Manufacture and Use. Beckett,S. T. (Ed.). New York: Chapman & Hall, pp. 182–199.
Ziegler, G. R., Mongia, G. & Hollender, R. (2001). Role of particle size distribution of suspended solids indefining the sensory properties of milk chocolate. International Journal of Food Properties, 4, 353–370.
Zumbe, A. & Grosso, C. (1993). Product and Process for Producing Milk Chocolate. US Patent 5238698/EPPatent 0575070 A2.

P1: KAE/UKS P2: KAEappA BLBK244-Afoakwa January 25, 2010 15:10 Printer Name: Yet to Come
Appendix 1: Abbreviations usedand their meanings
AEDA Aroma extract dilution analysisANOVA Analysis of varianceASTM American Society for Testing and MaterialsCBE Cocoa butter equivalentCBR Cocoa butter replacerCBS Cocoa butter substituteCCRD Central composite rotatable designcDNA Complementary deoxyribonucleic acidCSD Crystal size distributionDSC Differential scanning calorimetryEC European CommissionEU European UnionFID Flame ionisation detectionGC Gas chromatographyGC-MS Gas chromatography–mass spectrometryGC-O Gas chromatography–olfactometryGMS Glycerol monostearatesGU Gloss unitsHRGC High-resolution gas chromatographyICA International Confectionery AssociationICCO International Cocoa OrganisationIOCCC International Office of Cocoa, Chocolate and ConfectioneryNCA/CMA National Confectioners Association/Chocolate Manufacturers
AssociationPC Principal componentPCA Principal component analysisPGPR Polyglycerol polyricinoleatePS Particle sizePSD Particle size distributionRSM Response surface methodologySDS-PAGE Sodium dodecyl sulfate polyacrylamide gel electrophoresisSEM Scanning electron microscopySPME Solid phase micro-extractionSSA Specific surface areaTAGs Triacylglycerols
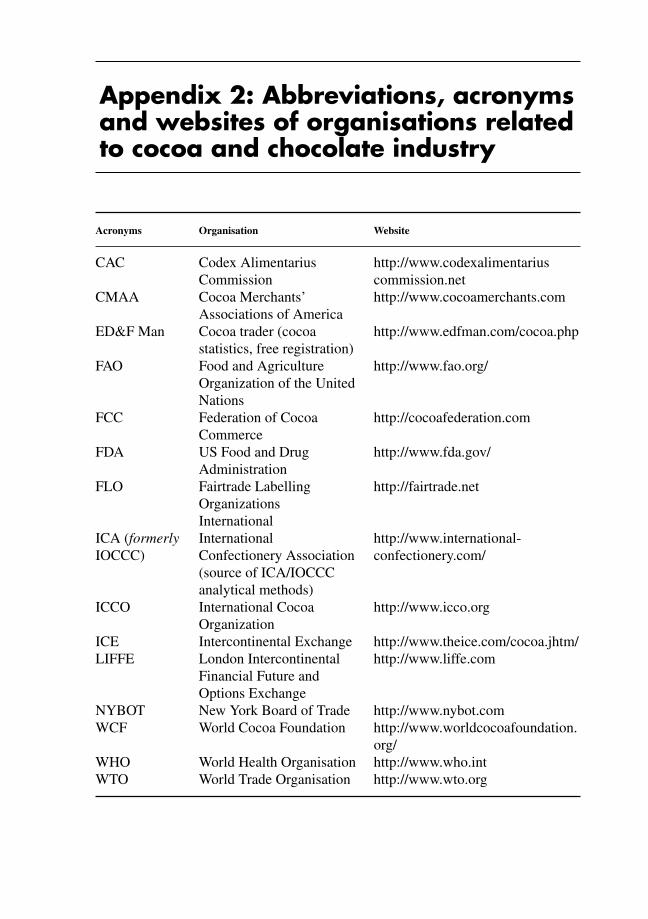
P1: KAE/UKS P2: KAEappB BLBK244-Afoakwa January 23, 2010 7:57 Printer Name: Yet to Come
Appendix 2: Abbreviations, acronymsand websites of organisations relatedto cocoa and chocolate industry
Acronyms Organisation Website
CAC Codex AlimentariusCommission
http://www.codexalimentariuscommission.net
CMAA Cocoa Merchants’Associations of America
http://www.cocoamerchants.com
ED&F Man Cocoa trader (cocoastatistics, free registration)
http://www.edfman.com/cocoa.php
FAO Food and AgricultureOrganization of the UnitedNations
http://www.fao.org/
FCC Federation of CocoaCommerce
http://cocoafederation.com
FDA US Food and DrugAdministration
http://www.fda.gov/
FLO Fairtrade LabellingOrganizationsInternational
http://fairtrade.net
ICA (formerlyIOCCC)
InternationalConfectionery Association(source of ICA/IOCCCanalytical methods)
http://www.international-confectionery.com/
ICCO International CocoaOrganization
http://www.icco.org
ICE Intercontinental Exchange http://www.theice.com/cocoa.jhtm/LIFFE London Intercontinental
Financial Future andOptions Exchange
http://www.liffe.com
NYBOT New York Board of Trade http://www.nybot.comWCF World Cocoa Foundation http://www.worldcocoafoundation.
org/WHO World Health Organisation http://www.who.intWTO World Trade Organisation http://www.wto.org
P1: KAE/UKS P2: KAEappC BLBK244-Afoakwa January 2, 2010 12:7 Printer Name: Yet to Come
Appendix 3: Glossary of chocolateterminologies
Bittersweet chocolate Also referred to as ‘dark chocolate’, this chocolate is manufacturedby blending a minimum amount of 35% cocoa liquor with variations of sugar, cocoa butter,emulsifiers and flavourings.
Bloom The appearance of fat or sugar on the surface of chocolate giving it white sheen orsometimes individual white blobs.
Casson equation√
τ = √τCA + √
η CA.√
γ
τ , yield stress; τCA, Casson yield stress; ηCA, Casson plastic viscosity; γ , shear rate.Cocoa butter A natural fat that is present in cocoa beans and obtained by pressing cocoa
liquor.Cocoa butter equivalent These are vegetable fats that are totally compatible with cocoa
butter and can be mixed with it in proportions stipulated by regulation.Cocoa butter replacer These are vegetable fats that may be mixed with cocoa butter but
only in a limited proportion by regulation.Cocoa liquor, cocoa mass Also known as chocolate liquor, this is composed of roasted and
ground cocoa nibs.Cocoa nibs Similar to cocoa cotyledons, these are cocoa beans with shells removed.Cocoa powder A product obtained by grinding or pulverising pressed cocoa cake and
available in different fat levels. It can be natural or manufactured by the Dutch process.Compound This is a confectionery product in which vegetable oil has been substituted for
cocoa butter.Dextrose Also known as glucose or cornstarch, it is a sweetener which is commercially
made from starch by the action of heat and acids or enzymes, resulting in the completehydrolysis of cornstarch. It is a reducing sugar that produces high-temperature browningeffects in baked foods. Industrially, it is used in ice-cream bakery products, confectionsand chocolate cookie drops. The sugar helps maintain the shape of the cookie drop duringbaking and reduces smearing of the chocolate after baking.
Dutching process This is an alkaline treatment of cocoa nibs prior to grinding, or theliquor prior to pressing. It facilitates darkening of the resultant cocoa liquor, modifies thechocolate flavour and also helps keep the cocoa solids in uniform suspension in chocolatebeverages.
Emulsifier A surface-active agent that promotes the formation and stabilisation of an emul-sion. Examples are lecithin and polyglycerol polyricinoleate that are used in chocolatemanufacturing to help control flow properties.
Enrobing The act of coating a candy centre by covering it with chocolate. This could bedone by either hand or mechanical means.
Fat bloom This is the visually undesirably white cast that appears on chocolate products asa result of poor or insufficient tempering or exposure of the chocolate to high temperatureswithout retempering.
Fermentation A process by which complex microbial interaction naturally modifies thecomposition of cocoa beans so that upon roasted it yields characteristic chocolate flavour.
P1: KAE/UKS P2: KAEappC BLBK244-Afoakwa January 2, 2010 12:7 Printer Name: Yet to Come
Appendix 3: Glossary of chocolate terminologies 257
Grinding A mechanical process by which roasted cocoa bean nib is reduced to a smoothliquid known as cocoa liquor.
Hard butter This is a class of specialty fats with physical properties similar to cocoa butter.They are typically solid to semisolid at ambient temperatures and melt relatively rapidlyat higher temperatures depending on application.
Lauric fat A vegetable fat typically containing 40–50% lauric fat acid and mainly obtainedfrom coconut and palm-kernel origin. Compound coatings containing lauric fats usuallyrequire appropriate tempering.
Lecithin A natural food additive which acts as an emulsifier and surface-active agent. Mostcommercial lecithin products are derived from soybean. In chocolate manufacture, itcontrols flow properties by reducing viscosity and it is typically used in ranges between0.1 and 0.5%.
Milk chocolate A chocolate product made by the combination of about 10% cocoa liquor,12% milk with cocoa butter, sugar or sweeteners, emulsifiers and some flavourings.
Natural process Non-alkalised cocoa liquor processed into cocoa powder without alkalinetreatment.
Non-lauric fat This is an edible fat which does not contain lauric fatty acids. Examples arecottonseed oil, soybean oil and palm oil. Manufacture of confectionery products containingnon-lauric fat typically requires no tempering and will possess a higher melting point.
Non-Newtonian liquid A liquid such as molten chocolate whose viscosity varies accordingto rate of stirring (shear).
Origin liquor Cocoa mass manufactured in country of bean origin.Particle fineness This is the measurement of average particle size of component solids in a
chocolate mix and is expressed in ten-thousandths of an inch or in microns.Plastic viscosity Amount of energy required to keep a non-Newtonian liquid moving once
motion has been initiated.Press cake The product that remains after most of the cocoa butter has been expressed from
the cocoa liquor. Press cake is pulverised for making cocoa powder.Pressing The process of partially removing cocoa butter from cocoa liquor by means of
hydraulic presses. The two products obtained after pressing are cocoa butter and pressedcake.
Roasting A cooking or heating process applied to cocoa beans using dry heat at hightemperatures to facilitate winnowing of the beans into nibs and also help develop thechocolate flavour.
Semisweet See ‘Bittersweet chocolate’, another name for semisweet.Sweet chocolate A chocolate product prepared by blending a minimum of 15% cocoa
liquor with varying amounts of sweeteners and cocoa butter. Flavourings may sometimesbe added.
Tempering The process of fat crystallisation during chocolate manufacture so that thefinished product solidifies in a stable crystal form. Proper tempering when followedprovides good contraction from moulds, good setting properties, good surface gloss andshelf-life characteristics. Tempering is a critical step in chocolate manufacture and certainconfectionery products.
Unsweetened baking chocolate This is a consumer term for cocoa or chocolate liquor.Vanillin An artificial substitute for vanilla.Viscosity A measure of the resistance to flow of molten chocolate and determines its abil-
ity to be pumped through pipes during industrial manufacture, and the extent to which
P1: KAE/UKS P2: KAEappC BLBK244-Afoakwa January 2, 2010 12:7 Printer Name: Yet to Come
258 Chocolate Science and Technology
the chocolate could be used to cover the centre of confectionery, cake, cookie or icecream. Chocolate viscosity is influenced by process, solids particle size distribution andformulation variations.
White chocolate A chocolate product composed of sugar, cocoa butter, whole milk andflavourings. In the United States, this product cannot be called chocolate since it does notcontain cocoa solids. It is sometimes referred to as white cocoa butter-based confectionerycoating.
Winnowing The process of cracking and removing the cocoa bean shell to reveal the innerpart of the bean, the ‘nibs’.
Yield value Amount of energy required to initiate motion in a non-Newtonian liquid, forexample molten chocolate.
P1: KAE/UKS P2: KAEind BLBK244-Afoakwa January 25, 2010 21:55 Printer Name: Yet to Come
Index
Aasted, 46, 108, 157–158, 176acetaldehyde, 64, 68, 219, 229, 234acetic acid, 23–24, 28, 43, 59, 64, 66–67,
220, 222–223, 225–228, 233–234acetic acid bacteria, 24Acetobacter, 24
aceti, 24pasteurianus, 24rancens, 24xylinum, 24
acid, 21, 23–24, 27–29, 33, 39, 43, 58–59,64–66, 72, 77, 80, 96, 229,234
acidity, 27, 39, 58–59, 64–65, 77, 82,216
acidoduric, 24acid-sour sensations, 229ADM, 9, 104, 157, 175, 200, 216adrenaline, 99aerobic condensation, 29, 33aerobic phase, 25, 29aerosols, 86Africa, 2–3, 15, 20–21, 27–28, 35, 37,
41, 58, 76, 94, 104, 175, 200, 216,228
aftertaste, 55, 78agglomeration, 42, 131Agilent Technologies, 218agricultural mulch, 38air blasting, 29air drying, 31alanine, 23, 64, 68, 229, 234albumin, 22alcohol, 29, 39, 51, 64, 68–70, 91, 215,
219–220, 225, 227–229, 233alcoholic fermentation, 23aldehydes, 39, 60, 62, 64, 66, 68–70, 76,
215, 219–220, 228–229, 233–234aldol, 63, 66alkali treatment, 64alkalisation (Dutch process), 12, 38–39, 41,
58, 64–65, 71–72, 235alkaloids, 20–22, 39, 77–78
aluminium, 178, 201aluminium pan, 178, 201Amadori compounds, 66Amazon, 1, 2, 27Amelonado, 15, 27America, 3, 4, 27, 98America Society for Testing and Materials
(ASTM), 201amine-assisted degradation, 59amines, 25, 60–61, 64, 66amino acids, 22, 25, 29, 34, 39, 59, 61–64,
66, 216aminopeptidase, 24anaerobic hydrolytic phase, 23, 29anaerobic yeasts, 23analysis of variance, 158, 175, 202anandamide, 100anthocyanin fractions, 21anthocyanins, 21–22, 27, 92–93antiatherosclerotic properties, 100anticarcinogenic activities, 98anticarcinogenic properties, 98antioxidants, 10, 35, 91–92, 95, 100, 215aphrodisiac, 91–92, 99–100apparent viscosity, 36, 53, 104–105,
107–108, 116, 118, 121–123appearance, 75–76, 174–175, 179, 183, 190,
193, 198–199, 202, 204, 206, 207, 210,212, 214, 230–234
arginine, 97aroma, 20, 22–24, 27, 29, 61, 68, 73–76, 78,
80, 83–85, 90, 215, 218aroma extract dilution analysis (AEDA), 68aromatic, 26–27, 29, 76, 80, 93Arriba, 16, 26, 76–77artisanal chocolate, 6Asia, 3–4, 27, 37aspartic endopeptidase, 22aspartic endoprotease, 22aspartic proteinase, 23, 25astringency, 25, 27, 29, 31, 34, 58, 65–66,
216astringent, 22, 59, 65, 78, 221, 228

P1: KAE/UKS P2: KAEind BLBK244-Afoakwa January 25, 2010 21:55 Printer Name: Yet to Come
260 Index
atherogenesis, 96atherosclerosis, 91, 96–97atmospheric pressure, 74atmospheric pressure chemical ionisation
mass spectrometry, 74Australasia, 5Australia, 4, 6Austria, 5–6automated kneaders, 41auxiliary flavours, 80Aztecs, 1, 91
Bacilluscereus, 24circulans, 24coagulans, 24megaterium, 24stearothermophilus, 24subtilis, 24
back extrusion, 109, 148Bahia, 27, 59ball mill, 40barley, 76basic cocoa, 1, 12basket fermentation, 27batch mixer, 41–42batch-to-batch consistency, 89beads mill, 40beans, 1–4, 9, 12, 14, 16, 18–22, 24–32, 35,
58–59, 71–72, 76, 80, 95, 215. Seecocoa beans
bean composition, 13, 20bean constituents, 33, 58bean cut test, 37bean genotype, 12–13, 215bean origin, 13bean selection, 58bean sizes, 37bean spreading, 29Belgium, 4, 6Bellafonte, 218benchmark cocoa flavour, 27Bingham, 102. See viscositybioactive compounds, 96Birmingham, 105, 157, 176, 200, 217biscuits, 8, 32, 51bitterness, 12, 22, 25, 27, 29, 31, 39,
58–59bittersweet, 38, 76–78black pod disease, 19blood lipid levels, 95blood pressure, 95–96, 99
bloom, 41, 44, 47, 53, 55–57, 75, 156, 178,180–181, 183–184, 186–188, 190,193–194, 197–198, 201, 203–204,206–208, 212, 214, 232–233
bob and cup geometry, 103–105, 107box fermentation, 27, 30Brazil, 1–4, 12, 20, 35, 37–38, 59, 64–65Brownian motion, 206browning reactions, 33. See also Maillard
reactionbudding, 14Bühler, 157, 200, 217bulk cocoa, 1, 12butanoic acid, 67butter fat, 43, 47
cacao, 1, 92, 95Cadbury, 41, 81caffeine, 21, 29, 77–78, 99calcium, 94–95Cameroon, 3, 12, 27cancer, 10, 91, 98Candida
castelli, 23guilliermondii, 23saitoana, 23
cannabinoid receptors, 92, 100capsids, 20Caracas, 27, 37caramel, 26, 29, 43, 58, 66, 68, 70–71,
76–77, 215, 220–221, 225–229, 234caramelisation, 66, 221caramelised flavour, 43, 58carbohydrate, 21, 35–36, 52, 94–95carbon dioxide, 23–24carbonyl–amino condensation reaction, 29carboxymethyl cellulose, 52carboxypeptidase, 22–24carcinogenic, 92, 97–99cardioprotective, 91, 100cardiovascular disease (CVD), 10, 91, 97,
99Cargill, 9, 104, 157, 175, 200, 216Caribbean islands, 1Casson, 49, 54–55, 101–104, 106, 112,
115–123, 146, 153, 230. See alsoplastic viscosity; yield value
Casson model, 55, 102, 120, 146, 154, 230Casson plastic viscosity, 54–55, 105, 107,
115–117, 119–123, 145–146, 153, 230Casson yield value, 54–55, 105, 107,
116–123, 145–146, 153, 230
P1: KAE/UKS P2: KAEind BLBK244-Afoakwa January 25, 2010 21:55 Printer Name: Yet to Come
Index 261
caster oil, 53catechins, 12, 21, 35, 92–95, 215Central America, 1Central composite rotatable design
(CCRD), 155, 158, 160Ceylon, 26cheese, 74China, 4, 7, 104, 157, 176, 200, 216chocolate, 1–4, 6–12, 14, 18, 20–22, 24,
29–31, 33, 35–36, 39, 41, 43, 45–50,53–58, 61, 63, 65–69, 71–76, 78–86,88–91, 94, 96–106, 108–109, 111, 113,115–121, 123–129, 131–139, 141–144,146–158, 159, 161, 165–172, 174–177,179–184, 186–194, 197–203, 205–210,213–216, 219, 221–222, 225–235
chocolate appearance, 205chocolate characters, 34, 58chocolate consumption, 2–3, 35, 73–74, 91chocolate defects, 55chocolate flavour, 29, 59, 74chocolate liquor, 66. See also cocoa massChocolate Manufacturers Association, 103chocolate mass, 156, 158, 174, 198, 200,
214chocolate melting profiles, 185chocolate microstructure, 175chocolate quality, 54–55, 74, 174, 234–235chocolate recipe, 58chocolate temper slope, 155chocolate temper units (CTU), 172, 234chocolate viscosity, 102, 153, 230chocolatl, 1cholesterol, 92, 95–98Christopher Columbus, 1CIELAB system, 177clean-in-place, 89cocoa, 1–33, 35–59, 64–65, 69–73, 75–78,
80–82, 85–86, 91–105, 112, 129, 136,155–157, 166, 169, 174–176, 180, 185,188, 190, 198–200, 206–207, 210, 212,215–217, 219–222, 225–229,233–235
cocoa, bulk, 12, 26, 35cocoa bean composition, 216cocoa beans, 1–4, 9, 12, 14, 19–20, 22, 24,
28–29, 31–32, 58, 64, 72, 77–78,215–216, 235
flat, 37smoky flavour, 80
cocoa butter, 1, 3, 39–45, 47, 49–53, 56–57,65, 75, 85, 92, 94, 104–105, 112,
155–158, 166, 169, 174–176, 180,198–200, 206, 216–217
cocoa butter equivalent (CBE), 47, 50cocoa butter replacer (CBR), 47, 51, 75cocoa fermentations, 24cocoa flavonoids, 92, 95, 96cocoa flavour, 20, 58cocoa fruits, 14–16cocoa genotypes, 26cocoa liquor, 2, 27, 39–42, 52, 64–65, 82,
94–95, 104–105, 157, 175–176, 200,216–217. See also cocoa mass
cocoa market, 3, 12cocoa mass, 24, 31, 68, 98cocoa nibs, 34, 50, 216cocoa pods, 17–19cocoa polyphenols, 96cocoa powder, 2, 32, 39–41, 64–65, 75, 92,
94–95, 188, 190, 207cocoa processing, 58, 219cocoa pulp, 23cocoa quality, 59cocoa solids, 2, 35, 39, 53, 82–83, 102, 105,
136, 190, 210, 212cocoa thrips, 20cocoa tree, 1, 12–14, 19–20. See also cacaococonut, 32, 51, 77coconut oil, 51, 77Codex Revised Standard, 105, 217coffee, 7, 70–71, 74, 221–222cohesiveness, 123–126colour, 12, 14, 20, 22, 25, 29–31, 33, 36, 39,
44–46, 52, 59, 61, 64, 75–76, 103,111–112, 128, 155, 175, 177, 179,183–184, 190, 193, 199, 201, 205–206,230
colour imaging analysis, 103colour intensity, 76computer vision, 103computerised tempermeter, 109, 201concentric cylinders, 102–103, 105, 107conche, 43, 55, 58, 66
Frisse, 43–44Lipp, 105, 158, 176, 217
conching, 2, 12, 41–43, 54, 65–66, 68,71–72, 74, 79–80, 82, 101–102, 112,158, 175, 202, 216, 219, 221, 226,235
confectionery, 2, 6, 8, 10, 41, 48, 51–54, 58,73–74, 97, 182, 193, 199, 226, 234
Congo, 26consistency, 75, 123–126

P1: KAE/UKS P2: KAEind BLBK244-Afoakwa January 25, 2010 21:55 Printer Name: Yet to Come
262 Index
consumer acceptability, 73consumer judgement, 73consumer likeness, 75consumer perception, 75, 80consumer preference, 35, 73continuous fat phase, 35continuous tempering, 45contraction, 46cooking chocolate, 50coolant fluid, 176, 200coolant temperatures, 155, 158, 160coolants, 155cooling curve, 158–159, 180–181copper, 94–95coronary heart diseases, 93correlation analysis, 144–145, 147–148correlation coefficient, 144–146, 149–150,
207Côte d’Ivoire, 2–5, 12, 58–59cotyledons, 18, 21–22, 24–25, 28–29, 39,
92Couette geometry, 47counterhegemonic act, 8Criollo, 1, 12, 21–22, 26, 35Croatia, 4crumb, 82, 128Crypto Peerless mixer, 105, 157, 176, 200,
217crystal growth, 45, 109crystal lattice formation, 47crystal maturity, 170crystal network organisation, 172, 174, 198crystal nucleation, 45crystal seed, 47crystal size distribution (CSD), 141, 174,
185crystal structure, 212crystal type, 185crystalline network density, 153, 230crystalline network structure, 101, 174crystalline-state distribution, 134, 185crystallinity, 135, 153–154, 174, 185crystallisation, 41, 44, 46, 56–57, 109, 141,
144, 150, 155–156, 158, 165, 172,174–175, 179–181, 185, 198, 232,234
crystallisation behaviour, 155, 172, 180,185
crystallisation conditions, 172, 175, 198crystallisation heat, 180crystallisation temperature, 172crystallised network microstructure, 175
crystallised state, 186crystallised TAG systems, 175, 199cut test, 29, 37cyanidin-3-α-l-arabinoside, 21cyanidin-3-β-d-galactoside, 21cyanidins, 25cyclo-oxygenase 1 and 2 (COX-1 and
COX-2), 96
dandelion, 76dark chocolate, 6–7, 10, 35–36, 42, 56,
65–66, 68–69, 71–72, 76, 78, 94–96,98–99, 101, 104–105, 107, 110–111,113, 115–121, 129, 131, 133–136,138–139, 141–144, 146–149, 151–157,161–162, 165, 169, 172–175, 179–185,187–194, 197–200, 202–203, 205–210,213–217, 219, 222, 225–233, 235
defatted cocoa powder, 2degree of crystallinity, 135, 153–154degree of roasting, 40dehydroreductone, 61demoulding, 41, 109, 174Denmark, 6, 108, 158, 176, 200, 217density, 2, 13, 153, 231deoxyhexosulose, 59deoxyribonucleotides, 99depulping, 33, 235descriptive analysis, 55descriptive sensory tests, 80dextrose, 51. See also fructosediabetes, 92diabetic chocolate, 51diet modification, 92dietary flavonoids, 93dietary supplementation, 91differential scanning calorimetry (DSC),
111, 138–139, 141–142, 175, 178,185–188, 201, 207, 212, 231, 233
diffusion, 22, 24, 83, 198–199, 214, 225diketopiperazines, 29dioxo compounds, 64disc mill, 40diseases, 13, 16, 18–20, 35, 91D-limonene, 48Dominican Republic, 3dopamine, 99dried cocoa beans, 32drug-induced psychoses, 100drying, 9, 12, 26–27, 29, 31, 33–34, 39, 52,
59, 66, 72, 74, 77, 82, 216, 235drying platform, 30

P1: KAE/UKS P2: KAEind BLBK244-Afoakwa January 25, 2010 21:55 Printer Name: Yet to Come
Index 263
drying methods, 235DSC thermograms, 142duo–trio test, 80Dutch, 1, 39, 75, 96Dutch process, 38–39. See also alkalisation
Ecuador, 1, 3, 5, 12, 16, 26–27, 37, 59,76–77
Ecuadorian beans, 59electron micrographs, 197electronic noses, 89electronic tongues, 89electrophoretic, 22endocannabinoid levels, 92, 100endoprotease, 22–23endorphins, 99endothelial function, 91, 96endothelial nitric oxide synthase (eNOS), 96endothermic transitions, 185, 207England, 108–109, 158, 200enrobing, 42, 116, 123, 144enthalpy, 138, 178, 187, 201, 207enthalpy of melting, 138environment, 8–10, 61, 215enzymatic mechanism, 66enzyme, 23, 25–26, 28, 33, 72, 76, 84, 86,
99–100epicatechin, 12, 21, 35, 92–93, 95, 215epigallocatechin, 21, 92epithelial sensations, 186esterification, 53, 199esters, 39, 53, 64, 66, 68–69, 215–216, 220ethanol, 23–24, 28ether, 70ethical consumerisms, 8euphoria, 92, 99Europe, 1, 3, 5, 7–8, 10European, 1, 4, 5, 7, 10, 48, 52European Commission Directive, 105, 157,
217European Union, 50, 52exopeptidase, 22
Fairtrade, 7–10, 35, 75Fairtrade cocoa, 7–8Fairtrade Labelling Organization (FLO), 7fat, 21, 35–37, 39–41, 44–46, 49–52, 54–57,
65–66, 76, 79, 82–83, 86, 92, 94–95,98, 102, 104–106, 112–113, 115–120,123–124, 126, 128–129, 131–132, 134,136–144, 147–152, 154–158, 161–162,164–176, 178–182, 185, 187–190,
197–199, 202, 204, 206–207, 209–210,212–217, 219, 225–235
fat bloom, 41, 44–45, 55–57, 156, 166, 174,190, 198–199, 206–207, 232–233. Seealso bloom
fat crystallisation, 144, 155–158, 161–162,164–176, 178–182, 185, 187–190,197–199, 202, 204, 206–207, 209–210,212–217, 219, 225–235
fat crystals, 45, 56, 165, 170fat–sugar melting profiles, 174, 197fatty acid, 44, 50, 52–53, 66, 98, 175, 199,
216fermentation, 8, 9, 12, 17–19, 21–31,
33–34, 36, 38–39, 59, 65–66, 72, 74,77–78, 82, 216, 235
fermenting pulp, 23Fernando Po, 1Finland, 6firmness, 79, 109–110, 112, 123–125, 127,
129–131, 144–149, 151–154, 230–231five-roll refiner, 41, 43. See also millflame ionisation detector (FID), 71flavan-3,4-diol, 21flavanol, 93, 95, 97, 99flavanones, 93flavones, 93flavonoid, 10, 35, 65, 72, 91–93, 95–96, 100flavonoid-rich cocoa, 91–93flavour, 9, 11–12, 14, 17–18, 21–24, 26–27,
29–31, 33, 37, 39, 42–43, 49, 51–52,55–59, 61, 66, 68–69, 73–77, 80–81,84–88, 90, 151, 215–216, 218–221,225–226, 228–229, 233–235
flavour character, 12, 27, 29, 225–227, 235flavour compounds, 12, 58, 68–69, 215, 220flavour development, 12, 27, 29–30, 34, 42,
58, 65, 71, 216flavour precursors, 18, 20, 22–23, 25–26,
29, 33, 73, 216flavour profile, 55flavour precursors, 12–13, 22, 58flavour properties, 58flavour quality, 17, 58flavour receptors, 81flavour release, 74, 187, 215, 235flavour synthesis, 68flavour volatiles, 215, 225–227flavour-active components, 29, 216flavours, 20, 26, 30flocculation, 131–132, 139, 153, 187, 231floral flavour notes, 26
P1: KAE/UKS P2: KAEind BLBK244-Afoakwa January 25, 2010 21:55 Printer Name: Yet to Come
264 Index
flow properties, 103, 113, 179, 202,231–232
flower, 14fluoroscopy, 85foam stability, 174food control, 73food matrix, 74food structure, 216Forastero, 1, 12, 15, 20–22, 25–27, 35,
76France, 4, 6free amino acids, 22free-choice profiling, 80free fatty acids (FFA), 36, 226free nerve endings, 79free radicals, 92, 99free trade, 8free water, 54fructose, 20–21, 25, 51, 77–78fructosylamine, 61fruit, 1, 14–16, 19, 76–77, 80, 92, 206fruity notes, 26, 215full-fat milk powder, 43functional foods, 10fungal attack, 19fungicides, 19, 20fungus, 19futures markets, 4
gallocatechin, 21gas chromatography, 68, 71, 89, 215–216,
218gas chromatography–mass spectroscopy
(GC-MS), 68, 71, 89, 215–216, 218gas chromatography–olfactometry (GCO),
215generic descriptive analysis, 81genetic origin, 26, 33genotype, 12, 14, 22, 25–26, 33, 80, 215,
235Germany, 3–6, 105, 107, 158, 217gestation, 84Ghana, 2, 4–5, 12–13, 26–27, 58–59global market, 91, 104gloss, 46, 79, 103, 155, 174–175, 177,
179–180, 183–184, 193, 197–199,202–208, 212, 232
gloss units (GU), 177glossy appearance, 79, 156, 190Gluconobacter oxydans, 24glucose, 21, 23, 25, 51, 59–60, 99glucosylamine, 60–61
glutamine, 61glyceride, 50glycerol, 53, 199glycerol backbone, 199glycerol molecule, 199glycine, 64glycosidase, 25, 29G-protein-coupled receptors, 84Greece, 6Grenada, 26grinding, 1–4, 40, 48, 79grittiness, 47, 78, 103, 132guaiacol, 27gum, 52, 74, 79gustatory, 74, 83gustatory–olfactory space, 83gustatory receptors, 74
Haake K20 Thermo-regulator, 106hammer mill, 40hammy flavours, 30handmade confections, 45hardness, 45, 75, 79, 110–112, 125, 127,
130–131, 139, 145, 147–150, 152–154,174, 175, 177, 179, 181–183, 186, 193,201–204, 207–208, 212, 230–233
harsh cocoa, 37harvesting, 13, 16–17, 19–20, 26hazelnuts, 67, 70, 77HDL cholesterol, 97headspace concentrations, 66, 226healthier foods, 216heap fermentation, 30heat exchangers, 45, 155–156, 158, 168,
171, 176, 180–181, 200, 217heat-resistant bacteria, 38heightened sensitivity, 92, 100Herman Cortes, 1Henri Nestlé, 2Herschel–Bulkley model, 54, 102Hershey, 81heterocyclic aroma volatiles, 63heterocyclic compounds, 61, 221hexanal, 32high-density lipoprotein (HDL), 97–98high-resolution gas chromatography
(HRGC), 71, 216honey, 1, 32, 76, 215, 219–221, 227–229,
234honeysuckle, 76house flavours, 81hue luminance, 128–129
P1: KAE/UKS P2: KAEind BLBK244-Afoakwa January 25, 2010 21:55 Printer Name: Yet to Come
Index 265
human buds, 75human nutrition, 35humidified sniffing port, 218humidity, 13, 56, 57HunterLab, 111, 177, 201hydrocarbon, 64, 66, 68–70, 220hydrodynamic force, 198, 206, 214, 233hydrolysis, 22, 24–25, 29hydrophilic, 22–23, 52, 128hydrophilic oligopeptides, 22hydrophilicity, 226hydrophobic, 22–23, 33, 52, 72hydrophobic amino acids, 22–33hydrophobic oligopeptides, 22hydrophobicity, 226hydroxymethylfurfural, 61hydroxytrytamine, 99hypercholesterolemia, 96hypertension, 92hypothalamus, 92, 99
icecream, 51icecream coatings, 50imidazole, 63Incas, 1index of viscosity, 123–127, 145–150,
154India, 27indium, 111, 178, 201Indonesia, 2–4, 12,inducible nitric oxide synthase (iNOS), 99inflammation, 91, 100infrared heating, 59ingredient, 1–2, 10, 36, 41, 51, 57, 73,
80–81, 100–101, 105, 153, 234inositol, 20insecticides, 20insects, 14, 19–20, 23, 36–37instrumental analyses, 235insufficient tempering, 180insulin sensitivity, 91, 96, 99intercrystal connections, 197, 203interfacial pressure gradient, 204International Confectionery Association
(ICA), 5–6, 54, 101–104, 108,120–121, 146, 153, 158, 176, 200, 230
International Cocoa Organisation, 1international cocoa market, 59international markets, 5International Office of Cocoa, Chocolate
and Confectionery (IOCCC), 54, 102,106, 108
International Organization forStandardization, 54
international trade, 7interparticle aggregates, 226interparticle aggregation, 139, 146, 185, 187interparticle flocculation, 226interparticle interactions, 101, 174, 184,
186, 198, 203interparticle passages, 206interparticle pores and crevices, 214interparticle network, 204interparticle network interactions, 204intrinsic qualities, 73invertase, 25Iquitos Mixed Calabacillo 67 (IMC67), 27Ireland, 5–6iron, 35, 94–95isoflavones, 93isoleucine, 64isomalt, 52isomerisation products, 61isothermal phase behaviour, 175Italians, 1Italy, 6Ivory Coast, 12, 27, 59, 65
Japan, 5, 6, 8, 178, 202Java, 27, 37Java beans, 27, 37jaw movement, 85Joint Photographic Expert Group (JPEG),
177–178, 202Joseph Fry, 2
Karl Fischer, 105, 158, 176, 200, 217ketones, 39, 64, 68–69, 71, 76, 215, 220key flavour compounds, 216key volatile fractions, 216kibbled cake, 40kibbling machines, 40kinaesthetic, 74Kluyveromyces marxianus, 23knife, 178, 202Kodak, 177
lactic acid, 23, 29, 59lactic acid bacteria, 23–24, 59lactic acid formers, 24lactitol, 51Lactobacillus
fermentum, 24plantarum, 24
P1: KAE/UKS P2: KAEind BLBK244-Afoakwa January 25, 2010 21:55 Printer Name: Yet to Come
266 Index
Lactococcus (Streptococcus), 24lactis, 24
lactose, 51–52laser diffraction particle size analyzer, 158,
200laser diffraction technique, 48–49laser light scattering, 48lauric fat, 51laxative effect, 52LDL cholesterol, 97LDL peroxidation, 97lecithin, 43, 52–53, 65, 79, 101–102,
104–106, 112, 115–120, 123–125,128–129, 131, 136–144, 148–149,151–152, 154, 157–158, 168,175–176, 182, 200, 216–217, 230–231,234
leucine, 61Leuconostoc mesenteroides, 24light microscopy, 101light milk chocolate, 37light roast, 37light scattering, 204–205light scattering coefficients, 204light to medium roast, 37linseed, 67lipid, 20, 35, 42, 46, 50, 53, 65, 87, 95, 97,
156lipid composition, 35lipid crystal form, 35lipid crystallisation, 44–45lipid oxidation products, 97lipid–protein cells, 20lipophilic, 226, 228–229lipophilic compounds, 226lipophilic–flavour interactions, 228, 234lipophilic matrix–flavour interactions, 226,
229lipophilicity, 226lipophobic, 52lipoxygenase, 96liquid fat, 180–181, 198, 212liquid fraction, 206liquid polarity, 216liquor pressing, 40liquor roasting, 39liquor treatment, 40London, 5London terminal market, 5low-density lipoprotein (LDL), 10, 91–92,
96, 98low-fat chocolate, 131
luminance, 177luteolin, 93
machete, 18magnesium, 35, 94–95Maillard, 23, 71, 216Maillard flavour notes, 82Maillard flavour precursors, 216Maillard reaction, 51, 59–60, 63, 66, 71–72,
219, 228–229, 233Malaysia, 2, 4, 26–27, 37, 64–65, 77Malaysian cocoa, 64maltitol, 51–52maltol, 66, 68Malvern Instrument, 48, 105, 158, 176, 200,
217Malvern MasterSizer, 48, 105, 158, 160,
176, 217–218Malvern particle size analyser, 48, 105, 160,
176, 217mannitol, 20, 51manufacturing techniques, 147Marasmius pernicious, 20marijuana, 100mass spectral data, 218mass spectrometry, 71, 74, 215Masterseeder, 45MasterSizer Laser Diffraction Particle Size
Analyzer, 105, 200mastication, 36, 78–79, 83–84, 86, 103matching descriptors, 218matrix, 215, 228, 234matrix effects, 215matrix particle size distribution, 215matrix retention, 222matrix structure, 228, 234Mayan, 1, 91mealy bugs, 19–20mean particle diameter, 49, 105mean particle size, 49, 105mechanical driers, 80mechanical properties, 103, 156, 174, 177,
179, 184–186medicinal benefits, 91medium roast, 37melanoidin, 63melting, 76, 79, 84, 86–87, 101, 104, 106,
111, 133–134, 138, 140–145, 149–154,156, 158, 174–176, 178–179, 185–189,193, 197–198, 200, 203, 207, 208–209,212, 215, 231–235
melting behaviour, 235
P1: KAE/UKS P2: KAEind BLBK244-Afoakwa January 25, 2010 21:55 Printer Name: Yet to Come
Index 267
melting character, 101, 104, 197, 235melting characteristics, 79, 101, 174–175melting duration, 101, 111, 144–145,
153–154, 231melting enthalpies, 186–187melting index, 101, 111, 144–145, 153–154,
178melting profile, 104, 175, 186–187melting properties, 35, 101, 144, 154,
174–175, 198, 215melting qualities, 101melting temperatures, 111, 153–154, 156methionine, 64methyl benzene, 68methylbutanal, 32, 64, 66–67, 69, 71, 215,
219, 222–223, 225–229, 233–234methylpropanal, 64, 69, 71, 215, 219, 222,
225methylxanthines, 99Mexican beans, 64Mexico, 1, 8, 27microbial activity, 24microflora, 24micrographs, 101, 174, 212micro-organisms, 23, 28, 38–39microscope, 111, 178, 232microscopic images, 212microstructural analysis, 153microstructural examination, 190microstructural organisations, 193microstructural properties, 135, 153–154,
156, 174microstructure, 103–104, 111, 131–134,
136, 153–154, 165, 174–175, 190,193–194, 198–199, 202, 204, 207, 212,216, 230–232, 234
mid-crop, 3migration, 75, 143, 204, 206milk, 2, 10, 35–37, 41–43, 46–49, 51–53,
56, 58, 65–66, 68, 71, 76–77, 79,81–82, 94–95, 102, 151, 182, 216, 235
milk chocolate, 2, 10, 35–37, 42, 46–48,51–52, 56, 58, 65, 68, 76, 79, 85, 87,94–95, 151, 182, 216, 235
milk crumb, 35, 43milk fat, 46, 51–52, 85, 235milk powder, 2, 35, 43milk protein, 52, 95milk solids, 41, 49, 51–52, 77, 81–82,
102mill, 40–41
ball, 40
disc, 40–41hammer, 40–41pin, 41stone, 40
milling, 40mixer, 41, 105mixing, 41, 43, 48–49, 146, 170, 176,
200mixing efficiency, 85modelling, 155moist roasting, 39moisture, 31, 33–34, 36, 39–40, 43, 51, 53,
54, 65, 72, 105, 113, 158, 175, 179,200, 216–217, 219, 226
molasses, 26molten chocolate, 45, 102, 146, 148, 150monosaccharide, 51monounsaturated fatty acids (MUFA), 98,
175mood-lifting effects, 91, 100mould, 18, 31, 33, 65, 109, 156, 176, 181mould growth, 31moulding, 41, 42, 123, 144mouth-feel, 47, 55, 73–75, 78–79, 84, 86,
103, 226mouth temperature, 75mucilage, 21mucilaginous pulp, 18, 28multimodal, 74, 202, 219multimodal size distributions, 179, 202,
219multiple comparison test, 186, 202, 205multiple range test, 158, 175, 202, 218multistage heat exchangers, 45, 155multivariate analysis, 235multivariate product space, 215multivariate statistics, 101, 145, 153multivariate techniques, 218muscle activity, 85mystical properties, 91
Nacional cocoa, 1, 12, 16, 26Nanay 33, 27nasopharynx, 85National Confectioners Association/
Chocolate Manufacturers Association(NCA/CMA), 103
Nestlé, 9, 41network microstructure, 216neurotransmitters, 99New Guinea, 27new product development, 103, 214, 235
P1: KAE/UKS P2: KAEind BLBK244-Afoakwa January 25, 2010 21:55 Printer Name: Yet to Come
268 Index
Newtonian, 49, 53, 54fluid, 49liquid, 53–54
nib, 25, 38–40, 59, 64. See also cocoa nibnib grinding, 40nib roasting, 25, 40, 59, 64niche markets, 9–10, 75Nigeria, 3, 12, 27NIST 05 Mass spectral library, 218nitric oxide, 91, 96–97, 99nitric oxide (NO) concentration, 96nitrogen, 21, 29, 68–69, 220, 228–229,
233non-cariogenic chocolate, 51non-hydrodynamic parameters, 216non-ideal plastic behaviour, 54non-Newtonian, 54non-Newtonian flow properties, 102Norway, 5–6nuclear magnetic resonance (NMR), 175nucleation, 45, 155–156, 158, 165,
169–171, 174, 180, 193, 197, 232. Seealso crystallisation
nutrition, 10, 35, 73, 91, 93, 97, 100nutritional benefits, 91nutritional constituents, 94nutty flavours, 59
obesity, 99octadecane, 111, 178, 201octanal, 32odour, 58, 66–71, 73, 77, 84, 89,
220–221odour assessment, 89odour characteristics, 58odour intensity, 68odourants, 31odour-active volatiles, 32odourous compounds, 73off-flavour, 24, 29, 31, 33, 52, 77oleic, 35, 50, 52, 199oleic acid, 52, 199olfactory, 74, 83, 84, 86, 89olfactory bulb, 84olfactory epithelium, 86, 89olfactory neurons, 89olfactory receptors, 74olfactory structures, 84oligomers, 21oligopeptides, 22optimal temper, 109, 176, 180, 235optimal temper regime, 109, 174, 179
optimally tempered, 158–160, 172,180–197, 200, 203
oral melting behaviour, 141, 186oral perception, 41oral sensations, 85–86organic acids, 22, 77–78origin chocolates, 35Orinoco valleys, 1orthonasal olfaction, 86orthonasal techniques, 73–74Ostwald ripening, 193, 198, 212, 214,
232–233. See also recrystallisationoven drying, 31overfermentation, 33overtemper, 176, 179, 235overtempered, 158–160, 172, 174, 176,
180–185, 187–197, 200, 204overtempering, 179–181oxalic acid, 21, 59oxazoles, 63oxidation, 24, 29, 63, 65–66, 91–92, 95–98,
216oxidative browning, 22oxidative condensation phase, 23oxidative stress, 93oxygen, 68, 219oxygen-mediated reactions, 29
packaging, 42, 89packaging materials, 89packing ability, 153packing fraction, 49palate, 48palate sensitivity, 48palm kernel oil, 51palmitic acid, 35, 50, 52, 199panning, 42Papua New Guinea, 3, 26parallel plate viscometer, 47parenchyma cell, 20Parinari 7, 27particle deformation, 216particle diameter, 48particle fineness, 235particle-to-particle connections, 197particle-to-particle crystal connections, 193particle-to-particle interactions, 101,
131–132, 182, 203particle-to-particle network, 146particle-to-particle strengths, 139particle size analyser, 48, 158, 217particle size determination, 102, 103

P1: KAE/UKS P2: KAEind BLBK244-Afoakwa January 25, 2010 21:55 Printer Name: Yet to Come
Index 269
particle size distribution, 36, 47–50, 53, 57,79, 81–82, 85, 101, 104, 106, 112–113,116–120, 123–128, 131, 133–136, 139,144, 148, 149, 151, 153–156, 160–161,165, 169, 172, 174–176, 179, 181, 184,187, 193, 200, 202–204, 215–216,218–219, 222, 226–235
particle size reduction, 42pathogenesis, 97pathogenic bacteria, 38pathophysiological mechanisms, 91pectins, 21penetrating chocolate, 61pentosans, 21peptides, 22–23, 29, 33, 66peroxidation, 96–97pesticides, 20pests, 13, 18pH, 13, 22–24, 28–29, 39, 59–60, 63–65, 74phase transformation, 175phase transition, 175, 181phenol, 27, 29, 66, 71, 80, 215phenol–protein interaction, 29phenolic compounds, 29phenylacetaldehyde, 32, 66, 227, 229,
233–234phenylalanine, 23, 64phenylethylamine, 99–100phosphatidylcholine, 52phosphoglyceride, 52phospholipids, 125phosphorus, 95photosensitive silicon, 48physiological functions, 100Phytophthora megakarya, 19Phytophthera palmivora, 19Pichia farinosa, 23pigment cells, 21pigmentation, 21pin mill, 40pine nut, 91plain chocolate, 2, 47, 79, 81. See dark
chocolateplasma antioxidant capacity, 97plastic mould, 176, 201, 217plastic trays, 176, 201, 217plastic viscosity (PV), 49, 51, 53–55, 102,
106, 112, 115–116, 119–121, 146, 153,175, 216, 226, 230. See also Casson;viscosity
platelet activation, 96platelet functions, 93
platelet reactivity, 100platelet-related primary hemostasis, 100pod borers, 20pod storage, 17, 29, 33pods, 3, 14, 16–19, 23, 235pollens, 14pollination, 14polycondensation, 53polydextrose, 51polydimethylsiloxane-divinylbenzene, 218polyethylene (PE), 41polyglycerol polyricinoleate (PGPR), 53,
102, 118polymerisation, 63, 65, 72polymorphic, 44–46, 141, 154–155, 174,
180–181, 185–186, 193, 197–199,207–208, 212, 231–234
polymorphic crystals, 155polymorphic crystalline transition, 199polymorphic fat, 174polymorphic forms, 44–46, 155, 180, 197,
233polymorphic stability, 139, 154, 181polymorphic state, 172, 175, 198polymorphic transformations, 45, 156,
180–181, 197–198, 232–234polymorphism, 141, 143, 147, 154, 175,
231–233polymorphs, 104, 155, 231–233polyphenol oxidase, 24, 25, 30polyphenolic cells, 20polyphenols, 12, 20–22, 24–27, 29–30,
33–34, 39, 92, 95–98, 215polyphenols storage cells, 21polysaccharides, 26, 33polyunsaturated fatty acids (PUFA), 98Portugal, 6post-harvest treatment, 33, 58, 216post-processing handling, 199post-processing storage, 199potassium, 35, 64, 95potassium carbonate, 64pre-crystallisation, 156, 199, 201, 217, 231,
234precursors, 12, 13, 22, 58, 59predictive process control, 50premium chocolate, 5–7, 10premium quality, 235premium varieties, 5pressed cake, 40pressing, 29, 40pressure, 42, 45, 179, 202
P1: KAE/UKS P2: KAEind BLBK244-Afoakwa January 25, 2010 21:55 Printer Name: Yet to Come
270 Index
primary crystallites, 193primary odourants, 68primary taste, 36principal component, 88, 152, 227–228principal component analysis (PCA), 88,
120, 123, 129, 152, 227–228proanthocyanidins, 21, 35, 92process design, 45, 156process efficiency, 49process fluidity, 49process improvements, 230process optimisation, 227procyanidins, 12, 21, 27, 92–93, 95–96, 99,
215product character, 216product composition, 103product development, 216, 230product identification, 103product manufacture, 216product matrices, 155product optimisation, 80product prototypes, 80product quality, 10, 155product quality characteristics, 155, 156product rheology, 216product structure, 216product surfaces, 212product texture, 216prostacyclin, 100protein, 20–22, 24, 35, 39, 52, 59, 66, 84,
94–95protein breakdown, 21protein hydrolysis, 21protein nitrogen, 21protein–polyphenol complexes, 29proteinaceous constituents, 29proteinase, 25proteolysis, 23, 33proteolytic degradation, 22proteolytic processes, 22proton transfer reaction mass spectrometry,
74psychoactive chemicals, 99pulp, 12, 14, 16, 18–19, 23–25, 27–28pulp invertase, 24pulp pre-conditioning, 33, 235pulsed nuclear magnetic resonance
(pNMR), 175pulverisation, 41pulverised cocoa cake, 41pungent, 32, 67, 80putrid flavours, 30
pyrazines, 27, 29, 39, 61, 63–64, 66, 68–71,215, 219, 221, 226, 229
pyridines, 63, 70–71, 215, 221pyrones, 71, 215, 221pyrroles, 60, 63, 71, 215, 219, 221, 226,
228–229pyruvaldehyde, 64
quality, 2, 8–10, 17–20, 22–23, 25, 36–38,45, 48, 51, 54–55, 57–58, 73–74,78–81, 87, 89–90, 101, 103–104, 133,154, 173–175, 181, 183–186, 190, 197,202, 216, 230–232, 234, 235
quality assurance, 8, 48, 81, 154, 173, 184,186, 231, 234–235
quality attributes, 10, 73quality characteristics, 101, 175quality control, 48, 81, 154, 173, 184, 186,
231, 234–235quantitative Descriptive Analysis, 55quantitative descriptive methods, 87quantitative flavour profiling, 81quinines, 25, 77–78quinone, 25
rainfall, 2, 3, 13, 26raised platforms, 30raisin-fruity notes, 27raisins, 26, 80reactive oxygen species (ROS), 92real-time magnetic resonance imaging, 85receptacles, 40recipe, 37, 45, 72, 82, 105, 147, 156–157,
176, 200, 217recrystallisation, 188, 190, 193, 197, 199,
204, 210, 212, 232red wine, 93reduced sugar, 10reducing sugars, 23, 34, 59, 61, 216refiner conche, 158refiner pressure, 158, 175, 202, 218refiner temperature, 158, 175, 202, 218refining, 41–42, 74, 79, 101, 112, 158,
175–176, 217, 222. See also rollrefiner
refractive index, 105, 158, 160, 176, 200,217
regression analysis, 144regression coefficient, 144, 146, 161, 164regression models, 146, 155, 161relative humidity, 176, 198, 201relative judgement, 55
P1: KAE/UKS P2: KAEind BLBK244-Afoakwa January 25, 2010 21:55 Printer Name: Yet to Come
Index 271
reproducibility, 118residence time, 81, 144residual fat, 40residual proteins, 29response plots, 161, 165–167, 169–171response surface, 155response surface curves, 155response surface methodology, 156retronasal flavour characters, 36, 73–74, 84retronasal flavour release, 85retronasal olfaction, 86retronasal pathway, 83retronasal techniques, 73–74rheological behaviour, 57, 104, 230rheological characteristics, 10, 50, 215, 230rheological measurements, 36, 54, 102–103,
146rheological models, 102, 104, 123rheological parameters, 101, 120, 123, 144,
146, 154rheological properties, 41, 47, 101–104,
111, 144, 152–154, 156, 161, 175,180–186, 199, 230–235
rheological qualities, 50, 101rheology, 11, 49, 54, 101, 105, 144, 151,
156. See also viscosityroast, 1, 12, 23, 25–27, 29–30, 36, 38, 40,
58–59, 68, 70–71, 76–78roasted, 23, 30, 38, 59, 68, 70–71, 76–78,
222, 225–228roasting, 1, 12, 23, 25–27, 29, 36, 38, 40,
58–59, 65, 72, 74, 77–78, 216, 235rodent infestation, 36–37rodents, 36–37roll refiner, 41, 43, 176, 200, 217
five, 41, 43three, 176, 200, 217two, 41
rotational viscometers, 102Rudolphe Lindt, 2Russia, 4–5, 7
Sabah, 27Saccharomyces cerevisiae, 23Saccharomyces exiguous, 23saliva, 20salivary enzymes, 86salt, 77, 79, 80, 84–85sample press, 111, 178, 201sample spanning aggregates, 120Sanchez, 27, 38Santa Clara, 218
satisfactory temper regime, 172–173,231
saturated fatty acid, 50, 52Sauter mean diameter, 105–106, 112, 131,
176, 200, 202, 218, 230SCA, 22scanning electron micrography, 174scanning electron microscopy, 178, 190scatter plots, 207scattering factor, 129, 183Scavina 12 (SCA 12), 27Schiff base, 59–62Schiff base formation, 59Schizosaccharomyces pombe, 23scraped surface heat exchanger, 47secondary taste, 77seed, 18, 25, 47, 156, 158, 168, 171, 232seed coat, 18seed cotyledons, 18seed crystals, 156, 158seed tempering, 45semi-selective sensors, 89semi-solid suspensions, 35semi-sweet chocolate, 37semi-sweet cookie drops, 38, 125sensorial attributes, 57, 103sensorial characters, 104sensorial properties, 73sensorial qualities, 175sensors, 158, 176, 200sensory, 11, 27, 31, 36, 41, 47, 49–50,
54–55, 73–76, 79–81, 84, 87–90,102–104, 112, 115, 133, 148, 175, 179,182, 202, 215, 229, 235
sensory analysis, 55, 235sensory attributes, 55sensory characteristics, 55sensory characters, 35–36, 50, 55, 73, 103,
148, 235sensory evaluation, 54–55, 74, 103, 175,
235sensory mapping, 80sensory perception, 11, 47, 55, 57, 74, 215sensory philosophies, 81sensory profile, 55sensory properties, 41, 49, 75, 144, 154,
175, 193, 232, 234–235sensory qualities, 102sensory scientists, 80sensory spectrum, 55sepals, 14serine carboxy-(exo)peptidase, 22

P1: KAE/UKS P2: KAEind BLBK244-Afoakwa January 25, 2010 21:55 Printer Name: Yet to Come
272 Index
serine exopeptidase, 22serotonin, 91, 99serum cholesterol, 92serum concentration, 96serum lipids, 96sexual sensitivities, 100sexual weakness, 92shade drying, 31shea butter, 75shear, 45, 47, 49, 54–55, 86, 102, 104,
107–108, 119, 156shear rate-controlled rheometer, 101shear stress, 55, 102, 107–108, 119–121,
131shear viscosity, 49shearing, 119, 120, 155–156, 174shear-thinning, 54, 86shear–time–temperature process, 156shelf-life, 45, 52, 81, 155–156, 174, 180shelf-life characteristics, 52, 81, 155, 174,
180shell, 20–21, 36, 38–40, 43shrivel, 3shrunken beans, 37silicon, 48Singapore, 177single-origin, 7, 10size distribution, 216skimmed milk powder, 42–43, 52slaty beans, 80Slovenia, 4smoky notes, 31, 80smooth appearance, 199snap, 76, 79, 155–156, 174, 180sniffing port, 218social class, 1sodium, 77, 95sodium chloride, 77soft model systems, 225soil condition, 33solid chocolate, 45solid crystals, 46solid fat contentsolid phase micro extraction (SPME), 218solid tempered chocolate, 230sorbitan, 53sorbose, 20sotolon, 68sour, 27, 67, 77–78, 80, 84–85, 228–229,
234South America, 1, 3, 20, 35South Korea, 5
Soxhlet, 105, 158, 176, 200, 217soya oil, 52Spain, 1, 6Spanish, 1Spanish Guinea, 1spatial distribution, 197specific surface area, 49, 146spectral libraries, 218specular reflectance, 205spices, 1spicy flavour notes, 26spreadability, 123–127stable crystals, 46, 156stable fat crystals, 46, 155stable polymorphs, 174, 214standard deviations, 201starch, 20–21starch granules, 20stearic acid, 35, 50, 52, 95, 199stearic triglyceride, 92stepwise regression analysis, 155Sterculiaceae, 1, 12stereoscopic binocular microscope, 178,
198, 208stereoscopic binocular micrographs, 197steric stabilisation, 53sterilisation, 38sterol, 50stickiness, 174, 177, 179, 182–183sticky surface, 79stimuli, 74stocks, 3stone mill, 40storage cells, 20storage characteristics, 181storage polypeptides, 22storage proteins, 22, 33, 215Strecker, 61–62, 64, 219, 229, 233–234Strecker aldehyde, 62, 66, 229Strecker degradation reaction, 61–62, 64,
66, 68, 72, 219stress, 49, 97strong basic cocoa, 26structural character, 156structural transformations, 188structural–fat migration relationships, 206structure–appearance relationships, 199,
207subnanometer-size dispersion, 206succinic acid, 59sucrose, 20–21, 25, 29, 51–52, 59, 77–78,
104–105, 157, 175–176, 200, 216–217

P1: KAE/UKS P2: KAEind BLBK244-Afoakwa January 25, 2010 21:55 Printer Name: Yet to Come
Index 273
sugar, 2, 10, 19–23, 25–26, 29, 33–35,40–42, 51–55, 57, 59–61, 66, 72, 75,77–78, 82–86, 93, 98, 102–103, 112,116, 131–132, 136, 144, 157, 174–175,178, 187–190, 200, 212, 216, 230, 235
sugar alcohols, 51–52sugar bloom, 55, 57sugar crystal surfaces, 125sugar melting properties, 188sugar particle surfaces, 125sugar particles, 51sugar products, 216sugar surfaces, 53sugar–amine condensation, 59–60sugar-coating ability, 144sugary chocolate, 75supercritical fluid extraction, 40sulphur, 25, 70, 221superoxide, 97suppliers, 6–7supply chain, 8, 175, 199sun drying, 30–31sun-dried beans, 31sunshine, 2, 30surface area, 49surface colour, 101surface crystalline network structure, 198surface gloss, 197surface image, 208surface plane, 205surface regularity, 205surface texture, 14, 101surface whiteness, 204surface-active agents, 52surface-active ingredients, 49, 103surfactant, 42, 52suspension consistency, 102sustainable development, 7sweatings, 23–24, 57Sweden, 6sweeteners, 51–52, 82–84, 89Switzerland, 4–7, 75, 105, 158, 176,
200–201, 217swollen shoot disease, 19systolic hypertension, 100
Tabasco, 27tactile, 74tallowy, 32tannin oxidation, 65, 216tannins, 65, 216target population, 55
tartaric acid, 59taste, 10, 36, 74taste buds, 74taste compounds, 86taste descriptors, 77taste intensity, 36taste masking, 89taste perceptions, 215taste receptors, 86taste sensations, 77, 79taste stimuli, 74tea, 12, 93, 215temper, 44, 160, 162–163, 166–174, 176,
179–190, 193, 197, 199, 231–232,234–235
temper index, 176temper regimes, 172–174, 181–183, 199,
234temper slopes, 158, 161–162, 165,
172–174temper status, 158temperature, 13, 24, 28–30, 33, 35, 38–41,
43–45, 47, 49–50, 56–57, 59, 61,65–66, 72–75, 84–87, 158, 160–163,165–166, 168–173, 176, 179–181,185–188, 193, 199–200, 202, 209,217–218, 231, 235
tempered chocolate, 46, 109, 173tempered products, 155temperer, 165, 169
Aasted, 46, 158, 200, 217tempering, 41, 43–47, 56, 74, 79, 108, 153,
155–158, 160, 165–166, 168–170,172–176, 179–181, 184, 193, 197,199–201, 206, 214, 217, 231–234
tempering behaviour, 155, 165, 173, 176tempering conditions, 144tempering curves, 176tempering equipment, 181. See also
temperertempering machines, 45. See also temperertempering process, 47, 158, 165tempering procedure, 107, 158tempering temperatures, 173tempering unit, 107, 173tempermeter, 109, 158–160, 166, 176, 201,
217temporal aspects, 86testa, 18, 20, 25tetrahydrocannabinol, 100tetramethylpyrazine, 29, 66, 221, 225–227,
229, 233–234

P1: KAE/UKS P2: KAEind BLBK244-Afoakwa January 25, 2010 21:55 Printer Name: Yet to Come
274 Index
textural attributes, 151textural properties, 71, 101, 144, 151–154,
175, 199, 203, 230, 234–235textural qualities, 50, 101–102texture, 2, 14, 41–42, 47, 49–52, 57, 65, 73,
75, 76, 79, 84–85, 88, 90, 101,103–104, 109, 129, 135, 139, 144, 147,153, 166, 174–175, 177, 179, 182, 187,193, 197–199, 202–203, 212, 216, 219,226, 230–231, 235
texture analyser, 101, 109, 111, 148, 177,201
texture profile analysis, 55Thailand, 5The Netherlands, 4, 6, 104, 157, 176, 200,
216Theobroma, 1, 2, 12, 25, 35, 72Theobroma cacao, 1, 2, 12, 25, 35, 72theobromine, 20, 29, 99theophylline, 20thermal analysis, 111, 178, 201thermal behaviour, 178thermal decomposition, 29thermal history, 172thermal thresholds, 66thermodynamic, 45thermodynamic differences, 193thermodynamic stability, 45thermogram, 135thermotolerant, 24thiazole, 63, 71thin film processing, 64thiobarbituric acid-reactive substance
(TBARS), 96thiozole, 215, 221thixotropic behaviour, 120thixotropy, 55, 107, 108, 112, 116,
119–123, 153. See also viscositythreonine, 61, 64time–intensity analysis, 88time–intensity (TI) curve, 87–88time–intensity measurements, 87, 235time–intensity methodology, 151time–intensity procedures, 235time–intensity techniques, 87time–temperature protocols, 174time–temperature throughputs, 155titratable acidity, 28–29tocopherol, 50tongue compression, 86Torulopsis spp., 23total nitrogen, 21
total plate count (TPC), 38total polyphenols, 216total quality, 8touch bloom, 56traceability, 8, 33trained assessors, 218trained panel, 55, 80tray fermentation, 27triacylglyceride, 109triacylglyceride fractions, 109, 217Tricor Gloss meter, 177, 201trigeminal sensations, 74trigeminal system, 79triglyceride composition, 44–46triglycerides, 35, 44–45, 50, 52, 156, 172,
174, 198–199, 217trilogy, 75trimers, 21trimethylpyrazine, 68, 70, 219, 221–222,
225, 227–229, 233trimodal particle size distribution, 49Trinidad, 20, 26–27, 37Trinitario cocoa, 1, 22, 26–27, 30, 35tropic of Cancer, 1, 13tropic of Capricorn, 1, 13trypsin inhibitor, 25tyramine, 99tyrosine, 23, 64
UIT1, 22UK, 2, 4, 6, 10, 104, 111, 157, 175–177,
200–201, 216–217ultrasonic dispersions, 105, 176, 200, 218umami, 79undertemper, 176, 179undertempered, 158–160, 172, 174, 176,
182–197, 199–200, 203, 207, 212undertempering, 179–182undesirable flavours, 80Unidentified Trinatario (UIT1), 27United States, 102unpleasant flavours, 80unstable crystals, 46untempered chocolate, 207untempering, 179unsatisfactory temper regime, 172–173,
231unstable crystal polymorphs, 180–181unstable fat, 198unstable fat polymorphs, 193unstable polymorphs, 198Upper Amazon clones, 27

P1: KAE/UKS P2: KAEind BLBK244-Afoakwa January 25, 2010 21:55 Printer Name: Yet to Come
Index 275
USA, 2, 4–7, 10, 102–103, 177–178, 201,218
vacuole, 20valine, 64value chain, 8van der Waals force, 193, 197, 232Van Houten, 39vanilla, 1, 66, 68, 77vanillin, 66vascular endothelium, 98–99vascular system, 96vasculoprotective effect, 100vasodilation, 91, 96, 100vasorelaxation, 98vegetable, 12, 92, 105, 160, 176, 200vegetable oil, 105, 160, 176, 200, 217Venezuela, 5, 26–27Viagra, 91vicilin (7S)-class globulin (VCG), 22, 25video fluoroscopy, 85videofluorography, 85vinegar, 220, 221viral disease, 19. See also swollen shoot
diseaseviscometer, 47, 54, 102
concentric cylinder, 102–103, 106Haake, 105
viscosity, 36, 40, 42–43, 45, 49–55, 81–83,86, 102, 107, 108, 110, 115–116,118–120, 123–127, 129–130, 145–147,149, 151–153, 216, 230–231, 234
apparent, 110, 112, 118–123, 144–146,148–150, 152, 154, 230–231
viscosity modifiers, 50, 103viscosity-reducing effects, 53visual appearance, 199volatile acids, 31, 39, 43, 59, 64–66, 72, 216volatile aroma compounds, 215volatile aromatic fractions, 33volatile compounds, 74volatile flavour constituents, 216volatile fractions, 33, 216
volatile organic compounds (VOCs), 218volatile phenols, 66volatile release, 36, 73–74, 225volume histograms, 179, 219
walnut, 77, 91warehouse, 55weight control, 46, 102well-tempered chocolate, 46, 50West Africa, 1, 2, 15, 20–21, 27–28, 35, 37,
58, 76, 104, 157, 175, 200, 228wheat, 76whey powder, 52whey protein, 52white chocolate, 35–36, 94, 98, 235white crystalline structure, 198, 214whole bean roasting, 39wine, 7, 12, 215Wiley 7N Registry of Mass Spectral Data,
218witches broom disease, 20wooden billet, 18world grindings, 3–4world cocoa prices, 4world trade, 8–9World Trade Organization (WTO), 9
xenomorphic, 188, 207xylitol, 51–52XYZ tristimulus values, 201
yeast, 23–24yeast metabolism, 24yeast population, 24yield, 9, 49, 102, 116–123, 144–150, 152yield stress, 49, 102, 112, 116–123, 131,
144–150, 152–154, 168, 175, 216,230–231
yield value, 49, 51, 53–54, 116–123, 132,142, 153, 230. See also viscosity
Zanzibar, 26zinc, 95

P1: KAE/UKS P2: KAEind BLBK244-Afoakwa January 25, 2010 21:55 Printer Name: Yet to Come
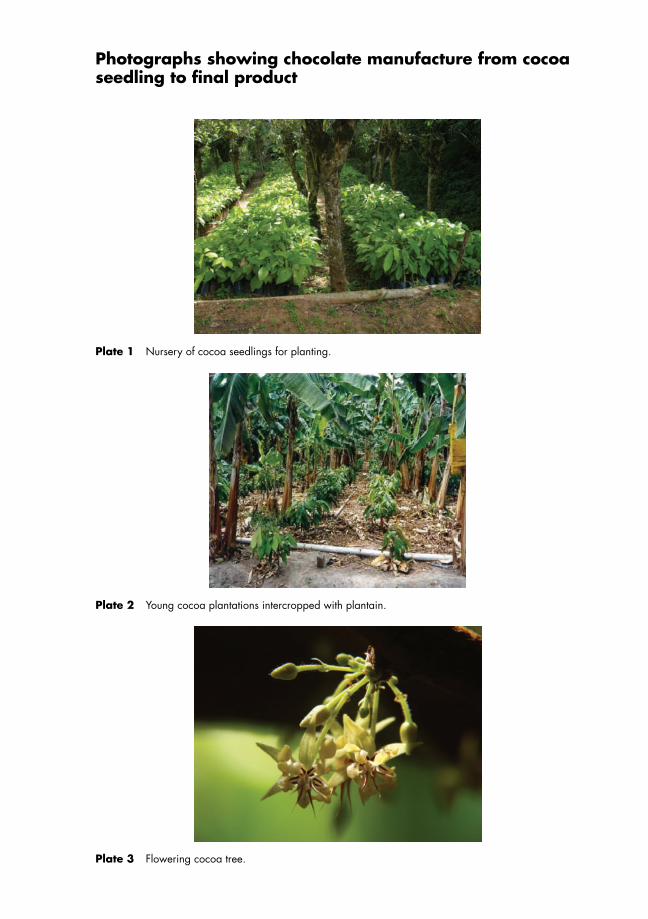
P1: KAE/UKS P2: KAEcp BLBK244-Afoakwa January 23, 2010 14:49 Printer Name: Yet to Come
Photographs showing chocolate manufacture from cocoaseedling to final product
Plate 1 Nursery of cocoa seedlings for planting.
Plate 2 Young cocoa plantations intercropped with plantain.
Plate 3 Flowering cocoa tree.
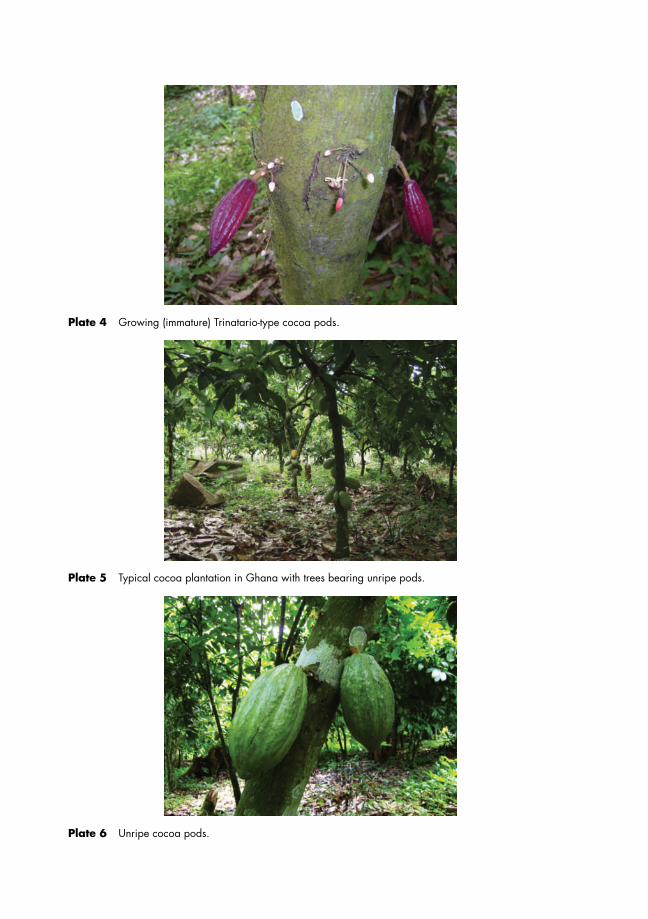
P1: KAE/UKS P2: KAEcp BLBK244-Afoakwa January 23, 2010 14:49 Printer Name: Yet to Come
Plate 4 Growing (immature) Trinatario-type cocoa pods.
Plate 5 Typical cocoa plantation in Ghana with trees bearing unripe pods.
Plate 6 Unripe cocoa pods.
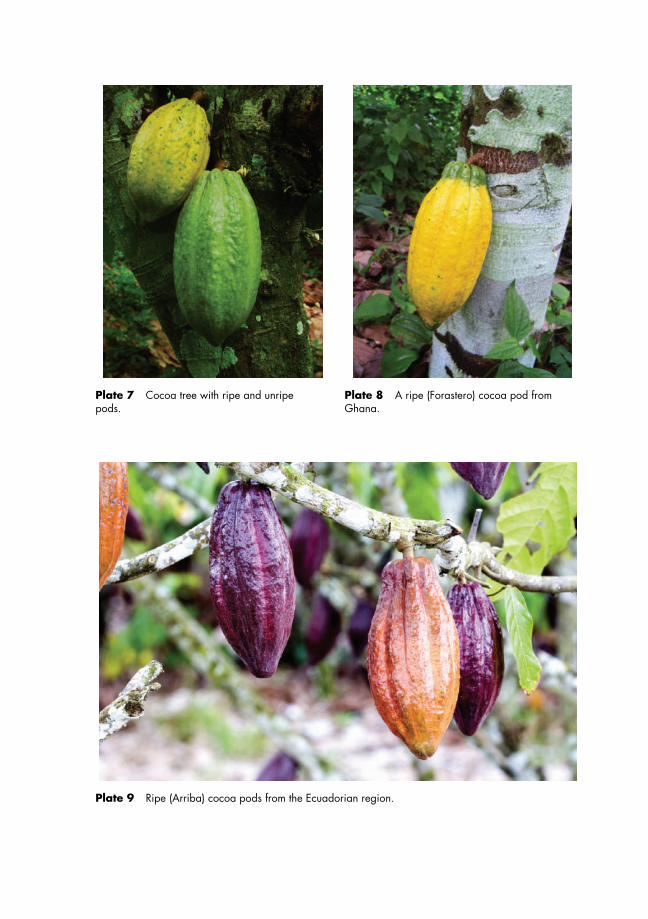
P1: KAE/UKS P2: KAEcp BLBK244-Afoakwa January 23, 2010 14:49 Printer Name: Yet to Come
Plate 7 Cocoa tree with ripe and unripepods.
Plate 9 Ripe (Arriba) cocoa pods from the Ecuadorian region.
Plate 8 A ripe (Forastero) cocoa pod fromGhana.
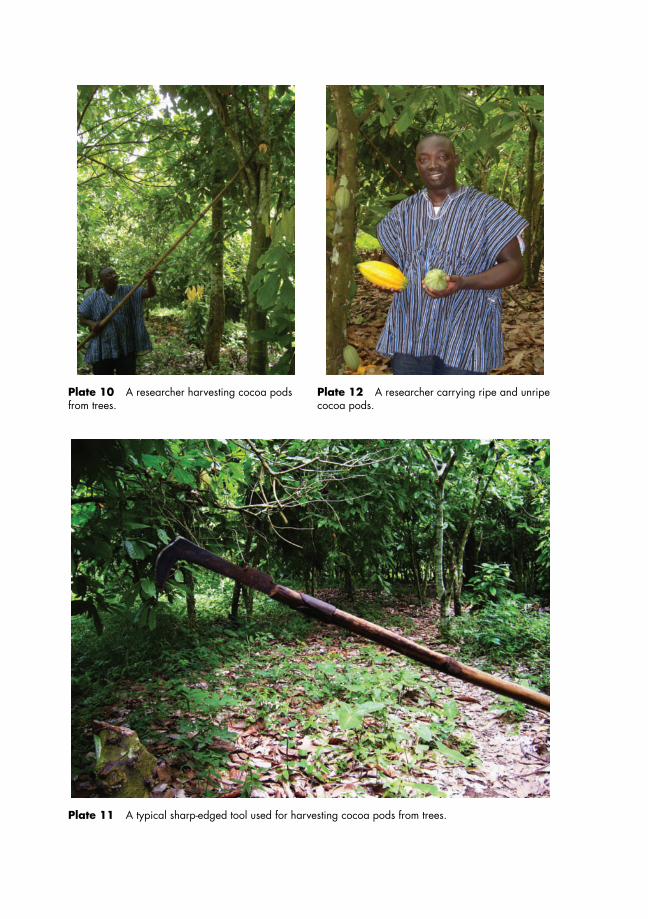
P1: KAE/UKS P2: KAEcp BLBK244-Afoakwa January 23, 2010 14:49 Printer Name: Yet to Come
Plate 10 A researcher harvesting cocoa podsfrom trees.
Plate 11 A typical sharp-edged tool used for harvesting cocoa pods from trees.
Plate 12 A researcher carrying ripe and unripecocoa pods.

P1: KAE/UKS P2: KAEcp BLBK244-Afoakwa January 23, 2010 14:49 Printer Name: Yet to Come
Plate 13 Ripe, unripe and over-ripe cocoa pods (from left to right).
Plate 14 Vertical sections of unripe and ripe cocoa pods showing arrangements and colour of fruitsand seeds.
Plate 15 An opened unripe cocoa pod showing longitudinal arrangement of fruits.

P1: KAE/UKS P2: KAEcp BLBK244-Afoakwa January 23, 2010 14:49 Printer Name: Yet to Come
Plate 16 Researchers opening cocoa pods in Ghana, West Africa.
Plate 17 Cocoa beans undergoing heap fermentation system in Ghana, West Africa.
Plate 18 Cocoa beans covered with plantain leaves undergoing heap fermentation in Ghana.
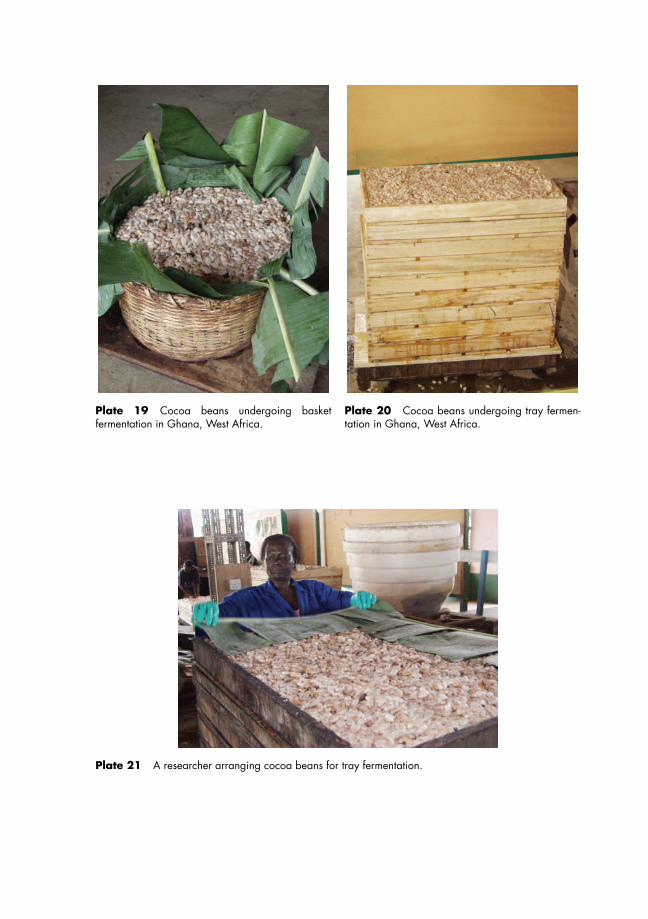
P1: KAE/UKS P2: KAEcp BLBK244-Afoakwa January 23, 2010 14:49 Printer Name: Yet to Come
Plate 19 Cocoa beans undergoing basketfermentation in Ghana, West Africa.
Plate 21 A researcher arranging cocoa beans for tray fermentation.
Plate 20 Cocoa beans undergoing tray fermen-tation in Ghana, West Africa.

P1: KAE/UKS P2: KAEcp BLBK244-Afoakwa January 23, 2010 14:49 Printer Name: Yet to Come
Plate 22 Typical set-up for box fermentation system.
Plate 23 Researchers drying cocoa beans on raised platforms at the Cocoa Research Institute of Ghana.
Plate 24 Dried cocoa beans.
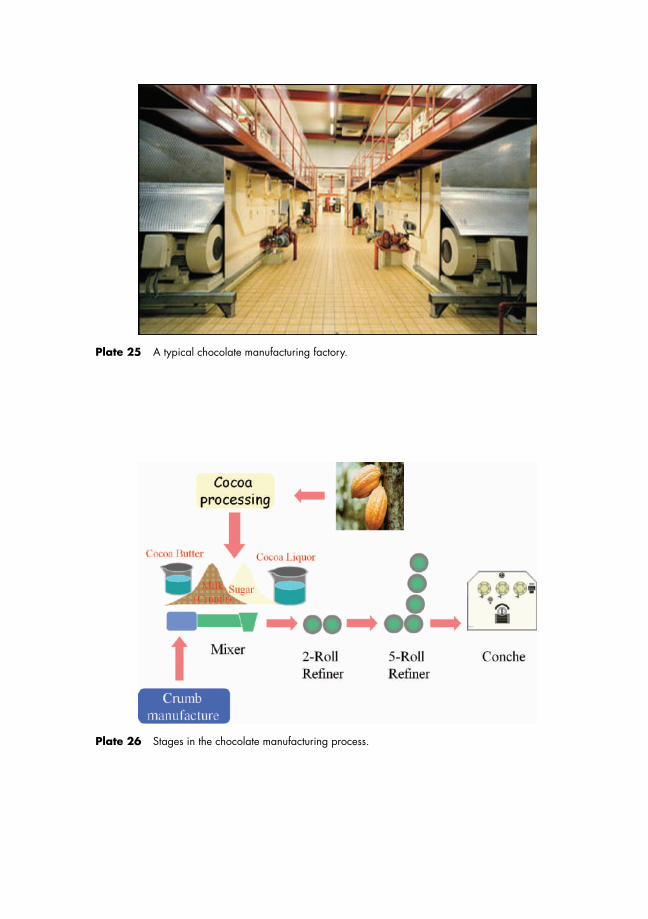
P1: KAE/UKS P2: KAEcp BLBK244-Afoakwa January 23, 2010 14:49 Printer Name: Yet to Come
Plate 25 A typical chocolate manufacturing factory.
Plate 26 Stages in the chocolate manufacturing process.
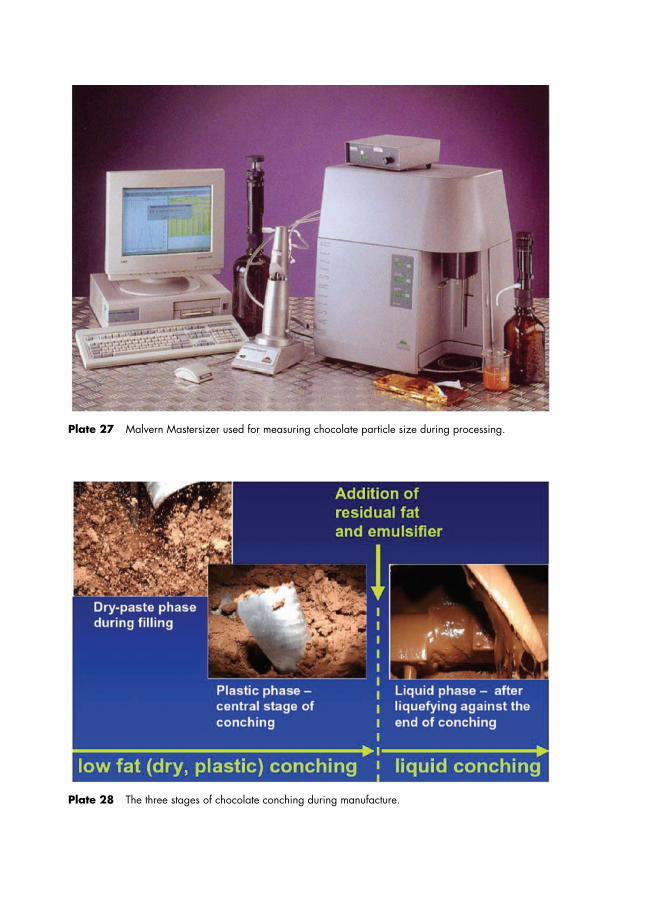
P1: KAE/UKS P2: KAEcp BLBK244-Afoakwa January 23, 2010 14:49 Printer Name: Yet to Come
Plate 27 Malvern Mastersizer used for measuring chocolate particle size during processing.
Plate 28 The three stages of chocolate conching during manufacture.
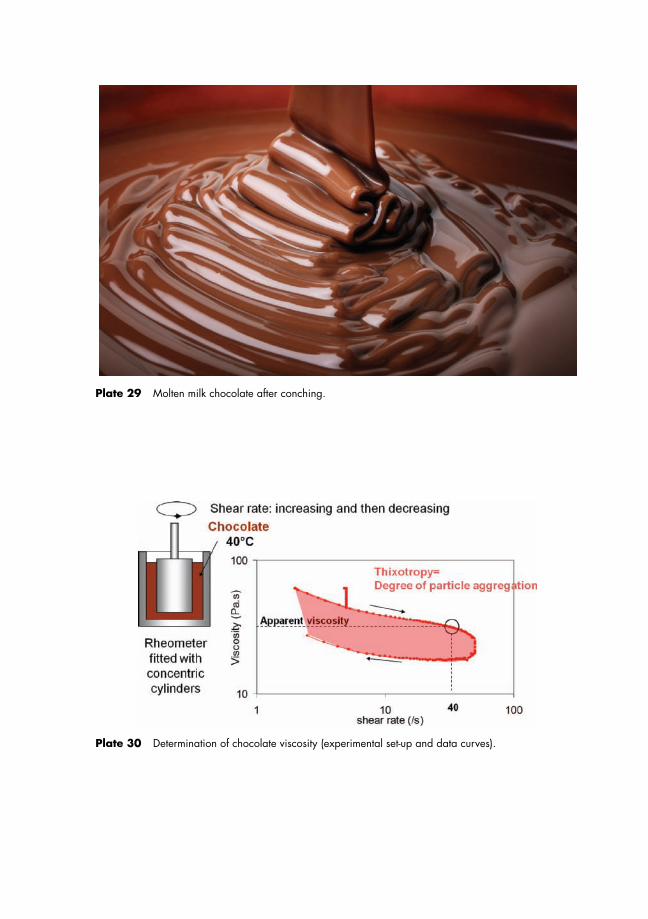
P1: KAE/UKS P2: KAEcp BLBK244-Afoakwa January 23, 2010 14:49 Printer Name: Yet to Come
Plate 29 Molten milk chocolate after conching.
Plate 30 Determination of chocolate viscosity (experimental set-up and data curves).

P1: KAE/UKS P2: KAEcp BLBK244-Afoakwa January 23, 2010 14:49 Printer Name: Yet to Come
Plate 31 AMK 50 Aasted Mikrovert Mini-temperer. Reprinted from Afoakwa et al. (2008g), copyright2008, with permission from Elsevier.
Plate 32 Depositing of molten chocolate on moulds.

P1: KAE/UKS P2: KAEcp BLBK244-Afoakwa January 23, 2010 14:49 Printer Name: Yet to Come
Plate 33 Depositing plant in a chocolate manufacturing factory.
Plate 34 Demoulded chocolate bars.
Plate 35 Handmade chocolate truffles with white, milk and dark types.
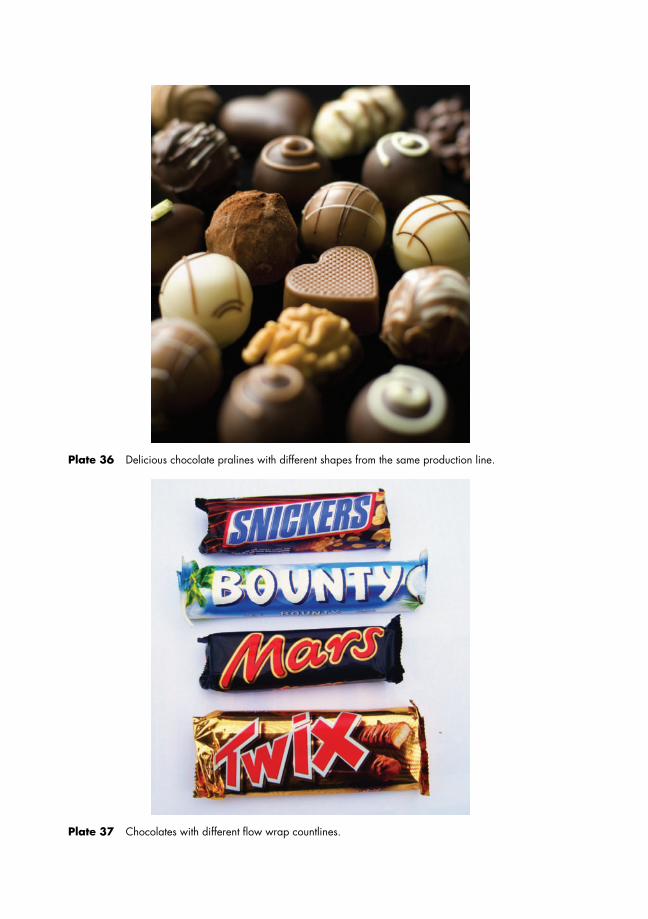
P1: KAE/UKS P2: KAEcp BLBK244-Afoakwa January 23, 2010 14:49 Printer Name: Yet to Come
Plate 36 Delicious chocolate pralines with different shapes from the same production line.
Plate 37 Chocolates with different flow wrap countlines.
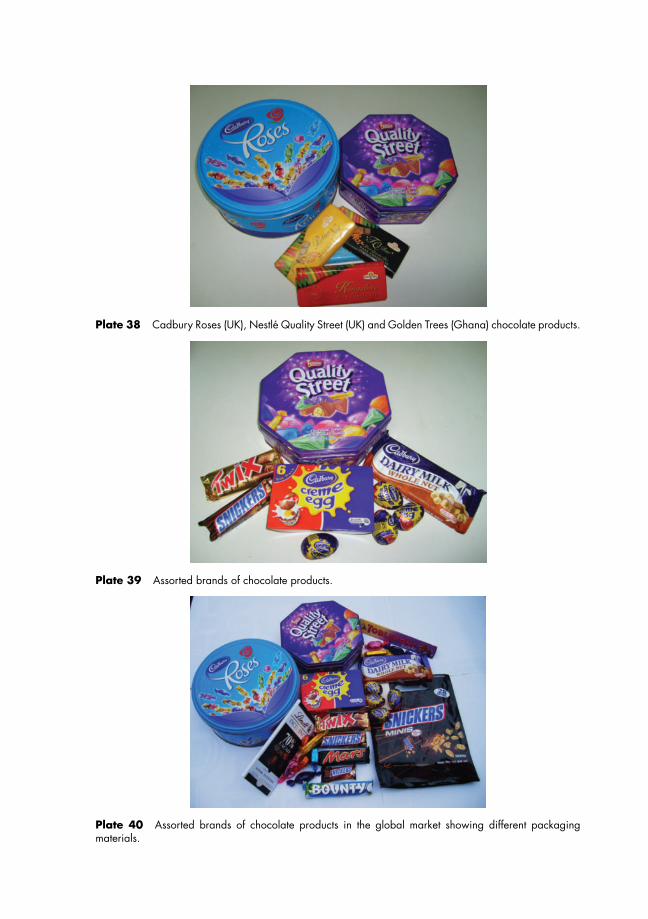
P1: KAE/UKS P2: KAEcp BLBK244-Afoakwa January 23, 2010 14:49 Printer Name: Yet to Come
Plate 38 Cadbury Roses (UK), Nestle Quality Street (UK) and Golden Trees (Ghana) chocolate products.
Plate 39 Assorted brands of chocolate products.
Plate 40 Assorted brands of chocolate products in the global market showing different packagingmaterials.

P1: KAE/UKS P2: KAEcp BLBK244-Afoakwa January 23, 2010 14:49 Printer Name: Yet to Come
Fig. 4.7 Cocoa powders alkalised into different colour shades.