Embed Size (px)
Citation preview
WP/14/75
China’s Monetary Policy and Interest Rate Liberalization: Lessons from International
Experiences
Wei Liao and Sampawende J.-A. Tapsoba
1
© 2014 International Monetary Fund WP/14/75
IMF Working Paper
Asia and Pacific Department
China’s Monetary Policy and Interest Rate Liberalization: Lessons from International Experiences
Prepared by Wei Liao and Sampawende J.-A. Tapsoba1
Authorized for distribution by Steven Barnett
May 2014
Abstract
China has been moving to a more market oriented financial system, which has implications for the monetary policy environment. The paper investigates the stability of the money demand function (MDF) in light of progress in financial sector reforms that, for example, have resulted in significant financial innovation (so-called shadow banking) and more liberalized interest rates. The analysis of international experience suggests that rapid development of the financial system often leads to structural shifts in the MDF. For example, financial innovation and liberalization alter the sensitivity of money balances to income and the interest rate. For China, we find that the stable long-run relationship between money demand, output, and interest rates that existed between 2002 and 2008 disappears after 2008. This coincides with the period of rapid financial innovation, especially the growth in off-balance sheet and nonbank financial intermediation. The results suggest that usefulness of M2 as an intermediate monetary target has declined with financial innovation and reform. A result that underscores the importance of moving toward increased reliance on more price-based targets such as interest rates
JEL Classification Numbers: E41, E44, E52, G15
Keywords: Financial Liberalization, Financial Innovation, and Money Demand Function
Authors’ E-Mail Addresses:[email protected]; [email protected]
1 We thank, without implication, Markus Rodlauer, Steven Barnett, Papa N’Diaye, and Franziska Ohnsorge for their invaluable comments and suggestions, and Rosanne Heller for her editorial assistance.
This Working Paper should not be reported as representing the views of the IMF. The views expressed in this Working Paper are those of the author(s) and do not necessarily represent those of the IMF or IMF policy. Working Papers describe research in progress by the author(s) and are published to elicit comments and to further debate.
2
Contents Page I. Introduction ............................................................................................................................3 II. Drivers of Stability and Instability of the Money Demand Function ....................................4 III. China’s Financial Liberalization and Lessons from International Experiences ..................6
A. China’s experience ............................................................................................................6 B. Selected International Experiences .................................................................................8
IV. Empirical Methodology and Data ......................................................................................11
A. Methodology .................................................................................................................11 B. Data ...............................................................................................................................12
V. Results .................................................................................................................................13
A. Long-run Stability ..........................................................................................................13 B. Factors of instability .......................................................................................................14 C. Robustness Checks ...........................................................................................................16
VI. Money Demand Function in China: A Discussion ............................................................17 VII. Conclusion ........................................................................................................................19 References ................................................................................................................................21 Figures 1. China: Total Social Financing, 2006–12 ...............................................................................7 2. China: M2 Velocity and Multiplier Trends, 2001:Q2–2012:Q2 ...........................................8 3. Japan: M2 Velocity and Multiplier Trends, 1973:Q1–2005:Q4 ............................................9 4. Korea: M2 Velocity and Multiplier Trends, 1973:Q1–2005:Q4 .........................................10 5. United States: M2 Velocity and Multiplier Trends, 1973:Q1–2005:Q4..............................11 6. China: Interest Rate and Income Parameters Using M2, 2001:Q2–2012:Q2 ......................18 Tables 1. Definition of Domestic Financial Liberalization (DFL) Index ............................................13 2. Cointegration Tests of Real Money, Real Output, and Short-Term Interest Rates Using M2 .........................................................................................................................14 3. Summary Statistics of the Parameters in the Money Demand Function ............................14 4. Factors of Instability in Money Demand Function Parameters ...........................................15 5. Factors of Instability in Money Demand Function Parameters ...........................................17 6. China: Quandt-Andrews Unknown Breakpoint Test in the Money Demand Function .......18 Appendix: Data Description and Sources ................................................................................20
3
I. INTRODUCTION
The success of targeting a monetary aggregate depends on the stability of the money demand function (MDF). If a monetary aggregate has a stable relationship with real income and interest rates, then it also has useful information near-term outlook for the economy and, of most relevance to monetary policy, output and inflation. In such cases, monetary policy can be successfully implemented by targeting money or credit supply.
Structural changes in the financial system could affect the stability of the MDF. For instance, financial innovation and liberalization could alter the link between money aggregates, output, and interest rates, which makes monetary aggregate targeting less effective (Blundell-Wignall and others 1990). The emergence of new interest-bearing assets triggered by financial development may increase the interest rate sensitivity of money holdings; and the extensive use of credit cards and leveraging tools may reduce the dependence of money demand on income. In this circumstance, a monetary policy framework heavily centered on direct instruments may no longer be able to influence real output effectively. As a result, central banks may have to shift toward the use of indirect monetary instruments such as interest rates to exercise macroeconomic control.
In the case of China, the monetary policy environment has undergone significant change, especially since 2008 as financial innovation and the pace of reforms have accelerated. China has embarked on a series of bold reforms of its financial sector since 1980 to make the exchange rate more flexible; expand the interbank money, bond, and stock markets; open the banking sector to more competition; and liberalize interest rates. Consistent with the more liberalized financial system, the breadth and depth of financial markets has increased. Modern financial products―such as wealth management products (WMP), mutual funds, and options—have been developed and banking services and modern payment systems have been extended to almost every major city. In 2012, around half of financial intermediation took place outside the traditional banking sector, compared to only about 10 percent in the early 2000s. Meanwhile, China’s monetary policy has historically been exercised with quantity controls on bank lending (window guidance) and direct instruments (reserve requirements) guided by monetary aggregate targets (Laurens and Maino, 2007). With such a fast-changing financial system, however, the stability of the MDF becomes a crucial ingredient of monetary policy effectiveness. Despite these change, China has continued to rely heavily on M2 targets and active use of window guidance. It is, therefore, relevant to understand the stability and instability of the MDF.
We analyze the stability of money demand from international and Chinese perspectives. First, using quarterly data for eight countries (Denmark, France, Japan, Korea, Mexico, Norway, Sweden, and the United States) from 1970:Q1 to 2005:Q4, we investigate the stability of the MDF before and after domestic financial reforms, especially interest rate liberalization. The key results are as follows. We find that, for most countries, the long-run relationship between money balances, output, and interest rates is altered by both financial liberalization and innovation. Moreover, taking advantage of the panel structure of the data, we estimate the drivers of the
4
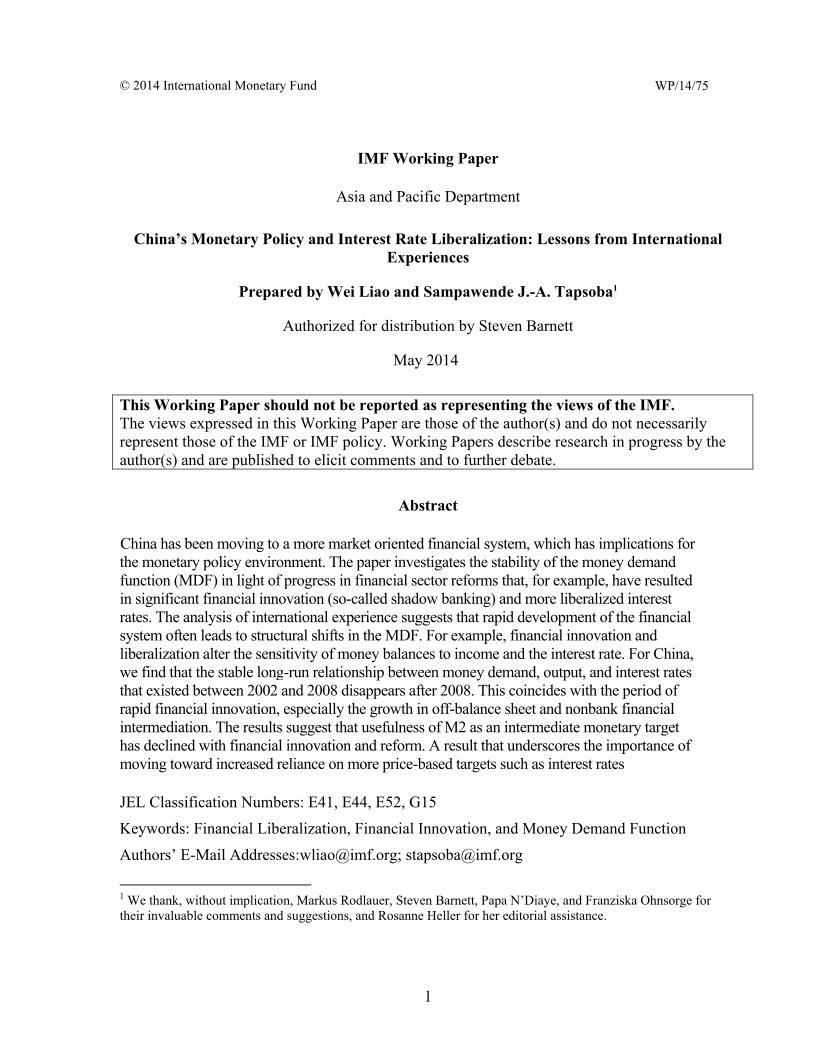
stability and instability of the MDF. It turns out that financial innovation and reforms reduce the sensitivity of money demand to income, but may raise interest rate sensitivity as households gain access to a larger pool of interest rate-bearing investment instruments. For China, comprehensive data are available from 2002. Our study finds that there is a significant structural shift in money velocity around 2009. Furthermore, cointegration tests show that a stable long-run relationship between M2, output, and interest rates exists over 2000–08, but is no longer evident if the post-2008 data are included. Such a structural shift in the MDF might be related to the brisk growth of off-balance-sheet activities and nonbank products (Figure 1). As China currently uses M2 as an intermediate monetary target, of which the effectiveness strongly depends on the stability of the MDF, our results imply that China will need to shift toward more price-based tools, such as interest rates, as an intermediate target for its monetary control.
The rest of the paper is structured as follows. Section II presents the theoretical background and a brief empirical literature review on the stability and instability of the MDF. Section III presents a selection of case studies (including China) on the adjustment of the conduct of monetary policy after rapid financial innovation and liberalization of domestic markets. Section IV describes the empirical strategy. Section V uses empirical models to investigate the stability and instability of the MDF and analyze the factors driving the sensitivity of money demand to output and interest rate changes. Section VI discusses the stability of the MDF for China and Section VII concludes.
II. DRIVERS OF STABILITY AND INSTABILITY OF THE MONEY DEMAND FUNCTION
Understanding the stability of money demand is important for conducting monetary policy, especially in frameworks that rely on quantitative targets. In a stable monetary policy environment, central bankers can adjust the money supply to achieve the desired growth objectives. Several studies have assessed the stability of the MDF by estimating a long-run relationship between money holdings, income, and interest rates. A number of papers have documented MDF instability (Ball, 2001 for the United States; Miyao, 1996 for Japan; and Pradhan and Subramanian, 2003 for India). Money holding depends on several factors and abrupt changes in those drivers can create instability of the MDF. Among these, the literature has focused on: (i) financial innovation (including Arrau and others, 1995; Sharma and Ericsson, 1998; Pradhan and Subramanian, 2003; and Choi and Oh, 2003); (ii) financial liberalization (McPhail, 1991; Haug, 1999; Caporale and Gil-Alana, 2005; and Maki and Kitasaka, 2006); (iii) wealth (Carstensen, 2006; Boone and van den Noord, 2008; and Dreger and Wolters, 2010); and (iv) macroeconomic uncertainty (Choi and Oh ,2003 and Atta-Mensah, 2004).
Financial innovation is a key determinant of the MDF. Financial sophistication affects the MDF through several channels such as financial deepening, the development of new financial products, deposit substitutes, and technological advancements in payments and transactions systems. The creation and growth of money substitutes has made the demand for money more interest elastic. Lieberman (1977) argues that increased use of credit, better synchronization of receipts and expenditures, more intensive use of money substitutes, and more efficient payments mechanisms will tend to decrease permanently the transaction demand for money over time. Sharma and
5
Ericsson (1998) and Pradhan and Subramanian (2003) find that financial advancement, such as the rapid introduction of interest-bearing assets and rapid development of financial infrastructure, can cause the MDF to become unstable. Arrau and others (1995) found that the intensive use of money substitutes and efficient payment mechanisms decrease the transaction demand for money through lower transactions costs and therefore reduce income elasticity. However, even if financial development starts from a low base, rapid monetization and higher savings in the form of time deposits, and ensuing financial innovation may increase demand for money (Choi and Oh, 2003).
Measures that promote financial market development could result in the deepening of markets for new and more attractive interest-sensitive assets. This may cause a one-time portfolio shift within the stock of monetary aggregates toward liquid assets, which could lower the income elasticity. At the same time, the emergence of new interest-bearing money substitutes may improve the sensitivity of money holdings to interest rates. However, other papers highlight the liquidity effect. It consists in a central bank’s purchase of bonds that creates a once-and-for-all increase in liquidity, but a persistent decrease in interest rates (Ireland, 2009 and Alvarez and Lippi, 2011). This effect would reduce or even flip the sign of the interest sensitivity of money demand.
The second important determinant of the MDF identified in the literature is financial liberalization. There is an established literature arguing that financial market reform may affect the demand for money, especially through financial innovation. In addition, increased competition among financial institutions will lower transactions costs and favor financial deepening. These changes may cause money demand to respond more rapidly to interest rate changes, and thereby increase the interest elasticity of money demand. Conversely, income elasticity decreases with improved competition in the banking system. In a competitive banking environment, new interest-bearing assets are rapidly developed, and these developments make it easier to convert money substitutes into money. Several studies show that past financial reforms did have significant effects on the MDF in advanced economies (McPhail, 1991; Haug, 1999; Caporale and Gil-Alana, 2005; and Maki and Kitasaka, 2006).
Besides financial innovation and financial liberalization, studies identify additional factors that could explain MDF instability, such as wealth and macroeconomic uncertainty. The effect of wealth on the demand for money can be positive or negative depending on the extent of the income effect relative to the substitution effect of wealth (Carstensen, 2006; Boone and van den Noord, 2008; and Dreger and Wolters, 2010). If the income effect dominates, wealth increases the demand for financial assets and monetary aggregates at a faster pace than income. Hence, in countries with significant wealth assets, income elasticity from the MDF tends to be larger. Conversely, if the substitution effect dominates, a rise in wealth could lead to a decline in money demand, and the income elasticity would be lower in countries with large financial assets. Much of the literature has shown that the preference for liquidity is determined by the level of macroeconomic uncertainty (Choi and Oh, 2003 and Atta-Mensah, 2004). Economic uncertainty measured as the volatility in the real exchange rate or inflation rate undermines the store-of-value function of money and therefore reduces the preference for liquidity. The opportunity cost of
6
holding money is higher in an unstable environment. For example, an increase in inflation volatility renders all nominal assets riskier as their real value becomes less predictable. In an uncertain inflationary environment, economic agents may prefer tangible assets such as gold or commodities. Similarly, in a hyperinflationary environment, dollarization or currency substitution (transactions in a foreign currency) could increase the velocity of the domestic money stock; such increases often have the appearance of being irreversible (Guidotti and Rodriguez, 1992). Accordingly, income elasticity is likely to be lower with macroeconomic instability and money demand will be less interest rate sensitive.
III. CHINA’S FINANCIAL LIBERALIZATION AND LESSONS FROM INTERNATIONAL
EXPERIENCES
International experience can provide some useful insights for China. We examine a sample of countries that went through bold financial market reforms (including China), focusing on how financial sector liberalization impacted the monetary policy environment and how the central bank responded to the changing environment.
A. China’s Experience
Starting in the early 1980s, China has been gradually reforming its financial sector. State-owned banks have been commercialized and restructured onto a more market-oriented footing since the early 1990s; shareholding banks have been set up and recognized since 1996; and markets have been gradually opened up to foreign-owned banks and to Chinese-foreign joint-venture financial institutions since the early 2000s. Interest rates have become considerably more flexible, with the ceiling on deposit interest rates the most prominent remaining restriction. Some recent steps include the expansion of the floating range of deposit and lending rates in mid-2012, and eliminating the floor on lending rates in July 2013.
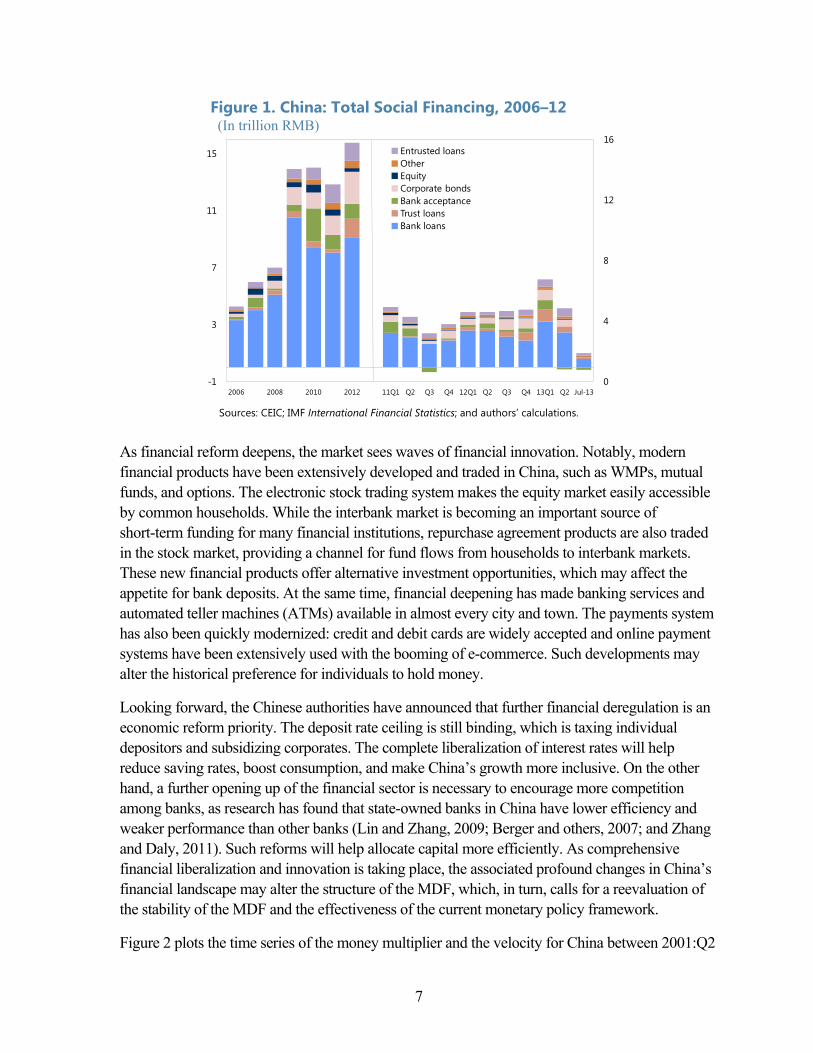
Outside the banking sector, the financial system has also been significantly modernized. For instance, the Shanghai and Shenzhen stock exchanges were set up in 1990 and 1991, and interbank money and bond markets have been developed since the late 1980s. As a result, the financial market structure is changing quickly. Equity, bond, and bank acceptance bills, as well as trust loans and private equity, are the major forms of financing other than the traditional bank loans (Figure 1). While the development of nontraditional finance marks a shift to more market-based intermediation, the migration of activity to less regulated parts of the system poses risks to financial stability.
7
Figure 1. China: Total Social Financing, 2006–12 (In trillion RMB)
Sources: CEIC; IMF International Financial Statistics; and authors’ calculations.
As financial reform deepens, the market sees waves of financial innovation. Notably, modern financial products have been extensively developed and traded in China, such as WMPs, mutual funds, and options. The electronic stock trading system makes the equity market easily accessible by common households. While the interbank market is becoming an important source of short-term funding for many financial institutions, repurchase agreement products are also traded in the stock market, providing a channel for fund flows from households to interbank markets. These new financial products offer alternative investment opportunities, which may affect the appetite for bank deposits. At the same time, financial deepening has made banking services and automated teller machines (ATMs) available in almost every city and town. The payments system has also been quickly modernized: credit and debit cards are widely accepted and online payment systems have been extensively used with the booming of e-commerce. Such developments may alter the historical preference for individuals to hold money.
Looking forward, the Chinese authorities have announced that further financial deregulation is an economic reform priority. The deposit rate ceiling is still binding, which is taxing individual depositors and subsidizing corporates. The complete liberalization of interest rates will help reduce saving rates, boost consumption, and make China’s growth more inclusive. On the other hand, a further opening up of the financial sector is necessary to encourage more competition among banks, as research has found that state-owned banks in China have lower efficiency and weaker performance than other banks (Lin and Zhang, 2009; Berger and others, 2007; and Zhang and Daly, 2011). Such reforms will help allocate capital more efficiently. As comprehensive financial liberalization and innovation is taking place, the associated profound changes in China’s financial landscape may alter the structure of the MDF, which, in turn, calls for a reevaluation of the stability of the MDF and the effectiveness of the current monetary policy framework.
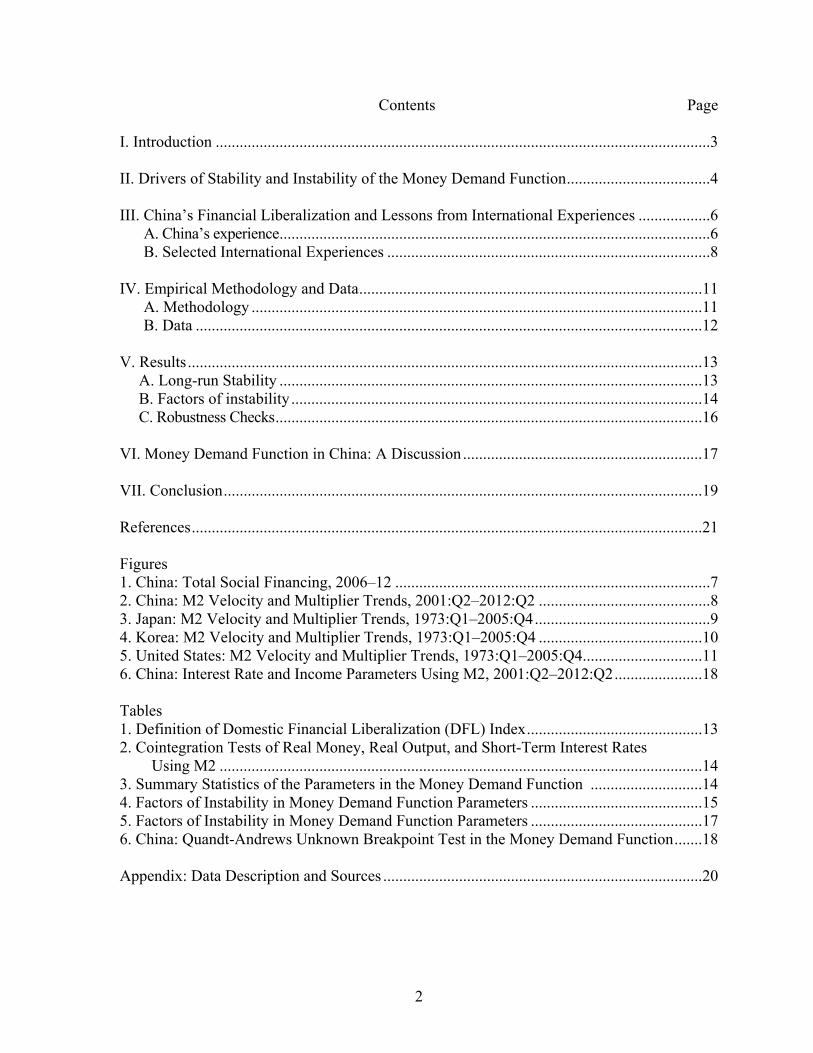
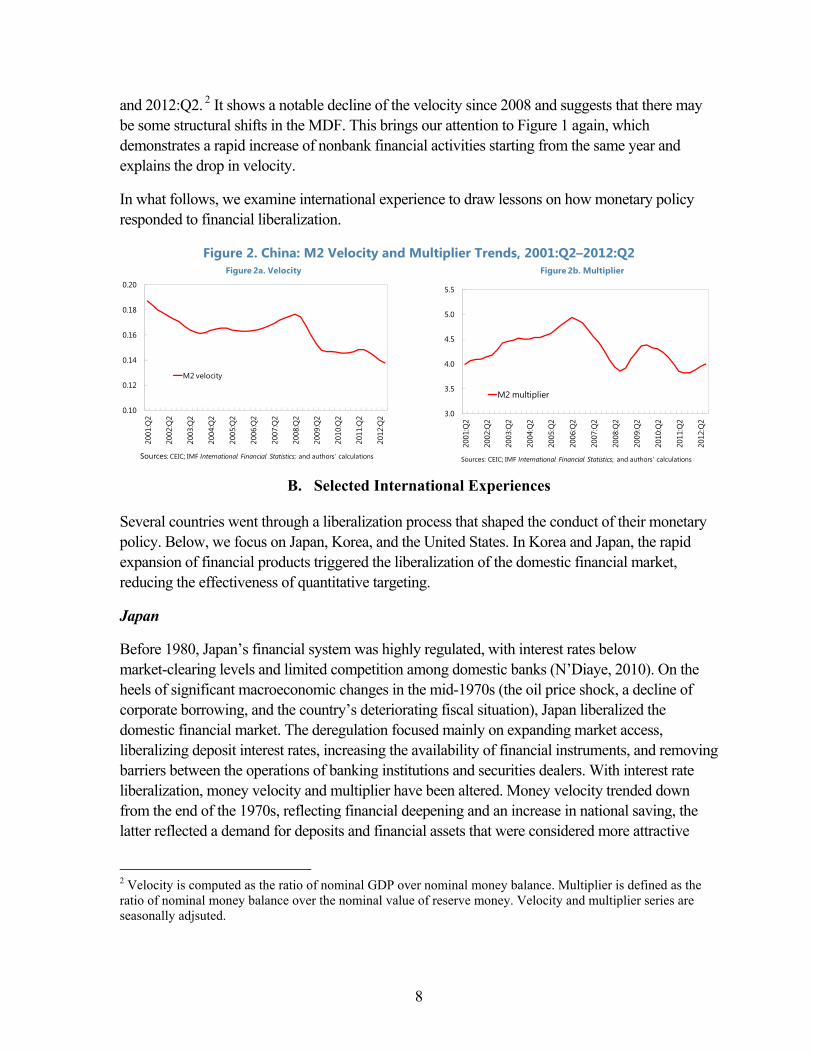
Figure 2 plots the time series of the money multiplier and the velocity for China between 2001:Q2
0
4
8
12
16
-1
3
7
11
15
2006 2008 2010 2012 11Q1 Q2 Q3 Q4 12Q1 Q2 Q3 Q4 13Q1 Q2 Jul-13
Entrusted loansOtherEquityCorporate bondsBank acceptanceTrust loansBank loans
8
and 2012:Q2. 2 It shows a notable decline of the velocity since 2008 and suggests that there may be some structural shifts in the MDF. This brings our attention to Figure 1 again, which demonstrates a rapid increase of nonbank financial activities starting from the same year and explains the drop in velocity.
In what follows, we examine international experience to draw lessons on how monetary policy responded to financial liberalization.
Figure 2. China: M2 Velocity and Multiplier Trends, 2001:Q2–2012:Q2
B. Selected International Experiences
Several countries went through a liberalization process that shaped the conduct of their monetary policy. Below, we focus on Japan, Korea, and the United States. In Korea and Japan, the rapid expansion of financial products triggered the liberalization of the domestic financial market, reducing the effectiveness of quantitative targeting.
Japan
Before 1980, Japan’s financial system was highly regulated, with interest rates below market-clearing levels and limited competition among domestic banks (N’Diaye, 2010). On the heels of significant macroeconomic changes in the mid-1970s (the oil price shock, a decline of corporate borrowing, and the country’s deteriorating fiscal situation), Japan liberalized the domestic financial market. The deregulation focused mainly on expanding market access, liberalizing deposit interest rates, increasing the availability of financial instruments, and removing barriers between the operations of banking institutions and securities dealers. With interest rate liberalization, money velocity and multiplier have been altered. Money velocity trended down from the end of the 1970s, reflecting financial deepening and an increase in national saving, the latter reflected a demand for deposits and financial assets that were considered more attractive
2 Velocity is computed as the ratio of nominal GDP over nominal money balance. Multiplier is defined as the ratio of nominal money balance over the nominal value of reserve money. Velocity and multiplier series are seasonally adjsuted.
0.10
0.12
0.14
0.16
0.18
0.20
2001
:Q2
2002
:Q2
2003
:Q2
2004
:Q2
2005
:Q2
2006
:Q2
2007
:Q2
2008
:Q2
2009
:Q2
2010
:Q2
2011
:Q2
2012
:Q2
M2 velocity
Figure 2a. Velocity
Sources: CEIC; IMF International Financial Statistics; and authors’ calculations
3.0
3.5
4.0
4.5
5.0
5.5
2001
:Q2
2002
:Q2
2003
:Q2
2004
:Q2
2005
:Q2
2006
:Q2
2007
:Q2
2008
:Q2
2009
:Q2
2010
:Q2
2011
:Q2
2012
:Q2
M2 multiplier
Figure 2b. Multiplier
Sources: CEIC; IMF International Financial Statistics; and authors’ calculations
9
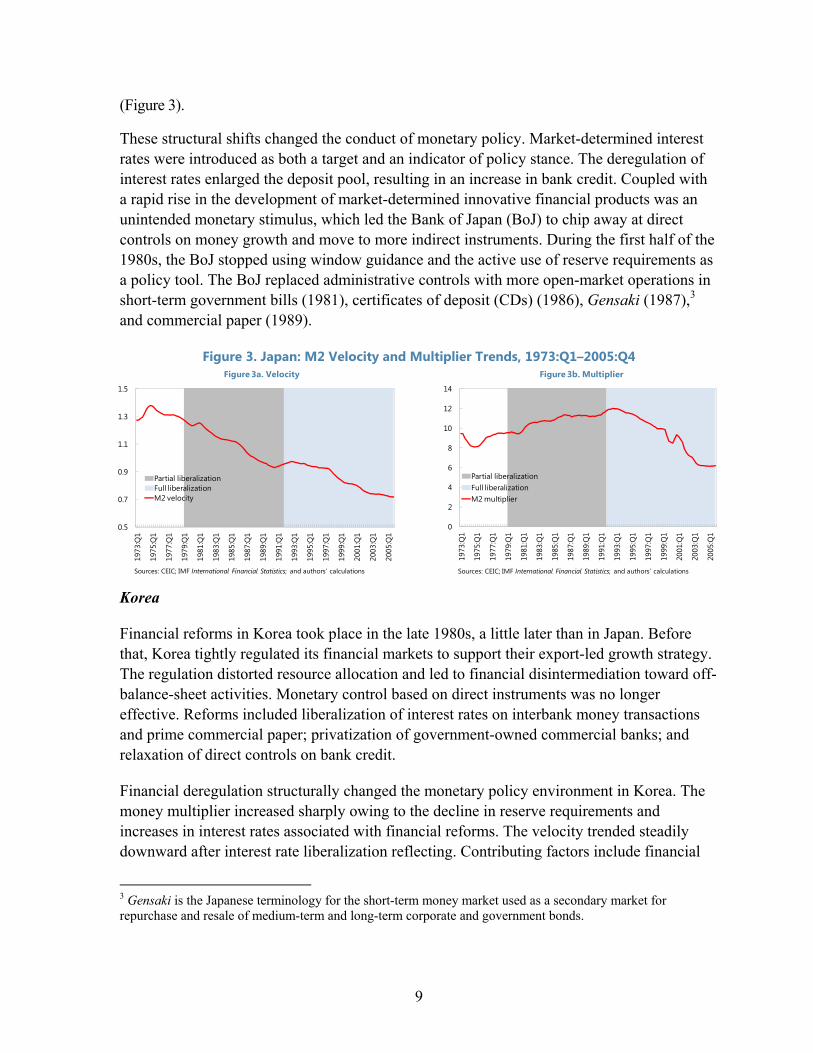
(Figure 3).
These structural shifts changed the conduct of monetary policy. Market-determined interest rates were introduced as both a target and an indicator of policy stance. The deregulation of interest rates enlarged the deposit pool, resulting in an increase in bank credit. Coupled with a rapid rise in the development of market-determined innovative financial products was an unintended monetary stimulus, which led the Bank of Japan (BoJ) to chip away at direct controls on money growth and move to more indirect instruments. During the first half of the 1980s, the BoJ stopped using window guidance and the active use of reserve requirements as a policy tool. The BoJ replaced administrative controls with more open-market operations in short-term government bills (1981), certificates of deposit (CDs) (1986), Gensaki (1987),3 and commercial paper (1989).
Figure 3. Japan: M2 Velocity and Multiplier Trends, 1973:Q1–2005:Q4
Korea
Financial reforms in Korea took place in the late 1980s, a little later than in Japan. Before that, Korea tightly regulated its financial markets to support their export-led growth strategy. The regulation distorted resource allocation and led to financial disintermediation toward off-balance-sheet activities. Monetary control based on direct instruments was no longer effective. Reforms included liberalization of interest rates on interbank money transactions and prime commercial paper; privatization of government-owned commercial banks; and relaxation of direct controls on bank credit.
Financial deregulation structurally changed the monetary policy environment in Korea. The money multiplier increased sharply owing to the decline in reserve requirements and increases in interest rates associated with financial reforms. The velocity trended steadily downward after interest rate liberalization reflecting. Contributing factors include financial
3 Gensaki is the Japanese terminology for the short-term money market used as a secondary market for repurchase and resale of medium-term and long-term corporate and government bonds.
0
2
4
6
8
10
12
14
1973
:Q1
1975
:Q1
1977
:Q1
1979
:Q1
1981
:Q1
1983
:Q1
1985
:Q1
1987
:Q1
1989
:Q1
1991
:Q1
1993
:Q1
1995
:Q1
1997
:Q1
1999
:Q1
2001
:Q1
2003
:Q1
2005
:Q1
Partial liberalizationFull liberalizationM2 multiplier
Figure 3b. Multiplier
Sources: CEIC; IMF International Financial Statistics; and authors’ calculations
0.5
0.7
0.9
1.1
1.3
1.5
1973
:Q1
1975
:Q1
1977
:Q1
1979
:Q1
1981
:Q1
1983
:Q1
1985
:Q1
1987
:Q1
1989
:Q1
1991
:Q1
1993
:Q1
1995
:Q1
1997
:Q1
1999
:Q1
2001
:Q1
2003
:Q1
2005
:Q1
Partial liberalizationFull liberalizationM2 velocity
Figure 3a. Velocity
Sources: CEIC; IMF International Financial Statistics; and authors’ calculations
10
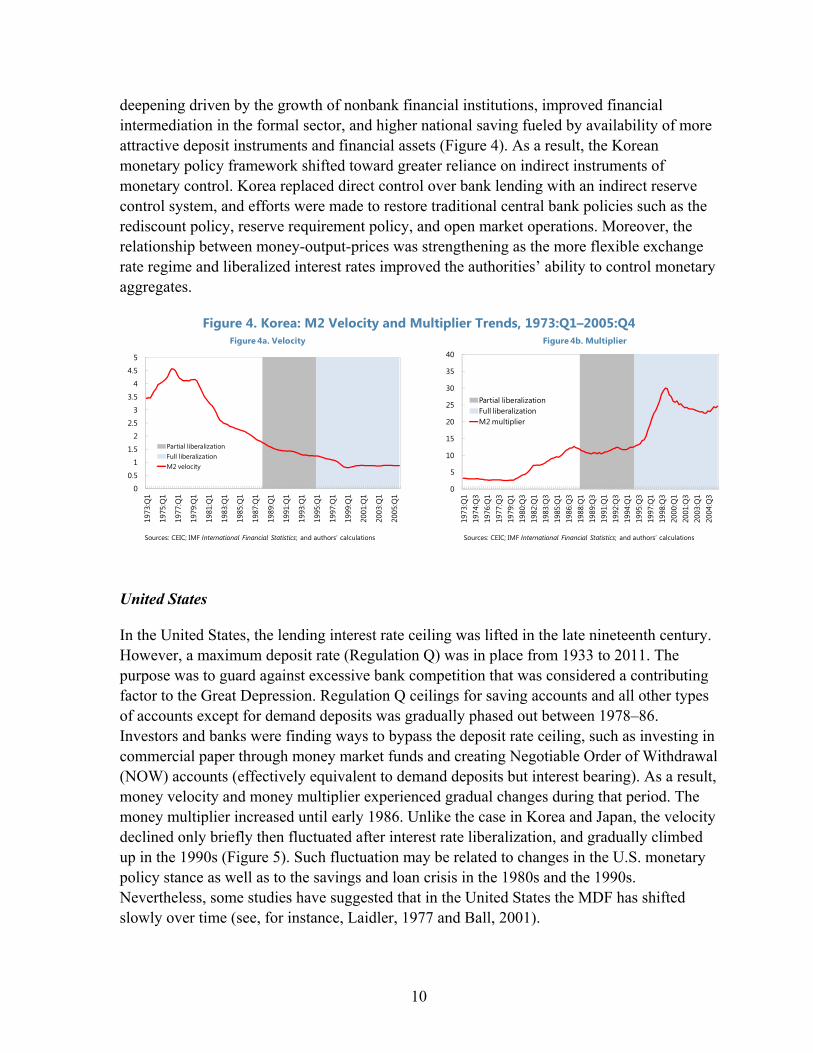
deepening driven by the growth of nonbank financial institutions, improved financial intermediation in the formal sector, and higher national saving fueled by availability of more attractive deposit instruments and financial assets (Figure 4). As a result, the Korean monetary policy framework shifted toward greater reliance on indirect instruments of monetary control. Korea replaced direct control over bank lending with an indirect reserve control system, and efforts were made to restore traditional central bank policies such as the rediscount policy, reserve requirement policy, and open market operations. Moreover, the relationship between money-output-prices was strengthening as the more flexible exchange rate regime and liberalized interest rates improved the authorities’ ability to control monetary aggregates.
Figure 4. Korea: M2 Velocity and Multiplier Trends, 1973:Q1–2005:Q4
United States
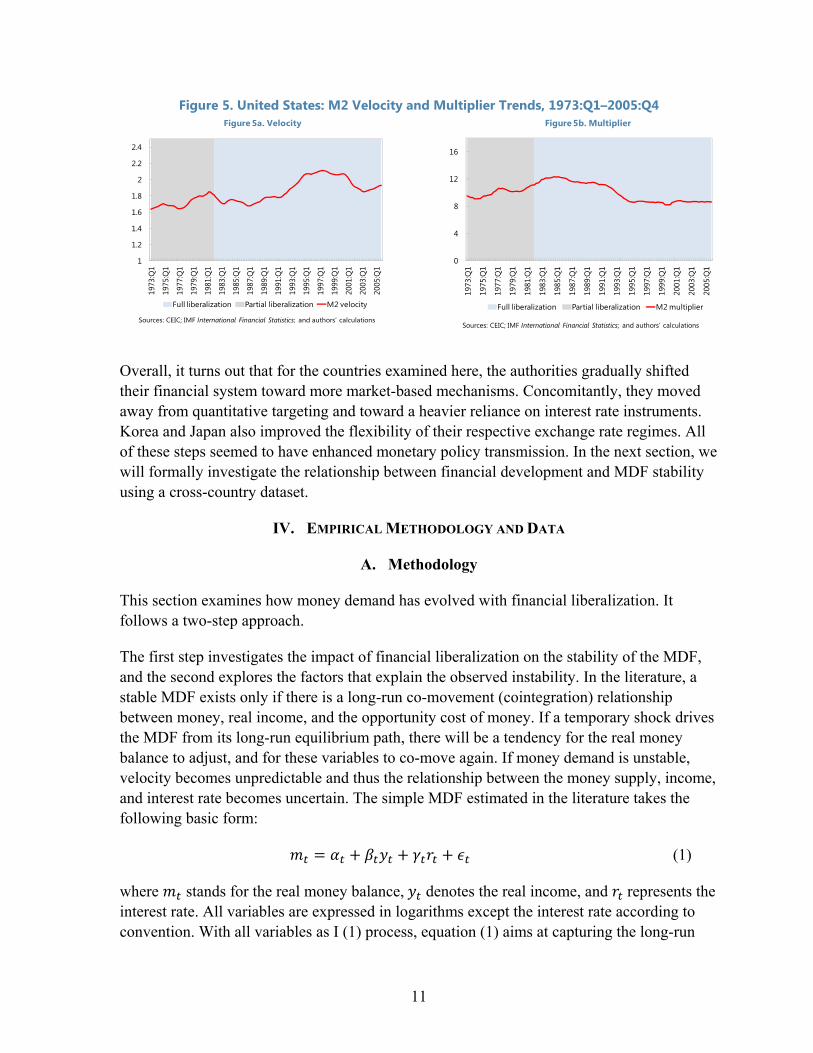
In the United States, the lending interest rate ceiling was lifted in the late nineteenth century. However, a maximum deposit rate (Regulation Q) was in place from 1933 to 2011. The purpose was to guard against excessive bank competition that was considered a contributing factor to the Great Depression. Regulation Q ceilings for saving accounts and all other types of accounts except for demand deposits was gradually phased out between 1978–86. Investors and banks were finding ways to bypass the deposit rate ceiling, such as investing in commercial paper through money market funds and creating Negotiable Order of Withdrawal (NOW) accounts (effectively equivalent to demand deposits but interest bearing). As a result, money velocity and money multiplier experienced gradual changes during that period. The money multiplier increased until early 1986. Unlike the case in Korea and Japan, the velocity declined only briefly then fluctuated after interest rate liberalization, and gradually climbed up in the 1990s (Figure 5). Such fluctuation may be related to changes in the U.S. monetary policy stance as well as to the savings and loan crisis in the 1980s and the 1990s. Nevertheless, some studies have suggested that in the United States the MDF has shifted slowly over time (see, for instance, Laidler, 1977 and Ball, 2001).
0
0.5
1
1.5
2
2.5
3
3.5
4
4.5
5
1973
:Q1
1975
:Q1
1977
:Q1
1979
:Q1
1981
:Q1
1983
:Q1
1985
:Q1
1987
:Q1
1989
:Q1
1991
:Q1
1993
:Q1
1995
:Q1
1997
:Q1
1999
:Q1
2001
:Q1
2003
:Q1
2005
:Q1
Partial liberalizationFull liberalizationM2 velocity
Figure 4a. Velocity
Sources: CEIC; IMF International Financial Statistics; and authors’ calculations
0
5
10
15
20
25
30
35
40
1973
:Q1
1974
:Q3
1976
:Q1
1977
:Q3
1979
:Q1
1980
:Q3
1982
:Q1
1983
:Q3
1985
:Q1
1986
:Q3
1988
:Q1
1989
:Q3
1991
:Q1
1992
:Q3
1994
:Q1
1995
:Q3
1997
:Q1
1998
:Q3
2000
:Q1
2001
:Q3
2003
:Q1
2004
:Q3
Partial liberalizationFull liberalizationM2 multiplier
Figure 4b. Multiplier
Sources: CEIC; IMF International Financial Statistics; and authors’ calculations
11
Figure 5. United States: M2 Velocity and Multiplier Trends, 1973:Q1–2005:Q4
Overall, it turns out that for the countries examined here, the authorities gradually shifted their financial system toward more market-based mechanisms. Concomitantly, they moved away from quantitative targeting and toward a heavier reliance on interest rate instruments. Korea and Japan also improved the flexibility of their respective exchange rate regimes. All of these steps seemed to have enhanced monetary policy transmission. In the next section, we will formally investigate the relationship between financial development and MDF stability using a cross-country dataset.
IV. EMPIRICAL METHODOLOGY AND DATA
A. Methodology
This section examines how money demand has evolved with financial liberalization. It follows a two-step approach.
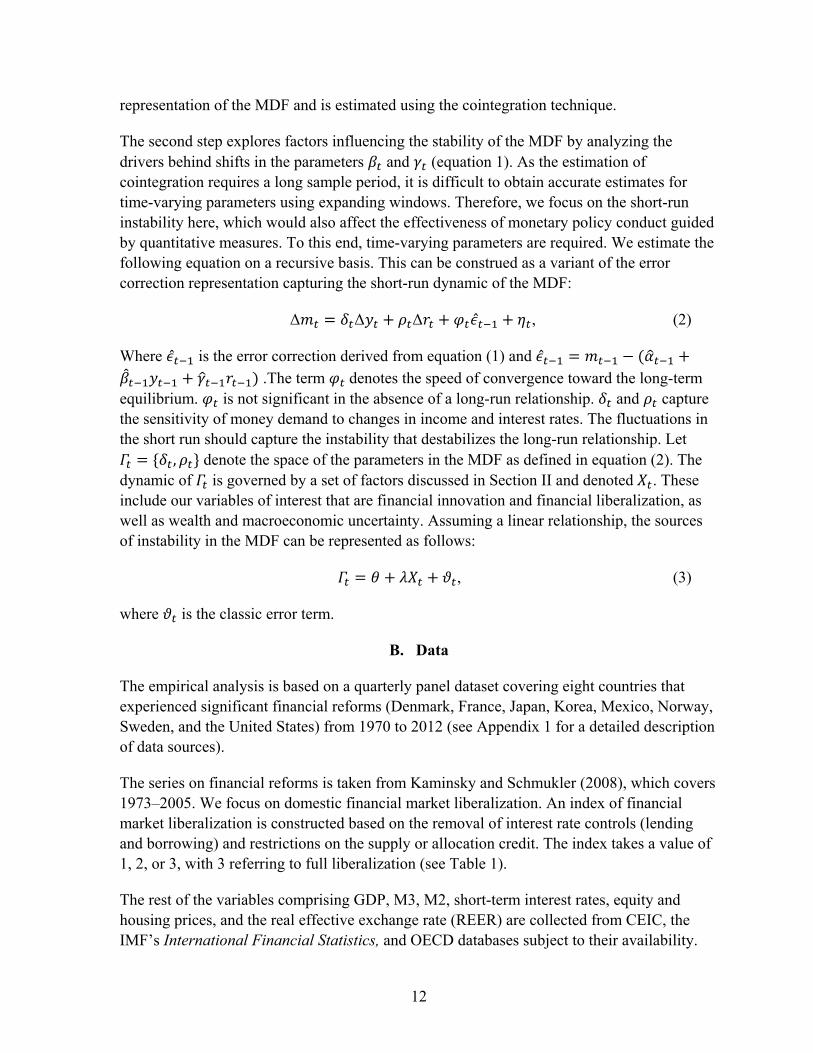
The first step investigates the impact of financial liberalization on the stability of the MDF, and the second explores the factors that explain the observed instability. In the literature, a stable MDF exists only if there is a long-run co-movement (cointegration) relationship between money, real income, and the opportunity cost of money. If a temporary shock drives the MDF from its long-run equilibrium path, there will be a tendency for the real money balance to adjust, and for these variables to co-move again. If money demand is unstable, velocity becomes unpredictable and thus the relationship between the money supply, income, and interest rate becomes uncertain. The simple MDF estimated in the literature takes the following basic form:
(1)
where stands for the real money balance, denotes the real income, and represents the interest rate. All variables are expressed in logarithms except the interest rate according to convention. With all variables as I (1) process, equation (1) aims at capturing the long-run
0
4
8
12
16
1973
:Q1
1975
:Q1
1977
:Q1
1979
:Q1
1981
:Q1
1983
:Q1
1985
:Q1
1987
:Q1
1989
:Q1
1991
:Q1
1993
:Q1
1995
:Q1
1997
:Q1
1999
:Q1
2001
:Q1
2003
:Q1
2005
:Q1
Full liberalization Partial liberalization M2 multiplier
Figure 5b. Multiplier
Sources: CEIC; IMF International Financial Statistics; and authors’ calculations
1
1.2
1.4
1.6
1.8
2
2.2
2.419
73:Q
1
1975
:Q1
1977
:Q1
1979
:Q1
1981
:Q1
1983
:Q1
1985
:Q1
1987
:Q1
1989
:Q1
1991
:Q1
1993
:Q1
1995
:Q1
1997
:Q1
1999
:Q1
2001
:Q1
2003
:Q1
2005
:Q1
Full liberalization Partial liberalization M2 velocity
Figure 5a. Velocity
Sources: CEIC; IMF International Financial Statistics; and authors’ calculations
12
representation of the MDF and is estimated using the cointegration technique.
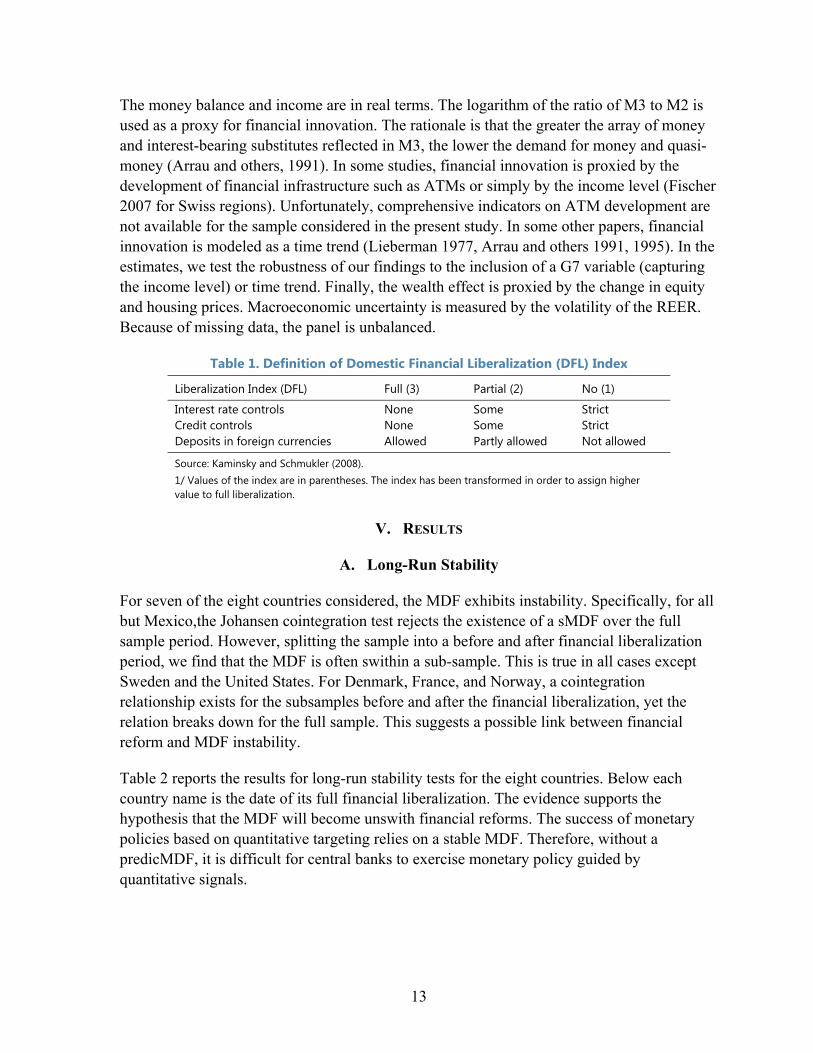
The second step explores factors influencing the stability of the MDF by analyzing the drivers behind shifts in the parameters and (equation 1). As the estimation of cointegration requires a long sample period, it is difficult to obtain accurate estimates for time-varying parameters using expanding windows. Therefore, we focus on the short-run instability here, which would also affect the effectiveness of monetary policy conduct guided by quantitative measures. To this end, time-varying parameters are required. We estimate the following equation on a recursive basis. This can be construed as a variant of the error correction representation capturing the short-run dynamic of the MDF:
Δ Δ Δ ̂ , (2)
Where ̂ is the error correction derived from equation (1) and ̂ .The term denotes the speed of convergence toward the long-term
equilibrium. is not significant in the absence of a long-run relationship. and capture the sensitivity of money demand to changes in income and interest rates. The fluctuations in the short run should capture the instability that destabilizes the long-run relationship. Let
, denote the space of the parameters in the MDF as defined in equation (2). The dynamic of is governed by a set of factors discussed in Section II and denoted . These include our variables of interest that are financial innovation and financial liberalization, as well as wealth and macroeconomic uncertainty. Assuming a linear relationship, the sources of instability in the MDF can be represented as follows:
, (3)
where is the classic error term.
B. Data
The empirical analysis is based on a quarterly panel dataset covering eight countries that experienced significant financial reforms (Denmark, France, Japan, Korea, Mexico, Norway, Sweden, and the United States) from 1970 to 2012 (see Appendix 1 for a detailed description of data sources).
The series on financial reforms is taken from Kaminsky and Schmukler (2008), which covers 1973–2005. We focus on domestic financial market liberalization. An index of financial market liberalization is constructed based on the removal of interest rate controls (lending and borrowing) and restrictions on the supply or allocation credit. The index takes a value of 1, 2, or 3, with 3 referring to full liberalization (see Table 1).
The rest of the variables comprising GDP, M3, M2, short-term interest rates, equity and housing prices, and the real effective exchange rate (REER) are collected from CEIC, the IMF’s International Financial Statistics, and OECD databases subject to their availability.
13
The money balance and income are in real terms. The logarithm of the ratio of M3 to M2 is used as a proxy for financial innovation. The rationale is that the greater the array of money and interest-bearing substitutes reflected in M3, the lower the demand for money and quasi-money (Arrau and others, 1991). In some studies, financial innovation is proxied by the development of financial infrastructure such as ATMs or simply by the income level (Fischer 2007 for Swiss regions). Unfortunately, comprehensive indicators on ATM development are not available for the sample considered in the present study. In some other papers, financial innovation is modeled as a time trend (Lieberman 1977, Arrau and others 1991, 1995). In the estimates, we test the robustness of our findings to the inclusion of a G7 variable (capturing the income level) or time trend. Finally, the wealth effect is proxied by the change in equity and housing prices. Macroeconomic uncertainty is measured by the volatility of the REER. Because of missing data, the panel is unbalanced.
Table 1. Definition of Domestic Financial Liberalization (DFL) Index
Liberalization Index (DFL) Full (3) Partial (2) No (1)
Interest rate controls None Some Strict Credit controls None Some Strict Deposits in foreign currencies Allowed Partly allowed Not allowed
Source: Kaminsky and Schmukler (2008). 1/ Values of the index are in parentheses. The index has been transformed in order to assign higher value to full liberalization.
V. RESULTS
A. Long-Run Stability
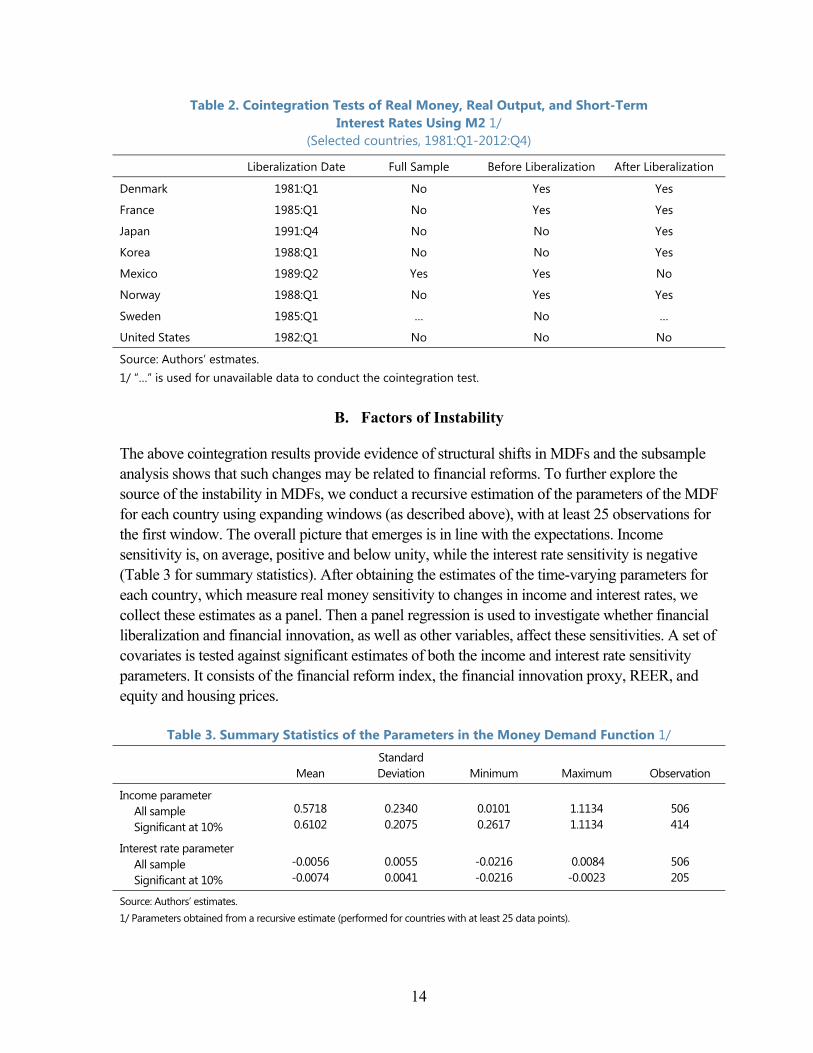
For seven of the eight countries considered, the MDF exhibits instability. Specifically, for all but Mexico,the Johansen cointegration test rejects the existence of a sMDF over the full sample period. However, splitting the sample into a before and after financial liberalization period, we find that the MDF is often swithin a sub-sample. This is true in all cases except Sweden and the United States. For Denmark, France, and Norway, a cointegration relationship exists for the subsamples before and after the financial liberalization, yet the relation breaks down for the full sample. This suggests a possible link between financial reform and MDF instability.
Table 2 reports the results for long-run stability tests for the eight countries. Below each country name is the date of its full financial liberalization. The evidence supports the hypothesis that the MDF will become unswith financial reforms. The success of monetary policies based on quantitative targeting relies on a stable MDF. Therefore, without a predicMDF, it is difficult for central banks to exercise monetary policy guided by quantitative signals.
14
Table 2. Cointegration Tests of Real Money, Real Output, and Short-Term Interest Rates Using M2 1/
(Selected countries, 1981:Q1-2012:Q4)
Liberalization Date Full Sample Before Liberalization After Liberalization
Denmark 1981:Q1 No Yes Yes
France 1985:Q1 No Yes Yes
Japan 1991:Q4 No No Yes
Korea 1988:Q1 No No Yes
Mexico 1989:Q2 Yes Yes No
Norway 1988:Q1 No Yes Yes
Sweden 1985:Q1 … No …
United States 1982:Q1 No No No
Source: Authors’ estmates. 1/ “…” is used for unavailable data to conduct the cointegration test.
B. Factors of Instability
The above cointegration results provide evidence of structural shifts in MDFs and the subsample analysis shows that such changes may be related to financial reforms. To further explore the source of the instability in MDFs, we conduct a recursive estimation of the parameters of the MDF for each country using expanding windows (as described above), with at least 25 observations for the first window. The overall picture that emerges is in line with the expectations. Income sensitivity is, on average, positive and below unity, while the interest rate sensitivity is negative (Table 3 for summary statistics). After obtaining the estimates of the time-varying parameters for each country, which measure real money sensitivity to changes in income and interest rates, we collect these estimates as a panel. Then a panel regression is used to investigate whether financial liberalization and financial innovation, as well as other variables, affect these sensitivities. A set of covariates is tested against significant estimates of both the income and interest rate sensitivity parameters. It consists of the financial reform index, the financial innovation proxy, REER, and equity and housing prices.
Table 3. Summary Statistics of the Parameters in the Money Demand Function 1/
Mean Standard Deviation Minimum Maximum Observation
Income parameter All sample Significant at 10%
0.5718 0.6102
0.2340 0.2075
0.0101 0.2617
1.1134 1.1134
506 414
Interest rate parameter All sample Significant at 10%
-0.0056 -0.0074
0.0055 0.0041
-0.0216 -0.0216
0.0084 -0.0023
506 205
Source: Authors’ estimates. 1/ Parameters obtained from a recursive estimate (performed for countries with at least 25 data points).
15
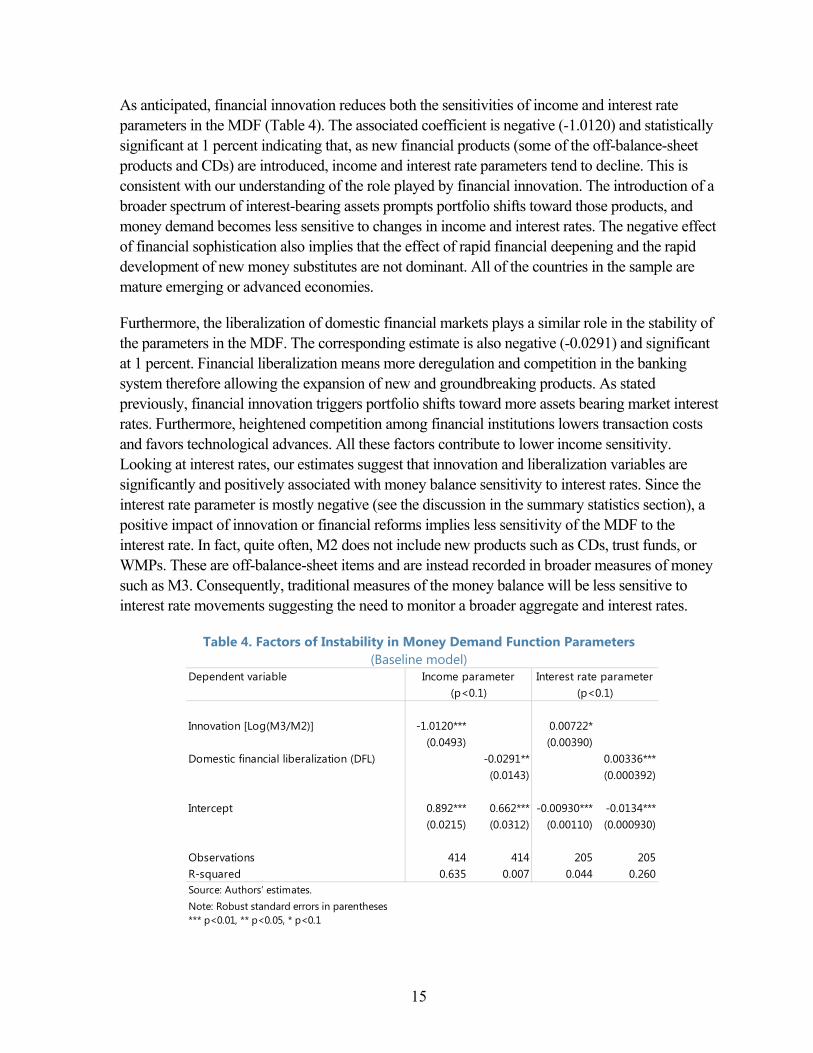
As anticipated, financial innovation reduces both the sensitivities of income and interest rate parameters in the MDF (Table 4). The associated coefficient is negative (-1.0120) and statistically significant at 1 percent indicating that, as new financial products (some of the off-balance-sheet products and CDs) are introduced, income and interest rate parameters tend to decline. This is consistent with our understanding of the role played by financial innovation. The introduction of a broader spectrum of interest-bearing assets prompts portfolio shifts toward those products, and money demand becomes less sensitive to changes in income and interest rates. The negative effect of financial sophistication also implies that the effect of rapid financial deepening and the rapid development of new money substitutes are not dominant. All of the countries in the sample are mature emerging or advanced economies.
Furthermore, the liberalization of domestic financial markets plays a similar role in the stability of the parameters in the MDF. The corresponding estimate is also negative (-0.0291) and significant at 1 percent. Financial liberalization means more deregulation and competition in the banking system therefore allowing the expansion of new and groundbreaking products. As stated previously, financial innovation triggers portfolio shifts toward more assets bearing market interest rates. Furthermore, heightened competition among financial institutions lowers transaction costs and favors technological advances. All these factors contribute to lower income sensitivity. Looking at interest rates, our estimates suggest that innovation and liberalization variables are significantly and positively associated with money balance sensitivity to interest rates. Since the interest rate parameter is mostly negative (see the discussion in the summary statistics section), a positive impact of innovation or financial reforms implies less sensitivity of the MDF to the interest rate. In fact, quite often, M2 does not include new products such as CDs, trust funds, or WMPs. These are off-balance-sheet items and are instead recorded in broader measures of money such as M3. Consequently, traditional measures of the money balance will be less sensitive to interest rate movements suggesting the need to monitor a broader aggregate and interest rates.
Table 4. Factors of Instability in Money Demand Function Parameters (Baseline model)
Innovation [Log(M3/M2)] -1.0120*** 0.00722*(0.0493) (0.00390)
Domestic financial liberalization (DFL) -0.0291** 0.00336***(0.0143) (0.000392)
Intercept 0.892*** 0.662*** -0.00930*** -0.0134***(0.0215) (0.0312) (0.00110) (0.000930)
Observations 414 414 205 205R-squared 0.635 0.007 0.044 0.260Source: Authors’ estimates.Note: Robust standard errors in parentheses*** p<0.01, ** p<0.05, * p<0.1
Dependent variable Income parameter (p<0.1)
Interest rate parameter (p<0.1)
16
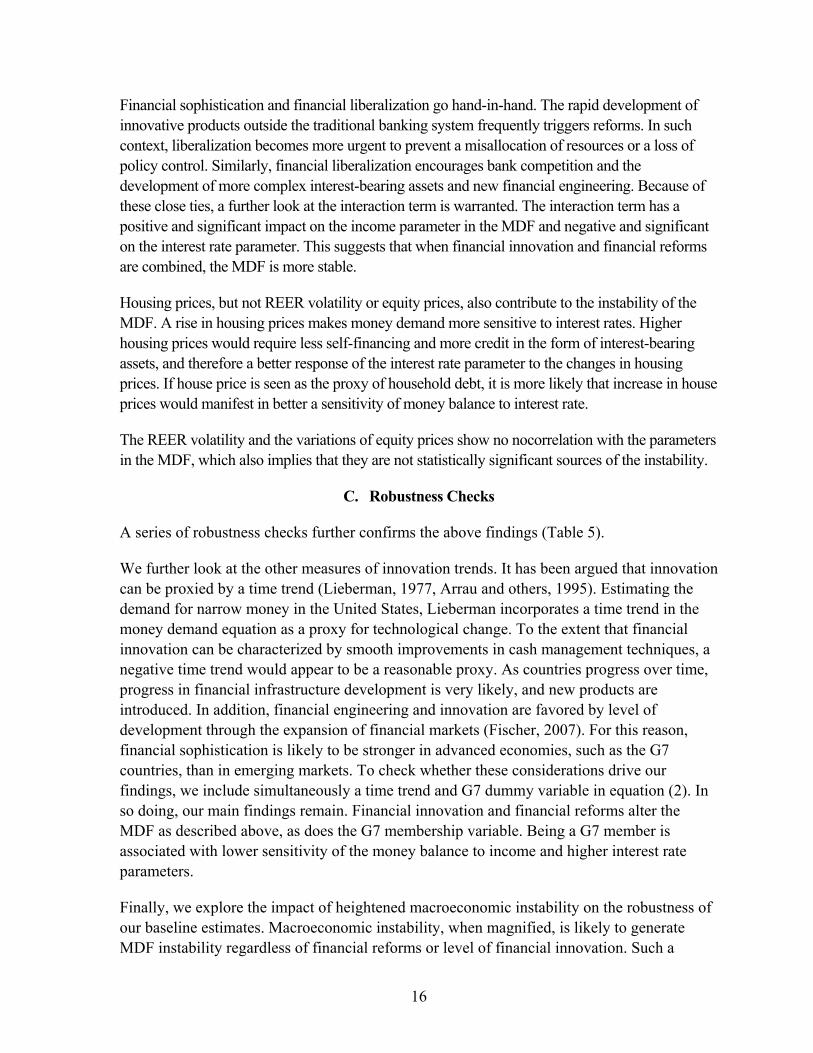
Financial sophistication and financial liberalization go hand-in-hand. The rapid development of innovative products outside the traditional banking system frequently triggers reforms. In such context, liberalization becomes more urgent to prevent a misallocation of resources or a loss of policy control. Similarly, financial liberalization encourages bank competition and the development of more complex interest-bearing assets and new financial engineering. Because of these close ties, a further look at the interaction term is warranted. The interaction term has a positive and significant impact on the income parameter in the MDF and negative and significant on the interest rate parameter. This suggests that when financial innovation and financial reforms are combined, the MDF is more stable.
Housing prices, but not REER volatility or equity prices, also contribute to the instability of the MDF. A rise in housing prices makes money demand more sensitive to interest rates. Higher housing prices would require less self-financing and more credit in the form of interest-bearing assets, and therefore a better response of the interest rate parameter to the changes in housing prices. If house price is seen as the proxy of household debt, it is more likely that increase in house prices would manifest in better a sensitivity of money balance to interest rate.
The REER volatility and the variations of equity prices show no nocorrelation with the parameters in the MDF, which also implies that they are not statistically significant sources of the instability.
C. Robustness Checks
A series of robustness checks further confirms the above findings (Table 5).
We further look at the other measures of innovation trends. It has been argued that innovation can be proxied by a time trend (Lieberman, 1977, Arrau and others, 1995). Estimating the demand for narrow money in the United States, Lieberman incorporates a time trend in the money demand equation as a proxy for technological change. To the extent that financial innovation can be characterized by smooth improvements in cash management techniques, a negative time trend would appear to be a reasonable proxy. As countries progress over time, progress in financial infrastructure development is very likely, and new products are introduced. In addition, financial engineering and innovation are favored by level of development through the expansion of financial markets (Fischer, 2007). For this reason, financial sophistication is likely to be stronger in advanced economies, such as the G7 countries, than in emerging markets. To check whether these considerations drive our findings, we include simultaneously a time trend and G7 dummy variable in equation (2). In so doing, our main findings remain. Financial innovation and financial reforms alter the MDF as described above, as does the G7 membership variable. Being a G7 member is associated with lower sensitivity of the money balance to income and higher interest rate parameters.
Finally, we explore the impact of heightened macroeconomic instability on the robustness of our baseline estimates. Macroeconomic instability, when magnified, is likely to generate MDF instability regardless of financial reforms or level of financial innovation. Such a
17
context could be proxied by banking crises. To this end, we include in equation (2) a dummy variable for countries facing a banking crisis (data from Laeven and Valencia, 2013). It turns out that our baseline findings are again robust after accounting for a significant episode of macroeconomic instability. A banking crisis itself can affect the stability of the MDF but does not change the result that financial innovation and financial reforms are key in influencing the stability of money demand and the ability of a nation’s central bank to conduct monetary policy based on quantitative targeting.
Table 5. Factors of Instability in Money Demand Function Parameters (Augmented model)
To recapitulate, financial innovation and financial liberalization help explain the structural shifts in the MDF. They reduce MDF sensitivity to income and the picture for interest rate sensitivity is mixed. We also find that when financial innovation and liberalization proceed in tandem, that the MDF tends to be more stable.
VI. MONEY DEMAND FUNCTION IN CHINA: A DISCUSSION
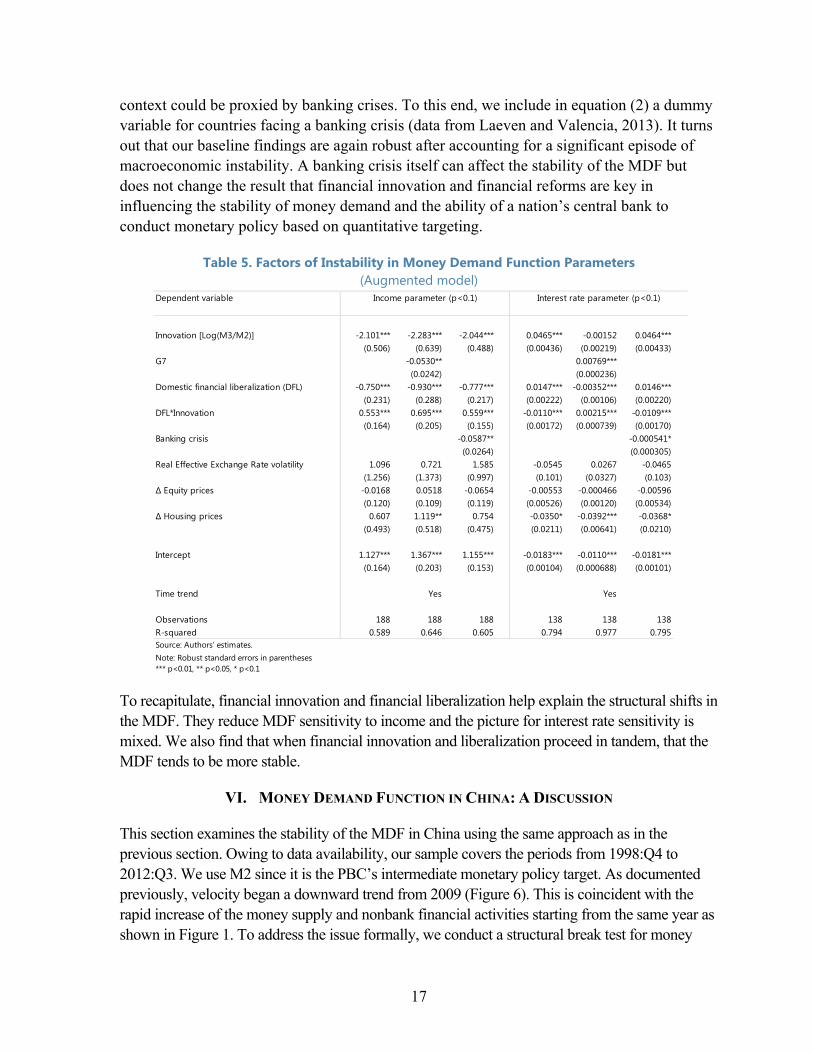
This section examines the stability of the MDF in China using the same approach as in the previous section. Owing to data availability, our sample covers the periods from 1998:Q4 to 2012:Q3. We use M2 since it is the PBC’s intermediate monetary policy target. As documented previously, velocity began a downward trend from 2009 (Figure 6). This is coincident with the rapid increase of the money supply and nonbank financial activities starting from the same year as shown in Figure 1. To address the issue formally, we conduct a structural break test for money
Innovation [Log(M3/M2)] -2.101*** -2.283*** -2.044*** 0.0465*** -0.00152 0.0464***(0.506) (0.639) (0.488) (0.00436) (0.00219) (0.00433)
G7 -0.0530** 0.00769***(0.0242) (0.000236)
Domestic financial liberalization (DFL) -0.750*** -0.930*** -0.777*** 0.0147*** -0.00352*** 0.0146***(0.231) (0.288) (0.217) (0.00222) (0.00106) (0.00220)
DFL*Innovation 0.553*** 0.695*** 0.559*** -0.0110*** 0.00215*** -0.0109***(0.164) (0.205) (0.155) (0.00172) (0.000739) (0.00170)
Banking crisis -0.0587** -0.000541*(0.0264) (0.000305)
Real Effective Exchange Rate volatility 1.096 0.721 1.585 -0.0545 0.0267 -0.0465(1.256) (1.373) (0.997) (0.101) (0.0327) (0.103)
∆ Equity prices -0.0168 0.0518 -0.0654 -0.00553 -0.000466 -0.00596(0.120) (0.109) (0.119) (0.00526) (0.00120) (0.00534)
∆ Housing prices 0.607 1.119** 0.754 -0.0350* -0.0392*** -0.0368*(0.493) (0.518) (0.475) (0.0211) (0.00641) (0.0210)
Intercept 1.127*** 1.367*** 1.155*** -0.0183*** -0.0110*** -0.0181***(0.164) (0.203) (0.153) (0.00104) (0.000688) (0.00101)
Time trend Yes Yes
Observations 188 188 188 138 138 138R-squared 0.589 0.646 0.605 0.794 0.977 0.795Source: Authors’ estimates.Note: Robust standard errors in parentheses*** p<0.01, ** p<0.05, * p<0.1
Dependent variable Income parameter (p<0.1) Interest rate parameter (p<0.1)
18
velocity in China. Both the Chow test and the Quandt-Andrews unknown breakpoint test identify 2009:Q1 as a break point, when the large countercyclical stimulus started and nonbank activity took off (Table 6).
Table 6. China: Quandt-Andrews Unknown Breakpoint Test in the
Money Demand Function (2002:Q1–2012:Q3)
Maximum LR F-statistic (2009:Q1) 189.14***
Maximum Wald F-statistic (2009:Q1) 189.14*** Exp. LR F-statistic 90.93*** Exp. Wald F-statistic 90.93*** Average LR F-statistic 30.50*** Average Wald F-statistic 30.50*** Source: Authors’ estimates.
1/ The null hypothesis is no breakpoints within 5 percent of trimmed data. All Equation variables are considered varying regressors. Number of breaks compared: 38. *** p<0.01.
As velocity is also subject to changes in interest rates and other variables, the shift in it is only indicative for instability in the MDF. We then estimate the long-run cointegration equation using M2, income, and interest rates. The results are consistent with the structural break observed in velocity. A cointegration test for the subsample 2002:Q1 to 2008:Q4 shows that there is a stable MDF. However, when we extend the sample to 2012:Q3, such stability breaks down, which again suggests a structural shift around 2009:Q1.
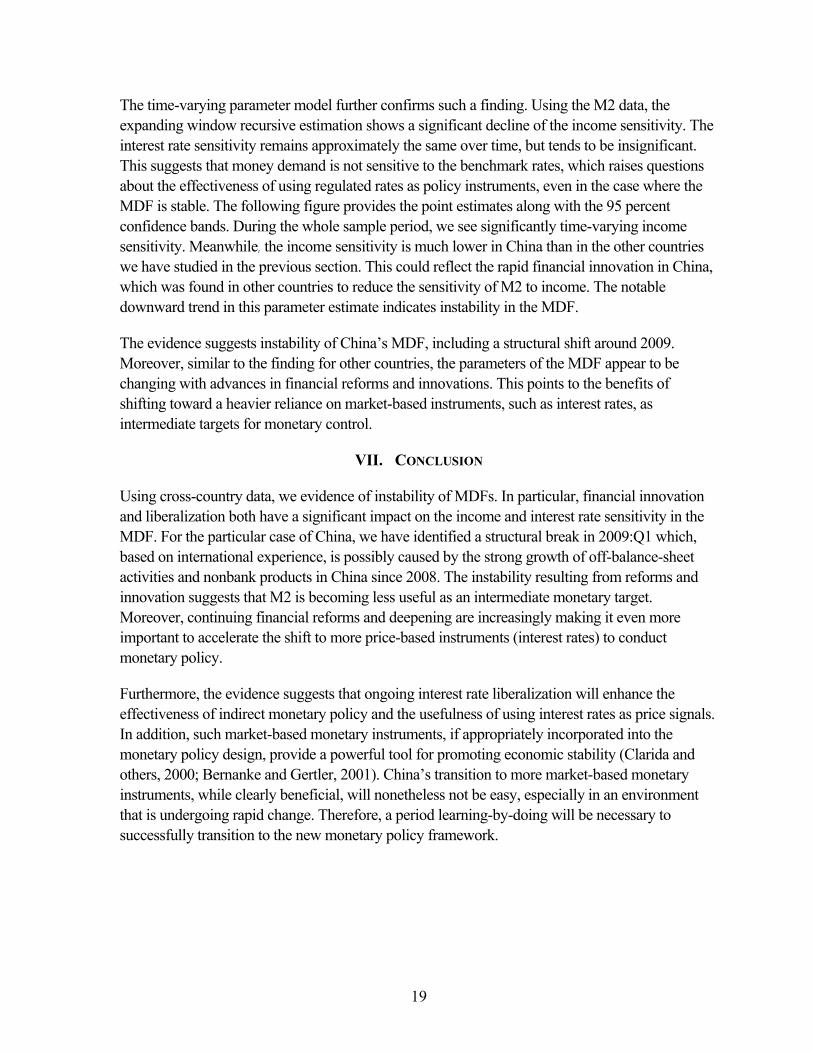
Figure 6. China: Interest Rate and Income Parameters Using M2, 2001:Q2–2012:Q2
-0.08
-0.06
-0.04
-0.02
0.00
0.02
0.04
0.06
2001
:Q2
2002
:Q2
2003
:Q2
2004
:Q2
2005
:Q2
2006
:Q2
2007
:Q2
2008
:Q2
2009
:Q2
2010
:Q2
2011
:Q2
2012
:Q2
ParameterLower boundUpper bound
Source: Authors’ calculations
Figure 6a. Interest rate
0.00
0.05
0.10
0.15
0.20
0.25
0.30
2001
:Q2
2002
:Q2
2003
:Q2
2004
:Q2
2005
:Q2
2006
:Q2
2007
:Q2
2008
:Q2
2009
:Q2
2010
:Q2
2011
:Q2
2012
:Q2
ParameterLower boundUpper bound
Figure 6b. Income
Source: Authors’ calculations
19
The time-varying parameter model further confirms such a finding. Using the M2 data, the expanding window recursive estimation shows a significant decline of the income sensitivity. The interest rate sensitivity remains approximately the same over time, but tends to be insignificant. This suggests that money demand is not sensitive to the benchmark rates, which raises questions about the effectiveness of using regulated rates as policy instruments, even in the case where the MDF is stable. The following figure provides the point estimates along with the 95 percent confidence bands. During the whole sample period, we see significantly time-varying income sensitivity. Meanwhile, the income sensitivity is much lower in China than in the other countries we have studied in the previous section. This could reflect the rapid financial innovation in China, which was found in other countries to reduce the sensitivity of M2 to income. The notable downward trend in this parameter estimate indicates instability in the MDF.
The evidence suggests instability of China’s MDF, including a structural shift around 2009. Moreover, similar to the finding for other countries, the parameters of the MDF appear to be changing with advances in financial reforms and innovations. This points to the benefits of shifting toward a heavier reliance on market-based instruments, such as interest rates, as intermediate targets for monetary control.
VII. CONCLUSION
Using cross-country data, we evidence of instability of MDFs. In particular, financial innovation and liberalization both have a significant impact on the income and interest rate sensitivity in the MDF. For the particular case of China, we have identified a structural break in 2009:Q1 which, based on international experience, is possibly caused by the strong growth of off-balance-sheet activities and nonbank products in China since 2008. The instability resulting from reforms and innovation suggests that M2 is becoming less useful as an intermediate monetary target. Moreover, continuing financial reforms and deepening are increasingly making it even more important to accelerate the shift to more price-based instruments (interest rates) to conduct monetary policy.
Furthermore, the evidence suggests that ongoing interest rate liberalization will enhance the effectiveness of indirect monetary policy and the usefulness of using interest rates as price signals. In addition, such market-based monetary instruments, if appropriately incorporated into the monetary policy design, provide a powerful tool for promoting economic stability (Clarida and others, 2000; Bernanke and Gertler, 2001). China’s transition to more market-based monetary instruments, while clearly beneficial, will nonetheless not be easy, especially in an environment that is undergoing rapid change. Therefore, a period learning-by-doing will be necessary to successfully transition to the new monetary policy framework.
20
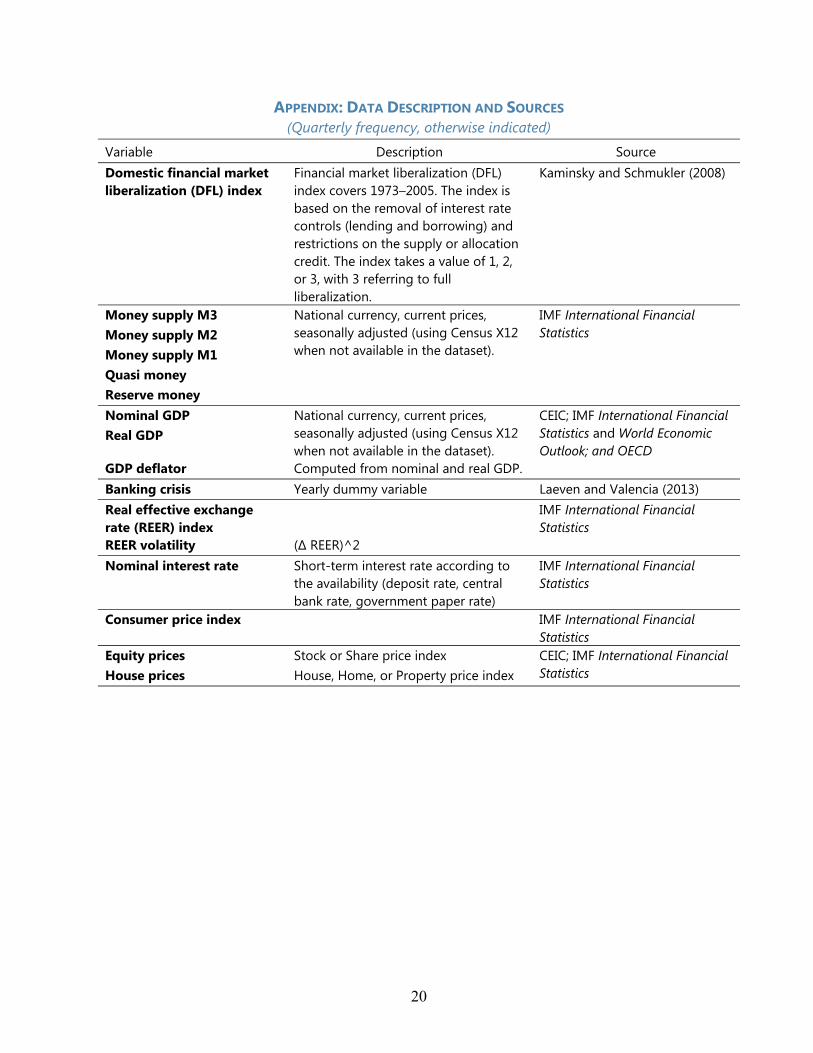
APPENDIX: DATA DESCRIPTION AND SOURCES (Quarterly frequency, otherwise indicated)
Variable Description Source Domestic financial market liberalization (DFL) index
Financial market liberalization (DFL) index covers 1973–2005. The index is based on the removal of interest rate controls (lending and borrowing) and restrictions on the supply or allocation credit. The index takes a value of 1, 2, or 3, with 3 referring to full liberalization.
Kaminsky and Schmukler (2008)
Money supply M3 National currency, current prices, seasonally adjusted (using Census X12 when not available in the dataset).
IMF International Financial Statistics Money supply M2
Money supply M1 Quasi money Reserve money Nominal GDP National currency, current prices,
seasonally adjusted (using Census X12 when not available in the dataset).
CEIC; IMF International Financial Statistics and World Economic Outlook; and OECD
Real GDP
GDP deflator Computed from nominal and real GDP. Banking crisis Yearly dummy variable Laeven and Valencia (2013) Real effective exchange rate (REER) index
IMF International Financial Statistics
REER volatility (∆ REER)^2 Nominal interest rate Short-term interest rate according to
the availability (deposit rate, central bank rate, government paper rate)
IMF International Financial Statistics
Consumer price index IMF International Financial Statistics
Equity prices Stock or Share price index CEIC; IMF International Financial Statistics House prices House, Home, or Property price index
21
REFERENCES
Alvarez, Fernando E. and Francesco Lippi, 2011, “Persistent Liquidity Effects and Long Run Money Demand,” NBER Working Paper No. 17566, pp. 1–39 (Cambridge, Massachusetts: National Bureau of Economic Research).
Arrau, Patricio, Jose De Gregorio, Carmen M. Reinhart, and Peter Wickham, 1991, “The Demand for Money in Developing Countries: Assessing the Role of Financial Innovation,” IMF Working Paper 91/45 (Washington: International Monetary Fund).
_________, 1995, “The Demand for Money in Developing Countries: Assessing the Role of Financial Innovation,” Journal of Development Economics, Vol. 46, No. 2, pp. 317–40.
Atta-Mensah, Joseph, 2004, “Money Demand and Economic Uncertainty,” Working Papers 04-25 (Ottawa, Ontario: Bank of Canada).
Ball, Laurence, 2001, “Another Look at Long-Run Money Demand,” Journal of Monetary Economics, Vol. 47, No. 1, pp. 31–44.
Berger, Allen N., Iftekhar Hasan, and Mingming Zhou, 2007, “Bank Ownership and Efficiency in China: What Lies Ahead in the World’s Largest Nation?” Research Discussion Papers 16/2007 (Helsinki: Bank of Finland).
Bernanke, Ben S. and Mark Gertler, 2001, “Should Central Banks Respond to Movements in Asset Prices,” American Economic Review, Vol. 91, No. 2, pp. 253–57.
Beyer, Andreas, 2009, “A Stable Model for Euro Area Money Demand: Revisiting the Role of Wealth,” Working Paper Series No. 1111, pp. 1‒62 (Frankfurt: European Central Bank).
Blundell-Wignall, Adrian, Frank Browne, and Paolo Manasse, 1990, “Monetary Policy in Liberalised Financial Markets,” OECD Economic Studies No. 15, pp. 146–74 (Paris: OECD).
Boone, Laurence and Paul van den Noord, 2008, “Wealth Effects on Money Demand in the Euro Area,” Empirical Economics, Vol. 34, No. 3, pp. 525–36.
Caporale, Guglielmo M. and Luis A. Gil-Alana, 2005, “Fractional Cointegration and Aggregate Money Demand Functions,” Vol. 73, No. 6, pp. 737–53 (Manchester: The Manchester School, University of Manchester).
Carstensen, Kai, 2006, “Stock Market Downswing and the Stability of European Monetary Union Money Demand,” Journal of Business and Economic Statistics, Vol. 24, pp. 395‒402.
Choi, Woon Gyu and Seonghwan Oh, 2003, “A Money Demand Function with Output
22
Uncertainty, Monetary Uncertainty, and Financial Innovations,” Journal of Money, Credit, and Banking, Vol. 35, No. 5, pp. 685–709.
Clarida, Richard, Jordi Gali, and Mark Gertler, 2000, “Monetary Policy Rules and Macroeconomic Stability: Evidence and Some Theory,” Quarterly Journal of Economics, Vol. 115, No. 1, pp. 147–80.
Dreger, Christian and Jürgen Wolters, 2010, “M3 Money Demand and Excess Liquidity in the Euro Area,” Public Choice, Vol. 144, No. 3, pp. 459–72.
Fischer, Andreas M., 2007, “Measuring Income Elasticity for Swiss Money Demand: What Do the Cantons Say About Financial Innovation?” European Economic Review, Vol. 51, No.7, pp. 1641–60.
Guidotti, Pablo and Carlos Rodriguez, 1992, “Dollarization in Latin America: Gresham’s Law in Reverse?” IMF Staff Papers, Vol. 39, No. 3, pp. 518–44.
Haug, Alfred. A., 1999, “Money Demand Functions: Data Span and Tests,” Conference Paper Presented at the New Zealand Econometric Study Group Meeting, Auckland July 1999. Available via the Internet at http://www.econ.canterbury.ac.nz/research/working_papers.shtml
Ireland, Peter N, 2009, “On the Welfare Cost of Inflation and the Recent Behavior of Money Demand,” American Economic Review, Vol. 99, No. 3, pp. 1040–52.
Kaminsky, Graciela L. and Sergio L. Schmukler, 2008, “Short-Run Pain, Long-Run Gain: Financial Liberalization and Stock Market Cycles,” Review of Finance, Vol. 12, No. 2, pp. 253–92.
Laeven, Luc and Fabian Valencia, 2013, “Systemic Banking Crises Database,” IMF Economic Review, Vol. 61, No. 2, pp. 225–70.
Laidler, David E., 1977, The Demand for Money: Theories and Evidence (New York: Harper and Row, 2nd ed.).
Laurens, Bernard J. and Rodolfo Maino, 2007, “China: Strengthening Monetary Policy Implementation,” IMF Working Paper 07/14 (Washington: International Monetary Fund).
Lieberman, Charles, 1977, “The Transactions Demand for Money and Technological Change,” Review of Economics and Statistics, Vol. 59, No. 3, pp. 307–17.
Lin, Xiaochi and Yi Zhang, 2009, “Bank Ownership Reform and Bank Performance in China,” Journal of Banking and Finance, Vol. 33, Issue 1, pp. 20–29.
Maki, Daiki and Shin-ichi Kitasaka, 2006, “The Equilibrium Relationship among Money, Income, Prices, and Interest Rates: Evidence from a Threshold Cointegration Test,”
23
Applied Economics, Vol. 38, No. 13, pp. 1585–92.
McPhail, Kim, 1991, “The Long-Run Demand for Money, Canada Savings Bonds and Treasury Bills in Canada.” Available via the Internet at http://www.esri.go.jp/en/archive/dis/discussion-e.html
Miyao, Ryuzo, 1996, “Does a Cointegrating M2 Demand Relation Really Exist in Japan?” Journal of the Japanese and International Economies, Vol. 10, No. 2, pp. 169–80.
N’Diaye, Papa, 2010, “Transforming China: Insights from the Japanese Experience of the 1980s,” IMF Working Paper 10/284 (Washington: International Monetary Fund).
Pradhan, Basanta K. and Arjunan Subramanian, 2003, “On the Stability of Demand for Money in a Developing Economy: Some Empirical Issues,” Journal of Development Economics, Vol. 72, No. 1, pp. 335–51.
Sharma, Sunil and Neil R. Ericsson, 1998, “Broad Money Demand and Financial Liberalization in Greece,” Empirical Economics, Vol. 23, No. 3, pp. 417–36.
Zhang, Xiaoxi and Kevin Daly, 2011, “China’s Banks Ownership and Performance.” Available via the Internet at http://dx.doi.org/10.2139/ssrn.1914894