Embed Size (px)
Citation preview

NBER WORKING PAPER SERIES
CHINA'S EXPORTERS AND IMPORTERS:FIRMS, PRODUCTS AND TRADE PARTNERS
Kalina ManovaZhiwei Zhang
Working Paper 15249http://www.nber.org/papers/w15249
NATIONAL BUREAU OF ECONOMIC RESEARCH1050 Massachusetts Avenue
Cambridge, MA 02138August 2009
We thank Doireann Fitzgerald, Pete Klenow and Bob Staiger for insightful conversations, and participantsat the 2008 LSE conference on the Emergence of China and India in the Global Economy, the 2008SITE conference on Aggregation in Macro, and the 2008 San Francisco Federal Reserve Pacific BasinConference for their comments. The views expressed herein are those of the author(s) and do not necessarilyreflect the views of the National Bureau of Economic Research.
NBER working papers are circulated for discussion and comment purposes. They have not been peer-reviewed or been subject to the review by the NBER Board of Directors that accompanies officialNBER publications.
© 2009 by Kalina Manova and Zhiwei Zhang. All rights reserved. Short sections of text, not to exceedtwo paragraphs, may be quoted without explicit permission provided that full credit, including © notice,is given to the source.

China's Exporters and Importers: Firms, Products and Trade PartnersKalina Manova and Zhiwei ZhangNBER Working Paper No. 15249August 2009JEL No. F10,F14,F23
ABSTRACT
This paper uses newly available data on Chinese trade flows to establish novel and confirm existingstylized facts about firm heterogeneity in trade. First, the bulk of exports and imports are capturedby a few multi�product firms that transact with a large number of countries. Second, the average importerimports more products than the average exporter exports, but exporters trade with more countries thanimporters do. Third, compared to private domestic firms, foreign affiliates and joint ventures trademore and import more products from more source countries, but export fewer products to fewer destinations.Fourth, the relationship between firms’ intensive and extensive margin of trade is non-monotonic,differs between exporters and importers, and depends on the ownership structure of the firm. Fifth,firms frequently exit and re-enter into trade and regularly change their product mix and trade partners,but foreign firms exhibit less churning. Finally, most of the growth in Chinese exports between 2003-2005was driven by deepening and broadening of trade relationships by surviving firms, while reallocationsacross firms contributed only 30%. These stylized facts shed light on the cost structure of internationaltrade and the importance of foreign ownership for firms’ export and import decisions.
Kalina ManovaDepartment of EconomicsStanford University579 Serra MallStanford, CA 94305and [email protected]
Zhiwei ZhangHong Kong Monetary Authority and [email protected]

1 Introduction
A growing body of empirical literature has examined firms’ participation in international trade and
identified substantial heterogeneity in activity across firms. More productive firms have been
shown to earn higher export revenues, enter more markets, and trade more products. In addition,
exporters systematically outperform non-exporters in terms of productivity, employment, wages,
skill- and capital-intensity.1 This firm heterogeneity has proven important because of evidence
that reallocations across firms are instrumental for the effects of trade liberalization on aggregate
productivity growth (Pavcnik 2002; Bernard, Jensen and Schott 2006).
This paper uses newly available and uniquely rich data on the universe of Chinese trading
firms to establish new and confirm existing stylized facts about firm heterogeneity among
exporters and importers. Our results shed light on the cost structure of international trade and the
importance of foreign ownership for firms’ export and import decisions. Our analysis also
provides a detailed overview of China’s trade activity and the sources of Chinese trade growth
over the 2003-2005 period.
The data we use offer a level of detail that has so far only been available for the United
States and is unprecedented for other developed or developing countries. In particular, we observe
firm exports and imports by product and destination/source country at a monthly frequency, and
have information about the firm ownership structure. By contrast, the prior literature has largely
explored data on exporting firms only, which typically lack information along at least one other
dimension of our data.2
Our work is closest to that of Bernard, Jensen and Schott (2009), henceforth BJS, who
examine the universe of U.S. importers and exporters with similarly rich data. BJS also compare
the performance of domestic firms to that of multinational affiliates, although they cannot identify
American vs. foreign-owned MNCs. Instead, we distinguish between Chinese private firms, state
enterprises, affiliates of foreign multinationals, and joint ventures (foreign ownership under
100%). By virtue of China's size, rapid trade expansion and range of institutional frictions, our 1 See, among others, Bernard and Jensen (1995, 1999) and Bernard, Jensen and Schott (2009) for the U.S.; Bernard and Wagner (1997) for Germany; Clerides, Lach and Tybout (1998) for Colombia, Mexico and Morocco; Aw, Chung and Roberts (2000) for Korea and Taiwan; Eaton, Kortum and Kramarz (2004, 2008) for France; and Bernard, Jensen, Redding and Schott (2007) for a survey of the literature. 2 For example, Eaton, Kortum and Kramarz (2004, 2008) observe French firm exports by destination, but not imports or products; Arkolakis and Muendler (2009) analyze Brazilian firm exports by product and destination, but not imports or ownership type; Muûls and Pisu (2009) study Belgian firm exports and imports by product and destination, but not ownership structure or the universe of trade flows.
1

data thus offer insight into the factors determining firms' trade participation decisions in general
and their salience in constrained environments.
Since joining the World Trade Organization in December 2001, China has experienced
rapid international trade expansion and a dramatic rise in multinational firm activity. Between
2003 and 2005 alone, exports grew 86% while imports increased 66%, to reach $548.4 and $483.5
billion, respectively. Chinese joint ventures and affiliates of foreign multinationals were
responsible for fully 75% of these trade flows.
These aggregate patterns mask substantial variation in activity and frequent reallocations
across firms. We establish six stylized facts about the nature of this firm heterogeneity:
Stylized fact #1: We confirm the result in the prior literature that a substantial share of
trade flows are captured by a few multi‐product firms that transact with a large number of
countries. While this pattern holds for both exports and imports, the distribution of imports is
significantly more skewed and there are many more small firms among importers. These findings
are consistent with the existing heterogeneous-firm models of exporting such as Melitz (2003),
and suggest that these models apply equally well to importing. The first stylized fact can thus be
attributed to firm heterogeneity in marginal costs and country-product specific fixed costs for both
exporters and importers. The different distributions for these two sets of firms indicate lower fixed
costs of importing relative to exporting and a greater dispersion in productivity (marginal costs)
across importers than across exporters.
In comparison, BJS document a substantially more skewed distribution of trade flows,
product and trade partner intensity across U.S. firms than the one we observe for China. This
difference is driven by the presence of many small American firms that trade a limited number of
products with a few countries. These patterns suggest that Chinese firms may face significantly
higher fixed trade costs, which raise the productivity cut-off for exporting and importing. Given
the higher level of financial development in the U.S. and the evidence that smaller firms are more
credit constrained3, small Chinese firms may also be unable to raise sufficient external financing
to engage in international trade.4
3 See, for example, Beck, Demirgüç-Kunt, Laeven and Levine (2008), Beck, Demirgüç-Kunt and Maksimovic (2005), and Forbes (2007). 4 Manova (2007) shows that credit constraints reinforce the selection of only the most productive firms into exporting. See Beck (2002, 2003), Becker and Greenberg (2007), and Manova (2007, 2008) among others for country-level evidence and Greenaway, Guariglia and Kneller (2007) and Muûls (2008) for firm-level evidence.
2

Stylized fact #2: The average importer buys more products than the average exporter sells,
but exporters trade with more countries than importers do.5 Similarly, 68% of the firms that
engage in two-way trade import more products than they export, and 53% export to more
countries than they import from. These patterns are consistent with the idea that many Chinese
firms import intermediate products for further processing, final assembly and re-exporting. This
could explain why most firms import numerous inputs from a few (potentially low-cost) source
countries and transform them into fewer final products for sale in a large number of destinations.
Stylized fact #3: Firms’ trading activity varies systematically with their extent of foreign
ownership. Foreign affiliates trade more on average and are more likely to engage in two-way
trade than joint ventures, who in turn lead private domestic firms. Moreover, import product
intensity and the number of source countries increase with foreign ownership, while export
product intensity and the number of destinations decrease with foreign ownership. Compared to
private domestic companies, foreign affiliates and joint ventures in fact import more products from
more source countries, but export fewer products to fewer destinations.
One possible explanation for these patterns is that domestic firms process a few basic input
materials into a broad range of simple final goods, while foreign firms specialize in high-tech
complex final products which require the assembly of numerous inputs. This would be consistent
with property-rights models of FDI that predict greater multinational activity in R&D intensive
sectors.6 Our results may also indicate that foreign firms prefer to source (potentially higher
quality) inputs from abroad, while domestic firms use local suppliers.
Relative to domestic companies, foreign affiliates may buy inputs from more countries
because they are more efficient at locating and importing inputs from abroad, or because they need
specialized inputs that are not available in one location. The results for the number of export
destinations appear surprising in the context of heterogeneous-firm models, which predict that
more productive firms enter more markets and are more likely to be multinational. Foreign firms,
however, may conduct intermediate stages of production in China and re-export unfinished goods
for further processing by affiliates in other countries. Since multinationals likely do not maintain
affiliates in all final consumer markets, their Chinese branches could record fewer export
5 Since we do not observe the domestic activity of Chinese trading firms, when we refer to the products an importer (exporter) buys (sells), we always mean the products the firm imports (exports). 6 See Antràs (2003) and Antràs and Helpman (2004, 2008) for a theoretical treatment, and Antràs (2003), Yeaple (2006), Nunn and Trefler (2008) and Feenstra and Hanson (2005) for empirical evidence.
3

destinations than domestic firms. Foreign firms may also produce relatively more specialized
intermediate or final goods that only richer countries demand, while domestic firms may focus on
standardized inputs or final goods that appeal to producers and consumers in many countries.
Stylized fact #4: The relationship between firms’ intensive and extensive margin of trade
differs between exporters and importers and depends on the ownership structure of the firm.
While domestic firms that export or import more products trade less per product, joint ventures
and foreign affiliates follow a non-monotonic relationship: exports and imports per product are
lowest for firms at an intermediate level of product intensity. At the same time, importers that
source products from more countries import more per country regardless of ownership type, while
exporters exhibit a U-shape.
These findings contribute to an active literature on the operations of multi-product firms
(Bernard, Redding and Schott 2009a,b,c; Arkolakis and Muendler 2009; Mayer, Melitz and
Ottaviano 2009; Eckel and Neary 2008; Nocke and Yeaple 2006), which tends to predict a
monotonic relationship between firms’ intensive and extensive margins. This relationship is
largely determined by the cost structure of trade and the nature of firm competition. The more
complex patterns we find suggest that we have yet to understand the economic forces that affect
firms’ optimal scope and scale. Our results also indicate the possibility of important differences
between firms' exporting and importing costs at the country-product level. Finally, the trade costs
firms face and their ability to finance these costs may vary with ownership structure, and thus
affect firms’ integration and location decisions.
Stylized fact #5: Firms are prone to exit and re-enter into exporting and importing, and
frequently change their trade partners and product mix. Foreign affiliates and joint ventures,
however, have significantly higher survival rates and exhibit less product and trade partner
turnover than domestic firms. These results complement evidence in the prior empirical literature
on the importance of churning for firm- and aggregate productivity.7 They also speak to the
relevance of theoretical models of intra-industry firm dynamics and intra-firm product turnover
(Melitz 2003; Bernard, Redding and Schott 2009b,c; Costantini and Melitz 2009). In particular,
our findings indicate that firms face sufficiently low sunk costs of trade or sufficiently volatile
cost/demand shocks to warrant regular adjustments on the extensive margin. The systematic
7 See Pavcnik (2002), Alessandria and Choi (2007), Bernard, Redding and Schott (2009a), Besedes and Prusa (2006a,b, 2007), BJS, Eaton, Eslava, Kugler and Tybout (2008), and Bartelsman, Haltiwanger and Scarpetta (2008).
4

differences across ownership types signal that foreign firms have higher sunk costs or experience
fewer and smaller shocks. If firms face liquidity constraints, the affiliates of foreign multinationals
may also be better able to weather negative shocks since they can access internal lending from the
parent company.8
Stylized fact #6: The growth in Chinese exports between 2003-2005 was driven by firm
entry (30%, aggregate extensive margin), surviving firms expanding exports of surviving products
to existing trade partners (42%, firm intensive margin), and surviving exporters adding new
products and destinations (28%, firm extensive margin). This breakdown is 27% - 51% - 22% for
imports. If one ignored firm heterogeneity and focused on China’s product composition and trade
partners in aggregate, almost the entire growth in trade would erroneously be attributed to the
intensive margin: Average Chinese trade flows per product and average Chinese trade flows per
trade partner increased at roughly the same rate as overall trade. These results indicate that the
biggest boost to Chinese trade came from new and surviving firms expanding into products and
markets that other firms were already tapping. Thus, understanding firm heterogeneity and firms’
trade decisions is central to understanding movements in aggregate trade flows.
The remainder of the paper is organized as follows. The next section describes the Chinese
trade data. Section 3 documents the distribution of trade flows, product scope and trade partner
intensity across firms with different ownership structures. Section 4 decomposes China's trade
growth into its extensive and intensive margins, while Section 5 explores firm, product and trade
partner dynamics. The last section concludes.
2 Data
We analyze a recently released proprietary database on the universe of Chinese firms that
participated in international trade over the 2003-2005 period. These data have been collected and
made available by the Chinese Customs Office.
We observe the value of firm exports and imports (in US dollars) by product and trade
partner for 243 destination/source countries and 7,526 different products in the 8-digit
Harmonized System.9 Each firm is assigned one of seven possible ownership types, which we
8 See, for example, Desai, Foley and Forbes (2008) for evidence that the affiliates of foreign multinationals are less credit constrained relative to domestic firms. 9 The classification of products is relatively consistent across countries at the 6-digit HS level. The number of distinct product codes in the Chinese 8-digit HS classification is comparable to that in the 10-digit HS trade data for the U.S..
5

group into four categories: domestic state enterprises, domestic privately held firms (including
collectively-owned firms), fully foreign-owned affiliates, and joint ventures (with foreign
ownership under 100%). While the data are available at a monthly frequency, for most of the
analysis we focus on annual trade flows in the most recent year in the panel, 2005. We use higher
frequency data to examine firm, product and trade partner dynamics in Section 5.
The data contain a number of additional variables which we do not exploit in this paper.
For each (firm, trade partner, product) triplet, we observe the means of transportation (out of 19
options such as air, ship, etc.), the customs office where the transaction was processed (out of 42
offices), the region or city in China where the product was exported from or imported to (out of
710 locations), and any potential transfer country or region (such as Hong Kong). The dataset also
provides information on the quantities traded in one of 12 different units of measure (such as
pieces, kilograms, square meters, etc.).
Some state enterprises in China are pure “trading” companies in the sense that they do not
engage in manufacturing but serve exclusively as intermediaries between domestic producers
(buyers) and foreign buyers (producers). We focus on the operations of firms that manufacture and
trade goods, and leave the study of “trading” companies for future work. While the data do not
explicitly identify such “trading” firms, we look for keywords in company names to flag them.10
We can nevertheless not be sure that we have excluded all such enterprises, and comment on this
as appropriate. In the rest of the paper, we refer to all firms remaining in our data as trading firms.
3 China’s trading firms, traded products and trade partners
In this section, we document the distribution of exports and imports across firms of different
ownership type, and examine their product and trade partner intensity. We also explore the
relationship between the extensive margin (number of products or trade partners) and the intensive
margin of trade (average trade per product or per trade partner) at the firm level. We first describe
a range of patterns in the data, and then highlight our most important findings as four stylized
facts.
10 We drop 23,073 “trading” firms which mediate a quarter of China’s trade by value.
6

3.1 Exporting and importing firms
In 2005, 114,483 Chinese firms participated in international trade. As Table 1 shows, more than
half of these firms engaged in both exporting and importing. However, this ratio varies
significantly across firms with different ownership structure. Fully foreign-owned firms are
substantially more likely to conduct two-way trade (67%) than joint ventures (53%) and state
enterprises (48%), which are in turn more likely to do so than privately held domestic firms
(31%). These numbers are markedly higher than the ones BJS report for the United States, where
only 17.5% of all trading firms both exported and imported in 2000. Moreover, in the U.S. this
share is similar for domestic and multinational firms.
While the fraction of Chinese firms that only import but do not export is roughly 15%
regardless of organizational structure, the share of firms that only export decreases with foreign
ownership.11 This is consistent with the idea that multinational companies (MNCs) operating
affiliates in China are likely to import intermediate inputs for further processing or final assembly
before re-exporting to third destinations. By splicing the production chain into tasks with different
factor intensities, MNCs can thus exploit cross-country differences in factor prices.12
Table 2 shows the total value of Chinese trade flows and its breakdown by firm ownership
type. In 2005, China's exports and imports amounted to $548.2 billion and $483.3 billion,
respectively. Fully 90% of all trade was conducted by firms that both export and import. While
foreign affiliates represented 38% of all trading firms, they captured half of all exports and
imports. Joint ventures accounted for a quarter of all firms and of aggregate trade flows. Privately
held domestic firms were more than five times as numerous as state enterprises (see Table 1), but
they traded less on average and were considerably less likely to both export and import. For these
reasons, private domestic companies contributed significantly less to exports (13%) than their
numbers would suggest (32%), while state-owned firms (6.3% of all firms) claimed a larger than
proportional share of exports (10.3%). This pattern is even more extreme for imports.
In line with existing stylized facts for other countries, the distribution of trade flows across
Chinese firms is extremely skewed. As Table 3 illustrates, firms at the 90th percentile by export
value export over 200 times more than firms at the 10th percentile. This ratio is an astounding
1,700 for importing firms. This difference is mostly driven by a fatter left tail in the distribution of 11 Throughout the paper, when we say that a variable increases in foreign ownership, we mean that it is higher for foreign firms than for joint ventures, and in turn higher for joint ventures than for private domestic firms. 12 See Helpman (1984) for a classical treatment of the incentives for vertical FDI.
7

imports than exports: While importers tend to buy less than exporters sell at any percentile level,
this gap is greatest among the very small trading firms.
Simple averages suggest that state enterprises trade greater volumes than foreign affiliates,
which have a slight advantage over joint ventures and a more pronounced lead over private
domestic firms. These differences are, however, driven by the top 25% of state-owned firms and a
generally longer and fatter right tail in their distribution of trade flows. Given that a sizeable share
of state enterprises serve as intermediaries between domestic and foreign buyers and producers
without manufacturing in-house, this pattern may indicate that the filter we used did not exclude
all state trading companies.
As these skewed distributions would imply, the vast majority of Chinese trade is conducted
by a few very active firms (Table 4). The top 1% firms in terms of trade flows are responsible for
51% and 60% of all exports and imports, respectively, while the top 10% firms capture 80%-90%
of all trade. By contrast, the bottom half of all exporters account for less than 2% of China's
exports, and the bottom 75% importers channel less than 3% of China's imports.
Among private firms, the concentration of exports and imports in the top 1%-5% firms
increases with foreign ownership. In other words, the data exhibit progressively greater skewness
as one moves from private domestic firms to joint ventures to foreign affiliates. The distribution of
trade flows across state enterprises does not fit neatly into this ordering as it is much more
concentrated for imports than for exports. This pattern may once again reflect the presence of
misclassified large trading companies.
In comparison, BJS report a substantially more skewed distribution for the United States,
where the top 1% firms perform 81% of U.S. trade. This suggests that there is a fringe of firms
which can viably export and import at a small scale in the United States, but not in China. We
return to this observation in Section 3.4.
3.2 Exporters’ and importers’ product intensity
There is tremendous variation in product and trade partner intensity across Chinese exporters and
importers. There are also some systematic differences across firms of different ownership type.
On average, Chinese importers transact in more products than exporters, although the
distribution of product intensity has a much longer right tail among exporters. As Table 5 shows,
the average number of products traded is 9.3 for exporters and 17.1 for importers, where goods are
8

classified according to the 8-digit HS system. This comparison, however, masks important
differences across firms with different organizational structures. Note first that state enterprises
have a higher than average product intensity, and import and export roughly the same number of
goods on average (21.5 and 22.8, respectively). Some transact in the broadest range of goods
observed across all firms, reaching a maximum of 1,610 products exported and 767 products
imported.13 These are likely trading companies that engage in little or no manufacturing which our
filter has not identified.
Interesting patterns emerge among private firms. In absolute levels, average import product
intensity increases with foreign ownership, while the converse is true of exports. However, foreign
affiliates and joint ventures import roughly three times as many products on average as they
export. By contrast, the average domestic firm exports 50% more products than it imports.
Similarly, the maximum number of products traded by any foreign firm or joint venture is higher
for importers than for exporters, while the converse holds for private domestic firms.
These patterns are confirmed in the sample of Chinese firms that both export and import
(Panel C of Table 5). Such firms tend to transact in more products than firms which engage in one-
way trade only, and for this reason their mean number of goods exported (10.5) and imported
(19.4) exceeds the averages reported in Panels A and B. This comparison holds within each firm
ownership group as well. Among private firms, average import product intensity once again
increases with foreign ownership, while the converse is true of exports. Moreover, only 19.7% of
foreign affiliates export more products than they import, while that share rises to 30.9% for joint
ventures and 58.3% for private domestic firms. In the full sample, this fraction is 31.7%. In other
words, the systematic variation of the average export and import product intensity with foreign
ownership is not an artifact of aggregating across firms but is true at the firm level as well.
How can these patterns be explained? One possible interpretation is that the composition of
firm ownership varies systematically across sectors, and sectors differ in their input-output
characteristics. For example, private domestic firms may be most active in industries that process a
few basic input materials into a broad range of final goods. A firm may thus import a unique
product, such as cotton textile, and produce a range of different products – for instance, various
clothing pieces – that would be recorded as separate HS-8 export categories. Similarly, a plastic or
steel manufacturer may import a single raw material and export a range of products such as toys,
13 The overall maximum number of products imported is 868, exhibited by private domestic firms.
9

buttons and kitchen bowls. On the other hand, firms with partial or full foreign ownership may
specialize in high-tech industries that produce a limited number of complex final goods which
require the assembly and processing of numerous customized inputs. A number of papers have in
fact argued that, in the presence of imperfect contractibility and relationship specific investments,
there will be more multinational activity in R&D intensive sectors.14 In unreported summary
statistics, we have confirmed that foreign firms indeed capture a substantially larger share of
Chinese trade flows of differentiated manufactured goods and R&D intensive sectors.
The above explanation implicitly assumes that, within a given industry, all firms are
equally likely to import their intermediate inputs instead of buying them domestically, as well as
to export their final products instead of only selling them locally. An alternative and
complementary explanation may be that foreign affiliates and joint ventures prefer to source inputs
from abroad while domestic firms use local suppliers, even if they tend to produce similar output
products. For example, foreign firms may produce higher-quality goods using better technology
and choose to import higher-quality inputs that may not be available in China.
While this could account for the patterns we document for import product intensity, it
would not explain the systematic differences in export product intensity across firm ownership
types. If anything, one would expect foreign affiliates and joint ventures to be more likely to
export a good, conditional on producing it. This is particularly true of China, which has
traditionally attracted more vertical and export-platform FDI than horizontal FDI. Indeed, a much
bigger share of foreign firms than private domestic firms in China engage in both exporting and
importing (recall Table 1).
In addition to summarizing the average product intensity across exporters and importers,
Table 5 also reports the number of products traded by firms at different percentiles of the
distribution. These statistics illustrate the extent of skewness in the data. Roughly 75% of all firms
have a narrower product scope than the mean, while firms at the 90th percentile transact in twice as
many products as the average firm. These patterns appear independent of firms’ organizational
structure and highlight the importance of firm heterogeneity in the data.
The lion's share of China's trade is conducted by a few firms that trade the broadest range
of products. Table 6 reports the distribution of firms across different bins by product intensity
14 See Antràs (2003) and Antràs and Helpman (2004, 2008) for a theoretical treatment, and Antràs (2003), Yeaple (2006), Nunn and Trefler (2008) and Feenstra and Hanson (2005) for empirical evidence.
10

(odd-numbered columns) and the percent share of total exports or imports firms in each bin
capture (even-numbered columns). While 23% (19%) of all exporters (importers) trade exactly
one product, they mediate only 5.6% (2.2%) of all exports (imports). By contrast, only 4.4% of
exporters sell more than 30 products, but they contribute 30% to all exports. Similarly, only 2.6%
of importers buy more than 100 products, but they account for 42% of all imports. These patterns
are qualitatively the same in each subset of firms with a given ownership structure.
BJS report a significantly more skewed distribution of trade flows across product intensity
bins for the United States. In 2000, fully 38% of U.S. exporters and 32% of U.S. importers traded
only one product, but they captured a mere 0.7% of all trade. By contrast, 15% of U.S. exporters
and 21% of U.S. importers transacted in more than 10 products, but mediated over 92% of U.S.
trade. Combined with the conclusion from the end of the previous section, this suggests that firms
which optimally trade small volumes in a few (or even only one) products may be viable in the
United States but not in China.
3.3 Exporters’ and importers’ trade partner intensity
The average Chinese exporter transacts with almost twice as many trade partner countries (7.5) as
the average importer (4), as seen in Table 7. Similarly, the maximum number of export
destinations observed for any firm is 144, while the most active importer sources products from
only 67 origin countries. These patterns hold within each of the four groups of firms with different
ownership structure as well. However, the difference between the average exporter and importer
trade partner intensity is largest for domestic firms (both state-owned and privately-held), lower
for joint ventures, and smallest for foreign affiliates.
Perhaps surprisingly, foreign firms on average export to fewer destination markets (6) than
joint ventures (7.4), which in turn sell to fewer countries than private domestic firms (8.7). By
contrast, importers exhibit the opposite ranking, with foreign firms sourcing products from more
countries than private domestic companies. Chinese state enterprises transact with the greatest
number of destination markets (11.2) and source countries (5.6) on average, although these
averages may partly reflect the activity of trading companies that our filter has not detected.
Similar patterns persist in the sample of firms that engage in both exporting and importing.
These firms maintain trading relationships with more countries on average, with a mean export
and import trade partner intensity of 8.2 and 4.3, respectively. Once again, the average number of
11

source countries increases with foreign ownership, while the average number of export
destinations falls. Moreover, while 44% of foreign affiliates export to more countries than they
import from, this fraction is 53.6% for joint ventures and 70.6% for private domestic firms. In the
full sample of firms participating in two-way trade, this share is a little over a half. In other words,
the reason why foreign firms have more export destinations than source countries on average, and
conversely for domestic firms, is because that is true of most firms that both export and import.
What factors drive these patterns? Relative to domestic companies, firms with full or
partial foreign ownership may buy intermediate inputs from more countries because they are more
efficient at locating and importing inputs from abroad, or because they need specialized inputs that
are not available in one location. Since we do not observe firms’ domestic purchases, our results
may also indicate that foreign firms prefer to source (potentially higher quality) inputs from
abroad, while domestic firms use local suppliers.
The results for the number of export destinations are, on the other hand, somewhat
surprising since heterogeneous firm models predict that more productive firms enter more markets
and are more likely to be multinational. A number of explanations may account for foreign firms'
relatively lower number of export destinations. MNC affiliates and joint ventures may conduct
intermediate stages of production in China and re-export unfinished goods for further processing
to affiliates in other countries. Since multinationals likely do not maintain affiliates in all final
consumer markets, their Chinese branch may record fewer export destinations than domestic firms
even if they have final consumers in as many or more countries. An alternative but not
contradictory explanation is that foreign firms may produce more specialized intermediate or final
goods that fewer, richer countries demand. Domestic firms, on the other hand, may focus on
standardized intermediate inputs or cheap, basic final goods that appeal to producers and
consumers in many countries. This explanation would also be consistent with the property rights
view of multinational operations discussed in the previous sub-section, according to which FDI
activity is concentrated in R&D intensive sectors.
As with firms' product intensity, the distribution of trade partner intensity across Chinese
firms is also very skewed. This is apparent from Table 7, which reports the number of export
destinations and source countries for firms at different points in the distribution. The average firm
transacts with twice as many countries as the median, while firms at the 90th percentile maintain
trade relationships with 4 to 6 times as many countries as the median company. These patterns are
12

largely invariant across organizational structures, and are yet another manifestation of the extent of
firm heterogeneity in the data.
The bulk of China's trade is conducted by a few firms that transact with the greatest
number of countries. Table 8 presents the distribution of firms across bins with varying trade
partner intensity (odd-numbered columns) and the percent share of total exports or imports that
firms in each bin capture (even-numbered columns). While 27% (35%) of all exporters (importers)
trade with exactly one country, they account for only 6.2% (2.4%) of all exports (imports). By
contrast, the 4.1% of exporters that sell to more than 30 markets mediate fully one third of all
exports. The distribution of imports across firms is even more skewed: only 0.3% of importers
source products from over 30 countries, but they contribute almost a quarter of all imports. The
22% (8%) of exporters (importers) that transact with at least 11 countries channel two thirds of
China's trade.
The results in Table 8 once again highlight important differences between Chinese and
U.S. firms. BJS document a significantly more skewed distribution of trade flows across firms
with different trade partner intensity in the United States. In 2000, for example, while more than
half of all U.S. trading firms transacted with exactly one country, they captured less than 4% of all
trade flows. On the other hand, 8% (4%) of U.S. exporters (importers) traded with more than 10
countries, but were responsible for 78% (86%) of U.S. exports (imports).
Combining our results for product and trade partner intensity, we conclude that China's
exports and imports are concentrated in a few multi-product firms that transact with a large
number of destination or source countries. The left half of Table 9 illustrates the joint distribution
of firms by product intensity (rows) and trade partner intensity (columns), while the right half of
the table records the percent share of total exports or imports that firms in each bin capture. Bold
entries identify groups of firms that mediate a larger than proportional fraction of trade flows.
Most firms trade a few products with a few countries and enter in the upper left corner of
the table. However, the lion's share of trade is channeled by the few firms that are active in many
products and countries in the lower right corner, where most bold entries are concentrated. For
example, 12.3% (16.3%) of all exporters (importers) trade exactly one product with one country,
but their trade flows amount to only 1.4% (0.6%) of all exports (imports). By contrast, the 2.9%
exporters and 5.4% importers who trade over 30 products with more than 10 countries are
responsible for 27% and 54% of total Chinese exports and imports, respectively.
13
3.4 Summarizing the evidence on firm heterogeneity
The results presented above emphasize different dimensions and manifestations of firm
heterogeneity in the data. We highlight three stylized facts that we consider most important:
Stylized fact #1: The bulk of trade is concentrated in a few multi‐product firms that
transact with a large number of countries. This pattern holds for both exports and imports, but the
distribution of imports is significantly more skewed and there are many more small firms among
importers.
Stylized fact #2: The average importer buys more products than the average exporter sells,
but exporters trade with more countries than importers do. 68% of all firms that engage in two-
way trade import more products than they export, and 53% export to more countries than they
import from.
Stylized fact #3: Foreign affiliates trade more on average and are more likely to engage in
two-way trade than joint ventures, who in turn lead private domestic firms. Import product
intensity and the number of source countries increase with foreign ownership, while export
product intensity and the number of destinations decrease with foreign ownership.
The first stylized fact is consistent with the Melitz (2003) model of exporting which
emphasizes firm heterogeneity in marginal production costs and country specific fixed costs of
exporting. In that framework, there is a productivity cut-off for exporting associated with each
destination, and all firms above this threshold enter the market. Thus, more productive firms will
enter more markets and export more in each destination. Similarly, Bernard, Redding and Schott
(2009a,b) show that in a world with multi-product firms and destination-product specific fixed
costs, more productive firms will likely sell greater volumes of more products to more countries.
Firm heterogeneity in marginal costs can thus account for the skewed distributions we document
for export flows, product and trade partner intensity, and explain the concentration of aggregate
trade flows among the most active firms.
Our results suggest that export models with firm heterogeneity apply equally well to
importing. The more skewed distributions we find for importers relative to exporters indicate that
the fixed costs of importing are likely lower, while the dispersion in productivity across importers
is greater than that across exporters. Such differences could make low levels of imports optimal
for some firms but low levels of exports unfeasible.
14

The second and third stylized facts we establish are novel and have yet to be embedded in
international trade models. We have already offered some possible explanations for these results,
which build on existing theories of outsourcing (firms’ production location decision) and
multinational activity (firms’ integration decision). In particular, the patterns we find are
consistent with the idea that many Chinese firms import intermediate products for further
processing, final assembly and re-exporting. This would explain why most firms import numerous
inputs from a few low-cost source countries and transform them into fewer final products for sale
in a large number of destinations. Explaining the variation in these patterns across firms with
different levels of foreign ownership, however, remains an open question for future work.
Of note, BJS document a substantially more skewed distribution of trade flows, product
and trade partner intensity across U.S. firms than the one we observe for China. This difference is
driven by the presence of many small American firms that trade small volumes of a limited
number of products with a few countries. One possible rationalization for these patterns is that
Chinese firms face significantly higher fixed trade costs, which raise the productivity cut-off for
exporting and importing and preclude small firms from participating in international trade.
An alternative explanation may rest on differences in firms' access to external financing. A
number of recent papers have argued that financial frictions limit firms' ability to become
exporters and to export larger volumes. For example, Manova (2007) proposes a Melitz (2003)
type model in which firms face credit constraints in the financing of export costs and financial
contractibility varies across countries. In that framework, the productivity cut-off for exporting is
lower and more firms become exporters in economies with better financial development. This
implies that less productive, small firms which would optimally export to only the most profitable
destinations are more likely to survive in financially developed countries.15 Moreover, in the
presence of destination specific fixed costs of exporting, firms that do export enter more markets
when they have easier access to external financing. An extension of this model with product-
market specific fixed export costs could generate similar results for firms' product intensity.
Finally, similar predictions would hold for importing in the presence of fixed import costs and
heterogeneity in marginal costs across importers.
15 These predictions dovetail with evidence in the corporate finance literature that smaller firms are more credit constrained. See, for example, Beck, Demirgüç-Kunt, Laeven and Levine (2008), Beck, Demirgüç-Kunt and Maksimovic (2005), and Forbes (2007).
15

Given the higher level of financial development in the United States, smaller firms may
find it easier to raise sufficient external financing and to engage in international trade when they
are based in the U.S.. It may thus be possible for less productive firms that optimally trade a
limited number of products with a few countries to survive in the U.S. but not in China. This
would explain the more skewed distributions BJS document for the United States.
Our results for the variation in trade flows across firms with different ownership structures
provide further evidence consistent with this explanation. Foreign affiliates, and to a lesser degree
joint ventures, have access to internal financing from their parent or related foreign company.16
For that reason, foreign-owned firms may perform better than joint ventures, which may in turn
lead private domestic firms. At the same time, relative to private ownership, state ownership
facilitates access to local financing from China's state banks. This may explain why state
enterprises outperform private domestic firms in the data, and are in some respects comparable to
foreign firms. In ongoing work, Manova, Wei and Zhang (2009) find econometric support for this
credit constraints hypothesis by exploiting the variation in ownership structure across firms and
the variation in external finance dependence across sectors.
3.5 Firms’ intensive and extensive margin of trade
We next study the relationship between the extensive and intensive margins of trade at the firm
level, and find that firm ownership and trade profile play an important role.
Figure 1 shows that in the full sample of trading firms, product scope is negatively
correlated with product scale for both exporters and importers. The horizontal axis indicates bins
of firms with a given range of products traded, while the vertical axis plots the average value of
exports or imports per product across all firms with a given product intensity. Although the graphs
are downward sloping, the simple correlation between product intensity and product scale is close
to zero for both exporters (-0.015) and importers (-0.004).
These weak correlations, however, mask important differences between Chinese and
foreign firms. Figure 2 illustrates the relationship between the extensive and intensive margins of
trade for firms of different organizational structure. Private domestic firms that trade more
products trade less per product. Among foreign affiliates and joint ventures, on the other hand, this
16 See, for example, Desai, Foley and Forbes (2008) for evidence that foreign affiliates respond faster and more effectively to profitable export opportunities than domestic firms by relying on funding from the parent company.
16

relationship is non-monotonic and follows a U-shape: trade per product is lowest for firms with an
intermediate level of product intensity. This pattern holds for both exporters and importers.17
These results contribute to an active recent literature on the operations of multi-product
firms. A few different, opposing forces could generate either a positive or a negative relationship
between the extensive and the intensive margin. Assume first that all products potentially available
to a firm are identical in terms of cost structure and profitability. When firm economies of scale
are more important than product economies of scale, larger firms should both produce/export more
products and produce/export more per product. This would be the case if, for example,
technological know-how, managerial control and marketing research were easily deployable
across products. On the other hand, firms may face limited managerial capacity and experience
diminishing returns to scope but increasing returns to scale. When the latter effect dominates, the
intensive and extensive margins would be negatively correlated.
In recent work, Bernard, Redding and Schott (2009b) propose that firms draw productivity
levels and firm-country-product specific demand shocks. In this framework, the products available
to a firm differ in their profitability. While higher firm productivity raises export revenues across
all goods and induces a positive correlation between product scope and average product scale,
more productive firms also export less profitable products on the margin. The model is thus
consistent with either a positive or a negative correlation between a firm's intensive and extensive
margin. Similarly, an extension of the Manova (2007) model to multi-product firms could generate
similar predictions. If firms offer a range of products with varying profitability, they would choose
to export the most profitable goods subject to their credit constraint. Thus, firms would optimally
expand their product range in decreasing order of product profitability until they have exhausted
the external financing available to them. More productive firms that face less financial constraints
will go further down this product ladder, record higher product intensity, and have lower product
scale because they will sell smaller values of less profitable goods on the margin. Arkolakis and
Muendler (2009) derive a positive correlation in an alternative model, and find empirical support
for it in Brazilian firm-level exports data.18
Our results suggest that the credit constraints and limited managerial capacity effects may
dominate in the case of domestic firms in China (both state-owned and privately-held). As for
17 The relationship is also non-monotonic (inverted U-shape) for state enterprises. 18 See also Eckel and Neary (2008) who study cannibalization effects among a firms' products and Nocke and Yeaple (2006) who assume that unit costs of all products increase with the range of products produced.
17

foreign affiliates and joint ventures, they appear subject to the same forces to a lesser degree,
potentially because they have access to internal financing or higher skilled management. The U-
shape these firms exhibit suggests that they also experience powerful increasing returns to scale.
One possible explanation for this distinction is that foreign firms operate in sectors intensive in
technological knowledge and generalizable firm-level ability that can be deployed across products.
We also examine the relationship between firms’ intensive and extensive margin of trade
by looking at their trade partner intensity and average exports (imports) per country. As Figures 3
and 4 show, we no longer observe sharp differences across firm ownership types. Instead, firms’
trade profile becomes important: Importers which source products from more countries import
more per country regardless of ownership type (correlation coefficient 0.13). Exporters, on the
other hand, exhibit a U-shape (correlation coefficient -0.01): average exports per destination are
lowest for firms in the middle of the distribution by number of trade partners. By contrast, BJS
report a positive correlation between trade partner intensity and average trade per country for U.S.
exporters and importers.
Taken as a whole, the earlier evidence and our own results suggest that we have yet to
understand a range of firm-level decisions in international trade. Our findings indicate that there
may be important differences between the cost structure of exporting and importing at the country-
product level which affect firms’ optimal scope and scale. The trade costs firms face and their
ability to finance these costs may also vary with ownership structure, and thus influence firms’
integration and location decisions. Finally, the disparities across country studies highlight the
importance of the institutional environment in which firms operate. Without restating the specific
patterns we document, we summarize our results as follows:
Stylized fact #4: The relationship between firms’ intensive and extensive margin of trade
differs between exporters and importers and depends on the ownership structure of the firm.
4 Decomposing China’s trade expansion
In 2003, China's aggregate exports and imports amounted to over $290 billion each. Over the next
two years alone, the cumulative growth rate of trade was an astonishing 86% for exports and 66%
for imports. Since China joined the World Trade Organization only in December 2001, this rapid
trade expansion is part of China's fast convergence to a new steady state of integration in world
18

markets. This section examines this process and decomposes China's trade growth into its
extensive and intensive margins.
We first describe the evolution of the number of trading firms in China and the number of
products and countries China as a whole traded with. As Table 10 indicates, the number of
exporters increased 48% from 65.5 thousand in 2003 to 96.6 thousand in 2005, while the number
of importing firms grew by a third, from 57.4 to 76.4 thousand. Average exports and imports per
firm expanded as well, at a more moderate rate of 25%.
If one ignored firm heterogeneity and focused on China’s product composition and trade
partners in the aggregate, almost the entire growth in trade would erroneously be attributed to the
intensive margin: Average Chinese exports and imports per product increased at roughly the same
rate as overall trade, with only a 2-3% broadening of product scope. Similar patterns hold for
China's number of trade partners and average trade flows per country. These results indicate that
the biggest boost to Chinese trade came from new and surviving firms expanding into products
and markets that other firms were already active in. Thus, understanding firm heterogeneity and
firms’ trade decisions is central to understanding movements in aggregate trade flows.
The 2003-2005 period of Chinese trade expansion provides an opportunity to do so. To
that end, Table 11 presents a more detailed decomposition of China's trade growth by
distinguishing between surviving exporters and importers (which traded in 2003 and 2005), new
firms (which did not trade in 2003 but did in 2005) and exiting firms (which stopped trading
between 2003 and 2005). More than 70% of Chinese trade growth can be attributed to surviving
firms expanding their trade flows. New exporters and importers contributed about 30%, while
exiting firms slowed down trade by only 1%.
The expansion of trade flows by surviving firms resulted from important adjustments on
both the intensive and the extensive margin. Two thirds of surviving firms’ growth
(60%=42.2%/70.1% for exporters and 70%=50.7%/72.8% for importers) reflect deepening in
trade flows within existing trade partner relationships in surviving products. However, firms also
reallocated a big proportion of their activity across products and markets. For example, the exports
of new products by surviving firms contributed 30% to total Chinese exports expansion, while
13% were lost due to surviving exporters discontinuing some products. Similarly, firm entry into
new destination countries boosted overall export growth by 19%, while market exit deducted 7%.
Surviving firms were also prone to change the products they sold in a given market, even if they
19

did not withdraw from it completely. Thus the exports of new products to existing trade partners
added 33% to China's export growth, but half of that gain was neutralized by firms simultaneously
discontinuing products in the same destination.19 Similar numbers describe Chinese importers and
their adjustments to the products they imported and the source countries they transacted with.
We summarize these findings with the following stylized fact:
Stylized fact #6: The growth in Chinese exports between 2003-2005 was driven by firm
entry (30%, aggregate extensive margin), surviving firms expanding exports of surviving products
to existing trade partners (42%, firm intensive margin), and surviving exporters adding new
products and destinations (28%, firm extensive margin). This breakdown is 27% - 51% - 22% for
imports.
These results speak to the relevance of theoretical models of intra-industry firm dynamics
and intra-firm product turnover in general, and in response to trade liberalization in particular. For
example, Melitz (2003) and Costantini and Melitz (2009) model the reallocation of market shares
across firms with different productivity levels in the presence of fixed and sunk costs of exporting,
while Pavcnik (2002) and Bernard, Jensen and Schott (2006) provide empirical evidence for such
reallocations in the aftermath of tariff reductions in Colombia and the U.S.. Similarly, Bernard,
Redding and Schott (2009b) model multi-product firms, and examine the reallocation of trade
flows both across firms and across products within firms. Goldberg, Khandelwal, Pavcnik and
Topalova (2008), however, find only limited empirical support for this model using data on the
behavior of Indian firms around trade reform.
5 Firm, product and trade partner dynamics
The decomposition of China's trade expansion between 2003 and 2005 highlights the role of
reallocations across and within firms in response to trade liberalization. At the same time, this
two-year comparison masks recurrent churning and reallocations across firms, products and trade
partners. The monthly frequency of our data allows us to track firms over a 36-month period and
document the constant adjustments they make to their product scope and choice of trade partners.
Between January 2003 and December 2005, the overall number of exporters and importers
grew by 45% and 22% respectively (Table 12). These rates varied substantially across firms with 19 Note that a firm need not start exporting an entirely new product, but can simply introduce products it was already exporting to some countries in a new country instead.
20

different ownership structure, but were always higher for exporters than for importers. The
number of private domestic firms that trade more than doubled, while the number of state-owned
exporters (importers) contracted by 9% (14%). Foreign affiliates became significantly more
numerous (48% for exporters and 32% for importers), while more joint ventures started exporting
(6%) but some stopped importing (9%).
These net growth rates in firm numbers were accompanied by frequent firm entry and exit
from international trade. Thirty-two percent of all exporters and 40% of all importers trading in
January 2003 no longer did in December 2005, and were active in 15.6 and 13.5 of the 36 months,
respectively. Overall, 12% of all exporters and 20% of all importers stopped trading each month,
but on average even more new ones entered to replace them. Foreign-owned exporters and
importers were more likely to survive from one month to the next than joint ventures, which had
in turn better chances than domestic companies.
Trading firms are prone to repeatedly exit from and re-enter into exporting or importing.
Forty percent of all exporters and 29% of all importers were active in all 36 months in 2003-2005,
with these shares increasing in foreign ownership. Less than 10% of all firms traded continuously
over this period but for one spell of non-trading, while more than 20% switched their status
multiple times. Survival rates are slightly higher and churning less common at a quarterly
frequency (see Appendix Table 1), but firm dynamics exhibit otherwise similar patterns.
Firms regularly adjust their trade participation even when they do not completely withdraw
from exporting or importing. For example, firms that trade continuously over the 36 months in our
data frequently add and drop trade partners, as reported in Table 13. The average number of
destination and source countries per firm increased by 26% for exporters and 13% for importers
between January 2003 and December 2005, with little variation in this growth rate across
ownership types.20 However, firms on average replaced a third of their trade partners every month.
This share decreases in foreign ownership, with foreign affiliates exhibiting less churning than
joint ventures and domestic firms showing the highest turnover rates. State enterprises experience
slightly less churning in trade partners than privately-held local firms. Turnover is only marginally
lower at a quarterly frequency.
In addition to rationalizing trade partners, firms that trade every month in our data also
routinely adjust their product composition. As Table 14 shows, in any given month, exporters
20 Note that 26%=(4.3-3.4)/3.4 and 13%=(3.4-3)/3.
21

(importers) discontinue 30% (35%) of the products they trade with at least one country, and
introduce as many new goods. Moreover, firms often vary the mix of products they trade with a
given destination or source country. On average, 45% (40%) of all bilaterally exported (imported)
products are replaced with new ones from month to month. As with trade partner dynamics,
foreign affiliates exhibit systematically less product churning than joint ventures, which in turn
maintain a more stable product composition than state enterprises. Privately-held domestic
companies adjust their product scope most frequently. Due to this recurrent churning, firms trade a
given product in about 7 months in the 2003-2005 period on average, and in only 5 months with a
specific trade partner.
Stylized fact 5 summarizes our results for export and import dynamics.
Stylized fact #5: Firms are prone to exit and re-enter into exporting and importing, and
frequently change their trade partners and product mix. Foreign affiliates and joint ventures,
however, have significantly higher survival rates and exhibit less product and trade partner
turnover than domestic firms.
Our findings indicate that firms face sufficiently low sunk costs of trade and/or sufficiently
volatile cost or demand shocks to warrant regular adjustments to trade flows. Moreover, the more
frequent churning of products than trade partners in our data suggests that the sunk costs of
entering into new markets and sourcing from new countries may exceed the sunk costs of trading
new products with the same country. These results complement the evidence in BJS, Bernard,
Redding and Schott (2009a), Alessandria and Choi (2007), and Besedes and Prusa (2006 a,b) on
the frequency and determinants of firm and product churning in exporting.21 These papers have
emphasized the productivity gains associated with within-firm reallocations in activity across
products. Further evidence on firms' continuous product and trade partner adjustments will shed
light on firms' trade participation decisions and the cost structure of exporting and importing.
The systematic differences we document across ownership types signal that foreign firms
may have higher sunk costs or experience fewer and smaller shocks. If firms face liquidity
constraints, the affiliates of foreign multinationals may also be better able to weather negative
21 See also Eaton, Eslava, Kugler and Tybout (2008) for evidence on reallocations across and within firms in Colombia.
22

shocks since they can access internal lending from the parent company.22 Similarly, state
enterprises may more easily access financing from state-owned banks than private domestic firms.
By the same logic, with product or country specific shocks, financially constrained firms may be
more likely to discontinue some products or stop trading with some countries.23 In the presence of
sunk trade costs, on the other hand, easier access to financing may increase churning because
firms have a lower option value of staying in during a bad shock. Our results suggest that this
effect may be dominated by the impact of liquidity shocks.
6 Conclusion
This paper uses newly available proprietary data on Chinese firm-level trade flows to establish
novel and confirm existing stylized facts about firm heterogeneity in trade. This firm heterogeneity
is most clearly manifested in the skewed distribution of exports, imports, product scope and trade
partner intensity across firms. We corroborate the finding in the prior literature that a substantial
share of exports and imports are captured by a few multi‐product firms that transact with a large
number of countries.
We also provide a detailed overview of China’s trade activity and the sources of Chinese
trade growth over the 2003-2005 period. This analysis, too, emphasizes the importance of
reallocation of activity across heterogeneous firms and across products and trade partners within
firms. While 40-50% of the expansion in exports and imports can be attributed to surviving firms
deepening their trade flows of surviving products with existing trade partners, firm entry and firm
expansion into new products and markets is just as important. Thus, understanding firm
heterogeneity and firms’ trade decisions is central to understanding aggregate trade outcomes.
We highlight a few novel results which shed light on the cost structure of international
trade and the importance of foreign ownership for firms’ export and import decisions. First, the
distribution of imports is significantly more skewed than that of exports, and there are many more
small firms among importers. Second, foreign affiliates trade more on average and are more likely
to engage in two-way trade than joint ventures, who in turn lead private domestic firms. Third,
importers import more products than exporters export, but exporters trade with more countries
22 See, for example, Desai, Foley, and Forbes (2008) for evidence that the affiliates of foreign multinationals are less credit constrained relative to domestic firms. 23 See Manova (2007) for evidence that financially developed countries feature higher product survival rates and lower product turnover, especially in financially vulnerable sectors.
23

than importers do. Moreover, import product intensity and the number of source countries increase
with foreign ownership, while export product intensity and the number of destinations decrease
with foreign ownership. Fourth, the relationship between firms’ intensive and extensive margin of
trade is not monotonic, differs between exporters and importers, and depends on the ownership
structure of the firm. Finally, while all firms are prone to exit and re-enter into exporting and
importing, and to frequently change their trade partners and product mix, foreign ownership is
associated with significantly higher survival rates and less churning.
We believe these novel findings will guide future work on the nature of firm heterogeneity
in trade, the optimal scope and scale of multi-product firms, and the production location and
organizational decisions of multinational firms.
References
Alessandria, G. and H. Choi (2007). "Do Sunk Costs of Exporting Matter for Net Export Dynamics?" Quarterly Journal of Economics 122 (1), p.289-336.
Antràs, P. (2003). “Firms, Contracts, and Trade Structure.” Quarterly Journal of Economics 118(4), p. 1374-1418.
Antràs, P. and E. Helpman (2004). “Global Sourcing.” Journal of Political Economy 112, p.552–80.
Antràs, P. and E. Helpman (2008). "Contractual Frictions and Global Sourcing," forthcoming in E. Helpman, D. Marin, and T. Verdier (eds.), The Organization of Firms in a Global Economy, Harvard University Press.
Arkolakis, C. and M. Muendler (2009). “The Extensive Margin of Exporting Goods: A Firm-level Analysis.” Yale University mimeo.
Aw, B., Chung, S., and M. Roberts (2000). “Productivity and Turnover in the Export Market: Micro-level Evidence from the Republic of Korea and Taiwan (China).” World Bank Economic Review 14(1), p.65-90.
Bartelsman, E., J. Haltiwanger and S. Scarpetta (2008). “Cross-Country Differences in Productivity: the Role of Allocative Efficieincy.” University of Maryland mimeo.
Beck, T. (2002). “Financial Development and International Trade. Is There a Link?” Journal of International Economics 57, p.107-31.
Beck, T. (2003). “Financial Dependence and International Trade.” Review of International Economics 11, p.296-316.
Beck, T., Demirgüç-Kunt, A., Laeven L. and R. Levine (2008). "Finance, Firm Size, and Growth." Journal of Money, Banking, and Finance 40(7), p.1371-405.
Beck, T., Demirgüç-Kunt, A. and V. Maksimovic (2005). "Financial and Legal Constraints to Firm Growth: Does Size Matter?" Journal of Finance 60(1), p.137-77.
24

Becker, B. and D. Greenberg (2007). "Financial Development, Fixed Costs and International Trade." Harvard Business School mimeo.
Bernard, A. and J. Jensen (1999). “Exceptional Exporter Performance: Cause, Effect or Both?” Journal of International Economics 47(1), p.1-25.
Bernard, A. and J. Jensen (1995). “Exporters, Jobs, and Wages in U.S. Manufacturing, 1976-1987.” Brookings Papers on Economic Activity, Microeconomics.
Bernard, A., Jensen, J. and P. Schott (2009). "Importers, Exporters, and Multinationals: A Portrait of Firms in the U.S. that Trade Goods," in T. Dunne, J.B. Jensen, and M.J. Roberts, eds., Producer Dynamics: New Evidence from Micro Data, University of Chicago Press.
Bernard, A., Jensen, J. and P. Schott (2006). "Survival of the Best Fit: Exposure to Low Wage Countries and The (Uneven) Growth of US Manufacturing Plants." Journal of International Economics 68, p.219-37.
Bernard, A., Redding, S. and P. Schott (2009a). "Multi-Product Firms and Product Switching." American Economic Review (forthcoming).
Bernard, A., Redding, S. and P. Schott (2009b). "Multi-Product Firms and Trade Liberalization." NBER Working Paper 12782.
Bernard, A., Redding, S. and P. Schott (2009c). "Products and Productivity." Scandinavian Journal of Economics (forthcoming).
Bernard, A. and J. Wagner (1997). “Exports and Success in German Manufacturing.” Weltwirtschaftliches Archiv 133(1), p.134-57.
Besedes, T. and T. Prusa (2006a). "Ins, Outs, and the Duration of Trade." Canadian Journal of Economics 39(1), p.266-95.
Besedes, T. and T. Prusa (2006b). "Product Differentiation and Duration of US Import Trade." Journal of International Economics 70(2), p.339-58.
Besedes, T. and T. Prusa (2007). "The Role of Extensive and Intensive Margins and Export Growth." NBER Working Paper 13628.
Clerides, S., Lach, S. and J. Tybout (1998). “Is Learning by Exporting Important? Micro-dynamic Evidence from Colombia, Mexico, and Morocco." Quarterly Journal of Economics 113(3), p.903-47.
Costantini, J. and M. Melitz (2009). “The Dynamics of Firm Level Adjustment to Trade Liberalization,” in E. Helpman, D. Marin and T. Verdier, The Organization of Firms in a Global Economy, Harvard University Press (forthcoming)..
Desai,M., Foley, F. and K. Forbes (2008). "Financial Constraints and Growth: Multinational and Local Firm Responses to Currency Depreciations." Review of Financial Studies (forthcoming).
Eaton, J., Eslava, Kugler and J. Tybout (2008). "The Margins of Entry into Exports Markets: Evidence from Columbia," in E. Helpman, D. Marin and T. Verdier, eds., The Organization of Firms in a Global Economy, forthcoming, Harvard University Press.
Eaton, J., Kortum, S. and F. Kramarz (2008). "An Anatomy of International Trade: Evidence from French Firms." NBER Working Paper 14610.
Eaton, J., Kortum, S. and F. Kramarz (2004). "Dissecting Trade: Firms, Industries, and Export Destinations." American Economic Review Papers and Proceedings 94(2), p. 150-54.
25
26
Eckel, C. and P. Neary (2008). "Multi-Product Firms and Flexible Manufacturing in the Global Economy." Review of Economic Studies (forthcoming).
Feenstra, R. and G. Hanson (2005). “Ownership and Control in Outsourcing to China: Estimating the Property-Rights Theory of the Firm.” Quarterly Journal of Economics 120(2), p.729–61.
Forbes, K. (2007). "One Cost of the Chilean Capital Controls: Increased Financial Constraints for Smaller Traded Firms." Journal of International Economics 71(2), p.294-323.
Goldberg, P., Khandelwal, A., Pavcnik, N. and P. Topalova (2008). “Multi-product Firms and Product Turnover in the Developing World: Evidence from India.” Review of Economics and Statistics (forthcoming).
Greenaway, D., Guariglia, A. and R. Kneller (2007). "Financial Factors and Exporting Decisions." Journal of International Economics 73(2), p.377-95.
Helpman, E. (1984). “A Simple Theory of International Trade with Multinational Corporations.” Journal of Political Economy 92, p.451-471.
Manova, K. (2007). "Credit Constraints, Heterogeneous Firms and International Trade." NBER Working Paper 14531.
Manova, K. (2008). "Credit Constraints, Equity Market Liberalizations and International Trade." Journal of International Economics 76, p.33-47.
Manova, K., S.-J. Wei and Z. Zhang (2009). “Credit Constraints and International Trade: A Firm-Level Analysis.” (in progress)
Mayer, T., Melitz, M. and G. Ottaviano (2009). “Market size, Competition, and the Product Mix of Exporters.” (in progress)
Melitz, M. (2003). "The Impact of Trade on Intra-Industry Reallocations and Aggregate Industry Productivity." Econometrica 71(6), p.1695-725.
Muûls, M. (2008). "Exporters and Credit Constraints. A Firm Level Approach." London School of Economics mimeo.
Muûls, M. and M. Pisu (2009). “Imports and Exports at the Level of the Firm: Evidence from Belgium.” World Economy 32, p.692-734.
Nocke, V. and S. Yeaple (2006). "Globalization and Endogenous Firm Scope." NBER Working Paper 12322.
Nunn, N. and D. Trefler (2008). "The Boundaries of the Multinational Firm: An Empirical Analysis," forthcoming in E. Helpman, D. Marin, and T. Verdier (eds.), The Organization of Firms in a Global Economy, Harvard University Press.
Pavcnik, N. (2002). "Trade Liberalization, Exit, and Productivity Improvements: Evidence from Chilean Plants." The Review of Economic Studies 69, p.245-76.
Yeaple, S. (2006). “Offshoring, Foreign Direct Investment, and the Structure of U.S. Trade.” Journal of the European Economic Association 4, p.602–11.

ship structure and tradecaptured by firms with a
Foreign-Owned
firm ownership structure.these fractions are as a
ent the ratio of firms with
Foreign-Owned
Table 1. Exporting and Importing Firms in ChinaThis table shows the number of Chinese firms that participated in international trade in 2005, and provides a breakdown byIt also shows what fraction of firms export only, import only, or engage in two-way trade. In the first three rows of the table,share of all firms with the same ownership type as indicated in the column heading. In the last row, these percentages represthat ownership type to all Chinese trading firms.
Firm Type All Firms State-Owned Private Domestic Joint Ventures
# Firms % Share # Firms % Share # Firms % Share # Firms % Share # Firms % Share
Exporters 38,090 33.3 2,370 32.7 19,605 53.3 8,357 30.8 7,758 17.9Importers 17,893 15.6 1,411 19.5 5,654 15.4 4,296 15.8 6,532 15.1Exporters & Importers 58,500 51.1 3,472 47.9 11,520 31.3 14,477 53.4 29,031 67.0
All Trading Firms 114,483 100.0 7,253 6.3 36,779 32.1 27,130 23.7 43,321 37.8
Table 2. Chinese Trade Flows by Firm Type
This table shows the total value of Chinese exports and imports in 2005 (in billion US Dollars) and its breakdown by ownerparticipation. The top two rows in each panel report the percent share of trade flows by firms with a given ownership typegiven trade profile. The bottom row gives the share of total Chinese trade flows captured by firms with that ownership type.
Firm Type All Firms State-Owned Private Domestic Joint VenturesTrade % Share Trade % Share Trade % Share Trade % Share Trade % Share
Panel A. ExportsExporters 53.2 9.7 8.0 14.2 26.4 36.9 12.1 8.4 6.7 2.4Exporters & Importers 495.0 90.3 48.3 85.8 45.3 63.1 132.2 91.6 269.5 97.6
All Exporting Firms 548.2 100.0 56.2 10.3 71.7 13.1 144.3 26.3 276.2 50.4
Panel B. ImportsImporters 61.3 12.7 22.5 21.4 11.7 34.4 14.8 12.7 12.3 5.4Exporters & Importers 422.0 87.3 82.4 78.6 22.4 65.6 101.6 87.3 215.8 94.6
All Importing Firms 483.3 100.0 104.9 21.7 34.1 7.1 116.4 24.1 228.1 47.2

Table 3. The Distribution of Trade Flows across Firms
This table shows the distribution of exports and imports (in thousands of US Dollars) across Chinese firms thatparticipated in international trade in 2005. Each column presents statistics for all firms with a given ownershipstructure as indicated in the column heading. Each cell reports the value of total exports or imports of a firm atthe 10th, 25th, 50th, 75th or 90th percentile by trade value. The bottom row in each panel shows the number offirms with that ownership structure.
Firm Type All Firms State-Owned Private Domestic Joint Ventures Foreign-Owned
Panel A. Firm exportsMean 5,677 9,621 2,303 6,317 7,509St Dev 74,173 49,378 15,051 51,095 110,589
10th Perc 36 35 34 44 3325th Perc 166 177 145 218 15950th Perc 724 973 584 945 72575th Perc 2,590 4,820 1,946 3,207 2,67390th Perc 7,602 16,600 4,952 8,830 8,376
# Firms 96,590 5,842 31,125 22,834 36,789
Panel B. Firm importsMean 6,329 21,500 1,986 6,199 6,414St Dev 120,759 392,064 16,148 48,216 93,968
10th erc P 4 5 1 4 1025th Perc 38 62 8 40 6750th Perc 282 556 98 289 38675th P75th Perc 1 5011,501 3 9883,988 660660 1 5741,574 1 7771,77790th Perc 6,271 21,100 2,919 6,784 6,687
# Firms 76,393 4,883 17,174 18,773 35,563

Table 4. The Concentration of Trade Flows in the Largest Trading Firms
This table demonstrates the skewed distribution of trade flows across trading firms in 2005. The table reports thepercent share of total exports or imports captured by the top 1, 5, 10, 25 or 50 percent of all exporting or importingfirms. These statistics are presented for all firms, as well as for each firm ownership type, as indicated in thecolumn heading.
Firm Type All Firms State-Owned Private Domestic Joint Ventures Foreign-Owned
# Firms % Exports or Imports
% Exports or Imports
% Exports or Imports
% Exports or Imports
% Exports or Imports
Panel A. ExportsTop 1% 965 51% 36% 27% 47% 58%Top 5% 4,829 71% 66% 50% 68% 76%Top 10% 9,659 80% 78% 64% 78% 84%Top 25% 24,147 92% 92% 84% 90% 94%Top 50% 48,295 98% 99% 96% 98% 99%
Panel B. ImportsTop 1% 763 60% 65% 46% 53% 60%Top 5% 3,819 82% 84% 74% 80% 80%Top 10% 7,639 89% 91% 85% 88% 88%Top 25% 19,098 97% 98% 96% 96% 96%Top 50% 38,196 99% 100% 99% 99% 99%

7
Table 5. Trading Firms' Product Intensity
This table shows the distribution of product intensity across exporting and importing Chinese firms in 2005, andits variation with firm ownership structure. In Panels A and B, each cell reports the number of products exportedor imported by a firm at the 10th, 25th, 50th, 75th, 90th or 100th percentile of product intensity. Panel C lists theaverage number of products exported and imported by firms who both export and import, and the percent shareof such firms that export more products than they import.
Firm Type All Firms State-Owned Private Domestic Joint Ventures Foreign-Owned
Panel A. Number of products exportedMean 9.3 22.8 12.5 6.5 6.3St Dev 31.0 74.5 41.2 10.1 9.3
10th erc P 1 1 1 1 125th erc P 2 2 2 2 250th erc P 3 4 4 3 375th Perc 8 12 8 7 790th Perc 17 46 20 15 15Maximum 1,610 1,610 1,009 460 623
Panel B. Number of products importedMean 17.1 21.5 8.5 16.9 20.7St Dev 32.9 50.2 23.7 32.4 33.1
10th erc P 1 1 1 1 125th erc P 2 2 1 2 350th erc P 6 5 3 6 975th Perc75th Perc 1818 1818 7 1818 242490th Perc 43 51 18 43 51Maximum 868 767 868 576 710
Panel C. Product intensity of firms that both export and importMean Exported 10.5 31.7 16.9 7.8 6.8Mean Imported 19.4 25.1 8.8 19.1 23.1# Exported > # Imported 31.7% 47.5% 58.3% 30.9% 19.7%

ms across different binsapture (even-numberedidentify groups of firms
Foreign-Owned
1 4 4 8 8 6 7 6 5
Table 6. The Concentration of Trade Flows in Multi-Product Firms
This table demonstrates the skewed distribution of trade flows across trading firms in 2005. It reports the distribution of firby product intensity (odd-numbered columns) and the percent share of total exports or imports that firms in each bin ccolumns). The entries in each column sum to 100%, and column headings identify the firm ownership type. The cells in boldthat capture a larger than proportional share of trade flows.
Firm Type All Firms State-Owned Private Domestic Joint Ventures
% Firms % Eor I
xports mports % Firms % Exports
or Imports % Firms % Ex
or Imports ports % Firms %
o Exports
r Imports % Firms % Exports or Imports
(1) (2) (3) (4) (5) (6) (7) (8) (9) (10)
Panel A. Exporters' share of total exports, by product intensity# Products Exported
1 23.3 5.6 22.9 4.4 23.0 8.4 23.8 7.2 23.2 4.32 16.2 7.0 14.4 6.4 15.9 8.5 16.5 8.6 16.6 5.83-5 25.7 17.2 21.3 15.2 25.4 19.2 25.7 16.8 26.6 17.26-10 16.8 16.7 13.8 12.5 16.3 16.8 17.1 20.1 17.4 15.811-30 13.7 23.6 14.2 13.2 13.3 20.8 14.0 23.0 13.7 26.8>30 4.4 29.9 13.4 48.3 6.2 26.3 2.8 24.2 2.4 30.0
31-50 2.2 9.1 4.0 6.7 2.4 6.9 2.1 9.5 1.8 10.051-10051-100 1.1.1 11.511.5 4.4. 8.8. 1.61. 7.5.5 0.60. 13.0 0.5 12.213.0 0. 12.2>100 1.1 9.3 5.0 32.8 2.2 11.9 0.1 1.7 0.1 7.8
Panel B. Importers' share of total imports, by product intensity# Products Imported
1 18.9 2.2 20.5 3.3 32.4 10.3 18.6 2.3 12.2 0.52 11.2 1.7 11.9 1.8 16.0 6.9 11.7 1.9 8.6 0.83-5 18.1 6.0 18.7 12.2 21.2 18.4 18.7 4.4 16.1 2.16-10 14.7 11.5 14.1 36.1 12.0 11.9 14.2 5.5 16.4 3.211-30 22.1 11.7 18.1 8.2 13.0 21.7 22.0 13.1 27.2 11.1>30 15.0 66.8 16.8 38.4 5.4 30.8 14.9 72.7 19.5 82.3
31-50 7.1 8.6 6.5 4.8 2.7 10.8 7.0 10.6 9.4 8.951-100 5.3 15.9 5.5 8.6 1.9 8.5 5.4 16.5 6.9 20.2>100 2.6 42.3 4.8 25.0 0.8 11.5 2.5 45.6 3.2 53.2

2 3 2 2 2
Table 7. Firms' Trade Partner Intensity
This table shows the distribution of trade partner intensity across exporting and importing Chinese firms in 2005,and its variation with firm ownership structure. In Panels A and B, each cell reports the number of trade partnersthat firms export to or import from, for firms at the 10th, 25th, 50th, 75th, 90th or 100th percentile of trade partnerintensity. Panel C lists the average number of trade partners for firms who both export and import, and thepercent share of such firms that have more export destinations than source countries.
Firm Type All Firms State-Owned Private Domestic Joint Ventures Foreign-Owned
Panel A. Number of countries firms export toMean 7.5 11.2 8.7 7.4 5.9St Dev 10.4 16.2 11.1 10.0 8.3
10th erc P 1 1 1 1 125th erc P 1 2 2 1 150th erc P 3 5 4 3 375th Perc 9 13 11 9 790th Perc 19 30 22 19 15Maximum 144 128 140 144 128
Panel B. Number of countries firms import fromMean 4.0 5.6 3.0 4.0 4.2St Dev 4.6 6.7 3.7 4.5 4.6
10th erc P 1 1 1 1 125th erc P 1 1 1 1 150th Perc50th Perc 2 3 2 2 275th erc P 5 7 3 5 590th erc P 9 14 7 9 10Maximum 67 58 56 57 67
Panel C. Trade partner intensity of firms that both export and import
Mean # Destinations 8.2 14.7 11.0 8.2 6.4
Mean # Source Countries 4.3 6.3 3.0 4.3 4.5
# Destinations > # Sources 52.8% 63.8% 70.6% 53.6% 44.0%

ms across different binsapture (even-numberedidentify groups of firms
Foreign-Owned
1 8 2 8 4
Table 8. The Concentration of Trade Flows in Firms with Many Trade Partners
This table demonstrates the skewed distribution of trade flows across trading firms in 2005. It reports the distribution of firby trade partner intensity (odd-numbered columns) and the percent share of total exports or imports that firms in each bin ccolumns). The entries in each column sum to 100%, and column headings identify the firm ownership type. The cells in boldthat capture a larger than proportional share of trade flows.
Firm Type All Firms State-Owned Private Domestic Joint Ventures
% Firms % Eor I
xports mports % Firms % Exports
or Imports % Firms % Ex
or Imports ports % Firms %
o Exports
r Imports % Firms % Exports or Imports
(1) (2) (3) (4) (5) (6) (7) (8) (9) (10)
Panel A. Exporter's share of total exports, by trade partner intensity# Export Destination Countries
1 26.8 6.2 21.6 2.5 21.0 5.8 26.3 7.1 32.9 6.62 14.6 5.1 12.2 2.5 13.2 5.2 14.6 6.4 16.1 4.93-5 21.2 10.1 19.7 6.4 21.9 12.3 21.4 12.4 20.8 9.16-10 15.5 11.8 15.7 13.8 17.3 13.6 16.1 12.3 13.6 10.7>10 21.8 66.8 30.7 74.7 26.6 63.1 21.6 61.8 16.6 68.8
11-30 17.7 34.3 20.8 27.0 21.3 33.6 17.7 34.5 14.2 35.931-50 3.1 15.0 6.1 13.6 4.0 14.5 3.0 12.8 2.0 16.5>51>51 1.0.0 17.617.6 3.83. 34.134.1 1.21. 15.015.0 0.80. 14.5 0.4 16.414.5 0. 16.4
Panel B. Importer's share of total imports, by trade partner intensity# Import Origin Countries
1 35.1 2.4 28.1 0.9 45.9 8.6 33.3 2.3 31.9 2.32 18.4 3.1 16.4 1.6 18.9 9.2 18.6 3.0 18.2 2.93-5 25.3 10.7 23.2 5.7 21.6 20.4 26.6 12.3 26.6 10.86-10 13.4 16.8 17.1 14.0 9.4 21.0 13.6 22.3 14.7 14.6>10 7.8 66.9 15.3 77.7 4.2 40.9 7.9 60.0 8.6 69.3
11-30 7.5 43.7 14.0 32.7 4.0 34.1 7.6 47.5 8.3 48.431-50 0.3 18.2 1.2 36.9 0.2 6.4 0.2 11.9 0.3 14.7>51 0.02 4.9 0.08 8.1 0.02 0.4 0.02 0.7 0.01 6.2

Table 9. The Joint Distribution of Product and Trade Partner Intensity
This table demonstrates the skewed distribution of trade flows across trading firms in 2005. Each cell reports thepercent of all exporters or importers that trade a given number of products with a given number of trade partners(left half of the table) OR the share of the value of exports or imports captured by such firms (right half of thetable). Rows indicate the number of products firms trade, while columns indicate the number of trade partners. Thecells in bold identify groups of firms that capture a larger than proportional share of trade flows.
% Firms % Total Exports or Imports
# Trade Partners 1 2 3-5 6-10 >10 1 2 3-5 6-10 >10
Panel A. Breakdown of exporting firms and their exports by product and trade partner intensity# Products
1 12.3 3.7 3.8 1.9 1.5 1.4 0.7 1.1 0.9 1.52 5.0 3.4 3.8 2.1 2.0 1.0 0.6 1.2 1.2 2.93-5 5.2 4.0 6.7 4.7 5.0 1.6 1.4 2.6 3.1 8.56-10 2.4 2.0 3.9 3.4 5.1 1.0 1.0 2.1 2.4 10.211-30 1.6 1.3 2.7 2.7 5.4 0.8 0.7 2.1 3.1 17.0>30 0.3 0.2 0.4 0.6 2.9 0.4 0.6 1.1 1.1 26.6
Panel B. Breakdown of importing firms and their imports by product and trade partner intensity# Products
1 16.3 1.7 0.8 0.1 0.0 0.6 0.5 0.7 0.2 0.12 5.0 4.2 1.6 0.3 0.0 0.2 0.3 0.7 0.3 0.13-5 5.5 4.8 6.5 1.2 0.2 0.3 0.5 1.7 2.1 1.46-10 3.5 2.9 5.7 2.3 0.3 0.3 0.4 1.5 1.8 7.611-30 3.8 3.5 7.4 5.6 1.8 0.5 0.7 2.5 4.1 3.9>30 1.1 1.3 3.3 3.9 5.4 0.5 0.8 3.6 8.2 53.8

# Firms Exporting 65,494 96,590 47.5%
# Products Exported 6,692 6,915 3.3%
China exports to and average exports per destination; and the number of products China exports
in millions of US Dollars.
#
Table 10. China's Trade Expansion, 2003-2005
This table examines the expansion in Chinese exports and imports over the 2003-2005 period.Panel A documents the total value of exports in 2003 and in 2005, as well as the percent changeover these three years. It also shows these statistics for different decompositions of the total valueof exports: the number of firms exporting and average exports per firm; the number of countries
and average exports per product. Panel B repeats the exercise for Chinese imports. All values are
Firm Type 2003 2005 % Growth 2003-2005
Panel A. The expansion of China's exports, 2003-2005Total Exports 294,641 548,372 86.1%
Avg Exports per Firm 4.5 5.7 26.2%
# Trade Partners 225 231 2.7%Avg Exports per Trade Partner 1,310 2,374 81.3%
Avg Exports per Product 44.0 79.3 80.1%
Panel B. The expansion of China's imports, 2003-2005Total Imports 290,955 483,488 66.2%
# Firms Importing 57,351 76,393 33.2%Avg Imports per Firm 5.1 6.3 24.8%
# Trade Partners Trade Partners 194 202194 202 4 1%4.1%Avg Imports per Trade Partner 1,500 2,394 59.6%
# Products Imported 6,769 6,876 1.6%Avg Imports per Product 43.0 70.3 63.6%

in
2003-
New Ex s
oducts Pro r .
t Sur r s o .
T nsi v
This table examines 2005 "2003 but did in 2005; not and "s bothand 2005. The trade o new ivingdestinations. The top alue of(Panel B) between and of e tsfirm/product/destination ategory bution tr alues e
2003-
ew P S D ons 9c oduc
in
2003-
New . Ex s
oducts . Pr
c Sur e
fc oduc c es
New
Fi
Pan
∆ T
∆ TToTo
Su∆
Su∆
of
Pan
∆ T
∆ TToTo
Su∆
Su∆
rm Type
el A. The exp
otal Exports
otal Exports oftal Exports oftal Exports of
rviving Firms Exports of Sur
Exports of NewExports of Disc
rviving Firms Exports to Sur∆ Exports ofExports of New
US Dollars.
Exports of NExports of Dis
Exports to NewExports to Disc
el B. The exp
otal Imports
otal Imports oftal Imports oftal Imports of
rviving Firms Imports of Sur
Imports of NewImports of Disc
rviving Firms Imports from∆ Imports ofImports of NewImports of Dis
Imports fromImports from Dis
Survv
Pr
c
v
an
2005
Sur
ntin
vvivPr ro
Dest
Sur F
v
an
2005
oducontinued Pr
iving Produc
ontinued Pr Sour
Firmiting F
iving Pr
v
ontinued Des
sion
ingoducduc
ontinued Pr
ued
iving Des
iving Produc
virm
iting F
sion
the"exflowrow
2003c
ts
iving Sour
ts
ceontinued Sour
sirm
iving Fir
of
Ptsts
inations
Pts
iving Fs
irm
of
exitingsin
Ch
irm
oduc
oducto
abl
pansfir
f seac
to
t
Ch
m
oduc
oducrom
Countr
ets
ice
200
ts
s
inations
ts Surur
ts
inations
2003-
s
e 11.
ionmsurh
2005and
of
Countr fr
Surts fes
3-2
2003-
a's imp
to vvivits
2003-
a's exp
in" tr
vivingpanel
in
Chi
omvrom
Countr
005
2005
Suivingng to
2003-
2005
2005
T
C
its
n
i Sur
o
rviD
Sur
2005
or
h
adedfirr
levelsper
esv
iving Sour Sur
ies
rts
vinesestv
ts
e Ext
hina'sin
msepor
.c
a's T
2003-
v
g inat
tr
artsT
ent
r
2005
iving Source
Detinationsi
iving Des
, 2003-
, 2003-
e
ade2003
ethehec
iving Sour
tin
t
v
butdec
cres
ontri
ade Expansi
c Countr
ati
2005
2005
over
omhanget
iese
ns
inations
e and I
the
pos
Countr
n
inedin
eacto
i
Countr
te
2003-2005;
theht
on,
es
i
nsi
intov
panelotal
e M
,
sade
a
perur
exi
howex
2005rgi
iod.
ting,totals tpans
V
ns
viving
ehe
124.4
-
-
117
-
54-
192.5
140.1
-
1078282
-
-33
147.4
134.6
177.7
-
253.7
al
"Newfi
andx
ion.
97.684.357.533.918.3
.075.252.1
.82.4
18.5
.29.
42.748.9
.076.1
78.62.7
ue
rms
porvalue
All
firs"ur
ts (
v
mstrvPof
didaded
anelx
-
-
60
-
28-
423232
-
-
-13
Ex
-
prA)
porar
64.6%50.7%43.8%29.9%17.6%
9.5%
8%39.0%27.1%
5%1.2%
72.8%
7.3%
2%7%.7%
16.8%19.3%
0%
58.1%
53.0%30.0%
70.1%31.0%
1.1%
% Tpans
not
oducorfoin
otal
trints
imrb
ion
ade2003
porgillions
in
andts
iven

y
rm # Fi % Fi s rm Fi Fi) (3 ) ( (10)
exp g, n y data 2003 - Dec 2005 in J 49,644 16,249 100%n 72,219 17,185 148%
iving F 33,771 10,473s. 19,679 6,177
itc onc 8% 1,182itc e 10,142 3,114
Avg. # m in 3 33.8
F 15,873 % 5,776i 15 14 16
T Fi t m i
table i f y it om porting im per ed berhat the in of the w even-num c g t perc hare ms
ty a lum heading. e into rv f hic 2003i s t Jan 0 not tr Dec 03).
s ir tr onth 1 rm ate.
s S o es ned
# in 16.0
ng F 38,448 % 6,71218.6
te
l B. F d imp g, n y data 2003 - Dec 2005 in J 37,248 % 11,747 100%
45,480 10,660 132%iving F 22,360 6,341
s. 10,708 3,019itc onc 7% 731itc e 2,591
Avg. # m in 32.3
14,888 5,406Avg. # m in 13.8
ng F 23,120 4,31916.4
te
rms
77%46%9%
21%
23%
ofwithandThe
71%
90%11%
70%36%
9%25%
30%
62%
84%17%
rms # Firms %8) (9)
100% 19,738106% 29,133
64% 15,10838% 9,169
7% 1,71719% 4,222
34.0
36% 4,63016 3
columns report the numof these firms of all firh traded in January
05, but not in Jan
Foreign-Ow
16.3
41% 14,02518.3
89%11%
100% 18,47991% 24,40254% 12,96526% 6,639
6% 1,63722% 4,689
33.0
46% 5,51414.4
37% 11,43718.1
79%20%
s %
ng
numberent sirms (w
aded in entry r
int Ventur
0
# Fi(7
port
Odd-heiving
hich the fi
J
iod.ivesu
s (wll as
Firm(6)
ng and I
nssfirm we
stic
100%236%
63%32%
9%22%
37
73
85%17%
00197%
40%10%5%
25%
60%
157%
67%34%
%
i
2005olumfirming, as
e
1
1
s
om Export
2003-ed
posenter
t+
ivate Dom
1
6
rm(5)
theber
omandade in
Pr
9,28621,931
5,8352,965
7942,076
33.2
3,4511515.1
16,09616.6
3,927,7481,579
41218798029.0
2,34711.0
6,16913.2
#
fr
over
B dec05),o tr
rms
ting
andDecill als
100%91%54%31%6%
17%
6%
7%
86%14%
0%86%48%21%5%
22%
52%
39%
78%22%
Fi(4)
and Exi
porhileAint w
ned
4
3
10
ry
iod,Panels
Ow
n
rms)
rm Ent
andper
3 butading in m
tate-
, Jan4,3713,9702,3551,368
25773033.3
2,016114.1
1,61517.5
, Ja3,0962,6701,475
63814469331.3
1,62112.9
1,19516.6
s
thl
e 12.
exend
nin
ms
thl
Firm(2)
mo100%145%
68%40%
20%
32%
abl
frthecoraded
that f
77%
88%13%
mo100%122%
60%29%
24%
40%
62%
80%21%
%
exandn thehich
irm
tin
rtin
s
and
ted i(w
obability
All F
or
,950
.7
615.6
17.6
o
,699,95332.4
13.5
16.4
# Fi(1
entrbeginningindica
firmt the pr
3
3
28
irm
sting
mics in
mics in
yna
e
n
nesinpe,, ex
repor
ate
yna
e
ate
xamadedhip2005)ow
rm dan 2003
c 2005rms
o only > onc
os.
smosos.
msg. # mos. in
ival R Ra
rm an 2003
2005rms
o only > onc
os.
sos.
msg. # mos. in
ival R Ra
pe
etr
nersber two r
. Fi
Dei
In all 36 mhh
irm# m
ir
Surv Entry
i
in Deci
In all 36 mhh
irm
ir
Surv Entry
rm T
iss towem
bottom
el Amsms iv
SwSw
tingA gAvg.
eriAv
onthlyonthly
nemsmsv
SwSw
iting F
iAv
onthlyonthly
Fi
ThfirmthatDec
PanFirFirSur
Exi
Ent
MM
PaFirFirSur
Ex
Enter
MM

Firm Type All Firms State-Owned Private Domestic Joint Ventures Foreign-Owned
# Trade Partners in Q1 03 4.5 8.6 5.3 4.3 3.7
% New Trade Partners 33.9% 40.1% 46.7% 34.0% 30.1%
Panel B. Importers' turnover of source countries
Table 13. Firms' Trade Partner Dynamics
This table examines the trade-partner dynamics of firms that traded during all 36 months in the 2003-2005 period.Panel A documents the average number of destination countries exporting firms sold to in the beginning of and in theend of the period. It also shows the percent of all trade partner relationships that were discontinued or initiated from t to t+1 as a share of the number of trade partners in period t , where a period is a month or a quarter as indicated inthe table. Panel B repeats the exercise for all importing firms and their source countries. The table explores the tradepartner dynamics for firms of different firm ownership structure, as indicated in the column heading.
Panel A. Exporters' turnover of export destinationsMonthly Data
# Trade Partners in Jan 03 3.4 6.4 3.8 3.1 2.9# Trade Partners in Dec 05 4.3 7.3 5.3 4.0 3.7
% Trade Partners Dropped 38.5% 40.7% 47.5% 37.6% 31.5%% New Trade Partners 39.4% 40.7% 48.8% 38.1% 32.6%
Quarterly Data
# Trade Partners in Q4 05 6.0 9.9 7.7 5.6 4.9
% Trade Partners Dropped 33.4% 40.3% 45.8% 34.0% 29.3%
Monthly Data
## Trade Partners in Jan 03 3.0 4.5 2.7 3.0 2.8# Trade Partners in Dec 05 3.4 4.4 2.9 3.3 3.4
% Trade Partners Dropped 32.7% 34.0% 39.7% 31.7% 26.7%% New Trade Partners 35.8% 34.2% 44.4% 33.5% 30.2%
Quarterly Data
# Trade Partners in Q1 03 3.4 5.3 3.1 3.4 3.3# Trade Partners in Q4 05 3.8 5.3 3.3 3.7 3.8
% Trade Partners Dropped 29.9% 35.9% 41.7% 30.7% 25.3%% New Trade Partners 31.3% 35.3% 44.6% 30.5% 27.6%

Table 14. Firms' Product Dynamics
This table examines the product dynamics of firms that traded during all 36 months in the 2003-2005 period.Panel A documents the number of products that firms stopped exporting or started exporting from month t to t+1 as a share of all products exported in month t . It also reports the average net monthly growth rate of firms' exportproduct intensity, as well as the average duration spell (in months) of an export product. The top half of Panel Astudies product churning in worldwide exports and focuses on products that firms export to at least onedestination. The bottom half of Panel A documents product churning in bilateral trade, i.e. destination bydestination. Panel B repeats the exercise for the product composition of all importing firms. The table exploresthe product dynamics for firms of different firm ownership structure, as indicated in the column heading.
Firm Type All Firms State-Owned Private Domestic Joint Ventures Foreign-Owned
Panel A. Exporters' product turnoverWorldwide Exports
% Exiting Products 29.4% 40.6% 37.2% 25.0% 21.6%% Entering Products 29.9% 40.7% 37.7% 25.5% 22.3%% Net Growth Rate 11.4% 12.7% 13.1% 10.2% 9.4%
Avg. # Months Traded 7.7 5.8 6.1 9.1 10.0
Bilateral Exports
% Exiting Products 44.4% 55.4% 54.9% 41.0% 35.8%% Entering Products 45.2% 55.7% 55.7% 41.9% 36.8%% Net Growth Rate 14.3% 21.2% 15.3% 10.3% 10.3%
Avg. # Months Traded 5.1 3.7 3.9 5.9 6.8
Panel B. Importers' product turnoverp pWorldwide Exports
% Exiting Products 34.8% 47.6% 39.9% 34.7% 32.9%% Entering Products 35.2% 47.5% 40.4% 35.1% 33.3%% Net Growth Rate 19.7% 21.5% 21.5% 18.1% 17.8%
Avg. # Months Traded 6.8 4.7 5.6 6.8 7.2
Bilateral Exports
% Exiting Products 39.0% 53.8% 45.6% 39.1% 36.7%% Entering Products 39.6% 53.8% 46.3% 39.6% 37.4%% Net Growth Rate 21.8% 28.7% 21.5% 19.2% 18.0%
Avg. # Months Traded 5.5 3.5 4.4 5.6 6.0
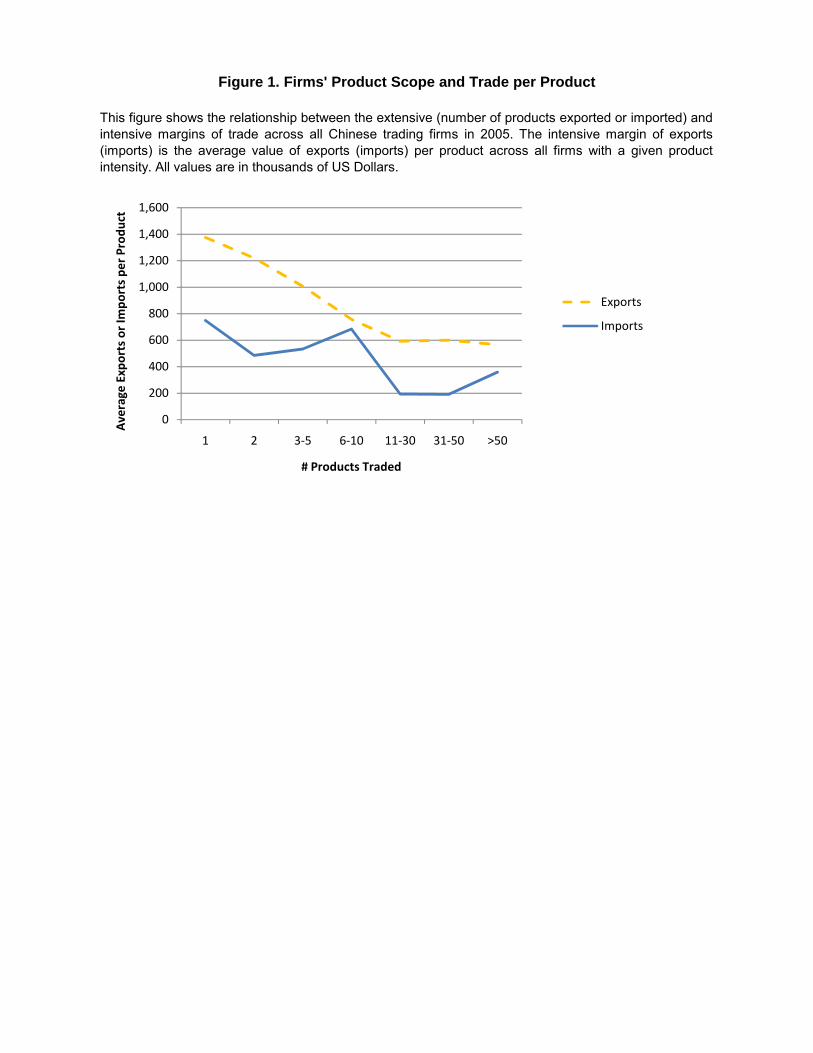
Figure 1. Firms' Product Scope and Trade per Product
intensive margins of trade across all Chinese trading firms in 2005. The intensive margin of exports(imports) is the average value of exports (imports) per product across all firms with a given productintensity. All values are in thousands of US Dollars.
This figure shows the relationship between the extensive (number of products exported or imported) and
0
200
400
1 2 3‐5 6‐10 11‐30 31‐50 >50
Average
Expor
# Products Traded
600
800
1,000
ts or Im
ports
1,200
1,400
1,600
per Prod
uct
Exports
Imports

This figure shows the relationship between the extensive (number of products exported) and intensivemargins of exports across Chinese exporters in 2005, by firm ownership type. The intensive margin of
Figure 2b. Importers' Product Scope and Trade per Product
0
500
1,000
1,500
2,000
0
500
1,000
1,500
1 2 3‐5 6‐10 11‐30 31‐50 >50
Average
Exports per
# Products Exported
State‐Owned
Prive Domestic
Joint Venture
Foreign‐Owned
This figure shows the relationship between the extensive (number of products imported) and intensivemargins of imports across Chinese importers in 2005, by firm ownership type. The intensive margin ofimports is the average value of imports per product across all firms with a given product intensity andownership structure. All values are in thousands of US Dollars. The series for state-owned firms isplotted on the right axis.
Figure 2a. Exporters' Product Scope and Trade per Product
exports is the average value of exports per product across all firms with a given product intensity andownership structure. All values are in thousands of US Dollars. The series for foreign owned firms isplotted on the right axis.
2,500
3,000
3,500
2,000
2,500
Prod
uct
0
500
1,000
1,500
0
500
1,000
1 2 3‐5 6‐10 11‐30 31‐50 >50
Average
Expor
# Products Exported
2,000
2,500
3,000
3,500
1,500
2,000
2,500
ts per Produ
ct
State‐Owned
Prive Domestic
Joint Venture
Foreign‐Owned
0
1,000
2,000
3,000
4,000
5,000
6,000
7,000
8,000
9,000
0
100
200
300
400
500
600
700
800
900
1 2 3‐5 6‐10 11‐30 31‐50 >50
Average
Impo
rts pe
r Prod
uct
# Products Imported
Private Domestic
Joint Venture
Foreign‐Owned
State‐Owned

countries) and intensive margins of trade across all Chinese trading firms in 2005. The intensive marginof exports (imports) is the average value of exports (imports) per trade partner across all firms with agiven trade partner intensity. All values are in thousands of US Dollars.
This figure shows the relationship between the extensive (number of export destinations or source
Figure 3. Firms' Number of Trade Partners and Trade per Country
0
5000
10000
0
200
400
1 2 3‐5 6‐10 11‐30 31‐50 >50
Average
Expor
# Trade Partners
15000
20000
600
800
1,000
ts or Im
ports pe
r
25000
30000
35000
1,200
1,400
1,600
Cou
ntry
Exports
Imports

Figure 4a. Exporters' Destinations and Trade per Trade Partner
This figure shows the relationship between the extensive (number of products exported) and intensivemargins of exports across Chinese exporters in 2005, by firm ownership type. The intensive margin ofexports is the average value of exports per country across all firms with a given trade partner intensityand ownership structure. All values are in thousands of US Dollars. The series for foreign owned firms isplotted on the right axis.
Figure 4b. Importers' Source Countries and Trade per Trade Partner
This figure shows the relationship between the extensive (number of products imported) and intensive
0
500
1,000
1,500
2,000
2,500
3,000
3,500
4,000
4,500
5,000
0
200
400
600
800
1,000
1,200
1,400
1,600
1,800
1 2 3‐5 6‐10 11‐30 31‐50 >50
Average
Exports per Destina
tion
# Export Destinations
State‐Owned
Prive Domestic
Joint Venture
Foreign‐Owned
This figure shows the relationship between the extensive (number of products imported) and intensivemargins of imports across Chinese importers in 2005, by firm ownership type. The intensive margin ofimports is the average value of imports per country across all firms with a given trade partner intensityand ownership structure. All values are in thousands of US Dollars. The series for private domestic firmsis plotted on the right axis. Data for firms importing from more than 50 countries is only shown for stateenterprises because there are less than four such firms with each of the other three ownership types.
0
500
1,000
1,500
2,000
2,500
3,000
3,500
4,000
4,500
5,000
0
200
400
600
800
1,000
1,200
1,400
1,600
1,800
1 2 3‐5 6‐10 11‐30 31‐50 >50
Average
Exports per Destina
tion
# Export Destinations
State‐Owned
Prive Domestic
Joint Venture
Foreign‐Owned
0
500
1,000
1,500
2,000
2,500
0
5,000
10,000
15,000
20,000
25,000
30,000
35,000
40,000
45,000
1 2 3‐5 6‐10 11‐30 31‐50 >50
Average
Impo
rts pe
r Source Cou
ntry
# Source Countries
State‐Owned
Joint Venture
Foreign‐Owned
Private Domestic

Firm Type
# Firms % Firms # Firms % Firms # Firms % Firms # Firms %(1) (2) (3) (4) (5) (6) (7) (
Panel A. Firm dynamics in exporting, quarterly data, Q1 2003 - Q4 2005Firms in Q1 2003 59,478 100% 5,280 100% 11,860 100% 19,086Firms in Q4 2005 83,698 141% 4,744 90% 26,555 224% 19,601Surviving Firms 42,207 71% 3,000 57% 7,870 66% 12,945
In all 12 quarters 36,508 61% 2,471 47% 6,477 55% 11,215Switch only once 2,542 4% 208 4% 649 5% 778Switch > once 3,157 5% 321 6% 744 6% 952Avg. # quarters in 11.7 11.5 11.6 11.7
Exiting Firms 17,271 29% 2,280 43% 3,990 34% 6,141Avg. # quarters in 5.5 5.2 5.3 5.6
Appendix Table 1. Firm Entry and Exit from Exporting and Importing (QuartThis table examines firm entry and exit from exporting and importing over the 2003-2005 period. Odd-num he numfirms that trade in the beginning and in the end of the period, while even-numbered columns give the percent all firmthat ownership type, as indicated in the column heading. Panels A and B decompose firms into surviving firm 20032005), exiting firms (which traded in Q1 03 but not in Q4 05), and entering firms (which traded in Q4 05, but twreport the probability that firms trading in quarter t will also trade in t+1 , as well as the firm entry rate.
All Firms State-Owned Private Domestic Joint Ventur Ow
Avg. # quarters in 5.5 5.2 5.3 5.6 7
Entering Firms 41,491 70% 1,744 33% 18,685 158% 6,656Avg. # quarters in 6.3 6.3 6.2 6.5
Quarterly Survival Rate 92% 88% 89%Quarterly Entry Rate 11% 11% 17%
Panel B. Firm dynamics in importing, quarterly data, Q1 2003 - Q4 2005Firms in Q1 2003 49,121 100% 4,044 100% 6,161 100% 15,389Firms in Q4 2005 57,643 117% 3,496 86% 11,234 182% 13,703Surviving Firms 30,841 63% 2,132 53% 2,667 43% 8,842
In all 12 quarters 23,879 49% 1,515 37% 1,594 26% 6,709Switch only once 2,506 5% 208 5% 328 5% 774Switch > once 4,456 9% 409 10% 745 12% 1,359Avg. # quarters in 11.3 11.1 10.7 11.3
Exiting Firms 18,280 37% 1,912 47% 3,494 57% 6,547Avg. # quarters in 4.9 4.9 4.3 5.0
Entering Firms 26,802 55% 1,364 34% 8,567 139% 4,861Avg. # quarters in 6.0 6.0 5.1 6.0
Quarterly Survival Rate 83% 81% 72%Quarterly Entry Rate 18% 18% 32%
Firms10)
100%141%79%70%
4%5%
21%
ber ofs with
and Q4o rows
ned
62%
94%9%
100%124%73%60%
5%8%
27%
51%
88%14%
% Firms # Firms(8) (9)
100% 23,252103% 32,79868% 18,39259% 16,345
4% 9075% 1,140
11.7
32% 4,8605.7
erly Data)bered columns report tshare of these firms ofs (which traded in Q1not in Q1 03). The bottom
es Foreign-
5.
35% 14,4066.4
92%8%
100% 23,52789% 29,21057% 17,20044% 14,061
5% 1,1969% 1,943
11.5
43% 6,3275.2
32% 12,0106.6
83%16%