Embed Size (px)
Citation preview
Tariffs on Imports from China:
The Estimated Impacts on the U.S. Economy
Prepared for
Consumer Technology Association
and
National Retail Federation
April 30, 2018
TRADE PARTNERSHIP WORLDWIDE, LLC
1701 K Street, NW • WASHINGTON, DC • 20006 202-347-1041 • 202-628-0669 (FAX)
Tariffs on Imports from China: The Estimated Impacts on the U.S. Economy
Joseph F. Francois and Laura M. Baughman*
Summary
In response to a Section 301 investigation finding that China’s intellectual property rights (IPR), forced technology transfers and innovation practices are harming U.S. companies, the Trump Administration is considering the imposition of tariffs of 25 percent on U.S. imports of selected products from China. China has responded with threats to impose tariffs of 25 percent on imports from the United States of selected products. The president then asked his administration to consider imposing additional duties totaling $100 billion on an unspecified list of products imported from China. China answered it would respond (presumably in kind) should the United States go forward with those tariffs.
This study estimates the economic impact of the proposed U.S. tariffs and China’s proposed retaliation in three different scenarios: (1) U.S. tariffs alone on $50 billion in goods imported from China, (2) U.S. tariffs on $50 billion in imports plus Chinese retaliation of $50 billion of U.S. goods exported to China, and (3) U.S. tariffs plus Chinese retaliation plus another $100 billion in U.S. and Chinese duties. We find, for the scenario we deem most probable (2), that the imposition by the United States of 25 percent tariffs on imports of selected products from China, coupled with promised retaliation by China, would have significant net negative impacts on the U.S. economy and U.S. employment, particularly over the one to two years after application.
• The U.S. tariffs and follow-‐on retaliation by China would hurt U.S. farmers, factory workers, and workers in construction and services sectors. Farmers would see a “hit” of 6.7 percent to their net incomes, and jobs in the sector would drop by over 67,000. Manufacturing employment would rise in some sectors, but fall in others; net jobs would drop by nearly 11,000. For employment as a whole, more than four jobs would be lost for every one gained, with the gains in metals and machinery coming at the expense of agriculture, transportation equipment, and services.
• Overall, U.S. output would decline by nearly $3 billion, and nearly 134,000 workers would lose jobs, most of them less-‐skilled workers.
______________________________ * Dr. Joseph Francois is Managing Director of Trade Partnership Worldwide, LLC, and Professor of Economics, University of Bern, Department of Economics and Managing Director, World Trade Institute. He also holds numerous research fellowships and professorships at think tanks and universities around the world. Dr. Francois formerly was the head of the Office of Economics at the U.S. International Trade Commission, and a research economist at the World Trade Organization. Dr. Francois holds a PhD in economics from the University of Maryland, and economics degrees from the University of Virginia. Laura M. Baughman is President of Trade Partnership Worldwide, LLC (TPW, www.tradepartnership.com). She holds degrees in economics from Columbia and Georgetown Universities.
2
• Tariffs plus retaliation will hurt every state, including those in the so-‐called “Rust Belt.”
If the tariff wars escalate to our third scenario (imposition of an additional $100 billion in tariffs by both countries), we find that:
• The “hit” to U.S. farmers would more than double. Farmer income would drop by 15 percent; jobs in the sector would decline by nearly 181,000. While manufacturing as a whole would gain as production that would otherwise occur in China and other countries returns to the United States, some manufacturing sectors would see output and employment declines. The job losses in agriculture would overwhelm any net gains to manufacturing.
• Overall, U.S. output would decline by $49 billion, and nearly 455,000 workers would lose jobs, most of them less-‐skilled workers.
3
1. Introduction
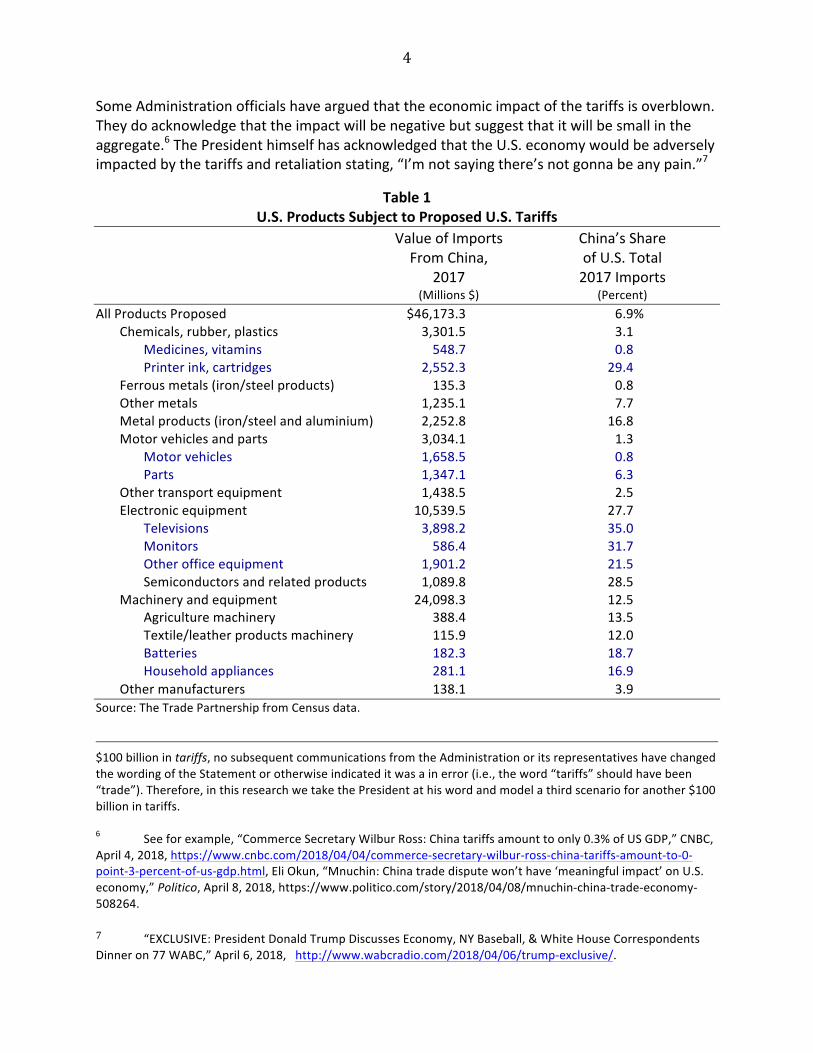
On March 22, 2018, the Office of the U.S. Trade Representative (USTR) issued a report that found certain acts, policies or practices of the Chinese government relating to technology transfer, intellectual property and innovation were adversely impacting U.S. companies.1 In response to that report, President Donald Trump instructed USTR to, among other actions, develop and publish a list of $50 billion of products imported from China upon which the United States could assess 25 percent duties.2 USTR published a list of about 1,300 products on April 3, stating that the government attempted to select products, “with the lowest consumer impact”3. In fact, more than one-‐quarter of the products on the Administration’s proposed tariff list are consumer goods (see Table 1; selected consumer goods are in blue).4
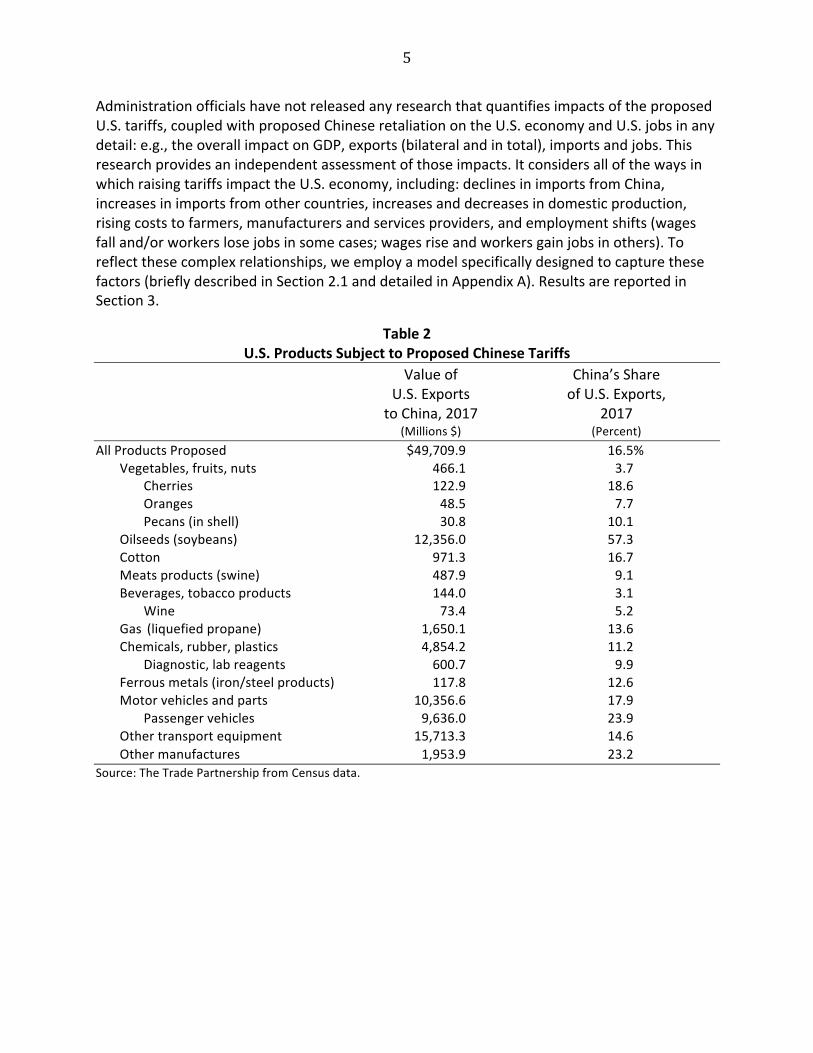
Within hours of publication, China responded with a retaliation tariff list of nearly $50 billion worth of U.S. exports. The Chinese list is comprised of 108 categories of products that would be subject to a 25 percent Chinese tariff should the United States moves forward with its tariffs. (see Table 2)
The back and forth did not end here, however. On April 5 the White House issued a statement from the President stating that he had instructed USTR to “consider whether $100 billion of additional tariffs would be appropriate under section 301 and, if so, to identify the products upon which to impose such tariffs.”5 China’s Ministry of Commerce responded immediately that it would “fight back resolutely.”
1 Office of the United States Trade Representative, Executive Office of the President, “Findings of the Investigation into China’s Acts, Policies, and Practices Related to Technology Transfer. Intellectual Property, and Innovation Under Section 301 of the Trade Act of 1974,” March 22, 2018, https://ustr.gov/sites/default/files/Section%20301%20FINAL.PDF. 2 “President Trump Announces Strong Actions to Address China’s Unfair Trade,” March 22, 2018, https://ustr.gov/about-‐us/policy-‐offices/press-‐office/press-‐releases/2018/march/president-‐trump-‐announces-‐strong. 3 Office of the United States Trade Representative, “Notice of Determination and Request for Public Comment Concerning Proposed Determination of Action Pursuant to Section 301: China’s Acts, Policies, and Practices Related to Technology Transfer, Intellectual Property, and Innovation,” Federal Register, 83 FR 14906, April 6, 2018, p. 8, https://www.federalregister.gov/documents/2018/04/06/2018-‐07119/notice-‐of-‐determination-‐and-‐request-‐for-‐public-‐comment-‐concerning-‐proposed-‐determination-‐of-‐action. 4 In research issued earlier in April, Trade Partnership Worldwide estimated the impacts on consumers of four consumer products on the proposed list: televisions, monitors, batteries and ink cartridges. We found that the tariffs would significantly increase the costs to consumers of imports from China. Moreover, in the cases of televisions and monitors in particular, it is not easy for importers to shift sourcing to other suppliers because the products made in China are quite different than those made in China. Therefore, consumer prices for these products will be impacted by the tariffs. See Trade Partnership Worldwide, LLC, “Estimated Impacts of Proposed Tariffs on Imports From China: Televisions, Monitors, Batteries and Printer Cartridges,” April 11, 2018. 5 The White House, Office of the Press Secretary, “Statement from President Donald J. Trump on Additional Proposed Section 301 Remedies,” April 5, 2018, https://www.whitehouse.gov/briefings-‐statements/statement-‐president-‐donald-‐j-‐trump-‐additional-‐proposed-‐section-‐301-‐remedies/. While most media reports of this action state that Trump asked for consideration of tariffs on an additional $100 billion in trade, rather than an additional
4
Some Administration officials have argued that the economic impact of the tariffs is overblown. They do acknowledge that the impact will be negative but suggest that it will be small in the aggregate.6 The President himself has acknowledged that the U.S. economy would be adversely impacted by the tariffs and retaliation stating, “I’m not saying there’s not gonna be any pain.”7
Table 1 U.S. Products Subject to Proposed U.S. Tariffs
Value of Imports China’s Share From China, of U.S. Total 2017 2017 Imports (Millions $) (Percent) All Products Proposed $46,173.3 6.9% Chemicals, rubber, plastics 3,301.5 3.1 Medicines, vitamins 548.7 0.8 Printer ink, cartridges 2,552.3 29.4 Ferrous metals (iron/steel products) 135.3 0.8 Other metals 1,235.1 7.7 Metal products (iron/steel and aluminium) 2,252.8 16.8 Motor vehicles and parts 3,034.1 1.3 Motor vehicles 1,658.5 0.8 Parts 1,347.1 6.3 Other transport equipment 1,438.5 2.5 Electronic equipment 10,539.5 27.7 Televisions 3,898.2 35.0 Monitors 586.4 31.7 Other office equipment 1,901.2 21.5 Semiconductors and related products 1,089.8 28.5 Machinery and equipment 24,098.3 12.5 Agriculture machinery 388.4 13.5 Textile/leather products machinery 115.9 12.0 Batteries 182.3 18.7 Household appliances 281.1 16.9 Other manufacturers 138.1 3.9 Source: The Trade Partnership from Census data.
$100 billion in tariffs, no subsequent communications from the Administration or its representatives have changed the wording of the Statement or otherwise indicated it was a in error (i.e., the word “tariffs” should have been “trade”). Therefore, in this research we take the President at his word and model a third scenario for another $100 billion in tariffs. 6 See for example, “Commerce Secretary Wilbur Ross: China tariffs amount to only 0.3% of US GDP,” CNBC, April 4, 2018, https://www.cnbc.com/2018/04/04/commerce-‐secretary-‐wilbur-‐ross-‐china-‐tariffs-‐amount-‐to-‐0-‐point-‐3-‐percent-‐of-‐us-‐gdp.html, Eli Okun, “Mnuchin: China trade dispute won’t have ‘meaningful impact’ on U.S. economy,” Politico, April 8, 2018, https://www.politico.com/story/2018/04/08/mnuchin-‐china-‐trade-‐economy-‐508264. 7 “EXCLUSIVE: President Donald Trump Discusses Economy, NY Baseball, & White House Correspondents Dinner on 77 WABC,” April 6, 2018, http://www.wabcradio.com/2018/04/06/trump-‐exclusive/.
5
Administration officials have not released any research that quantifies impacts of the proposed U.S. tariffs, coupled with proposed Chinese retaliation on the U.S. economy and U.S. jobs in any detail: e.g., the overall impact on GDP, exports (bilateral and in total), imports and jobs. This research provides an independent assessment of those impacts. It considers all of the ways in which raising tariffs impact the U.S. economy, including: declines in imports from China, increases in imports from other countries, increases and decreases in domestic production, rising costs to farmers, manufacturers and services providers, and employment shifts (wages fall and/or workers lose jobs in some cases; wages rise and workers gain jobs in others). To reflect these complex relationships, we employ a model specifically designed to capture these factors (briefly described in Section 2.1 and detailed in Appendix A). Results are reported in Section 3.
Table 2 U.S. Products Subject to Proposed Chinese Tariffs
Value of China’s Share U.S. Exports of U.S. Exports, to China, 2017 2017 (Millions $) (Percent) All Products Proposed $49,709.9 16.5% Vegetables, fruits, nuts 466.1 3.7 Cherries 122.9 18.6 Oranges 48.5 7.7 Pecans (in shell) 30.8 10.1 Oilseeds (soybeans) 12,356.0 57.3 Cotton 971.3 16.7 Meats products (swine) 487.9 9.1 Beverages, tobacco products 144.0 3.1 Wine 73.4 5.2 Gas (liquefied propane) 1,650.1 13.6 Chemicals, rubber, plastics 4,854.2 11.2 Diagnostic, lab reagents 600.7 9.9 Ferrous metals (iron/steel products) 117.8 12.6 Motor vehicles and parts 10,356.6 17.9 Passenger vehicles 9,636.0 23.9 Other transport equipment 15,713.3 14.6 Other manufactures 1,953.9 23.2 Source: The Trade Partnership from Census data.
6
2. Methodology
This section briefly summarizes the model used for analysis; a detailed description of our approach is provided in Appendix A. Also described are the assessment scenarios for potential impacts of U.S. and Chinese retaliatory tariffs.
2.1 The model
We base our analysis on the Global Trade Analysis Project (GTAP) database and its related “computable general equilibrium” (CGE) model. The GTAP database reports data for international trade and national inter-‐industry relationships and national income accounts, as well as tariffs, some nontariff barriers and other taxes, for 140 countries and regions. Our model incorporates the GTAPv10 database; we have further updated the data from the 2014 benchmark year to better reflect the U.S. economy in 2016, our base year for analysis. [We have not included in our baseline recent changes to U.S. and Chinese tariffs from the steel and aluminum Section 232 investigations because, at this writing, the status of those tariffs remains in flux. On May 1 (or thereafter), one or more countries may be exempted from the tariffs, and a process is in play to exclude individual steel and aluminum products from their scope. Picking one coverage option to include in our baseline analysis would be arbitrary. Effects from the final set of Section 232-‐related tariffs would be on top of those discussed here.]
The CGE model enables us to see how the imposition of tariffs affects supply chains and the locations where goods are produced. This mix of supply chain and location effects in turn drive changes in productivity, new investment, and the prices paid by consumers. In some instances, U.S. production and related employment may increase; in others, they will decline. These changes will also affect consumers, even if the product on which a tariff is assessed is not purchased in a retail store. For example, when the price of a good (parts or finished goods) or service increases because a tariff is imposed,8 consumers (be they manufacturers or households) buy less, firms make less still, and workers lose jobs or see their wages decline. Less spending by consumers (and producers) reverberates throughout the economy, with reduced sales and employment impacts on supplier industries and reduced spending by families and individuals on nights out at restaurants or movie theaters, for example. Lower spending on these services can trigger job losses in those sectors as well.
As noted above, the base year for our analysis is 2016, the most recent year for which detailed state-‐level employment and output data are available from the Bureau of Economic Analysis. We compare the actual U.S. economy and employment in a base year (2016) to the same 2016 economy after the United States assesses new (Section 301) tariffs on selected imports from China, and China assesses new retaliatory tariffs on selected U.S. exports to China. We focus on the short-‐term (one to two years after imposition of the duties).
Also considered are the impacts of the tariffs on the U.S. workforce in the short-‐run, i.e., the first year or two of their imposition. To do this, wages are treated as only somewhat “sticky” 8 See U.S. International Trade Commission, The Economic Effect of Significant U.S. Import Restraints: Ninth Update 2017, Inv. No. 332-‐325, Pub. No. 4726, Chapter 3, https://www.usitc.gov/publications/332/pub4726c.pdf for an excellent assessment of how imported services increasingly incorporate the value of U.S. tariffs on goods.
7
but with tight labor markets. This is meant to reflect current conditions and means that changes in demand for labor (positive or negative) are reflected in part by changes in employment, and in part by changes in wages. In the longer term (i.e., should the tariffs remain in effect ten years and longer), the labor impact would more appropriately be felt entirely by wage changes rather than employment changes. The approach followed reflects the growing, but still not complete, tightness in labor supply in the U.S. market in the shorter term. We examine the employment impacts on workers in different occupation/skill categories in the United States. Employment impact estimates are net, taking into account potential increases as well as decreases in employment as demand increases in some cases for U.S. products, and declines in others.
2.2 Scenarios
Three scenarios are considered:
(1) U.S. application of the 25 percent tariffs on selected imports of $50 billion in goods imported from China shown in Table 1;
(2) Application of tariffs in Table 1 plus application of the Chinese retaliatory tariffs on $50
billion in U.S. exports to China shown in Table 2, and (3) Scenario (2) plus the impacts of additional U.S. tariffs totaling $100 billion on imports
from China plus additional Chinese tariffs totaling $100 billion on imports from the United States.
3. Results
This section summarizes the results for national level effects (section 3.1), and state-‐level effects (section 3.2).
3.1 U.S. national level results
As shown in Table 3, U.S. tariffs on selected imports from China would have a negative impact on the United States; coupled with Chinese tariffs on an equal value of selected imports from the United States, which impact would increase substantially. Table 4 presents more detailed, by sector, employment impacts of the three tariff scenarios.
For all three scenarios, some sectors and workers gain from the tariffs; while others lose. More lose than gain. Particularly noteworthy is the “hit” to agriculture, both regarding farm property income (net farm-‐land income above labor and input costs) and employment. While some manufacturing sectors benefit from increased domestic output due to reduced imports from China, other manufacturing sectors lose, and services sectors lose overall as well. In short, the tariffs benefit some politically important manufacturing sectors, but at the expense of other politically important sectors, with a net negative impact on the economy, both in terms of output and jobs.
8
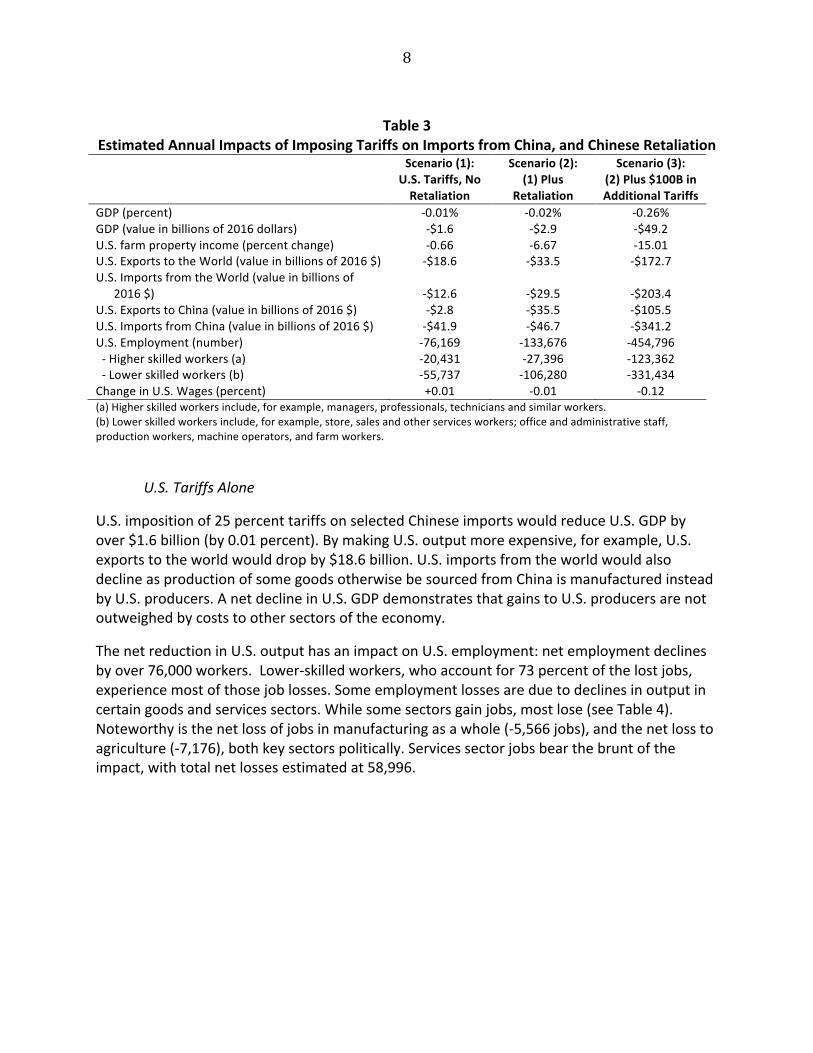
Table 3
Estimated Annual Impacts of Imposing Tariffs on Imports from China, and Chinese Retaliation Scenario (1):
U.S. Tariffs, No Retaliation
Scenario (2): (1) Plus
Retaliation
Scenario (3): (2) Plus $100B in Additional Tariffs
GDP (percent) -‐0.01% -‐0.02% -‐0.26% GDP (value in billions of 2016 dollars) -‐$1.6 -‐$2.9 -‐$49.2 U.S. farm property income (percent change) -‐0.66 -‐6.67 -‐15.01 U.S. Exports to the World (value in billions of 2016 $) -‐$18.6 -‐$33.5 -‐$172.7 U.S. Imports from the World (value in billions of 2016 $)
-‐$12.6
-‐$29.5
-‐$203.4
U.S. Exports to China (value in billions of 2016 $) -‐$2.8 -‐$35.5 -‐$105.5 U.S. Imports from China (value in billions of 2016 $) -‐$41.9 -‐$46.7 -‐$341.2 U.S. Employment (number) -‐76,169 -‐133,676 -‐454,796 -‐ Higher skilled workers (a) -‐20,431 -‐27,396 -‐123,362 -‐ Lower skilled workers (b) -‐55,737 -‐106,280 -‐331,434 Change in U.S. Wages (percent) +0.01 -‐0.01 -‐0.12 (a) Higher skilled workers include, for example, managers, professionals, technicians and similar workers. (b) Lower skilled workers include, for example, store, sales and other services workers; office and administrative staff, production workers, machine operators, and farm workers.
U.S. Tariffs Alone
U.S. imposition of 25 percent tariffs on selected Chinese imports would reduce U.S. GDP by over $1.6 billion (by 0.01 percent). By making U.S. output more expensive, for example, U.S. exports to the world would drop by $18.6 billion. U.S. imports from the world would also decline as production of some goods otherwise be sourced from China is manufactured instead by U.S. producers. A net decline in U.S. GDP demonstrates that gains to U.S. producers are not outweighed by costs to other sectors of the economy.
The net reduction in U.S. output has an impact on U.S. employment: net employment declines by over 76,000 workers. Lower-‐skilled workers, who account for 73 percent of the lost jobs, experience most of those job losses. Some employment losses are due to declines in output in certain goods and services sectors. While some sectors gain jobs, most lose (see Table 4). Noteworthy is the net loss of jobs in manufacturing as a whole (-‐5,566 jobs), and the net loss to agriculture (-‐7,176), both key sectors politically. Services sector jobs bear the brunt of the impact, with total net losses estimated at 58,996.
9
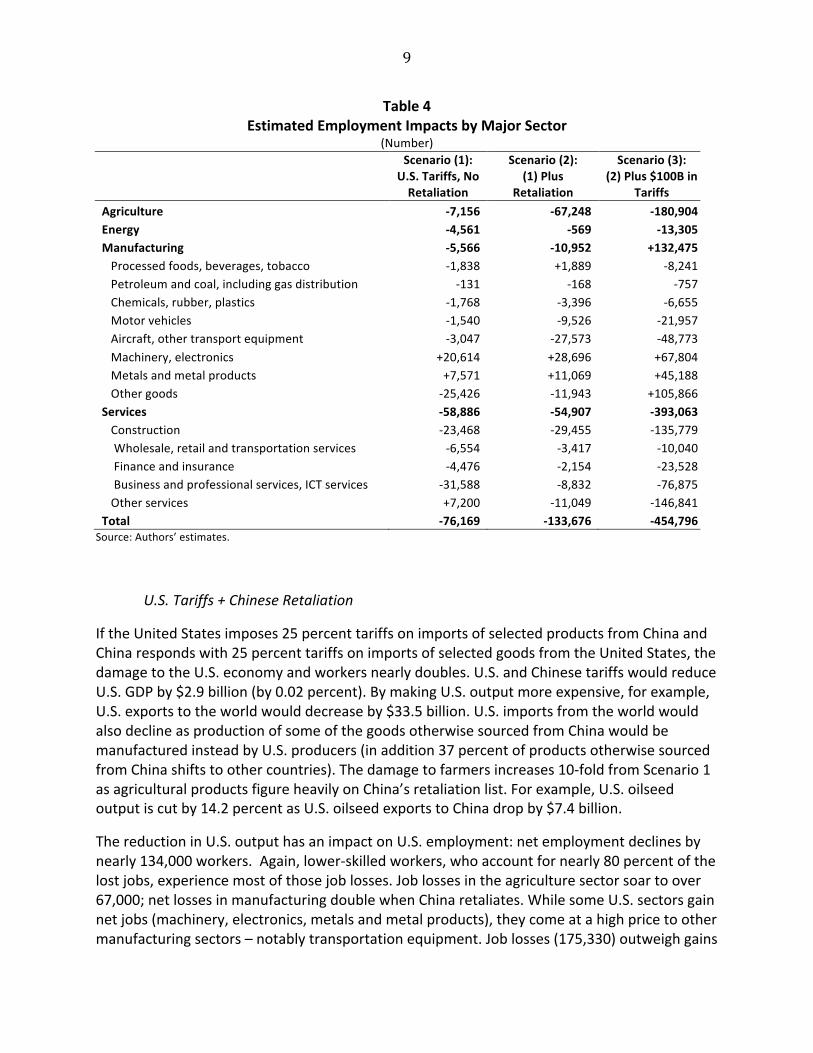
Table 4 Estimated Employment Impacts by Major Sector
(Number)
Scenario (1): U.S. Tariffs, No Retaliation
Scenario (2): (1) Plus
Retaliation
Scenario (3): (2) Plus $100B in
Tariffs Agriculture -‐7,156 -‐67,248 -‐180,904 Energy -‐4,561 -‐569 -‐13,305 Manufacturing -‐5,566 -‐10,952 +132,475 Processed foods, beverages, tobacco -‐1,838 +1,889 -‐8,241 Petroleum and coal, including gas distribution -‐131 -‐168 -‐757 Chemicals, rubber, plastics -‐1,768 -‐3,396 -‐6,655 Motor vehicles -‐1,540 -‐9,526 -‐21,957 Aircraft, other transport equipment -‐3,047 -‐27,573 -‐48,773 Machinery, electronics +20,614 +28,696 +67,804 Metals and metal products +7,571 +11,069 +45,188 Other goods -‐25,426 -‐11,943 +105,866 Services -‐58,886 -‐54,907 -‐393,063 Construction -‐23,468 -‐29,455 -‐135,779 Wholesale, retail and transportation services -‐6,554 -‐3,417 -‐10,040 Finance and insurance -‐4,476 -‐2,154 -‐23,528 Business and professional services, ICT services -‐31,588 -‐8,832 -‐76,875 Other services +7,200 -‐11,049 -‐146,841 Total -‐76,169 -‐133,676 -‐454,796
Source: Authors’ estimates.
U.S. Tariffs + Chinese Retaliation
If the United States imposes 25 percent tariffs on imports of selected products from China and China responds with 25 percent tariffs on imports of selected goods from the United States, the damage to the U.S. economy and workers nearly doubles. U.S. and Chinese tariffs would reduce U.S. GDP by $2.9 billion (by 0.02 percent). By making U.S. output more expensive, for example, U.S. exports to the world would decrease by $33.5 billion. U.S. imports from the world would also decline as production of some of the goods otherwise sourced from China would be manufactured instead by U.S. producers (in addition 37 percent of products otherwise sourced from China shifts to other countries). The damage to farmers increases 10-‐fold from Scenario 1 as agricultural products figure heavily on China’s retaliation list. For example, U.S. oilseed output is cut by 14.2 percent as U.S. oilseed exports to China drop by $7.4 billion.
The reduction in U.S. output has an impact on U.S. employment: net employment declines by nearly 134,000 workers. Again, lower-‐skilled workers, who account for nearly 80 percent of the lost jobs, experience most of those job losses. Job losses in the agriculture sector soar to over 67,000; net losses in manufacturing double when China retaliates. While some U.S. sectors gain net jobs (machinery, electronics, metals and metal products), they come at a high price to other manufacturing sectors – notably transportation equipment. Job losses (175,330) outweigh gains
10
(41,654) by a factor of more than four to one. [Section 3.2 reports the breakdown of these job impacts down by state.]
U.S. Tariffs + Chinese Retaliation + $100 Billion in Additional Tariffs
Escalation of tariffs and counter-‐tariff imposition envisioned in Scenario 3 would come at huge cost to the U.S. economy, multiplying the damage from Scenario 2 17-‐fold. U.S. and Chinese imposition of an additional $100 billion in tariffs would reduce U.S. GDP by over $49 billion (by 0.26 percent and would cut U.S. exports to the world by $173 billion. U.S. imports from the world would decline to the disadvantage of U.S. consumers and manufacturers who need competitively priced imports as inputs to U.S. production. The negative impact on farmers would more than double from the 25 percent tariff plus retaliation scenario.
Net U.S. employment would drop by nearly 455,000 jobs. Again, lower-‐skilled workers would pay a disproportionate price, accounting for 73 percent of the lost jobs. Net U.S. manufacturing employment overall increases as production that would otherwise have gone to make goods imported from China is brought back to the United States; however, the manufacturing employment increase is more than outweighed by losses to agriculture and services. Even within manufacturing, net job losses occur: in food and beverage products, chemicals and transportation equipment, for example.
11
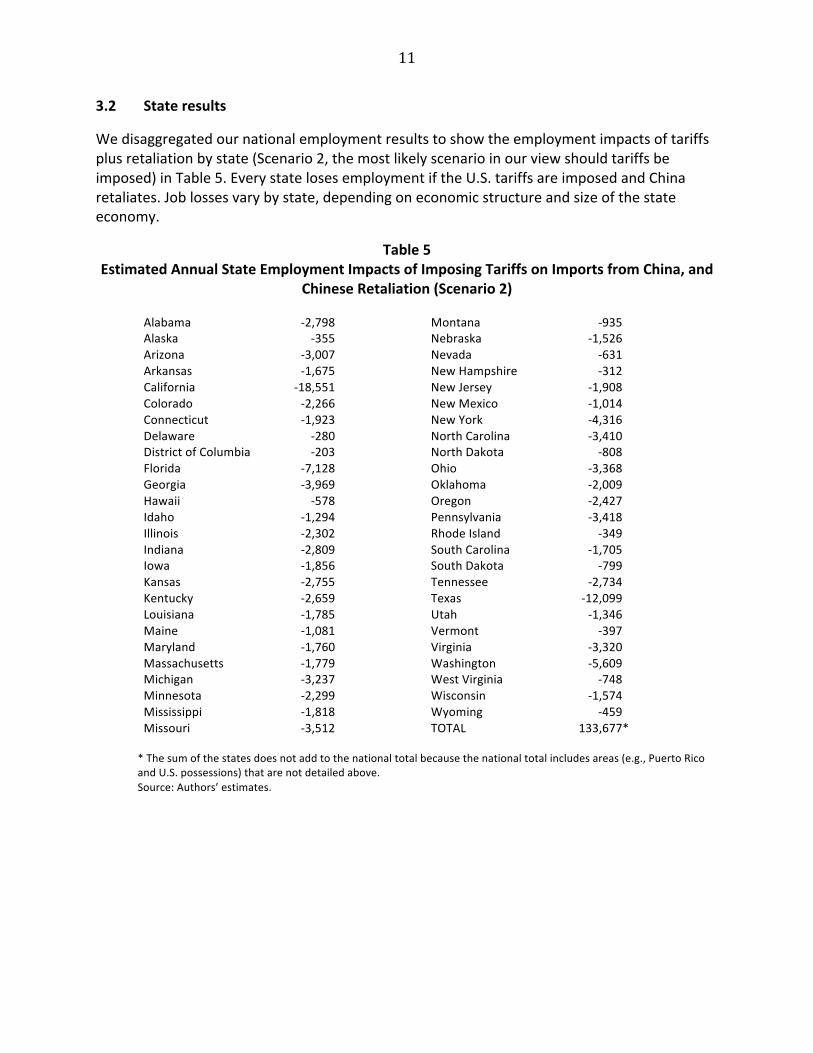
3.2 State results
We disaggregated our national employment results to show the employment impacts of tariffs plus retaliation by state (Scenario 2, the most likely scenario in our view should tariffs be imposed) in Table 5. Every state loses employment if the U.S. tariffs are imposed and China retaliates. Job losses vary by state, depending on economic structure and size of the state economy.
Table 5 Estimated Annual State Employment Impacts of Imposing Tariffs on Imports from China, and
Chinese Retaliation (Scenario 2)
Alabama -‐2,798 Montana -‐935 Alaska -‐355 Nebraska -‐1,526 Arizona -‐3,007 Nevada -‐631 Arkansas -‐1,675 New Hampshire -‐312 California -‐18,551 New Jersey -‐1,908 Colorado -‐2,266 New Mexico -‐1,014 Connecticut -‐1,923 New York -‐4,316 Delaware -‐280 North Carolina -‐3,410 District of Columbia -‐203 North Dakota -‐808 Florida -‐7,128 Ohio -‐3,368 Georgia -‐3,969 Oklahoma -‐2,009 Hawaii -‐578 Oregon -‐2,427 Idaho -‐1,294 Pennsylvania -‐3,418 Illinois -‐2,302 Rhode Island -‐349 Indiana -‐2,809 South Carolina -‐1,705 Iowa -‐1,856 South Dakota -‐799 Kansas -‐2,755 Tennessee -‐2,734 Kentucky -‐2,659 Texas -‐12,099 Louisiana -‐1,785 Utah -‐1,346 Maine -‐1,081 Vermont -‐397 Maryland -‐1,760 Virginia -‐3,320 Massachusetts -‐1,779 Washington -‐5,609 Michigan -‐3,237 West Virginia -‐748 Minnesota -‐2,299 Wisconsin -‐1,574 Mississippi -‐1,818 Wyoming -‐459 Missouri -‐3,512 TOTAL 133,677*
* The sum of the states does not add to the national total because the national total includes areas (e.g., Puerto Rico and U.S. possessions) that are not detailed above. Source: Authors’ estimates.
12
4. Conclusions The proposed tariffs on U.S. imports of selected products, coupled with retaliation by China, would have significant net negative impacts on the U.S. economy and U.S. workers. These impacts would be felt in nearly every sector, and in every U.S. state. 5. References Dür, A., Baccini, L., & Elsig, M. (2014). The design of international trade agreements: Introducing a new dataset. The Review of International Organizations, 9(3), 353-‐375, http://eprints.lse.ac.uk/59179/1/__lse.ac.uk_storage_LIBRARY_Secondary_libfile_shared_repository_Content_Baccini,%20L_Design%20of%20international%20trade_Baccini_Design%20of%20international%20trade_2015.pdf. Egger, Peter, Joseph Francois, Miriam Manchin and Douglas Nelson (July 2015). “Non-‐tariff barriers, integration and the transatlantic economy,” Economic Policy: 539-‐584, https://academic.oup.com/economicpolicy/article/30/83/539/2392366. Walmsley, Terrie and Caitlyn Carrico (June 2016). “Chapter 12B: Disaggregating Labor Payments,” in Aguiar, Angel, Badri Narayanan, & Robert McDougall. "An Overview of the GTAP 9 Data Base." Journal of Global Economic Analysis 1, no. 1 (June 3, 2016): 181-‐208, https://www.gtap.agecon.purdue.edu/databases/v9/v9_doco.asp.
13
Appendix A: Methodology In Detail
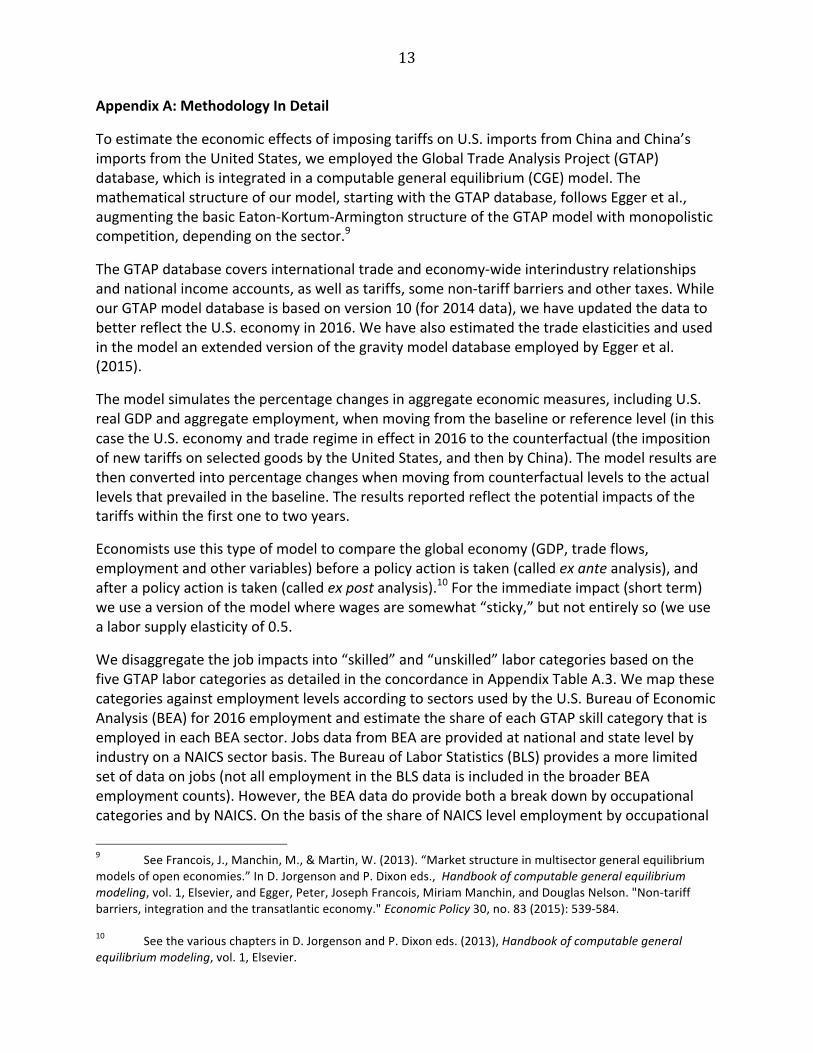
To estimate the economic effects of imposing tariffs on U.S. imports from China and China’s imports from the United States, we employed the Global Trade Analysis Project (GTAP) database, which is integrated in a computable general equilibrium (CGE) model. The mathematical structure of our model, starting with the GTAP database, follows Egger et al., augmenting the basic Eaton-‐Kortum-‐Armington structure of the GTAP model with monopolistic competition, depending on the sector.9
The GTAP database covers international trade and economy-‐wide interindustry relationships and national income accounts, as well as tariffs, some non-‐tariff barriers and other taxes. While our GTAP model database is based on version 10 (for 2014 data), we have updated the data to better reflect the U.S. economy in 2016. We have also estimated the trade elasticities and used in the model an extended version of the gravity model database employed by Egger et al. (2015).
The model simulates the percentage changes in aggregate economic measures, including U.S. real GDP and aggregate employment, when moving from the baseline or reference level (in this case the U.S. economy and trade regime in effect in 2016 to the counterfactual (the imposition of new tariffs on selected goods by the United States, and then by China). The model results are then converted into percentage changes when moving from counterfactual levels to the actual levels that prevailed in the baseline. The results reported reflect the potential impacts of the tariffs within the first one to two years.
Economists use this type of model to compare the global economy (GDP, trade flows, employment and other variables) before a policy action is taken (called ex ante analysis), and after a policy action is taken (called ex post analysis).10 For the immediate impact (short term) we use a version of the model where wages are somewhat “sticky,” but not entirely so (we use a labor supply elasticity of 0.5.
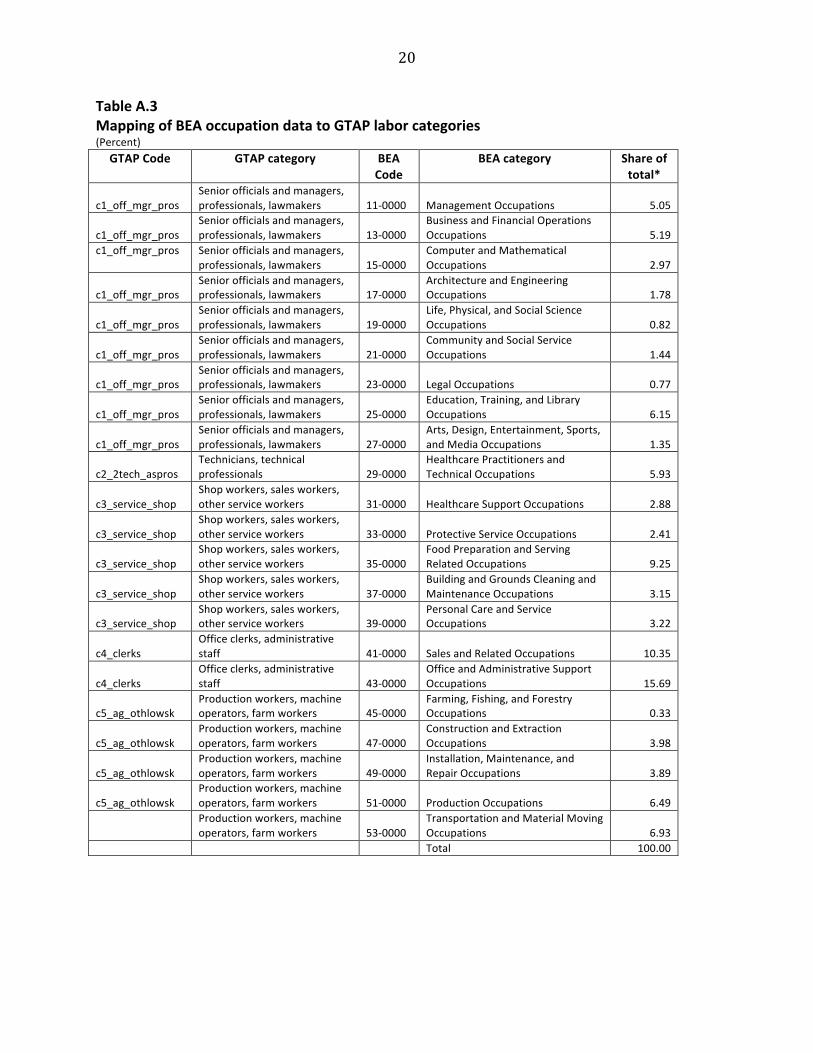
We disaggregate the job impacts into “skilled” and “unskilled” labor categories based on the five GTAP labor categories as detailed in the concordance in Appendix Table A.3. We map these categories against employment levels according to sectors used by the U.S. Bureau of Economic Analysis (BEA) for 2016 employment and estimate the share of each GTAP skill category that is employed in each BEA sector. Jobs data from BEA are provided at national and state level by industry on a NAICS sector basis. The Bureau of Labor Statistics (BLS) provides a more limited set of data on jobs (not all employment in the BLS data is included in the broader BEA employment counts). However, the BEA data do provide both a break down by occupational categories and by NAICS. On the basis of the share of NAICS level employment by occupational
9 See Francois, J., Manchin, M., & Martin, W. (2013). “Market structure in multisector general equilibrium models of open economies.” In D. Jorgenson and P. Dixon eds., Handbook of computable general equilibrium modeling, vol. 1, Elsevier, and Egger, Peter, Joseph Francois, Miriam Manchin, and Douglas Nelson. "Non-‐tariff barriers, integration and the transatlantic economy." Economic Policy 30, no. 83 (2015): 539-‐584. 10 See the various chapters in D. Jorgenson and P. Dixon eds. (2013), Handbook of computable general equilibrium modeling, vol. 1, Elsevier.

14
category in the BLS data, we have allocated BEA employment across industries according to occupational category. We then incorporated the skilled/unskilled disaggregation into the model following Walmsley and Carrico 2016.
Finally, for state-‐level analysis, we first map state-‐level data on employment and Gross State Employment for NAICS sectors from BEA to corresponding model sectors. We then map national changes in production and employment at industry level to the corresponding state data at the model sector level. The impact on states therefore reflects the variation in the output and employment structure across state economies.
15
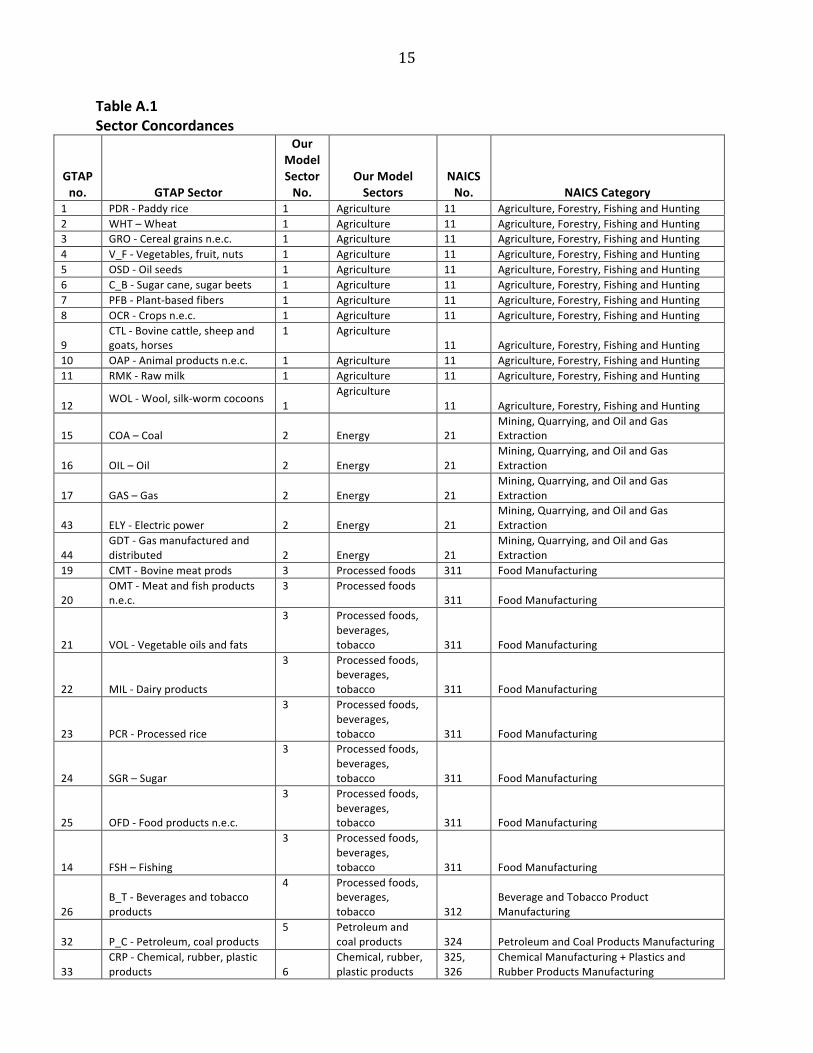
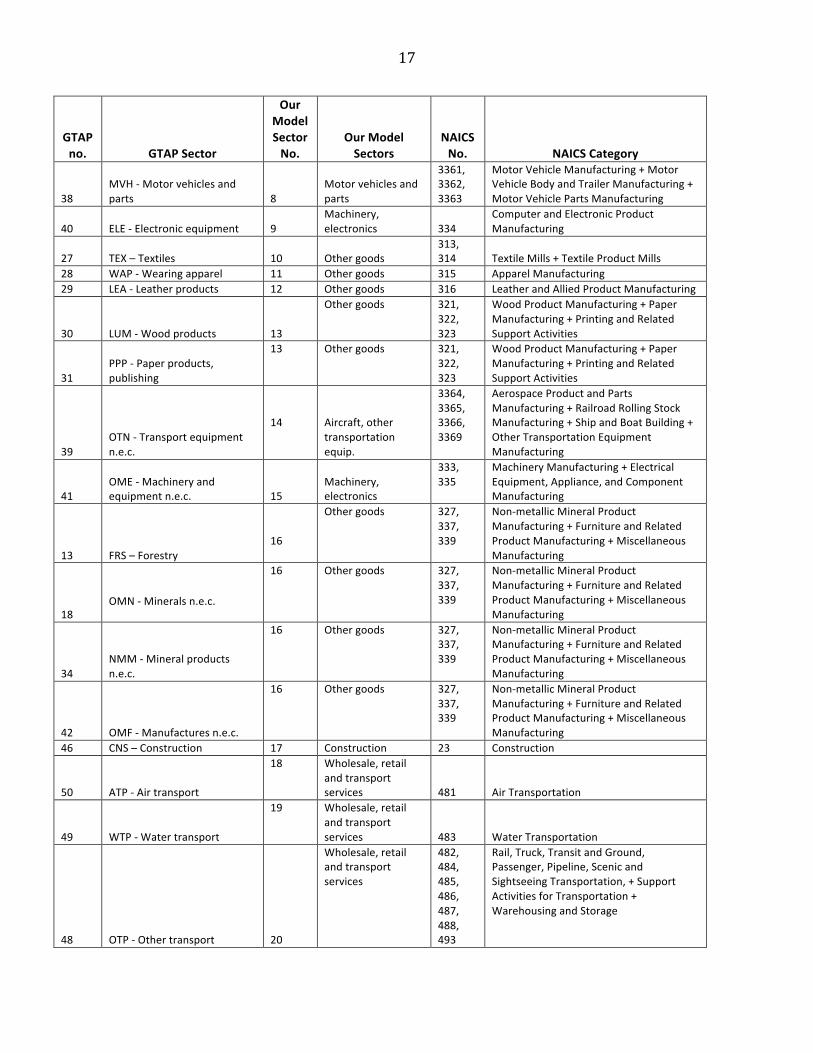
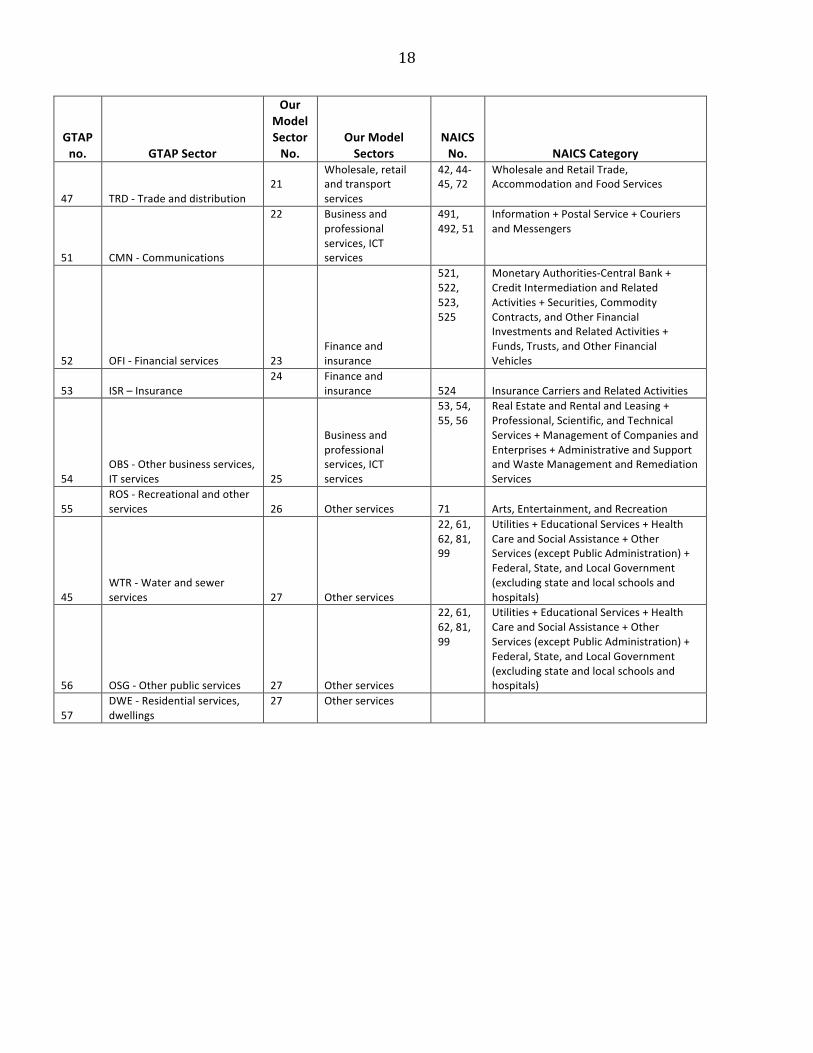
Table A.1 Sector Concordances
GTAP no.
GTAP Sector
Our Model Sector No.
Our Model Sectors
NAICS No.
NAICS Category 1 PDR -‐ Paddy rice 1 Agriculture 11 Agriculture, Forestry, Fishing and Hunting 2 WHT – Wheat 1 Agriculture 11 Agriculture, Forestry, Fishing and Hunting 3 GRO -‐ Cereal grains n.e.c. 1 Agriculture 11 Agriculture, Forestry, Fishing and Hunting 4 V_F -‐ Vegetables, fruit, nuts 1 Agriculture 11 Agriculture, Forestry, Fishing and Hunting 5 OSD -‐ Oil seeds 1 Agriculture 11 Agriculture, Forestry, Fishing and Hunting 6 C_B -‐ Sugar cane, sugar beets 1 Agriculture 11 Agriculture, Forestry, Fishing and Hunting 7 PFB -‐ Plant-‐based fibers 1 Agriculture 11 Agriculture, Forestry, Fishing and Hunting 8 OCR -‐ Crops n.e.c. 1 Agriculture 11 Agriculture, Forestry, Fishing and Hunting
9 CTL -‐ Bovine cattle, sheep and goats, horses
1 Agriculture 11 Agriculture, Forestry, Fishing and Hunting
10 OAP -‐ Animal products n.e.c. 1 Agriculture 11 Agriculture, Forestry, Fishing and Hunting 11 RMK -‐ Raw milk 1 Agriculture 11 Agriculture, Forestry, Fishing and Hunting
12 WOL -‐ Wool, silk-‐worm cocoons 1
Agriculture 11 Agriculture, Forestry, Fishing and Hunting
15 COA – Coal 2
Energy 21
Mining, Quarrying, and Oil and Gas Extraction
16 OIL – Oil 2
Energy 21
Mining, Quarrying, and Oil and Gas Extraction
17 GAS – Gas 2
Energy 21
Mining, Quarrying, and Oil and Gas Extraction
43 ELY -‐ Electric power 2
Energy 21
Mining, Quarrying, and Oil and Gas Extraction
44 GDT -‐ Gas manufactured and distributed
2
Energy 21
Mining, Quarrying, and Oil and Gas Extraction
19 CMT -‐ Bovine meat prods 3 Processed foods 311 Food Manufacturing
20 OMT -‐ Meat and fish products n.e.c.
3 Processed foods 311 Food Manufacturing
21 VOL -‐ Vegetable oils and fats
3 Processed foods, beverages, tobacco 311 Food Manufacturing
22 MIL -‐ Dairy products
3 Processed foods, beverages, tobacco 311 Food Manufacturing
23 PCR -‐ Processed rice
3 Processed foods, beverages, tobacco 311 Food Manufacturing
24 SGR – Sugar
3 Processed foods, beverages, tobacco 311 Food Manufacturing
25 OFD -‐ Food products n.e.c.
3 Processed foods, beverages, tobacco 311 Food Manufacturing
14 FSH – Fishing
3 Processed foods, beverages, tobacco 311 Food Manufacturing
26 B_T -‐ Beverages and tobacco products
4 Processed foods, beverages, tobacco 312
Beverage and Tobacco Product Manufacturing
32 P_C -‐ Petroleum, coal products 5 Petroleum and
coal products 324 Petroleum and Coal Products Manufacturing
33 CRP -‐ Chemical, rubber, plastic products
6
Chemical, rubber, plastic products
325, 326
Chemical Manufacturing + Plastics and Rubber Products Manufacturing

16
35 I_S -‐ Ferrous metals 7
Metals and metal products
331, 332
Primary Metal Manufacturing + Fabricated Metal Product Manufacturing
36 NFM -‐ Metals n.e.c.
7 Metals and metal products
331, 332
Primary Metal Manufacturing + Fabricated Metal Product Manufacturing
37 FMP -‐ Metal products 7
Metals and metal products
331, 332
Primary Metal Manufacturing + Fabricated Metal Product Manufacturing
17
GTAP no.
GTAP Sector
Our Model Sector No.
Our Model Sectors
NAICS No.
NAICS Category
38 MVH -‐ Motor vehicles and parts
8
Motor vehicles and parts
3361, 3362, 3363
Motor Vehicle Manufacturing + Motor Vehicle Body and Trailer Manufacturing + Motor Vehicle Parts Manufacturing
40 ELE -‐ Electronic equipment 9
Machinery, electronics 334
Computer and Electronic Product Manufacturing
27 TEX – Textiles 10
Other goods
313, 314
Textile Mills + Textile Product Mills
28 WAP -‐ Wearing apparel 11 Other goods 315 Apparel Manufacturing 29 LEA -‐ Leather products 12 Other goods 316 Leather and Allied Product Manufacturing
30 LUM -‐ Wood products
13
Other goods 321, 322, 323
Wood Product Manufacturing + Paper Manufacturing + Printing and Related Support Activities
31 PPP -‐ Paper products, publishing
13 Other goods 321, 322, 323
Wood Product Manufacturing + Paper Manufacturing + Printing and Related Support Activities
39 OTN -‐ Transport equipment n.e.c.
14
Aircraft, other transportation equip.
3364, 3365, 3366, 3369
Aerospace Product and Parts Manufacturing + Railroad Rolling Stock Manufacturing + Ship and Boat Building + Other Transportation Equipment Manufacturing
41 OME -‐ Machinery and equipment n.e.c.
15
Machinery, electronics
333, 335
Machinery Manufacturing + Electrical Equipment, Appliance, and Component Manufacturing
13 FRS – Forestry
16
Other goods 327, 337, 339
Non-‐metallic Mineral Product Manufacturing + Furniture and Related Product Manufacturing + Miscellaneous Manufacturing
18 OMN -‐ Minerals n.e.c.
16 Other goods 327, 337, 339
Non-‐metallic Mineral Product Manufacturing + Furniture and Related Product Manufacturing + Miscellaneous Manufacturing
34 NMM -‐ Mineral products n.e.c.
16 Other goods 327, 337, 339
Non-‐metallic Mineral Product Manufacturing + Furniture and Related Product Manufacturing + Miscellaneous Manufacturing
42 OMF -‐ Manufactures n.e.c.
16 Other goods 327, 337, 339
Non-‐metallic Mineral Product Manufacturing + Furniture and Related Product Manufacturing + Miscellaneous Manufacturing
46 CNS – Construction 17 Construction 23 Construction
50 ATP -‐ Air transport
18 Wholesale, retail and transport services 481 Air Transportation
49 WTP -‐ Water transport
19 Wholesale, retail and transport services 483 Water Transportation
48 OTP -‐ Other transport
20
Wholesale, retail and transport services
482, 484, 485, 486, 487, 488, 493
Rail, Truck, Transit and Ground, Passenger, Pipeline, Scenic and Sightseeing Transportation, + Support Activities for Transportation + Warehousing and Storage
18
GTAP no.
GTAP Sector
Our Model Sector No.
Our Model Sectors
NAICS No.
NAICS Category
47 TRD -‐ Trade and distribution
21
Wholesale, retail and transport services
42, 44-‐45, 72
Wholesale and Retail Trade, Accommodation and Food Services
51 CMN -‐ Communications
22 Business and professional services, ICT services
491, 492, 51
Information + Postal Service + Couriers and Messengers
52 OFI -‐ Financial services
23
Finance and insurance
521, 522, 523, 525
Monetary Authorities-‐Central Bank + Credit Intermediation and Related Activities + Securities, Commodity Contracts, and Other Financial Investments and Related Activities + Funds, Trusts, and Other Financial Vehicles
53 ISR – Insurance 24 Finance and
insurance 524 Insurance Carriers and Related Activities
54 OBS -‐ Other business services, IT services
25
Business and professional services, ICT services
53, 54, 55, 56
Real Estate and Rental and Leasing + Professional, Scientific, and Technical Services + Management of Companies and Enterprises + Administrative and Support and Waste Management and Remediation Services
55 ROS -‐ Recreational and other services
26
Other services 71 Arts, Entertainment, and Recreation
45 WTR -‐ Water and sewer services
27
Other services
22, 61, 62, 81, 99
Utilities + Educational Services + Health Care and Social Assistance + Other Services (except Public Administration) + Federal, State, and Local Government (excluding state and local schools and hospitals)
56 OSG -‐ Other public services
27
Other services
22, 61, 62, 81, 99
Utilities + Educational Services + Health Care and Social Assistance + Other Services (except Public Administration) + Federal, State, and Local Government (excluding state and local schools and hospitals)
57 DWE -‐ Residential services, dwellings
27 Other services
19
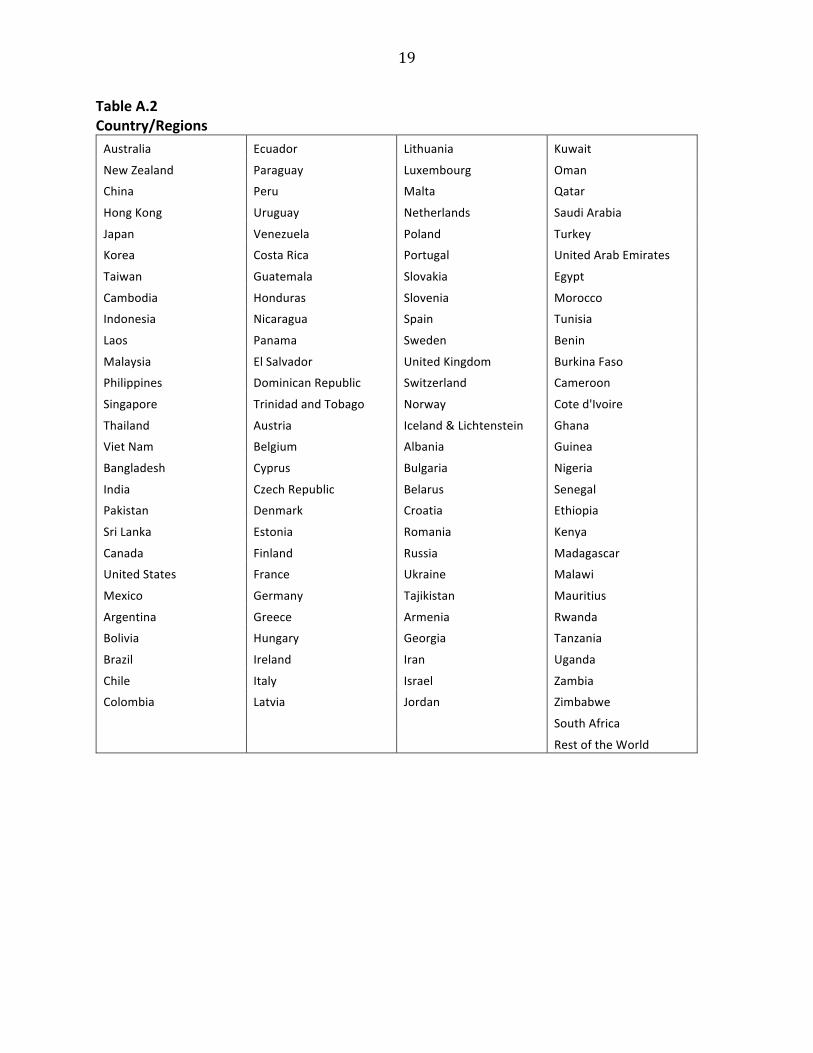
Table A.2 Country/Regions Australia Ecuador Lithuania Kuwait
New Zealand Paraguay Luxembourg Oman
China Peru Malta Qatar
Hong Kong Uruguay Netherlands Saudi Arabia
Japan Venezuela Poland Turkey
Korea Costa Rica Portugal United Arab Emirates
Taiwan Guatemala Slovakia Egypt
Cambodia Honduras Slovenia Morocco
Indonesia Nicaragua Spain Tunisia
Laos Panama Sweden Benin
Malaysia El Salvador United Kingdom Burkina Faso
Philippines Dominican Republic Switzerland Cameroon
Singapore Trinidad and Tobago Norway Cote d'Ivoire
Thailand Austria Iceland & Lichtenstein Ghana
Viet Nam Belgium Albania Guinea
Bangladesh Cyprus Bulgaria Nigeria
India Czech Republic Belarus Senegal
Pakistan Denmark Croatia Ethiopia
Sri Lanka Estonia Romania Kenya
Canada Finland Russia Madagascar
United States France Ukraine Malawi
Mexico Germany Tajikistan Mauritius
Argentina Greece Armenia Rwanda
Bolivia Hungary Georgia Tanzania
Brazil Ireland Iran Uganda
Chile Italy Israel Zambia
Colombia Latvia Jordan Zimbabwe
South Africa
Rest of the World
20
Table A.3 Mapping of BEA occupation data to GTAP labor categories
(Percent) GTAP Code GTAP category BEA
Code BEA category Share of
total* c1_off_mgr_pros
Senior officials and managers, professionals, lawmakers 11-‐0000 Management Occupations 5.05
c1_off_mgr_pros
Senior officials and managers, professionals, lawmakers 13-‐0000
Business and Financial Operations Occupations 5.19
c1_off_mgr_pros Senior officials and managers, professionals, lawmakers 15-‐0000
Computer and Mathematical Occupations 2.97
c1_off_mgr_pros
Senior officials and managers, professionals, lawmakers 17-‐0000
Architecture and Engineering Occupations 1.78
c1_off_mgr_pros Senior officials and managers, professionals, lawmakers 19-‐0000
Life, Physical, and Social Science Occupations 0.82
c1_off_mgr_pros Senior officials and managers, professionals, lawmakers 21-‐0000
Community and Social Service Occupations 1.44
c1_off_mgr_pros Senior officials and managers, professionals, lawmakers 23-‐0000 Legal Occupations 0.77
c1_off_mgr_pros Senior officials and managers, professionals, lawmakers 25-‐0000
Education, Training, and Library Occupations 6.15
c1_off_mgr_pros Senior officials and managers, professionals, lawmakers 27-‐0000
Arts, Design, Entertainment, Sports, and Media Occupations 1.35
c2_2tech_aspros Technicians, technical professionals 29-‐0000
Healthcare Practitioners and Technical Occupations 5.93
c3_service_shop Shop workers, sales workers, other service workers 31-‐0000 Healthcare Support Occupations 2.88
c3_service_shop Shop workers, sales workers, other service workers 33-‐0000 Protective Service Occupations 2.41
c3_service_shop Shop workers, sales workers, other service workers 35-‐0000
Food Preparation and Serving Related Occupations 9.25
c3_service_shop Shop workers, sales workers, other service workers 37-‐0000
Building and Grounds Cleaning and Maintenance Occupations 3.15
c3_service_shop
Shop workers, sales workers, other service workers 39-‐0000
Personal Care and Service Occupations 3.22
c4_clerks Office clerks, administrative staff 41-‐0000 Sales and Related Occupations 10.35
c4_clerks Office clerks, administrative staff 43-‐0000
Office and Administrative Support Occupations 15.69
c5_ag_othlowsk Production workers, machine operators, farm workers 45-‐0000
Farming, Fishing, and Forestry Occupations 0.33
c5_ag_othlowsk Production workers, machine operators, farm workers 47-‐0000
Construction and Extraction Occupations 3.98
c5_ag_othlowsk Production workers, machine operators, farm workers 49-‐0000
Installation, Maintenance, and Repair Occupations 3.89
c5_ag_othlowsk Production workers, machine operators, farm workers 51-‐0000 Production Occupations 6.49
Production workers, machine operators, farm workers 53-‐0000
Transportation and Material Moving Occupations 6.93
Total 100.00