Embed Size (px)
Citation preview
Review
Childhood Brain Tumor Epidemiology: A Brain TumorEpidemiology Consortium Review
Kimberly J. Johnson1, Jennifer Cullen2, Jill S. Barnholtz-Sloan3, Quinn T. Ostrom3, Chelsea E. Langer4,5,6,Michelle C. Turner4,5,6,7, Roberta McKean-Cowdin8, James L. Fisher9, Philip J. Lupo10,11, Sonia Partap12,Judith A. Schwartzbaum9, and Michael E. Scheurer10,11
AbstractChildhood brain tumors are themost common pediatric solid tumor and include several histologic subtypes.
Although progress has beenmade in improving survival rates for some subtypes, understanding of risk factors
for childhood brain tumors remains limited to a few genetic syndromes and ionizing radiation to the head and
neck. In this report, we review descriptive and analytical epidemiology childhood brain tumor studies from the
past decade andhighlight priority areas for future epidemiology investigations andmethodologicalwork that is
needed toadvanceourunderstandingof childhoodbrain tumor causes. Specifically,wesummarize the resultsof
a review of studies published since 2004 that have analyzed incidence and survival in different international
regions and that have examinedpotential genetic, immune system,developmental andbirth characteristics, and
environmental risk factors. Cancer Epidemiol Biomarkers Prev; 23(12); 2716–36. !2014 AACR.
IntroductionBrain and central nervous system (CNS) tumors are the
most common solid tumor and the second leading causeof cancer-related death in individuals 0 to 19 years of agein the United States and Canada (1, 2). The objective ofthis review is to summarize the descriptive and analyticepidemiology of childhood brain tumors (CBT) with aspecific focus on studies from the past decade (since 2004)and to delineate future directions in CBT epidemiologyresearch that are needed for progress in the field.We haveincluded studies published primarily since 2004 pertain-ing to CBT descriptive and analytical epidemiology. Wenote that there is no precise definition of CBTs, and thetumor types included vary between studies, which canmake them difficult to compare.
Descriptive EpidemiologyThere are >100 different histologic subtypes of CNS
tumors with the incidence of each varying by age andhistologic subtype. Childhood CNS tumor incidence var-ies by country from 1.12 to 5.14 cases per 100,000 personswith the highest incidence in the United States (Table 1).CBTs are more common in males, though this varies byhistologic type. In the United States, whites and Asians-Pacific Islanders have a higher CBT incidence than blacksand American Indians/Alaska Natives, whereas non-Hispanics have higher incidence than Hispanics. Subtypeincidence and survival rates are reviewed below andin Tables 1 and 2.
Case ascertainment methodology, completeness, andstandard populations used for age adjustment of ratesvary between cancer registries, making it challenging tocompare statistics across registries. In addition, registriesvary on when they began to include the reporting ofbenign brain tumors. For example, in the United States,registration of nonmalignant tumors was not required bylawand, therefore, limited before 2004. Final confirmationof CNS tumors can also vary by histologic type and byregion; even in the United States, some tumors are notmicroscopically confirmed but are confirmed radiograph-ically. However, across registries, the standard approachis to include both brain tumors and other CNS tumors inall statistics. Therefore, all comparison statistics must beinterpreted with these caveats in mind.
GliomaGliomas that arise from glial cells are the most common
CBT (3). Incidence and survival vary significantly depend-ing on location and histologic type (reviewed below andin Tables 1 and 2).
1Brown School Masters of Public Health Program, Washington Universityin St. Louis, St. Louis,Missouri. 2AmericanChildhoodCancerOrganization,Kensington, Maryland. 3Case Comprehensive Cancer Center, Case West-ern Reserve University School of Medicine, Cleveland, Ohio. 4Centre forResearch in Environmental Epidemiology, Carrer Doctor Aiguader, Barce-lona, Spain. 5Universitat Pompeu Fabra, Placa de la Merc!e, Barcelona,Spain. 6CIBER Epidemiología y Salud P"ublica, Carrer Casanova, Barce-lona, Spain. 7McLaughlin Centre for Population Health Risk Assessment,Institute of Population Health, University of Ottawa, Ottawa, Ontario,Canada. 8Department of Preventive Medicine, University of SouthernCalifornia, USC/Norris Comprehensive Cancer Center, Los Angeles, Cali-fornia. 9Division of Epidemiology, College of Public Health, The Ohio StateUniversity, Columbus, Ohio. 10Department of Pediatrics, Section of Hema-tology-Oncology, Baylor College of Medicine, Houston, Texas. 11Dan L.Duncan Cancer Center, Baylor College of Medicine, Houston, Texas.12Division of Neurology, Stanford University, Palo Alto, California.
Corresponding Author:Michael E. Scheurer, Baylor College of Medicine,One Baylor Plaza, MS-BCM305, Houston, TX 77030. Phone: 713-798-5547; Fax: 713-798-8711; E-mail: [email protected]
doi: 10.1158/1055-9965.EPI-14-0207
!2014 American Association for Cancer Research.
CancerEpidemiology,
Biomarkers& Prevention
Cancer Epidemiol Biomarkers Prev; 23(12) December 20142716
on February 4, 2015. © 2014 American Association for Cancer Research. cebp.aacrjournals.org Downloaded from
Published OnlineFirst September 5, 2014; DOI: 10.1158/1055-9965.EPI-14-0207
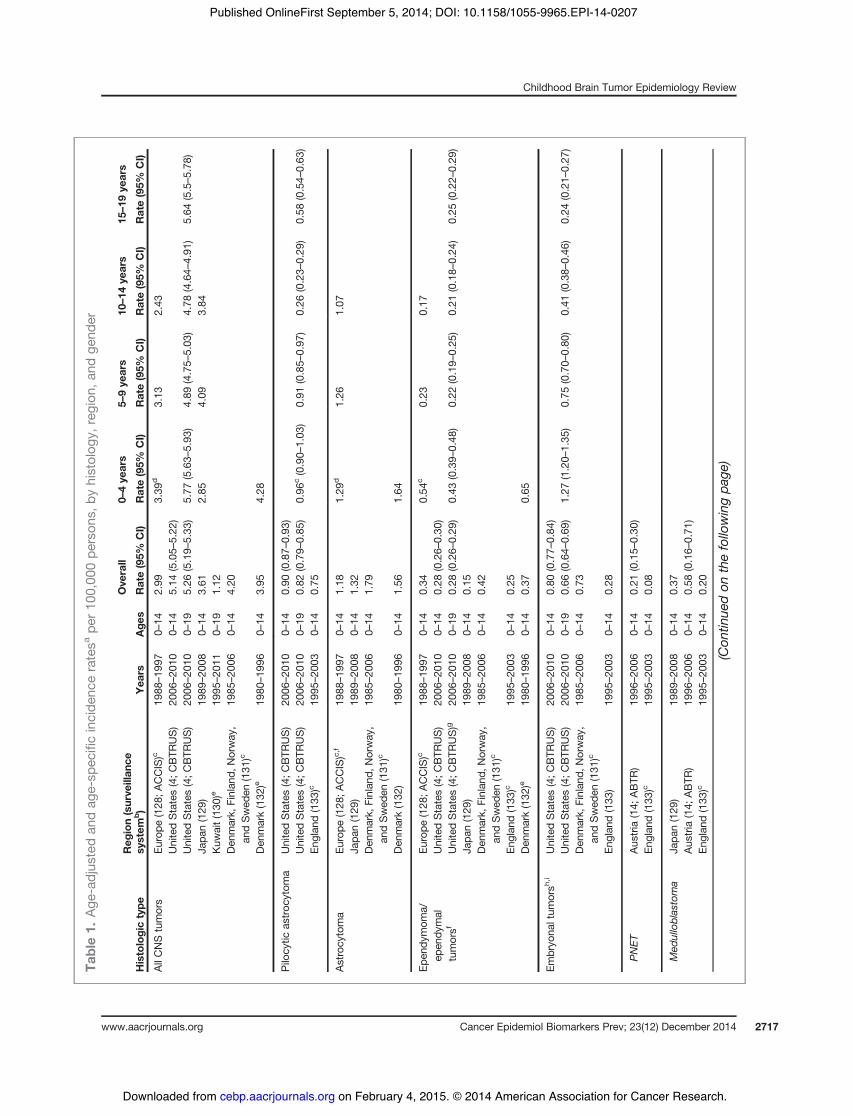
Table1.
Age
-adjus
tedan
dag
e-sp
ecificincide
nceratesa
per10
0,00
0pe
rson
s,by
histolog
y,region
,and
gend
er
Ove
rall
0–4ye
ars
5–9ye
ars
10–14
years
15–19
years
Histologictype
Reg
ion(surve
illan
cesy
stem
b)
Yea
rsAge
sRate(95%
CI)
Rate(95%
CI)
Rate(95%
CI)
Rate(95%
CI)
Rate(95%
CI)
AllCNStumors
Europe
(128
;ACCIS)c
1988
–19
970–
142.99
3.39
d3.13
2.43
UnitedStates(4;C
BTR
US)
2006
–20
100–
145.14
(5.05–
5.22
)UnitedStates(4;C
BTR
US)
2006
–20
100–
195.26
(5.19–
5.33
)5.77
(5.63–
5.93
)4.89
(4.75–
5.03
)4.78
(4.64–
4.91
)5.64
(5.5–5.78
)Ja
pan(129
)19
89–20
080–
143.61
2.85
4.09
3.84
Kuw
ait(130
)e19
95–20
110–
191.12
Den
mark,
Finlan
d,Norway
,an
dSwed
en(131
)c19
85–20
060–
144.20
Den
mark(132
)e19
80–19
960–
143.95
4.28
Pilo
cytic
astroc
ytom
aUnitedStates(4;C
BTR
US)
2006
–20
100–
140.90
(0.87–
0.93
)UnitedStates(4;C
BTR
US)
2006
–20
100–
190.82
(0.79–
0.85
)0.96
c(0.90–
1.03
)0.91
(0.85–
0.97
)0.26
(0.23–
0.29
)0.58
(0.54–
0.63
)En
glan
d(133
)c19
95–20
030–
140.75
Astrocy
toma
Europe
(128
;ACCIS)c,f
1988
–19
970–
141.18
1.29
d1.26
1.07
Japa
n(129
)19
89–20
080–
141.32
Den
mark,
Finlan
d,Norway
,an
dSwed
en(131
)c19
85–20
060–
141.79
Den
mark(132
)19
80–19
960–
141.56
1.64
Epen
dymom
a/ep
endy
mal
tumorsf
Europe
(128
;ACCIS)c
1988
–19
970–
140.34
0.54
c0.23
0.17
UnitedStates(4;C
BTR
US)
2006
–20
100–
140.28
(0.26–
0.30
)UnitedStates(4;C
BTR
US)g
2006
–20
100–
190.28
(0.26–
0.29
)0.43
(0.39–
0.48
)0.22
(0.19–
0.25
)0.21
(0.18–
0.24
)0.25
(0.22–
0.29
)Ja
pan(129
)19
89–20
080–
140.15
Den
mark,
Finlan
d,Norway
,an
dSwed
en(131
)c19
85–20
060–
140.42
Englan
d(133
)c19
95–20
030–
140.25
Den
mark(132
)e19
80–19
960–
140.37
0.65
Embryo
naltum
orsh
,iUnitedStates(4;C
BTR
US)
2006
–20
100–
140.80
(0.77–
0.84
)UnitedStates(4;C
BTR
US)
2006
–20
100–
190.66
(0.64–
0.69
)1.27
(1.20–
1.35
)0.75
(0.70–
0.80
)0.41
(0.38–
0.46
)0.24
(0.21–
0.27
)Den
mark,
Finlan
d,Norway
,an
dSwed
en(131
)c19
85–20
060–
140.73
Englan
d(133
)19
95–20
030–
140.28
PNET
Aus
tria
(14;
ABTR
)19
96–20
060–
140.21
(0.15–
0.30
)En
glan
d(133
)c19
95–20
030–
140.08
Med
ulloblastoma
Japa
n(129
)19
89–20
080–
140.37
Aus
tria
(14;
ABTR
)19
96–20
060–
140.58
(0.16–
0.71
)En
glan
d(133
)c19
95–20
030–
140.20
(Con
tinue
don
thefollo
wingpa
ge)
Childhood Brain Tumor Epidemiology Review
www.aacrjournals.org Cancer Epidemiol Biomarkers Prev; 23(12) December 2014 2717
on February 4, 2015. © 2014 American Association for Cancer Research. cebp.aacrjournals.org Downloaded from
Published OnlineFirst September 5, 2014; DOI: 10.1158/1055-9965.EPI-14-0207
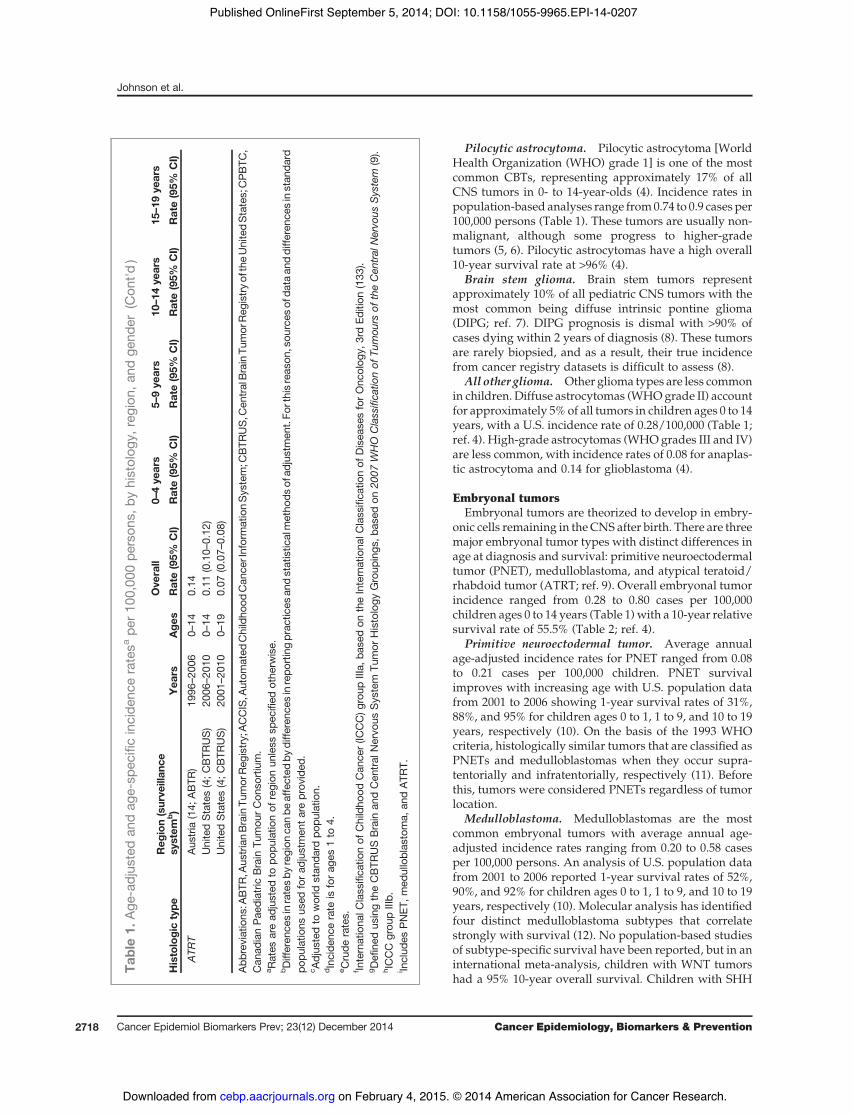
Pilocytic astrocytoma. Pilocytic astrocytoma [WorldHealth Organization (WHO) grade 1] is one of the mostcommon CBTs, representing approximately 17% of allCNS tumors in 0- to 14-year-olds (4). Incidence rates inpopulation-based analyses range from0.74 to 0.9 cases per100,000 persons (Table 1). These tumors are usually non-malignant, although some progress to higher-gradetumors (5, 6). Pilocytic astrocytomas have a high overall10-year survival rate at >96% (4).
Brain stem glioma. Brain stem tumors representapproximately 10% of all pediatric CNS tumors with themost common being diffuse intrinsic pontine glioma(DIPG; ref. 7). DIPG prognosis is dismal with >90% ofcases dying within 2 years of diagnosis (8). These tumorsare rarely biopsied, and as a result, their true incidencefrom cancer registry datasets is difficult to assess (8).
All other glioma. Other glioma types are less commonin children. Diffuse astrocytomas (WHOgrade II) accountfor approximately 5% of all tumors in children ages 0 to 14years, with a U.S. incidence rate of 0.28/100,000 (Table 1;ref. 4). High-grade astrocytomas (WHOgrades III and IV)are less common, with incidence rates of 0.08 for anaplas-tic astrocytoma and 0.14 for glioblastoma (4).
Embryonal tumorsEmbryonal tumors are theorized to develop in embry-
onic cells remaining in the CNS after birth. There are threemajor embryonal tumor types with distinct differences inage at diagnosis and survival: primitive neuroectodermaltumor (PNET), medulloblastoma, and atypical teratoid/rhabdoid tumor (ATRT; ref. 9). Overall embryonal tumorincidence ranged from 0.28 to 0.80 cases per 100,000children ages 0 to 14 years (Table 1)with a 10-year relativesurvival rate of 55.5% (Table 2; ref. 4).
Primitive neuroectodermal tumor. Average annualage-adjusted incidence rates for PNET ranged from 0.08to 0.21 cases per 100,000 children. PNET survivalimproves with increasing age with U.S. population datafrom 2001 to 2006 showing 1-year survival rates of 31%,88%, and 95% for children ages 0 to 1, 1 to 9, and 10 to 19years, respectively (10). On the basis of the 1993 WHOcriteria, histologically similar tumors that are classified asPNETs and medulloblastomas when they occur supra-tentorially and infratentorially, respectively (11). Beforethis, tumors were considered PNETs regardless of tumorlocation.
Medulloblastoma. Medulloblastomas are the mostcommon embryonal tumors with average annual age-adjusted incidence rates ranging from 0.20 to 0.58 casesper 100,000 persons. An analysis of U.S. population datafrom 2001 to 2006 reported 1-year survival rates of 52%,90%, and 92% for children ages 0 to 1, 1 to 9, and 10 to 19years, respectively (10). Molecular analysis has identifiedfour distinct medulloblastoma subtypes that correlatestrongly with survival (12). No population-based studiesof subtype-specific survival have been reported, but in aninternational meta-analysis, children with WNT tumorshad a 95% 10-year overall survival. Children with SHH
Table1.
Age
-adjus
tedan
dag
e-sp
ecificincide
nceratesa
per10
0,00
0pe
rson
s,by
histolog
y,region
,and
gend
er(Con
t'd)
Ove
rall
0–4ye
ars
5–9ye
ars
10–14
years
15–19
years
Histologictype
Reg
ion(surve
illan
cesy
stem
b)
Yea
rsAge
sRate(95%
CI)
Rate(95%
CI)
Rate(95%
CI)
Rate(95%
CI)
Rate(95%
CI)
ATR
TAus
tria
(14;
ABTR
)19
96–20
060–
140.14
UnitedStates(4;C
BTR
US)
2006
–20
100–
140.11
(0.10–
0.12
)UnitedStates(4;C
BTR
US)
2001
–20
100–
190.07
(0.07–
0.08
)
Abb
reviations
:ABTR
,Aus
trianBrainTu
mor
Reg
istry;ACCIS,A
utom
ated
Childho
odCan
cerInformationSystem;C
BTR
US,C
entralBrainTu
mor
Reg
istryof
theUnitedStates;CPBTC
,Can
adianPae
diatric
Brain
Tumou
rCon
sortium.
a Rates
aread
justed
topo
pulatio
nof
region
unless
spec
ified
othe
rwise.
bDifferen
cesinratesby
region
canbe
affected
bydiffe
renc
esinrepo
rtingprac
tices
andstatistic
almetho
dsof
adjustmen
t.Fo
rthisreas
on,sou
rces
ofda
taan
ddiffe
renc
esinstan
dard
popu
latio
nsus
edforad
justmen
tareprov
ided
.c A
djus
tedto
world
stan
dard
popu
latio
n.dIncide
ncerate
isforag
es1to
4.e C
rude
rates.
f Internationa
lClassifica
tionof
Childho
odCan
cer(IC
CC)g
roup
IIIa,
base
don
theInternationa
lClassifica
tionof
Disea
sesforOnc
olog
y,3rdEd
ition
(133
).gDefi
nedus
ingtheCBTR
USBrain
andCen
tral
Nervo
usSystem
Tumor
Histology
Group
ings
,bas
edon
2007
WHO
Classifica
tionof
Tumou
rsof
theCen
tral
Nervo
usSystem
(9).
hICCC
grou
pIIIb.
i Includ
esPNET
,med
ulloblas
toma,
andATR
T.
Johnson et al.
Cancer Epidemiol Biomarkers Prev; 23(12) December 2014 Cancer Epidemiology, Biomarkers & Prevention2718
on February 4, 2015. © 2014 American Association for Cancer Research. cebp.aacrjournals.org Downloaded from
Published OnlineFirst September 5, 2014; DOI: 10.1158/1055-9965.EPI-14-0207

tumors, group3, and large cell anaplastic tumors had51%,50%, and 32% 10-year survival, respectively (13).Atypical teratoid/rhabdoid tumor. ATRT is a rare
embryonal tumor that most commonly occurs in children<3 years old. Average annual age-adjusted incidence ratesrange from 0.07 to 0.14 per 100,000 persons (14, 15).Prognosis is generally poor, though survival increaseswith age (14–18). Overall, median survival is usuallybetween 6 and 18months (16, 18–20). Most analyses showthat ATRTs are more common in males (15, 16, 21) andamong whites (15, 22). A systematic diagnostic approachfor ATRT was not common until 2005; before that, thesetumors were frequently misclassified, mostly as medul-loblastomas or PNET (14).
Analytic EpidemiologyGenetic factorsCancer syndromes. Established familial cancer syn-
dromes (gene) that increase brain tumor susceptibility
include neurofibromatosis type 1 (NF1), neurofibromato-sis type 2 (NF2), tuberous sclerosis (TSC1 or TSC2), Li–Fraumeni (TP53 or CHEK2), nevoid basal cell carcinoma(PTCH), Turcot (APC), Cowden (PTEN), hereditary reti-noblastoma (RB1), and Rubinstein–Taybi (CREBBP;refs. 23–26).
Family history. Findings from studies of CBT riskamong familymembers vary substantially. A 2008 review(27) including publications as early as 1959 reported thatalthoughmost studies observed positive associations spe-cific to brain tumors, there was borderline statisticalevidence for an increased risk. Siblings of childhood CNScancer cases consistently showed increased risks of devel-oping a childhood CNS tumor, with a higher risk seen ifboth children had medulloblastoma or PNET diagnoses.Risk was also reported to be higher among relatives if theindex child was diagnosed at !4 years old. Children alsohad an increased risk of developing a nervous systemtumor if a parent also had this tumor type. The SEARCH
Table 2. Survival rates by histologic type and region
1 year 5 years 10 years
Histologic type RegionSurveillancesystem Years Ages Rate (95% CI) Rate (95% CI) Rate (95% CI)
All CNS tumors Europe (128) ACCIS 1988–1997 0–14 91 (60–62)United States (4) CBTRUS 2006–2010 0–14 85.2 (84.4–86) 72.3 (71.2–73.3) 68.2 (66.9–69.4)Sweden (135) 1984–2005 0–14 76 72
Ependymomaa Europe (128) ACCIS 1988–1997 0–14 53 (49–57)United States (4)b CBTRUS 1995–2010 0–14 93.6 (91.3–95.4) 72.2 (67.9–76.1) 62.8 (57.5–67.7)Sweden (135) 1984–2005 0–14 72 66
Astrocytomac Europe (128) ACCIS 1988–1997 0–14 75 (73–76)Sweden (135) 1984–2005 0–14 84 82
Pilocytic astrocytoma United States (4) CBTRUS 2006–2010 0–14 98.7 (98.1–99.1) 97.2 (96.3–98.0) 96.2 (94.9–97.2)Embryonal tumorsd United States (4) CBTRUS 1995–2010 0–14 79.9 (77.9–81.7) 62.1 (59.6–64.5) 55.5 (52.7–58.3)PNET Europe (128)e ACCIS 1988–1997 0–14 49 (46–51)
United States (4) CBTRUS 1995–2010 All ages 76.4 (72.9–79.6) 49.5 (45.3–53.6) 42.8 (38.4–47.2)United States (10) SEER 2001–2006 <1 31 (9–58) 14 (2–39)United States (10) SEER 2001–2006 1–9 88 (81–93) 64 (54–72)United States (10) SEER 2001–2006 10–19 94 (82–98) 57 (41–70)Sweden (135) 1984–2005 0–14 47 41
Medulloblastoma United States (4) CBTRUS 1995–2010 All ages 88.2 (86.5–89.7) 71.1 (68.5–73.5) 62.8 (59.7–65.8)United States (10) SEER 2001–2006 <1 52 (30–70) 42 (22–61)United States (10) SEER 2001–2006 1–9 90 (86–93) 69 (58–78)United States (10) SEER 2001–2006 10–19 92 (85–96) 69 (58–78)Sweden (135) 1984–2005 0–14 63 55
ATRT United States (4) CBTRUS 1995–2010 All ages 48.1 (40.3–55.5) 28.0 (20.7–35.7) 26.2 (18.8–34.3)
Abbreviations: ACCIS,AutomatedChildhoodCancer InformationSystem;CBTRUS,Central Brain TumorRegistry of theUnitedStates;SEER, Surveillance, Epidemiology, and End Results.aInternational Classification of ChildhoodCancer (ICCC) group IIIa, based on the International Classification of Diseases for Oncology,3rd Edition (134).bDefined using the CBTRUS Brain and Central Nervous System Tumor Histology Groupings, based on 2007 WHO Classification ofTumours of the Central Nervous System (9).cICCC group IIIb.dIncludes PNET, medulloblastoma, and ATRT.eICCC group IIIc.
Childhood Brain Tumor Epidemiology Review
www.aacrjournals.org Cancer Epidemiol Biomarkers Prev; 23(12) December 2014 2719
on February 4, 2015. © 2014 American Association for Cancer Research. cebp.aacrjournals.org Downloaded from
Published OnlineFirst September 5, 2014; DOI: 10.1158/1055-9965.EPI-14-0207
international brain tumor case–control study, whichincluded 1,200 CBT cases and 2,218 controls from Aus-tralia, Canada, France, Israel, Italy, Spain, and the UnitedStates, reported no significant associations between CBTsand brain tumor history in close relatives, with ORs of 0.8[95% confidence interval (CI), 0.5–1.3], 1.3 (95% CI, 0.7–2.3), and 1.1 (95% CI, 0.6–1.9) for astroglial (n ¼ 620),PNETs (n ¼ 244), and other CBT (n ¼ 324) subtypes,respectively (28).
Parental age. Parental age at birth may serve as amarker for inherited somatic changes in aging parentalgermlines. Hemminki and colleagues (29) previouslyreported that offspring of older fathers (>40 years at thechild’s birth) were at increased CBT risk with nomaternalage effect in a cohort study that included 1,617 CBT casesdiagnosed at ages 0 to 14 years. A more recent Swedishanalysis (30) of CNS tumors diagnosed in 0- to 4-year-olds(n ¼ 977) indicated higher risks associated with paternalage >40 years after maternal age adjustment [incidencerate ratio (IRR) ¼ 1.69; 95% CI, 1.21–2.35], particularly forastrocytoma. In contrast, Johnson and colleagues (31)reported an increased childhood CNS tumor risk in asso-ciationwithmaternal age after paternal age adjustment ina U.S. multistate record linkage study including >3,500cases (ORper 5-year age increase ¼ 1.08; 95% CI, 1.03–1.14).Only astrocytomas and ependymomas were associatedwith an increased risk. The authors also reported strongerIRRs for children diagnosed at younger ages.
Maternal genetic effects. Recent research has addre-ssed the role of maternal genetic variation in genes thatmay influence the in utero environment. In spite of thepotential importance of this mechanism in the etiology ofCBTs, few assessments of maternal genetic effects havebeen performed. To our knowledge, there is only onesmall report that used a case parent triad study design(32) of the role of maternal variation in xenobiotic detox-ification genes and the risk of childhoodmedulloblastoma(33), where it was reported that the maternal EPHX1rs1051740 genotype was associated with medulloblasto-ma risk (RR, 3.26; 95% CI, 1.12–9.53). Larger studies areneeded to explore the role of maternal genetic effects inCBT susceptibility.
Immune systemAllergic conditions (allergies, asthma, and eczema).
Studies consistently suggest inverse associations betweenadult gliomas and allergic conditions (34). In children, a2008 U.K. study including 575 cases diagnosed at <15years of age and 6,292 controls indicated that maternallyreported asthmadecreasedCNS tumor risk (OR, 0.75; 95%CI, 0.58–0.97), particularly for medulloblastoma/PNETs(OR, 0.43; 95% CI, 0.23–81). However, this result was notconfirmed in a participant subset for whom medicalrecords were available (OR, 1.20; 95% CI, 0.74–1.94),which could be due to the diagnosis not being present ornot being recorded (35). CNS tumors were not associatedwith eczema (OR, 0.94; 95% CI, 0.74–1.18), but there was asignificant inverse association for children with both
asthma and eczema (OR, 0.48; 95% CI, 0.28–0.81; ref. 36).A study of 272 matched case–control pairs reported aninverse association between CBTs diagnosed between 0and 15 years old and asthma (OR, 0.55; 95%CI, 0.33–0.93),which was stronger for ependymoma (OR, 0.15; 95% CI,0.18–1.21). No association with eczema was found. Over-all, CNS tumor risk was increased with use of asthmacontrollers (e.g., inhaled corticosteroids; OR, 2.55; 95%CI,0.79–8.20) or asthma relievers (e.g., beta agonists; OR, 1.62;95% CI, 0.57–4.63; ref. 37). Finally, CEFALO, a studyconducted in Denmark, Norway, Sweden, and Switzer-land that included 352 CBT cases diagnosed from 7 to 19years and 646 controls, found no association with anyatopic condition (asthma, wheezing, eczema, allergic rhi-nitis; OR, 1.03; 95% CI, 0.70–1.34) and some evidence forreverse causality; an inverse association between CBTsand having a current (OR, 0.76; 95% CI, 0.53–1.11) but notpast (OR, 1.22; 95% CI, 0.86–1.74) atopic condition wasfound (38). Altogether, allergic conditions may be a pro-tective factor for CBTdevelopment, but further research isneeded.
Markers of infectious exposures. Studies, before 2004,of markers of infection and CBT risk have yielded mixedresults (39–41).More recently, higher risks of CBTs amongfirst-born children versus those with higher birth orderand lower risks among those who attended daycare as aninfant have been reported. Altieri and colleagues (42)compared the incidence of brain tumors in the SwedishCancer Registry based on the number of total siblings,older siblings, and younger siblings. When comparedwith cases diagnosed at <15 years old with no siblings,the relative risk (RR) for cases with #3 younger siblingswas increased for astrocytoma (RR, 1.34), medulloblasto-ma (RR, 2.30), ependymoma (RR, 2.61), and meningioma(RR, 3.71). Shawandcolleagues (43) reported thatCBT riskwas elevated for having siblings (OR, 1.4; 95% CI, 0.9–2.3)and being at least second born (OR, 1.7; 95% CI, 1.2–2.4).
Several studies suggest infectious exposures duringolder childhood increase brain tumor risk,whereas earlierinfections reduce brain tumor risk. Harding and collea-gues (44) reported that childrenwho had no social contactwith other infants in the first year of life displayed anincreased CNS tumor risk versus those who had suchearly exposures (OR, 1.37; 95% CI, 1.08–1.75), particularlyamong medulloblastoma cases (OR, 1.78; 95% CI, 1.12–2.83). In addition, children who attended informal (OR,0.86; 95% CI, 0.68–1.09) or formal (OR, 0.93; 95% CI, 0.68–1.26) daycare showed slightly reduced risks versus thosereporting social contact only. Shaw and colleagues (43)reported that CBT risk was reduced for subjects whoattended daycare for >1 year or were breastfed, whereasHarding and colleagues (45) found no associationbetween breastfeeding and CBTs (OR, 1.01; 95% CI,0.85–1.21). Most recently, Andersen and colleagues (46)reported that glioma (OR, 2.93; 95% CI, 1.57–5.50) andembryonal tumor (OR, 4.21; 95% CI, 1.24–14.30) cases hadmore frequent sick days with infections in the first 6 yearsof life versus controls.However, the timing of infections in
Johnson et al.
Cancer Epidemiol Biomarkers Prev; 23(12) December 2014 Cancer Epidemiology, Biomarkers & Prevention2720
on February 4, 2015. © 2014 American Association for Cancer Research. cebp.aacrjournals.org Downloaded from
Published OnlineFirst September 5, 2014; DOI: 10.1158/1055-9965.EPI-14-0207

relation to the first year of life versus later in childhoodwas not evaluated. One common observation from thesestudies is that level of risk often varies by age at diagnosisand tumor type.
Developmental and birth characteristicsCongenital anomalies. Congenital anomalies (CA)
and birth characteristics have been examined as putativerisk factors for pediatric CNS tumors (47–49). Amonglarge studies, 45,200 children with CAs were identifiedin the Canadian Congenital Anomalies SurveillanceSystem and matched to 45,200 children without CAsidentified through the Ontario Birth Certificate File. TheOntario Cancer Registry was then used to identify 212newly diagnosed cancers in the matched cohorts. Theauthors observed a 2.5-fold increased CNS cancer risk inassociation with CAs that was stronger for children <1year old (5.5-fold greater risk). Those with nervoussystem anomalies had an approximate 6-fold increasedrate of primary CNS tumors (50).Using two population-based national birth registries in
Sweden and Norway, Bjorge and colleagues (51) linkedbirth and cancer registry data to examine risk of multiplepediatric cancer types in association with birth defects.Specifically, childrenwith nervous systemmalformationswere at elevated risk of CNS cancers in both countries,particularly Norway.Fisher and colleagues (52) linked data from the Cali-
fornia Cancer Registry (CCR) to the Birth Defects Moni-toring System for the period of 1988 to 2004 amongchildren ages 0 to 14 years. There were 4,869 childrenidentifiedwith cancer, amongwhom222hadamajor birthdefect. The authors reported a 1.87-fold (95% CI, 0.6–5.79)and 1.80-fold (95% CI, 1.28–2.53) elevated risks of CNStumors among children with and without nonchromo-somal and chromosomal anomalies, respectively.A second study linking the CCR to California birth
certificates examined birth anomalies and CNS tumorrisk among children ages 0 to 14 years old between1988 and 2006 (53). In this study, 4,560 newly diagnosedCNS tumors were identified of which 3,733 cases (82%)could be linked to the birth registry. Cases were thenindividuallymatched to four controls (n¼ 14,932).Medul-loblastomas and PNETs were more elevated in childrenwith birth defects, with age-stratified analyses revealingstronger risks for younger children (OR, 1.7; 95%CI, 1.12–2.57 and OR, 2.9; 95% CI, 1.68–5.05 for children <2 and <1year(s) old, respectively). This study was limited by theinability to capture birth defect information after hospitaldischarge.Birth characteristics. In one of the largest studies to
date, Bjorge and colleagues (54) conducted a nested case–control study to examine fetal growth in relation to cancerdevelopment in Nordic children born between 1967and 2010 using population-based birth registries. Eachcase (n¼ 17,698)wasmatched to 10 controls (n¼ 172,422).Both higher birth weight (RR#4,500 g vs. 3,000–3,499 g ¼ 1.3;
95% CI, 1.1–1.3) and increasing head circumference(RR39–45 cm vs. 33–36 cm ¼ 1.7; 95% CI, 1.2–2.3; P trend <0.001) were associatedwith childhood CNS cancer risk. Ina similar but smaller study including the same fourNordicnations, Schmidt and colleagues (55) conducted a nestedcase–control study to examine the impact of fetal growth(including birth weight) on CNS tumor risk among chil-dren ages 0 to 14 years who were diagnosed with a CNStumor between 1985 and 2006. This study matched 3,443CNS cases identified from national cancer registries to16,169 birth registry controls and found a significantgestational age-adjusted association between birthweight>4,500 g and risk of all CNS (RR, 1.27; 95% CI, 1.03–1.55),and embryonal (RR, 1.8; 95% CI, 1.2–2.8) tumors but notother histologic subtypes.
Milne and colleagues (56) examined the relationshipbetween fetal growth measured as proportion of optimalbirth weight or length and CNS tumor developmentdiagnosed between 1980 and 2004 in children ages 0 to14 years. Among >600,000 live births, 183 pediatric CNStumors were identified. There were no statistically signif-icant associations between fetal growth factors and CNStumor development.
Using CCR data to examine birth characteristics andCNS tumor risk in children ages 0 to 14 years old between1988 and 2006,MacLean and colleagues (57)matched eachchild with a CNS tumor (n ¼ 3,733) to four controlsidentified through the California birth certificate data-base, resulting in 14,932 controls. There was an increasedCNS cancer risk in the highest weight category (>4,000 g)among high-grade gliomas, whereas among low-gradegliomas, those in the lowest weight category (<2,500 g)appeared to be protected against CNS tumors. This studyindicates that separation of CNS subtype is warranted instudies of birth characteristics and CNS tumor risk.
Finally, in a 2008 meta-analysis, eight studies wereidentified that examined CBT risk in association withbirth weight. Data from over 1.7 million children/youngadults (0–18 years old) were analyzed, with 4,162 primarydiagnoses of astrocytoma, medulloblastoma, or ependy-momas combined. Most cases were identified throughcancer registries, and the predominant study design wascase–control. The authors found that high birth weight(>4,000 g) was predictive of both astrocytoma (OR, 1.38;95% CI, 1.07–1.79) and medulloblastoma (OR, 1.27; 95%CI, 1.02–1.60), but not ependymomas, which was onlyexamined in few studies (58).
Environmental exposuresRadiation exposure. High-dose radiation to the head
and neck for treatment of cancer or other conditions is anestablished CBT risk factor (59). Radiotherapy for acutelymphoblastic leukemia is associated with a particularlyhigh risk with several studies published in the 1990s(reviewed in ref. 60) showing increased brain tumor risks(gliomas, PNETs) in children who received prophylacticCNS irradiation (usually a cumulative dose of $25 Gy).
Childhood Brain Tumor Epidemiology Review
www.aacrjournals.org Cancer Epidemiol Biomarkers Prev; 23(12) December 2014 2721
on February 4, 2015. © 2014 American Association for Cancer Research. cebp.aacrjournals.org Downloaded from
Published OnlineFirst September 5, 2014; DOI: 10.1158/1055-9965.EPI-14-0207
The latency between radiotherapy and subsequent braintumordevelopmenthasbeen estimated at 7 to 9yearswitha higher risk for younger children (60). It has also beenbroadly accepted for several decades that in utero diag-nostic radiation exposure is associated with a small-to-moderate dose-dependent increase in childhood cancerrisk, including brain tumors (61). Recent studies examin-ing ionizing and nonionizing radiation exposure arereviewed briefly below with study details providedin Tables 3 and 4, respectively.
Ionizing radiation The Childhood Cancer SurvivorStudy reported that radiation therapy for a first primarycancer (most were leukemia) was associated with a sig-nificant 7.1-fold increased risk of a subsequentCNS tumor(62).
A Danish study examined CBT risk associated withneonatal diagnostic X-ray exposure (vs. no exposure)and observed a 2-fold positive nonsignificant associa-tion (63). A Swedish study of individuals born between1975 and 1984 examined the association between med-ical record–abstracted prenatal X-ray abdominal expo-sures and CBTs and found no increased risk overall butan almost 2-fold increased risk for PNETs (64). A U.S.study of medulloblastoma/PNETs examined risks asso-ciated with maternally reported postnatal diagnostic X-rays and reported no significant associations for head,dental, or any X-ray exposure versus no exposure (65).A U.K. study reported associations between cancers andmedical record–abstracted prenatal diagnostic radiationexposure. On the basis of 25 and 41 exposed CBT casesand controls, respectively, no significant association forprenatal or early infancy radiation exposure wasobserved (66).
Two studies examined childhood/adolescence CTscans and subsequent brain tumor development. A U.Kstudy employing a retrospective cohort study design thatincluded 176,587 CT scan–exposed individuals reportedincreased risks of subsequent brain tumor developmentfor the exposed group (67). An Australian study, thatincluded approximately 11 million individuals, alsoreported significant positive associations between CTscan exposure and brain tumor development with riskgenerally decreasingwith increasing age at first exposure,years since first exposure, and increasing calendar year offirst CT scan (68).
An ecological study conducted in Florida in response toan observed excess of childhood brain and other nervoustissue cancers in the 1990s found no evidence to indicatethat the observed excess was related to nuclear plantinstallation in St. Lucie County in 1976 (69).
Nonionizing radiation Sources of nonionizing radia-tion that have been studied for their role in CBT riskpredominantly include radio frequency/microwave (e.g., cell phones, AM and FM radio, televisions, andmicrowaves) and extremely low frequency magneticfields (ELF-MF; e.g., power lines and electrical wiring)that are classified as possibly carcinogenic by the Inter-national Agency for Cancer Research (70). Studies have
shown no significant associations between nonionizingradiation exposure and CBTs as summarized brieflybelow.
A South Korean case–control study examined associa-tions between residential AM-radio transmission expo-sures and CBTs. No significant associations were obs-erved by residential distance to the AM-radio transmitteror for estimated radio-frequency radiation exposure(mV/m) for the fourth versus first quartile (71).
A 2008 meta-analysis that examined associationsbetween residential magnetic field exposure and CBTsreported no significant associations in a number of dif-ferent analyses (72).
Kheifets and colleagues (73) conducted a pooled anal-ysis of 10 U.S. and European studies and found no evi-dence for an association between ELF-MFs and CBTs.
AU.K. registry-based case–control study that examinedmaternal radio-frequency exposure frommacrocell cellu-lar phone base stations (masts) andmast proximity duringpregnancy and offspringCBT risk reported no associationformother’s exposure tomasts during early pregnancy orfor modeled power density birth address (74).
CBTs and cellular phone use in 7- to 19-year-olds wereexamined in a European multicenter case–control study(CEFALO); the authors reported no significant associationbetween CBTs and regular cellular phone use versusnonuse (75).
Maternal medical conditions and exposures. Medica-tions Medications containing amides or amines (e.g.,barbiturates, antiepileptics, and antihistamines) may beconverted to carcinogenic N-nitroso compounds (NOCsincluding N-nitrosamines and N-nitrosoamides) uponingestion through reaction with dietary nitrate in thestomach. Two studies before 2004 did not find statisticalevidence for an association betweenmaternal exposure tonitrosable drugs and offspring CBTs (76, 77). Likewise, alarge study published in 2006 that included 1,218 CBTcases and 1,218 controls found little support for an asso-ciation betweenCBTs andmedications containing aminesor amides (OR, 1.01; 95% CI, 0.82–1.24) overall or forastroglial (OR, 1.01; 95% CI, 0.78–1.31), PNET (OR, 1.09;95% CI, 0.75–1.60), or other glial (OR, 1.01; 95% CI, 0.71–1.44) subtypes. No significant associations were foundwhendatawere analyzedbyagegroup (!5vs.>5years) orclass of drugs (barbituates, antiepileptics, antihistamines,neurally active drugs, diuretics, sex hormones, or antie-metics; ref. 78).
A German case–control study of 399 CNS cases diag-nosedbetween1992and1994and2,057 controls evaluatedassociations between maternally reported medicationsand CBTs and found no significant associations betweenCNS tumors and diuretics/antihypertensives (OR, 1.65;95% CI, 0.73–3.74), "pain relievers" (OR, 1.0; 95% CI, 0.6–1.67), antinauseants or antiemetics (OR, 1.15; 95%CI, 0.68–1.96), or cold medications (OR, 0.81; 95% CI, 0.55–1.21).The authors also reported ORs of 1.23 (95% CI, 0.71–2.12)and 0.92 (95% CI, 0.68–1.24) for associations betweenoffspring CNS tumors and high blood pressure/edema
Johnson et al.
Cancer Epidemiol Biomarkers Prev; 23(12) December 2014 Cancer Epidemiology, Biomarkers & Prevention2722
on February 4, 2015. © 2014 American Association for Cancer Research. cebp.aacrjournals.org Downloaded from
Published OnlineFirst September 5, 2014; DOI: 10.1158/1055-9965.EPI-14-0207

Table3.
Rev
iew
ofrece
ntstud
iesad
dres
sing
ionizing
radiation–
relatedris
ksan
dCBTs
Study
design
/pop
ulation
Sub
ject
numbe
r,radiation
mea
suremen
tmetho
dRad
iatio
nindica
tor
RR
(95%
CI)
Com
men
tRef.
Coh
orts
tudy
of#5ye
arssu
rvivorsof
child
hood
canc
erdiag
nose
dbe
twee
n19
70an
d198
6in
theUnitedStatesan
dCan
ada.
166CNSca
sesam
ong
14,361
coho
rtmem
bers
Therap
eutic
radiationon
lyfor
firstp
rimarych
ildho
odca
ncer
vs.n
oex
posu
re
OR,7
.07
(2.76–
18.1)a
Bothgliomaan
dmen
ingiom
aris
kswereincrea
sedwith
ash
orter
interval
followingex
posu
refor
gliomavs.m
eningiom
adiag
nose
s.CBTdiag
nose
swereno
tspe
cifica
llyrepo
rted
.
(62)
Med
ical
reco
rdab
straction
Dan
ishne
sted
case
–co
ntrols
tudy
inch
ildren
with
anim
maturity
diag
nosisbo
rnfrom
1977
to19
88.C
BTca
seswerediag
nose
dfro
m0to
19ye
ars.
Con
trolswererand
omly
selected
from
theba
seco
hort.
25ca
ses,
43co
ntrols
Any
newbo
rndiag
nostic
X-ray
expo
sure
vs.n
one
OR,2
.2(0.6–8.8)
b(63)
Med
ical
reco
rdab
straction
Swed
ishregistrylinka
gestud
yof
pren
atalX-rays
andCBTs
.Sub
jectswerebo
rnfrom
1975
to19
84.C
BTca
sesdiag
nose
dfrom
0to
14ye
ars
wereiden
tified
intheca
ncer
registry.C
ontrols
wererand
omly
selected
from
theMed
ical
BirthReg
istrar
match
edto
case
son
sexan
dbirthye
ar.
512CBTca
ses,
524
controls
Any
pren
atal
abdo
minal
X-rays
vs.n
one
OR,1
.02
(0.64–
1.62
)cRiskes
timates
forsu
btyp
es:low
-grad
eas
troc
ytom
as(O
R,0
.72;
95%
CI,0.38
–1.42
),high
-grade
astroc
ytom
as(O
R,1
.06;
95%
CI,
0.39
–2.88
),PNET
s(O
R,1
.88;
95%
CI,0.92
–3.83
),or
epen
dymom
as(O
R,1.01;95
%CI,0.24
–2.98
)c.R
isk
estim
ates
forno
nabd
ominal
pren
atal
X-rayex
posu
reswereno
tsign
ifica
nt.
(64)
Med
ical
reco
rdab
straction
Cas
e–co
ntrols
tudy
ofmed
ulloblas
tomas
and
PNET
sdiag
nose
dat
0to
5ye
arsfro
m19
91to
1997
.Cas
esan
dco
ntrols
wereas
certaine
dfro
mtheChildren'sOnc
olog
yGroup
and
rand
omdigitdialing,
resp
ectiv
ely.
Con
trols
werematch
edto
case
son
area
code
,rac
e,an
dbirthda
te(%
6mon
thsforca
ses
diag
nose
dat
<1ye
arof
age,%1ye
arforc
ases
diag
nose
dat
>1ye
arof
age).
318ca
ses,
318co
ntrols
Hea
dX-rayno
tdu
eto
head
injury
expo
sure
vs.n
one
OR,2
.3(0.91–
5.7)
d(65)
Materna
linterview
Pos
tnatalhe
adX-rayex
posu
revs
.non
eOR,1
.2(0.54–
2.5)
d
Pos
tnatal
dental
X-ray
expo
sure
vs.n
one
OR,1
.2(0.54–
2.5)
d
Any
postna
talX
-ray
expo
sure
vs.n
one
OR,1
.2(0.71–
2.0)
d
(Con
tinue
don
thefollo
wingpa
ge)
Childhood Brain Tumor Epidemiology Review
www.aacrjournals.org Cancer Epidemiol Biomarkers Prev; 23(12) December 2014 2723
on February 4, 2015. © 2014 American Association for Cancer Research. cebp.aacrjournals.org Downloaded from
Published OnlineFirst September 5, 2014; DOI: 10.1158/1055-9965.EPI-14-0207

Table3.
Rev
iew
ofrece
ntstud
iesad
dres
sing
ionizing
radiation–
relatedris
ksan
dCBTs
(Con
t'd)
Study
design
/pop
ulation
Sub
ject
numbe
r,radiation
mea
suremen
tmetho
dRad
iatio
nindica
tor
RR
(95%
CI)
Com
men
tRef.
Cas
e–co
ntrols
tudy
ofpren
atal/early
infanc
ydiag
nostic
radiationex
posu
rein
2,69
0ch
ildho
odca
ncer
case
san
d7,85
8co
ntrols.
Cas
eswerefrom
theUnitedKingd
omChildho
odCan
cerStudy
(UKCCS).Tw
oco
ntrols
perca
sewereas
certaine
dfrom
the
popu
latio
nregistrarm
atch
edon
sexan
dda
teof
birth(%
1mon
th).Study
subjec
tswerebo
rndu
ring19
76to
1996
.
25ex
pose
dCBTca
ses,
41ex
pose
dco
ntrols
Prena
tald
iagn
ostic
radiation
expo
sure
vs.n
one
OR,1
.06
(0.64–
1.77
)eEa
rly-in
fanc
yradiationex
posu
rewas
notsign
ifica
ntly
asso
ciated
with
CBTs
inan
alyses
that
cons
idered
nolatenc
yor
atw
o-ye
arlatenc
ype
riod.
(66)
Med
ical
reco
rdab
straction
Early
-infanc
ydiag
nostic
radiationex
posu
revs
.non
eOR,1
.06
(0.64–
1.77
)e
Retrosp
ectiv
eU.K.coh
orto
f176
,587
individu
als
expo
sedto
CTsc
ansdu
ringch
ildho
od.B
rain
tumor
case
swerediag
nose
dfrom
6to
45ye
arsdu
ring19
85to
2008
.
135ca
ses
CTsc
anex
posu
re(m
Gy)
ERRpe
rmGy¼
0.02
3(0.01–
0.04
9)
Nosp
ecificinform
ationwas
prov
ided
onCBTs
.(67)
Pap
eror
film
CTreco
rds
wereus
edto
mea
sure
expo
sure
andes
timate
dose
Cum
ulativedo
se#50
–74
vs.<
5mGy
RR,2
.82
(1.33–
6.03
)
Aus
tralianregistry
linka
gestud
yof
theMed
icare
andtheca
ncer
registry
that
includ
ed10
.9millionindividu
als.
Brain
tumor
case
swere
diag
nose
dthroug
htheire
arly40
sam
ong10
.9millionindividu
alsthat
includ
ed68
0,00
0CT
scan
–ex
pose
dsu
bjec
tsfrom
1985
to20
05.
283ca
ses
Any
CTex
posu
revs
.non
eIRR,2
.13
(1.88–
2.41
)fTh
eris
kde
crea
sedwith
numbe
rof
yearssinc
efirste
xpos
urean
dwith
increa
sing
calend
arye
arof
firstCT
scan
fora
geatex
posu
reag
egrou
ps1to
4an
d5to
9ye
ars.
(68)
Aus
tralianMed
icare
administrativeda
taba
seBrain
CTex
posu
revs
.non
eIRR,2
.44
(2.12–
2.81
)f
Other
CTsc
anvs
.non
eIRR,1
.51
(1.19–
1.91
)f
U.S.e
cologica
lstudy
cond
uctedin
St.Lu
cie
Cou
nty,Florida.CBTca
sesdiag
nose
dat
ages
0to
19ye
arsdu
ringthe19
50to
2000
perio
d.
13ca
ses
SMRgbe
fore
(195
6–19
75)a
ndafter(19
76–20
00)the
St.Lu
cie
Cou
ntynu
clea
rpow
erstation
installatio
nin19
76inSt.Lu
cie
Cou
ntyco
mpa
redwith
two
neighb
oringco
untie
s.
SMRbefore¼
0.87
(0.35–
2.20
)SMRswereca
lculated
usingge
neral
U.S.p
opulationmortalityrates.
(69)
SMRafter¼
0.96
(0.39–
2.06
)
a Adjus
tedfordiag
nosisgrou
p(leuk
emia,C
NS,o
ther).
bAdjus
tedforge
stationa
lage
.c A
djus
tedform
aterna
lage
,parity
,multip
lebirth,
mothe
rborninaNordicco
untry,ge
stationa
lage
atbirth,
mod
eof
delivery,bree
chpo
sitio
n,birthweigh
t,birthhe
adcircum
ferenc
e,leve
lofh
ospital,an
dhy
perten
sion
durin
gpreg
nanc
y;an
unad
justed
ORforep
endy
mom
awas
repo
rted
dueto
thelow
numbe
rof
case
s.dAdjus
tedforan
nual
hous
eholdinco
me>$
50,000
,mothe
r'sed
ucation,
andag
eof
child
atinterview.
e Adjus
tedforch
ildse
x,ag
eat
diag
nosis,
UKCCSstud
yregion
,birthweigh
t,materna
lage
,early-in
fanc
yradiation(1-yea
rlag),a
ndea
rlyultras
ound
scan
s(1-yea
rlag).
f Adjus
tedforag
e,se
x,ye
arof
birth,
includ
eson
e-ye
arlagpe
riod.
gStand
ardmortalityratio
.
Johnson et al.
Cancer Epidemiol Biomarkers Prev; 23(12) December 2014 Cancer Epidemiology, Biomarkers & Prevention2724
on February 4, 2015. © 2014 American Association for Cancer Research. cebp.aacrjournals.org Downloaded from
Published OnlineFirst September 5, 2014; DOI: 10.1158/1055-9965.EPI-14-0207

Table4.
Rev
iew
ofrece
ntstud
iesad
dres
sing
nonion
izingradiation–
relatedris
ksan
dCBTs
Study
design
/pop
ulation
Sub
ject
numbe
r,radiation
mea
suremen
tRad
iatio
nindica
tor
RR
(95%
CI)
Com
men
tsRef.
Sou
thKorea
nca
se–co
ntrols
tudy
ofradio-fre
quen
cyex
posu
refrom
AM-
radiotran
smitters.
CBTca
ses
diag
nose
dat
<15ye
ars.
Cas
ean
dco
ntrolsub
jectswereas
certaine
dfrom
theSou
thKorea
nMed
ical
Insu
ranc
eDataSystem.C
ontrolswith
resp
iratory
dise
ases
werematch
edto
case
son
agean
dse
xat
1:1ratio
.
956ca
ses,
3,08
2co
ntrols
Res
iden
tiald
istanc
eto
the
AM
tran
smitter
<2km
vs.
>20km
OR,1
.42
(0.38–
5.28
)aRad
io-frequ
ency
radiationex
posu
rewas
define
das
"the
high
estex
posu
rees
timateam
ongallthe
individu
alex
posu
rees
timates
obtained
from
each
tran
smitter
establishe
dbe
fore
the
subjec
ts'y
earof
diag
nosis."
(71)
Res
iden
tiala
ddress
esan
dGIS
pred
ictio
nprog
ram
toes
timate
radio-freq
uenc
yradiation
Estim
ated
radio-fre
quen
cyradiationexpo
sure
(mV/m)
fourth
vs.fi
rstq
uartile
OR,0
.77
(0.54–
1.10
)a
Meta-an
alysisof
stud
iesco
nduc
tedinthe
UnitedStates,
Swed
en,T
aiwan
,Den
mark,
Finlan
d,Norway
,United
Kingd
om,G
erman
y,an
dJa
panthat
exam
ined
reside
ntialm
agne
ticfield
expo
sure
[includ
ingdistan
ceto
overhe
adpo
wer
lines
,wire
code
s,ca
lculated
mag
netic
fields
,and
mag
netic
fieldmea
suremen
ts(spo
tor
long
-term
mea
suremen
ts)]an
dCBTs
.
25–6,60
5ca
ses,
57–6,60
5co
ntrols
Res
iden
tiald
istanc
eto
power
lines
<50m
vs.
#50
m(n
¼5stud
ies)
OR,0
.88
(0.57–
1.37
)Sev
eral
influe
ncean
alyses
didno
tmaterially
chan
getheresu
ltsan
dthe
funn
elplot
show
edno
eviden
ceof
publicationbias
.Whe
nco
nsidering
onlystud
iesthat
repo
rted
high
erdo
ses
(0.3
or0.4mT
),theco
mbine
dORwas
1.68
(95%
CI,0.83
–3.43
).Th
eau
thors
conc
lude
dthat
they
couldno
texc
lude
thepo
ssibility
ofan
increa
sedris
kat
high
erdo
sesbu
tforlower
dose
sthe
analyses
prov
ided
noev
iden
ceforan
increa
sedris
kof
CBTs
.
(72)
Distanc
eto
overhe
adpo
wer
lines
,wire
code
s,ca
lculated
mag
netic
fields
,and
mea
sured
mag
netic
fields
(spo
tor
long
-term
mea
suremen
ts)
Calcu
latedmag
netic
field
expo
sure
#2mT
vs.<
2mT
(n¼
4stud
ies)
OR,1
.13
(0.65–
1.95
)
Long
-term
mea
sured
expo
sure
#2mT
vs.<
2mT
,the
combine
d(n
¼4
stud
ies)
OR,1
.14
(0.65–
2.00
)
Highvs
.low
wire
code
curren
tco
nfigu
ratio
n(n
¼3stud
ies)
OR,1
.08
(0.6–1.98
)
Very
high
vs.low
wire
curren
tco
deco
nfigu
ratio
n(n
¼3
stud
ies)
OR,0
.83
(0.51–
1.36
)
Spo
tmea
suremen
t#2mT
vs.<
2mT
(n¼
3stud
ies)
OR,1
.13
(0.61–
2.10
)
(Con
tinue
don
thefollo
wingpa
ge)
Childhood Brain Tumor Epidemiology Review
www.aacrjournals.org Cancer Epidemiol Biomarkers Prev; 23(12) December 2014 2725
on February 4, 2015. © 2014 American Association for Cancer Research. cebp.aacrjournals.org Downloaded from
Published OnlineFirst September 5, 2014; DOI: 10.1158/1055-9965.EPI-14-0207
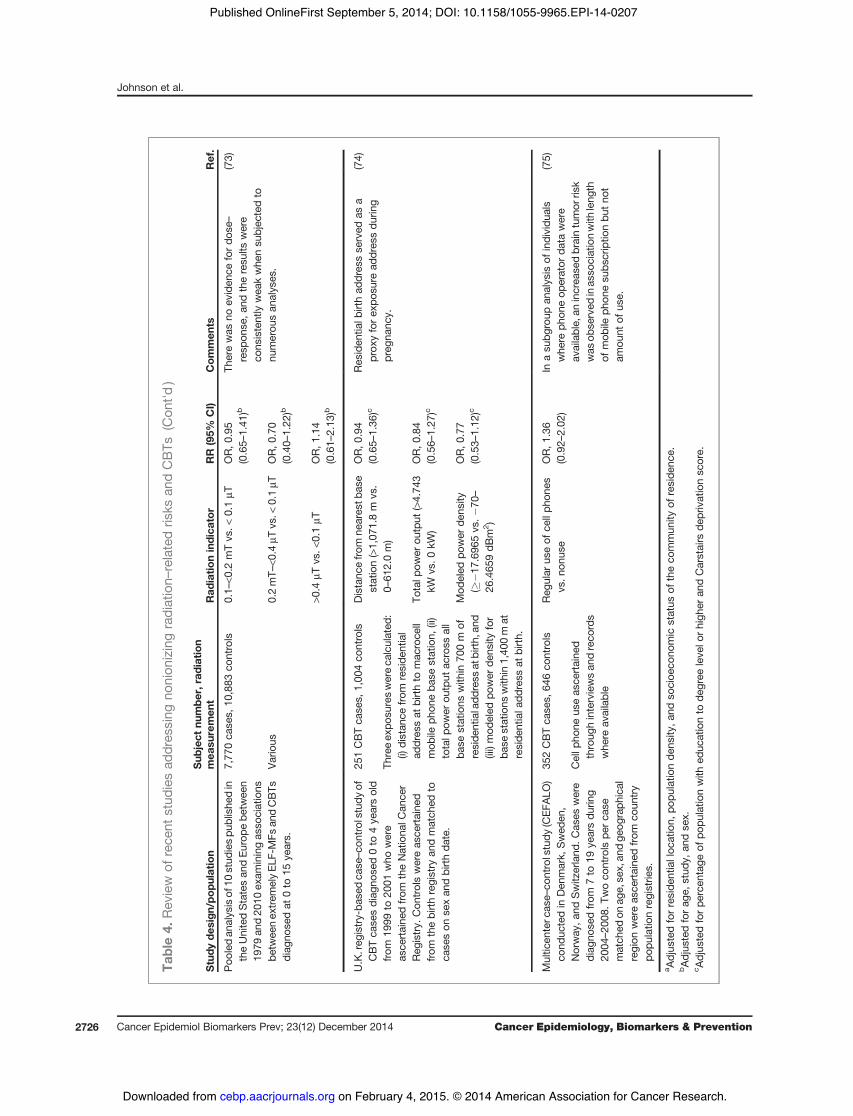
Table4.
Rev
iew
ofrece
ntstud
iesad
dres
sing
nonion
izingradiation–
relatedris
ksan
dCBTs
(Con
t'd)
Study
design
/pop
ulation
Sub
ject
numbe
r,radiation
mea
suremen
tRad
iatio
nindica
tor
RR
(95%
CI)
Com
men
tsRef.
Poo
ledan
alysisof
10stud
iespu
blishe
din
theUnitedStatesan
dEu
rope
betw
een
1979
and20
10ex
aminingas
sociations
betw
eenex
trem
elyEL
F-MFs
andCBTs
diag
nose
dat
0to
15ye
ars.
7,77
0ca
ses,
10,883
controls
0.1–
<0.2
mTvs
.<0.1mT
OR,0
.95
(0.65–
1.41
)bTh
erewas
noev
iden
cefordo
se–
resp
onse
,and
theresu
ltswere
cons
istently
wea
kwhe
nsu
bjec
tedto
numerou
san
alyses
.
(73)
Vario
us0.2mT–
<0.4
mTvs
.<0.1mT
OR,0
.70
(0.40–
1.22
)b
>0.4
mTvs
.<0.1mT
OR,1
.14
(0.61–
2.13
)b
U.K.reg
istry-ba
sedca
se–co
ntrolstudy
ofCBTca
sesdiag
nose
d0to
4ye
arsold
from
1999
to20
01who
were
asce
rtaine
dfrom
theNationa
lCan
cer
Reg
istry.
Con
trolswereas
certaine
dfrom
thebirthregistry
andmatch
edto
case
son
sexan
dbirthda
te.
251CBTca
ses,
1,00
4co
ntrols
Distanc
efro
mne
ares
tbas
estation(>1,07
1.8m
vs.
0–61
2.0m)
OR,0
.94
(0.65–
1.36
)cRes
iden
tialb
irthad
dres
sse
rved
asa
prox
yforex
posu
read
dres
sdu
ring
preg
nanc
y.
(74)
Threeex
posu
reswereca
lculated
:(i)
distan
cefrom
reside
ntial
addres
sat
birthto
mac
roce
llmob
ileph
oneba
sestation,
(ii)
totalp
ower
output
across
all
base
stations
with
in70
0m
ofreside
ntialadd
ress
atbirth,
and
(iii)mod
eled
power
dens
ityfor
base
stations
with
in1,40
0m
atreside
ntiala
ddress
atbirth.
Totalp
ower
output
(>4.74
3kW
vs.0
kW)
OR,0
.84
(0.56–
1.27
)c
Mod
eled
power
dens
ity(#
&17
.696
5vs
.&70
–
26.465
9dB
m2)
OR,0
.77
(0.53–
1.12
)c
Multic
enterc
ase–
controlstudy
(CEF
ALO
)co
nduc
tedin
Den
mark,
Swed
en,
Norway
,and
Switz
erland
.Cas
eswere
diag
nose
dfrom
7to
19ye
arsdu
ring
2004
–20
08.T
woco
ntrols
perca
sematch
edon
age,se
x,an
dge
ograph
ical
region
wereas
certaine
dfrom
coun
try
popu
latio
nregistrie
s.
352CBTca
ses,
646co
ntrols
Reg
ular
useof
cellph
ones
vs.n
onus
eOR,1
.36
(0.92–
2.02
)In
asu
bgroup
analysis
ofindividu
als
whe
reph
oneop
erator
data
were
available,
anincrea
sedbraintumor
risk
was
obse
rved
inas
sociationwith
leng
thof
mob
ileph
onesu
bscriptio
nbu
tno
tam
ount
ofus
e.
(75)
Cellp
hone
useas
certaine
dthroug
hinterviewsan
dreco
rds
whe
reav
ailable
a Adjus
tedforreside
ntialloc
ation,
popu
latio
nde
nsity
,and
socioe
cono
mic
status
oftheco
mmun
ityof
reside
nce.
bAdjus
tedforag
e,stud
y,an
dse
x.c A
djus
tedforpe
rcen
tage
ofpo
pulatio
nwith
educ
ationto
degree
leve
lorhigh
eran
dCarstairs
deprivationsc
ore.
Johnson et al.
Cancer Epidemiol Biomarkers Prev; 23(12) December 2014 Cancer Epidemiology, Biomarkers & Prevention2726
on February 4, 2015. © 2014 American Association for Cancer Research. cebp.aacrjournals.org Downloaded from
Published OnlineFirst September 5, 2014; DOI: 10.1158/1055-9965.EPI-14-0207
during pregnancy treated with and without drugs,respectively (79).A Taiwanese pregnancy cohort study examined mater-
nal use of herbal medicines (Coptidis Rhizoma, An-Tai-Yin, and other herbs) and reported an increased HR forbrain tumors in association with Coptidis Rhizoma (HR,4.79; 95% CI, 1.28–17.91; ref. 80).A Swedish registry–based linkage study used medical
record data to examine associations between maternalmedication ascertained from medical records and off-springCBTs from0 to 14 years.No significant associationswere found for alimentary tract medicines (mainly anta-cids and laxatives), vitamins and iron, folic acid (FA),diuretics, antiinfectives (antifungals, penicillin, antibio-tics), analgesics [Aspirin/NSAID, Opioids, Paracetamol(acetaminophen), antiemetics, antihistamines, neu-roleptics], antiasthmatics (oral and inhalation therapy).In contrast, maternal antihypertensives (OR, 2.7; 95% CI,1.1–6.5) were positively associated with offspring CBTs,especially for b-blockers (OR, 5.3; 95%CI, 1.2–24.8; ref. 81).A German case–control study reported significantly
increased risks for CNS tumors overall (OR, 1.56; 95% CI,1.01–2.40),medulloblastoma (OR, 2.07; 95%CI, 1.03–4.17),and astrocytoma (OR, 2.26; 95% CI, 1.09–4.69), but notependymoma (OR, 1.23; 95% CI, 0.37–4.13) in associationwith maternal prenatal antibiotic use. For maternal anti-biotic exposure, including the three months before preg-nancy through pregnancy, the associations were lessstrong and not significant for CNS tumors overall (OR,1.37; 95% CI, 0.92–2.05), medulloblastoma (OR, 1.79; 95%CI, 0.92–3.48), astrocytoma (OR, 1.79; 95% CI, 0.87–3.70),or ependymomas (OR, 0.95; 95% CI, 0.28–3.17; ref. 82).Maternal antibiotic use during pregnancy was also
examined in a Canadian case–control study that included272 case–control pairs. Cases were diagnosed at <15 yearsof age from 1980 to 1999. A nonsignificant positive asso-ciation between CBTs and prenatal antibiotic exposure(OR, 1.7; 95% CI, 0.8–3.6) was reported (43).Maternal nutrition. Prenatal vitamins/FA Relatively
consistent evidence from earlier studies for a protectiveeffect of prenatal vitamins on offspringCBT risk (reviewedin ref. 83) has been reported. A 2007 German case–controlstudy (79) reported no significant association betweenCBTs andmaternally reported vitamin, folate, and/or ironsupplements (OR, 1.07; 95% CI, 0.85–1.34). A U.S. case–control study of 315medulloblastomas/PNETs diagnosedfrom 0 to 5 years old from 1991 to 1997 reported noassociation for periconception (OR, 1.2; 95% CI, 0.8–2.1)or mid-pregnancy (OR, 1.1; 95% CI, 0.7–1.6) dietary folateintakewhen comparing the highestwith lowest quartile ofintake (84). In a later report, the authors reported an OR of0.7 (95% CI, 0.4–1.0) for preconception multivitamin use.For dietary folate with supplements, the periconceptionand mid-pregnancy ORs for the highest versus lowestintake quartile category (#380 mg vs. <267 mg) were 0.5(95%CI, 0.3–0.9) and 0.3 (95%CI, 0.5–1.3)with a significanttrend for increasing periconceptional intake (P ¼ 0.007;ref. 85). A Swedish study reported a nonsignificant inverse
association for FA supplementation (OR, 0.6; 95% CI, 0.3–1.1; ref. 81).
A 2010 case–case study compared maternal FA supple-ment intake in nervous system tumors (n ¼ 44) versusmesodermal tumor (n ¼ 155) cases diagnosed in childrenages 0 to 14 years old during the 2004 to 2006 period. TheORs for#400 versus <400 mg/daywere 0.34 (95%CI, 0.10–1.06), 0.19 (95% CI, 0.06–0.6), 0.57 (95% CI, 0.33–0.99), and0.94 (95% CI, 0.79–1.14) for preconceptional, <21 daysgestation, <36 days gestations, and any period, respective-ly.Multivitamin supplementationwas also inversely asso-ciated with CNS tumors for first (OR, 0.29; 95% CI, 0.09–0.92), second (OR, 0.18; 95% CI, 0.02–1.35), and any (OR,0.22; 95% CI, 0.07–0.68) trimester intake (86). A 2012 Aus-tralian studyof 327CBT cases diagnosed from0 to 14 yearsbetween 2005 and 2010 and 867 controls reported inverseassociations during pre-pregnancy for maternal FA sup-plement intake (OR, 0.68; 95% CI, 0.46–1.01) and FA sup-plementwithout iron, vitaminsB6, B12,C, orA intake (OR,0.55; 95% CI, 0.32–0.93). No significant associations werefound for FA supplement intake during trimester 1 or 2/3.Associations were also inverse for pre-pregnancy use forlow-grade gliomas (LGGs) (n ¼ 109) and medulloblasto-mas/PNETs (n¼ 47) for any FA versus no FA supplementuse (87).
Finally, two ecological studies reported CBT incidencetrends in association with mandatory population FAfortification of grain and cereal products. When CBTincidence before and after fortification (1985–1997 to1998–2006) was compared in a Canadian study, IRRs forchildren ages 0 to 4 and 5 to 9 years old of 0.95 (95% CI,0.75–1.19) and0.91 (95%CI, 0.73–1.13)were found, respec-tively (88).A similarly designedU.S. study examinedCBTincidence patterns from 1986 to 2008 for children diag-nosed between 0 and 4 years old by comparing rates forthosewhowere estimated to be in utero before versus afterfortification in 1998. On the basis of 573 prefortificationand 454 postfortification CBT cases, the authors reportedsignificantly lower incidence rates after fortification ver-sus before for PNETs (IRR, 0.56; 95% CI, 0.37–0.84) andependymomas (IRR, 0.7; 95% CI, 0.51–0.97) but not otherbrain tumor types or overall. Trend analyses indicatedthat the data were consistent with a fortification effect forPNETs but not ependymomas (89).
Dietary NOCs Studies of rodents and non-human pri-mates have provided evidence that maternal intake ofdietaryNOCs, particularlyN-nitrosamides, induces braintumors in offspring. However, their contribution tohuman CBTs is less clear. Direct NOC sources includenitrite-cured and smoked meat, fish, cheese, and beer,whereas vegetables containing nitrites that can undergoconversion to NOCs are an indirect NOC source(reviewed in ref. 90). A 2004 meta-analysis that included1,226 CBT cases and 1,768 controls from seven studiesreported a summary RR of 1.68 (95% CI, 1.30–2.17) for theassociationbetweenCBTsandmaternal curedmeat intakeduring pregnancy versus no intake (91). Since 2004, astudy of 315 medulloblastoma/PNET cases and 315
Childhood Brain Tumor Epidemiology Review
www.aacrjournals.org Cancer Epidemiol Biomarkers Prev; 23(12) December 2014 2727
on February 4, 2015. © 2014 American Association for Cancer Research. cebp.aacrjournals.org Downloaded from
Published OnlineFirst September 5, 2014; DOI: 10.1158/1055-9965.EPI-14-0207

controls reported no overall association betweenmaternalprenatal curedmeat intake and offspring CBTs; however,maternal high curedmeat intake in combination with lowvitamin C intake increased risk (OR, 1.5; 95% CI, 1.0–2.3;P ¼ 0.08; ref. 85). An international case–control study of1,218 CBT cases and 2,223 controls diagnosed from ages0 to 19 years old from 1982 to 1992 reported positiveassociations with ORs ranging from 1.8 to 2.5 acrossastrocytoma subtypes (92). Finally, one study of 202cases and 286 controls examined the associationbetween maternal cured meat consumption and CBTs,which was modified by glutathione S-transferase (GST)genotypes involved in NOC inactivation. Increasingrisk with increasing frequency of maternal cured meatconsumption in children without GSTT1 (OR, 1.29; 95%CI, 1.07–1.57) was reported (93). Altogether, a causalconnection between maternal intake of NOCs and CBTsis possible; however, other nutrients as well as geneticfactors may modify risk.
Parental smoking and alcohol. Alcohol exposure inutero is a known toxin to the developingCNS.However, inagreement with earlier studies (94), a recent large case–control study did not support maternal consumption as arisk factor for offspring CBTs (95).
The relation between maternal tobacco exposure andCBTs has been studied previously in case–control studieswith no significant associations (96–99). Only one recentprospective Swedish linkage study found an associationwith maternal smoking for CBTs (benign and malignanttumors, HR, 1.24; 95% CI, 1.01–1.53; ref. 100). A recentstudy assessed neonatal blood spots from 202 cases forgenetic polymorphisms that metabolize tobacco-smokechemicals and reported that the EPHX1 H139R polymor-phism, one of nine polymorphisms thatmetabolizes poly-cyclic aromatic hydrocarbons, had a positive interactionOR for both maternal and paternal smokers with CBTs inoffspring (P interaction ¼ 0.02 and 0.10; ref. 101).
Parental occupation. Pesticide exposure. Althoughseveral studies suggest a causal relation between residen-tial pesticide exposure and CBTs (reviewed in 2007, seeref. 102; see also residential pesticides section below),results from studies of parental occupational exposureare less consistent. These inconsistencies could be due toheterogeneous definition of "child" (ranging from 0 to 30years old), difficulties in separating parental occupationalexposure from residential use generic definitions of pes-ticides (i.e., "pesticides" instead of a specific compound),and inconsistent definitions of exposure time windows.
In a Northern England cancer registry study (n ¼ 843CNS tumors; ages 0–24 years old), no association betweenlikelypaternal occupational pesticide exposure (at the timeof the child’s birth) and childhood CNS tumor risk wasfoundwhen comparing caseswith other cancer controls incontrast to population controls where inverse associationswere observed for all CNS tumors (OR, 0.44, 95% CI, 0.31–0.63) and astrocytomas (OR, 0.48; 95%CI, 0.27–0.87). How-ever, the inverse associationsdisappearedwhen the resultswere stratified by urban versus rural residence (103).
In the U.S. Atlantic Coast Childhood Brain CancerStudy, 421 case–control pairs <10 years were analyzed(104). A positive associationwas observed between pater-nal exposure to herbicides from both residential andoccupational sources in the two years before the child’sbirth and astrocytoma (OR, 1.8; 95% CI, 1.1–3.1) withno evidence of an increased risk for fungicides orinsecticides.
TheAustralian Study ofChildhoodBrain Tumors (Aus-CBT) included 256 cases and819 controls ages 0 to 14 yearsold. Although the authors concluded that exposure topesticides in preconception aswell as during pregnancy isassociated with an increased CBT risk, the evidence wasless clear for parental occupational exposure specifically.Only 13 fathers were classified as "exposed" to occupa-tional pesticides in the year before pregnancy (OR, 1.36;95% CI, 0.66–2.80; ref. 105).
In a meta-analysis of this topic including studies pub-lished between 1985 and 2008, there was a significantpositive association between CBTs and paternal (OR,1.40; 95% CI, 1.20–1.62) but not maternal occupationalpesticide exposure (106). In a second meta-analysis ofstudies published between 1974 and 2010, a positiveassociation between parents who had potential prenataloccupational pesticide exposure (including farm/agricul-tural workers, pesticide applicators, pesticide manufac-turers, andothers such as gardeners, greenhouseworkers,etc.) and offspring brain tumors was reported after com-bining all case–control (summary OR, 1.30; 95% CI, 1.11–1.53) or cohort (summary rate ratio, 1.53; 95% CI, 1.20–1.95) studies (107).
ELF exposure. Previous studies examining the possibleassociation between parental occupational ELF exposurein different exposure time windows and CBTs are incon-sistent (108). A recent U.K. registry-based case–controlstudy of CNS tumors examined associations with likelypaternal occupational exposure to the broad category ofradiation or electromagnetic fields, applying an occupa-tional exposure matrix to jobs reported on birth certifi-cates (109). No association was observed with all CNStumors combined or for ependymomas, astrocytomas,PNETs, other gliomas, or other specified intracranial andintraspinal neoplasms.
A 2009 Canadian study of 548 incident CBTs (ages 0–14years old) and 760 control subjects assessed potentialassociationswith indicators ofmaternal occupational ELFexposure based on individualized exposure estimates or ajob exposure matrix (JEM) applied to job history infor-mation collected during interview (110). Positive associa-tions between average ELF exposure #90th percentile(0.30 mT) but not cumulative or peak exposure in thetwo-year period before conception were observed forCBTs overall (OR, 1.4; 95% CI, 1.0–2.1) and astroglialtumors specifically (OR, 1.5; 95% CI, 1.0–2.4). Positiveassociations between average ELF exposure #90th per-centile (0.28 mT) during the pregnancy period were alsoobserved for all CBTs (OR, 1.5; 95% CI, 1.1–2.2) andastroglial tumors (OR, 1.6; 95% CI, 1.1–2.5).
Johnson et al.
Cancer Epidemiol Biomarkers Prev; 23(12) December 2014 Cancer Epidemiology, Biomarkers & Prevention2728
on February 4, 2015. © 2014 American Association for Cancer Research. cebp.aacrjournals.org Downloaded from
Published OnlineFirst September 5, 2014; DOI: 10.1158/1055-9965.EPI-14-0207

A German case–control study of 444 child CNS tumors(0–14 years) from the German Childhood Cancer Registryand 444 controls recruited through resident registrationoffice files examined associations with preconceptionalparental occupational exposure to ELF estimated using aJEM applied to lifetime occupational histories collectedduring interview (111). No clear associationwas observedwithpreconceptional paternal occupational ELF exposure>0.2 mT (OR, 1.06; 95% CI, 0.84–1.34) or >1 mT (OR, 1.19;95%CI, 0.81–1.75). Similarly, no associationwas observedwith preconceptional maternal occupational ELF expo-sure >0.2 mT (OR, 0.88; 95% CI, 0.58–1.33).Other parental occupational exposures. In recent analy-
ses, a Taiwanese case–control study including 74 incidentbrain tumor cases <30 years old and 170 controls reportedpreliminary results thatCBTswere associatedwithmater-nal preconceptional occupations for electronic parts andcomponentmanufacturing (OR, 11.81; 95%CI, 1.20–116.3)and the textile and garment industry (OR, 7.25, 95% CI,1.18–31.0; ref. 112). In contrast, analyses of the completestudy of 202 CBT cases and 501 controls revealed noassociations with parental (paternal or maternal) or per-sonal occupation or industry for brain tumor risk overall,or with glioma specifically, nor with parental exposure topetrochemicals. A complete list of the industries/occupa-tions studies is not included in the article. Selected indus-tries/occupations studied included agriculture, forestry,fishing; electricity, gas, and water; clerks; plant andmachine operators and assemblers; construction; andcraft and related trades workers (113).An Australian population-based case–control study
examined associations between parental occupationalexposure to engine exhausts and brain tumors in childrenages 0 to 14 years (114). A total of 306 CBT cases wereexamined with 950 controls. Estimates of paternal andmaternal exposure to diesel, petrol, and other exposuresone and two years before birth and the year followingbirth were inferred based on a decision-rule approach.Significant positive associations for maternal (OR, 2.03;95% CI, 1.09–3.81) and paternal (OR, 1.38; 95% CI, 1.02–1.86) diesel exhaust exposure any time before birth wereobserved. Paternal occupational exposures to petrol andother exhausts were also studied; however, no significantassociation at any time before birth was found (OR, 1.31;95% CI, 0.92–1.87). No associations between CBTs andoccupational exposures to other exhausts were observed.Associations between CBTs and paternal occupationalpaint exposure were also examined with small positiveassociations reported for any paternal exposure before thechild’s birth (OR, 1.32; 95% CI, 0.90–1.92) or in the con-ception year (OR, 1.25; 95% CI, 0.69–2.28; ref. 115).In a case–control study of 1,218 CBT cases (0–19 years)
and 2,223 controls in seven countries, there was a signif-icant positive association between paternal preconcep-tional occupational exposure to polycyclic aromatichydrocarbons (PAH) and risk of all childhood brain (OR,1.3; 95%CI, 1.1–1.6) andastroglial tumors (OR, 1.4; 95%CI,1.1–1.7; ref. 116). These results are generally consistent
with previous studies on parental occupational PAHexposure (117).
A South Korean study that linked birth to death recordsfrom 1995 to 2004 classified parental occupation (listed onbirth certificate) as nonmanual (e.g., legislators, profes-sionals, office workers), manual (e.g., skilled agricultural,forestry and fishery workers, craft and affiliated craftworkers, device and machine operators), and economi-cally inactive (e.g., students, homemakers, soldiers). ForCNS tumors, the HRs for paternal and maternal occupa-tion were not significant (comparing manual and inactivework with nonmanual work). Likewise, when stratifiedby paternal education level, paternal occupation was notassociated with childhood CNS tumors (118).
Lastly, a case–control study of 11,119 CNS tumors diag-nosed at ages <15 years from the Great Britain NationalRegistry of Childhood Tumors and 11,039 matched con-trols from birth records examined potential associationswith 33 paternal occupational exposures as well as socialclass based on job title recorded at birth (119). Significantpositive associations were observed with "definite" pater-nal occupational exposure to animals (OR, 1.40; 95% CI,1.01–1.96) and lead (OR, 1.18; 95% CI, 1.01–1.39) and a sig-nificant inverse association with metal working (oil mists;OR, 0.87; 95% CI, 0.75–0.99). There was also a significantinverse association with paternal social class. Associationswere also observed with paternal occupational exposuresand specific CNS subtypes; however, they were somewhatsensitive to adjustment for paternal social class.
Residential pesticides. Pesticides are designed to acton the nervous system with some being carcinogenic inanimal models (120). Numerous studies have investigatedthe potential impact of use of household pesticides, pestextermination services on CBT development (117, 121).Overall, these studies suggest positive associations withCBTs. In a meta-analysis, increased CBT risks in associa-tion with paternal pesticide use (herbicides, insecticides,and fungicides) in the home or garden during the prenatal(OR, 1.48; 95%CI, 1.22–1.80) or postnatal (OR, 1.66; 95%CI,1.11–2.49) periodswere reported (106). AU.S. case–controlstudy found that parental use of garden or lawnherbicideswas significantly associated with childhood astrocytoma(RR, 1.9; 95% CI, 1.2–3.0) for children ages !10 years oldbut not PNETs and medulloblastomas (104). However,another case–control study of PNET/medulloblastomareported an association with use of pesticides on the lawnduring pregnancy (OR, 1.6; 95% CI, 1.0–2.5) or childhood(OR, 1.8; 95% CI, 1.2–2.8) for children ages!6 years old atdiagnosis (122).
Finally, a case–control study investigated genetic var-iation in the paraoxonase (PON1) gene that is involved inthe organophosphorus insecticide metabolism and CBTrisk. CBT risk increased with each PON1-108T allele thechild carried in children exposed to residential insecti-cides (OR, 2.6; 95% CI, 1.2–5.5) but not among unexposedchildren (OR, 0.9; 95% CI, 0.5–1.6; ref. 123). Research in anexpanded study population also found the associationwith PON1 (OR, 1.8; 95% CI, 1.1–3.0) and FMO1-9536A
Childhood Brain Tumor Epidemiology Review
www.aacrjournals.org Cancer Epidemiol Biomarkers Prev; 23(12) December 2014 2729
on February 4, 2015. © 2014 American Association for Cancer Research. cebp.aacrjournals.org Downloaded from
Published OnlineFirst September 5, 2014; DOI: 10.1158/1055-9965.EPI-14-0207
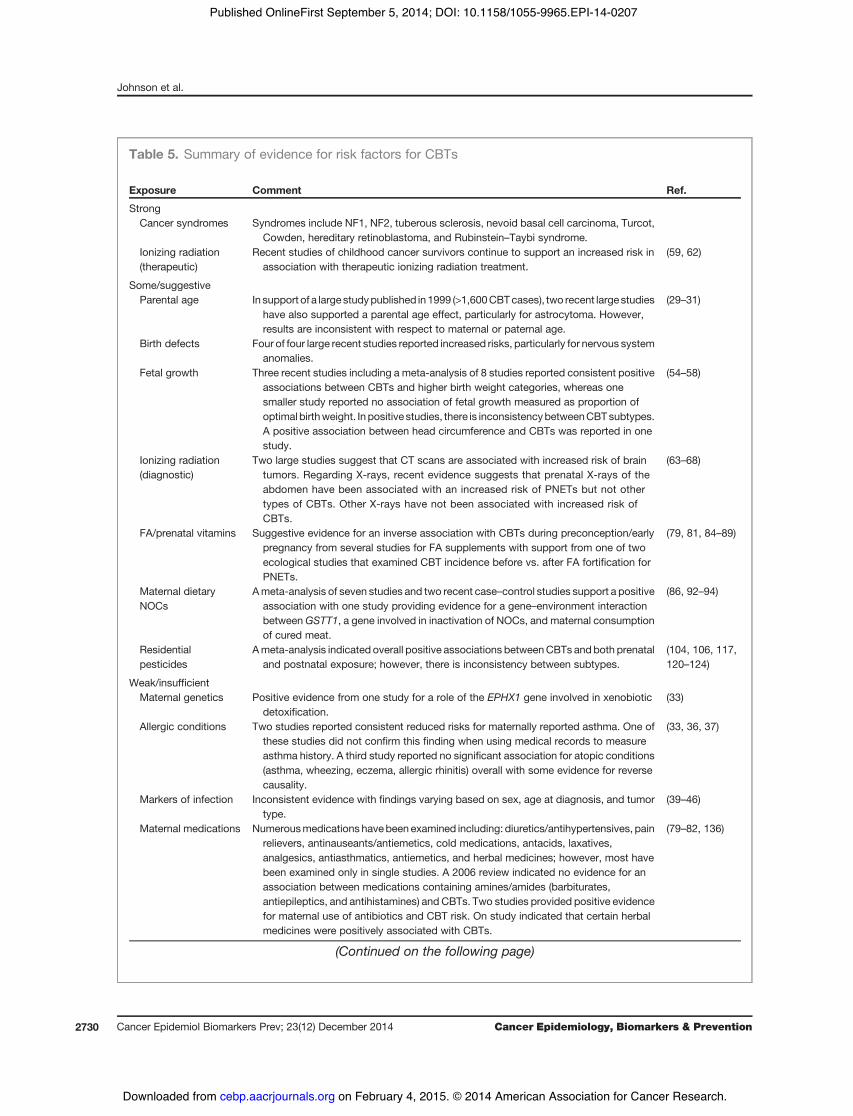
Table 5. Summary of evidence for risk factors for CBTs
Exposure Comment Ref.
StrongCancer syndromes Syndromes include NF1, NF2, tuberous sclerosis, nevoid basal cell carcinoma, Turcot,
Cowden, hereditary retinoblastoma, and Rubinstein–Taybi syndrome.Ionizing radiation(therapeutic)
Recent studies of childhood cancer survivors continue to support an increased risk inassociation with therapeutic ionizing radiation treatment.
(59, 62)
Some/suggestiveParental age In support of a large studypublished in 1999 (>1,600CBTcases), two recent large studies
have also supported a parental age effect, particularly for astrocytoma. However,results are inconsistent with respect to maternal or paternal age.
(29–31)
Birth defects Four of four large recent studies reported increased risks, particularly for nervous systemanomalies.
Fetal growth Three recent studies including a meta-analysis of 8 studies reported consistent positiveassociations between CBTs and higher birth weight categories, whereas onesmaller study reported no association of fetal growth measured as proportion ofoptimal birthweight. In positive studies, there is inconsistencybetweenCBTsubtypes.A positive association between head circumference and CBTs was reported in onestudy.
(54–58)
Ionizing radiation(diagnostic)
Two large studies suggest that CT scans are associated with increased risk of braintumors. Regarding X-rays, recent evidence suggests that prenatal X-rays of theabdomen have been associated with an increased risk of PNETs but not othertypes of CBTs. Other X-rays have not been associated with increased risk ofCBTs.
(63–68)
FA/prenatal vitamins Suggestive evidence for an inverse association with CBTs during preconception/earlypregnancy from several studies for FA supplements with support from one of twoecological studies that examined CBT incidence before vs. after FA fortification forPNETs.
(79, 81, 84–89)
Maternal dietaryNOCs
Ameta-analysis of seven studies and two recent case–control studies support a positiveassociation with one study providing evidence for a gene–environment interactionbetweenGSTT1, a gene involved in inactivation of NOCs, and maternal consumptionof cured meat.
(86, 92–94)
Residentialpesticides
Ameta-analysis indicated overall positive associations betweenCBTs andboth prenataland postnatal exposure; however, there is inconsistency between subtypes.
(104, 106, 117,120–124)
Weak/insufficientMaternal genetics Positive evidence from one study for a role of the EPHX1 gene involved in xenobiotic
detoxification.(33)
Allergic conditions Two studies reported consistent reduced risks for maternally reported asthma. One ofthese studies did not confirm this finding when using medical records to measureasthma history. A third study reported no significant association for atopic conditions(asthma, wheezing, eczema, allergic rhinitis) overall with some evidence for reversecausality.
(33, 36, 37)
Markers of infection Inconsistent evidence with findings varying based on sex, age at diagnosis, and tumortype.
(39–46)
Maternal medications Numerousmedications havebeen examined including: diuretics/antihypertensives, painrelievers, antinauseants/antiemetics, cold medications, antacids, laxatives,analgesics, antiasthmatics, antiemetics, and herbal medicines; however, most havebeen examined only in single studies. A 2006 review indicated no evidence for anassociation between medications containing amines/amides (barbiturates,antiepileptics, and antihistamines) and CBTs. Two studies provided positive evidencefor maternal use of antibiotics and CBT risk. On study indicated that certain herbalmedicines were positively associated with CBTs.
(79–82, 136)
(Continued on the following page)
Johnson et al.
Cancer Epidemiol Biomarkers Prev; 23(12) December 2014 Cancer Epidemiology, Biomarkers & Prevention2730
on February 4, 2015. © 2014 American Association for Cancer Research. cebp.aacrjournals.org Downloaded from
Published OnlineFirst September 5, 2014; DOI: 10.1158/1055-9965.EPI-14-0207

('6) allele (OR, 2.7; 95% CI, 1.2–5.9) among pesticide-exposed children exclusively (124).
Summary and Future DirectionsEstablished CBT risk factors remain limited to ionizing
radiation exposure and certain cancer syndromes. How-ever, accumulating evidence suggests relatively consis-tent support from larger studies and meta-analyses forpositive associations between advanced parental age,birth defects, markers of fetal growth, CT scans, maternaldietary NOCs, and residential pesticide exposure (sum-marized in Table 5 and Fig. 1).A priority area for future CBT epidemiologic research is
the elucidation of both common and rare genetic riskvariants that modify risk. Although it is well establishedthat certain genetic syndromes strongly increase CBT risk,no genome-wide association studies that identify commonrisk variants were published at the time of this review.Identification of common genetic loci as well as potentialparental genetic loci that modify CBT risk overall and bysubtype will inform CBT biology. Identification of raregermline CBT risk variants through genome sequencingstudies will also be an important future research priority.With the exception of higher doses of ionizing radi-
ation, no definitive environmental risk factors for CBTdevelopment exist. However, our review suggests thatmaternal dietary intake of NOCs, prenatal vitamin sup-plementation, and residential pesticide exposure mayincrease risk. Inherent limitations of case–control stud-ies, including small sample sizes, survey measurementerror, and selection bias, make it difficult to reachdefinitive conclusions. Finally, emerging evidence from
two administrative data analyses suggests that expo-sure to CT scans increases brain tumor risk, emphasiz-ing the importance of minimizing radiation exposurefrom diagnostic tests to the extent possible in children tomitigate cancer risk.
In summary, it is likely that the greatest gains inunderstanding of CBT etiology in the near future willcome from genomic studies that identify genetic factorsthat modify CBT risk overall and by subtype. It will alsobe important to identify interactions between geneticand environmental factors and to conduct studies thatintegrate germline and somatic tumor sequence data todetermine how germline variation influences tumormutation profiles and prognosis. For progress in theseareas to occur, a coordinated investment in systematiccollection of clinically annotated biospecimens (bothtumor and normal) from a large number of CBT casesshould be an international priority because cancer is aleading cause of death in children and CBTs have thehighest cancer mortality rate among childhood cancers(125). In the United States alone, there are >2,000 chil-dren diagnosed each year with brain tumors, represent-ing a substantial population that could be approachedfor research participation during clinic visits whererecruitment success has been shown to be higher(126). A clear need also exists for increased internationalcoordination to make samples available through stan-dardized processes to all researchers with meritoriousproposals. A step forward in this direction was recentlyachieved through funding of a biospecimen bank thatwill store samples from children diagnosed with cancerat a Children’s Oncology Group Institution that
Table 5. Summary of evidence for risk factors for CBTs (Cont'd )
Exposure Comment Ref.
Parental occupationalexposures
Inconsistent findings that could be due to difficulties in separating parental occupationalexposure to pesticides from residential use, generic definitions of pesticides, andinconsistent definitions of time windows of exposure. However, two large meta-analyses support a positive association parental occupational pesticide exposure andoffspring CBT risk. For parental occupational ELF exposure, studies are inconsistent.For various other parental occupational exposures (electronic parts, textiles, engineexhausts, petrochemicals, poly aromatic hydrocarbons, paints), there is limited studyof the same exposure in different study populations and interpretations are limited dueto small study sizes and the need for replication.
(103–107,109–116,118, 119)
Little/noneFamily history Overall, the evidence for a positive association is limited, suggesting that there is not a
strong genetic component to most CBT cases.(27, 28)
Nuclear power plants One report showed no evidence of an association. (69)Nonionizing radiation There is an overall lack of association observed between several types of nonionizing
radiation (residential AM-radio transmission, residential magnetic field exposure, ELF-MF, maternal radio-frequency exposure from cell phone base stations, and cell phoneuse among 7- to 19-year-olds), but findings not replicated.
(69, 71–75)
Parental alcohol andsmoking
No evidence from one recent study of maternal alcohol consumption during pregnancy,in agreement with earlier studies. There is limited evidence for parental smoking as arisk factor for CBT development.
(71–75, 94–101)
www.aacrjournals.org Cancer Epidemiol Biomarkers Prev; 23(12) December 2014 2731
Childhood Brain Tumor Epidemiology Review
on February 4, 2015. © 2014 American Association for Cancer Research. cebp.aacrjournals.org Downloaded from
Published OnlineFirst September 5, 2014; DOI: 10.1158/1055-9965.EPI-14-0207
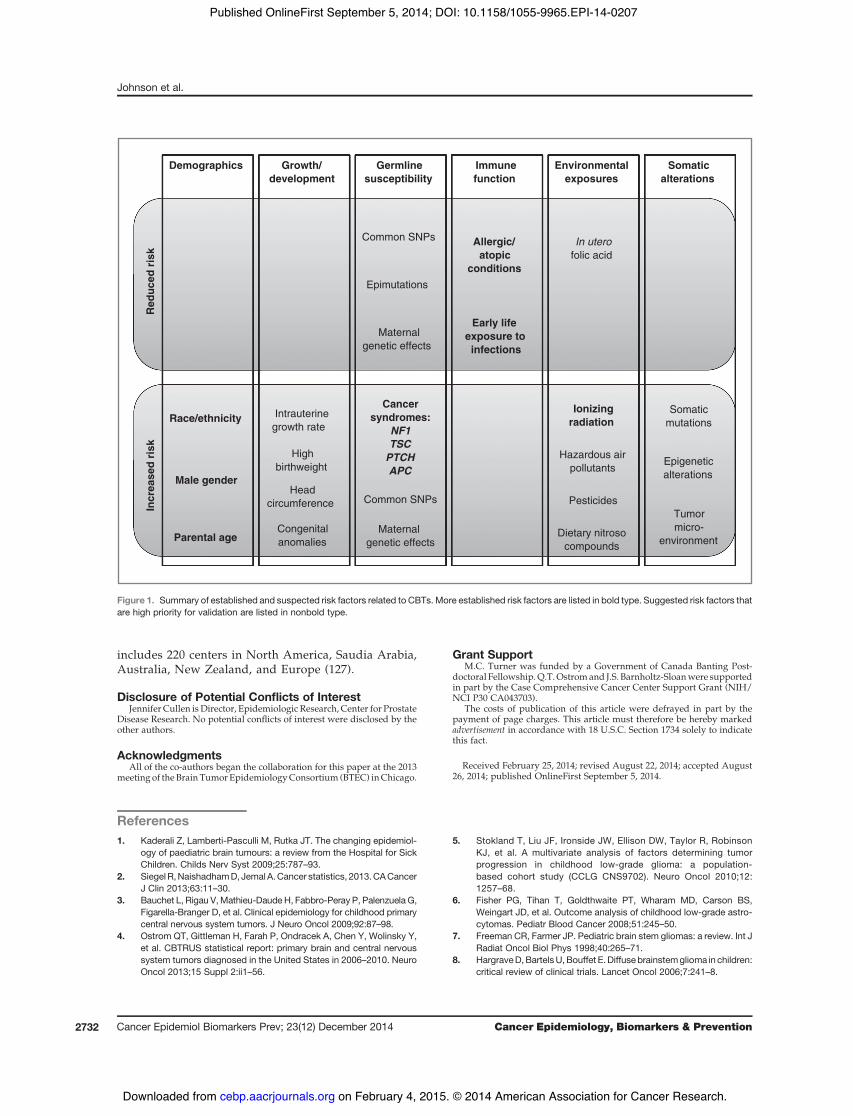
includes 220 centers in North America, Saudia Arabia,Australia, New Zealand, and Europe (127).
Disclosure of Potential Conflicts of InterestJennifer Cullen is Director, Epidemiologic Research, Center for Prostate
Disease Research. No potential conflicts of interest were disclosed by theother authors.
AcknowledgmentsAll of the co-authors began the collaboration for this paper at the 2013
meeting of theBrain TumorEpidemiologyConsortium (BTEC) inChicago.
Grant SupportM.C. Turner was funded by a Government of Canada Banting Post-
doctoral Fellowship.Q.T.Ostromand J.S. Barnholtz-Sloanwere supportedin part by the Case Comprehensive Cancer Center Support Grant (NIH/NCI P30 CA043703).
The costs of publication of this article were defrayed in part by thepayment of page charges. This article must therefore be hereby markedadvertisement in accordance with 18 U.S.C. Section 1734 solely to indicatethis fact.
Received February 25, 2014; revised August 22, 2014; accepted August26, 2014; published OnlineFirst September 5, 2014.
References1. Kaderali Z, Lamberti-Pasculli M, Rutka JT. The changing epidemiol-
ogy of paediatric brain tumours: a review from the Hospital for SickChildren. Childs Nerv Syst 2009;25:787–93.
2. Siegel R,NaishadhamD, JemalA.Cancer statistics, 2013.CACancerJ Clin 2013;63:11–30.
3. Bauchet L, Rigau V,Mathieu-Daude H, Fabbro-Peray P, Palenzuela G,Figarella-Branger D, et al. Clinical epidemiology for childhood primarycentral nervous system tumors. J Neuro Oncol 2009;92:87–98.
4. Ostrom QT, Gittleman H, Farah P, Ondracek A, Chen Y, Wolinsky Y,et al. CBTRUS statistical report: primary brain and central nervoussystem tumors diagnosed in the United States in 2006–2010. NeuroOncol 2013;15 Suppl 2:ii1–56.
5. Stokland T, Liu JF, Ironside JW, Ellison DW, Taylor R, RobinsonKJ, et al. A multivariate analysis of factors determining tumorprogression in childhood low-grade glioma: a population-based cohort study (CCLG CNS9702). Neuro Oncol 2010;12:1257–68.
6. Fisher PG, Tihan T, Goldthwaite PT, Wharam MD, Carson BS,Weingart JD, et al. Outcome analysis of childhood low-grade astro-cytomas. Pediatr Blood Cancer 2008;51:245–50.
7. Freeman CR, Farmer JP. Pediatric brain stem gliomas: a review. Int JRadiat Oncol Biol Phys 1998;40:265–71.
8. HargraveD,BartelsU,Bouffet E.Diffuse brainstemglioma in children:critical review of clinical trials. Lancet Oncol 2006;7:241–8.
Incr
ease
d ri
skR
educ
ed r
isk
Demographics Growth/development
Germlinesusceptibility
Immunefunction
Environmentalexposures
Somaticalterations
Race/ethnicity
Male gender
Parental age
Intrauterinegrowth rate
Highbirthweight
Headcircumference
Cancersyndromes:
NF1TSC
PTCHAPC
Common SNPs
Epimutations
Maternal genetic effects
Allergic/ atopic
conditions
Early life exposure to infections
Ionizingradiation
In uterofolic acid
Congenitalanomalies
Somaticmutations
Epigeneticalterations
Tumormicro-
environment
Hazardous air pollutants
Common SNPs
Maternal genetic effects
Pesticides
Dietary nitrosocompounds
Figure 1. Summary of established and suspected risk factors related to CBTs. More established risk factors are listed in bold type. Suggested risk factors thatare high priority for validation are listed in nonbold type.
Cancer Epidemiol Biomarkers Prev; 23(12) December 2014 Cancer Epidemiology, Biomarkers & Prevention2732
Johnson et al.
on February 4, 2015. © 2014 American Association for Cancer Research. cebp.aacrjournals.org Downloaded from
Published OnlineFirst September 5, 2014; DOI: 10.1158/1055-9965.EPI-14-0207

9. Louis DNOH,Wiestler OD, CavaneeWK, editors. WHO classificationof tumours of the central nervous system. Lyon, France: InternationalAgency for Research on Cancer; 2007.
10. Smoll NR. Relative survival of childhood and adult medulloblastomasand primitive neuroectodermal tumors (PNETs). Cancer 2012;118:1313–22.
11. Kleihues P, Burger PC, Scheithauer BW. The newWHO classificationof brain tumours. Brain Pathol 1993;3:255–68.
12. Rutkowski S, von Hoff K, Emser A, Zwiener I, Pietsch T, Figarella-Branger D, et al. Survival and prognostic factors of early childhoodmedulloblastoma: an international meta-analysis. J Clin Oncol 2010;28:4961–8.
13. Kool M, Korshunov A, RemkeM, Jones DT, Schlanstein M, NorthcottPA, et al. Molecular subgroups of medulloblastoma: an internationalmeta-analysis of transcriptome, genetic aberrations, and clinical dataof WNT, SHH, Group 3, and Group 4 medulloblastomas. Acta Neu-ropathol 2012;123:473–84.
14. Woehrer A, Slavc I, Waldhoer T, Heinzl H, Zielonke N, Czech T, et al.Incidence of atypical teratoid/rhabdoid tumors in children: a popu-lation-based study by the Austrian Brain Tumor Registry, 1996–2006.Cancer 2010;116:5725–32.
15. Ostrom QT, Chen Y, Blank Pd, Ondracek A, Farah P, Gittleman H,et al. The descriptive epidemiology of atypical teratoid/rhabdoidtumors in the United States, 2001–2010. Neuro Oncol 2014;16:1392–9.
16. Lafay-Cousin L, Hawkins C, Carret AS, Johnston D, Zelcer S, WilsonB, et al. Central nervous system atypical teratoid rhabdoid tumours:the Canadian Paediatric Brain Tumour Consortium experience. Eur JCancer 2012;48:353–9.
17. HildenJM,MeerbaumS,BurgerP, Finlay J, JanssA,ScheithauerBW,et al. Central nervous system atypical teratoid/rhabdoid tumor:results of therapy in children enrolled in a registry. J Clin Oncol2004;22:2877–84.
18. von Hoff K, Hinkes B, Dannenmann-Stern E, von Bueren AO,Warmuth-Metz M, Soerensen N, et al. Frequency, risk-factorsand survival of children with atypical teratoid rhabdoid tumors(AT/RT) of the CNS diagnosed between 1988 and 2004, andregistered to the German HIT database. Pediatr Blood Cancer2011;57:978–85.
19. Athale UH,Duckworth J, Odame I, Barr R. Childhood atypical teratoidrhabdoid tumor of the central nervous system: a meta-analysis ofobservational studies. J Pediatr Hematol Oncol 2009;31:651–63.
20. Lee JY, Kim IK, Phi JH, Wang KC, Cho BK, Park SH, et al. Atypicalteratoid/rhabdoid tumors: the need for more active therapeutic mea-sures in younger patients. J Neuro Oncol 2012;107:413–9.
21. Heck JE, Lombardi CA, Cockburn M, Meyers TJ, Wilhelm M, Ritz B.Epidemiology of rhabdoid tumors of early childhood. Pediatr BloodCancer 2013;60:77–81.
22. Bishop AJ, McDonald MW, Chang AL, Esiashvili N. Infant braintumors: incidence, survival, and the role of radiation based onSurveillance, Epidemiology, andEndResults (SEER) data. Int JRadiatOncol Biol Phys 2012;82:341–7.
23. Stefanaki K, Alexiou GA, Stefanaki C, Prodromou N. Tumors ofcentral and peripheral nervous system associated with inheritedgenetic syndromes. Pediatr Neurosurg 2012;48:271–85.
24. Hottinger AF, Khakoo Y. Neurooncology of familial cancer syn-dromes. J Child Neurol 2009;24:1526–35.
25. Bourdeaut F, Miquel C, Richer W, Grill J, Zerah M, Grison C, et al.Rubinstein-Taybi syndrome predisposing to non-WNT, non-SHH,group 3 medulloblastoma. Pediatr Blood Cancer 2014;61:383–6.
26. Yu CL, Tucker MA, Abramson DH, Furukawa K, Seddon JM, StovallM, et al. Cause-specific mortality in long-term survivors of retino-blastoma. J Natl Cancer Inst 2009;101:581–91.
27. Dearlove JV, Fisher PG, Buffler PA. Family history of cancer amongchildren with brain tumors: a critical review. J Pediatr Hematol Oncol2008;30:8–14.
28. Searles Nielsen S, Mueller BA, Preston-Martin S, Holly EA, Little J,Bracci PM, et al. Family cancer history and risk of brain tumors inchildren: results of the SEARCH international brain tumor study.Cancer Causes Control 2008;19:641–8.
29. Hemminki K, Kyyronen P, Vaittinen P. Parental age as a risk factor ofchildhood leukemia and brain cancer in offspring. Epidemiology1999;10:271–5.
30. Yip BH, Pawitan Y, Czene K. Parental age and risk of childhoodcancers: a population-based cohort study from Sweden. Int J Epi-demiol 2006;35:1495–503.
31. Johnson KJ, Carozza SE, Chow EJ, Fox EE, Horel S, McLaughlin CC,et al. Parental age and risk of childhood cancer: a pooled analysis.Epidemiology 2009;20:475–83.
32. Weinberg CR, Wilcox AJ, Lie RT. A log-linear approach to case-parent-triad data: assessing effects of disease genes that act eitherdirectly or through maternal effects and that may be subject toparental imprinting. Am J Hum Genet 1998;62:969–78.
33. Lupo PJ, Nousome D, Okcu MF, Chintagumpala M, Scheurer ME.Maternal variation in EPHX1, a xenobiotic metabolism gene, isassociated with childhood medulloblastoma: an exploratorycase-parent triad study. Pediatr Hematol Oncol 2012;29:679–85.
34. Chen C, Xu T, Chen J, Zhou J, Yan Y, Lu Y, et al. Allergy and risk ofglioma: a meta-analysis. Eur J Neurol 2011;18:387–95.
35. Bayley KB, Belnap T, Savitz L, Masica AL, Shah N, Fleming NS.Challenges in using electronic health record data for CER: experienceof 4 learning organizations and solutions applied. Med Care 2013;51:S80–6.
36. Harding NJ, Birch JM, Hepworth SJ, McKinney PA. Atopic dysfunc-tion and risk of central nervous system tumours in children. Eur JCancer 2008;44:92–9.
37. Roncarolo F, Infante-Rivard C. Asthma and risk of brain cancer inchildren. Cancer Causes Control 2012;23:617–23.
38. Shu X, Prochazka M, Lannering B, Schuz J, Roosli M, Tynes T, et al.Atopic conditions and brain tumor risk in children and adolescents–an international case-control study (CEFALO). Ann Oncol 2014;25:902–8.
39. Fear NT, Roman E, Ansell P, Bull D. Malignant neoplasms of the brainduring childhood: the role of prenatal and neonatal factors (UnitedKingdom). Cancer Causes Control 2001;12:443–9.
40. Nyari TA, Dickinson HO, Parker L. Childhood cancer in relation toinfections in the community during pregnancy and around the time ofbirth. Int J Cancer 2003;104:772–7.
41. DickinsonHO, Nyari TA, Parker L. Childhood solid tumours in relationto infections in the community in Cumbria during pregnancy andaround the time of birth. Br J Cancer 2002;87:746–50.
42. Altieri A, Castro F, Bermejo JL, Hemminki K. Association betweennumber of siblings and nervous system tumors suggests an infec-tious etiology. Neurology 2006;67:1979–83.
43. Shaw AK, Li P, Infante-Rivard C. Early infection and risk ofchildhood brain tumors (Canada). Cancer Causes Control 2006;17:1267–74.
44. Harding NJ, Birch JM, Hepworth SJ, McKinney PA. Infectious expo-sure in the first year of life and risk of central nervous system tumors inchildren: analysis of day care, social contact, and overcrowding.Cancer Causes Control 2009;20:129–36.
45. Harding NJ, Birch JM, Hepworth SJ, McKinney PA, Investigators U.Breastfeeding and risk of childhood CNS tumours. Br J Cancer2007;96:815–7.
46. Andersen TV, Schmidt LS, Poulsen AH, FeychtingM,RoosliM, TynesT, et al. Patterns of exposure to infectious diseases and socialcontacts in early life and risk of brain tumours in children andadolescents: an International Case-Control Study (CEFALO). Br JCancer 2013;108:2346–53.
47. Kobayashi N, Furukawa T, Takatsu T. Congenital anomalies in chil-dren with malignancy. Paediatr Univ Tokyo 1968;16:31–7.
48. Miller RW. Relation between cancer and congenital defects in man.N Engl J Med 1966;275:87–93.
49. Miller RW. Childhood cancer and congenital defects. A study of U.S.death certificates during the period 1960–1966. Pediatr Res 1969;3:389–97.
50. Agha MM, Williams JI, Marrett L, To T, Zipursky A, Dodds L. Con-genital abnormalities and childhood cancer. Cancer 2005;103:1939–48.
www.aacrjournals.org Cancer Epidemiol Biomarkers Prev; 23(12) December 2014 2733
Childhood Brain Tumor Epidemiology Review
on February 4, 2015. © 2014 American Association for Cancer Research. cebp.aacrjournals.org Downloaded from
Published OnlineFirst September 5, 2014; DOI: 10.1158/1055-9965.EPI-14-0207

51. Bjorge T, Cnattingius S, Lie RT, Tretli S, Engeland A. Cancer risk inchildren with birth defects and in their families: a population basedcohort study of 5.2million children fromNorway andSweden.CancerEpidemiol Biomarkers Prev 2008;17:500–6.
52. Fisher PG, Reynolds P, Von Behren J, Carmichael SL, RasmussenSA, Shaw GM. Cancer in children with nonchromosomal birthdefects. J Pediatr 2012;160:978–83.
53. Partap S, MacLean J, Von Behren J, Reynolds P, Fisher PG. Birthanomalies and obstetric history as risks for childhood tumors of thecentral nervous system. Pediatrics 2011;128:e652–7.
54. Bjorge T, Sorensen HT, Grotmol T, Engeland A, Stephansson O,Gissler M, et al. Fetal growth and childhood cancer: a population-based study. Pediatrics 2013;132:e1265–75.
55. Schmidt LS, Sch€uz J, L€ahteenm€aki P, Tr€ager C, Stokland T,Gustafson G, et al. Fetal growth, preterm birth, neonatal stressand risk for CNS tumors in children: a Nordic population- andregister-based case-control study. Cancer Epidemiol BiomarkersPrev 2010;19:1042–52.
56. Milne E, Laurvick CL, Blair E, de Klerk N, Charles AK, Bower C. Fetalgrowth and the risk of childhood CNS tumors and lymphomas inWestern Australia. Int J Cancer 2008;123:436–43.
57. MacLean J, Partap S, Reynolds P, Von Behren J, Fisher PG. Birthweight and order as risk factors for childhood central nervous systemtumors. J Pediatr 2010;157:450–5.
58. Harder T, PlagemannA,Harder A. Birthweight and subsequent risk ofchildhood primary brain tumors: a meta-analysis. Am J Epidemiol2008;168:366–73.
59. Kleinerman RA. Cancer risks following diagnostic and therapeuticradiation exposure in children. Pediatr Radiol 2006;36Suppl 2:121–5.
60. Ohgaki H, Kleihues P. Epidemiology and etiology of gliomas. ActaNeuropathol 2005;109:93–108.
61. Streffer C, Shore R, Konermann G, Meadows A, Uma Devi P, PrestonWithers J, et al. Biological effects after prenatal irradiation (embryoand fetus). A report of the International Commission on RadiologicalProtection. Ann ICRP 2003;33:5–206.
62. Neglia JP, Robison LL, Stovall M, Liu Y, PackerRJ, HammondS, et al.New primary neoplasms of the central nervous system in survivors ofchildhood cancer: a report from the Childhood Cancer SurvivorStudy. J Natl Cancer Inst 2006;98:1528–37.
63. Mellemkjaer L, HasleH,GridleyG, JohansenC,Kjaer SK, FrederiksenK, et al. Risk of cancer in children with the diagnosis immaturity atbirth. Paediatr Perinat Epidemiol 2006;20:231–7.
64. Stalberg K, Haglund B, Axelsson O, Cnattingius S, Pfeifer S, Kieler H.Prenatal X-ray exposure and childhood brain tumours: a population-based case-control study on tumour subtypes. Br J Cancer 2007;97:1583–7.
65. Khan S, Evans AA, Rorke-Adams L, Orjuela MA, Shiminski-MaherT, Bunin GR. Head injury, diagnostic X-rays, and risk of medul-loblastoma and primitive neuroectodermal tumor: a Children'sOncology Group study. Cancer Causes Control 2010;21:1017–23.
66. RajaramanP, Simpson J, NetaG, Berrington deGonzalez A, Ansell P,Linet MS, et al. Early life exposure to diagnostic radiation andultrasound scans and risk of childhood cancer: case-control study.BMJ 2011;342:d472.
67. Pearce MS, Salotti JA, Little MP, McHugh K, Lee C, Kim KP, et al.Radiation exposure from CT scans in childhood and subsequent riskof leukaemia and brain tumours: a retrospective cohort study. Lancet2012;380:499–505.
68. Mathews JD, Forsythe AV, Brady Z, Butler MW, Goergen SK, ByrnesGB, et al. Cancer risk in 680,000 people exposed to computedtomography scans in childhood or adolescence: data linkage studyof 11 million Australians. BMJ 2013;346:f2360.
69. Boice JD Jr, Mumma MT, Blot WJ, Heath CW Jr. Childhood cancermortality in relation to theStLucie nuclear power station. JRadiol Prot2005;25:229–40.
70. International Agency for Cancer Research. Agents classified by theIARCMonographs,Volumes1–109. Lyon: IARC;2014 [cited2014May7]. Available from: http://monographs.iarc.fr/ENG/Classification/
71. HaM, ImH, LeeM,KimHJ, KimBC,GimmYM, et al. Radio-frequencyradiation exposure from AM radio transmitters and childhood leuke-mia and brain cancer. Am J Epidemiol 2007;166:270–9.
72. Mezei G, GadallahM, Kheifets L. Residential magnetic field exposureand childhood brain cancer: a meta-analysis. Epidemiology 2008;19:424–30.
73. Kheifets L, Ahlbom A, Crespi CM, Feychting M, Johansen C, MonroeJ, et al. A pooled analysis of extremely low-frequencymagnetic fieldsand childhood brain tumors. Am J Epidemiol 2010;172:752–61.
74. Elliott P, Toledano MB, Bennett J, Beale L, de Hoogh K, Best N, et al.Mobile phone base stations and early childhood cancers: case-control study. BMJ 2010;340:c3077.
75. Aydin D, Feychting M, Schuz J, Tynes T, Andersen TV, Schmidt LS,et al.Mobilephoneuseandbrain tumors inchildrenandadolescents:amulticenter case-control study. J Natl Cancer Inst 2011;103:1264–76.
76. McKean-Cowdin R, Pogoda JM, Lijinsky W, Holly EA, Mueller BA,Preston-Martin S. Maternal prenatal exposure to nitrosatabledrugs and childhood brain tumours. Int J Epidemiol 2003;32:211–7.
77. Carozza SE, Olshan AF, Faustman EM, Gula MJ, Kolonel LN, AustinDF, et al. Maternal exposure to N-nitrosatable drugs as a risk factorfor childhood brain tumours. Int J Epidemiol 1995;24:308–12.
78. Cardy AH, Little J, McKean-Cowdin R, Lijinsky W, Choi NW, CordierS, et al. Maternal medication use and the risk of brain tumors in theoffspring: the SEARCH international case-control study. Int J Cancer2006;118:1302–8.
79. Schuz J, Weihkopf T, Kaatsch P. Medication use during pregnancyand the risk of childhood cancer in the offspring. Eur J Pediatr2007;166:433–41.
80. Chuang CH, Doyle P, Wang JD, Chang PJ, Lai JN, Chen PC. Herbalmedicines during pregnancy and childhood cancers: an analysis ofdata from a pregnancy cohort study. Pharmacoepidemiol Drug Saf2009;18:1119–20.
81. Stalberg K, Haglund B, Stromberg B, Kieler H. Prenatal exposure tomedicines and the risk of childhood brain tumor. Cancer Epidemiol2010;34:400–4.
82. Kaatsch P, Scheidemann-Wesp U, Schuz J. Maternal use of anti-biotics and cancer in the offspring: results of a case-control study inGermany. Cancer Causes Control 2010;21:1335–45.
83. Goh YI, Koren G. Prenatal supplementation with multivitamins andthe incidence of pediatric cancers: clinical and methodologicalconsiderations. Pediatr Blood Cancer 2008;50:487–9; discussion98.
84. Bunin GR, Kushi LH, Gallagher PR, Rorke-Adams LB, McBride ML,Cnaan A. Maternal diet during pregnancy and its association withmedulloblastoma in children: a children's oncology group study(United States). Cancer Causes Control 2005;16:877–91.
85. Bunin GR, Gallagher PR, Rorke-Adams LB, Robison LL, Cnaan A.Maternal supplement, micronutrient, and cured meat intake duringpregnancy and risk of medulloblastoma during childhood: a chil-dren's oncology group study. Cancer Epidemiol Biomarkers Prev2006;15:1660–7.
86. Ortega-Garcia JA, Ferris-Tortajada J, Claudio L, SoldinOP, Sanchez-Sauco MF, Fuster-Soler JL, et al. Case control study of periconcep-tional folic acid intake and nervous system tumors in children. ChildsNerv Syst 2010;26:1727–33.
87. Milne E, Greenop KR, Bower C, Miller M, van Bockxmeer FM, ScottRJ, et al. Maternal use of folic acid and other supplements and risk ofchildhood brain tumors. Cancer Epidemiol Biomarkers Prev2012;21:1933–41.
88. Grupp SG, Greenberg ML, Ray JG, Busto U, Lanctot KL, Nulman I,et al. Pediatric cancer rates after universal folic acid flour fortificationin Ontario. J Clin Pharmacol 2011;51:60–5.
89. Linabery AM, Johnson KJ, Ross JA. Childhood cancer incidencetrends in association with US folic acid fortification (1986–2008).Pediatrics 2012;129:1125–33.
90. Huncharek M. Maternal intake of N-nitroso compounds from curedmeat and the risk of pediatric brain tumors: a review. J Environ PatholToxicol Oncol 2010;29:245–53.
Cancer Epidemiol Biomarkers Prev; 23(12) December 2014 Cancer Epidemiology, Biomarkers & Prevention2734
Johnson et al.
on February 4, 2015. © 2014 American Association for Cancer Research. cebp.aacrjournals.org Downloaded from
Published OnlineFirst September 5, 2014; DOI: 10.1158/1055-9965.EPI-14-0207

91. Huncharek M, Kupelnick B. A meta-analysis of maternal cured meatconsumption during pregnancy and the risk of childhood braintumors. Neuroepidemiology 2004;23:78–84.
92. Pogoda JM, Preston-Martin S, Howe G, Lubin F, Mueller BA, HollyEA, et al. An international case-control study of maternal diet duringpregnancy and childhood brain tumor risk: a histology-specific anal-ysis by food group. Ann Epidemiol 2009;19:148–60.
93. Searles Nielsen S, Mueller BA, Preston-Martin S, Farin FM, Holly EA,McKean-CowdinR.Childhoodbrain tumors andmaternal curedmeatconsumption in pregnancy: differential effect by glutathione S-trans-ferases. Cancer Epidemiol Biomarkers Prev 2011;20:2413–9.
94. Infante-Rivard C, El-Zein M. Parental alcohol consumption andchildhood cancers: a review. J Toxicol Environ Health B Crit Rev2007;10:101–29.
95. Milne E, Greenop KR, Scott RJ, de Klerk NH, Bower C, Ashton LJ,et al. Parental alcohol consumption and risk of childhood acutelymphoblastic leukemia and brain tumors. Cancer Causes Control2013;24:391–402.
96. Bunin GR, Buckley JD, Boesel CP, Rorke LB, Meadows AT. Riskfactors for astrocytic glioma and primitive neuroectodermal tumor ofthe brain in young children: a report from the Children's CancerGroup. Cancer Epidemiol Biomarkers Prev 1994;3:197–204.
97. Norman MA, Holly EA, Ahn DK, Preston-Martin S, Mueller BA,Bracci PM. Prenatal exposure to tobacco smoke and childhoodbrain tumors: results from the United States West Coast childhoodbrain tumor study. Cancer Epidemiol Biomarkers Prev 1996;5:127–33.
98. Filippini G, Maisonneuve P, McCredie M, Peris-Bonet R, Modan B,Preston-Martin S, et al. Relation of childhood brain tumors toexposure of parents and children to tobacco smoke: the SEARCHinternational case-control study. Surveillance of environmentalaspects related to cancer in humans. Int J Cancer 2002;100:206–13.
99. Huncharek M, Kupelnick B, Klassen H. Maternal smoking duringpregnancy and the risk of childhood brain tumors: a meta-analysis of6566 subjects from twelve epidemiological studies. J Neuro Oncol2002;57:51–7.
100. Brooks DR, Mucci LA, Hatch EE, Cnattingius S. Maternal smokingduring pregnancy and risk of brain tumors in the offspring. A pro-spective study of 1.4 million Swedish births. Cancer Causes Control2004;15:997–1005.
101. Barrington-Trimis JL, Searles Nielsen S, Preston-Martin S, Gauder-man WJ, Holly EA, Farin FM, et al. Parental smoking and risk ofchildhood brain tumors by functional polymorphisms in polycyclicaromatic hydrocarbon metabolism genes. PLoS ONE 2013;8:e79110.
102. Infante-Rivard C, Weichenthal S. Pesticides and childhood cancer:an update of Zahm andWard's 1998 review. J Toxicol Environ HealthB Crit Rev 2007;10:81–99.
103. Pearce MS, Hammal DM, Dorak MT, McNally RJ, Parker L. Pater-nal occupational exposure to pesticides or herbicides as riskfactors for cancer in children and young adults: a case-controlstudy from the North of England. Arch Environ Occup Health2006;61:138–44.
104. Shim YK, Mlynarek SP, van Wijngaarden E. Parental exposure topesticides and childhood brain cancer: U.S. Atlantic coast childhoodbrain cancer study. Environ Health Perspect 2009;117:1002–6.
105. Greenop KR, Peters S, Bailey HD, Fritschi L, Attia J, Scott RJ, et al.Exposure topesticides and the risk of childhoodbrain tumors.CancerCauses Control 2013;24:1269–78.
106. Vinson F, Merhi M, Baldi I, Raynal H, Gamet-Payrastre L. Exposure topesticides and risk of childhood cancer: a meta-analysis of recentepidemiological studies. Occup Environ Med 2011;68:694–702.
107. VanMaele-Fabry G, Hoet P, LisonD. Parental occupational exposureto pesticides as risk factor for brain tumors in children and youngadults: a systematic review and meta-analysis. Environ Int 2013;56:19–31.
108. World Health Organization. Extremely low frequency fields [Internet].Lyon: IARC; 2007 [cited 2014 May 7]. Available from: http://www.who.int/peh-emf/publications/Complet_DEC_2007.pdf.
109. Pearce MS, Hammal DM, Dorak MT, McNally RJ, Parker L. Paternaloccupational exposure to electro-magnetic fields as a risk factor forcancer in children and young adults: a case-control study from theNorth of England. Pediatr Blood Cancer 2007;49:280–6.
110. Li P,McLaughlin J, Infante-RivardC.Maternal occupational exposureto extremely low frequency magnetic fields and the risk of braincancer in the offspring. Cancer Causes Control 2009;20:945–55.
111. Hug K, Grize L, Seidler A, Kaatsch P, Schuz J. Parental occupationalexposure to extremely low frequency magnetic fields and childhoodcancer: a German case-control study. Am J Epidemiol 2010;171:27–35.
112. Ali R, Yu CL, Wu MT, Ho CK, Pan BJ, Smith T, et al. A case-control study of parental occupation, leukemia, and brain tumorsin an industrial city in Taiwan. J Occup Environ Med 2004;46:985–92.
113. Mazumdar M, Liu CY, Wang SF, Pan PC, Wu MT, Christiani DC.No association between parental or subject occupation andbrain tumor risk. Cancer Epidemiol Biomarkers Prev 2008;17:1835–7.
114. Peters S, Glass DC, Reid A, de Klerk N, Armstrong BK, Kellie S, et al.Parental occupational exposure to engine exhausts and childhoodbrain tumors. Int J Cancer 2013;132:2975–9.
115. Greenop KR, Peters S, Fritschi L, Glass DC, Ashton LJ, Bailey HD,et al. Exposure to household painting and floor treatments, andparental occupational paint exposure and risk of childhood braintumors: results from an Australian case-control study. CancerCauses Control 2014;25:283–91.
116. Cordier S, Monfort C, Filippini G, Preston-Martin S, Lubin F,Mueller BA, et al. Parental exposure to polycyclic aromatic hydro-carbons and the risk of childhood brain tumors: the SEARCHInternational Childhood Brain Tumor Study. Am J Epidemiol 2004;159:1109–16.
117. Baldwin RT, Preston-Martin S. Epidemiology of brain tumors inchildhood–a review. Toxicol Appl Pharmacol 2004;199:118–31.
118. Son M, Kim J, Oh J, Kawachi I. Inequalities in childhood cancermortality according to parental socioeconomic position: a birthcohort study in South Korea. Soc Sci Med 2011;72:108–15.
119. Keegan TJ, Bunch KJ, Vincent TJ, King JC, O'Neill KA, Kendall GM,et al. Case-control study of paternal occupation and social class withrisk of childhood central nervous system tumours in Great Britain,1962–2006. Br J Cancer 2013;108:1907–14.
120. Gurney JG, Smith MA, Olshan AF, Hecht SS, Kasum CM. Clues tothe etiology of childhood brain cancer: N-nitroso compounds,polyomaviruses, and other factors of interest. Cancer Invest 2001;19:630–40.
121. Zahm SH, Ward MH. Pesticides and childhood cancer. EnvironHealth Perspect 1998;106 Suppl 3:893–908.
122. Rosso AL, Hovinga ME, Rorke-Adams LB, Spector LG, BuninGRChildren's Oncology G. A case-control study of childhood braintumors and fathers' hobbies: a Children's Oncology Group study.Cancer Causes Control 2008;19:1201–7.
123. Searles Nielsen S, Mueller BA, De Roos AJ, Viernes HM, Farin FM,Checkoway H. Risk of brain tumors in children and susceptibility toorganophosphorus insecticides: the potential role of paraoxonase(PON1). Environ Health Perspect 2005;113:909–13.
124. Searles Nielsen S, McKean-Cowdin R, Farin FM, Holly EA, Preston-Martin S, Mueller BA. Childhood brain tumors, residential insecticideexposure, and pesticide metabolism genes. Environ Health Perspect2010;118:144–9.
125. Ward E, DeSantis C, Robbins A, Kohler B, Jemal A. Childhood andadolescent cancer statistics, 2014. CA Cancer J Clin 2014;64:83–103.
126. Heiden TL, Bailey HD, Armstrong BK, Milne E. Participation inpaediatric cancer studies: timing and approach to recruitment.BMC Res Notes 2013;6:191.
127. The Children's Oncology Group. Project: every child [Internet]. Phi-ladelphia: The Children's Oncology Group; [cited 2014 May 14].Available from: http://projecteverychild.org/
128. Peris-Bonet R, Martinez-Garcia C, Lacour B, Petrovich S, Giner-Ripoll B, Navajas A, et al. Childhood central nervous system
www.aacrjournals.org Cancer Epidemiol Biomarkers Prev; 23(12) December 2014 2735
Childhood Brain Tumor Epidemiology Review
on February 4, 2015. © 2014 American Association for Cancer Research. cebp.aacrjournals.org Downloaded from
Published OnlineFirst September 5, 2014; DOI: 10.1158/1055-9965.EPI-14-0207

tumours–incidence and survival in Europe (1978–1997): report fromAutomated Childhood Cancer Information System project. Eur JCancer 2006;42:2064–80.
129. Makino K, Nakamura H, Yano S, Kuratsu JKumamoto Brain TumorGroup. Population-based epidemiological study of primary intracra-nial tumors in childhood. Childs Nerv Syst 2010;26:1029–34.
130. Katchy KC, Alexander S, Al-Nashmi NM, Al-Ramadan A. Epidemi-ology of primary brain tumors in childhood and adolescence inKuwait. SpringerPlus 2013;2:58.
131. Schmidt LS, Schmiegelow K, Lahteenmaki P, Trager C, Stokland T,Grell K, et al. Incidence of childhood central nervous system tumors inthe Nordic countries. Pediatr Blood Cancer 2011;56:65–9.
132. Raaschou-Nielsen O, Sorensen M, Carstensen H, Jensen T, Bern-hardtsen T, Gjerris F, et al. Increasing incidence of childhood tumours
of the central nervous system in Denmark, 1980–1996. Br J Cancer2006;95:416–22.
133. Arora RS, Alston RD, Eden TO, Estlin EJ, Moran A, Birch JM. Age-incidence patterns of primary CNS tumors in children, adolescents,and adults in England. Neuro Oncol 2009;11:403–13.
134. Steliarova-Foucher E, Stiller C, Lacour B, Kaatsch P. Internationalclassification of childhood cancer, third edition. Cancer 2005;103:1457–67.
135. Lannering B, Sandstrom PE, Holm S, Lundgren J, Pfeifer S, Samuels-sonU, et al. Classification, incidence and survival analysesof childrenwith CNS tumours diagnosed in Sweden 1984–2005. Acta Paediatr2009;98:1620–7.
136. Connelly JM, Malkin MG. Environmental risk factors for brain tumors.Curr Neurol Neurosci Rep 2007;7:208–14.
Cancer Epidemiol Biomarkers Prev; 23(12) December 2014 Cancer Epidemiology, Biomarkers & Prevention2736
Johnson et al.
on February 4, 2015. © 2014 American Association for Cancer Research. cebp.aacrjournals.org Downloaded from
Published OnlineFirst September 5, 2014; DOI: 10.1158/1055-9965.EPI-14-0207

2014;23:2716-2736. Published OnlineFirst September 5, 2014.Cancer Epidemiol Biomarkers Prev Kimberly J. Johnson, Jennifer Cullen, Jill S. Barnholtz-Sloan, et al. Epidemiology Consortium ReviewChildhood Brain Tumor Epidemiology: A Brain Tumor
Updated version
10.1158/1055-9965.EPI-14-0207doi:
Access the most recent version of this article at:
Cited Articles
http://cebp.aacrjournals.org/content/23/12/2716.full.html#ref-list-1
This article cites by 132 articles, 34 of which you can access for free at:
E-mail alerts related to this article or journal.Sign up to receive free email-alerts
SubscriptionsReprints and
To order reprints of this article or to subscribe to the journal, contact the AACR Publications Department
Permissions
To request permission to re-use all or part of this article, contact the AACR Publications Department at
on February 4, 2015. © 2014 American Association for Cancer Research. cebp.aacrjournals.org Downloaded from
Published OnlineFirst September 5, 2014; DOI: 10.1158/1055-9965.EPI-14-0207